the Creative Commons Attribution 4.0 License.
the Creative Commons Attribution 4.0 License.
 | 01 Sep 2025
The 21st-century wetting inhibits growing surface ozone in Northwestern China
Xiaodong Zhang
Yu Yan
Ning Zhang
Wenpeng Wang
Huabing Suo
Xiaohu Jian
Chao Wang
Haibo Ma
Hong Gao
Zhaoli Yang
Tao Huang
Jianmin Ma
Previous studies have shown that surface air temperature (SAT) facilitates the formation of surface ozone (O3), while relative humidity (RH) often inhibits ozone generation. However, the degree to which O3 may respond simultaneously to rising SATs and RH due to climate change remains less understood. We conducted extensive atmospheric chemistry model scenario simulations to investigate the impacts of long-term trends of humidification and warming on summer O3 concentrations in Northwestern China (NW) from 1998 to 2017, a period during which this region experienced both warming and the most significant wetting trend in China. We found that the summer mean O3 level in NW increased by 19.9 % during this time. The changes in meteorology led to a reduction in O3 levels, primarily due to humidification in NW, which counteracts the warming-induced O3 increase. We demonstrate that the wetting trend in NW will continue from 2019 to 2030 under a shared socioeconomic pathway (SSP) in conjunction with a representative concentration pathway SSP5-RCP8.5, but will either cease or shift to drier conditions from 2019 to 2060 under the SSP2-RCP4.5. No significant responses of O3 fluctuations to RH variations were observed, partly due to manual intervention under the SSP2-RCP4.5.
- Article
(5692 KB) - Full-text XML
-
Supplement
(2811 KB) - BibTeX
- EndNote


Atmospheric humidity is recognized as a crucial factor that directly and indirectly influences the formation and evolution of surface ozone (Ghazali et al., 2022; Han et al., 2011; Kerr et al., 2020). The relationship between atmospheric humidity and surface O3 is complex. From a chemical standpoint, humidity can modify the rates of photochemical reactions, thereby affecting O3 formation. In addition, humidity plays a role in generating hydroxyl radicals (OH) in the atmosphere, which are vital for breaking down volatile organic compounds (VOCs) and other pollutants (Ding et al., 2023a; Ma et al., 2021). These radicals can interact with O3 precursors, affecting the rate of O3 production. High humidity can also enhance aerosol formation, facilitating heterogeneous reactions. Depending on the specific chemical pathways involved, some of these reactions may either generate or deplete O3 (Eck et al., 2020). From a physical perspective, humidity is critical for cloud and fog formation as well as precipitation. The latter promotes O3 dissolution in water droplets and its removal from the atmosphere through wet deposition, particularly during precipitation events, which weakens solar radiation and disrupts the energy balance near the surface (Ding et al., 2021; Eck et al., 2020; Kleeman, 2008; Madden and Williams, 1978; Millstein and Harley, 2009).
It has been reported that O3 levels increased by 30 % over Northern China in summer and 50 % over Eastern China in autumn during a dry year compared to a wet year, indicating that wet climate conditions do not support rising O3 levels (Ding et al., 2023b). Long-term ambient O3 measurement data indicate that rising absolute air humidity resulted in lower near-surface O3 concentrations at temperatures of 0–30 °C (Belan and Savkin, 2019). Other studies examining the relationship between O3 concentrations and atmospheric humidity have also identified negative correlations between O3 levels and humidity (Li et al., 2022a). Nevertheless, significant knowledge gaps regarding the relationship between humidity and O3 persist (Li et al., 2021a). Most previous studies utilized short-term or instantaneous O3 concentrations to evaluate the associations between O3 and atmospheric humidity (Gong et al., 2021; Li et al., 2021b). Their long-term relationships still require clarification. Previous investigations of the connections between climate and O3 primarily focused on the impact of air temperature, which often overshadows the effects of other meteorological variables (Wang et al., 2024). The extent to which atmospheric humidity could significantly influence the long-term O3 trend remains uncertain, given that the synergistic effects of warming and wetting frequently occur in a warming climate.
In recent decades, Northwestern China (NW) has emerged as a critical region for studying O3 variability due to its unique climatic and environmental conditions. Observational studies report a significant increase in summer surface O3 concentrations across the region, with trends ranging from 1.5–3.0 µg m−3 yr−1 between 2000 and 2020 (Li et al., 2020b; Zhang et al., 2022). This rise has been attributed to intensified anthropogenic emissions (e.g., NOx and VOCs from energy and industrial activities) and shifting meteorological patterns, including the “warming and wetting” climate regime (Yang et al., 2023). For instance, Ding et al. (2023b) identified a 20 % increase in O3 levels during dry years compared to wet years in arid regions, highlighting the sensitivity of O3 to humidity. In this context, O3 and RH trends in NW over the past decades probably present a unique scenario to help bridge this knowledge gap. NW (Fig. S1), located in the hinterland of the Asian-European continent, is Asia's largest arid and semi-arid region, characterized by limited rainfall and vegetation (Koster et al., 2004; Yang et al., 2023). Meteorological records indicate that from 1960 to 2013, precipitation in NW increased at a rate of 0.55 mm yr−1 (Li et al., 2012; Liu et al., 2013; Yang et al., 2017). During this period, the air temperature rose at a rate of 0.034 °C yr−1, exceeding the warming trends observed across all of China (0.025 °C yr−1) and globally (0.013 °C yr−1). Although RH does not exhibit a significant growth trend during this period, in the recent decade (2008–2017), it increased markedly at a slope of 0.313 in NW and 0.381 in the three westernmost provinces of Xinjiang, Gansu, and Qinghai within NW. Based on these records, NW appears to be entering a warming and wetting phase, accompanied by a rise in precipitation, runoff, and lake levels (Nie et al., 2022; Peng and Zhou, 2017; Shi et al., 2002; Yao et al., 2021).
The present study aims to address the knowledge gap in the complex and long-term relationships between ozone pollution and atmospheric humidity, focusing on NW, where increasing O3 pollution, air temperature and humidity have co-occurred (Peng and Zhou, 2017; Yang et al., 2017), mainly since the early 2000s. This research provides valuable insights into the broader context of air quality management and climate variability by enhancing our understanding of the long-term relationship between ozone pollution and atmospheric humidity.
2.1 WRF-Chem model configuration
Since measured O3 concentration data in China is only available after 2013, we applied the three-dimensional Weather Research and Forecasting with Chemistry (WRF-Chem) version 3.7 model (http://www2.mmm.ucar.edu/wrf/users/wrf_files/wrfv3.7/updates-3.7.html, last access: 26 August 2025) to predict meteorology, O3 concentrations, and other relevant data in Northwestern and mainland China. The model domain spans the entire mainland China at a 20 km × 20 km resolution, extending vertically from the surface to the lower stratospheric ozone layer at an altitude of 50 hPa with 30 staggered vertical layers. This vertical segmentation facilitates a deepened comprehension of the O3 dynamics within the region, enabling the capture of its detailed behavior throughout the atmospheric stratifications (Li et al., 2020a; Zhang et al., 2020, 2022). Detailed physical and chemical schemes contributing to O3 formation in WRF-Chem and emission input followed previous studies (Bei et al., 2018; Bossioli et al., 2016; Liao et al., 2015; Tie et al., 2009; Wild et al., 2000) and are presented in Sect. S1 in the Supplement and Tables S1–S2. The soil NO, NOx and HONO emissions have been considered a necessary process contributing to surface ozone formation in recent years (Lu et al., 2021). However, given the lack of soil emission inventories of these reactive nitrogen species in China and the world, the present modeling study did not take these processes into consideration. The aerosol feedback mechanisms include the direct and indirect effects, and both are considered in WRF-Chem. The model simulations with a nudging option in WRF were conducted from 1 June to 31 August in each summer from 1998 to 2017, with a time-step of 30 s. A spin-up time of 3 d was adopted before 1 June in each summer. Further details are referred to Sect. S1 in the Supplement.
Located in the upstream of China in terms of dominant prevailing westerly winds in the mid-latitudes of the Northern Hemisphere, it is expected that NW would receive more O3 and its precursors from foreign sources in Eurasian countries to the west of China compared to Eastern China (Li et al., 2014, 2016). Such an “upstream” effect is implicitly accounted for in meteorology and chemistry lateral boundary conditions under an open boundary approach (https://www2.acom.ucar.edu/wrf-chem, last access: 8 May 2024). These boundary conditions typically come from global chemical transport model outputs (e.g., GEOS-Chem, MOZART) that themselves simulate O3 on a global scale (including those upstream regions), chemical reactions, wet and dry deposition and atmospheric transport processes. These datasets are usually generated or assimilated from global models and observations. The lateral boundary conditions govern the fluxes and concentration levels of pollutants entering the model domain from external (upstream) regions. They represent the environmental or regional background concentration outside the model domain, which already integrate emissions and transport influences from a broader region (including upstream areas). The lateral boundary conditions of chemical species in our modeling exercise were estimated from MOZART-4 reanalysis driven fields (Emmons et al., 2010; Zhang et al., 2020) on a daily basis. The ERA-Interim data with a 6-hourly time resolution and 0.7° × 0.7° lat/lon spatial resolution provided by the ECMWF (European Centre for Medium-Range Weather Forecasts) were adopted as lateral boundary conditions of meteorology. Further, since the multiple model scenario simulations in our study used the same lateral boundary conditions, this effectively removed the influences of precursor emissions and atmospheric transport from Eurasian countries but focused on the wetting effect on O3 evolution in the internal model domain (China).
2.2 Trend
The Mann–Kendall (MK) test and Sen's slope (El-Shaarawi and Niculescu, 1992; Kendall, 1949; Mann, 1945) were used to examine the trend of O3, surface air temperature (SAT) at the 2 m height, and relative humidity (RH, %) at the 2 m height. The MK test and Sen's Slope are both non-parametric statistical methods commonly used for analyzing trends in time series data. The MK Test helps determine if there is a significant trend, and Sen's slope quantifies the strength and direction of the trend (slope value).
Interannual ozone variability in NW is primarily driven by large-scale meteorological shifts (e.g., warming, humidification) and regional precursor emissions, rather than diurnal processes. Previous studies (Cooper et al., 2014; Li et al., 2020a) have revealed that long-term O3 trends (interannual and interdecadal scales) are robustly represented by seasonal or annual mean concentrations, as diurnal variations associated with daytime photochemistry and nighttime titration are statistically insignificant. For example, Ding et al. (2023b) reported that separating daytime and nighttime O3 yielded negligible differences (> 95 % correlation) in O3 trend over a 20-year period in arid seasons in China.
2.3 O3 Attribution to meteorology and emission
We calculated the fraction (percentage change, %) to account for O3 attribution to meteorology and emission subject to different model scenarios. For example, we define the fraction
as the attribution of O3 concentration to emissions, where CS1 and CS3 are the summer surface O3 air concentrations from the base (S1) and fixed meteorology (S3) scenarios.
2.4 Data
To initialize and prescribe boundary conditions in the WRF model from 1998 to 2017, meteorological data were sourced from the ERA-Interim reanalysis from the European Centre for Medium-Range Weather Forecast (ECMWF, https://rda.ucar.edu/datasets/d627000/, last access: 26 August 2025). This allows the adoption of the open boundary conditions to dynamically account for cross-regional O3 and precursor transport, and to resolve both local photochemical production and contributions from transboundary sources, ensuring a comprehensive representation of O3 dynamics.
Anthropogenic emissions were collected from the Emissions Database for Global Atmospheric Research (EDGAR) version 4.3 on a spatial resolution of 0.1° × 0.1°, which was available when we started this modeling investigation. A grid-mapping program implemented the emissions into the WRF-Chem (Crippa et al., 2018; Mo et al., 2017). Biogenic emissions were simulated using MEGAN version 2.1 (Guenther et al., 2006, 2012). A recent study suggests that temperature can alter precursor emissions (Pfannerstill et al., 2024). However, since available emission inventories worldwide, including the widely-used EDGAR inventory, did not account for the influence of meteorology, typically the air temperature, on emissions but only considers emissions from anthropogenic and natural sources, the emissions used as input in the present modeling might be subject to additional uncertainties. The reduction of these uncertainties will depend on improved inventories that take the meteorological effect into account.
We replaced WRF land-use change (LUC) data with the Chinese land use/land cover remote sensing monitoring database provided by the Data Center for Resources and Environmental Sciences, Chinese Academy of Sciences (RESDC) (https://www.resdc.cn/, last access: 26 August 2025), which significantly improved China's LUC in our investigation of the effect of urbanization on O3 pollution in China (Zhang et al., 2022). The new LUC data have a spatial resolution of 1 km × 1 km, which is extrapolated to the WRF-Chem grid cells (20 km × 20 km).
Considering that the warming and wetting trends in NW might persist in the coming decades, we also projected future O3 and meteorology in 2019, 2030 and 2060 in the WRF-Chem model framework and simulations, respectively. We collected future anthropogenic emission data from the Dynamic Projection Model for Emissions in China (DPEC Inventory – MEICModel, http://meicmodel.org.cn, last access: 26 August 2025), with a spatial resolution of 0.25° × 0.25° longitude and latitude (Cheng et al., 2021, 2023; Tong et al., 2020). The meteorological data were collected from Shared Socioeconomic Pathways (SSPs) and Representative Concentration Pathways (RCP) climate scenarios under the CMIP6 framework (https://aims2.llnl.gov/search/cmip6/, last access: 26 August 2025), with the MPI-ESM1-2-HR model (Eyring et al., 2016). Compared with other models, MPI-ESM1-2-HR has higher resolution and can simulate the complex interactions within the climate system, including all climate scenarios (SSP2-RCP4.5 and SSP5-RCP8.5) targeted by this study, and has been widely used in WRF simulations.
2.5 Model evaluations
Rigorous comparisons between simulated O3 concentrations and measured data were conducted and presented in Figs. S2–S7 and Sect. S2 in the Supplement. Overall, the simulated O3 concentrations agree reasonably well with measured data, demonstrating a high level of reliability of modeling results.
2.6 Model scenario set-up
We established several model scenarios to distill signals of meteorological conditions, primarily SAT and RH, in modeled O3 concentrations. Detailed configurations are provided in Table 1. The first scenario (S1) serves as the baseline, incorporating summer-specific meteorological variables and emissions from 1998 to 2017 into WRF-Chem simulations, and is thus considered a realistic scenario. In the second scenario (S2), we fixed emissions from 1998 throughout the period from 1998 to 2017, aiming to assess the significance of the meteorological effect on O3 variation. In the third scenario (S3), we fixed meteorology from 1998 during the same period, thereby emphasizing the importance of emissions in O3 variation. To evaluate the sensitivity of scenario S3, we also conducted an additional WRF-Chem run by fixing SAT and RH only in 1998 (scenario S4) and compared the modeled O3 concentrations with those simulated in scenario S3 for 2004. Overall, we found minor differences (two tails T-test = 0.1065) between model scenario S3 and the results from the fixed SAT and RH model run (Fig. S8) but slightly stronger O3 pollution levels subject to fixed RH and SAT scenario than S3 results can be discerned in the Northern China Plain. ozone concentrations under fixed SAT and RH in 1998 seemed higher than fixed all meteorology in 1998 (S3 scenario). We further calculated the differences of the planetary boundary layer heights (PBLH) between the two scenarios (fixed RH and SAT scenario minus scenario S3). The results are illustrated in Fig. S9. Negative PBLH differences can be seen in many areas across China, including the North China Plain (NCP), indicating that fixed SAT and RH scenario reduced PBLH, which often associates with stronger air pollution within the PBLH. By calculating the differences and fractions, we can discern the contributions of meteorology and emissions to O3 formation and destruction. We also established two additional model scenarios to project the responses of O3 concentrations to future meteorology and emissions in NW based on CMIP6 pathways SSP2-RCP4.5 and SSP5-RCP8.5, specifically for 2019, 2030, and 2060, respectively. Detailed descriptions of these two pathways and the corresponding data are presented in Sect. S3 in the Supplement.
3.1 Summer ozone trends
Figure 1a and b present MK-test statistics and Sen's slope estimated temporal trends of summer O3 concentrations from 1998 to 2017 under scenario S1 (base scenario) and S3 with fixed meteorology in China. In the S1 scenario (Fig. 1a), O3 concentrations exhibit statistically significant declining trends in the northernmost regions, spanning from Northeastern Xinjiang to Northeastern China, with the most significant decline occurring in Inner Mongolia. Increasing O3 concentrations are observed along Tianshan Mountain in Xinjiang, western Tibet, and central China. The fixed meteorology scenario (S3, Fig. 1b) shows a monotonically increasing trend across China, indicating continuously rising O3 levels for the past two decades due to growing precursor emissions, except for some grid cells in the Yangtze River Delta (YRD), the Pearl River Delta (PRD), the Beijing-Tianjin metropolitan area and other sporadic regions, where the MK-test and Sen's slope identified statistically significant negative O3 trends. Previous studies have also noted the negative trends over the past decade in these regions (Hu et al., 2024; Li et al., 2022b; Wang et al., 2020; Yu et al., 2021). The Beijing-Tianjin area, YRD and PRD are three critical regions under China's joint efforts to prevent and control air pollution. Regional emission mitigation in these areas may lead to varying reductions in precursor emissions and declines in O3 concentrations. Overall, increasing precursor emissions have dominated the O3 trend in China, as meteorology remained constant during this period. This is evidenced by the linear trends of NOx and NMVOC (non-methane VOC) emissions in China from 1998 to 2017 (Fig. S10). When comparing the MK-test and Sen's slope results between the two scenarios model runs (Fig. 1c), the meteorological conditions from 1998 to 2017 overshadowed the effects of emissions, primarily contributing to the declining O3 levels (negative trends) in the northernmost regions of China, extending from Inner Mongolia to Northeastern China. Our modeling result shows that mean summer O3 concentration, averaged over Inner Mongolia, reached the maximum in 2007 and slightly declined thereafter (Fig. S11). This can be partly attributed to relatively lower precursor emissions resulting from the sparse population and limited industrial activities in this part of China, though having a growing trend (Zhang et al., 2022, 2023).
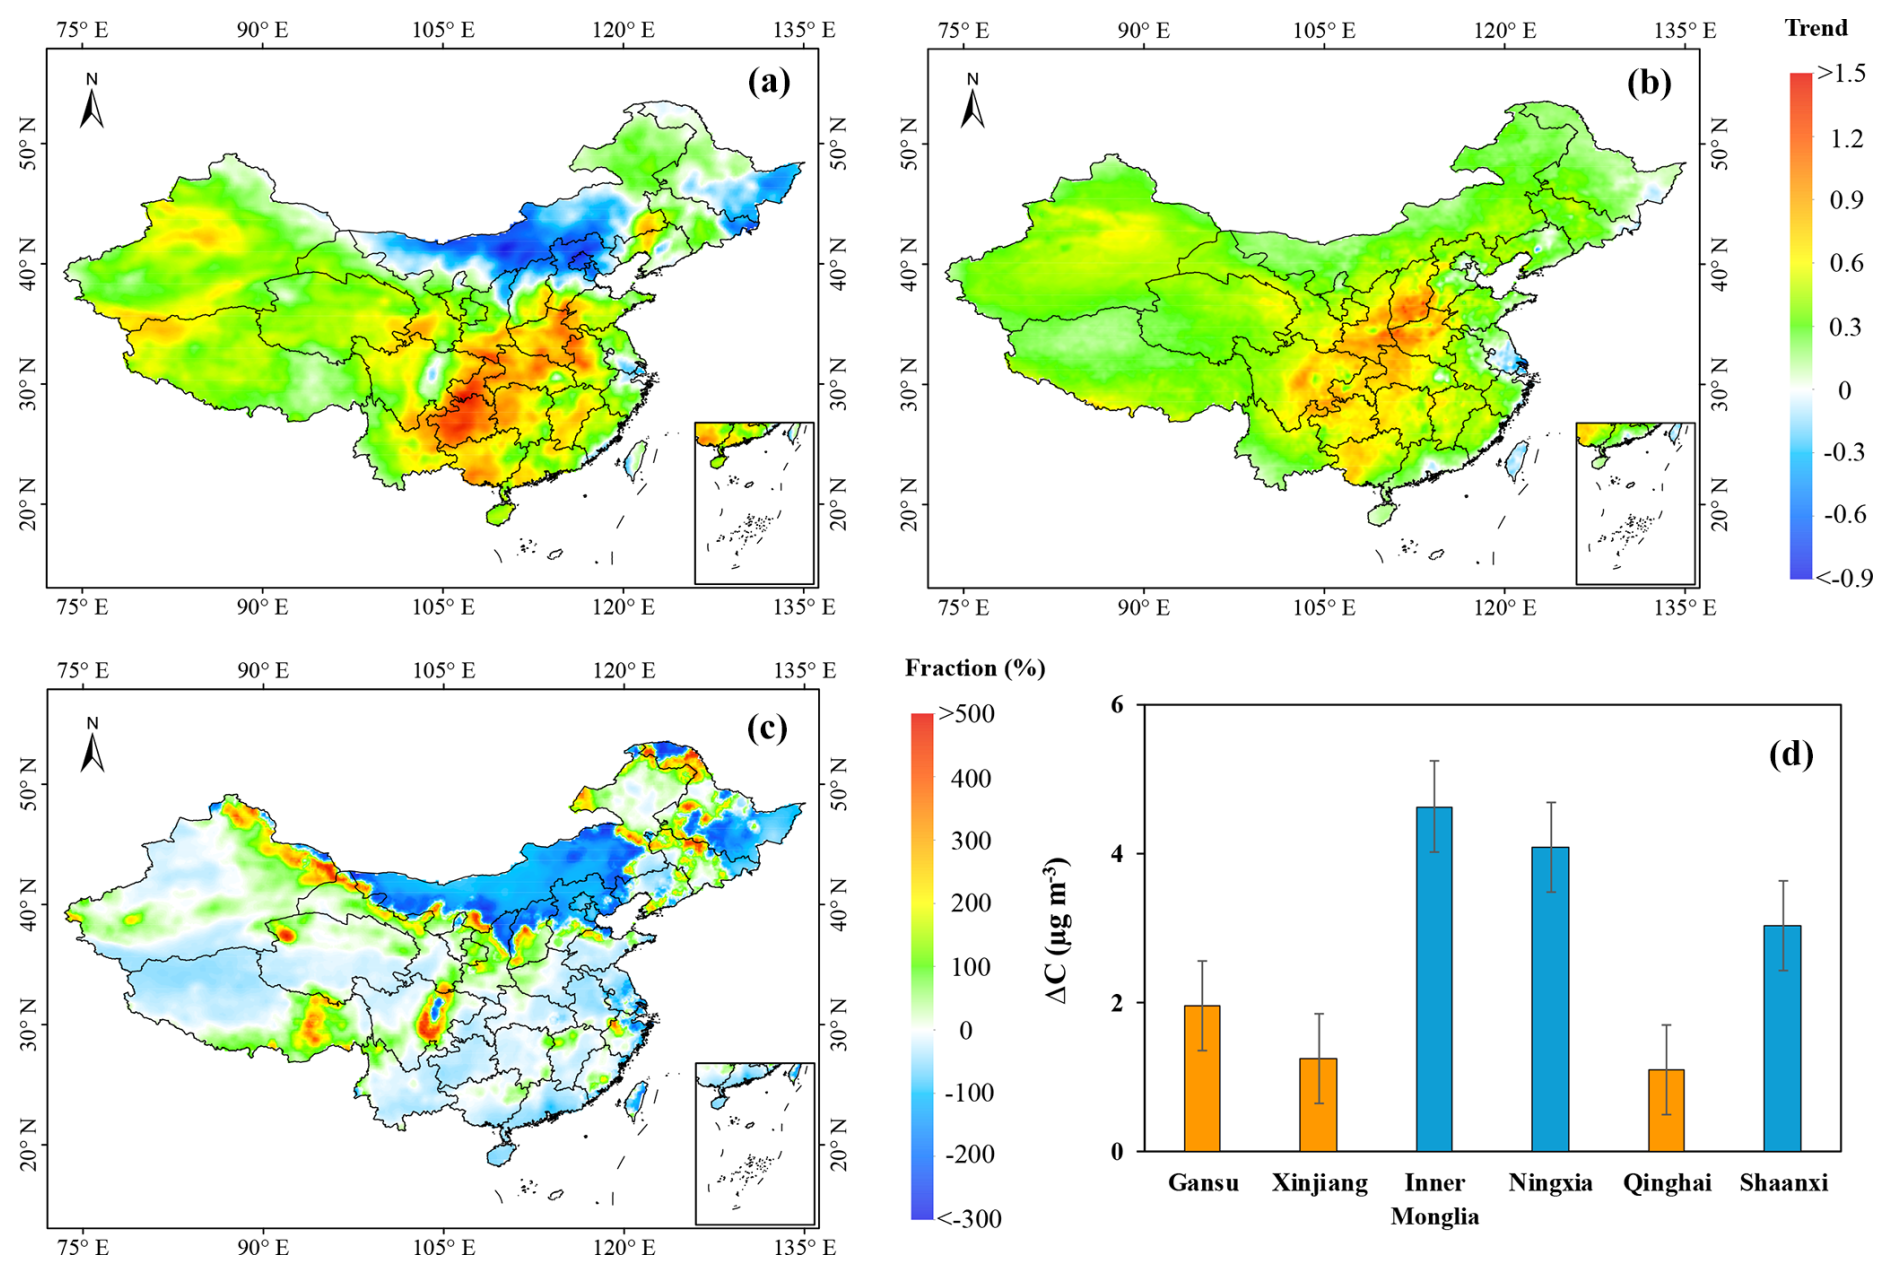
Figure 1MK-Test and Sen's slope estimated summer O3 concentration trend and O3 attribution (fraction or percentage change, %) under baseline (S1) and fixed meteorology (S3) scenarios from 1998 to 2017, respectively. (a) MK-Test and Sen's slope estimated trend from the base scenario S1, the trends of concentrations are well within the MK-Test statistically significant range at 95 % confidence level in terms of > 1.96 criteria; (b) same as panel (a) but for fixed meteorology scenario S3; (c) fraction of O3 concentration trend between the model scenarios 1 and 3 from 1998 to 2017; (d) mean differences of summer mean O3 concentrations averaged from 1998 to 2017 between the model scenarios 1 and 3, defined by , where and stand for mean summer O3 concentrations averaged over 1998 to 2017, respectively. in three westernmost provinces of NW is shown by yellow bars and blue bars for three easternmost provinces of NW. Error bar in Fig. 1d stands for ±1 SD.
To discern potential influences of meteorology on O3 concentrations at the provincial level, we estimated the differences of summer mean O3 concentrations averaged from 1998 to 2017 between model scenarios 1 (S1) and 3 (S3), defined by . Figure 1d illustrates in each province of NW. Since the mean O3 levels under scenario S1 were greater than those under scenario S3 with fixed meteorology in 1998, although in some years we also identified negative ΔO3 in the three westernmost provinces (Xinjiang, Gansu, and Qinghai), we would expect positive , as shown in Fig. 1d. In this context, the values of indicate the extent of meteorological influence on O3 concentrations. Specifically, the smaller , the stronger meteorological influences, as a smaller suggests that O3 levels with varying meteorology (S1) are closer to those with fixed meteorology in 1998 (S3). We highlighted the three provinces with smaller (< 2 µg m−3) using yellow bars, all located in westernmost NW, indicating a weaker increase in O3 concentrations in these three westernmost provinces compared to others, aligning well with the RH trends in these provinces, as compared to the other three provinces located in the east of NW (Inner Mongolia, Ningxia and Shaanxi), as mentioned in the Introduction. As shown in Fig. S12, modeled concentration fractions under the S2 model scenario with fixed emissions in 1998 in the three westernmost provinces of NW are negative, indicating that meteorology tended to inhibit the increase in summer ozone concentrations, particularly in Xinjiang, Gansu and Qinghai, confirming the result in Fig. 1d. In the other three provinces to the east of NW, we observe larger values, suggesting that meteorology, along with precursor emissions, tended to enhance O3 levels from 1998 to 2017. Consequently, we would expect that meteorology favored O3 growth in these three eastern provinces of NW.
3.2 Associations of summer ozone with wetting and warming
Figure 2a illustrates the MK-Test statistics of gridded summer O3 concentrations from 1998 to 2017 subject to the model scenario S2 with fixed emissions and annually varied meteorology, aiming to highlight the effect of meteorology on O3 evolution. A notable decline in summer O3 ozone concentrations is evident in most areas of mainland China, except for the Northern China Plain, central China, the Sichuan Basin and the Guanzhong Plain (inner figure on the left-low corner of Fig. 2a). The declining O3 trends are also evident in most regions across NW with the most substantial decrease occurring in west Gansu, northwest Inner Mongolia and Xinjiang. With fixed emission, such an O3 falling trend is induced primarily by meteorology (climate). Considering that air temperature and humidity are two key meteorological factors influencing O3 fluctuations, we present the MK-test statistics of the trends of summer RH (%) at the 2 m height in Northwestern and mainland China (illustrated in the lower-left corner of Fig. 2b), along with their annual variations depicted in a line chart in the lower-right corner of Fig. 2b. We also present the SAT (K) in Northwestern and mainland China in a line chart in the lower-right corner of Fig. 2c. Compared to many places across Eastern and Central China where RH has negative or drying trends (left-low corner of Fig. 2b), RH in NW showed a marked surge, suggesting pronounced wetting, as reported before (Peng and Zhou, 2017). This can also be seen in the annual changes in the mean RH averaged over NW (the line chart on the right-low corner of Fig. 2b) from 1998 to 2017, dominated by an overall upward RH trend with a mean growth rate of 1.9 % yr−1. Similarly, NW also experienced warming during the same period, as shown in Fig. 2c, particularly in the western part of NW, including Xinjiang, western Gansu Province and Qinghai Province. NW has been undergoing one of the most significant warming trends in the nation. Between 2005 and 2017, NW, particularly the Xinjiang region, has warmed by over 0.5 K with a rate of 0.04 K yr−1. In contrast, eastern and Central China show a cooling trend. The rising SAT trend and falling O3 trend are in contrast to the common knowledge that increasing SATs should enhance O3 levels. The result thus implies that SATs did not dominate the O3 trend in NW.
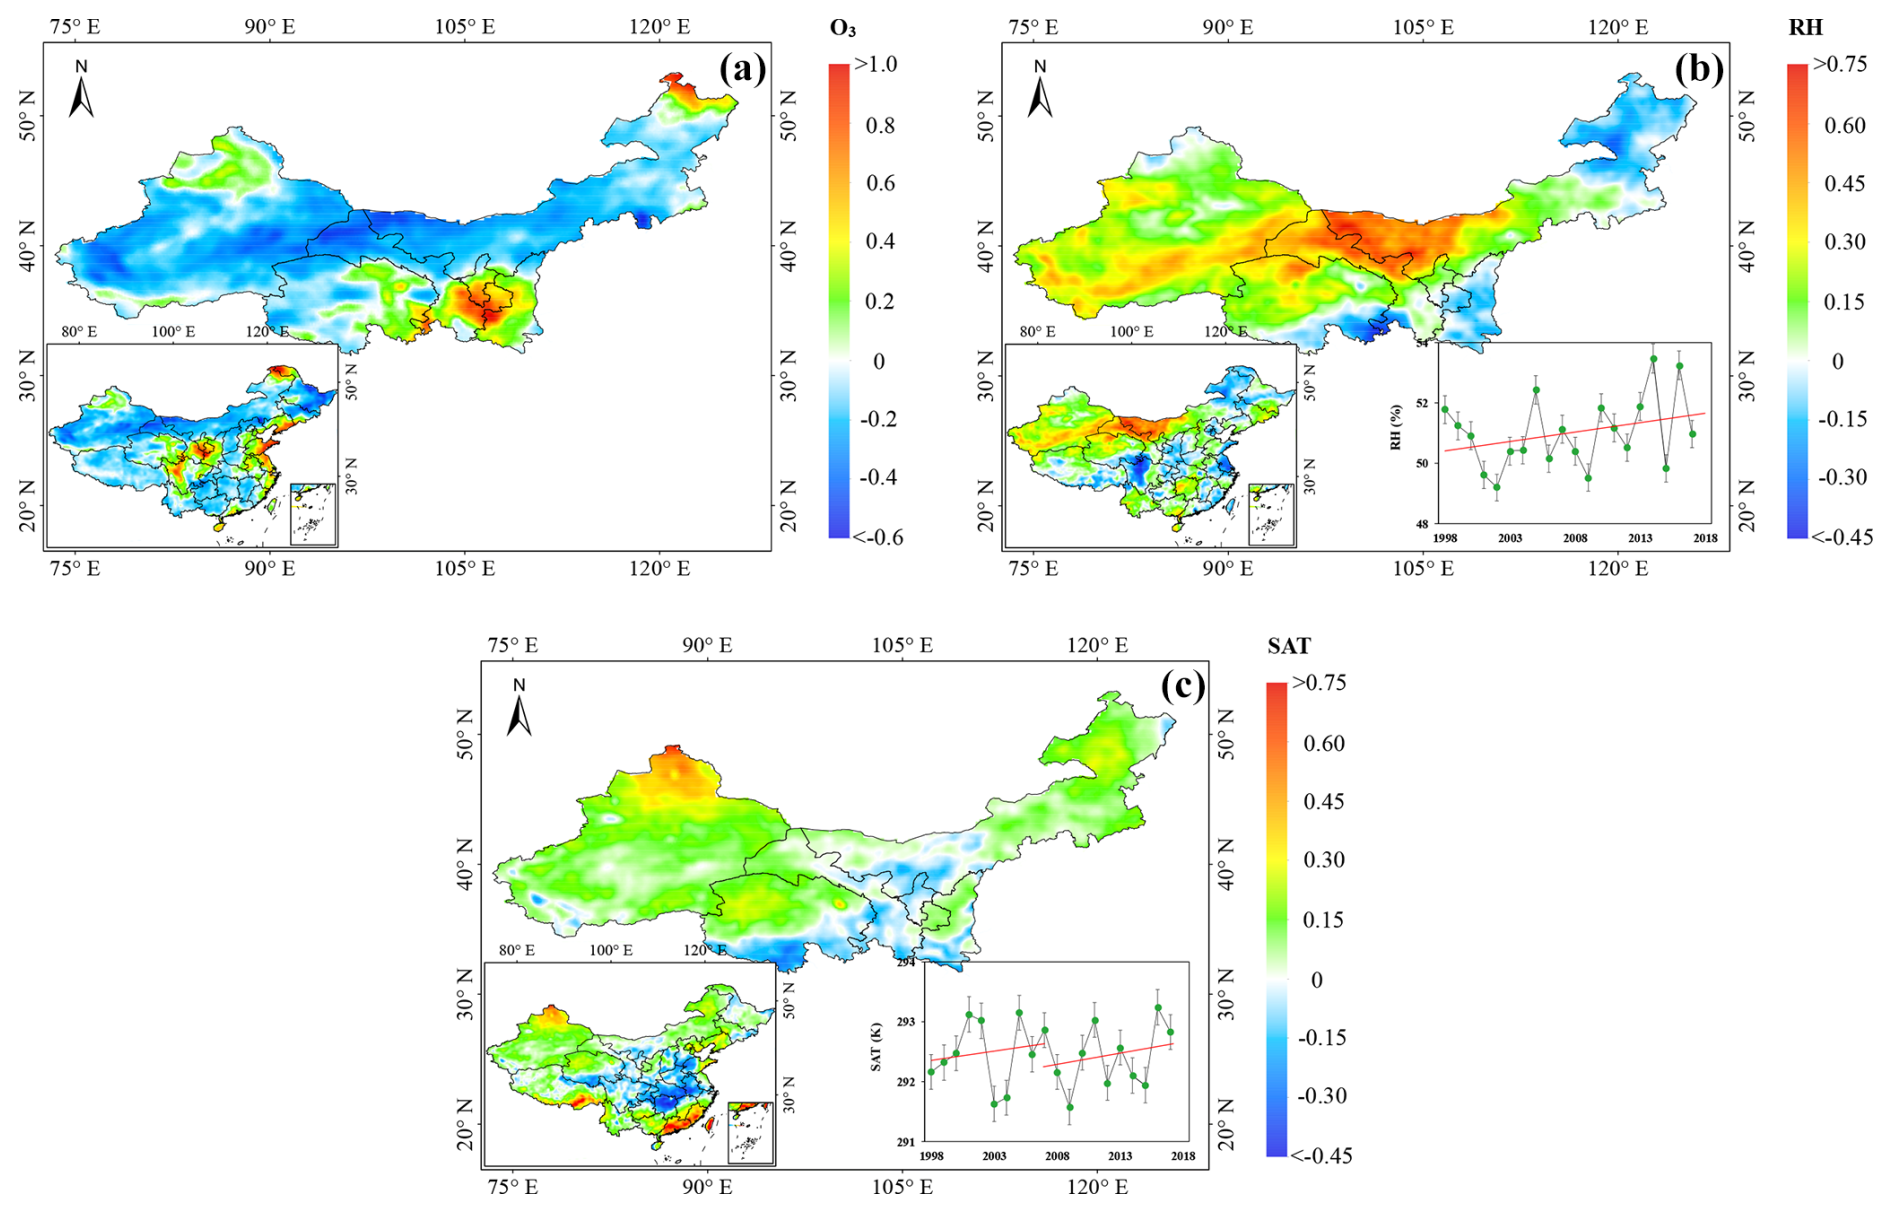
Figure 2(a) MK-Test statistics for the trends of summer O3 concentrations from 1998 to 2017 subject to model scenario 2 (S2) with fixed emissions in 1998, (b) MK-Test statistics for summer RH from 1998 to 2017, the line chart on the low-right corner illustrates summer RH in NW from 1998 to 2017 under scenario 2, (c) MK-Test statistics for trend of summer SATs from 1998 to 2017, the line chart shows summer SATs averaged over Northwest China from 1998 to 2017, under scenario 2. Contour figures on the low left corner of panels (a)–(c) illustrates MK-Test statistics for O3 trends under fixed emission (model scenario 2) and modeled RH and SAT trends in mainland China from 1998 to 2017. The trends are well within the statistically significant range at 95 % confidence level in terms of > 1.96 criteria.
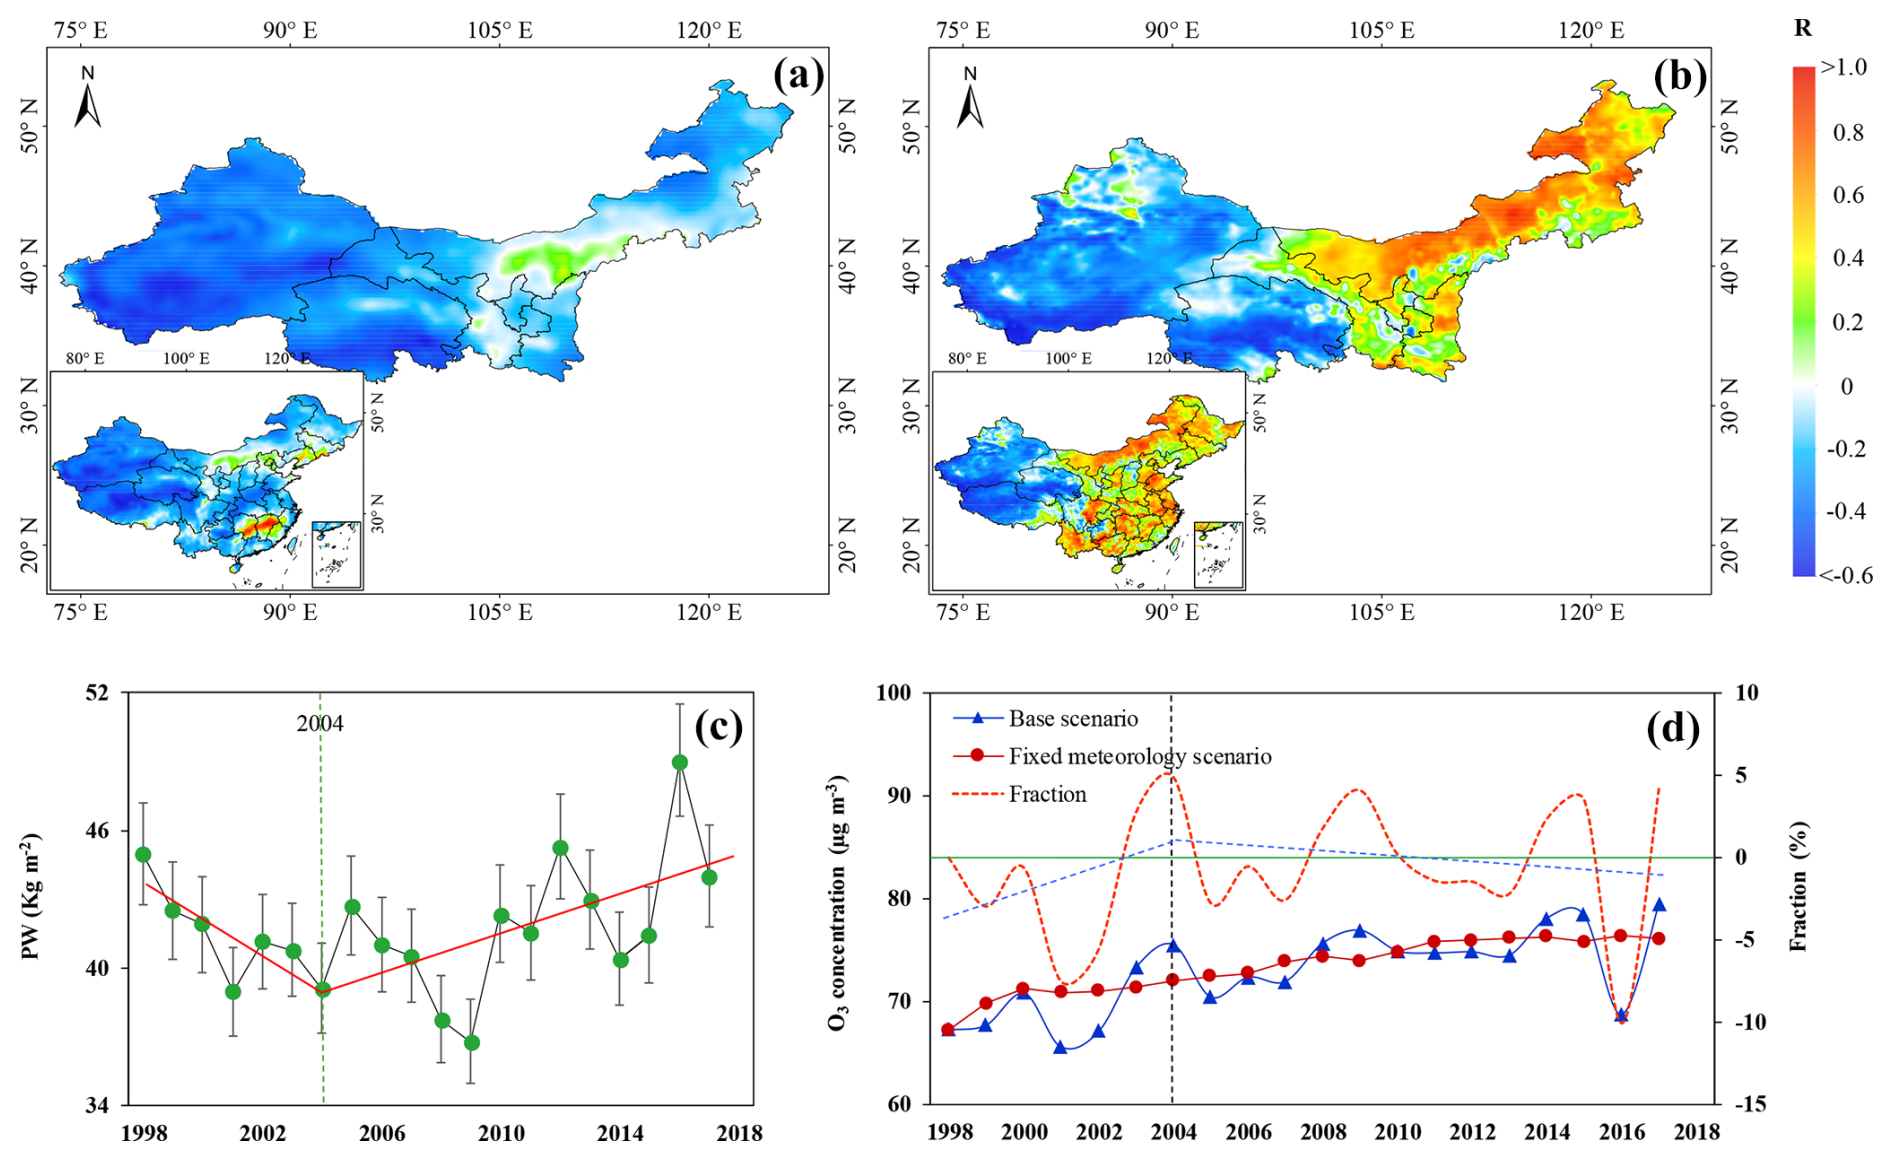
Figure 3(a) Pearson correlation (R) between summer O3 concentration and RH from 1998 to 2017 under S2 scenario, (b) R between summer OH radical concentration and O3 concentration from 1998 to 2017 under S2 scenario, (c) summer surface precipitable water (PW) in the bounded area of NW from 1998 to 2017, error bar stands for ±1 SD and red solid line stands for linear trend, (d) summer O3 concentrations under Scenarios 1 (dark blue solid line with triangles) and 3 (red solid line with circles) scaled on the left y axis, and their fractions % (red dashed line) in the three westernmost provinces of NW (Xinjiang, Qinghai, and Gansu), where CS1 and CS3 are the summer (June to August) surface O3 air concentrations from the base (S1) and fixed meteorology (S3) scenarios, scaled on the right y axis, the blue dashed line in panel (d) is a linear fitting line from 1998 to 2004 and 2004 to 2017, respectively. The green solid line represents the zero-value line of the fraction.
As mentioned earlier, since rising temperatures favor O3 formation while increasing humidity is detrimental to O3 growth, it is intriguing to investigate which of these two meteorological factors contributes more to the O3 trend in NW. We first calculated linear correlation coefficients between RH and O3 concentrations modeled from the S2 scenario (fixed emissions) from 1998 to 2017 across Northwestern and mainland China (bottom left corner of Fig. 3a). Strong negative correlations are evident in most regions of Xinjiang, Qinghai, and Western Gansu. These negative correlations indicate declining O3 concentrations with rising RH. To highlight the influences of RH and precipitation on summer O3 variation, Fig. 3d illustrates modeled mean summer O3 concentrations averaged over the three westernmost provinces of NW (Xinjiang, Qinghai and Gansu) under the base scenario S1 with annually varying summer meteorology and emissions, and S3 with fixed meteorology in 1998 and annually varying emissions averaged over NW, along with the concentration fractions (%, red dashed line) between the two scenarios from 1998 to 2017. O3 concentrations exhibit the same increasing trend primarily driven by rising precursor emissions. However, the S1 scenario shows more significant annual fluctuations (solid dark blue line in Fig. 3d) compared to the S3 scenario (solid red line in Fig. 3d). These stronger fluctuations can be attributed to the influence of meteorology. Since scenarios 1 and 3 shared the same emissions and chemistry, the concentration fractions quantify the contributions of meteorology to the O3 trend alone. As shown, the fractions increased from 1998 to 2004, decreased thereafter, and turned negative after 2009 (the red dashed lines), indicating that meteorology has led to declining O3 concentrations since 2005 in NW. Among the two key meteorological factors influencing O3 formation, increasing SAT (Fig. 2c) tends to elevate O3 levels, which contradicts the decreasing and negative O3 fractions. Consequently, RH probably plays a more significant role in the O3 trend in NW, as rising RH aligns well with the decreasing and negative O3 fractions.
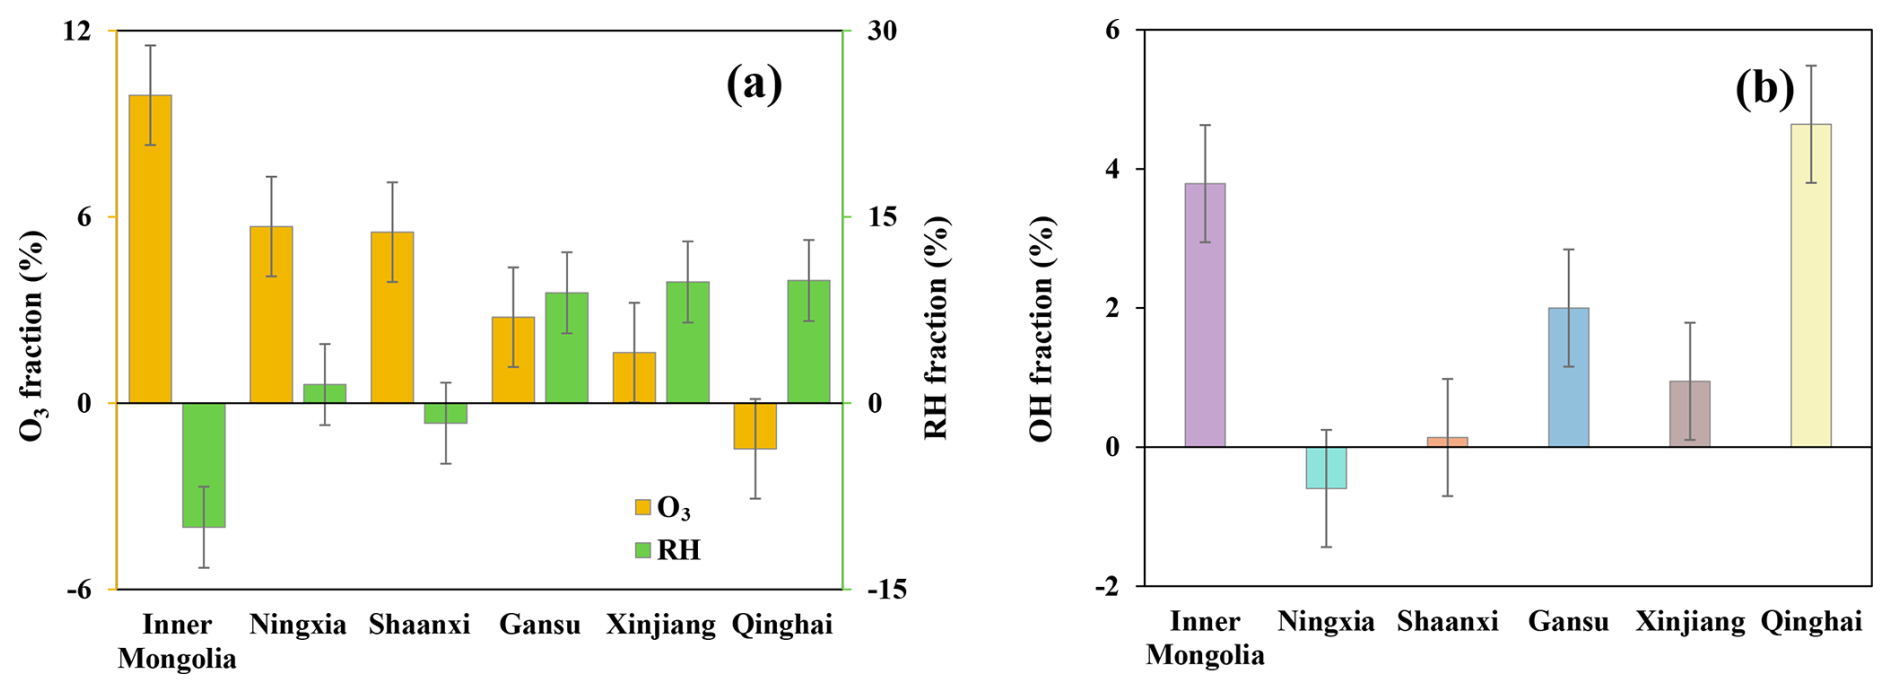
Figure 4Summer RH, O3, and OH radical fractions between 1998 and 2017 in six provinces of NW under the fixed emission scenario (S2). (a) RH and O3 fractions, O3 fractions are scaled on the left y-axis, and RH fractions are scaled on the right y-axis, (b) OH radical fractions. Error bars denote ±1 SD.
Figure 3c displays the mean summer surface precipitable water (PW, kg m−2) over the region bounded between 75–100° E in NW from 1998 to 2017, collected from the NCAR reanalysis (https://psl.noaa.gov/cgi-bin/data/composites/printpage.pl, last access: 13 June 2024). One can identify a slow decrease in PW from 1998 to 2004 and a rapidly growing PW thereafter. Since warming exacerbates drought in arid and sub-arid NW (Lian et al., 2021), growing precipitation in NW implies that increasing humidity might play a more significant role than warming in the changing climate, which acts to reduce O3 levels via precipitation washout and chemistry. A close look at Figs. 2b, c and 3a indicate that more substantial warming and wetting occurred in Xinjiang, Gansu (including westernmost of Inner Mongolia) and Qinghai provinces. We compared the fractions of provincial mean summer RH and summer O3 concentrations from the fixed emissions and annually varying meteorology scenario (S2) between 1998 and 2017 (Fig. 4a), defined by %, where f is the concentration or RH fractions and Y1998 and Y2017 stand for O3 concentrations or RH in 1998 and 2017, respectively, thereby to highlight the net effect from meteorology. The most significant fraction of O3 concentration was identified in Inner Mongolia at 9.9 %, followed by Ningxia (5.7 %), Shaanxi (5.5 %), Gansu (2.8 %), Xinjiang (1.6 %) and Qinghai (−1.5 %), respectively. Among the six provinces, Xinjiang and Gansu accounted for smaller O3 fractions, and Qinghai accounted for a negative fraction (Fig. 4a), indicating that O3 levels in these three provinces inclined less significantly or even declined (Qinghai) between 1998 and 2017 as compared to the other three provinces. Interestingly, more significant O3 fractions, meaning growing O3 levels for the two decades in Inner Mongolia, Ningxia and Shaanxi, correspond to smaller (Ningxia) or negative (Inner Mongolia and Shaanxi) RH fractions, meaning falling RH. In contrast, more diminutive and negative O3 fractions in Xinjiang, Gansu, and Qinghai provinces are associated well with the stronger increasing trend of summer RH by MK-test (Figs. 2b and 4a) at the growing rate of 9.8 % in Xinjiang, 8.9 % in Gansu and 9.9 % in Qinghai from 1998 to 2017, respectively. While the weak or falling summer O3 levels in three provinces respond to both growing RH and SAT trends (Fig. 2b and c), since growing SATs tend to enhance O3 concentrations but modeled O3 respond weakly to rising SAT in these three provinces, the result demonstrates again that the wetting might inhibit O3 formation and increment for the past decades in NW.
Note that model scenario 2 with fixed emissions also considers chemistry, in which OH radicals and water vapor can interact. The primary source of OH radicals in the atmosphere is the reaction between water vapor (H2O) and excited oxygen atoms (O(1D)), which are formed by the photolysis of ozone (O3) by ultraviolet (UV) radiation. The OH radicals react with ozone to form oxygen (O2) and the excited oxygen atom O(1D), which can further react with water vapor to regenerate two OH radicals:
This reaction does not lead to a net reduction in OH radicals but contributes to ozone removal by initiating reactions that lead to the formation of less reactive species. Figure 3b is a correlation diagram between modeled summer O3 concentrations and OH radicals in NW and mainland China (the left-low corner of Fig. 3b) subject to the fixed emission scenario (S2). The spatial pattern of correlation coefficients in NW is, to some extent, similar to that between O3 concentrations and RH (Fig. 3a), showing the negative associations between OH radicals and O3 concentrations, particularly in Xinjiang and Qinghai with the most significant wetting trend, suggesting that increasing OH radicals reduce O3 levels. Figure 4b displays the fractions of provincial mean summer OH radicals from the fixed emissions and annually varying meteorology scenario (S2) between 1998 and 2017. Relatively larger positive fractions can be discerned in Xinjiang, Qinghai and Gansu, meaning increasing OH radicals in these provinces as a result of increasing RH (Eq. 1), which corresponds to higher RH fractions and lower O3 fractions. An exception occurs in Inner Mongolia, where the large positive OH radical fraction (Fig. 4b) is associated with negative RH and large O3 fractions (Fig. 4a). OH radicals show an increasing trend (Fig. S13) which agrees with the positive correlation between OH and O3 concentrations shown in Fig. 3b. This anomaly from the modeling results requires further investigations.
There are several primary mechanisms of OH radicals leading to O3 reduction, including the reaction with VOCs to form peroxyl radicals (RO2), the reaction of RO2 with nitrogen oxides (NOx = NO + NO2) to form nitrogen dioxide (NO2) and other compounds, and photodissociation of NO2. Figure S10a and b show the MK test estimated NOx and NMVOC emission trends from 1998 to 2017. While increasing NOx is observed in NW (Fig. S10a), its emission levels are considerably lower than in Eastern and Southern China (Fig. S10c). Both NMVOC emission levels and trends in NW are significantly smaller than in Eastern and Southern China due to lower populations and less developed economies (Fig. S10b and d). Hence, it is likely that the reaction of water vapor (H2O) with excited oxygen atoms (O(1D)) produced by the photodissociation of ozone by UV light plays a specific role in the negative correlation between O3 and OH radicals.
A multiple regression model (MRM) was established to further quantitatively assess the contribution of RH and SAT to summer O3 concentrations in NW. The MRM has been applied in a number of investigations to quantify meteorological effects on ozone evolution in China (Li et al., 2019, 2020b, 2021a; Yan et al., 2024). For SAT and RH, the MRM model can be defined as
where α, β1 and β2 are model coefficients, and ε is a random error. In the first instance, we considered three provinces with significant wetting trends: Xinjiang, Gansu and Qinghai. We combined annual summer O3, RH, and SAT from three provinces into one time series of each dependent and independent variable from 1998 to 2017, yielding 60 samples for each variable. Tables S4–S6 list regression coefficients and statistics of the MRM. To examine the multicollinearity in the MRM, we estimated the variance inflation factor (VIF, Tables S4–S6). The VIFs for RH and SAT are far less than 10, indicating no multicollinearity in the model. The contribution of RH and SAT to O3 is calculated by:
where , and βi denotes the regression coefficient of independent variable i (namely, RH and SAT), SDi is the standard deviation of regression coefficient of independent variable i, and SDα represents the standard deviation of coefficient of intercept.
The MRM analysis reveals that RH contributes 77.5 %, 59.4 % and 46.2 % to O3 variations in Xinjiang, Qinghai and Gansu, respectively. Accordingly, SAT contributes 22.5 %, 40.6 % and 53.8 %, respectively, to O3 fluctuations in these three provinces from 1998 to 2017. The results indicate that RH has become a major contributor to long-term change in O3 concentrations, overwhelming or equivalent to SAT's contributions to the O3 trend for the past two decades, probably via interactions among increasing precipitation washout and OH radical, O3 concentration, and water vapor.
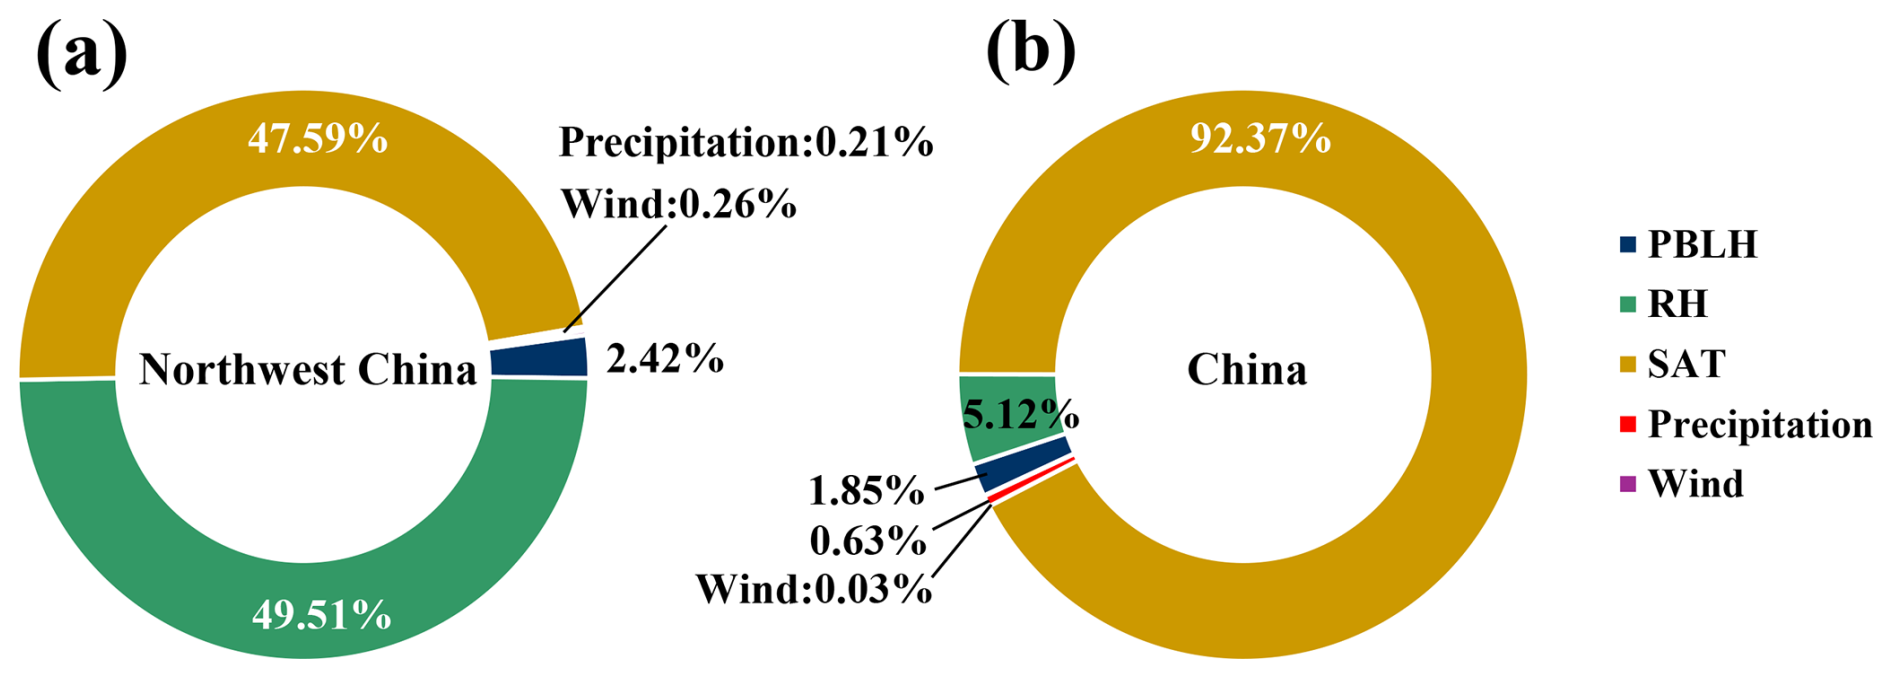
Figure 5Contribution of PBLH (planetary boundary-layer height), RH, SAT, precipitation, and wind to O3 evolution. (a) Northwest China, (b) Mainland China.
We further assess the contributions of precipitation, RH, SAT, winds and planetary boundary-layer height (PBLH) to O3 evolution in NW using an extended MRM model. The results confirm that RH and SAT made the most significant contributions to long-term ozone trends than other meteorological variables under the long-term perspective. As seen from Fig. 5, the contribution of RH (49.5 %) and SAT (47.6 %) to O3 evolution in NW was almost equivalent (Fig. 5a), but the SAT (92.4 %) dominated in entire mainland China (Fig. 5b). Whereas the PBLH only contributed approximately 2 % to O3 variations because the PBLH varies on a daily and hourly basis and affects insignificantly (summer) seasonal changes in O3 concentrations.
Note that since the wetness also helps growing vegetation, which causes increasing biogenic VOC (BVOC) emission and hence rising O3 concentrations, the contribution of BVOCs to O3 fluctuations under increasing wetness should also be taken into consideration. To examine this hypothesis, we designed an extra model scenario (S5) in which we used the updated LUC data (Sect. 2.4) and fixed LUC in 1998 in the WRF-Chem simulation and ran the model from 1998 to 2017. Since the LUC defines vegetation coverage, the fixed LUC suggests no vegetation change during this period. We then estimated the fractions between modeled O3 concentration with fixed LUC and the baseline scenario S1 with annually-varying LUC, thereby eliminating the effects from emissions, meteorology and chemistry but highlighting the LUC (or greenness) effect only. The result is illustrated in Fig. S14. As shown, while the fraction fluctuates positively (Xinjiang) and negatively (Northern Shaanxi and Eastern Inner Mongolia), indicating increasing and decreasing O3 levels induced by LUC or greening, the magnitudes of provincial mean concentration fractions are very small, mostly in the range −1 % to 0.3 %, suggesting that the LUC under the wetting trend in NW plays an insignificant role in O3 fluctuation.
3.3 Projected future climate impacts on summer ozone
Given the significant impacts of wetting on O3 evolution in NW over the past two decades, concerns have also been raised regarding O3 responses to future wetting and warming. We estimated the projected O3 concentrations, RH and SAT fractions between the baseline and fixed meteorology scenarios under the SSP2-4.5 and SSP5-8.5 pathways (Sect. 2.6) for the years 2019, 2030, and 2060, respectively (Figs. 6 and 7). As mentioned earlier, since both scenarios implemented the same emissions and chemistry but the baseline scenario accounted for variable meteorology, the fractions (or differences) between the two scenarios eliminated the effects of emissions and chemistry, thereby isolating meteorological signals only.
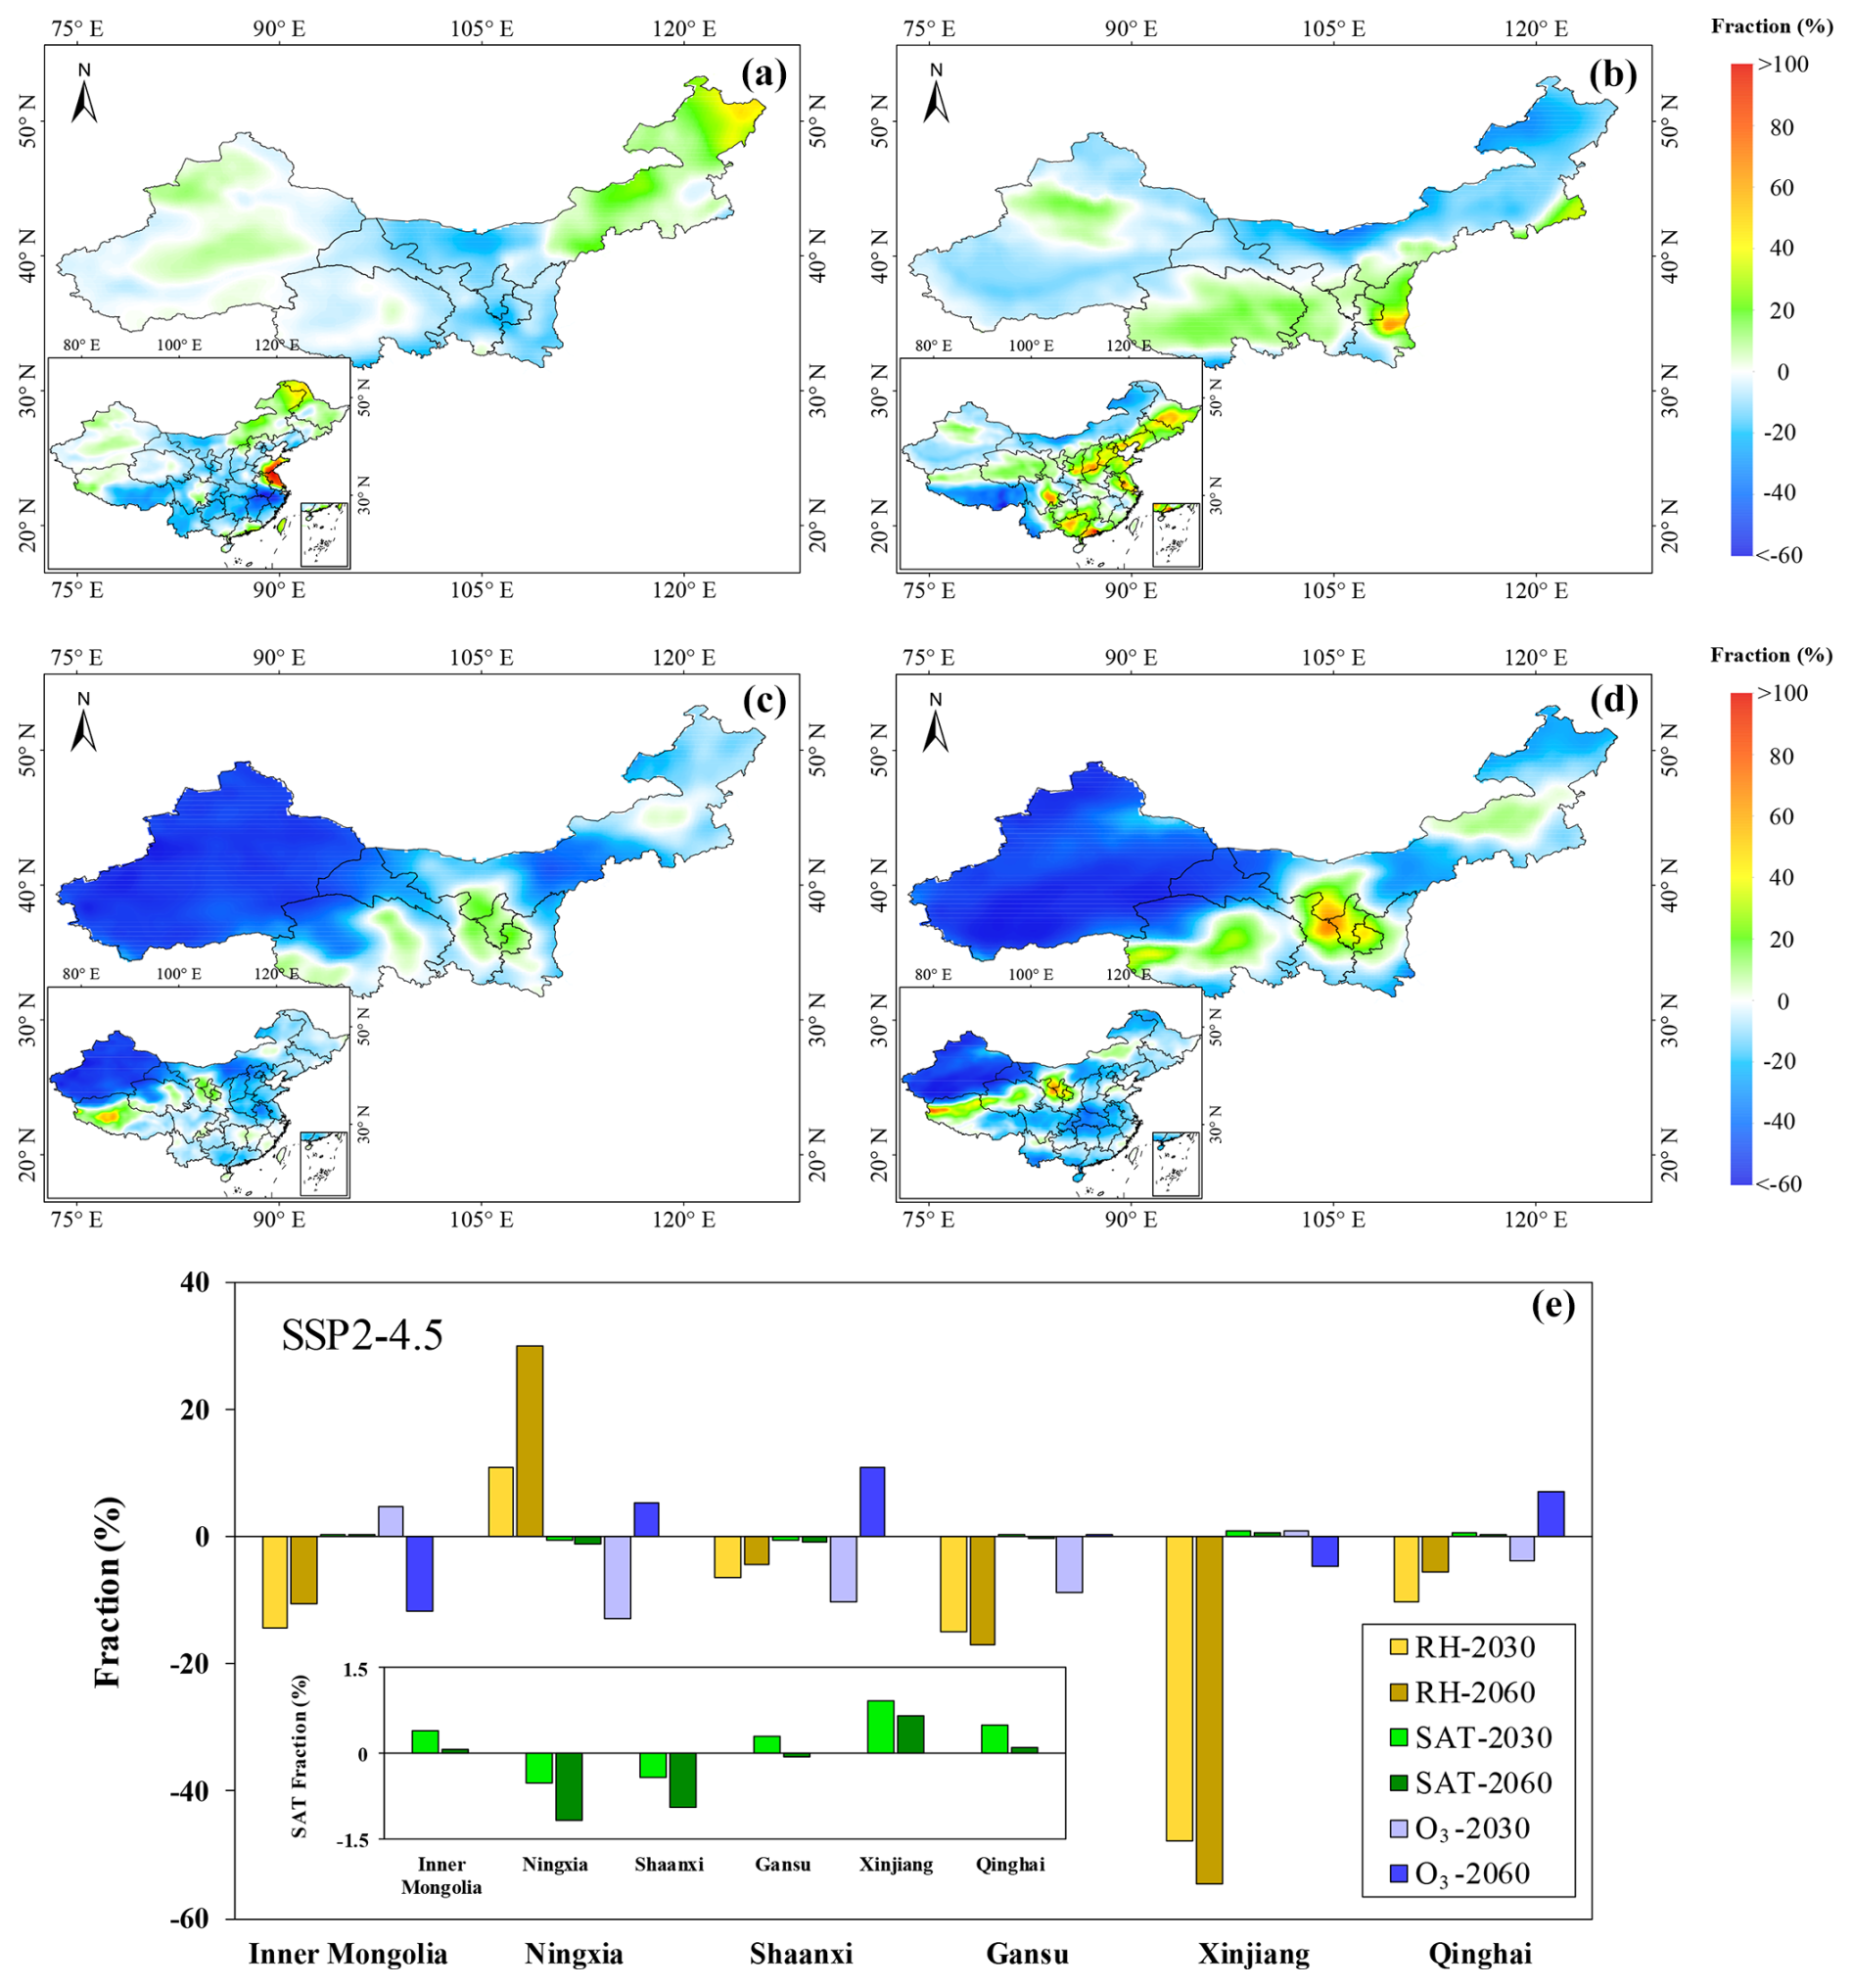
Figure 6(a) Summer O3 concentration fractions of 2019 to 2030 under SSP2-4.5scenario, estimated by %, where C2019 and C2030 are the summer surface O3 air concentrations in 2019 and 2030, respectively, (b) same as panel (a) but for O3 fractions of 2019 to 2060, (c) same as panel (a) but for summer RH fractions of 2019 to 2030, (d) same as panel (a) but for summer RH fractions of 2019 to 2060, (e) fractions of RH, SAT, and O3 of 2019 to 2030 and 2019 to 2060 (shown in the same color bar as 2030 but with oblique lines) in the six provinces of NW under the SSP2-4.5 scenario.
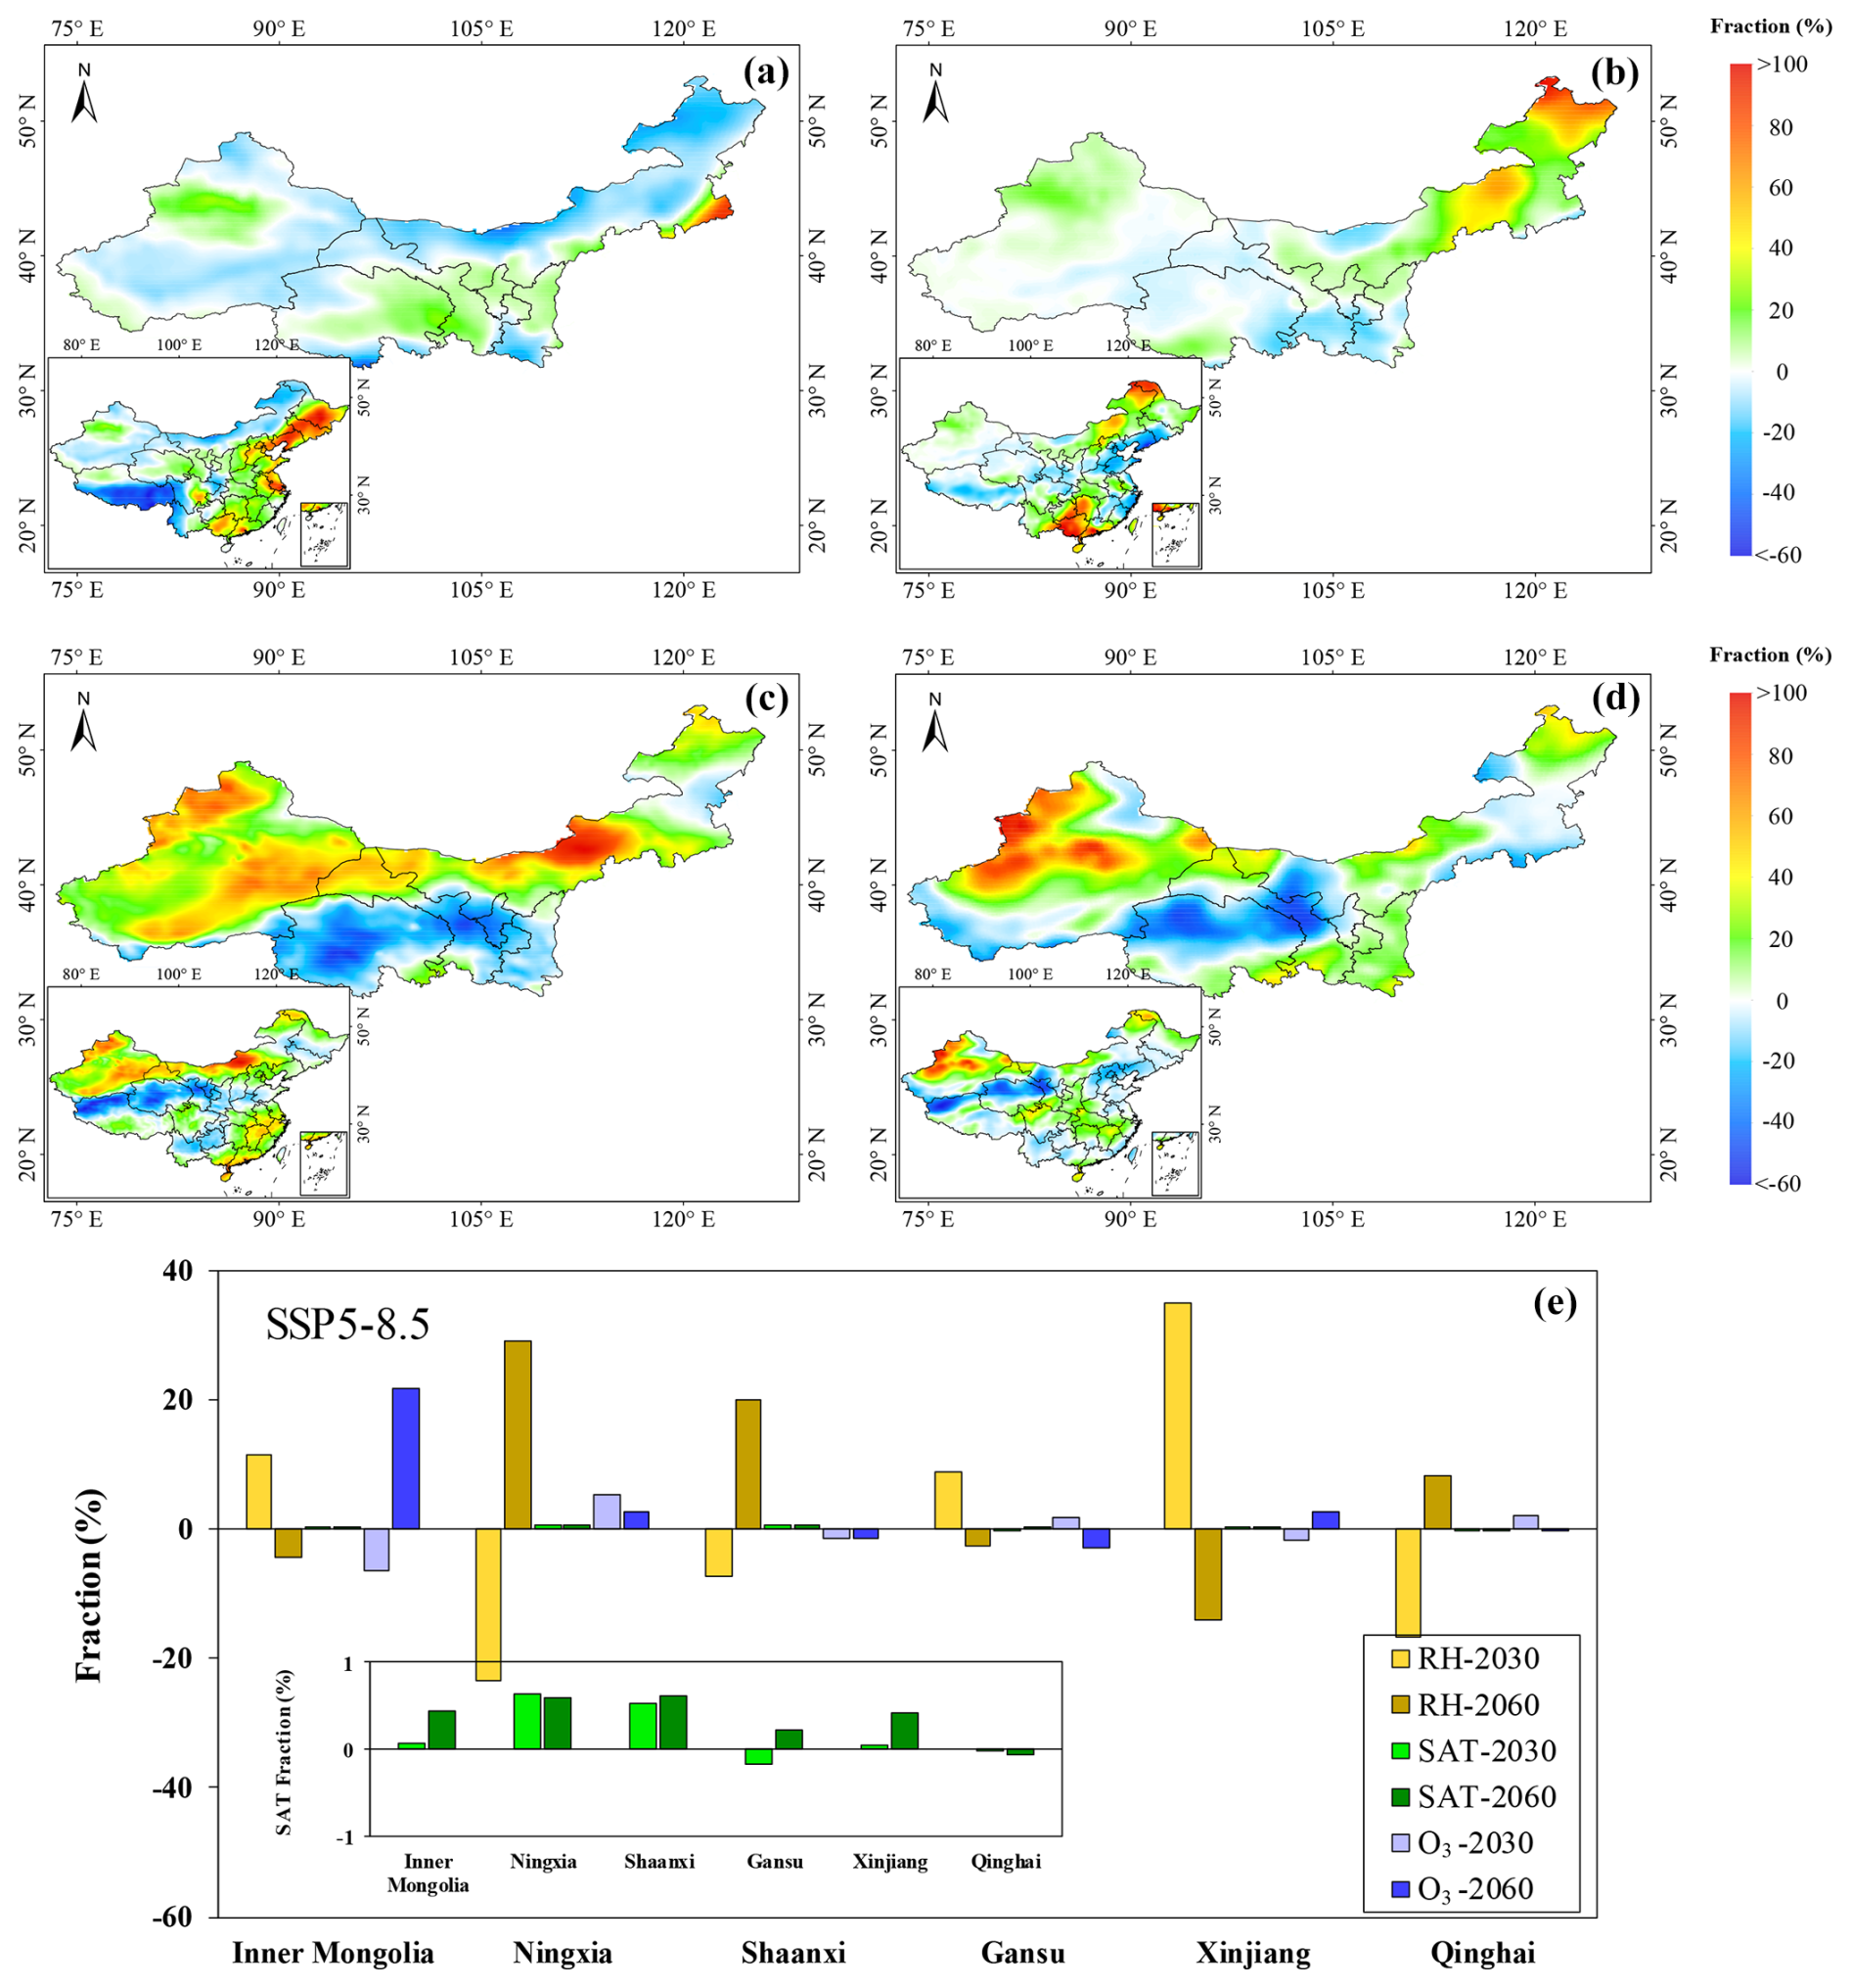
Figure 7(a) Summer O3 concentration fraction of 2019 to 2030 under the SSP5-8.5 scenario, estimated by %, where C2019 and C2030 are the summer surface O3 air concentrations in 2019 and 2030, respectively, (b) same as panel (a) but for O3 fraction of 2019 to 2060, (c) same as panel (a) but for summer RH fraction of 2019 to 2030, (d) same as panel (a) but for summer RH fraction of 2019 to 2060, (e) fractions of RH, SAT, and O3 of 2019 to 2030 and 2019 to 2060 (shown in the same color bar as 2030 but with oblique lines) in the six provinces of NW under the SSP5-8.5 scenario.
Detailed discussions on the associations between projected O3 evolution and trends of RH and SAT under the SSP2-4.5 and SSP5-8.5 pathways from 2019 to 2030 and from 2019 to 2060 are presented in Sect. S4 in the Supplement and Figs. 6–7 and S15, respectively. Overall, from 2019 to 2030, we observe a stronger negative association between O3 and RH under SSP5-8.5 than under SSP2-4.5 across NW, suggesting that climate conditions under the SSP5-8.5 scenario will more effectively suppress O3 growth compared to SSP2-4.5 during this period. However, from 2019 to 2060, the SSP5-8.5 tends to project higher O3 levels than SSP2-4.5. From a wetting trend perspective, we must determine which pathway would project a more realistic future humidity trend in NW. China has been making significant strides in transitioning to renewable energy sources, reducing its carbon footprint, and committing to achieve a carbon peak before 2030 and carbon neutrality by 2060. These commitments align more closely with the mitigation efforts outlined in SSP2-4.5, which, as manual interventions, will overshadow the impact of climate change on O3 fluctuations. There have also been debates regarding ongoing wetting trends in NW based on CMIP6 projections under SSP5-8.5 and historical data analysis (Huang et al., 2017). Historically, China's rapid economic growth has heavily depended on fossil fuels, which may render SSP5-8.5 more applicable in China. The responses of O3 evolution to RH under SSP5-8.5 are more akin to those observed from 1998 to 2017 (Sect. 3.2) than to SSP2-4.5. In light of this, while China may achieve its carbon peak and neutrality goals, the wetting trend in NW will probably persist in the coming decades, exacerbating continuous O3 pollution in NW, in addition to manual interventions. Under SSP5-8.5, the projected increase in humidity (e.g., 34.9 % in Xinjiang by 2030) may enhance O3 wet deposition, partially offsetting the warming-driven O3 rise. This aligns with Li et al. (2014), who identified humidity as a critical factor modulating cross-regional ozone transport efficiency.
This study conducted extensive sensitivity model simulations to explore the surface O3 responses to past and future climate change in NW. The results demonstrated that significant wetting since the 21st century in this region, particularly in the three westernmost provinces (Xinjiang, Qinghai and Gansu) of NW, has slowed O3 growth. We show that in these provinces, the wetting influence on O3 evolution has outweighed the warming effect and played an almost equal role to warming across the entire NW. Both factors contributed approximately 50 % to summer O3 variations from 1998 to 2017, among the major meteorological factors causing changes in O3 concentrations. This finding contrasts with the dominant role of warming in the meteorological effects on O3 evolution in China. We linked the increasing OH radicals, which interact with water vapor, to the declining O3 trend. Given that humidification in NW is projected to continue in the coming years and that the mitigation of O3 precursor emissions in China will still be implemented under the nation's air pollution control strategies, the impact of humidification on O3 trends in NW will probably become more significant. Such an impact should be considered in future policymaking for the reduction of O3 pollution in NW. While this study advances our understanding of ozone-climate interactions in NW, several uncertainties warrant attention. First, the reliance on static emission inventories (e.g., EDGAR) may underestimate dynamic sources such as soil NOx emissions, which are critical in arid region. Second, the 20 km resolution of WRF-Chem may inadequately resolve fine-scale topographic effects on local meteorology (e.g., valley breezes in mountainous NW), potentially biasing ozone simulations. Future work should integrate high-resolution emission inventories to improve accuracy. In addition, ground-based ozone measurements in remote NW remain sparse, limiting robust model validation. Expanding monitoring networks will be essential to constrain uncertainties.
ERA-Interim reanalysis data can be accessed at https://rda.ucar.edu/datasets/d627000/ (last access: 26 August 2025). EDGAR dataset is available at https://edgar.jrc.ec.europa.eu/ (last access: 26 August 2025). LUC data can be accessed at https://www.resdc.cn/ (last access: 26 August 2025). DPEC Inventory is available at http://meicmodel.org.cn (last access: 26 August 2025). The meteorological data under the CMIP6 framework is collected from https://aims2.llnl.gov/search/cmip6/ (last access: 26 August 2025).
The supplement related to this article is available online at https://doi.org/10.5194/acp-25-9669-2025-supplement.
XZ and YY contributed equally to this article. All authors contributed to the manuscript and have given approval of the final version. XZ and HG coordinated and supervised the project. XZ, YY, WW and JM designed the present experiment, carried out modeling, and drafted the manuscript. NZ, HS, XJ, CW, and HM collected the data. XZ, YY, ZY and TH analyzed simulation results.
The contact author has declared that none of the authors has any competing interests.
Publisher's note: Copernicus Publications remains neutral with regard to jurisdictional claims made in the text, published maps, institutional affiliations, or any other geographical representation in this paper. While Copernicus Publications makes every effort to include appropriate place names, the final responsibility lies with the authors. Regarding the maps used in this paper, please note that Figs. 1–3 and 6–7 contain disputed territories.
We wish to thank the High-performance Computing Platform of Peking University for supporting the extensive model simulations of this study.
This research has been supported by the National Natural Science Foundation of China (grant nos. 42407134, 42177351, and 41977357).
This paper was edited by Leiming Zhang and reviewed by two anonymous referees.
Bei, N. F., Zhao, L. N., Wu, J. R., Li, X., Feng, T., and Li, G. H.: Impacts of sea-land and mountain-valley circulations on the air pollution in Beijing-Tianjin-Hebei (BTH): A case study, Environ. Pollut., 234, 429–438, https://doi.org/10.1016/j.envpol.2017.11.066, 2018.
Belan, B. D. and Savkin, D. E.: The Role of Air Humidity in Variations in Near-Surface Ozone Concentration, Atmospheric and Oceanic Optics, 32, 586–589, https://doi.org/10.1134/S1024856019050038, 2019.
Bossioli, E., Tombrou, M., Kalogiros, J., Allan, J., Bacak, A., Bezantakos, S., Biskos, G., Coe, H., Jones, B. T., Kouvarakis, G., Mihalopoulos, N., and Percival, C. J.: Atmospheric composition in the Eastern Mediterranean: Influence of biomass burning during summertime using the WRF-Chem model, Atmos Environ., 132, 317–331, https://doi.org/10.1016/j.atmosenv.2016.03.011, 2016.
Cheng, J., Tong, D., Zhang, Q., Liu, Y., Lei, Y., Yan, G., Yan, L., Yu, S., Cui, R. Y., Clarke, L., Geng, G. N., Zheng, B., Zhang, X. Y., Davis, S. J., and He, K. B.: Pathways of China's PM2.5 air quality 2015–2060 in the context of carbon neutrality, Natl. Sci. Rev., 8, nwab078, https://doi.org/10.1093/nsr/nwab078, 2021.
Cheng, J., Tong, D., Liu, Y., Geng, G. N., Davis, S. J., He, K. B., and Zhang, Q.: A synergistic approach to air pollution control and carbon neutrality in China can avoid millions of premature deaths annually by 2060, One Earth, 6, 978–989, https://doi.org/10.1016/j.oneear.2023.07.007, 2023.
Cooper, O., Parrish, D., Ziemke, J., Balashov, N., Cupeiro, M., Galbally, I., Gilge, S., Horowitz, L., Jensen, N., Lamarque, J., Naik, V., Oltmans, S., Schwab, J., Shindell, D., Thompson, A., Thouret, V., Wang, Y., and Zbinden, R.: Global distribution and trends of tropospheric ozone: An observation-based review, Elem. Sci. Anth., 2, 000029, https://doi.org/10.12952/journal.elementa.000029, 2014.
Crippa, M., Guizzardi, D., Muntean, M., Schaaf, E., Dentener, F., van Aardenne, J. A., Monni, S., Doering, U., Olivier, J. G. J., Pagliari, V., and Janssens-Maenhout, G.: Gridded emissions of air pollutants for the period 1970–2012 within EDGAR v4.3.2, Earth Syst. Sci. Data, 10, 1987–2013, https://doi.org/10.5194/essd-10-1987-2018, 2018.
Ding, J., Dai, Q., Zhang, Y., Xu, J., Huangfu, Y., and Feng, Y.: Air humidity affects secondary aerosol formation in different pathways, Sci. Total Environ., 759, 143540, https://doi.org/10.1016/j.scitotenv.2020.143540, 2021.
Ding, J., Dai, Q., Fan, W., Lu, M., Zhang, Y., Han, S., and Feng, Y.: Impacts of meteorology and precursor emission change on O3 variation in Tianjin, China from 2015 to 2021, J. Environ. Sci., 126, 506–516, https://doi.org/10.1016/j.jes.2022.03.010, 2023a.
Ding, S., Jiang, X., and Wu, C.: Contrasting near-surface ozone pollution in wet and dry year over China, Int. J. Env. Res. Pub. He., 20, 998, https://doi.org/10.3390/ijerph20020998, 2023b.
Eck, T. F., Holben, B. N., Kim, J., Beyersdorf, A. J., Choi, M., Lee, S., Koo, J. H., Giles, D. M., Schafer, J. S., Sinyuk, A., Peterson, D. A., Reid, J. S., Arola, A., Slutsker, I., Smirnov, A., Sorokin, M., Kraft, J., Crawford, J. H., Anderson, B. E., Thornhill, K. L., Diskin, G., Kim, S. W., and Park, S.: Influence of cloud, fog, and high relative humidity during pollution transport events in South Korea: Aerosol properties and PM2.5 variability, Atmos. Environ., 232, 117530, https://doi.org/10.1016/j.atmosenv.2020.117530, 2020.
El-Shaarawi, A. H. and Niculescu, S. P.: On kendall's tau as a test of trend in time series data, Environmetrics, 3, 385–411, https://doi.org/10.1002/env.3170030403, 1992.
Emmons, L. K., Walters, S., Hess, P. G., Lamarque, J.-F., Pfister, G. G., Fillmore, D., Granier, C., Guenther, A., Kinnison, D., Laepple, T., Orlando, J., Tie, X., Tyndall, G., Wiedinmyer, C., Baughcum, S. L., and Kloster, S.: Description and evaluation of the Model for Ozone and Related chemical Tracers, version 4 (MOZART-4), Geosci. Model Dev., 3, 43–67, https://doi.org/10.5194/gmd-3-43-2010, 2010.
Eyring, V., Bony, S., Meehl, G. A., Senior, C. A., Stevens, B., Stouffer, R. J., and Taylor, K. E.: Overview of the Coupled Model Intercomparison Project Phase 6 (CMIP6) experimental design and organization, Geosci. Model Dev., 9, 1937–1958, https://doi.org/10.5194/gmd-9-1937-2016, 2016.
Ghazali, S., Awang, N. R., Karim, M. F. A., and Muhammad, M.: Fluctuational Analysis of Nighttime Ground-Level Ozone Concentrations due to Variations in Hourly Relative Humidity, Smart Environmental Science, Technology and Management, 1, 118–121, https://doi.org/10.36647/978-93-92106-02-6.21, 2022.
Gong, C., Yue, X., Liao, H., and Ma, Y. M.: A humidity-based exposure index representing ozone damage effects on vegetation, Environ. Res. Lett., 16, 044030, https://doi.org/10.1088/1748-9326/abecbb, 2021.
Guenther, A., Karl, T., Harley, P., Wiedinmyer, C., Palmer, P. I., and Geron, C.: Estimates of global terrestrial isoprene emissions using MEGAN (Model of Emissions of Gases and Aerosols from Nature), Atmos. Chem. Phys., 6, 3181–3210, https://doi.org/10.5194/acp-6-3181-2006, 2006.
Guenther, A. B., Jiang, X., Heald, C. L., Sakulyanontvittaya, T., Duhl, T., Emmons, L. K., and Wang, X.: The Model of Emissions of Gases and Aerosols from Nature version 2.1 (MEGAN2.1): an extended and updated framework for modeling biogenic emissions, Geosci. Model Dev., 5, 1471–1492, https://doi.org/10.5194/gmd-5-1471-2012, 2012.
Han, S., Bian, H., Feng, Y., Liu, A., Li, X., Zeng, F., and Zhang, X.: Analysis of the Relationship between O3, NO and NO2 in Tianjin, China, Aerosol Air Qual. Res., 11, 128–139, https://doi.org/10.4209/aaqr.2010.07.0055, 2011.
Hu, F., Xie, P., Xu, J., Lv, Y., Zhang, Z., Zheng, J., and Tian, X.: Long-term trends of ozone in the Yangtze River Delta, China: Spatiotemporal impacts of meteorological factors, local, and non-local emissions, J. Environ. Sci., 7, 10–33, https://doi.org/10.1016/j.jes.2024.07.017, 2024.
Huang, J. P., Yu, H. P., Dai, A. G., Wei, Y., and Kang, L. T.: Drylands face potential threat under 2 °C global warming target, Nat. Clim. Chang., 7, 417–422, https://doi.org/10.1038/nclimate3275, 2017.
Kendall, M. G.: Rank Correlation Methods, Mathematics, https://doi.org/10.2307/1402637, 1949.
Kerr, G. H., Waugh, D. W., Steenrod, S. D., Strode, S. A., and Strahan, S. E.: Surface Ozone-Meteorology Relationships: Spatial Variations and the Role of the Jet Stream, J. Geophys. Res.-Atmos., 125, e2020JD032735, https://doi.org/10.1029/2020JD032735, 2020.
Koster, R. D., Dirmeyer, P. A., Guo, Z. C., Bonan, G., Chan, E., Cox, P., Gordon, C. T., Kanae, S., Kowalczyk, E., Lawrence, D., Liu, P., Lu, C. H., Malyshev, S., McAvaney, B., Mitchell, K., Mocko, D., Oki, T., Oleson, K., Pitman, A., Sud, Y. C., Taylor, C. M., Verseghy, D., Vasic, R., Xue, Y. K., Yamada, T., and Team, G.: Regions of strong coupling between soil moisture and precipitation, Science, 305, 1138–1140, https://doi.org/10.1126/science.1100217, 2004.
Kleeman, M. J.: A preliminary assessment of the sensitivity of air quality in California to global change, Climatic Change, 87, 273–292, https://doi.org/10.1007/s10584-007-9351-3, 2008.
Li, B., Chen, Y., and Shi, X.: Why does the temperature rise faster in the arid region of northwest China?, J. Geophys. Res.-Atmos., 117, D16115, https://doi.org/10.1029/2012JD017953, 2012.
Li, J., Yang, W., Wang, Z., Chen, H., Hu, B., Li, J., Sun, Y., Fu, P., Zhang, Y.: Modeling study of surface ozone source receptor relationships in East Asia, Atmos. Res. 167, 77–88, https://doi.org/10.1016/j.atmosres.2015.07.010, 2016.
Li, J. X., Wang, Z. X., Chen, L. L., Lian, L. L., Li, Y., Zhao, L. Y., Zhou, S., Mao, X. X., Huang, T., Gao, H., and Ma, J. M.: WRF-Chem simulations of ozone pollution and control strategy in petrochemical industrialized and heavily polluted Lanzhou City, NW, Sci. Total Environ., 737, 139835, https://doi.org/10.1016/j.scitotenv.2020.139835, 2020a.
Li, K., Jacob, D. J., Liao, H., Shen, L., Zhang, Q., and Bates, K. H.: Anthropogenic drivers of 2013–2017 trends in summer surface ozone in China, P. Natl. Acad. Sci. USA, 116, 422–427, https://doi.org/10.1073/pnas.1812168116, 2019.
Li, K., Jacob, D. J., Shen, L., Lu, X., De Smedt, I., and Liao, H.: Increases in surface ozone pollution in China from 2013 to 2019: anthropogenic and meteorological influences, Atmos. Chem. Phys., 20, 11423–11433, https://doi.org/10.5194/acp-20-11423-2020, 2020b.
Li, K., Jacob, D. J., Liao, H., Qiu, Y. L., Shen, L., Zhai, S. X., Bates, K. H., Sulprizio, M. P., Song, S. J., Lu, X., Zhang, Q., Zheng, B., Zhang, Y. L., Zhang, J. Q., Lee, H. C., and Kuk, S. K.: Ozone pollution in the North China Plain spreading into the late-winter haze season, P. Natl. Acad. Sci. USA, 118, e2015797118, https://doi.org/10.1073/pnas.2015797118, 2021a.
Li, L., Liu, N., Shen, L., Zhao, Z., Wang, H., Wang, Y., Li, X., and Ma, Y.: Ozone concentration at various heights near the surface layer in Shenyang, Northeast China, Front. Environ. Sci., 10, 1011508, https://doi.org/10.3389/fenvs.2022.1011508, 2022a.
Li, M., Yu, S., Chen, X., Li, Z., Zhang, Y., Wang, L., Liu, W., Li, P., Lichtfouse, E., Rosenfeld, D., and Seinfeld, J. H.: Large scale control of surface ozone by relative humidity observed during warm seasons in China, Environ. Chem. Lett., 19, 3981–3989, https://doi.org/10.1007/s10311-021-01265-0, 2021b.
Li, X., Liu, J., Mauzerall, D. L., Emmons, L. K., Walters, S., Horowitz, L. W., and Tao, S.: Effects of trans-Eurasian transport of air pollutants on surface ozone concentrations over Western China, J. Geophys. Res.-Atmos., 119, 12338–12354, https://doi.org/10.1002/2014JD021936, 2014.
Li, X. B., Yuan, B., Parrish, D. D., Chen, D. H., Song, Y. X., Yang, S. X., Liu, Z. J., and Shao, M.: Long-term trend of ozone in southern China reveals future mitigation strategy for air pollution, Atmos. Environ., 269, 118869, https://doi.org/10.1016/j.atmosenv.2021.118869, 2022b.
Lian, X., Piao, S. L., Chen, A. P., Huntingford, C., Fu, B. J., Li, L., Huang, J. P., Sheffield, J., Berg, A. M., Keenan, T. F., McVicar, T. R., Wada, Y., Wang, X. H., Wang, T., Yang, Y. T., and Roderick, M. L.: Multifaceted characteristics of dryland aridity changes in a warming world, Nat. Rev. Earth Env., 2, 232–250, https://doi.org/10.1038/s43017-021-00144-0, 2021.
Liao, J. B., Wang, T. J., Jiang, Z. Q., Zhuang, B. L., Xie, M., Yin, C. Q., Wang, X. M., Zhu, J. L., Fu, Y., and Zhang, Y.: WRF/Chem modeling of the impacts of urban expansion on regional climate and air pollutants in Yangtze River Delta, China, Atmos. Environ., 106, 204–214, https://doi.org/10.1016/j.atmosenv.2015.01.059, 2015.
Liu, X., Zhang, D., Luo, Y., and Liu, C.: Spatial and temporal changes in aridity index in northwest China: 1960 to 2010, Theor. Appl. Climatol., 112, 307–316, https://doi.org/10.1007/s00704-012-0734-7, 2013.
Lu, X., Ye, X. P., Zhou, M., Zhao, Y. H., Weng, H. J., Kong, H., Li, K., Gao, M., Zheng, B., Lin, J. T., Zhou, F., Zhang, Q., Wu, D. M., Zhang, L., and Zhang, Y. H.: The underappreciated role of agricultural soil nitrogen oxide emissions in ozone pollution regulation in North China, Nat. Commun., 12, 5021, https://doi.org/10.1038/s41467-021-25147-9, 2021.
Ma, S., Shao, M., Zhang, Y., Dai, Q., and Xie, M.: Sensitivity of PM2.5 and O3 pollution episodes to meteorological factors over the North China Plain, Sci. Total. Environ., 792, 148474, https://doi.org/10.1016/j.scitotenv.2021.148474, 2021.
Madden, R. A. and Williams, J.: The Correlation between Temperature and Precipitation in the United States and Europe, Mon. Weather Rev., 106, 142–147, https://doi.org/10.1175/1520-0493(1978)106<0142:TCBTAP>2.0.CO;2, 1978.
Mann, H. B.: Nonparametric Tests Against Trend, Econometrica, 13, 245, https://doi.org/10.2307/1907187, 1945.
Millstein, D. E. and Harley, R. A.: Impact of climate change on photochemical air pollution in Southern California, Atmos. Chem. Phys., 9, 3745–3754, https://doi.org/10.5194/acp-9-3745-2009, 2009.
Mo, J., Huang, T., Zhang, X., Zhao, Y., Liu, X., Li, J., Gao, H., and Ma, J.: Spatiotemporal distribution of nitrogen dioxide within and around a large-scale wind farm – a numerical case study, Atmos. Chem. Phys., 17, 14239–14252, https://doi.org/10.5194/acp-17-14239-2017, 2017.
Nie, J. S., Wang, W. H., Heermance, R., Gao, P., Xing, L., Zhang, X. J., Zhang, R., Garzione, C., and Xiao, W. J.: Late Miocene Tarim desert wetting linked with eccentricity minimum and East Asian monsoon weakening, Nat. Commun., 13, 3977, https://doi.org/10.1038/s41467-022-31577-w, 2022.
Peng, D. and Zhou, T.: Why was the arid and semiarid northwest China getting wetter in the recent decades?, J. Geophys. Res.-Atmos., 122, 9060–9075, https://doi.org/10.1002/2016JD026424, 2017.
Pfannerstill, E. Y., Arata, C., Zhu, Q., Schulze, B. C., Ward, R., Woods, R., Harkins, C., Schwantes, R. H., Seinfeld, J. H., Bucholtz, A., Cohen, R. C., and Goldstein, A. H.: Temperature-dependent emissions dominate aerosol and ozone formation in Los Angeles, Science, 384, 1324–1329, https://doi.org/10.1126/science.adg8204, 2024.
Shi, P. Y., Tilgner, M., and Lo, M. K.: Construction and characterization of subgenomic replicons of New York strain of West Nile virus, Virology, 296, 219–233, https://doi.org/10.1006/viro.2002.1453, 2002.
Tie, X., Madronich, S., Li, G., Ying, Z., Weinheimer, A., Apel, E., and Campos, T.: Simulation of Mexico City plumes during the MIRAGE-Mex field campaign using the WRF-Chem model, Atmos. Chem. Phys., 9, 4621–4638, https://doi.org/10.5194/acp-9-4621-2009, 2009.
Tong, D., Cheng, J., Liu, Y., Yu, S., Yan, L., Hong, C., Qin, Y., Zhao, H., Zheng, Y., Geng, G., Li, M., Liu, F., Zhang, Y., Zheng, B., Clarke, L., and Zhang, Q.: Dynamic projection of anthropogenic emissions in China: methodology and 2015–2050 emission pathways under a range of socio-economic, climate policy, and pollution control scenarios, Atmos. Chem. Phys., 20, 5729–5757, https://doi.org/10.5194/acp-20-5729-2020, 2020.
Wang, J., Li, J., Li, X., Wang, D., and Fang, C.: Relationship between ozone and air temperature in future conditions: A case study in Sichuan basin, China, Environ. Pollut., 343, 123276, https://doi.org/10.1016/j.envpol.2023.123276, 2024.
Wang, Z. B., Li, J. X., and Liang, L. W.: Spatio-temporal evolution of ozone pollution and its influencing factors in the Beijing-Tianjin-Hebei Urban Agglomeration, Environ. Pollut., 256, 113419, https://doi.org/10.1016/j.envpol.2019.113419, 2020.
Wild, O., Zhu, X., and Prather, M. J.: Fast-J: Accurate Simulation of In- and Below-Cloud Photolysis in Surface Chemical Models, J. Atmos. Chem., 37, 245–282, https://doi.org/10.1023/A:1006415919030, 2000.
Yan, D., Jin, Z. P., Zhou, Y. T., Li, M. M., Zhang, Z. H., Wang, T. J., Zhuang, B. L., Li, S., and Xie, M.: Anthropogenically and meteorologically modulated summertime ozone trends and their health implications since China's clean air actions, Environ. Pollut., 343, 123234, https://doi.org/10.1016/j.envpol.2023.123234, 2024.
Yang, P., Xia, J., Zhang, Y. Y., and Hong, S.: Temporal and spatial variations of precipitation in Northwest China during 1960–2013, Atmos. Res., 183, 283–295, https://doi.org/10.1016/j.atmosres.2016.09.014, 2017.
Yang, X. Y., Li, D. W., Yang, Z., Wu, K., Ji, L. Y., Zhou, Z. Q., and Lu, Y. Q.: Revealing historical observations and future projections of precipitation over Northwest China based on dynamic downscaled CMIP6 simulations, Front. Earth Sci., 10, 1090221, https://doi.org/10.3389/feart.2022.1090221, 2023.
Yao, J. Q., Mao, W. Y., Chen, J., and Dilinuer, T.: Recent signal and impact of wet-to-dry climatic shift in Xinjiang, China, J. Geog. Sci., 31, 1283–1298, https://doi.org/10.1007/s11442-021-1898-9, 2021.
Yu, R. X., Liu, M. X., Li, L., Song, J. Y., Sun, R. D., Zhang, G. J., Xu, L., and Mu, R. L.: Spatial and Temporal Variation of Atmospheric Ozone Column Concentration and Influencing Factors in the Yangtze River Delta Region in Recent 15 Years, Acta Scientiae Circumstantiae, 41, 770–784, https://doi.org/10.13671/j.hjkxxb.2020.0346, 2021.
Zhang, X., Zhugu, R., Jian, X., Liu, X., Chen, K., Tao, S., Liu, J., Gao, H., Huang, T., and Ma, J.: Associations of interannual variation in summer tropospheric ozone with the Western Pacific Subtropical High in China from 1999 to 2017, Atmos. Chem. Phys., 23, 15629–15642, https://doi.org/10.5194/acp-23-15629-2023, 2023.
Zhang, X. D., Du, J., Zhang, L. M., Huang, T., Gao, H., Mao, X. X., and Ma, J. M.: Impact of afforestation on surface ozone in the North China Plain during the three-decade period, Agr. Forest Meteorol., 287, 107979, https://doi.org/10.1016/j.agrformet.2020.107979, 2020.
Zhang, X. D., Jian, X. H., Zhao, Y., Liu, X. R., Chen, K. J., Wang, L. F., Tao, S., Liu, J. F., Huang, T., Gao, H., Liu, Y. J., Zhugu, R. R., and Ma, J. M.: Tropospheric Ozone Perturbations Induced by Urban Land Expansion in China from 1980 to 2017, Environ. Sci. Technol., 56, 6978–6987, https://doi.org/10.1021/acs.est.1c06664, 2022.