the Creative Commons Attribution 4.0 License.
the Creative Commons Attribution 4.0 License.
 | 11 Aug 2025
Impacts of wildfire smoke aerosols on near-surface ozone photochemistry
Jiaqi Shen
Ronald C. Cohen
Glenn M. Wolfe
Wildfires have been an increasing concern for the environment, yet the ozone (O3) production from wildfires remains poorly characterized. Here, we aim to elucidate the role of aerosols from wildfire smoke in near-surface O3 photochemistry by integrating insights from a 0-D box model (F0AM) to a 3-D chemical transport model (GEOS-Chem). While smoke aerosols typically inhibit O3 production through heterogeneous chemical and radiative pathways, we find that for most fires, the O3 enhancement driven by precursor emissions outweighs these aerosol-driven suppression effects. The relative importance of the two aerosol effects varies, with the heterogeneous chemical effect generally overshadowing the radiative effect in the far field of fires. However, near the sources of extremely large fires, the radiative effect dominates, leading to an overall suppression of O3 production. By assessing the chain termination of hydrogen oxide radicals (HOx) and introducing the “light-limited” regime determination in GEOS-Chem, we find that a significant portion of O3 production occurred within light-limited and heterogeneous chemistry-inhibited regimes during the 2020 wildfire season in California. Building on the discovery that both aerosol and nitrogen oxide (NOx) concentrations modulate aerosol influence, we demonstrate that the ratio of surface PM2.5 to tropospheric NO2 column – a metric retrievable from satellite – can serve as an indicator for identifying aerosol-dominated regimes through observations.
- Article
(3881 KB) - Full-text XML
-
Supplement
(2702 KB) - BibTeX
- EndNote


In recent years, wildfires have surged in size and severity (Cattau et al., 2020; Collins et al., 2021; Hanes et al., 2019; Li and Banerjee, 2021), presenting escalating challenges to air quality, ecosystems, social economics and human health (Duane et al., 2021; Jaffe et al., 2020; Jones et al., 2022; Reid et al., 2016; Wardle et al., 2003). Wildfires release substantial quantities of carbon monoxide (CO), volatile organic compounds (VOCs), oxides of nitrogen (NOx) and aerosols or particulate matter (PM) (Akagi et al., 2011). Wildfires also markedly complicate O3 air pollution mitigation, as many studies have documented exceedances of the O3 air quality standard and enhanced background O3 level due to fires (Dreessen et al., 2016; Gong et al., 2017; Jaffe et al., 2004; Jaffe and Wigder, 2012). Fires not only emit abundant O3 precursors but also provide important sources of hydrogen oxide radicals (HOx = OH + HO2) through the photolysis of nitrous acid (HONO), formaldehyde (HCHO), other aldehydes and O3, as well as the ozonolysis of alkenes (Jaffe and Wigder, 2012; Robinson et al., 2021; Xu et al., 2021). These radicals catalyze the chain oxidation of VOCs in the presence of NOx to produce O3 (Xu et al., 2021). The NOx-VOCs-radical-controlled O3 formation mechanism has been well-established over several decades (Pusede et al., 2014).
The impact of aerosols on O3 formation, particularly in the context of wildfires, remains poorly understood. Generally, aerosol particles affect O3 chemistry through two mechanisms: a radiative effect and a chemical effect. The radiative effect occurs when aerosols reduce light transmission, thereby slowing down photochemical reactions (He and Carmichael, 1999). The chemical effect refers to the role of aerosols in providing surfaces for the reactive uptake of HO2, RO2, oxygenated volatile organic compounds such as HCHO and reactive nitrogen species including NO2, NO3 and N2O5; among these chemical effects, HO2 uptake dominates, especially in the daytime near-surface O3 chemistry (Carlos-Cuellar et al., 2003; Ha et al., 2021; Jacob, 2000; Li et al., 2019). Aerosols typically inhibit O3 formation (Benas et al., 2013; Jiang et al., 2012; Li et al., 2019; Xu et al., 2012), except in certain instances where the reduction in photolysis rates disproportionately affects O3 loss more than O3 production (Real et al., 2007). O3 formation in wildfires exhibits considerable variability, with some studies reporting even suppressed O3 in plume center or downwind areas and in Mediterranean/boreal regions (Alvarado et al., 2010; Paris et al., 2009; Strada et al., 2012; Verma et al., 2009). Model studies often invoke underestimated heterogeneous chemistry as a source of persistent bias in overpredicting O3 (Jaffe and Wigder, 2012; Konovalov et al., 2012), yet the impacts of aerosols on O3 chemistry remain notably under-characterized. There is a pressing need to comprehensively evaluate the chemical and radiative effects of aerosols across different types of fires and at various stages of fire aging. Furthermore, understanding conditions under which fire emissions of NOx or VOCs or aerosols predominate is crucial for detangling the fire-related O3 chemistry.
Photochemical regimes indicating O3 sensitivity towards different precursor emissions have been used to guide regional air quality control strategies (Kleinman, 1994; Kleinman et al., 1997; Milford et al., 1994; Tonnesen and Dennis, 2000a, b). The two classical O3 regimes are NOx-limited and NOx-saturated (or VOC-limited). O3 production is fueled by HOx, and the termination of the HOx free radical chain by either self-reaction to yield peroxides (NOx-limited) or with NOx to yield HNO3 and RONO2 (NOx-saturated) defines the regime (Ivatt et al., 2022; Sillman and He, 2002). However, large aerosol loadings – typical of wildfire smoke and many polluted areas – often complicate O3 formation in ways that the classical regimes do not capture. For instance, an aerosol-inhibited regime was recently identified in heavily polluted areas of China and India, pointing to a strong impact of heterogeneous chemistry on O3 formation (Ivatt et al., 2022). Moreover, dense smoke can create a dark environment that makes O3 production limited by light (Jiang et al., 2012). As wildfires intensify and smoke plumes spread to downwind urban areas, understanding if and how such aerosol-inhibited behavior occurs in wildfire plumes becomes crucial for potential policy interventions and more accurate fire-related O3 predictions. Therefore, in this study, we refine the current O3 regime framework by introducing a new regime – the light-limited regime to better represent the role of aerosols in O3 formation.
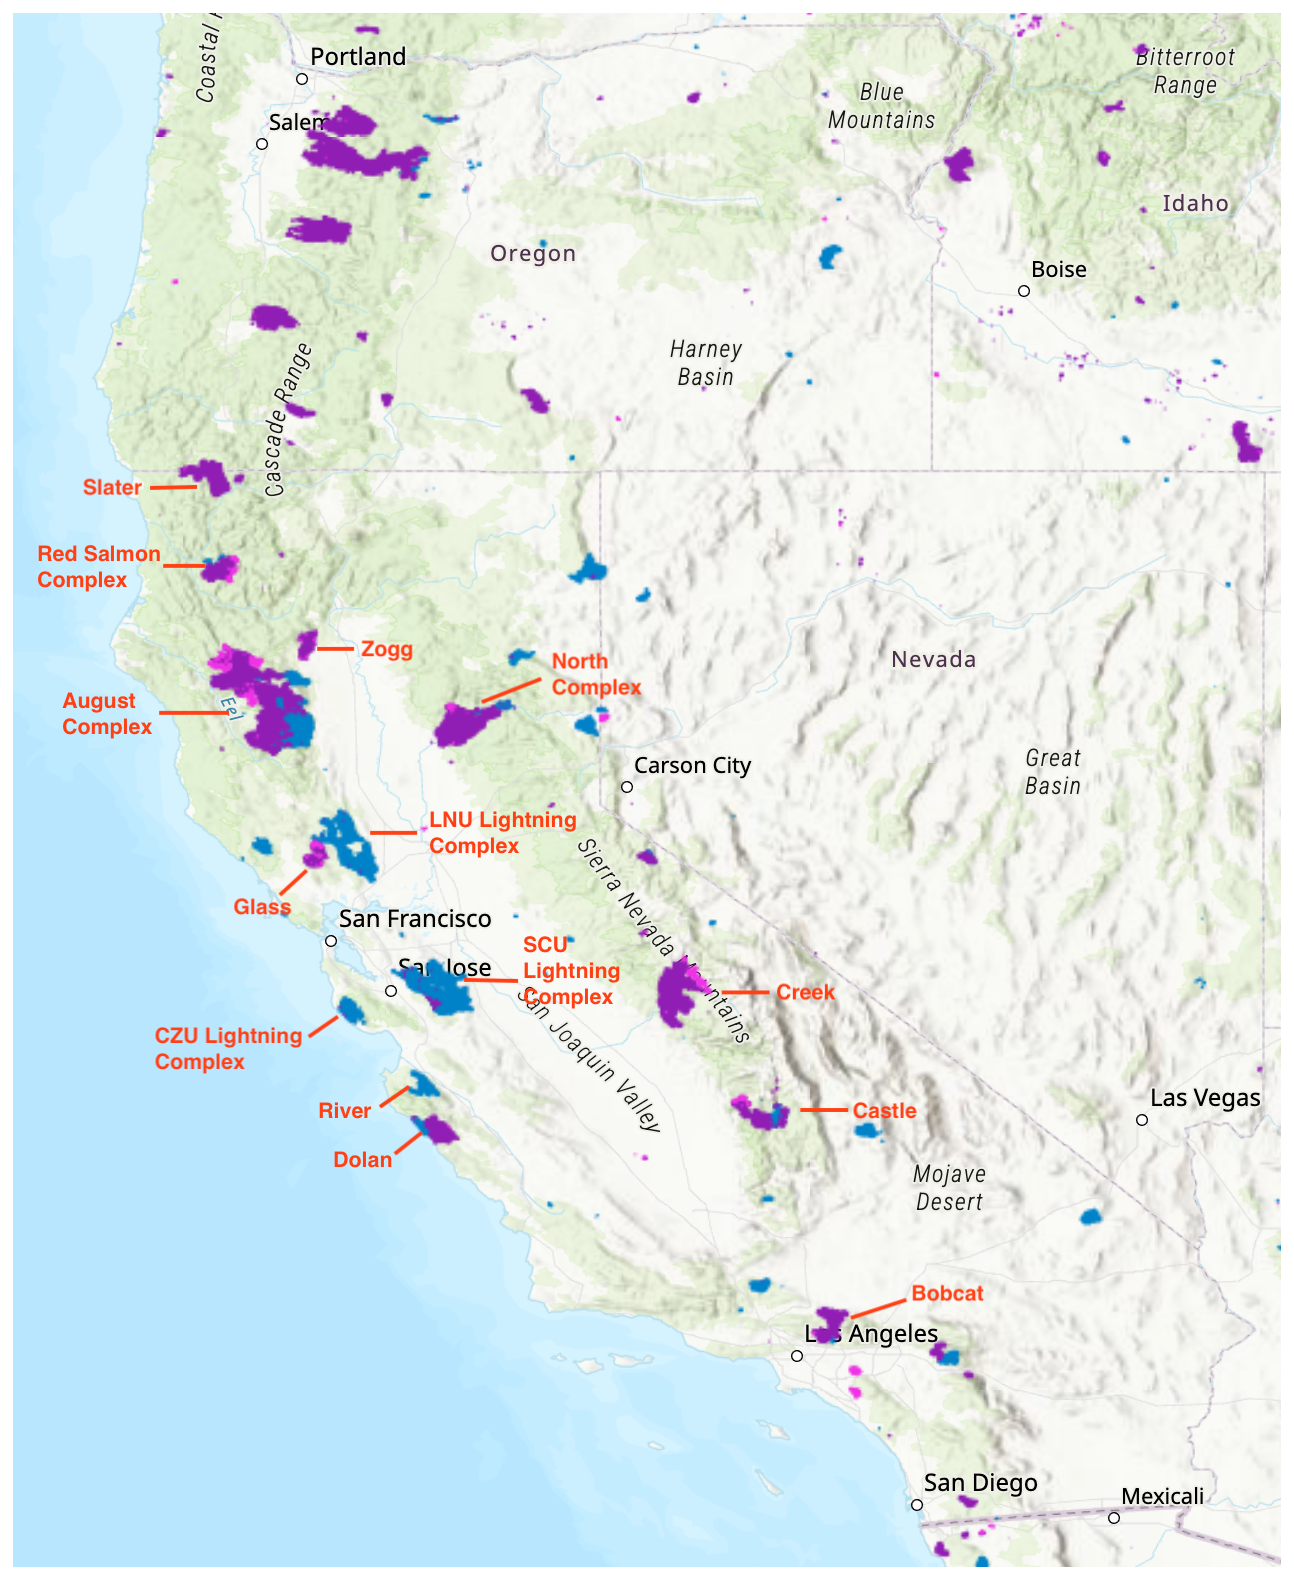
Figure 1Major fires during the 2020 California wildfire season (August–October). The map is sourced from NASA's Fire Information for Resource Management System (FIRMS) (NASA-FIRMS, 2025). Shaded areas represent MODIS-detected burned area, with blue, purple and pink indicating fires occurring in August, September and October, respectively.
The 2020 California fires provide a valuable opportunity to study the impacts of aerosols on O3 chemistry in wildfire plumes because they were especially extensive, varied in their intensity and well documented. Throughout the year, 8648 fires burned approximately 1.74 million ha across the state, with intense fire activities spanning from mid-August to November (CAL FIRE, 2020a). Figure 1 illustrates the distribution and burned area of major fires that occurred from August to October in 2020. The widespread wildfire season in the western US in 2020, far from being an outlier, is considered a harbinger of a new norm in a warming climate (Coop et al., 2022; Xie et al., 2022). PM2.5 pollution in western US is projected to double or even triple by the late 21st century under intermediate- and low-mitigation scenarios (Xie et al., 2022).
In this study, we employ a 3-D global chemical transport model (GEOS-Chem) and a box model (Framework for 0-D Atmospheric Modeling, F0AM) as well as observational constraints to elucidate the aerosol chemical and radiative effects on O3 production in the near field and far field of fires, as well as for different types of fires. We examine the role of emissions and of aerosols in O3 production and delve into the underlying processes. We provide a comprehensive evaluation of O3 production regimes by introducing two additional regimes, light-limited and aerosol chemistry-inhibited, to the well-established two-regime (NOx-limited and VOC-limited) classification. Furthermore, we explore the potential of the PM2.5-to-NO2 ratio as an indicator for identifying aerosol-dominated regimes. We derive the threshold based on the model diagnostic approach and apply it to observation-derived PM2.5 and NO2 datasets to distinguish the aerosol-dominated O3 regimes.
2.1 GEOS-Chem simulations
We use the GEOS-Chem (Bey et al., 2001) chemical transport model version 12.7.1 to examine the effects of aerosols on O3–NOx–VOCs chemistry. We run nested simulations over California regions (27–47° N, 110–130° W) with a resolution of 0.25° (latitude) × 0.3125° (longitude) and 47 vertical levels for the year 2020. The model is driven by the Goddard Earth Observation System Forward Processing product (GEOS-FP) assimilated meteorological field, with a 3 h temporal resolution for three-dimensional variables and 1 h resolution for surface variables. Boundary conditions for the simulations are generated from a global simulation at a resolution of 2° × 2.5° with a 1-year spin-up. The standard tropospheric chemical scheme includes detailed O3–NOx–VOCs–aerosol–halogen chemistry. Additionally we have incorporated the ethene and ethyne chemistry as introduced in GEOS-Chem version 13.3.0 (Kwon et al., 2021). Hourly anthropogenic emissions in the US are based on the EPA 2011 National Emission Inventory (NEI) and are scaled to 2020 using national interannual emission trends (US EPA, 2025). Fire emissions are sourced from the Global Fire Emissions Database (GFED, Version 4.1), with emissions categorized by fuel types, including tropical forest, temperate forest, boreal forest, savanna, peat and agricultural waste (Randerson et al., 2015). We allocate 65 % of these fire emissions within the boundary layer (Fischer et al., 2014), so our findings primarily reflect fires that predominantly impact the boundary layer.
Photolysis rates in GEOS-Chem are calculated using the fast-JX scheme (Bian and Prather, 2002). The influence of aerosols on the photolysis rates are considered (Martin et al., 2003), with the adjustments for aerosol size distribution and optical properties in response to relative humidity changes. GEOS-Chem treats black carbon (BC) as externally mixed, making it challenging to explicitly simulate the lensing effect, where BC exhibits larger absorption when coated by a non-absorbing shell. To incorporate this effect, we apply an absorption enhancement factor (the ratio of mass absorption efficiency (MAE) with and without coating) of 1.5 to hydrophilic BC and 1 for hydrophobic BC (Wang et al., 2014).
The heterogeneous uptake of HO2 is represented by a reaction probability parameterization as shown in Eq. (1), with the loss rate limited by diffusion or free molecular collision (Martin et al., 2003).
The first-order rate constant k for the chemical loss of the gas (i.e., HO2) is calculated based on the mean molecular speed (ν), gas-phase molecular diffusion coefficient (Dg), aerosol radius (a), reaction probability upon impacting the aerosol surface (γ) and aerosol surface area per unit volume of air (A). Consistent with numerous modeling studies (Ivatt et al., 2022; Jacob, 2000; Li et al., 2019; Martin et al., 2003), we adopt a uniform value of 0.2 for , aligning with the field measurements (Taketani et al., 2012; Zhou et al., 2020, 2021). GEOS-Chem assumes the same for all aerosol types, including organic carbon (OC), BC, sulfate-ammonium-nitrate, sea salt separated in two size bins and mineral dust in seven size bins.
Table 1Summary of the BASE simulation and five perturbation simulations conducted in GEOS-Chem.
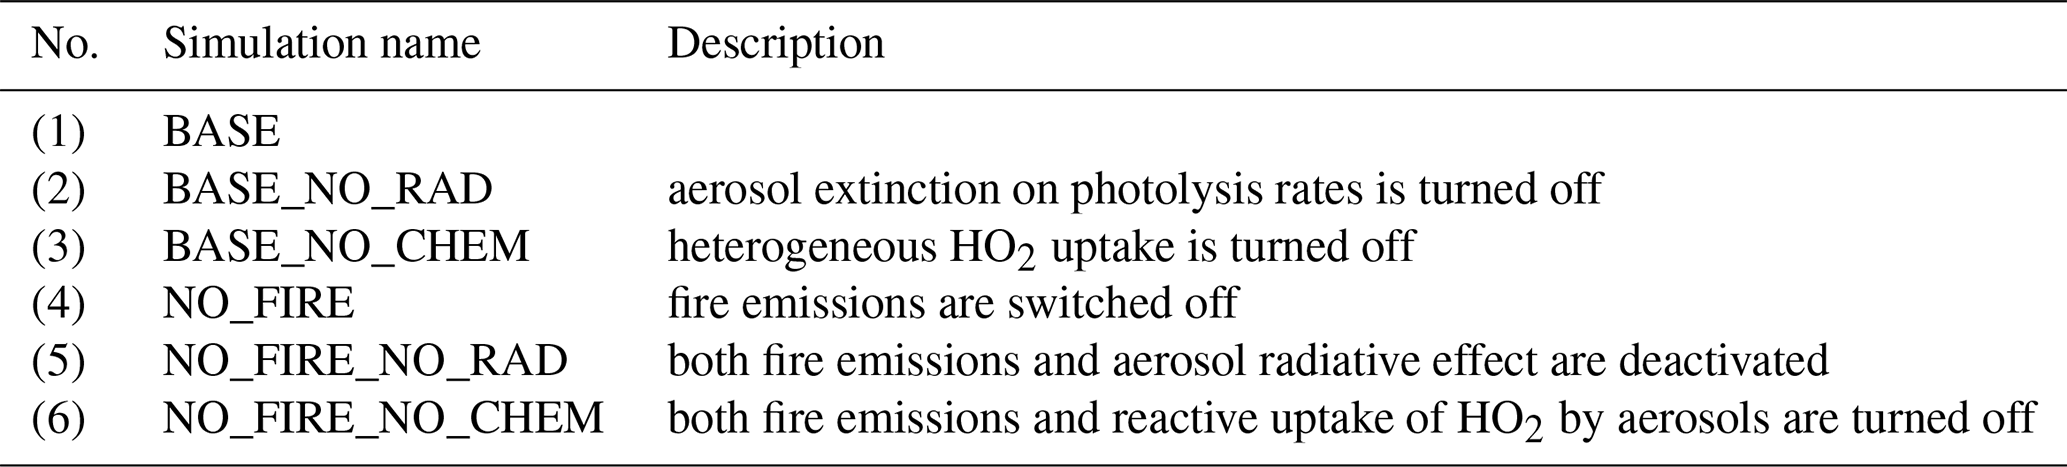
To examine the aerosol effects on O3, we conduct one BASE simulation and five perturbation simulations in GEOS-Chem, as summarized in Table 1. The difference between BASE and BASE_NO_RAD is considered as the radiative effect of all aerosols, and the difference between NO_FIRE and NO_FIRE_NO_RAD represents the radiative effect of aerosols other than fire smoke aerosols. The radiative effect of fire smoke aerosols is therefore calculated as BASE – BASE_NO_RAD – (NO_FIRE – NO_FIRE_NO_RAD). Similarly, the chemical effect of smoke aerosols is calculated as BASE – BASE_NO_CHEM – (NO_FIRE – NO_FIRE_NO_CHEM). Hourly species concentrations, meteorology, photolysis rates and reaction rates for the bottom five layers of the model (approximately 0–550 m) are averaged to investigate aerosol effects on near-surface O3 and perform regime calculations.
2.2 Fire plume evolution analysis
GEOS-Chem's Eulerian framework does not explicitly resolve individual plume pathways or their detailed evolution. We identify about 1633 fire plumes in 2020 that show clear plume patterns with an identifiable plume source and use the Hybrid Single-Particle Lagrangian Integrated Trajectory (HYSPLIT) dispersion model to calculate plume trajectories and plume age. The plume identification method is described in the work of Jin et al. (2023). Fire centers are identified using the Moderate Resolution Imaging Spectroradiometer (MODIS) Active Fire products and subsequently used as starting points for calculating 1 d plume dispersion using the HYSPLIT model with meteorological fields from North American Regional Reanalysis (NARR). The HYSPLIT model is run at an injection height of 1000 m and initialized at the same time of the day (18:00 UTC). In the absence of strong wind variability, the predicted plume trajectories should reasonably represent the progression from the near to far field of fires. The locations of the fire plumes are matched to GEOS-Chem grids to demonstrate changes in aerosol effects along the plumes. In this study, we define plume age as the physical age of the plume, determined as the time required for the plume to reach designated smoke-affected areas. We did not explicitly isolate fire plumes from urban influence in order to examine aerosol effects across a range of background NOx levels.
2.3 Box model setup
We employ F0AM (Wolfe et al., 2016) version 4.3 to assess the effectiveness of GEOS-Chem in resolving the aerosol effects on O3 within fire plumes. We use the Master Chemical Mechanism (MCM) version 3.3.1 (Jenkin et al., 2015), which features a near-explicit chemical mechanism with detailed gas-phase chemical processes. Additionally, we incorporate the heterogeneous uptake of HO2 by aerosols as described in Eq. (1) and assume a monodisperse size distribution for each aerosol type.
We first evaluate whether the aerosol effects resolved in GEOS-Chem are reproducible in F0AM by initializing F0AM with output from GEOS-Chem. The fire plumes are modeled with a pseudo-Lagrangian style in F0AM, where we set the initial chemical concentrations based on GEOS-Chem grids with a plume age of 1 h and allow them to evolve over the subsequent 5 h. Species used to initiate F0AM include CO, O3, reactive nitrogen species and some VOCs (Table S2 in the Supplement). Meteorological variables and photolysis-relevant parameters are constrained at each model step and held constant during the integration time of 1 h. We adopt the F0AM's hybrid method for J values calculations, which uses Tropospheric Ultraviolet and Visible (TUV)-calculated solar spectra but does not include explicit aerosol effects. J values of HONO and HCHO from GEOS-Chem are applied to scale box model-calculated J values. CO is an approximately conservative tracer (Robinson et al., 2021); we calculate the first-order dilution rate in F0AM at each model step using the temporal changes in CO concentrations along the fire plumes (Müller et al., 2016), as determined by GEOS-Chem. Configuration details of the F0AM setup are provided in Table S2. Chemical species, meteorological and photolysis variables from GEOS-Chem are matched to those in the MCM. To exhibit the aerosol effects on O3, we run one base simulation and two perturbation simulations in F0AM: one eliminating the chemical effect and another removing the radiative impact of fire-related aerosols.
We further assess whether the resolution of GEOS-Chem can resolve the in-plume O3 chemistry by focusing on fresh plumes in F0AM. Unlike the previous setup using GEOS-Chem outputs, here we initiate F0AM with gas-phase pollutants and aerosols (primarily OC and BC) for various fire types according to the GFED emission factors. We adopt aerosol effective radii of 0.035 µm for BC and 0.1 µm for OC, values that closely match GEOS-Chem averages over California in 2020 at 13:30 local time (LT), and assume a particle density of 1.3 g cm−3. We convert the emission factors (grams of species per kilogram dry matter burned) to concentrations (parts per billion for gases and µg m−3 for aerosols) using a fixed ratio of biomass burned per cubic meter of air. We then scale all pollutants to achieve aerosol concentrations ranging from 1 to 300 µg m−3 at the time of emission, allowing us to explore how aerosol effects vary with fire intensity. In this approach, we set only the initial chemical and physical parameters and run the model for 1 h, focusing specifically on the characteristics of fresh plumes. Photolysis rates, which we cannot directly constrain in scenarios with and without fires, are estimated based on the relationship between photolysis rate reduction and PM2.5 mass as derived from GEOS-Chem (Fig. S2). To prevent the buildup of secondary species, we set a 1 d lifetime for all species by applying a first-order dilution rate of s−1 and background concentrations at zero. Aerosol effects are calculated following the same method as in the F0AM–GEOS-Chem comparison.
2.4 Observational data
We use daily ground-based measurements of O3 and PM2.5 from the EPA Air Quality System (AQS) (EPA AQS, 2020) to evaluate the GEOS-Chem simulations. In addition, we analyze the decay of PM2.5 and NO2 within fire plumes using observationally derived datasets. Surface PM2.5 data are from Wei et al. (2023), featuring a daily, 1 km resolution, gapless PM2.5 dataset spanning 2017–2022. This dataset was generated using a 4-Dimensional Space-Time Extra-Trees (4D-STET) model, which reconstructs missing satellite AOD, establishes AOD-PM2.5 relationships and predicts high-resolution surface PM2.5 concentrations. This observation-based 1 km product improves upon earlier 10 km datasets, providing finer spatial detail for plume analysis. Tropospheric NO2 column data are sourced from TROPOspheric Monitoring Instrument (TROPOMI) retrievals provided by Jin et al. (2023), which incorporate a priori profiles from GEOS-Chem simulations and explicitly account for smoke aerosols during retrieval. Both the surface PM2.5 and tropospheric NO2 column data are also used to identify O3 regimes from observations (see Sect. 3.5).
2.5 Photochemical regime identification
We determine the photochemical regimes by assessing the chain termination rates of HOx radicals, similar to the method described in Ivatt et al. (2022). The radical termination pathways include (1) loss via NOx as indicated by the reactions NO2 + OH → HNO3 and RO2 + NO → alkyl nitrate (RONO2), (2) HOx self-reactions and (3) heterogenous uptake of HO2 by aerosols. A predominance of NOx as the sink for HOx characterizes a NOx-saturated regime. Dominance by HOx self-reactions indicates a NOx-limited regime. When the rate of HO2 uptake to aerosol dominates, it indicates a heterogeneous chemistry-inhibited regime. The radiative effect of aerosols, however, has not been considered in the regime calculations. To address this issue, we account for the aerosol radiative effect on O3 production by using the difference in total HOx termination rates between BASE and BASE_NO_RAD simulations () as a proxy. Notably, is not an actual chemical pathway; instead, it serves as an indicator of light availability and its influence on the photochemical activities. If exceeds any of the aforementioned three pathways, it suggests a light-limited regime. We use the reaction rate output from GEOS-Chem to calculate the chain termination rates and in each grid box at 20:30 UTC (around 13:30 LT) and identify the corresponding regime based on the maximum term. We focus on 13:30 LT because it coincides with a period of strong solar radiation that drives ozone photochemistry and aligns with typical satellite overpass time, facilitating integration of satellite-based observations to identify chemical regimes. Monthly mean regimes are determined by averaging the magnitudes of four terms rather than counting the occurrences of each regime to reflect the cumulative influence of these processes over time.
We further investigate how PM2.5 levels influence O3 photochemical regimes using GEOS-Chem. Specifically, we identify all fire-affected grid cells (those with PM2.5 enhancement larger than 10 µg m−3) at 20:30 UTC during 2020. For these grid cells, we calculate the HOx termination rates, determine the corresponding O3 regimes, and then group the regimes by PM2.5 concentrations to derive the probability of each regime at various PM2.5 levels.
3.1 The role of smoke aerosols in O3 production
We first evaluate GEOS-Chem-predicted O3 with daily ground measurements from the EPA AQS, as presented in Fig. S1. The comparison is conducted between AQS sites and the corresponding GEOS-Chem grid cells for the year 2020 around 13:00 LT. The modeled average O3 levels in California for 2020 are approximately 48 ± 4 ppb, in good agreement with ground observations of 44 ± 9 ppb (R2 of 0.64).
Next, we assess the aerosol effects and the overall impact of fires on O3 in GEOS-Chem in both the near and far field of fires (Fig. 2). Fire pixels are categorized based on PM enhancement (ΔPM2.5), calculated as the difference in PM2.5 mass between the BASE and NO_FIRE simulations for each individual grid cell. Specifically, ΔPM2.5 values of < 50, 50–100, 100–200 and > 200 µg m−3 are used to classify small, medium, large and extreme fire pixels, respectively. It reveals that for fire pixels with small to large PM enhancements, which represent the majority of fires, fires increase O3 concentrations in both near and far fields, indicating the influence of fires through the emissions of substantial quantities of O3 precursors outweighs the aerosol effects. Generally, fire pixels with larger PM enhancement are associated with larger increase in O3 concentrations. In contrast, pixels affected by extreme fires see suppressed O3 levels in their immediate vicinity, suggesting that the aerosol effect overshadows the emission effect. Furthermore, this O3 suppression is likely driven by the strong aerosol radiative effect associated with dense plumes near the centers of fires. In the near field of the fires, the average radiative impact on O3 concentrations for extreme fire pixels is about 60 times that observed in the others. Other factors contributing to the decreased O3 concentrations may be NOx titration or sequestration of NOx into peroxyacetyl nitrate (PAN) in the near field of fires (Jaffe and Wigder, 2012). For extreme fires, O3 suppression by aerosols is stronger in the near field and weakens downwind, leading to a net increase in O3 concentrations in the far field (Fig. 2).
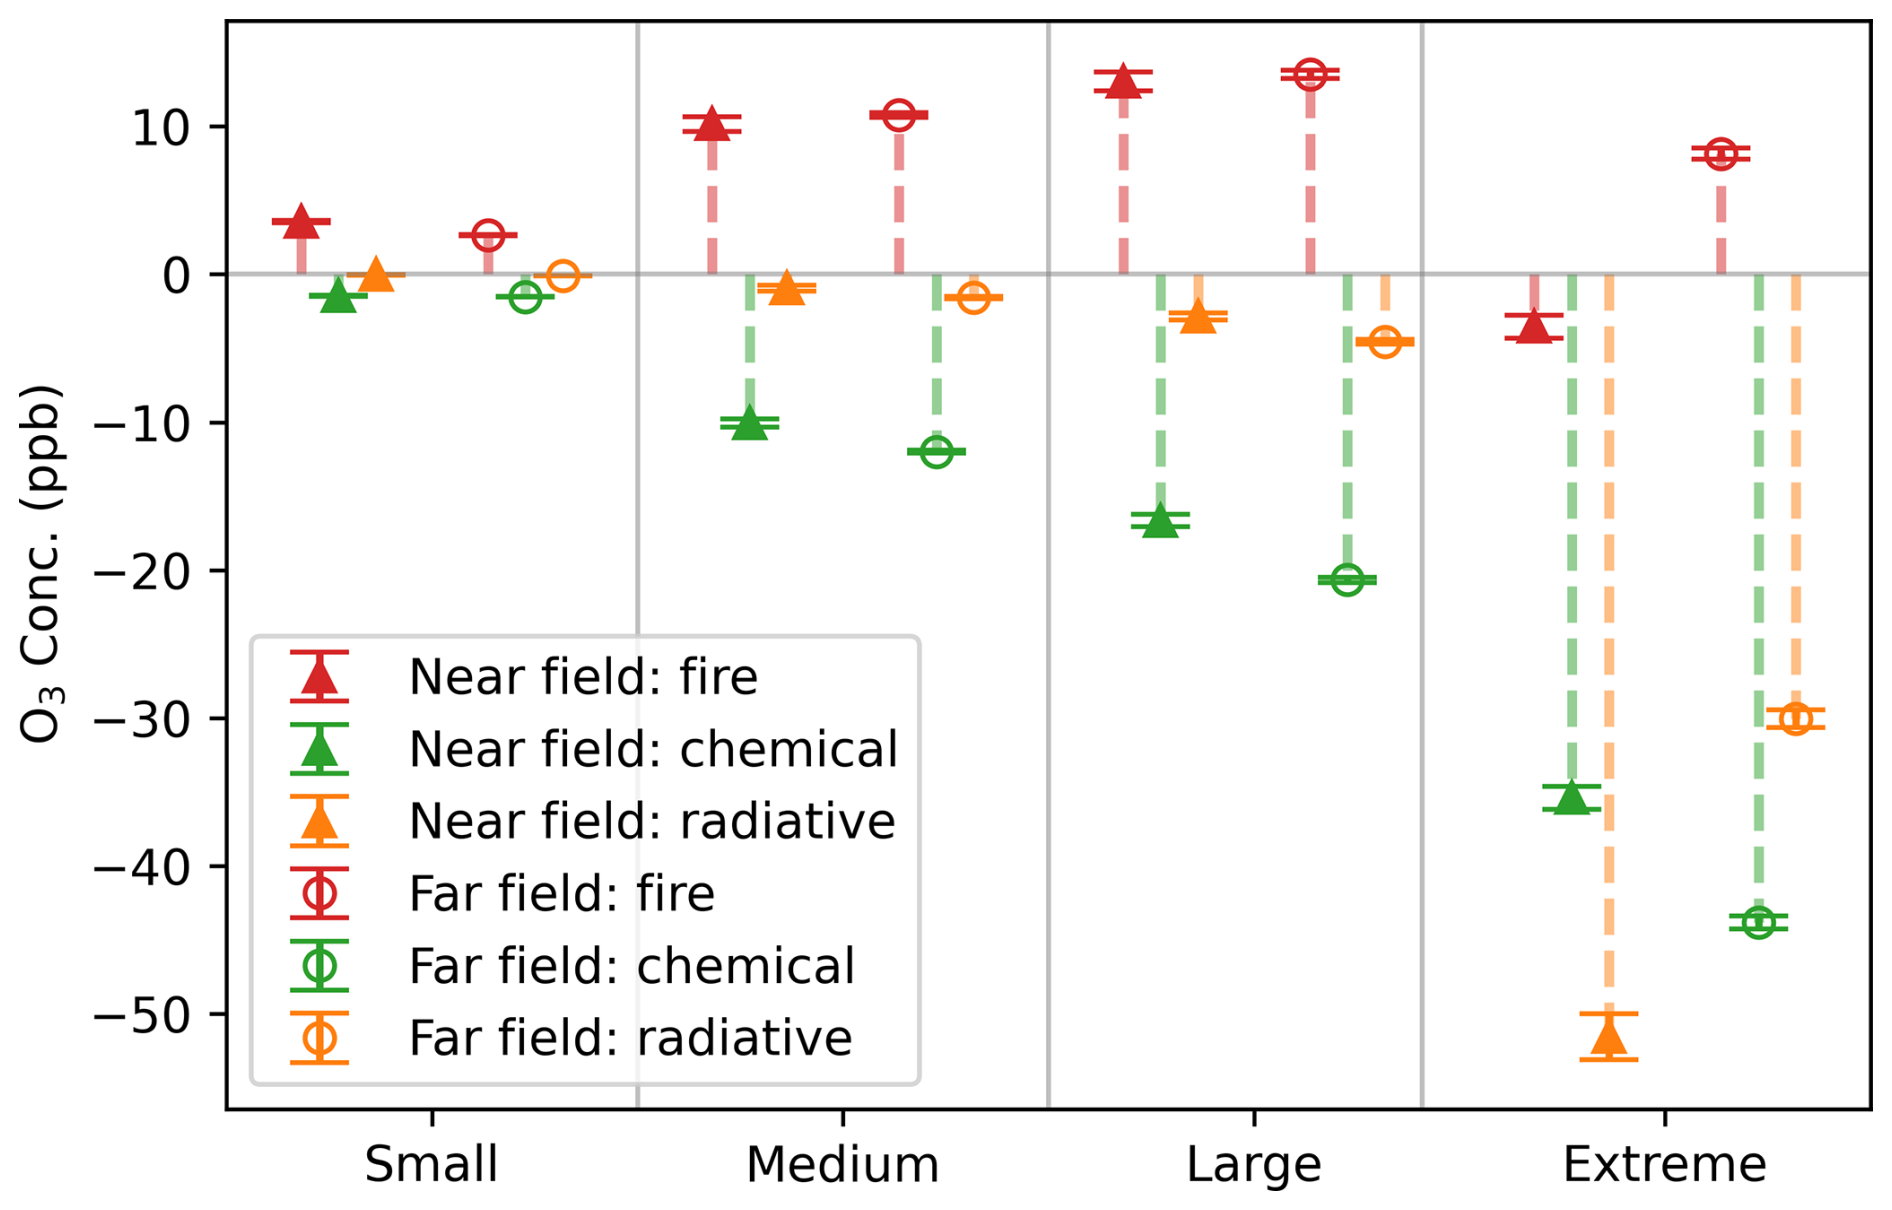
Figure 2Total fire effects and aerosol chemical and radiative impacts on O3 resolved in GEOS-Chem, across near and far fields at 20:30 UTC for fire plumes in 2020. Grid cells with a plume age of 1–3 h are marked as near field (triangles) and 4–24 h as far field (circles). To further elucidate the dependence of aerosol impacts on PM, we classify fire pixels into different groups based on the enhancement of PM2.5 (ΔPM2.5) at each grid box: small (ΔPM2.5 < 50 µg m−3), medium (50–100 µg m−3), large (100–200 µg m−3) and extreme (> 200 µg m−3). The total fire impact, chemical and radiative impacts on O3 concentrations are represented by red, green and orange colors, respectively. Error bars denote standard errors. The overall fire effect is indicated by the difference in O3 concentrations between the BASE and NO_FIRE simulations. Calculations of the aerosol effects are provided in the method section.
Both aerosol chemical and radiative effects are shown to decrease O3 in the fire plumes. For grid cells affected by small to large fires, the aerosol chemical effect outweighs the radiative effect. Contrary to the consistent behaviors observed in both the near-field and far-field regions for these fire pixels, those experiencing extreme PM enhancement exhibit pronounced variations. In the proximal areas of fire origins, the radiative effect on O3 concentrations is much higher than the heterogeneous chemical effect for these extreme fire pixels. Yet, this radiative effect represents a temporary suppression of O3 production, with its influence decaying rapidly – on average, the effect on O3 concentrations diminishes by about half within 5 h (Fig. S3). Moving further from the fire centers, the chemical effect starts to dominate over the radiative effect on O3. The aerosol impacts on O3 concentrations, through both chemical and radiative pathways, tend to intensify as ΔPM2.5 increases. The aerosol effects on O3 concentrations mirror those on O3 net production (Fig. S4). However, a notable difference exists when comparing large and extreme fire pixels: while their chemical effects on O3 production are similar in the near field (Fig. S4), extreme fires exert a stronger suppression on O3 concentrations (Fig. 2). This discrepancy likely stems from differences in transport and mixing. In the near field of extreme fires, HOx levels are low due to limited photochemical activity, making HO2 uptake less influential on O3 production. Nevertheless, extreme fires may cause greater suppression of O3 concentrations near the source. As O3 is transported downwind, this initial suppression can lead to a greater reduction in O3 concentrations despite similar local chemical production. Additionally, extreme fires may experience slower mixing with background air, reducing dilution of ozone-suppressed air and further enhancing the decrease in O3 concentrations. Overall, aerosol effects resolved in GEOS-Chem highlight the significant heterogeneous chemical influence on O3 for fires and an exceptionally critical radiative effect for extreme fires.
3.2 Comparison between GEOS-Chem and F0AM
We first use F0AM to conduct similar experiments with GEOS-Chem output for fire plumes of different scales. We select 12 fire plumes spanning small, medium, large and extreme cases, and comparisons for each individual fire plume are shown in Fig. S5. We find that the overall fire impacts on O3 concentrations and the aerosol chemical and radiative effects simulated in F0AM exhibit good agreement with those resolved in GEOS-Chem across fire plumes of different scales. Although F0AM does not explicitly account for atmospheric processes such as vertical mixing, turbulent diffusion, and dry and wet deposition, these factors appear to have a negligible impact (beyond their representation as dilution) on the several-hour timescale examined here. The comparison suggests that chemistry and to a lesser extent dilution are the leading factors explaining most variations in aerosol effects. It should be noted that although furanoid compounds markedly influence biomass-burning plume chemistry under both daytime and nighttime conditions (Decker et al., 2019; Xu et al., 2021), their reactions are not represented in either the GEOS-Chem version or the MCM mechanism used in this study.
Our results indicate relatively consistent aerosol effects resolved by different numerical simulation schemes. GEOS-Chem is a global Eulerian model, which solves continuity equations on a geographically fixed frame of reference (Liu et al., 2023; Long et al., 2015), whereas in F0AM plumes are simulated in a pseudo-Lagrangian approach that follows the movement of air parcels. However, the Eulerian model struggles with an unrealistic dilution of small plumes. In our comparison, the initial chemical concentrations used in F0AM are adopted from GEOS-Chem where dilution of initial subgrid plumes has occurred. Consequently, although both GEOS-Chem and F0AM exhibit comparable results, the near-field behavior of subgrid plumes may not be accurately solved by either model.
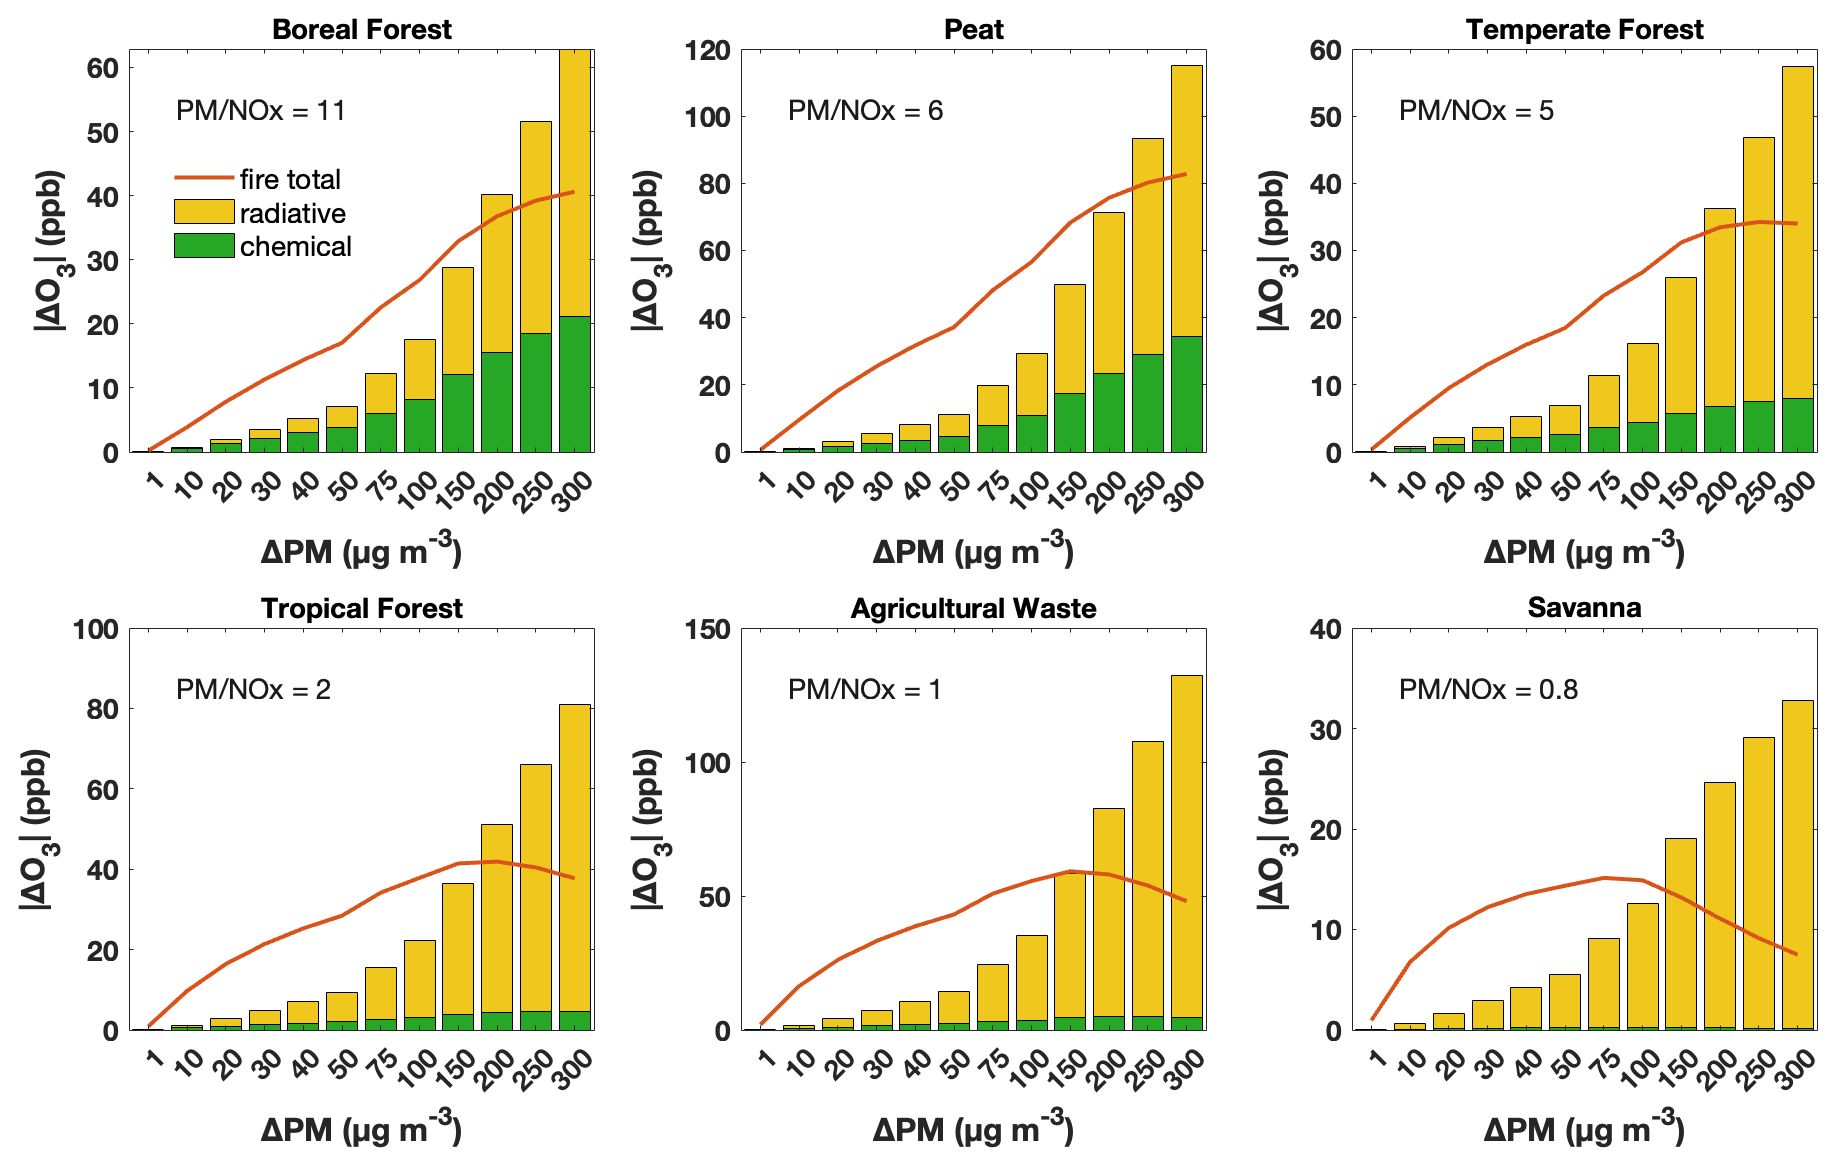
Figure 3The impact of aerosol chemical and radiative pathways on O3 concentrations in response to intensified fires, as indicated by increasing PM enhancement, for various fuel types in the GFED emission inventory. Results are from F0AM with a 1 h run time. Orange lines denote overall O3 enhancement due to fires, and green and yellow bars denote decreases in O3 concentrations attributable to the aerosol heterogeneous chemical and radiative pathways. The PM-to-NOx emission ratio is annotated for each fuel type.
Next, instead of initiating F0AM using GEOS-Chem simulations, we explore the aerosol influence on O3 in fresh plumes by initiating F0AM with emission data from GFED. Our analysis reveals that the aerosol influence on O3 depends on PM mass concentrations (Fig. 3), which is consistent with findings from GEOS-Chem (Fig. 2). Furthermore, at the same PM enhancement, the influence of aerosol chemical and radiative pathways on O3 concentrations appears to vary distinctly among various fuel types, suggesting underlying factors beyond PM concentrations play a role in controlling aerosol influence. PM enhancement thresholds where the radiative effect outweighs the chemical effect vary by fuel type, being highest for boreal forest fires, followed by peat and temperate forest, and lowest in deforested/tropical forest, agricultural waste and savanna. In the case of temperate forest fires, even small plumes could exhibit a more pronounced aerosol radiative effect than the chemical effect in the near field.
As we control the PM magnitude, the various patterns across fuel types are due to variations in emission factors of O3 precursors, particularly NOx. According to GFED, emissions from the boreal forest fires exhibit the highest PM-to-NOx ratio, followed by those from peat, temperate forest and tropical forest fires. The lowest ratios are observed in agricultural waste and savanna burning. These results highlight that the aerosol influence on O3 is not only dependent on the abundance of PM but also modulated by NOx concentrations. Higher NOx levels can suppress the chemical effect of aerosols by altering HOx loss pathways; under high-NOx conditions, more HOx is consumed by reactions with NOx, leaving less HOx for heterogeneous uptake by aerosols. On the other hand, larger PM concentrations enhance HOx loss through aerosol uptake. The interplay between these two factors largely accounts for the variations in aerosol impacts on O3 within fire plumes.
Studies generally report dilution rates in fire plumes on the order of 10−5–10−4 s−1 (Decker et al., 2021; Peng et al., 2021; Rickly et al., 2022), with some studies observing rates as high as 10−3 s−1 (Robinson et al., 2021). In Fig. 3, we adopt a dilution rate of approximately 10−5 s−1 and we further assess its impact by increasing this rate by factors of 10 and 100 in our F0AM simulations. Under the 10 × scenario (Fig. S6a), the overall fire effects and aerosol effects on O3 remain comparable, with similar thresholds at which the radiative effect exceeds the chemical effect. In the 100 × scenario (Fig. S6b), however, these effects diminish substantially. This is likely because an e-folding timescale of 17 min leaves limited time for ozone production before ozone precursors and aerosols are diluted, thereby weakening the influences of fire emissions. Nevertheless, the PM enhancement threshold at which the radiative effect exceeds the chemical effect still decreases following the order boreal forest, peat, temperate forest, tropical forest, agricultural waste and savanna (from > 300 µg m−3 down to about 20 µg m−3). The sensitivity test supports our findings that both PM and NOx are key factors controlling aerosol effects on O3.
The dependence of aerosol effects on NOx is also evident in GEOS-Chem. Figure S7 suggests that the radiative effect tends to surpass the chemical effect at high NOx levels. However, GEOS-Chem also indicates that the aerosol chemical effect consistently dominates the radiative effect for regular fires, a phenomenon not reproduced in F0AM. This discrepancy may arise because GEOS-Chem does not accurately resolve the aerosol effects on O3 for the subgrid-scale young plumes. But for plumes that are not in the immediate vicinity of the fire source, where mixing with background air has occurred, or in the case of large-scale fires that exceed the size of a grid cell, GEOS-Chem should be capable of resolving the aerosol impacts. Additionally, for the range of PM enhancement examined here (within 300 µg m−3), F0AM suggests that fire generally enhances O3 concentrations, aligning with our findings from GEOS-Chem.
Observations of PM2.5 and NO2 within fire plumes reveal that NO2 columns decay more rapidly than PM2.5 (Fig. 4). An even steeper decline is expected for surface NO2, as surface measurements are more sensitive to local emission sources compared to large-scale satellite observations (Lamsal et al., 2014). This observational finding implies that as plumes age, the aerosol heterogeneous chemical effect becomes increasingly important, as reflected by the higher PM-to-NO2 ratio in the far field compared to near sources. This also accounts for why, in GEOS-Chem simulations, the chemical effect tends to outweigh the radiative effect away from fire origins. By integrating GEOS-Chem and box model with observational constraints, our study provides a detailed and comprehensive depiction of aerosol effects within fire plumes and the potential underlying mechanisms.
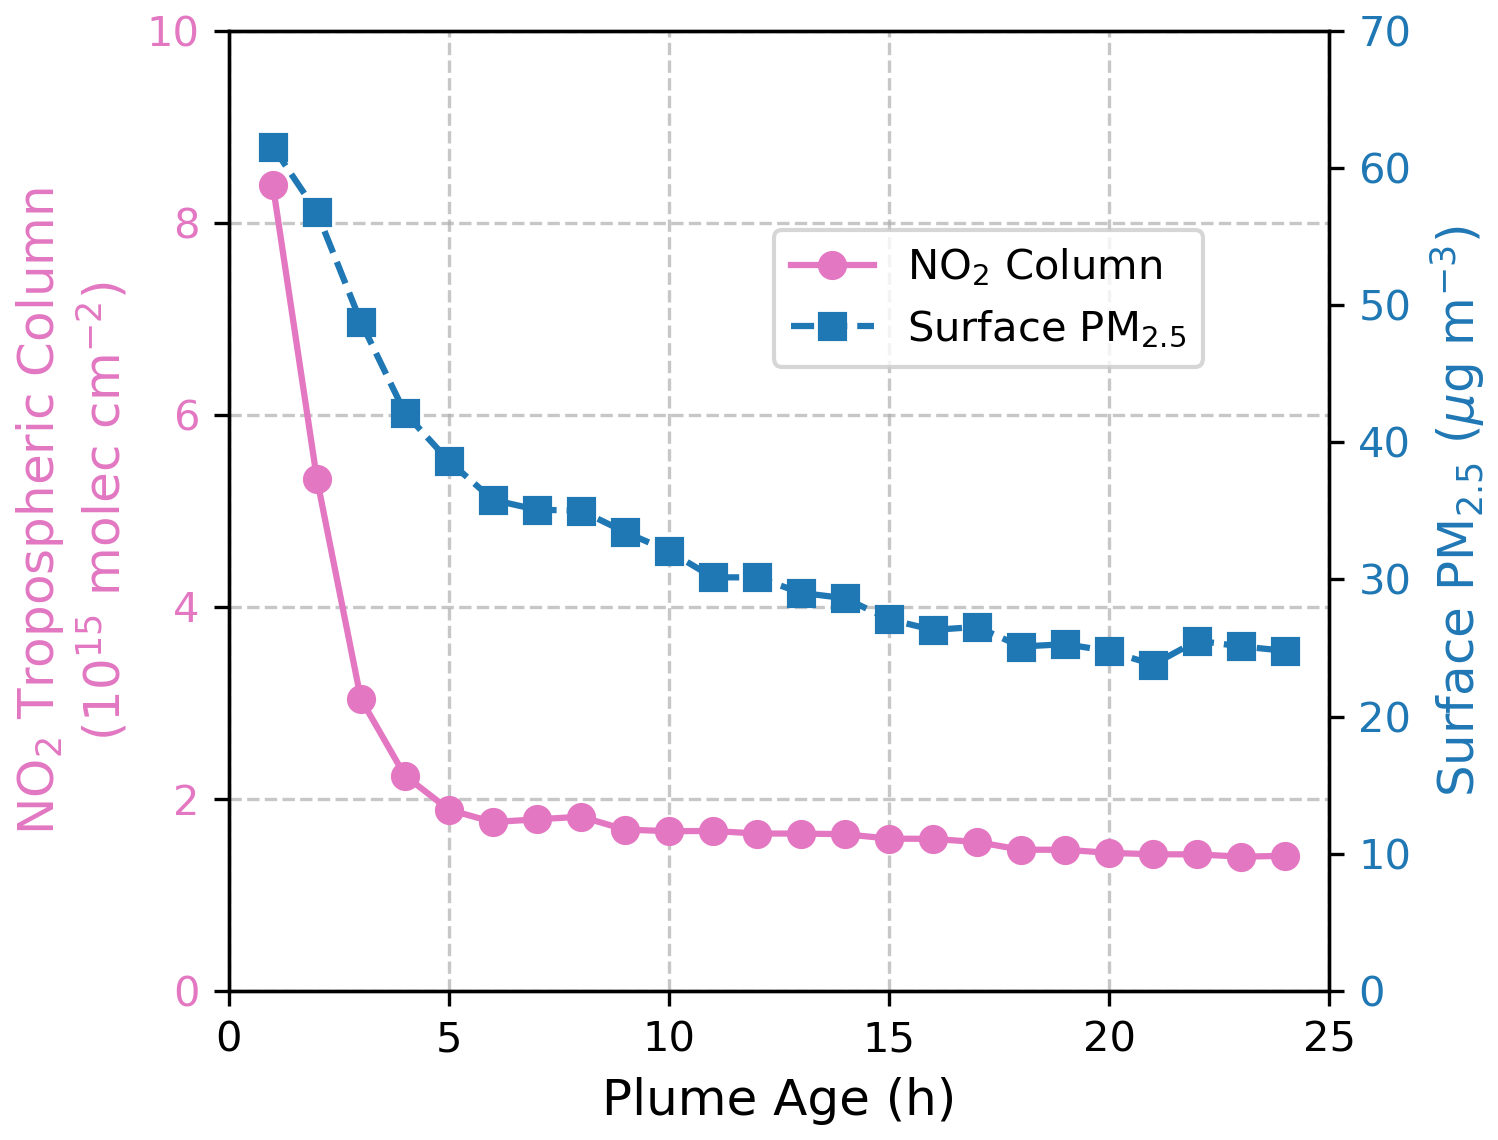
Figure 4Decay of NO2 column (pink) and surface PM2.5 (blue) within fire plumes. Surface PM2.5 data are from Wei et al. (2023) and TROPOMI NO2 tropospheric columns are from Jin et al. (2023).
To summarize, for most fires, there is generally a net positive effect on O3 concentrations. Near the source, heterogeneous chemical or radiative effects may outweigh each other depending on NOx levels. As the plumes age, NOx is rapidly consumed in the plumes, and the aerosol chemical effect tends to be increasingly important. In contrast, extremely large fires are dominated by the aerosol radiative effect, leading to an overall suppression of O3 in the near field that can extend further from the fire sources. Even for these fires, the radiative effect diminishes rapidly with dilution and is eventually surpassed by the chemical effect downwind.
The importance of aerosol effects on O3, especially the heterogeneous chemical effect, has been the subject of significant debate. Xu et al. (2021) found that the conceptual model based on gas-phase chemistry adequately explains the O3 chemistry in western US wildfire plumes (R2 of 0.64) and thus aerosol heterogeneous chemical processes are likely minor. Conversely, Li et al. (2019) and Ivatt et al. (2022) highlighted a significant role of the heterogeneous chemical effect on the near-surface O3 formation in eastern China and the Indo-Gangetic Plain during the mid-2010s. Even among studies that supported the importance of the aerosol chemical effect, some emphasized its significance in environments with high aerosol loadings, while others pointed to its relevance in clean suburban areas (Li et al., 2022; Xue et al., 2014).
Our findings reconcile seemingly contradictory studies by showing that the aerosol effects on O3 are determined by both aerosol loading and NOx concentrations. The study by Xu et al. (2021) focused on relatively fresh plumes, which are usually associated with high NOx concentrations, where the inhibitive effects of smoke aerosols may be secondary. However, as plumes age and both NOx and PM concentrations decay, the longer-lived accumulation mode aerosols (lifetime of 5–7 d, compared to hours to a day for NOx) (Jin et al., 2021; Seinfeld and Pandis, 2016) can become more influential in O3 production. The shift in the relative importance of aerosols vs. NOx may differ in urban/suburban settings, where PM and NOx can originate from different sources and possibly lead to more varied concentration patterns. O3 production can be significantly impacted by heterogeneous chemistry in conditions ranging from heavily polluted areas with high aerosol loadings to cleaner areas with moderate aerosol loadings but low NOx.
3.3 Prevalence of aerosol-dominated regimes during the 2020 California fire season
Our findings emphasize that both the heterogeneous chemical and radiative effects can significantly influence O3 production depending on fire conditions. Driven by these insights, we propose a novel O3 production regime, termed the “light-limited regime”, which is identified through a sensitivity test in which the radiative effect is turned off and the resulting reduction in HOx availability outweighs any of the three termination pathways. Figure S8 illustrates the O3 production regime over California from July to December under a no-biomass-burning scenario. In the absence of fire impacts, most of the areas are in NOx-limited regimes during the summertime, with a NOx-saturated regime in the urban cores of Los Angeles and San Francisco. During the cooler months, a large number of regions shift to a VOC-limited regime.
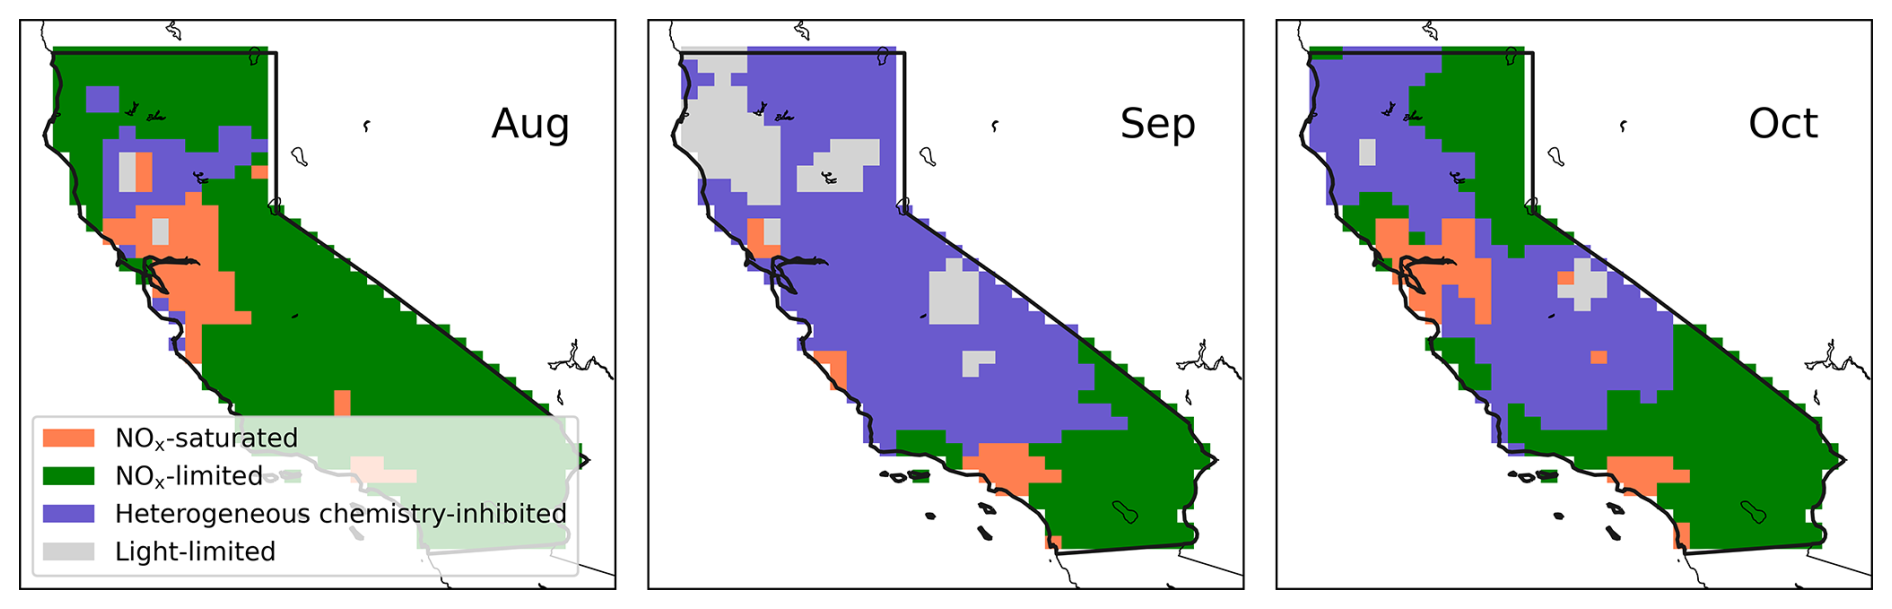
Figure 5Monthly mean GEOS-Chem-derived O3 photochemical regimes at 20:30 UTC (corresponding to 13:30 LT during daylight saving and 12:30 LT otherwise) over California during the fire season (August to October), when fires are accounted for.
Accounting for the impacts of fires on O3 reveals significant changes in the O3 production regimes during the fire season, as shown in Fig. 5 (and Fig. S9). Details about significant fire events and emissions during the 2020 wildfire season in California are summarized in Text S1. It is evident that numerous areas transition to either the heterogeneous chemistry-inhibited regime or the light-limited regime, which we collectively term “aerosol-dominated regimes”.
From August to October, the monthly mean proportions of grid boxes in California entering the aerosol-dominated regimes were 8.9 %, 75 % and 43 %, respectively (Fig. 5). Specifically, 8 %, 60 % and 41 % corresponded to the heterogeneous chemistry-inhibited regime, and 0.9 %, 15 % and 1.7 % were classified as the light-limited regime. The impact of fires on these regimes was minimal for November, when most wildfires were contained. Furthermore, the episodic nature of wildfires caused large daily variations in the O3 production regime; the heterogenous chemistry-inhibited regime had an average ± standard deviation of 19 ± 13 %, 48 ± 16 % and 33 ± 24 % for the periods of 16–31 August, September and October, respectively. Similarly, the light-limited regime showed 1.6 ± 1.4 %, 13 ± 9.6 % and 3.2 ± 5.9 % for the same periods.
The newly defined light-limited regime extensively reflects the central areas of megafires (Fig. 1). The August Complex, SCU Lightning Complex, Creek, LNU Lightning Complex and North Complex were ranked as the top five fires by burned areas in 2020 (CAL FIRE, 2020b). Notably, during September, the August Complex, Creek and North Complex fires peaked, leading to extensive areas falling under the light-limited regime due to these large-scale wildfires, with the peripheral zones exhibiting heterogeneous chemistry-inhibited regime (Fig. 5). The period from 8 to 10 September, during the fire season, experienced the most extensive coverage of the light-limited regime across the state (32 %–42 %, Fig. S10), coinciding with significant wildfire events. Notably, despite the exceptionally large scale of the SCU and LNU Lightning Complex fires, their impacts on the light-limited regime were much less pronounced compared to the other three fires based on both daily and monthly average. A NOx-saturated regime was predominant under the impact of these two wildfires. We attribute the difference in regimes to the distinct environments where fires occurred. Contrary to the fires in forest areas, the SCU and LNU fires occurred in the Bay area, an urban region characterized by significant higher background levels of NOx. Elevated NOx concentrations enhance HOx termination through reactions with NOx, necessitating higher aerosol concentrations for the light effect term to surpass this termination pathway. The observed reduction in the light-limited regime under high NOx conditions further corroborates our earlier findings on the interactions among aerosol effects, PM and NOx.
3.4 Uncertainties in GEOS-Chem-resolved aerosol effects and O3 regimes
The aerosol effects and regime calculations derived from modeling are subject to uncertainties, primarily associated with the HO2 uptake coefficient () and fire emission inventory. Due to the challenges of directly observing or constraining the aerosol heterogeneous uptake through measurements, we rely on model simulations to estimate the chemical effect. Consequently, the results are influenced by the values used in the analysis, a parameter that varies with aerosol types and relative humidity. A summary of reported in previous laboratory measurements and field studies is provided in Table S1. Organics constitute a major fraction of biomass-burning aerosols. Laboratory studies measuring the uptake coefficient from single-component organics have reported values of 0.007–0.09 for humic acid (Lakey et al., 2015), < 0.01–0.13 for levoglucosan (Taketani et al., 2010) and 0.02–0.18 for dicarboxylic acids (Taketani et al., 2013), across a variety of relative humidity levels. In comparison, field studies generally report higher values (0.08–0.40) (Taketani et al., 2012; Zhou et al., 2020), likely due to the presence of copper and iron ions in the particles that are known to enhance HO2 uptake (Mao et al., 2013). To our knowledge, no studies have specifically measured for biomass-burning aerosols in field settings, but Taketani et al. (2012) reported values of 0.2–0.37 for samples strongly affected by biomass burning. To assess the impact of on our results, we conduct sensitivity tests using of 0.1 and 0.02 for a 1-month simulation during September. Under the 0.1 scenario, aerosol effects across fire sizes are similar to Fig. 2: the aerosol chemical effect outweighs the radiative effect for small to large fire pixels, while extreme fire pixels show a pronounced radiative effect (Fig. S11a, b). Although the overall fire effect reduces O3 net production rate, its influence on O3 concentrations is minimal. The spatial pattern of photochemical regimes remains largely unchanged under this scenario (Fig. S12a).
Given that measured for single-component organics likely underestimates values for ambient aerosols, the case is tested as a conservative lower bond. Under this assumption, aerosol chemical and radiative effects on O3 concentrations become comparable for most fire pixels, whereas extreme fire pixels continue to exhibit a pronounced radiative effect (Fig. S11c, d). Although this strong radiative effect suppresses O3 production in near-field extreme fire pixels, O3 concentrations still increase. With this substantially reduced uptake coefficient, the spatial extent of heterogeneous chemistry-inhibited regimes decreases markedly. Nevertheless, overall aerosol influences remain important, with 31 % of California falling into aerosol-dominated regimes (Fig. S12b). Future research measuring for smoke aerosols is needed to better constrain this parameter.
Furthermore, we evaluate GEOS-Chem simulations of PM2.5 with ground-based measurements from EPA's AQS. We find that GEOS-Chem tends to overestimate PM2.5, simulating 2020 daily average PM2.5 levels at 24 ± 23 µg m−3, compared to 12 ± 5.5 µg m−3 from ground-based observations. During the fire season, modeled PM2.5 concentrations are about 1.2, 4.1 and 2.4 times higher than the ground observations in August, September and October, respectively. Outside the peak fire months, the agreement improves, with modeled PM2.5 concentrations being 0.6, 1.4 and 0.9 times the observed values in July, November and December, respectively. The overestimates of PM2.5 is likely driven by overestimated fire emissions in GFED (Qiu et al., 2024). These comparisons, however, are limited by factors such as the sparse ground observations (∼ 72 sites for PM2.5), the potential unrepresentativeness of a single site for the coarse grid in GEOS-Chem and the GEOS-Chem modeled decay of PM further from the fires. To assess the potential impacts of model overestimates on our analysis, we perform additional simulations by scaling monthly biomass-burning emissions based on the model–observation comparisons. Specifically, GFED fire emissions are adjusted by dividing total emissions by 0.6, 1.2, 4.1, 2.4, 1.4 and 0.9 for July through December, respectively. Despite the substantial reduction in overall fire emissions, the aerosol and total fire effects on O3 concentrations for most fires remain consistent with Fig. 2, whereas the radiative effect for extreme fires declines markedly in both the near and far field due to reduced aerosol loading (Fig. S11e, f). Aerosol-dominated regimes still accounted for about 7 %, 54 % and 17 % of the total area in August, September and October, respectively (Fig. S13). Notably, aerosol-dominated regimes remain dominant in September during the 2020 fire season.
3.5 What is the PM2.5 threshold for reaching aerosol-dominated regimes?
Recognizing that the regime classification discussed above may be affected by model inputs and performance, we further explore how these model-based findings can be applied to observational data, with a primary focus on identifying aerosol-dominated regimes. We first investigate whether PM2.5 as an indicator of aerosol concentrations can be used to identify the regime shift. Figure 6a shows the average fractional contribution of each HOx termination pathway at various PM2.5 levels. As PM levels increase, HOx loss via self-reaction declines, while aerosol heterogeneous uptake and photolysis reduction effects become increasingly dominant. Figure 6b exhibits the probability of each regime at various PM2.5 levels. Low PM2.5 levels are usually associated with a NOx-limited regime. The heterogeneous chemistry-inhibited regime is more likely to occur as PM2.5 levels increase until the light-limited regime overshadows it at extremely high PM2.5 concentrations. At a PM2.5 concentration of 30 µg m−3, O3 production already transitions to the heterogeneous chemistry-inhibited regime in most areas under the impact of fires. A considerably higher PM2.5 concentration (∼ 500 µg m−3) is required to enter the light-limited regime. We observe a similar pattern of HOx losses and regime shifts when reducing the value to 0.1, as shown in Fig. S14. In this calculation, the PM2.5 threshold for shifting to a heterogeneous chemistry-inhibited regime increases slightly from 30 to 40 µg m−3.
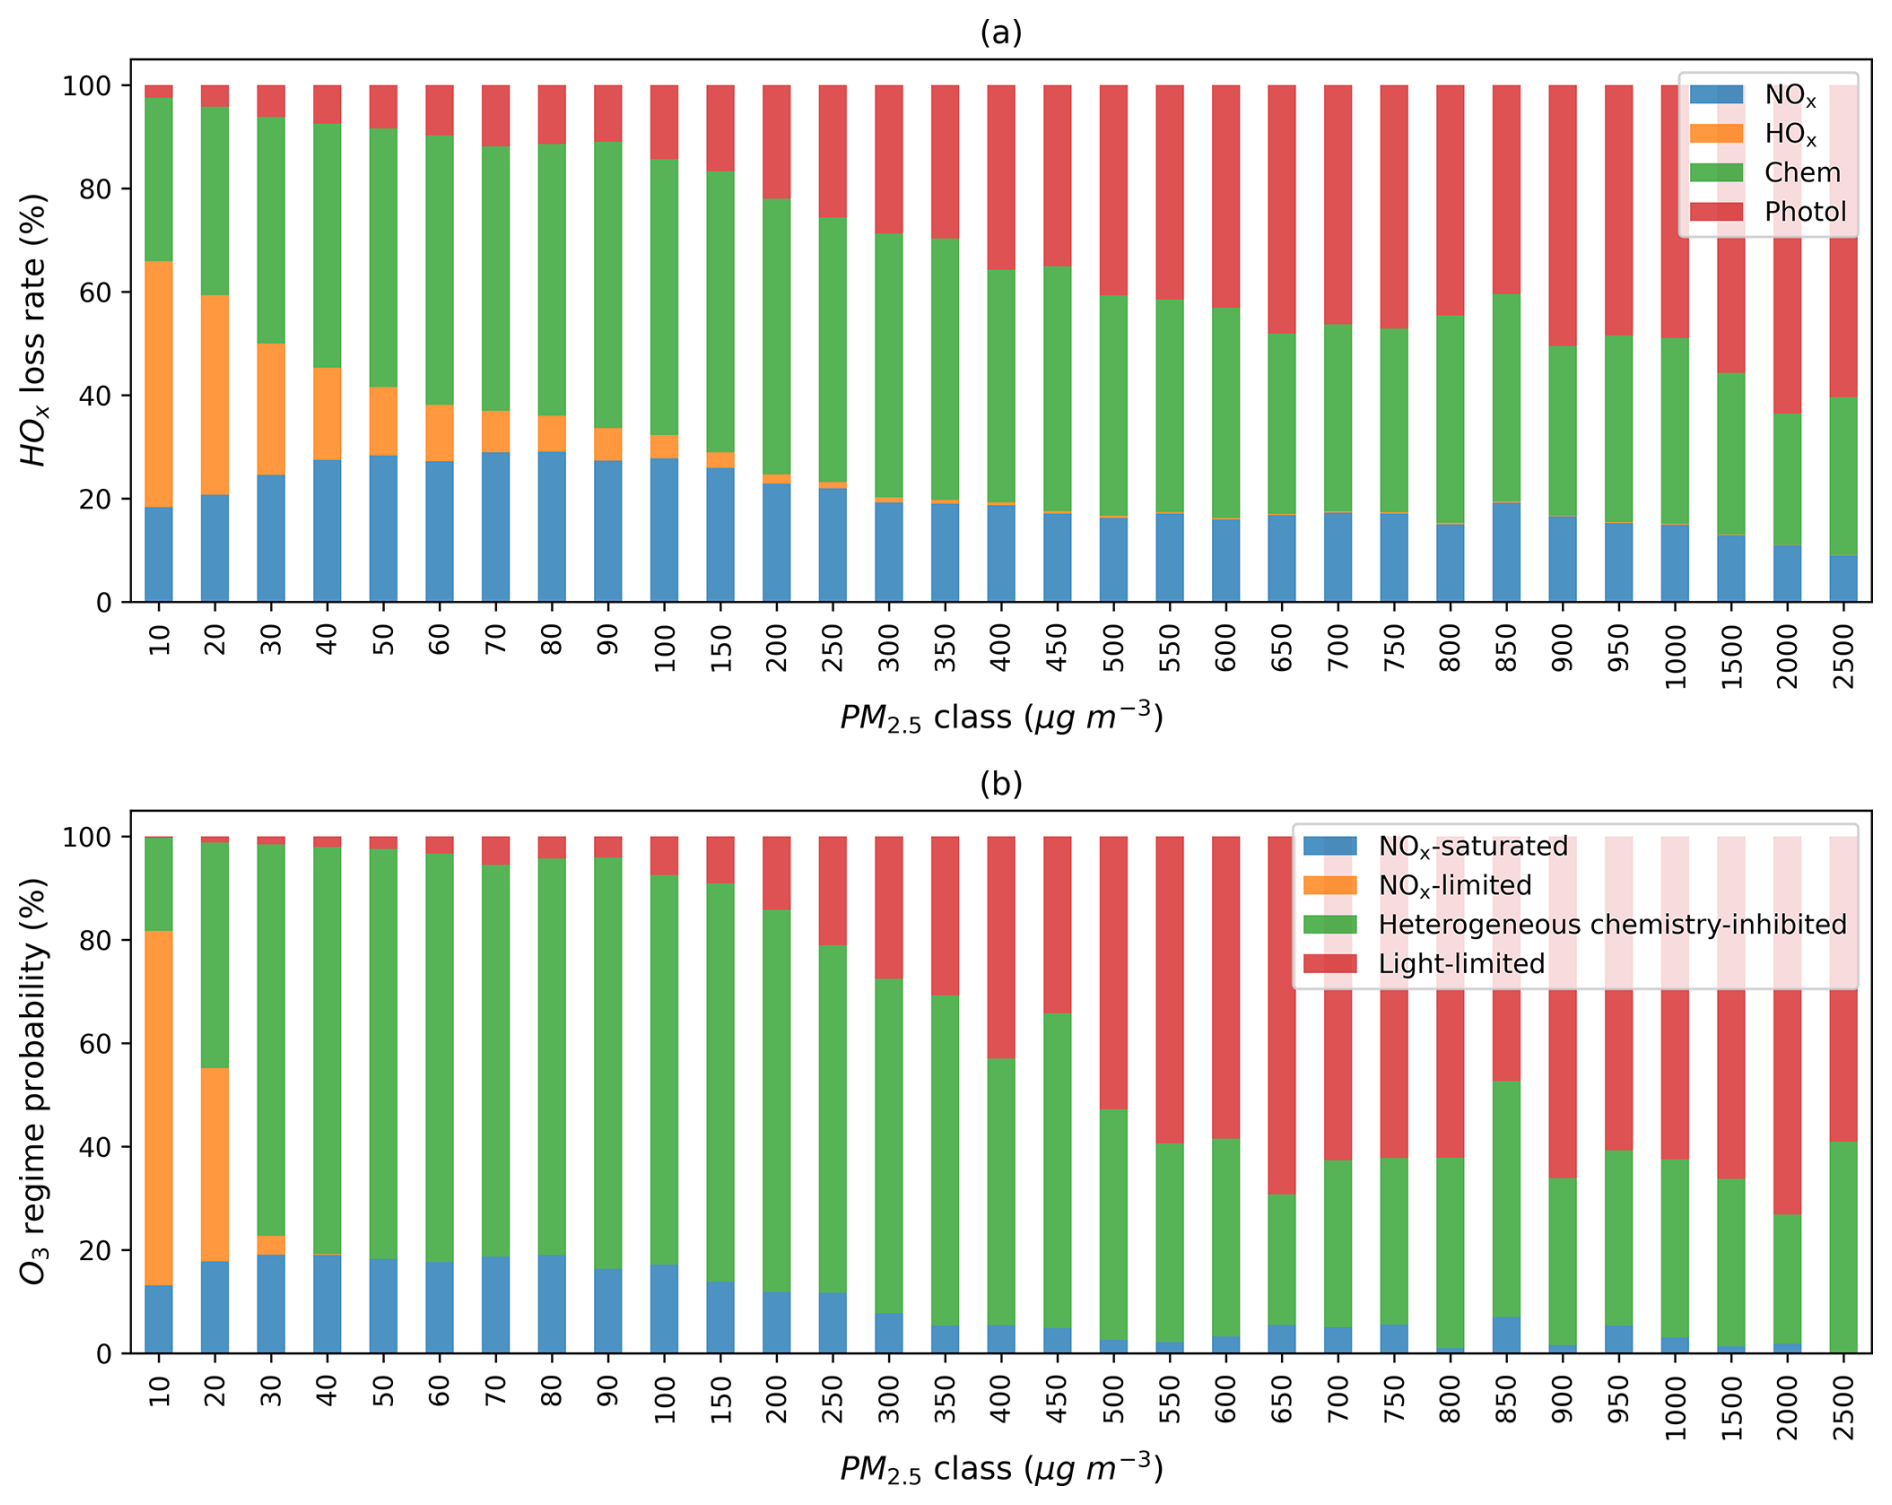
Figure 6(a) Average fractional contribution of the four HOx termination terms to the total. (b) Probability distribution of grid boxes across different photochemical regimes at various PM2.5 levels. The analysis includes all fire-affected grid boxes at 20:30 UTC on all days in 2020, identified based on ΔPM2.5 > 10 µg m−3. PM2.5 classes denote rounded total PM2.5 concentrations.
It is important to note that classifying a regime as “heterogeneous chemistry-inhibited” or “light-limited” does not necessarily imply a net suppression of O3. The regime classification approach based on HOx termination rate does not directly compare with the aerosol and emission effects quantified in Sect. 3.1 and 3.2. For example, a “heterogeneous chemistry-inhibited” regime indicates that HO2 uptake is the largest sink of HOx, but this does not imply that the combined aerosol chemical and radiative effects outweigh the influence of VOC and NOx emissions. As shown in Fig. 2, large fires with PM2.5 enhancement of 200 µg m−3 still exhibit net O3 increases despite strong heterogeneous chemical effects.
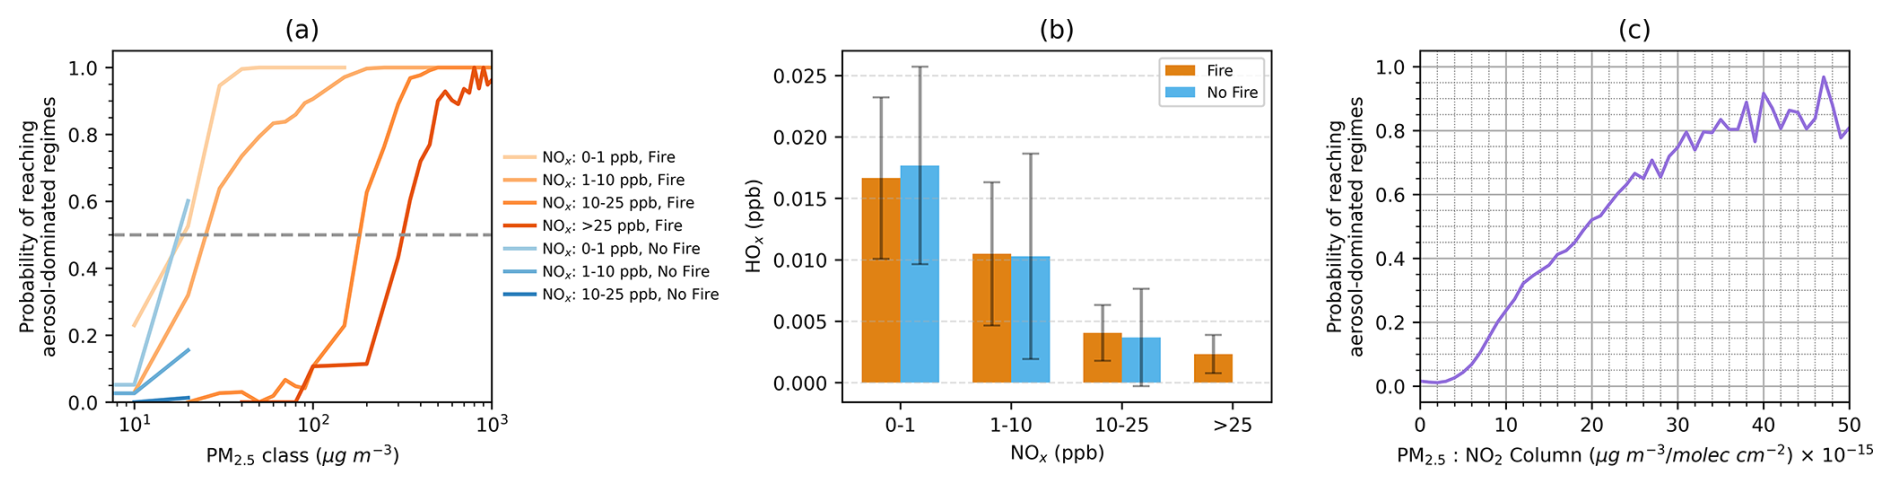
Figure 7(a) Probability of achieving aerosol-dominated regimes in response to varying PM2.5 and NOx concentrations, differentiated by fire-impacted (orange) and non-fire (blue) grid boxes. The dashed line marks the thresholds where half of the grid boxes enter aerosol-dominated regimes. (b) HOx concentrations across different NOx concentration bins. (c) Relationship between the surface PM2.5-to-NO2 column ratio and the probability of reaching aerosol-dominated regimes, combining both fire-impacted and non-fire grid boxes.
Further investigations uncover that the PM2.5 threshold required for most grid boxes to transition to a heterogeneous chemistry-inhibited regime is highly dependent on NOx concentrations (Fig. 7a). Here we categorize NOx concentrations into four classes: 0–1, 1–10, 10–25 and > 25 ppb, and the PM2.5 thresholds likely to induce aerosol-dominated regimes are approximately 18, 25, 185 and 320 µg m−3, correspondingly. We primarily focus on fire plumes in this study, but grid boxes not affected by fires appear to exhibit similar trends in the probability of aerosol-dominated regimes. These results support our earlier findings that in scenarios with high NOx concentrations, more PM is needed to attain a comparable level of aerosol contribution as observed in low NOx scenarios. As NOx concentrations increase, HOx levels tend to decrease (Fig. 7b), which necessitates higher PM levels for aerosol effects to surpass the emission effects. Since PM2.5 and NO2 can be derived from ground-based or satellite observations, we explore how their ratio can be used to imply aerosol-dominated regimes. While a surface PM2.5 NO2 ratio may seem more straightforward based on our analysis, the limited spatial coverage of surface NO2 measurements poses a challenge. Tropospheric NO2 column data, which are closely related to surface sources and have been widely used in O3 sensitivity analyses (Martin et al., 2004), offer a practical alternative. When combined with high resolution and gapless surface PM2.5 estimates derived from the integration of observations and machine learning, the PM2.5 NO2 column ratio serves as a proxy to constrain aerosol effects on near-surface O3 production. Indeed, we find a clear relationship between this ratio and the likelihood of aerosol-dominated regimes (Fig. 7c). When the ratio (PM2.5 NO2 column) reaches about 20 µg m−3 (1015 molec. cm−2)−1, the aerosol-dominated regimes are likely to prevail and will consistently be dominant at higher ratios.
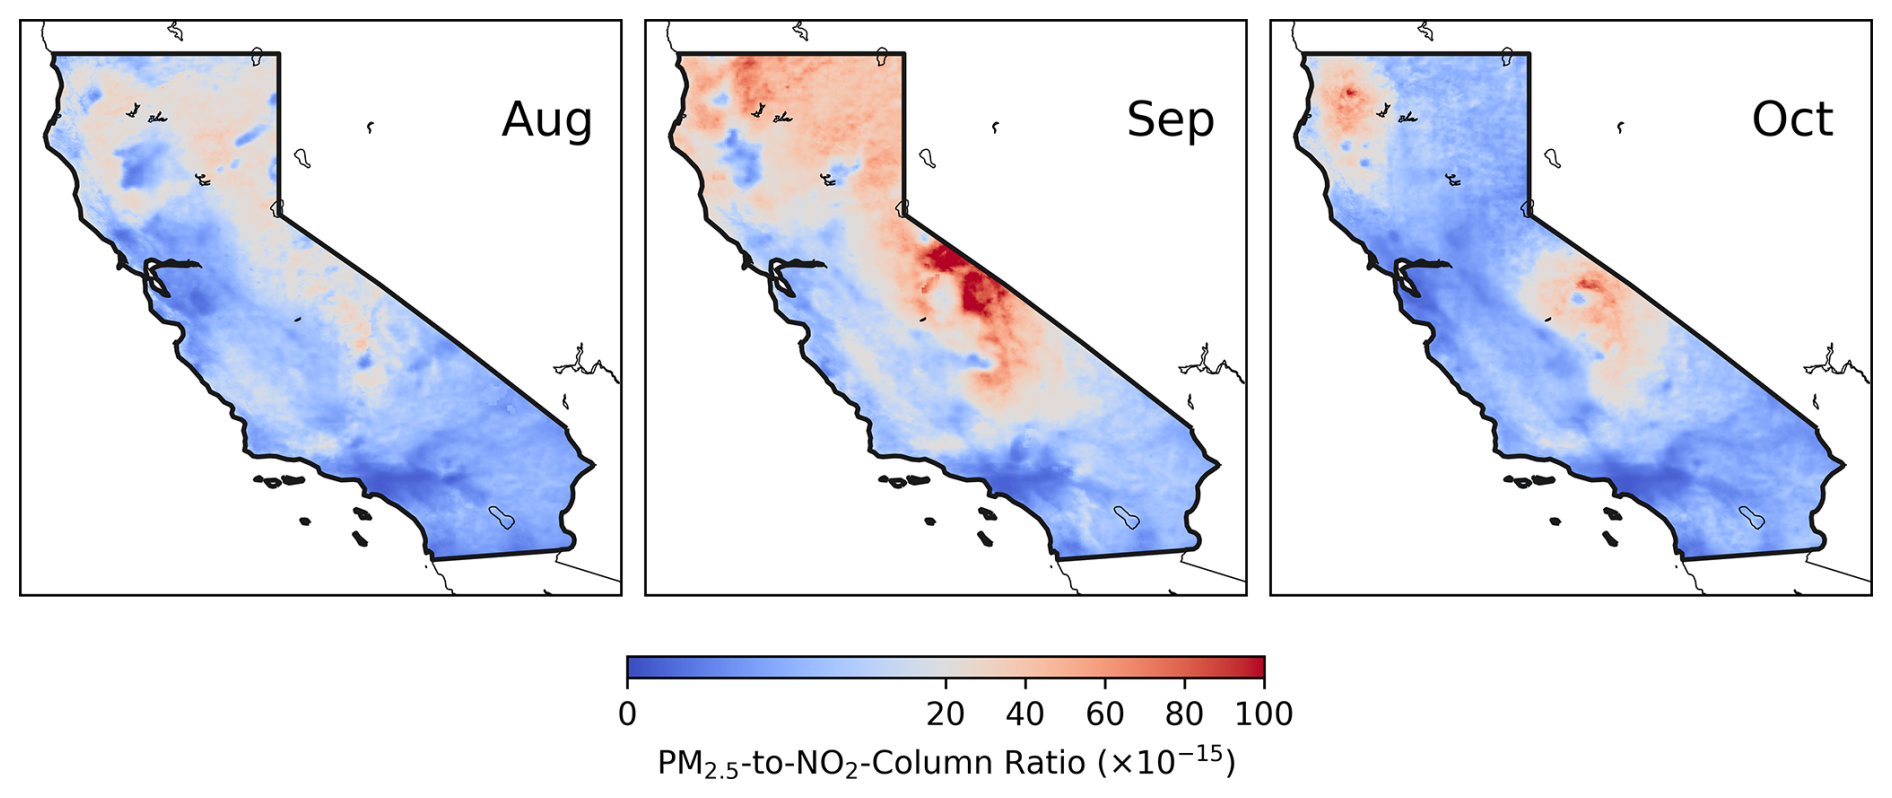
Figure 8Monthly mean O3 photochemical regimes identified using the ratio of surface PM2.5 to TROPOMI NO2 column over California from August to October. Red colors represent aerosol-dominated regimes, while blue colors indicate NOx-limited or NOx-saturated regimes. Monthly mean PM2.5 and NO2 are used to calculate the ratio, with a threshold of 20 µg m−3 (1015 molec. cm−2)−1 applied to identify aerosol-dominated regimes.
We therefore adopt a threshold of 20 µg m−3 (1015 molec. cm−2)−1 for PM2.5 NO2 to identify aerosol-dominated regimes and apply it to satellite-derived surface PM2.5 and tropospheric NO2 column data. The resulting aerosol-dominated regimes are highlighted in red in Fig. 8. Overall, the observation-based aerosol-dominated regimes in Fig. 8 align well with the model-based classification in Fig. 5. Both methods reveal similar spatial distributions: aerosol-dominated regimes were widespread in September, peaked in the northern and central region in October, but exhibited relatively larger discrepancies in August. Spatially, the observation-based method estimates that approximately 20 %, 47 % and 16 % of the state fell within aerosol-dominated regimes from August to October; these values are larger than the model estimates for August but smaller for September. Despite these differences, the general agreement between the two regime classifications underscores the significant role of aerosols in surface O3 photochemistry under wildfire conditions. This analysis also highlights the utility of satellite-derived PM2.5-to-NO2 ratio for pinpointing aerosol-dominated regimes. Applying this metric to other regions and environments may need further investigation. While the comparison of fire and urban plumes is beyond the scope of this study, it is worth noting that fire and urban plumes may differ substantially in emissions and aerosol composition and thus O3 chemistry. Future research is therefore warranted to incorporate more sophisticated representations of these differences. Additionally, it may be valuable to compare the robustness of this metric with a fully satellite-based indicator, such as the AOD NO2 ratio.
Aerosols typically suppress surface O3 formation through heterogeneous uptake of HO2 and the reduction in photolysis rates, yet both pathways are difficult to observe or measure directly. Here, we combine GEOS-Chem, F0AM box model and observational constraints to examine aerosol effects on O3 formation. We found that for most fires, O3 concentrations increase because emissions of O3 precursors outweigh aerosol effects. In contrast, during extreme large fires, the strong radiative effect may lead to an O3 suppression near the fire sources. As plumes age, the aerosol chemical effect becomes more pronounced. To represent these effects, we introduce the aerosol heterogenous chemistry-inhibited and light-limited regimes into GEOS-Chem. Our results suggest that aerosol-dominated regimes played a significant role during the 2020 wildfire season in California.
Aerosol loading and NOx levels are the key factors governing aerosol effects on near-surface O3 formation. Under NOx-saturated and aerosol-dominated regimes, O3 chemistry becomes HOx-limited. Higher NOx reduces aerosol effects by driving more HOx to react with NOx. These results imply that even at similar aerosol concentrations, fire and urban plumes are likely to experience different levels of aerosol effects and fall in distinct photochemical regimes. Within wildfires, areas are apt to achieve the heterogeneous chemistry-inhibited regime when PM2.5 concentrations approach tens of µg m−3. However, the typically high NOx concentrations in urban areas may preclude the emergence of aerosol-dominated regimes in these regions. These insights have significant implications for O3 pollution in downwind urban areas. Previous studies have pointed out that VOC-rich wildfire plumes can enhance O3 pollution when they mix into high-NOx urban plumes (Jin et al., 2023; Xu et al., 2021). This study, however, unveils an additional, hidden downside of urban high NOx: it obscures aerosol effects that would otherwise help reduce O3, thereby exacerbating O3 pollution relative to scenarios where wildfire smoke penetrates rural or suburban areas. It suggests that reducing NOx concentrations in urban downwind areas could yield further benefits for mitigating O3 pollution under fire conditions.
In addition to the diagnostic modeling approach for identifying aerosol-dominated regimes, we propose using the surface PM2.5-to-NO2 column ratio as an indicator. When combined with the widely used HCHO-to-NO2 ratio (FNR) for identifying NOx-limited or NOx-saturated regimes with satellite remote sensing (Itahashi et al., 2022; Jin et al., 2020; Souri et al., 2020), this enables a comprehensive identification of O3 regimes on a global scale using observation-based NO2, HCHO and PM2.5. However, challenges remain for identifying O3 regimes under wildfire conditions due to retrieval uncertainties in thick smoke plumes and significant primary HCHO emissions that may compromise its effectiveness as an indicator of VOC reactivity (Liao et al., 2021). More work is needed to evaluate the reliability of FNR thresholds in wildfire plumes and to refine PM2.5-to-NO2 thresholds under diverse environmental settings to improve our ability to characterize photochemical regimes.
The data and scripts for the regime classification in this study are openly available at https://github.com/Jiaqi-Shen/Shen_et_al_fire_chemistry_manuscript (last access: 31 July 2025; https://doi.org/10.5281/zenodo.16584864, Shen, 2025).
The supplement related to this article is available online at https://doi.org/10.5194/acp-25-8701-2025-supplement.
JS: methodology, formal analysis, data curation, visualization, writing – original draft. RCC: conceptualization, funding acquisition, writing – review and editing. GMW: methodology, writing – review and editing. XJ: conceptualization, methodology, funding acquisition, writing – review and editing. All authors have given approval to the final version of the article.
The contact author has declared that none of the authors has any competing interests.
Publisher's note: Copernicus Publications remains neutral with regard to jurisdictional claims made in the text, published maps, institutional affiliations, or any other geographical representation in this paper. While Copernicus Publications makes every effort to include appropriate place names, the final responsibility lies with the authors.
This research used the computational cluster resource provided by the Office of Advanced Research Computing (OARC) at Rutgers, The State University of New Jersey. We thank Jean Rivera-Rios from Rutgers University for insightful discussions on organic nitrate chemistry, Ke Li from Nanjing University of Information Science and Technology for discussions on GEOS-Chem simulations and Jing Wei from University of Maryland for providing data support on surface PM2.5.
This research has been supported by US National Oceanic and Atmospheric Administration (NOAA) Climate Program Office's Atmospheric Chemistry, Carbon Cycle, and Climate program (grant no. NA22OAR4310199) and US National Aeronautics and Space Administration (NASA) Aura Science Team and Atmospheric Composition Modeling and Analysis Program (grant no. 80NSSC23K1004). Glenn M. Wolfe was supported by NASA Tropospheric Composition program.
This paper was edited by Yuan Wang and reviewed by four anonymous referees.
Akagi, S. K., Yokelson, R. J., Wiedinmyer, C., Alvarado, M. J., Reid, J. S., Karl, T., Crounse, J. D., and Wennberg, P. O.: Emission factors for open and domestic biomass burning for use in atmospheric models, Atmos. Chem. Phys., 11, 4039–4072, https://doi.org/10.5194/acp-11-4039-2011, 2011.
Alvarado, M. J., Logan, J. A., Mao, J., Apel, E., Riemer, D., Blake, D., Cohen, R. C., Min, K.-E., Perring, A. E., Browne, E. C., Wooldridge, P. J., Diskin, G. S., Sachse, G. W., Fuelberg, H., Sessions, W. R., Harrigan, D. L., Huey, G., Liao, J., Case-Hanks, A., Jimenez, J. L., Cubison, M. J., Vay, S. A., Weinheimer, A. J., Knapp, D. J., Montzka, D. D., Flocke, F. M., Pollack, I. B., Wennberg, P. O., Kurten, A., Crounse, J., Clair, J. M. St., Wisthaler, A., Mikoviny, T., Yantosca, R. M., Carouge, C. C., and Le Sager, P.: Nitrogen oxides and PAN in plumes from boreal fires during ARCTAS-B and their impact on ozone: an integrated analysis of aircraft and satellite observations, Atmos. Chem. Phys., 10, 9739–9760, https://doi.org/10.5194/acp-10-9739-2010, 2010.
Benas, N., Mourtzanou, E., Kouvarakis, G., Bais, A., Mihalopoulos, N., and Vardavas, I.: Surface ozone photolysis rate trends in the Eastern Mediterranean: Modeling the effects of aerosols and total column ozone based on Terra MODIS data, Atmos. Environ., 74, 1–9, https://doi.org/10.1016/j.atmosenv.2013.03.019, 2013.
Bey, I., Jacob, D. J., Yantosca, R. M., Logan, J. A., Field, B. D., Fiore, A. M., Li, Q., Liu, H. Y., Mickley, L. J., and Schultz, M. G.: Global modeling of tropospheric chemistry with assimilated meteorology: Model description and evaluation, J. Geophys. Res.-Atmos., 106, 23073–23095, https://doi.org/10.1029/2001JD000807, 2001.
Bian, H. and Prather, M. J.: Fast-J2: Accurate Simulation of Stratospheric Photolysis in Global Chemical Models, J. Atmos. Chem., 41, 281–296, https://doi.org/10.1023/A:1014980619462, 2002.
CAL FIRE: 2020 Incident Archive, CAL FIRE, https://www.fire.ca.gov/incidents/2020 (last access: 29 January 2025), 2020a.
CAL FIRE: California wildfires statistics, CAL FIRE, https://www.fire.ca.gov/our-impact/statistics (last access: 29 January 2025), 2020b.
Carlos-Cuellar, S., Li, P., Christensen, A. P., Krueger, B. J., Burrichter, C., and Grassian, V. H.: Heterogeneous Uptake Kinetics of Volatile Organic Compounds on Oxide Surfaces Using a Knudsen Cell Reactor: Adsorption of Acetic Acid, Formaldehyde, and Methanol on α-Fe2O3, α-Al2O3, and SiO2, J. Phys. Chem. A, 107, 4250–4261, https://doi.org/10.1021/jp0267609, 2003.
Cattau, M. E., Wessman, C., Mahood, A., and Balch, J. K.: Anthropogenic and lightning-started fires are becoming larger and more frequent over a longer season length in the U.S.A., Glob. Ecol. Biogeogr., 29, 668–681, https://doi.org/10.1111/geb.13058, 2020.
Collins, L., Bradstock, R. A., Clarke, H., Clarke, M. F., Nolan, R. H., and Penman, T. D.: The 2019/2020 mega-fires exposed Australian ecosystems to an unprecedented extent of high-severity fire, Environ. Res. Lett., 16, 044029, https://doi.org/10.1088/1748-9326/abeb9e, 2021.
Coop, J. D., Parks, S. A., Stevens-Rumann, C. S., Ritter, S. M., and Hoffman, C. M.: Extreme fire spread events and area burned under recent and future climate in the western USA, Glob. Ecol. Biogeogr., 31, 1949–1959, https://doi.org/10.1111/geb.13496, 2022.
Decker, Z. C. J., Zarzana, K. J., Coggon, M., Min, K.-E., Pollack, I., Ryerson, T. B., Peischl, J., Edwards, P., Dubé, W. P., Markovic, M. Z., Roberts, J. M., Veres, P. R., Graus, M., Warneke, C., de Gouw, J., Hatch, L. E., Barsanti, K. C., and Brown, S. S.: Nighttime Chemical Transformation in Biomass Burning Plumes: A Box Model Analysis Initialized with Aircraft Observations, Environ. Sci. Technol., 53, 2529–2538, https://doi.org/10.1021/acs.est.8b05359, 2019.
Decker, Z. C. J., Robinson, M. A., Barsanti, K. C., Bourgeois, I., Coggon, M. M., DiGangi, J. P., Diskin, G. S., Flocke, F. M., Franchin, A., Fredrickson, C. D., Gkatzelis, G. I., Hall, S. R., Halliday, H., Holmes, C. D., Huey, L. G., Lee, Y. R., Lindaas, J., Middlebrook, A. M., Montzka, D. D., Moore, R., Neuman, J. A., Nowak, J. B., Palm, B. B., Peischl, J., Piel, F., Rickly, P. S., Rollins, A. W., Ryerson, T. B., Schwantes, R. H., Sekimoto, K., Thornhill, L., Thornton, J. A., Tyndall, G. S., Ullmann, K., Van Rooy, P., Veres, P. R., Warneke, C., Washenfelder, R. A., Weinheimer, A. J., Wiggins, E., Winstead, E., Wisthaler, A., Womack, C., and Brown, S. S.: Nighttime and daytime dark oxidation chemistry in wildfire plumes: an observation and model analysis of FIREX-AQ aircraft data, Atmos. Chem. Phys., 21, 16293–16317, https://doi.org/10.5194/acp-21-16293-2021, 2021.
Dreessen, J., Sullivan, J., and Delgado, R.: Observations and impacts of transported Canadian wildfire smoke on ozone and aerosol air quality in the Maryland region on June 9–12, 2015, J. Air Waste Manage. Assoc., 66, 842–862, https://doi.org/10.1080/10962247.2016.1161674, 2016.
Duane, A., Castellnou, M., and Brotons, L.: Towards a comprehensive look at global drivers of novel extreme wildfire events, Climatic Change, 165, 43, https://doi.org/10.1007/s10584-021-03066-4, 2021.
EPA AQS: AirData, EPA AQS, https://aqs.epa.gov/aqsweb/airdata/download_files.html (last access: 6 August 2024), 2020.
Fischer, E. V., Jacob, D. J., Yantosca, R. M., Sulprizio, M. P., Millet, D. B., Mao, J., Paulot, F., Singh, H. B., Roiger, A., Ries, L., Talbot, R. W., Dzepina, K., and Pandey Deolal, S.: Atmospheric peroxyacetyl nitrate (PAN): a global budget and source attribution, Atmos. Chem. Phys., 14, 2679–2698, https://doi.org/10.5194/acp-14-2679-2014, 2014.
Gong, X., Kaulfus, A., Nair, U., and Jaffe, D. A.: Quantifying O3 Impacts in Urban Areas Due to Wildfires Using a Generalized Additive Model, Environ. Sci. Technol., 51, 13216–13223, https://doi.org/10.1021/acs.est.7b03130, 2017.
Ha, P. T. M., Matsuda, R., Kanaya, Y., Taketani, F., and Sudo, K.: Effects of heterogeneous reactions on tropospheric chemistry: a global simulation with the chemistry–climate model CHASER V4.0, Geosci. Model Dev., 14, 3813–3841, https://doi.org/10.5194/gmd-14-3813-2021, 2021.
Hanes, C. C., Wang, X., Jain, P., Parisien, M.-A., Little, J. M., and Flannigan, M. D.: Fire-regime changes in Canada over the last half century, Can. J. For. Res., 49, 256–269, https://doi.org/10.1139/cjfr-2018-0293, 2019.
He, S. and Carmichael, G. R.: Sensitivity of photolysis rates and ozone production in the troposphere to aerosol properties, J. Geophys. Res.-Atmos., 104, 26307–26324, https://doi.org/10.1029/1999JD900789, 1999.
Itahashi, S., Irie, H., Shimadera, H., and Chatani, S.: Fifteen-Year Trends (2005–2019) in the Satellite-Derived Ozone-Sensitive Regime in East Asia: A Gradual Shift from VOC-Sensitive to NOx-Sensitive, Remote Sens., 14, 4512, https://doi.org/10.3390/rs14184512, 2022.
Ivatt, P. D., Evans, M. J., and Lewis, A. C.: Suppression of surface ozone by an aerosol-inhibited photochemical ozone regime, Nat. Geosci., 15, 536–540, https://doi.org/10.1038/s41561-022-00972-9, 2022.
Jacob, D. J.: Heterogeneous chemistry and tropospheric ozone, Atmos. Environ., 34, 2131–2159, https://doi.org/10.1016/S1352-2310(99)00462-8, 2000.
Jaffe, D., Bertschi, I., Jaeglé, L., Novelli, P., Reid, J. S., Tanimoto, H., Vingarzan, R., and Westphal, D. L.: Long-range transport of Siberian biomass burning emissions and impact on surface ozone in western North America, Geophys. Res. Lett., 31, L16106, https://doi.org/10.1029/2004GL020093, 2004.
Jaffe, D. A. and Wigder, N. L.: Ozone production from wildfires: A critical review, Atmos. Environ., 51, 1–10, https://doi.org/10.1016/j.atmosenv.2011.11.063, 2012.
Jaffe, D. A., O'Neill, S. M., Larkin, N. K., Holder, A. L., Peterson, D. L., Halofsky, J. E., and Rappold, A. G.: Wildfire and prescribed burning impacts on air quality in the United States, J. Air Waste Manage. Assoc., 70, 583–615, https://doi.org/10.1080/10962247.2020.1749731, 2020.
Jenkin, M. E., Young, J. C., and Rickard, A. R.: The MCM v3.3.1 degradation scheme for isoprene, Atmos. Chem. Phys., 15, 11433–11459, https://doi.org/10.5194/acp-15-11433-2015, 2015.
Jiang, X., Wiedinmyer, C., and Carlton, A. G.: Aerosols from Fires: An Examination of the Effects on Ozone Photochemistry in the Western United States, Environ. Sci. Technol., 46, 11878–11886, https://doi.org/10.1021/es301541k, 2012.
Jin, X., Fiore, A., Boersma, K. F., Smedt, I. D., and Valin, L.: Inferring Changes in Summertime Surface Ozone–NOx–VOC Chemistry over U.S. Urban Areas from Two Decades of Satellite and Ground-Based Observations, Environ. Sci. Technol., 54, 6518–6529, https://doi.org/10.1021/acs.est.9b07785, 2020.
Jin, X., Zhu, Q., and Cohen, R. C.: Direct estimates of biomass burning NOx emissions and lifetimes using daily observations from TROPOMI, Atmos. Chem. Phys., 21, 15569–15587, https://doi.org/10.5194/acp-21-15569-2021, 2021.
Jin, X., Fiore, A. M., and Cohen, R. C.: Space-Based Observations of Ozone Precursors within California Wildfire Plumes and the Impacts on Ozone-NOx-VOC Chemistry, Environ. Sci. Technol., 57, 14648–14660, https://doi.org/10.1021/acs.est.3c04411, 2023.
Jones, M. W., Abatzoglou, J. T., Veraverbeke, S., Andela, N., Lasslop, G., Forkel, M., Smith, A. J. P., Burton, C., Betts, R. A., van der Werf, G. R., Sitch, S., Canadell, J. G., Santín, C., Kolden, C., Doerr, S. H., and Le Quéré, C.: Global and Regional Trends and Drivers of Fire Under Climate Change, Rev. Geophys., 60, e2020RG000726, https://doi.org/10.1029/2020RG000726, 2022.
Kleinman, L. I.: Low and high NOx tropospheric photochemistry, J. Geophys. Res.-Atmos., 99, 16831–16838, https://doi.org/10.1029/94JD01028, 1994.
Kleinman, L. I., Daum, P. H., Lee, J. H., Lee, Y.-N., Nunnermacker, L. J., Springston, S. R., Newman, L., Weinstein-Lloyd, J., and Sillman, S.: Dependence of ozone production on NO and hydrocarbons in the troposphere, Geophys. Res. Lett., 24, 2299–2302, https://doi.org/10.1029/97GL02279, 1997.
Konovalov, I. B., Beekmann, M., D'Anna, B., and George, C.: Significant light induced ozone loss on biomass burning aerosol: Evidence from chemistry-transport modeling based on new laboratory studies, Geophys. Res. Lett., 39, L17807, https://doi.org/10.1029/2012GL052432, 2012.
Kwon, H.-A., Park, R. J., Oak, Y. J., Nowlan, C. R., Janz, S. J., Kowalewski, M. G., Fried, A., Walega, J., Bates, K. H., Choi, J., Blake, D. R., Wisthaler, A., and Woo, J.-H.: Top-down estimates of anthropogenic VOC emissions in South Korea using formaldehyde vertical column densities from aircraft during the KORUS-AQ campaign, Elem. Sci. Anth., 9, 00109, https://doi.org/10.1525/elementa.2021.00109, 2021.
Lakey, P. S. J., George, I. J., Whalley, L. K., Baeza-Romero, M. T., and Heard, D. E.: Measurements of the HO2 Uptake Coefficients onto Single Component Organic Aerosols, Environ. Sci. Technol., 49, 4878–4885, https://doi.org/10.1021/acs.est.5b00948, 2015.
Lamsal, L. N., Krotkov, N. A., Celarier, E. A., Swartz, W. H., Pickering, K. E., Bucsela, E. J., Gleason, J. F., Martin, R. V., Philip, S., Irie, H., Cede, A., Herman, J., Weinheimer, A., Szykman, J. J., and Knepp, T. N.: Evaluation of OMI operational standard NO2 column retrievals using in situ and surface-based NO2 observations, Atmos. Chem. Phys., 14, 11587–11609, https://doi.org/10.5194/acp-14-11587-2014, 2014.
Li, J., Kohno, N., Sakamoto, Y., Pham, H. G., Murano, K., Sato, K., Nakayama, T., and Kajii, Y.: Potential Factors Contributing to Ozone Production in AQUAS–Kyoto Campaign in Summer 2020: Natural Source-Related Missing OH Reactivity and Heterogeneous HO2 RO2 Loss, Environ. Sci. Technol., 56, 12926–12936, https://doi.org/10.1021/acs.est.2c03628, 2022.
Li, K., Jacob, D. J., Liao, H., Shen, L., Zhang, Q., and Bates, K. H.: Anthropogenic drivers of 2013–2017 trends in summer surface ozone in China, P. Natl. Acad. Sci. USA, 116, 422–427, https://doi.org/10.1073/pnas.1812168116, 2019.
Li, S. and Banerjee, T.: Spatial and temporal pattern of wildfires in California from 2000 to 2019, Sci. Rep., 11, 8779, https://doi.org/10.1038/s41598-021-88131-9, 2021.
Liao, J., Wolfe, G. M., Hannun, R. A., St. Clair, J. M., Hanisco, T. F., Gilman, J. B., Lamplugh, A., Selimovic, V., Diskin, G. S., Nowak, J. B., Halliday, H. S., DiGangi, J. P., Hall, S. R., Ullmann, K., Holmes, C. D., Fite, C. H., Agastra, A., Ryerson, T. B., Peischl, J., Bourgeois, I., Warneke, C., Coggon, M. M., Gkatzelis, G. I., Sekimoto, K., Fried, A., Richter, D., Weibring, P., Apel, E. C., Hornbrook, R. S., Brown, S. S., Womack, C. C., Robinson, M. A., Washenfelder, R. A., Veres, P. R., and Neuman, J. A.: Formaldehyde evolution in US wildfire plumes during the Fire Influence on Regional to Global Environments and Air Quality experiment (FIREX-AQ), Atmos. Chem. Phys., 21, 18319–18331, https://doi.org/10.5194/acp-21-18319-2021, 2021.
Liu, Y., Huang, Y., Liggio, J., Hayden, K., Mihele, C., Wentzell, J., Wheeler, M., Leithead, A., Moussa, S., Xie, C., Yang, Y., Zhang, Y., Han, T., and Li, S.-M.: A newly developed Lagrangian chemical transport scheme: Part 1. Simulation of a boreal forest fire plume, Sci. Total Environ., 880, 163232, https://doi.org/10.1016/j.scitotenv.2023.163232, 2023.
Long, M. S., Yantosca, R., Nielsen, J. E., Keller, C. A., da Silva, A., Sulprizio, M. P., Pawson, S., and Jacob, D. J.: Development of a grid-independent GEOS-Chem chemical transport model (v9-02) as an atmospheric chemistry module for Earth system models, Geosci. Model Dev., 8, 595–602, https://doi.org/10.5194/gmd-8-595-2015, 2015.
Mao, J., Fan, S., Jacob, D. J., and Travis, K. R.: Radical loss in the atmosphere from Cu-Fe redox coupling in aerosols, Atmos. Chem. Phys., 13, 509–519, https://doi.org/10.5194/acp-13-509-2013, 2013.
Martin, R. V., Jacob, D. J., Yantosca, R. M., Chin, M., and Ginoux, P.: Global and regional decreases in tropospheric oxidants from photochemical effects of aerosols, J. Geophys. Res.-Atmos., 108, 4097, https://doi.org/10.1029/2002JD002622, 2003.
Martin, R. V., Fiore, A. M., and Van Donkelaar, A.: Space-based diagnosis of surface ozone sensitivity to anthropogenic emissions, Geophys. Res. Lett., 31, L06120, https://doi.org/10.1029/2004GL019416, 2004.
Milford, J. B., Gao, D., Sillman, S., Blossey, P., and Russell, A. G.: Total reactive nitrogen (NOy) as an indicator of the sensitivity of ozone to reductions in hydrocarbon and NOx emissions, J. Geophys. Res.-Atmos., 99, 3533–3542, https://doi.org/10.1029/93JD03224, 1994.
Müller, M., Anderson, B. E., Beyersdorf, A. J., Crawford, J. H., Diskin, G. S., Eichler, P., Fried, A., Keutsch, F. N., Mikoviny, T., Thornhill, K. L., Walega, J. G., Weinheimer, A. J., Yang, M., Yokelson, R. J., and Wisthaler, A.: In situ measurements and modeling of reactive trace gases in a small biomass burning plume, Atmos. Chem. Phys., 16, 3813–3824, https://doi.org/10.5194/acp-16-3813-2016, 2016.
NASA-FIRMS: https://firms.modaps.eosdis.nasa.gov/map/, last access: 9 April 2025.
Paris, J.-D., Stohl, A., Nédélec, P., Arshinov, M. Yu., Panchenko, M. V., Shmargunov, V. P., Law, K. S., Belan, B. D., and Ciais, P.: Wildfire smoke in the Siberian Arctic in summer: source characterization and plume evolution from airborne measurements, Atmos. Chem. Phys., 9, 9315–9327, https://doi.org/10.5194/acp-9-9315-2009, 2009.
Peng, Q., Palm, B. B., Fredrickson, C. D., Lee, B. H., Hall, S. R., Ullmann, K., Campos, T., Weinheimer, A. J., Apel, E. C., Flocke, F., Permar, W., Hu, L., Garofalo, L. A., Pothier, M. A., Farmer, D. K., Ku, I.-T., Sullivan, A. P., Collett, J. L. J., Fischer, E., and Thornton, J. A.: Observations and Modeling of NOx Photochemistry and Fate in Fresh Wildfire Plumes, ACS Earth Space Chem., 5, 2652–2667, https://doi.org/10.1021/acsearthspacechem.1c00086, 2021.
Pusede, S. E., Gentner, D. R., Wooldridge, P. J., Browne, E. C., Rollins, A. W., Min, K.-E., Russell, A. R., Thomas, J., Zhang, L., Brune, W. H., Henry, S. B., DiGangi, J. P., Keutsch, F. N., Harrold, S. A., Thornton, J. A., Beaver, M. R., St. Clair, J. M., Wennberg, P. O., Sanders, J., Ren, X., VandenBoer, T. C., Markovic, M. Z., Guha, A., Weber, R., Goldstein, A. H., and Cohen, R. C.: On the temperature dependence of organic reactivity, nitrogen oxides, ozone production, and the impact of emission controls in San Joaquin Valley, California, Atmos. Chem. Phys., 14, 3373–3395, https://doi.org/10.5194/acp-14-3373-2014, 2014.
Qiu, M., Kelp, M., Heft-Neal, S., Jin, X., Gould, C. F., Tong, D. Q., and Burke, M.: Evaluating Chemical Transport and Machine Learning Models for Wildfire Smoke PM2.5: Implications for Assessment of Health Impacts, Environ. Sci. Technol., 58, 22880–22893, https://doi.org/10.1021/acs.est.4c05922, 2024.
Randerson, J. T., Van Der Werf, G. R., Giglio, L., Collatz, G. J., and Kasibhatla, P. S.: Global Fire Emissions Database, Version 4.1 (GFEDv4), ORNL DAAC, https://doi.org/10.3334/ORNLDAAC/1293, 2015.
Real, E., Law, K. S., Weinzierl, B., Fiebig, M., Petzold, A., Wild, O., Methven, J., Arnold, S., Stohl, A., Huntrieser, H., Roiger, A., Schlager, H., Stewart, D., Avery, M., Sachse, G., Browell, E., Ferrare, R., and Blake, D.: Processes influencing ozone levels in Alaskan forest fire plumes during long-range transport over the North Atlantic, J. Geophys. Res.-Atmos., 112, D10S41, https://doi.org/10.1029/2006JD007576, 2007.
Reid, C. E., Brauer, M., Johnston, F. H., Jerrett, M., Balmes, J. R., and Elliott, C. T.: Critical Review of Health Impacts of Wildfire Smoke Exposure, Environ. Health Persp., 124, 1334–1343, https://doi.org/10.1289/ehp.1409277, 2016.
Rickly, P. S., Guo, H., Campuzano-Jost, P., Jimenez, J. L., Wolfe, G. M., Bennett, R., Bourgeois, I., Crounse, J. D., Dibb, J. E., DiGangi, J. P., Diskin, G. S., Dollner, M., Gargulinski, E. M., Hall, S. R., Halliday, H. S., Hanisco, T. F., Hannun, R. A., Liao, J., Moore, R., Nault, B. A., Nowak, J. B., Peischl, J., Robinson, C. E., Ryerson, T., Sanchez, K. J., Schöberl, M., Soja, A. J., St. Clair, J. M., Thornhill, K. L., Ullmann, K., Wennberg, P. O., Weinzierl, B., Wiggins, E. B., Winstead, E. L., and Rollins, A. W.: Emission factors and evolution of SO2 measured from biomass burning in wildfires and agricultural fires, Atmos. Chem. Phys., 22, 15603–15620, https://doi.org/10.5194/acp-22-15603-2022, 2022.
Robinson, M. A., Decker, Z. C. J., Barsanti, K. C., Coggon, M. M., Flocke, F. M., Franchin, A., Fredrickson, C. D., Gilman, J. B., Gkatzelis, G. I., Holmes, C. D., Lamplugh, A., Lavi, A., Middlebrook, A. M., Montzka, D. M., Palm, B. B., Peischl, J., Pierce, B., Schwantes, R. H., Sekimoto, K., Selimovic, V., Tyndall, G. S., Thornton, J. A., Van Rooy, P., Warneke, C., Weinheimer, A. J., and Brown, S. S.: Variability and Time of Day Dependence of Ozone Photochemistry in Western Wildfire Plumes, Environ. Sci. Technol., 55, 10280–10290, https://doi.org/10.1021/acs.est.1c01963, 2021.
Seinfeld, J. H. and Pandis, S. N.: Atmospheric Chemistry and Physics: From Air Pollution to Climate Change, John Wiley & Sons, 1146 pp., ISBN 978-1-118-94740-1, 2016.
Shen, J.: Jiaqi-Shen/Shen_et_al_fire_chemistry_manuscript: ozone regime calculation (v1.0.0), Zenodo [data set and code], https://doi.org/10.5281/zenodo.16584864, 2025.
Sillman, S. and He, D.: Some theoretical results concerning O3-NOx-VOC chemistry and NOx-VOC indicators, J. Geophys. Res.-Atmos., 107, ACH 26-1–ACH 26-15, https://doi.org/10.1029/2001JD001123, 2002.
Souri, A. H., Nowlan, C. R., Wolfe, G. M., Lamsal, L. N., Chan Miller, C. E., Abad, G. G., Janz, S. J., Fried, A., Blake, D. R., Weinheimer, A. J., Diskin, G. S., Liu, X., and Chance, K.: Revisiting the effectiveness of HCHO NO2 ratios for inferring ozone sensitivity to its precursors using high resolution airborne remote sensing observations in a high ozone episode during the KORUS-AQ campaign, Atmos. Environ., 224, 117341, https://doi.org/10.1016/j.atmosenv.2020.117341, 2020.
Strada, S., Mari, C., Filippi, J.-B., and Bosseur, F.: Wildfire and the atmosphere: Modelling the chemical and dynamic interactions at the regional scale, Atmos. Environ., 51, 234–249, https://doi.org/10.1016/j.atmosenv.2012.01.023, 2012.
Taketani, F., Kanaya, Y., and Akimoto, H.: Kinetics of HO2 Uptake in Levoglucosan and Polystyrene Latex Particles, J. Phys. Chem. Lett., 1, 1701–1704, https://doi.org/10.1021/jz100478s, 2010.
Taketani, F., Kanaya, Y., Pochanart, P., Liu, Y., Li, J., Okuzawa, K., Kawamura, K., Wang, Z., and Akimoto, H.: Measurement of overall uptake coefficients for HO2 radicals by aerosol particles sampled from ambient air at Mts. Tai and Mang (China), Atmos. Chem. Phys., 12, 11907–11916, https://doi.org/10.5194/acp-12-11907-2012, 2012.
Taketani, F., Kanaya, Y., and Akimoto, H.: Kinetic Studies of Heterogeneous Reaction of HO2 Radical by Dicarboxylic Acid Particles, Int. J. Chem. Kin., 45, 560–565, https://doi.org/10.1002/kin.20783, 2013.
Tonnesen, G. S. and Dennis, R. L.: Analysis of radical propagation efficiency to assess ozone sensitivity to hydrocarbons and NOx: 1. Local indicators of instantaneous odd oxygen production sensitivity, J. Geophys. Res.-Atmos., 105, 9213–9225, https://doi.org/10.1029/1999JD900371, 2000a.
Tonnesen, G. S. and Dennis, R. L.: Analysis of radical propagation efficiency to assess ozone sensitivity to hydrocarbons and NOx: 2. Long-lived species as indicators of ozone concentration sensitivity, J. Geophys. Res.-Atmos., 105, 9227–9241, https://doi.org/10.1029/1999JD900372, 2000b.
US EPA: Air Pollutant Emissions Trends Data, US EPA, https://www.epa.gov/air-emissions-inventories/air-pollutant-emissions-trends-data, last access: 2 April 2025.
Verma, S., Worden, J., Pierce, B., Jones, D. B. A., Al-Saadi, J., Boersma, F., Bowman, K., Eldering, A., Fisher, B., Jourdain, L., Kulawik, S., and Worden, H.: Ozone production in boreal fire smoke plumes using observations from the Tropospheric Emission Spectrometer and the Ozone Monitoring Instrument, J. Geophys. Res.-Atmos., 114, D02303, https://doi.org/10.1029/2008JD010108, 2009.
Wang, X., Heald, C. L., Ridley, D. A., Schwarz, J. P., Spackman, J. R., Perring, A. E., Coe, H., Liu, D., and Clarke, A. D.: Exploiting simultaneous observational constraints on mass and absorption to estimate the global direct radiative forcing of black carbon and brown carbon, Atmos. Chem. Phys., 14, 10989–11010, https://doi.org/10.5194/acp-14-10989-2014, 2014.
Wardle, D. A., Hörnberg, G., Zackrisson, O., Kalela-Brundin, M., and Coomes, D. A.: Long-Term Effects of Wildfire on Ecosystem Properties Across an Island Area Gradient, Science, 300, 972–975, https://doi.org/10.1126/science.1082709, 2003.
Wei, J., Li, Z., Lyapustin, A., Wang, J., Dubovik, O., Schwartz, J., Sun, L., Li, C., Liu, S., and Zhu, T.: First close insight into global daily gapless 1 km PM2.5 pollution, variability, and health impact, Nat. Commun., 14, 8349, https://doi.org/10.1038/s41467-023-43862-3, 2023.
Wolfe, G. M., Marvin, M. R., Roberts, S. J., Travis, K. R., and Liao, J.: The Framework for 0-D Atmospheric Modeling (F0AM) v3.1, Geosci. Model Dev., 9, 3309–3319, https://doi.org/10.5194/gmd-9-3309-2016, 2016.
Xie, Y., Lin, M., Decharme, B., Delire, C., Horowitz, L. W., Lawrence, D. M., Li, F., and Séférian, R.: Tripling of western US particulate pollution from wildfires in a warming climate, P. Natl. Acad. Sci. USA, 119, e2111372119, https://doi.org/10.1073/pnas.2111372119, 2022.
Xu, J., Zhang, Y., Zheng, S., and He, Y.: Aerosol effects on ozone concentrations in Beijing: A model sensitivity study, J. Environ. Sci., 24, 645–656, https://doi.org/10.1016/S1001-0742(11)60811-5, 2012.
Xu, L., Crounse, J. D., Vasquez, K. T., Allen, H., Wennberg, P. O., Bourgeois, I., Brown, S. S., Campuzano-Jost, P., Coggon, M. M., Crawford, J. H., DiGangi, J. P., Diskin, G. S., Fried, A., Gargulinski, E. M., Gilman, J. B., Gkatzelis, G. I., Guo, H., Hair, J. W., Hall, S. R., Halliday, H. A., Hanisco, T. F., Hannun, R. A., Holmes, C. D., Huey, L. G., Jimenez, J. L., Lamplugh, A., Lee, Y. R., Liao, J., Lindaas, J., Neuman, J. A., Nowak, J. B., Peischl, J., Peterson, D. A., Piel, F., Richter, D., Rickly, P. S., Robinson, M. A., Rollins, A. W., Ryerson, T. B., Sekimoto, K., Selimovic, V., Shingler, T., Soja, A. J., St. Clair, J. M., Tanner, D. J., Ullmann, K., Veres, P. R., Walega, J., Warneke, C., Washenfelder, R. A., Weibring, P., Wisthaler, A., Wolfe, G. M., Womack, C. C., and Yokelson, R. J.: Ozone chemistry in western U.S. wildfire plumes, Sci. Adv., 7, eabl3648, https://doi.org/10.1126/sciadv.abl3648, 2021.
Xue, L. K., Wang, T., Gao, J., Ding, A. J., Zhou, X. H., Blake, D. R., Wang, X. F., Saunders, S. M., Fan, S. J., Zuo, H. C., Zhang, Q. Z., and Wang, W. X.: Ground-level ozone in four Chinese cities: precursors, regional transport and heterogeneous processes, Atmos. Chem. Phys., 14, 13175–13188, https://doi.org/10.5194/acp-14-13175-2014, 2014.
Zhou, J., Murano, K., Kohno, N., Sakamoto, Y., and Kajii, Y.: Real-time quantification of the total HO2 reactivity of ambient air and HO2 uptake kinetics onto ambient aerosols in Kyoto (Japan), Atmos. Environ., 223, 117189, https://doi.org/10.1016/j.atmosenv.2019.117189, 2020.
Zhou, J., Sato, K., Bai, Y., Fukusaki, Y., Kousa, Y., Ramasamy, S., Takami, A., Yoshino, A., Nakayama, T., Sadanaga, Y., Nakashima, Y., Li, J., Murano, K., Kohno, N., Sakamoto, Y., and Kajii, Y.: Kinetics and impacting factors of HO2 uptake onto submicron atmospheric aerosols during the 2019 Air QUAlity Study (AQUAS) in Yokohama, Japan, Atmos. Chem. Phys., 21, 12243–12260, https://doi.org/10.5194/acp-21-12243-2021, 2021.