the Creative Commons Attribution 4.0 License.
the Creative Commons Attribution 4.0 License.
 | 04 Aug 2025
First reported detection of a winter continental gamma-ray glow in Europe
Jakub Šlegl
Zbyněk Sokol
Petr Pešice
Ronald Langer
Igor Strhárský
Jana Popová
Martin Kákona
Iva Ambrožová
This study presents the first-ever published detection of two parallel winter continental gamma-ray glows in Central Europe, observed during a rare winter thunderstorm on Milešovka hill, Czech Republic. The combination of the hill's altitude of 837 m above sea level (a.s.l.) and the low altitude of the winter thunderstorm cloud resulted in an observation very near the acceleration region inside the thundercloud. The event was captured using a combination of advanced instruments, including a Ka-band cloud profiler (which enabled a detailed analysis of the storm's microphysics), a SEVAN large-area scintillation detector for monitoring ionizing radiation, and a staffed professional meteorological observatory. The radar data indicated the alignment of ice crystals within the cloud, strongly suggesting the presence of a substantial electric field. The findings offer valuable insights into winter thunderstorm dynamics in continental climates, with broader implications for studying high-energy atmospheric physics.
- Article
(6798 KB) - Full-text XML
- BibTeX
- EndNote


Observations of radiation coming from thunderclouds were made on board airplanes and balloons (McCarthy and Parks, 1985; Kelley et al., 2015; Kochkin et al., 2017) as well as on the ground at locations such as Lomnický štít in Slovakia (Kudela et al., 2017; Chum et al., 2020; Šlegl et al., 2022; Chilingarian et al., 2021c), Musala in Bulgaria (Chilingarian et al., 2021c), Aragats in Armenia (Chilingarian et al., 2021c, b, 2010, 2016; Chilingarian and Mkrtchyan, 2012; Williams et al., 2022), Yangbajing in Tibet in China (Tsuchiya et al., 2012), and in Japan (Tsuchiya et al., 2007, 2009, 2011; Torii et al., 2009, 2011; Wada et al., 2021b, a, 2019, 2018, 2023).
Gamma-ray glows, also called long bursts (Tsuchiya et al., 2009; Torii et al., 2011) or thunderstorm ground enhancements (Chilingarian et al., 2011), are long, minute-scale enhancements in the ionizing radiation environment with passing thunderclouds. The mechanisms of their origin are attributed to the process called relativistic runaway electron avalanche (RREA) (Gurevich et al., 1992) and to the modification of the energy spectra (MOS) (Chilingarian and Mkrtchyan, 2012) created between regions of opposite charge that are strong enough, with at least one situated in the cloud.
This region of a strong electric field (a charged region) moves with the cloud and creates typical bell-shaped enhancements in the count rates observed by ground detectors (Wada et al., 2021b). The peak of count rates is detected at the moment of the shortest distance between the detector and the center of the active (charged) region.
In some cases, such as the presented event, the gamma-ray glow is terminated by discharge. This discharge reduces at least one of the charged regions and makes the RREA or MOS process stop. Many such cases have been reported (Tsuchiya et al., 2013; Chilingarian et al., 2015, 2017), with discharges sometimes starting far from the detected gamma-ray glow where the intra-cloud (IC) leader passed by (Wada et al., 2018, 2019).
Winter thunderstorms are much rarer, especially in continental Europe. During 4 years of continuous measurements on top of Milešovka hill, only a few summer season gamma-ray glows were observed (Kolmašová et al., 2022) and none during winter until the event observed on 4 February 2022, which is presented here. This is probably caused by several reasons: winter continental thunderstorms are rare (there are known occurring winter thunderstorms near the coast of Japan, near the Great Lakes, and in the Mediterranean, all connected to water), they are of low intensity (low flash rate), and their cloud base is higher than in Japan, therefore the photons from bremsstrahlung are attenuated below a detectable level. Another reason is that the measurements of ambient ionizing radiation were not suitable for such observations, with acquisition intervals that were too long – 10 min for the Czech radiation monitoring system (Šlegl et al., 2019).
For the study of thunderstorms, the observatory on Milešovka hill (837 m above sea level (a.s.l.)) was equipped with a unique set of measuring instruments for the detection of ionizing radiation and meteorological and climatological observations, including the cloud profiler (Ka-band).
Milešovka station (50.55° N, 13.93° E), Czech Republic, is a professional meteorological station with a 24/7 service, located at the top of Milešovka hill at an altitude of 836 m a.s.l. It exceeds the surrounding area by about 300 m.
Apart from standard meteorological and climatological measuring instruments (thermometer, barometer, rain gauges, hygrometer, wind speed, and direction meters), the station is also equipped with a ceilometer, a disdrometer, a Ka-band cloud profiler, and a SEVAN radiation detector.
The SEVAN detector system (Chilingarian et al., 2009) consists of three plastic scintillator detectors, each coupled with one PMT. The upper one and the bottom one are set up from four plastic scintillator slabs (with a thickness of 5 cm), creating a square with 1 m long sides. The middle one, separated from the top and the bottom by a 5 cm thick lead, consists of five stacked slabs (with a thickness of 5 cm each). The energy threshold of the upper channel of SEVAN is expected to be approximately 7 MeV.
Together with fast electronics, this set-up allows us to estimate particle types as well as their intensity. For example, coincidence 100 (response in the upper channel while no response in the bottom and middle channels in a narrow time interval) shows interactions of most probably photons or electrons. Coincidences 101 and 111 most probably show muons as they pass through both lead layers. The SEVAN detector provides only count rates per second.
The cloud profiler MIRA 35c at the Milešovka station is a vertically oriented Doppler polarimetric radar manufactured by the METEK GmbH company. It operates within the Ka-band with a center frequency of 35.12 ± 0.1 GHz and a peak power of 2.5 kW. The temporal resolution is 2 s, and the vertical resolution includes 509 gates separated by 28.8 m. More technical details are given in Sokol et al. (2020) and Kolmašová et al. (2022). Data provided by the cloud profiler, which are used in this study, are radar reflectivity (Ze), Doppler vertical velocity (V), its spectrum width (W), linear depolarization ratio (LDR), and co-polar correlation coefficient (RHO).
Cloud radars differ from conventional operational radars in that they use significantly higher frequencies than operational weather radars (usually working in C-, S-, or X-band). This is reflected in the measurement characteristics. Contrary to operational weather radars, which record and recognize bigger (precipitation) particles, cloud radars can measure fine particles, such as cloud droplets or ice crystals, thereby enabling individual hydrometeor distinction. Further, cloud radars generally have much higher spatial resolution as compared to operational weather radars. In contrast, the measurements of cloud radars are more affected by attenuation from heavy rain, and the radar beam reflections follow Mie scattering rather than Rayleigh scattering, which influences the processing of, e.g., Ze. The Ka-band cloud radar at the Milešovka station emits energy in the horizontally polarized plane but receives reflections in both the horizontal (Zh, co-channel) and vertical (Zv, cross-channel) planes. The LDR, which is the ratio of Zv to Zh, allows researchers to determine the symmetry of the measured object (its shape), which contributes significantly to distinguishing the type of hydrometeor present in a cloud.
V determines the velocity of the object in the radial direction, and W characterizes the variability of the velocity of moving hydrometeors. Since the measurements are made in the vertical direction and individual hydrometeors have different terminal velocities, high values of W indicate the existence of different hydrometeors in the scan volume. The value of RHO depends on the symmetry or shape of the hydrometeors, and high RHO values correspond to symmetric objects.
Postprocessing of the data was carried out following the methods described in Sokol et al. (2018). This consists of calculating vertical air velocity (Va), which is then used in the classification of the hydrometeors developed and described in the paper.
A disdrometer Thies laser precipitation monitor with an infrared laser beam is capable of distinguishing the type of hydrometeor by its size and fall speed.
Lightning data recorded by the EUCLID (European Cooperation for Lightning Detection, https://www.euclid.org/, last access: 10 July 2025) network by BLIDS (Blitz Informationsdienst von Siemens), used in this paper, contain records of the time (with the accuracy of ms, position, type (cloud-to-cloud, CC; or cloud-to-ground, CG), estimated peak current (in kA, including its polarity), and quality of detection (good/bad) of registered discharges. It should be mentioned that all lightning data for the studied winter storm were of good quality.
Blitzortung, a lightning detection network for the localization of atmospheric discharges with very-low-frequency receivers (3 to 30 kHz), uses the time of arrival and time of group arrival techniques to register lightning discharges (Wanke, 2010). As Milešovka hill is in an area that has a dense coverage of antenna stations, the accuracy of this network is within 1 km in the area, as the Blitzortung project claims.
3.1 Gamma-ray glows
During the passing thunderstorm, two different gamma-ray glows were detected. One was very obvious, with a shorter duration and a higher intensity, and ended through a discharge – we will call it a strong gamma-ray glow. The other was of longer duration, had less intensity, and was not ended through a discharge – we will call it a weak gamma-ray glow. This naming refers only to the detected count rates, as we are unaware of the true gamma-ray glow intensity at its maximum outside the station. The temporal positions of these gamma-ray glows are indicated in Figs. 7 and 8 by different levels of gray: the strong gamma-ray glow is indicated by darker gray, whereas the weak gamma-ray glow by lighter gray.
As the function F(t) to fit the temporal evolution of count rate, a Gaussian curve was selected as in Wada et al. (2021b):
where t is time, a is the peak count rate, μ is the peak time, σ is the standard deviation, and c is the background count rate. The Gaussian function was selected only because the time series of count rates roughly follows this line. However, there is no physical explanation. This function has the benefit of the easy calculation of full duration in half maximum (FDHM≈2.355σ).
3.1.1 Strong gamma-ray glow
The rise in the upper SEVAN channel lasted for 30 s and reached a maximum of 835 counts s−1 (i.e., 375 % of the background level). The peak occurred 8 s before the end with the discharge, which happened between 23:20:08.147 and 23:20:08.187, according to the Blitzortung network. Throughout the paper, we will use time in UTC; local time (CET) is UTC+01.
As visible in Fig. 1, the count rates follow the Gaussian curve up to the maximum of the strong gamma-ray glow, being still at the beginning of the Gaussian curve. However, our fitting is relevant because the fitted curve is similar to those previously observed in, e.g., Šlegl et al. (2022) and Wada et al. (2019). If the strong gamma-ray glow had not been interrupted by the discharge and had continued following the Gaussian curve, the duration of the peak would have been roughly 2.5 min, which aligns with the previous observations as the wind speed of 10 m s−1 does not deviate from the regular wind speed during thunderstorms (with higher speed, the acceleration region moves faster and thus creates a narrower peak). Also, the peak count rate of 5552 counts s−1 for the SEVAN top channel with subtracted background is reasonable, as the cloud base height was less than 30 m (the lower the accelerating region, the lower the attenuation of the radiation). There were even higher count rates detected at the SEVAN top channel on Lomnický štít, Slovakia (Chum et al., 2020).
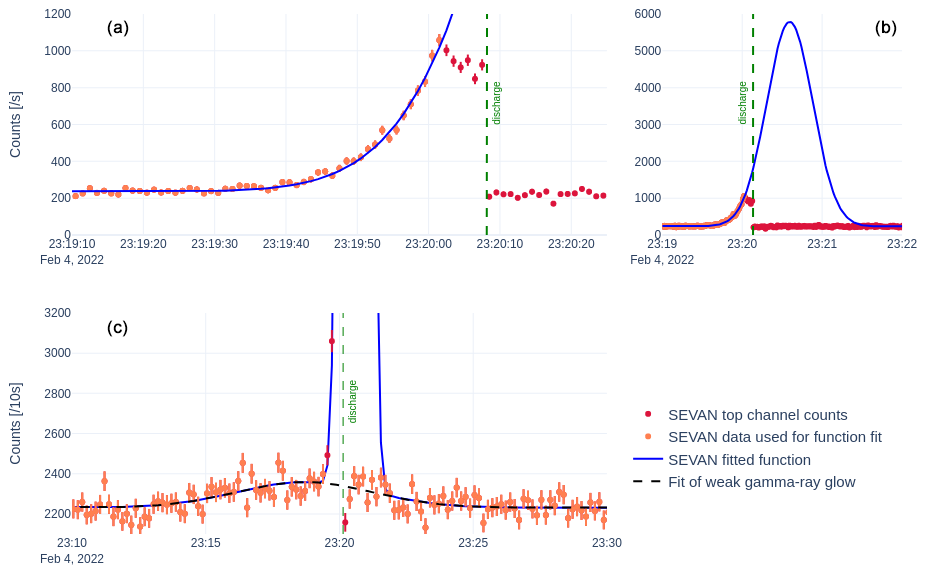
Figure 1Counts measured by the upper channel of SEVAN (red) without considering coincidences. Panel (a) shows the strong gamma-ray glow fitted with the best-fit function (light markers depict data used for the function fitting, while dark markers represent data not used for the fitting). Two Gaussian functions were combined: one for the weak gamma-ray glow and one for the strong, Eq. (1). Panel (b) represents the expected peak had there not been any discharge resulting from the best-fit functions. Panel (c) shows SEVAN data for the weak gamma-ray glow and its best-fit function in 10 s summed bins (light markers represent data used for the function fitting, while dark markers display data not used for the dashed function fitting). Note that two markers of the strong gamma-ray glow are out of the y axis range of the graph.
The continuation of the gamma-ray glow, if not terminated by the discharge, would correlate to the echo of ice crystals aligned by the electric field, as shown by the data from the cloud profiler (Fig. 8 – RHO). The continuation of such an alignment of ice crystals in the upper part of the cloud can be explained by residually charged areas in the upper part of the cloud, above which the ice crystals were still caught in the electric field. Either the stroke did not discharge the upper charged region totally or not at all. This suggests the possibility of a horizontal discharge that left the upper charged region intact.
A question arises about the last 7 s (23:20:01.0–23:20:08.0) that preceded the discharge. As it does not follow the Gaussian curve, some mechanism must have prevented the gamma-ray glow from full development. Such a sharp peak with a decrease before the end of the discharge was also observed by Wada et al. (2019).
3.1.2 Discharge ending the strong gamma-ray glow
The discharge was accompanied by strong light and sound emissions. The observer on duty at the Milešovka station reported no observable time difference between the lightning and the thunder. This shows the extreme proximity of the flash to the station, as supported by Blitzortung and EUCLID data. Shortly after the flash, the power generator automatically started, suggesting a direct hit to the facility or a nearby strong electric impulse that caused a power outage.
The EUCLID network reported two radio-frequency pulses of the same flash (see Fig. 2) very close to the station (−3.4 and −9.8 kA, both identified as CC). Blitzortung recorded multiple pulses within a radius of 11 km from the station but noted that they began near the station as well. The lightning flash ending the gamma-ray glow lasted for about 40 ms (23:20:08.147–187 UTC). According to the lightning monitoring networks (both EUCLID and Blitzortung), the lightning flash occurred in very close proximity to the Milešovka station. EUCLID even showed a horizontal distance of 50 m from the station, while it was 1.1 km in the case of Blitzortung. Both networks recorded the same time of the first radio-frequency pulse and indicated the continuation of electromagnetic activity at 23:20:08.163. EUCLID showed one more pulse, very close to the Milešovka station; however, Blitzortung recorded 21 pulses in the vicinity of the station (within a 3 km distance) and two further away, 15 and 18 km from the station, respectively. The following radio-frequency pulses were observed by Blitzortung only: one at 23:20:08.182 and two at 23:20:08.187.
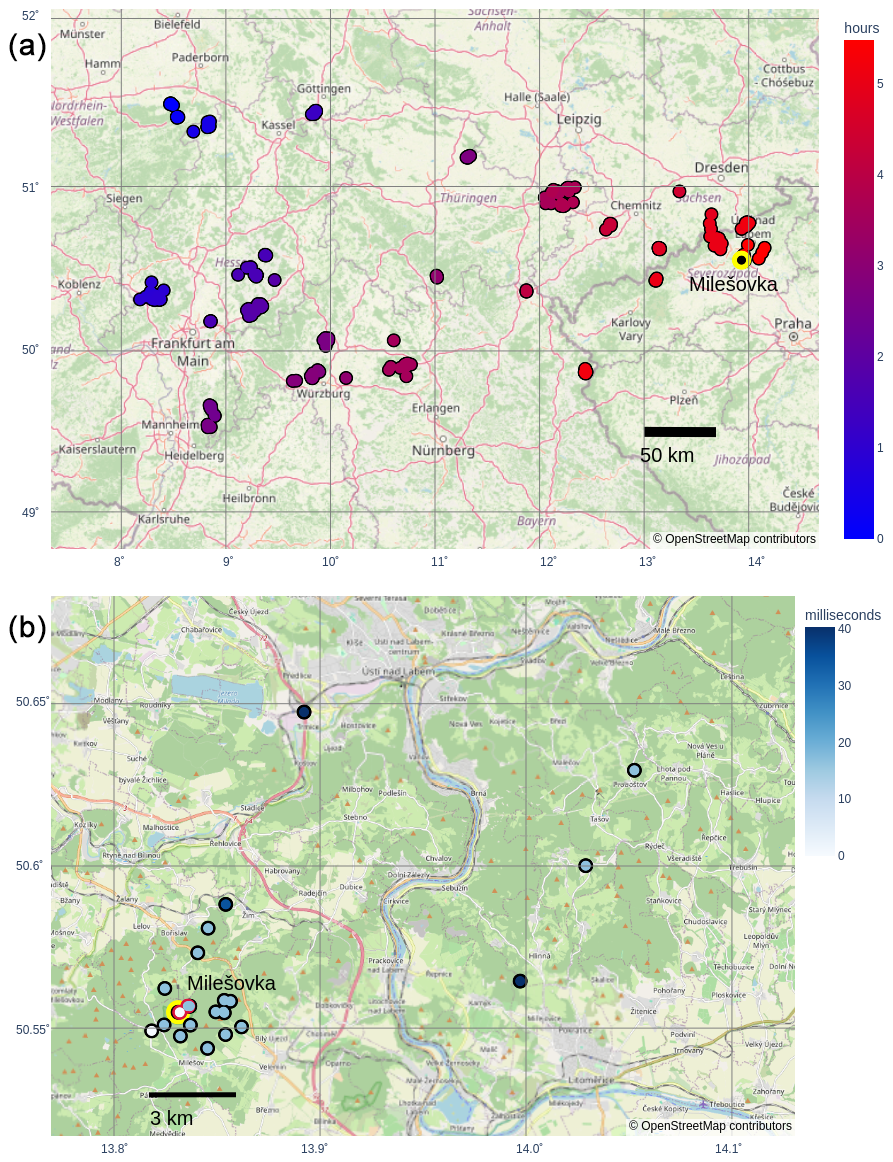
Figure 2(a) Radio-frequency pulses detected by Blitzortung (black-bordered circles) as the thunderstorm passed Germany and entered the Czech Republic. The color scale shows time in hours from the first flash at 17:51:01 UTC. The Milešovka event happened in the final stage of the thunderstorm. (b) Radio-frequency pulses detected by Blitzortung (black-bordered circles) and EUCLID (red-bordered circles) at the time of the end of the strong gamma-ray glow (23:20:08.147–187). The color scale shows time in milliseconds from the first pulse of the flash. Both networks indicate the beginning of the gamma-ray-ending flash (its first radio-frequency pulse) very near the Milešovka station, depicted by a yellow-bordered point. © OpenStreetMap contributors 2024. Distributed under the Open Data Commons Open Database License (ODbL) version 1.0.
According to the analysis of Kolmašová (2024), the gamma-ray-ending discharge was probably an upward-moving lightning stroke initiated at the observatory tower.
3.1.3 Weak gamma-ray glow
Upon closer inspection of the data, a weak gamma-ray glow can be seen in the SEVAN top channel data (Fig. 1c). A 10 s binning was used for better visibility. The discharge did not end this gamma-ray glow as with the strong one. A Gaussian curve fits its shape, and from this it is clear that it is much broader in duration (FDHM was 6 min) than the strong gamma-ray glow, and its center (23:18:40 UTC) is even before the start of the strong glow. In the figures that follow, it is marked by a light-gray color.
Different behaviors of the weak gamma-ray glow from the strong one lead us to the suggestion that the source of the glow was different. The strong gamma-ray glow source was very near the observatory and probably above it as the flash of lightning started above the station. The weak gamma-ray glow, on the other hand, was probably way off as it was very weak in detected count rates and also was not discharged. With the presence of the strong gamma-ray glow and small height of the cloud, we believe the source of the weak gamma-ray glow was moving sideways of the observatory.
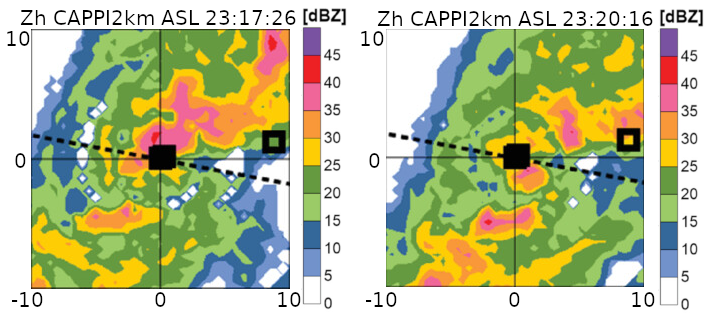
Figure 3Radar reflectivity factor fields of horizontal polarization wave Zh at constant altitude plan position indicator (CAPPI) of 2 km a.s.l. during the winter thunderstorm, adopted from Popová et al. (2023). The time of the beginning of the plan position indicator (PPI) scans is shown in the title. The black square in the center of the panels indicates the position of the Milešovka observatory, and the axes show the distance from the observatory in kilometers. The dashed line shows the movement of the cold front.
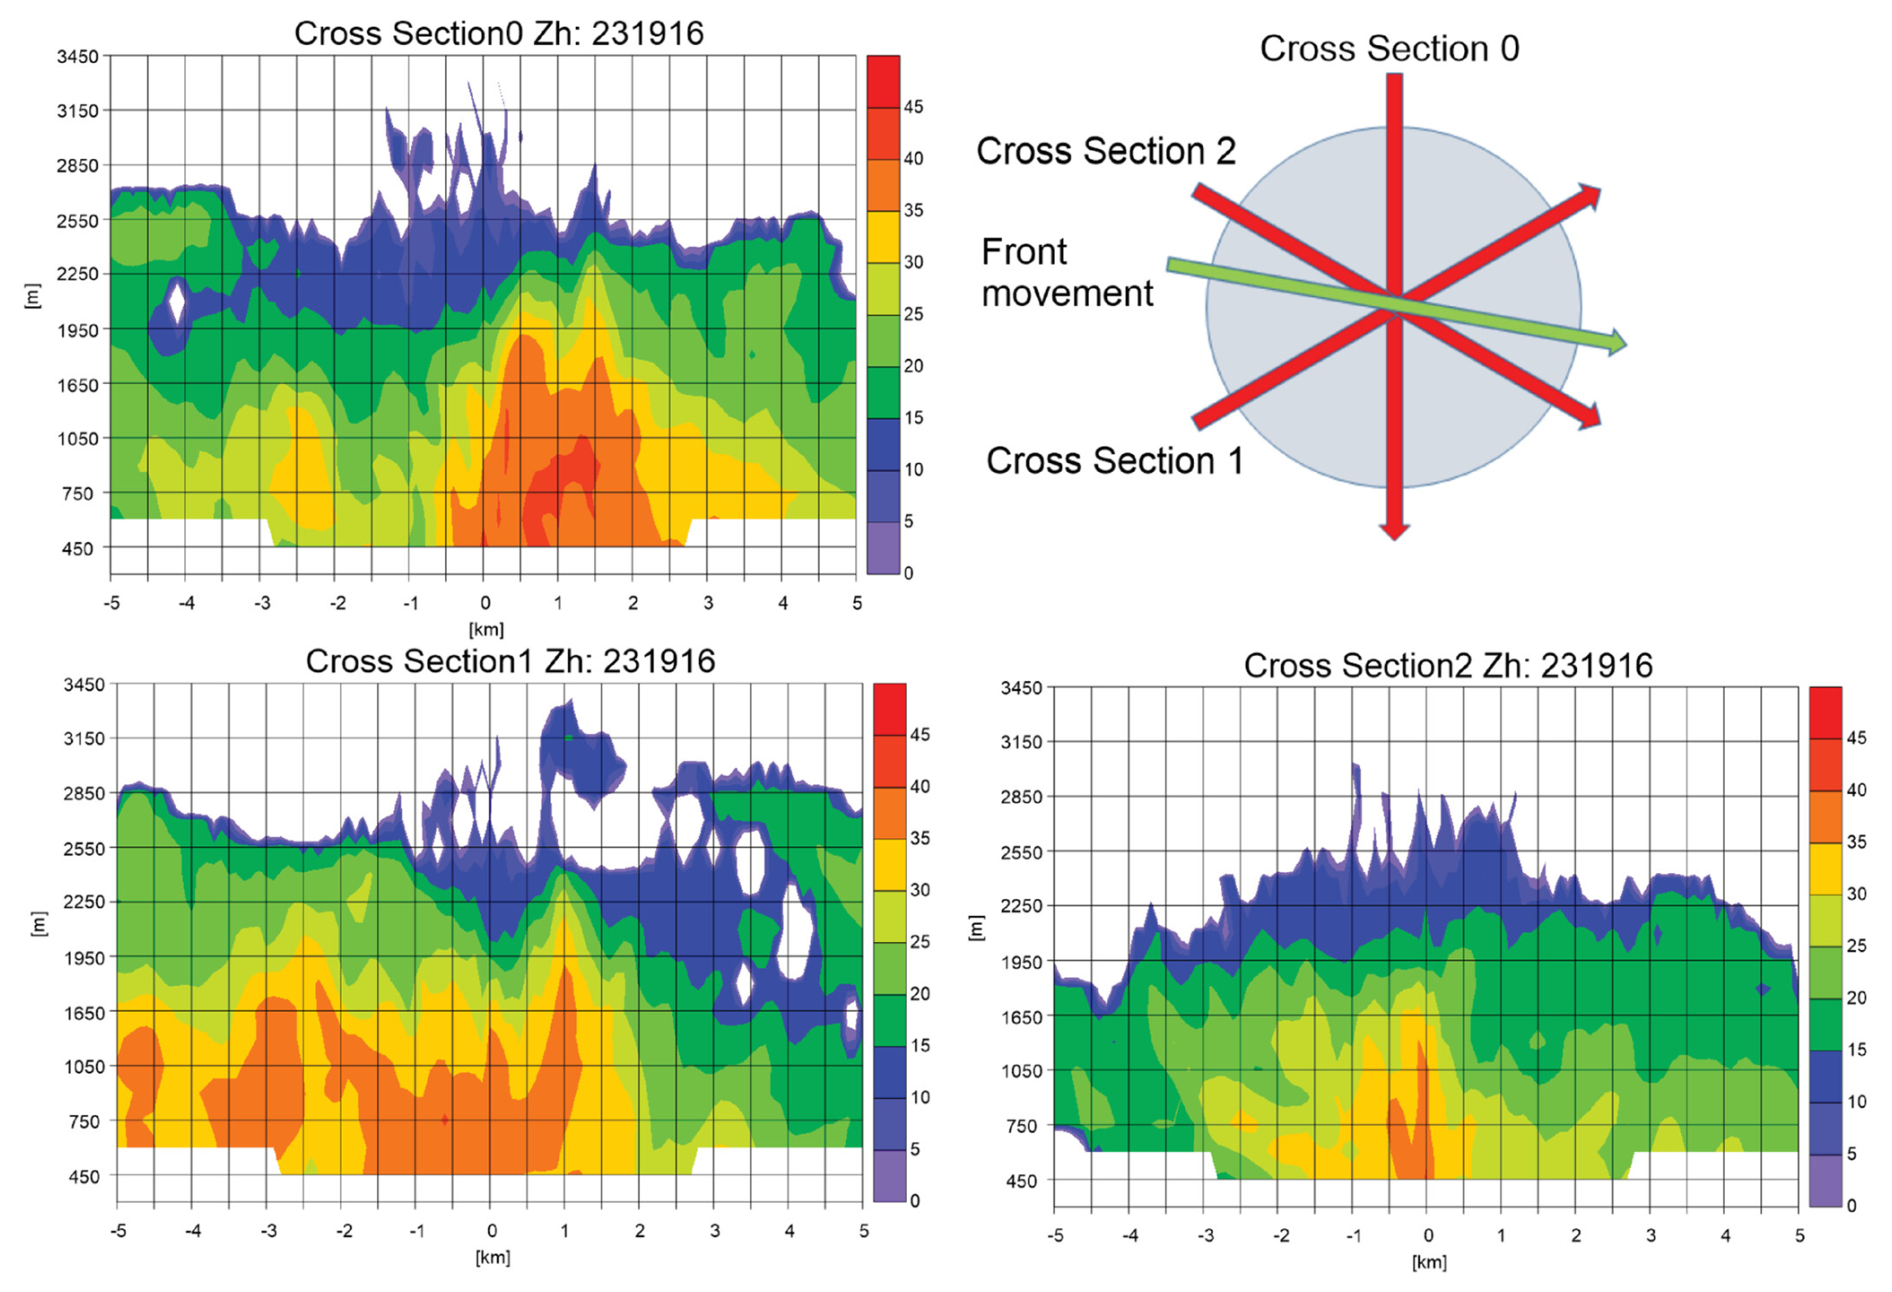
Figure 4Vertical cross-sections of Zh at 23:19:16 UTC (RHI scans). Red arrows in the upper-right panel show the orientations of the cross-sections, while the green arrow in the upper-right panel shows the approximate movement of the cold front (i.e., cloud belt) at a constant altitude plan position indicator (CAPPI) of 2 km. The direction of the cold front corresponds to the wind direction measured at the surface at the time of the recorded lightning. The radar position is at (0,0). The figure is adapted from Popová et al. (2023).
As the flash ending the strong gamma-ray glow propagated in the northeast direction along the front, we can place the source of the weak gamma-ray glow in the area south of the hill. A storm center passing just south of the observatory seems to have been separated from the north–discharged one by Milešovka hill (see Fig. 3). It is possible that this south center was separated enough not to get discharged.
The thunderstorm center can also be observed on the cross-section 0 in Fig. 4. This area of strong reflectivity (40–45 dBZ) is reaching to the bottom of the radar vertical limit at 450 m above the ground and has a horizontal offset of 500 m from the station.
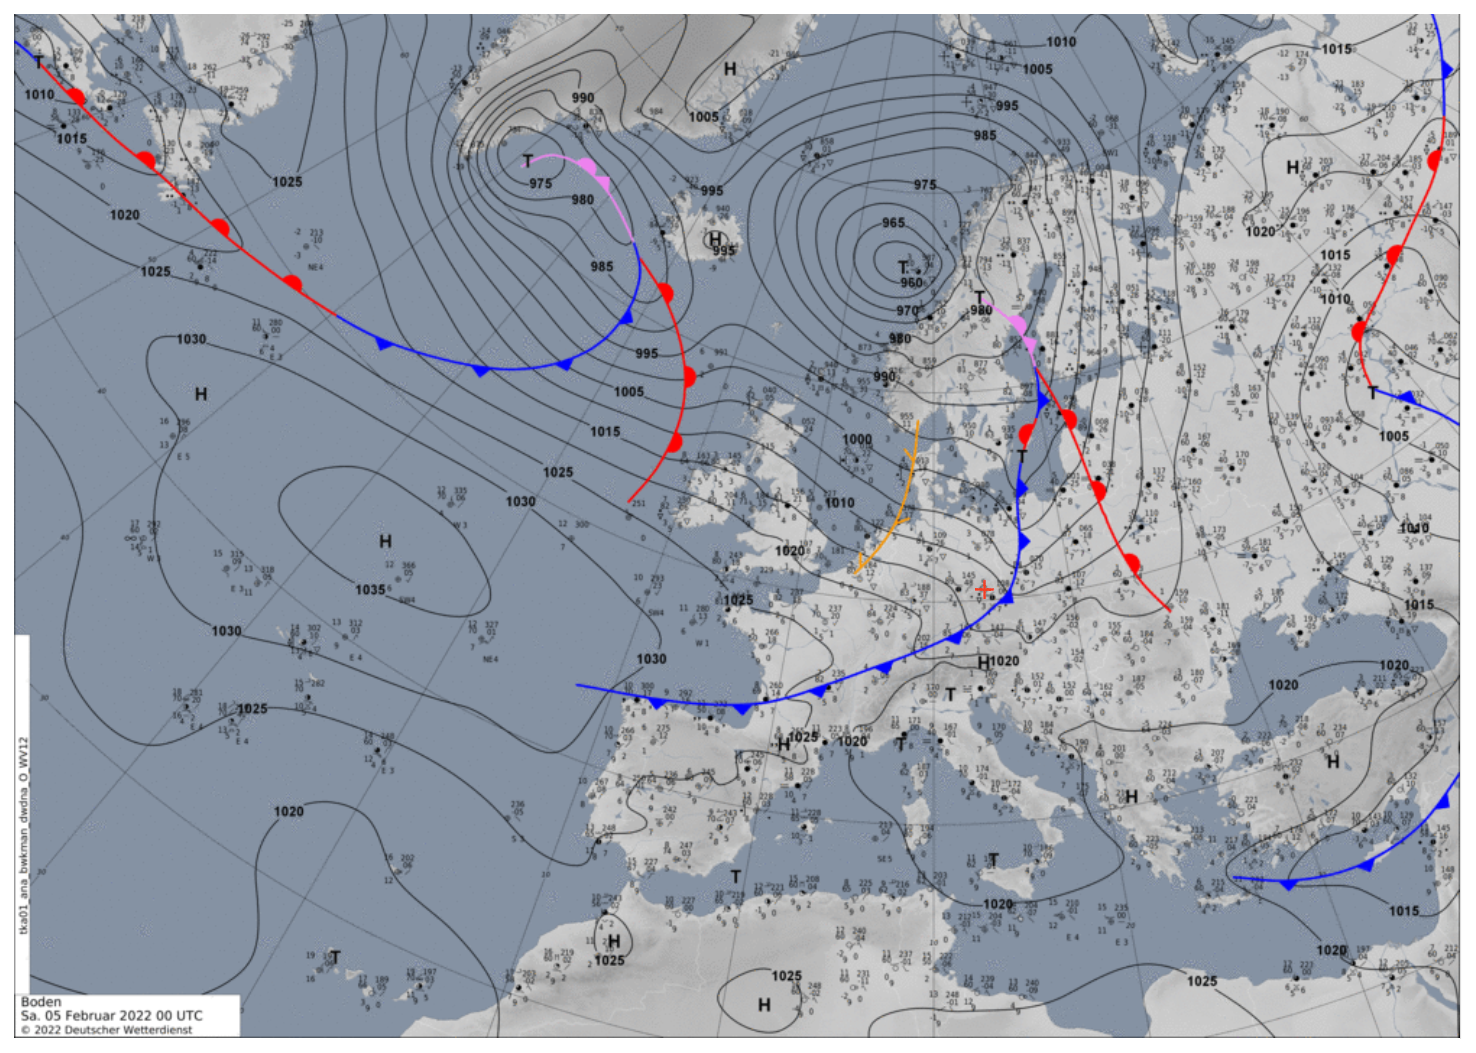
Figure 5Synoptic map based on reanalyzed data provided by the German Weather Service (or DWD). The red cross indicates the position of Milešovka hill.
3.2 Meteorological situation
Winter thunderstorms in the Czech Republic, a landlocked country, are rare. Munzar and Franc (2003) mentioned a rise in the number of winter thunderstorms over the whole of the Czech Republic but not more than a couple per year. Unlike summer storms, winter thunderstorms cause less economic damage but are more unpredictable compared to summer thunderstorms.
Munzar and Franc (2003) also related the occurrence of winter thunderstorms over the Czech Republic to cold fronts. This was also the case on 4 February 2022 (see Figs. 5 and 7), when gamma-ray glows were measured. The cold front with temperatures below zero passed Milešovka hill, with a cloud base below the station at the moment of the gamma-ray glow event. The passage of the cold front was confirmed by the synoptic map (Fig. 5) and the radar reflectivity at the CAPPI 2 km level (Fig. 6) from the operational radar of the Czech Hydrometeorological Institute. The front was moving from the northwest, and the radar reflectivity (Fig. 6) shows that there were several storm centers on the front, accompanied by lightning.
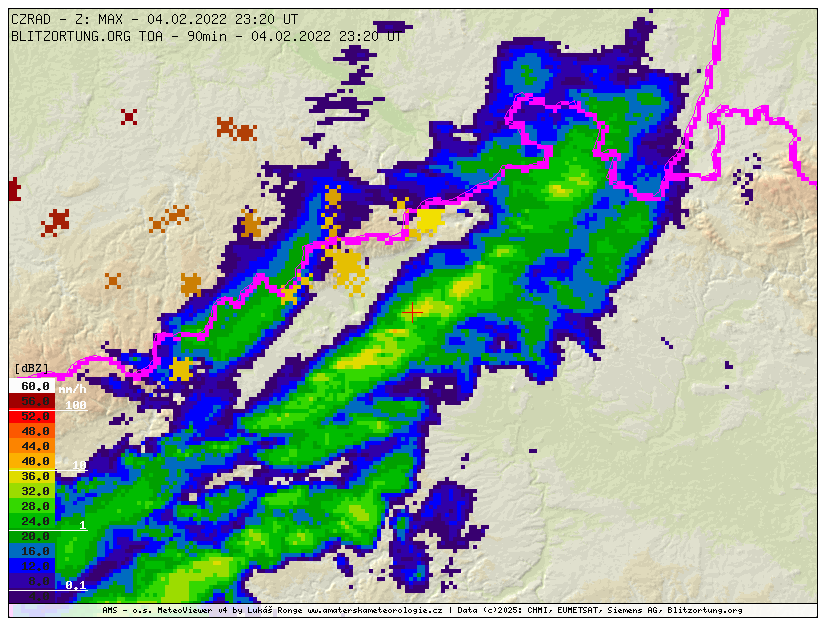
Figure 6Radar reflectivity at a constant altitude plan position indicator (CAPPI) of 2 km a.s.l. in dBz, measured by the radar network CZRAD, which is operated by the Czech Hydrometeorological Institute. The red cross indicates the position of Milešovka hill. The pink line displays the border of the Czech Republic, Germany, and Poland.
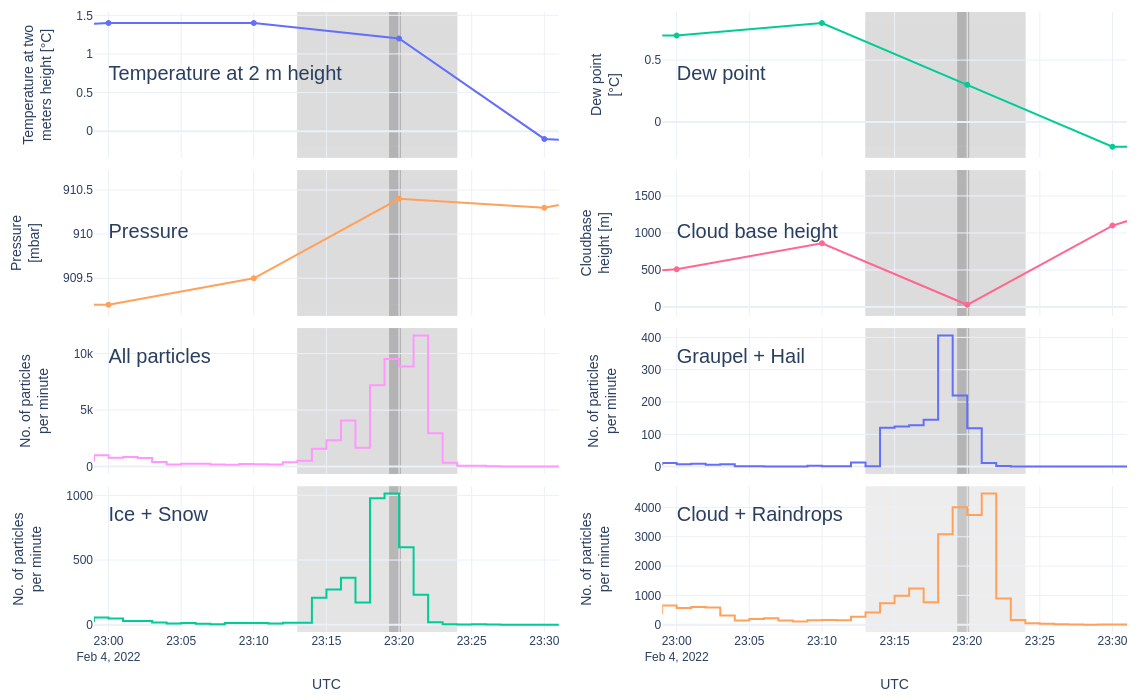
Figure 7Change in 2 m temperature, dew point at 2 m, pressure, cloud base height, number of all particles detected by the disdrometer, and three groups of hydrometeors detected by the disdrometer: graupel and hail (although there was no hail), ice and snow, and cloud and raindrops during the thunderstorm on 4 February 2022. Note that the cloud base height is at the lowest measurable value at 23:20 UTC. The actual cloud base was below the observation site. Solid lines only connect points of measurement for better readability. Gamma-ray glows are represented by gray areas.
According to the Blitzortung network data, the thunderstorm lightning activity started in Germany, near Dortmund, at around 17:30 UTC. It crossed Germany and reached the German–Czech border and the Ore Mountains at 22:50 UTC, then crossed the Milešovka station and eventually dissipated after the last flash east of Milešovka hill at 23:23 UTC (see Fig. 2). The overall flash rate was 7.5 flashes h−1.
3.3 Cloud profiler data and disdrometer
The thunderstorm passing the Milešovka station on 4 February 2022 was unique in its height. The cloud base was unusually low – at the altitude of the hilltop or even lower – and the cloud top was also low. As visible in the data from the cloud profiler (Fig. 8), the height of the cloud top did not exceed 3500 m above the hilltop. The cloud top height was also estimated using the Meteosat Second Generation satellite (https://www.eumetsat.int/meteosat-second-generation, last access: 10 July 2025). Using the brightness temperature of the infrared channel 10.8 µm at 23:20 UTC and the temperature sounding measurements at the Praha-Libuš station (80 km south of the Milešovka observatory) at 00:00 UTC on 5 February 2022, the cloud top height was approximately 3 km above the surface (Popová et al., 2023). LDR and RHO values (Fig. 8) show that the height of the thundercloud reflecting back the signal was even smaller, reaching a height of only 2500 m at the maximum and only 1500 m at the time of the discharge.
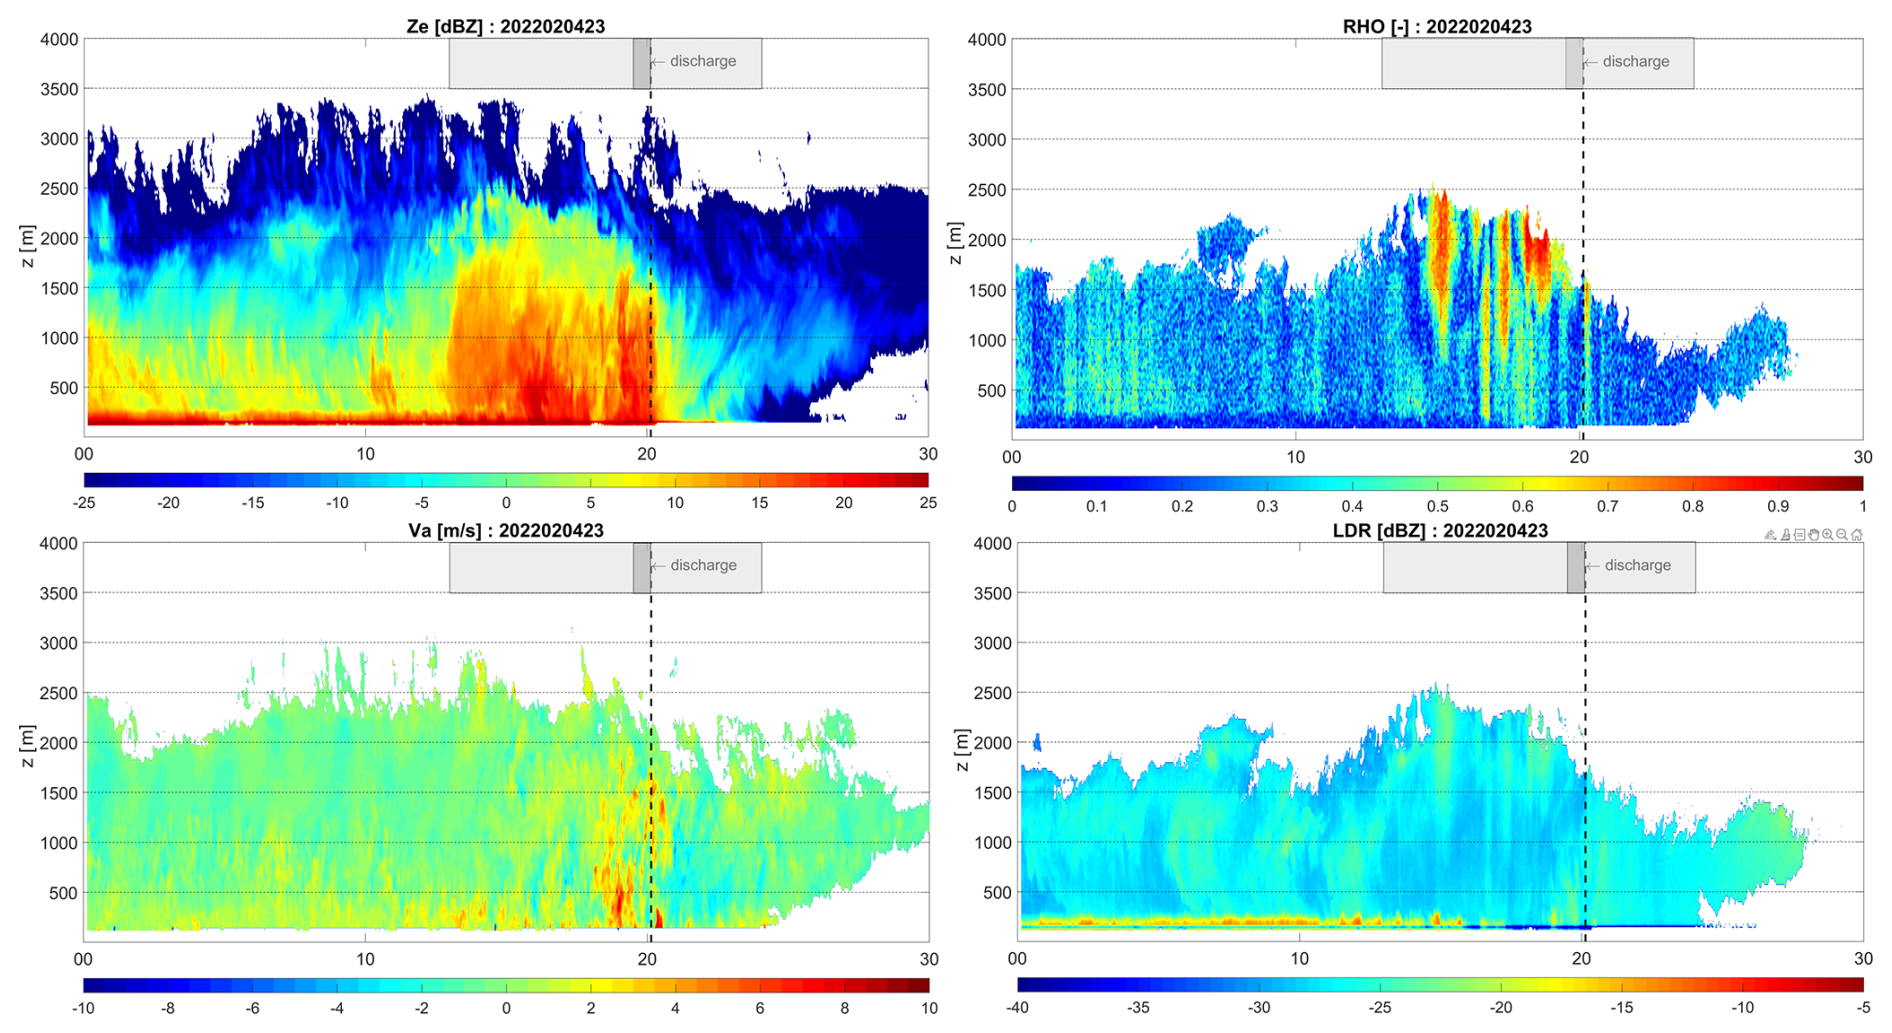
Figure 8Ze, LDR, Va, and RHO measured by the vertical profiler MIRA 35c from 23:00 to 23:30 UTC (horizontal axis). The vertical dashed line shows the time of the recorded discharge. Gray areas show both gamma-ray glows: the low-intensity gamma-ray glow (light gray) and the high-intensity gamma-ray glow ended by the discharge (dark gray). For more details, see Popová et al. (2023).
The weak gamma-ray glow started at the moment of a higher reflectivity region, with Ze above 15 dBZ, passing the hill and ending when there were very low values of Ze (lower than −15 dBZ; Fig. 8 – Ze). The end of the weak gamma-ray glow roughly correlates with the last pixel of graupel and hail (GH; see Fig. 9), as deduced from the fitted Gaussian curve. However, since the excess of the weak gamma-ray glow was low above the background, its end is not very recognizable and is smeared in the fluctuation of the background. During the weak gamma-ray glow, the cloud contained graupel and hail, with a sparse mix of cloud water and raindrops (Fig. 9). The classification algorithm has one class for both hail and graupel. Due to the lower values of the measured Ze, it can be concluded that hail probably did not occur, as is supported by the data from the disdrometer (see Fig. 7).
During the strong gamma-ray glow, Ze was above 20 dBZ in the lowest 1500 m of the cloud, and the cloud contained a category of hydrometeors of graupel and hail, with a sparse mix of cloud water and raindrops, as in the case of the low-intensity gamma-ray glow. These findings are consistent with ranges previously calculated by Chilingarian et al. (2021b) and Diniz et al. (2022).
The polarimetric feature of the cloud profiler can even reveal areas of aligned ice crystals that change the reflection of the radar signal. This alignment is probably caused by the ambient electric field, which can be used to identify strong electric fields in clouds (Melnikov et al., 2019). In the upper parts of the cloud, the ice crystals are usually columnar in shape. If these crystals are oriented horizontally along the long axis, then Zh is larger and Zv smaller than when the crystals are oriented vertically. Hence, the LDR is higher in the latter case than in the former case. Usually, ice crystals are randomly oriented in the scan volume, but when these crystals are exposed to a strong electric field, they arrange along the longer axis vertically, making the LDR increase, and since they are symmetric in the scan direction, it makes the RHO increase as well. Such areas are visible in Fig. 8, where LDR values higher than −20 dBZ indicate the alignment of ice crystals in the area above the melting layer, which shows the highest LDR values at about 250 m above the radar. These areas are even more pronounced in the projection of RHO; the higher the number, the higher the specific reflectivity, leading to a conclusion on intensified electric fields (Melnikov et al., 2019). The most interesting area is just after the discharge (discharge depicted by the dashed line in Fig. 8). The narrow area of higher values of RHO right after the discharge spanned from the top to almost the bottom of the cloud. This could confirm the previous existence of an area of intensified electric field that aligned the ice crystals and also caused the gamma-ray glow observed on the ground.
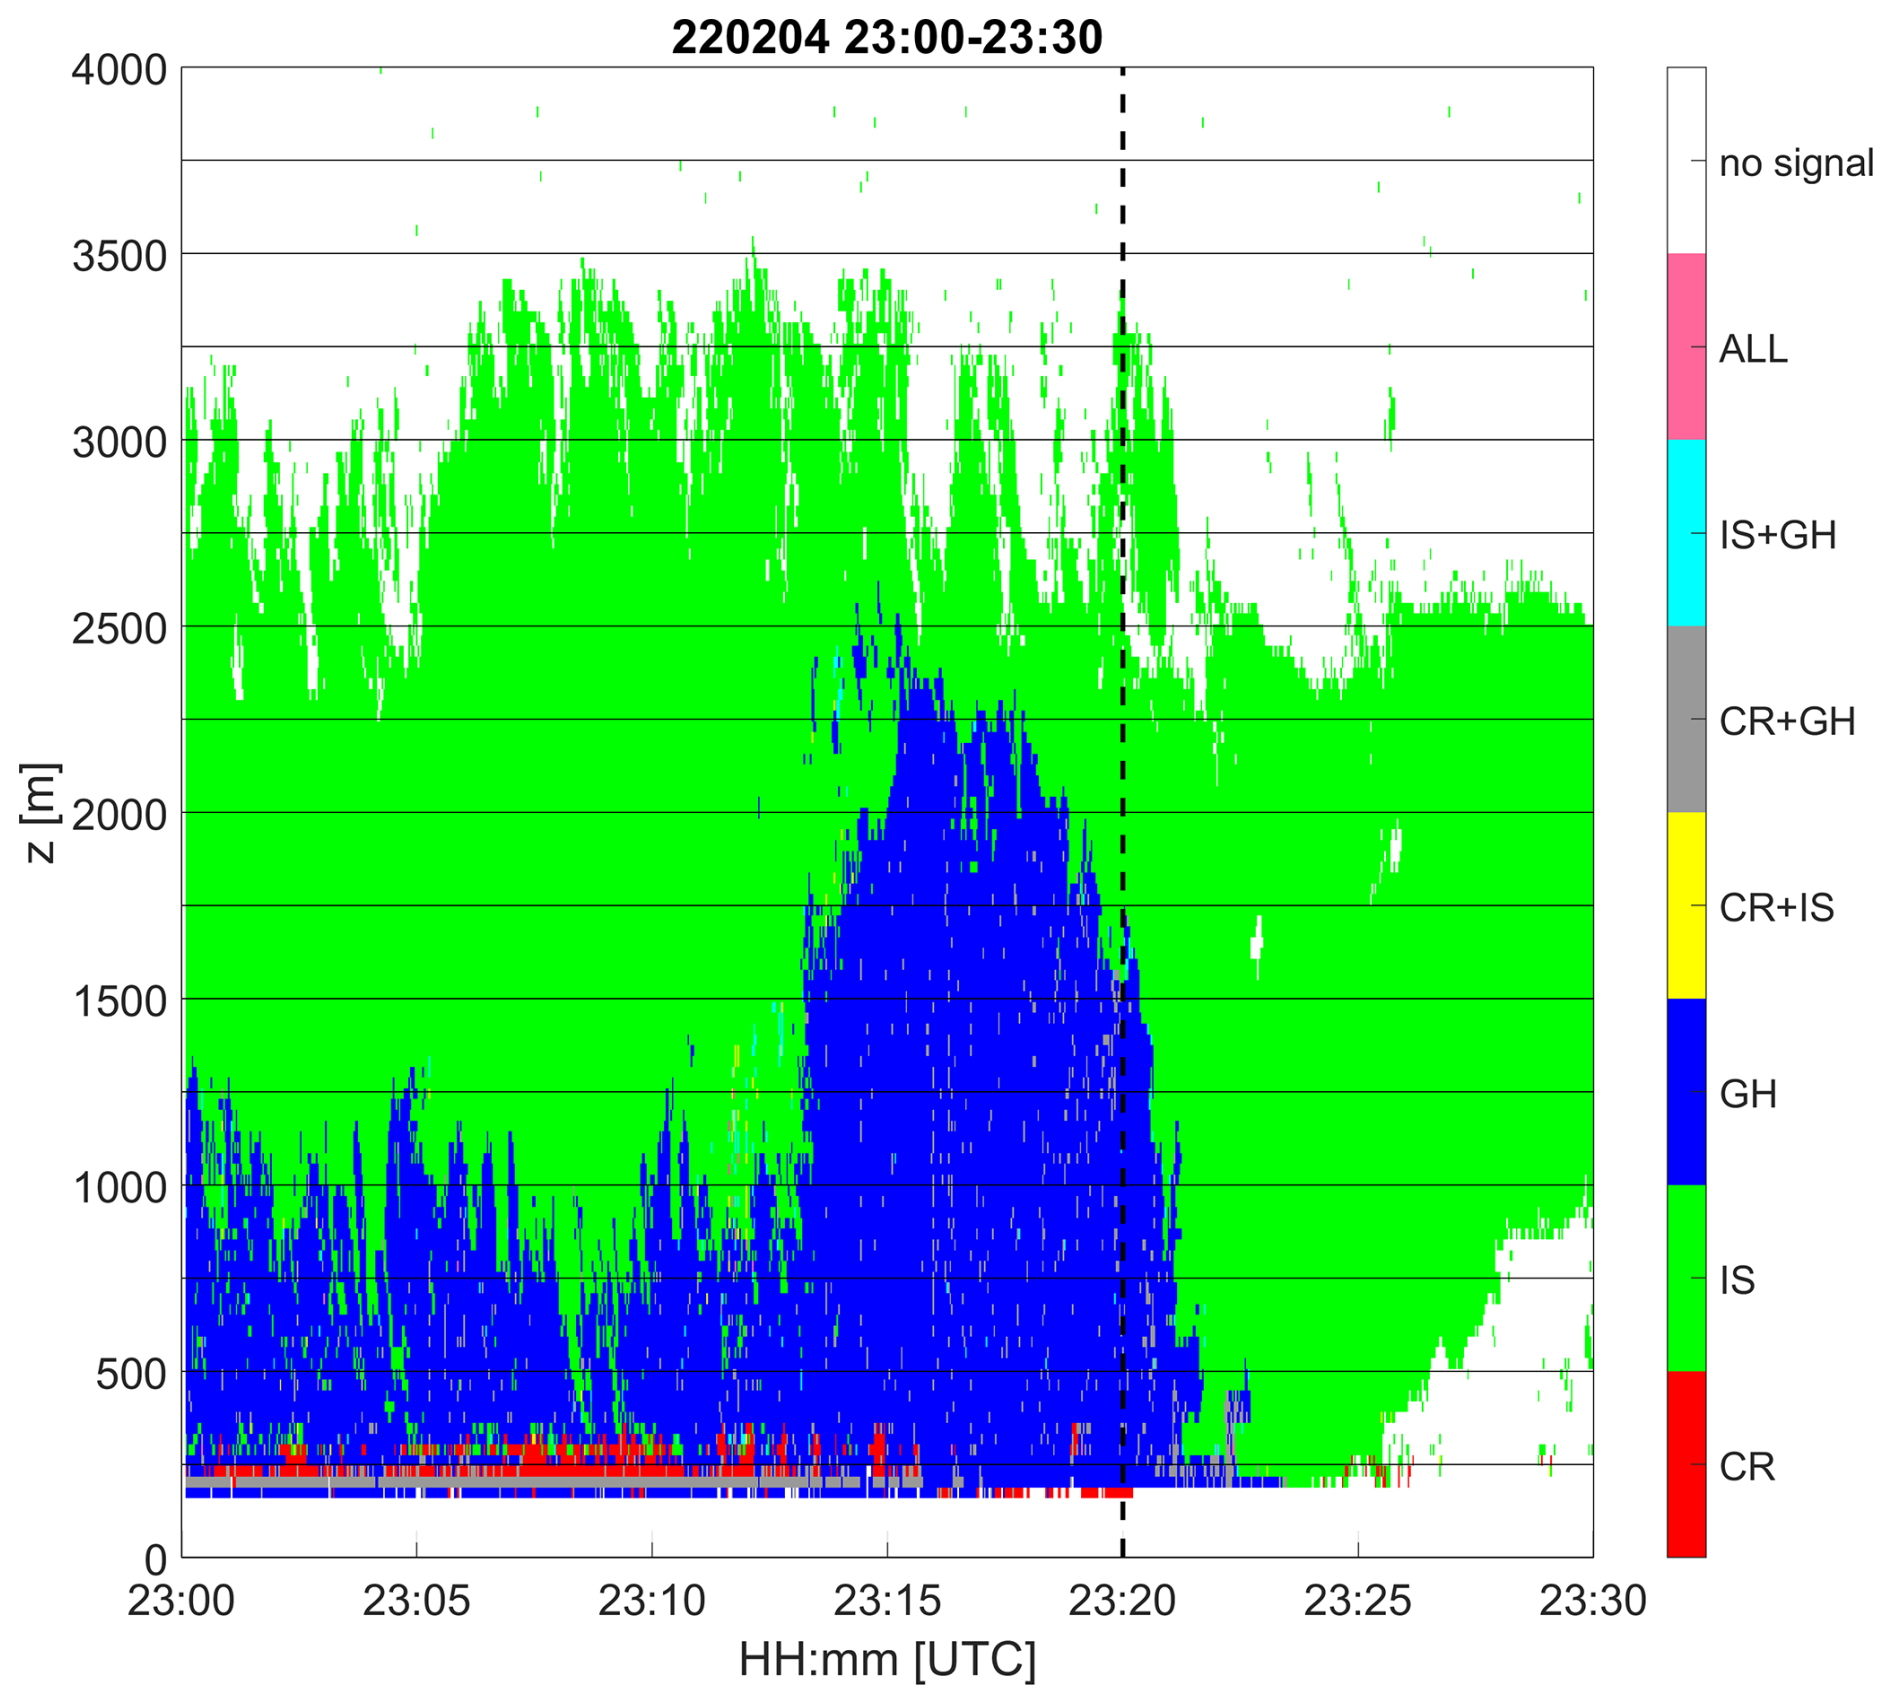
Figure 9Hydrometeor classification using cloud profiler data based on Sokol et al. (2018). CR – cloud and raindrops, IS – ice and snow, GH – graupel and hail. Note the sparse small, gray areas (CR+GH) within the blue area (GH). For more details, see Popová et al. (2023).
Around the gamma-ray glow event, the disdrometer did not detect any hail. On the other hand, graupel and snow grains were recorded right before the strong ionizing radiation enhancement (Fig. 7). The existence of falling snow grains was also recorded by the observer on duty and agrees well with the observations in other studies (Chilingarian et al., 2021a; Wada et al., 2021b).
The observation of a winter continental gamma-ray glow on Milešovka hill, Czech Republic, provides novel insights into thunderstorm-related radiation phenomena in a rarely studied environment. The findings reveal several important points.
-
First described winter gamma-ray glow in continental Europe. This event marks the first documented observation of a winter gamma-ray glow in Central Europe, a region where such phenomena are uncommon due to the rarity of winter thunderstorms with suitable conditions.
-
Role of ice crystal alignment in radiation generation. Radar observations showed the clear alignment of ice crystals in the cloud, indicative of a strong electric field higher up. This suggests that strong localized electric fields within the cloud, rather than at the ground level, play a crucial role in generating gamma-ray glows.
-
Unique meteorological conditions contributing to the event. The exceptionally low cloud base and the relatively shallow vertical extent of the cloud allowed gamma radiation to reach the ground. This highlights how specific meteorological settings, like a low cloud base and limited cloud height, can influence the occurrence and detection of gamma-ray glows.
The findings also underscore the value of combining multiple observational tools, such as a cloud radar and ionizing radiation detector, to unravel the complexities of thunderstorm dynamics and radiation generation in different climatic conditions.
The cloud profiler data are described in Popová et al. (2023). The disdrometer, meteorological, and SEVAN data are available online (via Mendeley Data; https://doi.org/10.17632/c3tn4877gj.2, Šlegl and Sokol, 2025). Graphs of the latter-mentioned data were produced by Plotly (Plotly Technologies Inc., 2015).
JŠ: conceptualization, investigation, software, data curation, resources, visualization, writing, and original draft. ZS: funding acquisition, software, methodology, visualization, and writing (review and editing). PP: investigation. RL: investigation. IS: software and resources. JP: resources and writing (review and editing). MK: funding acquisition, resources, validation, and writing (review and editing). IA: supervision and writing (review and editing). OP: supervision, funding acquisition, and writing (review and editing).
The contact author has declared that none of the authors has any competing interests.
Publisher's note: Copernicus Publications remains neutral with regard to jurisdictional claims made in the text, published maps, institutional affiliations, or any other geographical representation in this paper. While Copernicus Publications makes every effort to include appropriate place names, the final responsibility lies with the authors.
We would like to thank the staff of the Milešovka observatory for the ongoing care of the equipment. We would also like to express our sincere gratitude to Yuuki Wada for his comments and discussions, which greatly improved the quality and clarity of this research, as well as to the other reviewer. We acknowledge BLIDS (Blitz Informationsdienst von Siemens) for providing us with the lightning data for the case study.
This research was supported by the Johannes Amos Comenius Programme (OP JAC) (project no. CZ.02.01.01/00/22_008/0004605 “Natural and anthropogenic georisks”).
This paper was edited by John Plane and reviewed by Yuuki Wada and one anonymous referee.
Chilingarian, A. and Mkrtchyan, H.: Role of the Lower Positive Charge Region (LPCR) in initiation of the Thunderstorm Ground Enhancements (TGEs), Phys. Rev. D, 86, 1–11, https://doi.org/10.1103/PhysRevD.86.072003, 2012. a, b
Chilingarian, A., Hovsepyan, G., Arakelyan, K., Chilingaryan, S., Danielyan, V., Avakyan, K., Yeghikyan, A., Reymers, A., and Tserunyan, S.: Space environmental viewing and analysis network (SEVAN), Earth Moon Planets, 104, 195–210, https://doi.org/10.1007/s11038-008-9288-1, 2009. a
Chilingarian, A., Daryan, A., Arakelyan, K., Hovhannisyan, A., Mailyan, B., Melkumyan, L., Hovsepyan, G., Chilingaryan, S., Reymers, A., and Vanyan, L.: Ground-based observations of thunderstorm-correlated fluxes of high-energy electrons, gamma rays, and neutrons, Phys. Rev. D, 82, 1–11, https://doi.org/10.1103/PhysRevD.82.043009, 2010. a
Chilingarian, A., Hovsepyan, G., and Hovhannisyan, A.: Particle bursts from thunderclouds: Natural particle accelerators above our heads, Phys. Rev. D, 83, 1–11, https://doi.org/10.1103/PhysRevD.83.062001, 2011. a
Chilingarian, A., Hovsepyan, G., Khanikyanc, G., Reymers, A., and Soghomonyan, S.: Lightning origination and thunderstorm ground enhancements terminated by the lightning flash, EPL-Europhys. Lett., 110, 49001, https://doi.org/10.1209/0295-5075/110/49001, 2015. a
Chilingarian, A., Hovsepyan, G., and Mnatsakanyan, E.: Mount Aragats as a stable electron accelerator for atmospheric high-energy physics research, Phys. Rev. D, 93, 1–12, https://doi.org/10.1103/PhysRevD.93.052006, 2016. a
Chilingarian, A., Hovsepyan, G., and Mailyan, B.: In situ measurements of the Runaway Breakdown (RB) on Aragats mountain, Nucl. Instrum. Meth. A, 874, 19–27, https://doi.org/10.1016/j.nima.2017.08.022, 2017. a
Chilingarian, A., Hovsepyan, G., Karapetyan, G., and Zazyan, M.: Stopping muon effect and estimation of intracloud electric field, Astropart. Phys., 124, 102505, https://doi.org/10.1016/j.astropartphys.2020.102505, 2021a. a
Chilingarian, A., Hovsepyan, G., Svechnikova, E., and Zazyan, M.: Electrical structure of the thundercloud and operation of the electron accelerator inside it, Astropart. Phys., 132, 102615, https://doi.org/10.1016/j.astropartphys.2021.102615, 2021b. a, b
Chilingarian, A., Karapetyan, T., Zazyan, M., Hovsepyan, G., Sargsyan, B., Nikolova, N., Angelov, H., Chum, J., and Langer, R.: Maximum strength of the atmospheric electric field, Phys. Rev. D, 103, 43021, https://doi.org/10.1103/PhysRevD.103.043021, 2021c. a, b, c
Chum, J., Langer, R., Baše, J., Kollárik, M., Strhárský, I., Diendorfer, G., and Rusz, J.: Significant enhancements of secondary cosmic rays and electric field at the high mountain peak of Lomnický Štít in High Tatras during thunderstorms, Earth Planets Space, 72, 28, https://doi.org/10.1186/s40623-020-01155-9, 2020. a, b
Diniz, G., Wada, Y., Ohira, Y., Nakazawa, K., and Enoto, T.: Atmospheric Electron Spatial Range Extended by Thundercloud Electric Field Below the Relativistic Runaway Electron Avalanche Threshold, J. Geophys. Res.-Atmos., 127, 1–14, https://doi.org/10.1029/2021JD035958, 2022. a
Gurevich, A. V., Milikh, G. M., and Roussel-Dupre, R.: Runaway electron mechanism of air breakdown and preconditioning during a thunderstorm, Phys. Lett. A, 165, 463–468, https://doi.org/10.1016/0375-9601(92)90348-P, 1992. a
Kelley, N. A., Smith, D. M., Dwyer, J. R., Splitt, M., Lazarus, S., Martinez-McKinney, F., Hazelton, B., Grefenstette, B., Lowell, A., and Rassoul, H. K.: Relativistic electron avalanches as a thunderstorm discharge competing with lightning, Nat. Commun., 6, 7845, https://doi.org/10.1038/ncomms8845, 2015. a
Kochkin, P., van Deursen, A. P., Marisaldi, M., Ursi, A., de Boer, A. I., Bardet, M., Allasia, C., Boissin, J. F., Flourens, F., Østgaard, N., van Deursen, A. P. J., Marisaldi, M., Ursi, A., de Boer, A. I., Bardet, M., Allasia, C., Boissin, J. F., Flourens, F., and Østgaard, N.: In-Flight Observation of Gamma Ray Glows by ILDAS, J. Geophys. Res.-Atmos., 122, 12801–12811, https://doi.org/10.1002/2017JD027405, 2017. a
Kolmašová, I.: Comment on egusphere-2024-3075, https://doi.org/10.5194/egusphere-2024-3075-CC1, 2024. a
Kolmašová, I., Santolík, O., Šlegl, J., Popová, J., Sokol, Z., Zacharov, P., Ploc, O., Diendorfer, G., Langer, R., Lán, R., and Strhárský, I.: Continental thunderstorm ground enhancement observed at an exceptionally low altitude, Atmos. Chem. Phys., 22, 7959–7973, https://doi.org/10.5194/acp-22-7959-2022, 2022. a, b
Kudela, K., Chum, J., Kollárik, M., Langer, R., Strhárský, I., and Baše, J.: Correlations Between Secondary Cosmic Ray Rates and Strong Electric Fields at Lomnický štít, J. Geophys. Res.-Atmos., 122, 10700–10710, https://doi.org/10.1002/2016JD026439, 2017. a
McCarthy, M. and Parks, G. K.: Further observations of X-rays inside thunderstorms, Geophys. Res. Lett., 12, 393–396, https://doi.org/10.1029/GL012i006p00393, 1985. a
Melnikov, V., Zrnić, D. S., Weber, M. E., Fierro, A. O., and MacGorman, D. R.: Electrified Cloud Areas Observed in the SHV and LDR Radar Modes, J. Atmos. Ocean. Tech., 36, 151–159, https://doi.org/10.1175/JTECH-D-18-0022.1, 2019. a, b
Munzar, J. and Franc, M.: Winter thunderstorms in central Europe in the past and the present, Atmos. Res., 67–68, 501–515, https://doi.org/10.1016/S0169-8095(03)00062-0, 2003. a, b
Plotly Technologies Inc.: Collaborative data science, Plotly Technologies Inc., Montreal, QC [code], https://plot.ly (last access: 10 July 2025), 2015. a
Popová, J., Sokol, Z., Wang, P., and Svoboda, J.: Observations and modelling of the winter thunderstorm on 4 February 2022 at the Milešovka meteorological observatory, Q. J. Roy. Meteor. Soc., 149, 3541–3561, https://doi.org/10.1002/qj.4572, 2023. a, b, c, d, e, f
Šlegl, J. and Sokol, Z.: Materials for “First Reported Detection of a Winter Continental Gamma-Ray Glow in Europe”, V2, Mendeley Data [data set], https://doi.org/10.17632/c3tn4877gj.2, 2025. a
Šlegl, J., Minářová, J., Kuča, P., Kolmašová, I., Santolík, O., Sokol, Z., Reitz, G., Ambrožová, I., and Ploc, O.: Response of the Czech RMN Network to Thunderstorm Activity, Radiat. Prot. Dosim., 186, 215–218, https://doi.org/10.1093/rpd/ncz205, 2019. a
Šlegl, J., Langer, R., Brunclík, T., Mašek, P., Strhárský, I., Ambrožová, I., Chum, J., and Ploc, O.: Spectrometry of High-Energy Photons on High Mountain Observatory Lomnický Štít During Thunderstorms, Radiat. Prot. Dosim., 198, 623–627, https://doi.org/10.1093/rpd/ncac108, 2022. a, b
Sokol, Z., Minářová, J., and Novák, P.: Classification of hydrometeors using measurements of the ka-band cloud radar installed at the Milešovka Mountain (Central Europe), Remote Sens.-Basel, 10, 1674, https://doi.org/10.3390/rs10111674, 2018. a, b
Sokol, Z., Minářová, J., and Fišer, O.: Hydrometeor Distribution and Linear Depolarization Ratio in Thunderstorms, Remote Sens.-Basel, 12, 2144, https://doi.org/10.3390/rs12132144, 2020. a
Torii, T., Sugita, T., Tanabe, S., Kimura, Y., Kamogawa, M., Yajima, K., and Yasuda, H.: Gradual increase of energetic radiation associated with thunderstorm activity at the top of Mt. Fuji, Geophys. Res. Lett., 36, L13804, https://doi.org/10.1029/2008GL037105, 2009. a
Torii, T., Sugita, T., Kamogawa, M., Watanabe, Y., and Kusunoki, K.: Migrating source of energetic radiation generated by thunderstorm activity, Geophys. Res. Lett., 38, 2–6, https://doi.org/10.1029/2011GL049731, 2011. a, b
Tsuchiya, H., Enoto, T., Yamada, S., Yuasa, T., Kawaharada, M., Kitaguchi, T., Kokubun, M., Kato, H., Okano, M., Nakamura, S., and Makishima, K.: Detection of high-energy gamma rays from winter thunderclouds, Phys. Rev. Lett., 99, 165002, https://doi.org/10.1103/PhysRevLett.99.165002, 2007. a
Tsuchiya, H., Enoto, T., Torii, T., Nakazawa, K., Yuasa, T., Torii, S., Fukuyama, T., Yamaguchi, T., Kato, H., Okano, M., Takita, M., and Makishima, K.: Observation of an energetic radiation burst from mountain-top thunderclouds, Phys. Rev. Lett., 102, 10–13, https://doi.org/10.1103/PhysRevLett.102.255003, 2009. a, b
Tsuchiya, H., Enoto, T., Yamada, S., Yuasa, T., Nakazawa, K., Kitaguchi, T., Kawaharada, M., Kokubun, M., Kato, H., Okano, M., and Makishima, K.: Long-duration γ ray emissions from 2007 and 2008 winter thunderstorms, J. Geophys. Res., 116, D09113, https://doi.org/10.1029/2010JD015161, 2011. a
Tsuchiya, H., Hibino, K., Kawata, K., Hotta, N., Tateyama, N., Ohnishi, M., Takita, M., Chen, D., Huang, J., Miyasaka, M., Kondo, I., Takahashi, E., Shimoda, S., Yamada, Y., Lu, H., Zhang, J. L., Yu, X. X., Tan, Y. H., Nie, S. M., Munakata, K., Enoto, T., and Makishima, K.: Observation of thundercloud-related gamma rays and neutrons in Tibet, Phys. Rev. D, 85, 092006, https://doi.org/10.1103/PhysRevD.85.092006, 2012. a
Tsuchiya, H., Enoto, T., Iwata, K., Yamada, S., Yuasa, T., Kitaguchi, T., Kawaharada, M., Nakazawa, K., Kokubun, M., Kato, H., Okano, M., Tamagawa, T., and Makishima, K.: Hardening and termination of long-duration γ rays detected prior to lightning, Phys. Rev. Lett., 111, 1–5, https://doi.org/10.1103/PhysRevLett.111.015001, 2013. a
Wada, Y., Bowers, G. S., Enoto, T., Kamogawa, M., Nakamura, Y., Morimoto, T., Smith, D. M., Furuta, Y., Nakazawa, K., Yuasa, T., Matsuki, A., Kubo, M., Tamagawa, T., Makishima, K., and Tsuchiya, H.: Termination of Electron Acceleration in Thundercloud by Intracloud/Intercloud Discharge, Geophys. Res. Lett., 45, 5700–5707, https://doi.org/10.1029/2018GL077784, 2018. a, b
Wada, Y., Enoto, T., Nakamura, Y., Furuta, Y., Yuasa, T., Nakazawa, K., Morimoto, T., Sato, M., Matsumoto, T., Yonetoku, D., Sawano, T., Sakai, H., Kamogawa, M., Ushio, T., Makishima, K., and Tsuchiya, H.: Gamma-ray glow preceding downward terrestrial gamma-ray flash, Communications Physics, 2, 3–6, https://doi.org/10.1038/s42005-019-0168-y, 2019. a, b, c, d
Wada, Y., Enoto, T., Kubo, M., Nakazawa, K., Shinoda, T., Yonetoku, D., Sawano, T., Yuasa, T., Ushio, T., Sato, Y., Diniz, G. S., and Tsuchiya, H.: Meteorological Aspects of Gamma-Ray Glows in Winter Thunderstorms, Geophys. Res. Lett., 48, 1–11, https://doi.org/10.1029/2020GL091910, 2021a. a
Wada, Y., Matsumoto, T., Enoto, T., Nakazawa, K., Yuasa, T., Furuta, Y., Yonetoku, D., Sawano, T., Okada, G., Nanto, H., Hisadomi, S., Tsuji, Y., Diniz, G. S., Makishima, K., and Tsuchiya, H.: Catalog of gamma-ray glows during four winter seasons in Japan, Physical Review Research, 3, 043117, https://doi.org/10.1103/PhysRevResearch.3.043117, 2021b. a, b, c, d
Wada, Y., Tsurumi, M., Hayashi, S., and Michimoto, K.: Synoptic meteorological conditions of gamma-ray glows in winter thunderstorms, Progress in Earth and Planetary Science, 10, 6, https://doi.org/10.1186/s40645-023-00538-2, 2023. a
Wanke, E.: Blitzortung.org A low cost Time of Arrival Lightning Location Network, https://www.blitzortung.org/Compendium/Documentations/Documentation_2010-11-03_Green_PCB_6.5_PCB_5.5.pdf (last access: 10 July 2025), 2010. a
Williams, E., Mkrtchyan, H., Mailyan, B., Karapetyan, G., and Hovakimyan, S.: Radar Diagnosis of the Thundercloud Electron Accelerator, J. Geophys. Res.-Atmos., 127, e2021JD035957, https://doi.org/10.1029/2021JD035957, 2022. a