the Creative Commons Attribution 4.0 License.
the Creative Commons Attribution 4.0 License.
 | 31 Jul 2025
Shortwave radiative impacts of the Asian Tropopause Aerosol Layer (ATAL) using balloon-borne in situ measurements at three distinct locations in India
Vadassery Neelamana Santhosh
Bomidi Lakshmi Madhavan
Sivan Thankamani Akhil Raj
Madineni Venkat Ratnam
Jean-Paul Vernier
Frank Gunther Wienhold
This study aims to investigate the direct shortwave (SW) radiative forcing (RF) and heating rates of the Asian Tropopause Aerosol Layer (ATAL) in the upper troposphere–lower stratosphere (UTLS) using in situ observations from the Balloon measurement campaigns of the Asian Tropopause Aerosol Layer (BATAL) conducted between 2014 and 2018. Measurements were obtained over three distinct locations in India: Gadanki (13.48° N, 79.18° E), Hyderabad (17.47° N, 78.58° E), and Varanasi (25.27° N, 82.99° E). Given the ambiguity in the chemical composition of ATAL from several reported studies, seven different aerosol mixtures – comprising sulfate (SUL), nitrate (NIT), organic carbon (OC), and ammonium (AM) – were considered to assess their impact on estimates of ATAL radiative forcing and heating rates. A pronounced enhancement in aerosol backscatter was observed at ATAL altitudes (13 to 19 km) across all locations, with the backscatter ratio (BSR; at 455 nm) peaking at 1.07 over Varanasi and Hyderabad, followed by 1.06 over Gadanki. Radiative forcing estimates indicate a net warming effect, with ATAL contributing up to 3 % of the total columnar atmospheric forcing. Heating rates reveal a marked increase in aerosol-induced warming at ATAL altitudes, with maximum heating rates reaching 0.03 K d−1 across the study locations. The radiative impact of ATAL aerosols is highly sensitive to variations in the aerosol composition. Compared to a reference case with a stratospheric sulfate background, the ATAL radiative forcing varies between 0.03 and 0.28 W m−2 (1.5- to 14-fold increase). At the same time, heating rates exhibit a 30-fold increase, reaching 0.03 K d−1, depending on the aerosol mixture. Despite these strong localized effects within the UTLS, the overall contribution to total columnar aerosol forcing remains moderate (up to 5 %), underscoring the importance of aerosol composition in determining ATAL's radiative influence.
- Article
(5798 KB) - Full-text XML
-
Supplement
(1519 KB) - BibTeX
- EndNote


The Asian summer monsoon, which occurs from June to August, plays a crucial role in transporting pollutant-laden air masses across a vast geographic region in the Northern Hemisphere (e.g., Vogel et al., 2024; Yu et al., 2017). A large-scale anti-cyclonic circulation, known as the Asian Summer Monsoon Anticyclone (ASMA), develops in the upper troposphere–lower stratosphere (UTLS) due to intense heating over the Tibetan Plateau, coupled with deep convection over the head Bay of Bengal (BoB). This system effectively traps and redistributes air masses within a broad region (10–40° N, 10–140° E) (von Hobe et al., 2021; Lelieveld et al., 2018; Park et al., 2007; Randel and Park, 2006), leading to significant enhancements in trace constituents such as water vapor, methane, nitrogen dioxide, and ozone around the ASMA center (Basha et al., 2021; Kumar and Ratnam, 2021; Park et al., 2007). Satellite observations have identified a persistent aerosol enhancement in the UTLS (∼ 13–18 km) during the monsoon, known as the Asian Tropopause Aerosol Layer (ATAL) (Vernier et al., 2011, 2015; Thomason and Vernier, 2013). The ATAL is of particular scientific interest due to its potential influence on stratospheric composition, chemistry, cirrus cloud properties, and the Earth's radiative balance.
The formation and dissipation of ATAL are closely linked to deep convection, which transports aerosols from the BoB and surrounding land areas into the UTLS (He et al., 2020). However, ATAL aerosols exhibit significant spatial and temporal variability, reflecting their diverse sources and transport pathways (Fairlie et al., 2020; Lau et al., 2018; Neely et al., 2014; Fadnavis et al., 2013). The presence of both natural and anthropogenic aerosols within ATAL, combined with dynamic and chemical interactions (including secondary aerosol formation), further complicates its characterization. Recent studies indicate that a substantial fraction of ATAL aerosols results from gas-to-particle conversion of inorganic and organic precursors, highlighting the role of secondary aerosol formation in this region (Appel et al., 2022).
Despite growing interest in ATAL, its optical and radiative properties remain poorly constrained due to limitations in observational datasets. Aerosol optical depth (AOD) and extinction coefficient measurements in the UTLS are hindered by low aerosol concentrations, instrumental detection thresholds, and retrieval uncertainties in satellite and lidar observations. Additionally, complex transport and mixing processes in the UTLS make it challenging to determine ATAL's chemical composition, which is critical for quantifying its optical properties – such as single-scattering albedo (SSA) and asymmetry parameter (ASY) – that govern radiative transfer calculations. Early studies primarily identified sulfate (SUL) as the dominant component of ATAL (e.g., Vernier et al., 2015; Yu et al., 2015; Fadnavis et al., 2013). However, subsequent investigations revealed a more diverse aerosol composition. A reanalysis study for the summer of 2008 detected significant contributions from mineral dust and carbonaceous aerosols transported by deep convection (Lau et al., 2018). Long-term simulations (2000–2015) using the Community Earth System Model further indicated that ATAL aerosols comprise approximately 40 % sulfate, 30 % secondary aerosols, 15 % primary aerosols, 14 % ammonia-based aerosols, and trace amounts of black carbon (Bossolasco et al., 2021). Additionally, combined satellite, high-altitude aircraft, and cloud-chamber studies suggested the dominance of ammonium nitrate particles in the upper troposphere (Höpfner et al., 2019). Several in situ studies have also reported a substantial nitrate (NIT) fraction in ATAL (e.g., Vernier et al., 2022; Vernier et al., 2018), with aircraft-based chemical analyses indicating significant contributions from particulate nitrate, ammonium (AM), and organic aerosols at 13–18 km (Appel et al., 2022).
Understanding the radiative impacts of ATAL remains a major research challenge due to the uncertainties in aerosol composition, optical properties, and vertical distribution. Limited studies have quantified its radiative effects. Vernier et al. (2015) reported an increase in summertime AOD over Asia associated with ATAL from 0.002 to 0.006 between 1995 and 2013, leading to a regional shortwave (SW) radiative forcing (RF) of −0.12 W m−2 at the top of the atmosphere (TOA). This forcing partially offset (∼ 33 %) the radiative impact of global CO2 increases during 2000–2010 (Solomon et al., 2011). Using MERRA-2 reanalysis, Gao et al. (2023) estimated that ATAL aerosols exert a clear-sky positive radiative forcing of 0.15 W m−2 at 20 km due to their absorption properties. Chemistry–climate modeling by Fadnavis et al. (2022) further demonstrated that carbonaceous aerosols induce tropospheric and lower-stratospheric heating of 0.02–0.3 K per month, thereby enhancing water vapor transport into the UTLS. Similarly, Chavan et al. (2021) showed that biomass-burning aerosols over Asia contribute to UTLS heating rates of 0.001–0.02 K d−1.
Despite these insights, significant gaps remain in our understanding of ATAL's radiative effects. The contribution of ATAL aerosols to total atmospheric forcing is largely unknown, and real-time, high-resolution altitudinal in situ observations remain scarce. Moreover, previous estimates rely predominantly on reanalysis or model-based studies, which introduce uncertainties due to several assumptions. Therefore, there is a need for direct observational constraints on ATAL radiative forcing and heating rates.
To address these gaps, the Balloon measurement campaigns of the Asian Tropopause Aerosol Layer (BATAL) provide high-resolution in situ measurements of aerosol and atmospheric properties, offering a unique opportunity to refine radiative transfer calculations for ATAL. This study leverages BATAL observations to (i) characterize ATAL enhancements across multiple BATAL study locations, (ii) quantify ATAL radiative forcing and heating rates within the UTLS (12–20 km) using the high-resolution in situ measurements, (iii) assess the contribution of ATAL to total atmospheric column forcing, (iv) ascertain the sensitivity of ATAL radiative forcing and heating rates to variations in aerosol compositions, and (v) compare the heating rate estimates from in situ measurements from the three-point locations with spatially averaged estimates derived from satellite observations to ascertain their regional representativeness and variability. To achieve these objectives, we introduce a methodological framework that integrates in situ data to screen clouds, identify potential aerosol types or compositions, and incorporate these observations into radiative transfer calculations.
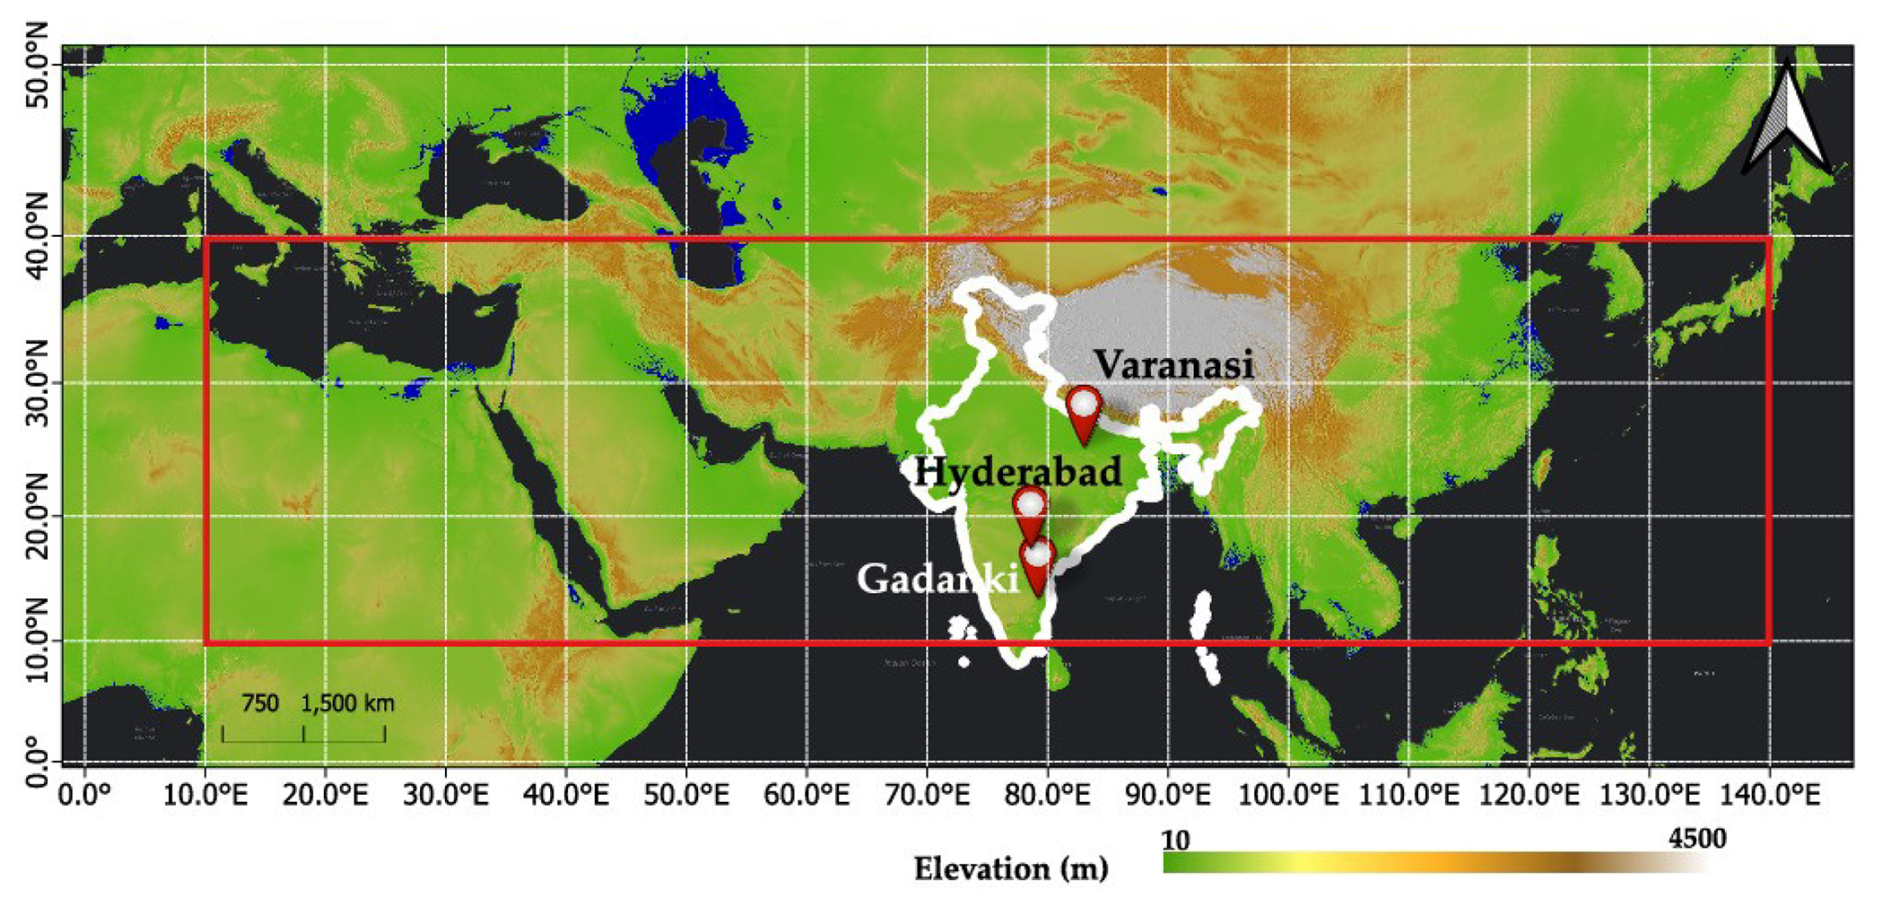
Figure 1Balloon launch sites during the 2014–2018 BATAL. The red box outlines the typical geographic extent of the Asian Tropopause Aerosol Layer (ATAL) region, spanning 10–40° N and 10–140° E.
The paper is structured as follows: Section 2 provides a brief description of the BATAL and study locations, Sect. 3 details the datasets used, and Sect. 4 outlines the methodology for estimating radiative impacts. The results are discussed in Sect. 5, followed by a summary of key findings in Sect. 6.
The BATAL were conducted jointly by the Indian Space Research Organisation (ISRO) and the National Aeronautics and Space Administration (NASA) during the late monsoon season (July–September) from 2014 to 2018. These campaigns deployed high-altitude balloons equipped with miniature payloads to investigate the optical properties, size distribution, and composition of aerosols in the ATAL. Additionally, the campaigns focused on examining the behavior of ozone and water vapor in the UTLS and assessing the role of deep convection in transporting aerosols and trace gases to this region. For detailed descriptions of the payloads, balloon specifications, and other scientific objectives, refer to Vernier et al. (2018).
The BATAL were conducted at three distinct sites in India, chosen based on their local weather, emission characteristics, and recovery of payload (Fig. 1):
- i.
Gadanki (13.48° N, 79.18° E) – A rural background location in southern peninsular India with hilly topography. Aerosol sources in this region are primarily from vehicular emissions, agricultural activities, and wood burning. During the monsoon season, the site experiences surface pressures between 960 and 965 hPa, temperatures ranging from 27 to 30 °C, and prevailing southwesterly winds of 1.5 to 1.6 m s−1. The relative humidity (RH) is typically below 60 %. Sky radiometer observations from this location revealed the presence of dominant coarse-mode aerosols during the monsoon (Santhosh et al., 2024a; Madhavan et al., 2021).
- ii.
Hyderabad (17.47° N, 78.58° E) – A rapidly urbanizing megacity situated on the Deccan Plateau. This region has a semi-arid climate characterized by significant seasonal variations in temperature and humidity. Anthropogenic sources primarily drive local emissions, whereas long-range aerosol transport is more prevalent during the monsoon season. AOD measurements indicate that coarse-mode aerosols contribute significantly to the overall aerosol burden (Ratnam et al., 2020; Sinha et al., 2013).
- iii.
Varanasi (25.27° N, 82.99° E) – An urban site in the Indo-Gangetic Plain (IGP) characterized by a humid subtropical climate with pronounced seasonal variations in temperature and rainfall. The region experiences high aerosol loading due to a mix of natural and anthropogenic sources. Coarse-mode aerosols, primarily dust, dominate in the pre-monsoon months, while fine-mode anthropogenic aerosols, including carbonaceous and sulfate aerosols, are more prominent during the post-monsoon and winter months (Murari et al., 2017; Tiwari and Singh, 2013).
These strategically selected sites offer critical insights into the spatial variability in aerosols that influence the ATAL, enabling a comprehensive assessment of their chemical composition, transport pathways, and radiative impacts in the UTLS.
Among the multiple payloads launched during the BATAL, this study focuses on measurements from radiosondes and ozonesondes (for atmospheric parameters) and the Compact Optical Backscatter Aerosol Detector (COBALD) (for aerosol measurements).
3.1 Radiosonde and ozonesonde
We utilized pressure, temperature, and relative humidity (RH) data from radiosondes, along with ozone volume mixing ratios from ozonesondes, to generate user-defined atmospheric profiles for the radiative forcing calculations. The Meisei (RS-11 G) and iMet radiosondes were used to measure temperature and pressure at different altitudes. The iMet radiosondes employed piezo-resistors for atmospheric pressure measurements, with an accuracy of 1–2 hPa. The Meisei radiosonde, which lacks a pressure sensor, derived pressure values from temperature and GPS altitude data. Ozone mixing ratios were obtained using EN-SCI Electrochemical Concentration Cell (ECC) ozonesondes, following the methodology outlined by Komhyr et al. (1995). More details on these methodologies can be found in Ratnam et al. (2014) and Akhil Raj et al. (2015). The observed atmospheric parameter profiles in the UTLS region are shown in Fig. S1 in the Supplement.
3.2 Compact Optical Backscatter Aerosol Detector (COBALD)
COBALD, developed by ETH Zurich, is a lightweight, balloon-borne sonde designed to measure backscattered light from aerosols, molecules, and clouds (Vernier et al., 2018). It operates with two LED light sources emitting at 455 nm (blue) and 940 nm (red) wavelengths. The emitted light illuminates the surrounding air, and a silicon photodetector captures the backscattered signal from particles within a 0.5 m range. Approximately 90 % of the measured backscattering signal originates from within a 10 m radius of the instrument. COBALD operates without requiring external airflow and transmits real-time backscatter data, alongside pressure and temperature measurements, to the ground station at a frequency of 1 Hz. The instrument has an uncertainty of 5 % and a precision better than 1 % in the UTLS region (Vernier et al., 2015, 2018).
Details of the balloon launches from which the present study's measurements were obtained are summarized in Table 1. We considered those balloon-borne in situ measurements, which covered a minimum altitude of 20 km above the surface, to capture the ATAL signal effectively.
Table 1Summary of balloon launches during the BATAL, highlighting the availability of Compact Optical Backscatter Aerosol Detector (COBALD), radiosonde, and ozonesonde measurements. All measurements cover a minimum altitude of 20 km, with maximum altitudes ranging from 25 to 35 km. The average maximum altitude is 29 km at Gadanki, 27 km at Hyderabad, and 30 km at Varanasi. “Y” indicates data availability for a specific payload, while “N” denotes non-availability. All launches were conducted during local nighttime (UTC +05:30).
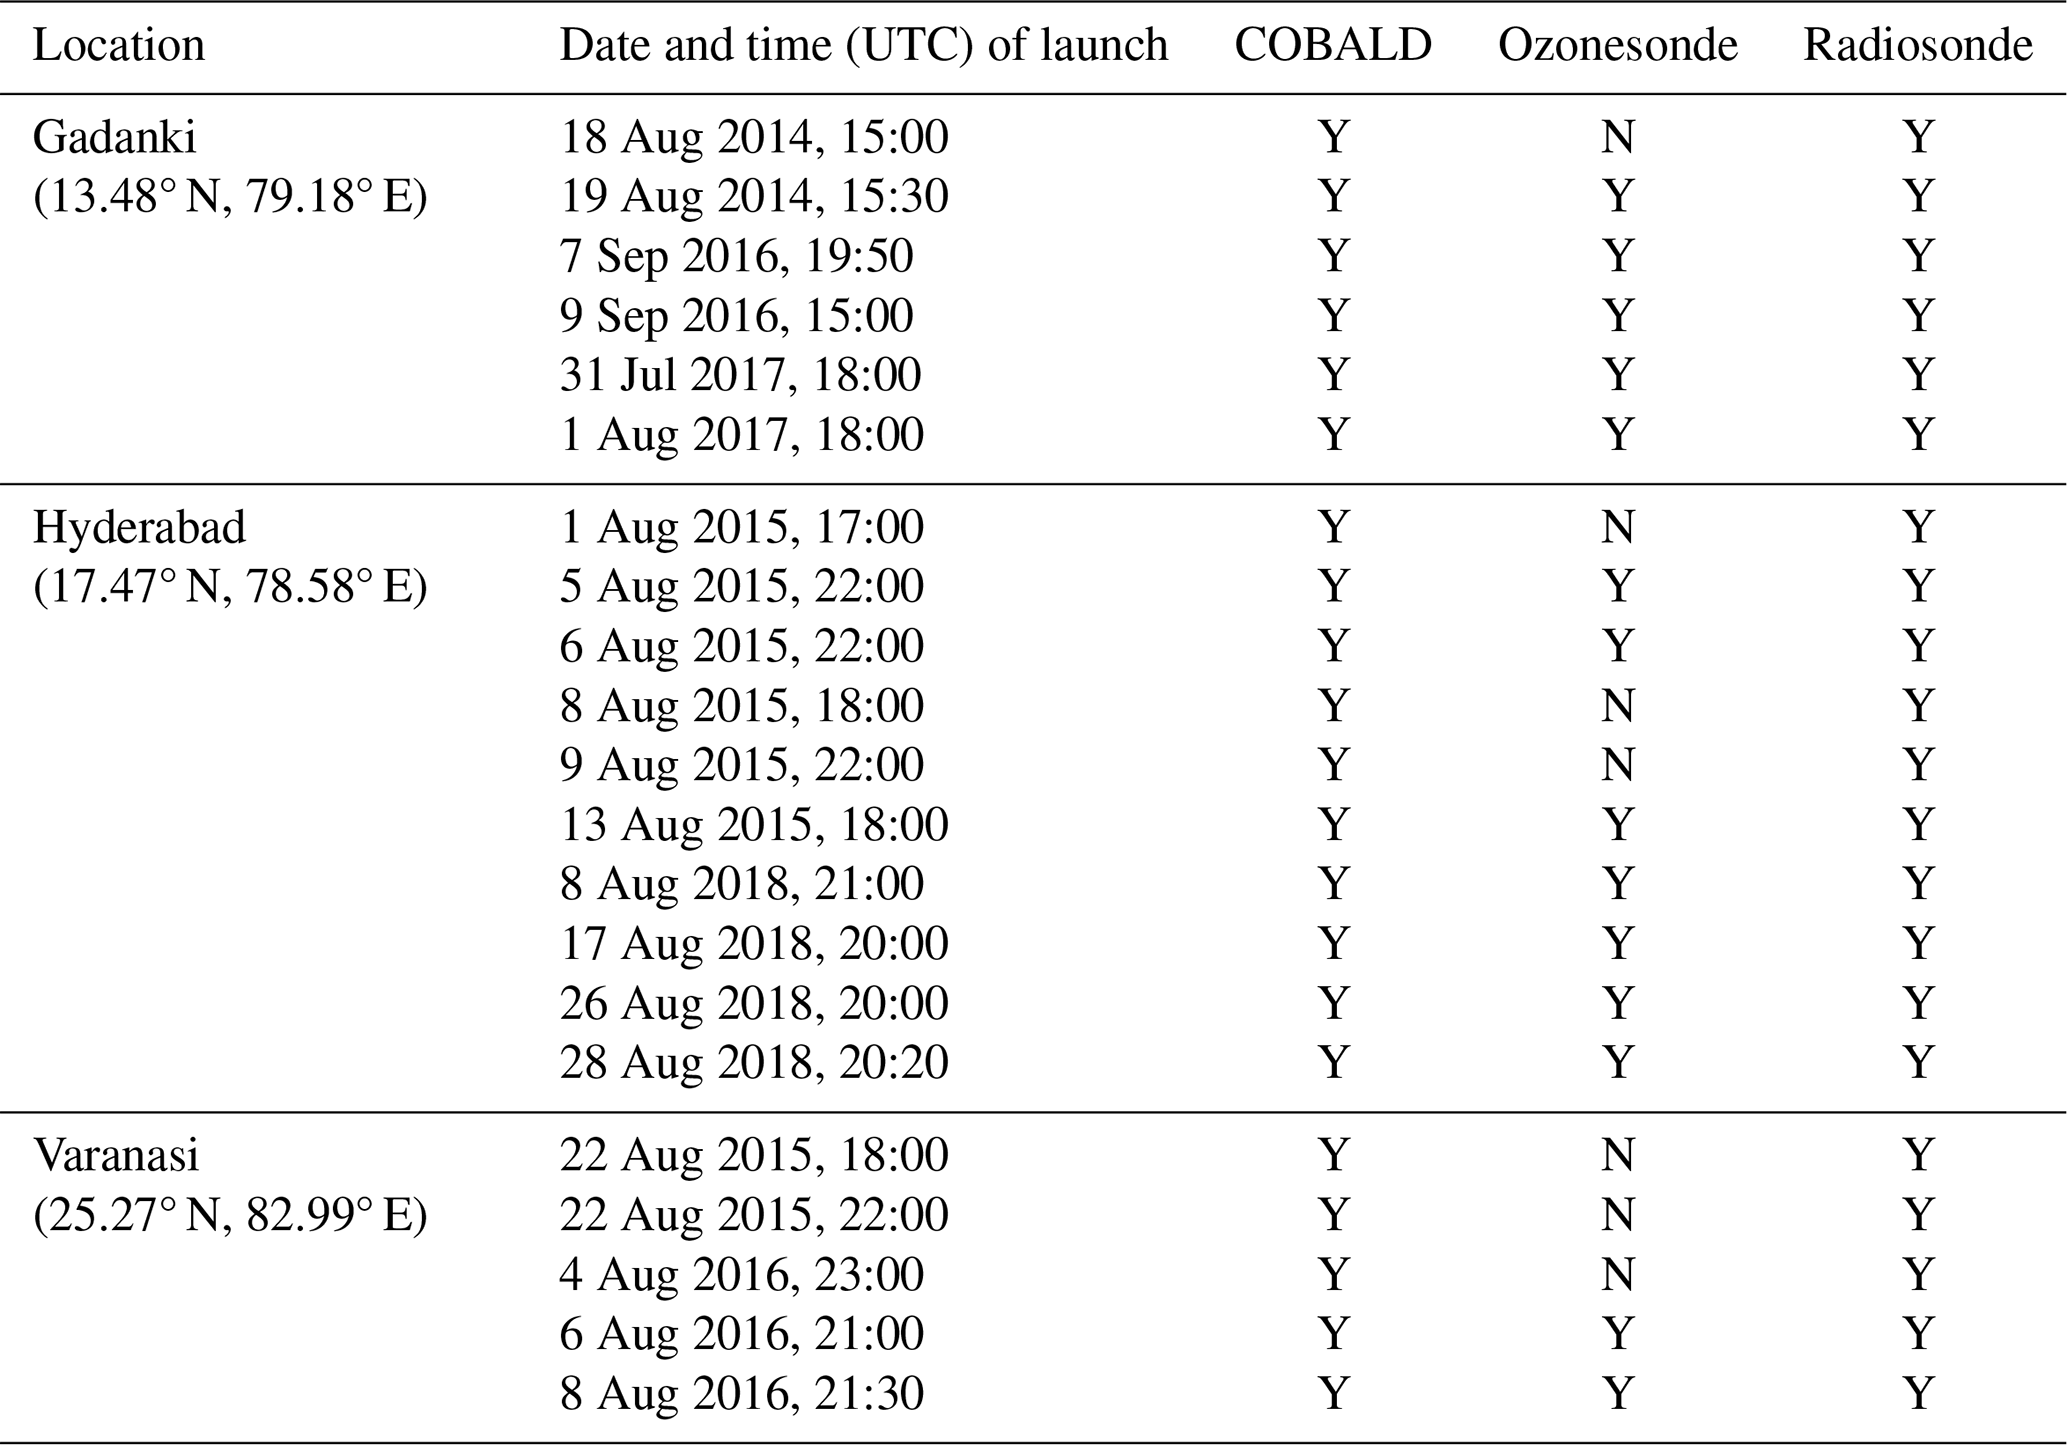
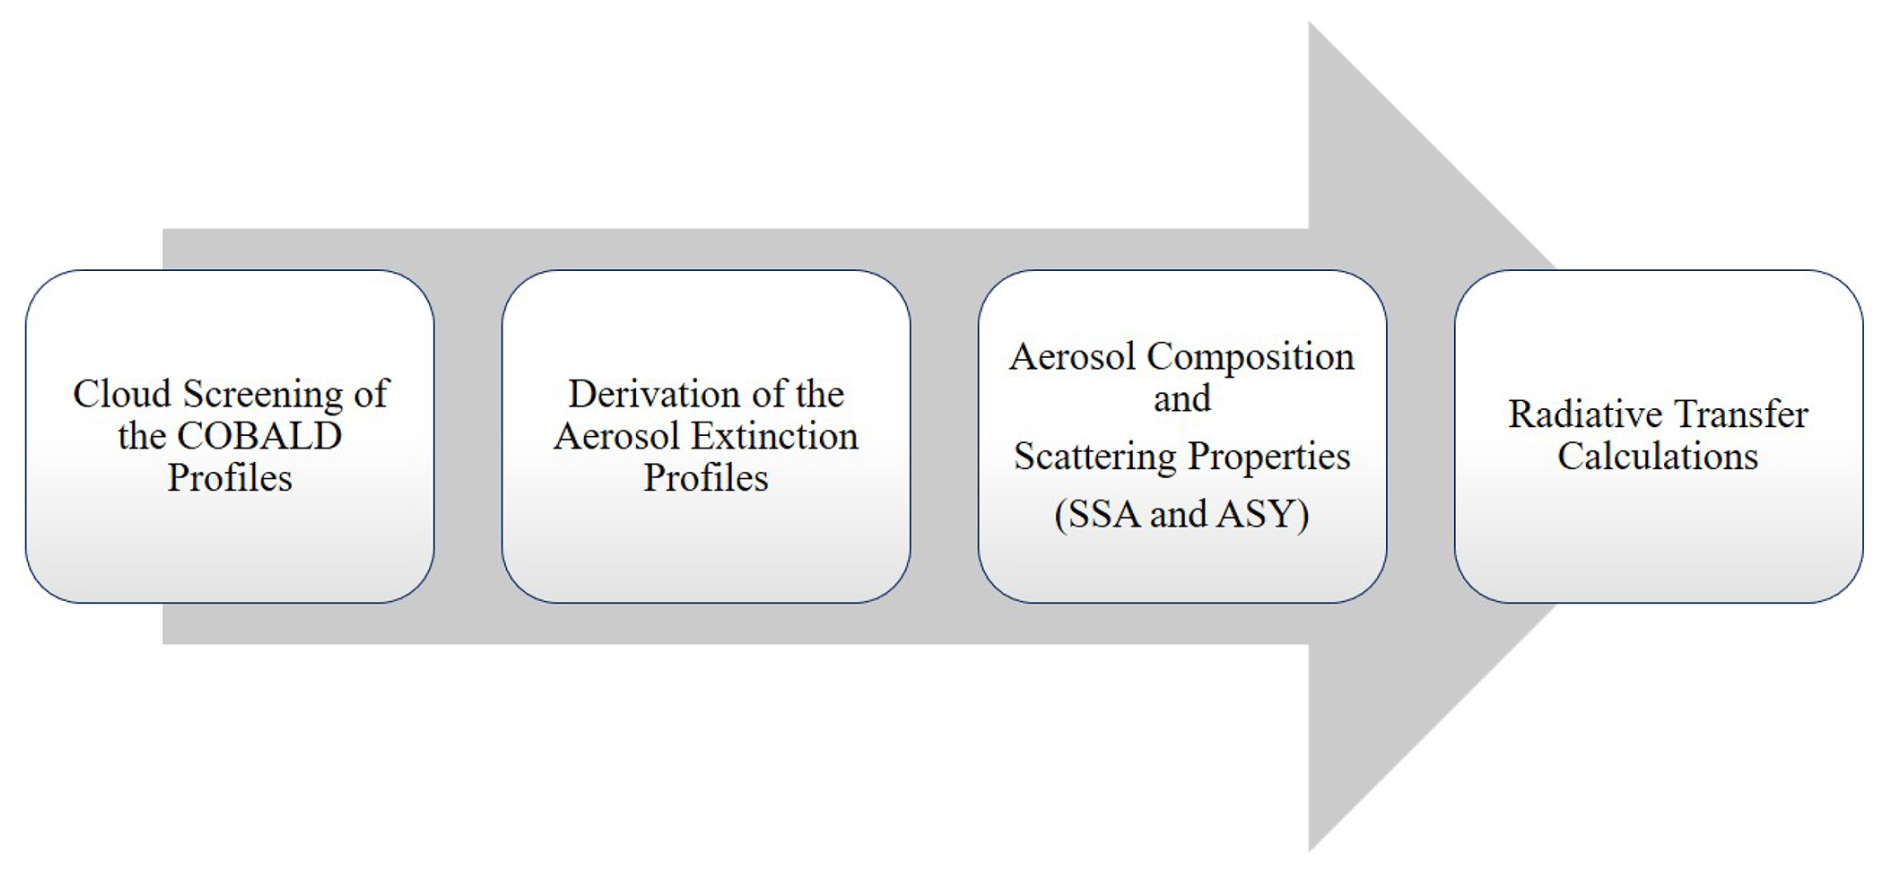
Figure 2Schematic representation of the methodology used in this study. SSA and ASY refer to single-scattering albedo and asymmetry parameter, respectively.
3.3 Ancillary datasets
In addition to in situ measurements, we utilized the following ancillary datasets:
- i.
We used the Modern-Era Retrospective analysis for Research and Applications, Version 2 (MERRA-2), Hourly, Time-averaged, Single-Level, Assimilation, Aerosol Diagnostics dataset (M2T1NXAER; 0.625° × 0.5° resolution, V5.12.4) developed by NASA's Global Modeling and Assimilation Office (GMAO) to retrieve AOD values for the campaign period. These AOD values were used to normalize aerosol extinction profiles, ensuring consistency between columnar aerosol loading and derived extinction profiles (for example, Santhosh et al., 2024b). Since collocated nighttime AOD retrievals from in situ measurements were unavailable, MERRA-2 served as a reliable alternative. Che et al. (2019) reported improved MERRA-2 AOD performance in the South Asian region based on comparisons with AERONET observations. The dataset provides total AOD at 550 nm and the Ångström exponent (AE) for the 470–870 nm range. The AODs at 455 and 940 nm wavelengths were derived using the Ångström power law (Ångström, 1964):
where λ0 represents the target wavelength. Given that our required wavelengths (455 and 940 nm) fall slightly outside the 470–870 nm range, we assumed the power-law relationship remains valid. Across study locations, Varanasi had the highest mean nighttime AOD at 550 nm (0.37 ± 0.13) from 19:30 to 05:30 LT, followed by Hyderabad (0.28 ± 0.05) and Gadanki (0.26 ± 0.07).
- ii.
Surface reflectance is a critical parameter in aerosol radiative forcing (ARF) calculations. We used the Moderate Resolution Imaging Spectroradiometer (MODIS) MCD43A4 Nadir Bidirectional Reflectance Distribution Function (BRDF)-Adjusted Reflectance (NBAR) product. This dataset (MODIS/Terra Nadir BRDF-Adjusted Reflectance Daily L3 Global 500 m SIN Grid) provides spectral reflectance values at MODIS spectral band (centered at 0.469, 0.555, 0.645, 0.859, 1.24, 1.64, and 2.13 µm) at local solar noon (https://modis.ornl.gov/globalsubset/, last access: 21 July 2025). Surface reflectance values were found to be similar across study locations in the visible spectrum, with deviations in the infrared range. Among the sites, Hyderabad exhibited the highest reflectance, while Varanasi had the lowest (Fig. S2).
The methodology followed in this study (Fig. 2) is discussed in the following subsections.
4.1 Cloud screening of the COBALD profiles
COBALD measurements capture total backscattered light from a mixture of aerosols, clouds, and molecules. Isolating aerosol contributions from the total backscatter becomes challenging in the presence of clouds, necessitating the identification and exclusion of these cloud-contaminated in situ measurements. The total backscatter signal is typically expressed as the backscatter ratio (BSR), defined as
where βmol represents the molecular backscatter coefficient and βTotal includes both particle and molecular contributions. In cloud-free conditions, , where βaer is the aerosol backscatter coefficient.
The color index (CI) is defined as the 940 / 455 nm ratio of the aerosol component of BSR:
CI is independent of particle number concentration and serves as a useful metric for interpreting particle size. Both BSR and CI are indicators of aerosol presence. Cirrus clouds can be identified separately using BSR at 455 and 940 nm or through CI, which enables discrimination between ice particles (CI < 7) and aerosol (CI > 7) (Hanumanthu et al., 2020). Based on previous studies, we set the following cloud screening criteria (above 10 km):
-
BSR455 < 1.12 for the blue-channel measurements, similarly to Akhil Raj et al. (2022);
-
BSR940 < 2.5 and CI > 7 for the red channel following Vernier et al. (2015).
Since these cloud screening criteria have not been validated in the lower atmosphere, we employed an alternative approach that combines vertical gradients of air temperature and relative humidity (RH) with altitude-dependent RH thresholds, as described in Xu et al. (2023), in the lower atmosphere (below 10 km). While radiosonde data provide measurements in the UTLS and beyond, this method may introduce uncertainties at higher altitudes due to radiosonde limitations associated with the accuracy of RH measurements (Miloshevich et al., 2006). A detailed description of this method is provided in Sect. S1 in the Supplement, along with relevant relative humidity (RH) thresholds (Table S1 in the Supplement) and an example (Fig. S3).
Based on the above methodology, a backscatter ratio profile influenced by molecules and aerosols is derived from the surface to the maximum altitude of a given COBALD measurement.
4.2 Derivation of the aerosol extinction profiles
Under cloud-free conditions, the aerosol backscatter coefficient βaer (expressed in ) at a given wavelength λ and altitude z is obtained from Eq. (2):
The molecular backscatter coefficients βmol (expressed in ) are determined using the in situ temperature and pressure profiles from radiosonde measurements (Collis and Russell, 2005) using the following equation:
where Rd = 287 is the gas constant for dry air and M = 4.81 × 1032 kg is the molecular weight of dry air. The aerosol backscatter coefficients were multiplied by a lidar ratio of 40 sr to derive extinction coefficient profiles, consistent with previous studies over the Indian region (e.g., Gupta et al., 2021).
To reduce uncertainties in lidar ratios, the aerosol extinction coefficient profiles βext(z) at wavelength λ were normalized using MERRA-2 AOD:
where AODCOBALD(λ) represents the AOD obtained by integrating the derived aerosol extinction profile (with a lidar ratio of 40 sr). This normalization ensures consistency between the columnar loading and extinction profiles, reducing biases in the estimates of aerosol direct radiative effects (Santhosh et al., 2024b).
4.3 Aerosol composition and scattering properties
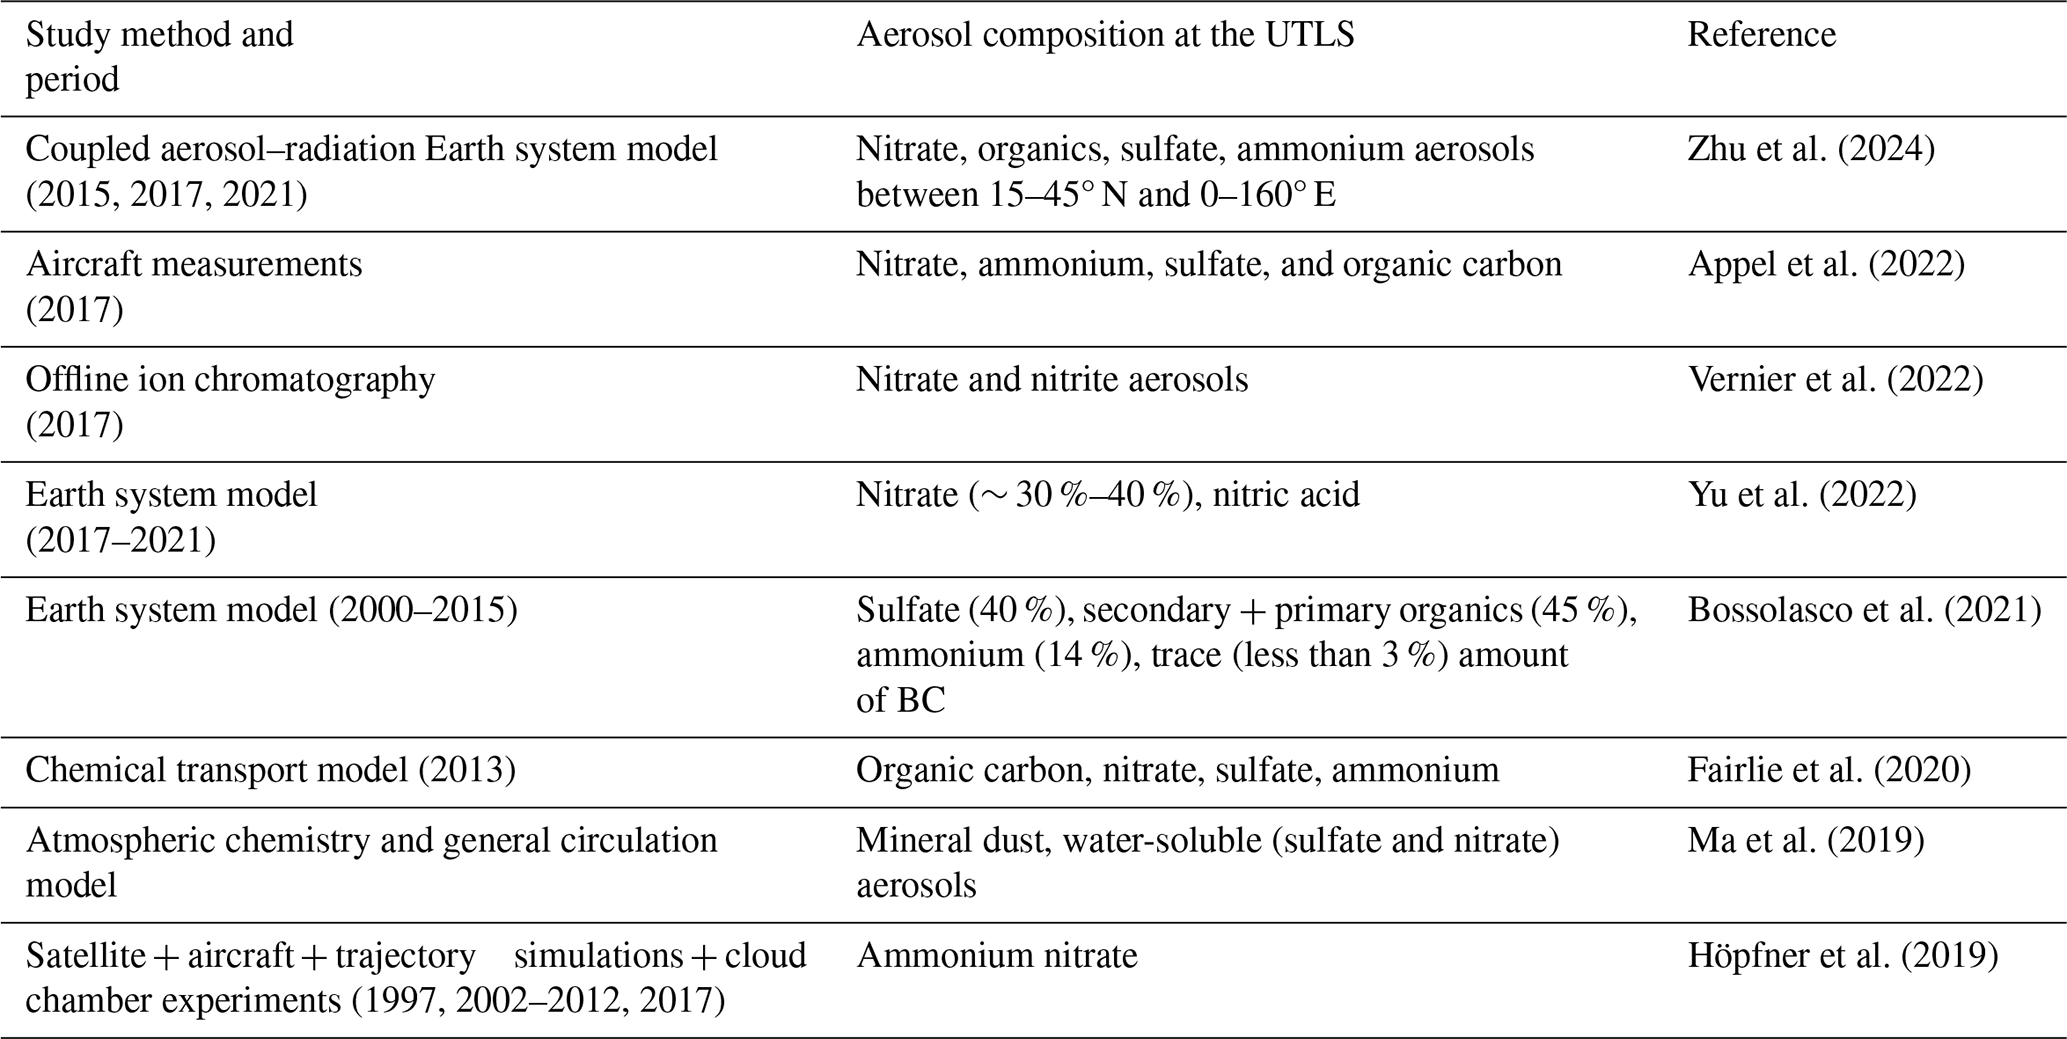
The composition of aerosols in the UTLS region during ATAL periods remains highly variable across different measurement techniques and time periods, posing a significant challenge for accurate characterization (Table 2). Despite differences, multiple studies consistently report the presence of sulfates, nitrates, organic carbon (OC), and ammonium aerosols in varying proportions.
Table 2Summary of studies on ATAL aerosol composition using different models and measurement techniques.
To account for this variability, we considered seven UTLS aerosol scenarios with different fractions of sulfate (SUL), nitrate (NIT), organic carbon (OC), and ammonium (AM), assuming external mixing (Table 3). Among these scenarios, the OC-dominant combination (with 50 % OC, denoted as C1) and the combination with 40 % OC and 30 % AM (denoted as C2) are adapted, respectively, from Bossolasco et al. (2021) and Appel et al. (2022). Two ideal scenarios are also assumed where the sulfate and nitrate aerosols contribute 100 % of the UTLS aerosols (SUL and NIT, respectively). The SUL scenario serves as a reference, representing UTLS aerosols with background sulfate levels similar to those in the stratosphere (Junge and Manson, 1961). The NIT scenario defines an upper baseline, while the remaining cases (denoted as C1 to C5) explore varying nitrate compositions from 0 to 0.4.
Table 3Aerosol mixing scenarios considered for UTLS aerosols, with fractional compositions (fi) of sulfates (SUL), nitrates (NIT), organic carbon (OC), and ammonium (AM).
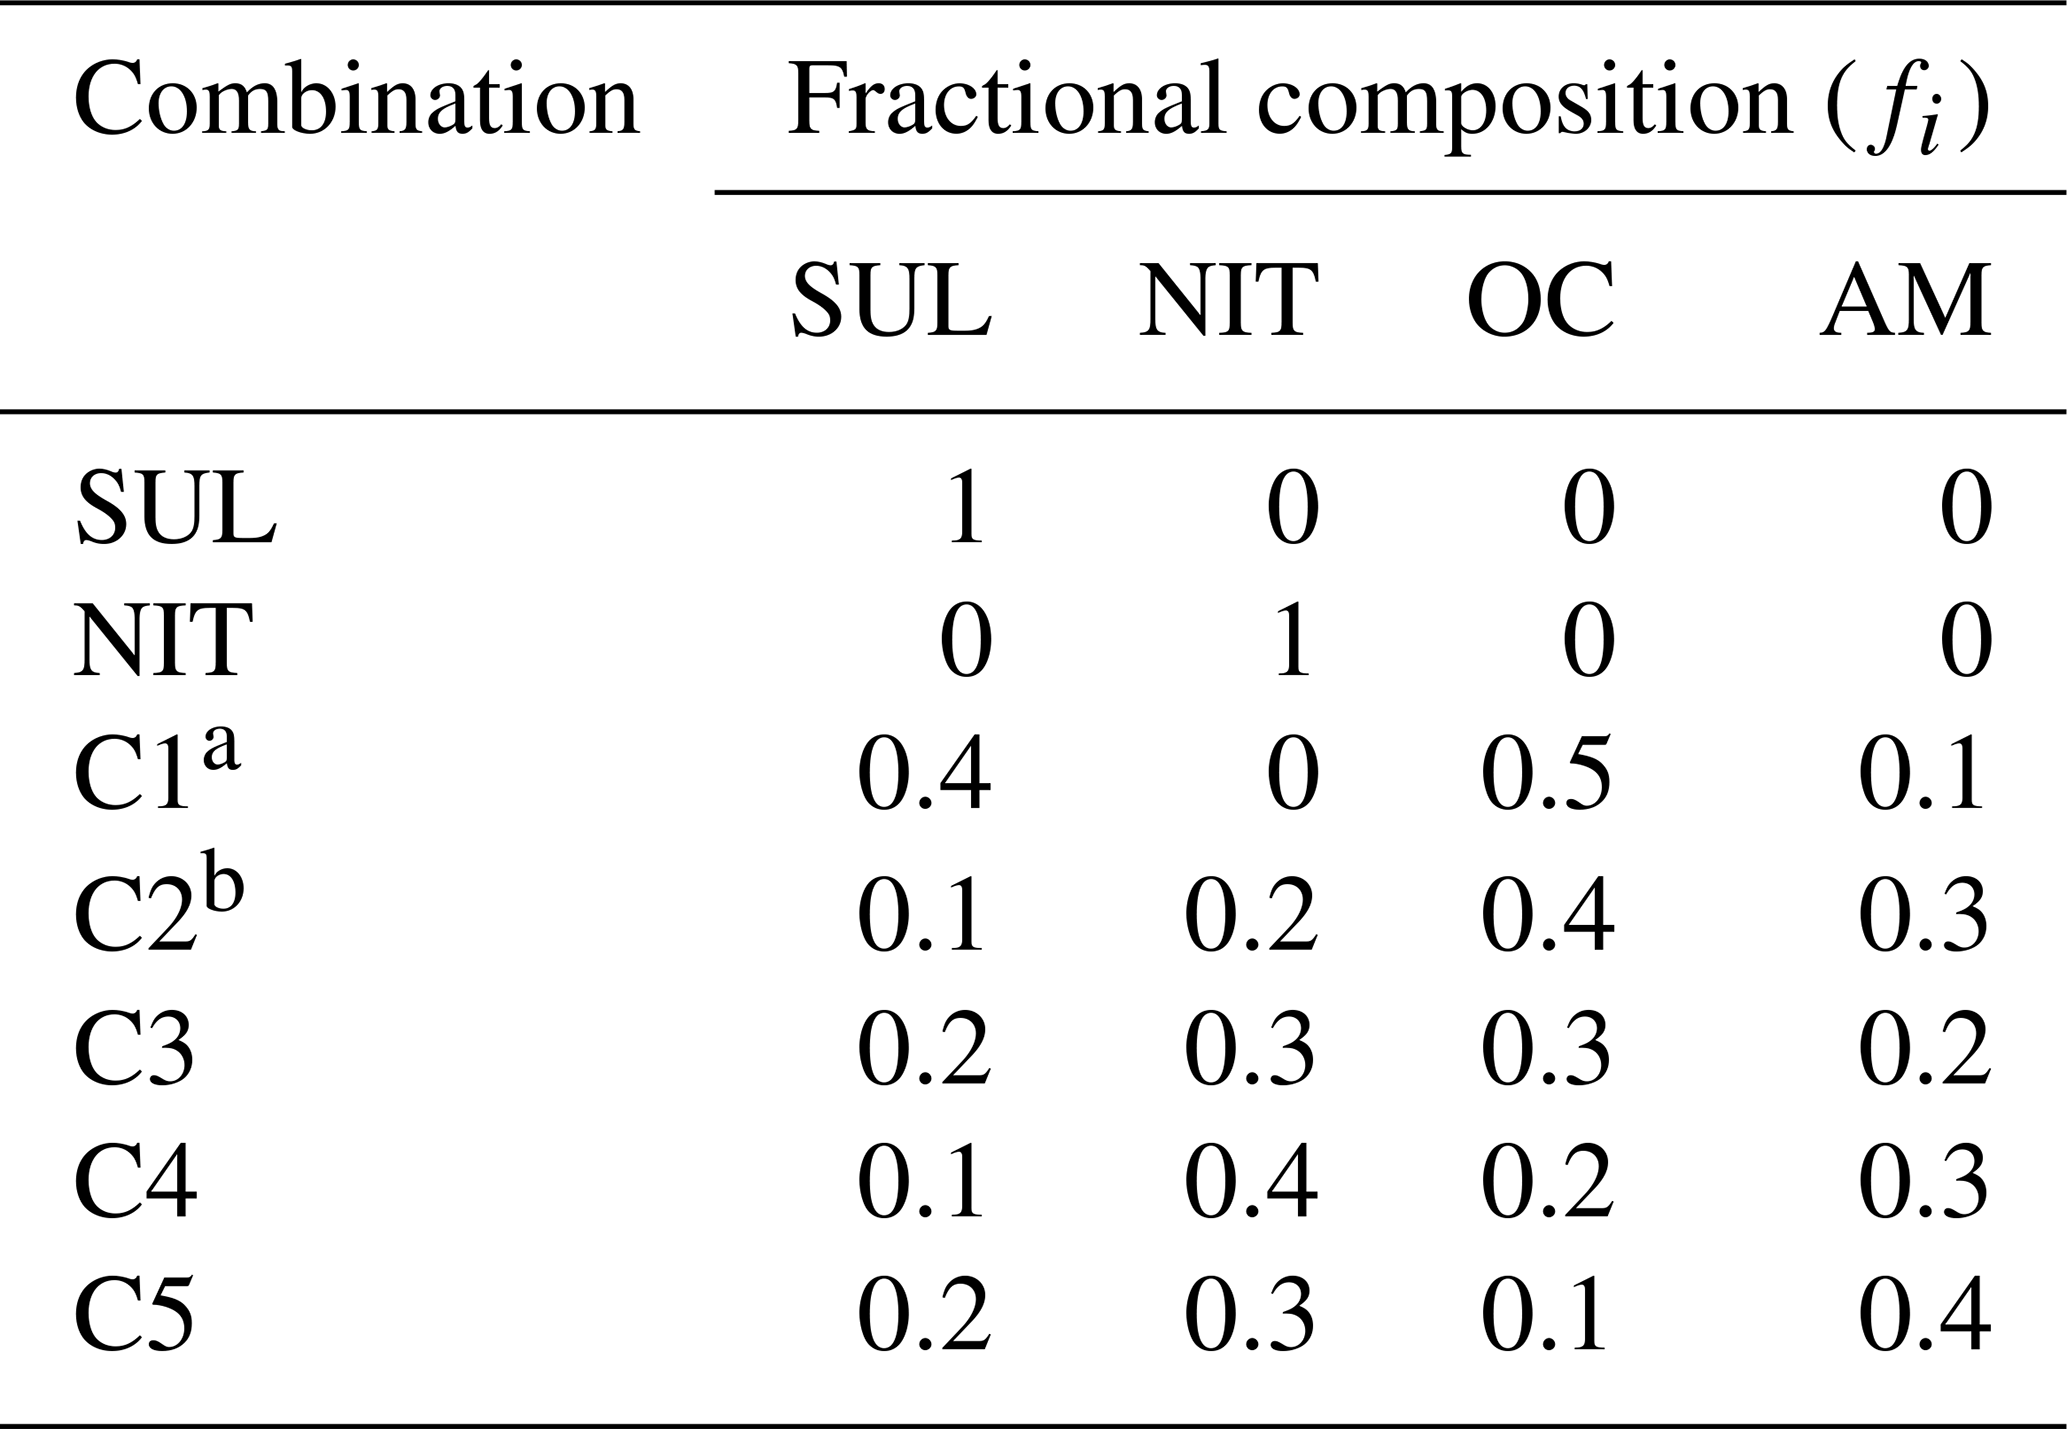
a This combination is adapted from Bossolasco et al. (2021). b This combination is adapted from Appel et al. (2022).
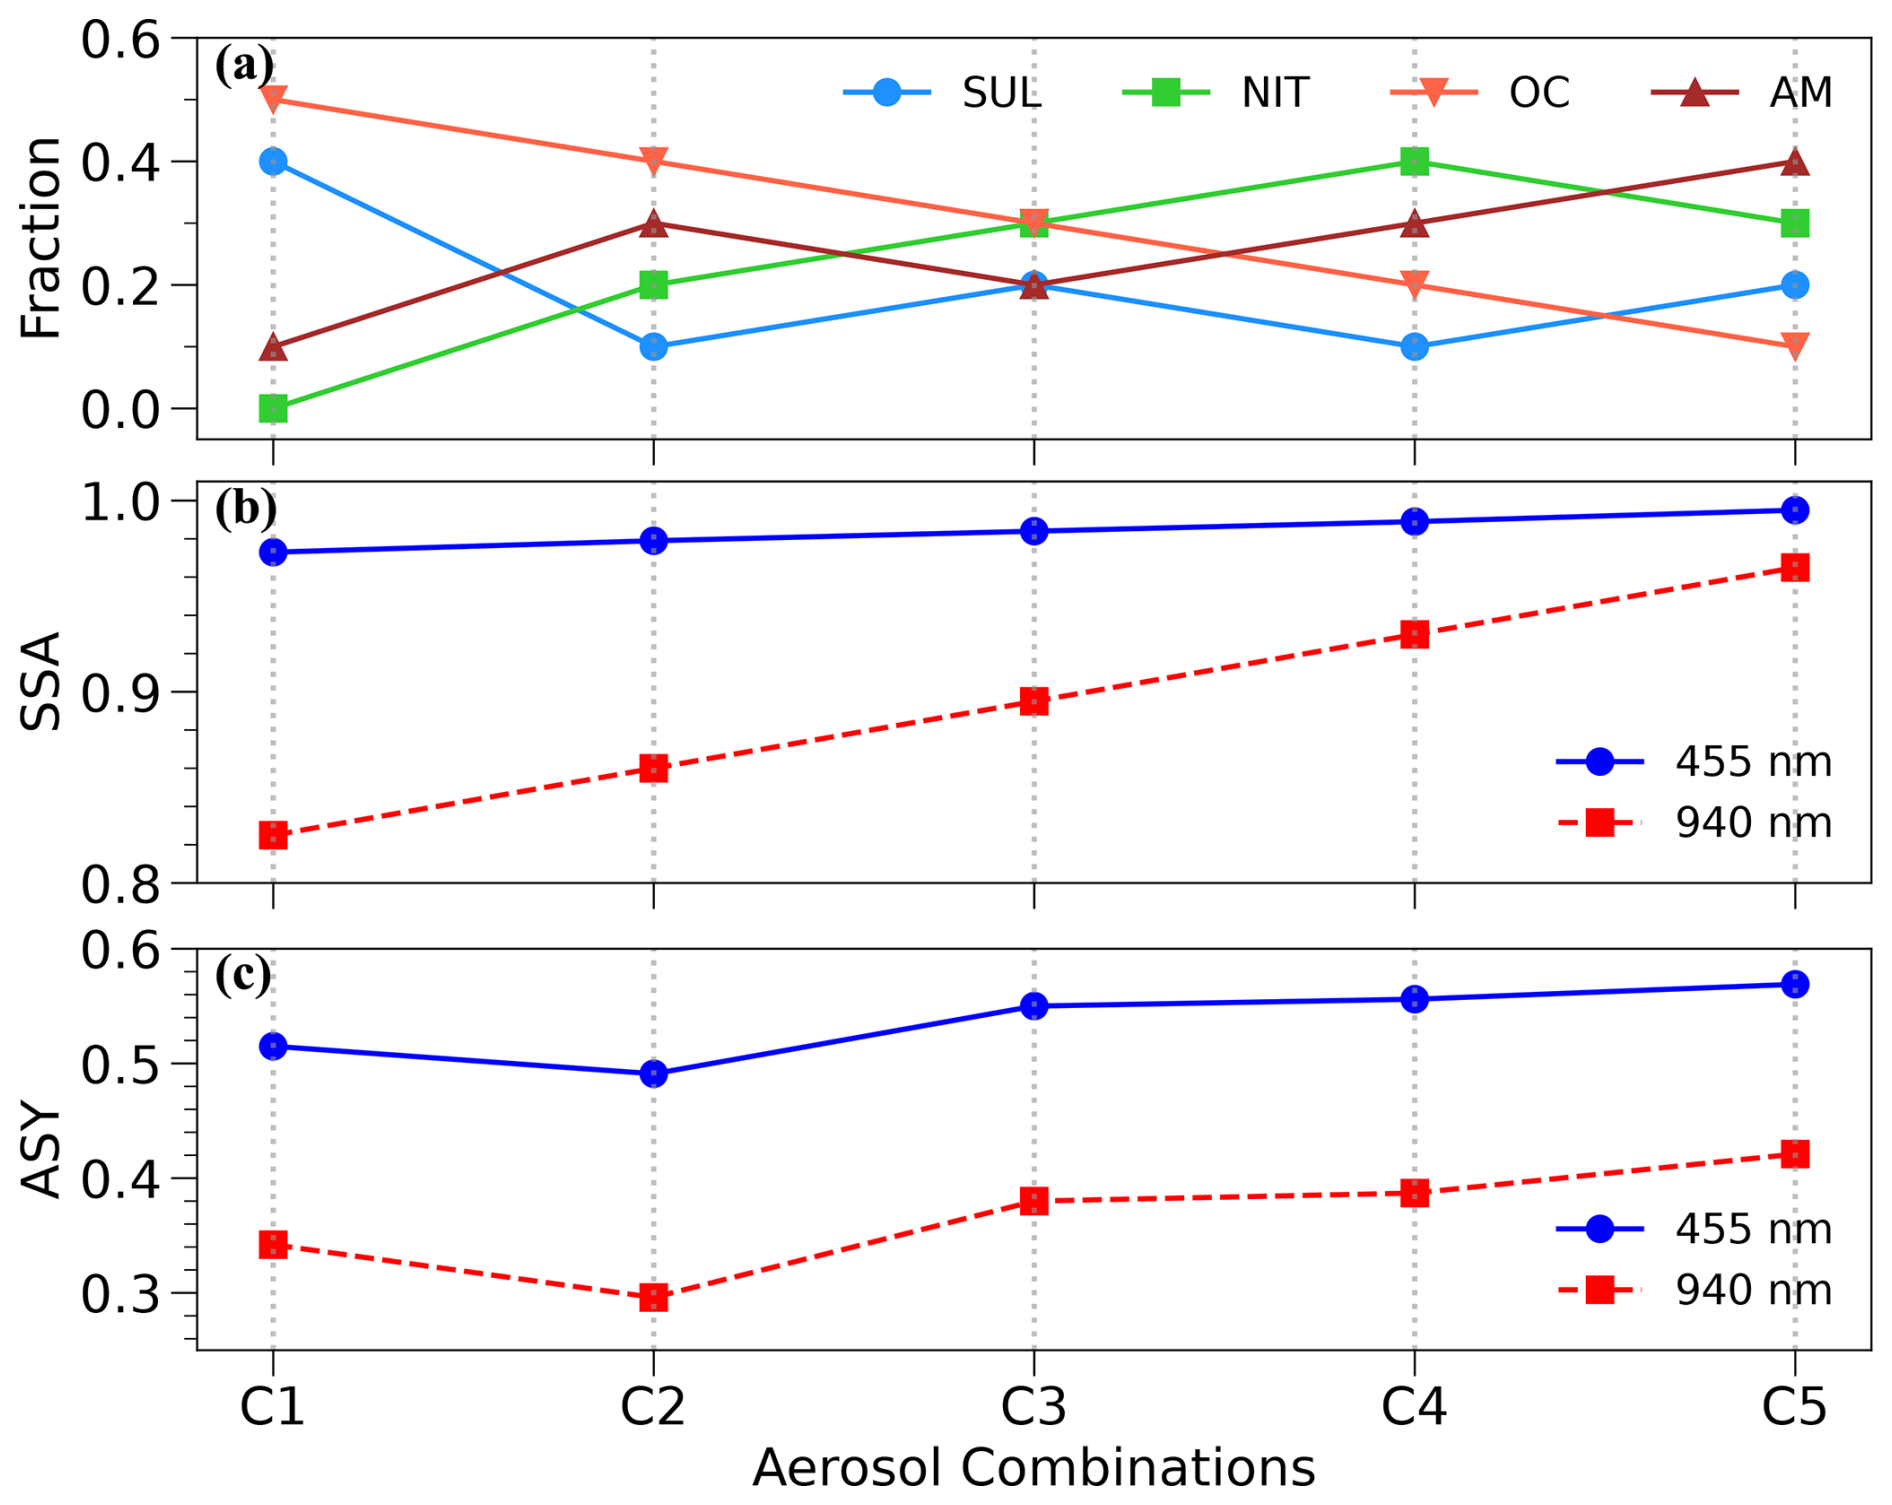
Figure 3(a) Fractional contribution of aerosol species – sulfate (SUL), nitrate (NIT), organic carbon (OC), and ammonium (AM) – in the aerosol mixing combinations (C1 to C5) considered in this study. (b) Single-scattering albedo (SSA) and (c) asymmetry parameter (ASY) corresponding to each combination under dry conditions.
The SSA and ASY of each aerosol species were derived from their size distribution parameters and complex refractive indices under dry conditions (Table S2) using the Mie scattering theory, assuming that all the aerosol species follow the log-normal size distribution. If fi is the fraction of an individual aerosol species in a given combination, then SSA and ASY of the combination are obtained using the following equations:
where SSAi and ASYi denote the single-scattering albedo and asymmetry parameter of respective aerosol species at a given wavelength λ. These derived SSA and ASY for each aerosol combination at 455 and 940 nm are illustrated in Fig. 3.
Among the compositions, the OC-dominant scenario (C1) exhibits the lowest SSA, indicating higher absorption, while SSA increases with decreasing OC fractions and increasing fractions of nitrates and ammonium (C2–C5). Sulfates and nitrates have SSA=1 at both wavelengths (445 and 940 nm), with slight ASY differences (e.g., ASYSUL = 0.724 and ASYNIT = 0.718 at 445 nm; ASYSUL = 0.679 and ASYNIT = 0.549 at 940 nm). These SSA and ASY values were applied to altitude bins in the 10 to 20 km range.
In the lower atmosphere (below 10 km), aerosol composition/typing was characterized using 7 d air mass back-trajectories at 500 m (boundary layer) and 4000 m (free troposphere) above mean sea level, generated using the Hybrid Single-Particle Lagrangian Integrated Trajectory (HYSPLIT) model (Stein et al., 2015). Trajectories were clustered based on spatial similarity using hierarchical clustering and the total spatial variance (TSV) method, optimizing the number of clusters where further TSV reduction provides minimal improvement. This approach identifies distinct transport pathways shaped by synoptic-scale meteorology, allowing the classification of aerosol types based on air mass origin, transport history, and residence time over source regions. A similar approach was used by Pawar et al. (2015) in Pune to identify aerosol types through back-trajectory analysis. After categorizing the air mass clusters based on potential aerosol types from the Optical Properties of Aerosols and Clouds (OPAC) database (Hess et al., 1998; Table S3), the corresponding wavelength and RH-dependent aerosol scattering properties (SSA and ASY) were obtained. A detailed description of this method is provided in Sect. S2 along with the identified aerosol types through back-trajectory clusters at the three locations for the two altitude levels (Fig. S4). Since marine aerosols typically have a low scale height (< 2 km), their influence was considered only within the boundary layer. Additionally, air masses of oceanic origin that remained over land for more than 24 h before arrival were reclassified as continental aerosols.
4.4 Radiative transfer calculations
The radiative forcing due to aerosols at a given level of the atmosphere is the difference between the radiative fluxes under aerosol-laden and no-aerosol (and without clouds) conditions. For a given layer in the atmospheric column with its vertical thickness Δz (in km), this radiative forcing (RF; in W m−2) at its top and bottom levels is mathematically expressed as
Here, and represent the downward and upward radiative fluxes in aerosol-laden conditions, while and denote the corresponding fluxes under no-aerosol (and without clouds) conditions.
The aerosol radiative forcing (ARF) of this atmospheric layer is the difference between the RF at its top and bottom levels, which quantifies the amount of energy trapped within the layer and represents the atmospheric absorption due to aerosols (Gadhavi and Jayaraman, 2006). Mathematically,
The rate at which the atmosphere heats up due to aerosols (referred to as HR, in K d−1) for a given layer can be determined using the following equation (Liou, 2002):
In this equation, g represents the acceleration due to gravity and Cp denotes the isobaric specific heat capacity of dry air (∼ 1006 ). ΔP signifies the pressure difference between the top and bottom boundaries of the atmospheric layer, ρ indicates the density of the air (in kg m−3), and represents the radiative power absorbed or emitted by the medium per-unit volume of the atmosphere (in W m−3). Since the atmosphere consists of several vertically heterogeneous layers, repeating the above calculation for each layer yields the profile of the heating rate.
For estimating the radiative forcing and heating rates associated with UTLS aerosols, the aerosol profiles (extinction coefficient, SSA, and ASY) and the atmospheric profiles (pressure, temperature, water vapor density, and ozone density) are provided as input into the Santa Barbara Discrete Ordinate Radiative Transfer (DISORT) Atmospheric Radiative Transfer (SBDART) model (Ricchiazzi et al. 1998). This computational tool calculates plane-parallel radiative transfer in various atmospheric and surface conditions, including clear and cloudy scenarios. The DISORT module, which employs a numerically stable algorithm, is used to solve the equations of plane-parallel radiative transfer in vertically inhomogeneous atmospheres (Stamnes et al., 1988). The accuracy of the SBDART model is estimated to be within a few percent for clear-sky conditions.
The calculations are performed in the shortwave (SW) region (0.25–4 µm) with a spectral resolution of 0.005 µm and eight radiation streams at 1 h intervals for a range of solar zenith angles to obtain a 24 h average. Shortwave ARF is computed for the atmospheric column (extending from the surface at 0 up to 30 km) and specifically for the UTLS region (12–20 km). Additionally, heating rate profiles are derived for the UTLS layer across all seven previously discussed aerosol scenarios.
5.1 Spatial variability in ATAL aerosols in the UTLS region
Figure 4 presents the mean cloud-screened backscatter ratio at 455 nm (BSR455) for the UTLS region over the study locations. The approximate vertical extent of the ATAL region is adapted from Akhil Raj et al. (2022), where its boundaries are determined based on dynamic constraints. The lower boundary corresponds to the convective outflow level, identified as the altitude where the potential temperature gradient reaches a minimum below the cold-point tropopause (CPT) after applying a nine-point running mean. The upper boundary is defined by the altitude of maximum stability (LmaxS), derived from the squared Brunt–Väisälä frequency (N2). Their analysis indicates that LmaxS is located 1–2.7 km above the CPT, corresponding to a potential temperature of approximately 442.11 ± 25.64 K (454.39 ± 13.89 K) over the Indian region, roughly 19 km above the Earth's surface. The convective outflow level, on the other hand, is observed at ∼ 13 km across all locations. Based on these criteria, we define the ATAL region's approximate vertical extent between 13 to 19 km, corresponding to a potential temperature range of 350 to 440 K.
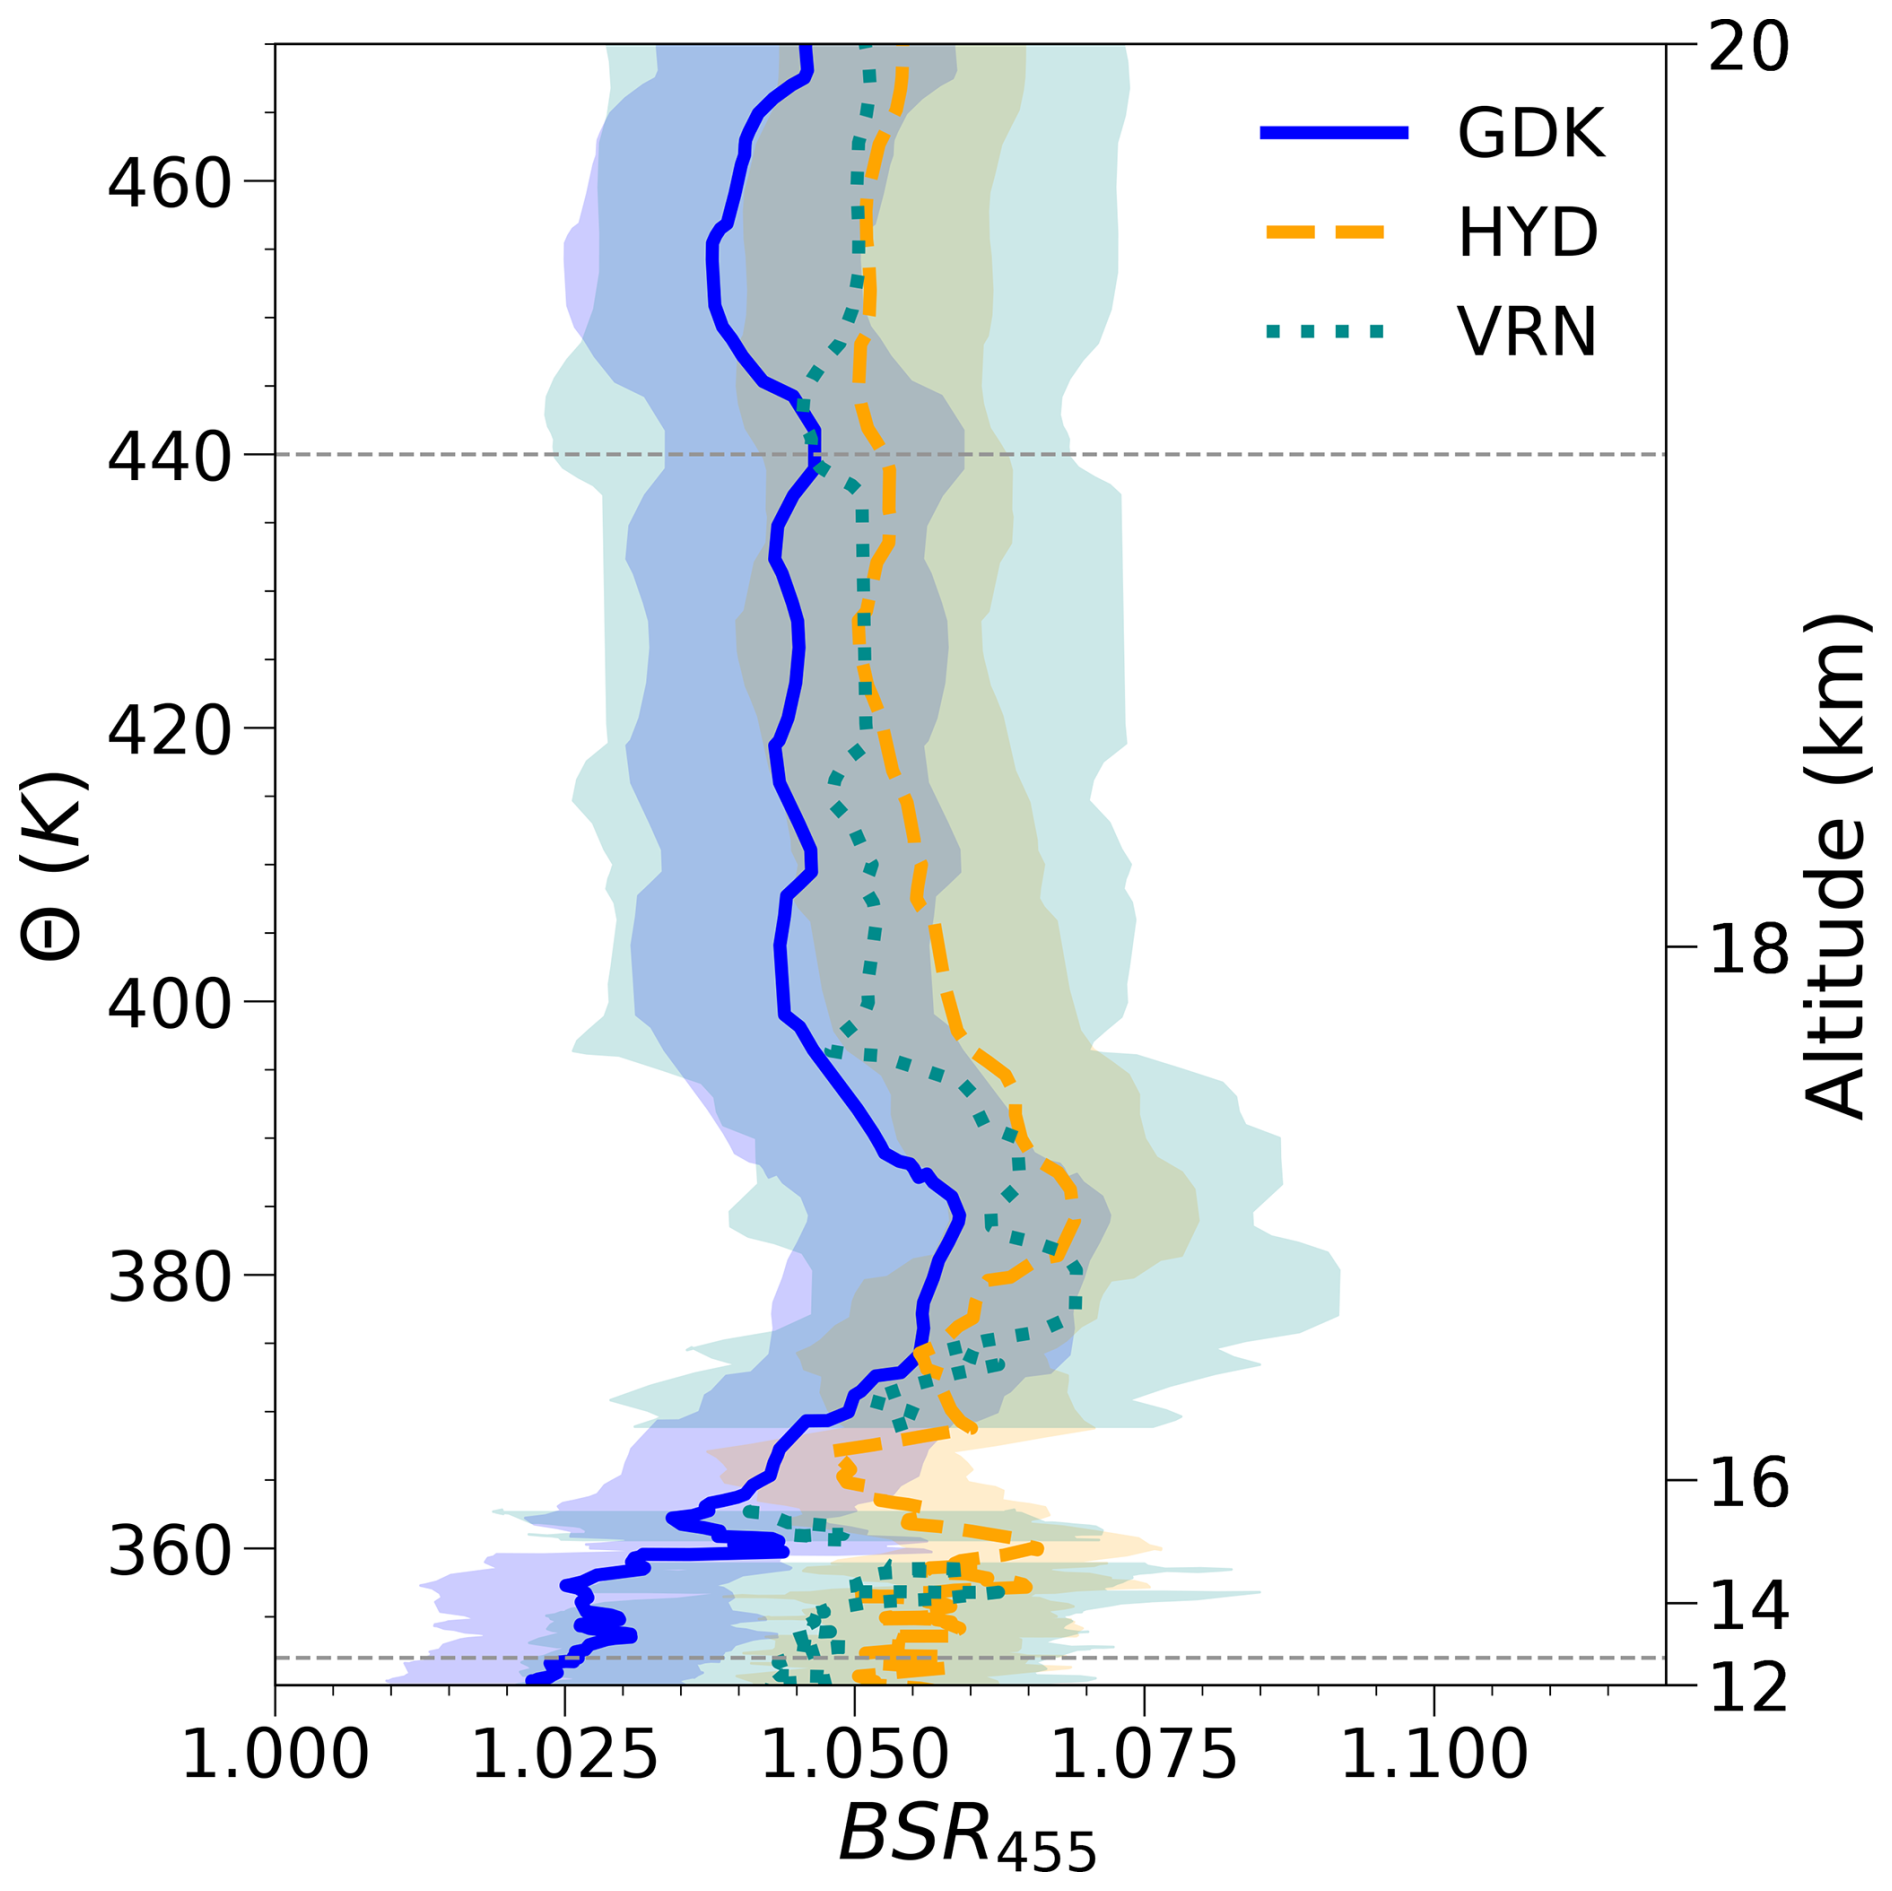
Figure 4Mean cloud-screened backscatter ratios at 455 nm plotted against potential temperature (Θ) on the primary y axis and altitude on the secondary y axis over Gadanki (GDK), Hyderabad (HYD), and Varanasi (VRN). The dashed lines at 13 and 19 km indicate the approximate vertical extent of ATAL aerosols (see text for details).
A consistent increase in aerosols is observed in the 16–18 km altitude range (365–400 K potential temperature) across all study locations. The highest BSR455 values are recorded over Varanasi and Hyderabad (∼ 1.07), followed by Gadanki (∼ 1.06), with site-specific variations in backscatter profiles. These findings align with previous ATAL aerosol observations reported by Akhil Raj et al. (2022). The maximum BSR455 value (1.07 over Varanasi) is comparable to that observed over Nainital (29.35° N, 79.46° E) in August 2016 (Hanumanthu et al., 2020). For reference, CALIPSO-derived BSR532 values for ATAL have been reported to range between 1.10 and 1.15, with an associated depolarization ratio of < 5 % (Vernier et al., 2011), further supporting the presence of submicron aerosols in this region.
Despite the observed enhancements, no clear monotonic trend in aerosol concentration emerges across the study locations, which are positioned at different geographical points relative to the ATAL core: Gadanki (southern periphery), Hyderabad (transition region), and Varanasi (central ATAL region). However, the slightly lower aerosol BSR at Gadanki suggests a weaker ATAL influence at the outermost edge. Further validation through extensive in situ and satellite-based observations is necessary to confirm these spatial trends and understand the seasonal and inter-annual variability in ATAL aerosols.
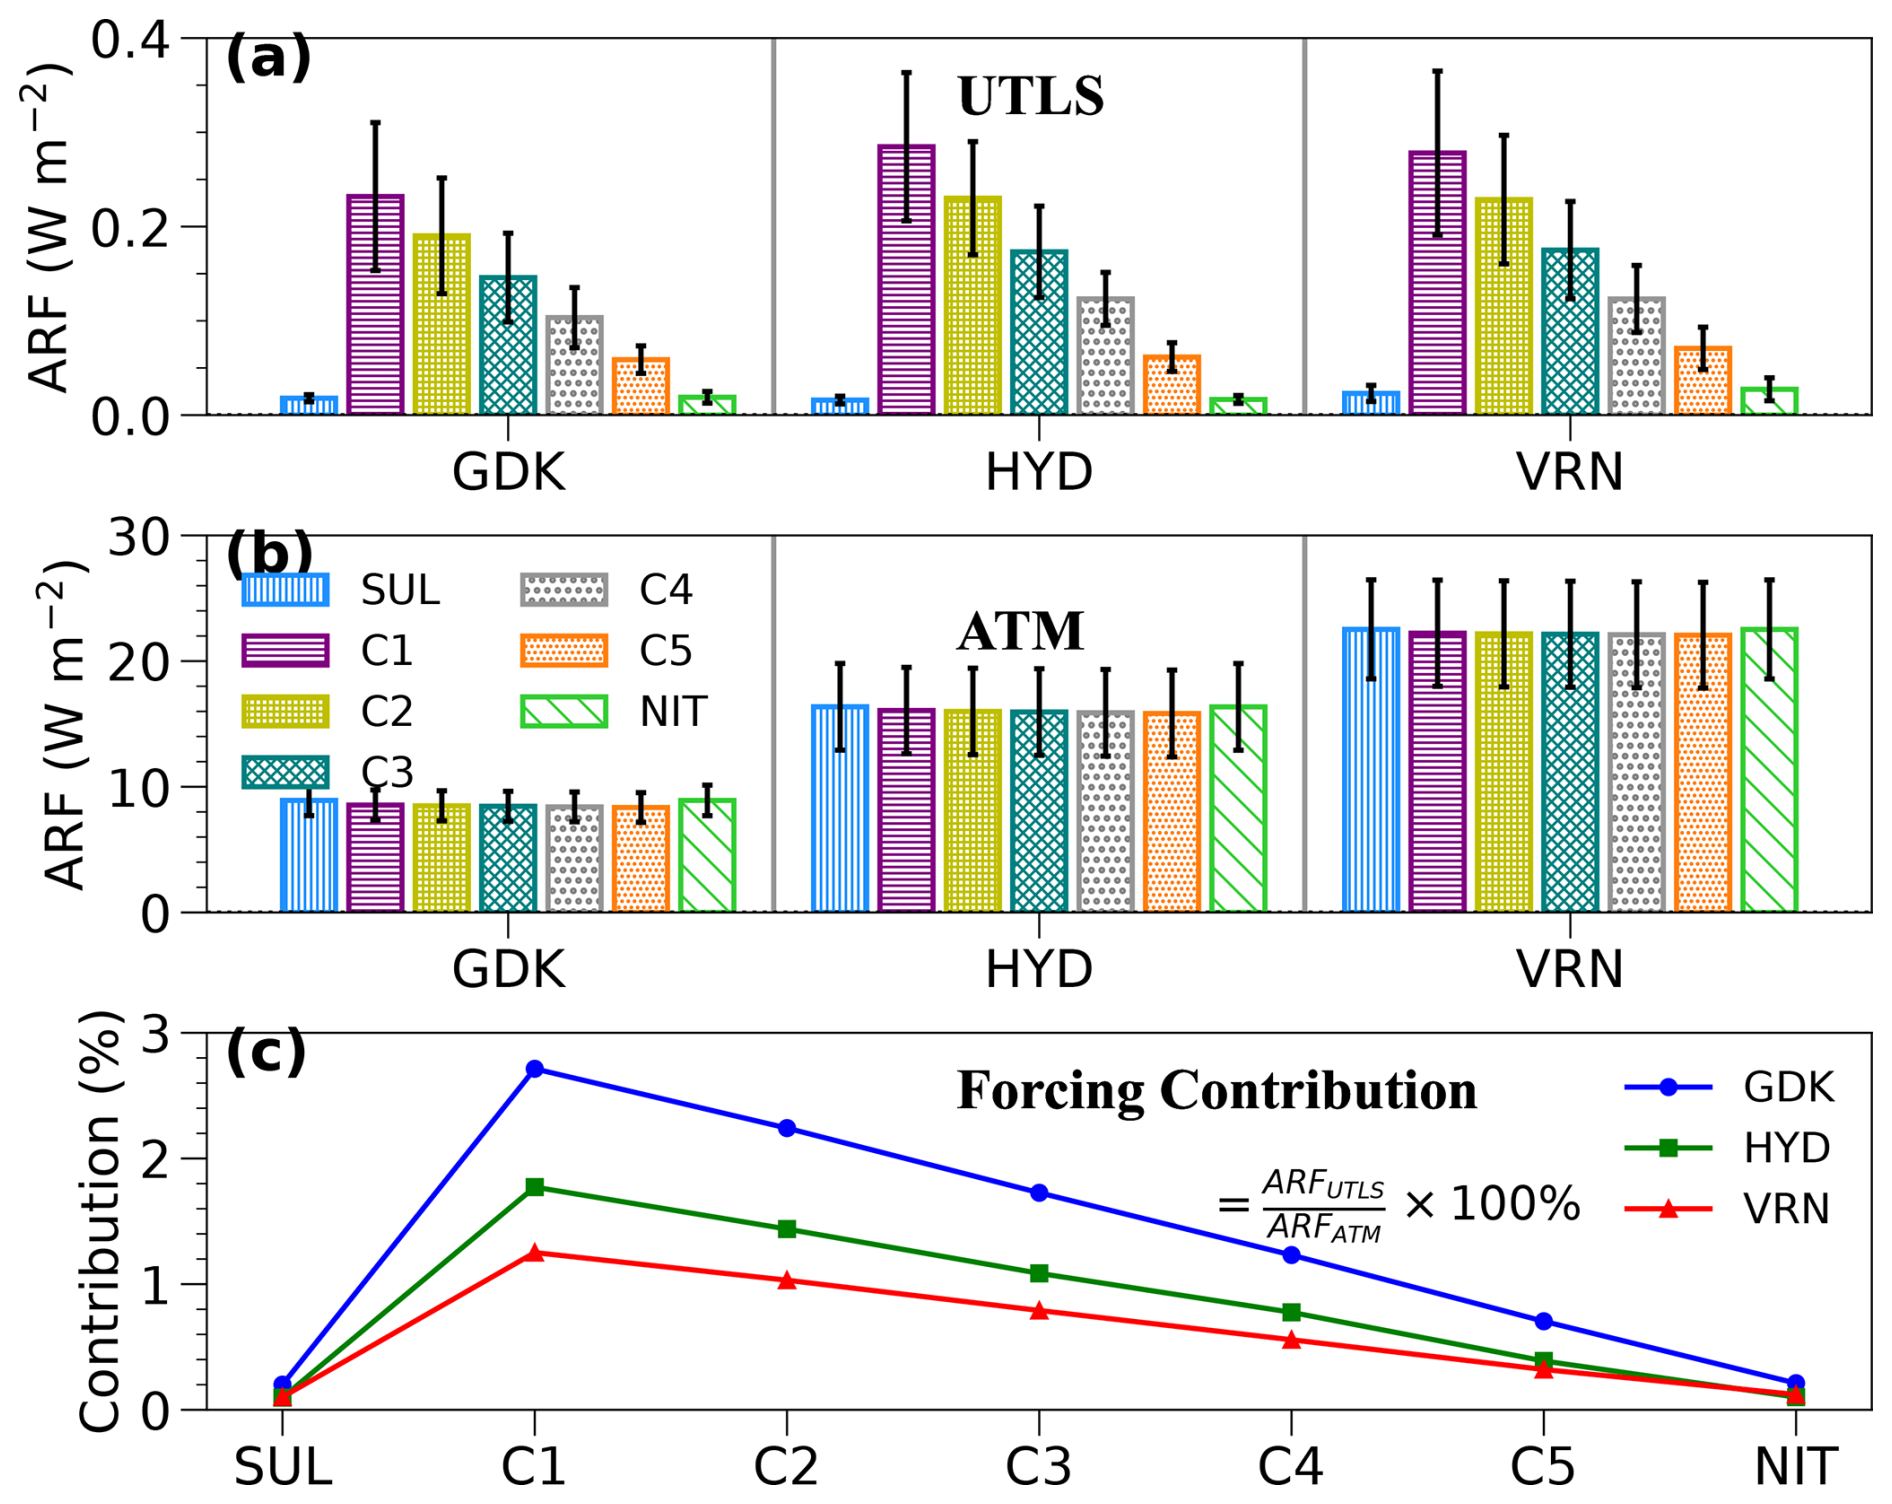
Figure 5Aerosol radiative forcing (ARF) for different aerosol scenarios in the UTLS region over Gadanki (GDK), Hyderabad (HYD), and Varanasi (VRN) during the study period: (a) ARF in the UTLS region, (b) ARF in the total atmospheric column from the surface to 30 km, and (c) percent fractional contribution of UTLS forcing to the total atmospheric forcing.
5.2 Impact of UTLS aerosol composition on radiative forcing and its contribution to the atmospheric column
Figure 5a illustrates the ARF in the UTLS region, which exhibits a net positive forcing (warming) across all aerosol combinations. However, under sulfate (SUL)- and nitrate (NIT)-dominant scenarios, the warming effect is negligible (< 0.02 W m−2) across all locations. In contrast, mixed-aerosol scenarios (C1–C5) display a stronger UTLS forcing, ranging from 0.06 to 0.23 W m−2 over Gadanki, 0.06 to 0.29 W m−2 over Hyderabad, and 0.07 to 0.29 W m−2 over Varanasi. Similar magnitudes are observed in Hyderabad and Varanasi, with slightly lower values over Gadanki, indicating a spatial variability in UTLS absorption. Among the mixed-aerosol scenarios, the OC-dominant case (C1) exhibits the highest UTLS absorption, whereas C5, where organic carbon (OC) contributes only 10 % and ammonium and nitrate dominate (70 %), shows the lowest absorption. The successive decrease in UTLS absorption from C1 to C5 highlights the role of absorbing aerosols in enhancing radiative warming in the UTLS. Considering the estimates using previously reported aerosol compositions (C1 from Bossolasco et al., 2021, and C2 from Appel et al., 2022), the UTLS forcing ranged from 0.19 to 0.29 W m−2 across different locations.
When considering the total aerosol radiative forcing (ARFATM), the highest values are observed over Varanasi (up to 22.5 W m−2), followed by Hyderabad (up to 16.4 W m−2) and Gadanki (up to 8.92 W m−2) (Fig. 5b). Since this forcing results from aerosols across multiple atmospheric layers, the UTLS contribution is quantified in terms of the percent fraction of the total ARF (Fig. 5c). The OC-dominant scenario (C1) exhibits the highest relative UTLS contribution (up to 2.7 %), with a decreasing trend as the OC fraction is reduced (C2–C5), consistent with the ARFUTLS variations discussed earlier. In SUL- and NIT-dominant cases, the UTLS contribution is minimal (0.1 %).
The variation in UTLS forcing contribution across study locations suggests differences in the overall aerosol distribution within the atmospheric column. Despite similar absolute UTLS forcing values, its relative contribution is highest over Gadanki, moderate over Hyderabad, and lowest over Varanasi. This pattern suggests that, over Varanasi, the dominant contribution to atmospheric absorption comes from aerosols in the lower atmosphere, likely driven by the presence of strongly absorbing aerosols in this location (Table S3). Conversely, at Gadanki, the lower atmosphere appears to be dominated by scattering aerosols, resulting in reduced absorption, which increases the relative importance of UTLS forcing. These findings underscore the significant impact of lower-atmospheric aerosol composition on the contribution of UTLS aerosols to total atmospheric forcing at various locations.
To quantify the influence of aerosol composition on radiative forcing in the UTLS, we examined the difference in radiative forcing (δARF) between various aerosol scenarios and an SUL-dominant reference case. The δARF was computed as
where x represents the mixed-aerosol compositions (C1 to C5) and NIT-dominant composition. The sign of δARFx indicates whether a given aerosol composition induces further warming or cooling in the UTLS and the atmospheric column relative to the sulfate baseline.
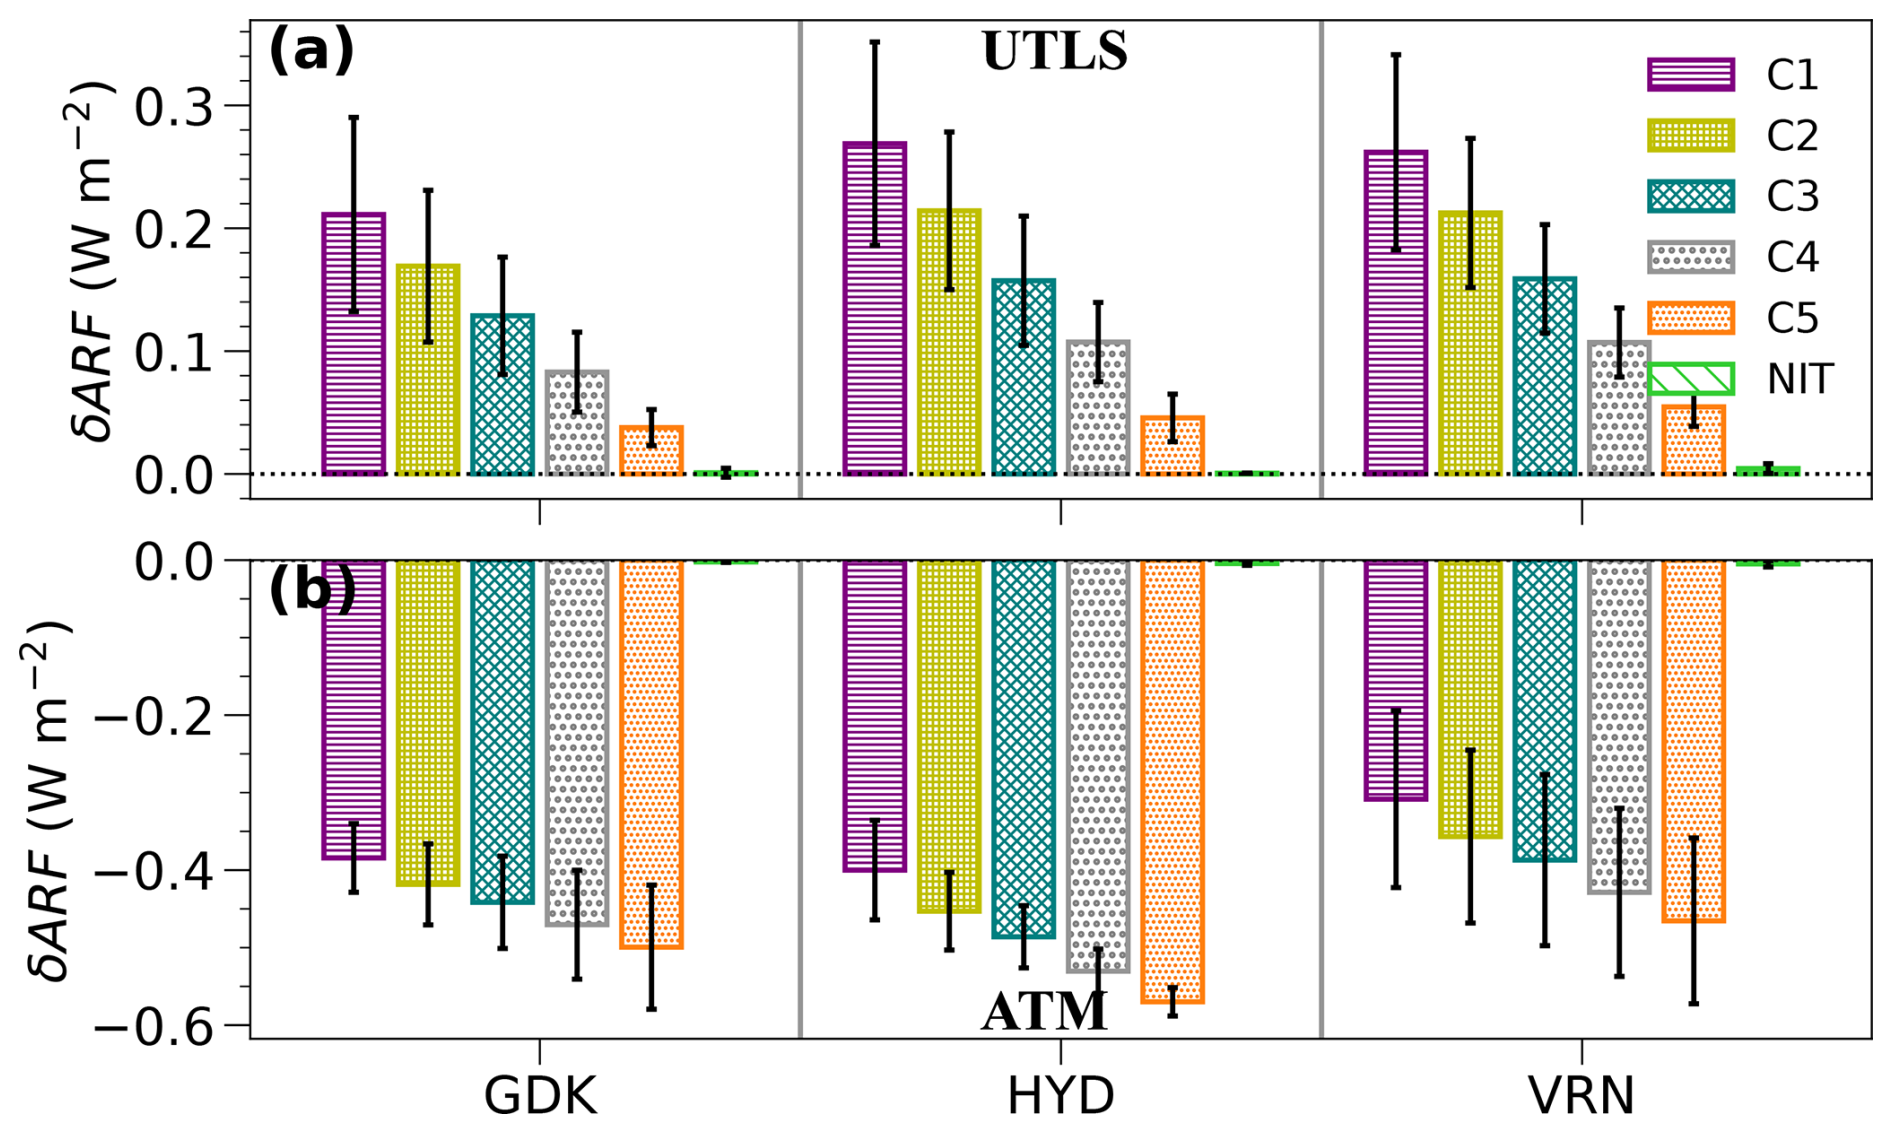
Figure 6Differences in aerosol radiative forcing (δARF) due to changes in aerosol composition within the UTLS region, with sulfate-forcing as the reference (δARFx = ARFx − ARFSUL, where x represents NIT and C1 to C5): (a) δARF in the UTLS region and (b) δARF for the entire atmospheric column.
In the UTLS, δARFx values are predominantly positive, suggesting that all tested aerosol compositions – except the nitrate-dominant (NIT) case – contribute to warming (Fig. 6a). The δARF for the NIT scenario remains close to zero across all locations, implying minimal radiative influence from nitrate aerosols in the UTLS. The magnitude of δARFx varies significantly, ranging from 0.06 to 0.28 W m−2 (an increase of 300 %–1400 %) over Varanasi, 0.05 to 0.27 W m−2 (250 %–1300 %) over Hyderabad, and 0.03 to 0.2 W m−2 (150 %–1000 %) over Gadanki. These large variations highlight the strong sensitivity of UTLS radiative forcing to aerosol composition, where even small changes in aerosol properties result in disproportionately large changes in forcing.
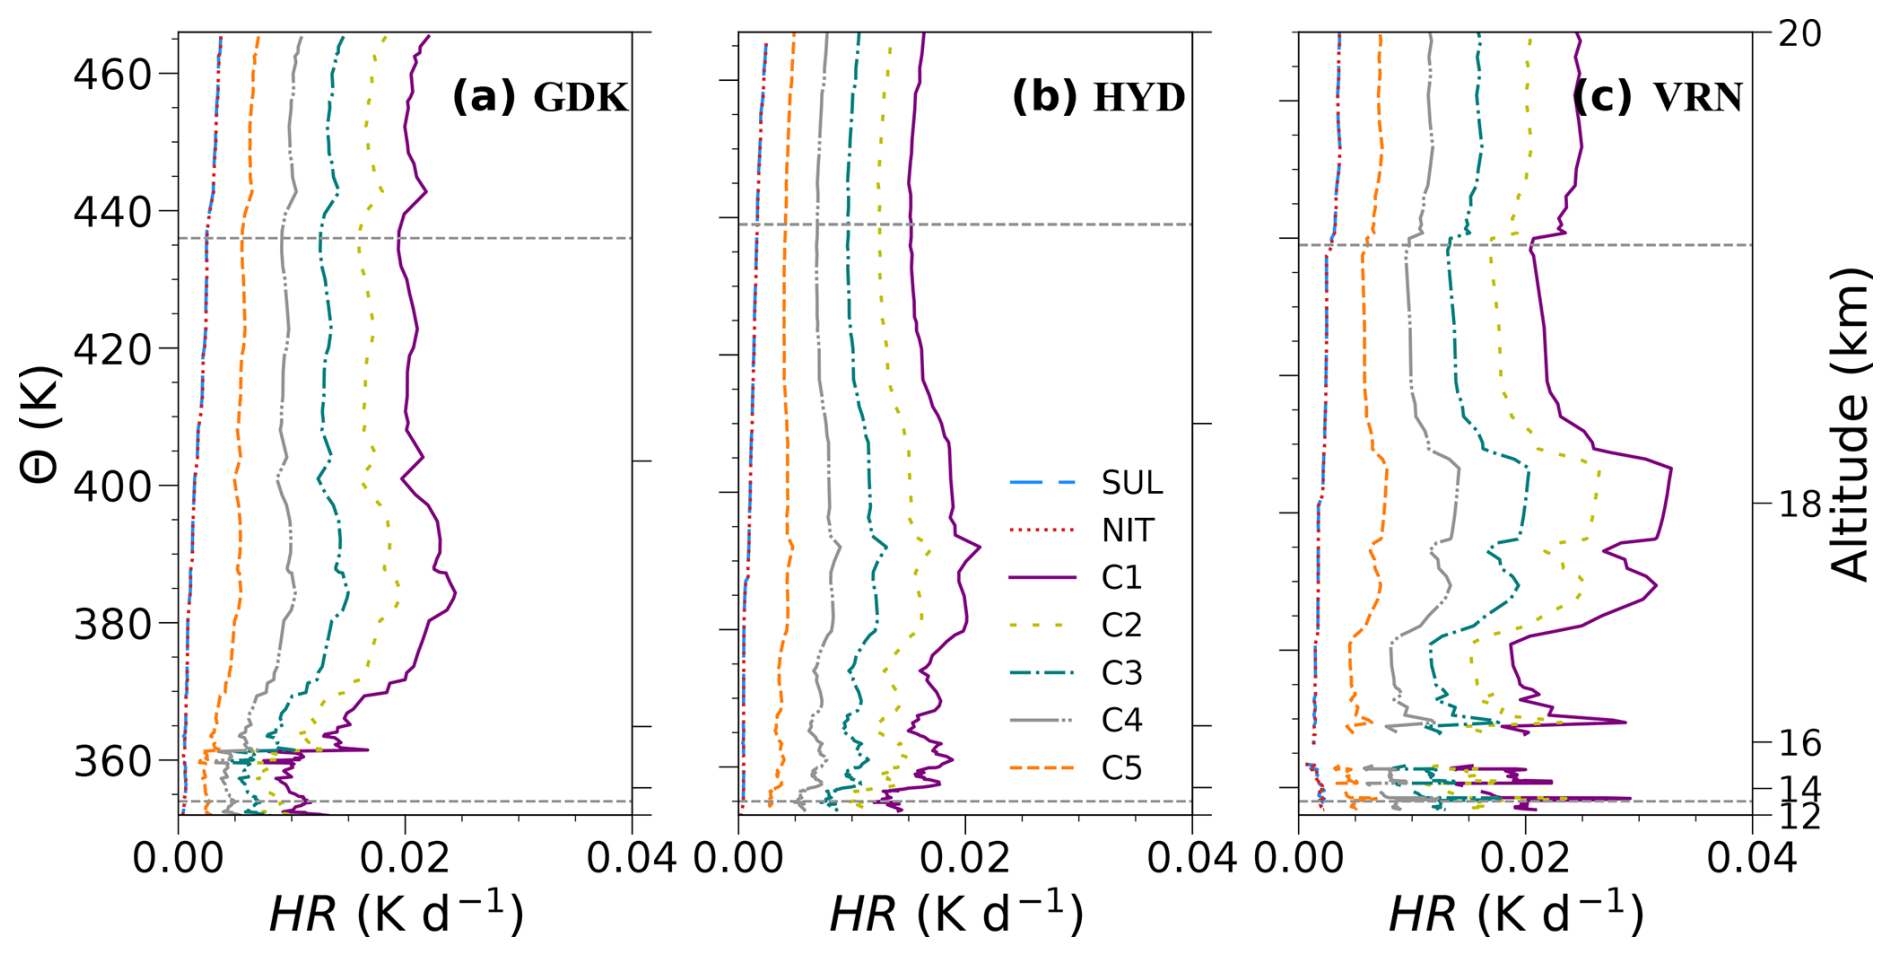
Figure 7Aerosol heating rates in the UTLS plotted against potential temperature (Θ) and altitude over (a) Gadanki, (b) Hyderabad, and (c) Varanasi. The dashed gray lines at 13 and 19 km indicate the approximate vertical extent of ATAL.
Among the mixed compositions (C1–C5), the largest δARFx occurs in the OC-dominant scenario (C1) (Bossolasco et al., 2021), highlighting the strong absorptive nature of organic carbon in the UTLS. A progressive reduction in δARF is observed with decreasing OC fraction and increasing nitrate and ammonium content (C2 to C5), indicating that absorbing aerosols, such as OC, substantially modify the UTLS radiative forcing. In the atmospheric column, δARFATM values are negative, indicating that changes in UTLS aerosol composition led to a decrease in atmospheric forcing (Fig. 6b). The magnitudes of δARFATM reach approximately −0.5 W m−2 (5 %) over Gadanki, −0.6 W m−2 (4 %) over Hyderabad, and −0.5 W m−2 (2.3 %) over Varanasi. This suggests that, while UTLS aerosol composition significantly alters radiative forcing at high altitudes, the net effect on the entire atmospheric column remains relatively modest.
5.3 Influence of aerosol composition on heating rates in the UTLS
Shortwave heating rates associated with mixed-type aerosol compositions in the UTLS (C1 to C5) are significantly higher than those observed under SUL- and NIT-dominant scenarios (Fig. 7). Neither the SUL nor NIT cases exhibit distinct heating rate patterns at ATAL altitudes, with only slight warming observed, peaking at approximately 0.003 K d−1. This negligible difference between sulfate and nitrate aerosols can be attributed to their similar optical properties, as discussed in Santhosh et al. (2025). In contrast, enhanced heating rates are observed between 16–18 km (365–404 K potential temperature) over Gadanki, 14–16 km (357–366 K) over Hyderabad, and 16–18 km (367–403 K) over Varanasi for the mixed-aerosol scenarios (C1 to C5). The heating in the ATAL layer reaches a maximum of 0.03 K d−1, with Varanasi exhibiting notably higher heating rates than the other locations.
Consistent with the discussion on UTLS radiative forcing, the highest heating rates occur in the OC-dominant composition (C1). A progressive decline is observed as the OC fraction decreases, while ammonium and nitrate fractions increase (C2 to C5). These results highlight the warming effect of absorbing aerosols in the UTLS. Previous studies, such as Fadnavis et al. (2022), reported UTLS warming due to anthropogenic aerosols, with estimates ranging from 0.02 to 0.3 K per month, equivalent to an upper limit of ∼ 0.01 K d−1. Similarly, carbonaceous aerosols with strong absorption characteristics have been shown to increase UTLS heating by 0.001 to 0.02 K d−1 (Chavan et al., 2021).
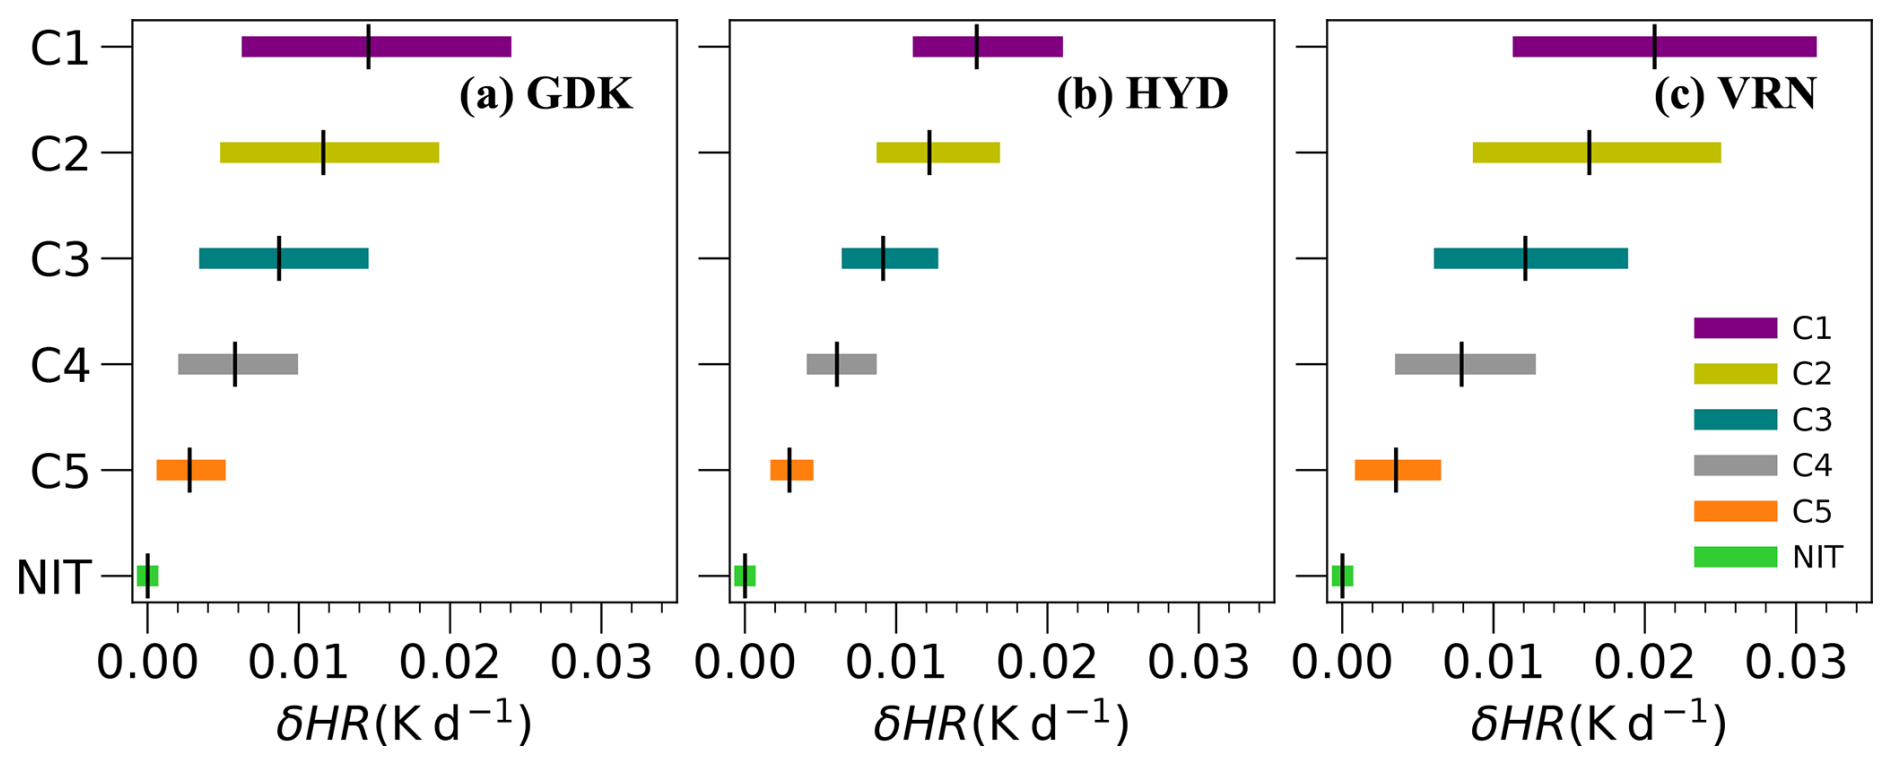
Figure 8Range of changes in aerosol heating rates due to different aerosol compositions relative to the sulfate-dominant scenario (δHR = HRx − HRSUL, where x represents compositions other than sulfates) over (a) Gadanki (GDK), (b) Hyderabad (HYD), and (c) Varanasi (VRN). Horizontal bars represent the minimum to maximum range of δHR, while small black vertical markers indicate the mean values.
To evaluate the sensitivity of heating rates to changes in aerosol composition within the ATAL region, we estimate the difference in heating rates (δHR) for the nitrate (NIT) and mixed-aerosol compositions (C1–C5) relative to the sulfate (SUL) reference scenario across 13–19 km as
where x represents aerosol compositions other than sulfates. The δHR values range from ∼ 0 to 0.03 K d−1 across the locations (Fig. 8).
A broader range of δHR is observed for compositions with a higher OC fraction, such as C1 (50 % OC) and C2 (40 % OC), leading to heating rate increases from 0.01 to 0.03 K d−1, which is approximately 10–30 times larger than the sulfate baseline. As the OC fraction decreases, the δHR range also diminishes, similar to the δARF trend discussed earlier. Due to the comparable heating rates of nitrate and sulfate aerosols in the UTLS, the δHR associated with the NIT scenario remains negligible. However, when nitrates constitute a significant portion of the mixed compositions (e.g., 30 % in C5 and 40 % in C4), along with ammonium aerosols (40 % in C5 and 30 % in C4), δHR values become non-negligible (∼ 0.001 to 0.01 K d−1), leading to a 10-fold increase in heating rates compared to the sulfate reference. These results confirm that variations in aerosol composition in the UTLS have a substantial impact on heating rates, further influencing radiative effects and atmospheric stability in this region.
5.4 Comparison of heating rates at point locations relative to spatially averaged estimates
Since this study focuses on heating rates at specific point locations, it is valuable to compare these estimates with those obtained for a broader spatial domain using a similar methodology. A recent study by Santhosh et al. (2025) examined radiative forcing and heating rates in the 12–20 km altitude range over a broader geographic region within the Asian Summer Monsoon Anticyclone (ASMA) (25–37.5° N, 40–95° E) using Cloud-Aerosol Lidar with Orthogonal Polarization (CALIOP) data. In that study, three dominant aerosol scenarios were considered in the UTLS: sulfate, nitrate, and anthropogenic aerosols. The sulfate and nitrate aerosols had microphysical properties similar to those in our study, while the anthropogenic aerosol model was based on the continental clean-aerosol model of Hess et al. (1998), representing a mixed-aerosol scenario.
To assess the representativeness of the point-location heating rates, we compare the sulfate- and nitrate-dominated cases from the present study with the corresponding heating rates reported by Santhosh et al. (2025). Although a direct comparison of mixed aerosols is more complex due to differences in aerosol definitions, we use the composition with the highest heating rates from this study (C1) as a reference for comparison against the anthropogenic heating rates reported by Santhosh et al. (2025).
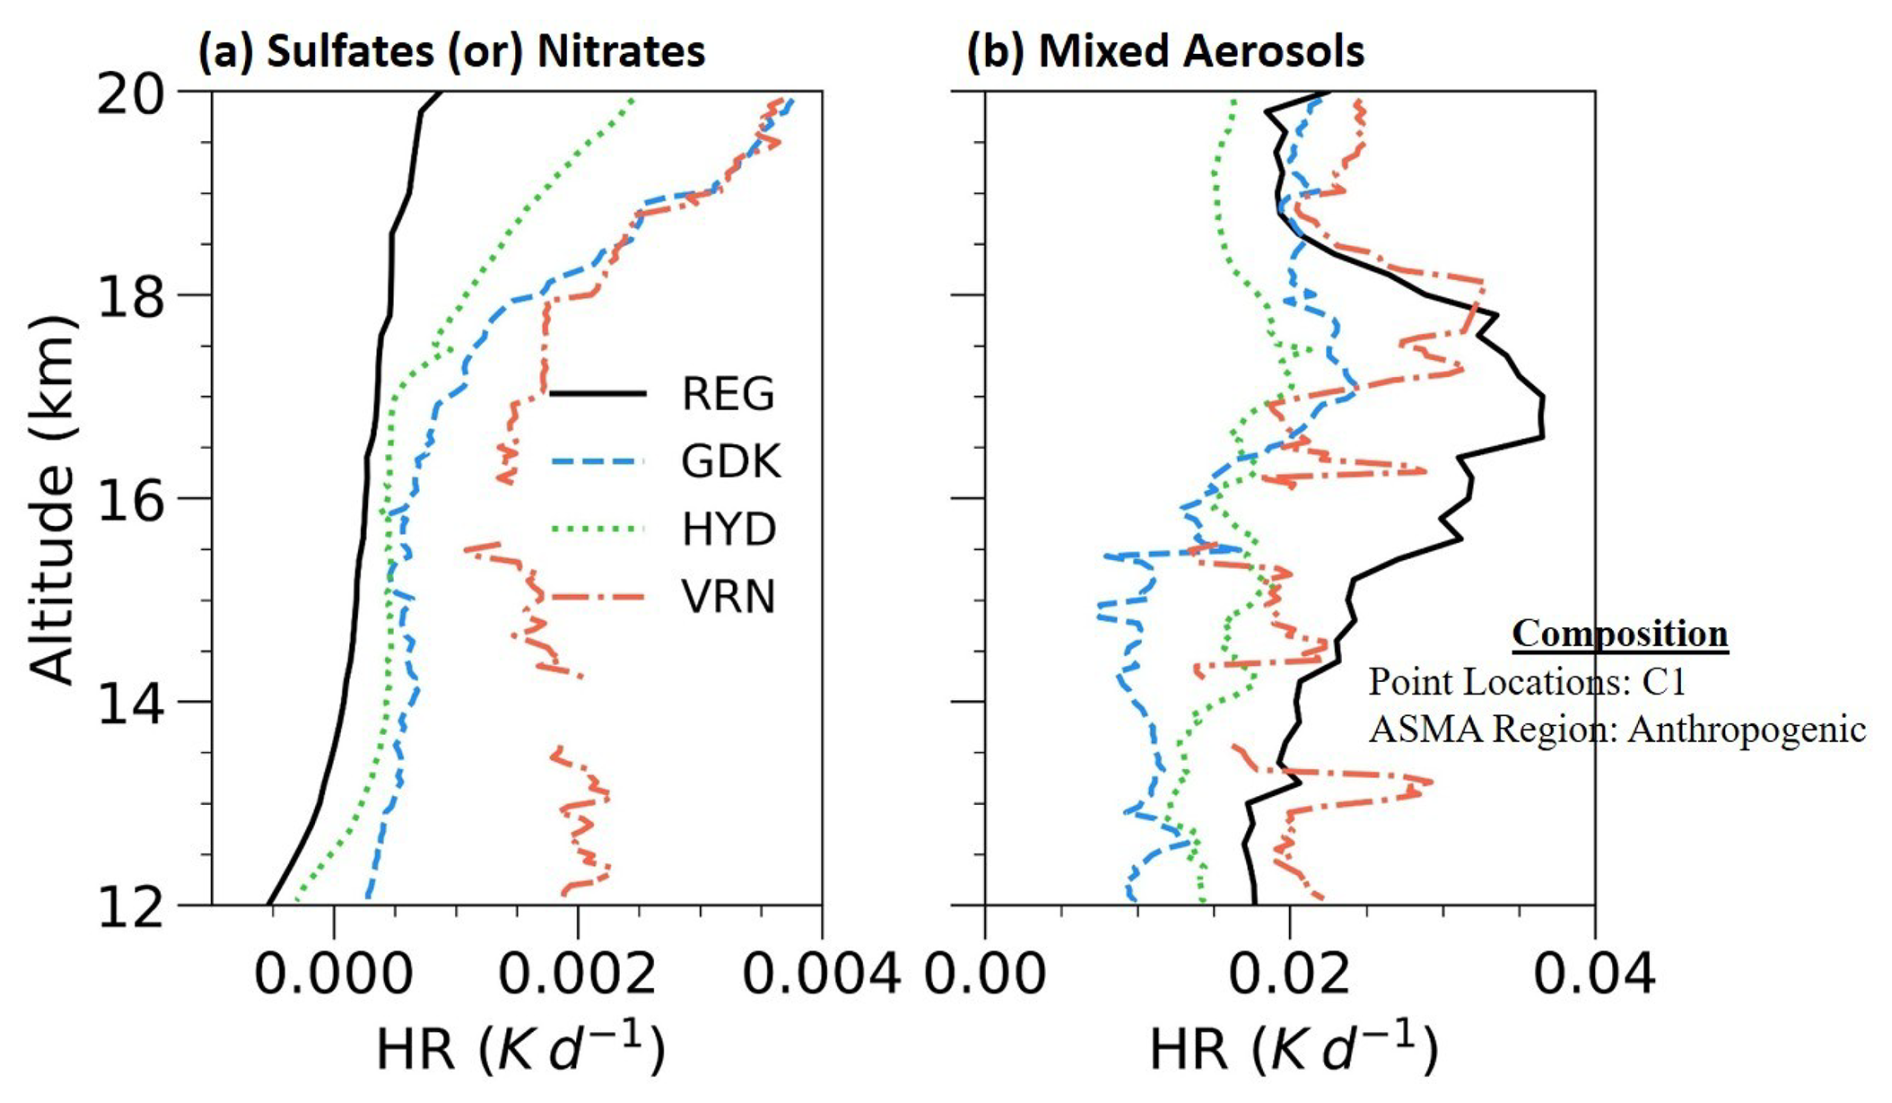
Figure 9Comparison of UTLS heating rates for (a) sulfate- or nitrate-dominant composition and (b) mixed-aerosol composition across the UTLS region (25–37.5° N, 40–95° E; adapted from Santhosh et al., 2025) and over Gadanki (GDK), Hyderabad (HYD), and Varanasi (VRN). In the mixed-aerosol scenario, the composition with the highest observed heating rates (C1) is compared with the anthropogenic composition in the UTLS region reported by Santhosh et al. (2025). As Santhosh et al. (2025) also observed a near-similar heating rate pattern for sulfates and nitrates, consistent with the present study, only heating rates with nitrates are plotted here.
Our analysis reveals that heating rates at individual locations (Gadanki, Hyderabad, and Varanasi) are slightly higher than the spatially averaged heating rates over the ASMA region under sulfate- and nitrate-dominant scenarios (Fig. 9). However, for the mixed-aerosol scenarios, the heating rates estimated over the ASMA region exceed those observed at individual point locations.
This discrepancy can be attributed to the interplay between aerosol optical properties and spatial averaging effects. Santhosh et al. (2025) assumed that the climatological mean and standard deviation profiles of aerosol backscatter ratios sufficiently capture the spatial heterogeneity of ATAL in radiative transfer calculations. Scattering aerosols, such as sulfates and nitrates, primarily reflect shortwave radiation and do not significantly contribute to global warming or atmospheric heating. When averaged over a large spatial domain, the weak radiative response of these aerosols is integrated across a broader region, leading to lower overall heating rates.
In contrast, the heating effects of absorbing aerosols within mixed-aerosol scenarios are less sensitive to spatial heterogeneity. Even small fractions of absorbing aerosols in the ATAL contribute to warming, and regional averaging enhances this consistent heating effect. This explains why the ASMA-wide mixed-aerosol heating rates exceed those at point locations. These findings suggest that the mixed-aerosol compositions considered in this study may lead to stronger warming in the UTLS over a broader spatial domain. Further investigations with realistic observational constraints and model validation are needed to better quantify these effects.
This study presents a detailed analysis of the shortwave radiative impacts of monsoon UTLS aerosols, focusing on radiative forcing and heating rates derived from balloon-borne in situ measurements conducted as part of the Balloon measurement campaigns of the Asian Tropopause Aerosol Layer (BATAL) between 2014 and 2018. To assess aerosol effects, we considered seven aerosol compositions dominated by different species: (i) sulfate (SUL), representing the background or reference condition; (ii) nitrate (NIT), a primarily scattering aerosol; and (iii) five mixed-type aerosol scenarios incorporating varying fractions of sulfates, nitrates, organic carbon, and ammonium aerosols. The key findings from this study, based on measurements at Gadanki, Hyderabad, and Varanasi, are summarized as follows:
- i.
Aerosol enhancement in ATAL altitudes. A significant enhancement in aerosol backscatter was observed in the 13–19 km altitude range across all locations, with BSR455 peaks reaching up to 1.07 over Varanasi and Hyderabad and 1.06 over Gadanki.
- ii.
UTLS radiative forcing and its contribution to total atmospheric forcing. A net positive aerosol forcing was observed in the UTLS region, contributing between 0.1 % and 3 % of the total atmospheric column forcing. Among the tested compositions, the scenario with 50 % organic carbon (C1) exhibited the highest contribution (1.25 %–3 %), whereas nitrate- and sulfate-dominated scenarios contributed significantly less (0.1 %–0.2 %). The highest UTLS forcing estimates were recorded over Varanasi and Hyderabad (∼ 0.3 W m−2), followed by Gadanki (0.23 W m−2). Under sulfate- and nitrate-dominant conditions, forcing remained nearly uniform across locations, with values not exceeding 0.02 W m−2. The UTLS forcing decreased with increasing fractions of nitrate and ammonium.
- iii.
Heating rates in the UTLS region. The heating rate profiles for mixed-aerosol compositions exhibited a notable increase in aerosol-induced heating at ATAL altitudes, with rates reaching up to 0.03 K d−1 across the study locations. However, heating rates for sulfate- and nitrate-dominant scenarios were approximately 1/10 of those observed under mixed-aerosol conditions, suggesting significantly weaker or negligible heating.
- iv.
Influence of the UTLS aerosol composition on the radiative forcing and heating rates. To quantify the impact of aerosol composition on radiative forcing, we used the sulfate-dominant scenario as a reference. While replacing sulfates with nitrates led to minimal changes in radiative forcing, the inclusion of organic carbon and ammonium in mixed-aerosol compositions resulted in disproportionate increases in UTLS radiative forcing (up to 14-fold). However, in terms of total column atmospheric forcing, these changes were relatively modest, with a maximum reduction of ∼ 5 %, underscoring the localized nature of UTLS radiative effects. Heating rate variations followed a similar pattern, with mixed-aerosol scenarios exhibiting up to a 30-fold increase compared to sulfate-dominated conditions.
- v.
Comparison with spatially averaged UTLS heating rates. When comparing our point-location heating rate estimates with spatially averaged heating rates over the ASMA region (Santhosh et al., 2025), we found that mixed absorbing and scattering aerosols produced a stronger regional warming effect, whereas purely scattering aerosols (e.g., sulfates, nitrates) had a weaker impact. This suggests that regional-scale radiative effects are more sensitive to variations in ATAL aerosol composition.
Although this study considered near-realistic aerosol compositions for the ATAL, the actual chemical composition of UTLS aerosols remains a challenge due to spatial and temporal variability (Hanumanthu et al., 2020). Observational datasets with altitude-resolved aerosol composition are essential for improving radiative impact assessments. Additionally, while dust and black carbon have been detected in the ATAL (Bossolasco et al., 2021; Ma et al., 2019), previous studies have shown that dust has minimal impact on clear-sky shortwave heating rates (Gao et al., 2023), and black carbon concentrations are modest in the ATAL, as indicated by recent in situ measurements (Appel et al., 2022; Vernier et al., 2022). Therefore, these species were excluded from our analysis.
A significant limitation of the study is its reliance on shortwave radiative effects, as nitrate and sulfate aerosols exhibit similar scattering properties across the shortwave spectrum. However, nitrates have distinct absorption features in the thermal infrared, which could influence longwave radiative forcing (Zhang et al., 2012). Future studies should incorporate improved measurements in the longwave and thermal infrared regions to assess the full radiative impact of nitrate aerosols. Additionally, given the sensitivity of UTLS radiative effects to water vapor concentrations (Santhosh et al., 2024a), further investigations are necessary to assess the coupled effects of aerosols and water vapor on the UTLS radiative balance.
Given the geographic and temporal limitations of in situ observations, an integrated approach combining satellite retrievals, reanalysis datasets, and in situ measurements is crucial for tracking long-term trends in ATAL radiative forcing and heating rates. Ongoing efforts in this direction are expected to refine our understanding of the effects of UTLS aerosols. One of the key questions that remains unexplored is whether the chemical composition of ATAL aerosol has any role in strengthening or weakening the monsoon anticyclone. By modulating radiative heating, aerosols can influence the temperature gradient and stability of the upper troposphere, potentially altering the strength and persistence of the anticyclonic circulation. Finally, the second phase of the BATAL, which commenced in August 2024, is anticipated to yield new insights into ATAL composition and radiative effects, particularly regarding the impact of wildfires and volcanic eruptions. These findings will be instrumental in refining the understanding of UTLS aerosol–radiation interactions.
The data collected from the BATAL are available on request.
The supplement related to this article is available online at https://doi.org/10.5194/acp-25-8255-2025-supplement.
VNS: data curation, formal analysis, investigation, software, validation, visualization, writing (original draft). BLM: conceptualization, investigation, methodology, supervision, writing (review and editing). STA: data curation, visualization, writing (review and editing). MVR: project administration, resources, writing (review and editing). JPV: project administration, resources, writing (review and editing). FGW: software, writing (review and editing).
The contact author has declared that none of the authors has any competing interests.
Publisher's note: Copernicus Publications remains neutral with regard to jurisdictional claims made in the text, published maps, institutional affiliations, or any other geographical representation in this paper. While Copernicus Publications makes every effort to include appropriate place names, the final responsibility lies with the authors.
This article is part of the special issue “Exploring impacts of troposphere–stratosphere coupling processes and challenges of forecasting extreme events in the Asian summer monsoon in a changing climate (ACP/WCD inter-journal SI)”. It is a result of the International Workshop on Stratosphere-Troposphere Interactions and Prediction of Monsoon weather EXtremes (STIPMEX), Pune, India, 2–7 June 2024.
The findings presented in this paper are derived from the ISRO–NASA joint BATAL, which was supported by the National Atmospheric Research Laboratory (NARL) under the Department of Space (DoS) and NASA ROSES Upper Atmospheric Research Program and Atmospheric Composition Modeling and Analysis Program (UARP, ACMAP, UACO). We acknowledge and extend our gratitude to Amit Kumar Pandit, National Institute of Aerospace, Hampton, USA, and other members from NARL Gadanki, TIFR Balloon Facility, Hyderabad, and BHU Varanasi for their active involvement in the BATAL project from Gadanki to Varanasi. We thank NASA's Earthdata team for providing free access to their MERRA-2, MODIS, MLS, and AIRS datasets, which were used as supportive data in this study. We also thank the Air Resources Laboratory (ARL) of the National Oceanic and Atmospheric Administration (NOAA) for their HYSPLIT software.
This paper was edited by Eduardo Landulfo and reviewed by two anonymous referees.
Akhil Raj, S. T., Venkat Ratnam, M., Narayana Rao, D., and Krishna Murthy, B. V.: Vertical distribution of ozone over a tropical station: Seasonal variation and comparison with satellite (MLS, SABER) and ERA-Interim products, Atmos. Environ., 116, 281–292, https://doi.org/10.1016/j.atmosenv.2015.06.047, 2015.
Akhil Raj, S. T., Ratnam, M. V., Vernier, J. P., Pandit, A. K., and Wienhold, F. G.: Defining the upper boundary of the Asian Tropopause Aerosol Layer (ATAL) using the static stability, Atmos. Pollut. Res., 13, 101451, https://doi.org/10.1016/j.apr.2022.101451, 2022.
Ångström, A.: Technique of determining the turbidity of the atmosphere, Tellus, 13, 214–223, https://doi.org/10.1111/j.2153-3490.1961.tb00078.x, 1964.
Appel, O., Köllner, F., Dragoneas, A., Hünig, A., Molleker, S., Schlager, H., Mahnke, C., Weigel, R., Port, M., Schulz, C., Drewnick, F., Vogel, B., Stroh, F., and Borrmann, S.: Chemical analysis of the Asian tropopause aerosol layer (ATAL) with emphasis on secondary aerosol particles using aircraft-based in situ aerosol mass spectrometry, Atmos. Chem. Phys., 22, 13607–13630, https://doi.org/10.5194/acp-22-13607-2022, 2022.
Basha, G., Ratnam, M. V., Jiang, J. H., Kishore, P., and Babu, S. R.: Influence of indian summer monsoon on tropopause, trace gases and aerosols in Asian summer monsoon anticyclone observed by COSMIC, MLS and CALIPSO, Remote Sens.-Basel, 13, 3486, https://doi.org/10.3390/rs13173486, 2021.
Bossolasco, A., Jegou, F., Sellitto, P., Berthet, G., Kloss, C., and Legras, B.: Global modeling studies of composition and decadal trends of the Asian Tropopause Aerosol Layer, Atmos. Chem. Phys., 21, 2745–2764, https://doi.org/10.5194/acp-21-2745-2021, 2021.
Chavan, P., Fadnavis, S., Chakroborty, T., Sioris, C. E., Griessbach, S., and Müller, R.: The outflow of Asian biomass burning carbonaceous aerosol into the upper troposphere and lower stratosphere in spring: radiative effects seen in a global model, Atmos. Chem. Phys., 21, 14371–14384, https://doi.org/10.5194/acp-21-14371-2021, 2021.
Che, H., Gui, K., Xia, X., Wang, Y., Holben, B. N., Goloub, P., Cuevas-Agulló, E., Wang, H., Zheng, Y., Zhao, H., and Zhang, X.: Large contribution of meteorological factors to inter-decadal changes in regional aerosol optical depth, Atmos. Chem. Phys., 19, 10497–10523, https://doi.org/10.5194/acp-19-10497-2019, 2019.
Collis, R. T. H. and Russell, P. B.: Lidar Measurement of particles and gases by elastic backscattering and differential absorption, in: Laser Monitoring of the Atmosphere, edited by: Hinkley, E. D., Springer Verlag, Berlin, Germany, https://doi.org/10.1007/3-540-07743-X_18, 71–151, 2005.
Fadnavis, S., Semeniuk, K., Pozzoli, L., Schultz, M. G., Ghude, S. D., Das, S., and Kakatkar, R.: Transport of aerosols into the UTLS and their impact on the Asian monsoon region as seen in a global model simulation, Atmos. Chem. Phys., 13, 8771–8786, https://doi.org/10.5194/acp-13-8771-2013, 2013.
Fadnavis, S., Chavan, P., Joshi, A., Sonbawne, S. M., Acharya, A., Devara, P. C. S., Rap, A., Ploeger, F., and Müller, R.: Tropospheric warming over the northern Indian Ocean caused by South Asian anthropogenic aerosols: possible impact on the upper troposphere and lower stratosphere, Atmos. Chem. Phys., 22, 7179–7191, https://doi.org/10.5194/acp-22-7179-2022, 2022.
Fairlie, T. D., Liu, H., Vernier, J. P., Campuzano-Jost, P., Jimenez, J. L., Jo, D. S., Zhang, B., Natarajan, M., Avery, M. A., and Huey, G.: Estimates of Regional Source Contributions to the Asian Tropopause Aerosol Layer Using a Chemical Transport Model, J. Geophys. Res.-Atmos., 125, 1–20, https://doi.org/10.1029/2019JD031506, 2020.
Gadhavi, H. and Jayaraman, A.: Airborne lidar study of the vertical distribution of aerosols over Hyderabad, an urban site in central India, and its implication for radiative forcing calculations, Ann. Geophys., 24, 2461–2470, https://doi.org/10.5194/angeo-24-2461-2006, 2006.
Gao, J., Huang, Y., Peng, Y., and Wright, J. S.: Aerosol Effects on Clear-Sky Shortwave Heating in the Asian Monsoon Tropopause Layer, J. Geophys. Res.-Atmos., 128, 1–23, https://doi.org/10.1029/2022JD036956, 2023.
Gupta, G., Ratnam, M. V., Madhavan, B. L., Prasad, P., and Narayanamurthy, C. S.: Vertical and spatial distribution of elevated aerosol layers obtained using long-term ground-based and space-borne lidar observations, Atmos. Environ., 246, 118172, https://doi.org/10.1016/j.atmosenv.2020.118172, 2021.
Hanumanthu, S., Vogel, B., Müller, R., Brunamonti, S., Fadnavis, S., Li, D., Ölsner, P., Naja, M., Singh, B. B., Kumar, K. R., Sonbawne, S., Jauhiainen, H., Vömel, H., Luo, B., Jorge, T., Wienhold, F. G., Dirkson, R., and Peter, T.: Strong day-to-day variability of the Asian Tropopause Aerosol Layer (ATAL) in August 2016 at the Himalayan foothills, Atmos. Chem. Phys., 20, 14273–14302, https://doi.org/10.5194/acp-20-14273-2020, 2020.
He, Q., Ma, J., Zheng, X., Wang, Y., Wang, Y., Mu, H., Cheng, T., He, R., Huang, G., Liu, D., and Lelieveld, J.: Formation and dissipation dynamics of the Asian tropopause aerosol layer, Environ. Res. Lett., 16, 014015, https://doi.org/10.1088/1748-9326/abcd5d, 2020.
Hess, M., Koepke, P., and Schult, I.: Optical Properties of Aerosols and Clouds: The Software Package OPAC, B. Am. Meteorol. Soc., 79, 831–844, https://doi.org/10.1175/1520-0477(1998)079<0831:OPOAAC>2.0.CO;2, 1998.
Höpfner, M., Ungermann, J., Borrmann, S., Wagner, R., Spang, R., Riese, M., Stiller, G., Appel, O., Batenburg, A. M., Bucci, S., Cairo, F., Dragoneas, A., Friedl-Vallon, F., Hünig, A., Johansson, S., Krasauskas, L., Legras, B., Leisner, T., Mahnke, C., Möhler, O., Molleker, S., Müller, R., Neubert, T., Orphal, J., Preusse, P., Rex, M., Saathoff, H., Stroh, F., Weigel, R., and Wohltmann, I.: Ammonium nitrate particles formed in upper troposphere from ground ammonia sources during Asian monsoons, Nat. Geosci., 12, 608–612, https://doi.org/10.1038/s41561-019-0385-8, 2019.
Junge, C. E. and Manson, J. E.: Stratospheric aerosol studies, J. Geophys. Res., 66, 7, 2163–2182, https://doi.org/10.1029/JZ066i007p02163, 1961.
Komhyr, W. D., Barnes, R. A., Brothers, G. B., Lathrop, J. A., and Opperman, D. P.: Electrochemical concentration cell ozonesonde performance evaluation during STOIC 1989, J. Geophys. Res., 100, 9231–9244, https://doi.org/10.1029/94JD02175, 1995.
Kumar, A. H. and Ratnam, M. V.: Variability in the UTLS chemical composition during different modes of the Asian Summer Monsoon Anti-cyclone, Atmos. Res., 260, 105700, https://doi.org/10.1016/j.atmosres.2021.105700, 2021.
Lau, W. K. M., Yuan, C., and Li, Z.: Origin, Maintenance and Variability of the Asian Tropopause Aerosol Layer (ATAL): The Roles of Monsoon Dynamics, Sci. Rep.-UK, 8, 1–14, https://doi.org/10.1038/s41598-018-22267-z, 2018.
Lelieveld, J., Bourtsoukidis, E., Brühl, C., Fischer, H., Fuchs, H., Harder, H., Hofzumahaus, A., Holland, F., Marno, D., Neumaier, M., Pozzer, A., Schlager, H., Williams, J., Zahn, A., and Ziereis, H.: The South Asian monsoon—Pollution pump and purifier, Science, 361, 270–273, https://doi.org/10.1126/science.aar2501, 2018.
Liou, K. N.: An Introduction to Atmospheric Radiation, 2nd edition, Academic Press, Cambridge, MA, USA, ISBN 9780123958259, 1053 pp., 2002.
Ma, J., Brühl, C., He, Q., Steil, B., Karydis, V. A., Klingmüller, K., Tost, H., Chen, B., Jin, Y., Liu, N., Xu, X., Yan, P., Zhou, X., Abdelrahman, K., Pozzer, A., and Lelieveld, J.: Modeling the aerosol chemical composition of the tropopause over the Tibetan Plateau during the Asian summer monsoon , Atmos. Chem. Phys., 19, 11587–11612, https://doi.org/10.5194/acp-19-11587-2019, 2019.
Madhavan, B. L., Krishnaveni, A. S., Ratnam, M. V., and Ravi Kiran, V.: Climatological aspects of size-resolved column aerosol optical properties over a rural site in the southern peninsular India, Atmos. Res., 249, 105345, https://doi.org/10.1016/j.atmosres.2020.105345, 2021.
Miloshevich, L. M., Vömel, H., Whiteman, D. N., Lesht, B. M., Schmidlin, F. J., and Russo, F.: Absolute accuracy of water vapor measurements from six operational radiosonde types launched during AWEX-G, and implications for AIRS validation, J. Geophys. Res., 111, D09S10, https://doi.org/10.1029/2005JD006083, 2006.
Murari, V., Kumar, M., Mhawish, A., Barman, S. C., and Banerjee, T.: Airborne particulate in Varanasi over middle Indo-Gangetic Plain: variation in particulate types and meteorological influences, Environ. Monit. Assess., 189, 157, https://doi.org/10.1007/s10661-017-5859-9, 2017.
Neely, R. R., Yu, P., Rosenlof, K. H., Toon, O. B., Daniel, J. S., Solomon, S., and Miller, H. L.: The contribution of anthropogenic SO2 emissions to the Asian tropopause aerosol layer, J. Geophys. Res., 119, 1571–1579, https://doi.org/10.1002/2013JD020578, 2014.
Park, M., Randel, W. J., Gettelman, A., Massie, S. T., and Jiang, J. H.: Transport above the Asian summer monsoon anticyclone inferred from Aura Microwave Limb Sounder tracers, J. Geophys. Res.-Atmos., 112, 1–13, https://doi.org/10.1029/2006JD008294, 2007.
Pawar, G. V., Devara, P. C. S., and Aher, G. R.: Identification of aerosol types over an urban site based on air-mass trajectory classification, Atmos. Res., 164–165, 142–155, https://doi.org/10.1016/j.atmosres.2015.04.022, 2015.
Randel, W. J. and Park, M.: Deep convective influence on the Asian summer monsoon anticyclone and associated tracer variability observed with Atmospheric Infrared Sounder (AIRS), J. Geophys. Res.-Atmos., 111, 1–13, https://doi.org/10.1029/2005JD006490, 2006.
Ratnam, M. V., Sunilkumar, S. V., Parameswaran, K., Krishna Murthy, B. V., Ramkumar, G., Rajeev, K., Basha, G., Ravindra Babu, S., Muhsin, M., Kumar Mishra, M., Hemanth Kumar, A., Akhil Raj, S. T., and Pramitha, M.: Tropical tropopause dynamics (TTD) campaigns over Indian region: An overview, J. Atmos. Sol.-Terr. Phy., 121, 229–239, https://doi.org/10.1016/j.jastp.2014.05.007, 2014.
Ratnam, M. V., Raj, S. T. A., Madhavan, B. L., Vernier, J. P., Kiran, V. R., Jain, C. D., Basha, G., Nagendra, N., Kumar, B. S., Pandit, A. K., Murthy, B. V. K., and Jayaraman, A.: Vertically resolved black carbon measurements and associated heating rates obtained using in situ balloon platform, Atmos. Environ., 232, 117541, https://doi.org/10.1016/j.atmosenv.2020.117541, 2020.
Ricchiazzi, P., Yang, S., Gautier, C., and Sowle, D.: SBDART: A research and teaching software tool for plane-parallel radiative transfer in the Earth's atmosphere, B. Am. Meteorol. Soc., 79, 2101–2114, 1998.
Santhosh, V. N., Madhavan, B. L., Ratnam, M. V., Naik, D. N., and Sellitto, P.: Assessing biases in atmospheric parameters for radiative effects estimation in tropical regions, J. Quant. Spectrosc. Ra., 314, 108858, https://doi.org/10.1016/j.jqsrt.2023.108858, 2024a.
Santhosh, V. N., Madhavan, B. L., Ratnam, M. V., and Naik, D. N.: Influence of columnar versus vertical distribution of aerosol properties on the modulation of shortwave radiative effects, J. Quant. Spectrosc. Ra., 329, 109179, https://doi.org/10.1016/j.jqsrt.2024.109179, 2024b.
Santhosh, V. N., Madhavan, B. L., and Venkat Ratnam, M.: Quantifying shortwave radiative forcing and heating rates of UTLS aerosols in the Asian summer monsoon anticyclone region, J. Quant. Spectrosc. Ra., 339, 109430, https://doi.org/10.1016/j.jqsrt.2025.109430, 2025.
Sinha, P. R., Dumka, U. C., Manchanda, R. K., Kaskaoutis, D. G., Sreenivasan, S., Krishna Moorthy, K., and Suresh Babu, S.: Contrasting aerosol characteristics and radiative forcing over Hyderabad, India due to seasonal mesoscale and synoptic-scale processes, Q. J. Roy. Meteor. Soc., 139, 434–450, https://doi.org/10.1002/qj.1963, 2013.
Solomon, S., Daniel, J. S., Neely, R. R., Vernier, J. P., Dutton, E. G., and Thomason, L. W.: The persistently variable “background” stratospheric aerosol layer and global climate change, Science, 333, 866–870, https://doi.org/10.1126/science.1206027, 2011.
Stamnes, K., Tsay, S.-C., Wiscombe, W., and Jayaweera, K.: Numerically stable algorithm for discrete-ordinate-method radiative transfer in multiple scattering and emitting layered media, Appl. Optics, 27, 2502, https://doi.org/10.1364/ao.27.002502, 1988.
Stein, A. F., Draxler, R. R., Rolph, G. D., Stunder, B. J. B., Cohen, M. D., and Ngan, F.: NOAA's hysplit atmospheric transport and dispersion modeling system, B. Am. Meteorol. Soc., 96, 2059–2077, https://doi.org/10.1175/BAMS-D-14-00110.1, 2015.
Thomason, L. W. and Vernier, J.-P.: Improved SAGE II cloud/aerosol categorization and observations of the Asian tropopause aerosol layer: 1989–2005, Atmos. Chem. Phys., 13, 4605–4616, https://doi.org/10.5194/acp-13-4605-2013, 2013.
Tiwari, S. and Singh, A. K.: Variability of Aerosol parameters derived from ground and satellite measurements over Varanasi located in the Indo-Gangetic Basin, Aerosol Air Qual. Res., 13, 627–638, https://doi.org/10.4209/aaqr.2012.06.0162, 2013.
Vernier, H., Rastogi, N., Liu, H., Pandit, A. K., Bedka, K., Patel, A., Ratnam, M. V., Kumar, B. S., Zhang, B., Gadhavi, H., Wienhold, F., Berthet, G., and Vernier, J.-P.: Exploring the inorganic composition of the Asian Tropopause Aerosol Layer using medium-duration balloon flights, Atmos. Chem. Phys., 22, 12675–12694, https://doi.org/10.5194/acp-22-12675-2022, 2022.
Vernier, J. P., Thomason, L. W., and Kar, J.: CALIPSO detection of an Asian tropopause aerosol layer, Geophys. Res. Lett., 38, 1–6, https://doi.org/10.1029/2010GL046614, 2011.
Vernier, J.-P., Fairlie, T. D., Natarajan, M., Wienhold, F. G., Bian, J., Martinsson, B. G., Crumeyrolle, S., Thomason, L. W., and Bedka, K. M.: Increase in upper tropospheric and lower stratospheric aerosol levels and its potential connection with Asian pollution, J. Geophys. Res.-Atmos., 120, 1608–1619, https://doi.org/10.1002/2014JD022372, 2015.
Vernier, J. P., Fairlie, T. D., Deshler, T., Ratnam, M. V., Gadhavi, H., Kumar, B. S., Natarajan, M., Pandit, A. K., Akhil Raj, S. T., Hemanth Kumar, A., Jayaraman, A., Singh, A. K., Rastogi, N., Sinha, P. R., Kumar, S., Tiwari, S., Wegner, T., Baker, N., Vignelles, D., Stenchikov, G., Shevchenko, I., Smith, J., Bedka, K., Kesarkar, A., Singh, V., Bhate, J., Ravikiran, V., Durga Rao, M., Ravindrababu, S., Patel, A., Vernier, H., Wienhold, F. G., Liu, H., Knepp, T. N., Thomason, L., Crawford, J., Ziemba, L., Moore, J., Crumeyrolle, S., Williamson, M., Berthet, G., Jégou, F., and Renard, J.-B.: BATAL: The balloon measurement campaigns of the Asian tropopause aerosol layer, B. Am. Meteorol. Soc., 99, 955–973, https://doi.org/10.1175/BAMS-D-17-0014.1, 2018.
Vogel, B., Volk, C. M., Wintel, J., Lauther, V., Clemens, J., Grooß, J.-U., Günther, G., Hoffmann, L., Laube, J. C., Müller, R., Ploeger, F., and Stroh, F.: Evaluation of vertical transport in ERA5 and ERA-Interim reanalysis using high-altitude aircraft measurements in the Asian summer monsoon 2017, Atmos. Chem. Phys., 24, 317–343, https://doi.org/10.5194/acp-24-317-2024, 2024.
von Hobe, M., Ploeger, F., Konopka, P., Kloss, C., Ulanowski, A., Yushkov, V., Ravegnani, F., Volk, C. M., Pan, L. L., Honomichl, S. B., Tilmes, S., Kinnison, D. E., Garcia, R. R., and Wright, J. S.: Upward transport into and within the Asian monsoon anticyclone as inferred from StratoClim trace gas observations, Atmos. Chem. Phys., 21, 1267–1285, https://doi.org/10.5194/acp-21-1267-2021, 2021.
Xu, H., Guo, J., Tong, B., Zhang, J., Chen, T., Guo, X., Zhang, J., and Chen, W.: Characterizing the near-global cloud vertical structures over land using high-resolution radiosonde measurements, Atmos. Chem. Phys., 23, 15011–15038, https://doi.org/10.5194/acp-23-15011-2023, 2023.
Yu, P., Toon, O. B., Neely, R. R., Martinsson, B. G., and Brenninkmeijer, C. A. M.: Composition and physical properties of the Asian Tropopause Aerosol Layer and the North American Tropospheric Aerosol Layer, Geophys. Res. Lett., 42, 2540–2546, https://doi.org/10.1002/2015GL063181, 2015.
Yu, P., Rosenlof, K. H., Liu, S., Telg, H., Thornberry, T. D., Rollins, A. W., Portmann, R. W., Bai, Z., Ray, E. A., Duan, Y., Pan, L. L., Toon, O. B., Bian, J., and Gao, R.-S.: Efficient transport of tropospheric aerosol into the stratosphere via the Asian summer monsoon anticyclone, P. Natl. Acad. Sci. USA, 114, 6972–6977, https://doi.org/10.1073/pnas.1701170114, 2017.
Yu, P., Lian, S., Zhu, Y., Toon, O. B., Höpfner, M., and Borrmann, S.: Abundant Nitrate and Nitric Acid Aerosol in the Upper Troposphere and Lower Stratosphere, Geophys. Res. Lett., 49, e2022GL100258, https://doi.org/10.1029/2022GL100258, 2022.
Zhang, H., Shen, Z., Wei, X., Zhang, M., and Li, Z.: Comparison of optical properties of nitrate and sulfate aerosol and the direct radiative forcing due to nitrate in China, Atmos. Res., 113, 113–125, https://doi.org/10.1016/j.atmosres.2012.04.020, 2012.
Zhu, Y., Yu, P., Wang, X., Bardeen, C., Borrmann, S., Höpfner, M., Mahnke, C., Weigel, R., Krämer, M., Deshler, T., Bian, J., Bai, Z., Vernier, H., Portmann, R. W., Rosenlof, K. H., Kloss, C., Pan, L. L., Smith, W., Honomichl, S., Zhang, J., Stone, K. A., and Toon, O. B.: Evaluating the Importance of Nitrate-Containing Aerosols for the Asian Tropopause Aerosol Layer, J. Geophys. Res.-Atmos., 129, e2024JD041283, https://doi.org/10.1029/2024JD041283, 2024.