the Creative Commons Attribution 4.0 License.
the Creative Commons Attribution 4.0 License.
 | 28 Jul 2025
Copper accelerates photochemically induced radical chemistry of iron-containing secondary organic aerosol (SOA)
Kevin Kilchhofer
Laura Torrent
Rico K. Y. Cheung
Peter A. Alpert
Photochemical aging in secondary organic aerosol (SOA) particles alters their chemical composition and affects their adverse health effects. However, there is limited mechanistic insight on the role of transition metals in photochemical SOA aging and the evolution of the oxidative potential through their effect on radical chemistry. Here, we investigated the influence of copper (Cu) on the photochemical aging of iron (Fe) containing SOA in single particles using scanning transmission X-ray microscope measurements and chemical box modeling. The SOA proxy included citric acid (CA), iron(III) citrate (FeIII(Cit)), and copper(II) citrate (CuII(HCit)), which were exposed to UV light (λ=365 nm) in a humidified environmental cell. We modeled known catalytic radical destruction mechanisms resulting from cross-redox reactions between copper and iron. Simulating anoxic aging experiments showed a lower initial iron(III) reduction compared to particles, indicating a reduced iron(II) quantum yield than from the photolysis of the FeIII(Cit) alone. We hypothesize that this effect may be due to copper replacing an iron center in a polynuclear complex. At higher relative humidity up to 60 %, a lower iron(II) quantum yield could not account for our observations of iron reoxidation in the dark. Instead, reoxidation appears to be highly sensitive to a potential copper(II)-induced reoxidation reaction. We provide a comprehensive discussion and evaluation of the poorly understood role of copper in modifying redox and radical chemistry, which is relevant for reactions involving transition metals mixed with SOA in the atmosphere.
- Article
(13863 KB) - Full-text XML
- BibTeX
- EndNote


Secondary organic aerosol (SOA) particles are a major component of tropospheric particulate matter (PM), predominantly formed through the oxidation of biogenic and anthropogenic volatile organic compounds (Hallquist et al., 2009). Consequently, SOA particles consist of various molecules from different precursor gases, which greatly influence atmospheric chemistry (Pöschl and Shiraiwa, 2015). Due to their substantial mass yield, SOA particles are significant contributors to particulate air pollution (Huang et al., 2015). The health impacts of PM are suggested to be related to the concentration of reactive oxygen species (ROS), such as hydroxy radicals or hydroperoxides (Weichenthal et al., 2019; Shiraiwa et al., 2023). ROS can be introduced into the body through the inhalation of PM (particle-bound ROS) (Dellinger et al., 2001) or catalytically generated in vivo after inhalation by redox-active PM species (semi-empirically quantified by the oxidative potential, or OP) (Bates et al., 2019). For example, particle-bound ROS have been associated with fine-mode SOA particles and with coarse-mode metals from vehicular non-exhaust emissions (Daellenbach et al., 2020). SOA particles nucleated from the oxidation products of biogenic volatile organic compounds (VOCs) can mix with primary emitted aerosol particles (e.g., mineral dust), which contain redox-active components such as transition metal ions (Charrier and Anastasio, 2015). This mixing has been found to enhance ROS production by these particles (Tuet et al., 2017; Alpert et al., 2021).
Transition metal ions, such as iron and copper, have long been known to dissolve in atmospheric liquid phases (Kieber et al., 2001; Deguillaume et al., 2005). Natural emissions from dust regions and anthropogenic activities, such as traffic and combustion, are primary sources of soluble iron (Ito and Miyakawa, 2023), making it the most abundant metal in the atmosphere. Copper emissions increased greatly during the industrial revolution (Hong et al., 1996), and the atmospheric copper concentration has been measured up to of the ambient iron concentration (Schroeder et al., 1987). In megacities, higher metal concentrations lead to increased levels of soluble iron and copper in PM (Chifflet et al., 2024). In SOA, dissolved metals form complexes with organic material (Moffet et al., 2012; Al-Abadleh, 2015, 2024). Field studies have shown that soluble iron occurs mainly in complexes with carboxylate functional groups (Tapparo et al., 2020; Tao and Murphy, 2019), and both iron and copper complexes have been identified in ambient PM, indicating a significant alteration of their OP (Wei et al., 2019).
Due to the long atmospheric lifetimes, aging processes can significantly alter the physicochemical properties of SOA particles (Kroll and Seinfeld, 2008; Robinson et al., 2007). Photochemistry plays a central role in many aerosol aging processes (George et al., 2015). In the condensed phase, photochemical reactions are more easily initiated compared to the gas phase, as photoexcited species are in closer proximity to energy or electron acceptors. Organometallic complexes often have a high UV absorption cross section, leading to indirect photochemistry (George et al., 2015; Corral Arroyo et al., 2018a). We hypothesize that particles containing iron, copper, and SOA undergo photochemical reactions subsequently producing ROS. This study aims to quantify the redox chemistry of these transition metals and to further elucidate the photochemical reaction mechanism, shedding light on new pathways of ROS formation in SOA.
Citric acid (CA) is commonly used as a model system for SOA due to its oxygen-to-carbon ratio (O:C) and atmospherically relevant viscosity properties (Reid et al., 2018; Dou et al., 2021; Alpert et al., 2021; Wang et al., 2023). Iron citrate (FeIII(Cit)) is a representative iron-carboxylate complex with reasonably well-characterized photochemistry (Cieśla et al., 2004; Wang et al., 2012; Weller et al., 2013, 2014; Dou et al., 2021). Its high absorbance in the UV-visible range (Seraghni et al., 2012; Abida et al., 2012) enables FeIII(Cit) to initiate condensed phase radical processes at wavelengths that most oxidized organic compounds (non-carbonyl) would not absorb on their own.
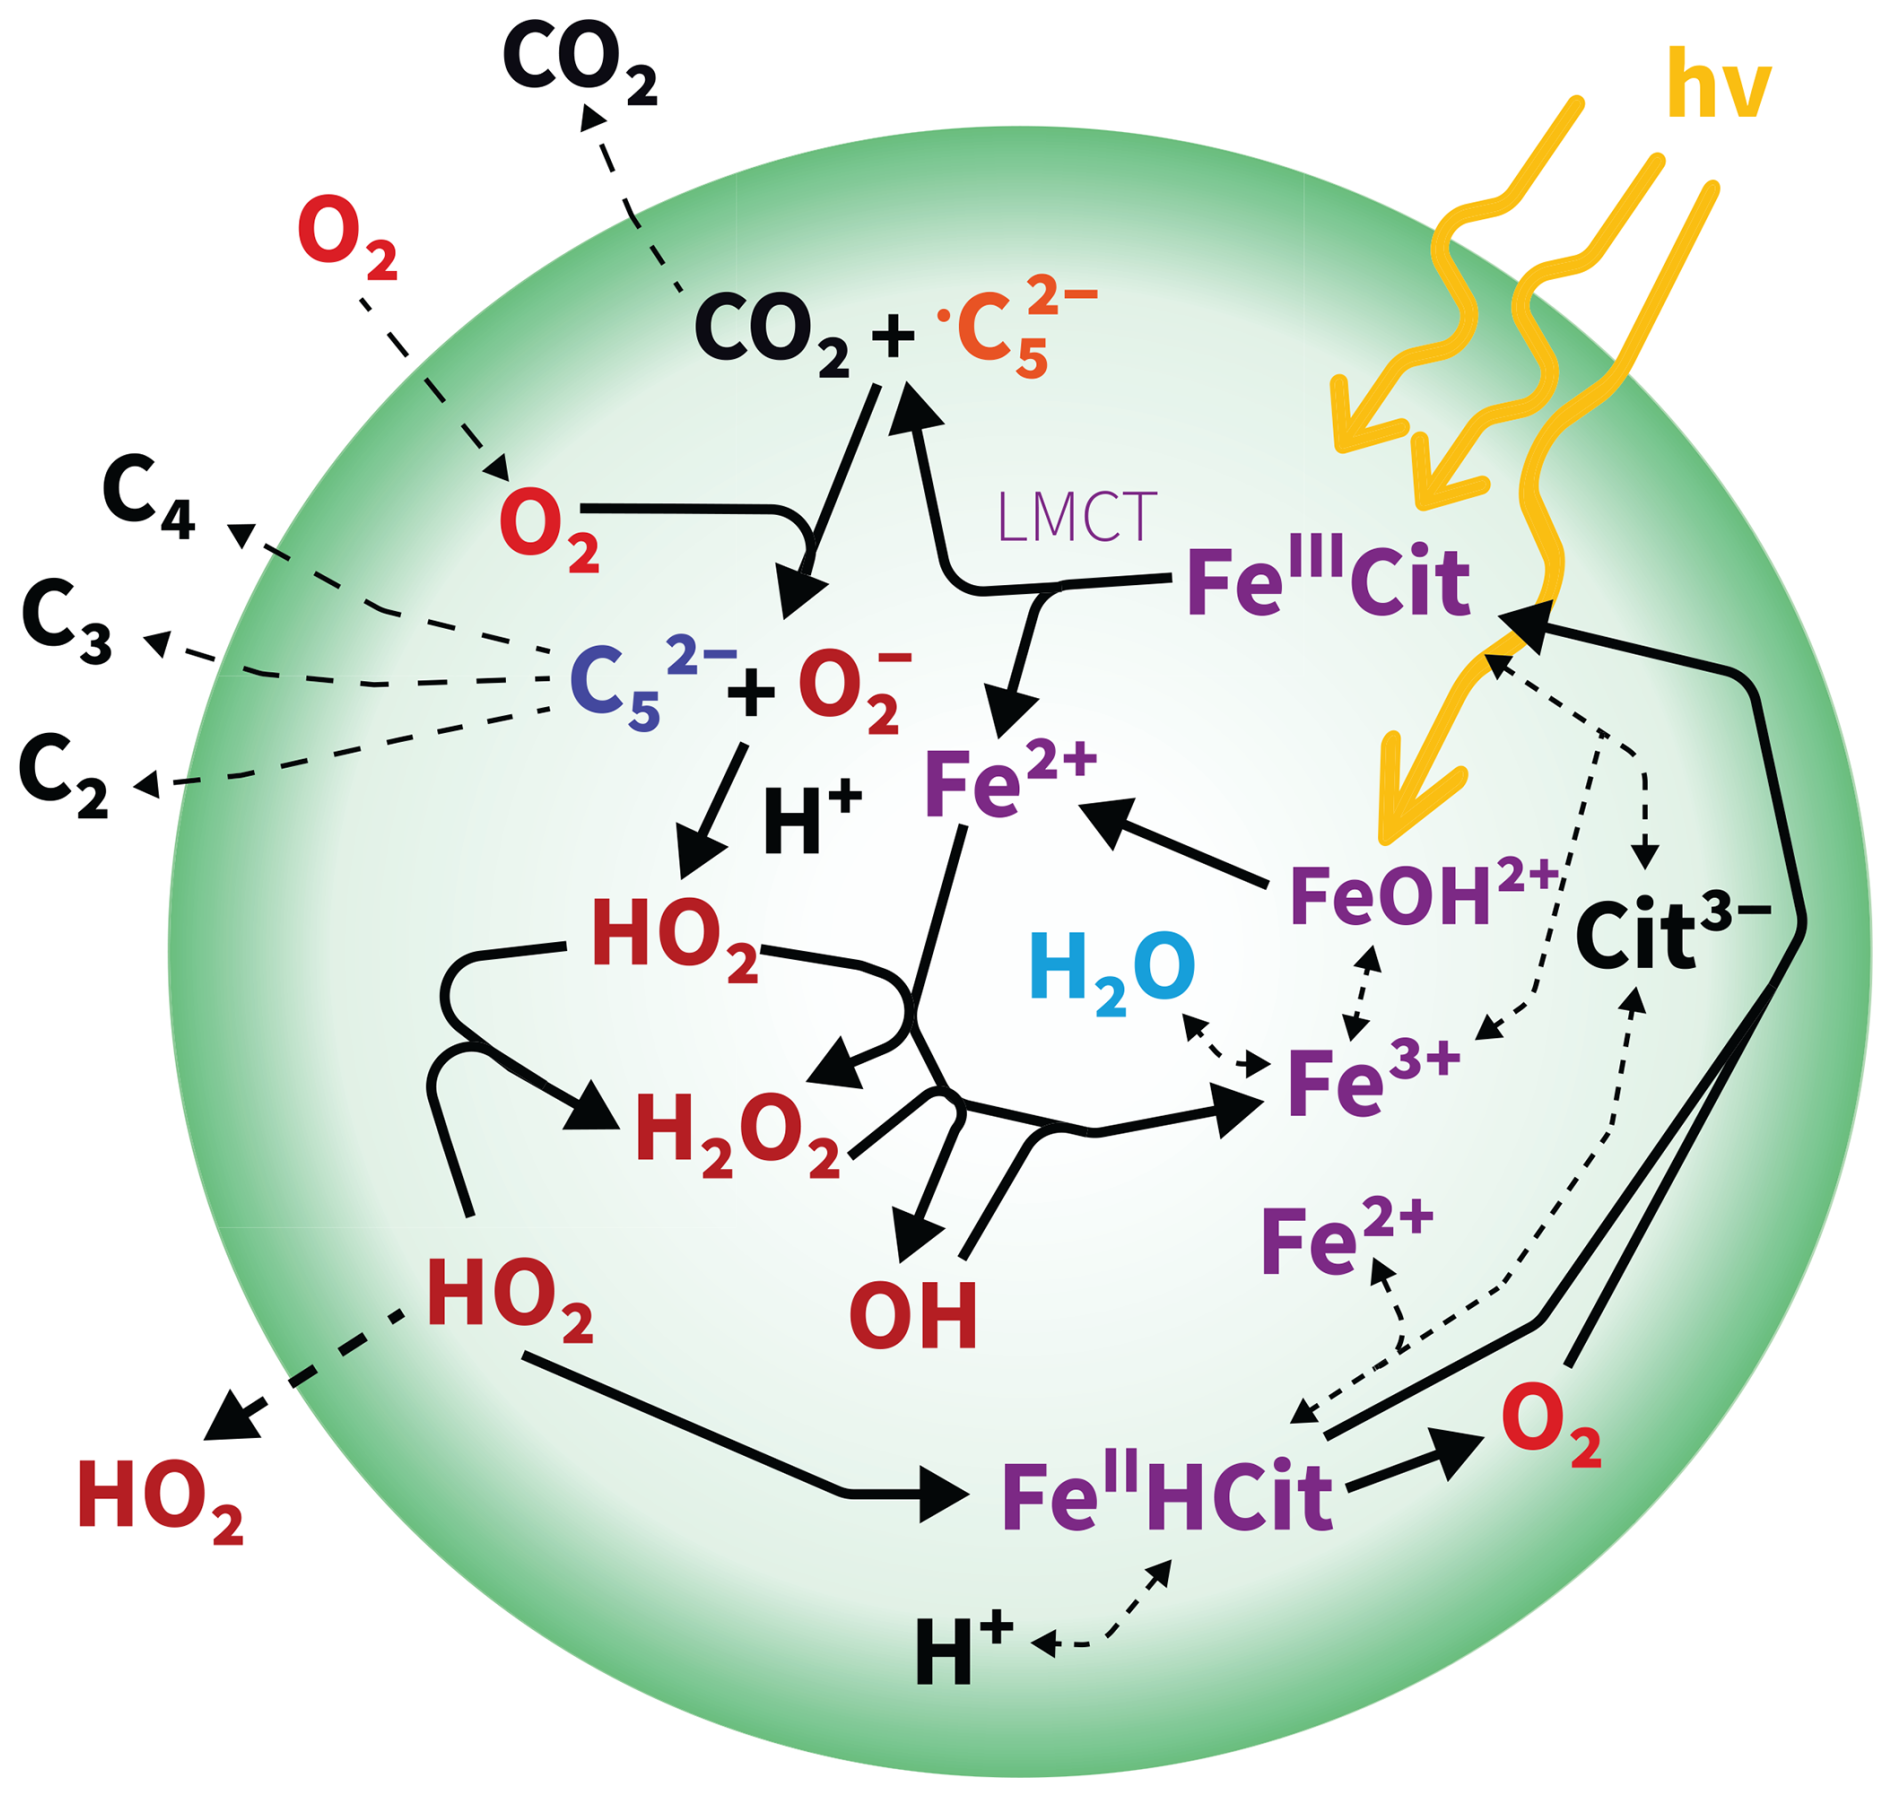
Figure 1Schematic of photochemically induced chemistry in a viscous particle. The detailed mechanism, including equilibria and reaction rates, is outlined in Tables 1 and 2. denotes the carbon-centered free radical , while refers to the ketoacid in reactions E8, R1, and R2. FeIIICit denotes FeC6H5O7, FeIIHCit corresponds to , and Cit3− refers to . LMCT stands for ligand-to-metal charge transfer.
The number of citrate ligands per iron center, as well as the abundance of polynuclear (thus poly-iron) complex aggregates, varies depending on the pH and the ratio between CA and FeIII (Abrahamson et al., 1994; Silva et al., 2009; Gracheva et al., 2022), with each species exhibiting different absorbance. In the following, we shorty outline the main FeIII(Cit) photochemical mechanism shown in Fig. 1 initiated by ligand-to-metal charge transfer (LMCT, violet), generating a reduced radical complex as the first intermediate (Glebov et al., 2011; Pozdnyakov et al., 2014). This may decompose into FeII and a citrate radical, which rapidly decarboxylates at the central carboxyl group, releasing CO2 and forming a carbon-centered free radical (, orange in Fig. 1) (Weller et al., 2013). In the presence of O2, ROS, i.e., HO2 and , and a ketoacid (, blue in Fig. 1) are produced. The ketoacid can also form through the reaction of the citrate radical or the reduced radical complex with FeIII(Cit) or by reaction with another FeIII center within the same polynuclear complex (Abrahamson et al., 1994; Glebov et al., 2011). These additional pathways yield a second FeII without producing ROS, potentially leading to a higher apparent iron(II) quantum yield (ϕ). Iron(II) can be reoxidized to iron(III) with ROS via the Fenton reaction cycle (Fenton, 1894). Iron(III) subsequently combines with another CA molecule to form a new FeIII(Cit) complex, completing the photocatalytic cycle. This photodegradation process is also an important sink of carboxylate groups, and prolonged irradiation may result in the formation of Fe-carbonaceous colloids, as recently reported by West et al. (2023). In more detail, with respect to the quantum yield, for different aqueous iron(III) polycarboxylate complexes, including FeIII(Cit), ϕ varies with the solution composition, pH, and the presence or not of O2. Faust and Zepp (1993) found a ϕ value of 0.28 in air for FeIII(Cit) complexes. Characterizing a series of environmentally relevant iron(III) carboxylate complexes at multiple wavelengths in the actinic spectrum, Weller et al. (2013) confirmed a range for ϕ between 0.2 and 0.6. This relatively low ϕ under various environmental conditions may be due to the possibility of back-electron transfer of the reduced iron(II) radical complex intermediate (Glebov et al., 2011; Pozdnyakov et al., 2014). Abrahamson et al. (1994) found photoreduction in crystalline FeIII(Cit) but not in acetonitrile solution without water, highlighting the need for water. Abrahamson et al. (1994) measured ϕ in solution for various carboxylic acid proxies at different pH and initial metal-to-ligand ratios. For FeIII(Cit), over the pH range from 4 to 2, they observed ϕ decreasing from around 0.4 to around 0.1, while when increasing the iron(III)-to-ligand ratio from 0.02 to 0.5 at pH = 3, ϕ increased from 0.2 to 0.45. This was attributed to the formation of dimeric photoactive FeIII(Cit) species at high iron-to-ligand ratios. Therefore, the presence of dimeric or polymeric complexes, formed through paramagnetic coupling among Fe centers via oxygen bridges, and the presence of water seem crucial for both absorbance and ϕ, which will be discussed in this work.
The formation of various ROS, primarily driven by the generation of peroxy radicals, relies on O2 supplied from the gas phase. Because O2 has relatively low solubility, its availability can become rate limiting (Alpert et al., 2021), especially when SOA particles become highly viscous at low relative humidity (RH) and/or temperatures (Virtanen et al., 2010; Koop et al., 2011). Under these anoxic conditions within the particle bulk, highly reactive species generated by photochemistry can accumulate. Upon humidification to higher RH, the increase in O2 uptake enhances the formation of additional ROS (Alpert et al., 2021). This work aims to bridge the gap between model SOA proxies and ambient SOA by investigating the role of relevant metal ions, specifically iron and copper, in the aerosol phase. The interactions between iron and other dissolved metals in SOA, as well as their impact on particle-bound ROS production, remain unexplored. Previous studies on this subject have primarily focused on the role of metals in surrogate lung fluid in relation to their OP (Charrier et al., 2014; Wei et al., 2019; Lelieveld et al., 2021, 2024).
In this study, we introduce copper citrate (CuII(HCit)) to evaluate the influence of copper ions and organic complexes on the photochemical aging of particles, thereby examining its role in aerosol aging, multiphase chemistry, and particle-bound ROS formation. Using X-ray spectromicroscopy, we found that copper alters the photochemical aging process in particles, particularly in terms of iron reoxidation, compared to the particles studied by Alpert et al. (2021) without copper. This observation led us to model the photochemistry in particles and assess the importance of ROS–copper and iron–copper coupled reactions available from previous literature. In addition, the new reoxidation experiments could be explained only by adjusting the iron(II) quantum yield of FeIII(Cit) photolysis. We suggest that copper may not only catalyze ROS cycling but also potentially replace iron in polymetal complexes, reducing the photolysis quantum yield and accelerating reoxidation in this system.
2.1 STXM/NEXAFS for determining iron oxidation state
Scanning transmission X-ray microscopy coupled with near-edge X-ray absorption fine structure (STXM/NEXAFS) spectroscopy (Raabe et al., 2008; Moffet et al., 2010) was used to determine the fraction of iron(III), β, out of the total iron after photoreduction and during in situ reoxidation in individual particles, following established methods (Alpert et al., 2019, 2021; Dou et al., 2021). The experiments were conducted at the PolLux beamline at the Swiss Light Source (SLS). NEXAFS spectra were also measured to quantify the oxidation states of both iron and copper. X-ray spectra were obtained by imaging particles at individual X-ray energies and then scanning across the energy range of relevant absorption edges. For iron, the energy was scanned from 700 to 735 eV, covering the L-edges around 709 and 721 eV, while for copper, the scan ranged from 925 to 965 eV to capture the L2,3-edge peaks at 934 and 954 eV. For carbon, the energy was scanned from 278 to 318 eV to cover the C-K-edge NEXAFS region.
At different oxidation states, iron has a different L-edge peak position, occurring at, e.g., ∼707.8 and 709.6 eV for FeCl2 and FeCl3, respectively, with a separation of 1.8 eV (Moffet et al., 2012). This information was used to calibrate X-ray energy (Fig. A1) with a constant offset. A mixture of the two oxidation states was quantified by first subtracting the background absorption at the iron pre-edge (between 700 and 705 eV, where iron does not absorb strongly), then taking the ratio of the absorption peak heights, and finally applying a previously established parameterization (Moffet et al., 2012; Dou et al., 2021; Alpert et al., 2019, 2021). All particles appeared homogeneous in terms of metal and organic distribution, meaning we never observed dense nanoparticles or gradients in Fe, Cu, or organic concentration. However, we did observe gradients in the oxidation state, and note that only Fe(II), Fe(III), Cu(I), and Cu(II) oxidation states were detected.
In order to quantify the iron oxidation states, we followed the procedure by Alpert et al. (2019), calculating the pre-edge absorption from a polynomial fit as a function of the sum of the absorption at the Fe(II) and Fe(III) peaks. Then, two high-spatial-resolution images with a pixel size of 35×35 nm2 were acquired at the peak absorption energies for iron(II) and iron(III) at 710.1 and 711.9 eV, respectively (see Fig. A1), allowing the calculation of β in the particles using Eq. 1. The total iron(II) and iron(III) peak absorption energies with respect to the concentration (C) of each species in the particles were subsequently found. These fractions were then used to map the individual particles with a resolution of tens of nanometers, providing detailed spatial insights into their iron oxidation states.
When determining β, calculations were performed for each pixel in the images of particles, with uncertainties stemming from photon counting statistics, nanometer scale drift in positioning, automated image alignment, and errors from the iron pre-edge calculation (prediction error at 95 % confidence). Radial profiles of β were obtained by averaging concentric pixels on and from the perimeter of the imaged particles (Alpert et al., 2019). The uncertainty in β was determined to be either or propagated from the photon counting error, whichever was larger. Two experimental procedures were utilized to investigate photochemical reduction and reoxidation over time. In the first, particles were generated from a solution, placed under vacuum, and exposed to UV light. In the second, particles were generated from a solution containing CuII(HCit) and placed in an environmental cell with controlled light exposure, RH, and O2 concentration. When the humidity (and thus particle water content), O2, or copper content was varied, the iron pre-edge absorption of the particles changed. Prior to light exposure for each experiment, background absorption at 700 eV and the two absorption peaks for iron(II) and iron(III) were measured for about 100 particles. These data were used to create a unique polynomial fit for background absorption prior to UV exposure. As previously mentioned, the background absorption image was calculated from the fit, reducing the number of images from three to two in order to decrease the time needed to quantify β maps (Alpert et al., 2021).
2.2 Solutions and sample preparation
Particles for STXM/NEXAFS analysis were prepared by nebulizing the solutions using a custom-built ultrasonic nebulizer (Steimer et al., 2015). The nebulized particles were then dried at RH ≤30 % and directed to a single jet impactor in a N2 flow, following passage through a differential mobility analyzer to select a dry mobility diameter of 300–400 nm. The particles were nebulized for 50–100 s to ensure a homogeneously distributed sample with particles of 0.2–1 µm in diameter. We prepared six different solutions. Three had a 1:1 mole ratio of FeIII(Cit):CA, two had mole ratios of CuII(HCit):FeIII(Cit) = 0.2 and 0.02, and one had a mole ratio of CuIICl2:FeIII(Cit) = 0.2. These ratios were chosen to replicate experiments from Alpert et al. (2021) and to evaluate atmospherically relevant copper concentrations, approximately of the iron concentration (Schroeder et al., 1987; Wei et al., 2019). CA (≥99.5 %; CAS = 5949-29-1), FeIII(Cit) tribasic monohydrate (18 %–20 % Fe basis; CAS = 2338-05-8), and CuII(HCit) (97 %; CAS = 866-82-0) were purchased from Sigma-Aldrich. The dilute aqueous solutions were prepared in ultrapure water (18 MΩ cm−1, Milli-Q). The measured pH ≈ 2 of the solutions did not differ between the different mole ratios. Because we sampled only a very low mass of particles, we were unable to measure the pH after an STXM experiment. The solution was then nebulized, and the particles were impacted on silicon nitride windows, which were then sealed inside replaceable sample holders compatible with the environmental cell used for the STXM/NEXAFS (Alpert et al., 2021; Huthwelker et al., 2010). The viscosity of the particles at the same RH did not vary between different particle compositions, as the concentrations of iron were too low to influence the viscosity of CA, as proved by Alpert et al. (2021), while we assume that the small amount of additional copper did not change that.
2.3 STXM environmental cell and photochemical reactor
In the environmental cell, the iron oxidation state was mapped in situ in the dark following photolysis (Alpert et al., 2021; Huthwelker et al., 2010). The particle samples were first transported under vacuum to the PolLux end station at the SLS, where they were loaded into the environmental cell. During preparation, transport, and loading, all ambient room light was switched off, and efforts were made to shield the samples and the solutions from any additional light, ensuring minimal light exposure before sealing the end station. The interval between impaction and X-ray investigation was approximately 2 hours. The environmental cell maintained a controlled gas flow with constant RH ranging from 0 %–60 % and O2 at partial pressure, adjusted according to the desired RH. Helium served as the carrier gas for O2 and H2O, with a total flow rate of 20 mL min−1 (stp). At RH = 60 %, 50 %, and 40 %, the oxygen-to-helium flow ratios were 0.6, 0.75, and 0.8, respectively.
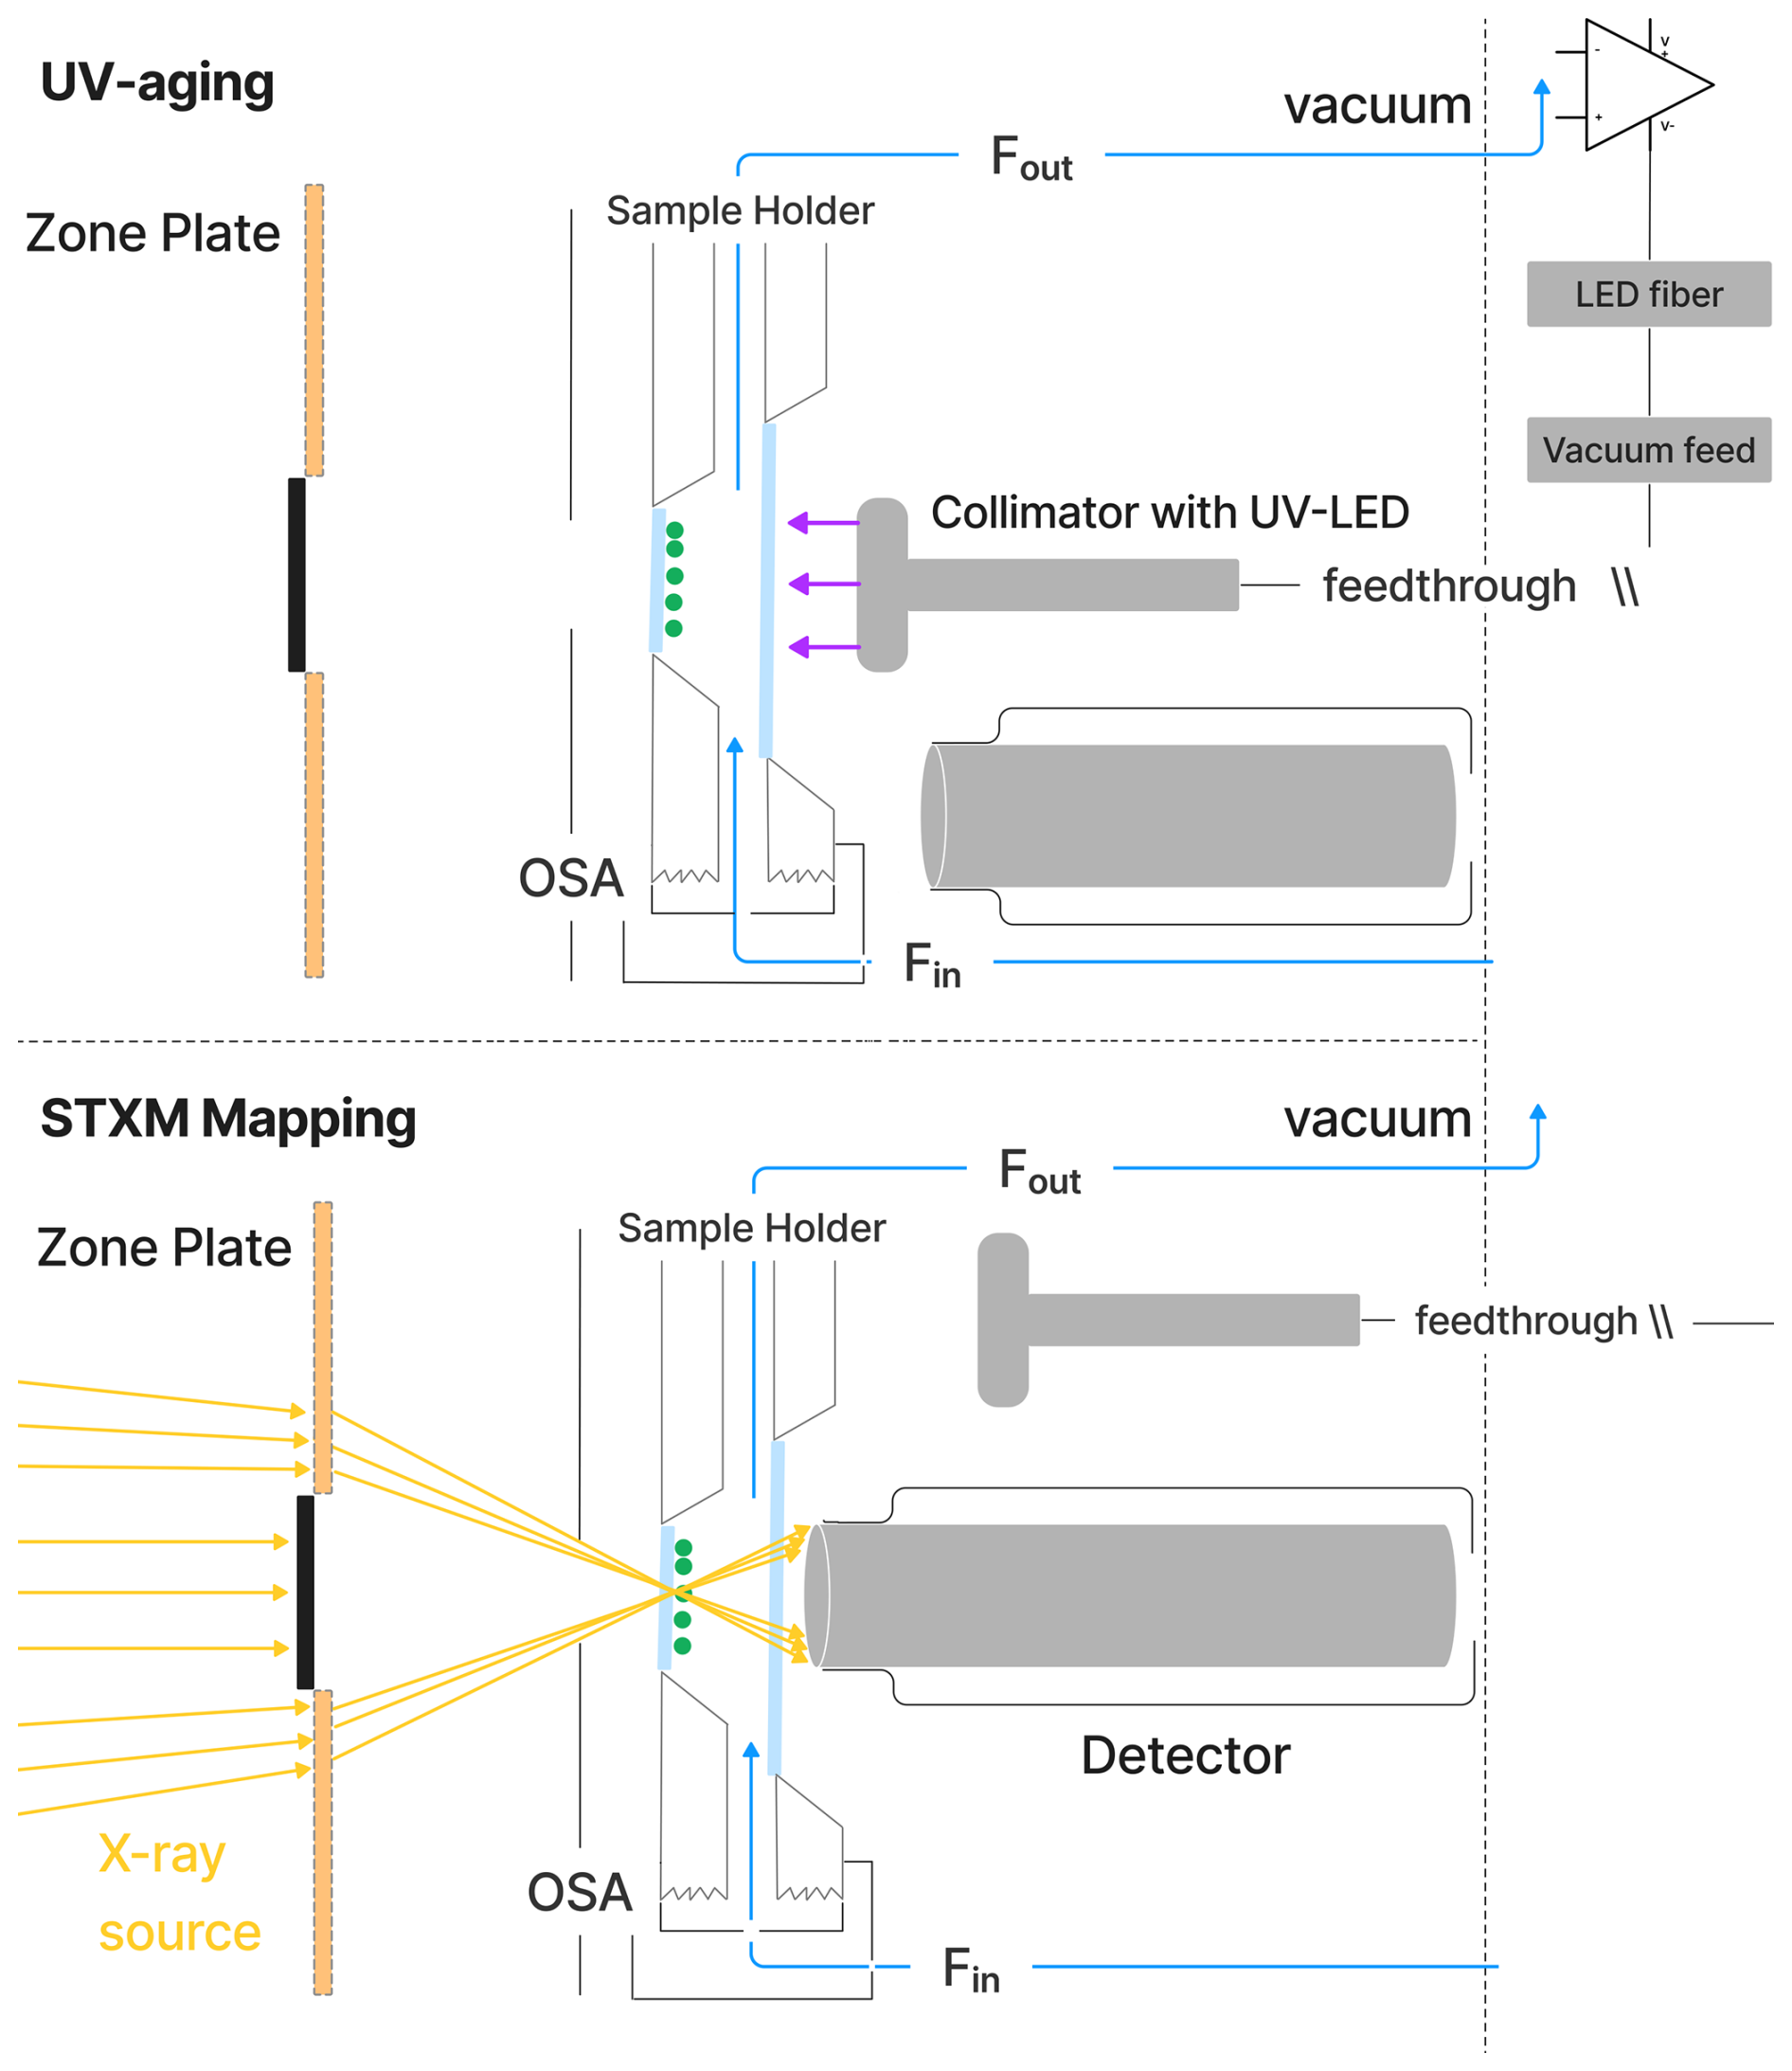
Figure 2Schematic of the environmental cell situated inside the STXM/NEXAFS vacuum chamber. During UV aging, the particles (green dots) on the silicon nitride (SiNit) membranes were aligned with a UV–LED collimator. For STXM/NEXAFS analysis, the collimator was moved aside, and an X-ray detector was moved to its place. SiNit membranes were sealed in an aluminum sample holder, which was attached to the aluminum environmental cell sealed with an O-ring. A constant, humid helium flow (blue line) was maintained through the environmental cell. The positions of the detector and collimator were automatically alternated between the two experimental conditions.
Figure 2 shows a schematic of the UV–LED fiber optic system used for UV-aging experiments in the STXM. The system includes a LED (LuxiGen™ 365 nm UV LED Gen 4 Emitter, Model LZ1‐00UV0R) and two interchangeable collimators (Thorlabs, model CFC-2X-A and model CFC-5X-A), which provide uniform illumination throughout the sample area. The power density can be adjusted between 2.36 ± 0.06 and 13.55 ± 0.06 W m−2 over a narrow wavelength range of 360–380 nm (with a full-width half-maximum of approximately 20 nm). This corresponds to a photolysis frequency for FeIII(Cit), jFeCit, ranging from 1.4 ± 0.2 × 10⁻³ to 8.1 ± 0.9 × 10⁻³ s−1. Light intensity was regulated by a dimmer circuit, which was controlled by an electrical signal ranging from 1 to 7 V. The fiber optics, with a numerical aperture of 0.5 and a core diameter of 1000 µm, allowed for a large acceptance angle, ensuring sufficient light transmission from the LEDs. The fiber is multimode and has a high OH content, which ensures transmission of ultraviolet and visible light with minimal loss. A custom-built vacuum feed connected the fiber optics to the STXM chamber. The spectral flux density of the light as a function of wavelength was measured after the collimator using a pre-calibrated power meter (Air-Cooled Thermopile Sensors, Model PM2) and spectrometer (Avantes, model AvaSpec-ULS2048XL-EVOis).
2.4 Photolysis frequency
We compared the photolysis frequency of FeIII(Cit), jFeCit, when illuminated by the LED light to the actinic flux in Los Angeles at sea level for June (EQF(λ)sun) and December days. The actinic flux data were obtained using the libRadtran software (Emde et al., 2016) with the following parameters: albedo = 0.1, aerosol optical depth τ=0.1, single scattering albedo (SSA) = 0.85, solar zenith angle (SZA) = 23.4 °, and O3 column = 300 DU. The corresponding spectra can be seen in Fig. B1) in the Appendix. At noon in June, the photolysis frequency in Los Angeles is 10−2 s−1, integrated over the 270–500 nm wavelength range. The UV aging of particles under atmospheric conditions scales in proportion to j calculated from the LED flux, the absorption cross section, and an iron(II) quantum yield, ϕ, of 1. For the wavelength range emitted by the LED (350–400 nm), jLED reaches 8.1 ± 0.9 × 10⁻³ s−1.
Using an equation derived by Malecha and Nizkorodov (2016) (Eq. 2), we compared j under atmospheric conditions with the LED spectrum for two wavelength ranges, i.e., 350–400 and 270–500 nm. The resulting factor, ζ, is approximately 3.6 using the 350–400 nm range, at the lowest LED dimmer setting of 1 V. This indicates that the photochemical cycling with the LED light should be slower compared to ambient sunlight. We calculated ζ for the two LED dimmer settings (1 and 7 V) for both summer and winter sunlight conditions and for the two wavelength ranges. These results are shown in Table B1 in the Appendix. For example, an LED–UV exposure of 10–15 min at 7 V is approximately 4–8 min sunlight exposure during summer in Los Angeles.
2.5 Kinetic model of reoxidation in the system
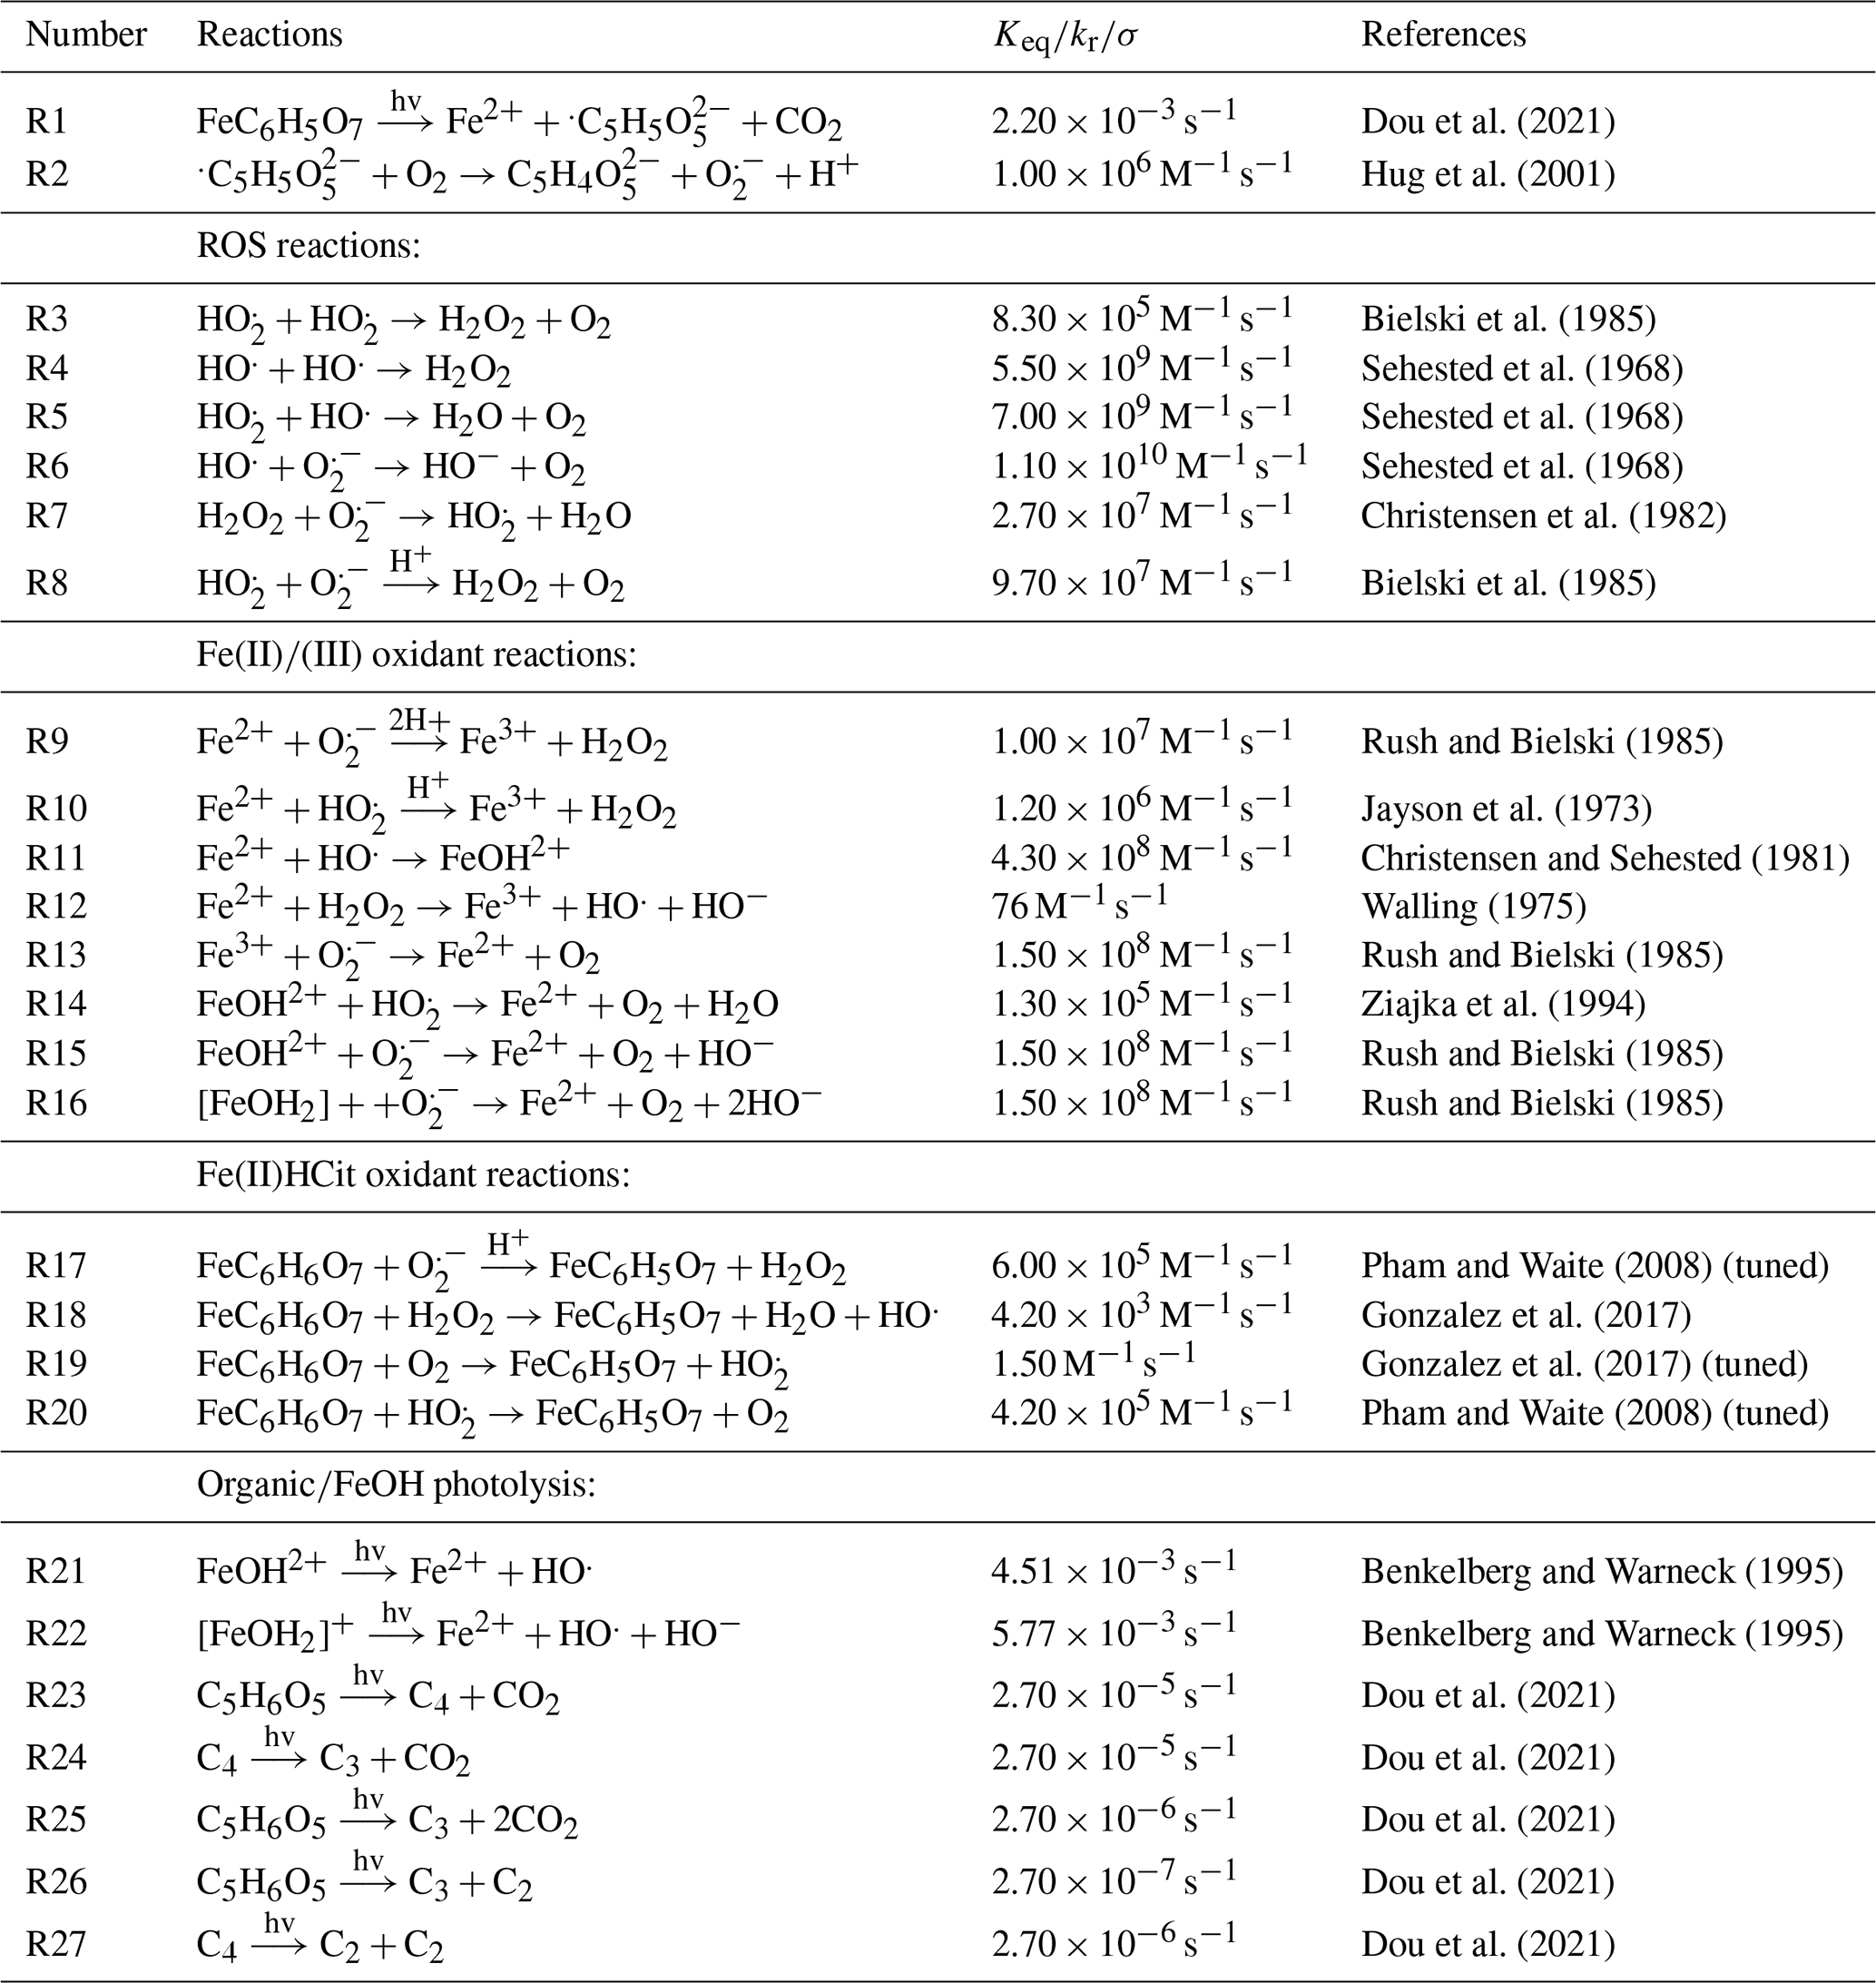
A kinetic box model (Kintecus solver package V2021, Ianni, 2017) was used to simulate the photochemical reduction and reoxidation of iron under variable RH, both with and without copper. Kintecus is a homogeneous phase-box model, which means that it does not account for inhomogeneity within particles. The model includes reactions, species descriptions, and parameter descriptions designed to replicate the flow conditions in the STXM environmental cell. A summary of the chemical mechanisms, equilibrium constants, and reaction rate coefficients used in the model is presented in Tables 1 and 2. Except for reaction R19, where the rate coefficient was adjusted from kr = 3.00 ± 0.70 to 1.50 for better simulation performance, all reaction rate constants were taken from Gonzalez et al. (2017). The initial conditions for the chemical concentrations were calculated as detailed in Sect. E of the Appendix, with the initial β before UV irradiation based on STXM/NEXAFS experimental data. A constant acidity of pH = 2 was maintained.
The phase transfer of a molecule (M) from the gas to the aqueous phase, M(g)→M(aq), was modeled with the rate , where ωM is the mean thermal velocity of M and is the surface-to-volume ratio of a particle. The reverse rate, M(aq)→M(g), was modeled using Henry's law and given as . Chemical reactions and molecular diffusion can limit changes in particle composition over time (Berkemeier et al., 2013), often leading to lower concentrations of species in the gas phase within particles than expected in equilibrium. In the case of rapid O2 uptake and reaction with condensed phase molecules (reaction R2 in Table 2), O2 maintains Henry's law of equilibrium only near the particle surface, while its concentration rapidly decreases due to its reaction with abundant organic radicals. As our box model is non-depth resolving, the transfer of oxygen to the particle, , was parameterized to account for this limitation. We treated as an effective uptake coefficient parameterized as , where , a1=12.40, and a2=27.78 based on fitting our results to those of the multilayer PRAD model (Dou et al., 2021). Although our box model does not account for molecular diffusion within particles, despite prior evidence of radial concentration gradients in FeIII(Cit), it still serves as a useful tool to explore mechanistic scenarios, particularly how copper affects FeIII(Cit) photochemistry. In future studies, a multilayer model informed by this work could be developed for a more detailed investigation.
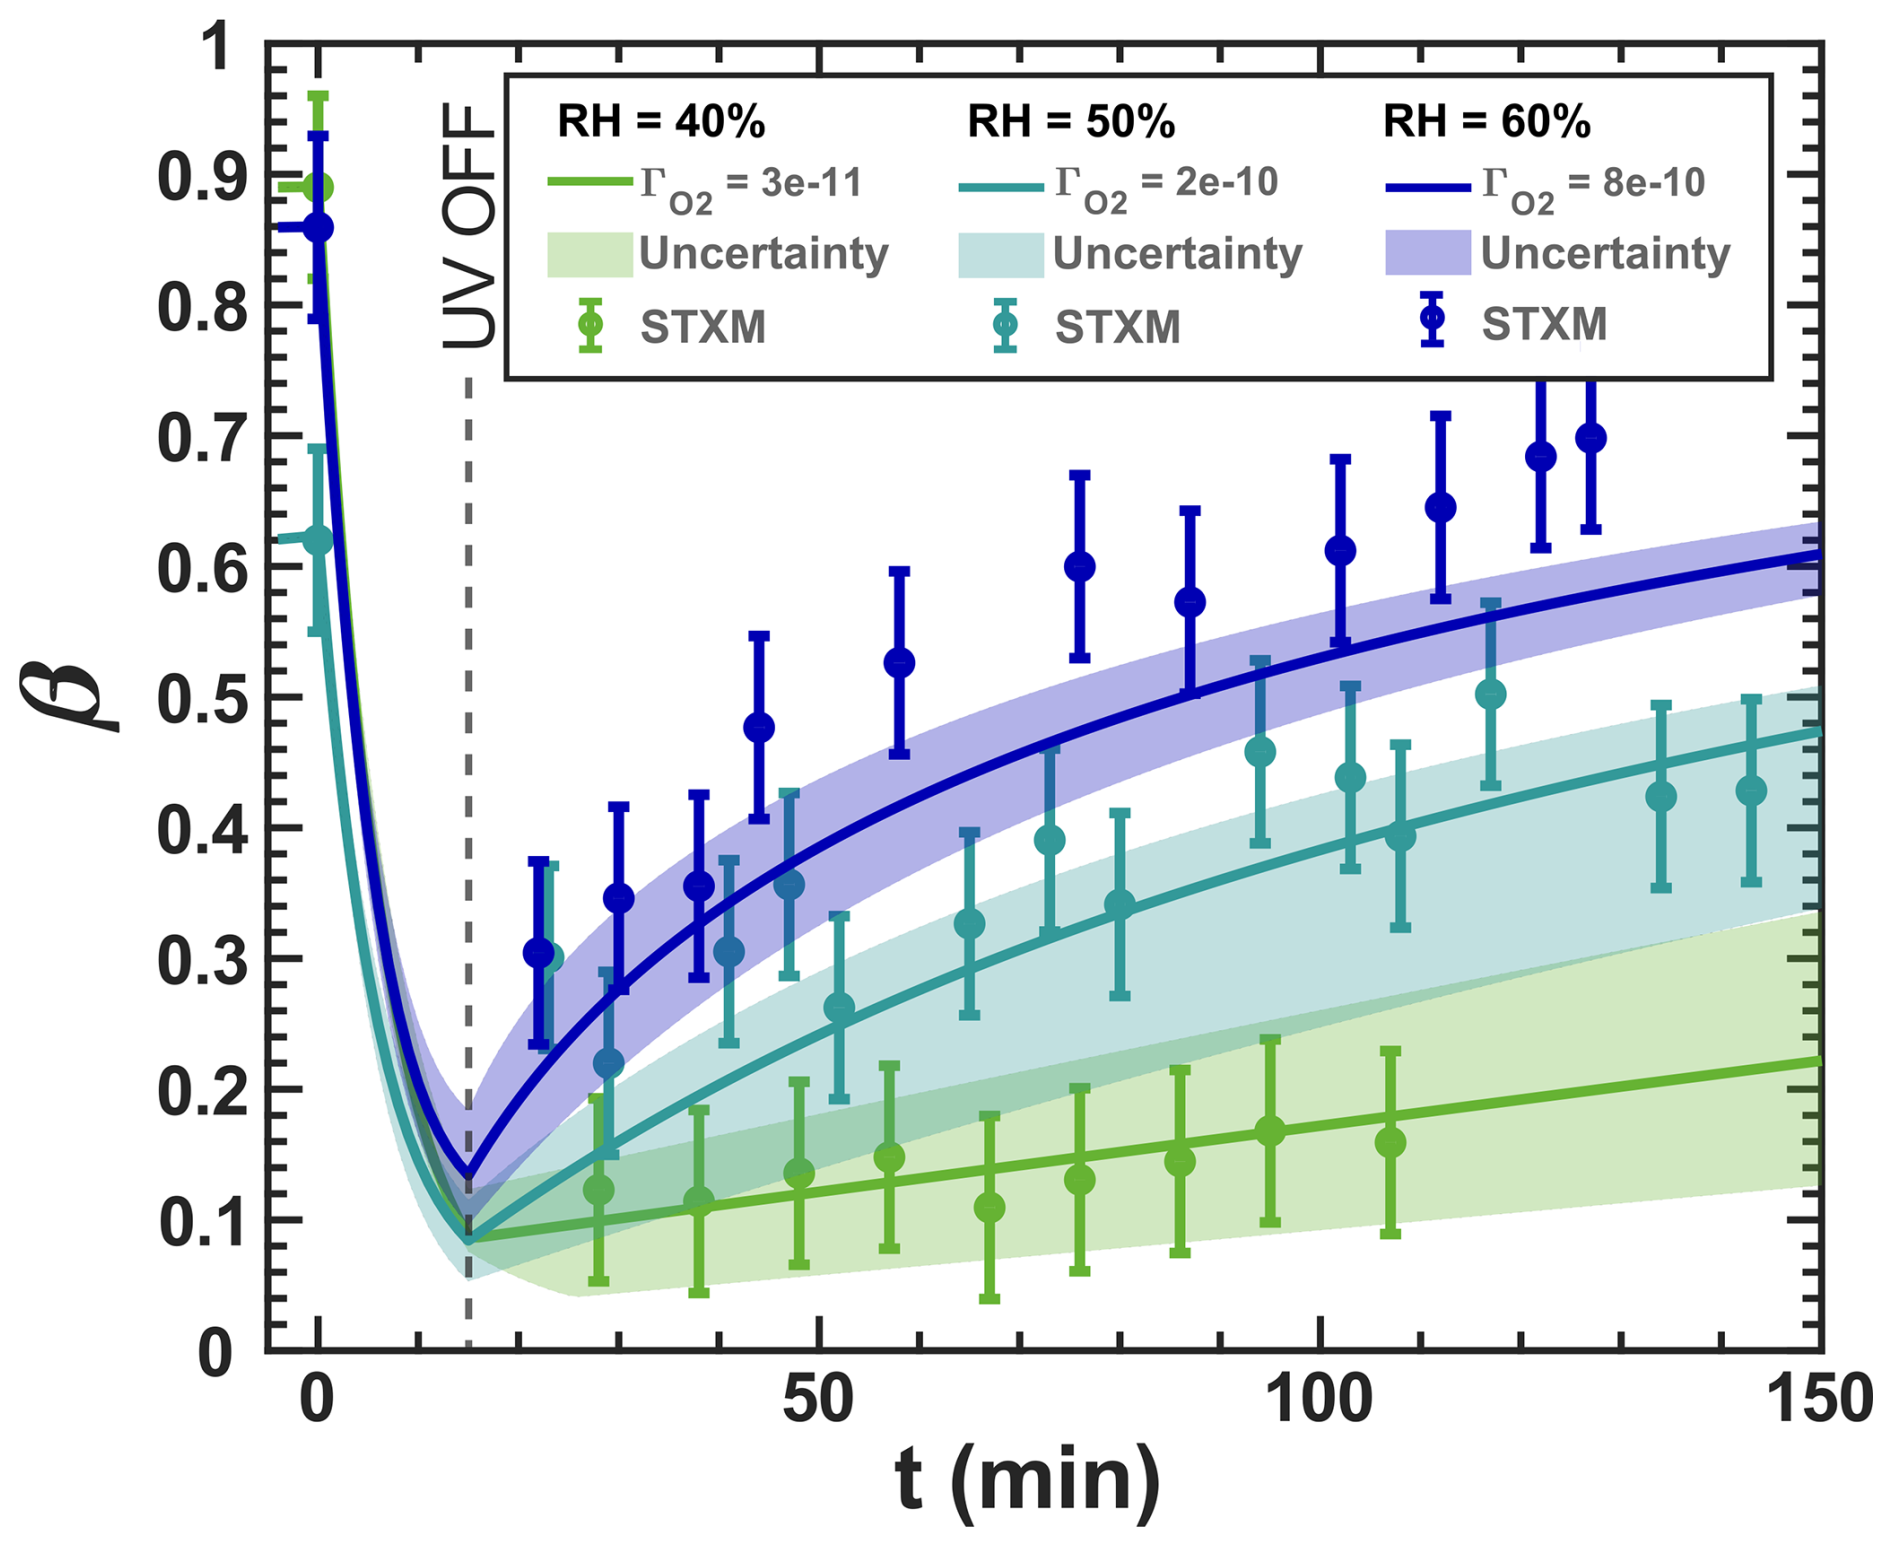
Figure 3Iron(III) fraction, β, as a function of time, t, for 15 min of irradiation (0.2 × 10⁻³ s−1) followed by a period of dark reoxidation under three humidity conditions. Each humidity scenario with a different oxygen uptake coefficient, , is shown as green for RH = 40 % and , turquoise for RH = 50 % and , and blue for RH = 60 % and . The circles with error bars are previous data (Dou et al., 2021), while the straight lines correspond to the output from the updated Kintecus model. The model uncertainty is the shaded area, stemming from uncertainty in measured RH and light intensity.
Figure 3 shows previously published data from three separate reoxidation experiments with FeIII(Cit):CA particles at a 1:1 mole ratio, conducted at RH = 60 %, 50 %, and 40 % (depicted as blue, turquoise, and green, respectively) (Dou et al., 2021). Data points at t=0 min are measurements taken before UV irradiation and serve as the initial β values for each box model scenario. The box model results, shown as lines, agree well with the experimental data, taking into account the uncertainties in both the experimental data and the model, which mainly stem from variations in RH at ±2 % and light intensity. Using these results as a reference for the FeIII(Cit) system, we will adapt our box model in the results section to simulate the reduction and reoxidation of photochemically aged FeIII(Cit) CuII(HCit) CA particles and explore potential reaction mechanisms. The model uncertainties (colored area) stem from the uncertainty in RH of ±2.5 %, the light intensity, and the oxygen uptake coefficient (). This was used in the model calculations to represent the change in particle viscosity at different RH.
Welch et al. (1969)De Laat and Le (2005)Bielski et al. (1985)Martell and Smith (1982)Martell and Smith (1982)Martell and Smith (1982)Dou et al. (2021)Dou et al. (2021)Dou et al. (2021)Dou et al. (2021)Dou et al. (2021)Dou et al. (2021)Brandt and van Eldik (1995)Hemmes et al. (1971)Table 1Chemical equilibria with equilibria constants (Keq) and reaction rate constants (kr) for forward and reverse reactions at pH = 2.
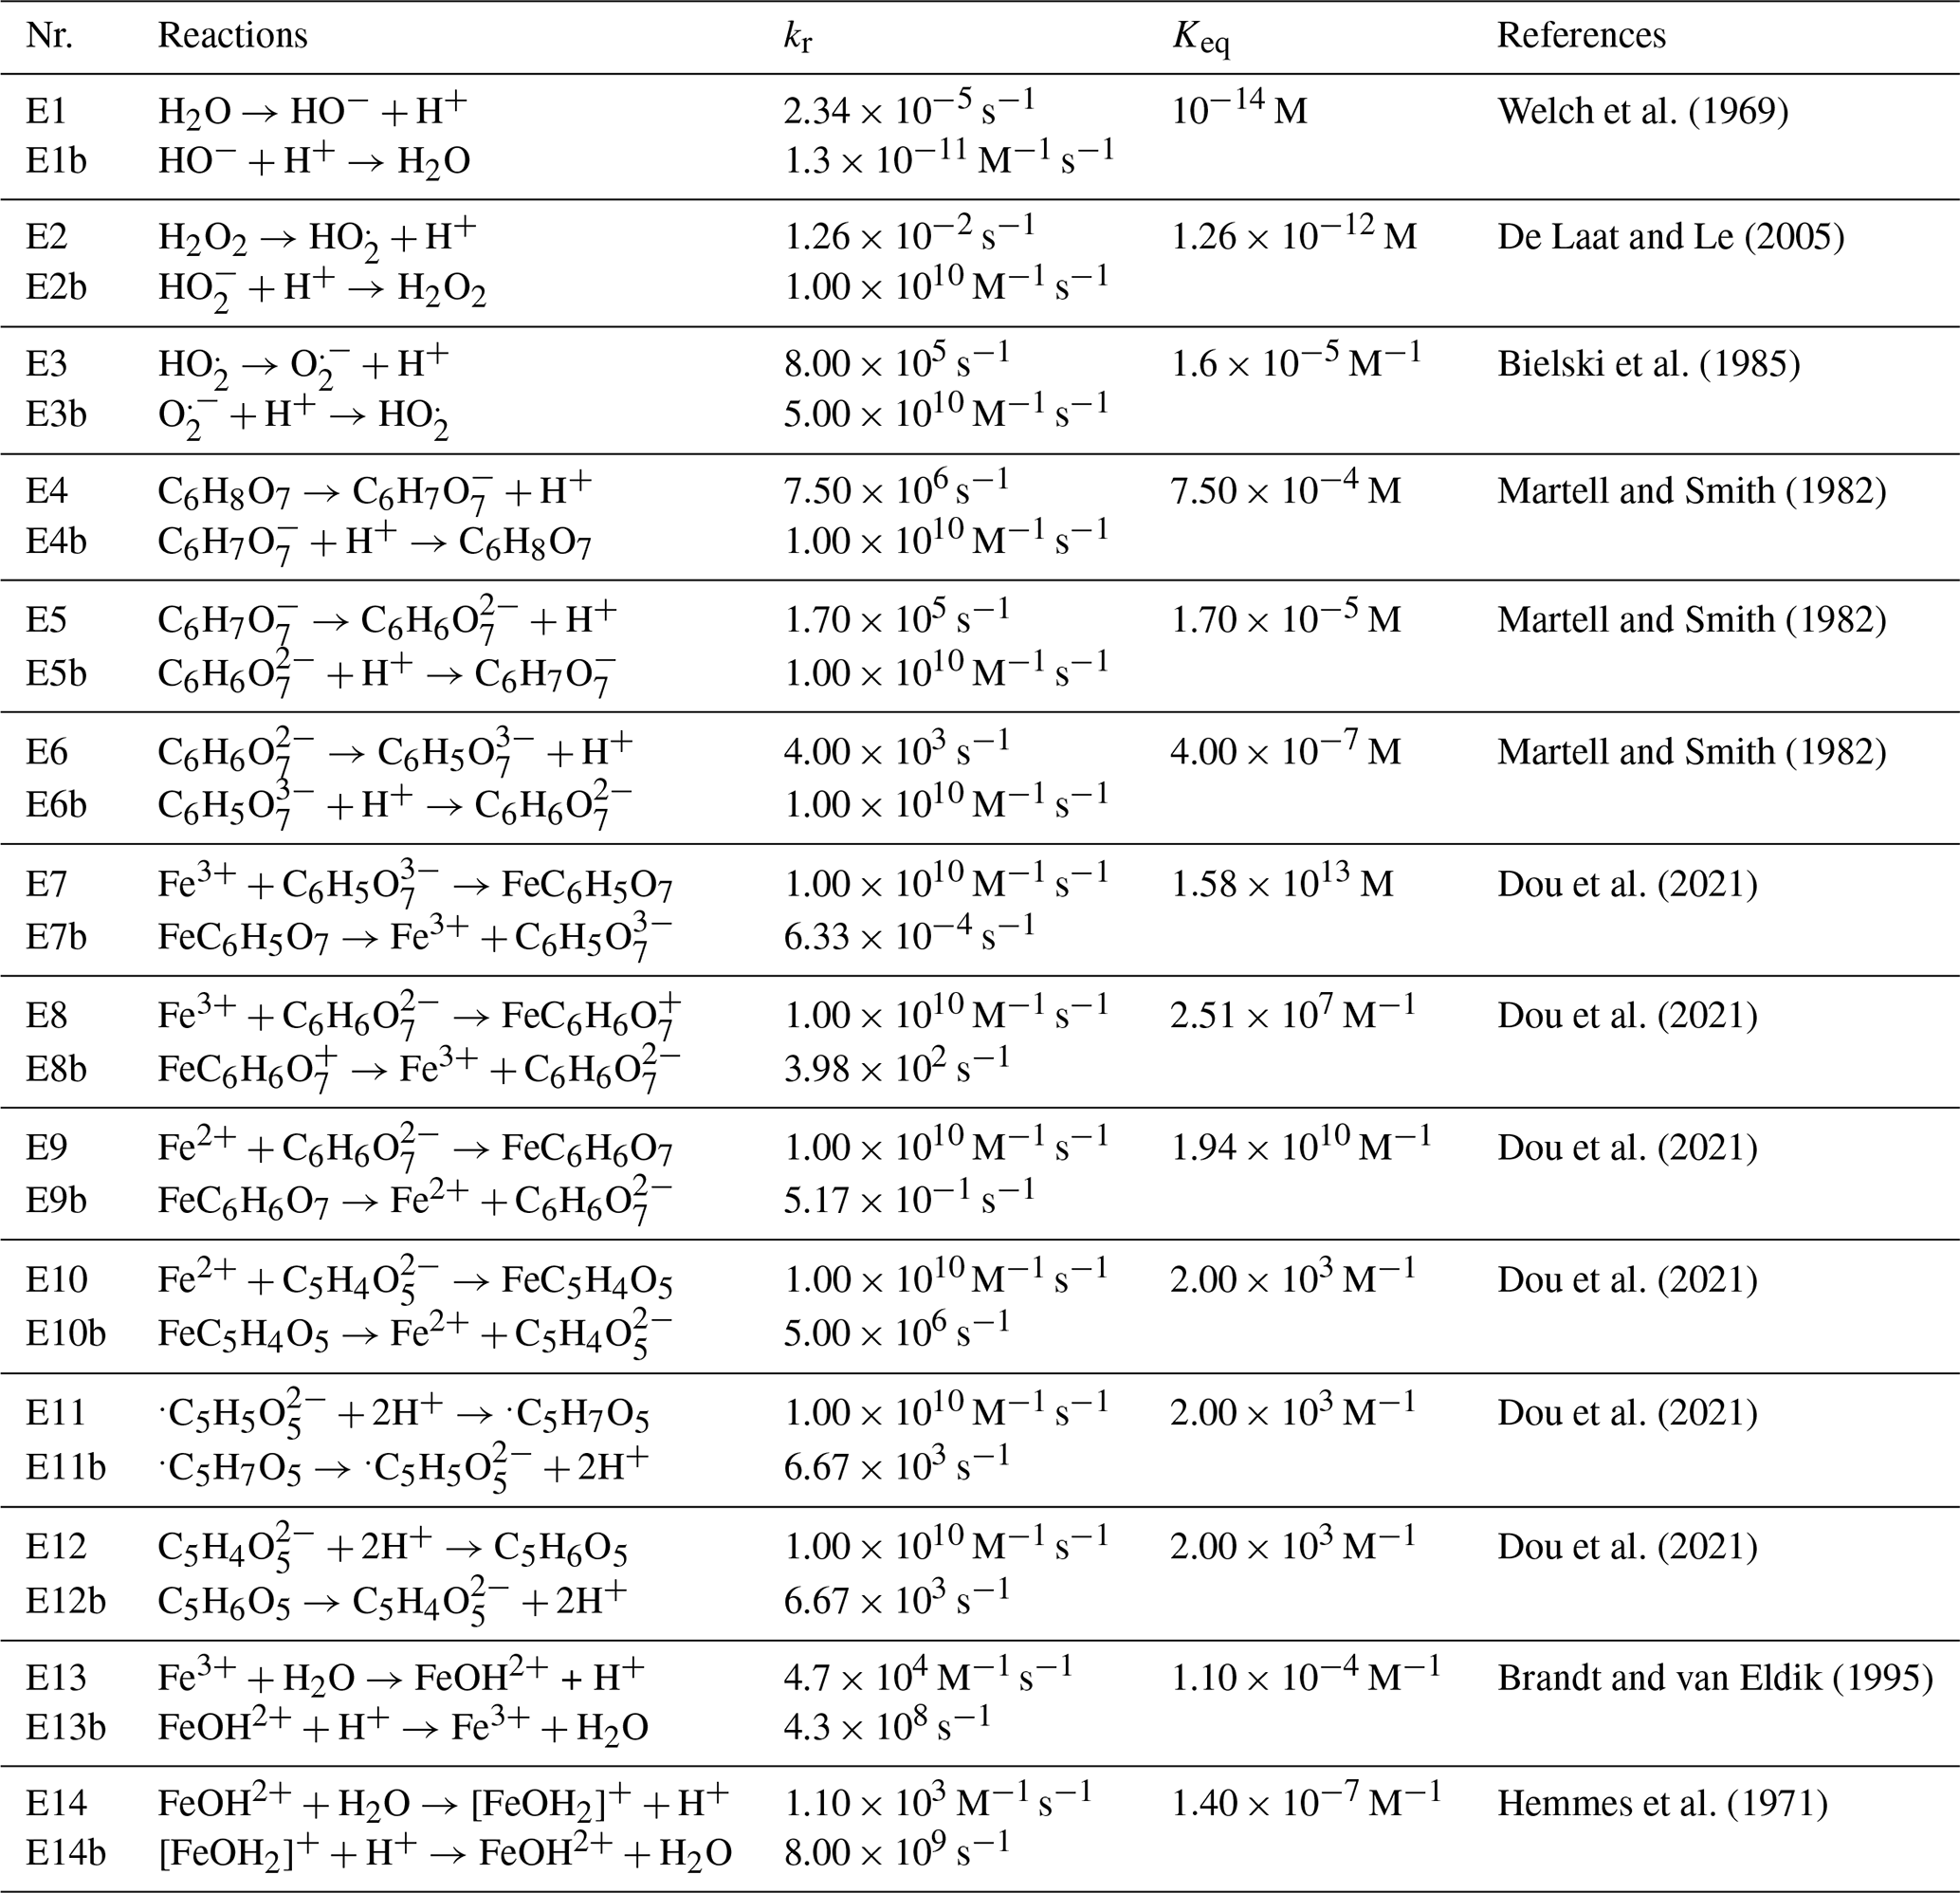
Table 2Chemical reactions with rate constants and photolysis frequencies used in Kintecus at pH = 2.
3.1 Iron(III) reduction experiments
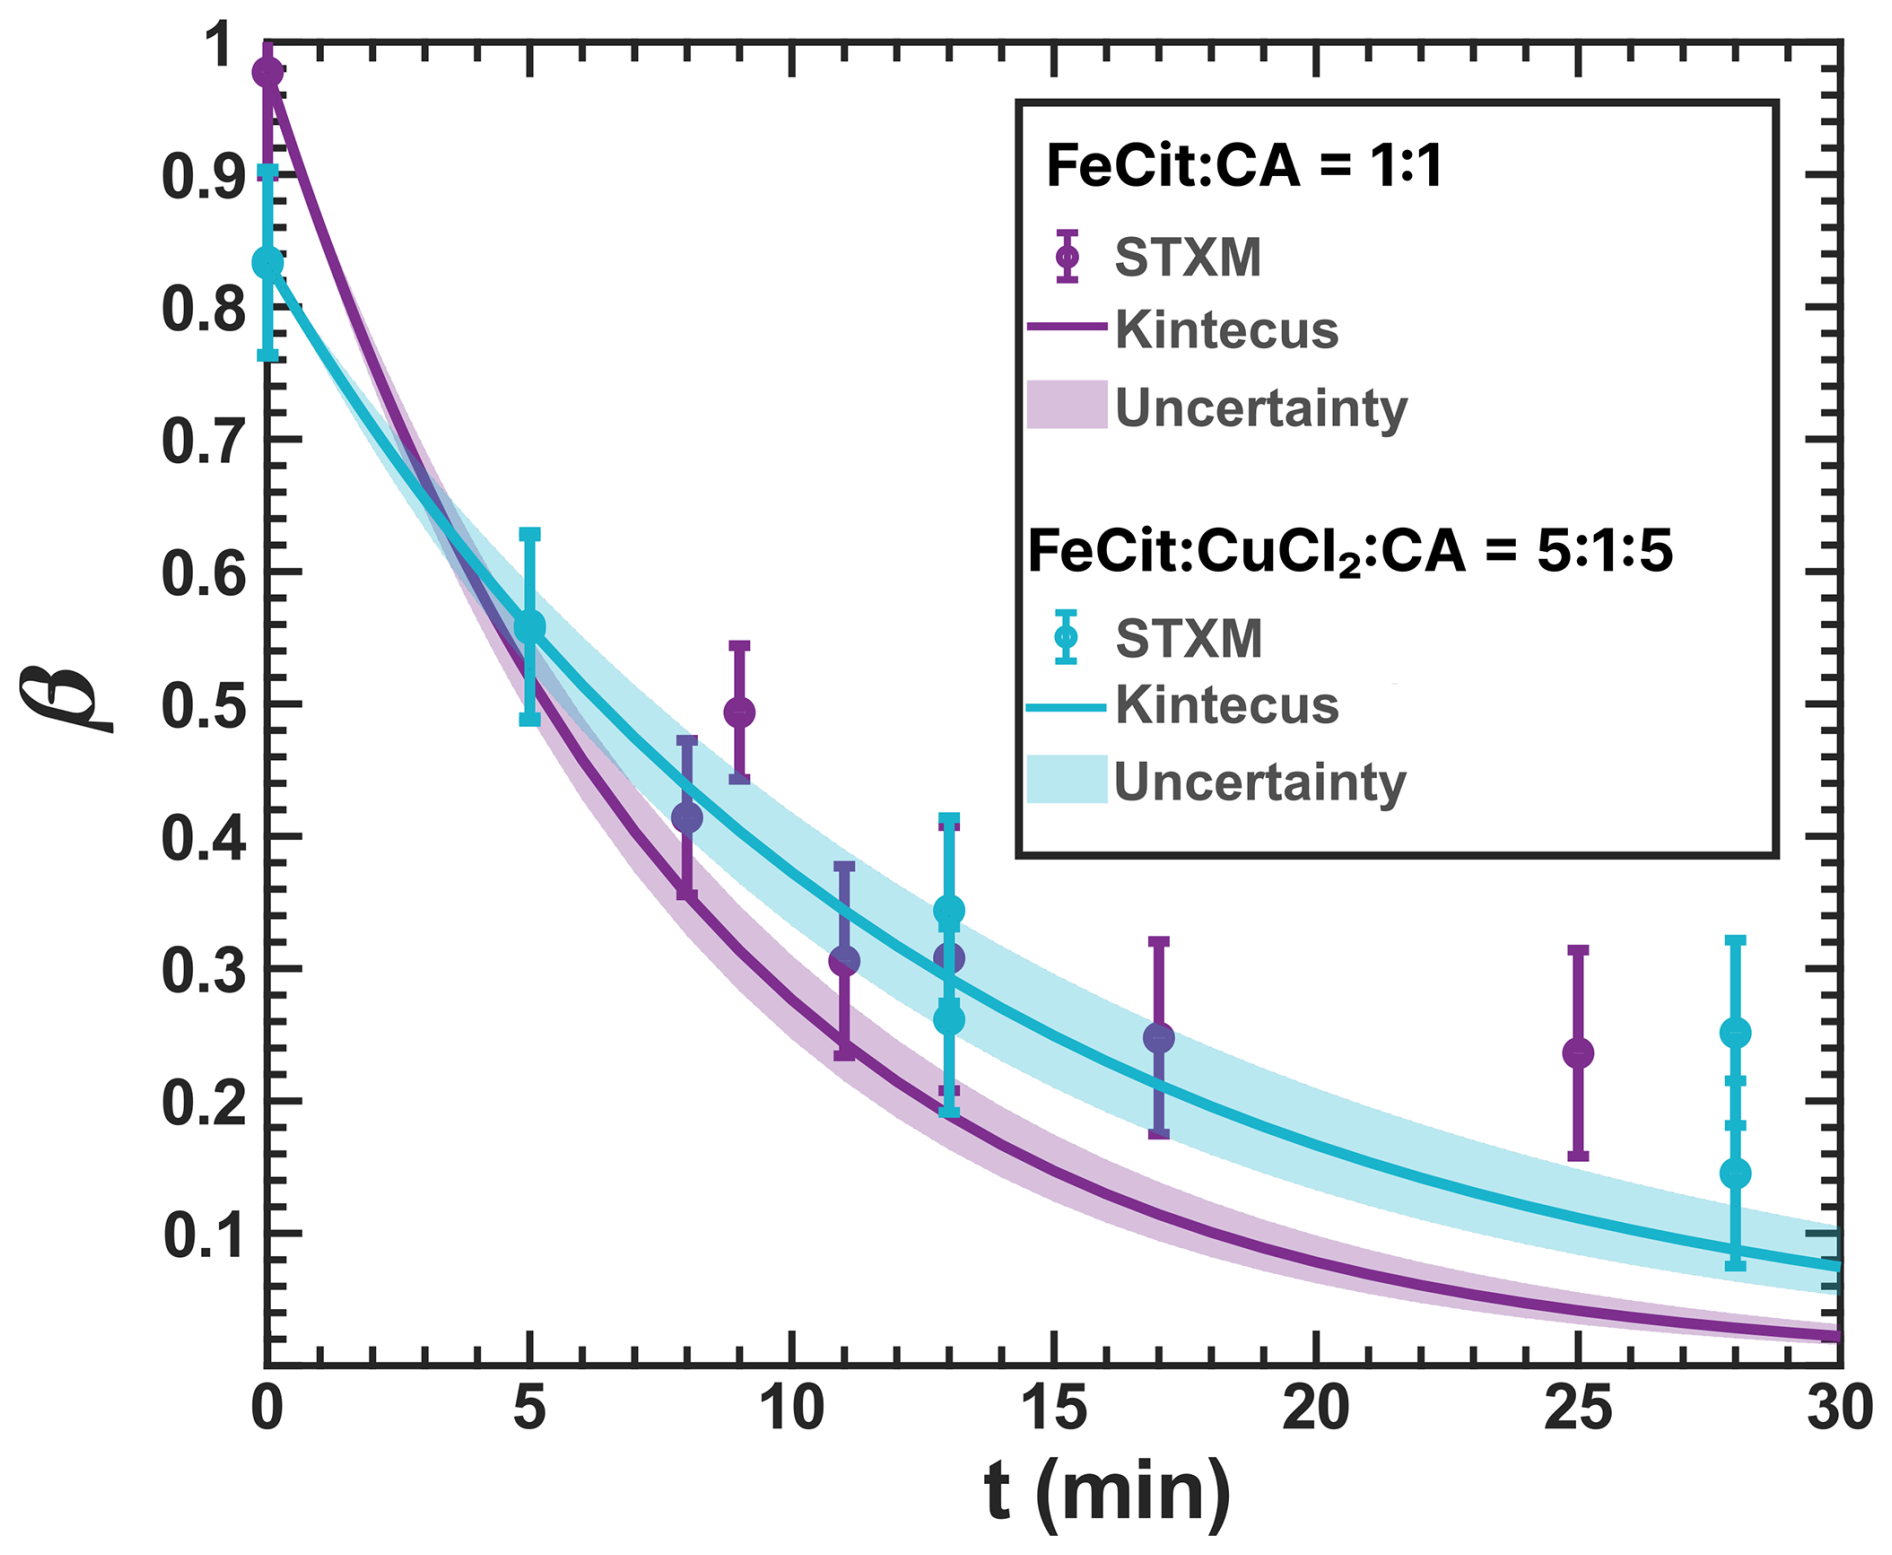
Figure 4Iron(III) fraction, β, as a function of time and irradiated with UV light from an LED with a narrow wavelength band centered at 370 nm. The plot shows circles and lines as measurements and model output, respectively. The light-blue measurements, performed in the environmental cell without O2 and RH = 0 %, show irradiation of at a mole ratio with the corresponding model output from this work. We have used a UV intensity of 2.36 ± 0.06 × 10⁻³ W m−2, which resulted in a calculated photolysis frequency of 10−3 s−1 for 10 min. Violet data and model output are from a previous study using with a UV intensity of 3.6 ± 0.6 × 10⁻³ W m−2 and modeled using a photolysis frequency 10−3 s−1 (Dou et al., 2021). An iron(II) quantum yield, ϕ=1, was used to calculate j. Error bars are ±0.07 or propagated from the photon counting error, whichever is larger.
Figure 4 shows β under vacuum conditions (without O2 and RH = 0). Light exposure resulted in the reduction of iron from its initial condition, both in the presence and absence of copper as CuCl2, with a photolysis frequency 10−3 s−1. However, consistently higher values of β were observed compared to our model predictions at longer exposure times. Our box model reproduces measurements of iron reduction in the photochemical system, confirming j used in previous experiments conducted under vacuum conditions, with ϕ=1 (Dou et al., 2021). This agreement suggests that the system aligns with the calculated photochemical loss rate until β falls below 0.2 at an exposure time of 17 min. Under vacuum conditions, both FeIII(Cit) alone or its mixture with CuCl2 are expected to be present as crystalline or amorphous (glassy) solid, potentially phase separated or mixed phase. We also applied ϕ=1 in the model shown in Fig. C1. From these results, we conclude the following. First, CuCl2 does not affect the initial photochemical reaction steps to reduce FeIII(Cit). Second, ϕ for the photochemical reduction between 345 and 385 nm for and is between 0.9 and 1. Previous studies have reported photoreduction of pure crystalline FeIII(Cit) through observation of CO2 production (Abrahamson et al., 1994), indicating that the solid matrix does not impede iron(III) reduction. ϕ=0.3 has been reported for FeIII(Cit) in aqueous solutions (Pozdnyakov et al., 2014). Furthermore, Corral Arroyo et al. (2022) reported enhanced photoreduction in pure FeIII(Cit) particles through resonant nanofocusing. Although we did not image photoreduction hotspots (likely due to different optical properties or the non-spherical shape of the mixed particles considered here), such photochemical enhancement may account for the higher ϕ in our reduction experiments compared to aqueous solutions.
3.2 Iron reoxidation experiments
Figure 5 shows STXM/NEXAFS images of particles from previous experiments (Alpert et al., 2021) (Fig. 5a and b) compared to images of acquired in this study (Fig. 5c and d) before and after reoxidation. The color bar indicates β determined from the STXM/NEXAFS experiments.
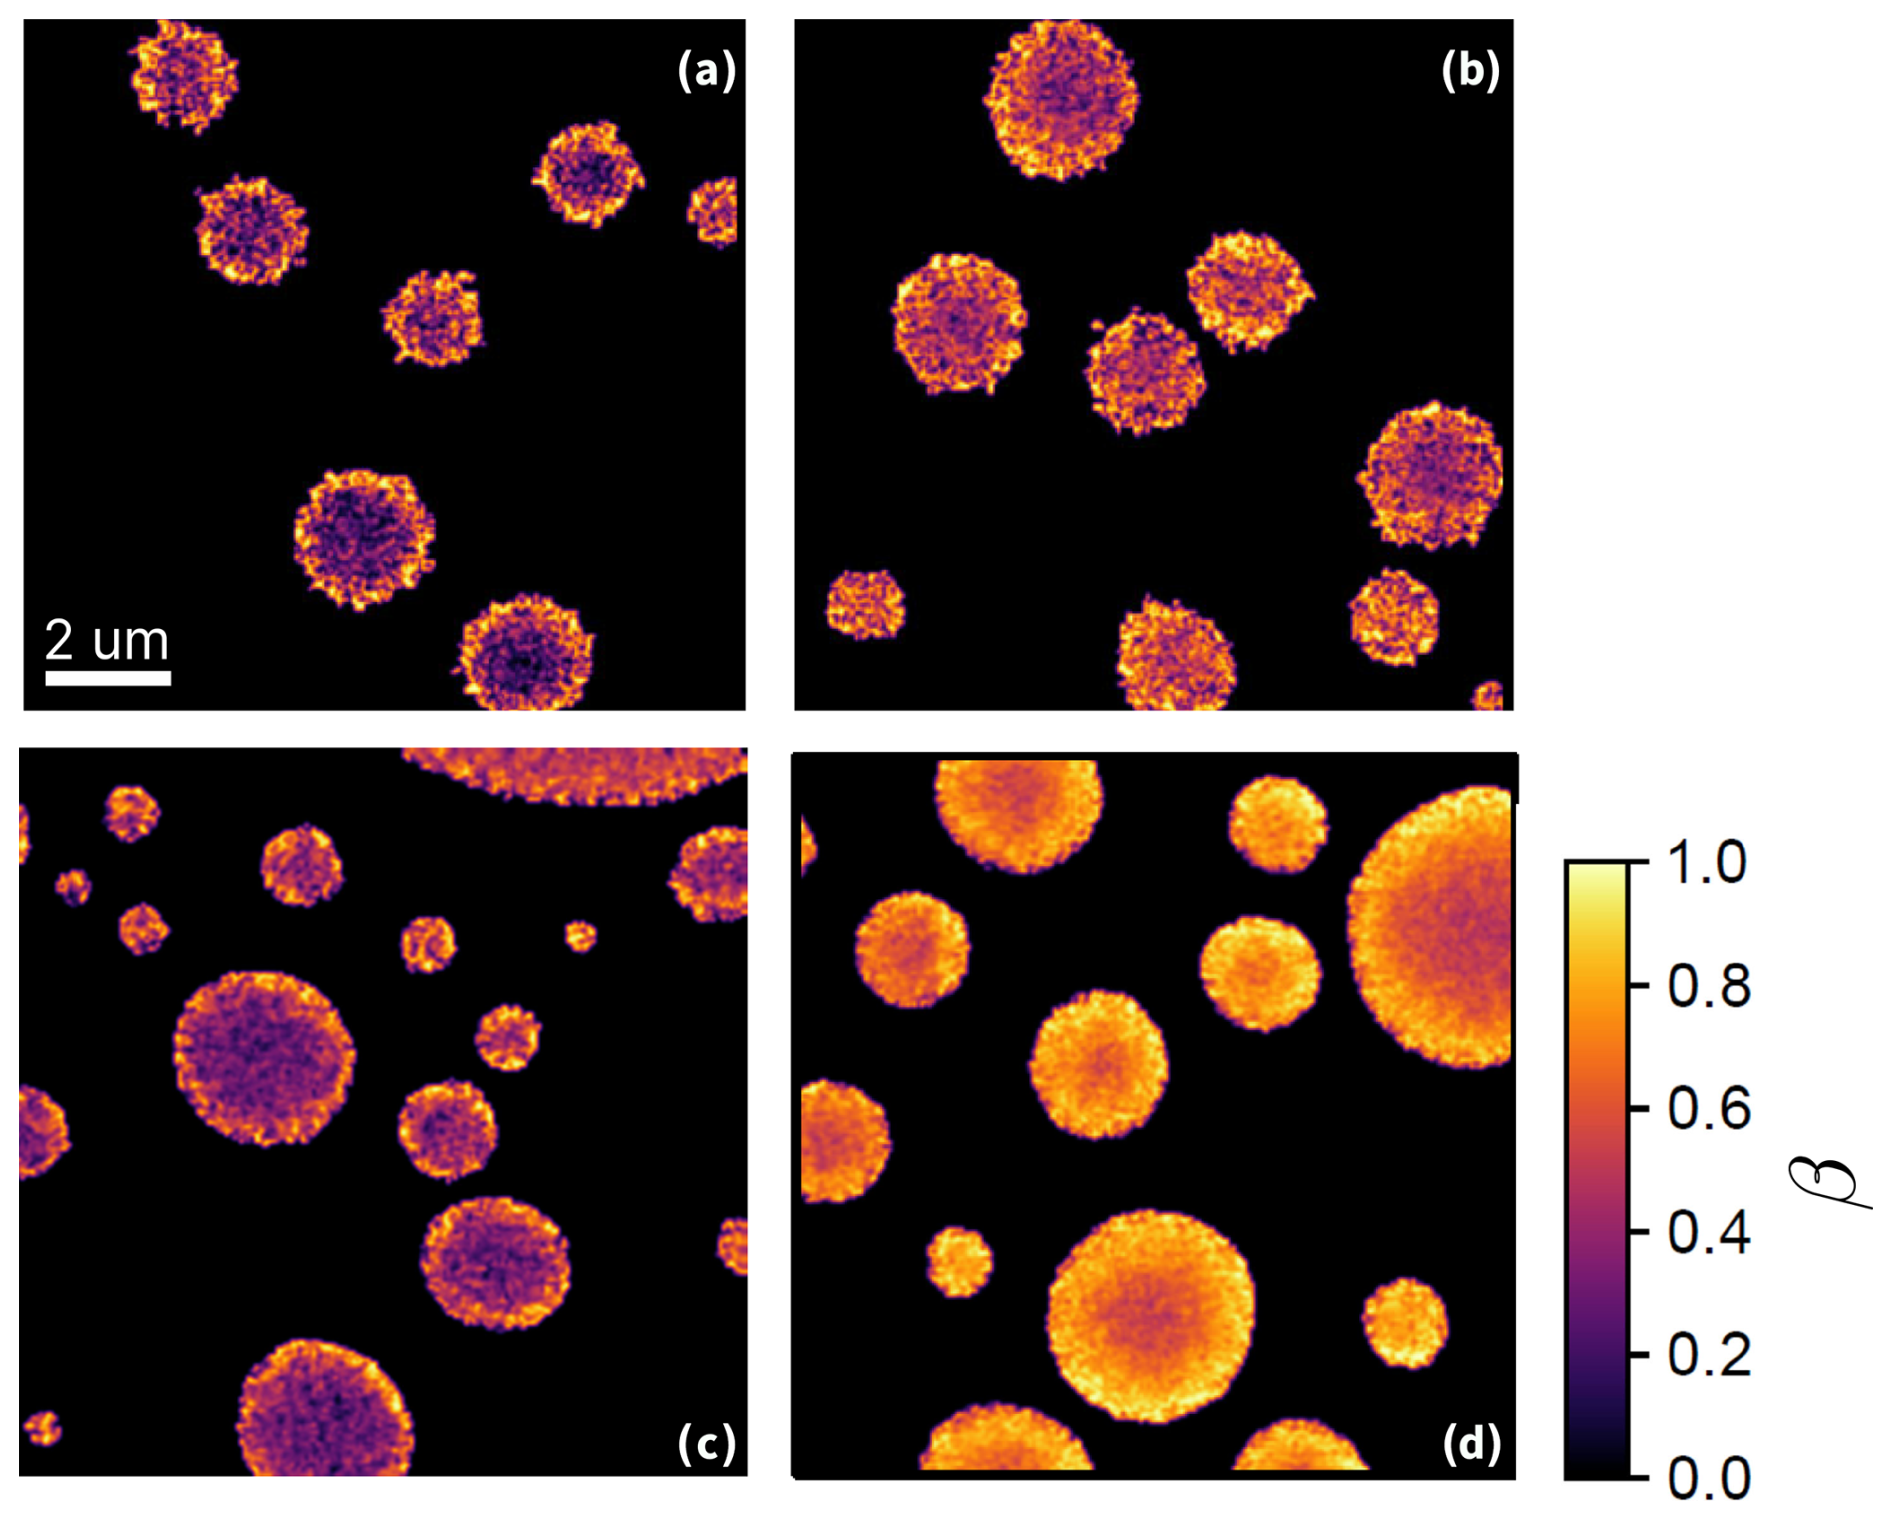
Figure 5STXM/NEXAFS images of the iron(III) fraction, β, of (a) and (b) FeIII(Cit):CA particles with a mole ratio of 1:1 shortly after irradiation and following more than three hours of reoxidation, respectively (adapted from Alpert et al. (2021) with permission by CC-BY license). (c) and (d): particles with a mole ratio of after being UV-aged for 10 min following ∼2 min and 1 hour of reoxidation, respectively. All images were taken under the same flow cell conditions at RH = 47 % and T=20 °C.
Figure 5a was acquired after 10 min of illumination followed by ∼2 min of reoxidation in the dark at 47 % RH. In this case, the smaller particles and the outermost layers of the larger particles were more oxidized compared to the centers of the larger particles. Figure 5b is a STXM image of particles on the same sample 1 hour after the light was turned off, still showing only a small overall increase in the FeIII fraction and, again, more so in the outermost layers. As discussed in our previous work (Alpert et al., 2021), at this RH, this slow reoxidation is strongly limited by the supply of O2, which fuels the formation of peroxy radicals that drives the process. Due to the short reacto-diffusive length for O2 at this RH, this reaction occurred within a depth of just tens of nanometers, and the diffusional exchange of FeII and FeIII between the bulk and the surface was slow (Alpert et al., 2021). When particles were used with a mole ratio of (Fig. 5c and d), at the same RH, the initial photochemical reduction was similar, with a strong reduction in the particle centers and more oxidized surface layers. However, after 1 h of dark reoxidation (Fig. 5d), still at 47 % RH, the particles showed a substantially greater extent of reoxidation compared to Fig. 5b (after 3 h in the dark), with a several-hundred-nanometer-thick FeIII layer, a gradient in β toward the center of the particles, and a significantly higher FeIII fraction throughout the particle.
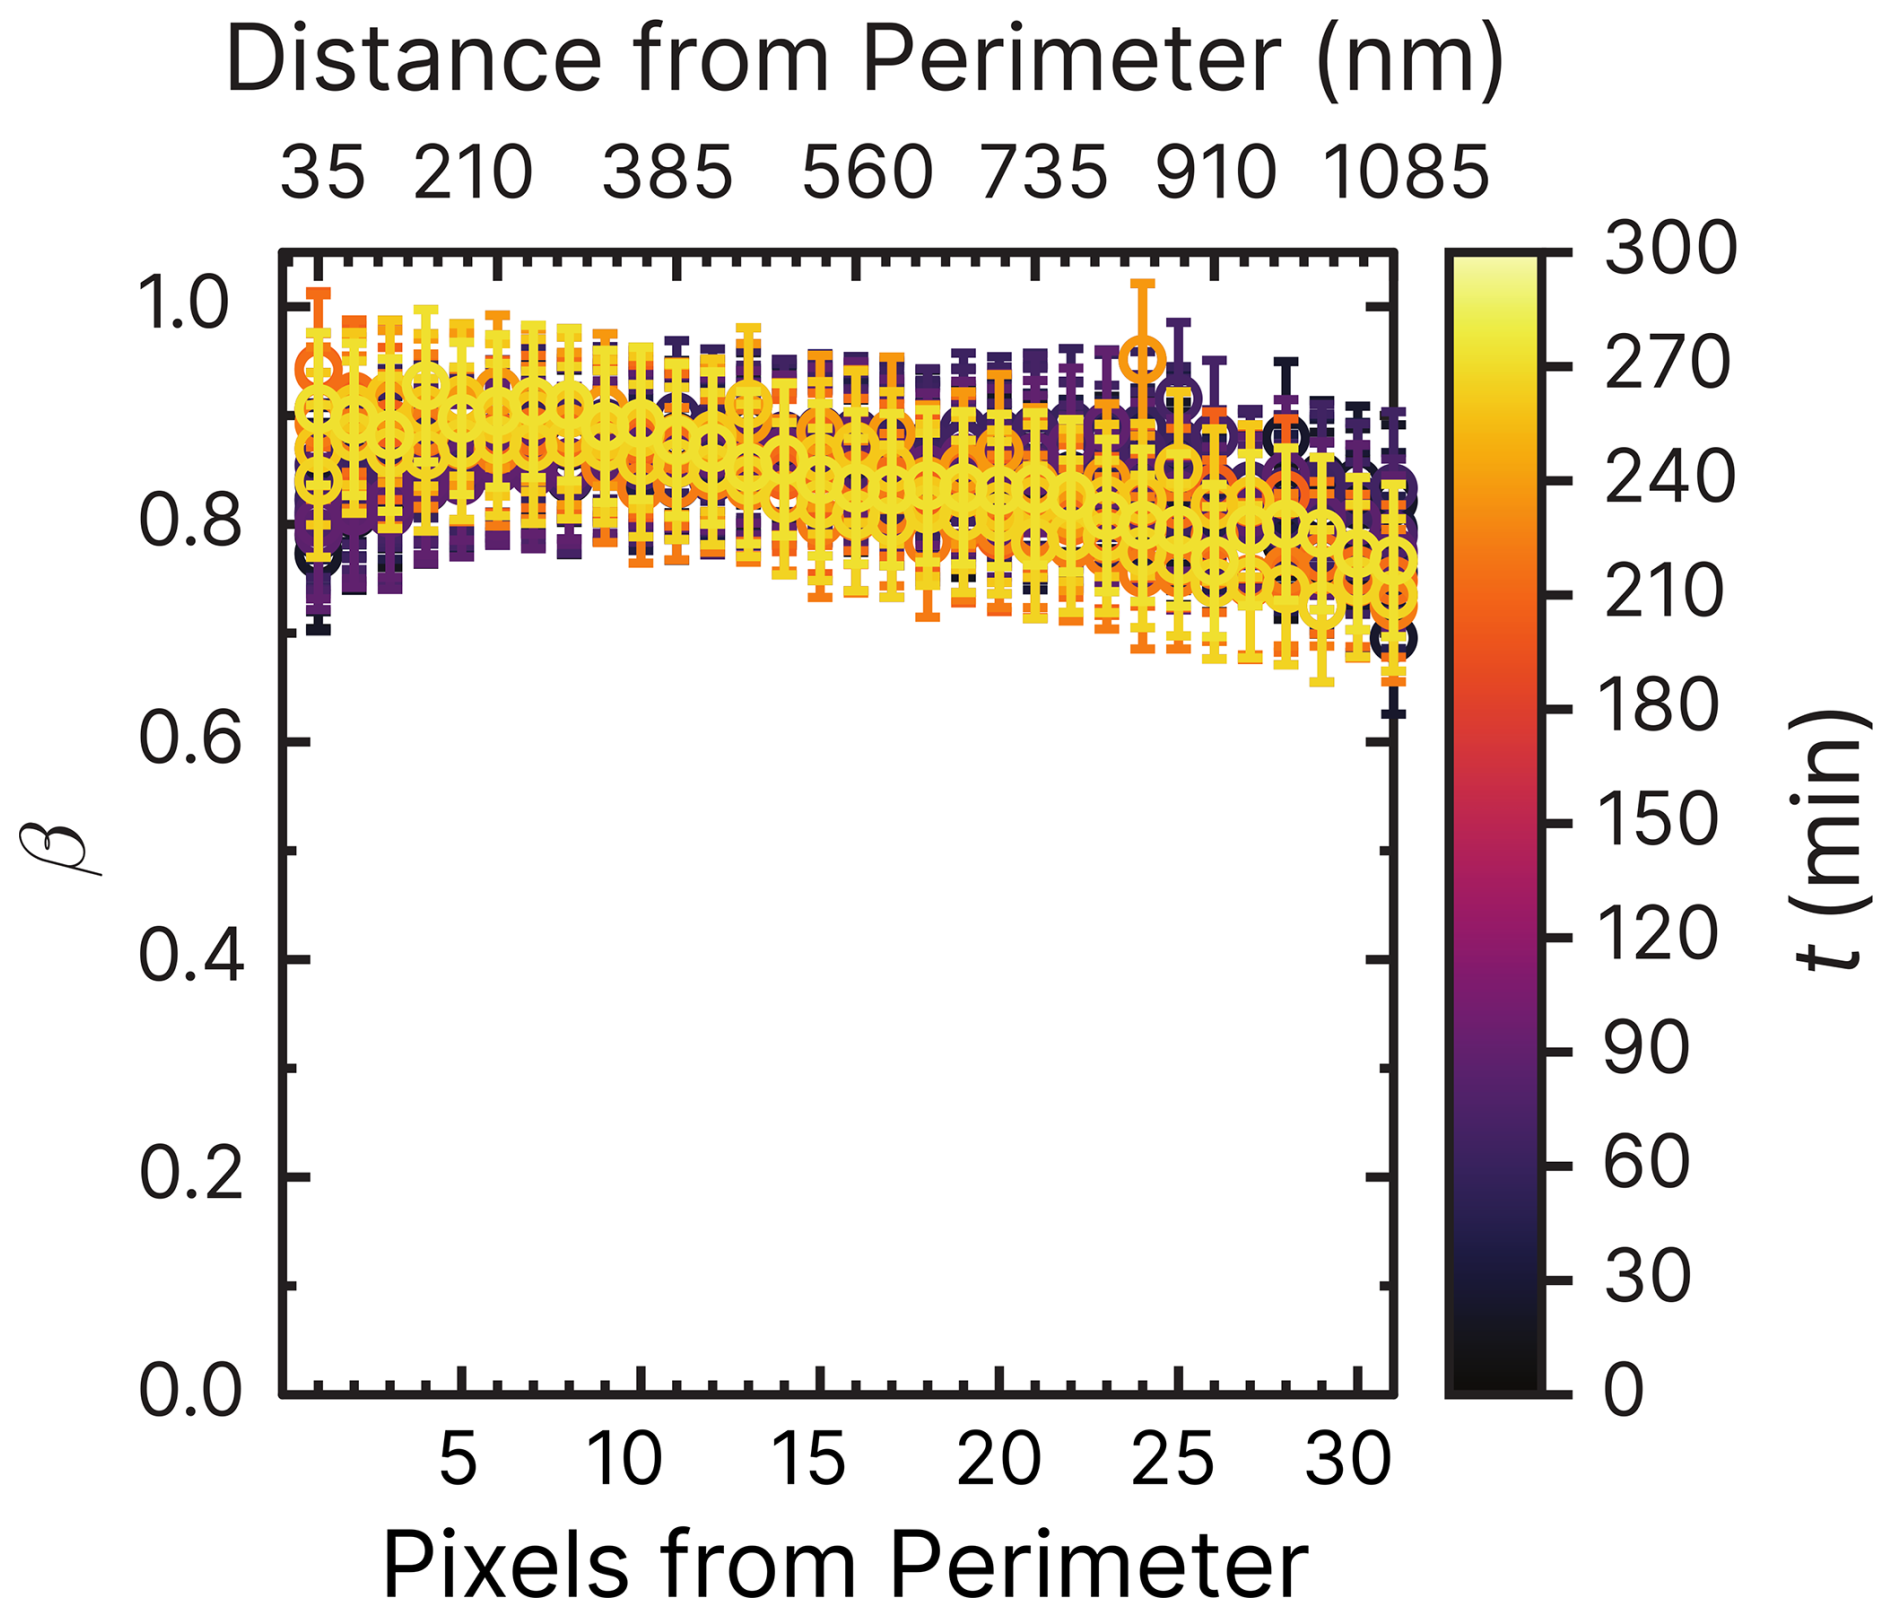
Figure 6Iron(III) fraction, β, as a function of the distance and pixels from the perimeter of particles. Each line of data points corresponds to measurements of a single image of multiple particles at a given time, t, during O2. The color scale is the t after O2 was introduced to the environmental cell. The experiment was conducted at RH = 47 % with a mole ratio of = . Error bars are ±0.07 or propagated from the photon counting error, whichever is larger.
The radial profile of β as a function of pixels and distance from the perimeter and the reoxidation time, t, is explored in Fig. 6. This figure presents β from 1 to 35 pixels (or 35 to 1085 nm) from the perimeter of particles (mole ratio of ) under RH = 47 % and O2, without prior irradiation. The color scale corresponds to the time since O2 was introduced to the gas flow. Initial β values of the samples were in the same range of 0.8–1 as the data of samples published in Alpert et al. (2021) and Dou et al. (2021). As a function of O2 exposure without light, β remained constant throughout the experiment at ∼0.85 within error. Only at t>200 min was iron(III) slightly reduced in the center of the particles and oxidized in the outer shells. This experiment has shown that O2 alone does not cause iron(III) to get significantly reduced or oxidized. The small fraction of FeII was initially likely due to handling, transferring, and mounting the samples in the STXM environmental cell despite all efforts to keep them from exposure to ambient light (see Sect. 2.3).
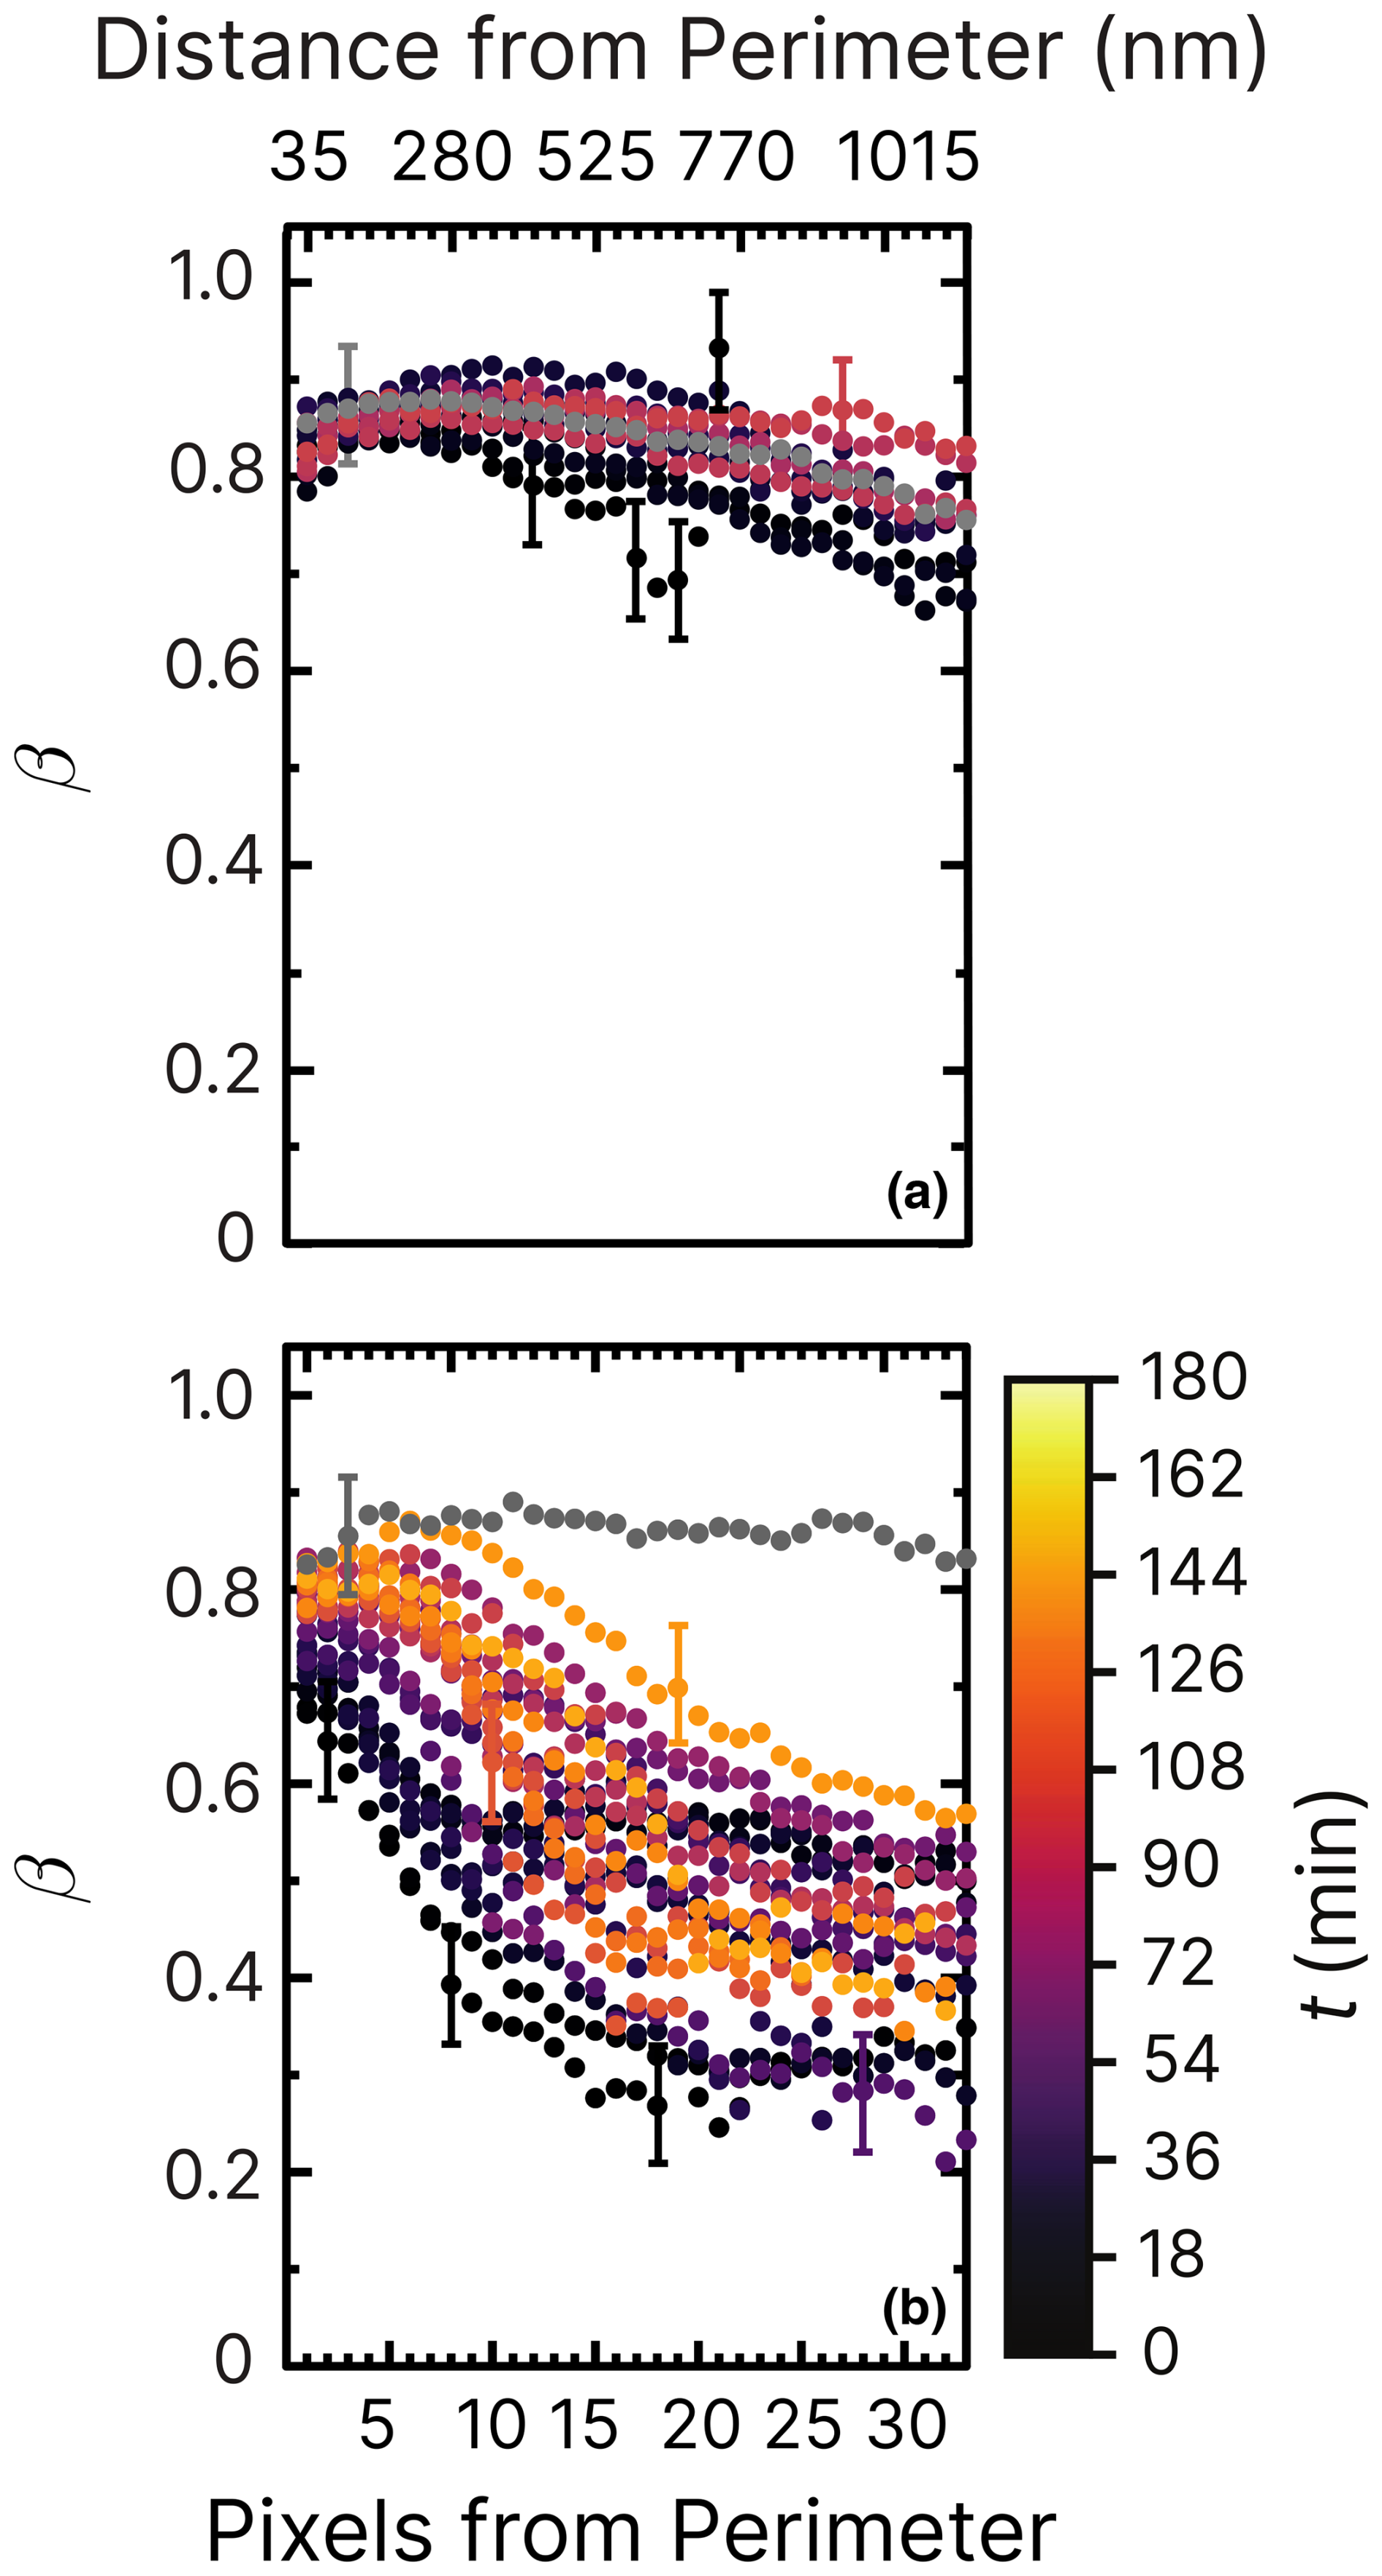
Figure 7Iron(III) fraction, β, as a function of the distance and pixels from the perimeter of particles and time, t, after UV light was switched off at RH = 47 % and a mole ratio of . The particles were irradiated after measuring the initial fraction β before irradiation (gray dots). The UV intensity used was (a) 2.36 ± 0.06 × 10⁻³ W m−2 and (b) 13.55 ± 0.06 × 10⁻³ W m−2, resulting in a calculated photolysis frequency of (a) s−1 for 10 min and (b) 10−3 s−1 for 10 min. The iron(III) fraction was then measured until ≈150 min after irradiation (light-orange dots). The error bars are not shown for better visibility but are similar in magnitude to Fig. 6. Error bars are ±0.07 or propagated from the photon counting error, whichever is larger.
In a new experiment (shown in Fig. 7a), particles were irradiated for 10 min at low UV intensity, 2.36 ± 0.06 × 10⁻³ W m−2, at the same RH = 47 % as in Fig. 6. A reduction in iron(III) was observed from β=0.9 to 0.7 in the interior of the particles within the first 30 min (black dots), followed by slow reoxidization. In particular, no changes were detected on the perimeter of the particles (pixels from perimeter <10). This contrasts with a previous study without copper (Alpert et al., 2021), where particles exposed to similar UV intensity (3.6 ± 0.06 × 10⁻³ W m−2) and humidity (RH = 50 %) showed markedly lower β. In that case, the initial reduction was also much more significant (β≃0.2), and reoxidation occurred only slightly toward the surface. These findings indicate that copper strongly influences iron(III) reoxidation by altering the rate of FeIII photoreduction (R1 in Table 2), despite the comparable photoreduction observed under vacuum conditions (Fig. 4).
The measurement was repeated at a higher UV intensity (13.55 ± 0.06 × 10⁻³ W m−2, as shown in Fig. 7b). In this case, β remained high near the surface but decreased sharply toward the center of the particles at values ≃0.4–0.3. Immediately after the UV lights were turned off (early reoxidation, t=0–15 min), β in the first 100 nm dropped from about 0.8 to 0.7, while β dropped to 0.3 at 500 nm within particles. We note that β reached values of 0.2 in the core of particles within the first 100 nm from the perimeter of particles (Alpert et al., 2021), in stark contrast to our observations where much higher light intensity was used. Experiments under different humidity conditions allow us to further differentiate the impact of copper on ϕ and the reoxidation rate.
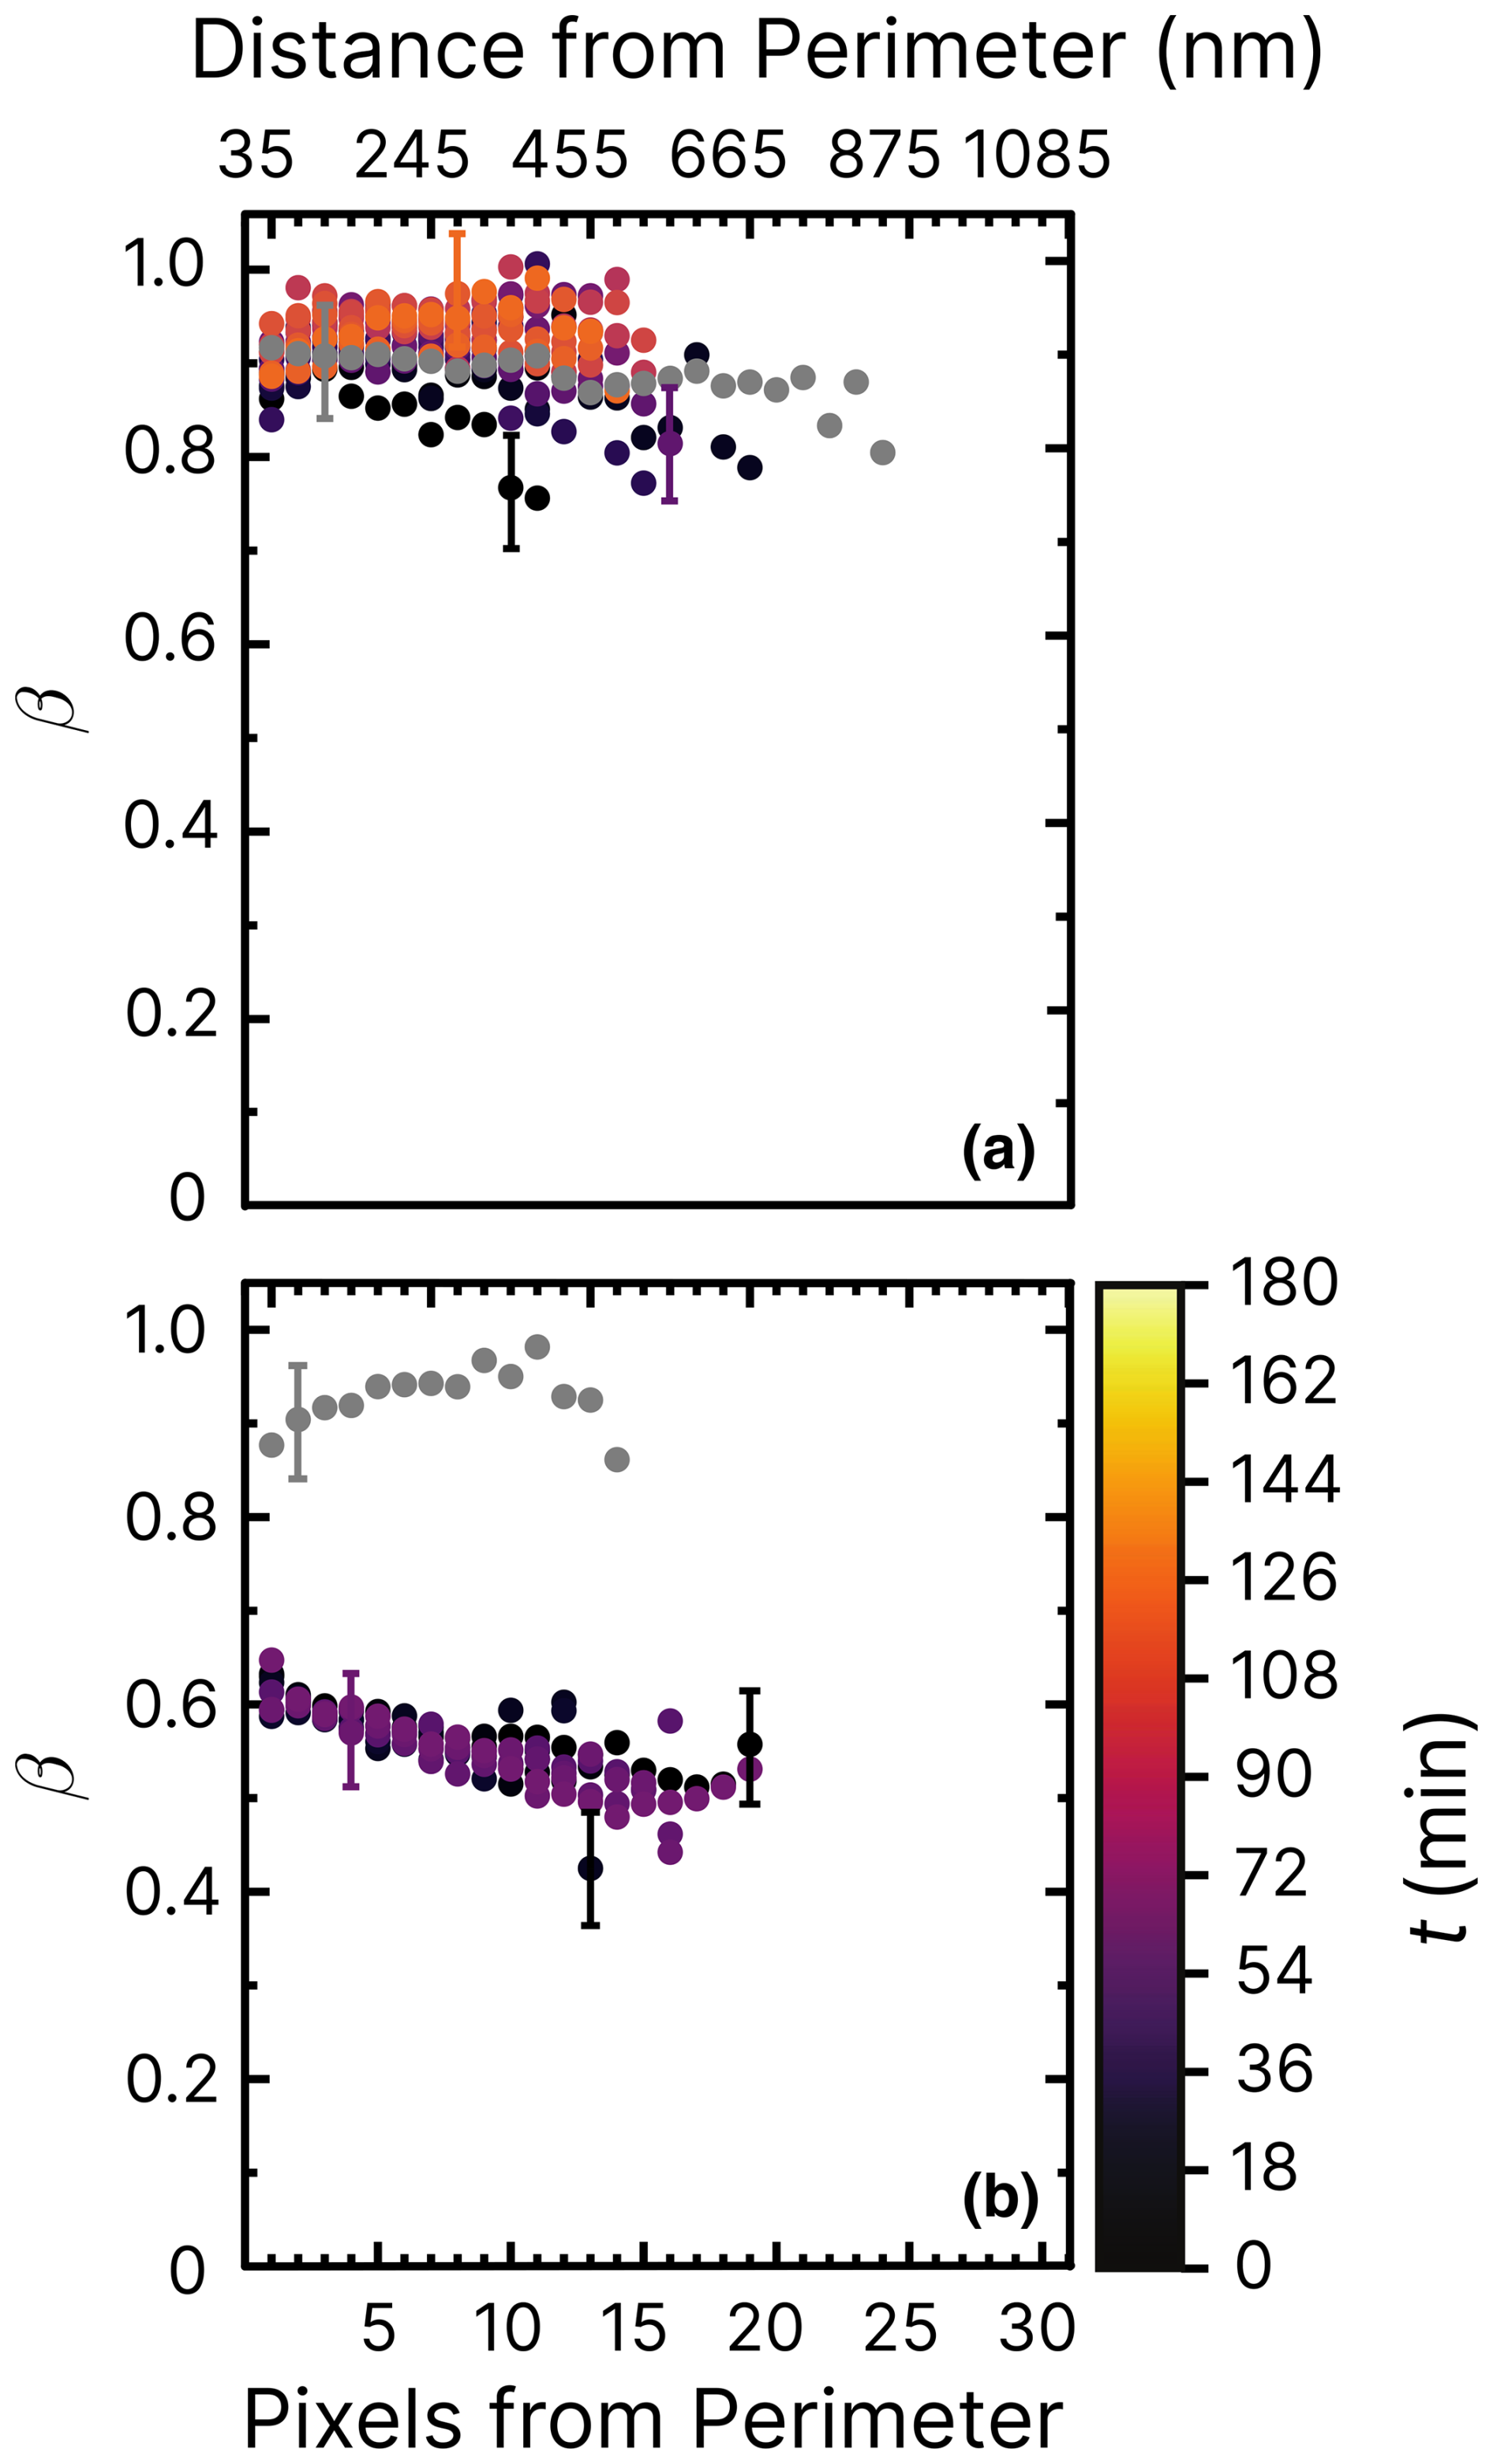
Figure 8Iron(III) fraction, β, as a function of the distance and pixels from the perimeter of particles and time, t, after UV light was switched off at RH = 60 % and a mole ratio of with a UV intensity of 13.55 ± 0.06 × 10⁻³ W m−2, resulting in a photolysis frequency of 10−3 s−1. In (a), oxygen was present in the environmental cell (see Fig. 2), whereas in (b), only helium was present. Error bars are ±0.07 or propagated from the photon counting error, whichever is larger.
Figure 8 shows experiments at RH = 60 % using the same mole ratios of particles and irradiation conditions as in Fig. 7b. In Fig. 8a, iron was seemingly reoxidized immediately after being reduced. In our first measurement at t≈10 min (black dots) after the light was switched off, iron was slightly reduced compared to the initial fraction in gray. This contrasts with the reduction observed in Fig. 7b. We suggest two possibilities to explain this, one being that FeIII(Cit) was not photolyzed as efficiently in the presence of copper at RH = 60 %, which would mean that ϕ would decrease with increasing RH. Another is that copper causes a faster reoxidation, comparable to the time it takes to acquire the first images after switching off the light. In the experiment shown in Fig. 8b, particles were again irradiated at RH = 60 % but without O2. We observed that iron was indeed reduced, reaching β=0.5. However, this was as not even as much as was the case for samples at RH = 40 %, with oxygen found to be reduced to a lower value of β=0.2 in Alpert et al. (2021). No reoxidation was detected in Fig. 8b, as we observed that β remained low for an hour. We conclude that both a low ϕ for iron(III) reduction (compared with FeIII(Cit) without copper) but also faster reoxidation in the presence of copper (and O2) is the reason for the observations. Experiments of particles containing 10 times less copper (mole ratio of ) are shown in the Appendix. Figure D1 aligns well with previous results of (Alpert et al., 2021) and our results of shown in Figs. 7 and 8. The trend of β in experiments with O2 at RH = 20 % (Fig. D2) is similar to that at RH = 60 % without O2. Iron in the particles did not reoxidize at all (β=0.45 after t≃10 h). Thus, reoxidation here was clearly limited by the oxygen supply to the particles, probably due to diffusion limitations at high viscosity, and the initial reduction in the presence of copper was less than for .
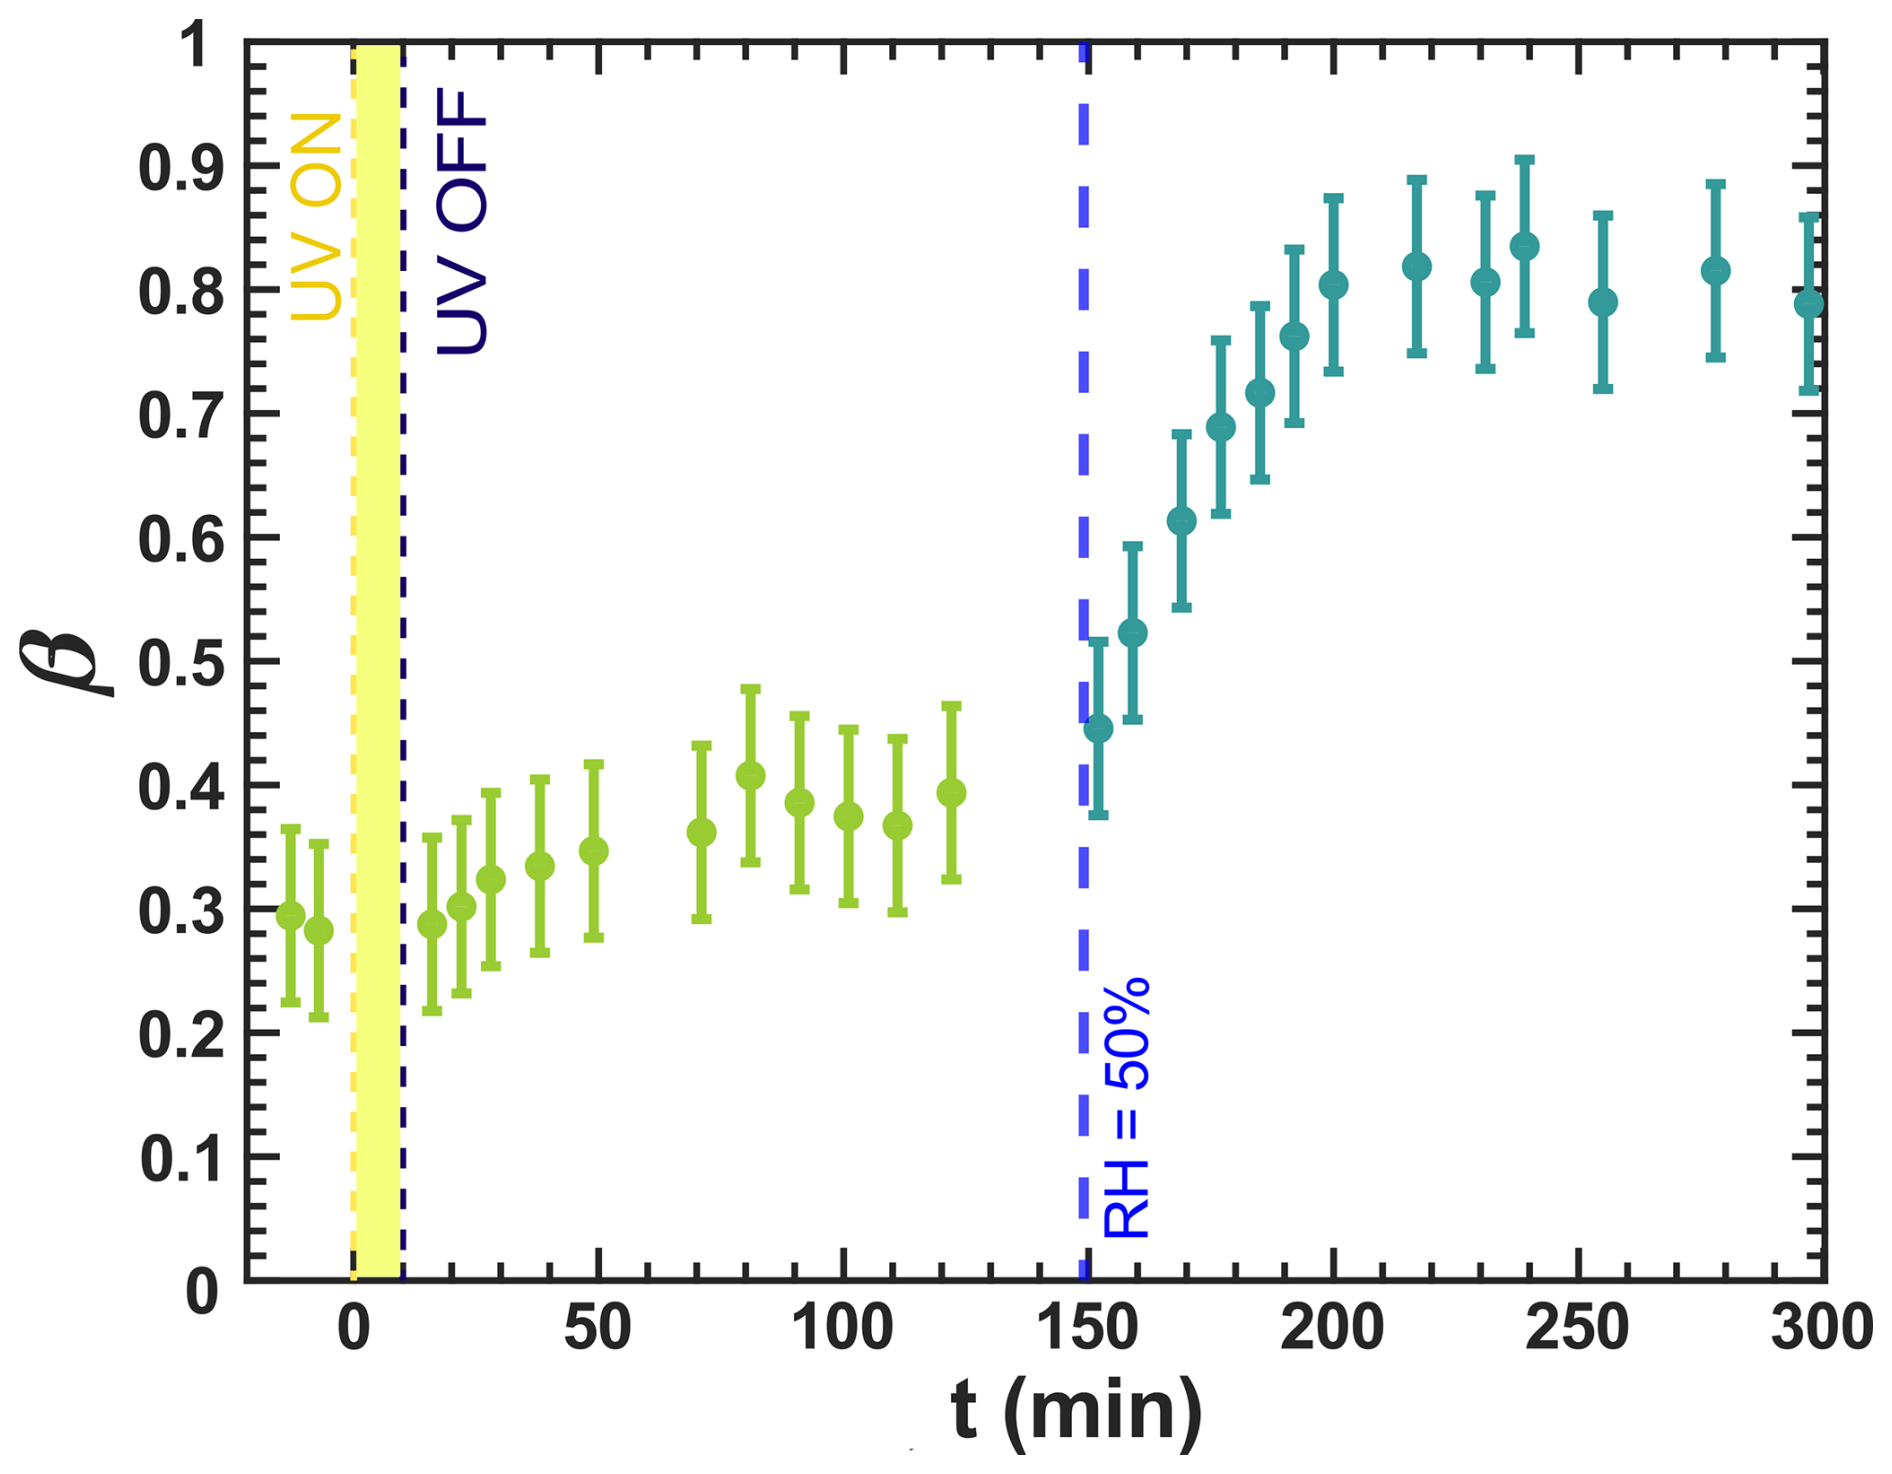
Figure 9Iron(III) fraction, β, as a function of time, t, in a specific experiment for irradiation at t=0–10 min at a UV intensity of 13.55 ± 0.06 × 10⁻³ W m−2, resulting in a photolysis frequency of 10−3 s−1 and RH = 20 % with a mole ratio of . The first data points at t<0 denote the initial β before irradiation. At t=149 min, RH was increased to 50 %. Note that this experiment was conducted after the experiments in Fig. 7, where irradiation occurred previously for 10 min. Error bars are ±0.07 or propagated from the photon counting error, whichever is larger.
We also assessed the impact of RH on iron reoxidation through a dynamic experiment in which RH was increased during a dark reoxidation period. In Fig. 9, the iron(III) fraction averaged over 10 to 15 particles in an image is plotted as a function of t, whereas in Fig. 7, the position-dependent iron(III) fractions are shown. Initially, at 20 %, no reoxidation was observed, consistent with the spatially resolved images in Fig. D2. At t=149 min, RH was raised to 50 %, and β immediately began to increase, reaching 0.8 at approximately 198 min. This reoxidation for 49 min was much faster than in the experiment where UV irradiation occurred at RH = 47 % (see Fig. 7b). Reoxidation intensified with an increase in RH, allowing O2 to diffuse into the particle phase, as discussed in Alpert et al. (2021) and in Figs. 7 and 8. Thus, diffusion limitations leading to anoxic conditions (Alpert et al., 2021) also explain our observations with particles.
3.3 Copper-containing samples revealed lower iron(II) quantum yield of FeIII(Cit) photochemistry
The experimentally observed changes in the reoxidation of iron(II) to iron(III) in the presence of copper call for a reassessment of the FeIII(Cit) photochemical system both with and without copper. We aim to elucidate the role of copper in FeIII(Cit) photochemistry by adapting and extending the mechanism for the box model calculations. The experiment in Fig. 4 provides evidence for an iron(II) quantum yield, with ϕ=1 for solid FeIII(Cit) in vacuum. This high ϕ=1 was then also used to explain the reoxidation data in Fig. 3 to reproduce the simulation results with the depth-resolving model in our previous work (Dou et al., 2021) as a sanity check of the present homogeneous box model. As mentioned in the introduction, a number of previous studies investigating the photochemistry of different aqueous iron(III) polycarboxylate complexes, including FeIII(Cit), reported lower ϕ in the range of 0.1–0.4 and its sensitivity to O2 (Faust and Zepp, 1993; Glebov et al., 2011; Pozdnyakov et al., 2014; Abrahamson et al., 1994; Pozdnyakov et al., 2012; Weller et al., 2013). The presence of dimeric or polymeric complexes, formed through paramagnetic coupling among Fe centers via oxygen bridges, seems crucial for both absorbance and ϕ. These complexes also influence photochemical outcomes, as the reduced radical complex can interact with a remaining Fe(III) center of the same dimer (Abrahamson et al., 1994; Glebov et al., 2011; Pozdnyakov et al., 2014).
Our model, simulating the reoxidation experiment at a RH = 40 %, is closely aligned with the experimental results shown in Fig. 3. In turn, for the higher RH, the simulated iron(III) fractions drop more strongly initially than what the data seem to indicate. This indicates that ϕ may be influenced by the phase state of the particles. For very high viscosity, thus for the vacuum conditions, the FeII radical complex may get frozen, justifying the high ϕ=1. For RH = 40 %, we adjusted ϕ to 0.9, and for experiments at higher humidity (RH = 50 % and 60 %) and lower viscosities, we allowed ϕ to have a lower value to represent a transition from high ϕ at low RH to ϕ values found in previous studies in an aqueous environment. We found that a value of 0.5 led to a better fit of the data for the two higher RH conditions than when applying ϕ=1, as shown in Fig. 10. As mentioned above, this sensitivity of ϕ to the water activity and thus to the solute concentration could result from the polynuclear complexes that likely change in abundance in parallel.
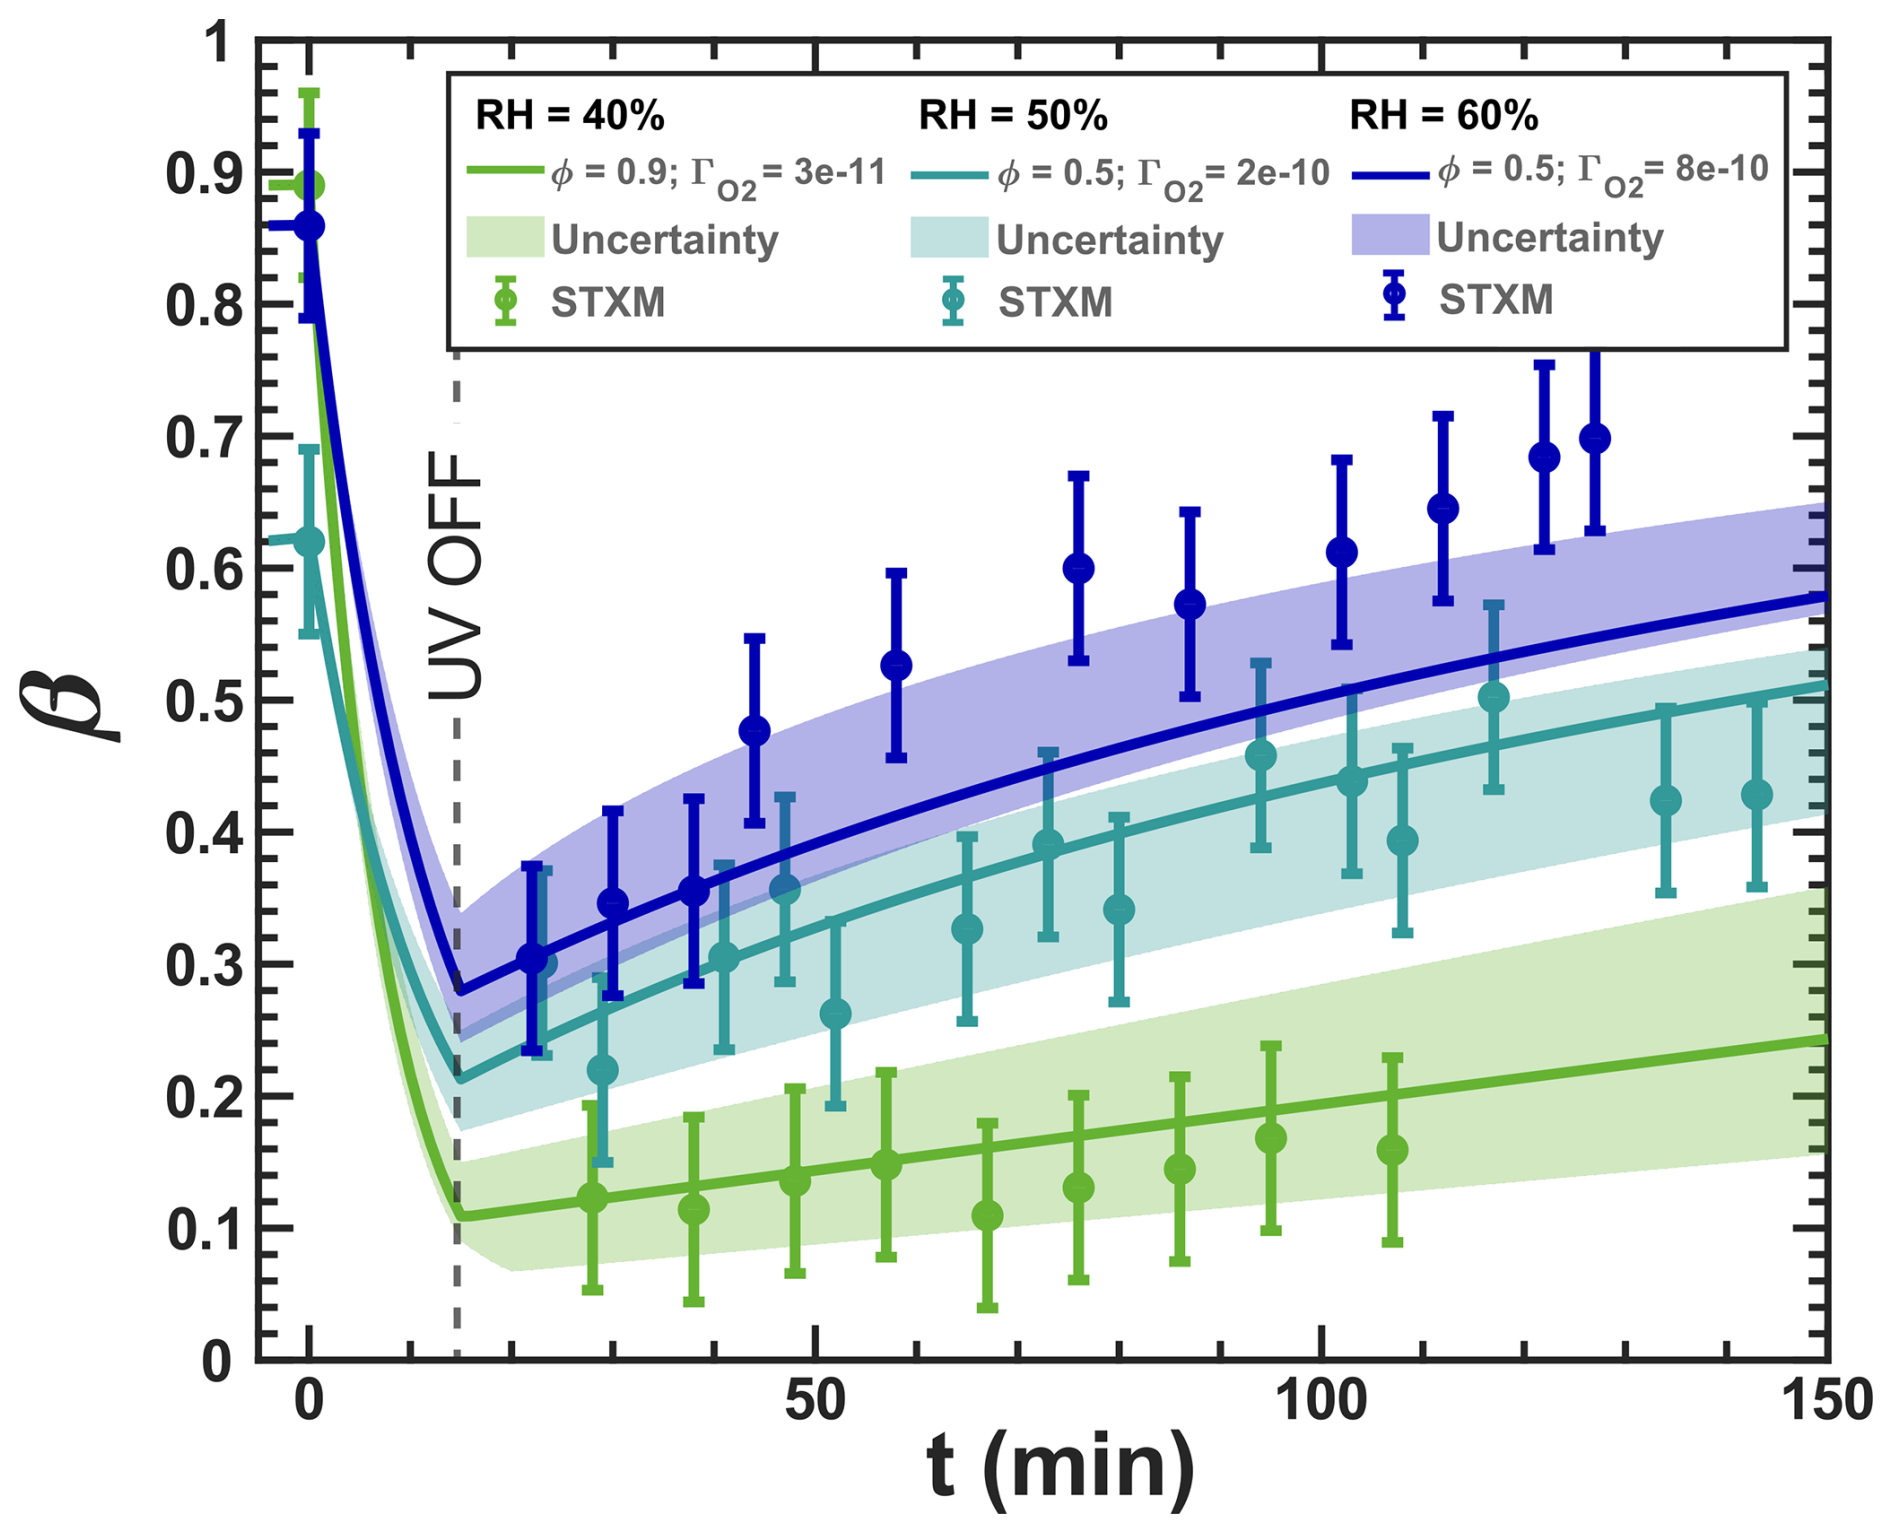
Figure 10The data in Fig. 3 are shown and compared with model scenarios with the corresponding oxygen uptake coefficient, , and quantum yield, ϕ, shown as different colors (green: RH = 40 % with ϕ=0.9 and 10−11; turquoise: RH = 50 % with ϕ=0.5 and 10−10; blue: RH = 60 % with ϕ=0.5 and 10−10). Model uncertainties are defined as in Fig. 3.
Based on the experimental results presented above, copper's effect is evident in two ways. First, ϕ at RH ≥20 % is substantially lower compared to FeIII(Cit) alone. Second, reoxidation is accelerated in the presence of copper, resulting in near-complete reoxidation shortly after the UV light was switched off. Our box model permits changing ϕ with Cu content and incorporates known reactions between Cu and Fe, as well as between Cu and ROS. This extended box model will be used to fit the STXM/NEXAFS UV-aging experiments. Several studies have proposed iron–copper mechanisms for carboxylic acid systems similar to CA (Ervens et al., 2003; Mao et al., 2013; Weller et al., 2014; Shen et al., 2021; Gonzalez et al., 2017). We integrated the relevant chemistry into the fundamental mechanism (see Sect. 2.5). The resulting copper equilibria and reactions, along with their corresponding rate constants, are listed in Tables 3 and 4 and were added to the existing chemical mechanism (Tables 1 and 2) in Kintecus. To the best of our knowledge, we believe that our model thus incorporates the important reactions potentially relevant to assess the role of copper in our system.
Perrin (1979)Perrin (1979)Table 3Copper equilibria, written as forward and back reactions, with their rate constants.
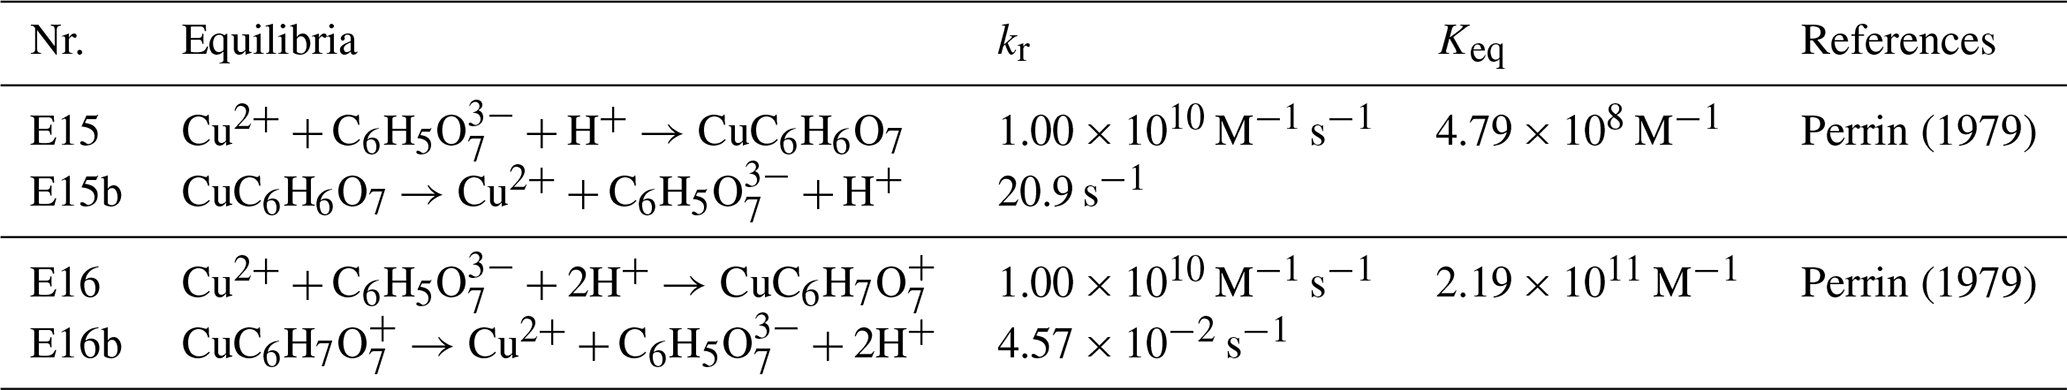
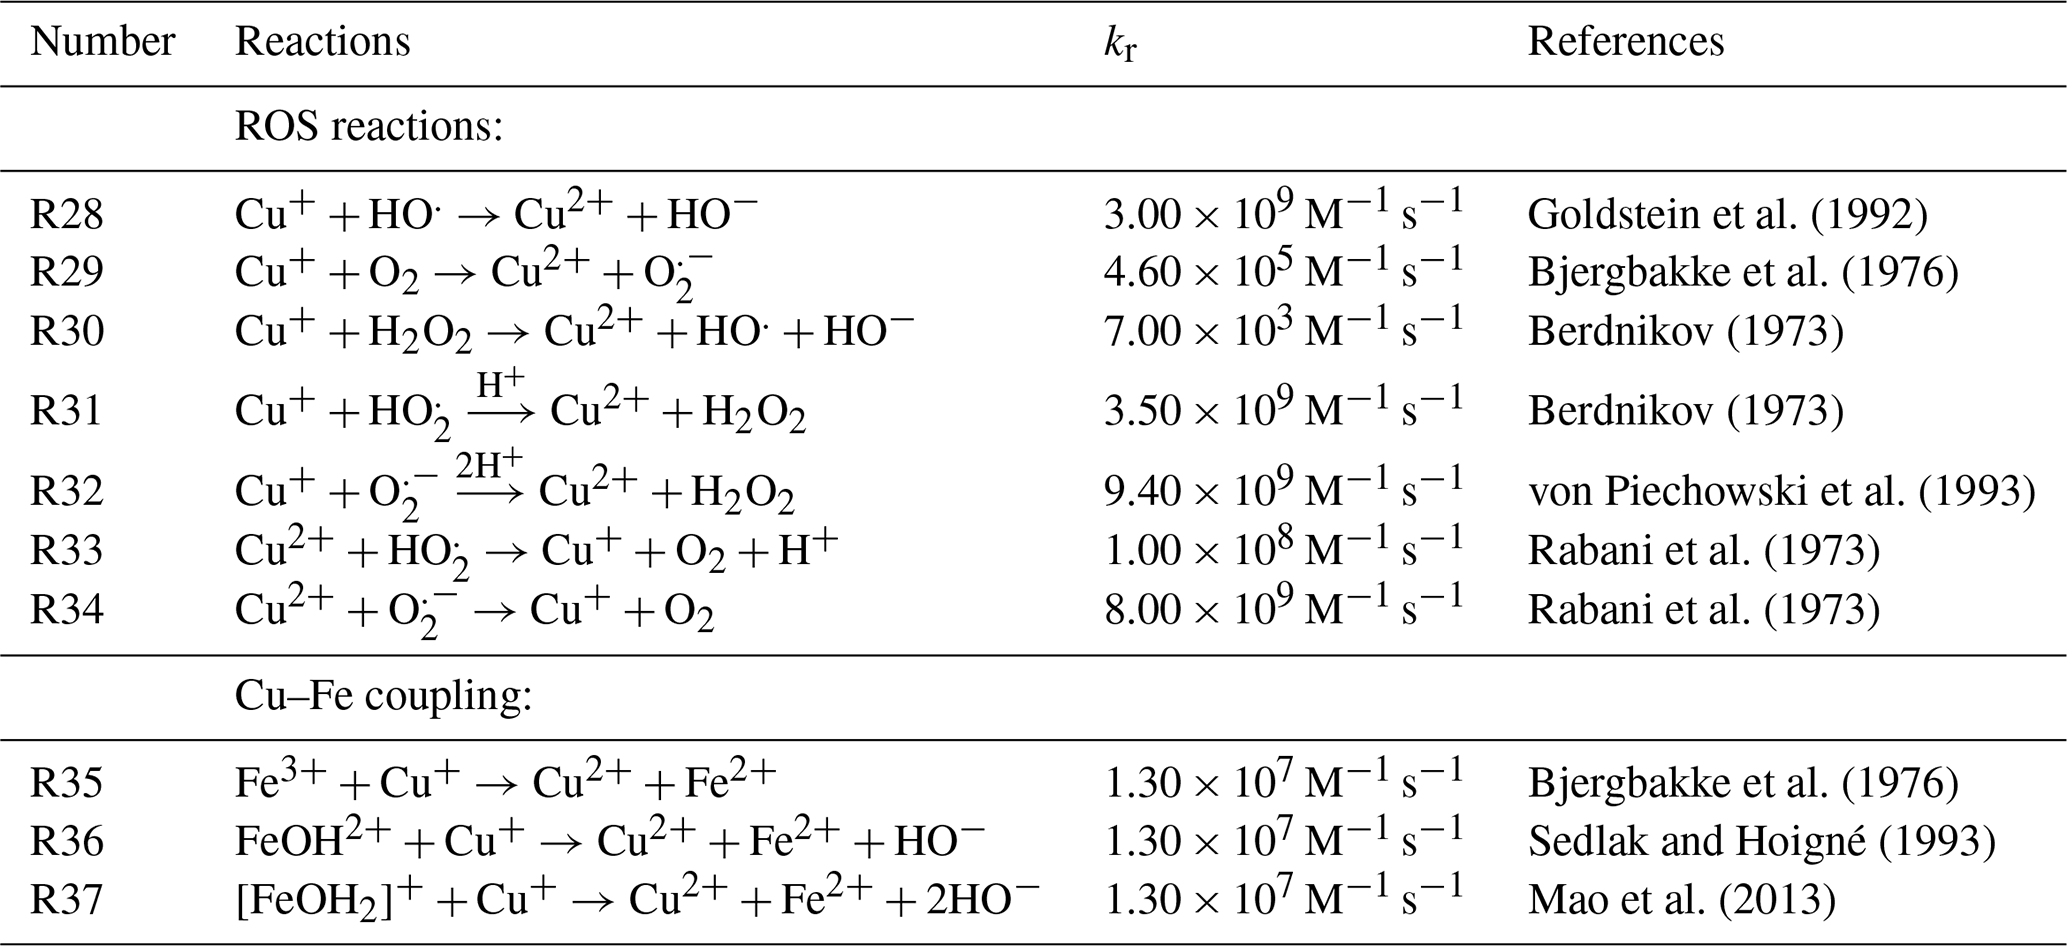
Table 4Copper, ROS, and Cu–Fe coupling reactions with their reaction rate constants at a constant pH = 2.
Determining the iron(II) quantum yield (ϕ) to accurately simulate the experiments required conducting a reoxidation experiment in the absence of oxygen. At RH = 60 % and a light intensity of 13.55 ± 0.06 W m−2, we observed and simulated the initial reduction in iron(III) in the system. Figure 11 shows the results of an optimization run, where j was calculated to be 8.1 ± 0.1 × 10⁻⁴ s−1 using ϕ=0.1. In this case, oxygen-related iron(II) reoxidation was excluded, enabling a simulation solely driven by copper and/or inhibited iron(III) reduction. It is important to note that these STXM/NEXAFS data correspond to those shown in Fig. 8b but are averaged at a single time step. We propose that ≪ by a factor of 5. Given the sensitivity of ϕ=0.1 to the presence of polynuclear iron complexes, we speculate that it results from copper replacing an iron center in a polynuclear complex or from copper inhibiting the secondary reaction of the reduced radical complex with FeIII(Cit) in a catalytic way.
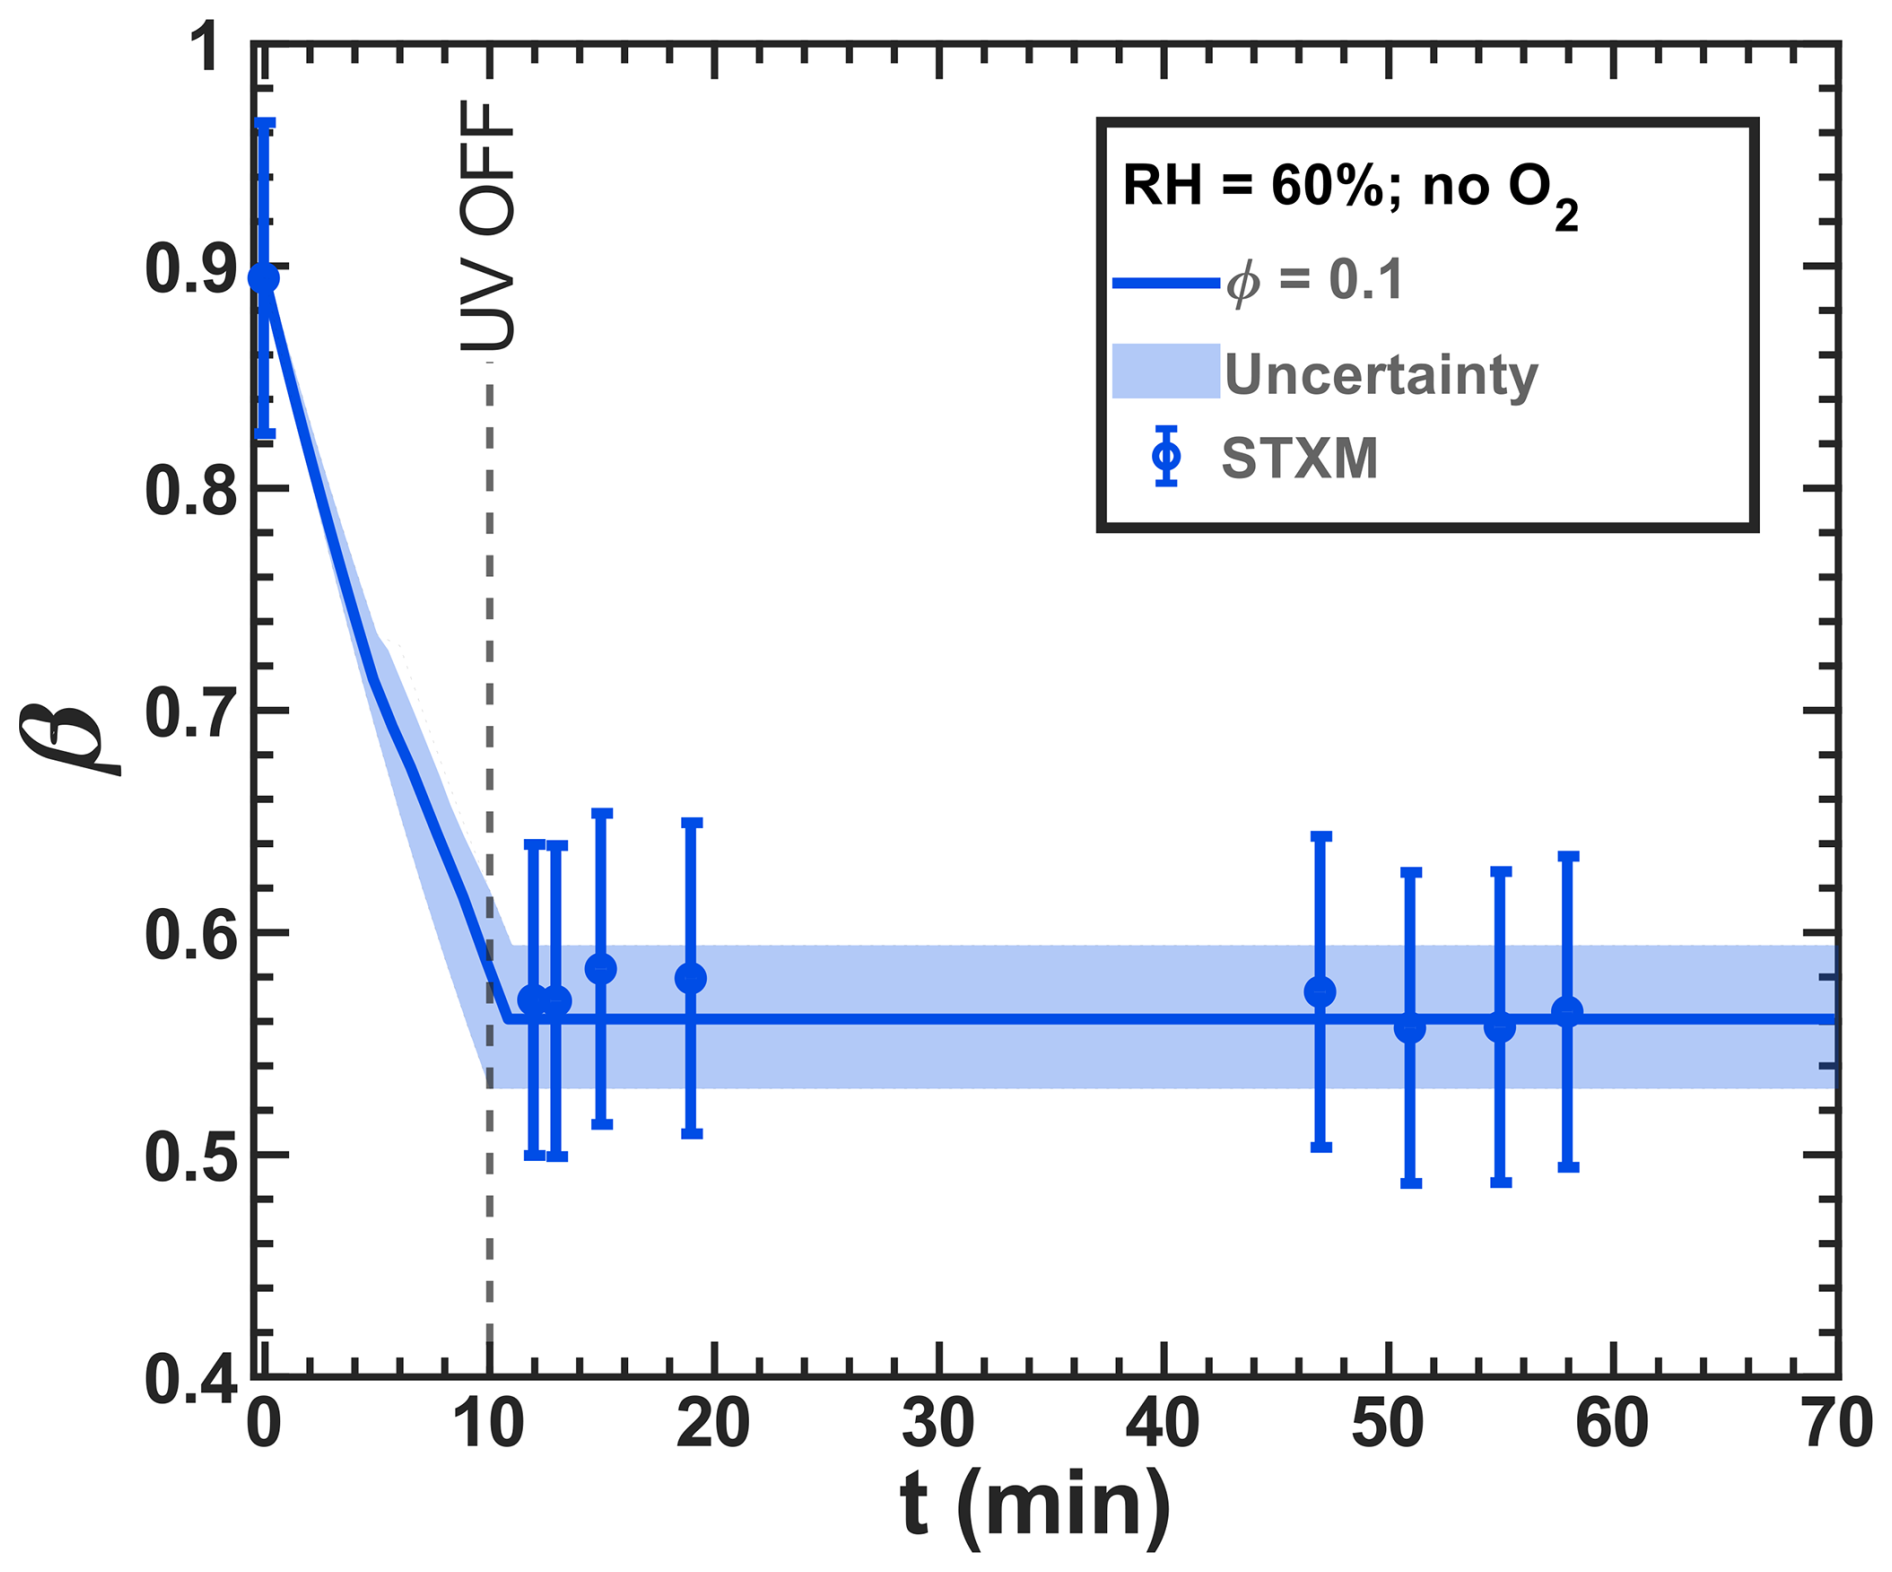
Figure 11Iron(III) fraction, β, as a function of time, t, for irradiation at t=0–10 min with a light intensity of 13.55 ± 0.06 × 10⁻³ W m−2 and RH = 60 % with a mole ratio of = and without oxygen in the gas phase. The circles with error bars represent the average of all particles mapped in one time step during the STXM experiments (data of Fig. 8b). Data uncertainty (error bars), model prediction, and model uncertainties (straight lines and shading, respectively) are as defined in Fig. 3. The iron(II) quantum yield, ϕ=0.1, was fit to the STXM/NEXAFS data and used to derive the photolysis frequency, 10−3 s−1, used in the model.
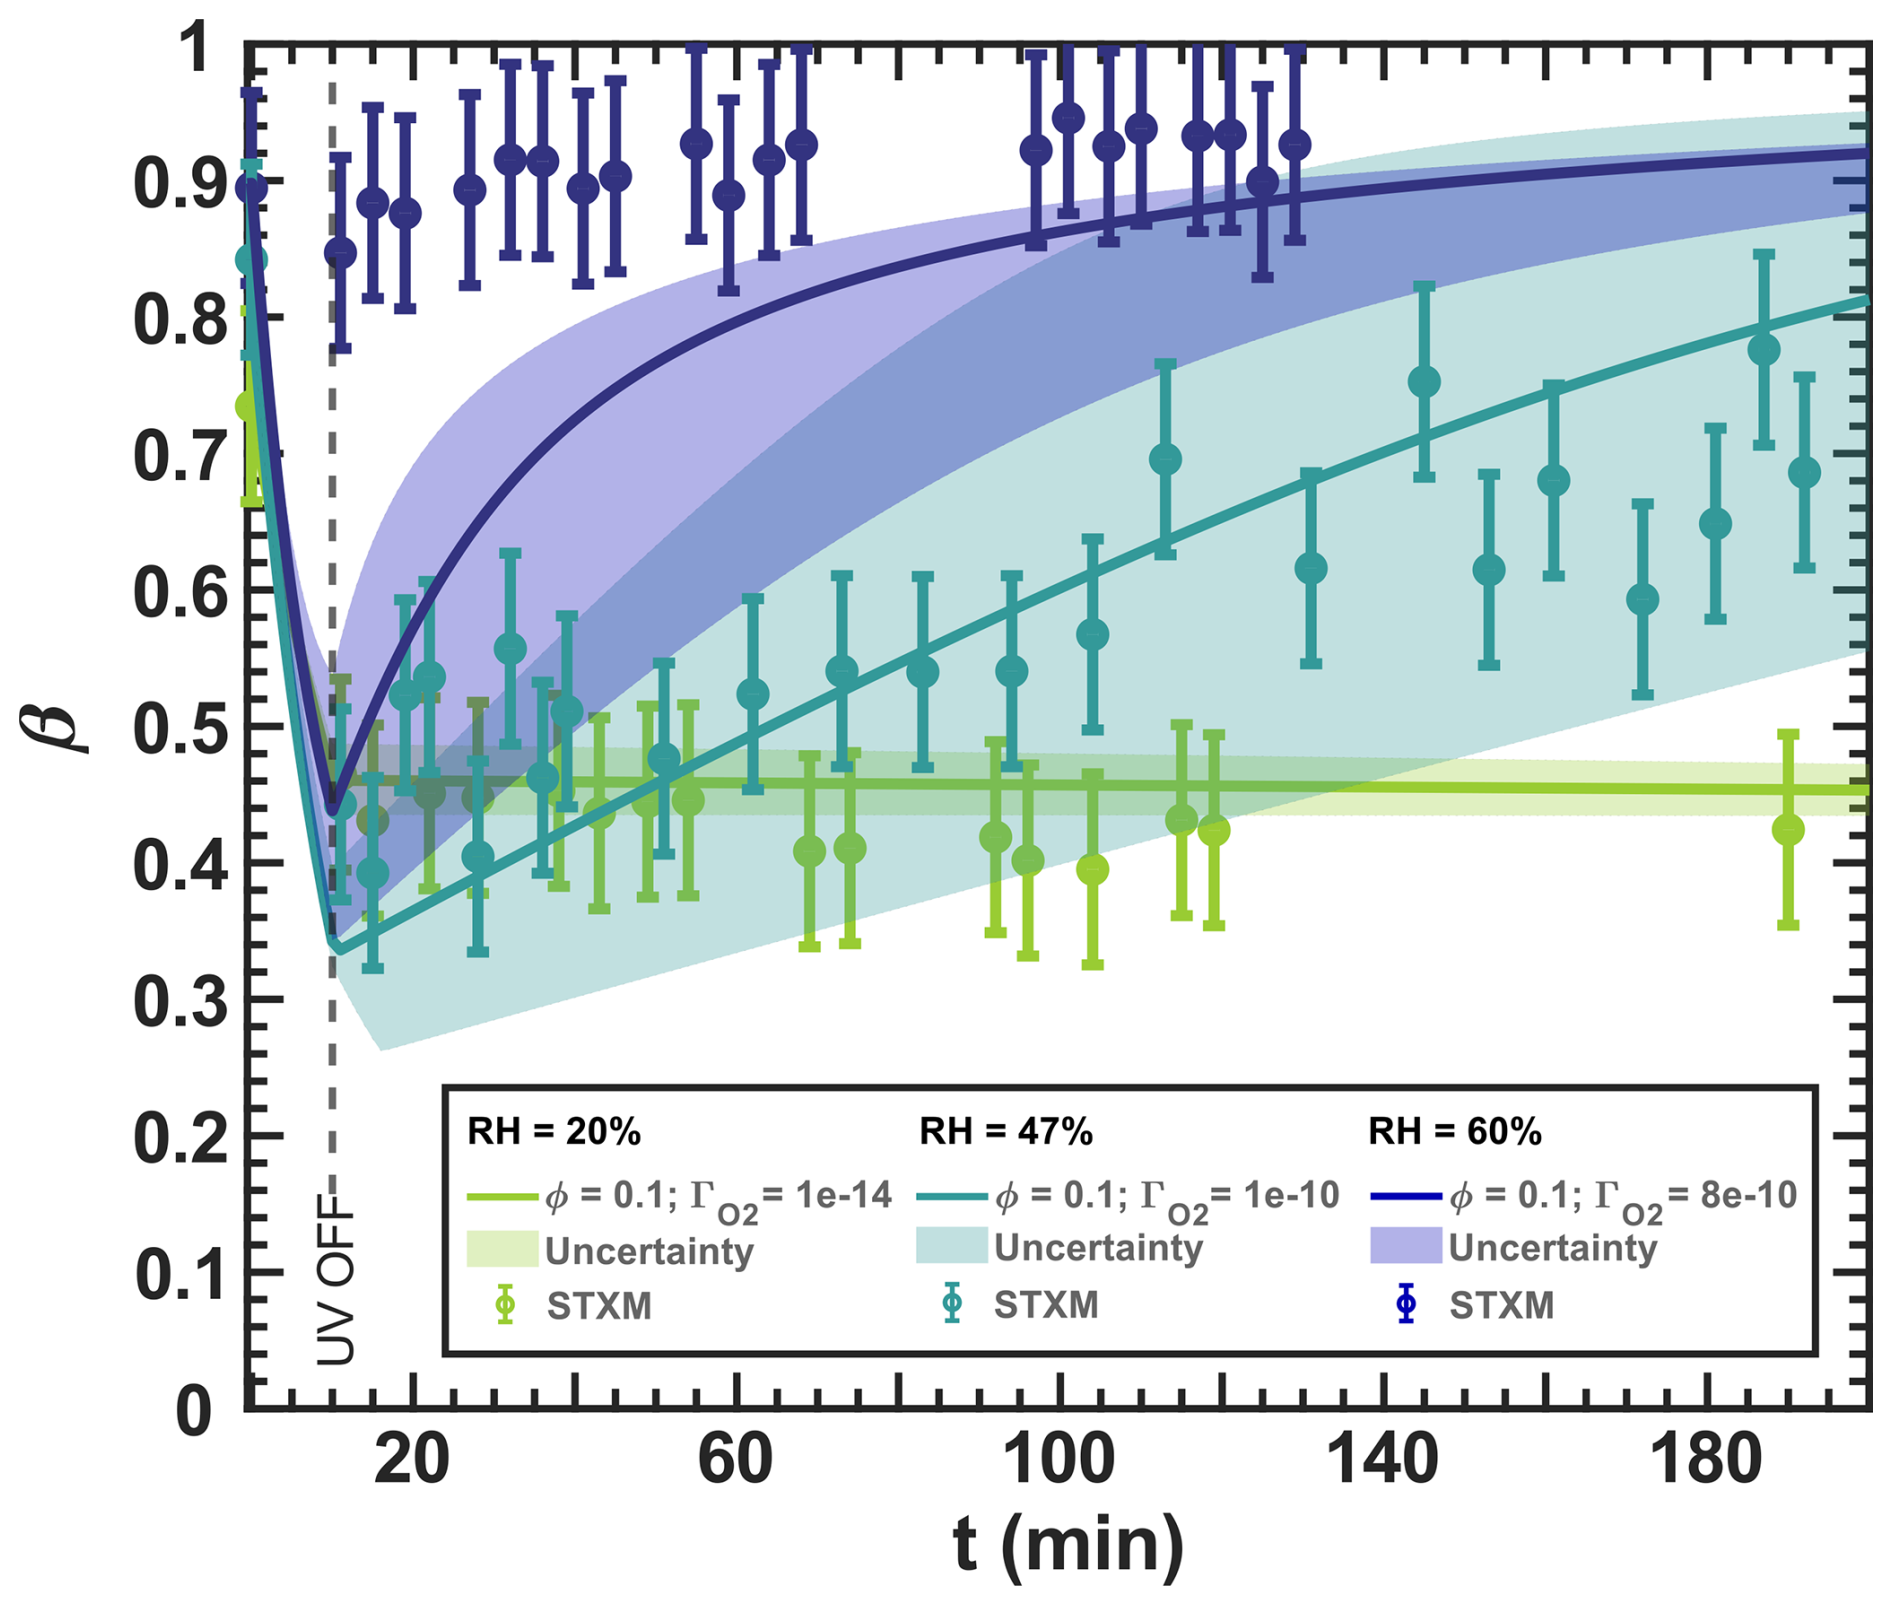
Figure 12Iron(III) fraction, β, as a function of time, t, for irradiation at t=0–10 min with a light intensity of 13.55 ± 0.06 × 10⁻³ W m−2, RH = 60 % (blue), 47 % (turquoise), and 20 % (green), and a mole ratio of . The circles with error bars represent the average of all particles mapped in one time step during the STXM experiments. Data uncertainty (error bars), model prediction, and model uncertainties (straight lines and shading, respectively) are as defined in Fig. 3. The iron(II) quantum yield, ϕ=0.1, was taken from the anoxic experiment shown in Fig. 11, which resulted in a photolysis frequency of 10−4 s−1). Oxygen uptake coefficients, , are indicated in the legend.
We present the optimized simulation results for different reoxidation experiments conducted under various mole ratios, RH conditions, and ϕ=0.1, as shown in Figs. 12 and 13. At RH = 20 % in Fig. 12, the reduction occurred while the UV lights were on. After turning them off, we observed no reoxidation, as expected, and the particles were likely highly viscous and therefore lacked the sufficient oxygen supply needed for reoxidation, similar to the observations in Fig. 11. The model is in excellent agreement with the observations considering the experimental uncertainty. At RH = 47 %, reoxidation after the UV lights were switched off was consistent and significant, increasing from approximately β=0.4 to 0.8 from t=10–200 min. The increased molecular diffusion at this higher RH likely accounts for the greater reoxidation compared to RH = 20 %. However, there is some data scatter, especially for t=10–40 min, which we suggest indicates fast reoxidation occurring on a time scale comparable to the acquisition of the STXM/NEXAFS images, even under UV irradiation (t<10 min). In particular, our model captures all the experimental data, taking into account both the model and experimental uncertainties resulting from the measurement error of RH and the light intensity, as well as the error in . The width of the uncertainty of the model is much larger than that of other RH in Fig. 12, indicating that the photochemical reduction and dark reoxidation rates are highly sensitive at RH = 47 %. At RH = 60 %, reduction was not observed, with β>0.85 observed throughout the experiment, possibly due to reoxidation that occurs on short time scales that we could not experimentally resolve (<2 min). Despite using , which corresponds to well-mixed conditions in the aqueous phase without any diffusion limitations, our model could not reproduce this fast reoxidation. We prove such a diffusion limitation by deriving the reacto-diffusive length of oxygen in the Appendix (Sect. G2), resulting in 5.3 nm. This implies that even at high RH of 65 %, the limitation by reaction and diffusion is crucial for the O2 uptake.
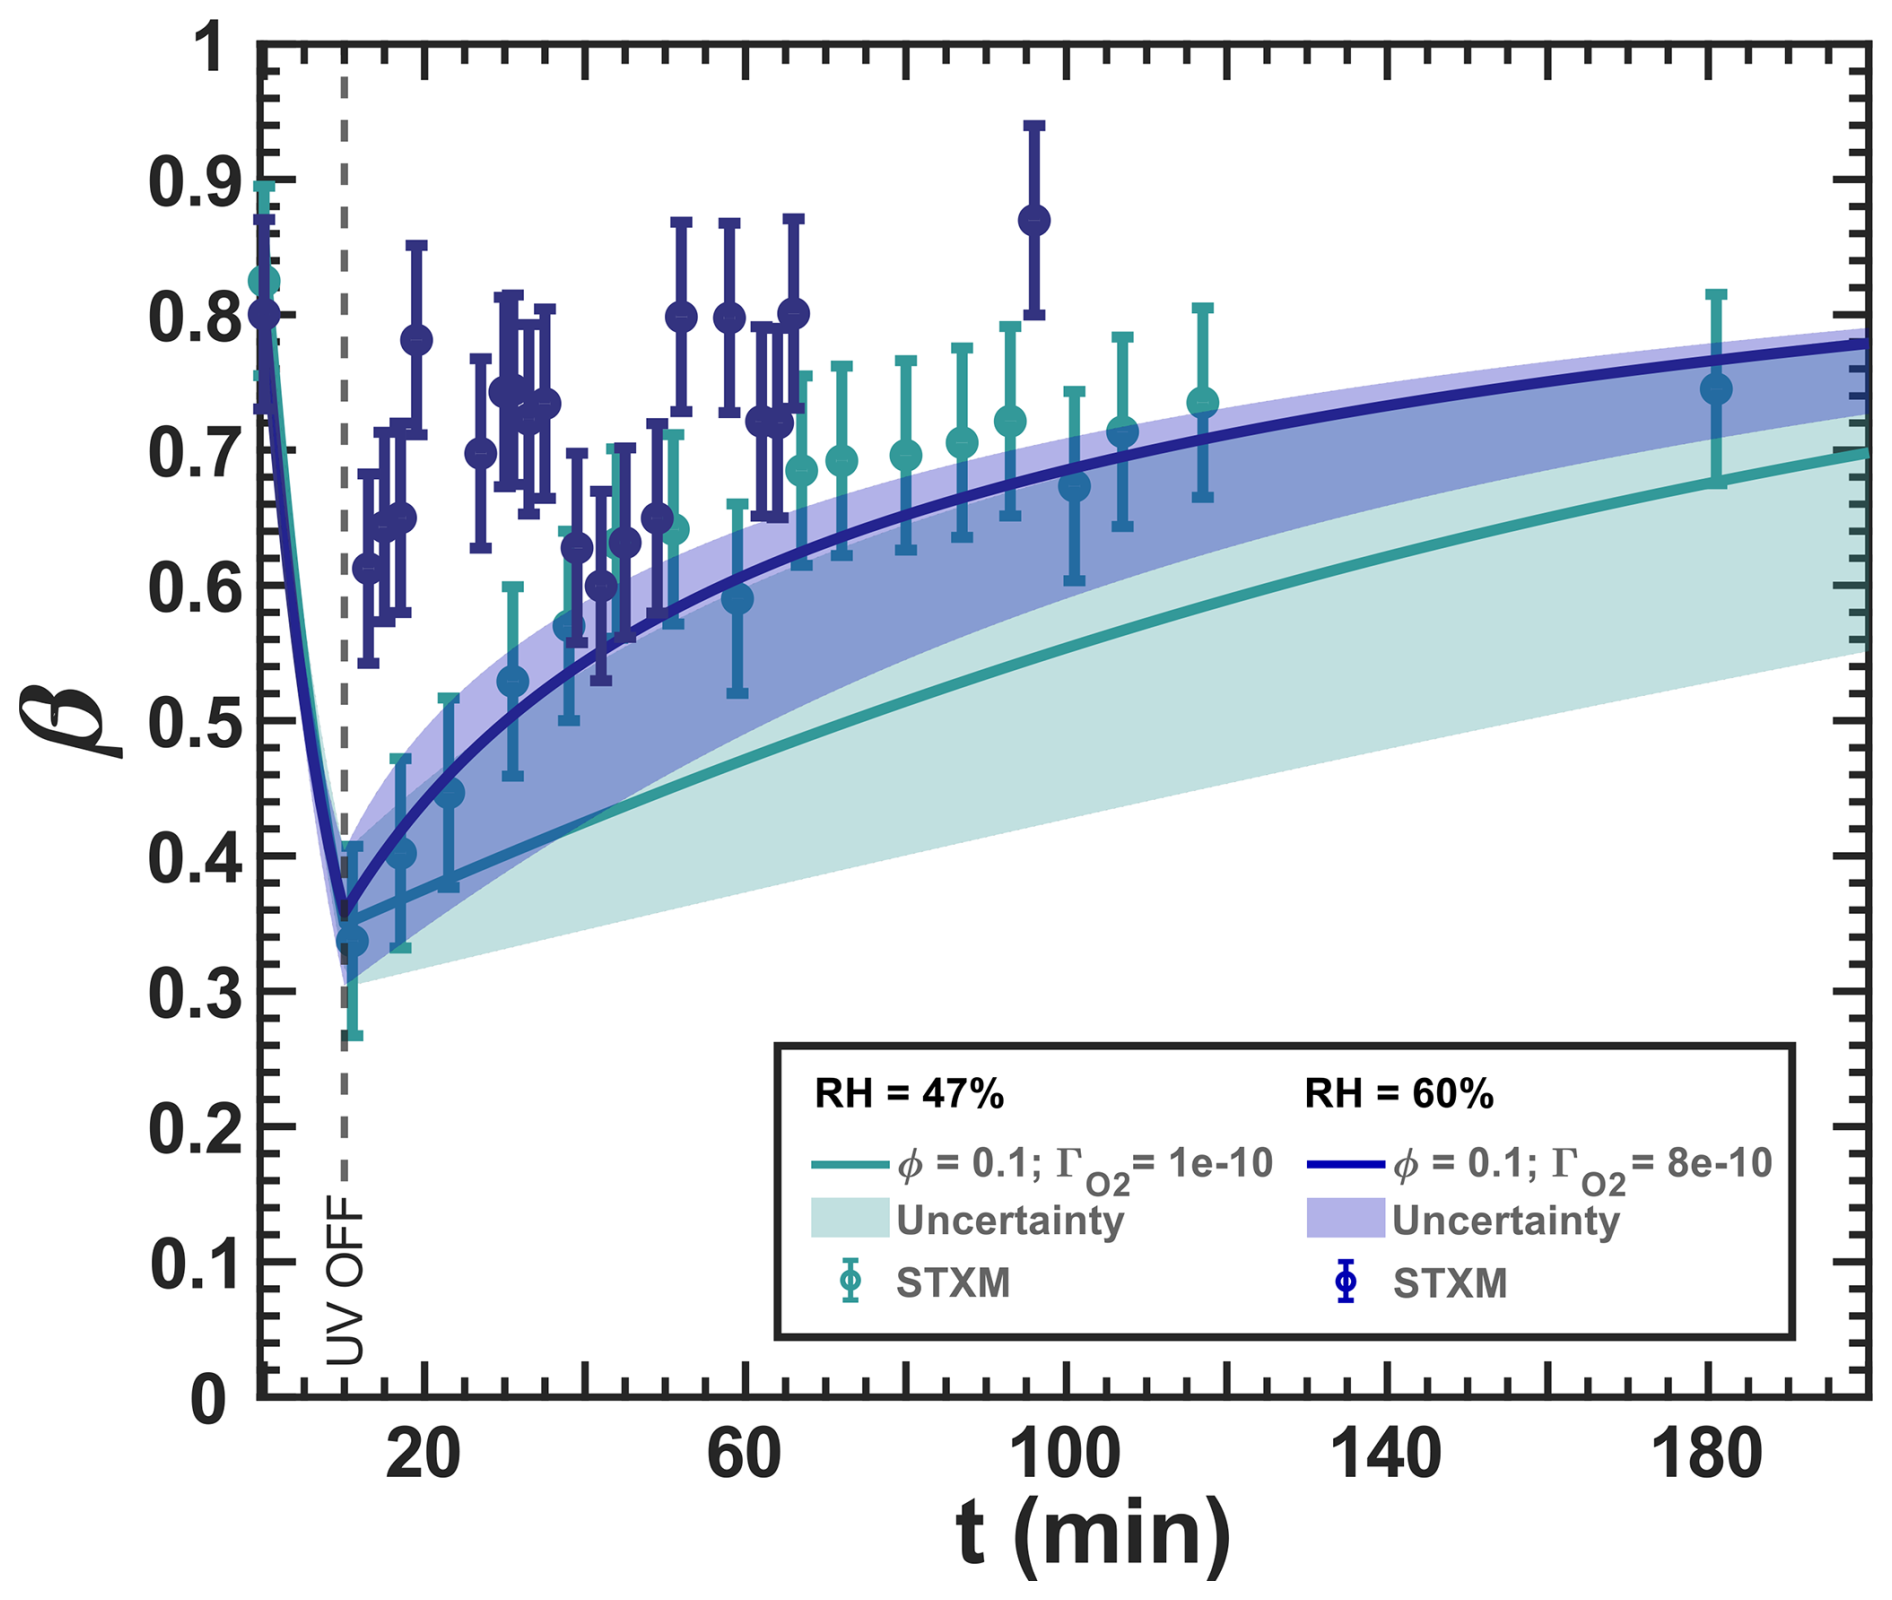
Figure 13Iron(III) fraction, β, as a function of time, t, for irradiation at t=0–10 min with a light intensity of 13.55 ± 0.06 × 10⁻³ W m−2, RH = 60 % (blue) and 47 % (turquoise), and a mole ratio of (10 times less copper than in Fig. 12). The circles with error bars represent the average of all particles mapped in one time step during the STXM experiments. Data uncertainty (error bars), model prediction, and model uncertainties (straight lines and shading, respectively) are as defined in Fig. 3. The iron(II) quantum yield, ϕ=0.1, was taken from the anoxic experiment shown in Fig. 11, which resulted in a photolysis frequency of 10−4 s−1). Oxygen uptake coefficients, , are indicated in the legend.
Figure 13 shows experimental and modeling results for a copper content reduced by a factor of 10 compared to Fig. 12. At RH = 47 %, we again observed a reduction during irradiation by UV light and reoxidation in the dark after UV light was switched off. Our model is in agreement with the observations, which were toward the top of the green-shaded area, indicating the model uncertainty. Unlike Fig. 12, there was very little data scatter in the 30 min after the UV light was switched off. At RH = 60 %, we observed some reduction and reoxidation, in contrast to Fig. 12. Although the data tend to scatter more for this experiment, there was a clear drop of β from 0.8 initially to 0.6, followed by reoxidation to a maximum of 0.86 at t=92 min. Our model could not capture the reduction by UV light and predicted a slower reoxidation for lower copper content. Interestingly, in Fig. 13, β>0.8 was not reached by our model and occurred only at the last data point, while this was easily observed in Fig. 12 at the same RH. We also emphasize that our model does not explicitly include another HO2 formation pathway, such as the photolysis of C5 ketone products, other than the elimination of HO2 from the citrate peroxy radical, which could cause uncertainty about the true HO2 and H2O2 production. For this, the model had been optimized to fit the available observables. From all of these observations and the fact that we have included all relevant reactions involving copper in our box model, we suspect that a missing iron(II) reoxidation pathway exists during UV irradiation and/or during dark periods that are related to copper increasing a chemical reoxidation pathway.
3.4 Copper(II) oxidizing iron(II)?
Observed reoxidation during UV irradiation and after the UV light was turned off (t=0–40 min) at RH =47 % and 60 % (Figs. 12 and 13) was underestimated. To elucidate the reasons, we derived turnover rates (d[reaction] dt) to identify the main chemical reactions responsible for both FeIII(Cit):CA and experiments. We selected experiments carried out at RH = 60 %, where transport limitations may play a lesser role.
Figures 14 and 15 show turnover rates of the (RH = 60 %) experiment from Table 2 ((HCit) oxidant reactions) and Table 4 (Cu–ROS and Cu–Fe coupling reactions), respectively. In the basic FeIII(Cit) photochemical system (Table 2), the two dominating reactions that oxidize iron(II) to iron(III) are R19 and R20 (green and light blue in Fig. 14), with turnover rates of 10−3 M s−1. In these reactions, both O2 and HO2 act as oxidants. In the case of the FeIII(Cit):CA (RH = 60 %) experiment simulation (see Fig. F1), HO2 is the predominant oxidant, with R20 occurring at a similarly fast rate in the presence of copper. Oxidation with O2 (R19) and H2O2 (R18) is 1 order of magnitude slower. In the absence of copper, OH remains a significant oxidant (R11). These results suggest that variations in ROS concentration and turnover may provide insight into the observed discrepancies, which we explore below.
Among the turnover rates shown in Fig. 15 for copper redox reactions, R29 and R33 are the highest, reaching 1.00 × 10⁻² M s−1. These reveal a steady state of hydroperoxyl radicals, where copper is initially oxidized via R29 and then HO2 reduces Cu2+ back to Cu+. Notably, the only sink for hydroperoxyl radicals is the self-reaction R31 (yellow) with turnover rates in the range 1.00 × 10⁻⁵–1.00 × 10⁻⁴ M s−1 producing H2O2. The concentration of Cu2+ is sustained by Fe3+ reoxidation, as visible in light blue (R35). We interpret these reactions as the primary contributors to elevated hydrogen peroxide (H2O2) concentration in the model of experiments. The ROS concentrations for both the FeIII(Cit):CA and experiments are compared in Fig. F3 in the Appendix. In the experiments, the H2O2 concentration is the highest among all ROS at mol L−1. This is in contrast to the FeIII(Cit):CA samples, where the concentrations of OH and HO2 are comparable to that of H2O2, differing no more than 1 order of magnitude. We attribute the elevated H2O2 concentration to the reoxidation of Cu+ by HO2 in R31.
Examining the O2 concentrations for both samples (see Fig. F4 in the Appendix) and comparing them with the ROS concentrations previously discussed, we observed a mildly inverse trend across all concentrations. Specifically, during UV exposure, ROS concentrations gradually rise and then consistently decline after the light is turned off. In contrast, the O2 concentrations drop significantly during UV exposure and gradually increase during the dark reoxidation phase. This outcome suggests that under UV light, ROS production is O2 limited. However, in the samples, the higher O2 concentration accelerates the FeII(HCit) reoxidation (R19), which is buffered by Fe3+ reduction by Cu+ in R35. The reduction in iron and the decreased hydroperoxyl radical levels in the presence of copper may explain why increasing reaction rates for R19 and R20 did not alter the iron(II) reoxidation rate when attempting to fit the model to the experimental data. As a sanity check, we again increased the O2 uptake coefficient to the level of well-mixed conditions, as it was done for the uncertainty limits above, to confirm that O2 flux into the condensed phase is not the sole driver of the fast reoxidation.
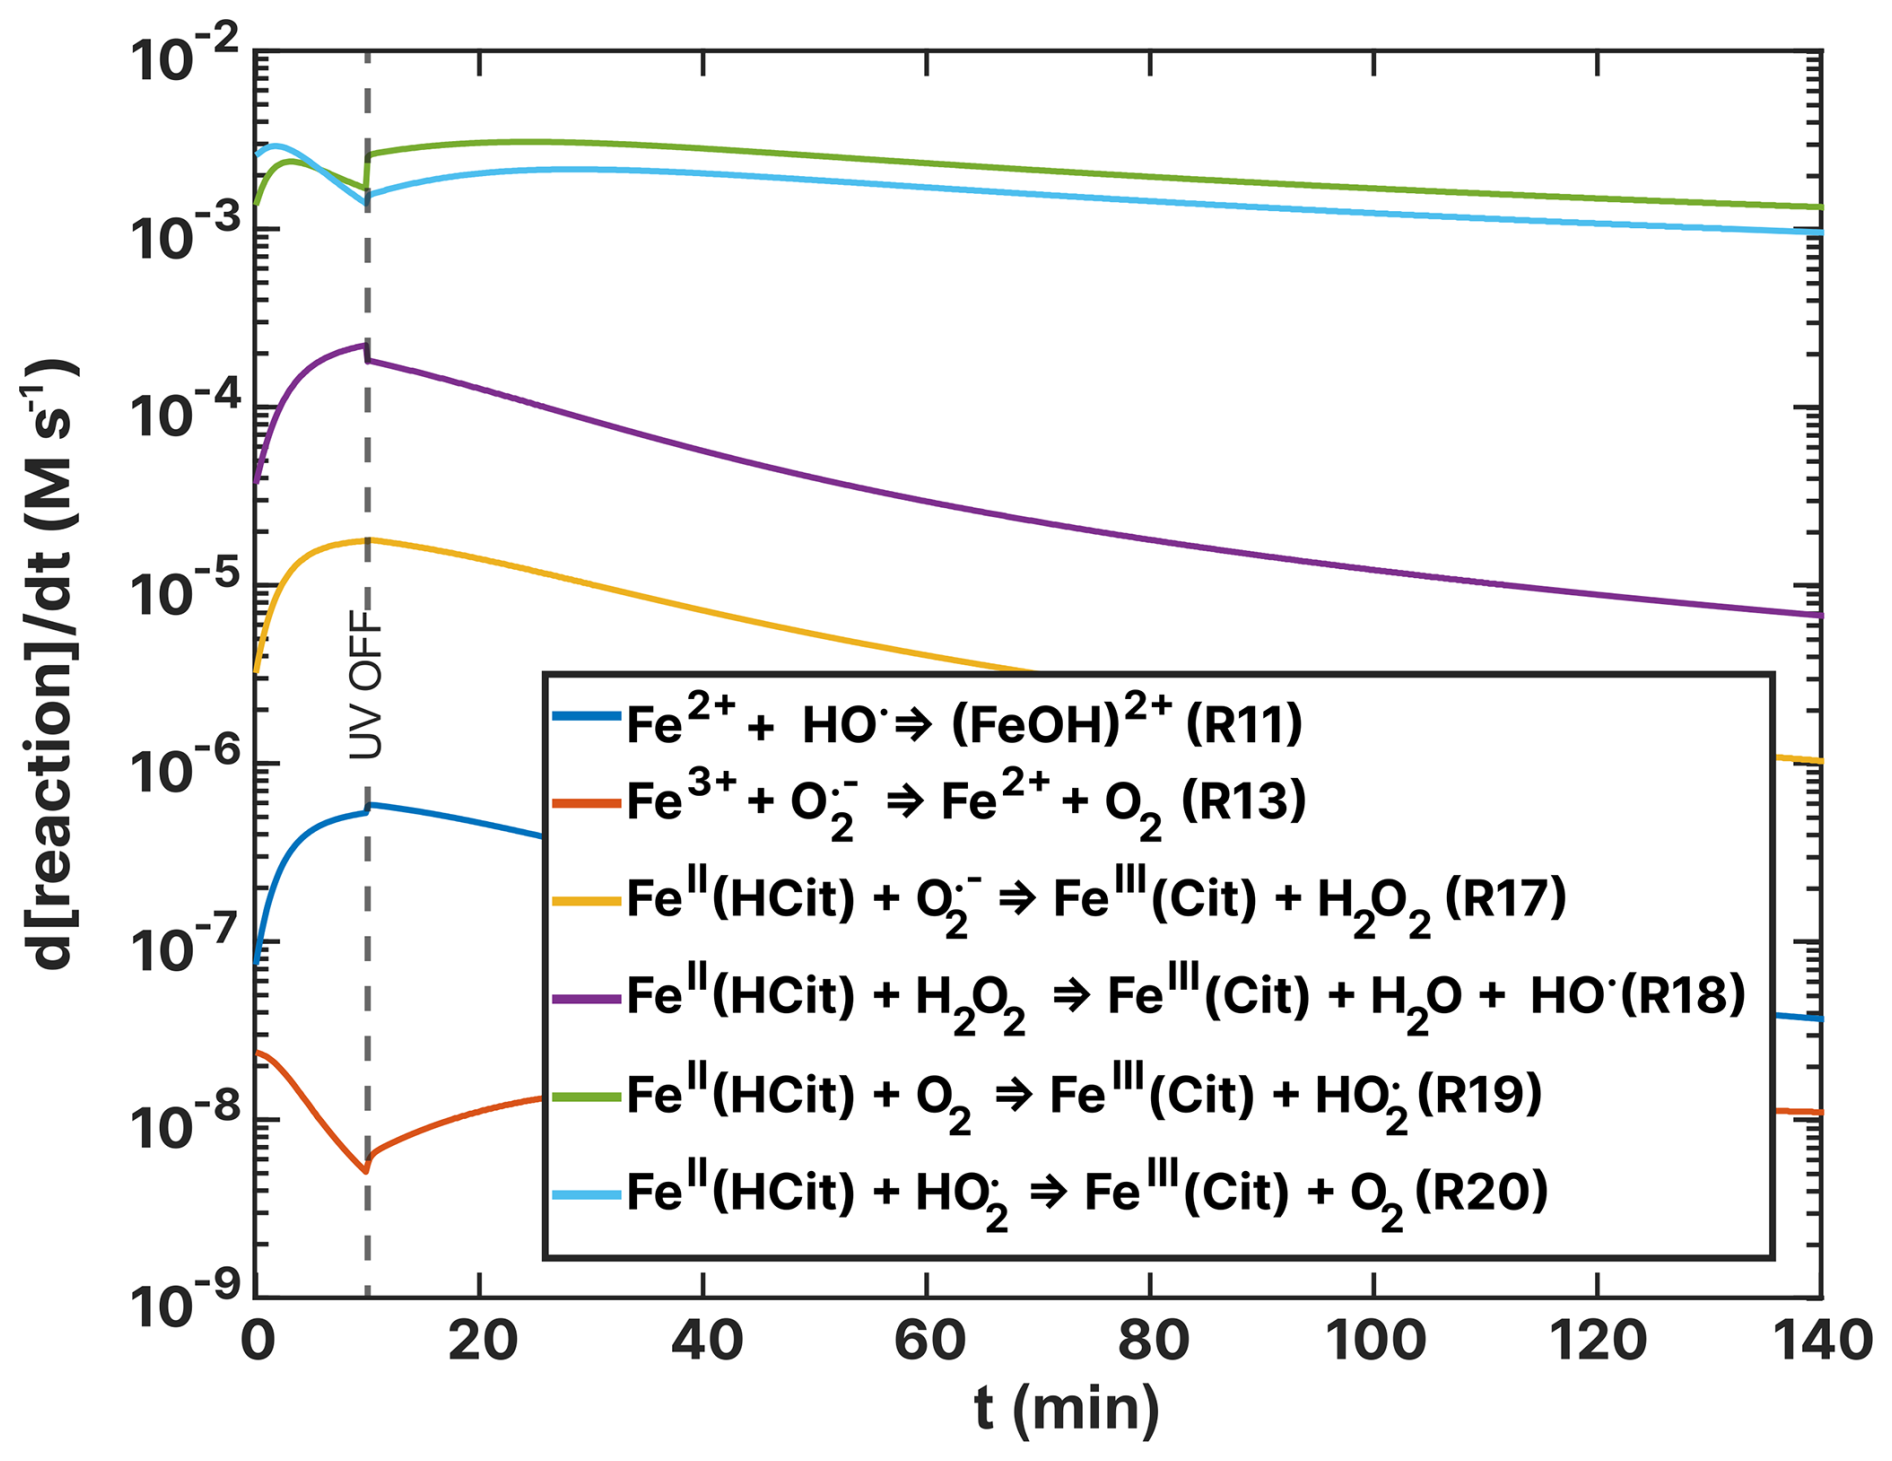
Figure 14Turnover rates (d[reaction] dt) of FeII(HCit) and Fe2+-Fe3+ ion loss reactions as a function of time, t, of the simulation of the (RH = 60 %) experiment as listed in Table 2. UV radiation is turned off at t=10 min.
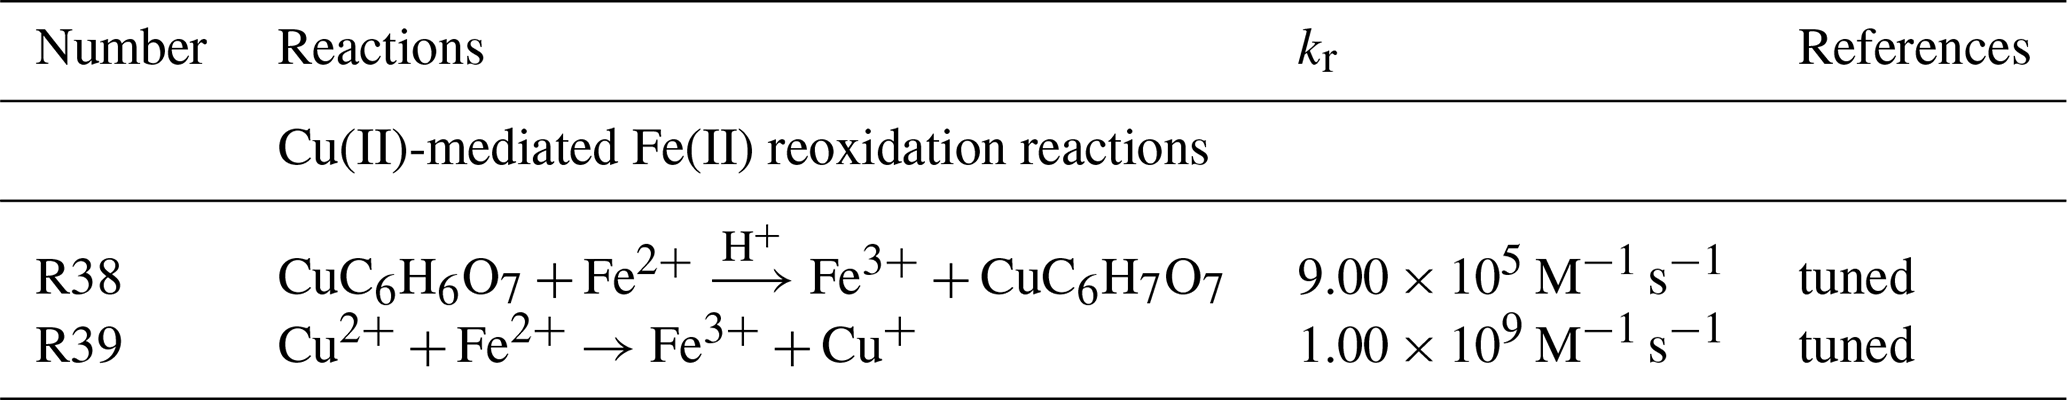
In conclusion, with existing chemical mechanisms found in the literature of the dilute aqueous phase redox chemistry of iron and copper and optimizations of the corresponding rate constants, we could not simulate the observed change in reoxidation with copper at RH = 60 %. Thus, we assert that a copper(II)-catalyzed reaction, which reoxidizes iron(II) during UV aging, is essential for enhancing the model's performance. Although not thermodynamically favored, Matocha et al. (2005) observed a rapid reduction of Cu(II) to Cu(I) in the aqueous phase by dissolved Fe(II) in the absence of oxygen, under conditions where the precipitation of Cu(I) oxides or hydroxides prevented reoxidation by Fe(III). Also, reactions R38 and R39 may also occur in the same way for Fe(II) complexes, not explicitly added to our mechanism. Here, copper can replace one of the iron centers and behave in a similar way as in a solid mixed Fe–Cu oxide, which effectively drives the redox equilibrium in the opposite direction to that expected for a dilute aqueous solution of free metal ions and their complexes. Another study demonstrated synergies between iron and copper oxides under oxygen-rich conditions, suggesting the possibility of direct contact between Fe2O3 and CuO on the surface of a fly ash surrogate (Potter et al., 2018). D'Huysser et al. (1981) found similar conversion but also cautioned that they could be X-ray-induced. Ammann et al. (1992) reported the conversion of mixed into in effloresced aerosol particles generated from mixed aqueous chloride solutions. Additionally, Goh et al. (2006) suspected the presence of Cu(I) in chalcopyrite, indicating mixed Cu-Fe sulfides. This may suggest an interaction between copper and iron ions in contact within mixed crystalline systems, where a different electrochemical equilibrium (favoring ) could occur, as opposed to aqueous solutions (favoring ). We hypothesize that similar coupling could take place in mixed Cu–Fe polynuclear citrate complexes. Based on this hypothesis, we included two direct reactions oxidizing Fe(II) to Fe(III) via the reduction of Cu(II) to Cu(I). Although we did not explicitly model polynuclear complexes, we consider that their reaction may aid in explaining our observations. The Cu2+-induced reoxidation reactions are listed in Table 5 (R38 and R39).
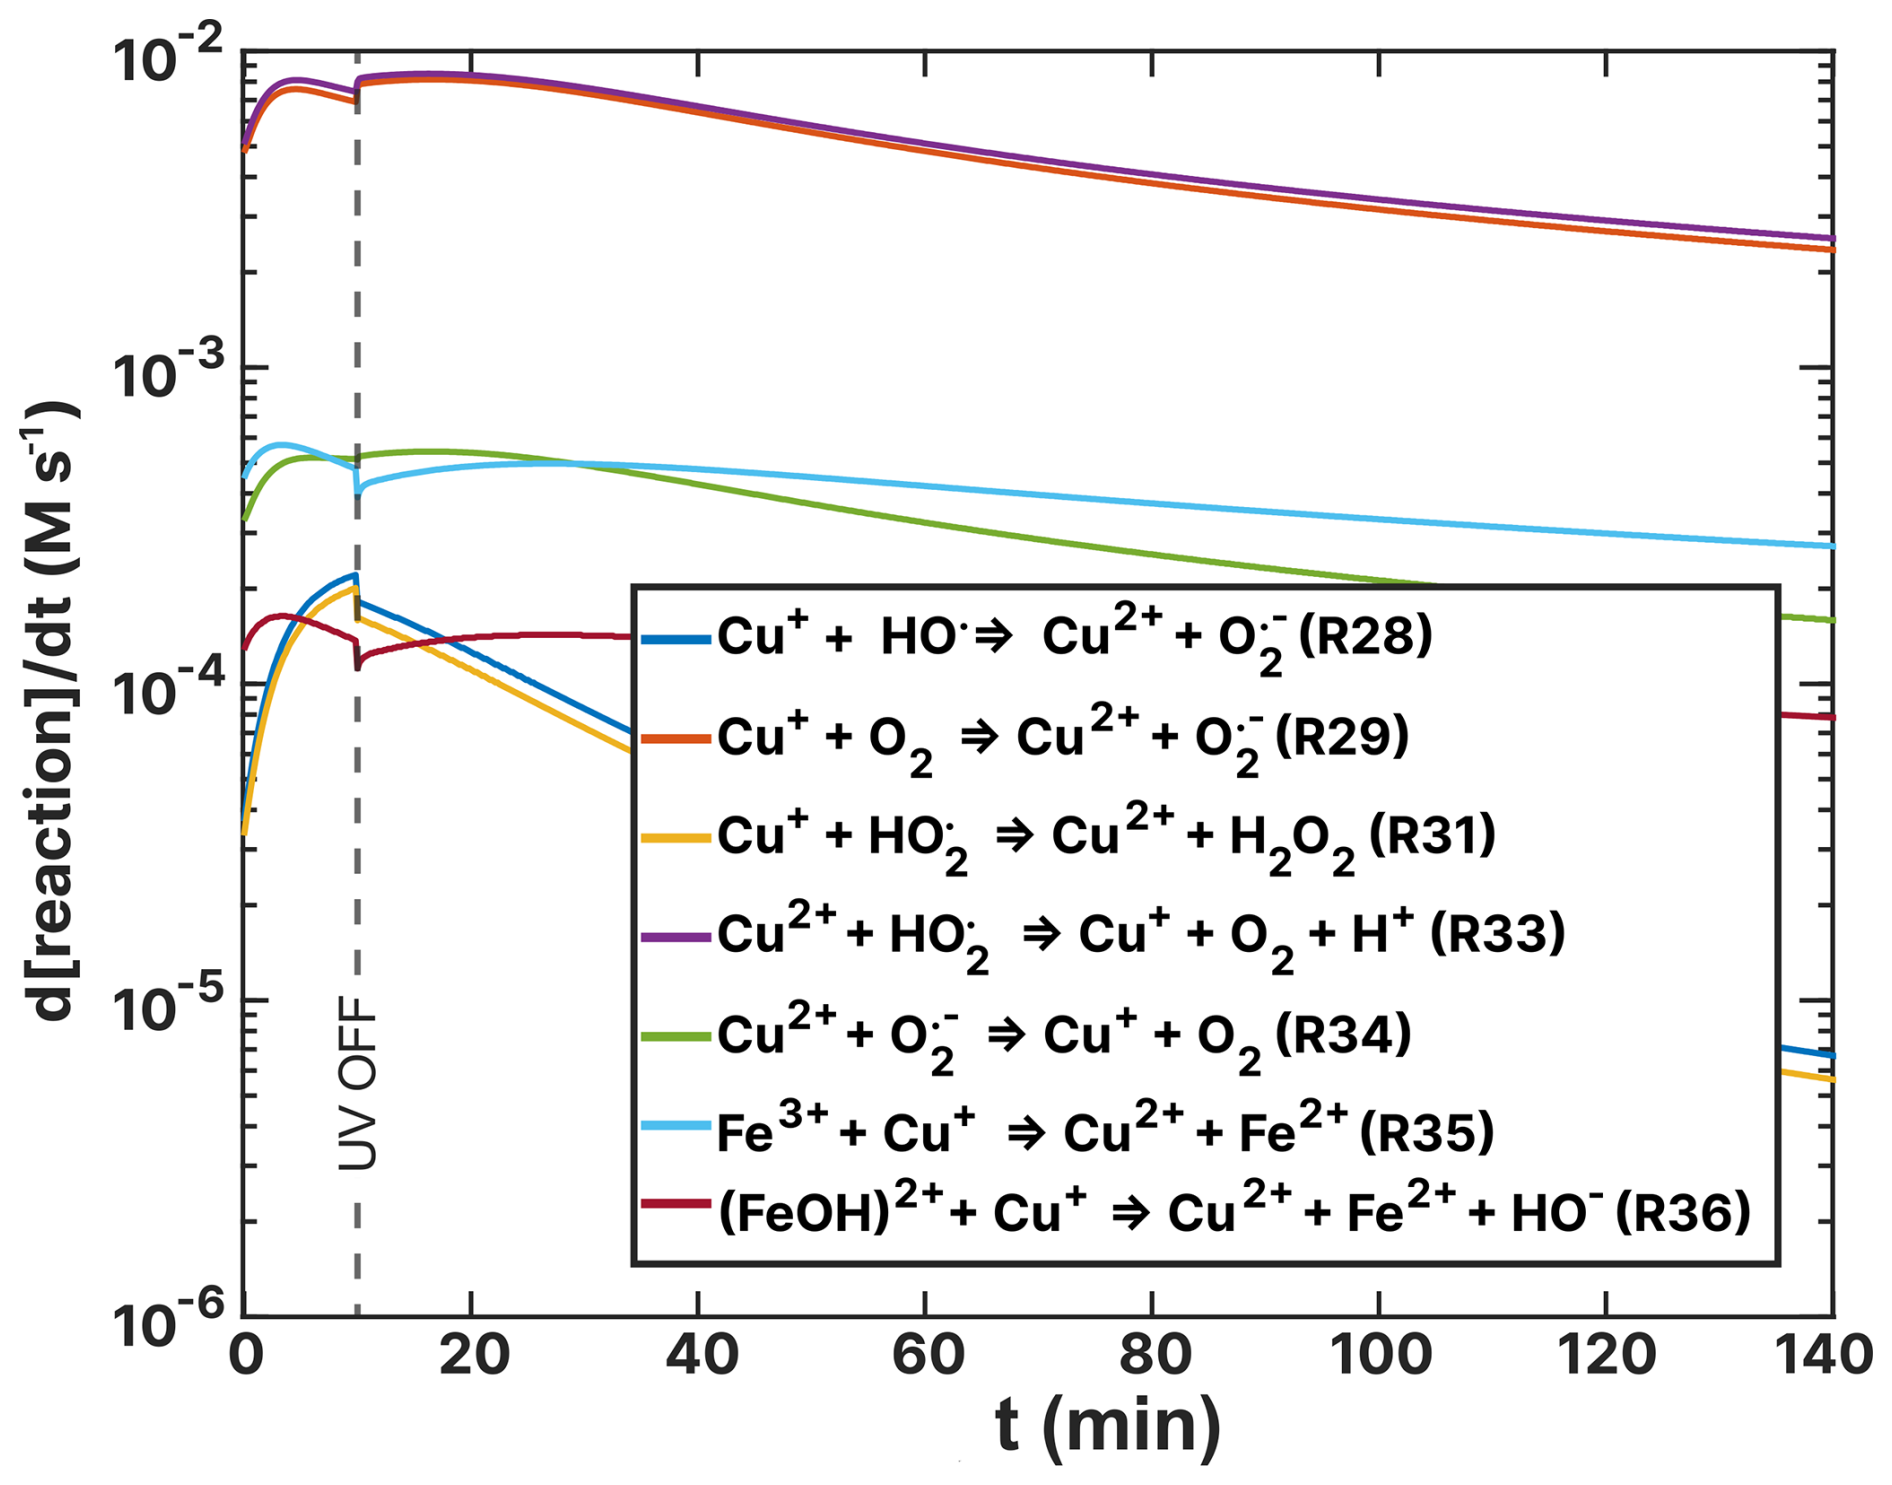
Figure 15Turnover rates (d[reaction] dt) of copper–ROS and Cu–Fe reoxidation reactions as a function of time, t, of the simulation of the (RH = 60 %) experiment as listed in Table 4. UV radiation is turned off at t=10 min.
The new simulation of the experiments with RH = 60 % incorporating R38 and R39 is shown in Fig. 16. The blue data points are the same as those in Fig. 13 ( results in Fig. G1 in the Appendix). These reactions tend to reoxidize iron at the expense of reducing Cu and agree well with our data, largely by imposing a slightly lower O2 transfer coefficient of instead of 8.00 × 10⁻¹⁰ from Figs. 12 and 13). Iron reoxidation was well represented 30 min after the UV light was turned off. Interestingly, the simulation exhibited transient intermediate behavior of the iron(III) fraction with a local minimum of β occurring at t=44 min. This is also apparent in the measurement data. A steady-state β for t≥50 min was also predicted, in agreement with our observations. Here, the uncertainty (blue region) stemmed from values ranging between 1.00 × 10⁻¹⁰ and 1.00 × 10⁻¹⁰, with the optimal fit at 10−10. In particular, the uncertainty range in the model from β=0.4–1 is much larger than our experimental error bars and points to the high sensitivity of multiphase photochemical redox reactions to O2 in the condensed phase, as well as Cu and Fe coupled reactions such as free iron in an organic complex.
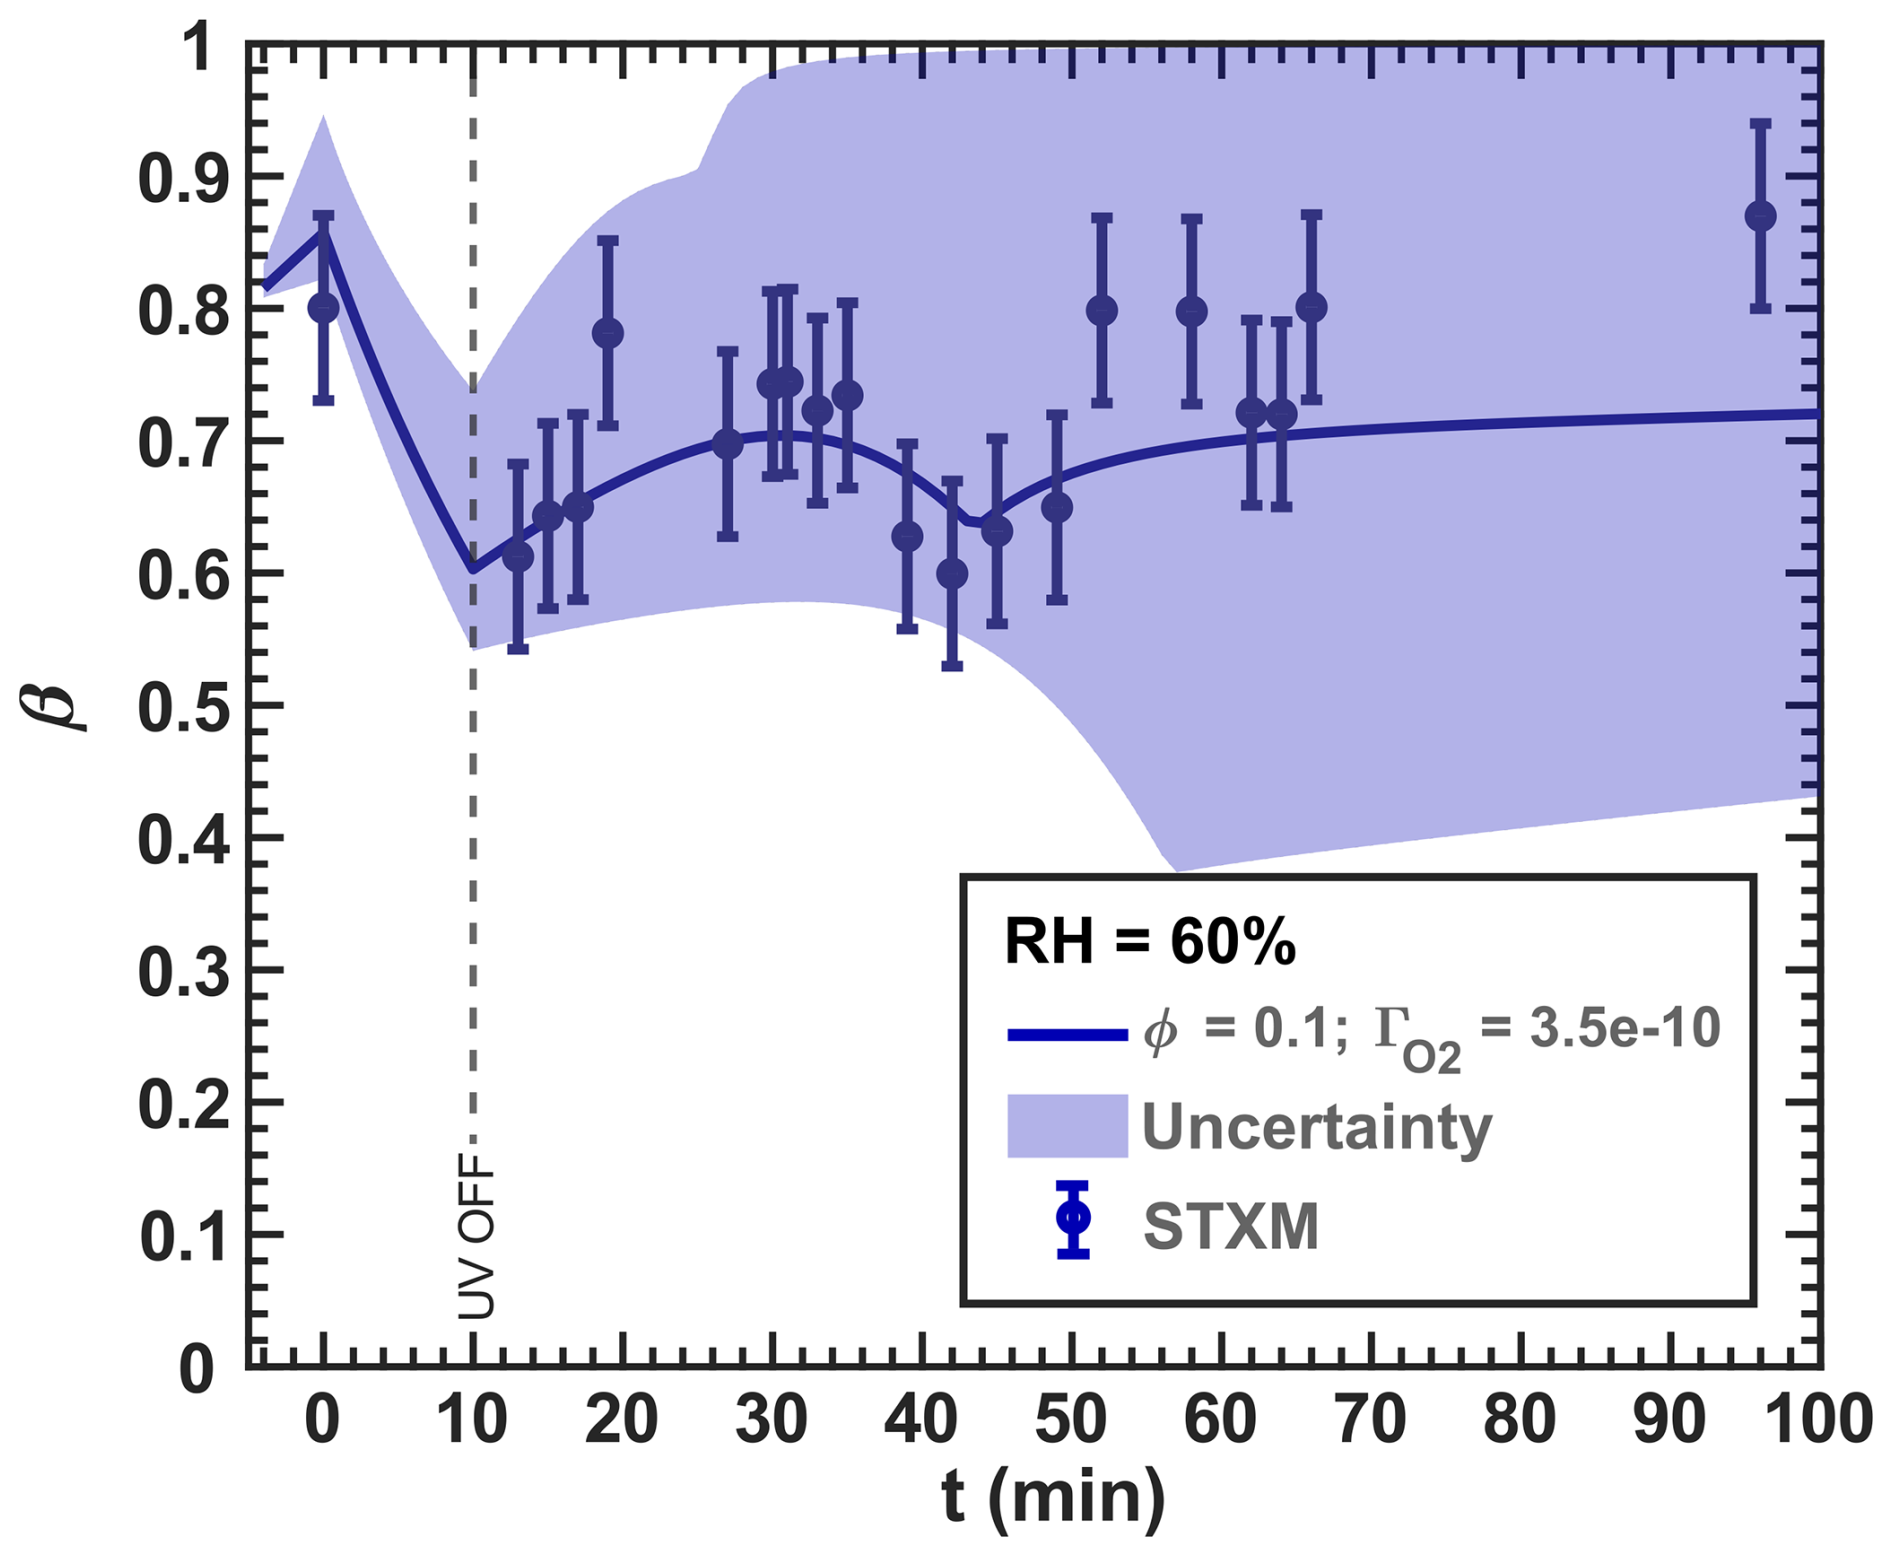
Figure 16Data reproduced from Fig. 13. The O2 uptake coefficient () of the RH = 60 % model run () was slightly adjusted from 8.00 × 10⁻¹⁰ from the initial mechanism to 3.50 × 10⁻¹⁰. The lower and upper boundary of the model uncertainty (blue area) originate from = 1.00 × 10⁻¹⁰–1.00 × 10⁻⁹.
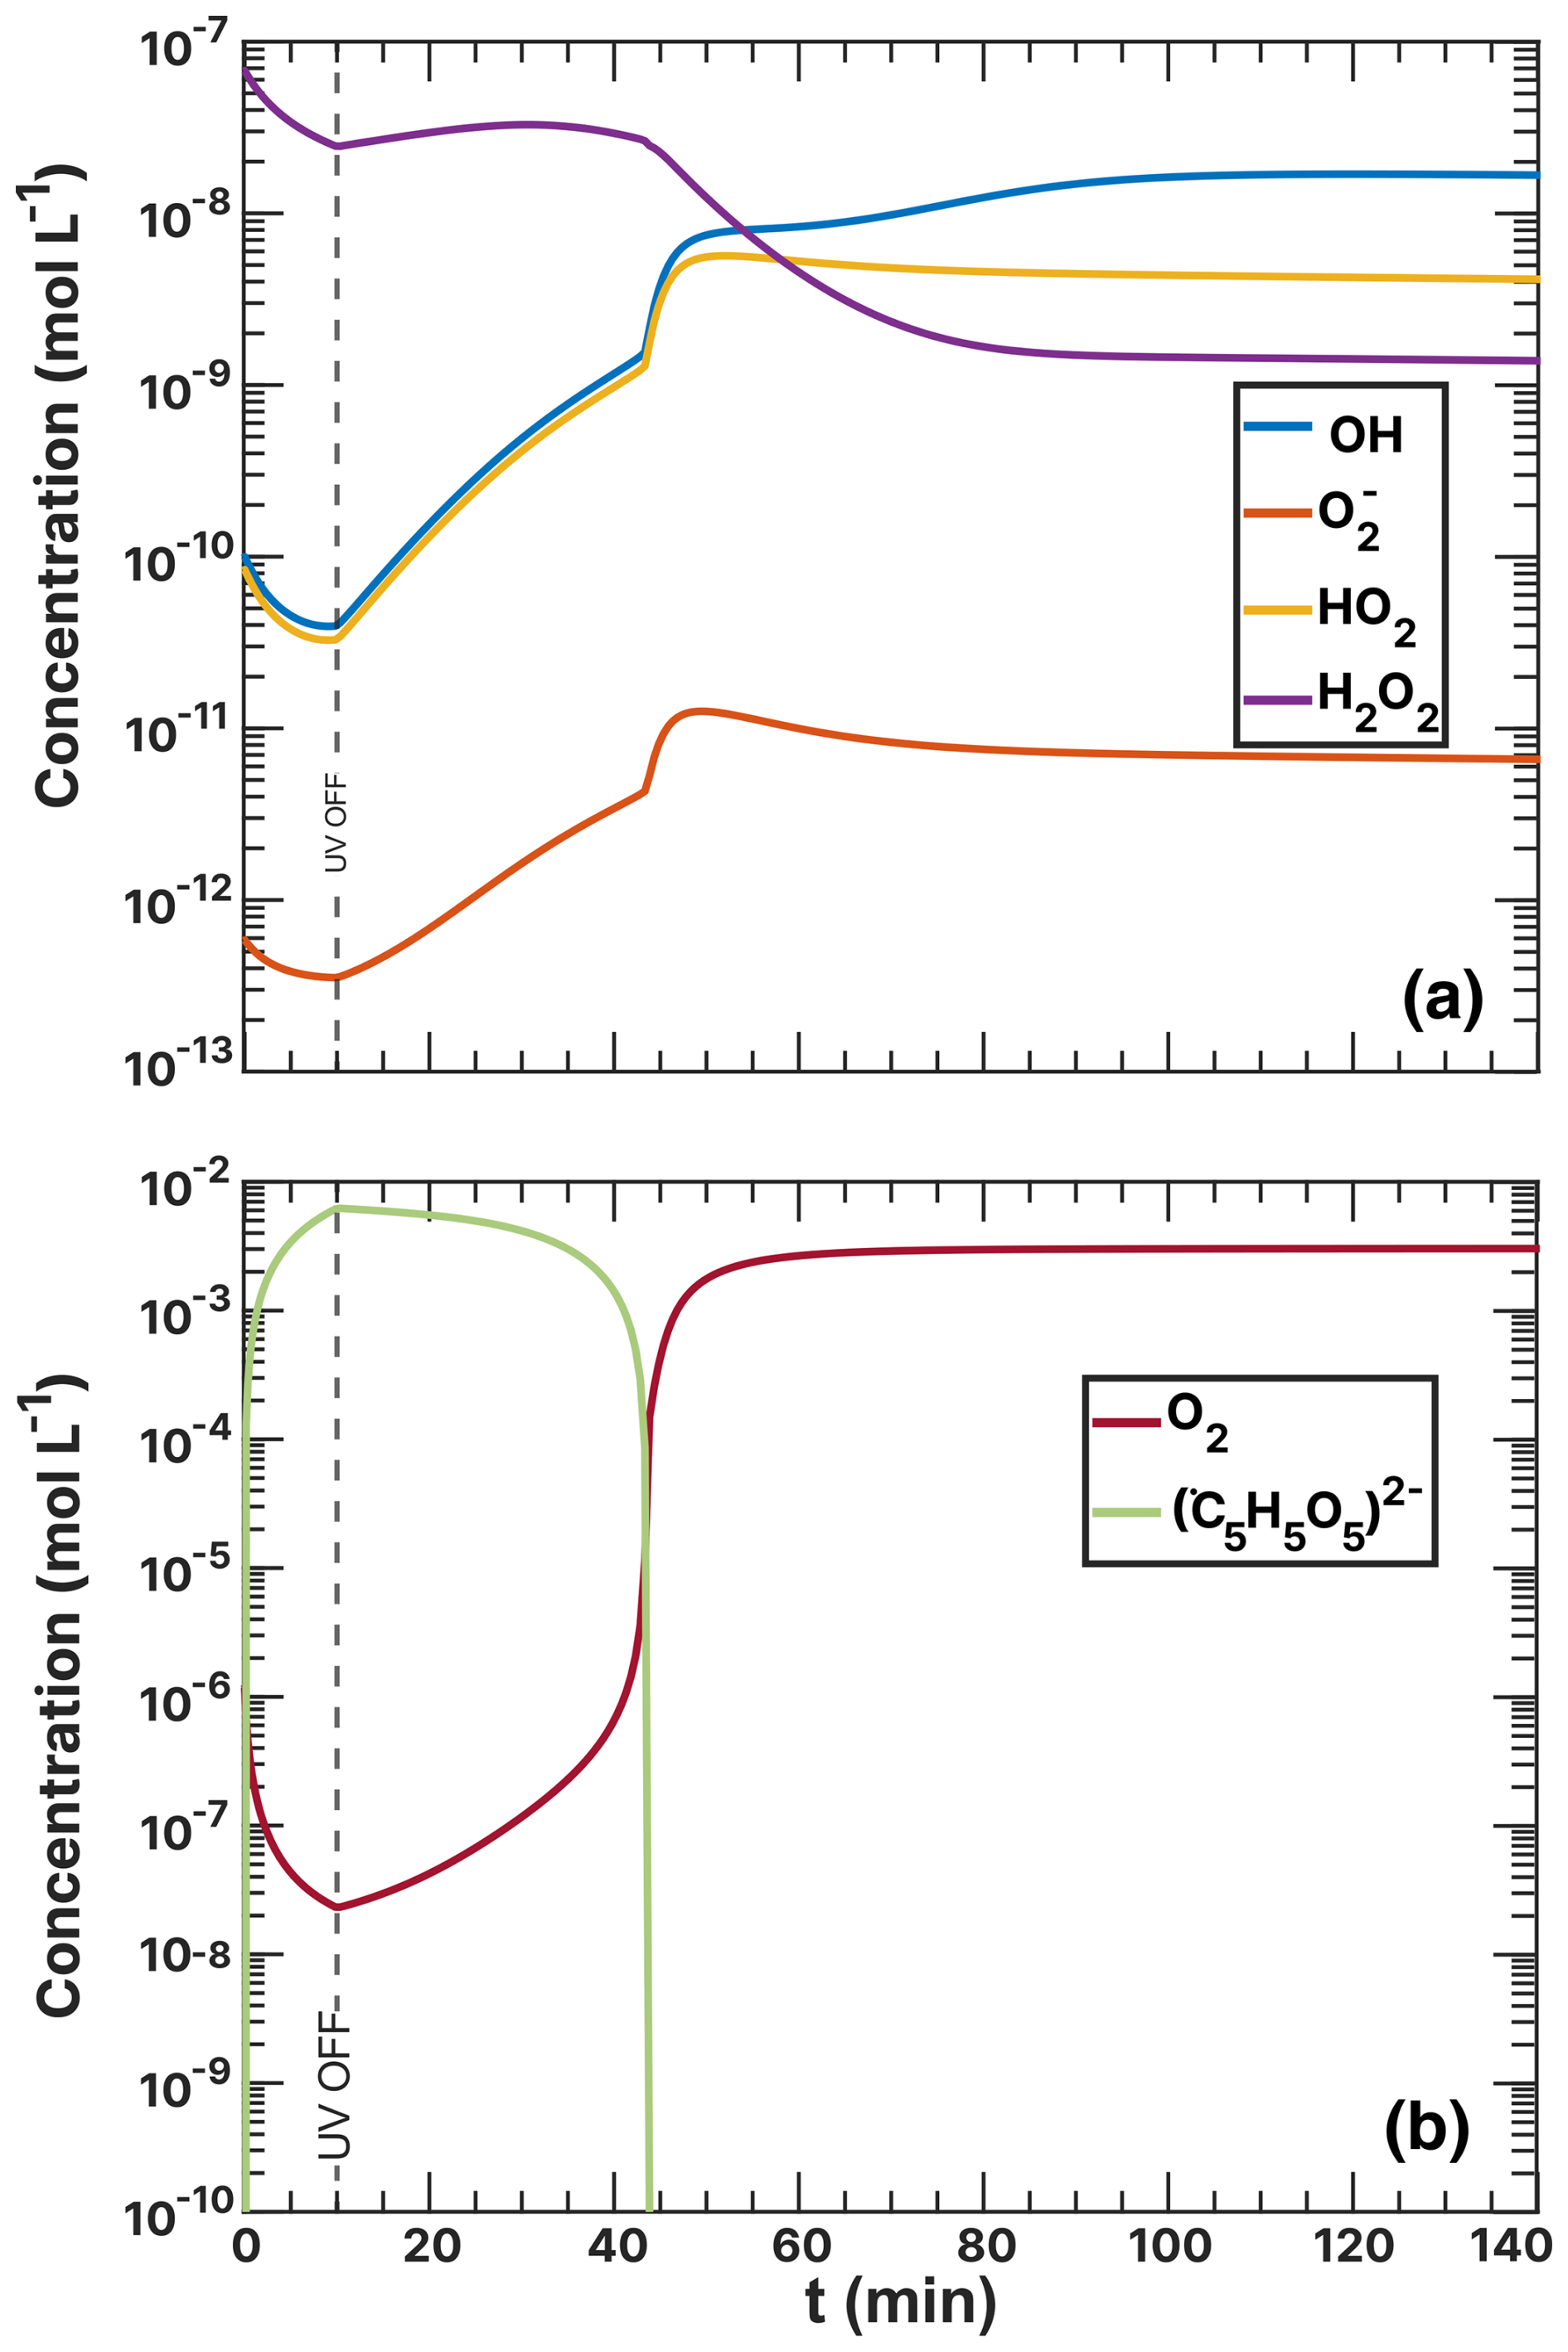
To provide an explanation for these findings, we also calculated the concentrations of O2, CCFR (), and ROS in Figs. 17 and G2 in the Appendix. The ROS levels (Fig. 17a) stabilize at a steady-state concentration at t> 40 min, with H2O2 decreasing to a minimum and OH, HO2, and increasing overall. The CCFR concentration did not deplete immediately after the UV light was turned off but instead decayed from 7.00 × 10⁻³ mol L−1 at t=10 min to zero at ≈40 min. The behavior mirrored the concentration of O2, indicating that O2 was consumed by the CCFR. Reaction R39 produces Cu+, which reduced O2 to via R29, preventing the O2 concentration from rising, resulting in a slow decay of CCFR and maintaining a high value. This behavior also coincided with high H2O2 levels at t≤ 45 min due to Cu+–ROS reactions R31 and R32.
The oxidation of Fe2+ by Cu2+ (R39) was essential to model the reoxidation of particles under high humidity conditions. These reactions enhanced overall turnover under light, making the supply of O2 an important factor. CCFRs were a transient intermediate that strongly constrained O2 reaction and diffusion to the entirety of the particle. We acknowledge that simply allowing to vary is not a rigorous approach to account for reaction or diffusion limitations, which may also affect other reactions. These limitations contribute to the uncertainty in and to the slight differences between model runs. Future work could apply a multilayer model to resolve them and explore reaction and diffusion limitations further.
Using scanning transmission X-ray microscopy (STXM/NEXAFS), we observed novel redox characteristics in photochemically aged iron–copper complexed citric acid (CA) particles. A kinetic model was employed to explore the chemical mechanisms that led to the altered iron reoxidation pattern compared to systems without copper. The STXM/NEXAFS data provided evidence that the reoxidation of UV-light-reduced iron(II) to iron(III) caused iron(III) fractions, β, to be elevated both on the surface and within the center of the particles, unlike pure iron-doped CA particles () (Alpert et al., 2021). Furthermore, at moderate relative humidity (RH =60 %), β in particles remained high immediately following UV irradiation.
Using a kinetic box model, we found that the changes in the photochemical aging process of particles observed in anoxic STXM/NEXAFS experiments at RH =60 % originated from a lower iron(II) quantum yield (ϕ) of the initial FeIII(Cit) photolysis and a faster iron reoxidation compared to particles. By employing the newly fitted parameter, ϕ=0.1, we subsequently modeled UV-aging experiments in the presence of oxygen. The model simulations of low-humidity experiments (RH = 20 % and 47 %), running on Cu–ROS and Cu–Fe coupling reactions taken from the literature, successfully replicated the experimental data. However, experiments carried out at RH = 60 % using different mole ratios of copper (Mr of and ) could not be replicated using the same chemical mechanism. The modeled value of β immediately after UV irradiation was underestimated by ≈0.4, reaching only β=0.9 after 90 min of reoxidation. The predicted oxygen concentration suggested that limitations in its uptake coefficient () could not account for the fast iron(III) reoxidation. Thus, at elevated humidity, an as-yet undescribed chemical process likely accelerated the reoxidation of copper-containing particles.
Reactions between copper(II) and iron(II), reoxidizing iron(II) even during UV light exposure, proved crucial to improving the model's performance. Previous studies have demonstrated copper–iron interactions in both solid phase (Ammann et al., 1992; Goh et al., 2006) and aqueous phase (Matocha et al., 2005) chemistry. In this work, we hypothesize that such coupling may also occur in mixed Cu–Fe polynuclear citrate complexes. To test this, we included two direct reactions oxidizing iron(II) to iron(III) while reducing copper(II) to copper(I) and adjusted their rate constants accordingly. Incorporating these reactions greatly improved the simulations, and the new model runs displayed an oscillating β pattern that began during UV aging, closely mirroring the STXM/NEXAFS observations for more than an hour of dark reoxidation.
This work emphasizes again the important role of condensed phase radical production via chromophores absorbing in the UVA range. While Mao et al. (2013) indicated that gas phase HO2 and H2O2 influxes into the condensed phase may be significantly higher than their internal production rates, we arrive at a different conclusion here, as already pointed out by Corral Arroyo et al. (2018b) for HO2 production initiated by aromatic carbonyl photosensitizers. Uptake of gas phase HO2 to aqueous particles is driven by the self-reaction of HO2 and by the reaction with transition metal ions (TMIs). Following the recommendation by IUPAC (Ammann et al., 2013), with its most recent updates available at IUPAC Task Group on Atmospheric Chemical Kinetic Data Evaluation (2017), γ is around 1 × 10⁻² for moderately acidic aerosol, TMI content in the mM range (Al-Abadleh, 2024), and particle diameters of d = 500 nm. With an HO2 concentration in the gas phase of 1.0 × 108 cm−3, an influx of HO2 of 1.8 × 10⁻⁶ is obtained. This influx is almost 3 orders of magnitude lower compared to our modeled HO2 production rate in the condensed phase of about 5.0 × 10⁻⁴ . Even when comparing to an extreme case with a TMI content of 1 M and thus an order of magnitude larger HO2 uptake, the internal HO2 production remains higher. Thus, even in the presence of copper, the internal HO2 production remains very important.
This study highlights the importance of understanding detailed chemical mechanisms for accurately depicting aerosol photochemical aging. Individual chemical species, such as copper, can significantly influence these processes in surprising ways, especially in organic aerosols that interact with trace compounds throughout their atmospheric lifetime. Anthropogenic emissions add further complexity to these photochemical aging mechanisms. Future work should focus on multiphase modeling approaches that link chemistry with physical characteristics and extend these mechanisms to ambient secondary organic aerosol particles.
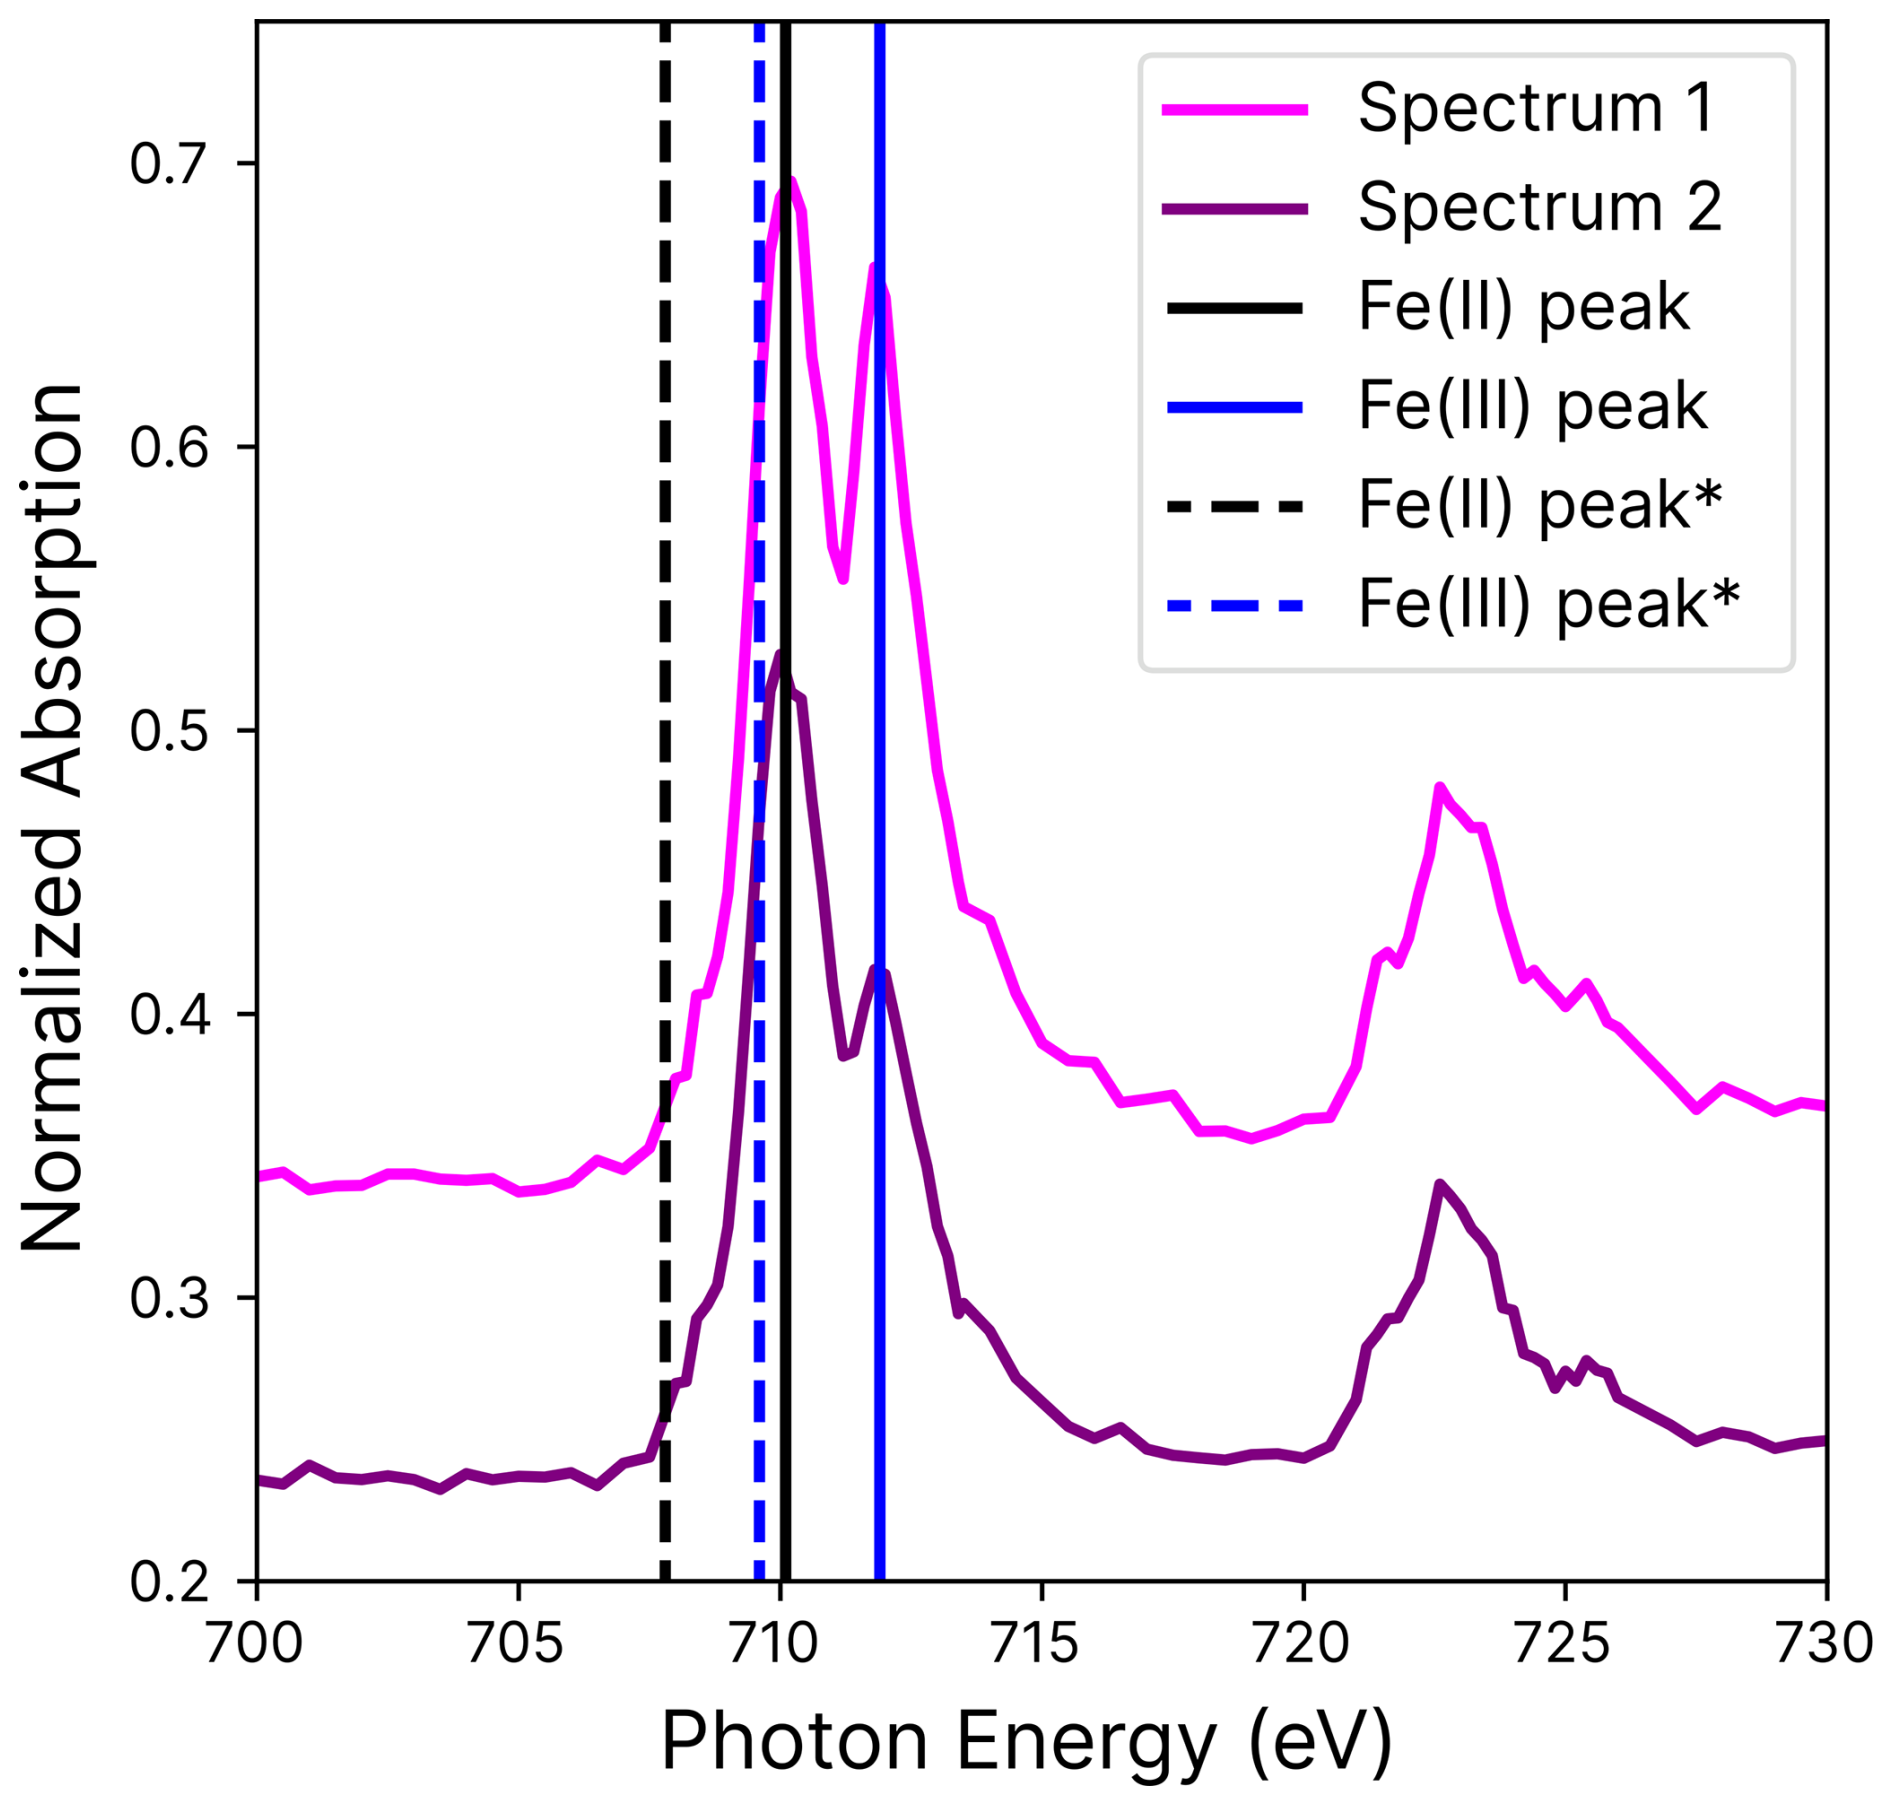
Figure A1Iron absorption as a function of photon energies over the L-edge with the iron(II) (black) and iron(III) (blue) absorption peaks (straight lines). The peaks were calibrated with measurements by Moffet et al. (2012) (starred) and differed by 2.3 eV. Two independently measured spectra are shown.
Table B1Results of the actinic flux/LED flux factor (ζ) with Eq. (2) for all possible combinations shown in Fig. B1.
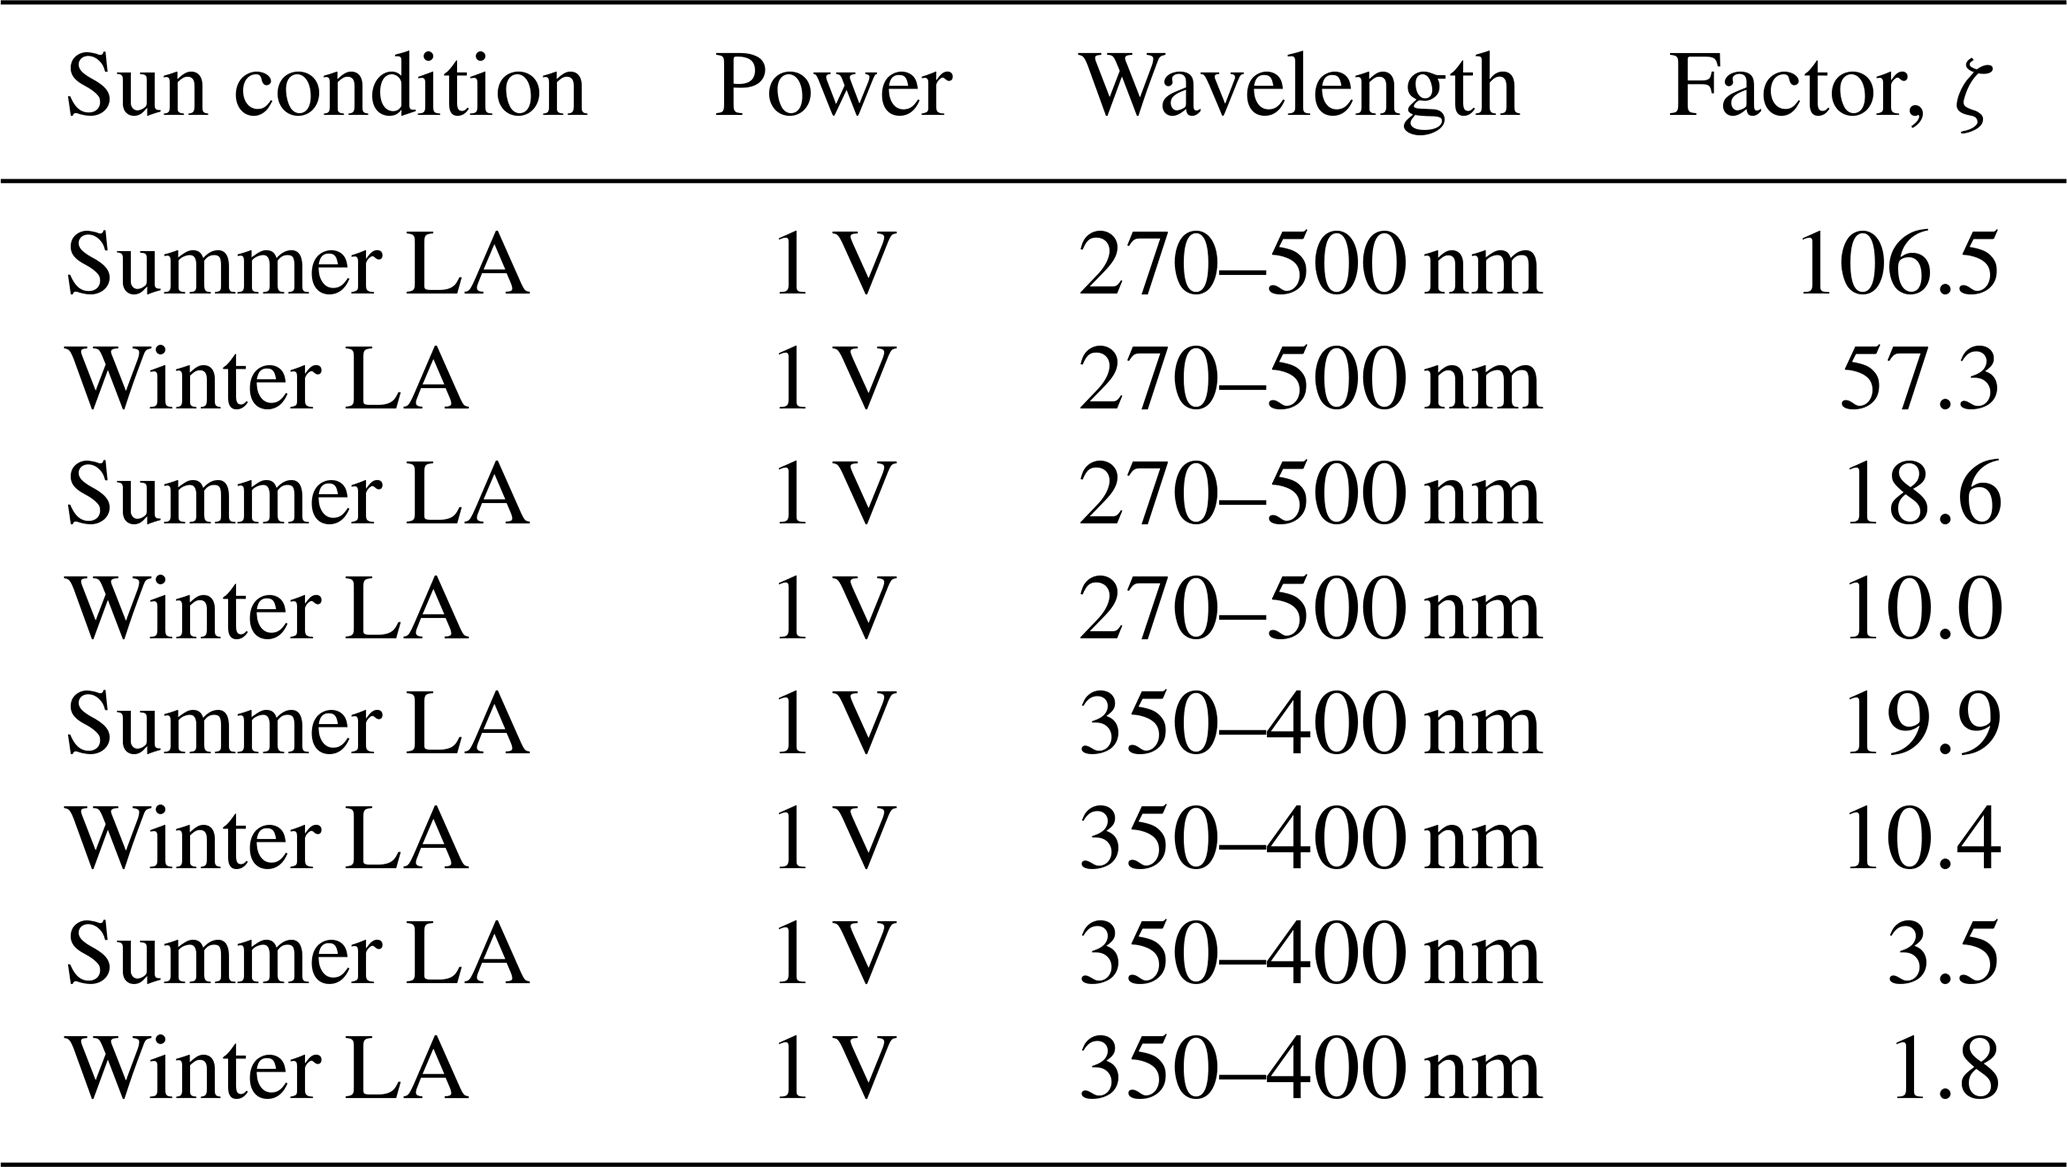
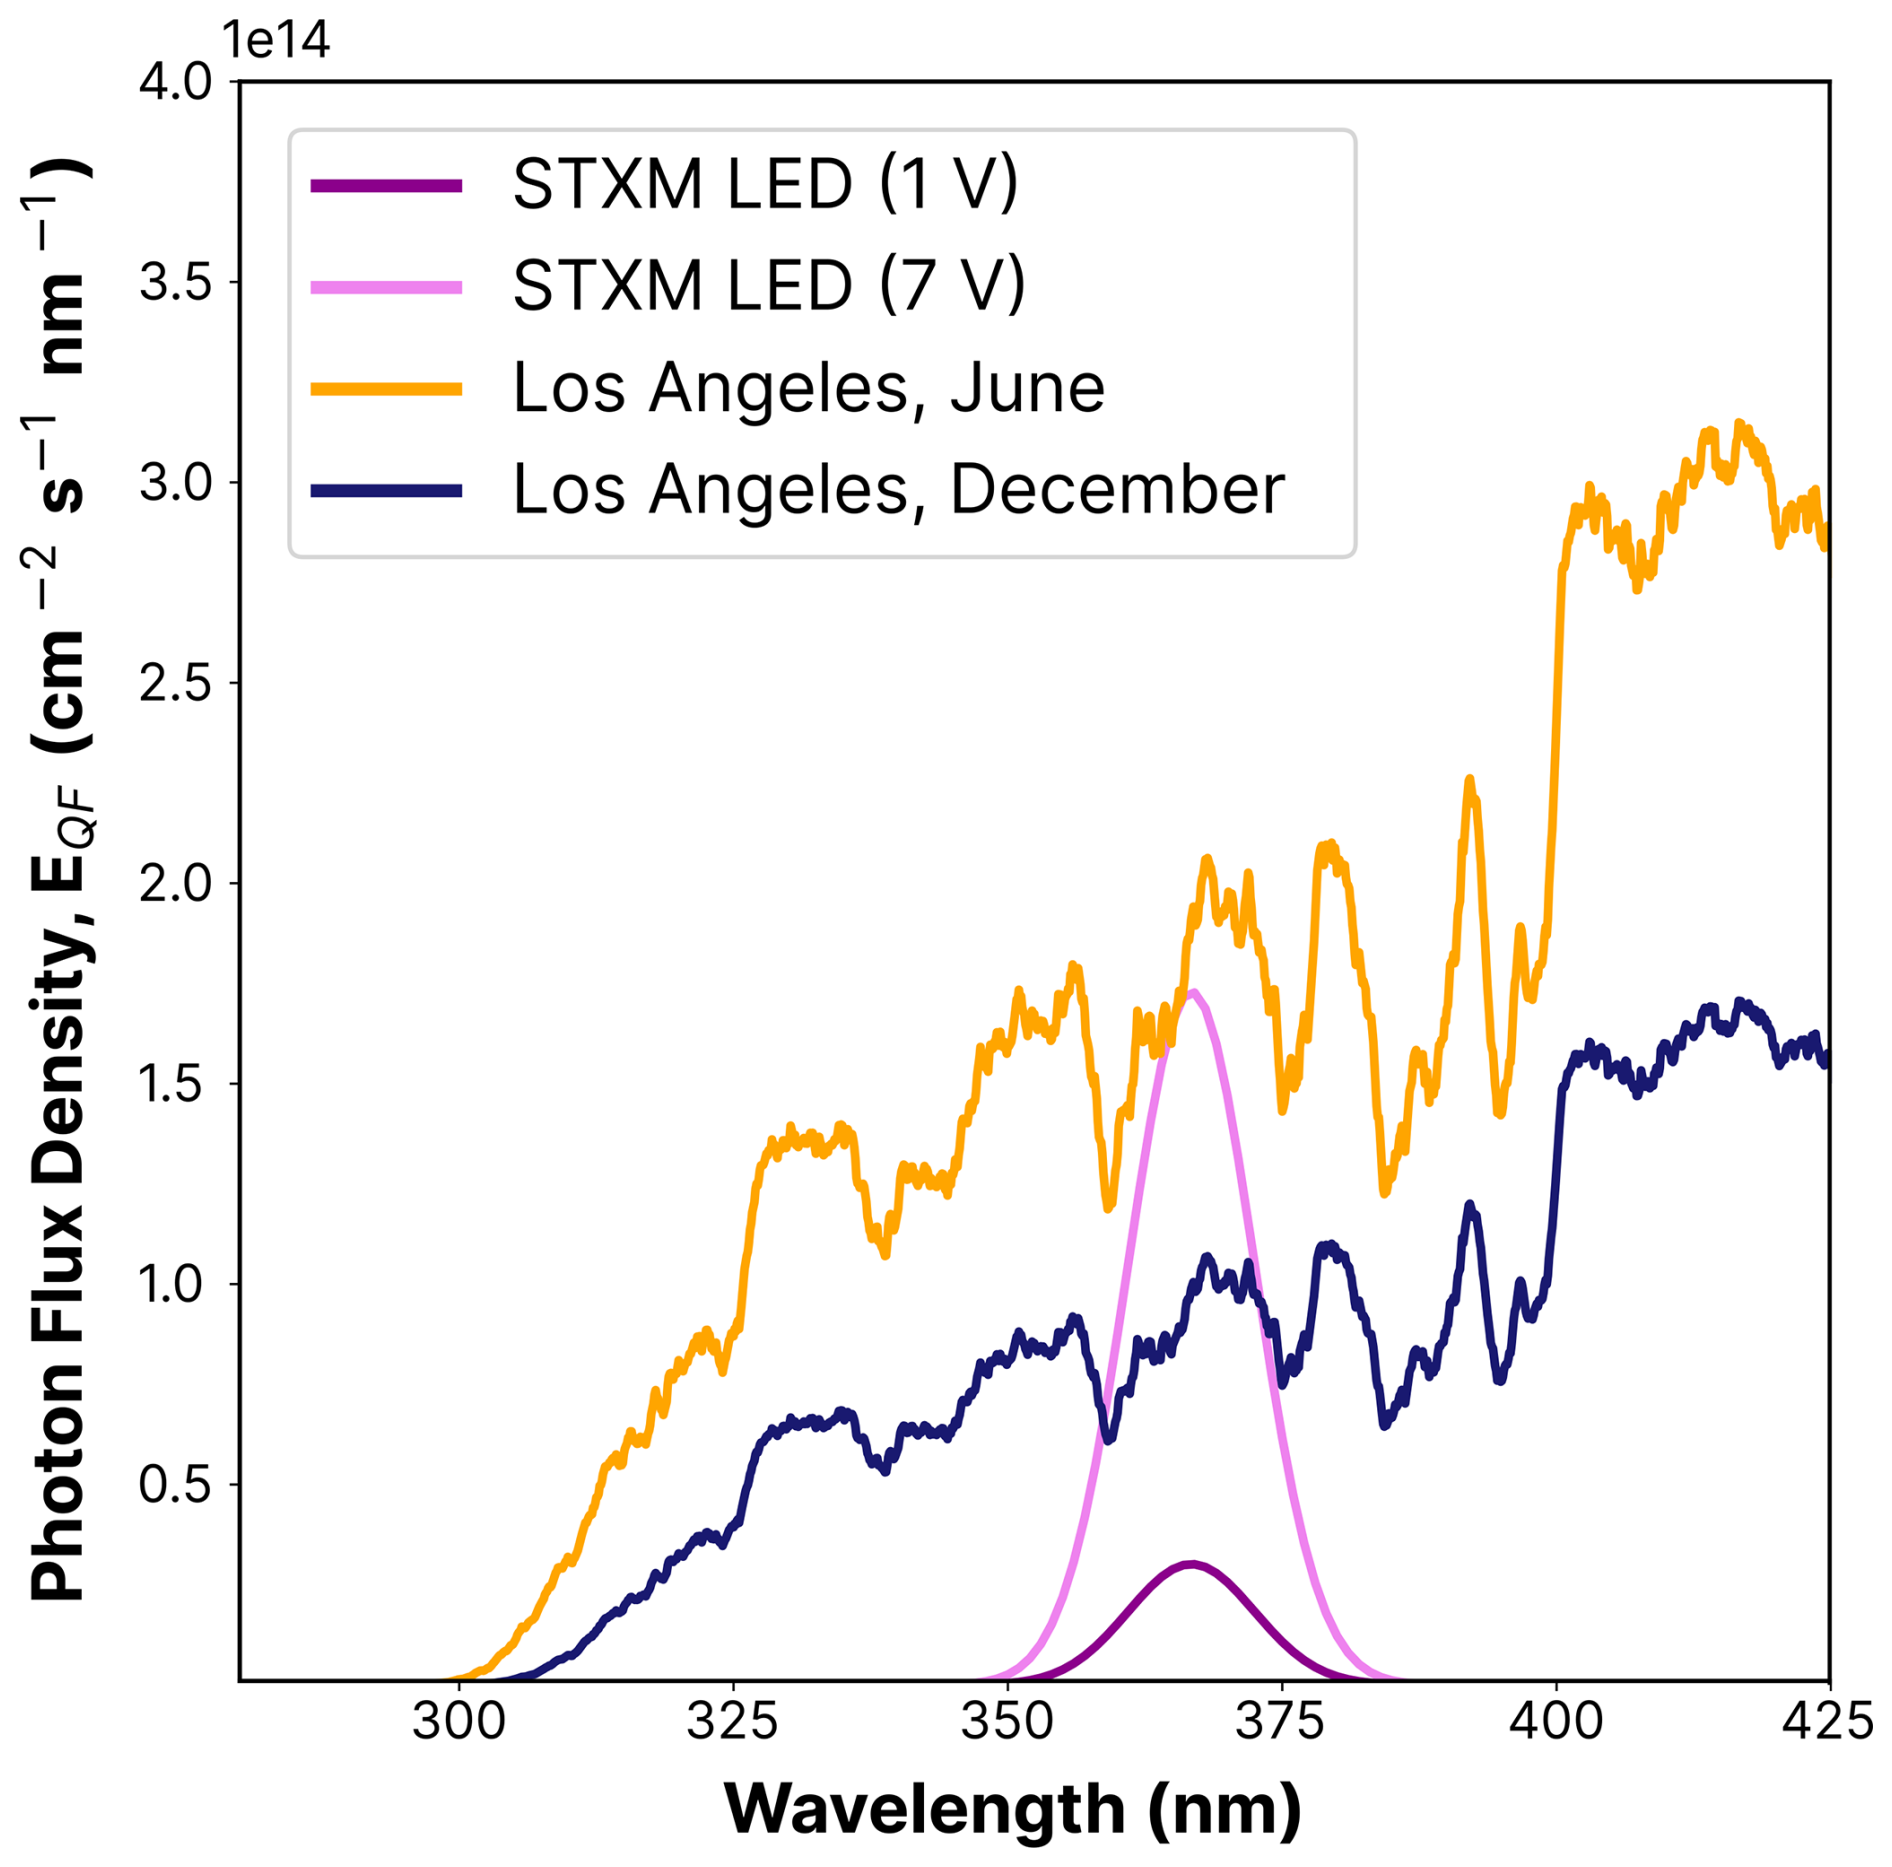
Figure B1UV LED spectra flux density used for UV aging in STXM/NEXAFS experiments for the 1 V (magenta) and 7 V (violet) settings, and solar spectral flux densities in Los Angeles in June (orange) and December (dark blue), measured at noon, as a function of the integrated UV-wavelength range (λ=270–500 nm; see Eq. 2). The flux densities of the actinic spectra are taken from the libRadtran software (Emde et al., 2016).
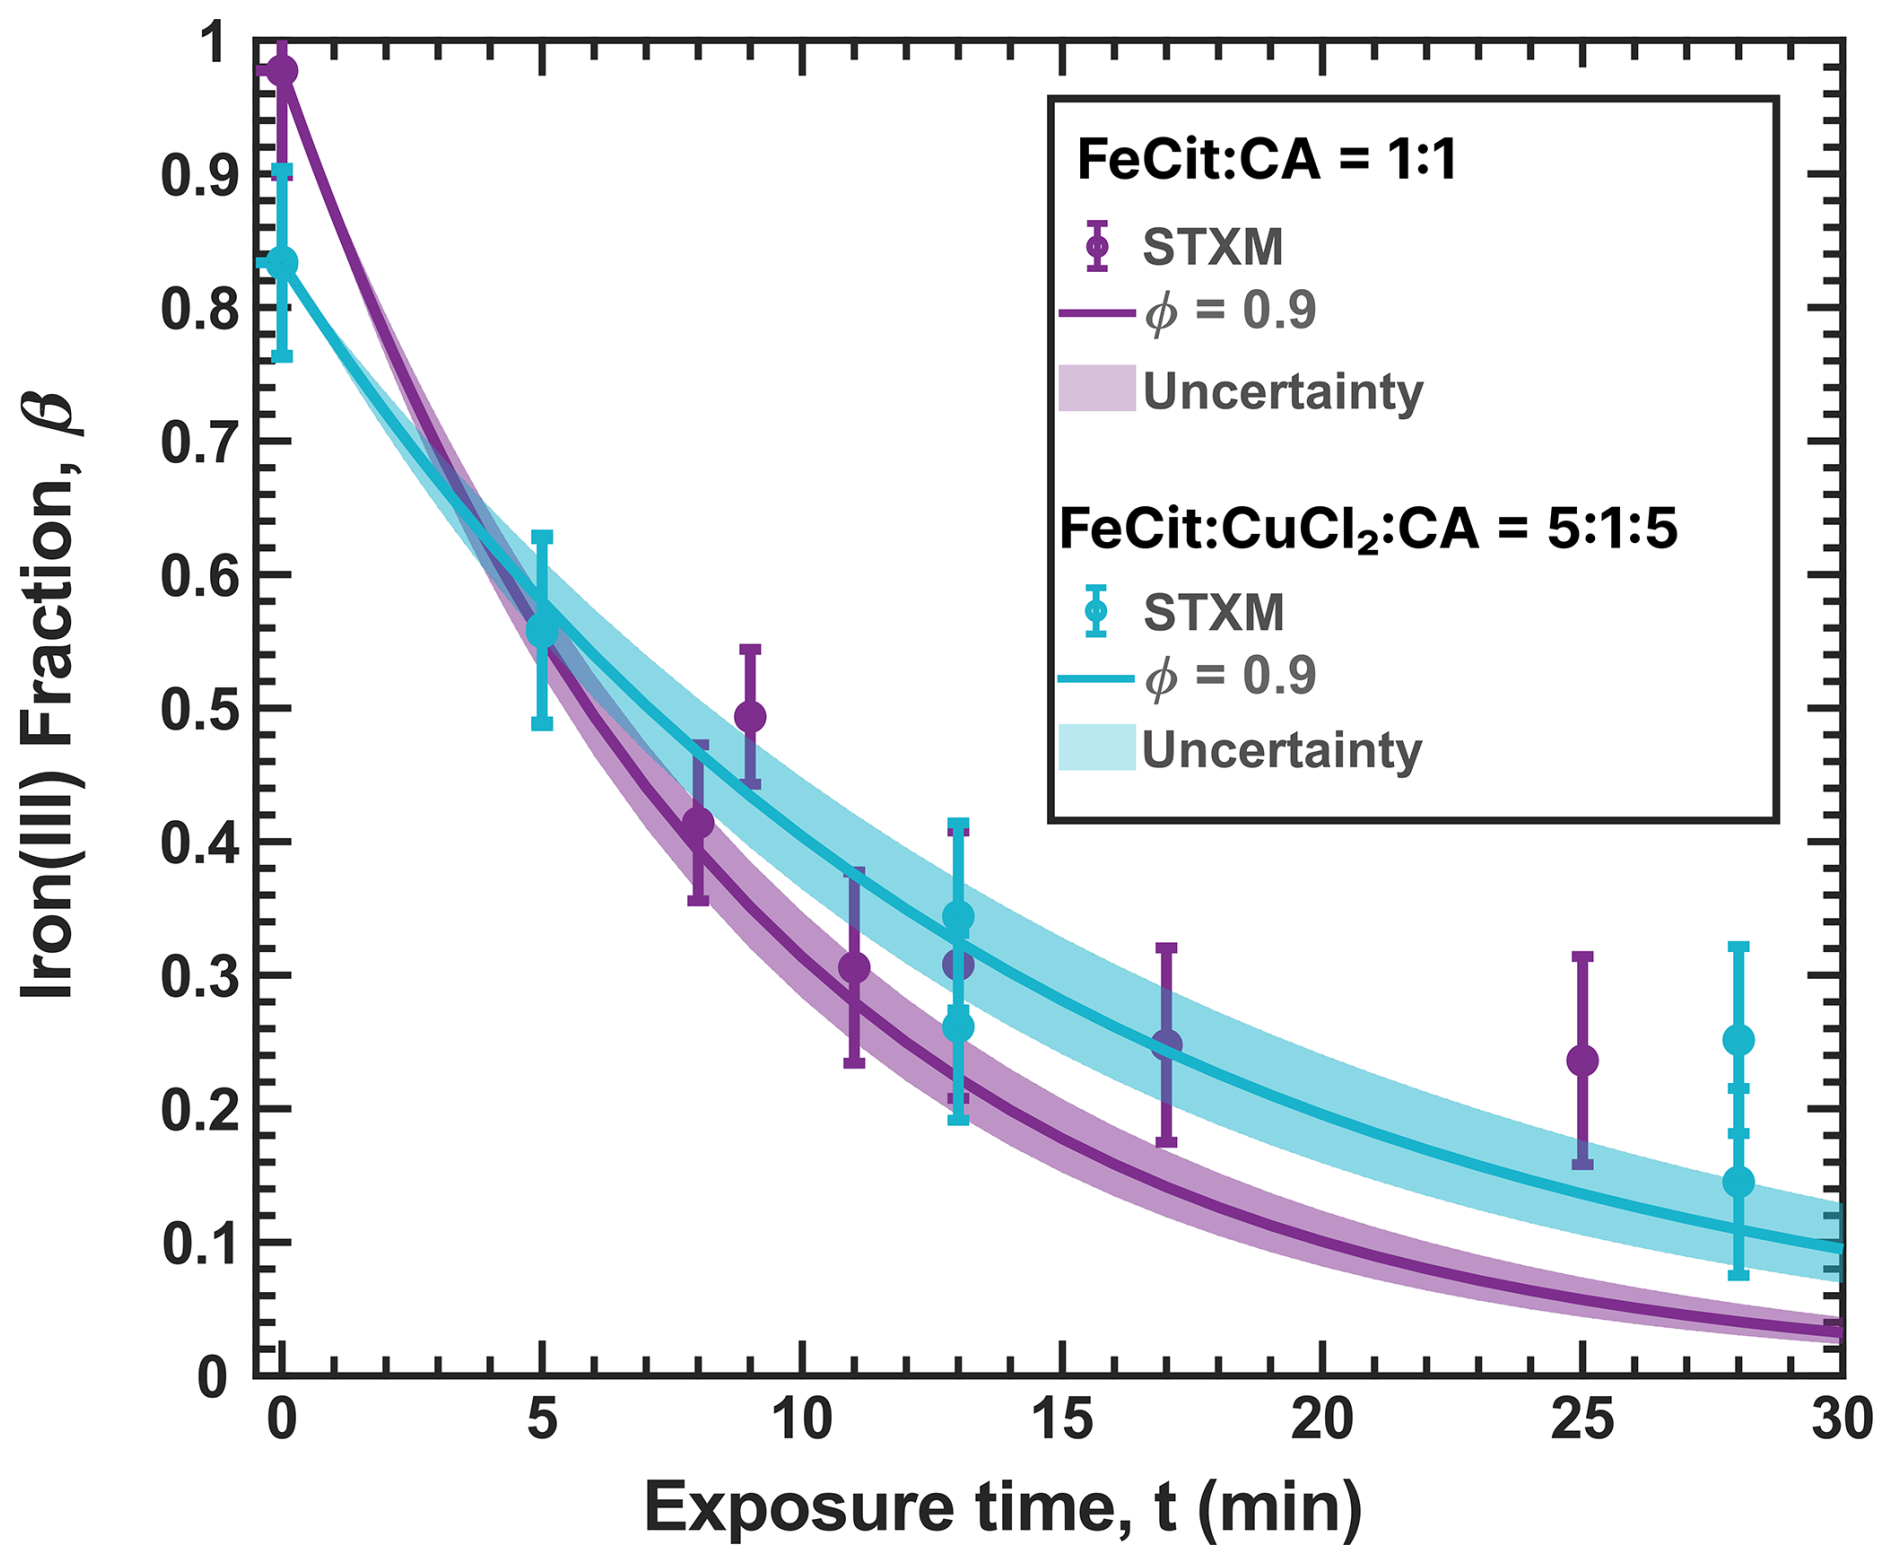
Figure C1Iron(III) fraction, β, as a function of time irradiated with UV light from an LED with a narrow wavelength band centered at 370 nm. The plot shows circles and lines as measurements and model output, respectively. Violet data and model output are from a previous study using and modeled using a photolysis frequency s−1 (Dou et al., 2021). The light-blue measurements, performed in the environmental cell without O2 and RH =0 %, and model output are from this work, using at a mole ratio with 10−3 s−1. An iron(II) quantum yield, ϕ=0.9, was used to calculate j. Error bars are ±0.07 or propagated from the photon counting error, whichever is larger.
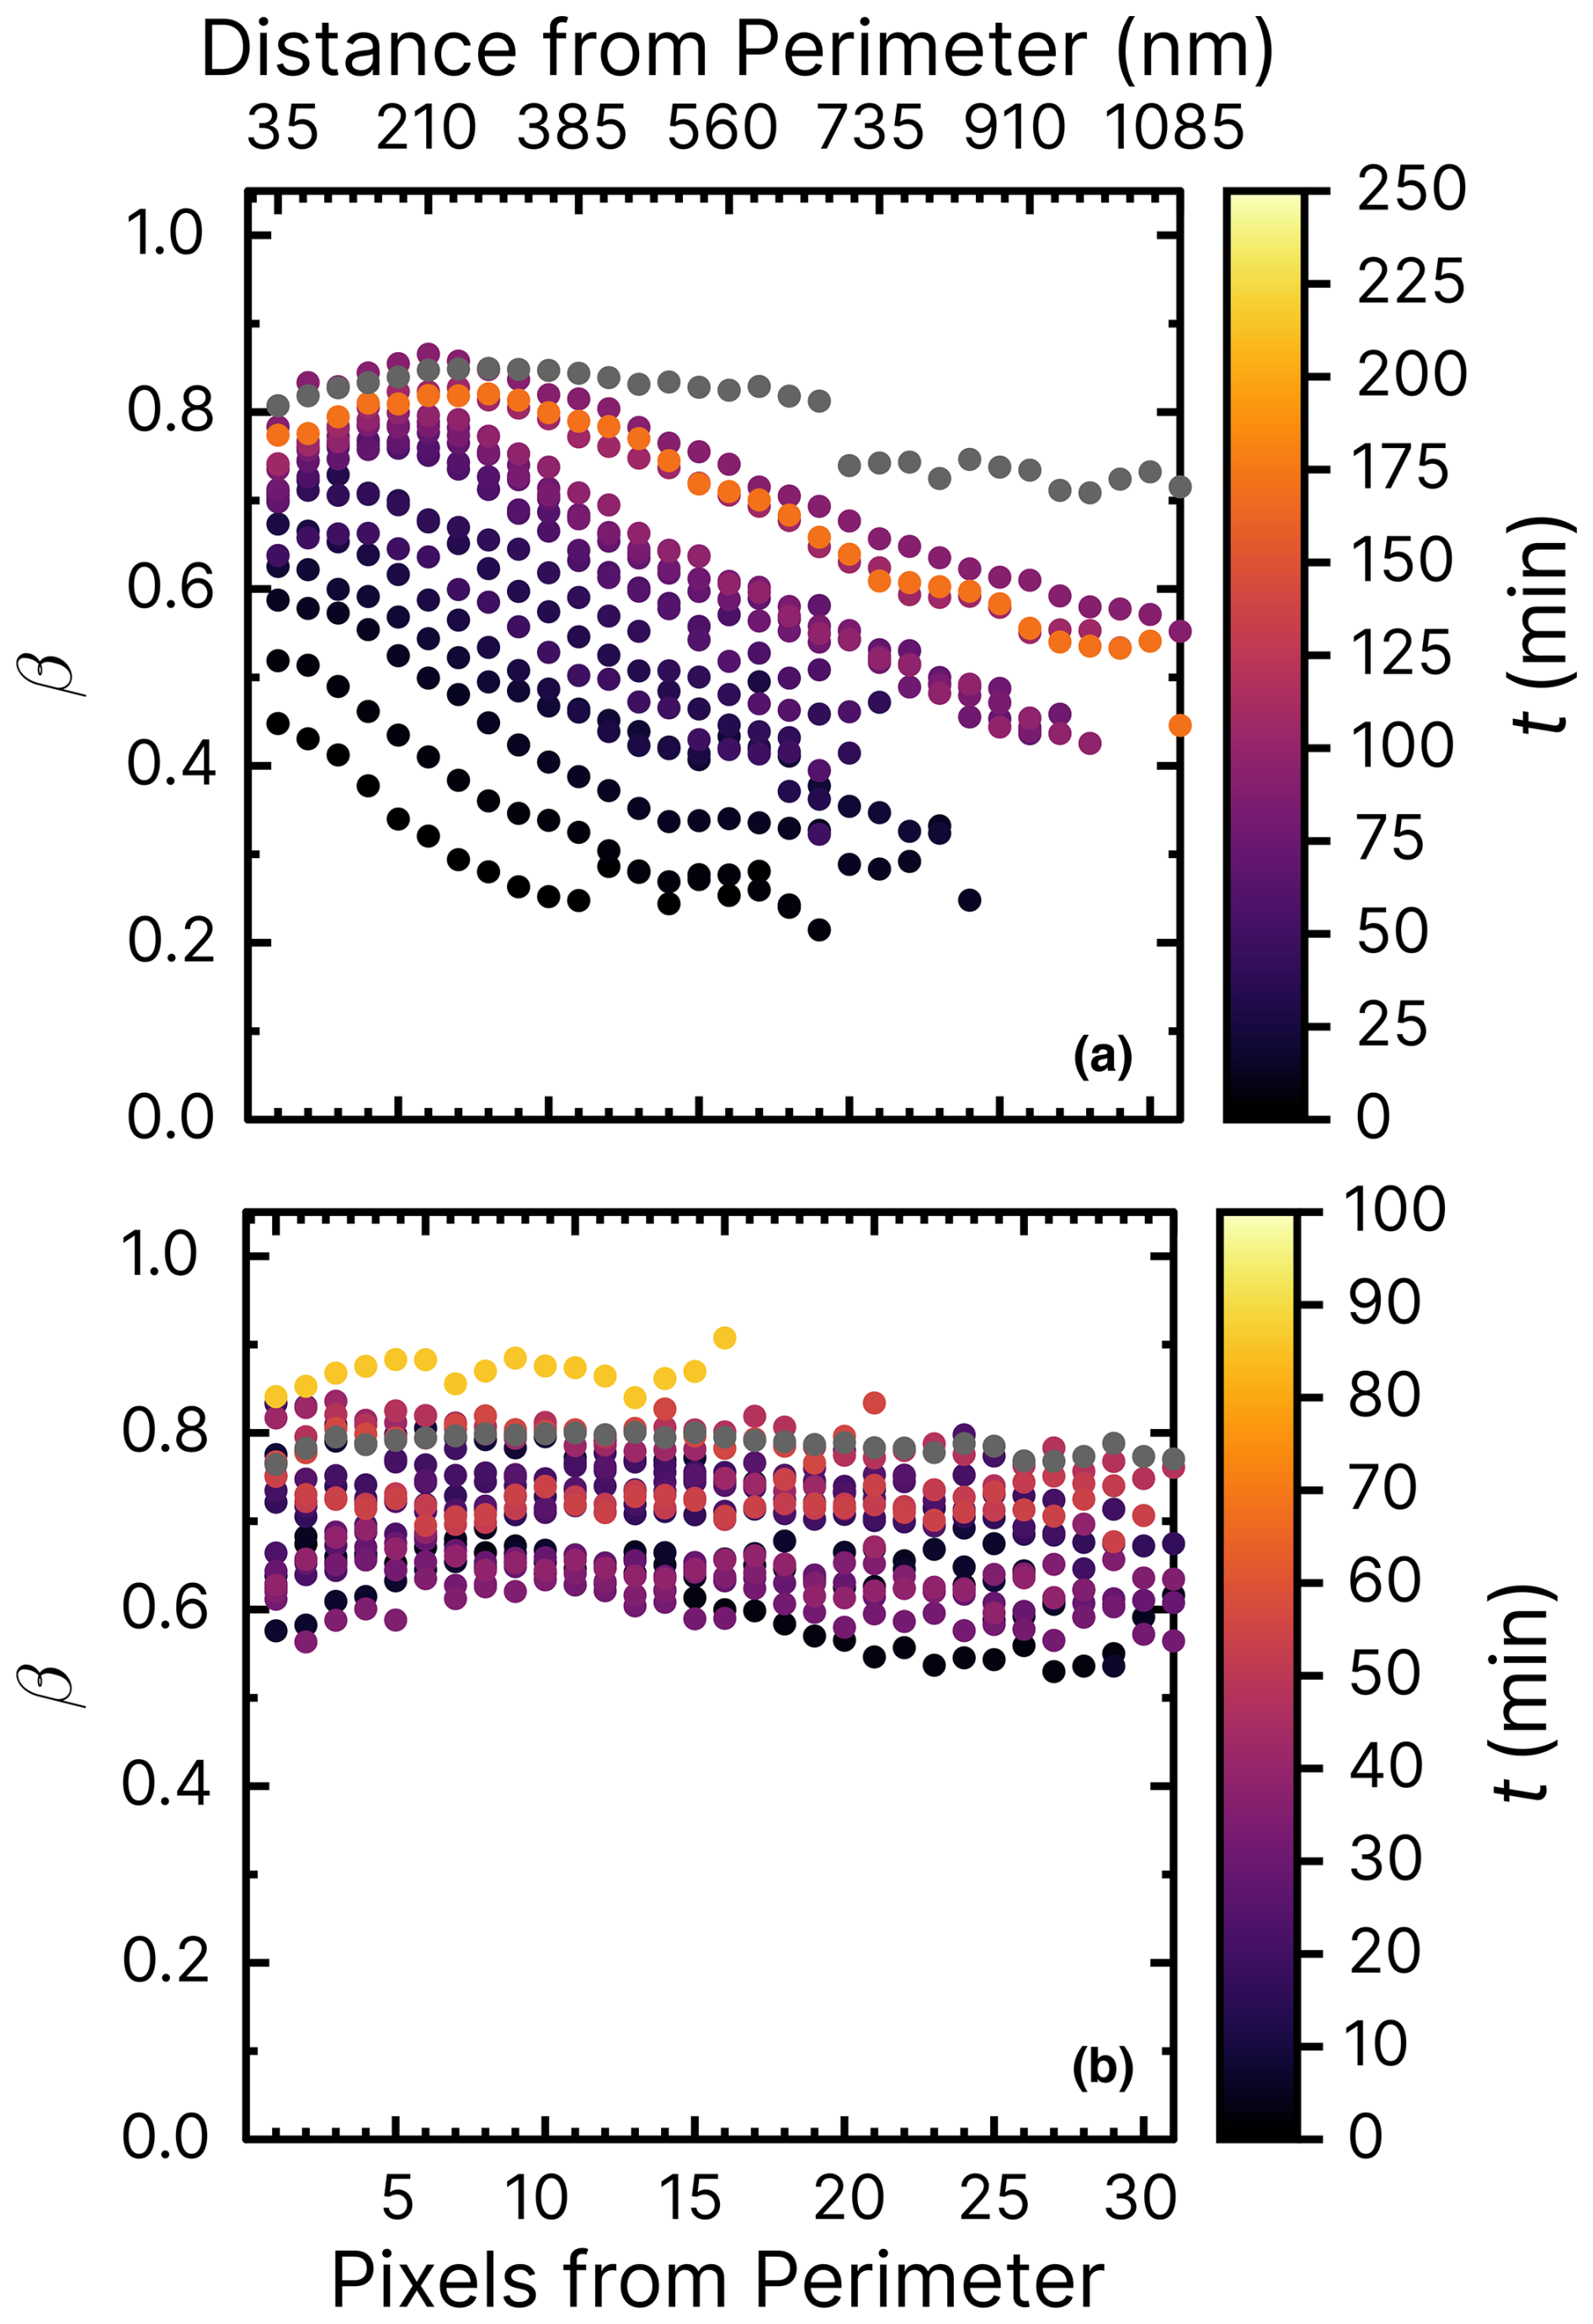
Figure D1Iron(III) fraction, β, with increasing reoxidation time, t, after irradiation for 10 min at a photolysis frequency of 10−3 s−1 and with a mole ratio of . RH = 47 % (a) and 60 % (b). Please note the different color bars for the reoxidation time, t.
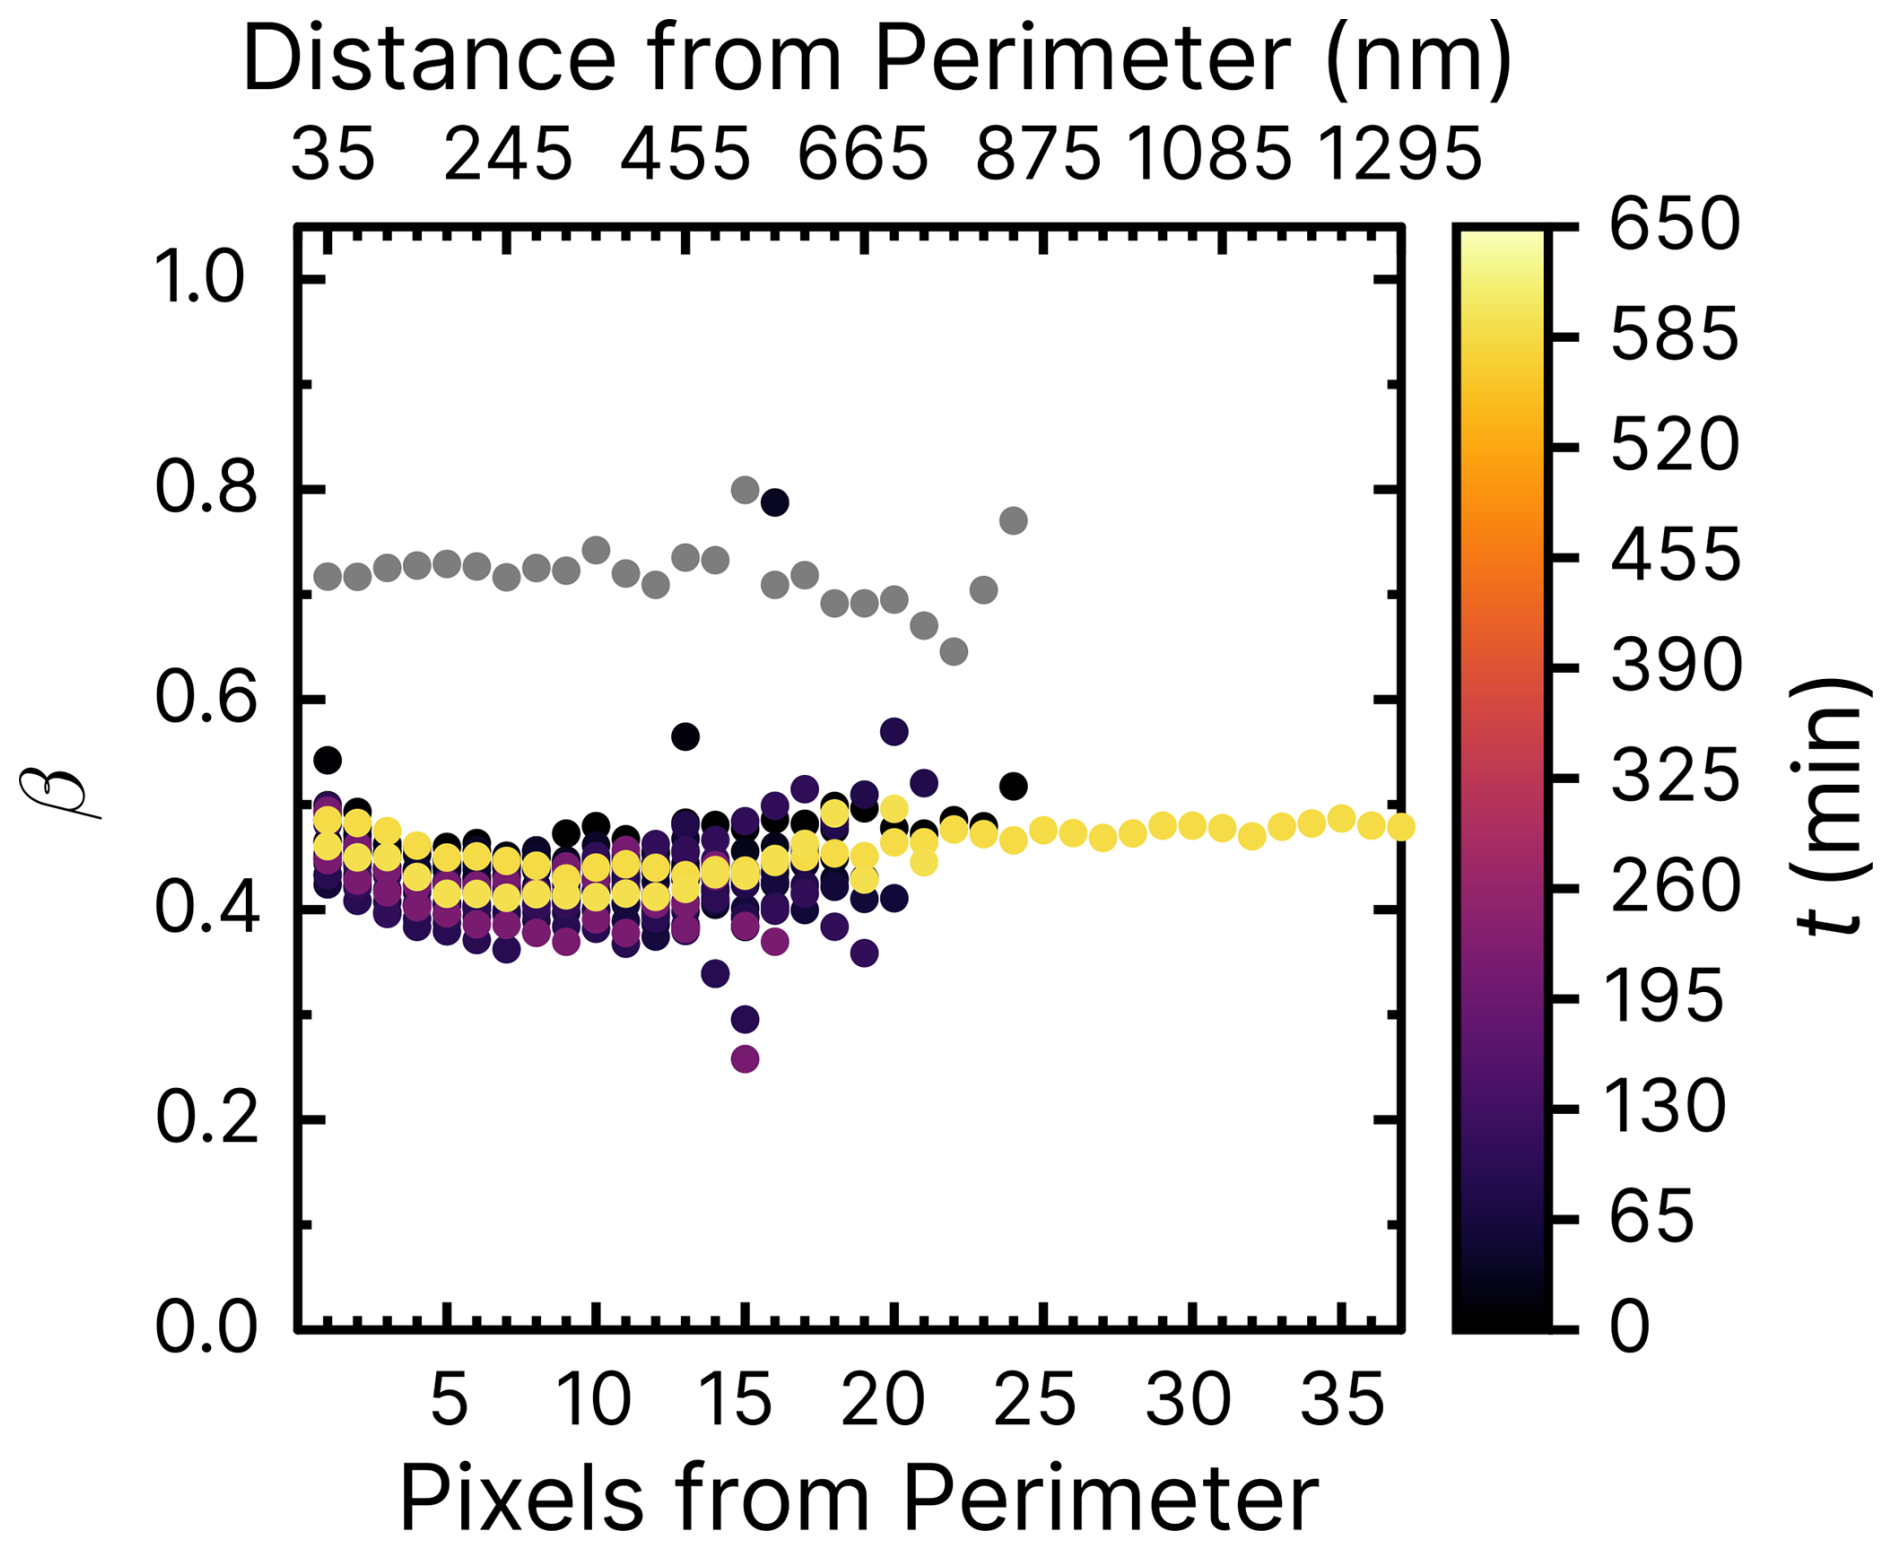
Figure D2Iron(III) fraction, β, with increasing reoxidation time, t, after irradiation for 10 min at a photolysis frequency of s−1 and RH = 20 % with a mole ratio of .
E1 Density of solution
The density of the solution is dependent on the mass fraction of iron citrate and CA in the film. We start with the density of CA as a function of its mass fraction (ρca(mfs)). This was measured by Lienhard et al. (2012) and fitted according to Eq. (E1).
Here, “mfs” corresponds to a certain RH in terms of water activity (aw) and is parameterized as follows:
An interpolation of Eq. (E2) gives us the exact mass fraction of CA, which we insert into Eq. (E1). Iron citrate is not parameterized in the literature. However, Dou et al. (2021) determined the water activity of an aqueous 1 m FeIII(cit) solution and found that this water activity corresponds to that of an 0.81 m aqueous CA solution. To correct for this, we need to assume that everything is considered CA. We use a variable ncit that represents the apparent moles of citrate with the correction factor introduced above:
The mass of the total solution, assuming that everything is citric acid, results in:
This follows in the mass of water:
leading to the total mass of the solution in the flow tube (mass of the equilibrated film):
It should be noted that these masses need to be proportionally scaled to those used to coat the flow tube. The actual mass fraction of the solute is then given by:
The density of the equilibrated solution is calculated as a weighted mean of the dry densities times the density of CA as a function of the mass fraction of solute (mfs):
whereas rfecit (rcucit) denote the ratios between the dry iron (copper) density and the dry density of CA.
E2 Concentrations
The number density (c) of CA, FeCit, CuCit, and H2O can now be calculated with the density of the solution and its mole ratio (a1, a2, ... in Eq. E12):
where:
| a1 | |
| a2 | |
| a3 | |
| a4 | |
| a5 | |
| a6 |
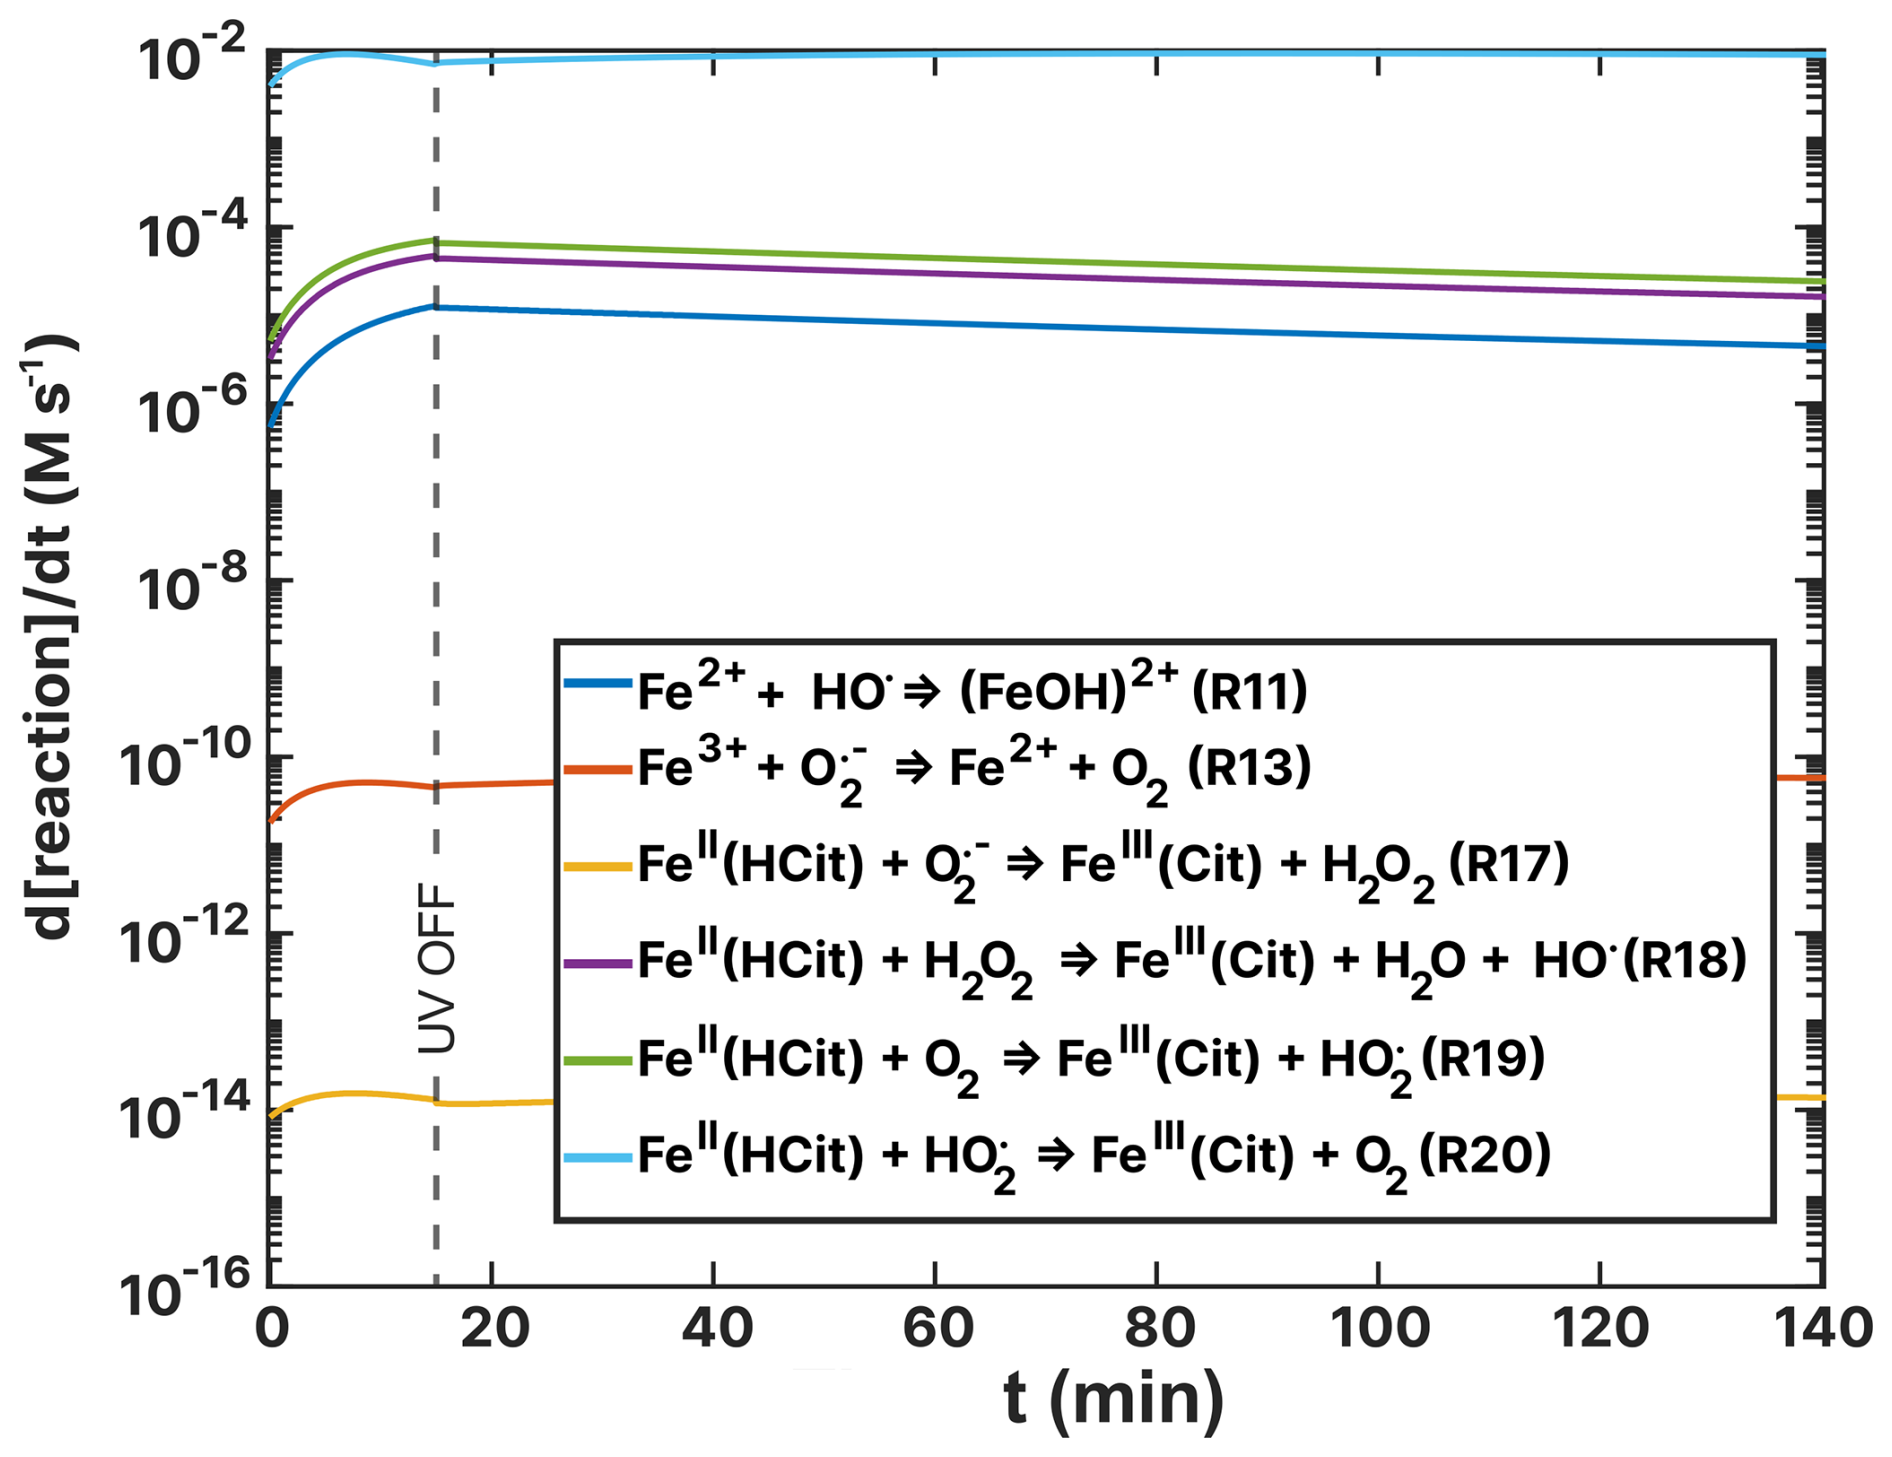
Figure F1Turnover rates (d[reaction]/dt) as a function of time, t, of FeII(HCit) and ion loss reactions of the FeIII(Cit):CA simulation of the RH =60 % experiment as listed in Table 2. UV radiation is turned off at t=15 min.
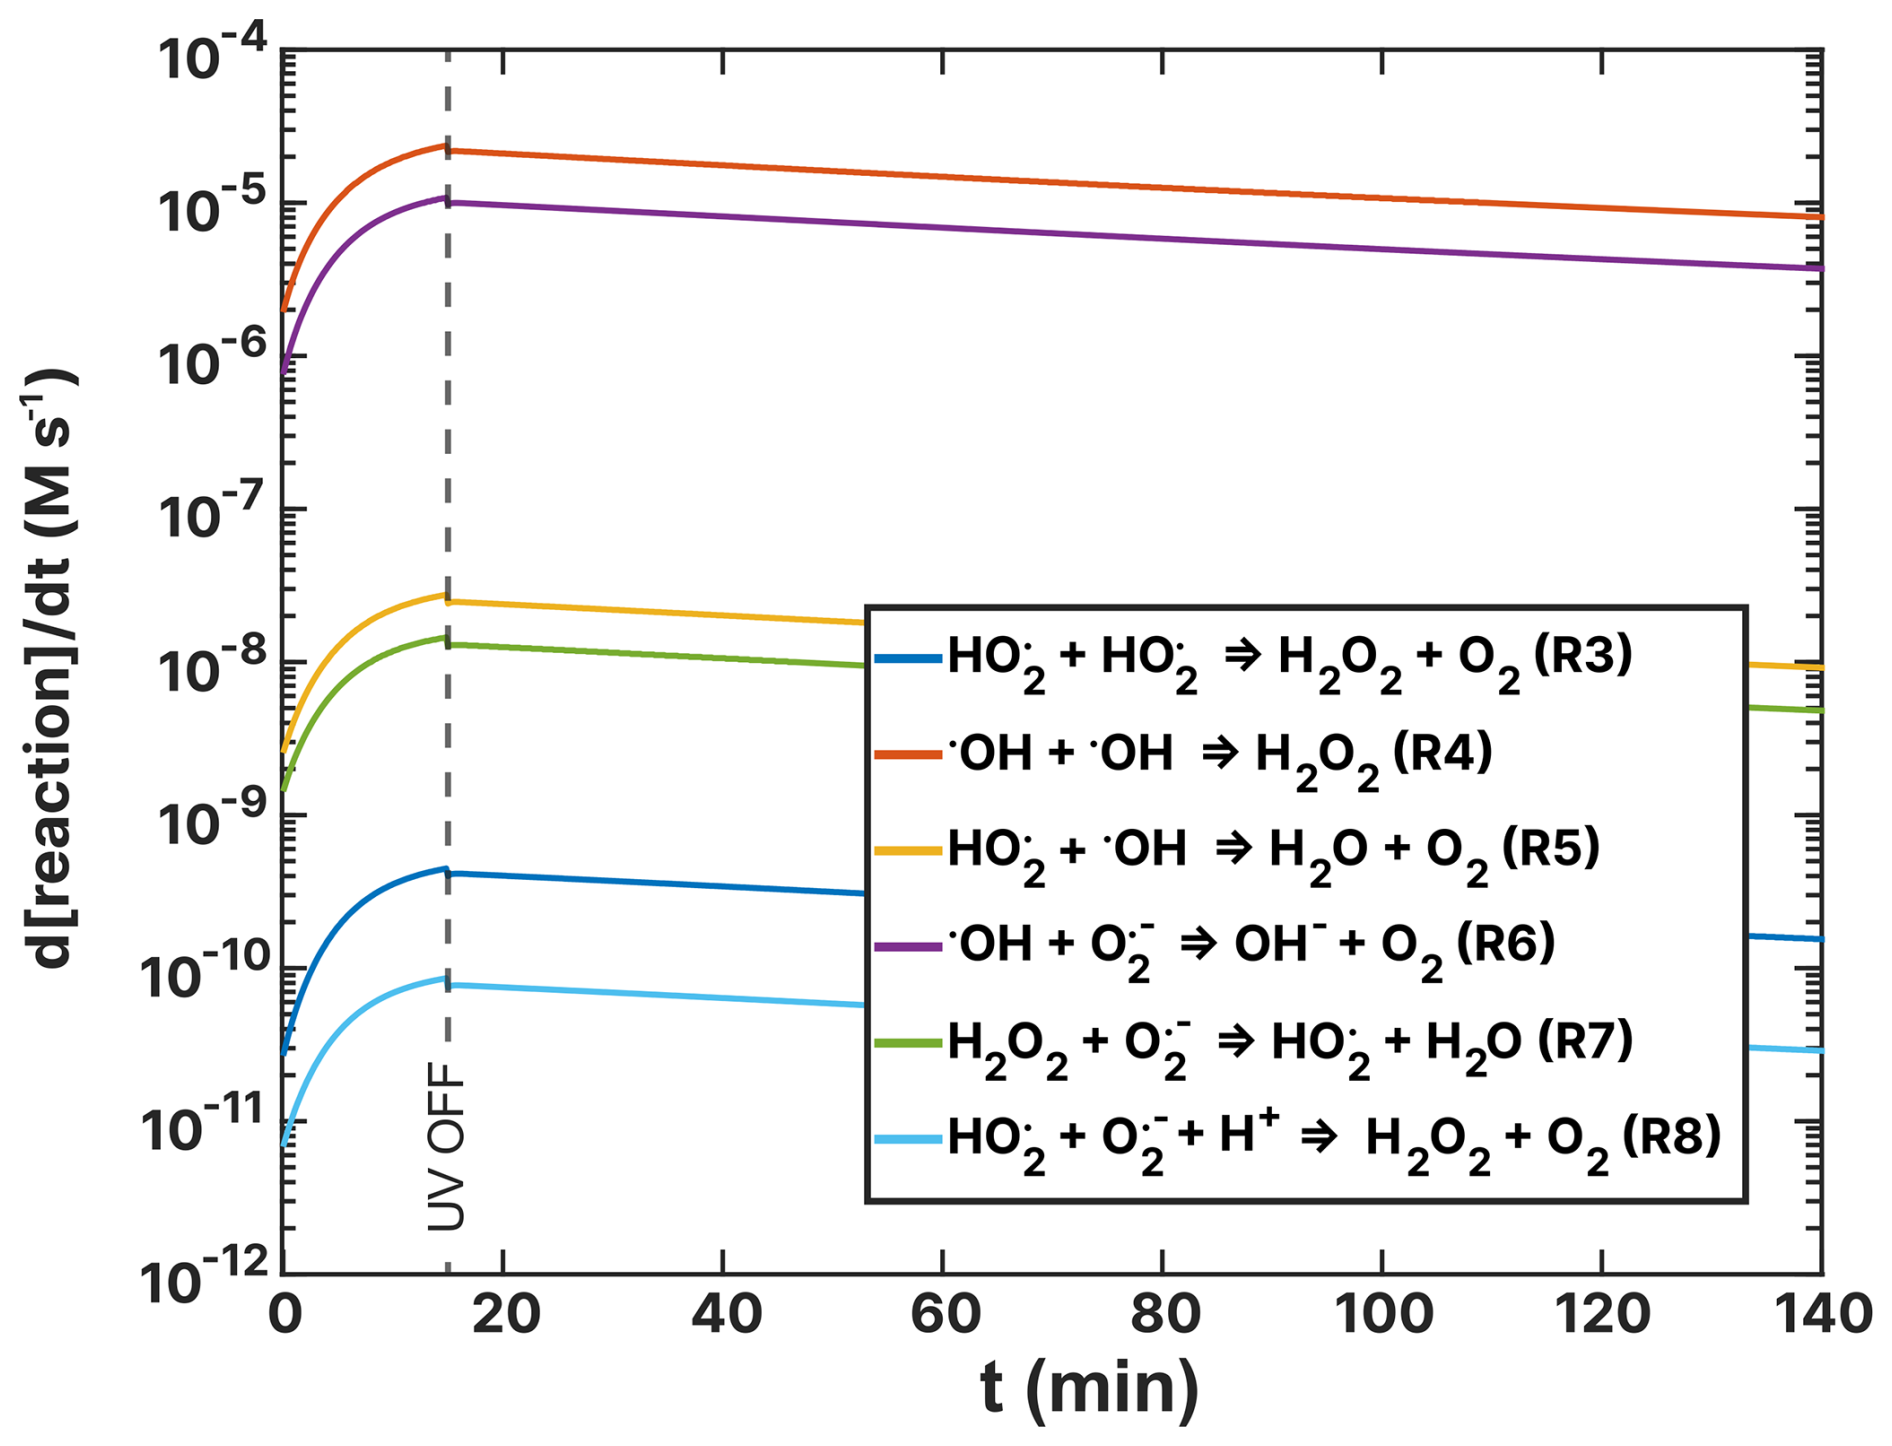
Figure F2Turnover rates (t) of the ROS reactions listed in Table 2 as a function of time, t, of the FeIII(Cit):CA experiment (a) and the experiment (b) simulations. UV radiation was turned off at t=15 min.
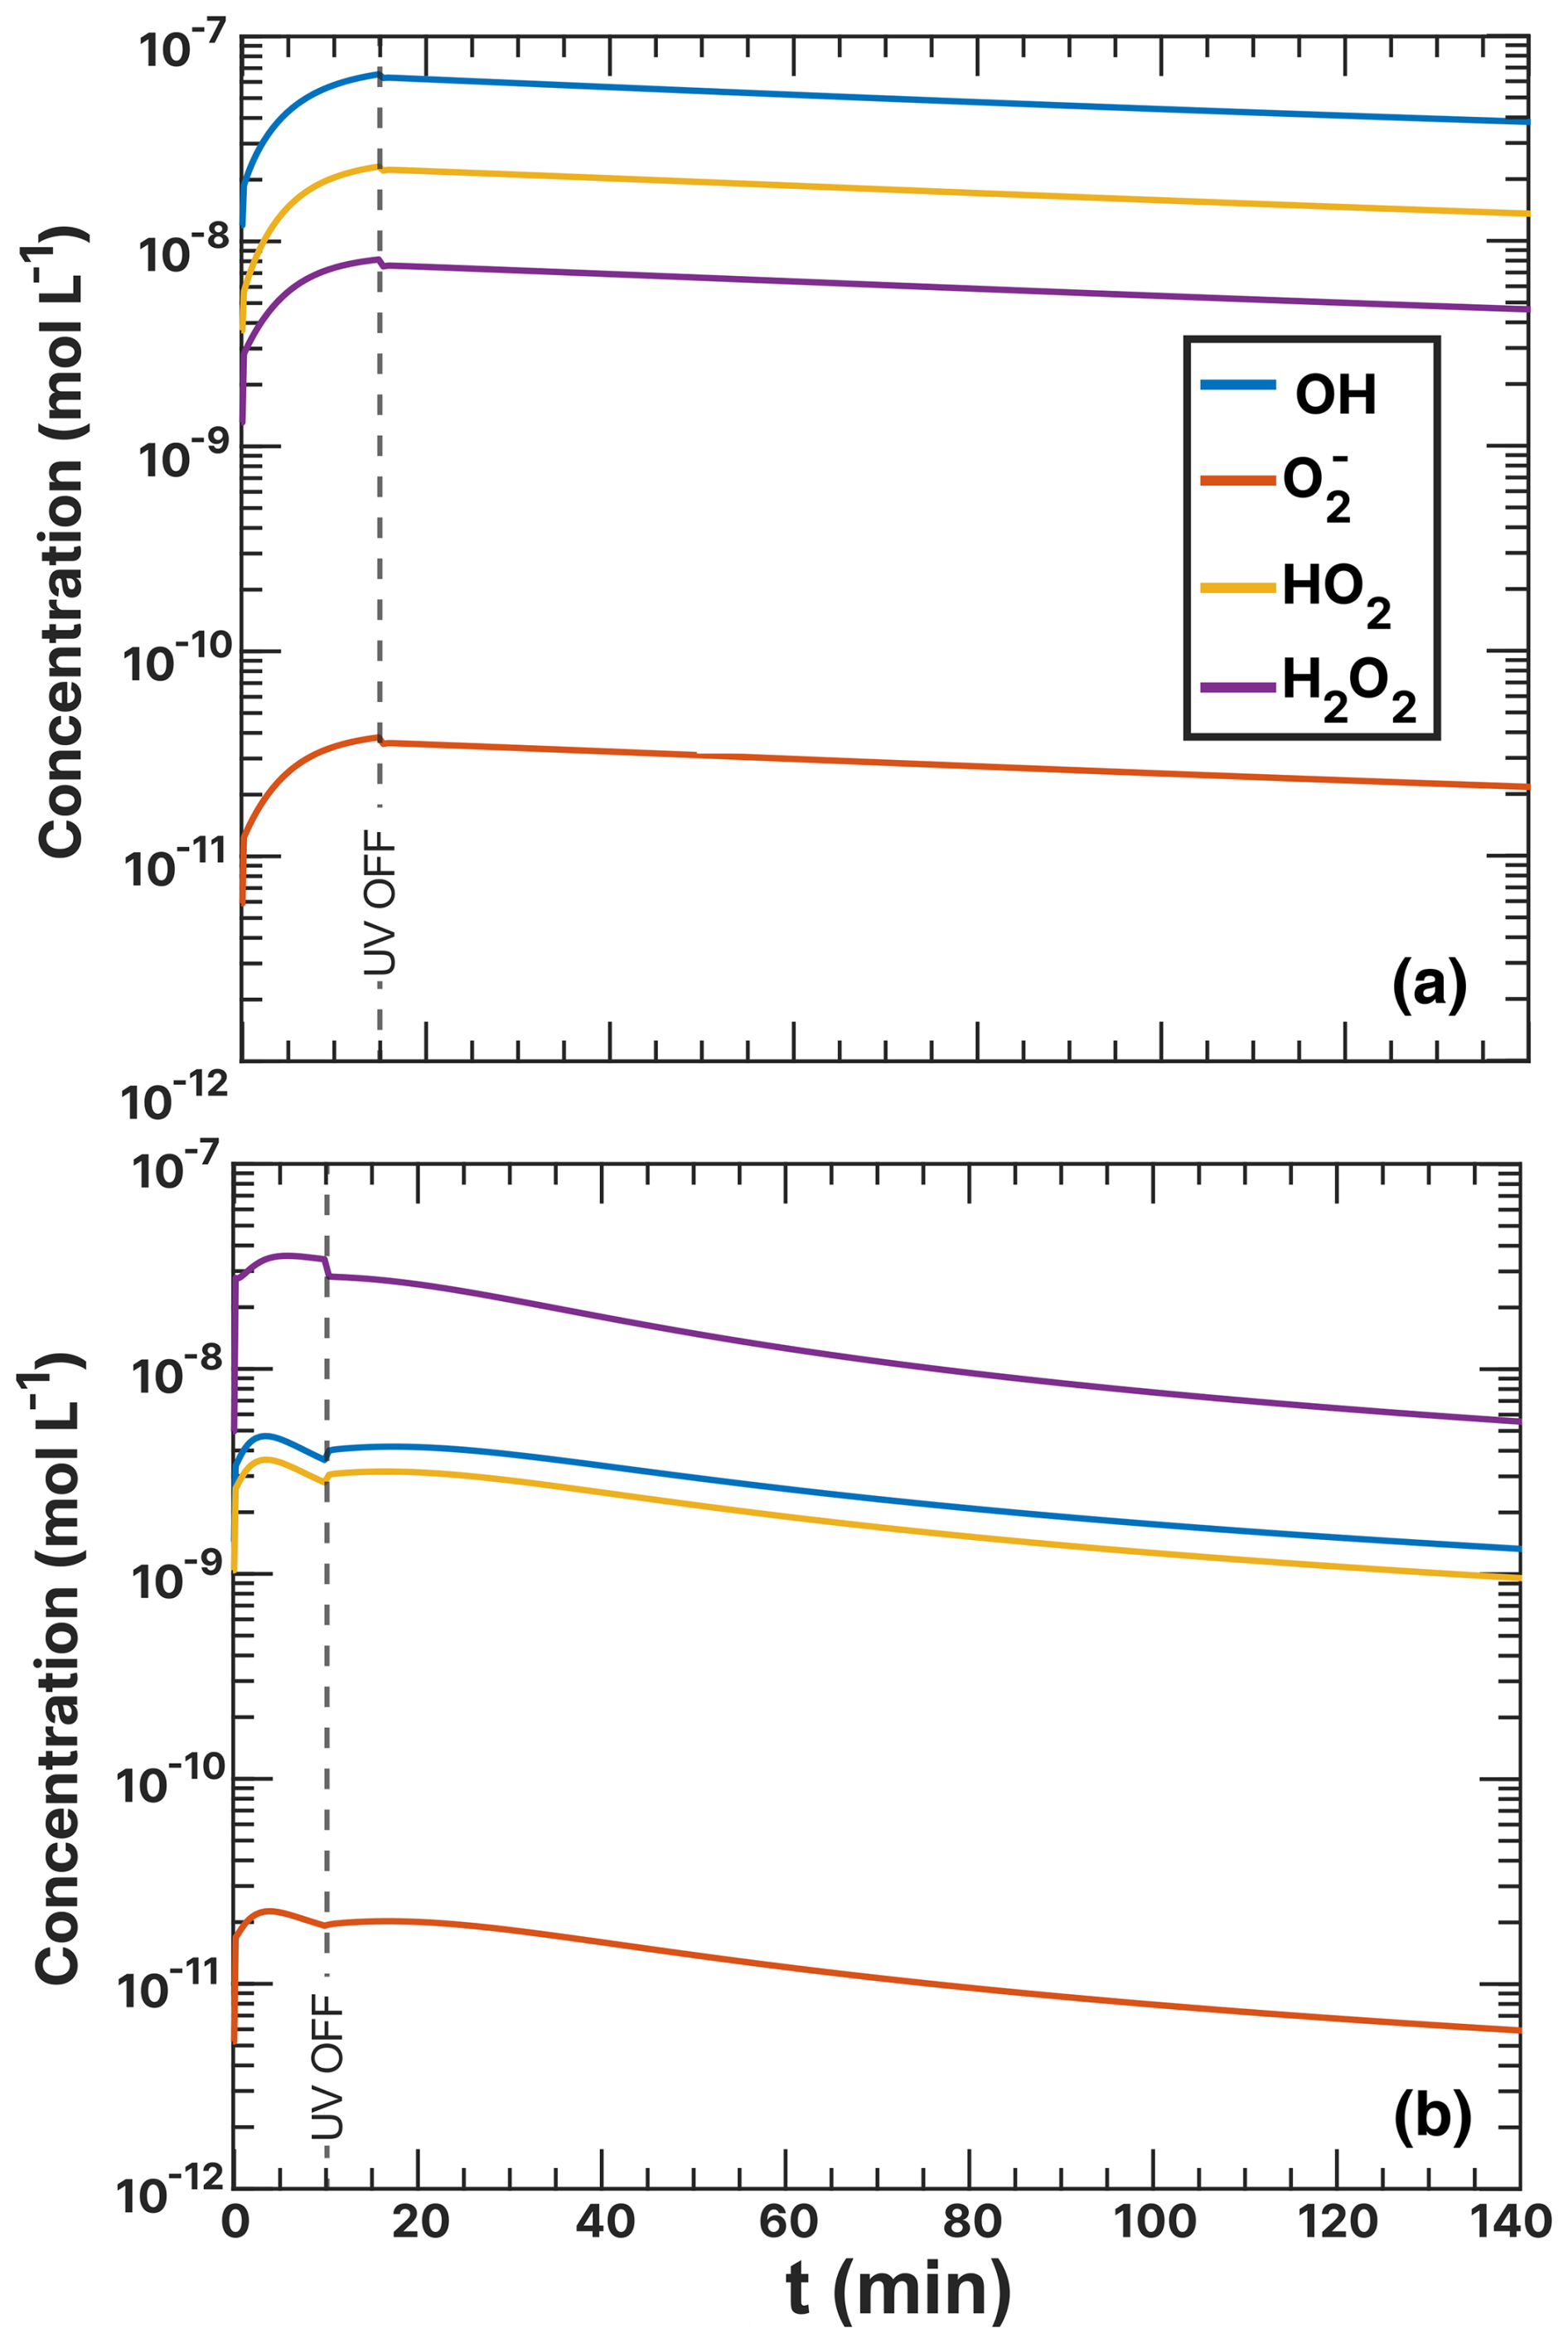
Figure F3ROS concentrations during the FeIII(Cit):CA (a) and (b) experiment simulations as a function of time. UV radiation was turned off at t=15 min (a) and 10 min (b).
Figure F4Oxygen concentrations during the FeIII(Cit):CA and the experiment simulations under RH = 60 % and as a function of time. UV radiation was turned off at t=10 and 15 min, respectively.
G1 Simulations of Cu2+-reduced reoxidation reactions of samples
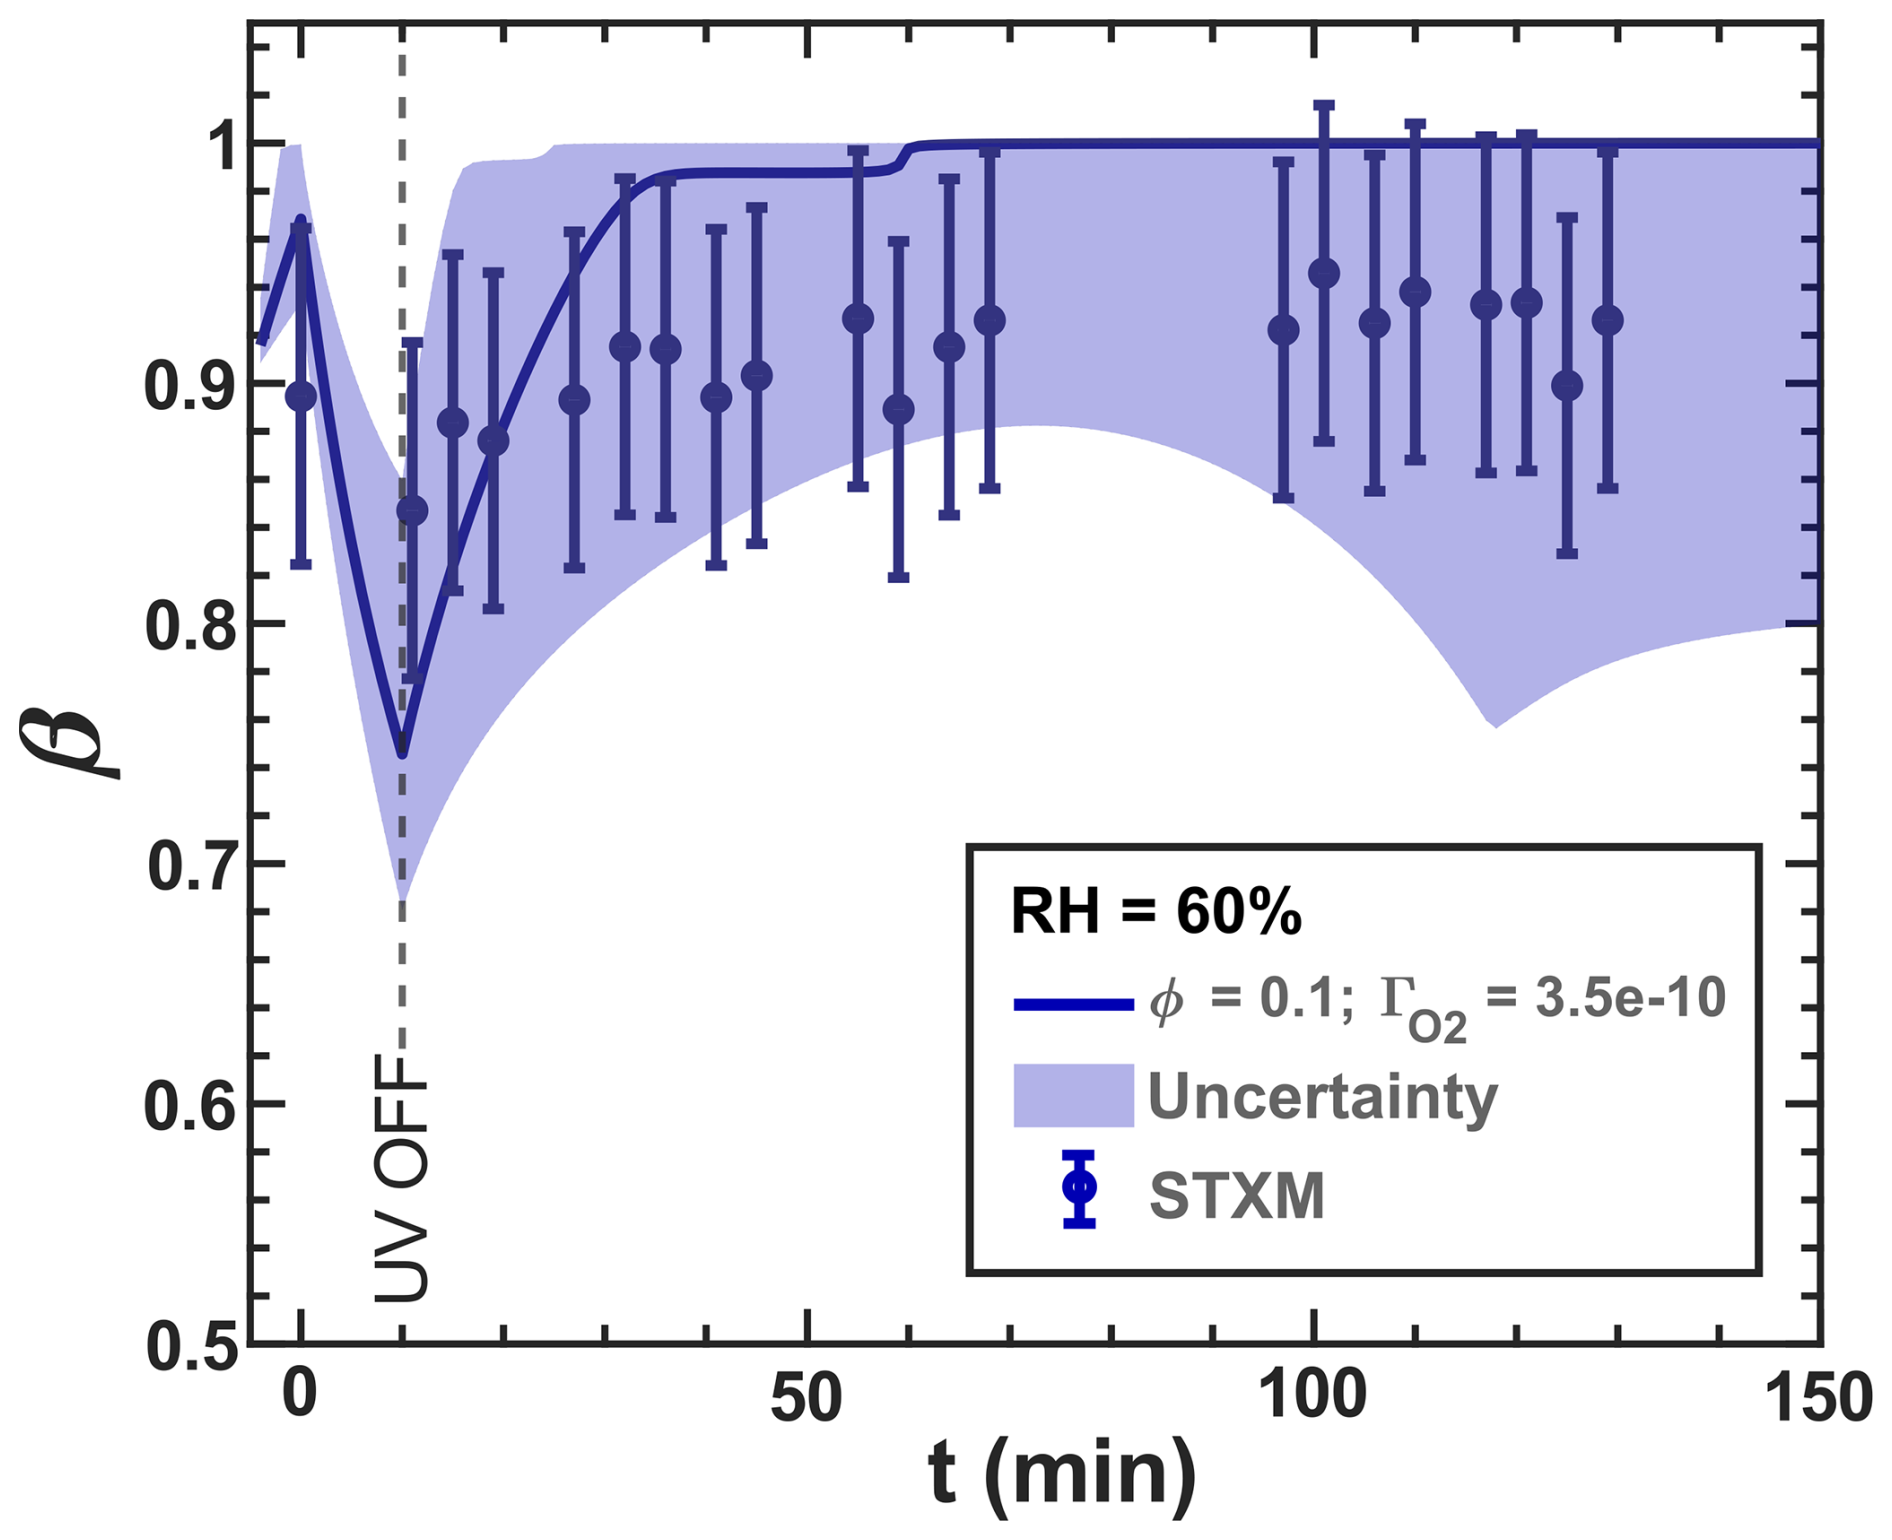
Figure G1Iron(III) fraction, β, with increasing dark reoxidation time, t, after UV radiation (t=10 min). samples. The circles with error bars represent the average of all particles mapped at one time step during the STXM experiments, and the straight lines express the Kintecus model output. The O2 uptake coefficients () were determined from the initial mechanism (see Sect. 2.5). The lower and upper boundary of the model uncertainty (blue area) originate from 10−10–1.00 × 10⁻⁹. The iron(II) quantum yield (ϕ) was adapted from the anoxic experiment shown in Fig. 11, optimized toward the new Cu2+-induced reoxidation reaction rates, and multiplied by the photolysis frequency ( 10−3 s−1). The reaction rate for R38 was 2.00 × 10⁶ and for R39 was 7.00 × 10⁸ . Uncertainty in the experimental-derived β was determined as .
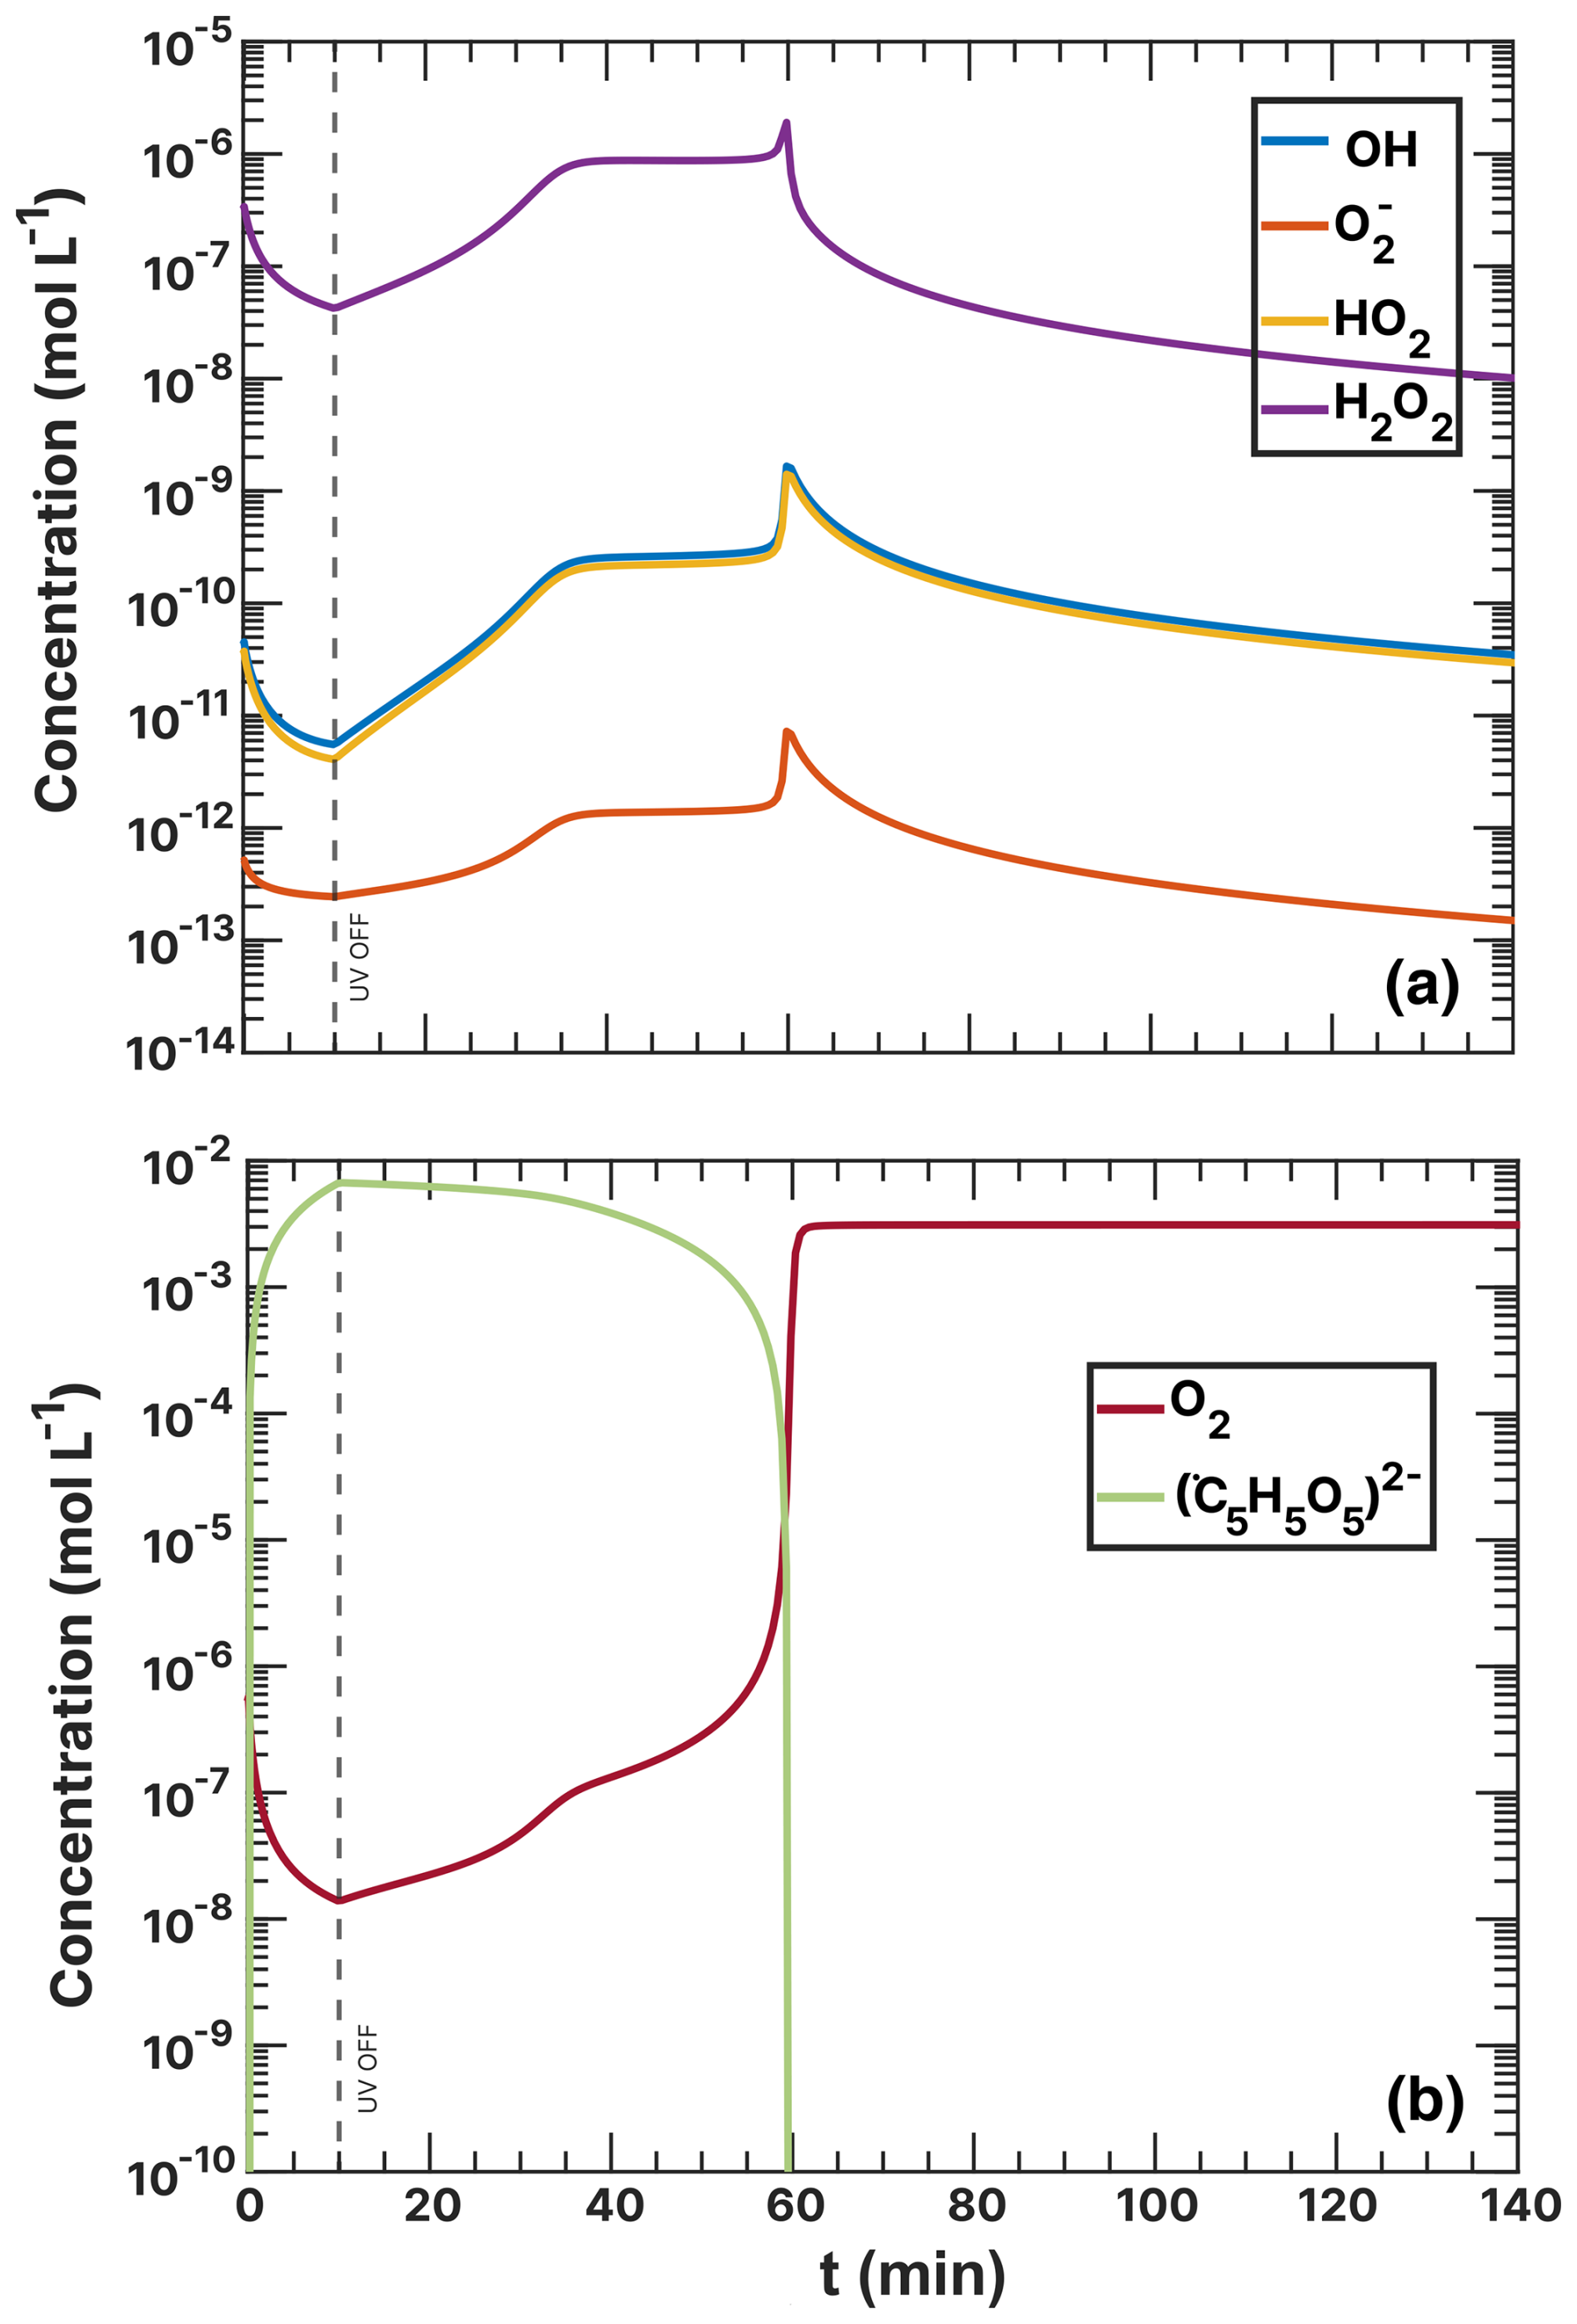
Figure G2Concentration results of the simulation including R38 and R39 from Table 5. (a) ROS concentrations. (b) Oxygen (O2) and CCFR () concentrations.
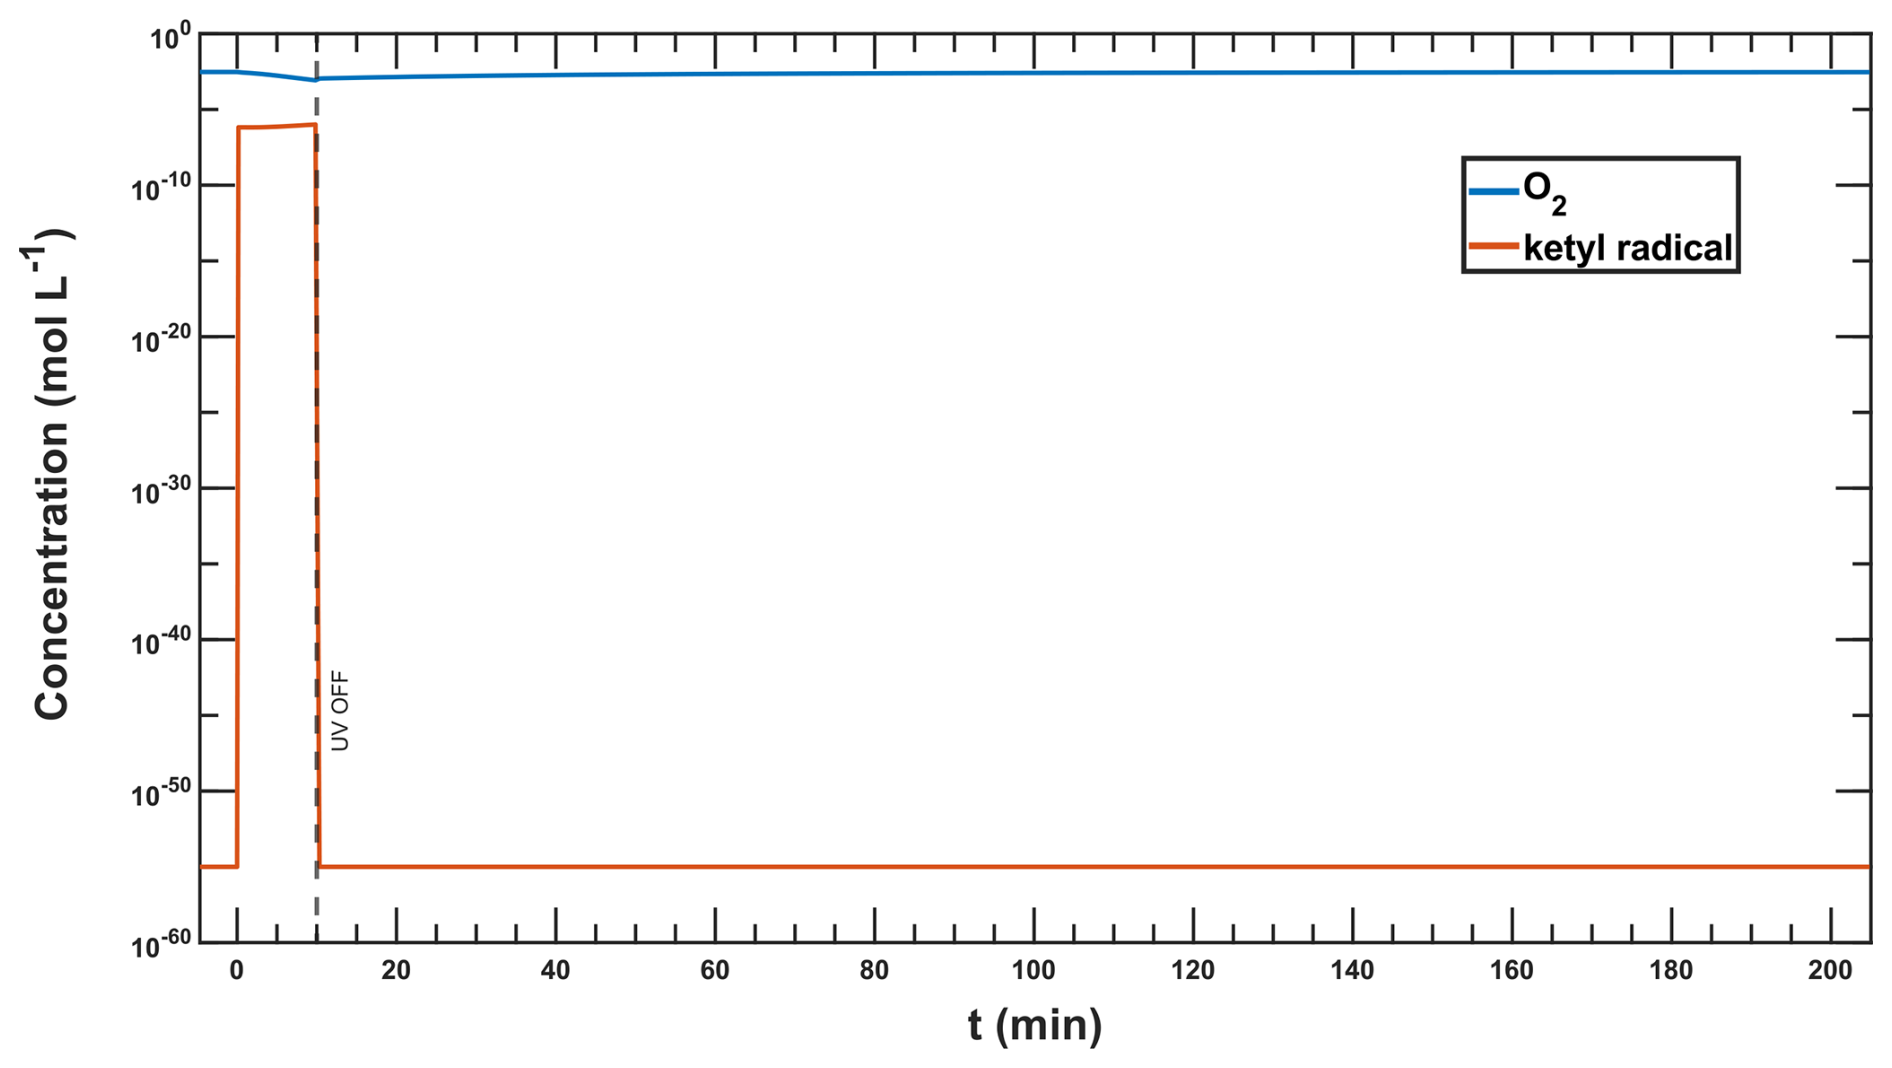
Figure G3Oxygen and ketyl radical () concentration in a = 1:0.2:1 simulation at RH =65 % used for the calculation of the diffuso-reactive length with Eqs. (G1) and (G2).
We know from Hanson et al. (1994) that the reacto-diffusive length is defined as:
whereas Dl is the liquid phase diffusion coefficient (taken from Dou et al., 2021) and kI describes the sum of the oxygen sinks corresponding to the turnover rate of reaction R2 in Table 2 (3.90 × 10⁻² ), as the other sink reaction with iron(II)Cit (R19) has a first-order reaction rate 6 orders of magnitude lower than R2 divided by the O2 concentration in steady state (Css in moles, taken from Fig. F4). In this case, it is equivalent to:
This leads to a diffuso-reactive length, lD, for oxygen of 5.26 × 10⁻⁹ m (5.3 nm). If we assume an aqueous phase dimension of the particle radii, which are about 100–500 nm, we can argue that this is much bigger than the diffuso-reactive length of oxygen and thus claim that the reoxidation system is underlying a diffusion-limited regime.
The data and codes that support the findings of this study are publicly available at https://doi.org/10.5281/zenodo.14065174 (Kilchhofer, 2024).
MA, PAA, and KK designed the research. LT, RKYC, PAP, and KK carried out the STXM/NEXAFS measurements. PAP and KK did the modeling work, with valuable input from MA. KK wrote the paper, with significant input from PAP and MA.
At least one of the (co-)authors is a member of the editorial board of Atmospheric Chemistry and Physics. The peer-review process was guided by an independent editor, and the authors also have no other competing interests to declare.
Publisher’s note: Copernicus Publications remains neutral with regard to jurisdictional claims made in the text, published maps, institutional affiliations, or any other geographical representation in this paper. While Copernicus Publications makes every effort to include appropriate place names, the final responsibility lies with the authors.
The authors thank the Swiss National Science Foundation for their financial support with grants no. 188662 and 189883. The authors thank Christian Ludwig for having facilitated this work, and Laura Torrent's salary was funded by the Swiss National Foundation (project no. 184817). In situ electron and X-ray absorption spectroscopy experiments were hosted at the PolLux Beamline at the Swiss Light Source (SLS), the support of which is highly appreciated.
This research has been supported by the Schweizerischer Nationalfonds zur Förderung der Wissenschaftlichen Forschung (grant no. 188662, 189883, and 184817).
This paper was edited by Theodora Nah and reviewed by Jingqiu Mao and one anonymous referee.
Abida, O., Kolar, M., Jirkovsky, J., and Mailhot, G.: Degradation of 4-chlorophenol in aqueous solution photoinduced by Fe(iii)-citrate complex, Photochem. Photobiol. Sci., 11, 794–802, https://doi.org/10.1039/c2pp05358f, 2012. a
Abrahamson, H. B., Rezvani, A. B., and Brushmiller, J. G.: Photochemical and spectroscopic studies of complexes, of iron(III) with citric acid and other carboxylic acids, Inorg. Chim. Acta, 226, 117–127, https://doi.org/10.1016/0020-1693(94)04077-X, 1994. a, b, c, d, e, f, g
Al-Abadleh, H. A.: Review of the bulk and surface chemistry of iron in atmospherically relevant systems containing humic-like substances, RSC Adv., 5, 45785–45811, https://doi.org/10.1039/c5ra03132j, 2015. a
Al-Abadleh, H. A.: Iron content in aerosol particles and its impact on atmospheric chemistry, Chem. Commun., 60, 1840–1855, https://doi.org/10.1039/d3cc04614a, 2024. a, b
Alpert, P. A., Arroyo, P. C., Dou, J., Krieger, U. K., Steimer, S. S., Förster, J. D., Ditas, F., Pöhlker, C., Rossignol, S., Passananti, M., Perrier, S., George, C., Shiraiwa, M., Berkemeier, T., Watts, B., and Ammann, M.: Visualizing reaction and diffusion in xanthan gum aerosol particles exposed to ozone, Phys. Chem. Chem. Phys., 21, 20613–20627, https://doi.org/10.1039/c9cp03731d, 2019. a, b, c, d
Alpert, P. A., Dou, J., Arroyo, P. C., Schneider, F., Xto, J., Luo, B., Peter, T., Huthwelker, T., Borca, C. N., Henzler, K. D., Schaefer, T., Herrmann, H., Raabe, J., Watts, B., Krieger, U. K., and Ammann, M.: Photolytic radical persistence due to anoxia in viscous aerosol particles, Nat. Commun., 12, 1–8, https://doi.org/10.1038/s41467-021-21913-x, 2021. a, b, c, d, e, f, g, h, i, j, k, l, m, n, o, p, q, r, s, t, u, v, w, x
Ammann, M., Hauert, R., and Burtscher, H.: In situ detection of monovalent copper in aerosols by photoemission, Fresenius' J. Anal. Chem., 343, 491–496, https://doi.org/10.1007/BF00322156, 1992. a, b
Ammann, M., Cox, R. A., Crowley, J. N., Jenkin, M. E., Mellouki, A., Rossi, M. J., Troe, J., and Wallington, T. J.: Evaluated kinetic and photochemical data for atmospheric chemistry: Volume VI – heterogeneous reactions with liquid substrates, Atmos. Chem. Phys., 13, 8045–8228, https://doi.org/10.5194/acp-13-8045-2013, 2013. a
Bates, J. T., Fang, T., Verma, V., Zeng, L., Weber, R. J., Tolbert, P. E., Abrams, J. Y., Sarnat, S. E., Klein, M., Mulholland, J. A., and Russell, A. G.: Review of Acellular Assays of Ambient Particulate Matter Oxidative Potential: Methods and Relationships with Composition, Sources, and Health Effects, Environ. Sci. Technol., 53, 4003–4019, https://doi.org/10.1021/acs.est.8b03430, 2019. a
Benkelberg, H. J. and Warneck, P.: Photodecomposition of iron(III) hydroxo and sulfato complexes in aqueous solution: Wavelength dependence of OH and quantum yields, J. Phys. Chem., 99, 5214–5221, https://doi.org/10.1021/j100014a049, 1995. a, b
Berdnikov, V.: Catalytic activity of the hydrated copper ion in the decomposition of hydrogen peroxide, Russ. J. Phys. Chem., 47, 1060–1162, 1973. a, b
Berkemeier, T., Huisman, A. J., Ammann, M., Shiraiwa, M., Koop, T., and Pöschl, U.: Kinetic regimes and limiting cases of gas uptake and heterogeneous reactions in atmospheric aerosols and clouds: a general classification scheme, Atmos. Chem. Phys., 13, 6663–6686, https://doi.org/10.5194/acp-13-6663-2013, 2013. a
Bielski, B. H. J., Cabelli, D. E., Arudi, R. L., and Ross, A. B.: Reactivity of HO2/O2 Radicals in Aqueous Solution, J. Phys. Chem. Ref. Data, 14, 1041–1100, https://doi.org/10.1063/1.555739, 1985. a, b, c
Bjergbakke, E., Sehested, K., and Rasmussen, O. L.: The Reaction Mechanism and Rate Constants in the Radiolysis of Fe Cu Solutions, Radiation Res., 66, 433–442, https://doi.org/10.2307/3574449, 1976. a, b
Brandt, C. and van Eldik, R.: Transition Metal-Catalyzed Oxidation of Sulfur(IV) Oxides. Atmospheric-Relevant Processes and Mechanisms, Chem. Rev., 95, 119–190, https://doi.org/10.1021/cr00033a006, 1995. a
Charrier, J. G. and Anastasio, C.: Rates of Hydroxyl Radical Production from Transition Metals and Quinones in a Surrogate Lung Fluid, Environ. Sci. Technol., 49, 9317–9325, https://doi.org/10.1021/acs.est.5b01606, 2015. a
Charrier, J. G., McFall, A. S., Richards-Henderson, N. K., and Anastasio, C.: Hydrogen peroxide formation in a surrogate lung fluid by transition metals and quinones present in particulate matter, Environ. Sci. Technol., 48, 7010–7017, https://doi.org/10.1021/es501011w, 2014. a
Chifflet, S., Guyomarc'h, L., Dominutti, P., Heimbürger-Boavida, L. E., Angeletti, B., Louvat, P., Jaffrezo, J. L., Vu, C. T., Uzu, G., and Mari, X.: Seasonal variations of metals and metalloids in atmospheric particulate matter (PM2.5) in the urban megacity Hanoi, Atmos. Pollut. Res., 15, 101961–101974, https://doi.org/10.1016/j.apr.2023.101961, 2024. a
Christensen, H. and Sehested, K.: Pulse radiolysis at high temperatures and high pressures, Rad. Phys. Chem. (1977), 18, 723–731, https://doi.org/10.1016/0146-5724(81)90195-3, 1981. a
Christensen, H., Sehested, K., and Corfitzen, H.: Reactions of hydroxyl radicals with hydrogen peroxide at ambient and elevated temperatures, J. Phys. Chem., 86, 1588–1590, https://doi.org/10.1021/j100206a023, 1982. a
Cieśla, P., Kocot, P., Mytych, P., and Stasicka, Z.: Homogeneous photocatalysis by transition metal complexes in the environment, J. Molecul. Cat. A, 224, 17–33, https://doi.org/10.1016/j.molcata.2004.08.043, 2004. a
Corral Arroyo, P., Bartels-Rausch, T., Alpert, P. A., Dumas, S., Perrier, S., George, C., and Ammann, M.: Particle-Phase Photosensitized Radical Production and Aerosol Aging, Environ. Sci. Technol., 52, 7680–7688, https://doi.org/10.1021/acs.est.8b00329, 2018a. a
Corral Arroyo, P., Malecha, K. T., Ammann, M., and Nizkorodov, S. A.: Influence of humidity and iron(iii) on photodegradation of atmospheric secondary organic aerosol particles, Phys. Chem. Chem. Phys., 20, 30021–30031, https://doi.org/10.1039/c8cp03981j, 2018b. a
Corral Arroyo, P., David, G., Alpert, P. A., Parmentier, E. A., Ammann, M., and Signorell, R.: Amplification of light within aerosol particles accelerates in-particle photochemistry, Science, 376, 293–296, https://doi.org/10.1126/science.abm7915, 2022. a
Daellenbach, K. R., Uzu, G., Jiang, J., Cassagnes, L. E., Leni, Z., Vlachou, A., Stefenelli, G., Canonaco, F., Weber, S., Segers, A., Kuenen, J. J., Schaap, M., Favez, O., Albinet, A., Aksoyoglu, S., Dommen, J., Baltensperger, U., Geiser, M., El Haddad, I., Jaffrezo, J. L., and Prévôt, A. S.: Sources of particulate-matter air pollution and its oxidative potential in Europe, Nature, 587, 414–419, https://doi.org/10.1038/s41586-020-2902-8, 2020. a
De Laat, J. and Le, T. G.: Kinetics and modeling of the Fe(III)/H2O2 system in the presence of sulfate in acidic aqueous solutions, Environ. Sci. Technol., 39, 1811–1818, https://doi.org/10.1021/es0493648, 2005. a
Deguillaume, L., Leriche, M., Desboeufs, K., Mailhot, G., George, C., and Chaumerliac, N.: Transition metals in atmospheric liquid phases: Sources, reactivity, and sensitive parameters, Chem. Rev., 105, 3388–3431, https://doi.org/10.1021/cr040649c, 2005. a
Dellinger, B., Pryor, W. A., Cueto, R., Squadrito, G. L., Hegde, V., and Deutsch, W. A.: Role of free radicals in the toxicity of airborne fine particulate matter, Chem. Res. Toxic., 14, 1371–1377, https://doi.org/10.1021/tx010050x, 2001. a
D'Huysser, A., Lerebours-Hannoyer, B., Lenglet, M., and Bonnelle, J. P.: La spectroscopie de photoélectrons induits par rayons X et la répartition des ions cuivre Cu+ et Cu2+ dans les ferrites de cuivre, J. Solid State Chem., 39, 246–256, https://doi.org/10.1016/0022-4596(81)90338-8, 1981. a
Dou, J., Alpert, P. A., Corral Arroyo, P., Luo, B., Schneider, F., Xto, J., Huthwelker, T., Borca, C. N., Henzler, K. D., Raabe, J., Watts, B., Herrmann, H., Peter, T., Ammann, M., and Krieger, U. K.: Photochemical degradation of iron(III) citrate/citric acid aerosol quantified with the combination of three complementary experimental techniques and a kinetic process model, Atmos. Chem. Phys., 21, 315–338, https://doi.org/10.5194/acp-21-315-2021, 2021. a, b, c, d, e, f, g, h, i, j, k, l, m, n, o, p, q, r, s, t, u, v, w, x, y, z
Emde, C., Buras-Schnell, R., Kylling, A., Mayer, B., Gasteiger, J., Hamann, U., Kylling, J., Richter, B., Pause, C., Dowling, T., and Bugliaro, L.: The libRadtran software package for radiative transfer calculations (version 2.0.1), Geosci. Model Dev., 9, 1647–1672, https://doi.org/10.5194/gmd-9-1647-2016, 2016. a, b
Ervens, B., George, C., Williams, J. E., Buxton, G. V., Salmon, G. A., Bydder, M., Wilkinson, F., Dentener, F., Mirabel, P., Wolke, R., and Herrmann, H.: CAPRAM 2.4 (MODAC mechanism): An extended and condensed tropospheric aqueous phase mechanism and its application, J. Geophys. Res.-Atmos., 108, 4426–4447, https://doi.org/10.1029/2002jd002202, 2003. a
Faust, C. and Zepp, R. G.: Photochemistry of Aqueous Iron(III) -Polycarboxylate Complexes: Roles in the Chemistry of Atmospheric and Surface Waters, Environ. Sci. Technol., 27, 2517–2522, https://doi.org/10.1021/es00048a032, 1993. a, b
Fenton, H. J.: Oxidation of tartaric acid in presence of iron, J. Chem. Soc. Trans., 65, 899–910, https://doi.org/10.1039/CT8946500899, 1894. a
George, C., Ammann, M., D'Anna, B., Donaldson, D. J., and Nizkorodov, S. A.: Heterogeneous Photochemistry in the Atmosphere, Chem. Rev., 115, 4218–4258, https://doi.org/10.1021/cr500648z, 2015. a, b
Glebov, E. M., Pozdnyakov, I. P., Grivin, V. P., Plyusnin, V. F., Zhang, X., Wu, F., and Deng, N.: Intermediates in photochemistry of Fe(iii) complexes with carboxylic acids in aqueous solutions, Photoch. Photobio. Sci., 10, 425–430, https://doi.org/10.1039/c0pp00151a, 2011. a, b, c, d, e
Goh, S. W., Buckley, A. N., Lamb, R. N., Rosenberg, R. A., and Moran, D.: The oxidation states of copper and iron in mineral sulfides, and the oxides formed on initial exposure of chalcopyrite and bornite to air, Geochim. Cosmochim. Acta, 70, 2210–2228, https://doi.org/10.1016/j.gca.2006.02.007, 2006. a, b
Goldstein, S., Czapski, G., Cohen, H., and Meyerstein, D.: Deamination of β-alanine induced by hydroxyl radicals and monovalent copper ions. A pulse radiolysis study, Inorg. Chim. Acta, 192, 87–93, https://doi.org/10.1016/S0020-1693(00)83177-1, 1992. a
Gonzalez, D. H., Cala, C. K., Peng, Q., and Paulson, S. E.: HULIS Enhancement of Hydroxyl Radical Formation from Fe(II): Kinetics of Fulvic Acid-Fe(II) Complexes in the Presence of Lung Antioxidants, Environ. Sci. Technol., 51, 7676–7685, https://doi.org/10.1021/acs.est.7b01299, 2017. a, b, c, d
Gracheva, M., Homonnay, Z., Singh, A., Fodor, F., Marosi, V. B., Solti, A., and Kovacs, K.: New aspects of the photodegradation of iron(III) citrate: spectroscopic studies and plant-related factors, Photoch. Photobio. Sci., 21, 983–996, https://doi.org/10.1007/s43630-022-00188-1, 2022. a
Hallquist, M., Wenger, J. C., Baltensperger, U., Rudich, Y., Simpson, D., Claeys, M., Dommen, J., Donahue, N. M., George, C., Goldstein, A. H., Hamilton, J. F., Herrmann, H., Hoffmann, T., Iinuma, Y., Jang, M., Jenkin, M. E., Jimenez, J. L., Kiendler-Scharr, A., Maenhaut, W., McFiggans, G., Mentel, Th. F., Monod, A., Prévôt, A. S. H., Seinfeld, J. H., Surratt, J. D., Szmigielski, R., and Wildt, J.: The formation, properties and impact of secondary organic aerosol: current and emerging issues, Atmos. Chem. Phys., 9, 5155–5236, https://doi.org/10.5194/acp-9-5155-2009, 2009. a
Hanson, D. R., Ravishankara, A. R., and Solomon, S.: Heterogeneous reactions in sulfuric acid aerosols: a framework for model calculations, J. Geophys. Res., 99, 3615–3629, https://doi.org/10.1029/93JD02932, 1994. a
Hemmes, P., Rich, L. D., Cole, D. L., and Eyring, E. M.: Kinetics of hydrolysis of ferric ion in dilute aqueous solution, Anal. Chem., 75, 929–932, https://doi.org/10.1021/ac60297a755, 1971. a
Hong, S., Candelone, J. P., Soutif, M., and Boutron, C. F.: A reconstruction of changes in copper production and copper emissions to the atmosphere during the past 7000 years, Sci. Total Environ., 188, 183–193, https://doi.org/10.1016/0048-9697(96)05171-6, 1996. a
Huang, R. J., Zhang, Y., Bozzetti, C., Ho, K. F., Cao, J. J., Han, Y., Daellenbach, K. R., Slowik, J. G., Platt, S. M., Canonaco, F., Zotter, P., Wolf, R., Pieber, S. M., Bruns, E. A., Crippa, M., Ciarelli, G., Piazzalunga, A., Schwikowski, M., Abbaszade, G., Schnelle-Kreis, J., Zimmermann, R., An, Z., Szidat, S., Baltensperger, U., El Haddad, I., and Prévôt, A. S.: High secondary aerosol contribution to particulate pollution during haze events in China, Nature, 514, 218–222, https://doi.org/10.1038/nature13774, 2015. a
Hug, S. J., Canonica, L., Wegelin, M., Gechter, D., and von Gunten, U.: Solar Oxidation and Removal of Arsenic at Circumneutral pH in Iron Containing Waters, Environ. Sci. Technol., 35, 2114–2121, https://doi.org/10.1021/es001551s, 2001. a
Huthwelker, T., Zelenay, V., Birrer, M., Krepelova, A., Raabe, J., Tzvetkov, G., Vernooij, M. G., and Ammann, M.: An in situ cell to study phase transitions in individual aerosol particles on a substrate using scanning transmission x-ray microspectroscopy, Rev. Sci. Instrum., 81, 113706, https://doi.org/10.1063/1.3494604, 2010. a, b
Ianni, J. C.: Kintecus, http://www.kintecus.com/ (last access: 9 April 2025), 2017. a
Ito, A. and Miyakawa, T.: Aerosol Iron from Metal Production as a Secondary Source of Bioaccessible Iron, Environ. Sci. Technol., 57, 4091–4100, https://doi.org/10.1021/acs.est.2c06472, 2023. a
IUPAC Task Group on Atmospheric Chemical Kinetic Data Evaluation: Evaluated kinetic data, IUPAC, https://iupac-aeris.ipsl.fr/datasheets/pdf/HET_O_12.pdf (last access: 20 April 2025), 2017. a
Jayson, G. G., Parsons, B. J., and Swallow, A. J.: Oxidation of ferrous ions by hydroxyl radicals, J. Chem. Soc. Farad. T. 1, 68, 2053–2058, https://doi.org/10.1039/F19726802053, 1973. a
Kieber, R. J., Williams, K., Willey, J. D., Skrabal, S., and Avery, G. B.: Iron speciation in coastal rainwater: concentration and deposition to seawater, Mar. Chem., 73, 83–95, https://doi.org/10.1016/S0304-4203(00)00097-9, 2001. a
Kilchhofer, K.: Data availibility for the paper “Copper accelerates photochemically induced radical chemistry of iron-containing SOA”, Zenodo [data set], https://doi.org/10.5281/zenodo.14065174, 2024. a
Koop, T., Bookhold, J., Shiraiwa, M., and Pöschl, U.: Glass transition and phase state of organic compounds: Dependency on molecular properties and implications for secondary organic aerosols in the atmosphere, Phys. Chem. Chem. Phys., 13, 19238–19255, https://doi.org/10.1039/c1cp22617g, 2011. a
Kroll, J. H. and Seinfeld, J. H.: Chemistry of secondary organic aerosol: Formation and evolution of low-volatility organics in the atmosphere, Atmos. Environ., 42, 3593–3624, https://doi.org/10.1016/j.atmosenv.2008.01.003, 2008. a
Lelieveld, S., Wilson, J., Dovrou, E., Mishra, A., Lakey, P. S., Shiraiwa, M., Pöschl, U., and Berkemeier, T.: Hydroxyl Radical Production by Air Pollutants in Epithelial Lining Fluid Governed by Interconversion and Scavenging of Reactive Oxygen Species, Environ. Sci. Technol., 55, 14069–14079, https://doi.org/10.1021/acs.est.1c03875, 2021. a
Lelieveld, S., Lelieveld, J., Mishra, A., Daiber, A., Pozzer, A., Pöschl, U., and Berkemeier, T.: Endogenous Nitric Oxide Can Enhance Oxidative Stress Caused by Air Pollutants and Explain Higher Susceptibility of Individuals with Inflammatory Disorders, Environ. Sci. Technol., 58, 1823–1831, https://doi.org/10.1021/acs.est.3c07010, 2024. a
Lienhard, D. M., Bones, D. L., Zuend, A., Krieger, U. K., Reid, J. P., and Peter, T.: Measurements of thermodynamic and optical properties of selected aqueous organic and organic-inorganic mixtures of atmospheric relevance, J. Phys. Chem. A, 116, 9954–9968, https://doi.org/10.1021/jp3055872, 2012. a
Malecha, K. T. and Nizkorodov, S. A.: Photodegradation of Secondary Organic Aerosol Particles as a Source of Small, Oxygenated Volatile Organic Compounds, Environ. Sci. Technol., 50, 9990–9997, https://doi.org/10.1021/acs.est.6b02313, 2016. a
Mao, J., Fan, S., Jacob, D. J., and Travis, K. R.: Radical loss in the atmosphere from Cu-Fe redox coupling in aerosols, Atmos. Chem. Phys., 13, 509–519, https://doi.org/10.5194/acp-13-509-2013, 2013. a, b, c
Martell, A. E. and Smith, R. M.: Critical stability constants, Springer US, Boston, vol. 5 Edn., 257 pp., https://doi.org/10.1007/978-1-4757-5506-0, 1982. a, b, c
Matocha, C. J., Karathanasis, A. D., Rakshit, S., and Wagner, K. M.: Reduction of Copper(II) by Iron(II), J. Environ. Qual., 34, 1539–1546, https://doi.org/10.2134/jeq2005.0002, 2005. a, b
Moffet, R. C., Henn, T., Laskin, A., and Gilles, M. K.: Automated chemical analysis of internally mixed aerosol particles using X-ray spectromicroscopy at the carbon K-edge, Anal. Chem., 82, 7906–7914, https://doi.org/10.1021/ac1012909, 2010. a
Moffet, R. C., Furutani, H., Rödel, T. C., Henn, T. R., Sprau, P. O., Laskin, A., Uematsu, M., and Gilles, M. K.: Iron speciation and mixing in single aerosol particles from the Asian continental outflow, J. Geophys. Res.-Atmos., 117, D07204, https://doi.org/10.1029/2011JD016746, 2012. a, b, c, d
Perrin, D. D.: Stability Constants of Metal-Ion Complexes, Part B: Organic Ligands, IUPAC Chemical Data Series, 22, 1263 pp., https://doi.org/10.1002/prac.19803220331, 1979. a, b
Pham, A. N. and Waite, T. D.: Modeling the kinetics of Fe(II) oxidation in the presence of citrate and salicylate in aqueous solutions at pH 6.0-8.0 and 25 °, J. Phys. Chem. A, 112, 5395–5405, https://doi.org/10.1021/jp801126p, 2008. a, b
Pöschl, U. and Shiraiwa, M.: Multiphase Chemistry at the Atmosphere-Biosphere Interface Influencing Climate and Public Health in the Anthropocene, Chem. Rev., 115, 4440–4475, https://doi.org/10.1021/cr500487s, 2015. a
Potter, P. M., Guan, X., and Lomnicki, S. M.: Synergy of iron and copper oxides in the catalytic formation of PCDD/Fs from 2-monochlorophenol, Chemosphere, 203, 96–103, https://doi.org/10.1016/j.chemosphere.2018.03.118, 2018. a
Pozdnyakov, I. P., Kolomeets, A. V., Plyusnin, V. F., Melnikov, A. A., Kompanets, V. O., Chekalin, S. V., Tkachenko, N., and Lemmetyinen, H.: Photophysics of Fe(III)-tartrate and Fe(III)-citrate complexes in aqueous solutions, Chem. Phys. Lett., 530, 45–48, https://doi.org/10.1016/j.cplett.2012.01.051, 2012. a
Pozdnyakov, I. P., Melnikov, A. A., Tkachenko, N., Chekalin, S. V., Lemmetyinen, H., and Plyusnin, V. F.: Ultrafast photophysical processes for Fe(iii)-carboxylates, Dalton T., 43, 17590–17595, https://doi.org/10.1039/c4dt01419g, 2014. a, b, c, d, e
Raabe, J., Tzvetkov, G., Flechsig, U., Böge, M., Jaggi, A., Sarafimov, B., Vernooij, M. G., Huthwelker, T., Ade, H., Kilcoyne, D., Tyliszczak, T., Fink, R. H., and Quitmann, C.: PolLux: A new facility for soft x-ray spectromicroscopy at the swiss light source, Rev. Sci. Inst., 79, 113704, https://doi.org/10.1063/1.3021472, 2008. a
Rabani, J., Klug-Roth, D., and Lilie, J.: Pulse radiolytic investigations of the catalyzed disproportionation of peroxy radicals. Aqueous cupric ions, The J. Phys. Chem., 77, 1169–1175, https://doi.org/10.1021/j100628a018, 1973. a, b
Reid, J. P., Bertram, A. K., Topping, D. O., Laskin, A., Martin, S. T., Petters, M. D., Pope, F. D., and Rovelli, G.: The viscosity of atmospherically relevant organic particles, Nat. Commun., 9, 956–970, https://doi.org/10.1038/s41467-018-03027-z, 2018. a
Robinson, A. L., Donahue, N. M., Shrivastava, M. K., Weitkamp, E. A., Sage, A. M., Grieshop, A. P., Lane, T. E., Pierce, J. R., and Pandis, S. N.: Rethinking Organic Aerosols: Semivolatile Emissions and Photochemical Aging, Science, 315, 1259–1262, https://doi.org/10.1126/SCIENCE.1133061, 2007. a
Rush, J. D. and Bielski, B. H.: Pulse radiolytic studies of the reactions of HO2/O with Fe(II)/Fe(III) ions. The reactivity of HO2/O with ferric ions and its implication on the occurrence of the Haber-Weiss reaction, J. Phys. Chem., 89, 5062–5066, https://doi.org/10.1021/j100269a035, 1985. a, b, c, d
Schroeder, W. H., Dobson, M., Kane, D. M., and Johnson, N. D.: Toxic Trace Elements Associated With Airborne Particulate Matter: A Review, J. Air Pollut. Control Assoc., 37, 1267–1285, https://doi.org/10.1080/08940630.1987.10466321, 1987. a, b
Sedlak, D. L. and Hoigné, J.: The role of copper and oxalate in the redox cycling of iron in atmospheric waters, Atmos. Environ. A, 27, 2173–2185, https://doi.org/10.1016/0960-1686(93)90047-3, 1993. a
Sehested, K., Rasmussen, O. L., and Fricke, H.: Rate constants of OH with HO2, O, and H2O from hydrogen peroxide formation in pulse-irradiated oxygenated water, J. Phys. Chem., 72, 626–631, https://doi.org/10.1021/j100848a040, 1968. a, b, c
Seraghni, N., Belattar, S., Mameri, Y., Debbache, N., and Sehili, T.: Fe(III)-citrate-complex-induced photooxidation of 3-methylphenol in aqueous solution, Int. J. Photoenergy, 2012, 630425, https://doi.org/10.1155/2012/630425, 2012. a
Shen, J., Griffiths, P. T., Campbell, S. J., Utinger, B., Kalberer, M., and Paulson, S. E.: Ascorbate oxidation by iron, copper and reactive oxygen species: review, model development, and derivation of key rate constants, Sci. Rep., 11, 1–14, https://doi.org/10.1038/s41598-021-86477-8, 2021. a
Shiraiwa, M., Fang, T., Wei, J., Lakey, P. S. J., Hwang, B. C., Edwards, K. C., Kapur, S., Monterrosa Mena, J. E., Huang, Y.-K., Digman, M. A., Weichenthal, S. A., Nizkorodov, S. A., and Kleinman, M. T.: Chemical and Cellular Formation of Reactive Oxygen Species from Secondary Organic Aerosols in Epithelial Lining Fluid, Tech. rep., UCI, Boston, MA: Health Effects Institute, 2023. a
Silva, A. M., Kong, X., Parkin, M. C., Cammack, R., and Hider, R. C.: Iron(iii) citrate speciation in aqueous solution, Dalton T., 2009, 8616–8625, https://doi.org/10.1039/b910970f, 2009. a
Steimer, S. S., Berkemeier, T., Gilgen, A., Krieger, U. K., Peter, T., Shiraiwa, M., and Ammann, M.: Shikimic acid ozonolysis kinetics of the transition from liquid aqueous solution to highly viscous glass, Phys. Chem. Chem. Phys., 17, 31101–31109, https://doi.org/10.1039/c5cp04544d, 2015. a
Tao, Y. and Murphy, J. G.: The Mechanisms Responsible for the Interactions among Oxalate, pH, and Fe Dissolution in PM2.5, ACS Earth Space Chem., 3, 2259–2265, https://doi.org/10.1021/acsearthspacechem.9b00172, 2019. a
Tapparo, A., Di Marco, V., Badocco, D., D'Aronco, S., Soldà, L., Pastore, P., Mahon, B. M., Kalberer, M., and Giorio, C.: Formation of metal-organic ligand complexes affects solubility of metals in airborne particles at an urban site in the Po valley, Chemosphere, 241, 125025, https://doi.org/10.1016/j.chemosphere.2019.125025, 2020. a
Tuet, W. Y., Chen, Y., Fok, S., Gao, D., Weber, R. J., Champion, J. A., and Ng, N. L.: Chemical and cellular oxidant production induced by naphthalene secondary organic aerosol (SOA): effect of redox-active metals and photochemical aging, Sci. Rep., 7, 1–10, https://doi.org/10.1038/s41598-017-15071-8, 2017. a
Virtanen, A., Joutsensaari, J., Koop, T., Kannosto, J., Yli-Pirilä, P., Leskinen, J., Mäkelä, J. M., Holopainen, J. K., Pöschl, U., Kulmala, M., Worsnop, D. R., and Laaksonen, A.: An amorphous solid state of biogenic secondary organic aerosol particles, Nature, 467, 824–827, https://doi.org/10.1038/nature09455, 2010. a
von Piechowski, M., Nauser, T., Hoigné, J., and Bühler, R. E.: O2 Decay Catalyzed by Cu and Cu+ Ions in Aqueous Solutions: A Pulse Radiolysis Study for Atmospheric Chemistry, Berichte der Bunsengesellschaft für physikalische Chemie, 97, 762–771, https://doi.org/10.1002/bbpc.19930970604, 1993. a
Walling, C.: Fenton's Reagent Revisited, Accounts Chem. Res., 8, 125–131, https://doi.org/10.1021/ar50088a003, 1975. a
Wang, J., Huang, D., Chen, F., Chen, J., Jiang, H., Zhu, Y., Chen, C., and Zhao, J.: Rapid Redox Cycling of Fe(II)/Fe(III) in Microdroplets during Iron–Citric Acid Photochemistry, Environ. Sci. Technol., 57, 4434–4442, https://doi.org/10.1021/acs.est.2c07897, 2023. a
Wang, Z., Chen, C., Ma, W., and Zhao, J.: Photochemical coupling of iron redox reactions and transformation of low-molecular-weight organic matter, J. Phys. Chem. Lett., 3, 2044–2051, https://doi.org/10.1021/jz3005333, 2012. a
Wei, J., Yu, H., Wang, Y., and Verma, V.: Complexation of Iron and Copper in Ambient Particulate Matter and Its Effect on the Oxidative Potential Measured in a Surrogate Lung Fluid, Environ. Sci. Technol., 53, 1661–1671, https://doi.org/10.1021/acs.est.8b05731, 2019. a, b, c
Weichenthal, S., Shekarrizfard, M., Traub, A., Kulka, R., Al-Rijleh, K., Anowar, S., Evans, G., and Hatzopoulou, M.: Within-City Spatial Variations in Multiple Measures of PM2.5 Oxidative Potential in Toronto, Canada, Environ. Sci. Technol., 53, 2799–2810, https://doi.org/10.1021/acs.est.8b05543, 2019. a
Welch, M. J., Lifton, J. F., and Seck, J. A.: Tracer studies with radioactive Oxygen-15. Exchange between carbon dioxide and water, J. Phys. Chem., 73, 3351–3356, 1969. a
Weller, C., Horn, S., and Herrmann, H.: Photolysis of fe(iii) carboxylato complexes: Fe(ii) quantum yields and reaction mechanisms, J. Photochem. Photobiol. A, 268, 24–36, https://doi.org/10.1016/j.jphotochem.2013.06.022, 2013. a, b, c, d
Weller, C., Tilgner, A., Bräuer, P., and Herrmann, H.: Modeling the impact of iron-carboxylate photochemistry on radical budget and carboxylate degradation in cloud droplets and particles, Environ. Sci. Technol., 48, 5652–5659, https://doi.org/10.1021/es4056643, 2014. a, b
West, C. P., Morales, A. C., Ryan, J., Misovich, M. V., Hettiyadura, A. P., Rivera-Adorno, F., Tomlin, J. M., Darmody, A., Linn, B. N., Lin, P., and Laskin, A.: Molecular investigation of the multi-phase photochemistry of Fe(iii)-citrate in aqueous solution, Environ. Sci., 25, 190–213, https://doi.org/10.1039/d1em00503k, 2023. a
Ziajka, J., Beer, F., and Warneck, P.: Iron-catalysed oxidation of bisulphite aqueous solution: Evidence for a free radical chain mechanism, Atmos. Environ., 28, 2549–2552, https://doi.org/10.1016/1352-2310(94)90405-7, 1994. a
- Abstract
- Introduction
- Material and methods
- Results and discussion
- Conclusions
- Appendix A: STXM/NEXAFS iron spectra
- Appendix B: Sun actinic flux vs STXM LED
- Appendix C: Iron(III) reduction with light
- Appendix D: Additional iron reoxidation experiments
- Appendix E: Particle concentration
- Appendix F: reaction turnovers and concentration profiles
- Appendix G: Additional copper reoxidation experiment with concentration profiles
- Appendix H: Calculation of diffuso-reactive length for O2
- Code and data availability
- Author contributions
- Competing interests
- Disclaimer
- Acknowledgements
- Financial support
- Review statement
- References