the Creative Commons Attribution 4.0 License.
the Creative Commons Attribution 4.0 License.
 | 28 Jul 2025
Distinct structures of interannual variations in stratosphere-to-troposphere ozone transport induced by the Tibetan Plateau thermal forcing
Qingjian Yang
Tianliang Zhao
Yongqing Bai
Kai Meng
Yuehan Luo
Zhijie Tian
Xiaoyun Sun
Weikang Fu
Kai Yang
Stratosphere-to-troposphere transport (STT) is an essential natural source of tropospheric ozone. Focusing on the STT variations in late spring and early summer with frequent ozone STT over the Asian region, this study investigated the Tibetan Plateau (TP) thermal effect on the interannual STT variations with the meteorological data over 1980–2014. The distinct structures of interannual STT anomalies with the key areas of TP thermal forcing are identified through the 35-year climatological statistics. Positive anomalies of thermal forcing over the central and eastern TP exert opposing impacts on the increasing and decreasing ozone STT, respectively, along the northern and southern branches of the westerly jet around the TP. Such stronger TP thermal forcing induces anticyclonic anomalies in the upper troposphere over the TP and the surroundings, which strengthens and attenuates the northern and southern branches of the westerly jet, intensifying and weakening the westerly trough for more (fewer) tropopause folds of ozone STT over the East Asian region. Furthermore, the positive anomalies of thermal forcing over the western TP are related to the western enhancing and eastern declining STT over the Asian region. This study reveals the distinct structures of interannual variations in ozone STT induced by the TP thermal forcing, providing a new perspective for the TP effect on the atmospheric environment.
- Article
(10345 KB) - Full-text XML
- BibTeX
- EndNote


As one of the most important chemicals in the atmosphere, ozone has globally captured considerable attention and sparked extensive scientific investigations. The high ozone layer in the stratosphere absorbs most of the harmful UV radiation, protecting the biosphere on the Earth's surface. Conversely, ozone in the troposphere acts as a potent oxidant with adverse effects on human health (Nuvolone et al., 2018), crop growth (Feng et al., 2015), and ecosystems (Yue et al., 2017). Despite its abundance in the troposphere being much less than that in the stratosphere (10 % vs. 90 %), tropospheric ozone can influence the global radiation balance and then the multiscale climate patterns of global, hemispheric, and regional circulations in the atmosphere, such as high-latitude warming, Hadley circulation, and East Asian summer monsoon system (Chen et al., 2007; Li et al., 2018), as an effective greenhouse gas (Schoeberl and Hartmann, 1991).
Although it is well-established that the photochemical oxidation of volatile organic compounds and nitrogen oxides primarily produces tropospheric ozone (Sillman, 2003), stratosphere-to-troposphere transport (STT) was proved to be an essential natural source influencing ozone change in the troposphere (Meng et al., 2022; Zhao et al., 2021). STT can transport ozone-enriched air from the stratosphere downward to the troposphere, exerting an important impact on temporal–spatial variations in tropospheric ozone (Ni et al., 2019; Oltmans et al., 2004). Thus, exploring the factors influencing the changes in ozone STT is of great importance.
The STT occurrences or stratospheric intrusions are highly associated with the upper-tropospheric westerly jet in the middle latitudes (Ding and Wang, 2006; Hsu et al., 2005; Lee et al., 2024). The descending pathway of STT is attributed to the tilted isentropic surfaces along the strong westerlies in the mid-latitudes (Akritidis et al., 2016; Škerlak et al., 2014; Sprenger and Wernli, 2003). The upper-level jet can drive isentropic mixing near the jet axis for tropopause folds, initiating downward transport of stratospheric ozone, with influence on the ozone in the troposphere (Lee et al., 2024).
Climatologically, the westerly jet is located near the tropopause between 200 and 300 hPa, with the southern branch extending northeastward from the southern side of the Tibetan Plateau (TP) to the Northwest Pacific and the northern branch stretching southeastward from the 40–65° N region north of the TP to the Northwest Pacific. The two branches converge over the northwestern Pacific, forming the strongest jet stream in the world (Cressman, 1981). The TP terrain effect plays a crucial role in shaping the southern and northern branches of the westerly jet (Li and Liu, 2015; Liu et al., 2020). During spring and summer, the thermal forcing of the TP induces the Asian summer monsoon anticyclonic circulation in the upper troposphere and lower stratosphere (UTLS) (Wu et al., 2007), intensifying the northern branch of the westerly jet northward and inhibiting the southern branch of the westerly jet, which may even disappear by late June (Duan and Wu, 2005; Luo and Yanai, 1983). The increase in spring snow cover with negative anomalies of TP thermal forcing over the TP can strengthen the southern branch and weaken the northern branch of the westerly jet (Dong and Yu, 1997). The north–south shift of the westerly jet is closely linked to the seasonal variations of the TP thermal forcing, especially during the spring–summer seasonal transition period (Li and Liu, 2015). However, it is poorly understood how the TP thermal forcing anomalies affect the changes in ozone STT along the northern and southern branches of the westerly jet.
The TP serves as a large heat source in boreal summer because high surface sensible heating could cause cyclonic circulation anomalies in the lower troposphere and could trigger vertical motion with notable latent heat release from cloud–precipitation in the middle–upper troposphere over the TP (Luo and Yanai, 1984; Duan and Wu, 2005; Wu et al., 2007). The TP thermal forcing refers to the heating intensity in the atmosphere over the TP, resulting from the atmospheric diabatic process of surface sensible heat, latent heat, and radiation heat. As the roof of the world with a large climatic external forcing, the TP can induce westerly jet change and further influence the weather (Wu et al., 2007; Xu et al., 2010, 2024; Tan et al., 2023) and the atmospheric environment in the downstream regions. The anomalous westerly jet induced by the TP significantly affects dust aerosol transport, precipitation, and drought in China (Liu et al., 2020). The thermal forcing change over the TP significantly modulates the interannual variations in ozone pollution with a dipole pattern over eastern China (Yang et al., 2024). However, the relationship between the TP terrain effect and ozone STT over China in the interannual variations remains unclear. Given that the thermal forcing of the TP significantly modulates the intensity and position of the westerly jet, the objective of this study is to characterize the thermal effect of the TP on the ozone STT over China while comprehending the TP's effect on atmospheric environmental change.
Based on the data of STT frequency and ozone STT product over 1980–2014, combined with the ERA5 data of reanalysis meteorology, the impact of the TP thermal forcing on interannual variations in ozone STT over China was investigated by using the statistical methods of singular value decomposition (SVD), composite analysis, and correlation analysis. Following the Introduction, the data and methodology are presented in Sect. 2. The impacts of the TP thermal effect on ozone STT are explored in Sect. 3. In Sect. 4, the physical mechanisms are investigated. In Sect. 5, we provide the conclusions of this study. The aim of this study is to extend the environmental influence of the TP terrain forcing on STT of ozone over downstream regions for a comprehensive understanding of environmental changes in China.
2.1 Data
The monthly STT frequency data from 1980–2014 were provided by the atmospheric dynamics group at ETH Zürich (http://eraiclim.ethz.ch/prot/ste.html, last access: 23 July 2025). The detection algorithm for STT events initiates with a comprehensive grid of trajectories launched every 24 h. Those trajectories intersecting the tropopause within the first day are identified and then tracked for 4 d, both forwards and backwards in time. In order to eliminate the transient exchange events, the methodology requires that each trajectory remains on either side of the tropopause for a minimum of 48 h. For the detailed introduction of the computational methods, please refer to the study by Sprenger and Wernli (2003).
The monthly data of ozone STT mass flux () from 1980–2014 were further calculated based on the STT frequency (Škerlak et al., 2014). Each trajectory represents a fixed amount of air mass flux determined by the spacing of the starting grid. Based on the air mass flux, the ozone STT flux is calculated accordingly with the molecular weights of the dry air and ozone, as well as the ozone concentrations at the tropopause. A thorough guide on the calculation method of the ozone STT mass flux is provided in the study of Škerlak et al. (2014).
The monthly tropopause fold frequency data from 1980–2014 were also derived from ETH Zürich (http://eraiclim.ethz.ch/prot/folds.html, last access: 23 July 2025). The identification of tropopause folds consists of a three-dimensional subdivision of the atmosphere into stratospheric and tropospheric parts and a subsequent examination of multiple tropopause crossings in vertical profiles of the analyses. The detailed calculation method can be found in Tyrlis et al. (2014) and Škerlak et al. (2015).
The monthly reanalysis data of meteorology with a horizontal resolution of 0.25°×0.25° and 32 vertical pressure layers up to 10 hPa were derived from the ERA5 of the European Centre for Medium-Range Weather Forecasts (ECMWF) (Hersbach et al., 2020) reanalysis dataset (https://www.ecmwf.int/en/forecasts/datasets/reanalysis-datasets/era5/, last access: 23 July 2025), including air temperature (T), potential vorticity (PV), relative humidity (RH), latitudinal and meridional components (U, V) of wind, and vertical velocity (ω).
2.2 The heat source over the TP
The atmospheric heat source (Q1) is a physical quantity that reflects the heat balance of an air column. For a given area, the Q1 is defined as the heat gained (lost) by the air column over a period of time, which is a combination of sensible heat, latent heat of condensation, and atmospheric radiation. Following the inverse algorithm of Yanai et al. (1973, 1992), the atmospheric heat source (Q1) was calculated based on the ERA5 reanalysis data:
where T and θ are air temperature and potential temperature, respectively; where R and Cp are the dry air gas constant and specific heat at constant pressure, respectively; and P0 is 1000 hPa.
The vertical integral value of Q1 in an atmospheric column can be expressed as
where Ps and Pt denote the surface pressure and atmospheric top pressure (200 hPa), respectively, and g is gravitational acceleration. The vertical integral of Q1 over the TP area of 78–103° E and 28–38° N, covering most of the region with an altitude>3000 m (Xu et al., 2016), represents the thermal forcing of the TP.
2.3 Singular value decomposition (SVD)
SVD is a powerful mathematical technique to identify the spatio-temporal relationships between two variable fields. Since the first application of SVD in meteorological analysis by Prohaska (1976), SVD has been widely applied in the studies of environment, climate, and ecology (Sein et al., 2024; Wang et al., 2017; Zhou et al., 2022). The matrix decomposition of SVD can obtain the spatial modes and their corresponding temporal coefficients from the correlation fields of paired variable domains. The correlations between the variations of one domain and the temporal coefficient of the other are defined as the heterogeneous correlation coefficients, reflecting the inter-field correlation distribution. The heterogeneous correlations are positive or negative, indicating the concord or inverse relationship between the two fields. The two-tailed Student t test is used for statistical significance testing for the heterogeneous correlation, and the regions of significant correlations are regarded as the key areas of interaction between the two fields. For the detailed methodology of SVD calculations, please refer to Prohaska (1976). In this study, the SVD method was used to capture the coupled patterns of the spatio-temporal variations in Q1 over the TP and STT frequency over China and surrounding regions (70–135° E and 20–55° N).
3.1 Monthly variations in STT frequency
The spatial patterns of the monthly mean of STT frequency over 1980–2014 are shown in Fig. 1. The STT frequency presents distinct monthly variations with the seasonal shift of high-frequency areas over Asia. From January–March, high STT frequencies are distributed in a zonal band south of the TP between 25 and 35° N, with the high-frequency zone extending east–west. Another zonal area of high STT frequency between 40 and 50° N progressively expands from the north of the TP to the regions between northeast China and the southern part of Japan (Fig. 1a–c), forming the northern and southern branches of the high-frequency zone around the TP.
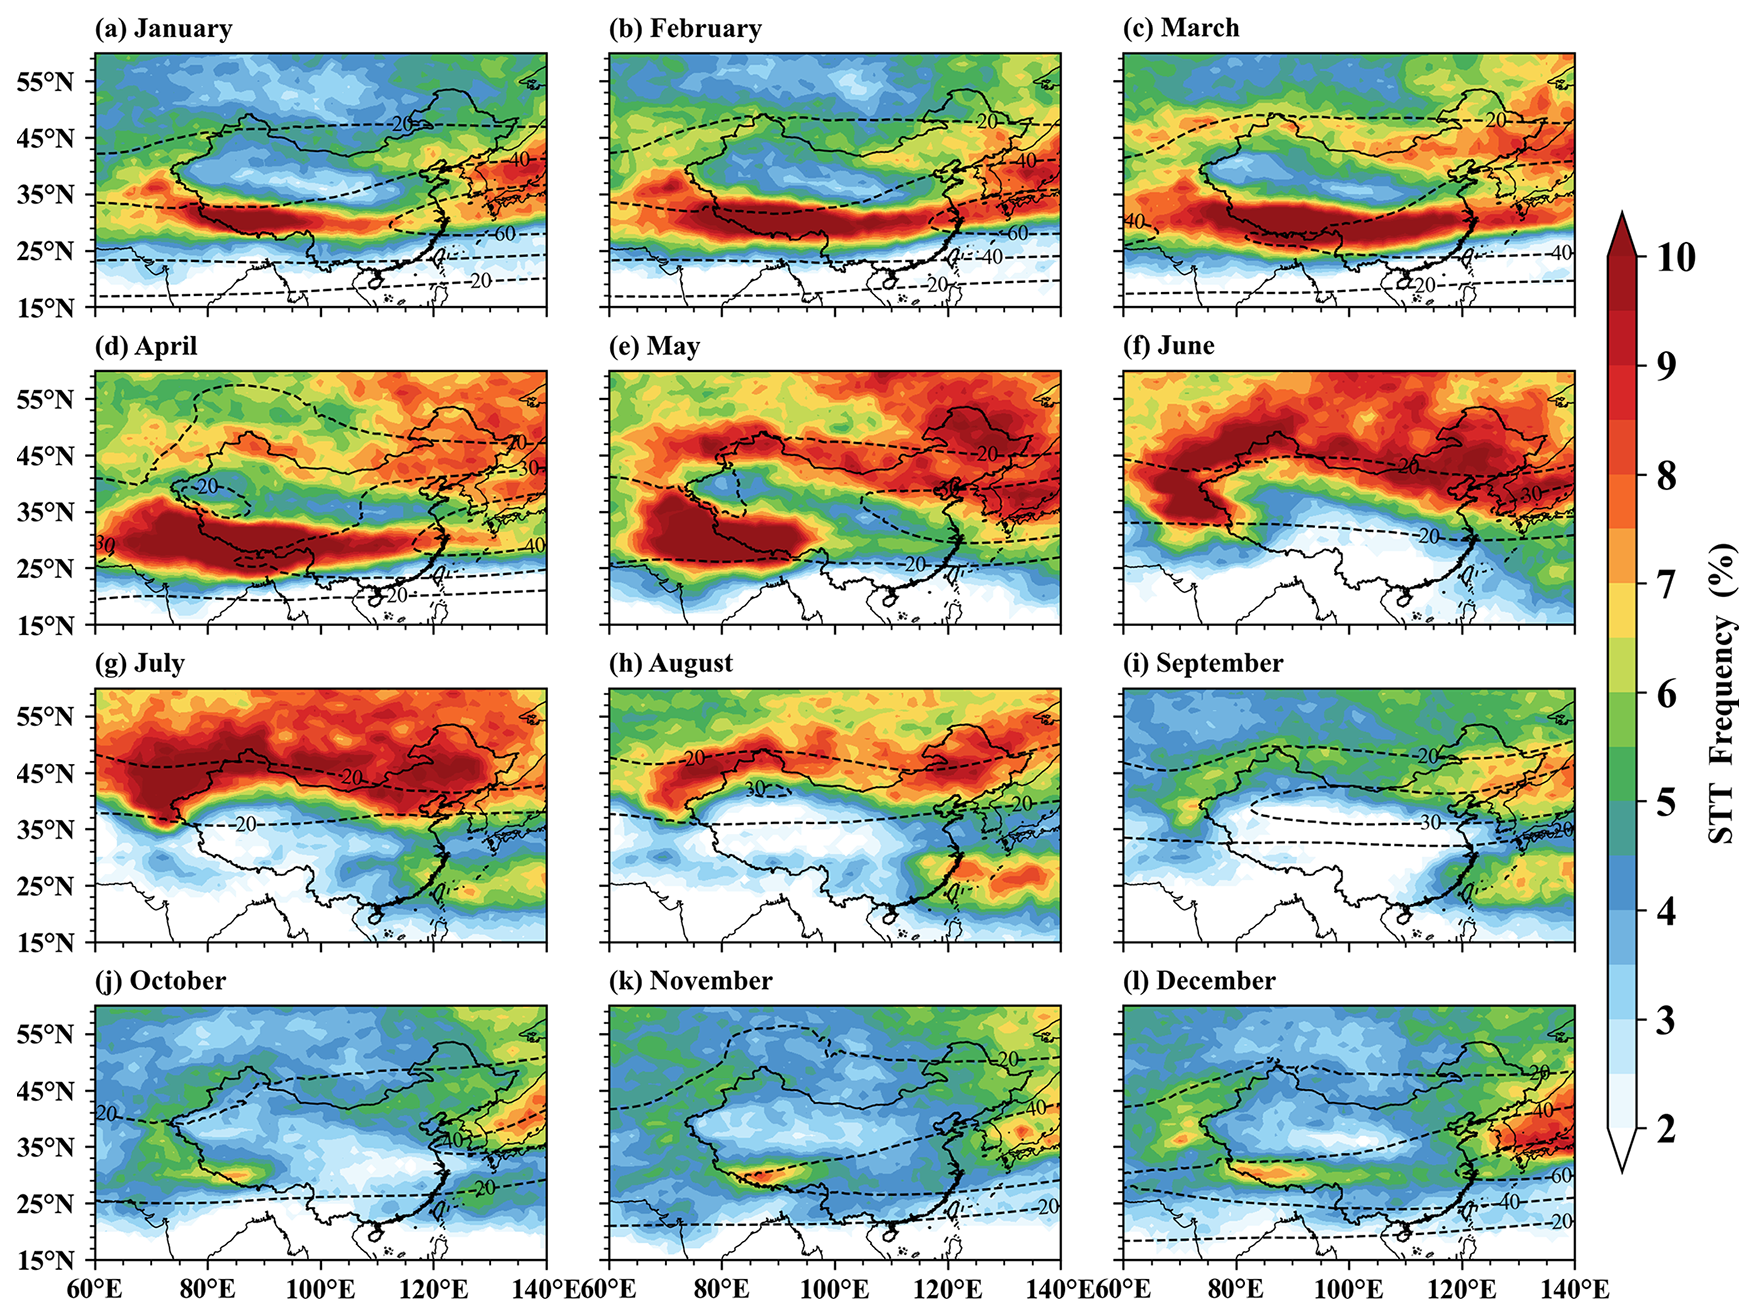
Figure 1Monthly variations in STT frequency (color contours) and zonal wind velocity in the UTLS (contour lines) over China and the surrounding Asian region averaged during 1980–2014. The zonal wind velocity (m s−1) is averaged over 200–300 hPa, indicating the westerly jet strengths and positions.
During late spring and early summer, from April–June, the southern branch of the high-frequency band contracts gradually from east to west and almost vanishes in July, while the northern branch of high STT frequency over the region from northeast China to Japan expands remarkably between 40–55° N from east to west, and the high STT frequency occupies the regions north of 35° N over China and the surroundings (Fig. 1d–g), which could reflect the high period of STT from April to June over China and the surrounding Asian region.
From August–September, both the magnitudes and areas of two branches of STT frequency diminish significantly (Fig. 1h and i), reaching their minimum of STT seasonal cycle during the autumn months of September, October, and November (Fig. 1i–k), which could be the period of low-air-mass STT throughout the year over China. Subsequently, as the STT seasonal shift from autumn to winter occurs, the STT recovery emerges in December over China, commencing in the region between northeast China and Japan, as well as in the southern edge of the TP (Fig. 1l), leading to the resurgence of the northern and southern branches of the high-frequency STT zone in the subsequent year (Fig. 1a and b). It is worthwhile to show the seasonal cycle of the westerly jets in association with the seasonal cycle of the STT frequency in Fig. 1. The STT frequency is notably linked to the strengths and positions of the northern and southern branch westerly jets around the TP, and the seasonal northward jump and southward retreat of the westerly jets from summer to winter significantly modulate the zonal variation of the high STT frequency in spatial distribution and seasonal patterns (Fig. 1).
The STT exhibits a prominent seasonal cycle. Specifically, in late spring to early summer (April, May, and June, hereafter referred to as AMJ), the northern and southern branches of the high-STT zone cover the largest area of China and surrounding areas. As illustrated in Fig. 2, the northern band, between 35 and 55° N, stretches from western China along the northern branch of the westerly jet to southern Japan, with a large area of high STT values found between northeast China and the Korea–Japan region, and the southern band is located between 25 and 35° N, spanning from the western edge of the TP and the southern Asian region to southern China and the East China Sea. The two branches converge over the northwestern Pacific, consistent with the spatial distribution of the upper-tropospheric westerly jet (Cressman, 1981). The STT frequency in these two high-value bands exceeds 7 %, with broad coverage significantly impacting tropospheric ozone changes in China. The study by Yang et al. (2016) indicated that the ozone STT flux peaks in the boreal extratropical regions exist during late spring and early summer, consistent with the high-frequency STT period identified in this study.
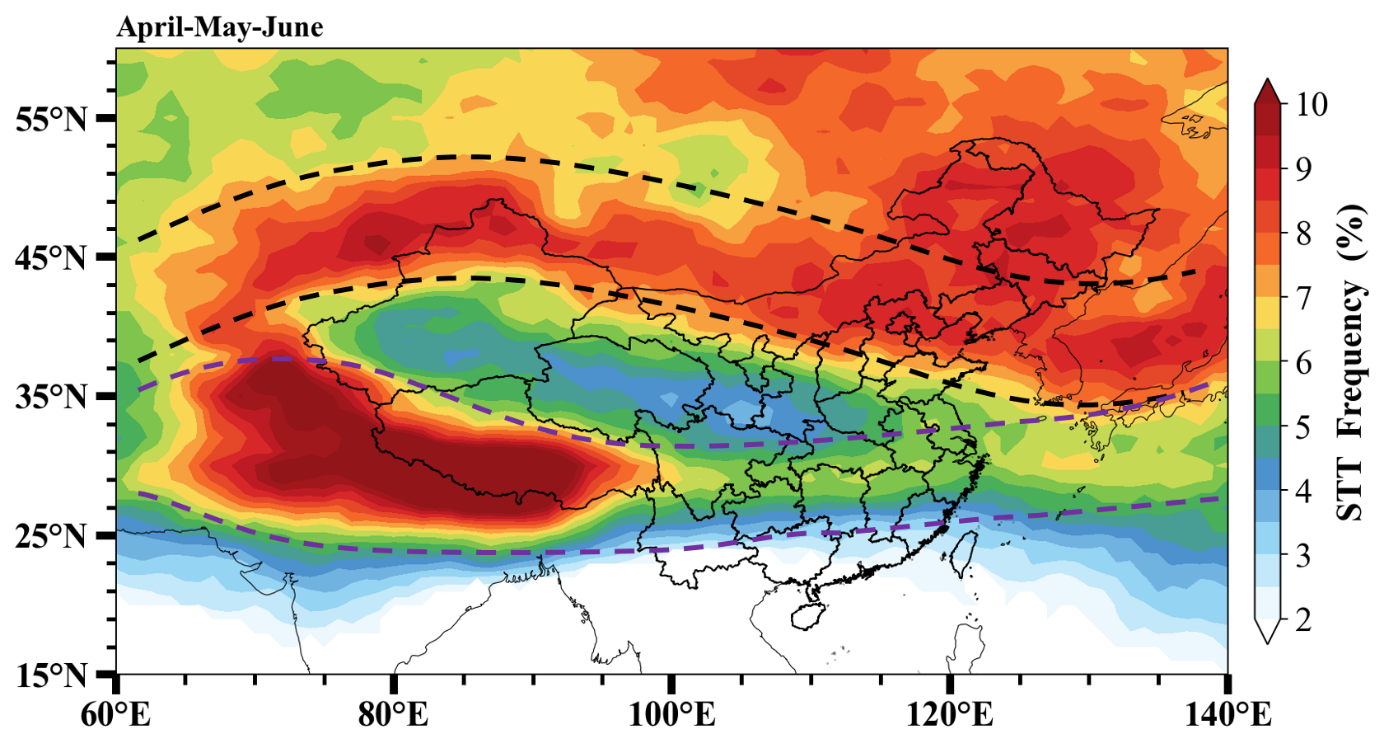
Figure 2The AMJ-averaged STT frequency over China and the surroundings during 1980–2014. The dashed black and purple lines denote the northern and southern branches of high STT frequency around the TP.
The notable seasonal cycles of STT frequency over China and the surroundings are closely tied to the seasonal shifts of the westerly jet (Akritidis et al., 2016; Lee et al., 2024; Stohl et al., 2003), which is primarily dependent on the mechanical and thermal forcing of the TP topography with the distinct seasonal change (Wu et al., 2007, 2018). As a result, by targeting AMJ of late spring and summer, this study explores the effects of the TP thermal forcing on interannual variations in STT frequency over China.
3.2 The TP thermal effect on STT frequency
Here, we use the SVD method to explore the spatio-temporal relationship between the thermal forcing of the TP and STT frequency over China during AMJ of 1980–2014. As shown in Figs. 3 and 4, two leading modes are decomposed by SVD with variance contributions of 31.59 % for SVD1 (Fig. 3a–c) and 25.20 % for SVD2 (Fig. 4a–c), respectively. The first two pairs of leading patterns can explain 56.79 % of the total variance, characterizing the majority of the relationship between the TP thermal forcing and STT frequency over China.
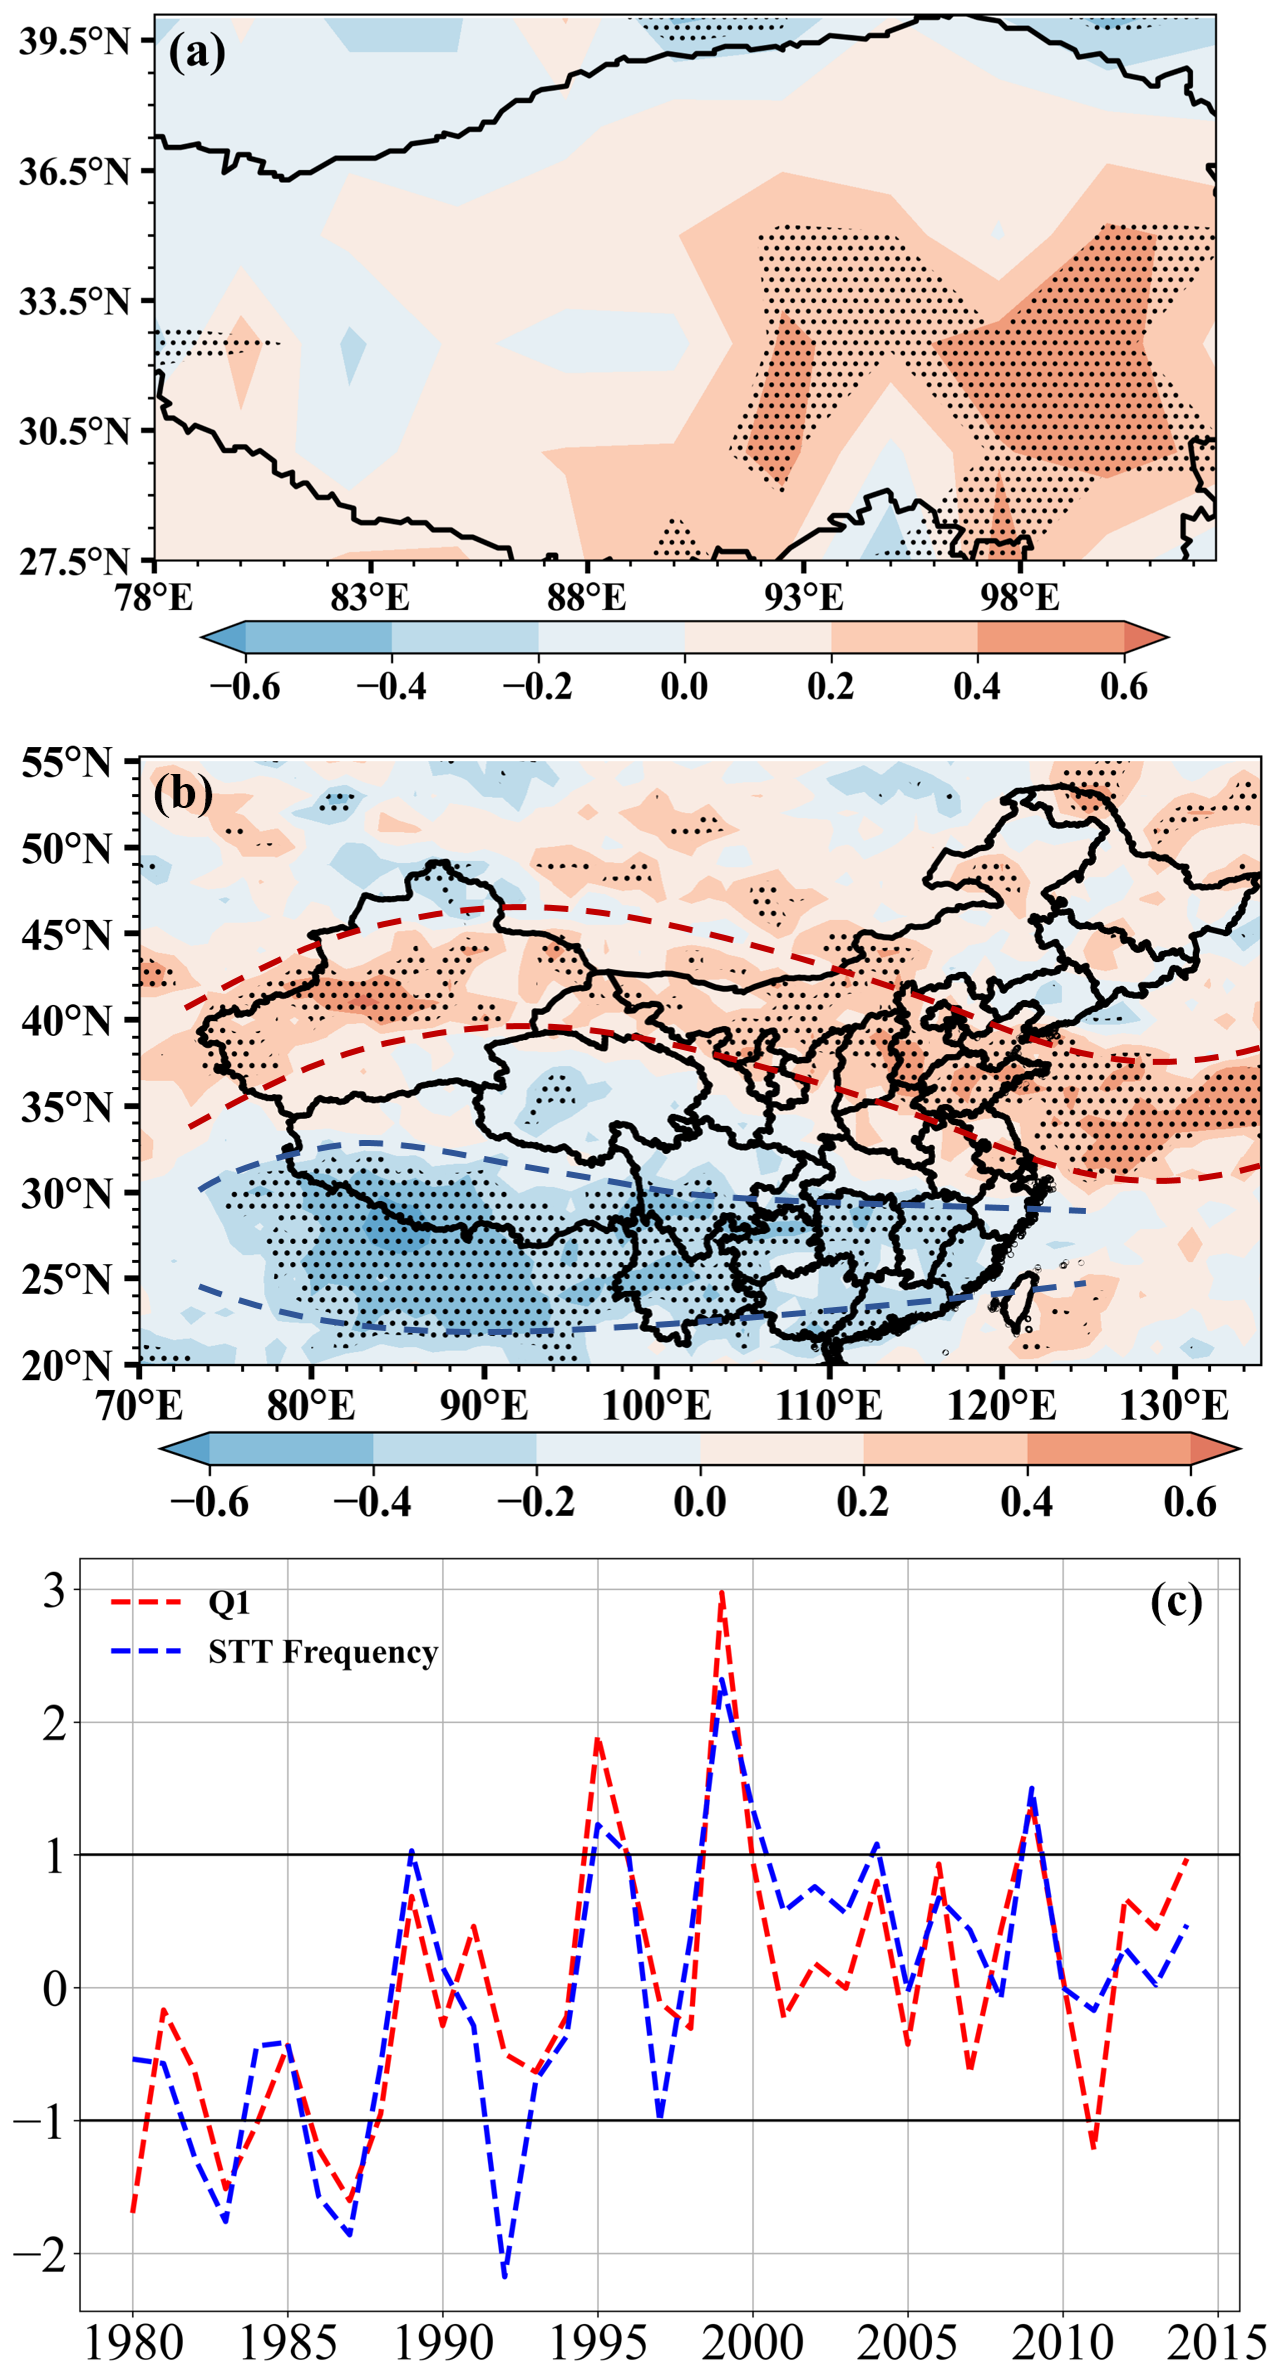
Figure 3Heterogeneous correlations of (a) TP thermal forcing, where the black line represents the isoline of altitude at 3000 m outlining the area of the TP; (b) STT frequency, where the dashed red and blue lines denote the northern and southern branches of STT frequency, respectively; and (c) their normalized temporal coefficients in the first SVD mode (SVD1). Black dots mean passing the 90 % confidence level based on the Student t test.
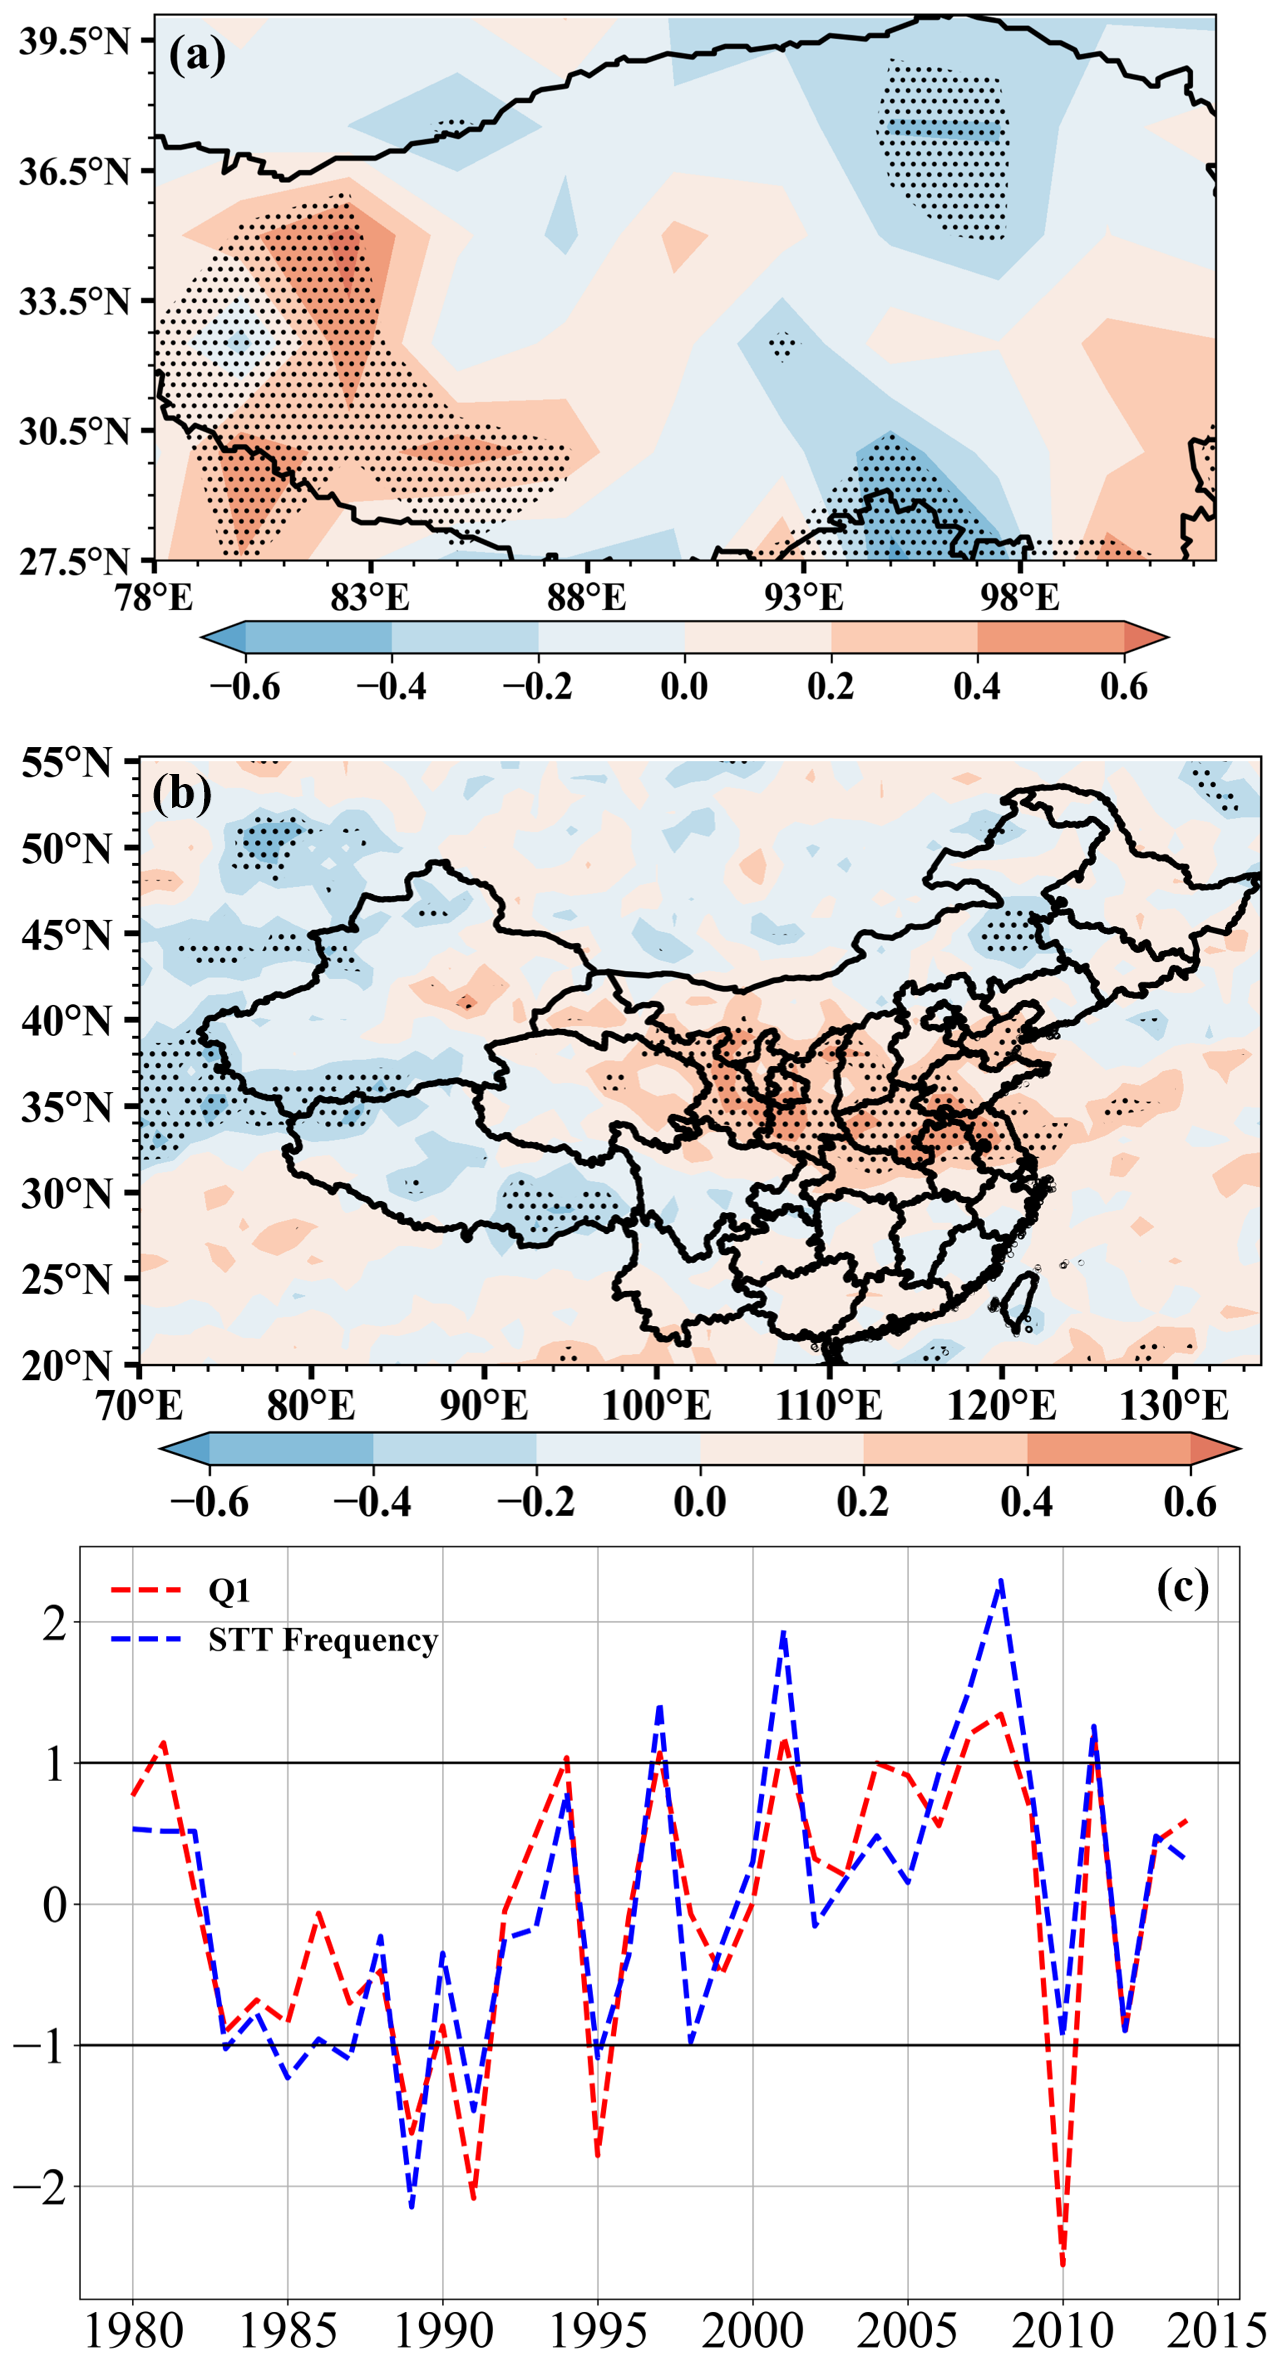
Figure 4Same as Fig. 3 but for the second SVD mode (SVD2).
Figure 3a–c present the distribution of heterogeneous correlations of TP thermal forcing and STT frequency over China and the normalized time series of temporal coefficients of the first SVD mode. As exhibited in Fig. 3a, the heterogeneous correlations are predominantly positive over the TP, and a key area of TP thermal effect on STT change over China is identified over the central and eastern TP with significant heterogeneous correlations. While for STT frequency variations (Fig. 3b), there is an obvious zonal pattern with significantly positive correlations along the northern branch of the westerly jet over northern China between 35–45° N (dashed red line in Fig. 3b) and negative correlations in the lower latitudes (20–30° N) from the TP to southeastern China along the southern branch of the westerly jet (dashed blue line in Fig. 3b) (Kuang et al., 2007). Their temporal coefficients show consistent interannual fluctuations (Fig. 3c) with a high correlation coefficient of 0.81, passing the 0.01 significance level, implying the strong effect of TP thermal forcing on interannual variations over China. The spatial distributions of heterogeneous correlations in SVD1 reveal that the interannual positive anomalies of the heat sources over the central and eastern TP are tightly associated with the positive anomalies in the STT frequency along the northern branch of the westerly jet over northern China and the downturn anomalies along the southern branch over the lower-latitude regions of China, and vice versa, indicating the reverse effect of the TP thermal forcing on STT frequency variations over northern and southern China. Compared with the first mode of SVD, the second mode presents different heterogeneous correlation patterns and normalized time series of temporal coefficients (Fig. 4). The heterogeneous correlations of the TP thermal forcing are featured with the significantly positive values centered over the western TP and the negative values over small areas in the northeastern TP and southeastern edge of the TP (Fig. 4a), which are recognized as the key regions for the western enhancing and eastern declining STT over China and the Asian region (Fig. 4b); especially the positive heterogeneous correlations of STT frequency are concentrated over the North China Plain in eastern China with the significantly positive values (Fig. 4b), indicating that the North China plain is the key region of STT variations influenced by the key regions of TP thermal forcing in the second mode.
The dynamic atmospheric processes leading to stratospheric intrusions are complex. In addition to the Brewer–Dobson circulation, tropopause folds and upper-tropospheric vortex processes play a significant role. A large amount of STT occurs through atmospheric dynamics in tropopause folds with mid-latitude westerly troughs and the cut-off lows in the upper-tropospheric vortex processes (Ancellet et al., 1994; Li et al., 2015; Meng et al., 2022; Luo et al., 2024). Ozone STT events often involve the interaction of tropopause folds, long-range transport, and turbulent dynamics, spanning spatial scales of over 1000 km for transport processes and approximately 100 km for tropopause folds. The transport of stratospheric ozone in vertical layers, with transit times ranging from longer residence times (e.g., >10 d) thousands of kilometers away to shorter times (lasting less than 2 d) in the troposphere, can result from slow indirect STT and rapid direct STT ozone intrusions into the lower troposphere (Zanis et al., 1999; Eisele et al., 1999), and the important distinction of ozone intrusions between direct and indirect STT is also addressed in the numerical study by Škerlak et al. (2019). The impacts of direct intrusions of stratospheric ozone on central and eastern China are more pronounced at daily timescales and confined to limited areas, whereas indirect intrusions of stratospheric ozone originate from remote regions thousands of kilometers away, evenly distributed latitudinally along the westerlies between 40° and 70° N (Meng et al., 2024). Considering the difference in the spatial extent of key regions with positive STT anomalies over China and its surroundings between the first and second SVD modes (Figs. 3b and 4b), the key region of TP thermal forcing in the second mode could induce the more direct stratospheric intrusion with the direct STT from the North China Plain to the troposphere over central and central China, while the key region of TP thermal forcing in the first mode could build the indirect pathways of stratospheric ozone intrusions to the troposphere over central and eastern China indirectly from thousands of kilometers away from the key STT along the extratropical westerly jet. The regional anomalies in TP thermal forcing could alter the direct and indirect pathways of stratospheric ozone intrusions to the troposphere over China.
Although the TP covers a smaller region compared to the broader Asian monsoon region, the thermal forcing over the TP, as “the world roof”, is the decisive factor in the formation of the Asian monsoon anticyclone and plays a significant role in building the Asian monsoons (Wu et al., 2015; Duan et al., 2024; Xu et al., 2010). Figures 3a and 4a encompass the region from 78–103° E and 28–38° N, covering most areas with elevations exceeding 3000 m, which are identified as the extent of the TP (Xu et al., 2016). Moreover, the areas with heterogeneous correlations passing the significance test are primarily concentrated over the TP region, including the TP platform within the 3000 m elevation border (black line) and some regions of the TP slopes near the TP platform. Therefore, our study focuses on this region to investigate the relationship between TP thermal forcing and STT variations. Previous studies have indicated that the thermal effects of the TP influence the weather and climate patterns in China by modulating the strength and position of the westerly jet (Wu et al., 2007; Liu et al., 2020; Tan et al., 2023). The first mode of SVD accurately captures the changes in STT occurrences along the northern and southern branches of the westerly jet and the connection with the TP heat sources. Considering that SVD1 is the predominant decomposition mode, accounting for 31.59 % of the total variance, representing the main change pattern, our analysis hereby focuses on the ozone STT flux changes as depicted by SVD1 and explores the meteorological mechanism of the cause–effect relationship in the following sections.
3.3 Anomalies of ozone STT flux induced by the TP thermal forcing
The AMJ-averaged ozone STT flux during 1980–2014 has a spatial distribution similar to the STT frequency over China (Fig. 2). In general, the high values of ozone STT flux are concentrated along the upper-tropospheric westerly jet during AMJ over China, including the North China Plain (NCP), northeast China, and northwestern parts of China, as well as in the southern and western TP edges, while the lower ozone STT flux values are located in southern China, exhibiting an overall spatial pattern of two branches of high ozone STT flux along the southern and northern branches of the westerly jet around the TP (Fig. 5a).
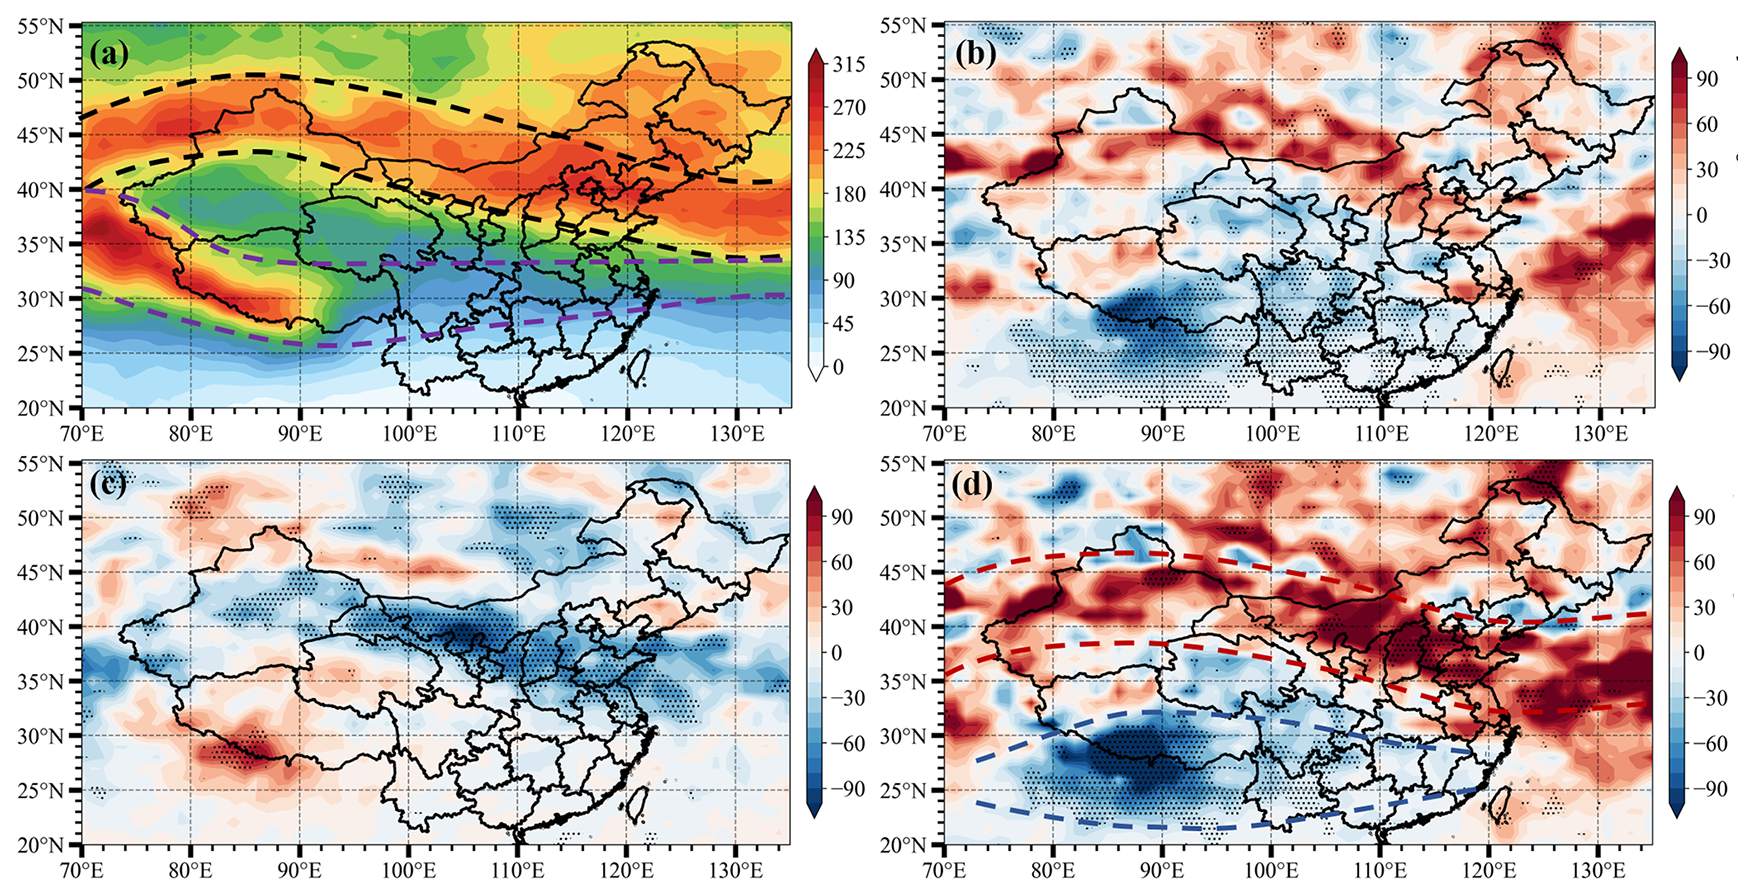
Figure 5(a) The AMJ-averaged ozone STT flux () during 1980–2014. Composite anomalies of ozone STT flux () during (b) positive years, (c) negative years, and (d) their differences. Dashed lines denote the northern and southern branches of ozone STT flux, respectively. Black dots indicate the composite anomalies passing the 90 % confidence level based on the Student t test.
A composite analysis was utilized to characterize the spatial patterns of ozone STT flux change with the TP thermal anomalies. Based on the normalized temporal coefficients of TP thermal forcing in SVD1 (Fig. 3c), the years with Q1 greater and less than 1 standard deviation during AMJ were selected as the positive and negative Q1 anomaly years, respectively. Thus, 4 positive Q1 years (1995, 1999, 2009, and 2014) and 6 negative Q1 years (1980, 1983, 1984, 1986, 1987, and 2011) are selected for the following composite analysis on anomalies of ozone STT flux induced by the TP thermal forcing.
The reverse patterns of spatial distributions in the composite anomalies of ozone STT flux over China are presented in positive and negative Q1 years (Fig. 5b and c). The positive anomalies of TP thermal forcing induce the positive anomalies of ozone STT flux along the northern branch westerly jet over northern China and negative ones in central and southern China along the southern branch (Fig. 5b), whereas the negative anomalies of TP thermal forcing trigger the opposite anomalies of ozone STT flux over China compared to the positive anomalies of TP thermal forcing (Fig. 5c).
The differences in the ozone STT flux anomalies during AMJ between positive and negative Q1 years exhibit a prominent spatial dipole pattern, characterized by positive anomalies in the north and negative anomalies in the south over China, with large areas passing the significance test (Fig. 5d), confirming spatial patterns of TP thermal forcing influencing the STT of ozone over China revealed by the SVD analysis of STT frequency (Fig. 3b). It is noteworthy that the large positive anomalies exist in northern China with climatologically high ozone STT flux, while negative anomalies are centered in southern China with relatively low ozone STT flux (Fig. 5a and d), indicating that the strong TP thermal forcing exerts reverse impacts on interannual variations of ozone STT along the southern and northern branches of the westerly jet, exacerbating the north–south gradient of ozone STT flux.
To further quantify the impact of TP thermal forcing on ozone STT flux, we calculated the regional averages of ozone STT flux changes over the northern branch (78–120° E, 35–45° N) with significant positive anomalies and the southern branch (78–120° E, 21–31° N) with prominent negative anomalies (Fig. 5d). The AMJ regional average of ozone STT flux in the northern branch reaches up to 180.34 , which is over twice the regional value of 73.71 in the southern branch (Table 1). With the most positive anomalies of TP thermal forcing, the composite anomalies in ozone STT flux are estimated at 14.73 kg with an increase rate of 8.17 % in the northern branch and 23.23 kg with a reduction rate of 31.52 % in the southern branch relative to the climatological AMJ averages (Table 1). The positive anomalies of the TP thermal forcing could enhance ozone STT over northern China and reduce ozone STT over southern China. In contrast, the composite anomalies of ozone STT flux present the opposite patterns over China during AMJ, with the most negative anomalies of TP thermal forcing, with the regional decrease estimated at 24.64 kg and a change rate of −13.66 % in the northern branch and an increase of 7.54 with a change rate of 10.23 % in the southern branch (Table 1). The negative anomalies of the TP thermal forcing could weaken ozone STT flux over northern China and aggravate ozone STT over southern China.
Table 1The averages (), the changes (), and the relative contributions (changes/averages in %) of ozone STT flux over the northern (78–120° E, 35–45° N) and southern (78–120° E, 21–31° N) branches induced by the most positive and negative anomalies of TP thermal forcing during AMJ of 1980–2014.
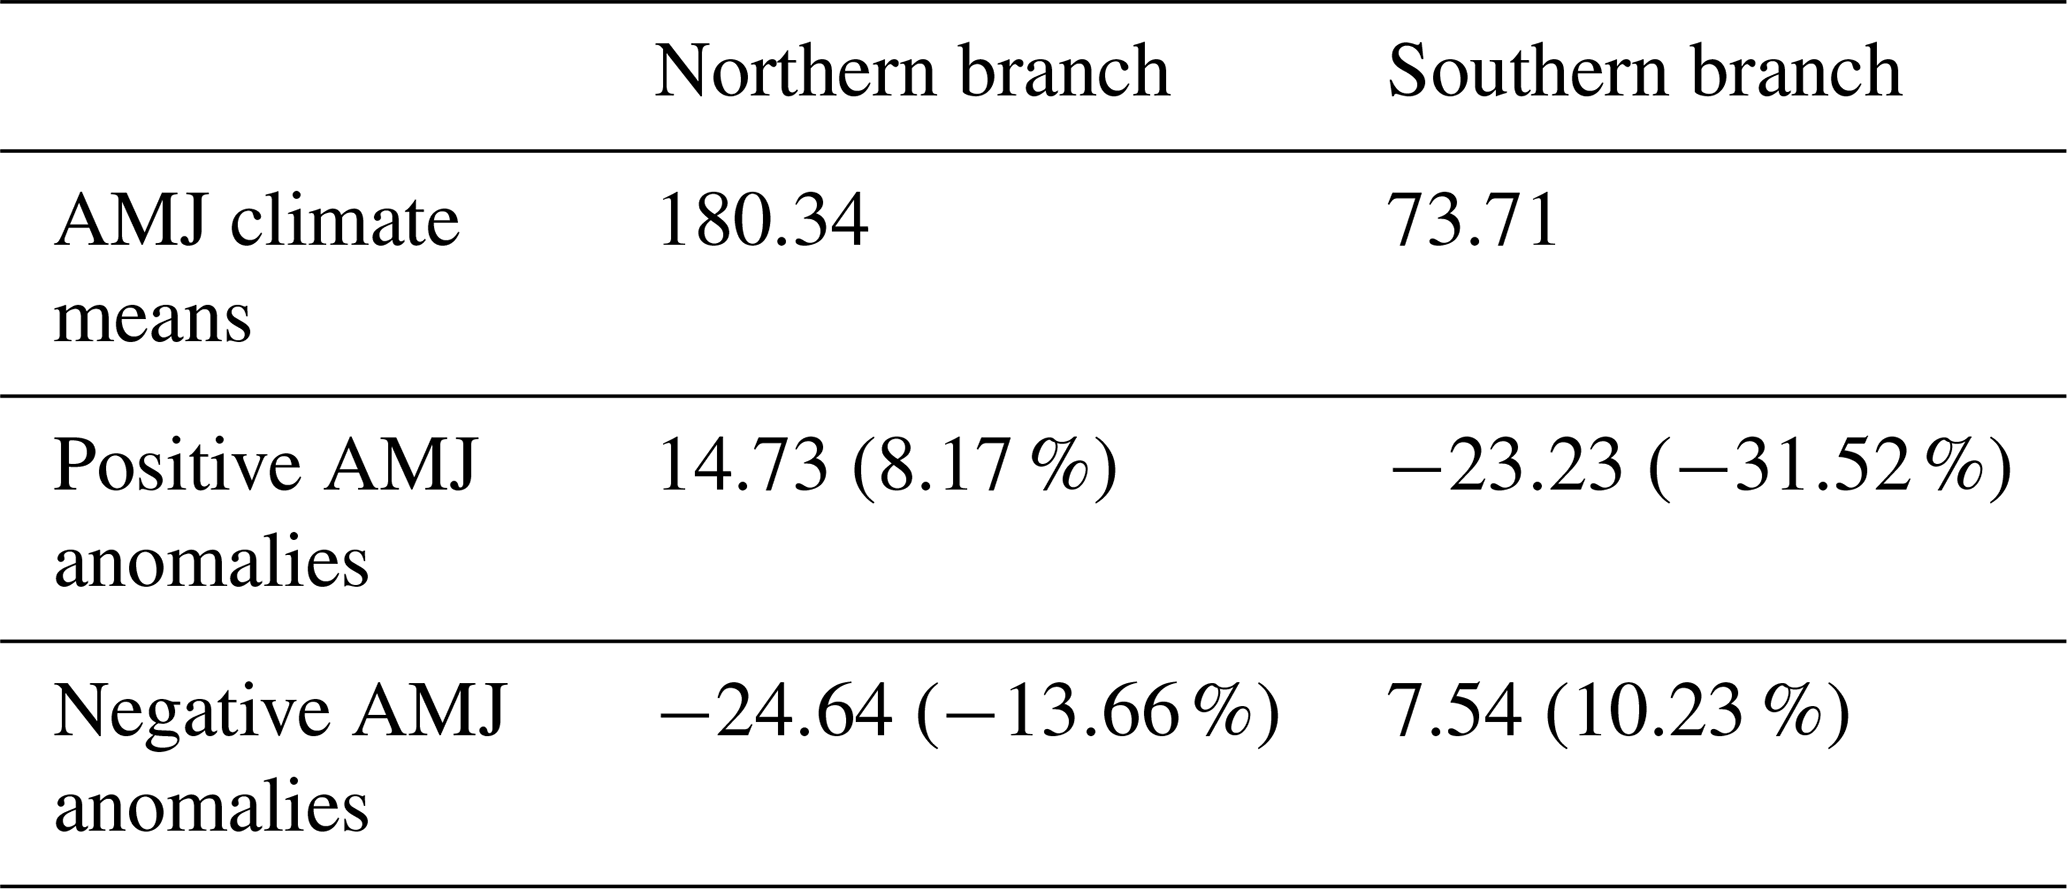
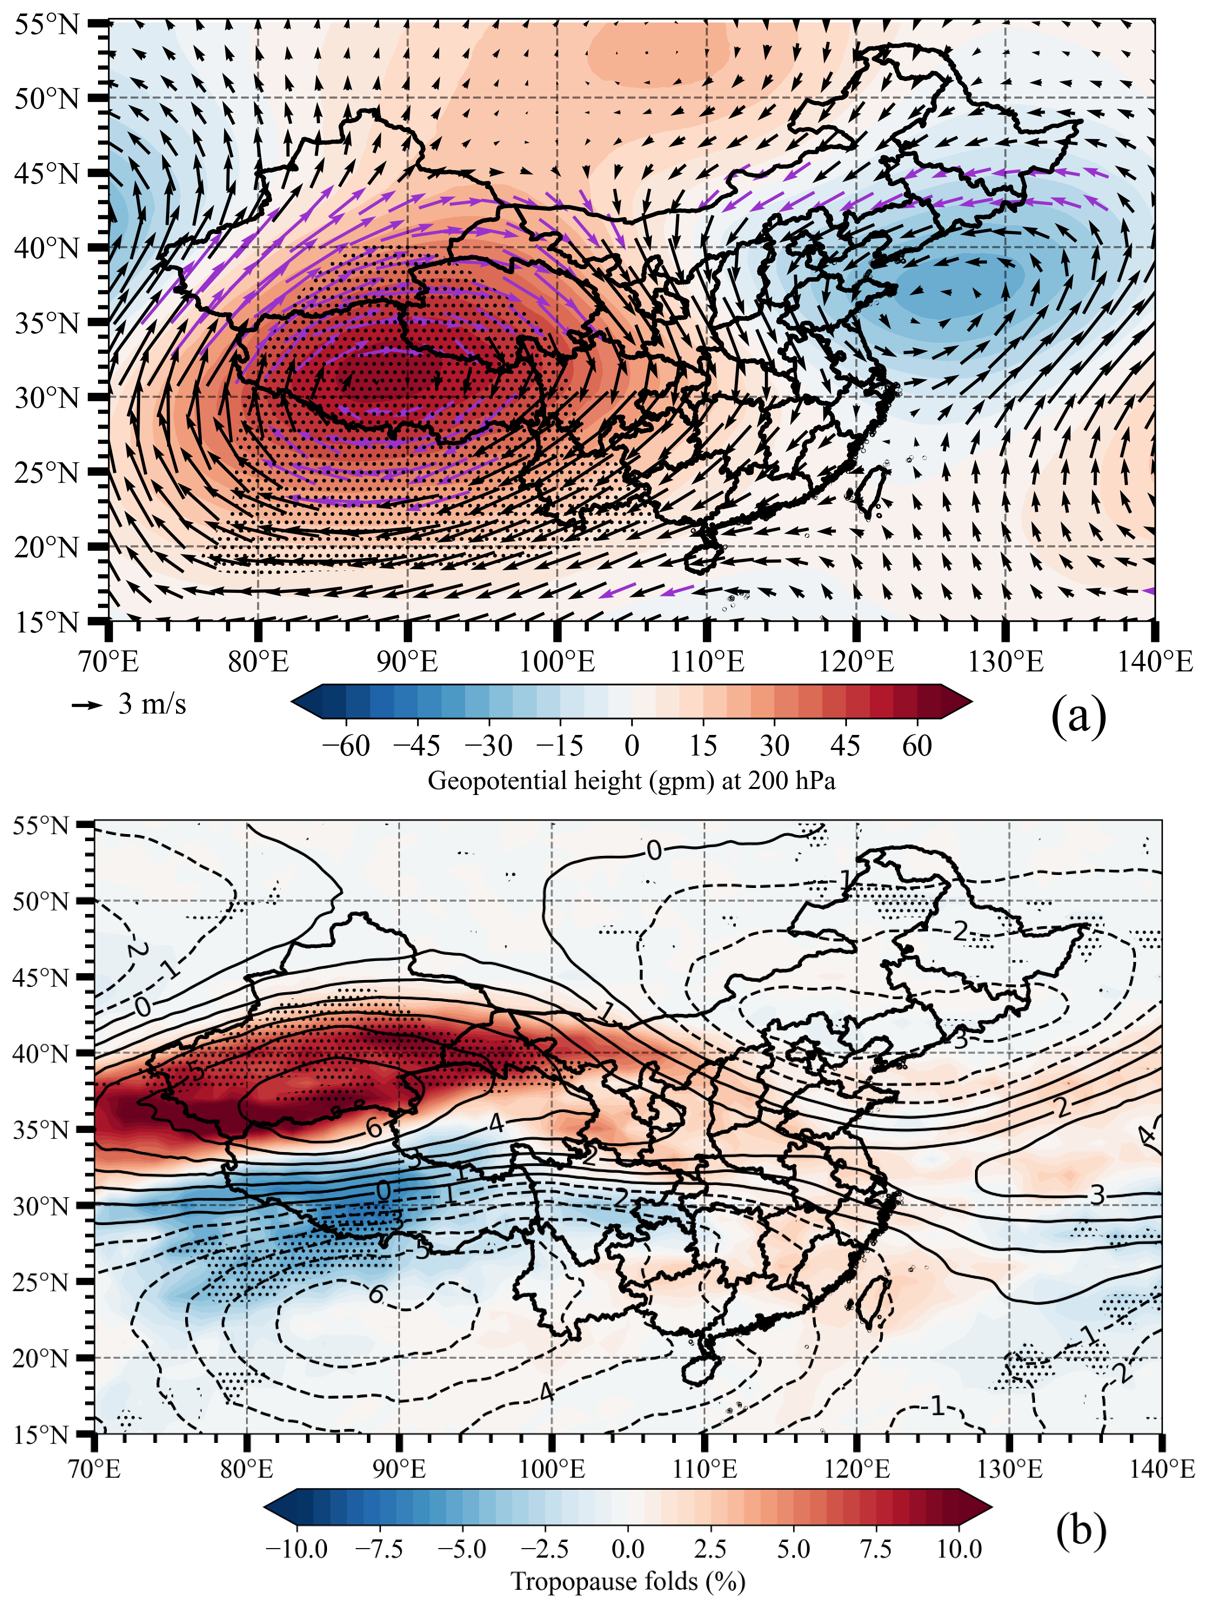
Figure 6Composite differences in (a) geopotential height (shaded, gpm) and wind vectors at 200 hPa and (b) tropopause fold frequency (shaded, %) and zonal wind speed at 200 hPa (contour, m s−1) with solid (dashed) contours representing an enhancement (attenuation) in the westerly jet. Black dots and purple vectors indicate the composite anomalies passing the 90 % confidence level based on the Student t test.
3.4 Meteorological mechanism of TP thermal effect on STT
The thermal effect of TP can generate large-scale vertical convection with a shallow cyclonic circulation in the lower troposphere and deep anticyclonic circulation in the UTLS (Duan and Wu, 2005; Wu, 2000), playing a decisive role in the formation and maintenance of the South Asian High and changes in upper-level wind fields (Ge et al., 2018; Liu et al., 2001; Ren et al., 2019). Since the STT frequency and ozone flux over China are closely linked to the westerly jet (Hsu et al., 2005; Lee et al., 2024), the changes in the upper-level westerly jet could be an important meteorological mechanism of the thermal effect over the TP on ozone STT flux over China.
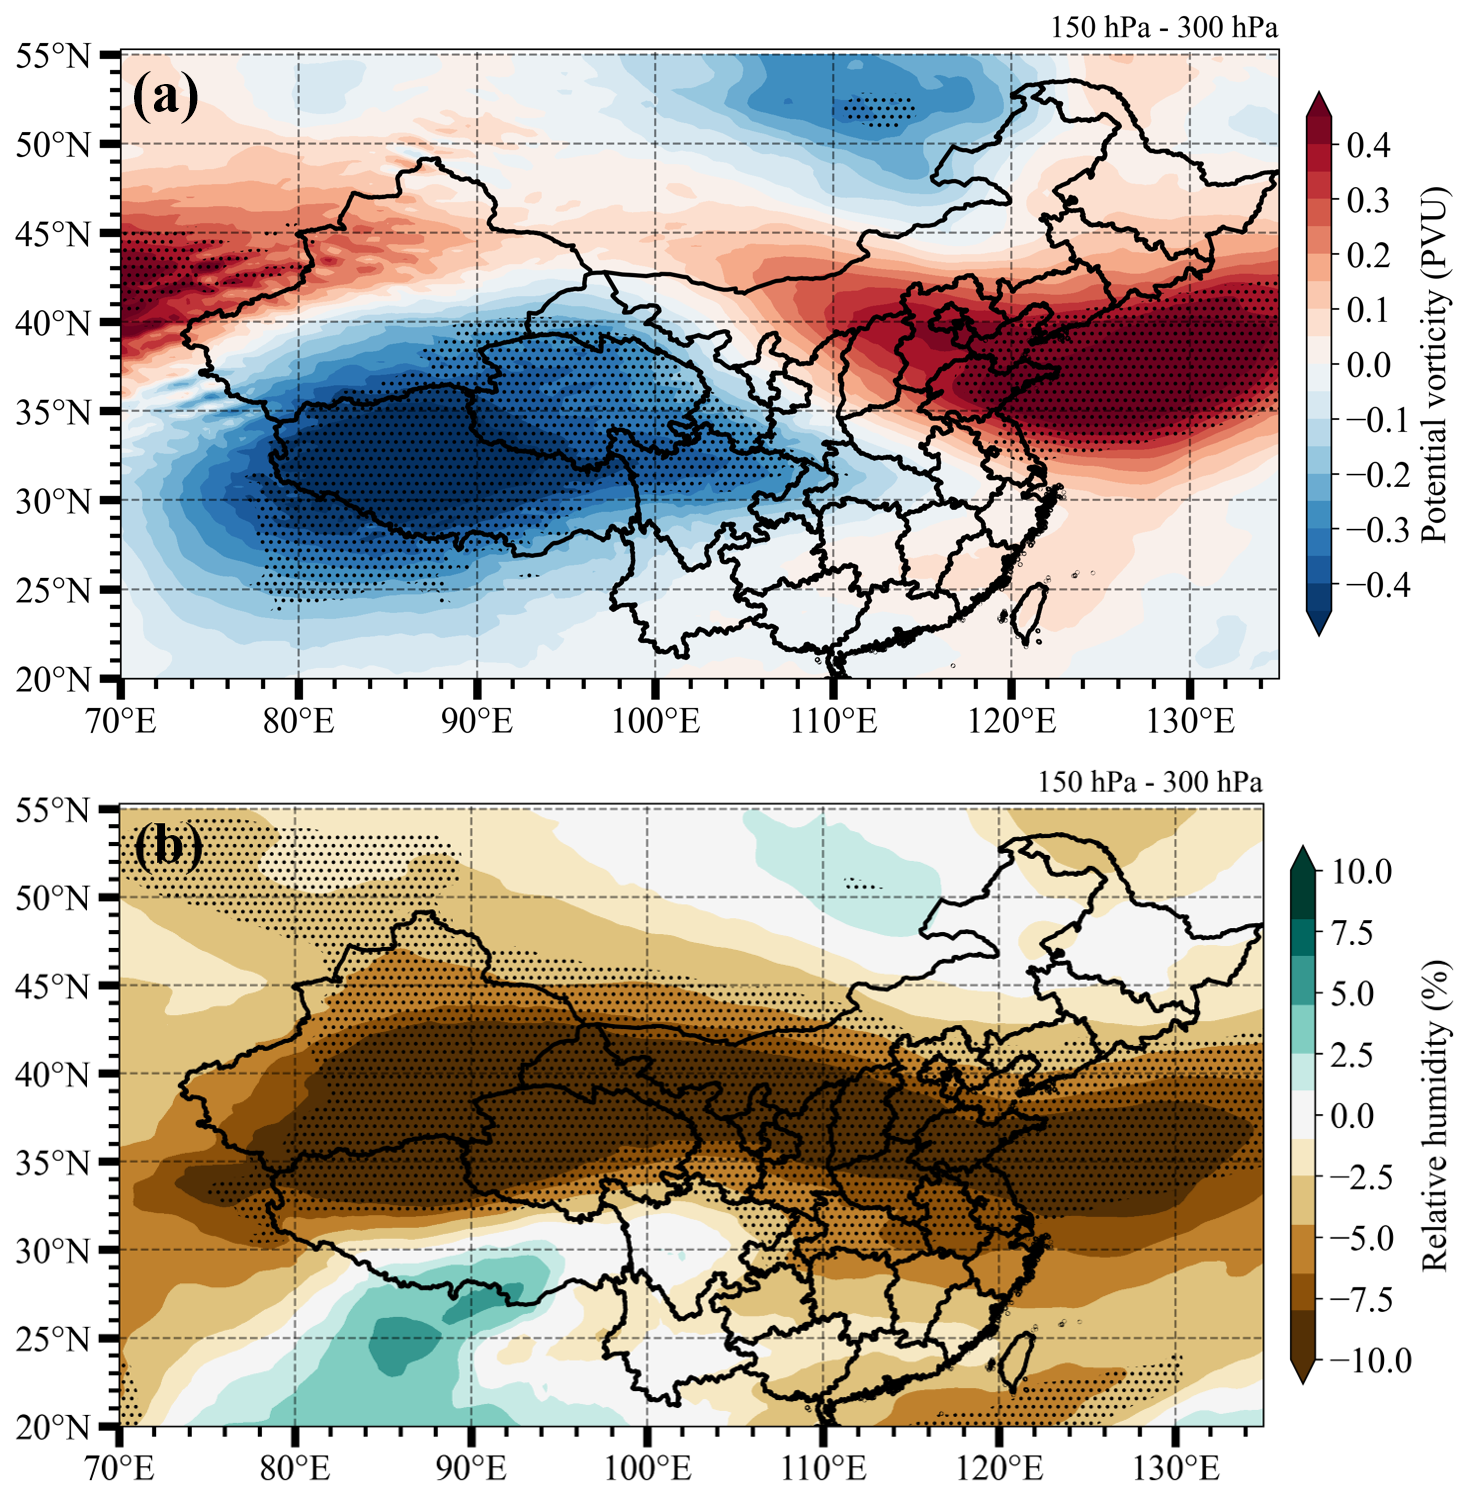
Figure 7Composite differences in (a) potential vorticity (PVU) and (b) relative humidity (%) averaged in the UTLS from 150–300 hPa between positive and negative Q1 anomaly years. Black dots indicate the composite anomalies passing the 90 % confidence level based on the Student t test.
As is shown in Fig. 6, the anomalous strong thermal forcing of the TP triggered the UTLS circulation pattern (200 hPa) with the anticyclonic anomalies over the TP and the cyclonic anomalies in northeastern China, generating anomalous westerlies to the north of the anticyclone and anomalous easterlies to the south of the TP (Fig. 6a), increasing and weakening the intensity and meridional structure of the northern and southern branches of the westerly jet, respectively. Subsequently, such a pattern of anomalous structures of the upper-level westerlies enhances (weakens) the tropopause folds (Fig. 6b) along the northern (southern) branch of the westerly jet for more (less) STT frequency and ozone flux over China and surrounding regions.
Potential vorticity (PV) and relative humidity (RH) are essential meteorological indicators for STT in tropopause folds. A typical tropopause fold is always characterized by elevated PV values and decreased RH values near or below the tropopause (James et al., 2003; Kim and Lee, 2010). Since the interannual variations in AMJ-averaged TP thermal forcing can change the intensity and meridional structures of the upper-tropospheric westerly jet for the tropopause folds, the meteorological mechanism of the TP thermal forcing affecting STT could be explored with the PV and RH changes in the UTLS induced by the atmospheric heating anomalies over the TP.
The composite PV and RH differences averaged in the UTLS between the positive and negative anomaly years of the TP thermal forcing exhibited similar spatial patterns to the heterogeneous correlations of STT frequency in SVD1 (Fig. 3b) and the anomalies of ozone STT ozone flux over China (Fig. 5d), which are induced by the changes of TP thermal forcing. There are significant positive (negative) PV (Fig. 7a) and negative (positive) RH anomalies (Fig. 7b) in the UTLS over China along the northern (southern) branch of the westerly jet, revealing the meteorological mechanisms of STT changes, with the tropopause folds affected by the TP thermal anomalies.
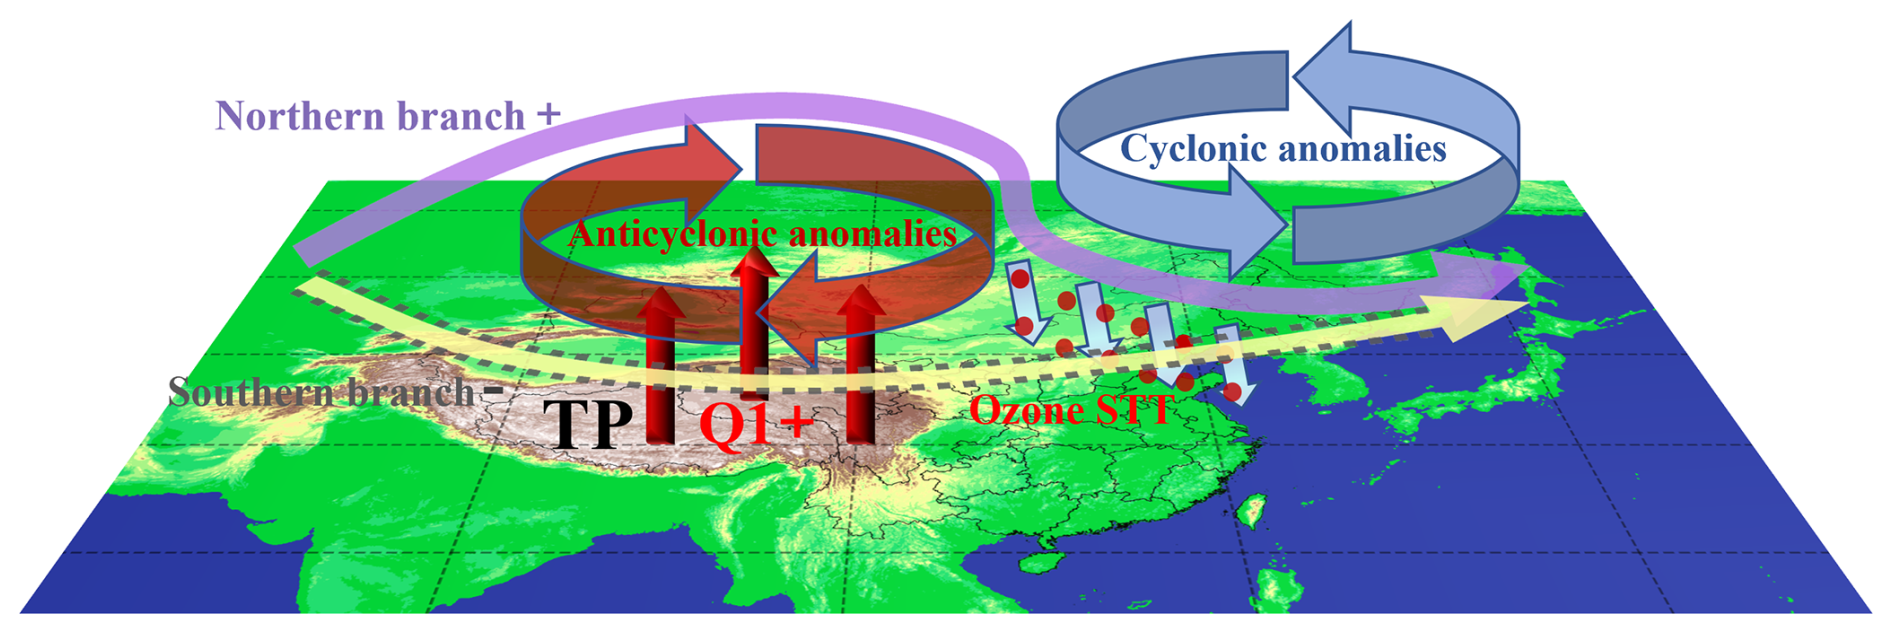
Figure 8Diagram of the meteorological mechanism of ozone STT change along the southern and northern branches of the westerly jet over China and the surrounding Asian region, with anticyclonic and cyclonic anomalies in the UTLS induced by the Tibetan Plateau (TP) thermal forcing (Q1), where “+” and “–” indicate enhancement and attenuation, respectively.
The TP topographic forcing plays an important role in global and regional climate, as well as environmental changes. However, the TP thermal effect on the interannual changes in ozone STT over China has not been extensively studied. Therefore, in this study, based on the STT frequency and ozone flux dataset and ERA5 data meteorological reanalysis for 1980–2014, the interannual variations in STT of ozone over China induced by the TP thermal forcing were investigated. The main results are concluded as follows.
The STT frequency in the Asian regions exhibits a distinct seasonal cycle with monthly changes. High STT frequency is concentrated in late spring and early summer of April, May, and June, covering areas along the northern and southern branches of the westerly jet around the TP over the Asian region. Through SVD diagnostic analysis, we identified a synergistic relationship between interannual variations of TP thermal forcing and STT frequency. The intensifying thermal forcing in the central and eastern TP is closely linked to increasing and decreasing STT frequency, respectively, along the northern and southern branches of the westerly jet, while the enhancing thermal forcing over the western TP is related to the western enhancement and eastern decline of STT over China and surrounding regions. The thermal forcing changes over the TP regions could regulate the interannual STT anomalies over China by altering the direct and indirect pathways of ozone STT. This study reveals a unique driver of the TP thermal forcing on the interannual variations of ozone STT with diverse structures, providing insight into the TP effect on the atmospheric environment and climate changes.
Stronger TP thermal forcing leads to an increase in ozone STT flux by 14.73 (8.17 %) along the northern branch and a decrease of 23.23 (31.52 %) along the southern branch of the westerly jet over China, while weak TP thermal forcing induces the ozone STT flux decrease of 24.64 (13.66 %) in the northern branch and the increase of 7.54 (10.23 %) in the southern branch, indicating the contrasting effects of TP thermal anomalies on the regional ozone STT changes in northern and southern China.
The meteorological mechanism of TP thermal effects on ozone STT along the southern and northern branches of the westerly jet around the TP is proposed in Fig. 8. The intensifying thermal forcing over the TP could induce an anomalous anticyclonic circulation in the UTLS over the TP and an anomalous cyclonic circulation in northeastern China. The anomalous circulations upraise the ridge of the northern branch, deepening the downwind East Asia trough along the westerly jet and filling the southern branch trough of the westerly jet, which could alter the intensity and structure of the northern and southern branches of the westerly jet, respectively, enhancing and weakening the tropopause folds along the northern and southern branches of the westerly jet for more and less STT of ozone over China and surrounding regions.
The distinct structures of interannual STT anomalies, with the key areas of TP thermal forcing, are identified based on the 35-year climatological statistics in this study, with the implication of tropospheric ozone change with the TP effects. In future studies, the effects of multiple climatic factors with multiscale variations could be considered to improve our understanding. Moreover, the fine observational network over the TP complex terrain could improve the assessment of the TP thermal forcing and regional climate change. Further investigation of climate modulation of the TP of ozone STT requires updated climate models with comprehensive processes of atmospheric physics and chemistry.
Data used in this paper can be provided upon request from Qingjian Yang (yangqj@nuist.edu.cn) or Tianliang Zhao (tlzhao@nuist.edu.cn).
QY: data curation, methodology, investigation, writing – original draft. TZ: conceptualization, methodology, writing – review and editing. YB and KM: conceptualization, methodology. YL, ZT, XS, WF, KY, and JH: investigation, conceptualization. All authors commented on the paper.
The contact author has declared that none of the authors has any competing interests.
Publisher's note: Copernicus Publications remains neutral with regard to jurisdictional claims made in the text, published maps, institutional affiliations, or any other geographical representation in this paper. While Copernicus Publications makes every effort to include appropriate place names, the final responsibility lies with the authors.
The authors are sincerely grateful to Michael Sprenger, the atmospheric dynamics group at ETH Zürich, and ECMWF for providing open-access environmental and meteorological data. We also wish to thank the two anonymous reviewers for their constructive comments that improved the clarity of the manuscript.
This research was supported by the National Key Research and Development Program of China (grant no. 2022YFC3701204), the National Natural Science Foundation of China (grant nos. 42275196 and 42475195), and the Postgraduate Research and Practice Innovation Program of Jiangsu Province (grant no. KYCX23_1317).
This paper was edited by Ewa Bednarz and reviewed by two anonymous referees.
Akritidis, D., Pozzer, A., Zanis, P., Tyrlis, E., Škerlak, B., Sprenger, M., and Lelieveld, J.: On the role of tropopause folds in summertime tropospheric ozone over the eastern Mediterranean and the Middle East, Atmos. Chem. Phys., 16, 14025–14039, https://doi.org/10.5194/acp-16-14025-2016, 2016.
Ancellet, G., Beekmann, M., and Papayannis, A.: Impact of a cutoff low development on downward transport of ozone in the troposphere, J. Geophys. Res.-Atmos., 99, 3451–3468, https://doi.org/10.1029/93JD02551, 1994.
Chen, W., Liao, H., and Seinfeld, J. H.: Future climate impacts of direct radiative forcing of anthropogenic aerosols, tropospheric ozone, and long-lived greenhouse gases, J. Geophys. Res., 112, 2006JD008051, https://doi.org/10.1029/2006JD008051, 2007.
Cressman, G. P.: Circulations of the West Pacific jet stream, Mon. Weather Rev., 109, 2450–2463, https://doi.org/10.1175/1520-0493(1981)109<2450:COTWPJ>2.0.CO;2, 1981.
Ding, A. and Wang, T.: Influence of stratosphere-to-troposphere exchange on the seasonal cycle of surface ozone at Mount Waliguan in western China, Geophys. Res. Lett., 33, L03803, https://doi.org/10.1029/2005GL024760, 2006.
Dong, M. and Yu, J.: A simulation study for the influences of Tibetan Plateau spring snow cover on the general circulation, J. Appl. Meteor. Sci., 8, 100–109, 1997.
Duan, A. and Wu, G.: Role of the Tibetan Plateau thermal forcing in the summer climate patterns over subtropical Asia, Clim. Dynam., 24, 793–807, https://doi.org/10.1007/s00382-004-0488-8, 2005.
Duan, A., Wu, G., Wang, B., Turner, A. G., Hu, J., Hu, W., Zhang, P., Hu, D., and Tang, Y.: Drivers of East Asian summer monsoon variability: Global oceans and the Tibetan Plateau, Sci. Bull., 69, 2487–2490, https://doi.org/10.1016/j.scib.2024.06.020, 2024.
Eisele, H., Scheel, H., Sladkovic, R., and Trickl, T.: High-resolution lidar measurements of stratosphere–troposphere exchange, J. Atmos. Sci., 56, 319–330, https://doi.org/10.1175/1520-0469(1999)056<0319:HRLMOS>2.0.CO;2, 1999.
Feng, Z., Hu, E., Wang, X., Jiang, L., and Liu, X.: Ground-level O3 pollution and its impacts on food crops in China: a review, Environ. Pollut., 199, 42–48, 2015.
Ge, J., You, Q., and Zhang, Y.: The influence of the Asian summer monsoon onset on the northward movement of the South Asian high towards the Tibetan Plateau and its thermodynamic mechanism, Int. J. Climatol., 38, 543–553, https://doi.org/10.1002/joc.5192, 2018.
Hersbach, H., Bell, B., Berrisford, P., Hirahara, S., Horányi, A., Muñoz-Sabater, J., Nicolas, J., Peubey, C., Radu, R., Schepers, D., Simmons, A., Soci, C., Abdalla, S., Abellan, X., Balsamo, G., Bechtold, P., Biavati, G., Bidlot, J., Bonavita, M., De Chiara, G., Dahlgren, P., Dee, D., Diamantakis, M., Dragani, R., Flemming, J., Forbes, R., Fuentes, M., Geer, A., Haimberger, L., Healy, S., Hogan, R. J., Hólm, E., Janisková, M., Keeley, S., Laloyaux, P., Lopez, P., Lupu, C., Radnoti, G., de Rosnay, P., Rozum, I., Vamborg, F., Villaume, S., and Thépaut, J.-N.: The ERA5 global reanalysis, Q. J. Roy. Meteor. Soc., 146, 1999–2049, https://doi.org/10.1002/qj.3803, 2020.
Hsu, J., Prather, M. J., and Wild, O.: Diagnosing the stratosphere-to-troposphere flux of ozone in a chemistry transport model, J. Geophys. Res.-Atmos., 110, D19305, https://doi.org/10.1029/2005JD006045, 2005.
James, P., Stohl, A., Forster, C., Eckhardt, S., Seibert, P., and Frank, A.: A 15 year climatology of stratosphere–troposphere exchange with a Lagrangian particle dispersion model: 1. Methodology and validation, J. Geophys. Res.-Atmos., 108, 8519, https://doi.org/10.1029/2002JD002637, 2003.
Kim, J. H. and Lee, H.: What causes the springtime tropospheric ozone maximum over Northeast Asia?, Adv. Atmos. Sci., 27, 543–551, https://doi.org/10.1007/s00376-009-9098-z, 2010.
Kuang, X., Zhang, Y., and Liu, J.: Seasonal variations of the East Asian subtropical westerly jet and the thermal mechanism, J. Meteorol. Res.-PRC, 21, 192–203, 2007.
Lee, J., Wu, Y., and Wang, X.: The Evolutions and Large-Scale Mechanisms of Summer Stratospheric Ozone Intrusion Across Global Hotspots, J. Geophys. Res.-Atmos., 129, e2023JD039877, https://doi.org/10.1029/2023JD039877, 2024.
Li, D., Bian, J., and Fan, Q.: A deep stratospheric intrusion associated with an intense cut-off low event over East Asia, Sci. China Earth Sci., 58, 116–128, https://doi.org/10.1007/s11430-014-4977-2, 2015.
Li, S., Wang, T., Zanis, P., Melas, D., and Zhuang, B.: Impact of Tropospheric Ozone on Summer Climate in China, J. Meteorol. Res., 32, 279–287, https://doi.org/10.1007/s13351-018-7094-x, 2018.
Li, X. and Liu, X.: Numerical simulation of Tibetan Plateau heating anomaly influence on westerly jet in spring, J. Earth Syst. Sci., 124, 1599–1607, https://doi.org/10.1007/s12040-015-0630-5, 2015.
Liu, Y., Wu, G., Liu, H., and Liu, P.: Condensation heating of the Asian summer monsoon and the subtropical anticyclone in the Eastern Hemisphere, Clim. Dynam., 17, 327–338, https://doi.org/10.1007/s003820000117, 2001.
Liu, Y., Li, Y., Huang, J., Zhu, Q., and Wang, S.: Attribution of the Tibetan Plateau to northern drought, Natl. Sci. Rev., 7, 489–492, https://doi.org/10.1093/nsr/nwz191, 2020.
Luo, H. and Yanai, M.: The large-scale circulation and heat sources over the Tibetan Plateau and surrounding areas during the early summer of 1979. Part I: Precipitation and kinematic analyses, Mon. Weather Rev., 111, 922–944, https://doi.org/10.1175/1520-0493(1983)111<0922:TLSCAH>2.0.CO;2, 1983.
Luo, H. and Yanai, M.: The large-scale circulation and heat sources over the Tibetan Plateau and surrounding areas during the early summer of 1979. Part II: Heat and moisture budgets, Mon. Weather Rev., 112, 966–989, https://doi.org/10.1175/1520-0493(1984)112<0966:TLSCAH>2.0.CO;2, 1984.
Luo, Y., Zhao, T., Meng, K., Hu, J., Yang, Q., Bai, Y., Yang, K., Fu, W., Tan, C., Zhang, Y., Zhang, Y., and Li, Z.: A mechanism of stratospheric O3 intrusion into the atmospheric environment: a case study of the North China Plain, Atmos. Chem. Phys., 24, 7013–7026, https://doi.org/10.5194/acp-24-7013-2024, 2024.
Meng, K., Zhao, T., Xu, X., Zhang, Z., Bai, Y., Hu, Y., Zhao, Y., Zhang, X., and Xin, Y.: Influence of stratosphere-to-troposphere transport on summertime surface O3 changes in North China Plain in 2019, Atmos. Res., 276, 106271, https://doi.org/10.1016/j.atmosres.2022.106271, 2022.
Meng, K., Zhao, T., Bai, Y., Wu, M., Cao, L., Hou, X., Luo, Y., and Jiang, Y.: Tracing the origins of stratospheric ozone intrusions: direct vs. indirect pathways and their impacts on Central and Eastern China in spring–summer 2019, Atmos. Chem. Phys., 24, 12623–12642, https://doi.org/10.5194/acp-24-12623-2024, 2024.
Ni, Z.-Z., Luo, K., Gao, X., Gao, Y., Fan, J.-R., Fu, J. S., and Chen, C.-H.: Exploring the stratospheric source of ozone pollution over China during the 2016 Group of Twenty summit, Atmos. Pollut. Res., 10, 1267–1275, https://doi.org/10.1016/j.apr.2019.02.010, 2019.
Nuvolone, D., Petri, D., and Voller, F.: The effects of ozone on human health, Environ. Sci. Pollut. R., 25, 8074–8088, https://doi.org/10.1007/s11356-017-9239-3, 2018.
Oltmans, S., Johnson, B., Harris, J., Thompson, A., Liu, H., Chan, C., Vömel, H., Fujimoto, T., Brackett, V., and Chang, W.: Tropospheric ozone over the North Pacific from ozonesonde observations, J. Geophys. Res.-Atmos., 109, D15S01, https://doi.org/10.1029/2003JD003466, 2004.
Prohaska, J. T.: A technique for analyzing the linear relationships between two meteorological fields, Mon. Weather Rev., 104, 1345–1353, https://doi.org/10.1175/1520-0493(1976)104<1345:ATFATL>2.0.CO;2, 1976.
Ren, R., Zhu, C., and Cai, M.: Linking quasi-biweekly variability of the South Asian high to atmospheric heating over Tibetan Plateau in summer, Clim. Dynam., 53, 3419–3429, https://doi.org/10.1007/s00382-019-04713-4, 2019.
Schoeberl, M. R. and Hartmann, D. L.: The Dynamics of the Stratospheric Polar Vortex and Its Relation to Springtime Ozone Depletions, Science, 251, 46–52, https://doi.org/10.1126/science.251.4989.46, 1991.
Sein, Z. M. M., Zhi, X., Ogou, F. K., Nooni, I. K., Paing, K. H., and Yeboah, E.: Covariability of decadal surface air temperature variability over Myanmar with sea surface temperature based on singular value decomposition analysis, Environ. Res. Lett., 19, 044056, https://doi.org/10/gtqk8c, 2024.
Sillman, S.: 9.11 – Tropospheric Ozone and Photochemical Smog, in: Treatise on Geochemistry, edited by: Holland, H. D. and Turekian, K. K., Pergamon, Oxford, 407–431, https://doi.org/10.1016/B0-08-043751-6/09053-8, 2003.
Škerlak, B., Sprenger, M., and Wernli, H.: A global climatology of stratosphere–troposphere exchange using the ERA-Interim data set from 1979 to 2011, Atmos. Chem. Phys., 14, 913–937, https://doi.org/10.5194/acp-14-913-2014, 2014.
Škerlak, B., Sprenger, M., Pfahl, S., Tyrlis, E., and Wernli, H.: Tropopause folds in ERA-Interim: Global climatology and relation to extreme weather events, J. Geophys. Res.-Atmos., 120, 4860–4877, https://doi.org/10.1002/2014JD022787, 2015.
Škerlak, B., Pfahl, S., Sprenger, M., and Wernli, H.: A numerical process study on the rapid transport of stratospheric air down to the surface over western North America and the Tibetan Plateau, Atmos. Chem. Phys., 19, 6535–6549, https://doi.org/10.5194/acp-19-6535-2019, 2019.
Sprenger, M. and Wernli, H.: A northern hemispheric climatology of cross-tropopause exchange for the ERA15 time period (1979–1993), J. Geophys. Res.-Atmos., 108, 8521, https://doi.org/10.1029/2002JD002636, 2003.
Stohl, A., Bonasoni, P., Cristofanelli, P., Collins, W., Feichter, J., Frank, A., Forster, C., Gerasopoulos, E., Gäggeler, H., and James, P.: Stratosphere–troposphere exchange: A review, and what we have learned from STACCATO, J. Geophys. Res.-Atmos., 108, 8516, https://doi.org/10.1029/2002JD002490, 2003.
Tan, Z., Liu, Y., Shao, T., Luo, R., Luo, M., and Xie, Y.: Association between Tibetan Heat Sources and Heat Waves in China, J. Climate, 36, 7905–7924, https://doi.org/10.1175/JCLI-D-22-0568.1, 2023.
Tyrlis, E., Škerlak, B., Sprenger, M., Wernli, H., Zittis, G., and Lelieveld, J.: On the linkage between the Asian summer monsoon and tropopause fold activity over the eastern Mediterranean and the Middle East, J. Geophys. Res.-Atmos., 119, 3202–3221, https://doi.org/10.1002/2013JD021113, 2014.
Wang, C., Yang, K., Li, Y., Wu, D., and Bo, Y.: Impacts of Spatiotemporal Anomalies of Tibetan Plateau Snow Cover on Summer Precipitation in Eastern China, J. Climate, 30, 885–903, https://doi.org/10.1175/JCLI-D-16-0041.1, 2017.
Wu, G.: Thermal adaptation, overshooting, dispersion, and subtropical anticyclone Part I: Thermal adaptation and overshooting. Chinese, J. Atmos. Sci., 24, 433–446, 2000.
Wu, G., Liu, Y., Zhang, Q., Duan, A., Wang, T., Wan, R., Liu, X., Li, W., Wang, Z., and Liang, X.: The influence of mechanical and thermal forcing by the Tibetan Plateau on Asian climate, J. Hydrometeorol., 8, 770–789, 2007.
Wu, G., Duan, A., Liu, Y., Mao, J., Ren, R., Bao, Q., He, B., Liu, B., and Hu, W.: Tibetan Plateau climate dynamics: recent research progress and outlook, Natl. Sci. Rev., 2, 100–116, https://doi.org/10.1093/nsr/nwu045, 2015.
Wu, G., Liu, Y., He, B., Bao, Q., and Wang, Z.: Review of the impact of the Tibetan Plateau sensible heat driven air-pump on the Asian summer monsoon, Chin. J. Atmos. Sci, 42, 488–504, https://doi.org/10.3878/j.issn.1006-9895.1801.17279, 2018.
Xu, H., Liang, X.-Z., and Xue, Y.: Regional climate modeling to understand Tibetan heating remote impacts on East China precipitation, Clim. Dynam., 62, 2683–2701, https://doi.org/10.1007/s00382-022-06266-5, 2024.
Xu, X., Lu, C., Shi, X., and Ding, Y.: Large-scale topography of China: A factor for the seasonal progression of the Meiyu rainband?, J. Geophys. Res.-Atmos., 115, D02110, https://doi.org/10.1029/2009JD012444, 2010.
Xu, X., Zhao, T., Liu, F., Gong, S. L., Kristovich, D., Lu, C., Guo, Y., Cheng, X., Wang, Y., and Ding, G.: Climate modulation of the Tibetan Plateau on haze in China, Atmos. Chem. Phys., 16, 1365–1375, https://doi.org/10.5194/acp-16-1365-2016, 2016.
Yanai, M., Esbensen, S., and Chu, J.-H.: Determination of bulk properties of tropical cloud clusters from large-scale heat and moisture budgets, J. Atmos. Sci., 30, 611–627, https://doi.org/10.1175/1520-0469(1973)030<0611:DOBPOT>2.0.CO;2, 1973.
Yanai, M., Li, C., and Song, Z.: Seasonal Heating of the Tibetan Plateau and Its Effects on the Evolution of the Asian Summer Monsoon, J. Meteorol. Soc. Jpn., 70, 319–351, https://doi.org/10.2151/jmsj1965.70.1B_319, 1992.
Yang, H., Chen, G., Tang, Q., and Hess, P.: Quantifying isentropic stratosphere–troposphere exchange of ozone, J. Geophys. Res.-Atmos., 121, 3372–3387, https://doi.org/10.1002/2015JD024180, 2016.
Yang, Q., Zhao, T., Bai, Y., Wei, J., Sun, X., Tian, Z., Hu, J., Ma, X., Luo, Y., Fu, W., and Yang, K.: Interannual variations in ozone pollution with a dipole structure over Eastern China associated with springtime thermal forcing over the Tibetan Plateau, Sci. Total Environ., 923, 171527, https://doi.org/10.1016/j.scitotenv.2024.171527, 2024.
Yue, X., Unger, N., Harper, K., Xia, X., Liao, H., Zhu, T., Xiao, J., Feng, Z., and Li, J.: Ozone and haze pollution weakens net primary productivity in China, Atmos. Chem. Phys., 17, 6073–6089, https://doi.org/10.5194/acp-17-6073-2017, 2017.
Zanis, P., Schuepbach, E., Gaeggeler, H., Huebener, S., and Tobler, L.: Factors controlling beryllium-7 at Jungfraujoch in Switzerland, Tellus B, 51, 789–805, https://doi.org/10.1034/j.1600-0889.1999.t01-3-00004.x, 1999.
Zhao, K., Huang, J., Wu, Y., Yuan, Z., Wang, Y., Li, Y., Ma, X., Liu, X., Ma, W., Wang, Y., and Zhang, X.: Impact of Stratospheric Intrusions on Ozone Enhancement in the Lower Troposphere and Implication to Air Quality in Hong Kong and Other South China Regions, J. Geophys. Res.-Atmos., 126, e2020JD033955, https://doi.org/10.1029/2020JD033955, 2021.
Zhou, H., Zhang, L., Liu, X., Liang, D., Zhu, Q., and Gou, Y.: Study of the Relationship between High Mountain Asia Snow Cover and Drought and Flood in the Yangtze River Basin during 1980–2019, Remote Sens., 14, 3588, https://doi.org/10.3390/rs14153588, 2022.