the Creative Commons Attribution 4.0 License.
the Creative Commons Attribution 4.0 License.
 | 25 Jul 2025
High-resolution modeling of early contrail evolution from hydrogen-powered aircraft
Annemarie Lottermoser
Simon Unterstrasser
In this study, we investigate the properties of young contrails formed behind hydrogen-powered aircraft, particularly compared to contrails from conventional kerosene combustion. High-resolution simulations of individual contrails are performed using the EULAG-LCM model, a large-eddy simulation model with fully coupled particle-based ice microphysics.
Previous studies on early contrail evolution during the vortex phase have explored a range of meteorological and aircraft-related parameters, but they have focused on contrails with ice crystal numbers and water vapor emissions typical of kerosene combustion.
This study examines the early H2-contrail evolution, starting at a state where ice crystal formation and wake vortex roll-up are complete. Two key parameters are adjusted: the emitted water vapor mass and the number of ice crystals formed during the initial stage. The emitted water vapor varies between 3.7 and 38.6 g per flight meter, depending on the fuel and aircraft type. The initial ice crystal number spans 4 orders of magnitude, from approximately 1010 to 1014 ice crystals per flight meter. Additionally, we extend our atmospheric scenarios to ambient temperatures up to 235 K, as H2 contrails can form under warmer conditions where kerosene plumes typically cannot.
Our results show that vortex phase processes reduce the 4-order-of-magnitude difference in ice crystal number to 2 orders of magnitude. Moreover, relative ice crystal loss increases with increasing ambient temperatures and decreasing relative humidity levels.
Finally, we extend the parameterization of ice crystal loss from a previous study to include scenarios of contrails from hydrogen propulsion systems.
- Article
(3709 KB) - Full-text XML
-
Supplement
(4973 KB) - BibTeX
- EndNote


For conventional kerosene-powered aircraft, the primary exhaust emissions consist of carbon dioxide and water vapor, with approximately 1.26 kg of water vapor emitted per kilogram of fuel burned (Bier et al., 2024). If the ambient atmosphere is sufficiently cold, water supersaturation emerges due to the mixing of the hot exhaust gases with the cold ambient air (Schumann, 1996). This happens within tenths of a second after the emission of the exhaust. Under these conditions and in the case of soot-rich combustion, water vapor condenses onto soot particles in the exhaust, forming water droplets that grow and eventually freeze into contrail ice crystals by homogeneous nucleation (Kärcher et al., 2015). Under ice-supersaturated conditions, these young (i.e., several minutes old) line-shaped contrails can evolve into contrail cirrus clouds, which may persist for several hours (Lewellen et al., 2014; Unterstrasser et al., 2017a). Contrail cirrus has been identified as a significant contributor to aviation-induced radiative forcing. On a global scale, contrail cirrus clouds exert a positive radiative forcing, resulting in a net warming effect on the atmosphere (Burkhardt and Kärcher, 2011; Lee et al., 2021; Bier and Burkhardt, 2022).
Several contrail mitigation strategies are currently under debate, and their mitigation potential is estimated. Adaptations of flight routes can pursue avoiding ice-supersaturated regions, where contrail formation and persistence are likely to happen (Gierens et al., 2020; Lee et al., 2023). Flying in formation reduces the contrail climate impact due to saturation effects (Unterstrasser, 2020; Marks et al., 2021). Moreover, modifying the fuel composition (e.g., by using sustainable aviation fuels – SAFs) can reduce the number of emitted soot particles (Moore et al., 2017). Measurements have demonstrated that using alternative fuel blends can reduce the number of ice crystals formed, as the contrail ice crystals primarily form on the emitted exhaust particles (Bräuer et al., 2021; Voigt et al., 2021). Märkl et al. (2024) found, in the specific case of the ECLIF3 experiment, a 56 % reduction in the ice particle number per mass of burned fuel for 100 % SAF compared to a reference Jet A-1 fuel. The initial ice crystal number is the crucial quantity that controls the contrail radiative effect and life cycle for given meteorological conditions (Unterstrasser and Gierens, 2010; Burkhardt et al., 2018). A systematic reduction in the ice crystal number in contrail cirrus clouds, e.g., triggered by using SAFs, decreases their optical depth and, consequently, their global radiative forcing (Bier et al., 2017; Burkhardt et al., 2018). However, Burkhardt et al. (2018) found that the relationship between the ice crystal number in young contrails and the climate impact of contrail cirrus is nonlinear. Consequently, recent advancements are being explored to reduce the number of emitted particles even further, such as transitioning to hydrogen-powered aircraft. As part of the ZEROe project, Airbus plans to build the first commercial hydrogen-powered aircraft by 2035 (Airbus, 2020).
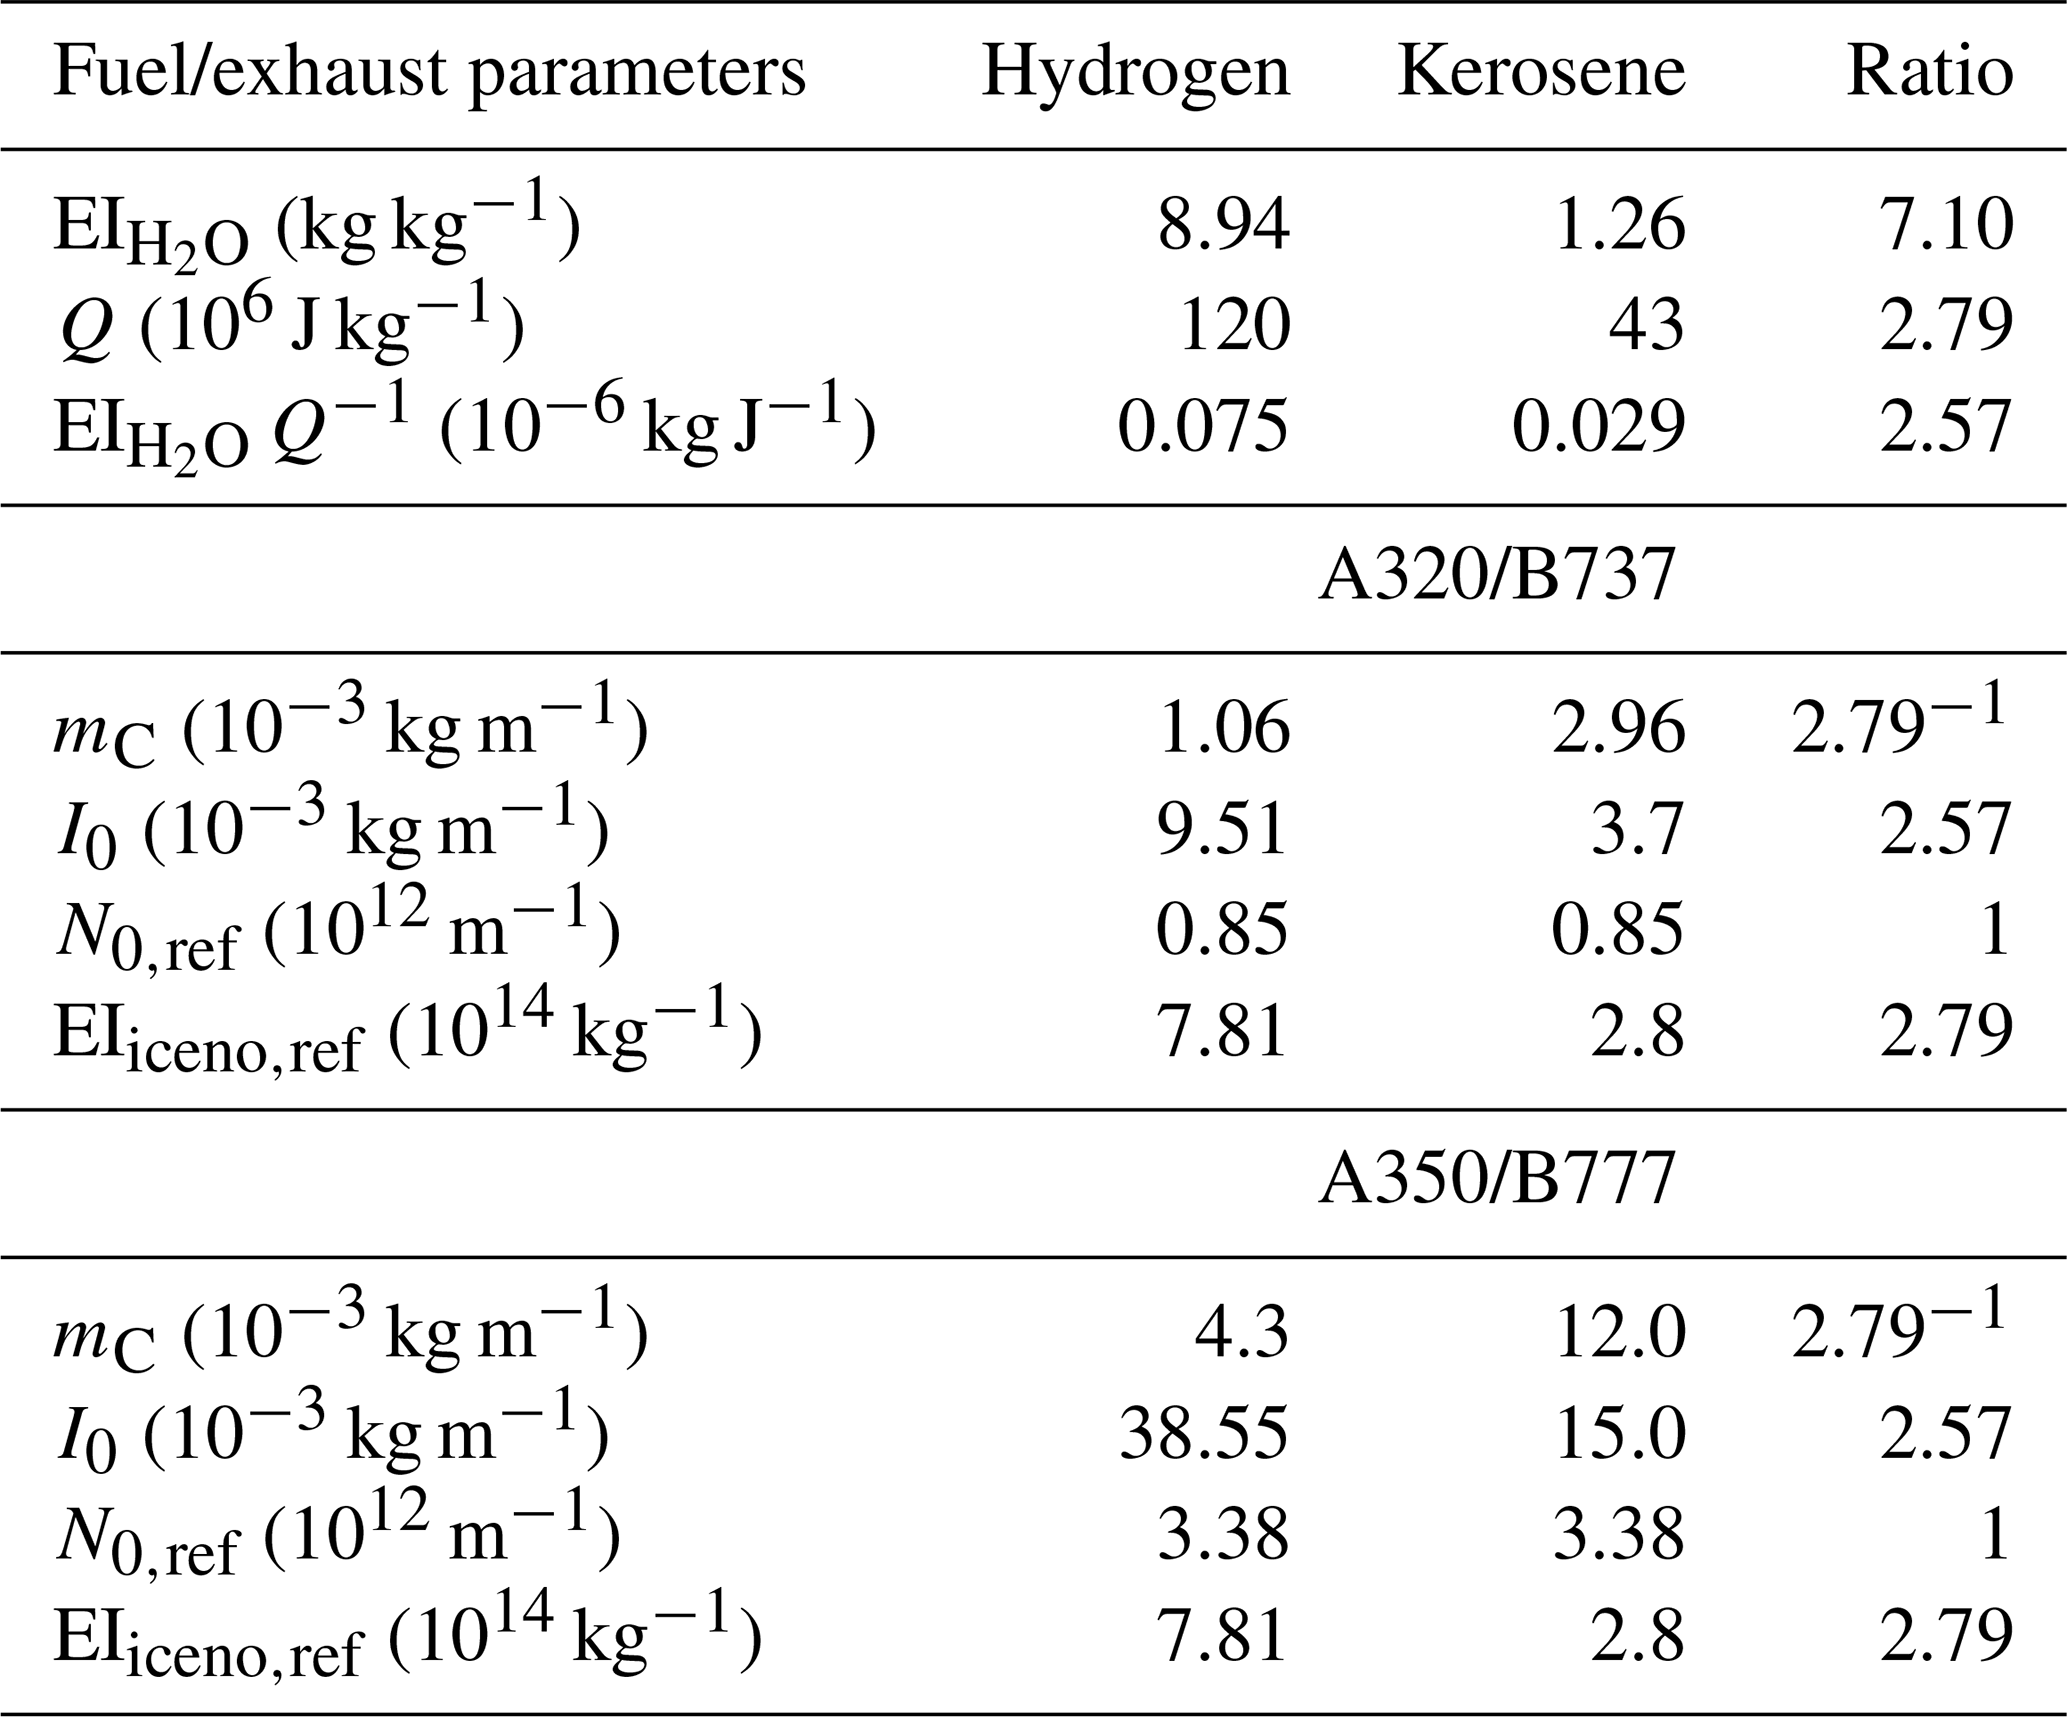
Hydrogen (H2) combustion results in exhaust plumes that are significantly moister than kerosene plumes (containing approximately 2.6 times more water vapor), and entrained atmospheric background aerosol particles are expected to serve as contrail ice nuclei, as hydrogen exhaust plumes are void of soot particles (Kärcher et al., 2015; Bier et al., 2024). Recent research by Bier et al. (2024) indicates that hydrogen-powered aircraft could reduce the number of ice crystals formed in contrails by more than 80 %–90 % compared to kerosene contrails. While no soot particles are produced during hydrogen combustion, the formation of ultrafine volatile particles is possible (Ungeheuer et al., 2022), and their role in ice crystal formation is not yet understood.
Another technological option using hydrogen as an energy carrier employs a hydrogen fuel cell propulsion system (also proposed in the ZEROe project). Hydrogen fuel cells create electrical energy that turns a propeller or fan. Fuel cells offer several advantages over conventional combustion-based technologies, as they are expected to operate at a higher overall propulsion efficiency (Kazula et al., 2023). Moreover, hydrogen fuel cells eliminate emissions of carbon dioxide and nitrogen oxides. Despite ongoing development efforts, several uncertainties regarding the performance and operation of fuel cell propulsion systems remain, making this an active field of research. According to the contrail formation theory for fuel cells (Gierens, 2021), the supersaturation over water in the exhaust plume of such systems could be significantly higher than for conventional combustion systems. This leads to a much larger slope of the mixing line as described by the Schmidt–Appleman theory (Schumann, 1996), which defines the linear relationship between plume partial water vapor pressure and temperature. The plume supersaturation can attain very high values, which could trigger homogeneous droplet nucleation (HDN; Wölk and Strey, 2001) and the formation of numerous small water droplets (Jansen and Heymsfield, 2015). Given the low ambient temperatures at typical cruise altitudes, these droplets would rapidly freeze, potentially resulting in a very high initial number of ice crystals. In this study, we address the potential implications of this propulsion system by artificially increasing the initial number of ice crystals in our simulations. We emphasize that we do not state that fuel cell propulsion leads to a high number of contrail ice crystals. Moreover, there are design options under consideration that may avoid abundant ice crystal production. Hence, our scenarios with high ice crystal numbers should be interpreted as just one possible scenario of fuel cell propulsion.
The initial properties of contrails, such as the number of ice crystals, are crucial for evaluating the radiative properties of contrail cirrus. For a thorough assessment of contrail mitigation options that aim to reduce the number of ice crystals during the initial formation stage, it is essential to examine the implications of the formation processes and consider the subsequent evolution of the contrail during the vortex phase. The vortex phase covers the first few minutes in the contrail's lifetime. The primary process is the interaction of the contrail ice crystals with the descending counter-rotating vortex pair. This consideration is necessary because the initial contrail ice crystal number closely matches the emitted soot particle number only under low-temperature and high-supersaturation conditions (Bier and Burkhardt, 2022). In contrast, significant deviations can occur under weakly supersaturated conditions and high ambient temperatures. Adiabatic heating in the descending vortex pair increases the saturation pressure, lowering the plume's relative humidity. This may lead to the sublimation of the ice crystals trapped in the descending vortices (Lewellen and Lewellen, 2001; Unterstrasser and Sölch, 2010). The survival fraction of ice crystals after the vortex phase is highly influenced by factors such as the number of nucleated ice crystals, the amount of emitted water vapor, the ambient temperature, the relative humidity over ice, the Brunt–Väisälä frequency, and the aircraft's wingspan. Generally, the fraction of ice crystals lost during the vortex phase will be larger (smaller) if more (fewer) ice crystals are present in the beginning. The initial number of ice crystals is related to the aircraft's fuel flow rate and an assumed apparent ice crystal emission index, EIiceno (Unterstrasser and Sölch, 2010; Lewellen et al., 2014). Unterstrasser (2016) states that an initial reduction in EIiceno from 1015 to 1014 kg−1 implies only a factor of 5.3 reduction in the ice crystal number after the vortex phase. Hence, initial differences in the ice crystal number (e.g., due to changes in the fuel or engine/combustor design) are reduced during the vortex phase. This means that a decreased ice crystal loss in the vortex phase partly compensates for the reduced ice nucleation (Bier and Burkhardt, 2022). The consideration of ice crystal loss processes during the vortex phase, as parameterized in Unterstrasser (2016) and implemented in larger-scale models, leads to significant changes in the later contrail properties on a regional (Gruber et al., 2018) and global (Bier and Burkhardt, 2022) scale.
In this study, we systematically investigate the properties of young H2 contrails, focusing on various ambient and meteorological parameters. Section 2 introduces the model and parameter setup. In Sect. 3, we examine the sensitivity of H2 contrails to various parameters and present the updated parameterization. Implications of the simulation results are discussed in Sect. 4, and conclusions are drawn in Sect. 5.
In this section, we introduce our model (Sect. 2.1) and describe the numerical setup employed in our simulations (Sect. 2.2). Furthermore, we define the specific quantities necessary for evaluating and analyzing the results (Sect. 2.3).
2.1 Model
We perform simulations of H2 contrails using the large-eddy simulation (LES) model EULAG-LCM. The base LES code EULAG solves the anelastic formulation of the momentum and energy equations (Smolarkiewicz and Margolin, 1997; Prusa et al., 2008). The Lagrangian Cloud Module (LCM), which incorporates a Lagrangian particle-tracking method to simulate the microphysical processes (Sölch and Kärcher, 2010), has been coupled to EULAG, resulting in the model version EULAG-LCM. This model version has been used in multiple previous studies to explore the properties of young contrails during the vortex phase (e.g., Unterstrasser and Sölch, 2010; Unterstrasser, 2014; Unterstrasser and Stephan, 2020) and their transition into contrail cirrus (Unterstrasser et al., 2017a, b; Unterstrasser, 2020). The model results have also been used to develop a parameterization of ice crystal loss and the geometric depth of contrails after vortex breakup (Unterstrasser, 2016).
In the particle-based framework of LCM, ice crystals are represented by simulation particles. Each simulation particle (SIP) represents a certain number of real ice crystals (referred to as the weight of the SIP) with identical properties, such as size and mass. The effect of particle inertia, specifically centrifugal acceleration in the rotating wake vortices, is neglected due to the small ice crystal sizes present in the primary wake, as shown in Unterstrasser (2014).
In this study, we consider the deposition growth and sublimation of ice crystals and latent heat release to be the most important microphysical processes and switch off several LCM routines, such as aggregation and radiation.
2.2 Numerical setup and set of simulations
Generally, we assume ambient conditions such that contrails form and persist, i.e., the atmosphere is sufficiently cold and moist (Schumann, 1996; Gierens and Spichtinger, 2000).
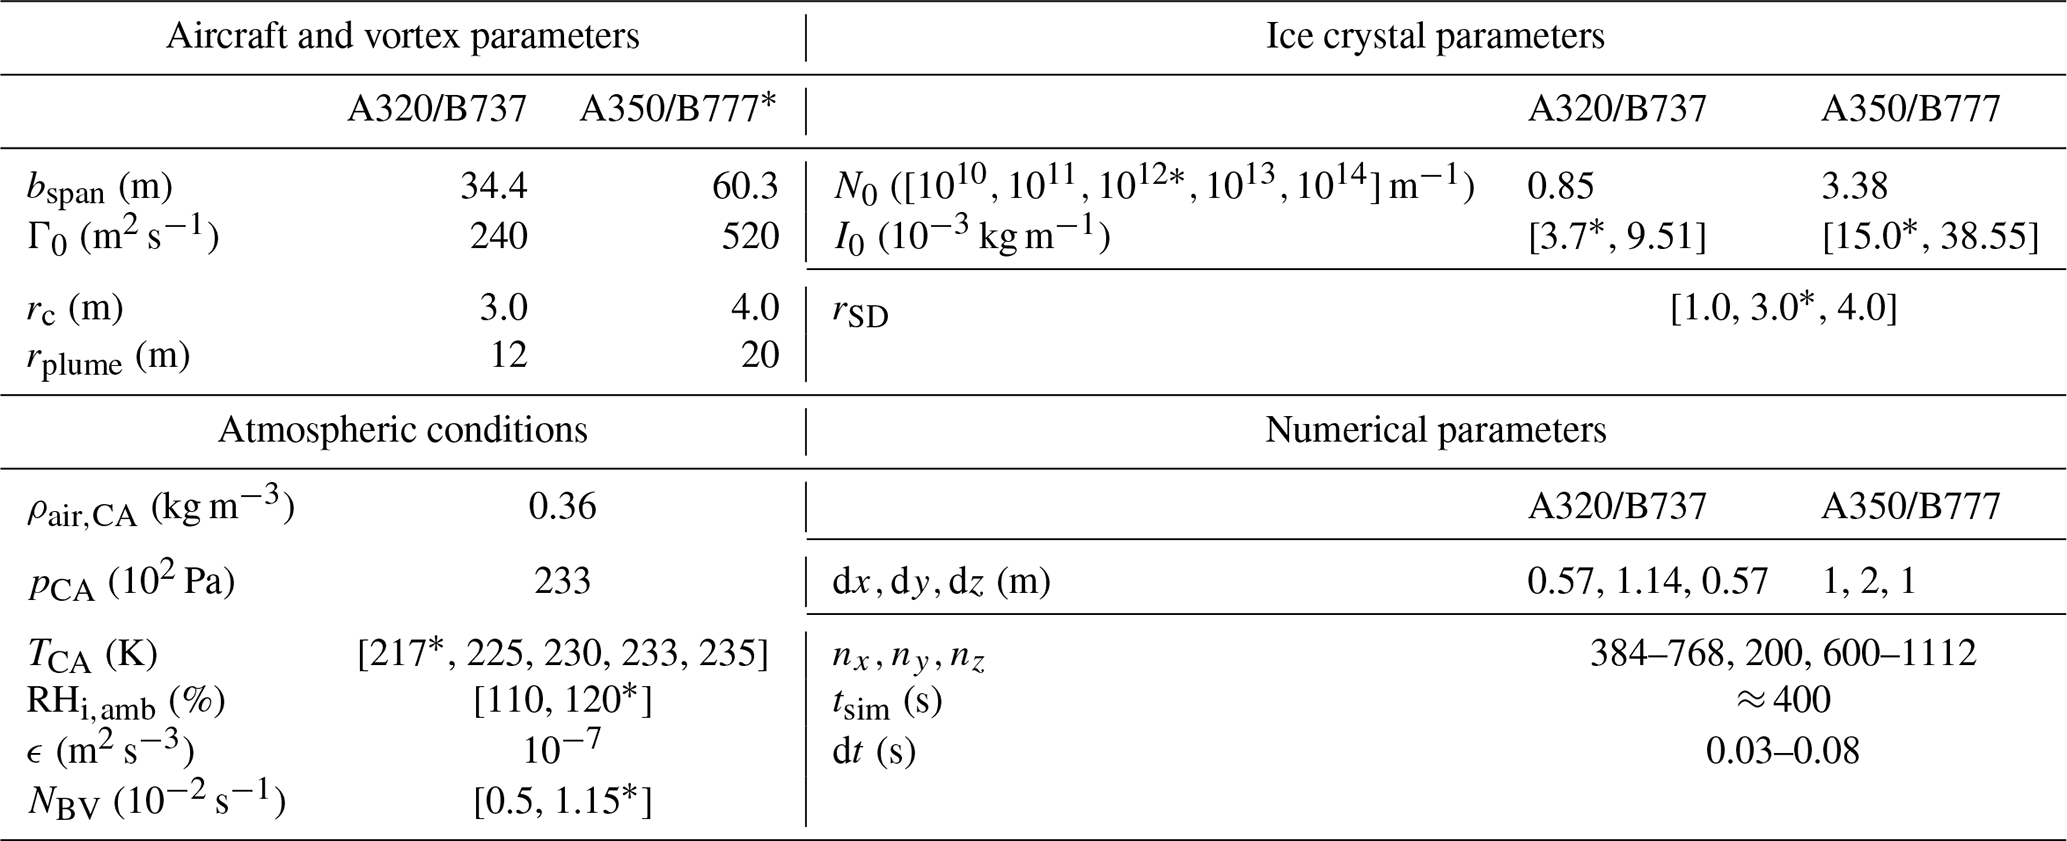
As hydrogen propulsion technology is likely to be initially employed on smaller aircraft, we conduct simulations for both an aircraft with a wingspan of bspan=60.3 m (A350/B777-like aircraft, default) and a smaller aircraft with a wingspan of 34.4 m (A320/B737-like aircraft). Generally, the setups are consistent with previous EULAG-LCM studies, where contrails from six different aircraft types were systematically investigated (Unterstrasser and Görsch, 2014; Unterstrasser, 2016). Throughout the text, when we use “A350” (“A320”) aircraft, we are generically referring to an “A350/B777-like” aircraft (“A320/B737-like” aircraft).
The number of grid points in our default model domain is nx=384, ny=200, and nz=600, where x, y, and z denote the transverse, longitudinal (along the flight direction), and vertical direction, respectively. The size of the simulation domain is adjusted based on specific conditions. For example, weaker stratification requires a larger domain, as the vortices descend further and exhibit more pronounced meandering due to the Crow instability (Crow, 1970). Additionally, for high cruise-altitude temperatures, i.e., TCA=230, 233, and 235 K, the vertical domain size was increased from 600 to 800 grid points for the A350 and from 856 to 1112 grid points for the A320. The grid resolution is 1 m along the transverse and vertical and 2 m along the longitudinal direction. For simulating an A320 aircraft, the resolution is changed to m and dy=1.14 m, as described in Unterstrasser and Görsch (2014). For both aircraft types, the domain size in the flight direction is chosen to allow the formation of the most unstable Crow mode. Periodic boundary conditions are applied in the horizontal and longitudinal directions. In the vertical direction, rigid boundary conditions are used, meaning that the vertical velocity component is zero at the top and bottom boundaries of the simulation domain. The total simulated time is around 6–7 min, where the time step increases from an initial value of 0.03 to 0.08 s at later stages of the simulation.
The simulations start at a plume age of several seconds. At this stage, it can be assumed that the ice crystal formation is finished and the vortices have fully rolled up. We initialize the ice crystals in two disks (one per wing) with uniform ice crystal number concentrations. The flow field is a superposition of a turbulent background field and two counter-rotating Lamb–Oseen vortices. The vortex circulation, vortex core radius, and plume radius depend on the aircraft type and are given in Table 1.
We incorporate the effects of a hydrogen propulsion system by varying the initial number of ice crystals (N0) and the emitted water vapor mass (I0). The default values of the initial ice crystal number correspond to typical values of the fuel flow rate, denoted by , and an apparent ice emission index kg−1 (Unterstrasser and Görsch, 2014), which represents a typical kerosene contrail. N0 is then determined by
where the fuel consumption mC is defined as . U∞ represents the aircraft velocity. The reference values are m−1 for an A320 aircraft and 3.38×10¹² m−1 for an A350 aircraft.
To explore a broad range of scenarios, we scale N0 up and down by factors of 10 and 100 relative to N0,ref. The downscaling simulations are supposed to cover hydrogen combustion scenarios. Conversely, the upscaling simulations could represent scenarios involving a hydrogen fuel cell propulsion system with HDN occurring (see Sect. 1). Varying the number of ice crystals in the model is achieved by varying the weight of the SIPs, which keeps their total number roughly the same. Clearly, the assumptions on the initial ice crystal number are made for hypothetical aircraft designs, and the research on contrail formation processes in H2 plumes started only recently (Bier et al., 2024; Ponsonby et al., 2024). A more in-depth discussion of the representativity of our N0 choice is deferred to Sect. 4.
Analogously to N0, the emitted water vapor mass is calculated using
where is the emission index of water vapor, with a value of 1.26 kg kg−1 for all aircraft types (Bier et al., 2024). We increase I0 by multiplying the default values, 3.7 g m−1 for an A320 aircraft and 15.0 g m−1 for an A350 aircraft (referred to as I0,kero), by 2.57, resulting in 9.51 g m−1 and 38.55 g m−1 (referred to as ), respectively. The value of 2.57 corresponds to the ratio of the emission index of water vapor divided by the combustion heat (Q) of hydrogen to kerosene (Bier et al., 2024). Note that N0 and I0 are given in units of “per meter of flight path”. Table 2 summarizes the key differences between hydrogen and kerosene fuel and exhaust properties.
We want to mention one caveat that is crucial for properly interpreting the comparison between the H2 and kerosene scenarios. According to Table 2, switching from kerosene to H2, the water vapor emission index increases by a factor of 7.1, while the specific heat of combustion is a factor of 2.79 higher. The energy-specific water emission is then 2.57 times higher, which is, by the way, a crucial difference affecting the contrail formation process and potential contrail coverage (Schumann, 1996; Bier et al., 2024; Kaufmann et al., 2024). Achieving the same work rate with both fuel types, the hydrogen fuel consumption is 2.79 times lower, while the water vapor emission (per flight distance) I0 is 2.57 times larger. Moreover, it is our design choice to assume the same N0,ref value for both fuel scenarios. This implies that the reference apparent ice emission index (EIiceno,ref) of the H2 scenarios, i.e., those simulations with a higher I0 value, is actually a factor of 2.79 larger. Comparing a factor “100 down” simulation with a larger I0 value, as a typical representative of a H2 contrail, with a conventional kerosene contrail, i.e., reference N0 and smaller I0 value, must not be interpreted as a factor of 100 variation in EIiceno,ref. The difference is actually smaller, with a factor of approximately 36.
Following, e.g., Unterstrasser and Sölch (2010), the initial ice crystal size distribution is represented by a lognormal distribution with a width parameter rSD. We adopt a default value of rSD=3.0 and explore variations with a narrower (rSD=1.0, monodisperse) and broader (rSD=4.0) initial size distribution, as previous studies have identified this parameter as significant (Unterstrasser and Sölch, 2010; Unterstrasser, 2014). Note that other modeling studies that initialize the contrails at an earlier state without the specification that all emitted water vapor has already been deposited on the ice crystals show a weaker impact of the width parameter (Lewellen et al., 2014). We conducted simulations only with a 100-fold increase or decrease in N0 when altering the width parameter to reduce the number of simulations.
Figure 1 shows the mean ice crystal radius versus the initial number of ice crystals for kerosene and hydrogen water vapor emission. For this estimate, we use a density of ice, ρi=0.92 g cm−3, and assume spherical particles, which is a reasonable approximation for small ice crystals with aspect ratios close to 1. The radius corresponding to the mean particle mass, r0, is then approximated by , assuming that all emitted water vapor is deposited onto the ice crystals. While the LCM represents ice crystal habits as hexagonal columns, this simplified estimate for r0 serves as a first-order approximation to illustrate the general relationship between N0, I0, and the resulting crystal size, as shown in Fig. 1. A higher N0 value generally results in a smaller mean radius, as the total amount of water is distributed among more particles. It is also evident that the initial water content I0 directly impacts the initial particle size: the higher the I0, as indicated by triangles that represent the hydrogen case, the larger the initial particles. The initial mean ice crystal radii remain unaffected by a variation in the initial width of the size distribution rSD.
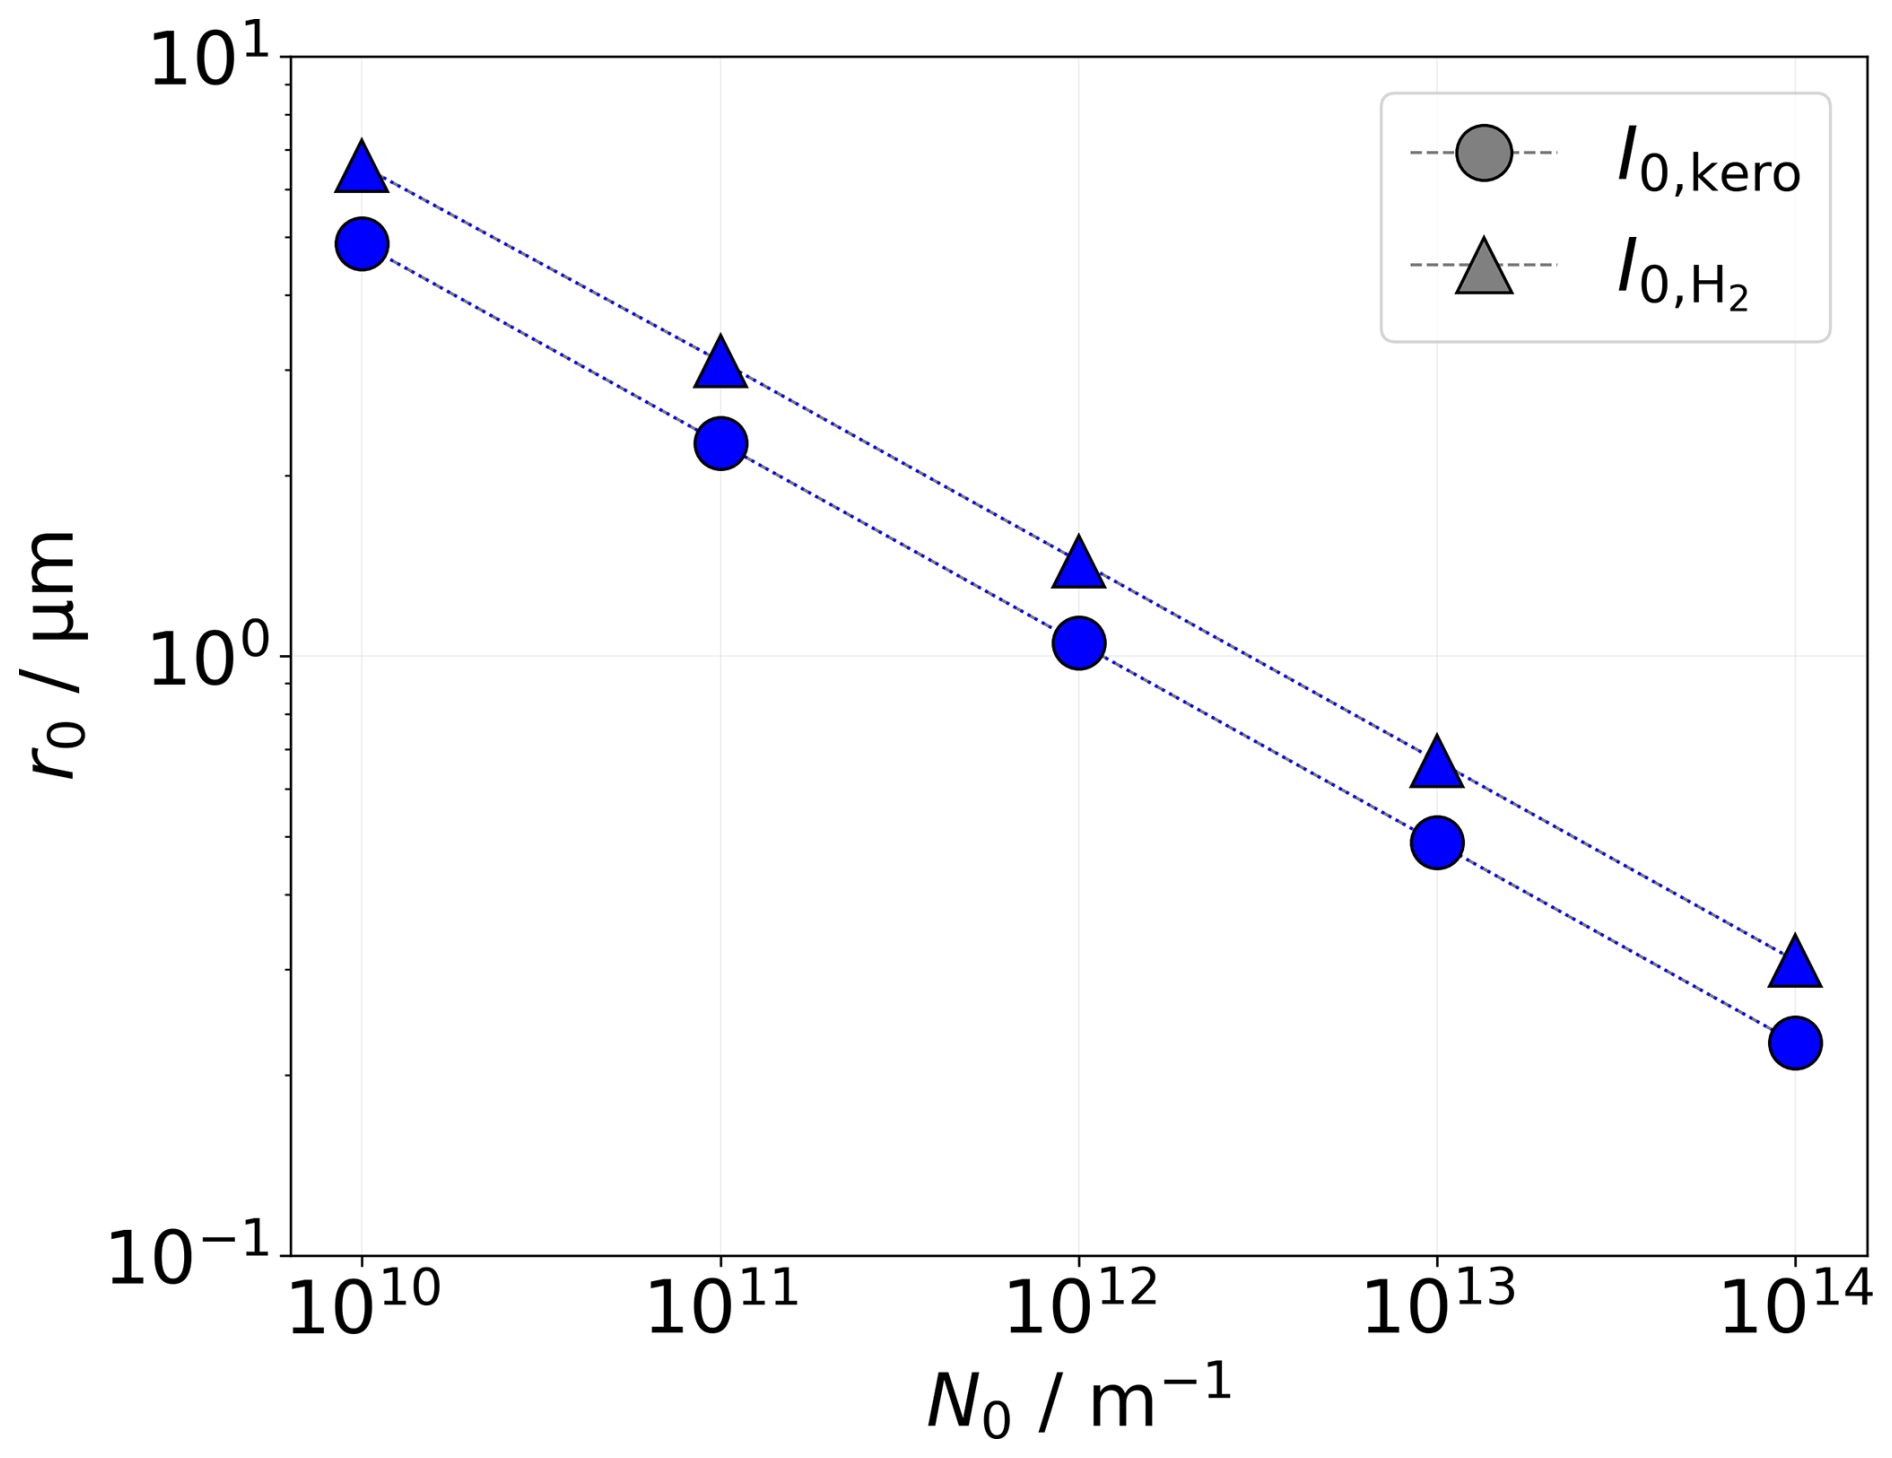
Figure 1Mean initial ice crystal radius as a function of the initial number of ice crystals. Its sensitivity regarding the microphysical initialization in terms of I0 (symbol) is depicted.
Additionally, we investigate the influence of different atmospheric conditions on the evolution of contrail ice crystals. Previous research has highlighted the importance of the ambient temperature at cruise altitude (TCA), the ambient relative humidity with respect to ice (RHi,amb), and the atmospheric stratification (NBV) (described by the Brunt–Väisälä frequency) as key input parameters (Lewellen et al., 2014; Unterstrasser, 2016). We vary these parameters as outlined in Table 1. At the lower boundary of the simulation domain, we prescribe an air pressure of p0=250 hPa and an air density of approximately kg m−3. For ambient temperature, we prescribe cruise-altitude values of TCA=217, 225, 230, 233, and 235 K. The relative humidity with respect to ice is assumed to be constant throughout the entire simulation domain and set to either 110 % or 120 %. We use a background turbulence field with an eddy dissipation rate of m2 s−3. The pressure and temperature vertical profiles are computed for an atmosphere with a vertically constant Brunt–Väisälä frequency according to Eq. (2) in Clark and Farley (1984). At cruise altitude, the resulting air pressure ranges from 231 to 235 hPa, depending on the Brunt–Väisälä frequency and temperature. In Table 1, an average air pressure value is provided. It would seem appropriate to vary the ambient pressure in combination with TCA to reflect a change in flight altitude. However, a variation in pressure has only little impact on the simulated contrail properties, as demonstrated in Sect. S3.3 in the Supplement. This is because the background water vapor mass concentration is independent of ambient pressure. Hence, we do not adapt p0.
In Table 1, values that are marked with an asterisk refer to the default simulation of an A350 aircraft with a water vapor emission value that corresponds to a kerosene combustion system I0=15.0 g m−1 and an initial ice crystal number m−1 at an ambient temperature of 217 K, an ambient relative humidity with respect to ice of 120 %, and a standard value for atmospheric stability of s−1. Ice crystal formation is improbable for ambient temperatures exceeding 233 K, as this surpasses the homogeneous freezing temperature (Bier et al., 2024), and liquid droplets that form first in the cooling exhaust plume would not freeze. Nevertheless, we include simulations with ambient temperatures of 233 and 235 K as limiting cases, as droplet freezing in turbulent and quickly cooling plumes is not well constrained. An overview of all performed simulations is provided in Table A1.
Table 1Aircraft and vortex, ice crystal, atmospheric, and numerical parameters. Multiple values in square brackets refer to sensitivity studies, and values with an asterisk refer to default values. Parameters are denoted as follows: bspan – wingspan; Γ0 – circulation; rc – vortex core radius; rplume – plume radius at initialization; N0 – initial number of ice crystals; I0 – emitted water vapor mass; rSD – width of initial ice crystal size distribution; ρair,CA – air density at cruise altitude; pCA – air pressure at cruise altitude; TCA – ambient temperature at cruise altitude; RHi,amb – ambient relative humidity with respect to ice; ϵ – eddy dissipation rate; NBV – Brunt–Väisälä frequency; – mesh sizes; – number of grid points; tsim – simulated time; dt – time step.
2.3 Quantities of interest
In the following, we give definitions of quantities that are used throughout the paper.
The respective total number of ice crystals per meter of flight path and the vertical ice crystal number profile are defined as follows:
Here, Ly is the domain length in the longitudinal direction and N represents the ice crystal number concentration. Both quantities, Ntot and Nv, are averaged along the flight direction. The total ice mass, Mtot, and the vertical ice mass profile, Mv, are computed analogously. The normalized ice crystal number is calculated as
In Sect. 3, we will use the term “survival fraction of ice crystals” (fN,s), which is the normalized ice crystal number at the end of the simulation. Another pertinent quantity to examine is the number of sublimated ice crystals (Nsubl). Vertical normalized profiles () are computed as described in Eqs. (3)–(4) and track the number of ice crystals that sublimate at a specific altitude.
3.1 Exploring H2 contrails
In this section, we examine the impact of the initial number of ice crystals and the emitted water vapor mass, corresponding to a H2 combustion engine or a potential fuel cell setup. These two parameters are varied as described in Sect. 2.2. The simulations presented in this section are performed for an A350 aircraft at TCA=217 K, RH %, and s−1, which were also the baseline meteorological conditions in previous EULAG-LCM studies. Hence, this scenario has been well explored, and the new simulations build upon the existing ones. Unless stated otherwise, the presented results use the default initial values, indicated by an asterisk in Table 1.
Figure 2 (top row) illustrates the temporal evolution of contrail ice crystals in the x–z plane over a 6 min period. The ice crystal number concentration is averaged along the flight direction. At the start of the simulation, two circular plumes are initialized at z=0 m. The centers of the plumes and of the wake vortices are co-located on each side. Within the first 2 min, a downward motion of the ice crystals is observed as the aircraft exhaust descends with the downward moving vortices, forming the primary wake. Also, we see a horizontal broadening of the contrail after few minutes due to the Crow instability (Crow, 1970). Ice crystals that are continuously detrained from the descending exhaust form a curtain between the original emission altitude and the vortex location, known as the secondary wake (Sussmann and Gierens, 1999; Unterstrasser, 2014). After 6 min, ice crystals are visible close to or even above the cruise altitude as the vertically displaced air masses rise back due to buoyancy after vortex breakup. Whereas ice crystals in the secondary wake grow in size due to the deposition of the available water vapor, a significant portion of the ice crystals can sublimate in the primary wake because of adiabatic heating (Lewellen and Lewellen, 1996; Sussmann and Gierens, 1999; Unterstrasser, 2016).
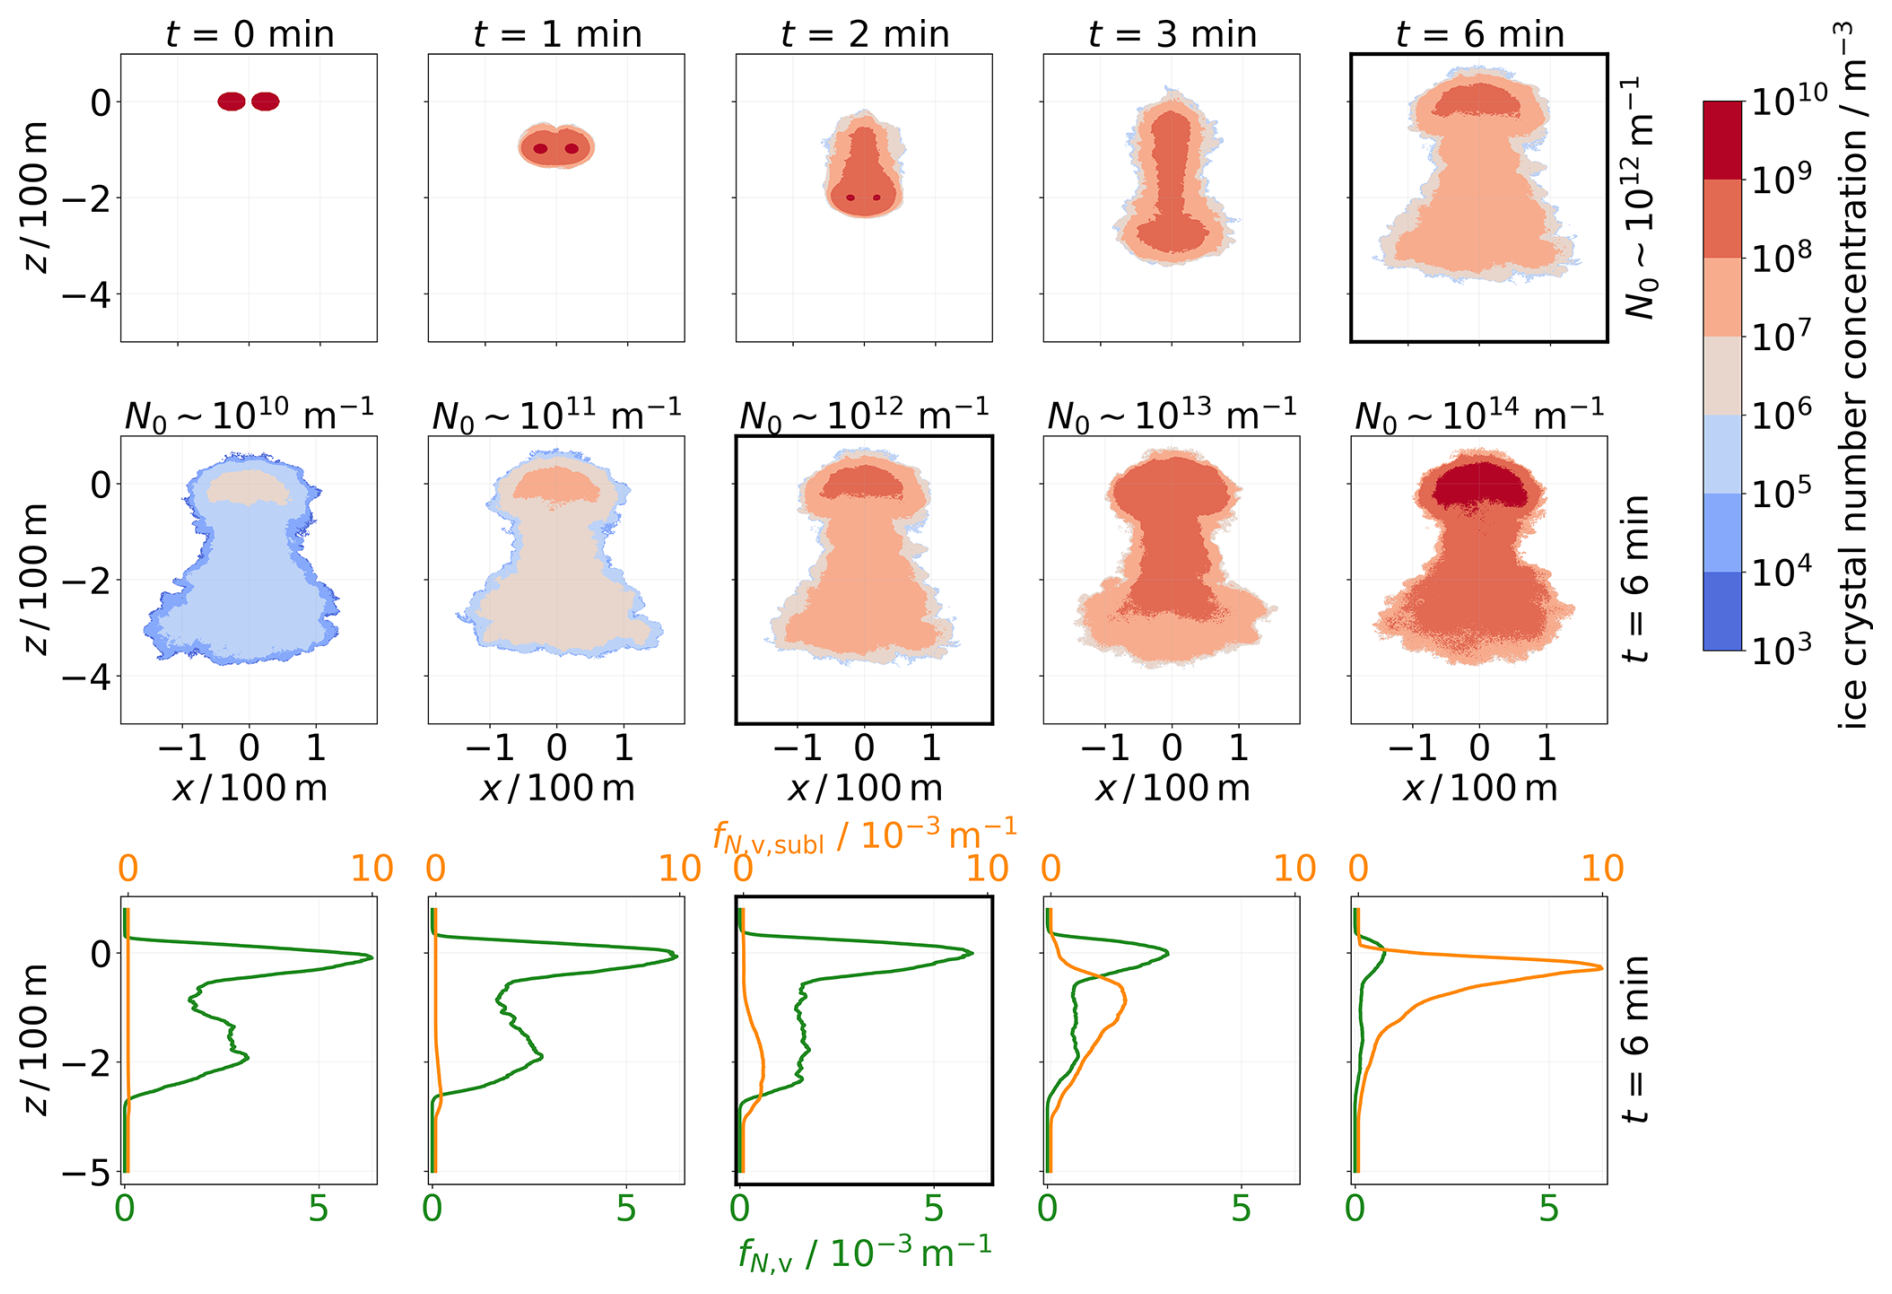
Figure 2Ice crystal number concentrations, averaged along the flight direction in the x–z plane, are depicted in the first and second rows. The first row illustrates the temporal evolution over 6 min. The final concentration distribution is displayed in the second row for five different N0 values. The third row shows the normalized vertical profiles of ice crystals (green) and sublimated ice crystals (orange) (the first row depicts one simulation, whereas the second and third rows depict five different simulations). The simulation displayed in the top row refers to the simulation in the middle panels in the second and third rows, marked by the black frame. The displayed simulations are performed for an A350 aircraft at TCA=217 K, RH %, and . The z coordinate is shifted such that z=0 m corresponds to the cruise altitude (which is also done in Figs. 4, 5, and 6).
The second row in Fig. 2 shows the cross-sectional ice crystal number concentrations after 6 min for the reference N0 case ( m−1) and the N0-upscaling and N0-downscaling cases. Higher final number concentrations in absolute terms are evident in the upscaling cases ( m−1 and m−1). Nonetheless, relative to the initial number, fewer ice crystals survive in these cases, as illustrated in the third row, where the final vertical profiles of normalized ice crystal numbers (green curves) are depicted. This observation is further supported by the final vertical profiles of normalized sublimated ice crystal numbers (orange curves). In the upscaling cases, ice crystals begin to sublimate at higher altitudes because they are smaller in size (see Fig. 1); this is a phenomenon that has already been described by Huebsch and Lewellen (2006) and Unterstrasser (2014).
Figures 3a and b display the temporal evolution of the normalized total ice crystal number and absolute total ice mass for different N0 and I0 values. The most significant reductions in fN occur in the upscaling scenarios (red curves in Fig. 3a), while the N0-downscaling simulations (blue curves) show little to no reduction in the temporal evolution of fN. Due to a higher absolute number of surviving ice crystals in the upscaling cases, these scenarios also exhibit a larger final total ice mass (red curves lie above the blue ones in Fig. 3b). The greater loss of ice crystals in the upscaling scenarios is reflected in the survival fraction depicted in Fig. 3c. Conversely, contrails with a lower value of N0 (and thus larger initial crystals) are less prone to sublimation, resulting in a higher survival fraction. This implies that initial differences in ice crystal number diminish over time. In this specific scenario, initial differences spanning 4 orders of magnitude, with N0-scaling factors of 0.01 and 100, reduce to just 2 orders of magnitude, 0.015 and 7.5, after the vortex phase. Moreover, initializing with a greater amount of emitted water vapor (indicated by circles in Fig. 3c) results in larger ice crystal sizes (refer to Fig. 1), which in turn increases the survival fraction and ice mass. In the simulations, the reduction in the initial differences is less pronounced, with the 4-order-of-magnitude difference reducing to 3 orders by the end of the vortex phase.
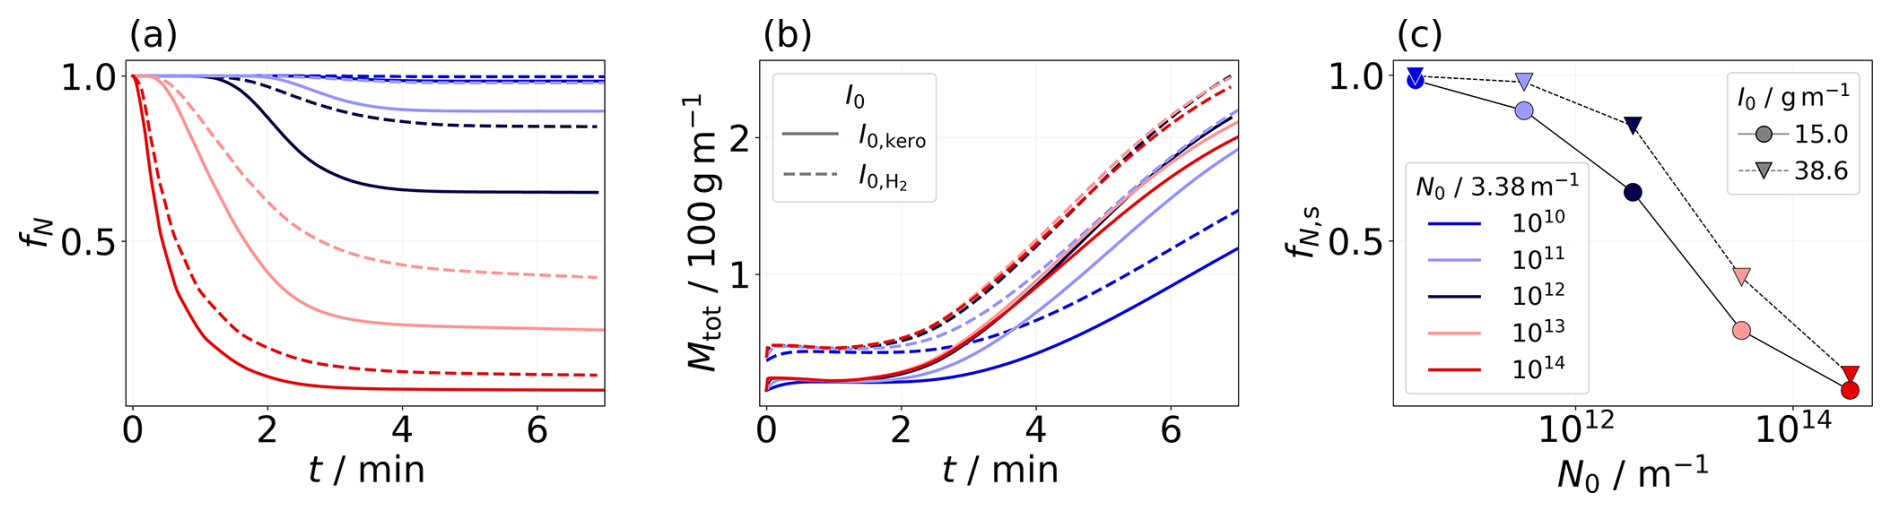
Figure 3Temporal evolution of the normalized total number of ice crystals and total ice mass for different values of N0 and I0 (a, b). In panel (c), the survival fractions as functions of N0 are depicted.
3.2 Parameter study of H2-contrail properties
3.2.1 Sensitivity to ambient conditions
As revealed in previous studies, the evolution of the contrail ice crystal number and ice mass is highly sensitive to ambient conditions (Lewellen and Lewellen, 2001; Unterstrasser, 2016). This section investigates the impact of ambient relative humidity, temperature, and atmospheric stratification on H2-contrail properties. Note that we performed simulations at TCA ≥ 230 K only for H2 contrails with an increased I0 value, as the formation of kerosene contrails is unlikely at these high ambient temperatures. The results presented in this section refer to simulations of an A350 aircraft with an initial size distribution width of rSD=3.0.
In Fig. 4, final vertical profiles of the ice crystal mass and normalized number and survival fractions after approximately 6 min are depicted. Columns represent simulations at temperatures of 217, 225, 230, 233, and 235 K, respectively. The simulations shown in the first and second rows are performed with . The ice mass (row 1 in Fig. 4) remains largely unaffected by variations in N0, except the factor-100 downscaling simulation, which shows a significantly reduced ice mass. A notable increase in ice mass is observed with increasing temperature, attributable to a higher water vapor mass concentration in the atmosphere. This additional water vapor can be deposited onto the ice crystals, thereby increasing their size.
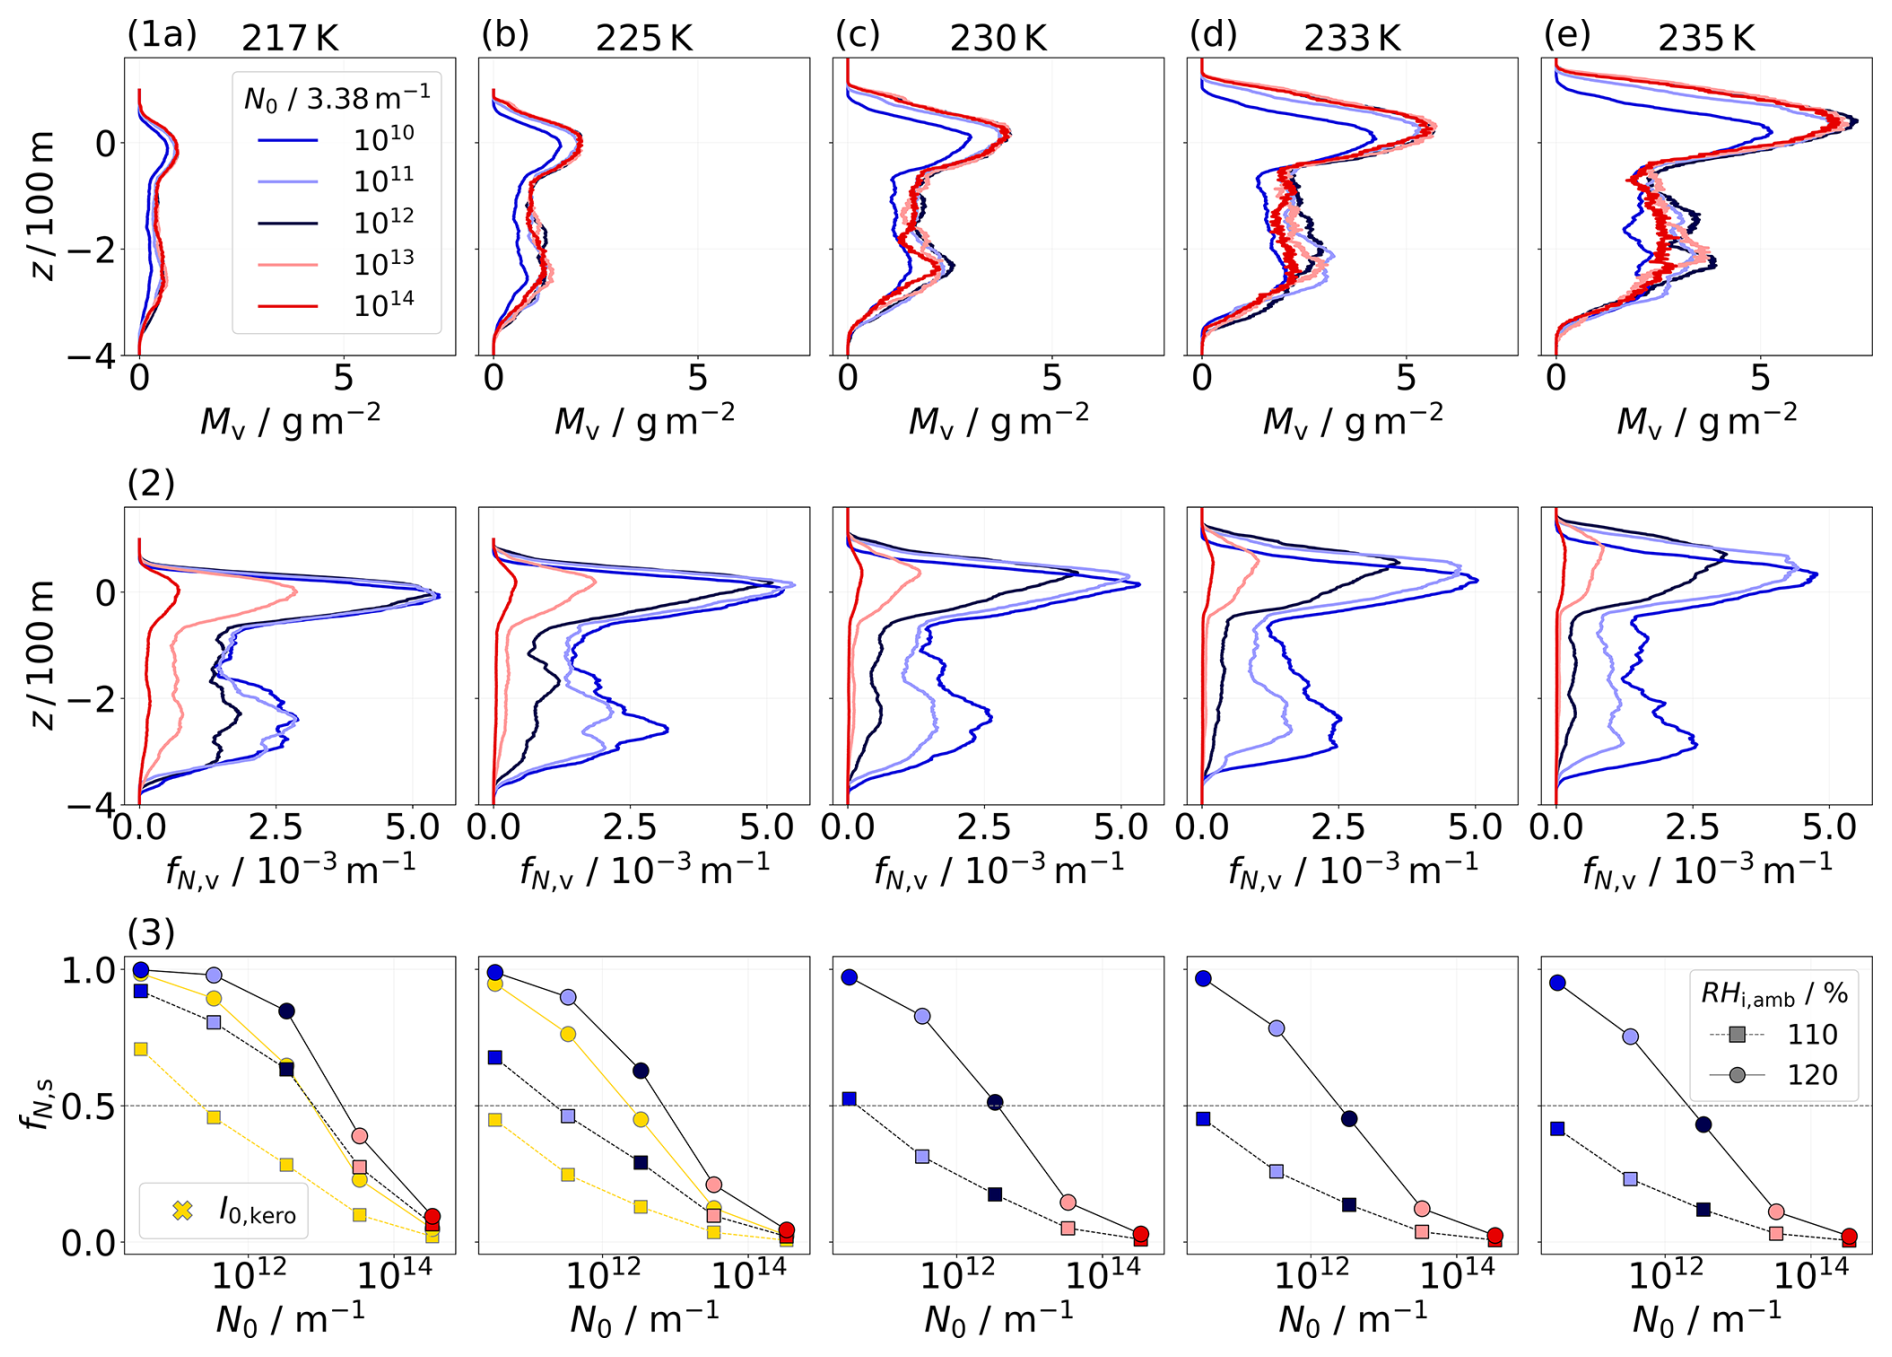
Figure 4Final vertical profiles of ice mass (first row) and normalized ice crystal number (second row) for different N0 values (as given in the legend in panel 1a) after 6 min. Columns depict results for ambient temperatures of 217, 225, 230, 233, and 235 K (see the headings above the columns). The ambient relative humidity is 120 %. The third row displays the survival fraction at the two different humidity values as indicated in panel (3e). At TCA=217 and 225 K, yellow symbols, which refer to simulations with , are plotted for comparison. A horizontal dashed line at is provided as a visual guide.
When examining the normalized ice crystal number (row 2 in Fig. 4), we observe a reduction with increasing temperature, primarily in the primary wake. Although the ice crystals grow larger during the first seconds due to the higher water vapor concentration at higher temperatures, they experience, in absolute terms, a stronger increase in the saturation pressure within the descending vortices, leading to increased sublimation (Unterstrasser, 2016; Bier and Burkhardt, 2022). This phenomenon is most pronounced in the N0-upscaling cases.
The sensitivity of the survival fraction to the ambient relative humidity and ambient temperature is illustrated in row (3) of Fig. 4. In addition to the default cases with , data points for the kerosene reference case with are displayed for TCA=217 and 225 K (yellow symbols). Simulations with indicate that ice crystals, which would typically sublimate under I0,kero conditions, are now sufficiently large to withstand adiabatic heating. This effect is most pronounced in the RH %, N0-downscaling scenarios: the differences between the yellow and the colored squares are larger than the differences between the yellow and colored circles at N0≲1013 m−1. Simulations at a lower ambient relative humidity (square symbols) show a stronger loss of ice crystals, a trend consistent across the variations regarding N0 and I0. This is due to the stronger sublimation effects in the primary wake in the case of a reduced relative humidity value (Unterstrasser et al., 2014; Unterstrasser, 2016). Notably, in the extreme N0-downscaling scenario (N0∼1010 m−1) at 120 % relative humidity, the survival fraction remains largely unaffected by the ambient temperature, with survival fractions equal or close to 1 at both 217 K () and 235 K (). In contrast, for the extreme N0-upscaling scenario, the impact of ambient temperature is significantly more pronounced, reducing the survival fraction by a factor of 4.5, from at 217 K down to at 235 K. This temperature sensitivity is further amplified under drier atmospheric conditions, where the effect on the survival fraction is more substantial. For the N0-downscaling scenario, the survival fraction decreases by a factor of 2.24, while in the N0-upscaling case, the reduction even exceeds 1 order of magnitude. In the upscaling cases with ambient temperatures at or above 230 K, nearly all ice crystals sublimate, with . Initial differences in N0 spanning 4 orders of magnitude are reduced to 2.98 (217 K, 120 %) and 2.85 (217 K, 110 %), and they further decrease to 2.37 (235 K, 120 %) and 2.14 (235 K, 110 %), highlighting the importance of both parameters, ambient temperature and ice relative humidity, in the context of ice crystal loss during the vortex phase.
The third ambient parameter varied in this study is stratification. Following, e.g., Unterstrasser et al. (2014), we use a Brunt–Väisälä frequency of s−1 as the default and a smaller value, s−1, that characterizes an atmosphere with weaker atmospheric stability. The simulation domain needs to be larger in the latter case, as the downward movement and oscillation of the vortex system are stronger. Therefore, to reduce the number of simulations and the associated computational cost, we only varied N0 by a factor of 100 both up and down. This simulation set is only performed for TCA=217 K.
Figure 5 displays normalized vertical profiles of the final ice crystal number (panel a) and the number of sublimated ice crystals (panel b) for both stratification scenarios (indicated by the line style). Only simulations with are displayed here. Evidently, in a weakly stratified ambient atmosphere, the wake vortices generally descend further down. Consequently, sublimation extends to lower altitudes, especially in the default and N0-downscaling cases, displayed by the black and blue curves, respectively. This is mainly observed in the simulations with a default or lower N0 value, as the difference in the final contrail height is about 200 m, compared to about 50 m in the N0-upscaling scenario. This reduced difference in the N0-upscaling case arises from the fact that most ice crystals are lost at higher altitudes, independently of stratification. As anticipated, the survival fraction is reduced for contrails evolving in a weakly stratified atmosphere. Decreasing the ambient relative humidity exacerbates crystal loss further. Also, lower survival fractions are observed in scenarios with , as previously noted (not shown). The original 4-order-of-magnitude difference in N0 decreases to 2.69 and 2.46 (default and weakly stratified, 120 %) and to 2.46 and 2.31 (110 %) at , while it decreases to 2.98 and 2.72 (120 %) and to 2.85 and 2.66 (110 %) at .
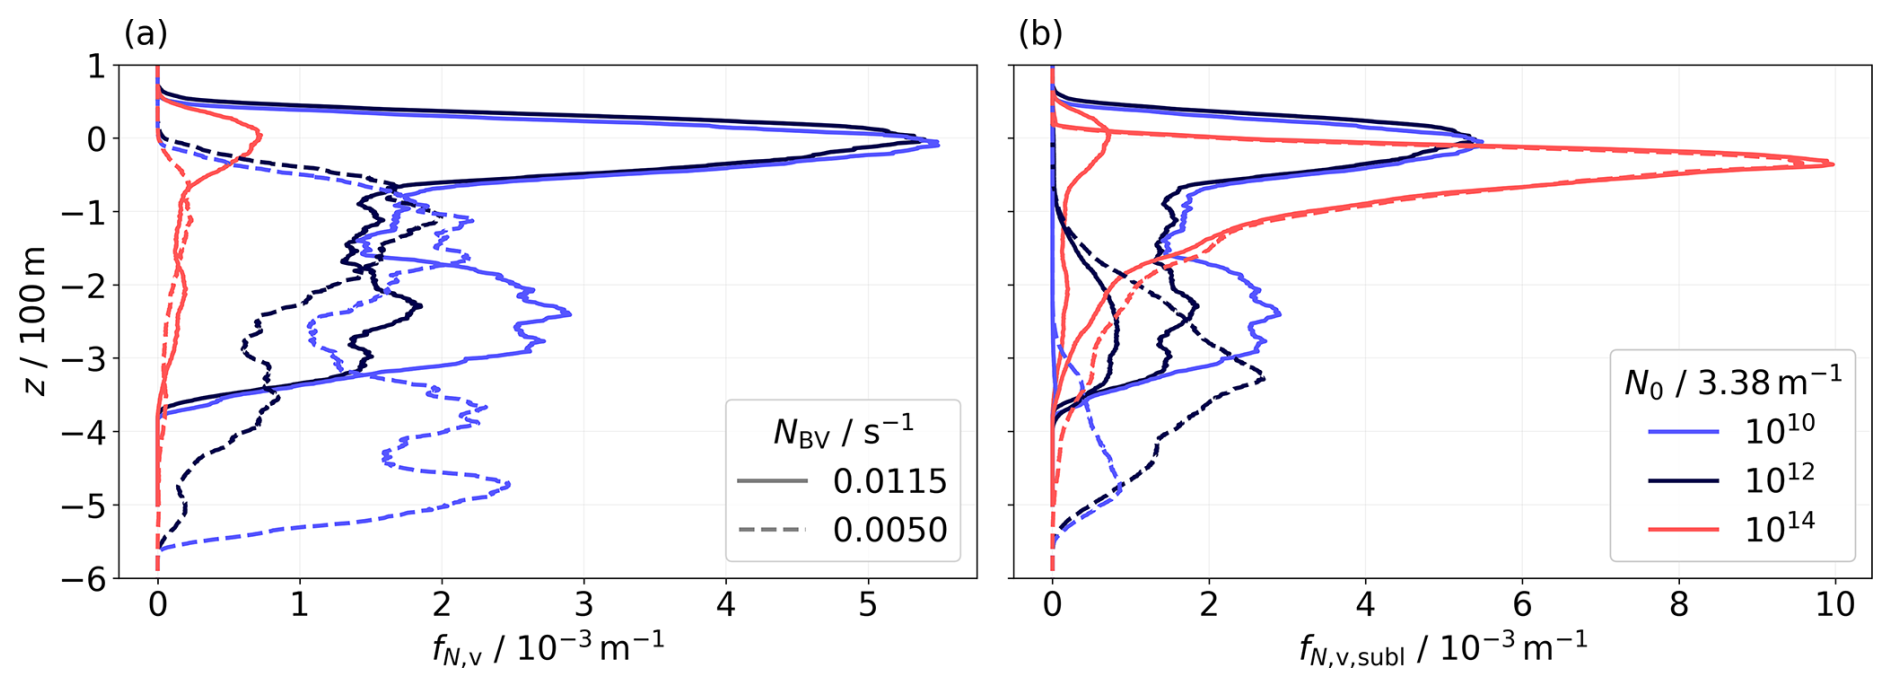
Figure 5Final vertical profiles of the normalized number of ice crystals (a) and the normalized number of sublimated ice crystals (b). Results for default (solid lines) and weaker (dashed lines) atmospheric stability are depicted. The displayed simulation results correspond to TCA=217 K, RH %, and .
3.2.2 Sensitivity to the microphysical initialization
We prescribe the initial ice crystal size distribution (SD) as a lognormal distribution with a specified width parameter rSD; see, e.g., Unterstrasser and Sölch (2010). A variation in rSD has been shown to have a non-negligible effect on the contrail's evolution during the vortex phase (Unterstrasser, 2014). Varying the width, we adjust the geometric mean diameter such that the total initial ice mass and ice crystal number are unaffected (Unterstrasser, 2014).
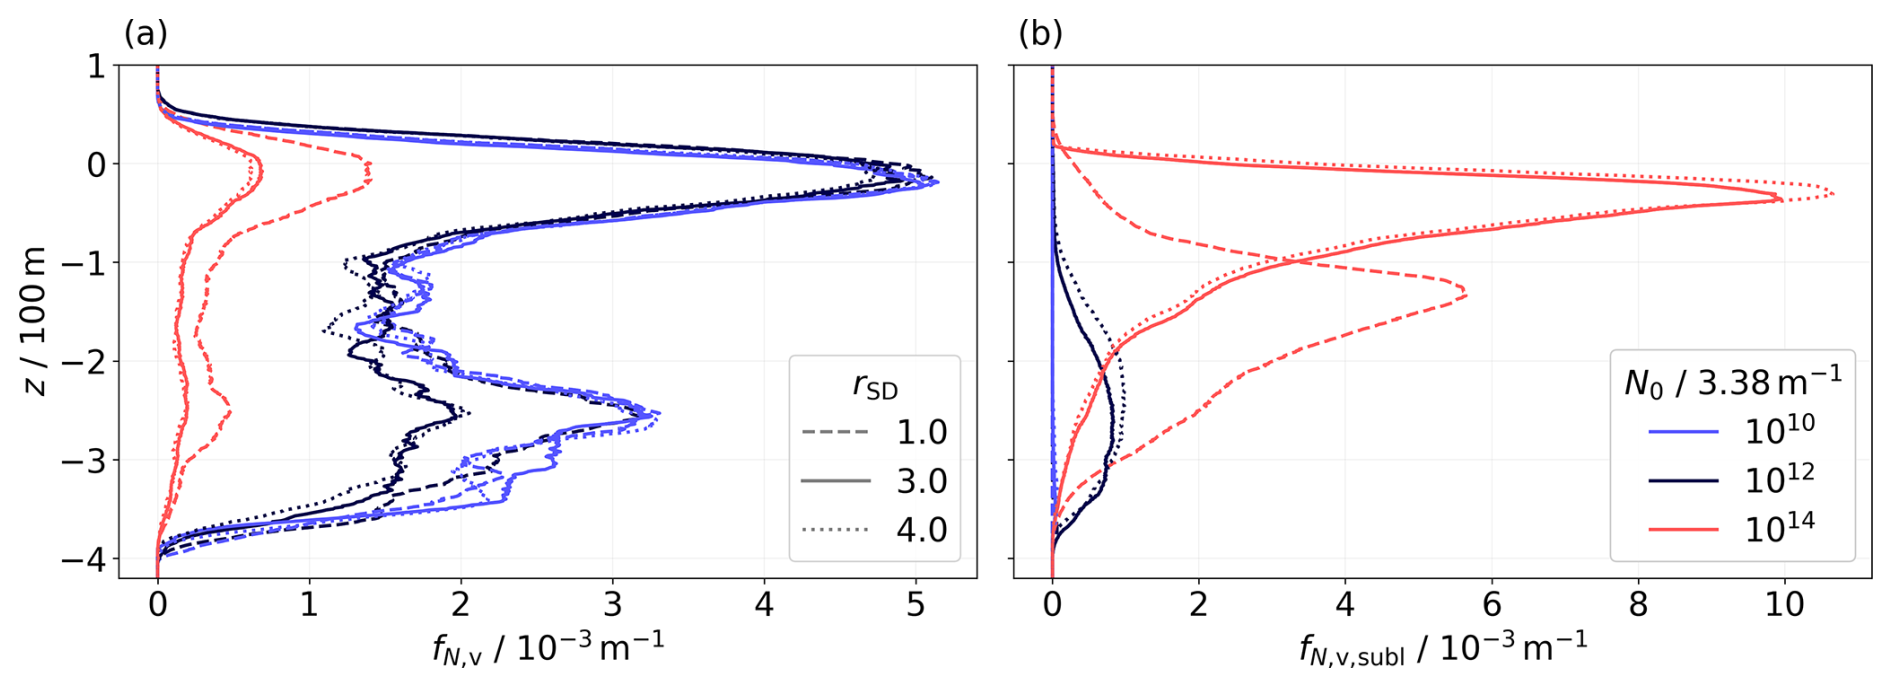
Figure 6Final vertical profiles of the normalized number of ice crystals (a) and the normalized number of sublimated ice crystals (b). Solid lines represent the reference cases with rSD=3.0, while initially broader and narrower ice crystal size distributions are depicted by dotted and dashed lines, respectively. The shown simulations were conducted for TCA=217 K, RH %, and .
In Fig. 6, we present simulations in which rSD is varied according to Table 1. The final contrail height for each N0 scenario appears relatively unaffected by variations in rSD, as shown in Fig. 6a. However, a narrower initial SD leads to a higher number of ice crystals present at lower altitudes (dashed curves). This can be explained by the delayed onset of sublimation, which occurs at lower altitudes (see panel b). In contrast, a broader initial SD results in a higher proportion of smaller ice crystals at the start; these smaller ice crystals tend to sublimate at higher altitudes, leading to lower survival fractions. This pattern is observed consistently across all N0 scenarios. To assess the robustness of these results with respect to ambient temperature, we repeated this set of simulations at TCA=233 K. The general trends related to rSD remain unchanged by the variation in ambient temperature. As expected based on previous findings, we observe generally lower survival fractions at this temperature compared to the corresponding rSD-simulation set at TCA=217 K.
In aircraft plumes characterized by negligible soot emission, such as those from hydrogen-powered engines, ice nucleation is assumed to predominantly occur on entrained ambient aerosol particles (Bier et al., 2024). Therefore, the dry radii of these ambient aerosols govern the size of the resulting ice crystals. Bier et al. (2024) identified several aerosol modes with sizes spanning from few nanometers to several micrometers. This broad size range is more accurately captured by an initial size distribution with larger values of rSD (e.g., 3.0 and 4.0), thus considered more representative of the physical conditions.
3.2.3 Sensitivity to aircraft type
H2-contrail simulations for a smaller A320 aircraft with a wingspan of bspan=34.4 m are performed for TCA≥225 K. The grid spacing is adapted as outlined in Table 1. We simulate this aircraft type only with an N0-scaling factor of 100.
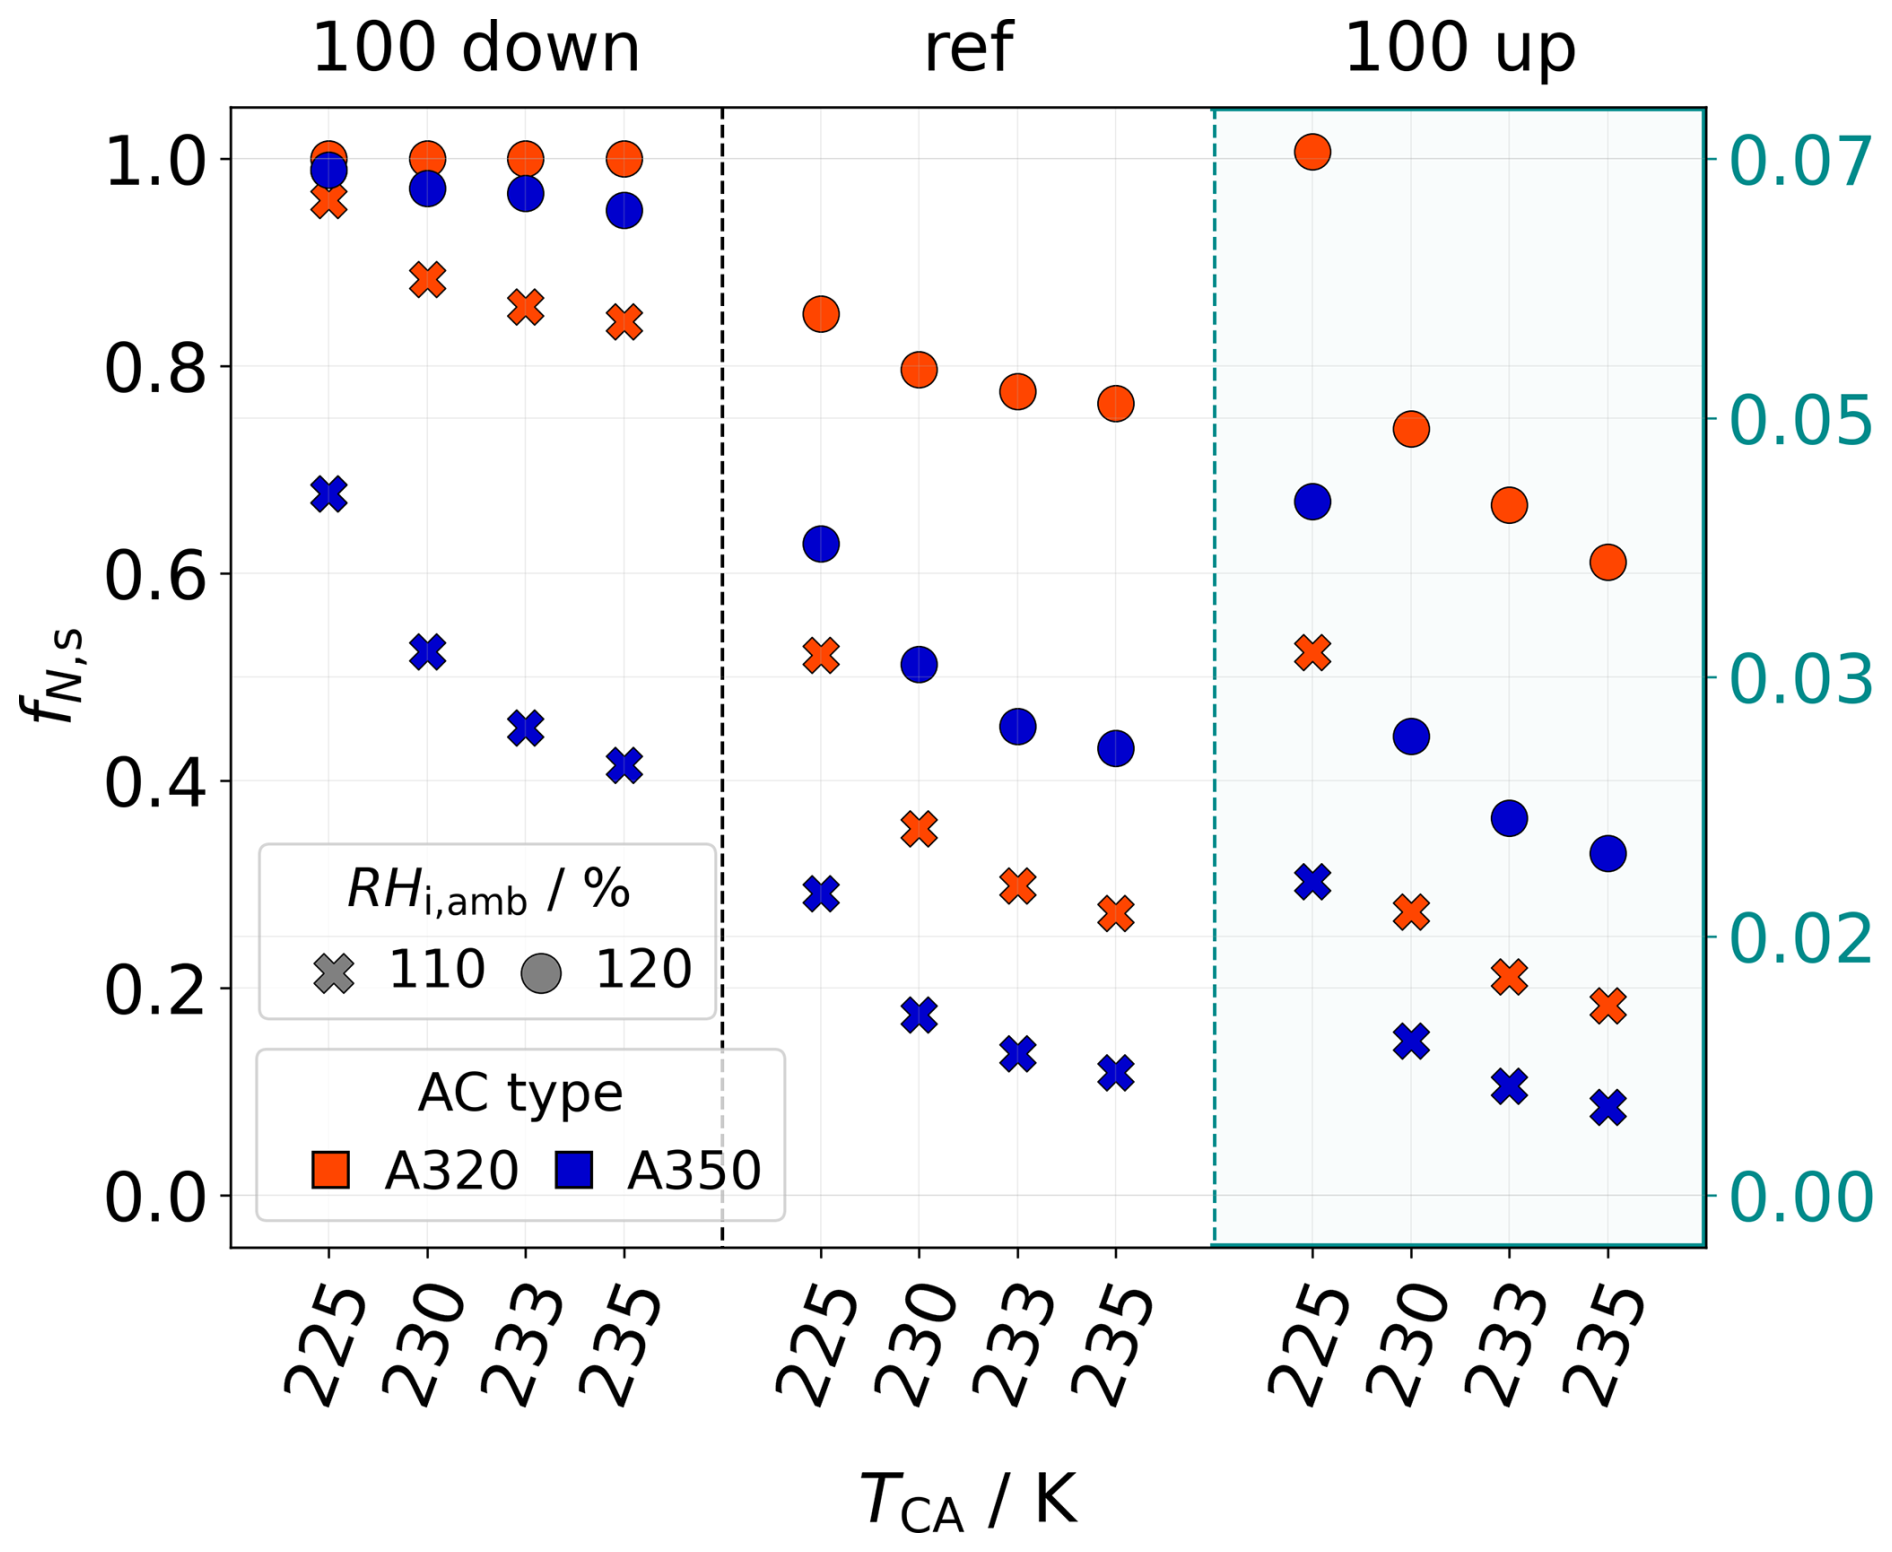
Figure 7Survival fractions of an A320 (red) and an A350 (blue) aircraft. The three boxes represent the ice crystal number scaling as indicated in the heading, where, e.g., “100 down” refers to the simulation with an N0 value equal to 3.38×10¹⁰ m−1 (A350) or 0.85×10¹⁰ m−1 (A320). In the case of a factor-100 upscaling, the survival fractions are small. Hence, we adapted the axis, as indicated by the light-blue labels. Simulation results for both values of ambient relative humidity are shown (symbols).
Unterstrasser and Görsch (2014) have done baseline simulations for an A320 aircraft under typical kerosene conditions. As revealed in this study, the altitude at which sublimation starts is independent of the aircraft type. As described in Sect. 2.2, both N0 and I0 are linearly dependent on the fuel flow rate. As EIiceno and are assumed to be constant across all aircraft types, the mean mass and radius of the initial ice crystals are consequently independent of the aircraft type, as both are proportional to the ratio . However, the vortex system of the A320 descends more slowly. Therefore, the sublimation threshold altitude is reached later. The vortices of the A320 dissolve before such low altitudes can be reached, where strong sublimation occurs. This decreases sublimation effects in the primary wake, allowing more ice crystals to survive the vortex phase for smaller aircraft like the A320 than larger ones like the A350. This trend holds across all N0-scaling scenarios. Although the final A350 contrail still contains more ice crystals than the A320 contrail, the relative ice crystal loss is greater for the A350, reducing the initial large differences in ice crystal numbers.
Figure 7 shows how the survival fractions depend on the aircraft type. Each box, delineated by the dashed vertical lines, corresponds to a different N0-scaling scenario. Note that in the factor-100 upscaling scenario, where the survival fractions are less than 0.1, the y axis is adjusted accordingly. For each scenario, simulations at TCA=225, 230, 233, and 235 K are performed, as indicated on the x axis. As discussed in Sect. 3.2.1, high ambient temperatures and low relative humidity values increase ice crystal loss. Overall, the A320 exhibits higher survival fractions, with the most pronounced differences at low N0 values and low ambient humidity (e.g., for the A320 and for the A350 at TCA=235 K). In scenarios with a strong N0 upscaling, nearly all ice crystals sublimate regardless of the aircraft type ().
3.3 Parameterization of ice crystal loss
Unterstrasser (2016, hereafter referred to as U2016) presents an ice crystal loss parameterization that approximates the survival fraction of ice crystals after the vortex phase (fN,s), based on the ambient relative humidity, temperature at cruise altitude, thermal stratification, apparent ice crystal emission index, and aircraft parameters. Relevant aircraft parameters are the water vapor emission (I0), the wingspan (bspan), and the wake vortices' initial circulation (Γ0). A typical application of the parameterization is its implementation in larger-scale contrail models, where the contrail initialization refers to some state after vortex breakup, and effects of the wake dynamics cannot be explicitly resolved. The development of the parameterization was based on a database of more than EULAG-LCM simulations, comprising sensitivity studies that varied the parameters mentioned above. Notably, the original focus was on contrails from kerosene combustion. The new set of H2-contrail simulations investigates the sensitivity to N0 more systematically and over a broader range. Moreover, contrails at temperatures above 225 K have not been considered previously, and the validity of the parameterization beyond this temperature threshold is not guaranteed.
The following paragraphs will briefly repeat the parameterization formulation, describe appropriate adaptations, and analyze its applicability and performance for the new H2-contrail dataset.
The ice crystal loss during the vortex phase can be assessed by introducing three length scales that describe the processes relevant to downward-propagating contrail ice crystals:
-
zdesc is the final vertical displacement of the wake vortex system, which leads to a maximum adiabatic heating experienced in the primary wake. The quantity depends most strongly on thermal stratification, aircraft mass, and wingspan.
-
zatm measures the effect of the ambient supersaturation on the ice crystal mass budget. zatm is the distance that an air parcel has to travel down until its saturation pressure equals its vapor pressure, i.e., until its supersaturation is depleted due to adiabatic heating. The quantity depends most strongly on the ambient relative humidity.
-
zemit measures the effect of water vapor emission on the ice crystal mass budget. Analogously to zatm, zemit is a vertical displacement that corresponds to an adiabatic heating such that an initially saturated parcel remains at saturation when the emitted water vapor is added to the parcel. The quantity depends on the ambient temperature and the amount of emitted water vapor, which in turn depends on the fuel consumption, the emission index of water vapor, and the contrail cross-section.
The exact definitions of these length scales are given in Sect. 3.1 of U2016. We repeat the definition of zdesc, which is given by
Regarding zatm and zemit, we implement slightly redefined formulae. In the previous version, the definitions of zatm and zemit are based on the assumption of balancing water vapor concentrations. In the updated parameterization, we redefine the two length scales by requiring the conservation of water vapor mass mixing ratios, which are the quantities that are actually conserved under adiabatic changes. Hence, we introduce the adiabatic index κ=3.5, and the modified equations read as follows:
Here, Γd denotes the dry adiabatic lapse rate, with a value of 9.8 K km−1, and RWV is the specific gas constant of water vapor, taken as 461.5 J . The water vapor saturation pressure is represented by es, and denotes the supersaturation. In Eq. (7), ρemit refers to the emitted water vapor concentration. According to U2016, we then define a linear combination of these length scales
with positive weights .
zΔ is large if the buffer effect of the ambient supersaturation and the emitted water vapor outweighs the adiabatic heating due to the wake vortex descent. This means that the water vapor surplus is sufficient to keep the heated air parcel supersaturated. It should be noted that, in the simulations, the air parcel does not remain supersaturated, but RHi quickly relaxes to 100 %. Figure 3b reveals that the water vapor surplus deposits on the ice crystals within a few seconds (for large N0) or within at most 30 s (for low N0). The local maximum attained within the first half a minute clearly relates to the water vapor surplus as estimated by the two length scales zatm and zemit. Also note that the increase in ice mass after 2 min is due to detrained ice crystals outside of the vortex system, which grow in the supersaturated ambient air. Figure 2a in Unterstrasser and Sölch (2010) displays the evolution of the total ice mass in the descending wake vortex system. This nicely reveals the dependence of the peak value on the water vapor surplus and the subsequent monotonic decrease in the ice mass. Hence, the buffer effect is achieved by increasing the total mass and the mass concentrations of the ice crystals in the vortex system. The larger those quantities are after the initial growth period, the more and the longer the ice crystals can shrink until complete sublimation.
A small zΔ (also including negative values) means that the wake vortex descent prevails for so long that a substantial fraction or even all of the entrained ice crystals are likely lost.
Following U2016, both and are modified to include the effect of a variation in N0, while can be left unchanged (i.e., ):
In U2016, Ψ was given by , with and a positive constant γ. In the new formulation, Ψ is defined as
where n0 is an (intermediate) ice crystal number concentration, and the “starred” quantity is the value normalized by a reference value n0,ref. In both approaches, increasing EIiceno in the original formulation or n0 in the new formulation gives smaller weights and . This reduces the buffer effect and, consequently, zΔ. This reflects the fact that ice crystal loss becomes more substantial when the water vapor surplus is distributed over more ice crystals with smaller masses on average. With smaller mean ice crystal sizes, a specific fraction of lost ice mass translates into a larger relative fraction of lost ice crystals.
The definition of n0 is deferred to the Appendix (Eq. A1), and the motivation for the switch from to is explained in Sect. 4.
The three length scales depend only on input parameters and can be evaluated for given meteorological and aircraft properties. Notably, they are independent of N0, and the sensitivity of zΔ to N0 enters the parameterization solely by an adaptation of the weights and .
Plotting the simulated fN,s values as functions of zΔ with suitably chosen weights, the data points can be reasonably well approximated by an arc tangent function. Hence, the parameterized survival fraction can then be defined as
with
In the following, we outline our procedure for determining the new set of fit coefficients. Simulations with rSD=1.0 and rSD=4.0, accounting for approximately 25 % of the total dataset, were excluded from the fitting process, as they represent extreme cases of the size distribution width. However, these simulations are still shown in Fig. 8. We selected a representative subset of simulations using the default value of rSD=3.0. Additionally, some data points from simulations with weaker stability were identified as outliers and excluded. Consequently, 69 % of the new simulations and the entire dataset from U2016 were used to derive the fit coefficients. A weighting was applied in the fitting procedure, with all data points at RH % and being assigned higher weights (1.1 and 2.0, respectively). On the one hand, these weights were introduced to reduce the absolute errors in the RH % cases. This is favorable as the survival fractions are systematically smaller than for the RH % cases. Hence, similar absolute errors over both sets of simulations would imply larger relative errors for RH % cases. Furthermore, the occurrence frequency of ice supersaturation is exponentially distributed with decreasing encounter probabilities for increasing RHi,amb values (Petzold et al., 2017). Increasing the weights is a pragmatic solution to put more emphasis on the low-RHi,amb cases.
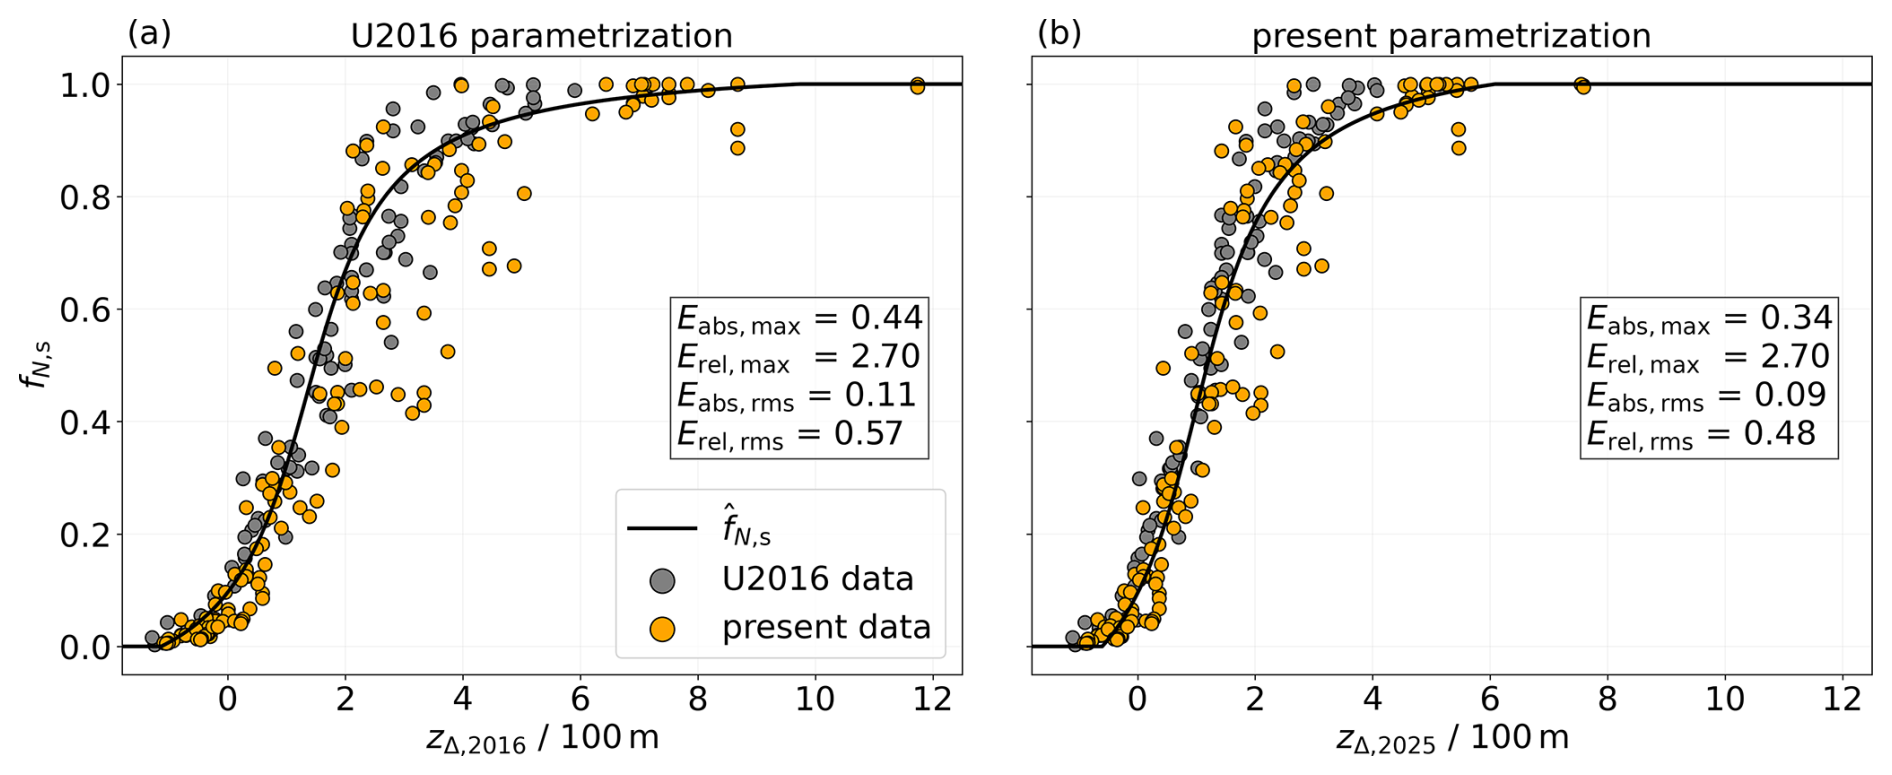
Figure 8Simulated survival fraction as a function of the parameter zΔ. The original (a) and updated (b) parameterizations are shown by the solid black line. Gray points represent the simulated survival fractions from the 2016 study, while orange points correspond to those from the present study. As the fit coefficients are adapted in the new formulation, the zΔ parameter differs in both versions, denoted by zΔ,2016 and zΔ,2025.
We propose the following values for the fitting coefficients:
Figure 8 presents a comparison between both versions, where the simulation data used to derive the original parameterization formulation are displayed in gray, while the present (additional) data points are shown in orange. Panel (a) depicts the 2016 parameterization curve. The new parameterization (panel b) reduces both the absolute maximum and root-mean-square error (see values inserted in the figure). The absolute root-mean-square is reduced by 2 %, whereas the relative root-mean-square error in the U2016 data is decreased by 9 %. Relative to the U2016 database, the new H2 simulations sample particularly the space for large and very small fN,s values more densely. The Supplement contains further plots that help to rate the changes implied by the new version.
In Fig. 9, we show the updated parameterization for various meteorological and aircraft scenarios. As indicated by its heading, each panel highlights specific sensitivity analyses. The dependencies of the survival fraction on the input parameters have been thoroughly explained in the preceding sections. The following will discuss the new insights gained from the updated parameterization. It can be observed that simulations performed at temperatures above 225 K are well represented by the parameterization. This holds for both the N0-upscaling and N0-downscaling scenarios. While a critical temperature exists above which contrail formation is not possible, this temperature threshold has no direct relevance for the microphysical processes during the vortex phase. Hence, it is not surprising that the validity of the parameterization extends beyond 225 K.
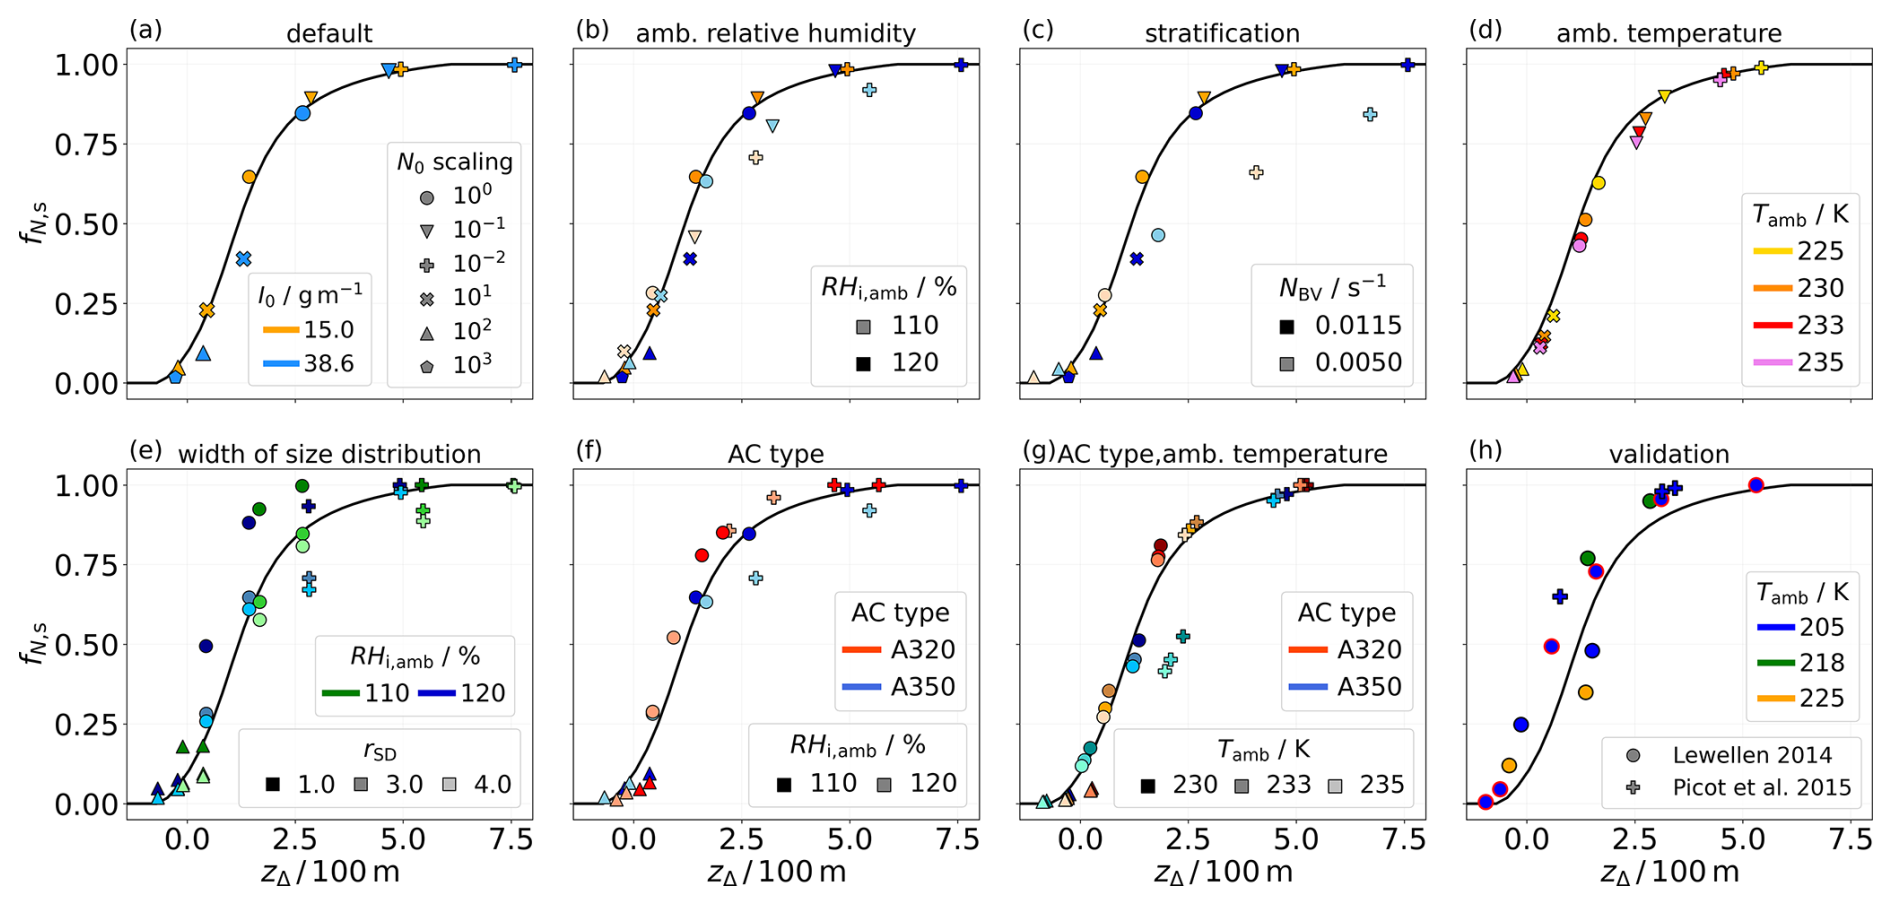
Figure 9Simulated survival fractions as functions of the parameter zΔ (), focusing exclusively on new H2 simulations. The symbol legend in panel (a) applies to panels (a)–(g), with symbols indicating N0-scaling information. In panels (a)–(c), blue symbols denote hydrogen water vapor emissions, while orange symbols represent kerosene cases. Each panel highlights a different meteorological or aircraft scenario, as the headings indicate. Panel (h) displays survival fractions from other studies for comparison and validation; there, symbols with a red outline correspond to a study investigating the effects of varying the ice crystal emission index (Lewellen et al., 2014).
The parameterization does not account for variations in rSD, meaning that data points from simulations with different rSD values but the same zΔ value are treated identically. Notably, for N0-upscaling cases, simulations with rSD=1.0 tend to show survival fractions that are somewhat overestimated. For the time being, this is an irreducible uncertainty partly due to idealizations in our initialization.
Regarding aircraft type, the parameterization effectively represents both A350 (bluish) and A320 (reddish) cases across upscaling and downscaling scenarios, as shown in panels (f) and (g). Additionally, the parameterization is consistent with other simulation results from studies such as Lewellen et al. (2014) and Picot et al. (2015), as highlighted in panel (h). Our updated H2 parameterization not only aligns well with these results but also particularly captures the ice crystal emission index variation study from Lewellen (2014), further demonstrating the validity of the new parameterization.
3.4 Impact of vortex phase processes on contrail-cirrus evolution
This section presents results of contrail-cirrus simulations and demonstrates the relevance of the ice crystal number in young contrails for the subsequent transition into contrail cirrus.
We employ the EULAG-LCM model in a setup largely based on that used in Unterstrasser et al. (2017a) and Unterstrasser et al. (2017b). The simulation domain consists of two dimensions, x (horizontal) and z (vertical), which are perpendicular to the flight direction. We embed the data of the vortex phase simulation (averaged along the flight direction) in a significantly larger simulation domain spanning 40 km in the x direction and 2.5 km in the z direction, with grid resolutions of m. The simulated time period is 8 h. The sedimentation velocities are determined using the Reynolds number and the maximum particle dimensions, as described in the Appendix of Sölch and Kärcher (2010). We prescribe a stepwise vertical profile of relative humidity, assuming an ambient ice supersaturated layer of 120 % between 1 and 2 km (see further details in, e.g., Unterstrasser et al., 2017a). Additionally, a synoptic-scale updraft with a velocity of w=1 cm s−1 is imposed over a period of approximately 6 h, leading to a final adiabatic cooling of 2 K. In these exemplary simulations, we model an A350 aircraft with TCA=225 K, s−1, , and rSD=3.0. In the first simulation series, the contrail-cirrus initialization is directly based on the results from the according vortex phase simulation (with s−1). The initialized contrail consists of ice crystals. In the second simulation series, we deliberately disregard vortex phase loss processes and initialize a contrail with N0 ice crystals. This is accomplished using the contrail data from the first simulation series and uniformly scaling up the ice crystal number concentrations by a factor of .
An important quantity for analyzing contrail evolution is the total extinction, which serves as a metric for the radiative effect of an individual contrail (Unterstrasser, 2020). It is defined as the horizontal integral of the extinction, , where τ represents the optical thickness along the vertical direction. Then, the total extinction is expressed as follows:
where is the extinction coefficient. It is proportional to the projected area of the ice crystals per unit volume. We assume an extinction efficiency Qext=2, as described in Schumann et al. (2011). Figure 10 illustrates the temporal evolution of the total ice crystal number (panel a) and the total extinction (panel b). In both panels, the color represents the N0 scaling, with red indicating upscaling scenarios and blue denoting downscaling scenarios. The line style differentiates between the two setups.
Based on this work, three key observations emerge. Firstly, E is significantly higher in the N0-upscaling scenarios. This outcome is expected, as total extinction is proportional to the effective surface area of the ice crystals; a larger number of ice crystals, as shown in panel (a), leads to a greater extinction. Secondly, the contrail (cirrus) dissipates more quickly when N0 is smaller. In the scenario where N0 is reduced by a factor of 100 (dark blue), the contrail disappears after only a few hours, indicating a significantly shorter lifetime. Thirdly, we observe an increase in E in the scenarios where the vortex phase losses are disregarded. In these cases, the contrail is initialized with more ice crystals compared to the first simulation series (see panel a).
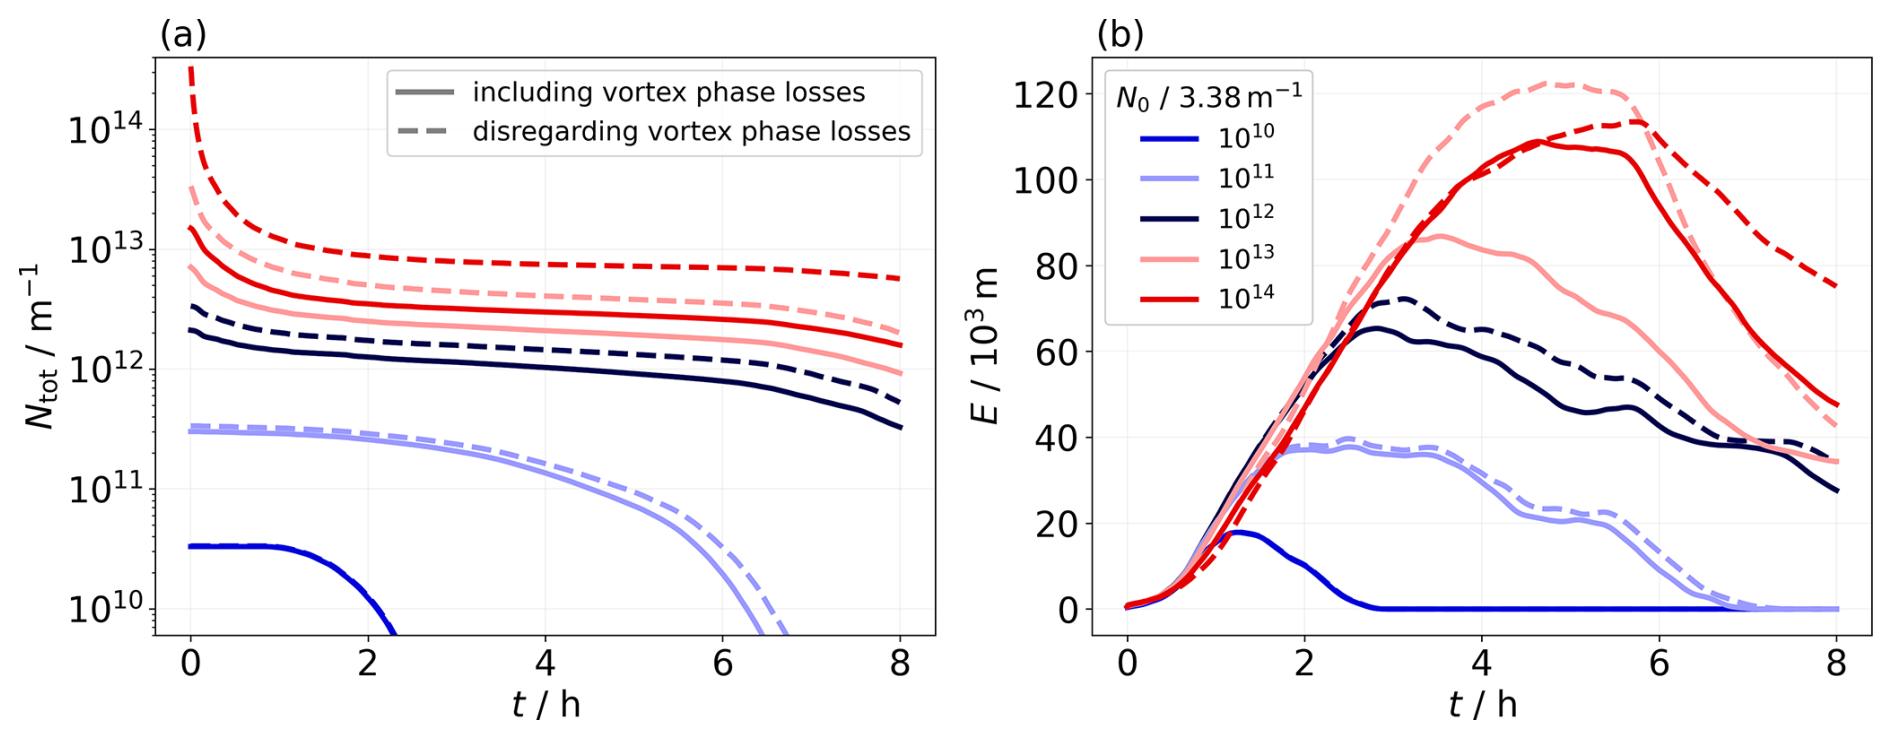
Figure 10Time evolution of the total number of ice crystals (a) and the total extinction (b) for the N0-upscaling and N0-downscaling cases. In the first simulation series, the contrails are initialized using the final state from the respective vortex phase simulations; in the second simulation series, the ice crystal numbers are upscaled by the respective survival fractions.
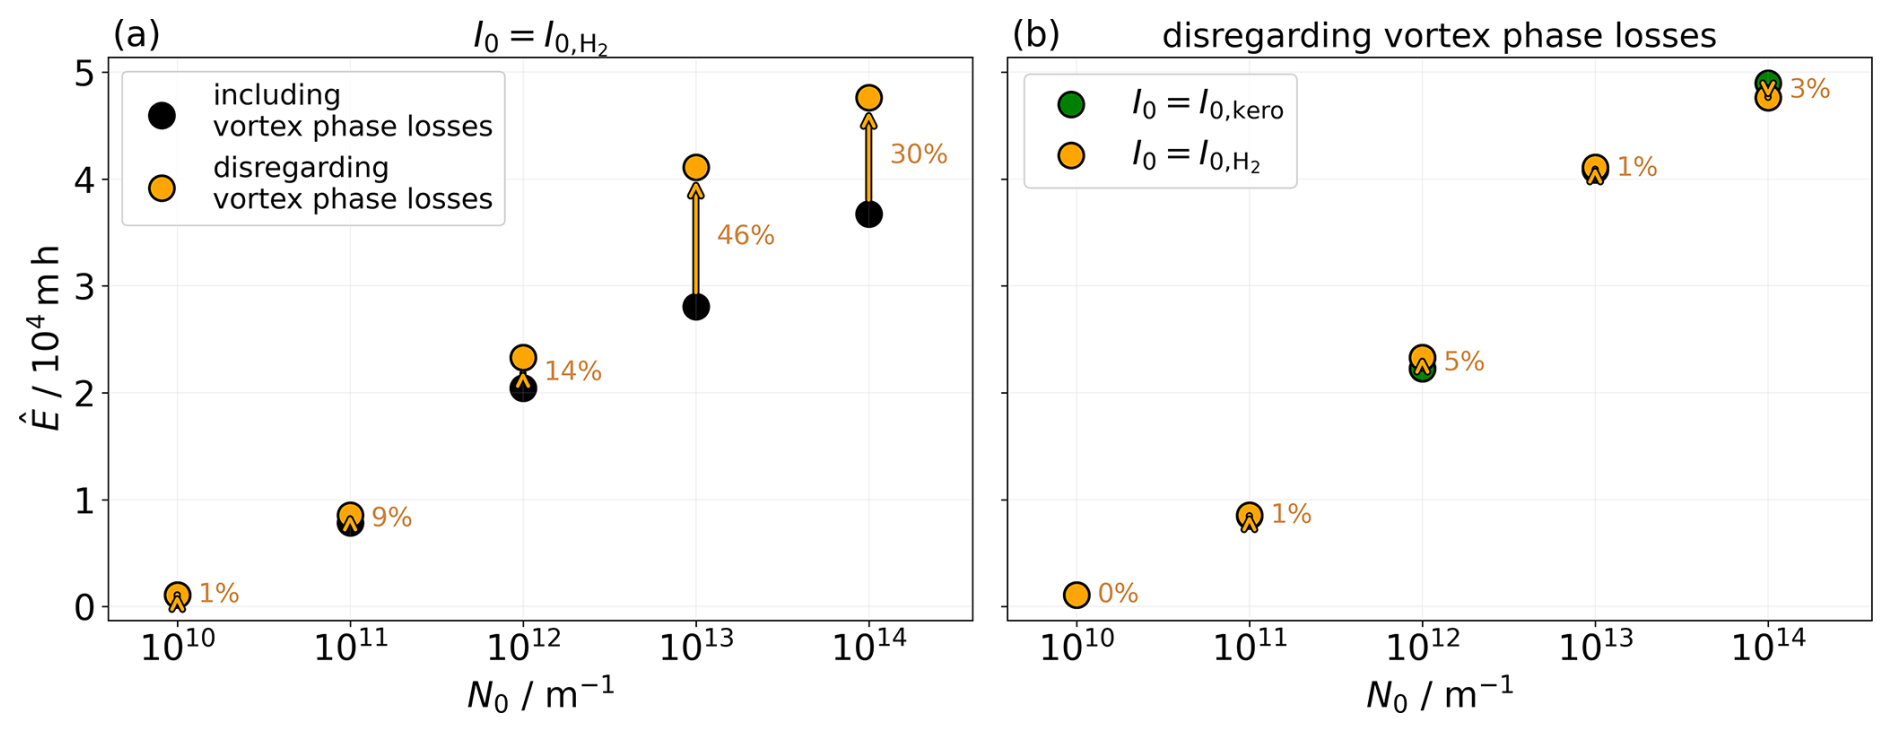
Figure 11Lifetime-integrated total extinction () for all five N0-scaling scenarios. Panel (a) highlights the increase in this quantity in the second simulation series (shown by the orange points). Panel (b) displays for both I0 options. The orange points are the same in both panels.
A qualitative comparison of the two setups can be made by examining the lifetime-integrated total extinction values, , that are displayed in Fig. 11a. Ignoring vortex phase losses leads, at maximum, to a difference in lifetime-integrated total extinction of 46 %. This indicates that the radiative impact of an individual contrail can be significantly overestimated if vortex phase processes, such as contrail expansion and ice crystal sublimation in the primary wake, are not considered. The nonlinear increase in the difference between both setups in the N0-upscaling simulations may be attributed to saturation effects. As the number of ice crystals increases, competition for available water vapor in the spreading contrail cirrus becomes more important. Consequently, the peak ice mass does not continue to grow indefinitely with increasing N0 values but is expected to reach a limit eventually. This explains why the simulation with a 100-fold increase in N0 shows a smaller increase in lifetime-integrated total extinction when disregarding the vortex phase losses compared to the simulation with a 10-fold increase in N0. We repeated this kind of simulation series, i.e., disregarding the crystal losses from the vortex phase, for the I0,kero scenario. Interestingly, we observe only a small impact on the lifetime-integrated total extinction, with differences of ≤5 %, when the vortex phase losses are ignored (see Fig. 11b). This suggests that the initial water vapor emission, compared to the ice crystal number, has only a minor impact on the radiative effect of an individual contrail cirrus cloud.
This is just one example of a contrail-cirrus simulation set. A comprehensive analysis, examining various meteorological parameters, will follow.
This study highlights the importance of ice crystal loss during the vortex phase depending on the propulsion system. While previous research has examined the effect of initial ice crystal numbers on crystal loss – such as Lewellen (2014), who varied the ice crystal emission index across 6 orders of magnitude, and Unterstrasser (2014), who explored a variation over 2 orders of magnitude – this work takes a systematic approach tailored explicitly to H2 contrails. It uniquely combines variations in the initial number of ice crystals with adjustments to the emitted water vapor mass. The N0-upscaling scenarios may not only represent a potential H2 fuel cell setup but also account for the formation of contrail ice crystals on ultrafine volatile particles (UFPs). UFPs, typically nanometer-sized particles, can contribute to ice crystal formation if the plume supersaturation is high enough to overcome the Kelvin barrier for activation (Kärcher et al., 2015). This requires the reduction in the soot particle number of at least 10-fold, preventing them from acting as the primary condensation nuclei for water vapor, and an ambient temperature significantly below the formation threshold (Kärcher, 2018).
In addition to nitrogen species emissions from H2 engines, oil vapor emissions due to engine lubrication systems are possible (Ungeheuer et al., 2022; Bier et al., 2024). This can lead to the nucleation into ultrafine oil droplets, as observed in measurements (Ungeheuer et al., 2021). Experiments by Ponsonby et al. (2024) explored the potential of lubrication oil droplets to act as contrail ice-forming particles, revealing that these droplets are less effective as condensation nuclei than soot particles within the temperature range of 225–245 K. Nevertheless, the study showed that lubrication oil droplets can competitively deplete plume supersaturation under soot-poor conditions, as their critical supersaturation is readily achievable. In H2 plumes, these ultrafine oil droplets might contribute to ice crystal formation alongside background aerosols. Further research on the properties of oil droplets, such as their size distribution and emission indices, is necessary to fully understand their potential role in contrail ice crystal formation processes. Yu et al. (2024) highlight that UFPs might significantly contribute to the total number of contrail ice particles if the sizes of the soot particles are reduced. Hence, understanding the role of UFPs in the contrail formation process requires the consideration of both soot emissions and particle sizes. The UFP number could potentially exceed that of emitted soot particles per flight distance, leading to a larger number of nucleated ice crystals in H2 plumes compared to conventional kerosene plumes (Kärcher et al., 2015; Bier et al., 2024). This justifies our approach of increasing the initial number of ice crystals to capture possible scenarios of additional ice-forming particle sources.
Furthermore, this study addresses a previously unexplored area by analyzing contrail evolution during the vortex phase at temperatures >225 K. At higher ambient temperatures, the number of nucleated ice crystals decreases, increasing the number of ice crystals that survive the vortex phase (Bier and Burkhardt, 2022). As our study design is independent of the specific formation processes, it hypothetically determines the survival fractions for a given fixed N0.
We revised the original formulation of the vortex loss parameterization by incorporating the conservation of mass mixing ratios, adding a layer of complexity to the equations but ensuring that the physical assumptions are accurately represented. With appropriately chosen parameters, the arc tangent curve fits the data points well, both from U2016 and the present study. Additionally, the new formulation of the fitting function is designed to account for scenarios in which N0 is significantly upscaled. Although the parameterization is based on the N0-scaling study spanning 4 orders of magnitude, it remains applicable even for more extreme values of N0. The parameterization also yields plausible results in terms of high ambient temperatures. The updated parameterization does not fully capture specific data points, particularly in cases with decreased stratification and downscaled N0 values. As the length scale zdesc is the quantity that accounts for the variation in atmospheric stability, an adjustment to the formulation of zdesc, as initially proposed by Unterstrasser (2014), may be necessary to improve accuracy.
Next, we motivate our new choice for the adaptation factor Ψ in the updated ice crystal loss parameterization. The original version in U2016 was based on simulations that all had the same value, and the emission index EIiceno was a good estimator of the representative ice crystal size in the contrail. A straightforward generalization would be to replace EIiceno by the ratio in the definition of Ψ. However, this quantity is only a proxy for the ice crystal mean mass () when all emitted water vapor deposits on the ice crystals, yet it neglects the contribution from the environment. Keeping in mind that the buffering effect of the two water vapor sources (from emission and from the environment) is already captured by zΔ, we now define Ψ as a proxy for the typical ice crystal number concentration in the primary wake. The exact definition can be found in Sect. A1 in Appendix A.
One main goal of our study is to understand and systematically analyze the impact of the initial ice crystal number and of an assumed water vapor emission on the early contrail properties. We neglect any possible changes in aircraft geometry, mass, overall propulsion efficiency, etc., between current kerosene-driven aircraft and future H2 aircraft. Clearly, such adaptations would affect the strength of the wake vortices and the fuel consumption (in addition to the factor of 2.79−1 mentioned above). Moreover, H2 fuel cells produce electric power that drives propellers. Design concepts with different numbers and positions of propellers and exhaust outlets exist in the literature (e.g., Marciello et al., 2023; Tiwari et al., 2024). Understanding the formation and the early evolution of contrails behind a propeller-driven aircraft deserves separate modeling studies. For the time being, we prefer to limit our study to variations in N0 and I0 without any other aircraft adaptation in order to avoid complicating and overloading the interpretation of our results.
Once H2 aircraft designs are less hypothetical, one could incorporate such adaptations (like a systematically higher aircraft mass due to larger tank systems or particular aspects of H2 fuel cell aircraft) in subsequent modeling studies.
The updated parameterization is now prepared for integration into large-scale global models, where the U2016 parameterization is already implemented (Bier and Burkhardt, 2022). Bier and Burkhardt (2022) underscore the significance of the initial number of ice crystals, highlighting the critical role of our study, which focuses on the vortex phase and ice crystal loss, in assessing the climate impact of H2 contrails.
In this study, we simulated the evolution of contrails up to an age of approximately 6 min using the EULAG-LCM model, a fluid dynamics solver coupled with a particle-based microphysical model. The focus is on contrails produced by hydrogen-powered aircraft, including both hydrogen direct combustion and hydrogen fuel cell systems. The simulations assume that ice crystal formation and vortex roll-up are complete at initialization. We varied the initial number of ice crystals over a wide range spanning 4 orders of magnitude, from 3.38×10¹⁰ m−1 (0.85×10¹⁰ m−1) to 3.38×10¹⁴ m−1 (0.85×10¹⁴ m−1) for an A350/B777-like (A320/B737-like) aircraft. Additionally, we scaled the emitted water vapor by a factor of 2.57 compared to the reference kerosene case. A parameter study was conducted, varying meteorological, microphysical, and aircraft parameters, focusing on the survival fraction/final number of ice crystals, a critical factor influencing subsequent contrail evolution.
Our simulations indicate that ice crystals tend to be larger in contrails from hydrogen-powered aircraft, leading to a higher likelihood of surviving the vortex phase. This effect is also observed in contrails initialized with a very small number of ice crystals, where the limited competition for available water vapor during depositional growth promotes the formation of larger ice crystals. As anticipated in previous studies, we find initial differences in the ice crystal number getting reduced after the vortex phase. The higher the initial ice crystal number, the stronger this reduction. This finding is independent of any meteorological condition. Sublimation driven by adiabatic heating in the descending vortex pair becomes more significant under drier atmospheric conditions, a trend consistent across all N0 variations. Furthermore, a higher ambient temperature enhances ice crystal sublimation, although the surviving crystals tend to be larger. We find that the temperature sensitivity is particularly pronounced in the N0-upscaling scenarios. Reduced thermal stratification leads to a more significant loss of ice crystals, with this effect being more pronounced at higher initial ice crystal numbers and under drier atmospheric conditions. A shift towards a narrower initial size distribution generally produces larger ice crystal sizes, thereby reducing the extent to which initial differences are balanced, as we have consistently observed in the H2 simulations. The weaker vortex descent associated with smaller aircraft results in a reduced sublimation of ice crystals in the primary wake, leading to higher survival fractions in the case of A320 aircraft. This trend is consistent across all N0 values and ambient temperature scenarios.
We have refined the existing parameterization of ice crystal loss, presented by Unterstrasser (2016), by incorporating a new set of H2-contrail simulations. Given that the new simulations tend to cluster at the extremes of the parameterization function, we adjusted the fitting procedure to better capture these behaviors. The updated set of fitting coefficients is provided. A comparison with simulation results from other studies demonstrates a good agreement with our updated parameterization.
It is not yet possible to make a definitive assessment of whether flying with hydrogen is advantageous from a contrail perspective. Further research is needed to assess contrail formation processes for hydrogen propulsion, with measurement results (Airbus, 2023) providing essential insights. As shown in Figs. 10 and 11, the initial number of ice crystals has a significant impact on the subsequent characteristics of the contrail. This study aimed to conduct a broad analysis of N0 during the first 6 min of contrail evolution. More robustly determining the number of ice crystals formed in the H2 case remains an active area of research.
The analysis of the complete set of contrail-cirrus simulations (extending the study that is demonstrated in Sect. 3.4), which are based on the H2-contrail vortex phase simulations presented here, is in progress.
A1 Definition of the ice crystal concentration n0 in the new parameterization
As described in Sect. 3.3, the adaptation factor Ψ accounting for the mean ice crystal size (in the original formulation given by ) is now defined differently. In the new formulation, Ψ is expressed as , where n0 represents an (intermediate) ice crystal number concentration:
where N0 is the initial ice crystal number (per meter of flight path) and Ap is the intermediate plume cross-sectional area. Hence, n0 represents an average concentration in the primary wake. We recall (see Eq. 1) and the empirical relationships for conventional aircraft designs of different sizes as studied in Unterstrasser and Görsch (2014) and derived in U2016: (Eq. A9 in U2016) and (Eqs. A6 and A7 in U2016), where bspan is the wingspan of the aircraft. Hence, n0 is roughly independent of aircraft type, but it depends linearly on EIiceno. Note that the empirical relation for Ap is derived from the simulation results and is not supposed to be adapted. The actual fuel consumption mC may, however, deviate from the empirical relationship representing typical kerosene fuels and should serve as input to the parameterization.
The parameterization was trained such that the kerosene A350 simulations serve as reference cases for determining n0,ref and (with m−1 and m). Note that, in particular, the mC values of our A350 setups deviate from the empirical relationship (see Fig. A1c in U2016); hence, switching to a smaller A320 aircraft gives a smaller n0 value (1.29×10⁹ m−3 (A350) versus 8.93×10⁸ m−3 (A320)), leading to .
A2 Differences between the original and new parameterization implementation
This section summarizes the differences between the original parameterization provided in Unterstrasser (2016) and the new one presented in Sect. 3.3. The overall design of the parameterization has not changed, and the cookbook of individual computations, as listed in Sect. A6 of U2016, received only minor changes, which are as follows:
-
In step 2, the formula for computing the plume area is now ; this replaces Eq. (A7) of U2016, which was given by .
-
In step 3, zatm and zemit are redefined using the adiabatic index κ (as given in Eqs. 6 and 7). Moreover, the bisection method for solving the nonlinear equation can be replaced by analytically defined fit functions provided in the subsequent subsection.
-
In steps 3 and 4, new values for the fitting coefficients are used as given in Eqs. (13a)–(13g). Moreover, the adaptation factor Ψ uses a new definition as given in Sect. A1.
The Supplement contains Fortran and Python implementations of the new and the original parameterization.
A3 Analytical fit functions of zatm and zemit
To compute the length scales zatm and zemit (Eqs. 6 and 7), we have, thus far, employed the numerical bisection method. Here, we present an alternative approach that directly calculates these length scales based on input data for temperature, ambient supersaturation, and water vapor concentration. The corresponding formulae are as follows:
and
with .
The resulting length scales show only slight deviations from those derived using the bisection method, with a maximum deviation of 3 m for zatm and 7 m for zemit. Applying the analytical relations to calculate the parameterized survival fraction, we observe no change in 44 % of the data (when rounded to two digits, as done in Table A1) and a maximum deviation of 2 %. A detailed comparison is provided in Table S1 in the Supplement. The Supplement contains further plots that demonstrate the suitability of the fit functions.
Table A1Summary of the simulations performed. Columns 3–5 list the meteorological parameters, while columns 6–8 present the microphysical initialization settings. Columns 9 and 10 display both the simulated and parameterized survival fractions. Lastly, columns 11–13 specify the length scales employed in the parameterization. Rows displaying five simulations correspond to sets with N0-scaling factors of 100, 10, 1, 0.1, and 0.01. Rows showing three simulations represent sets with scaling factors of 100, 1, and 0.01. In the third row, a total of six simulations are included, with simulation 11 using a scaling factor of 1000.
* The slight variation in with rSD is not a direct dependence but, rather, stems from an implicit dependence of on rSD via N0 due to the numerical discretization in the ice particles' initialization process.
The presented data are available from the corresponding author upon request (annemarie.lottermoser@dlr.de).
The supplement related to this article is available online at https://doi.org/10.5194/acp-25-7903-2025-supplement.
AL performed the simulations, created the tables and figures, and wrote the manuscript with contributions from SU. AL and SU conceptualized the study, evaluated and interpreted the results, and worked on the parameterization extension.
The contact author has declared that neither of the authors has any competing interests.
Publisher's note: Copernicus Publications remains neutral with regard to jurisdictional claims made in the text, published maps, institutional affiliations, or any other geographical representation in this paper. While Copernicus Publications makes every effort to include appropriate place names, the final responsibility lies with the authors.
This work contributes to the DLR internal projects H2CONTRAIL and H2EAT. The authors thank Klaus Gierens and Charles Renard for feedback on the initial paper draft. They also thank the reviewers for valuable comments.
This work used resources of the Deutsches Klimarechenzentrum (DKRZ) granted by its Scientific Steering Committee (WLA) under project no. bd0832. Both authors received funding from Airbus SAS within the framework of understanding contrails from hydrogen propulsion.
The article processing charges for this open-access publication were covered by the German Aerospace Center (DLR).
This paper was edited by Fangqun Yu and reviewed by two anonymous referees.
Airbus: Towards the world's first hydrogen-powered commercial aircraft, https://www.airbus.com/en/innovation/energy-transition/hydrogen/zeroe#concepts (last access: 27 October 2024), 2020. a
Airbus: Contrail-chasing Blue Condor makes Airbus' first full hydrogen-powered flight, https://www.airbus.com/en/newsroom/stories/2023-11-contrail-chasing-blue-condor-makes-airbus-first-full-hydrogen-powered# (last access: 15 November 2024), 2023. a
Bier, A. and Burkhardt, U.: Impact of Parametrizing Microphysical Processes in the Jet and Vortex Phase on Contrail Cirrus Properties and Radiative Forcing, J. Geophys. Res., 127, e2022JD036677, https://doi.org/10.1029/2022JD036677, 2022. a, b, c, d, e, f, g, h
Bier, A., Burkhardt, U., and Bock, L.: Synoptic Control of Contrail Cirrus Life Cycles and Their Modification Due to Reduced Soot Number Emissions, J. Geophys. Res., 122, 11584–11603, https://doi.org/10.1002/2017JD027011, 2017. a
Bier, A., Unterstrasser, S., Zink, J., Hillenbrand, D., Jurkat-Witschas, T., and Lottermoser, A.: Contrail formation on ambient aerosol particles for aircraft with hydrogen combustion: a box model trajectory study, Atmos. Chem. Phys., 24, 2319–2344, https://doi.org/10.5194/acp-24-2319-2024, 2024. a, b, c, d, e, f, g, h, i, j, k, l
Bräuer, T., Voigt, C., Sauer, D., Kaufmann, S., Hahn, V., Scheibe, M., Schlager, H., Huber, F., Le Clercq, P., Moore, R. H., and Anderson, B. E.: Reduced ice number concentrations in contrails from low-aromatic biofuel blends, Atmos. Chem. Phys., 21, 16817–16826, https://doi.org/10.5194/acp-21-16817-2021, 2021. a
Burkhardt, U. and Kärcher, B.: Global radiative forcing from contrail cirrus, Nat. Clim. Change., 1, 54–58, https://doi.org/10.1038/nclimate1068, 2011. a
Burkhardt, U., Bock, L., and Bier, A.: Mitigating the contrail cirrus climate impact by reducing aircraft soot number emissions, npj Climate and Atmospheric Science, 1, 37, https://doi.org/10.1038/s41612-018-0046-4, 2018. a, b, c
Clark, T. L. and Farley, R. D.: Severe downslope windstorm calculations in two and three spatial dimensions using anelastic interactive grid nesting: a possible mechanism for gustiness, J. Atmos. Sci., 41, 329–350, 1984. a
Crow, S.: Stability theory for a pair of trailing vortices, AIAA Journal, 8, 2172–2179, 1970. a, b
Gierens, K.: Theory of Contrail Formation for Fuel Cells, Aerospace, 8, 164, https://doi.org/10.3390/aerospace8060164, 2021. a
Gierens, K. and Spichtinger, P.: On the size distribution of ice-supersaturated regions in the upper troposphere and lowermost stratosphere, Ann. Geophys., 18, 499–504, https://doi.org/10.1007/s00585-000-0499-7, 2000. a
Gierens, K., Matthes, S., and Rohs, S.: How Well Can Persistent Contrails Be Predicted?, Aerospace, 7, 169, https://doi.org/10.3390/aerospace7120169, 2020. a
Gruber, S., Unterstrasser, S., Bechtold, J., Vogel, H., Jung, M., Pak, H., and Vogel, B.: Contrails and their impact on shortwave radiation and photovoltaic power production – a regional model study, Atmos. Chem. Phys., 18, 6393–6411, https://doi.org/10.5194/acp-18-6393-2018, 2018. a
Huebsch, W. and Lewellen, D.: Sensitivity Study on Contrail Evolution, 36 th AIAA Fluid Dynamics Conference and Exhibit, AIAA 2006-3749, 1–14, https://doi.org/10.2514/6.2006-3749, 2006. a
Jansen, J. and Heymsfield, A. J.: Microphysics of Aerodynamic Contrail Formation Processes, J. Atmos. Sci., 72, 3293–3308, https://doi.org/10.1175/JAS-D-14-0362.1, 2015. a
Kärcher, B.: Formation and radiative forcing of contrail cirrus, Nat. Commun., 9, 1824, https://doi.org/10.1038/s41467-018-04068-0, 2018. a
Kärcher, B., Burkhardt, U., Bier, A., Bock, L., and Ford, I. J.: The microphysical pathway to contrail formation, J. Geophys. Res., 120, 7893–7927, https://doi.org/10.1002/2015JD023491, 2015. a, b, c, d
Kaufmann, S., Dischl, R., and Voigt, C.: Regional and seasonal impact of hydrogen propulsion systems on potential contrail cirrus cover, Atmos. Environ., 24, 100298, https://doi.org/10.1016/j.aeaoa.2024.100298, 2024. a
Kazula, S., de Graaf, S., and Enghardt, L.: Review of fuel cell technologies and evaluation of their potential and challenges for electrified propulsion systems in commercial aviation, Journal of the Global Power and Propulsion Society, 7, 43–57, https://doi.org/10.33737/jgpps/158036, 2023. a
Lee, D. S., Fahey, D. W., Skowron, A., Allen, M. R., Burkhardt, U., Chen, Q., Doherty, S. J., Freeman, S., Forster, P. M., Fuglestvedt, J., Gettelman, A., De León, R. R., Lim, L. L., Lund, M. T., Millar, R. J., Owen, B., Penner, J. E., Pitari, G., Prather, M. J., Sausen, R., and Wilcox, L. J.: The contribution of global aviation to anthropogenic climate forcing for 2000 to 2018, Atmos. Environ., 244, 117834, https://doi.org/10.1016/j.atmosenv.2020.117834, 2021. a
Lee, D. S., Allen, M. R., Cumpsty, N., Owen, B., Shine, K. P., and Skowron, A.: Uncertainties in mitigating aviation non-CO2 emissions for climate and air quality using hydrocarbon fuels, Environ. Sci.: Atmos., 3, 1693–1740, https://doi.org/10.1039/D3EA00091E, 2023. a
Lewellen, D. and Lewellen, W.: Large-eddy simulations of the vortex-pair breakup in aircraft wakes, AIAA Journal, 34, 2337–2345, 1996. a
Lewellen, D. C.: Persistent contrails and contrail cirrus. Part 2: Full Lifetime Behavior, J. Atmos. Sci., 71, 4420–4438, https://doi.org/10.1175/JAS-D-13-0317.1, 2014. a, b
Lewellen, D. C. and Lewellen, W. S.: Effects of aircraft wake dynamics on measured and simulated NOx and HOx wake chemistry, J. Geophys. Res., 106, 27661–27672, 2001. a, b
Lewellen, D. C., Meza, O., and Huebsch, W. W.: Persistent contrails and contrail cirrus. Part 1: Large-eddy simulations from inception to demise, J. Atmos. Sci., 71, 4399–4419, https://doi.org/10.1175/JAS-D-13-0316.1, 2014. a, b, c, d, e, f
Marciello, V., Di Stasio, M., Ruocco, M., Trifari, V., Nicolosi, F., Meindl, M., Lemoine, B., and Caliandro, P.: Design Exploration for Sustainable Regional Hybrid-Electric Aircraft: A Study Based on Technology Forecasts, Aerospace, 10, 165, https://doi.org/10.3390/aerospace10020165, 2023. a
Märkl, R. S., Voigt, C., Sauer, D., Dischl, R. K., Kaufmann, S., Harlaß, T., Hahn, V., Roiger, A., Weiß-Rehm, C., Burkhardt, U., Schumann, U., Marsing, A., Scheibe, M., Dörnbrack, A., Renard, C., Gauthier, M., Swann, P., Madden, P., Luff, D., Sallinen, R., Schripp, T., and Le Clercq, P.: Powering aircraft with 100 % sustainable aviation fuel reduces ice crystals in contrails, Atmos. Chem. Phys., 24, 3813–3837, https://doi.org/10.5194/acp-24-3813-2024, 2024. a
Marks, T., Dahlmann, K., Grewe, V., Gollnick, V., Linke, F., Matthes, S., Stumpf, E., Swaid, M., Unterstrasser, S., Yamashita, H., and Zumegen, C.: Climate Impact Mitigation Potential of Formation Flight, Aerospace, 8, 14, https://doi.org/10.3390/aerospace8010014, 2021. a
Moore, R. H., Thornhill, K. L., Weinzierl, B., Sauer, D., D'Ascoli, E., Kim, J., Lichtenstern, M., Scheibe, M., Beaton, B., Beyersdorf, A. J., Barrick, J., Bulzan, D., Corr, C. A., Crosbie, E., Jurkat, T., Martin, R., Riddick, D., Shook, M., Slover, G., Voigt, C., White, R., Winstead, E., Yasky, R., Ziemba, L. D., Brown, A., Schlager, H., and Anderson, B. E.: Biofuel blending reduces particle emissions from aircraft engines at cruise conditions, Nature, 543, 411–415, https://doi.org/10.1038/nature21420, 2017. a
Petzold, A., Kramer, M., Neis, P., Rolf, C., Rohs, S., Berkes, F., Smit, H. G. J., Gallagher, M., Beswick, K., Lloyd, G., Baumgardner, D., Spichtinger, P., Nedelec, P., Ebert, V., Buchholz, B., Riese, M., and Wahner, A.: Upper tropospheric water vapour and its interaction with cirrus clouds as seen from IAGOS long-term routine in situ observations, Faraday Discuss., 200, 229–249, https://doi.org/10.1039/C7FD00006E, 2017. a
Picot, J., Paoli, R., Thouron, O., and Cariolle, D.: Large-eddy simulation of contrail evolution in the vortex phase and its interaction with atmospheric turbulence, Atmos. Chem. Phys., 15, 7369–7389, https://doi.org/10.5194/acp-15-7369-2015, 2015. a
Ponsonby, J., King, L., Murray, B. J., and Stettler, M. E. J.: Jet aircraft lubrication oil droplets as contrail ice-forming particles, Atmos. Chem. Phys., 24, 2045–2058, https://doi.org/10.5194/acp-24-2045-2024, 2024. a, b
Prusa, J., Smolarkiewicz, P., and Wyszogrodzki, A.: EULAG, a computational model for multiscale flows, Comput. Fluids, 37, 1193–1207, https://doi.org/10.1016/j.compfluid.2007.12.001, 2008. a
Schumann, U.: On conditions for contrail formation from aircraft exhausts, Meteorol. Z., 5, 4–23, https://doi.org/10.1127/metz/5/1996/4, 1996. a, b, c, d, e
Schumann, U., Mayer, B., Gierens, K., Unterstrasser, S., Jessberger, P., Petzold, A., Voigt, C., and Gayet, J.-F.: Effective Radius of Ice Particles in Cirrus and Contrails, J. Atmos. Sci., 68, 300–321, https://doi.org/10.1175/2010JAS3562.1, 2011. a
Smolarkiewicz, P. and Margolin, L.: On forward-in-time differencing for fluids: an Eulerian/semi-Lagrangian non-hydrostatic model for stratified flows, Atmosphere-Ocean Special, 35, 127–152, 1997. a
Sölch, I. and Kärcher, B.: A large-eddy model for cirrus clouds with explicit aerosol and ice microphysics and Lagrangian ice particle tracking, Q. J. Roy. Meteor. Soc., 136, 2074–2093, https://doi.org/10.1002/qj.689, 2010. a, b
Sussmann, R. and Gierens, K.: Lidar and numerical studies on the different evolution of vortex pair and secondary wake in young contrails, J. Geophys. Res., 104, 2131–2142, 1999. a, b
Tiwari, S., Pekris, M. J., and Doherty, J. J.: A review of liquid hydrogen aircraft and propulsion technologies, Int. J. Hydrogen Energ., 57, 1174–1196, https://doi.org/10.1016/j.ijhydene.2023.12.263, 2024. a
Ungeheuer, F., van Pinxteren, D., and Vogel, A. L.: Identification and source attribution of organic compounds in ultrafine particles near Frankfurt International Airport, Atmos. Chem. Phys., 21, 3763–3775, https://doi.org/10.5194/acp-21-3763-2021, 2021. a
Ungeheuer, F., Caudillo, L., Ditas, F., Simon, M., van Pinxteren, D., Kilic, D., Rose, D., Jacobi, S., Kürten, A., Curtius, J., and Vogel, A. L.: Nucleation of jet engine oil vapours is a large source of aviation-related ultrafine particles, Commun. Earth Environ., 3, 1–8, https://doi.org/10.1038/s43247-022-00653-w, 2022. a, b
Unterstrasser, S.: Large eddy simulation study of contrail microphysics and geometry during the vortex phase and consequences on contrail-to-cirrus transition, J. Geophys. Res., 119, 7537–7555, https://doi.org/10.1002/2013JD021418, 2014. a, b, c, d, e, f, g, h, i
Unterstrasser, S.: Properties of young contrails – a parametrisation based on large-eddy simulations, Atmos. Chem. Phys., 16, 2059–2082, https://doi.org/10.5194/acp-16-2059-2016, 2016. a, b, c, d, e, f, g, h, i, j, k, l
Unterstrasser, S.: The Contrail Mitigation Potential of Aircraft Formation Flight Derived from High-Resolution Simulations, Aerospace, 7, 170, https://doi.org/10.3390/aerospace7120170, 2020. a, b, c
Unterstrasser, S. and Gierens, K.: Numerical simulations of contrail-to-cirrus transition – Part 2: Impact of initial ice crystal number, radiation, stratification, secondary nucleation and layer depth, Atmos. Chem. Phys., 10, 2037–2051, https://doi.org/10.5194/acp-10-2037-2010, 2010. a
Unterstrasser, S. and Görsch, N.: Aircraft-type dependency of contrail evolution, J. Geophys. Res., 119, 14015–14027, https://doi.org/10.1002/2014JD022642, 2014. a, b, c, d, e
Unterstrasser, S. and Sölch, I.: Study of contrail microphysics in the vortex phase with a Lagrangian particle tracking model, Atmos. Chem. Phys., 10, 10003–10015, https://doi.org/10.5194/acp-10-10003-2010, 2010. a, b, c, d, e, f, g
Unterstrasser, S. and Stephan, A.: Far field wake vortex evolution of two aircraft formation flight and implications on young contrails, Aeronaut. J., 124, 667–702, https://doi.org/10.1017/aer.2020.3, 2020. a
Unterstrasser, S., Paoli, R., Sölch, I., Kühnlein, C., and Gerz, T.: Dimension of aircraft exhaust plumes at cruise conditions: effect of wake vortices, Atmos. Chem. Phys., 14, 2713–2733, https://doi.org/10.5194/acp-14-2713-2014, 2014. a, b
Unterstrasser, S., Gierens, K., Sölch, I., and Lainer, M.: Numerical simulations of homogeneously nucleated natural cirrus and contrail-cirrus. Part 1: How different are they?, Meteorol. Z., 26, 621–642, https://doi.org/10.1127/metz/2016/0777, 2017a. a, b, c, d
Unterstrasser, S., Gierens, K., Sölch, I., and Wirth, M.: Numerical simulations of homogeneously nucleated natural cirrus and contrail-cirrus. Part 2: Interaction on local scale, Meteorol. Z., 26, 643–661, https://doi.org/10.1127/metz/2016/0780, 2017b. a, b
Voigt, C., Kleine, J., Sauer, D., Moore, R. H., Bräuer, T., Le Clercq, P., Kaufmann, S., Scheibe, M., Jurkat-Witschas, T., Aigner, M., Bauder, U., Boose, Y., Borrmann, S., Crosbie, E., Diskin, G. S., DiGangi, J., Hahn, V., Heckl, C., Huber, F., Nowak, J. B., Rapp, M., Rauch, B., Robinson, C., Schripp, T., Shook, M., Winstead, E., Ziemba, L., Schlager, H., and Anderson, B. E.: Cleaner burning aviation fuels can reduce contrail cloudiness, Commun. Earth Environ., 2, 114, https://doi.org/10.1038/s43247-021-00174-y, 2021. a
Wölk, J. and Strey, R.: Homogeneous Nucleation of H2O and D2O in Comparison: The Isotope Effect, J. Phys. Chem. B, 105, 11683–11701, https://doi.org/10.1021/jp0115805, 2001. a
Yu, F., Kärcher, B., and Anderson, B. E.: Revisiting Contrail Ice Formation: Impact of Primary Soot Particle Sizes and Contribution of Volatile Particles, Environ. Sci. Technol., 58, 17650–17660, https://doi.org/10.1021/acs.est.4c04340, 2024. a