the Creative Commons Attribution 4.0 License.
the Creative Commons Attribution 4.0 License.
 | 22 Jul 2025
Measurement report: Insight into greenhouse gas emission characteristics of light-duty vehicles in China in the context of technological innovation
Xinping Yang
Jia Ke
Zhihui Huang
Yi Wen
Dailin Yin
Zhen Jiang
Zhigang Yue
Yunjing Wang
Songdi Liao
Hang Yin
Yan Ding
Greenhouse gas (GHG) emissions represent a pivotal driver of global climate change, with vehicular emissions, particularly from light-duty vehicles, emerging as a prominent source of GHGs. Despite extensive research on gaseous pollutants, studies on GHG emissions within the framework of carbon neutrality remain scarce. This study delves into the emission characteristics of three primary GHGs (carbon dioxide (CO2), methane (CH4), and nitrous oxide (N2O)) from various light-duty vehicles, encompassing conventional gasoline and hybrid vehicles and bi-fuel taxis. As anticipated, with advancements in emission standards and powertrains, vehicular GHG emissions have significantly decreased. However, our findings also revealed surprising trends. While engine technology upgrades reduced CO2, they unexpectedly increased CH4 and N2O emissions. Additionally, hot starts, beneficial for reducing CO2 and CH4 emissions, caused heightened N2O emissions, which is noteworthy under operating conditions with frequent start–stop events. Intriguingly, compressed natural gas (CNG), generally perceived as cleaner, increased CH4 emissions. Regarding the impact of three-way-catalyst (TWC) converters on GHG emissions, under “TWC deteriorated” conditions, N2O emissions from CNG-powered vehicles were approximately 3 times higher than those under “TWC worked” conditions, which can be attributed to the significant increase in nitrogen oxides (NOx). Considering the global warming potential (GWP), the “TWC deteriorated” scenario paradoxically decreased GWP values, highlighting the complex interaction between emission control technologies and their environmental impacts. This study provides crucial insights into vehicular GHG emissions, which are essential for developing effective strategies aimed at mitigating emissions and enhancing the efficiency of emission control systems.
- Article
(1285 KB) - Full-text XML
-
Supplement
(500 KB) - BibTeX
- EndNote


As the issue of global climate change becomes increasingly prominent, reducing greenhouse gas (GHG) emissions has emerged as a critical objective for environmental protection. In 2023, global energy-related carbon dioxide (CO2) emissions grew by 1.1 %, an increase of 410 million tonnes (Mt), reaching a new record high of 37.4 billion tonnes (Gt). This is in comparison to the rise of 490 Mt in 2022, which was a 1.3 % increase (IEA, 2024). Transportation is a significant source of GHG emissions, with the global transportation sector accounting for 23 % of all energy-related CO2 emissions (Liu et al., 2023). In 2023, the number of motor vehicles in China reached 435.6 million; among these vehicles, the number of automobiles reached 336 million, a year-on-year increase of 5.3 % (Ministry of Ecology and Environment, 2024). Due to the large number of vehicles, the road transportation sector's contribution to CO2 emissions is significant. One study indicated that in 2019, China's vehicle CO2 emissions were 952 Mt, with gasoline and other fuels (natural gas, alcohol fuels) comprising 47.5 % of this figure (Huang et al., 2022b). A recent study found that GHG emissions rose from 431 Mt in 2005 to 807 Mt in 2015, with an annual growth rate of 6.5 % (Li et al., 2019). Many studies have shown that the transportation sector of China will not peak before 2030 due to huge increasing transport demand (Yuan et al., 2021; Liu et al., 2018; Yin et al., 2015). Furthermore, road-based transport is the largest emission source in the transportation sector (Xue et al., 2019), accounting for 82.7 % of total CO2 emissions in the entire transportation sector in 2015 (Zhang et al., 2019); thus, road-based transport has a much larger CO2 emission reduction potential compared to other transport modes (Wang et al., 2017).
In addition to CO2, vehicular activities are closely associated with the greenhouse gases methane (CH4) and nitrous oxide (N2O). The N2O emissions are primarily produced by the combustion of nitrogenous compounds in fuel, while CH4 is generated from incomplete combustion in natural gas vehicles or the thermal cracking of alkanes (such as n-alkanes) in gasoline at high temperatures. Although the emissions of N2O and CH4 from vehicles are 3 to 6 orders of magnitude smaller than those of CO2, their global warming potential (GWP) is significantly higher. The GWP of N2O and CH4 is 298 times and 25 times greater than that of CO2, respectively (IPCC, 2014). While the emissions of CH4 from vehicles may be negligible on a global scale, in urban areas, particularly those with heavy traffic, CH4 emissions can account for up to 30 % of the regional CH4 emissions (Nam et al., 2004). In northern China, where natural-gas-powered vehicles are more common, cities need to consider the impact of fuel types and emission standards on N2O and CH4 emissions when developing carbon reduction plans for vehicles (Da et al., 2020). However, earlier studies have paid less attention to this aspect. Additionally, the population of light-duty hybrid electric vehicles in China is currently experiencing rapid growth, but comprehensive research on their GHG emission profiles remains inadequate. Precise quantification of GHG emissions from hybrid electric vehicles (HEVs) is crucial for developing effective strategies to mitigate emissions from the light-duty-vehicle sector. Meanwhile, the three-way-catalyst (TWC) system remains the predominant aftertreatment technology for gasoline vehicles. This catalytic system facilitates the abatement of exhaust pollutants by catalyzing the oxidation of carbon monoxide (CO) and unburned total hydrocarbons (THC), alongside a reduction in nitrogen oxides (NOx). Notably, the NOx reduction process involves undesirable side reactions, particularly the interaction between NO and nitrogen species on the catalyst, resulting in the formation of N2O (Wallington and Wiesen, 2014). Therefore, there is a need to strengthen comprehensive research on vehicular GHG emissions to further provide data and theoretical support for controlling greenhouse gas emissions. The Chinese government has promised to reach peak CO2 around 2030 and strives to achieve it as soon as possible. The government has incorporated climate change into its ecological planning and built a low-carbon system for society and the economy.
Currently, research on vehicular GHG emissions both domestically and internationally mainly employs three methods: chassis dynamometer testing, onboard testing, and model estimation. In recent years, a significant number of scholars have explored the emission characteristics of vehicular greenhouse gases. Emission factors for GHGs for actual vehicles under different emission standards, temperature points and driving operating conditions were obtain (He et al., 2014; Zhong et al., 2023; Clairotte et al., 2020; Wang et al., 2022b). Specifically, CO2 emissions for China VI (335 g km−1) diesel vehicles have been reduced compared to those for China IV (415 g km−1) and China V (447 g km−1) vehicles (Li et al., 2024), and some studies have reported CO2 emissions for China VI gasoline vehicles of around 200 to 300 g km−1 (Zhu et al., 2022; Wang et al., 2022b). The CH4 emissions decreased from 48 mg km−1 for China I to 28 mg km−1 for China IV light-duty gasoline vehicles, and N2O emissions were reduced from 45 (China I) to 21 mg km−1 (China IV) (He et al., 2014). The CH4 and N2O emissions for Euro V to Euro VI vehicles were found to be 7 mg km−1 (Clairotte et al., 2020); the average emission factors of CO2 and CH4 for light-duty vehicles in Thailand were found to be 232.25 g km−1 and 9.50 mg km−1, respectively (Sirithian et al., 2022). With advancements in powertrain technologies, hybrid electric vehicles are being progressively promoted and have demonstrated significant potential in reducing both pollutant and CO2 emissions (Selleri et al., 2022). Furthermore, from a model simulation perspective, computational models such as International Vehicle Emissions (IVE), the Motor Vehicle Emission Simulator (MOVES), and the Gompertz Growth Model have been utilized to establish greenhouse gas emission inventories for different base years (Tang et al., 2018; Li et al., 2022; Zeng et al., 2016) and even to predict future greenhouse gas emissions (Zeng et al., 2016).
Overall, from the perspective of GHG emissions from domestic vehicles in China, Yin et al. (2024) explored the GHG emissions of 84 China VI light-duty gasoline vehicles, indicating that vehicular GHG emissions generally tend to increase with engine displacement and that the CO2 increase rate caused by the CO2 conversion of CH4 and N2O emissions from all types of vehicles was less than 1 %; this suggests that CO2 emissions from vehicle exhaust remain the primary source of greenhouse gases (Yin et al., 2024). Nevertheless, existing research reveals a critical knowledge gap in systematic comparative analysis of CO2, CH4, and N2O emission profiles from vehicles certified under China's most stringent emission standards. Notably, old vehicles with deteriorated aftertreatment systems have been confirmed as “super-emitters”, contributing 50 %–80 % to total vehicular emissions while representing only 23 % of the fleet composition (Huo et al., 2012). However, comprehensive understanding of GHG emission characteristics from these “super-emitters” remains incomplete. To address these gaps, key investigations are urgently required, including the establishment of comprehensive domestic emission profiles for vehicles complying with China's latest emission standards and their comparison with previous emission standards and the determination of GHG emission characteristics from “super-emitters”.
In this study, we conducted chassis dynamometer experiments on GHGs (CO2, CH4, and N2O) from light-duty vehicles with different emission standards, engine types, fuel types, and working conditions of aftertreatment devices, aiming at improving the characteristics of GHG emission factors for light-duty vehicles and exploring the GHG emission potential of light-duty-vehicle exhaust emissions. This study provides an important data foundation for fully understanding the localized GHG emissions from light-duty vehicles in China, effectively reducing the uncertainty in greenhouse gas emission inventory calculations.
2.1 Tested vehicles and fuels
A total of 11 in-use light-duty vehicles, comprising 10 internal combustion engine vehicles (ICEVs) and 1 hybrid electric vehicle (HEV), from rental car companies were tested in this study. These light-duty vehicles selected cover various emission standard categories, engine techniques, powertrain technology types, and mileage accumulations, as detailed in Table 1. Among the eight light-duty gasoline vehicles (vehicles #1 to #8), representation was provided by China IV, China V, and China VI emission standards. This is mainly since China's current light-duty-vehicle fleet is predominantly composed of China IV-, China V-, and China VI-compliant vehicles. These vehicles featured two distinct engine techniques – gasoline direct injection (GDI) and port fuel injection (PFI) – and all were equipped with TWC converters. With the advancement of vehicular emission control technologies, GDI engines are progressively replacing traditional PFI engines due to their superior combustion efficiency, which is achieved by directly injecting fuel into the combustion chamber. Additionally, to assess the GHG emission differences between gasoline and hybrid electric vehicles, one non-plug-in hybrid electric light-duty vehicle (vehicle #9) adhering to the China VI emission standard was also included, utilizing both conventional gasoline engines and electric motors and potentially influencing overall GHG emissions.
Table 1Specifications of the light-duty vehicles in this study, including category, model year, emission standard, engine technology, displacement, mileage, max net engine power, max authorized mass, and aftertreatment types.
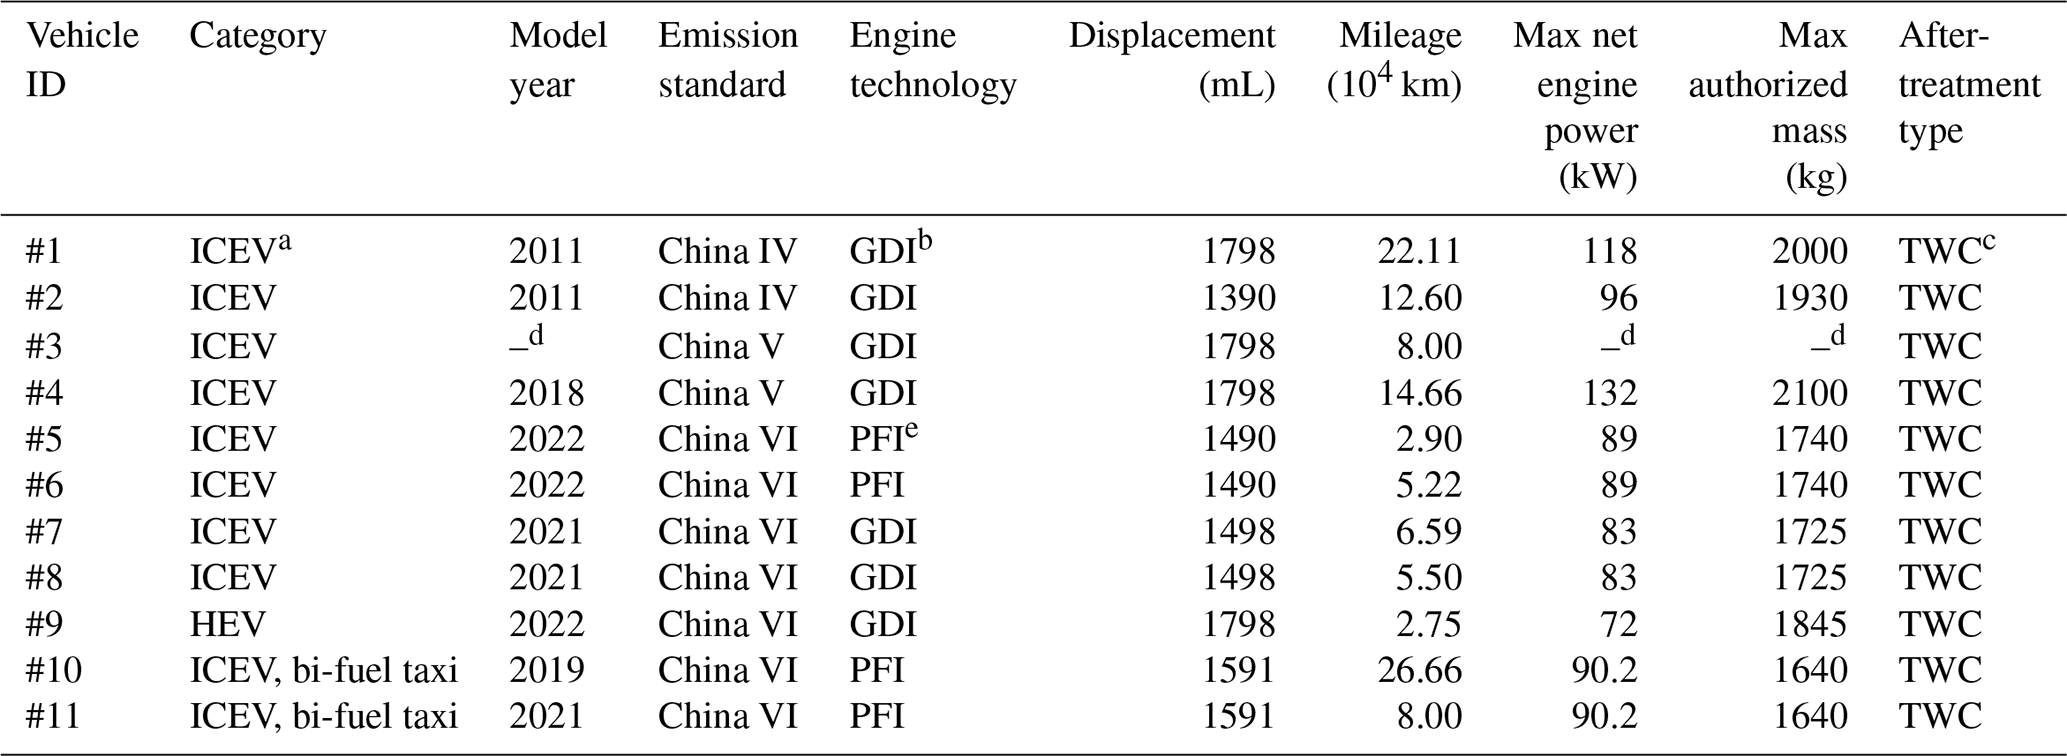
a Internal combustion engine vehicle. b Gasoline direct injection. c Three-way catalyst. d The unrecorded data, being a non-essential parameter, have no bearing on the subsequent analysis. e Port fuel injection.
To gain a deeper understanding of the effects of fuel types and TWC operating conditions on vehicular GHG emissions, two China VI compliant bi-fuel taxis (vehicles #10 to #11) were tested, one with 266 624 km (representing the “TWC deteriorated” condition) and another only 79 960 km (representing the “TWC worked” condition). Figure S1 in the Supplement demonstrates the emission characteristics of the two vehicles representing distinct TWC operational states: (1) a properly functioning under the “TWC worked” condition and (2) a deteriorated system under the “TWC deteriorated” condition. The analysis revealed that the “TWC deteriorated” vehicle emitted substantially higher levels of carbon monoxide (CO) and total hydrocarbons (THC), with emission factors elevated by over 24-fold and 97-fold, respectively, compared to the “TWC worked” vehicle. These compressed natural gas (CNG) bi-fuel taxis were originally equipped with two separate fuel delivery systems and control units from the equipment manufacturer, allowing for seamless switching between gasoline and CNG during operation, with gasoline being used during the warm-up phase (engine coolant temperature <70 °C) before transitioning to CNG (Wang et al., 2024).
In this study, we employed three types of fuel: conventional gasoline, ethanol gasoline, and compressed natural gas (CNG). The conventional gasoline, exclusively utilized in light-duty gasoline vehicles and HEVs, was sourced from an automobile testing center, guaranteeing uniformity in chemical composition throughout all testing cycles. The specifications of this conventional gasoline adopted in this study have been previously detailed in our earlier work (refer to Supplement Table 2 in Zhang et al., 2024). To delve deeper into the impact of fuels on vehicular emissions, all three fuel types were applied in the case of bi-fuel taxis. Ethanol gasoline and CNG came from gasoline fueling and natural gas fueling station locations, respectively.
2.2 Experimental protocol and driving cycles
We carried out vehicular emission tests utilizing a chassis dynamometer within the esteemed China Automotive Technology and Research Center (CATARC) laboratory, a type-approval testing center accredited by the Ministry of Ecology and Environment of China. The tailpipe pollutants are diluted by a constant volume sampling (CVS) method; this is followed by analysis using an array of measurement systems, as shown in Fig. 1. For GHG quantification, specific instruments were employed: a non-dispersive infrared (NDIR) analyzer for CO2 and a quantum cascade laser (QCL) analyzer for N2O, ensuring precise measurements. Additionally, CH4 concentrations were determined by a setup combining a non-methane cutoff (NMC) filter with a hydrogen flame ionization detector (FID) (Yin et al., 2024). The calculation of distance-based emission factors for GHGs was achieved through a meticulous process involving second-by-second concentrations, exhaust volume, pollutant density, and the actual driving distance during the driving cycles.
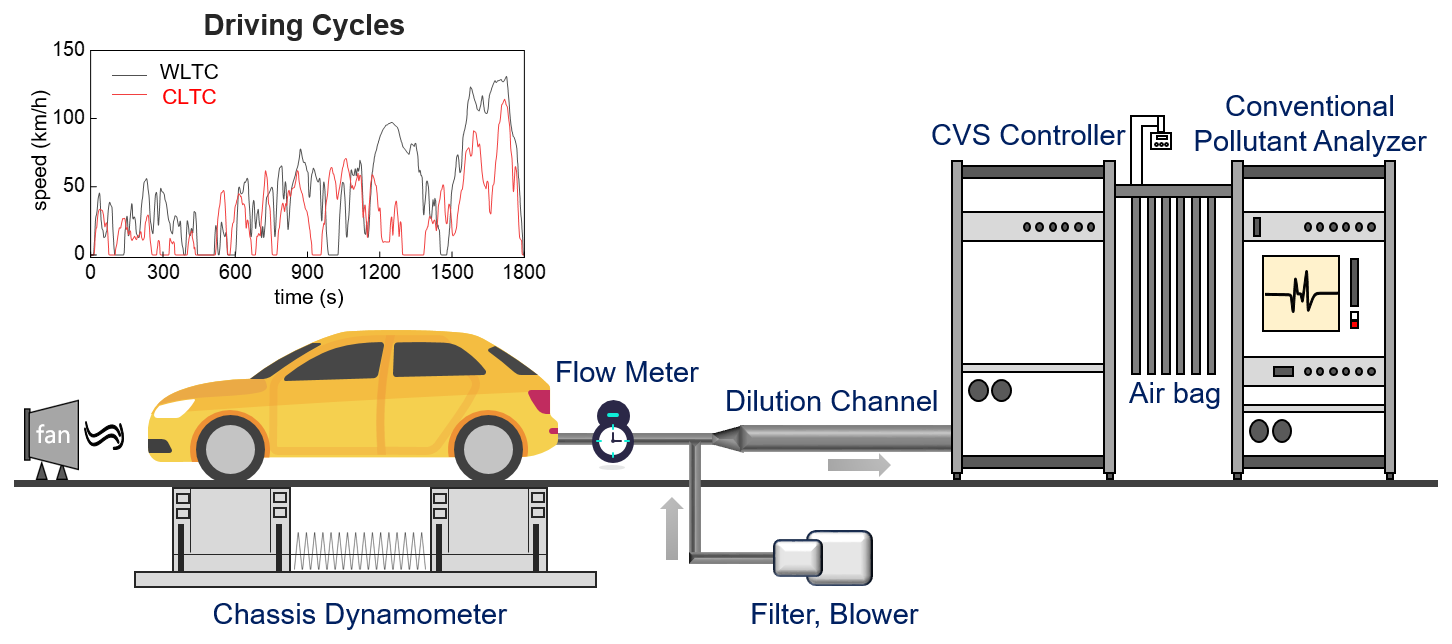
Figure 1Schematic diagram for vehicular emission measurements based on the chassis dynamometer used in this study.
To comprehensively investigate the impact of diverse driving conditions on GHG emissions, we implemented three distinct types of driving cycle. For gasoline vehicles and HEVs, we adhered to the Worldwide Harmonized Light Vehicles Test Cycle (WLTC), newly introduced into the China VI emission regulations. The WLTC protocol comprises four phases: low-speed (589 s), medium-speed (433 s), high-speed (455 s), and extra-high-speed (323 s) phases. The impacts of both cold and hot startup modes on vehicular emissions were explored during the application of the WLTC protocol. Furthermore, we conducted additional driving tests on some typical vehicles using the China Light-duty Vehicle Test Cycle (CLTC), which could be more relevant to real-world driving conditions in China. This protocol, which encompasses CLTC-P (passenger) and CLTC-C (commercial), was proposed in 2019 (Wang et al., 2020; Hu et al., 2021). In addition, we conducted the emission testing based on constant-speed conditions: 30, 60, 90, and 120 km h−1. During these constant-speed tests, the driver accelerated to the target speed and maintained it for 10 min, allowing for the precise measurement of GHG emissions under stable driving conditions. Notably, for the CLTC protocol and our constant-speed tests, only the hot start mode was employed.
2.3 Calculation of global warming potentials
Global warming potentials (GWPs) have been established as a widely accepted method for comparing the climate impacts of various greenhouse gas emissions over the past decades (Shine, 2009). This metric enables the conversion of CH4 and N2O emissions into their CO2 equivalents, thereby facilitating a standardized comparison. Furthermore, the relative growth rate of CO2 after conversion can be obtained, which is calculated precisely according to Eq. (1), offering valuable insights into the long-term warming potential of these gases.
where is the relative growth rate of CO2, Mi denotes the emissions of CH4 or N2O, and denotes the emissions of CO2. The GWP of N2O and CH4 is 298 and 25, respectively.
3.1 Scenario-based greenhouse gas emission factors
3.1.1 Distance-based emission factors
Figure 2 comprehensively depicts the distance-based emission factors of GHGs, illustrating the diverse impacts stemming from various scenarios, encompassing emission standard categories, engine techniques, powertrain advancements, startup modes, and driving cycles. Concerning emission standard categories, distinct trends emerged across the three primary GHG types. Prior research has documented a pronounced reduction in CO, NOx, and THC emissions in response to stricter emission standards (Duan et al., 2021). Similarly, in this study, CH4 emission factors have undergone a substantial decline, with the China VI gasoline vehicle (during cold starts) exhibiting an emission factor of approximately one-sixth of that recorded for the China IV gasoline vehicle under similar conditions. This trend in CH4 is consistent with previously reported variations in volatile organic compounds (VOCs; Qi et al., 2021; Duan et al., 2021). Turning to CO2 and N2O, Fig. 2 highlights that the emission factors for these gases in China VI gasoline vehicles were notably lower than those in China IV and China V vehicles. Nevertheless, the emission factors for CO2 of the China V vehicles (155 g km−1 for the hot starts) were comparable to those of China IV vehicles (151 g km−1 for the hot starts), and those for N2O of the China V vehicles (2.0 mg km−1 for the hot start) were even higher than those of China IV vehicles (1.5 mg km−1 for the hot starts), particularly for the hot start mode. This highlights a nuanced aspect of emission performance that needs further investigation. A comparison with previous studies shows that the CH4 emissions for China V and China VI vehicles in our study were lower than those for Euro 5 and Euro 6 vehicles reported by Clairotte et al. (2020). A similar trend was observed for N2O emissions, as demonstrated by the summary of previous studies provided in Table S1 in the Supplement. Furthermore, lower CO2 emissions were found in our study compared to those for gasoline vehicles reported by Zhu et al. (2022) and Wang et al. (2022b) as well as those for diesel vehicles reported by Wu et al. (2017), Cai and Xie (2010), Wang et al. (2022a), and Li et al. (2024), as shown in Table S1.
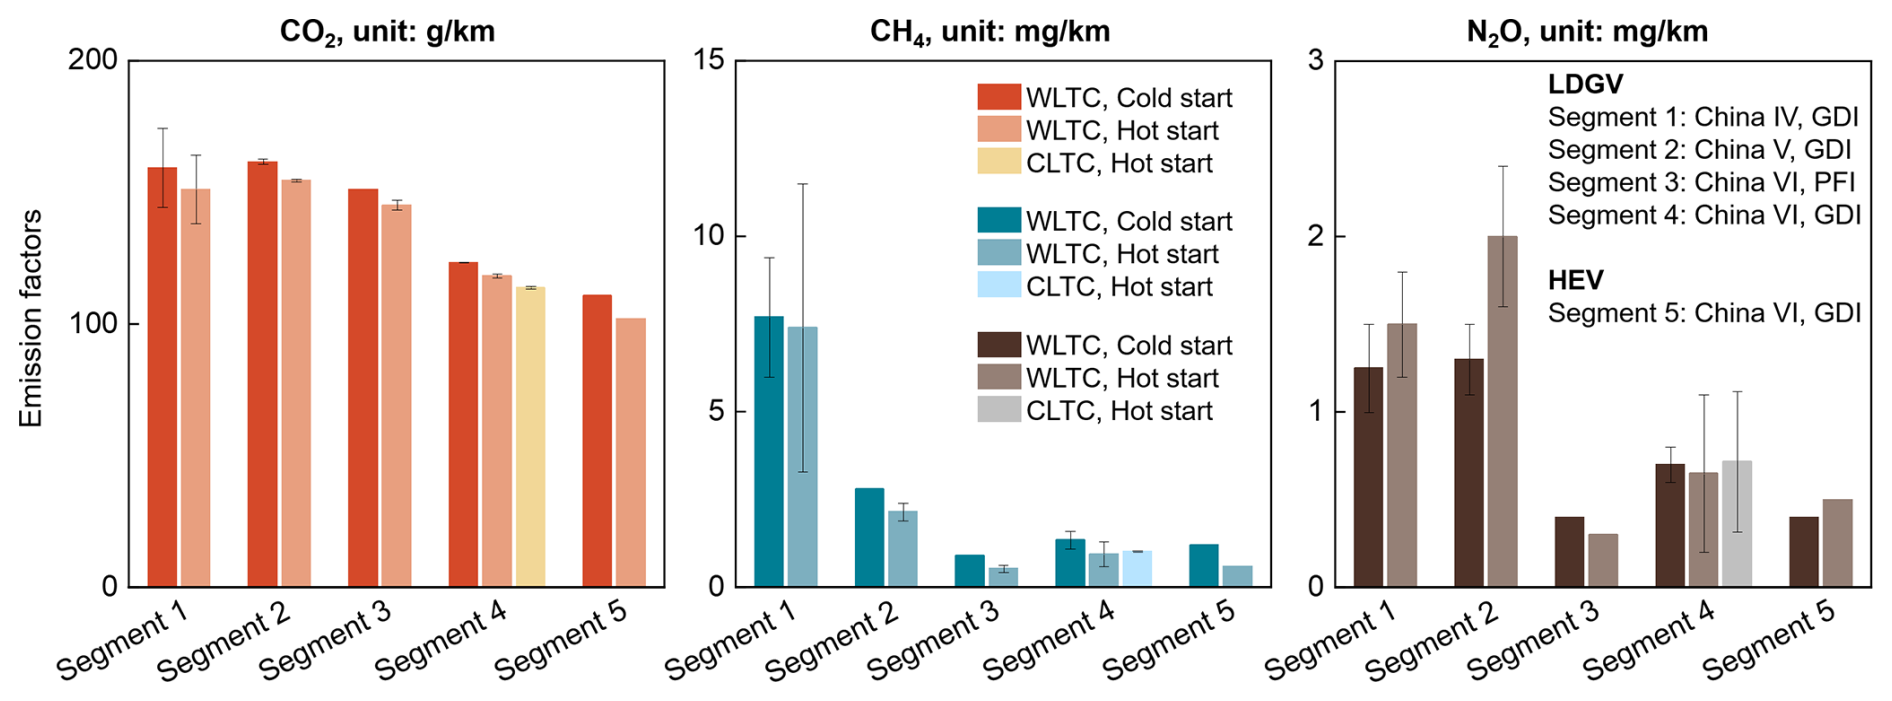
Figure 2Emission factors of GHGs (CO2, CH4, and N2O) for various scenarios involving different emission standard categories, engine techniques, powertrain technology types, startup modes, and driving cycles.
Regarding the startup modes, our analysis revealed that CO2 and CH4 emissions were slightly lower during hot starts compared to cold starts. Herein, we conducted a comparative assessment of vehicular emissions from tested vehicles equipped with GDI engines. Specifically, the CO2 emission factors for the tested China IV vehicles were found to be 159 g km−1 under cold startup mode and 151 g km−1 under hot startup mode. Similarly, for the tested China V vehicles, the CO2 emission factors were 161 and 155 g km−1, respectively, for cold and hot startup modes. The China VI vehicles also exhibited a similar trend, with CO2 emission factors of 151 and 145 g km−1 for cold and hot startup modes, respectively. Similarly, the CH4 emissions displayed a declining trend, transitioning from cold starts to hot starts across all tested vehicle categories. For China IV vehicles, the CH4 emission factors were 7.7 mg km−1 under cold starts and 7.4 mg km−1 under hot starts. China V vehicles showed a reduction from 2.8 to 2.2 mg km−1, and China VI vehicles showed a reduction from 1.4 to 1.0 mg km−1. Interestingly, the trend for N2O emissions was inverse to that of CO2 and CH4, with higher emissions observed during hot starts compared to cold starts, particularly among China IV and China V vehicles. A systemic introduction to the detailed cause analysis will be presented in Sect. 3.1.2.
When it comes to engine techniques, a notable trend emerged in the comparison between PFI and GDI engines. Specifically, PFI engines exhibited higher CO2 emission factors compared to GDI engines. Conversely, GDI engines demonstrated higher CH4 and N2O emissions. In terms of testing protocols, the CLTC protocol yielded slightly lower CO2 emission factors by approximately 4 % compared to the WLTC protocol. However, the CH4 and N2O emission factors for CLTC were observed to be higher, with increases of around 8 % and 10 %, respectively, compared to WLTC. Additionally, a comparative analysis between the gasoline vehicles and HEV revealed insight into the advancement of powertrain technology. Despite the selected HEV having a higher overall mass and displacement, they demonstrated a significant reduction in GHG emissions. Specifically, CO2 emissions were reduced by 10 % to 14 %, CH4 emissions by 11 % to 37 %, and N2O emissions by 23 % to 43 %.
3.1.2 Interpreting technological upgrading through the perspective of generation mechanisms
The different trends of GHG emissions across various scenarios might be attributed to the underlying mechanism of their generation. CO2 can originate from the complete combustion of fuel in the tailpipe or from the oxidation of THC by the catalyst in TWC converters, highlighting a strong correlation between CO2 emissions, fuel consumption, and the completeness of combustion. CH4, on the other hand, can be formed through the partial oxidation of gasoline fuels or the thermal cracking of organic compounds in fuels. Regarding N2O, it may arise from the reaction between ammonia (NH3) and NOx or from the decomposition of ammonium nitrate (NH4NO3) generated in catalytic converters, suggesting a greater dependence on NOx and NH3 concentrations (Yin et al., 2024; Brinklow et al., 2023).
The fuel consumption for China VI vehicles (5.0 L (100 km)−1 for the hot start) was lower than that of China IV (6.4 L (100 km)−1 for the hot start) and China V (6.6 L (100 km)−1 for the hot start) vehicles. The lower fuel consumption for China VI vehicles caused the lower CO2 and CH4 emissions. Furthermore, N2O emissions are primarily derived from reactions in the aftertreatment systems. Similar aftertreatment technology routes for China IV and China V vehicles may account for their comparable N2O emissions.
The startup modes have a significant impact on the engine combustion state and the effectiveness of the aftertreatment systems. Generally, the cold start mode tends to enhance hydrocarbon emissions, partly due to the incomplete combustion during the warm-up phase (Drozd et al., 2016) and partly because the temperature does not reach the light-off temperature of the exhaust catalyst (Saxer et al., 2006), leading to enhanced CH4 emissions during the cold start mode. In terms of CO2, lower emissions might be primarily attributed to the lower fuel consumption during the hot startup mode. Regarding N2O emissions, the higher N2O emissions observed for China IV and China V vehicles during hot startups compared to cold startups can be explained by the increased NOx emissions during the hot start mode. Specifically, for the tested GDI vehicles, China IV vehicles exhibited NOx emission factors of 24.2 and 32.7 mg km−1 during cold and hot startup modes, respectively, while China V vehicles displayed factors of 24.9 and 27.3 mg km−1 and China VI vehicles exhibited factors of 6.5 and 8.2 mg km−1 for the same conditions. This disparity underscores the influence of the startup mode on NOx and consequently on N2O emissions.
Furthermore, GDI engines exhibited lower CO2 emissions compared to PFI engines. This is attributed to the fact that GDI engines inject fuel directly into the combustion cylinder, enabling more precise control over injection time, fuel volume, and oil–gas mixing and hence a higher brake thermal efficiency and power output (Awad et al., 2020). As a result, the improved engine efficiency for GDI engines can reduce fuel consumption, ultimately leading to decreased emissions of CO2 and CH4. However, it is possible that due to the differences in vehicle configurations, the advantages of GDI engines may not fully offset the increase in CH4 emissions, causing higher CH4 emissions from vehicles equipped with GDI engines. Regarding the strong correlation between N2O and NOx, herein, we compared the NOx emissions of different engine technologies. Compared to PFI engines, GDI engines have a higher air : fuel ratio, which can have two opposing effects on the generation mechanism of NOx, which originates from the oxidation of N2 in the air within the combustion chamber (Huang et al., 2016). On the one hand, a high air : fuel ratio provides more air to oxidize N2, but on the other hand, it can reduce the mixture temperature, constraining NOx production. For the China VI vehicles in our study, the NOx emissions for GDI engines (6.5 and 8.2 mg km−1 in cold and hot startup modes, respectively) were significantly higher than those for PFI engines (4.6 and 3.8 mg km−1 in cold and hot startup modes, respectively). Additionally, NO can selectively form N2O at lower temperatures (Brinklow et al., 2023). Consequently, compared to PFI engines, the higher NOx emissions and the lower temperature for GDI engines contributed to enhanced N2O emissions.
When considering the impact of driving protocols on GHG emissions from vehicles, it is notable that the CLTC protocol, compared to the WLTC protocol, represents a low average speed, a high idle-speed ratio, and more frequent acceleration and deceleration characteristics (Liu et al., 2020). Additionally, the idling conditions during the CLTC protocol exceed 20 %, which is significantly higher than the 12.7 % in the WLTC protocol, ultimately possibly leading to lower fuel consumption. Specifically, the fuel consumption of China VI vehicles during hot starts for WLTC and CLTC protocols was 5.0 and 4.8 L (100 km)−1, respectively. Moreover, previous studies have reported that HEVs facilitate reduced emissions of gaseous and particulate pollutants (Zhang et al., 2024; Huang et al., 2022a). In this study, we utilized non-plug-in hybrids, which operate on the principle that the engine and generator complement each other to maintain optimal engine performance for minimizing electricity consumption. This type of vehicle cannot be charged externally, and the battery is charged by the internal combustion engine through electricity generation. Consequently, HEVs achieve lower fuel consumption (4.7 and 4.3 L (100 km)−1 in cold and hot startup modes, respectively) compared to gasoline vehicles with the same engine technology and emission standard (5.2 and 5.0 L (100 km)−1 in cold and hot startup modes, respectively). Additionally, HEVs exhibit higher combustion efficiency as the engine can maintain optimal operating conditions during operation. Both of these factors combine to result in lower GHG emissions for HEVs compared to gasoline vehicles.
Overall, the China VI emission regulation marks a significant milestone in the control of GHG emissions by introducing a specific emission limit of 20 mg km−1 for N2O. Notably, the N2O emissions recorded from all tested vehicles in this study, including even the older China IV vehicles, fell well below this limit, indicating a positive trend toward reduced emissions. However, the current emission standards in China have yet to establish emission limit values for CO2 and CH4. This lack of stringent regulations for these GHGs underscores the need for a more comprehensive and systematic approach to greenhouse gas control.
3.2 Influence of fuel types and three-way-catalyst operation conditions on GHG emissions
In this study, we investigated two bi-fuel taxis exhibiting substantial disparities in mileage. By comparing the CO and THC emissions between these two taxis (241 and 5719 mg km−1 for CO under “TWC worked” and “TWC deteriorated” conditions and 3 and 329 mg km−1 for THC under “TWC worked” and “TWC deteriorated” conditions, respectively), it was found that the taxi with a mileage of 266 624 km was equipped with a deteriorated TWC, whereas the taxi with a significantly lower mileage of 79 960 km was equipped with a worked TWC. Herein, Fig. 3 illustrates the GHG emission factors associated with various fuel types and TWC operating conditions for our tested bi-fuel taxis.
Under “TWC worked” conditions, CO2 emission factors of conventional and ethanol gasoline were observed to be virtually identical, with both fuels exhibiting comparable CH4 emission factors as well. As a gaseous fuel, CNG demonstrated a noteworthy reduction in CO2 emissions by approximately 27 % compared to the two liquid fuels. However, this reduction was accompanied by a marked increase in CH4 emissions, with CNG emitting 10.8 times more CH4 than conventional gasoline and 6.5 times more than ethanol gasoline. This trend of reduced CO2 emissions and elevated CH4 with CNG usage has been consistently reported in previous studies (Lv et al., 2023; Rašić et al., 2017; Bielaczyc et al., 2014). The lower CO2 emissions from CNG can be attributed to its lower C H ratio. Conversely, the elevated CH4 emissions from CNG are primarily due to the direct emission of unburned CN4, the primary component of CNG, from the tailpipe. Turning to N2O emissions, CO and NO serve as the principal precursors, while H2 and THC also play important roles as precursor species (Brinklow et al., 2023; Nevalainen et al., 2018). The three fuel types exhibited comparable N2O emission factors, ranging from 0.3 to 0.4 mg km−1. Specifically, ethanol gasoline exhibited slightly higher N2O emissions than conventional gasoline, which could be attributed to the combined effects of increased precursor concentration and reduced combustion temperatures stemming from ethanol's relatively low combustion flame temperature and calorific value compared to conventional gasoline (Qu et al., 2020). Between the two liquid fuels, NOx emission factors were comparable, with conventional gasoline at 11 mg km−1 and ethanol gasoline at 10 mg km−1. Nevertheless, ethanol gasoline would emit much higher CO and THC concentrations: the CO and THC emission factors for conventional gasoline were 240 g km−1 and 3 mg km−1, whereas those for ethanol gasoline were 407 g km−1 and 7 mg km−1, respectively. Nevertheless, previous studies have revealed that ethanol gasoline would increase the emissions of non-methane organic gases (NMOGs), acetaldehydes, 1,3-butadiene, and benzene and would not lead to statistically significant changes in NOx, CO2, CH4, N2O or formaldehyde emissions (Graham et al., 2008). When using gasoline with higher ethanol concentrations (e.g., E85), distinct emission characteristics can be observed. The NOx, 1,3-butadiene, and benzene are significantly reduced, while the emissions of formaldehyde and acetaldehyde increase statistically significantly. In contrast, there are no statistically significant changes in the emissions of CO, CO2, or NMOGs (Graham et al., 2008). When comparing ethanol gasoline to CNG, CNG demonstrated lower CO emission factors (158 g km−1 for CNG versus 407 g km−1 for ethanol gasoline) but higher NOx and THC emission factors (15 mg km−1 for NOx and 9 mg km−1 for THC versus 10 and 7 mg km−1, respectively, for ethanol gasoline). Notably, CNG has a higher combustion temperature (Lv et al., 2023; Chen et al., 2019), which may be detrimental to conversion of NO to N2O (Brinklow et al., 2023). Consequently, in the N2O generation process, the potential advantage of higher precursor concentrations in CNG may be counteracted by the unfavorable effects of high temperatures, resulting in comparable N2O emission factors for CNG and ethanol gasoline.
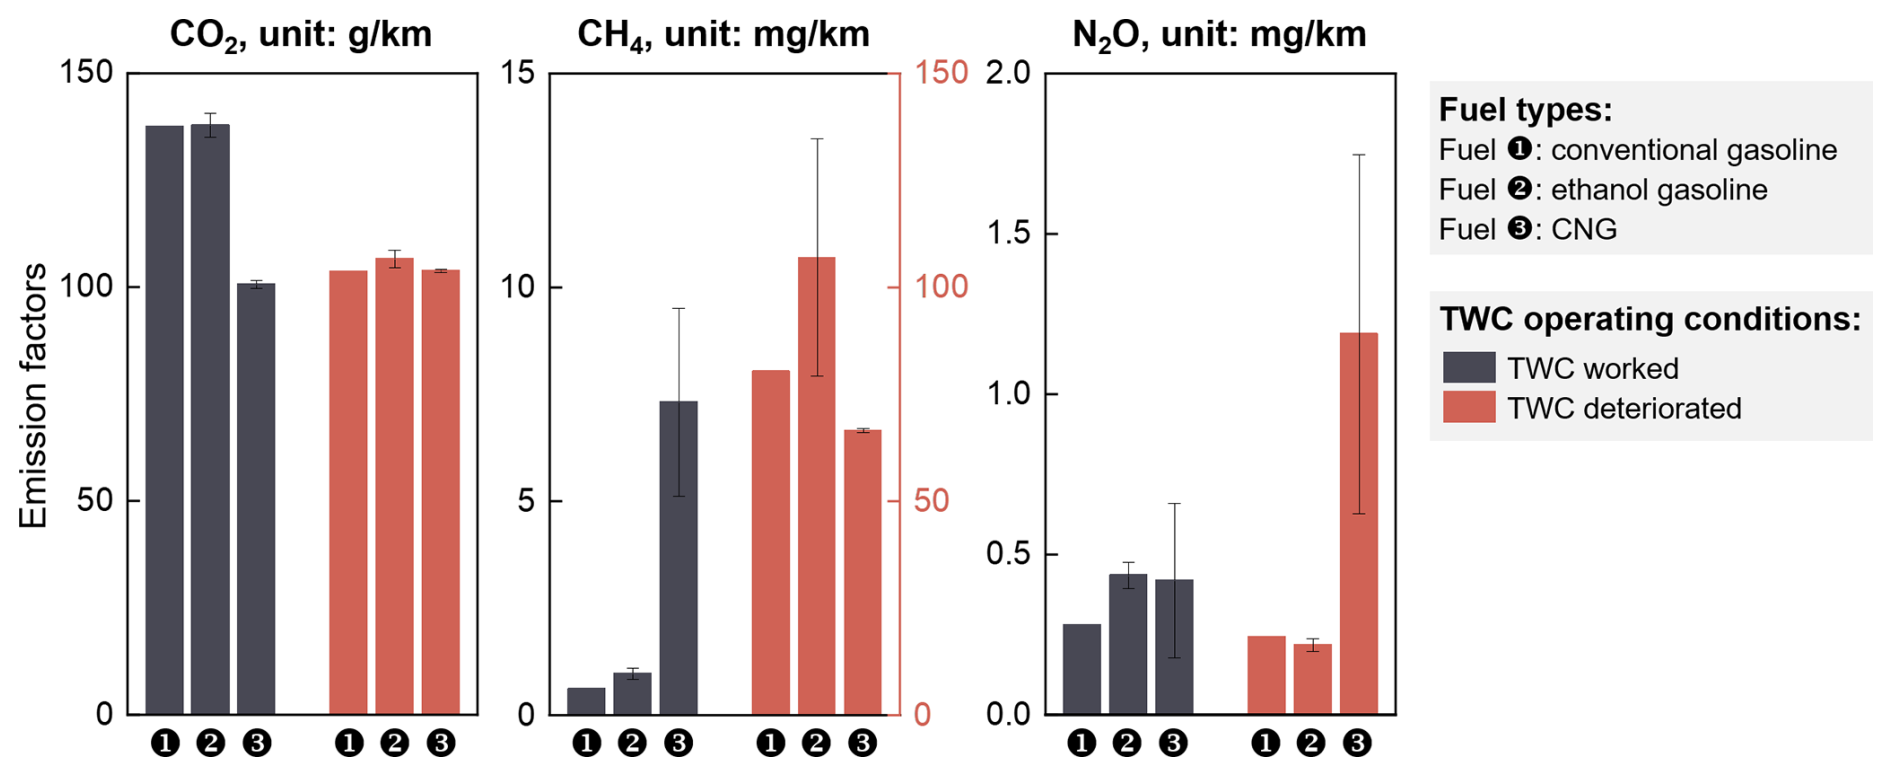
Figure 3Emission factors of GHGs (CO2, CH4, and N2O) for different fuel types and TWC operating conditions of our tested bi-fuel taxis.
TWC converters are instrumental in mitigating vehicular emissions. Under “TWC deteriorated” conditions, notable enhancement in CH4 emissions was recorded for the three fuel types, which was similar to the good removal ability of TWC for THC as reported in previous studies (Woo Jeong et al., 2024). Specifically, the CH4 emission factors for conventional gasoline under “TWC deteriorated” conditions were around 130 times higher, while those for ethanol gasoline were approximately 110 times higher and those for CNG were around 9 times higher, compared to the “TWC worked” conditions. Intriguingly, CO2 emissions from both conventional and ethanol gasoline exhibited lower emission factors under “TWC deteriorated” conditions compared to “TWC worked” conditions. On the one hand, this may be related to the unexpectedly lower fuel consumption for “TWC deteriorated” conditions (4.8 L (100 km)−1 for conventional gasoline and 4.9 L (100 km)−1 for ethanol gasoline) compared to “TWC worked” conditions (5.8 L (100 km)−1 for conventional gasoline and 5.8 L (100 km)−1 for ethanol gasoline). On the other hand, from the perspective of considering the aftertreatment system, this could also be explained by the underlying operating mechanism of TWC converters. When the high-temperature exhaust passes through TWC, the catalyst within it enhances the reactivity of CO, HC, and NOx, catalyzing oxidation and reduction reactions. This process converts CO into CO2, HC into H2O and CO2, and NOx into N2 and O2 (De Abreu Goes et al., 2021). Consequently, under “TWC deteriorated” conditions, these conversions are hindered, leading to reduced CO2 generation and correspondingly lower emission factors.
Regarding N2O, its generation pathway is related to the primary precursors, notably CO, NOx, and THC, with lower temperatures facilitating N2O formation (Brinklow et al., 2023). The formation of N2O over TWC converters is the result of a complex interplay of factors, including the active metal composition, converter aging, exhaust temperature, air : fuel ratio, and feed gas composition (Nevalainen et al., 2018; Mejía-Centeno et al., 2007). For both conventional and ethanol gasoline, despite the substantial increases in CO and THC emissions observed under “TWC deteriorated” conditions compared to “TWC worked” conditions, N2O emission factors did not correspondingly become elevated. This phenomenon could be attributed to the significant reduction in NOx emissions under “TWC deteriorated” conditions, which were only one-seventh of those recorded under “TWC worked” conditions. This suggests that NOx may be a pivotal precursor in determining N2O production other than CO and THC. Similar to prior research highlighting that catalyst aging would change the structure of oxygen storage material and thereby cause an enhancement of N2O formation (Nevalainen et al., 2018), our findings reveal a notable increase in N2O emissions for CNG under “TWC deteriorated” conditions, reaching approximately 3 times that of “TWC worked” conditions. This elevation is likely attributable to heightened precursor concentrations, particularly NOx. Our study underscores the variability in the impact of TWC deterioration on N2O emissions across different fuel types corresponding to different combustion states. This highlights the need for future research to delve deeper into identifying the primary driver of N2O generation and elucidating the underlying mechanism governing N2O generation under diverse fuel usage conditions.
Overall, the difference in GHG emissions between conventional gasoline and ethanol gasoline is not significant. The application of CNG can effectively reduce CO2 emissions but significantly increase CH4 emissions. In the context of CNG usage, CO2 was not sensitive to TWC aging, while the combined effect of CNG usage and TWC aging led to a substantial increase in CH4 emissions. Additionally, N2O emissions are minimally affected by the substitution of clean fuels such as CNG but are greatly influenced by TWC deterioration.
3.3 GHG emissions from hybrid electric vehicles
Previous studies have reported that HEVs facilitate reduced emissions of gaseous and particulate pollutants (Zhang et al., 2024; Huang et al., 2022a). In this study, we focused on non-plug-in hybrids, which operate on the principle that the engine and generator complement each other to maintain optimal engine performance for minimizing electricity consumption. This type of vehicle cannot be charged externally, and the battery is charged by the internal combustion engine through electricity generation. Consequently, HEVs exhibited lower fuel consumption, achieving 4.7 and 4.3 L (100 km)−1 in cold and hot startup modes, respectively, compared to gasoline vehicles, which consumed 5.2 and 5.0 L (100 km)−1 under the same conditions. Furthermore, HEVs showed higher combustion efficiency as the engine can maintain optimal operating conditions during operation. These factors, when combined, lead to a substantial reduction in GHG emissions for HEVs compared to gasoline vehicles. Specifically, CO2 emission factors were 110.8 and 102.0 g km−1 for cold and hot startup modes, respectively, while CH4 emission factors stood at 1.2 and 0.6 mg km−1 and N2O emission factors at 0.4 and 0.5 mg km−1 for the same conditions. A comparative analysis between gasoline vehicles and HEVs underscores the advancements in powertrain technology. Notably, despite the HEV in our study having a higher overall mass and higher displacement, it demonstrated remarkable reductions in GHG emissions. In particular, CO2 emissions were reduced by 10 % to 14 %, CH4 emissions by 11 % to 37 %, and N2O emissions by 23 % to 43 %, highlighting the environmental benefits of HEV technology.
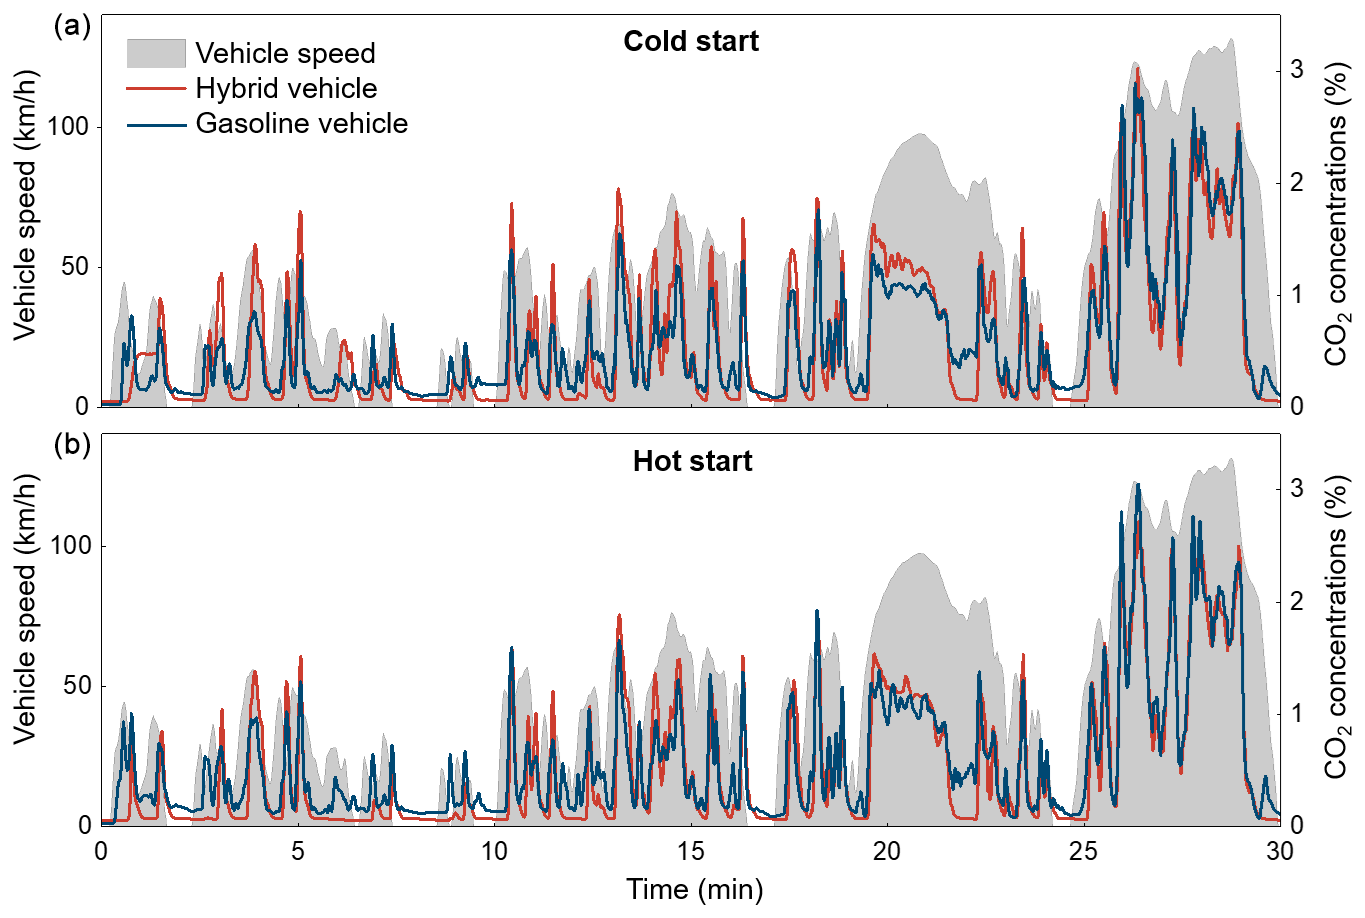
Figure 4Time series of CO2 and vehicle speed in the WLTC protocol with cold starts (a) and hot starts (b) of the HEV and gasoline vehicle.
HEVs, when compared to conventional gasoline vehicles, utilize electric motors for propulsion during startup and low-speed driving conditions (approximately 20 km h−1). As depicted in Fig. 4, HEVs exhibited a delayed and significantly reduced CO2 emission profile during these phases. This reduction is attributed to the electric motor's efficiency and the absence of fuel combustion. However, when the vehicle accelerates beyond a certain threshold, the internal combustion engine (ICE) is activated to provide additional power. At this juncture, there was a marked increase in CO2 emissions, reflecting the higher fuel consumption required to initiate the engine's operation. This transient spike underscores the instantaneous fuel demand and combustion process associated with engine startup in HEVs.
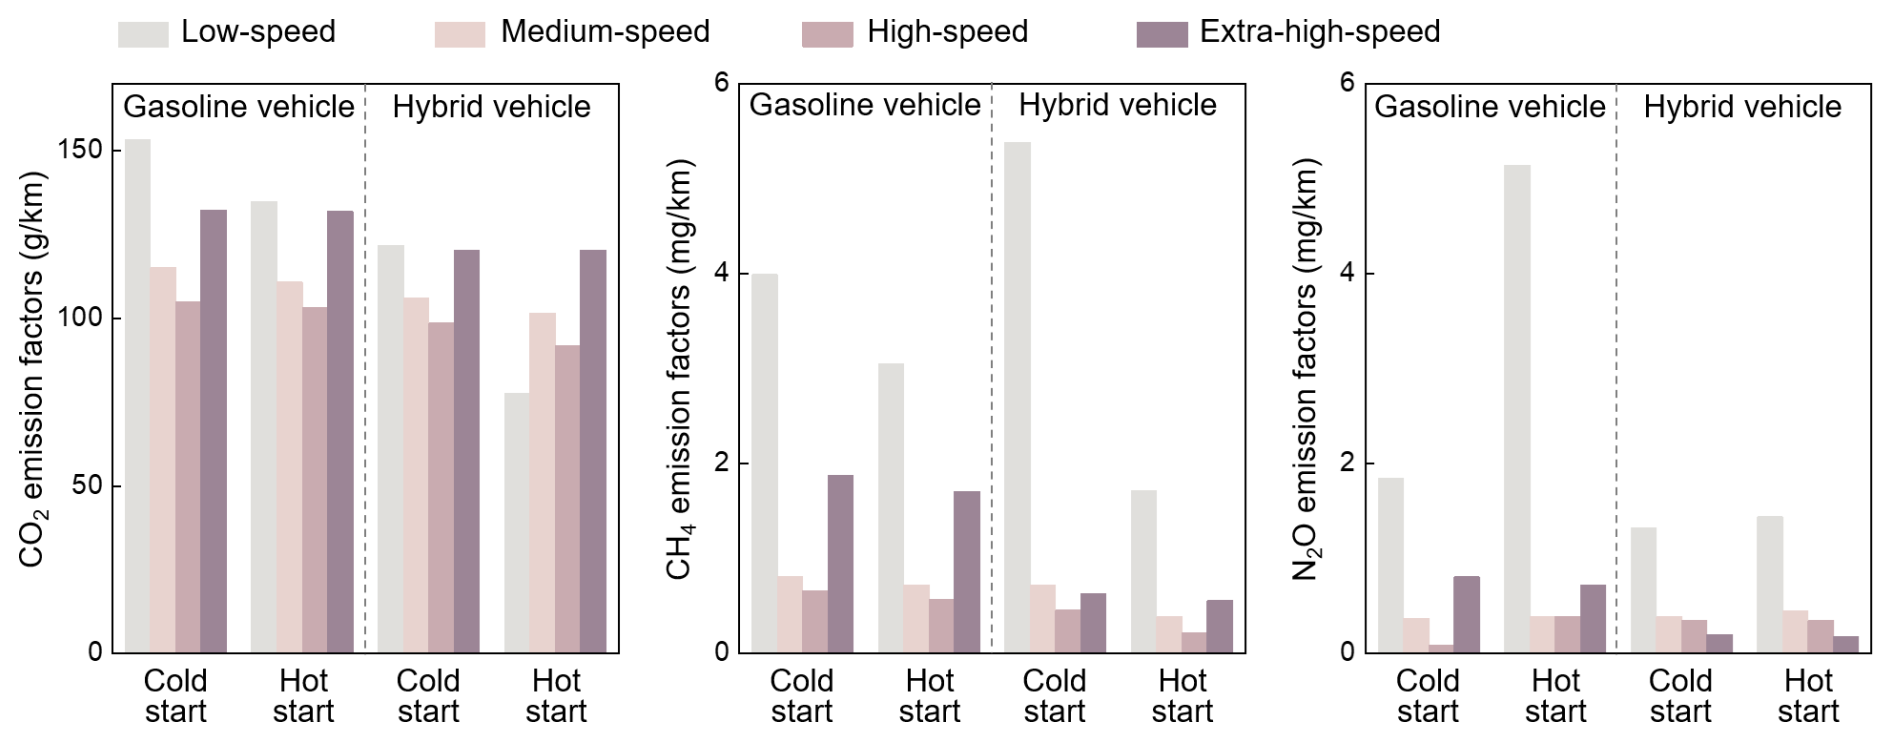
Figure 5Emission factors of CO2, CH4, and N2O under different speed phases under the WLTC protocol for the China VI HEV and China VI gasoline vehicle.
As presented in Fig. 5, an examination of the various speed phases within the WLTC revealed that HEVs demonstrated notably lower CO2 emissions during low-speed segments, especially under hot start conditions. This reduction in CO2 emissions can be attributed to the efficient operation of the electric motor at lower speeds. Conversely, the emission factors for CH4 and N2O were observed to be relatively high in these low-speed segments, indicating a trade-off in emission profiles. When compared to conventional gasoline vehicles, HEVs generally exhibited lower emissions across a range of pollutants. The exception to this trend was the CH4 emissions during cold starts at low speeds, where HEVs display elevated levels. This anomaly suggests that while HEVs are more efficient overall, certain conditions may lead to increased emissions of specific pollutants. For example, the analysis of CO emissions from hybrid vehicles reveals significant advantages when compared to conventional fuel-powered vehicles. Specifically, during cold starts, hybrid vehicles exhibit a CO emission factor of 70.9 mg km−1, whereas their conventional counterparts register 95.7 mg km−1, reflecting a 26.8 % reduction in CO emissions under these conditions. Similarly, during hot starts, hybrid vehicles achieve an impressive CO emission factor of 43.3 mg km−1, compared to the 71.9 mg km−1 emitted by conventional vehicles, demonstrating a 40.5 % decrease. This indicates that hybrid vehicles have more advantages in terms of combustion efficiency comparison.
3.4 Global warming potentials of light-duty vehicles
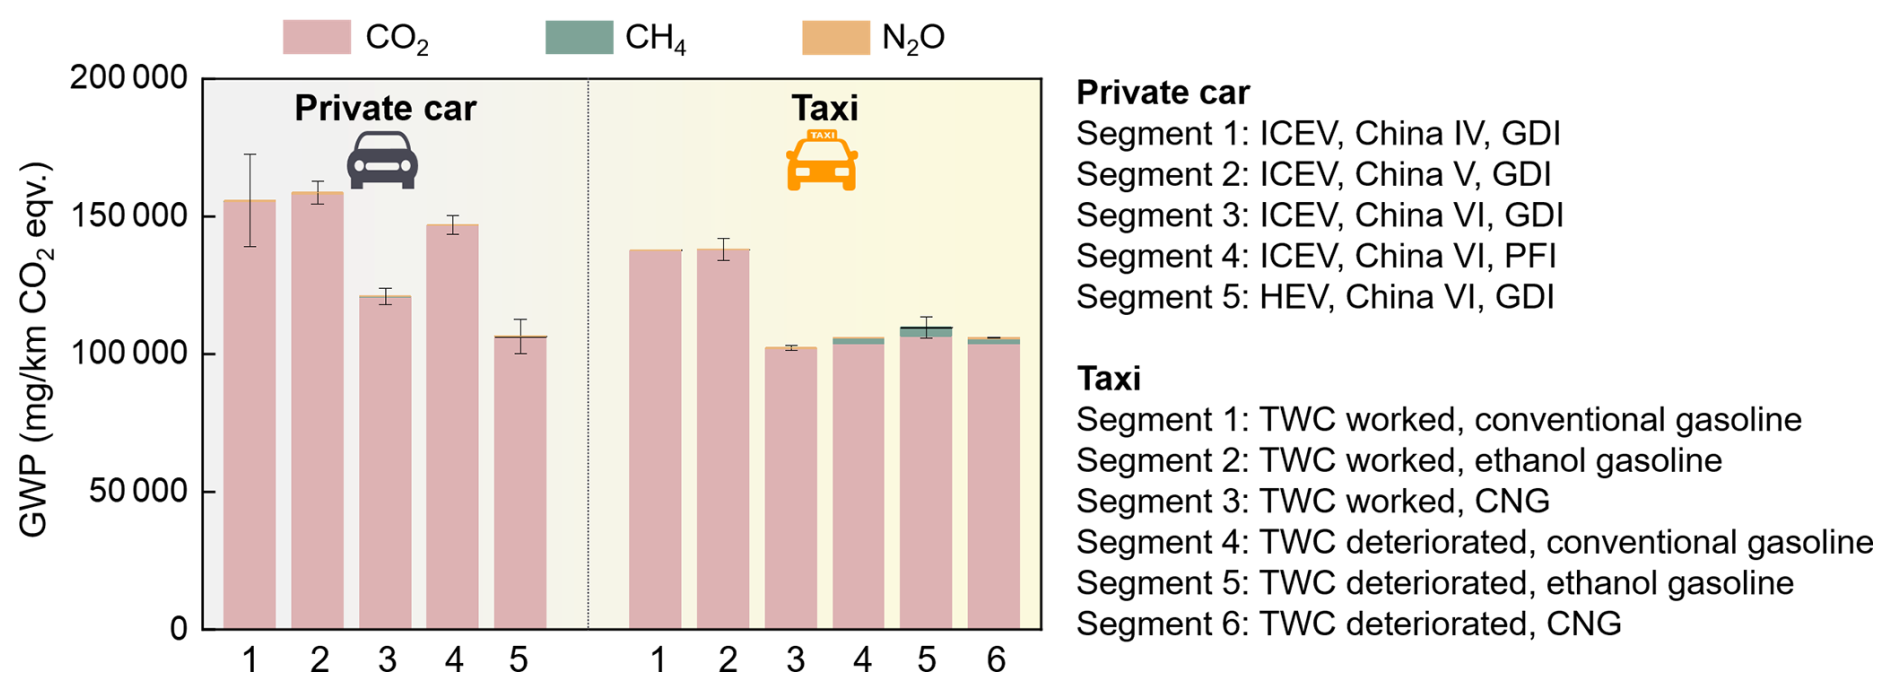
As shown in Fig. 6, vehicle exhaust emissions, particularly the emission of CO2, remain the primary contributor to global warming potential, accounting for over 99 % of the total of the three GHGs. Even though CH4 and N2O have global warming potentials 25 and 298 times higher, respectively, than that of CO2, the sheer volume of CO2 emissions from vehicle tailpipes still dominates. Furthermore, for conventional gasoline-powered vehicles, the GWP values tended to decrease as emission standards became more stringent. However, for China VI vehicles, those equipped with PFI engines exhibited higher GWP compared to those with GDI engines, with GDI vehicles showing a 17.6 % reduction compared to PFI vehicles. This difference highlights the varying efficiency and emission profiles between the two types of engine technology. GDI technology allows for more precise fuel delivery and better combustion efficiency, which translates into lower CO2 emissions. Furthermore, the impact of hybrid engine technology on GWP values is particularly noteworthy. HEVs combine an internal combustion engine with an electric motor, which enhances fuel efficiency and reduces emissions. The data indicate that HEVs achieve a further 12.0 % reduction in GWP compared to conventional GDI vehicles. Therefore, vehicles with GDI engines and hybrid technology exhibit lower GWP values.
For bi-fuel taxis, under “TWC worked” conditions, the fuel consumption is higher when using ethanol gasoline and conventional gasoline compared to using CNG. At the same time, due to the catalytic effect of TWC, CO and HC can be converted into CO2, resulting in higher GWP values. This indicates that bi-fuel vehicles can benefit from alternative fuels, especially the use of CNG, which can effectively reduce the emissions of vehicular GHGs. Unexpectedly, under “TWC deteriorated” conditions, lower GWP values were observed compared to those under “TWC worked” conditions, with a decrease of approximately 27.8 %. This contradictory finding indicates that although TWC is effective in reducing pollutants such as CO, HC, and NOx, its level of control over greenhouse gas emissions may still be worth further discussion. Overall, the deterioration of TWC may lead to a reduction in GWP, but this is also accompanied by the risk of increased emissions of other pollutants, indicating a complex interaction between emission control technologies and overall environmental impacts.
Vehicular emissions constitute a pivotal contributor to atmospheric pollutants and greenhouse gases in the troposphere. While extensive research has been conducted on the emission characteristics of gaseous pollutants emanating from vehicle exhausts, there remains a notable scarcity of studies focusing on greenhouse gas emissions, particularly in the context of achieving carbon neutrality. To address this gap, our study conducted a comprehensive investigation into the emission characteristics of three important GHG (CO2, CH4, and N2O) emanating from a diverse fleet of 11 light-duty vehicles, encompassing conventional gasoline cars, hybrid electric vehicles, and bi-fuel taxis. The main findings of our research are outlined below.
Compared to China IV and China V vehicles, China VI vehicles significantly reduce greenhouse gas emissions, which might be related to the low CO2 and CH4 emissions of China VI vehicles being associated with their low fuel consumption, while the low N2O emissions are associated with their aftertreatment technologies.
Compared to PFI engines, GDI engines can reduce CO2 emissions but have adverse effects on CH4 and N2O emissions. The different responses of these three greenhouse gases to engine technologies may stem from variations in combustion efficiency, the air : fuel ratio, and combustion temperature between the two engine technologies.
In contrast to hot startup mode, cold starts promote CO2 and CH4 emissions, while N2O emissions exhibit an opposing trend, which is mainly related to the higher NOx concentrations during hot starts.
Under the “TWC worked” conditions, the GHG emissions from conventional gasoline and ethanol gasoline are roughly equivalent. However, CNG, as a clean fuel, can significantly reduce CO2 emissions, whereas it promotes CH4 emissions since CH4 is its primary component.
Unexpectedly, the CO2 emissions from the two liquid fuels under the “TWC deteriorated” conditions exhibit lower emission factors than those under the “TWC worked” conditions. In the case of N2O emissions, the TWC deterioration does not lead to higher N2O emissions when using conventional gasoline or ethanol gasoline, mainly because of the significant reduction in NOx under the “TWC deteriorated” conditions despite the significant increase in CO and THC. However, under CNG usage, the emission factor of N2O under “TWC deteriorated” conditions is approximately 3 times that under “TWC worked” conditions. This significant increase is primarily associated with a substantial increase in NOx.
In terms of greenhouse gas emission reduction, hybrid vehicles demonstrate a significant advantage over conventional gasoline vehicles primarily due to the usage of electric motors. Specifically, hybrid vehicles exhibit notably lower CO2 emissions in low-speed phases, while emissions of CH4 and N2O tend to be relatively high at these speeds.
The global warming potential from vehicle exhaust is primarily attributed to CO2 emissions. HEVs demonstrate a more advantageous environmental impact compared to conventional gasoline vehicles. Surprisingly, however, under the “TWC deteriorated” conditions, a lower GWP value has been observed, indicating a complex interaction between emission control technologies and environmental impact.
This study aims to provide insights into the emission characteristics of GHGs from vehicles, which are crucial for developing targeted strategies to reduce GHG emissions and enhance the overall efficiency and environmental performance of vehicle emission control systems. However, a limitation of this study is that the vehicle fleet remains relatively small. In future research, we should investigate motor vehicle GHG emissions more systematically while simultaneously measuring auxiliary parameters such as catalyst temperature to facilitate a mechanistic understanding of GHG formation. This will aid in managing and controlling the GHG emissions from vehicles in the future.
The data used in this publication are available at https://doi.org/10.5281/zenodo.15253351 (Yang et al., 2025), and they can be accessed by request to the corresponding authors.
The supplement related to this article is available online at https://doi.org/10.5194/acp-25-7669-2025-supplement.
XY and SL performed the formal analysis, acquired funding, and wrote the original draft. JK and ZH performed the formal analysis. YW, DY, ZJ, and ZY discussed the results and commented on the article. YW, SL, HY, and YD conceived and led the studies.
The contact author has declared that none of the authors has any competing interests.
Publisher’s note: Copernicus Publications remains neutral with regard to jurisdictional claims made in the text, published maps, institutional affiliations, or any other geographical representation in this paper. While Copernicus Publications makes every effort to include appropriate place names, the final responsibility lies with the authors.
This research has been supported by the National Natural Science Foundation of China (grant nos. 42205111 and 42207114).
This paper was edited by Tanja Schuck and reviewed by Yan Liu and one anonymous referee.
Awad, O. I., Ma, X., Kamil, M., Ali, O. M., Zhang, Z., and Shuai, S.: Particulate emissions from gasoline direct injection engines: A review of how current emission regulations are being met by automobile manufacturers, Sci. Total Environ., 718, 137302, https://doi.org/10.1016/j.scitotenv.2020.137302, 2020.
Bielaczyc, P., Woodburn, J., and Szczotka, A.: An assessment of regulated emissions and CO2 emissions from a European light-duty CNG-fueled vehicle in the context of Euro 6 emissions regulations, Appl. Energ., 117, 134–141, https://doi.org/10.1016/j.apenergy.2013.12.003, 2014.
Brinklow, G., Herreros, J. M., Zeraati Rezaei, S., Doustdar, O., Tsolakis, A., Kolpin, A., and Millington, P.: Non-carbon greenhouse gas emissions for hybrid electric vehicles: three-way catalyst nitrous oxide and ammonia trade-off, Int. J. Environ. Sci. Te., 20, 12521–12532, https://doi.org/10.1007/s13762-023-04848-2, 2023.
Cai, H. and Xie, S.: Determination of emission factors from motor vehicles under different emission standards in China, Acta Scientiarum Naturalium Universitatis Pekinensis, 46, 319–326, 2010 (in Chinese).
Chen, H., He, J., and Zhong, X.: Engine combustion and emission fuelled with natural gas: A review, J. Energy Inst., 92, 1123–1136, https://doi.org/10.1016/j.joei.2018.06.005, 2019.
Clairotte, M., Suarez-Bertoa, R., Zardini, A. A., Giechaskiel, B., Pavlovic, J., Valverde, V., Ciuffo, B., and Astorga, C.: Exhaust emission factors of greenhouse gases (GHGs) from European road vehicles, Environmental Sciences Europe, 32, 125, https://doi.org/10.1186/s12302-020-00407-5, 2020.
Da, P., Tao, L., Sun, K., Golston, L. M., Miller, D. J., Zhu, T., Qin, Y., Zhang, Y., Mauzerall, D. L., and Zondlo, M. A.: Methane emissions from natural gas vehicles in China, Nat. Commun., 11, 4588, https://doi.org/10.1038/s41467-020-18141-0, 2020.
De Abreu Goes, J., Olsson, L., and Watling, T. C.: Global Kinetic Model of a Three-Way-Catalyst-Coated Gasoline Particulate Filter: Catalytic Effects of Soot Accumulation, Ind. Eng. Chem. Res., 60, 16899–16910, https://doi.org/10.1021/acs.iecr.1c02742, 2021.
Drozd, G. T., Zhao, Y., Saliba, G., Frodin, B., Maddox, C., Weber, R. J., Chang, M. O., Maldonado, H., Sardar, S., Robinson, A. L., and Goldstein, A. H.: Time Resolved Measurements of Speciated Tailpipe Emissions from Motor Vehicles: Trends with Emission Control Technology, Cold Start Effects, and Speciation, Environ. Sci. Technol., 50, 13592–13599, https://doi.org/10.1021/acs.est.6b04513, 2016.
Duan, L., Yuan, Z., Sha, Q. e., Wang, M., Liu, X., Liu, Y., Hao, Y., and Zheng, J.: Investigation on the trend of emission characteristics of volatile organic compounds from motor vehicle exhaust under different emission standards, Acta Scientiae Circumstantiae, 41, 1239–1249, https://doi.org/10.13671/j.hjkxxb.2021.0062, 2021.
Graham, L. A., Belisle, S. L., and Baas, C.-L.: Emissions from light duty gasoline vehicles operating on low blend ethanol gasoline and E85, Atmos. Environ., 42, 4498–4516, https://doi.org/10.1016/j.atmosenv.2008.01.061, 2008.
He, L., Song, J., Hu, J., Xie, S., and Zu, L.: An investigation of the CH4 and N2O emission factors of light-duty gasoline vehicles, Environ. Sci., 35, 4489–4494, 2014.
Hu, Z., Lu, Z., Song, B., and Quan, Y.: Impact of test cycle on mass, number and particle size distribution of particulates emitted from gasoline direct injection vehicles, Sci. Total Environ., 762, 143128, https://doi.org/10.1016/j.scitotenv.2020.143128, 2021.
Huang, R., Ni, J., Zheng, T., Wang, Q., Shi, X., and Cheng, Z.: Characterizing and assessing the fuel economy, particle number and gaseous emissions performance of hybrid electric and conventional vehicles under different driving modes, Atmos. Pollut. Res., 13, 101597, https://doi.org/10.1016/j.apr.2022.101597, 2022a.
Huang, X., Wang, Y., Xing, Z., and Du, K.: Emission factors of air pollutants from CNG-gasoline bi-fuel vehicles: Part II. CO, HC and NOx, Sci. Total Environ., 565, 698–705, https://doi.org/10.1016/j.scitotenv.2016.05.069, 2016.
Huang, Z., Ji, L., Yin, J., Lv, C., Wang, J., Yin, H., Ding, Y., Cai, B., and Yan, G.: Peak Pathway of China's Road Traffic Carbon Emissions, Res. Environ. Sci., 385–393, https://doi.org/10.13198/j.issn.1001-6929.2021.11.06, 2022b.
Huo, H., Yao, Z., Zhang, Y., Shen, X., Zhang, Q., Ding, Y., and He, K.: On-board measurements of emissions from light-duty gasoline vehicles in three mega-cities of China, Atmos. Environ., 49, 371–377, https://doi.org/10.1016/j.atmosenv.2011.11.005, 2012.
IEA: CO2 Emissions in 2023, https://www.iea.org/reports/co2-emissions-in-2023 (last access: 9 July 2025), 2024.
IPCC: Summary for Policymakers, in: Climate Change 2013 – The Physical Science Basis: Working Group I Contribution to the Fifth Assessment Report of the Intergovernmental Panel on Climate Change, Intergovernmental Panel on Climate, Cambridge University Press, Cambridge, 1–30, https://doi.org/10.1017/CBO9781107415324.004, 2014.
Li, D., Yu, F., Zhang, R., Zhu, M., Liao, S., Lu, M., Guo, J., Wu, L., and Zheng, J.: Real-world greenhouse gas emission characteristics from in-use light-duty diesel trucks in China, Sci. Total Environ., 940, 173400, https://doi.org/10.1016/j.scitotenv.2024.173400, 2024.
Li, F., Cai, B., Ye, Z., Wang, Z., Zhang, W., Zhou, P., and Chen, J.: Changing patterns and determinants of transportation carbon emissions in Chinese cities, Energy, 174, 562–575, https://doi.org/10.1016/j.energy.2019.02.179, 2019.
Li, G., Gao, J., Deng, S., Sun, Z., Zhang, S., Lu, Z., Lu, P., Zhang, Y., Abula, T., and Li, Q.: A study on high temporal-spatial resolution emission inventory and its characteristics of greenhouse gas for on-road mobile source in Weinan, Acta Scientiae Circumstantiae, 42, 332–340, https://doi.org/10.13671/j.hjkxxb.2022.0215, 2022.
Liu, J., Sun, Y., Wang, K., Zou, J., and KOng, Y.: Study on mid- and long-term low carbon development pathway for China's transport sector, Advances in Climate Change Research, 14, 513–521, 2018.
Liu, J., Huang, F., and Chen, B.: Research on Influencing Factors and Emission Reduction Strategies of Carbon Emission in Transportation Industry, Highway, 68, 252–259, 2023.
Liu, Y., Wu, Z. X., Zhou, H., Zheng, H., Yu, N., An, X. P., Li, J. Y., and Li, M. L.: Development of China Light-Duty Vehicle Test Cycle, Int. J. Automot. Techn., 21, 1233–1246, https://doi.org/10.1007/s12239-020-0117-5, 2020.
Lv, Z., Wu, L., Ma, C., Sun, L., Peng, J., Yang, L., Wei, N., Zhang, Q., and Mao, H.: Comparison of CO2, NOx, and VOCs emissions between CNG and E10 fueled light-duty vehicles, Sci. Total Environ., 858, 159966–159966, https://doi.org/10.1016/j.scitotenv.2022.159966, 2023.
Mejía-Centeno, I., Martínez-Hernández, A., and Fuentes, G. A.: Effect of low-sulfur fuels upon NH3 and N2O emission during operation of commercial three-way catalytic converters, Top. Catal., 42, 381–385, https://doi.org/10.1007/s11244-007-0210-2, 2007.
Ministry of Ecology and Environment: China Mobile Source Environmental Management Annual Report, https://www.mee.gov.cn/hjzl/sthjzk/ydyhjgl/202503/t20250326_1104757.shtml (last access: 9 July 2025), 2024.
Nam, E. K., Jensen, T. E., and Wallington, T. J.: Methane Emissions from Vehicles, Environ. Sci. Technol., 38, 2005–2010, https://doi.org/10.1021/es034837g, 2004.
Nevalainen, P., Kinnunen, N. M., Kirveslahti, A., Kallinen, K., Maunula, T., Keenan, M., and Suvanto, M.: Formation of NH3 and N2O in a modern natural gas three-way catalyst designed for heavy-duty vehicles: the effects of simulated exhaust gas composition and ageing, Appl. Catal. A-Gen., 552, 30–37, https://doi.org/10.1016/j.apcata.2017.12.017, 2018.
Qi, L., Zhao, J., Li, Q., Su, S., Lai, Y., Deng, F., Man, H., Wang, X., Shen, X. e., Lin, Y., Ding, Y., and Liu, H.: Primary organic gas emissions from gasoline vehicles in China: Factors, composition and trends, Environ. Pollut., 290, 117984–117984, 10.1016/j.envpol.2021.117984, 2021.
Qu, G., Yao, C., Wu, T., Wang, H., Li, Z., and Yan, J.: Comparative experiment research on unregulated exhaust emission characteristics of alcohol-gasoline and gasoline, Acta Scientiae Circumstantiae, 40, 111–118, 2020.
Rašić, D., Rodman Oprešnik, S., Seljak, T., Vihar, R., Baškovič, U. Ž., Wechtersbach, T., and Katrašnik, T.: RDE-based assessment of a factory bi-fuel CNG/gasoline light-duty vehicle, Atmos. Environ., 167, 523–541, https://doi.org/10.1016/j.atmosenv.2017.08.055, 2017.
Saxer, C. J., Forss, A.-M., Rüdy, C., and Heeb, N. V.: Benzene, toluene and C2-benzene emissions of 4-stroke motorbikes: Benefits and risks of the current TWC technology, Atmos. Environ., 40, 6053–6065, https://doi.org/10.1016/j.atmosenv.2005.12.059, 2006.
Selleri, T., Melas, A. D., Franzetti, J., Ferrarese, C., Giechaskiel, B., and Suarez-Bertoa, R.: On-Road and Laboratory Emissions from Three Gasoline Plug-In Hybrid Vehicles–Part 1: Regulated and Unregulated Gaseous Pollutants and Greenhouse Gases, Energies, 15, 2401, https://doi.org/10.3390/en15072401, 2022.
Shine, K. P.: The global warming potential–the need for an interdisciplinary retrial, Climatic Change, 96, 467–472, https://doi.org/10.1007/s10584-009-9647-6, 2009.
Sirithian, D., Thanatrakolsri, P., and Pongpan, S.: CO2 and CH4 Emission Factors from Light-Duty Vehicles by Fuel Types in Thailand, Atmosphere, 13, 1588, https://doi.org/10.3390/atmos13101588, 2022.
Tang, W., He, P., Yang, Q., Lu, Q., Zheng, S., Xia, Y., Jing, B., LU, B., Huang, C., and Lu, J.: Study on greenhouse gas emission inventory of road source in Hangzhou based on IVE model and large data analysis, Acta Scientiae Circumstantiae, 38, 1368–1376, https://doi.org/10.13671/j.hjkxxb.2017.0493, 2018.
Wallington, T. J. and Wiesen, P.: N2O emissions from global transportation, Atmos. Environ., 94, 258–263, https://doi.org/10.1016/j.atmosenv.2014.05.018, 2014.
Wang, H., Ou, X., and Zhang, X.: Mode, technology, energy consumption, and resulting CO2 emissions in China's transport sector up to 2050, Energ. Policy, 109, 719–733, https://doi.org/10.1016/j.enpol.2017.07.010, 2017.
Wang, Q., Cao, F., Fu, M., Su, S., Wang, M., Zhao, Z., Lin, Y., and Zhang, Y.: Emission factors of carbon dioxide from in-use vehicles based on bench testing, Journal of Nanjing University of Information Science & Technology, 14, 156–166, 2022a (in Chinese).
Wang, X., Wang, C., Li, R., Ge, Y., Hao, L., and Tan, J.: Tracing the regulated emissions of field-aged gasoline/natural gas bi-fuel taxis from new to 160,000 km: Deterioration and environmental implications, Fuel, 362, 130863, https://doi.org/10.1016/j.fuel.2024.130863, 2024.
Wang, Y., Hao, C., Ge, Y., Hao, L., Tan, J., Wang, X., Zhang, P., Wang, Y., Tian, W., Lin, Z., and Li, J.: Fuel consumption and emission performance from light-duty conventional/hybrid-electric vehicles over different cycles and real driving tests, Fuel, 278, 118340, https://doi.org/10.1016/j.fuel.2020.118340, 2020.
Wang, Y., Zhao, H., Yin, H., Yang, Z., Hao, L., Tan, J., Wang, X., Zhang, M., Li, J., Lyu, L., Wang, H., Wang, C., Tan, D., and Ge, Y.: Quantitative study of vehicle CO2 emission at various temperatures and road loads, Fuel, 320, 123911, https://doi.org/10.1016/j.fuel.2022.123911, 2022b.
Woo Jeong, J., Baek, S., Park, S., Lee, S., Lim, Y., and Lee, K.: Trends in NOx and NH3 emissions caused by three-way catalysts, Fuel, 366, 131282, https://doi.org/10.1016/j.fuel.2024.131282, 2024.
Wu, Y., Zhang, S., Hao, J., Liu, H., Wu, X., Hu, J., Walsh, M. P., Wallington, T. J., Zhang, K. M., and Stevanovic, S.: On-road vehicle emissions and their control in China: A review and outlook, Sci. Total Environ., 574, 332–349, https://doi.org/10.1016/j.scitotenv.2016.09.040, 2017.
Xue, L., Jin, Y., Yu, R., Liu, Y., and Ren, H.: Toward “net zero” emissions in the road transport sector in China, World Resources Institute, https://wri.org.cn/sites/default/files/2021-12/toward-net-zero-emissions-road-transport-sector-china-CN.pdf (last access: 9 July 2025), 2019.
Yang, X., Ke, J., Huang, Z., Wen, Y., Yin, D., Jiang, Z., Yue, Z., Wang, Y., Liao, S., Yin, H., and Ding, Y.: Measurement report: Insight into Greenhouse Gas Emission Characteristics of Light-Duty Vehicles in China Driven by Technological Innovation, Zenodo [data set], https://doi.org/10.5281/zenodo.15253351, 2025.
Yin, D., Ai, L., and Weng, Y.: Greenhouse gas emissions characteristics of China VI light-duty gasoline vehicles, China Environmental Science, 44, 679–685, 2024.
Yin, X., Chen, W., Eom, J., Clarke, L. E., Kim, S. H., Patel, P. L., Yu, S., and Kyle, G. P.: China's transportation energy consumption and CO2 emissions from a global perspective, Energ. Policy, 82, 233–248, https://doi.org/10.1016/j.enpol.2015.03.021, 2015.
Yuan, Z., Li, Z., Kang, L., Tan, X., Zhou, X., Li, X., Li, C., Peng, T., and Ou, X.: A review of low-carbon measurements and transition pathway of transport sector in China, Advances in Climate Change Research, 17, 27–35, 2021.
Zeng, Y., Tan, X., Gu, B., Wang, Y., and Xu, B.: Greenhouse gas emissions of motor vehicles in Chinese cities and the implication for China's mitigation targets, Appl. Energ., 184, 1016–1025, https://doi.org/10.1016/j.apenergy.2016.06.130, 2016.
Zhang, L., Long, R., Chen, H., and Geng, J.: A review of China's road traffic carbon emissions, J. Clean. Prod., 207, 569–581, https://doi.org/10.1016/j.jclepro.2018.10.003, 2019.
Zhang, Y., Yang, X., and Fu, M.: Emission Characteristics of Particle Number from Conventional Gasoline and Hybrid Vehicles, Sustainability, 16, 12, https://doi.org/10.3390/su16010012, 2024.
Zhong, H., Yu, F., Liao, S., Zhu, M., Duan, J., Sha, Q. e., Liu, J., and Zheng, J.: Development and evaluation of methane emission factor model for light-duty gasoline vehicles based on on-road driving tests, Acta Scientiae Circumstantiae, 43, 176–184, 2023.
Zhu, X.-H., He, H.-D., Lu, K.-F., Peng, Z.-R., and Gao, H. O.: Characterizing carbon emissions from China V and China VI gasoline vehicles based on portable emission measurement systems, J. Clean. Prod., 378, 134458, https://doi.org/10.1016/j.jclepro.2022.134458, 2022.