the Creative Commons Attribution 4.0 License.
the Creative Commons Attribution 4.0 License.
 | 15 Jul 2025
Significant influence of oxygenated volatile organic compounds on atmospheric chemistry: a case study in a typical industrial city in China
Jingwen Dai
Yanli Feng
Xin Yi
Rui Li
Jin Xue
Qing Li
Lishu Shi
Jiaqiang Liao
Yanan Yi
Fangting Wang
Liumei Yang
Hui Chen
Ling Huang
Jiani Tan
Yangjun Wang
Oxygenated volatile organic compounds (OVOCs), an important subgroup of volatile organic compounds (VOCs), are emitted directly or formed secondarily through photochemical processes. They play a crucial role in tropospheric chemistry as ozone (O3) precursors. However, due to measurement limitations, the influence of OVOCs on O3 formation has often been underestimated. In this study, 74 VOCs (including 18 OVOCs) were measured at five representative stations (urban, suburban, industrial, upwind, and downwind stations) in Zibo, an industrial city in the North China Plain. The VOCs level in Zibo (44.6 ± 20.9 × 10⁻⁹) is in the upper-middle range (> 32 × 10−9) compared to previous studies conducted in most Chinese cities, with OVOCs contributing for 30.0 %–37.8 %. The average O3 formation potential in Zibo is 410.4 ± 197.2 µg m−3, with OVOCs being the dominant contributor (31.5 %–55.9 %). An observation-based model (OBM) was used to access the contributions of chemical production (RNetProd) and emissions/transport (REmis&Trans) to individual OVOCs. Daytime (08:00–18:00 LT) RNetProd is highest at the urban site (5.9 × 10⁻⁹ h−1), while nighttime REmis&Trans is most negative at the industrial site (0.76 × 10⁻⁹ h−1). Simulations without OVOC constraint overestimate OVOCs (42.1 %–126.5 %) and key free radicals (e.g., hydroperoxy radicals (HO2, 5.3 %–20.4 %) and organic peroxy radicals (RO2, 6.6 %–35.1 %)), leading to a 1.8 %–11.9 % O3 overestimation. This overestimation causes an underestimation of hydroxyl radicals (OH) (1.8 %–20.9 %) and atmospheric oxidizing capacity (3.5 %–12.5 %). These findings emphasize the importance of comprehensive OVOC measurements to constrain numerical models, especially in regions with dense anthropogenic emissions, to better reproduce atmospheric photochemistry, and to formulate more effective air pollution control strategies.
- Article
(4353 KB) - Full-text XML
-
Supplement
(2763 KB) - BibTeX
- EndNote


Oxygenated volatile organic compounds (OVOCs), contributing 20.1 %–73.5 % of total volatile organic compounds (VOCs) (Han et al., 2019; Huang et al., 2020; Li et al., 2022a; Liu et al., 2024; Song et al., 2024), are critical components of tropospheric photochemistry (Yang et al., 2014). Photolysis of OVOCs has been proved to be the most significant primary source of ROx (OH + HO2+ RO2) in Guangzhou, Beijing, and Xi'an in China (Wang et al., 2022c; Yang et al., 2018; Zhang et al., 2021b), and thereby accelerating the recycling of radicals to promote ozone (O3) formation (Qu et al., 2021; Wang et al., 2022c). In addition, previous studies have shown that sufficient free radicals produced by photolysis of OVOCs are the dominating contributors to O3 pollution during winter (Edwards et al., 2014; Emmerson et al., 2005). The study of Li et al. (2021b) indicates that the fast generation of O3 during winter haze in the North China Plain is mainly driven by the photolysis of formaldehyde (HCHO), which leads to a large production of HOx radical and offsets the radical titration induced by NOx emissions. In addition, HCHO and other OVOCs dominated the OH loss with VOCs (Goldan et al., 2004), resulting in a predominant role in OH reactivity (Ling et al., 2014; Yang et al., 2018). Therefore, OVOCs play a significant role in the atmospheric chemistry.
OVOCs have complex and diverse sources, including primary emissions from anthropogenic, e.g., vehicle exhausts (Gentner et al., 2013; Legreid et al., 2007; Wang et al., 2022b), volatile chemical product use (Ou et al., 2015), industries (Wang et al., 2023), biomass combustion (Gilman et al., 2015; Karl et al., 2007; Li et al., 2014a; Yokelson et al., 2007), and biogenic sources (Ou et al., 2015; Rieksta et al., 2023). They are also formed secondarily through photochemical reactions (Huang et al., 2020; Song et al., 2024; Xia et al., 2021). Mo et al. (2016) estimated that OVOCs from heavy-duty diesel vehicle emissions accounted for 53.8 % of total VOCs in China, and OVOCs account for 12.4 %–46.3 % of VOCs emission from biomass and residential coal combustion, which demonstrates the importance of combustion-related sources of OVOCs. In addition, measurement of VOC fluxes based on the airborne eddy covariance technique showed that urban emission sources comprise a surprisingly large proportion of OVOCs (29 %–56 %) (Karl et al., 2018; Pfannerstill et al., 2023). Due to the high share of OVOCs in VOCs, previous studies have reported that OVOCs could contribute 38 %–60 % of ozone formation potential (OFP) (Liu et al., 2024; Mo et al., 2022; Wang et al., 2022a, 2024). The loss of OVOCs occurs through photolysis, reactions with oxidants (e.g., OH, NO3, and O3), dilution mixing and deposition (Atkinson, 2000; Atkinson and Arey, 2003). Moreover, air mass transport also can significantly affect the mixing ratio of OVOCs.
Chemical transport models (CTMs) have been widely used for the study of formation mechanism of OVOCs and their influence on air quality (Chen et al., 2022; de Gouw et al., 2018; Luecken et al., 2012; Steiner et al., 2008; Yang et al., 2023). However, due to the deviation of the meteorological field, uncertainty of the emission inventory (Li et al., 2019; McDonald et al., 2018; Shen et al., 2019), and defects of lumped chemical mechanism (Li et al., 2014b; Sarwar et al., 2008; Stockwell et al., 1997a; Venecek et al., 2018), there is a large uncertainty in the OVOCs simulated by CTMs, which in turn leads to large deviations in the simulated atmospheric photochemistry. The observation-based model (OBM) can avoid these biases to a certain extent by constraining meteorological parameters and chemical species, and leveraging detailed chemical mechanism (e.g., Master chemical mechanism (MCM)). Nevertheless, due to the limited observations of OVOCs (e.g., Pfannerstill et al., 2023), many existing studies use OBM without the observed OVOC data, or only with limited inputs for certain OVOC species (formaldehyde, acetaldehyde, acetone), which can greatly bias the assessment of O3 generation mechanism, free radical chemistry, and atmospheric oxidation. Wang et al. (2022a) showed that the box model without the constraint of OVOCs underestimates OVOC concentrations, which in turn lead to the underestimation of ROx and O3 formation. Thus, it is meaningful to couple OVOC observation with OBM to investigate how OVOCs affect radical chemistry, atmospheric oxidization capability, and O3 formation mechanism.
Zibo, a typical industrial cluster city in China, has been suffering from O3 pollution for years (Li et al., 2021a; Qin et al., 2023). However, comprehensive studies involving the observation of VOCs, particularly OVOCs such as HCHO, are rare. Qin et al. (2023) used observations of 98 VOCs (without HCHO) in Zibo to constrain OBM, but the absence of HCHO in their simulation could result in underestimation ROx, thus disturbing the investigation of OH budget (Fuchs et al., 2017; Guo et al., 2021; Ling et al., 2014; Qu et al., 2021; Tan et al., 2017). This study hypothesizes that incorporating observational constraints on OVOCs significantly influences the OBM simulations. To evaluate this, a 5 day field campaign was conducted across five representative sites in Zibo. Concentrations of 74 VOC species, including 29 alkanes, 16 aromatics, 9 alkenes, 18 OVOCs, acetylene and isoprene, were obtained. The contributions of secondary formation, emissions/transport to OVOCs level were analyzed by the OBM. Additionally, the effect of OVOCs on radical chemistry, atmospheric oxidation capability, and consequently O3 production were quantified.
2.1 Sampling sites and measurements
To capture a typical ozone pollution case, the field campaign was conducted from 8 to 12 August 2021, at five monitoring sites (Zhonglou (ZL), Chengdong (CD), Chengqu (CQ), Tianzhen (TZ), and Xindian (XD)) in Zibo (Fig. 1, Table S1 in the Supplement). Among the five sites, the ZL site (117°54′ E, 36°39′ N) is an urban site, which is located in the central area of Zibo, and is mainly surrounded by residential areas and factory buildings. According to the prevailing wind direction (northeast, Fig. S1a in the Supplement), CQ (118°60′ E, 36°57′ N) the location is an upwind site, while CD (117°53′ E, 36°31′ N) is a downwind site. CD is located on a hillside in the southern part of Zibo, with a small number of ceramic and refractory factories nearby. TZ (117°48′ E, 37°10′ N) is close to the Shengli Oil field on the west, and is surrounded by farmland. This site is regarded as a suburban site and is affected by residential emissions in the north of Zibo, as well as nearby oil production operations. XD (118°19′ E, 36°48′ N) is close to a chemical industrial park and serves as an industrial site. More detailed information about these sites can be found listed in Table S1.
Site-scale wind patterns can affect the levels and spatial distribution of OVOCs and PAMS (target VOC species from the photochemical assessment monitoring stations include 29 alkanes, 16 aromatics, 9 alkenes, isoprene, and acetylene) across sites. Urban (ZL) and downwind (CD) sites are affected by OVOC pollution from northeasterly (NNE, NE, ENE) winds, while the upwind (CQ) site experiences higher OVOC and VOC pollution from both northeasterly and northwesterly (WNW, NW, NNW) winds (Fig. S2a, b). Suburban (TZ) and industrial (XD) sites exhibited higher OVOC and VOC levels under southeasterly (SE) and southwesterly (WSW) winds, respectively, probably due to upwind emissions from nearby industrial sources. Wind speeds (WSs) between 1 and 2 m s−1 were most common (40.4 %) during the observation period. At suburban (TZ) and industrial (XD) sites, OVOC and VOC levels were higher at low WSs (WS <2 m s−1) than that at higher WS, reflecting the influence of local emissions (Fig. S2c, d). In contrast, at the downwind (CD) site, higher OVOC and VOC levels were observed at WS > 2 m s−1, indicating the effect of regional transport. At the urban (ZL) site, higher WS is associated with lower VOC levels and higher OVOC levels, indicating the influence of aging air masses transported from upwind regions.
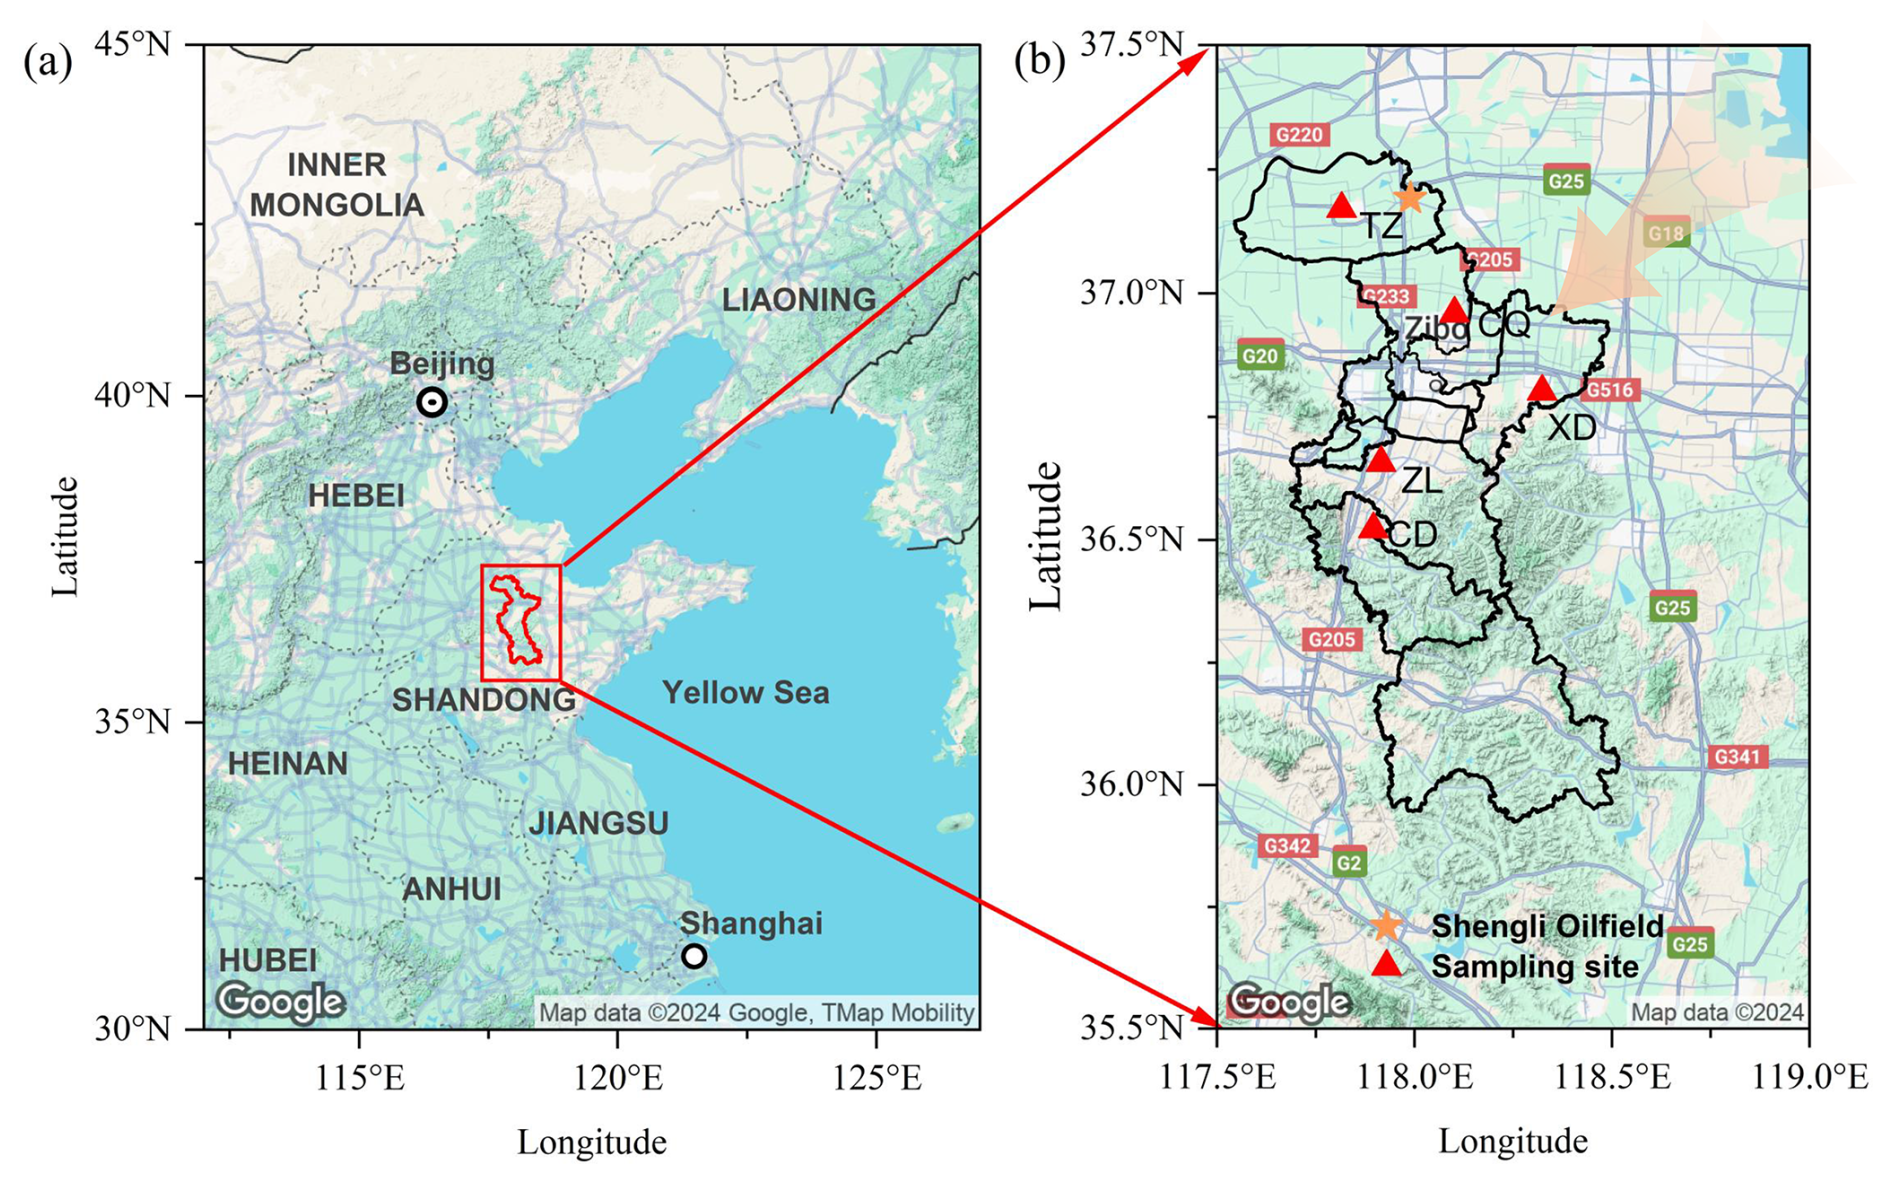
Figure 1(a) Map of the North China Plain and (b) map of Zibo with locations of VOCs monitoring stations (red triangles), and Shengli Oil field (yellow star), and prevailing wind direction (orange arrow).
During the campaign, two online gas chromatography-flame ionization detector (GC-FID, Thermo Scientific GC5900) systems were deployed at suburban (TZ) and upwind (CQ) stations, and three online gas chromatography-flame ionization detector (GC-FID, Syntech Spectras GC 955–615/815) systems were deployed at downwind (CD), industrial (XD) and urban (ZL) stations, respectively. A mixture of 56 PAMS target species (Spectra Gases Inc., USA, Table S2) was used for the calibration of the GC-FID system. Each VOC analyzer provided measurements with a 1 h temporal resolution. More detailed descriptions of these instruments can be found in previous studies (Li et al., 2023; Wang et al., 2014; Yang et al., 2022a; Zheng et al., 2023). Overall, the detection limits for most VOC species are below 0.1 × 10⁻⁹. Additionally, 18 oxygenated VOC species were collected by 2,4-dinitrophenylhydrazine (DNPH) sorbent tubes in conjunction with an automated sampler for a period of 1 or 3 h per sample. A 47 mm quartz filter membrane is attached to the front of the sampling tube to filter particulate matter. An ozone scrubber (silica gel column tubing coated with potassium iodide) was placed at the front of the air inlet to avoid ozone interference. OVOCs were derivatized in cartridges to hydrazones during sampling. The cartridges were eluted with 3 mL of acetonitrile and stored at 0–4 °C immediately. Then the eluants were analyzed using an Agilent HPLC, equipped with an ultraviolet absorption detector (UVD), quadruple pump, and an Agilent TM C18 reversed column (250 mm × 4.6 mm, 5.0 µ m). A gradient elution was used, and the mobile phase was a mixture of acetonitrile, tetrahydrofuran, and water. The analysis was carried out using a ternary gradient elution program at a flow rate of 1.2 mL min−1, with a detection wavelength of 360 nm, and sample volume of 10 µL at a column temperature of 45 °C. More details about OVOC samplings and analysis can be found in Peng et al. (2023). The lower limit of detection for OVOC were < 0.1 × 10⁻⁹ (Peng et al., 2023). A total of 271 valid OVOCs samples were collected during the campaign. At the industrial (XD) and suburban (TZ) stations, eight samples were collected per day at 3 h intervals. At the urban (ZL), upwind (CQ), and downwind (CD) stations, 10 samples were collected per day, with seven samples collected at 1 h intervals during 07:00–21:00 LT, and three samples collected at 3 h intervals during the night (01:00–06:00 and 22:00–01:00+1 LT); totaling 59 valid samples per station. Finally, a total of 74 VOCs (56 PAMS and 18 OVOCs) were combined to conduct data analysis in this study (Table S2). Conventional gas phase pollutants (e.g., O3, CO, and NOx (NO and NO2)) were measured using commercial online analyzers (Thermo Scientific 49i, 48i, and 42i, USA) at each site. NOx was measured by NO chemiluminescence and chemical conversion with a molybdenum convertor, which is known to be affected by NOz species (Tan et al., 2017, 2019a). Meteorological parameters, including temperature (T), relative humidity (RH), WS, wind direction (WD), and ambient pressure (P) were obtained synchronously by Chinese ground-based meteorological stations (Boshan, Huantai, Gaoqing, Linzi, and Zichuan sites) (http://data.cma.cn/, last access: 26 March 2024).
2.2 Observation-based model
A box model (F0AM) coupled with MCM v3.3.1 was utilized to simulate the in situ atmospheric chemical process at the five sites (Jenkin et al., 2015; Wolfe et al., 2016). The MCMv3.3.1, as a nearly explicit mechanism with more than 5800 species and 17 000 reactions, provides a more detailed gas chemistry than other lumped mechanisms, such as the Carbon Bond Mechanism (CB) (Yarwood et al., 2005, 2010), Regional Atmospheric Chemistry Mechanism (RACM) (Goliff et al., 2013; Stockwell et al., 1997b), and SAPRC (Carter, 1990, 2010b; Carter and Heo, 2013). The box model calculations were constrained by comprehensive measurements of trace gases (NO, NO2, CO, and SO2) and 45 speciated VOCs, encompassing 20 alkanes, 9 alkenes, 14 aromatics, 15 OVOCs, isoprene and acetylene, as well as meteorological parameters (T, RH and P). To address potential NO2 measurement artifacts, several adjustments were implemented. Considering that PKU-Mo as a catalytic converter for NO2 measurement can cause interferences from other nitrogen–oxygen compounds (e.g., PAN, HNO3), potentially overestimating NO2 by 30 %–50 % (Kim et al., 2015; Tan et al., 2017, 2019a; Xu et al., 2013). In this study, the observed NO2 concentrations at the five sites were reduced by 30 %–40 % (40 % for ZL and CQ, 30 % for CD, TZ and XD) to compensate for catalytic converter interferences (Xu et al., 2013). Additionally, strong anthropogenic emissions (e.g., vehicle emissions) near the sites may prevent the model from reaching steady state, leading to positive deviations (Li et al., 2014c). Therefore, NO steady-state approximations (NOss), calculated according to the equations proposed by Del Negro et al. (1999) (Eq. S1 in the Supplement), were used to constrain the simulated NO. The uncertainties derived from the NOx settings are listed in Table S3 and analyzed in Sect. 3.4. HONO was fixed to 2 % of the corrected NO2 mixing ratio (Elshorbany et al., 2012; Tan et al., 2019a), and the corresponding uncertainty is summarized in Sect. 3.4. In addition, the boundary-layer height (BLH), and surface net solar radiation (SSR) were obtained from the fifth generation of the European Centre for Medium-Range Weather Forecasts (ECMWF) reanalysis for the global climate and weather (https://cds.climate.copernicus.eu, last access: 1 March 2024). The photolysis frequency correction factor (Jcorr) of the model input was adjusted by SSR. BLH was also included in the model to control the deposition process (Xuan et al., 2023; Zhu et al., 2020).
The model ran with a continuous time-series profile for the campaign period (8–12 August) with a 1 h time step. A sensitivity analysis was performed for the time step and the results are summarized in Sect. 3.4. Each simulation started with a 10 d spin up to reach the steady-state condition. Missing observation data were filled with linear interpolation, and the mixing ratios of OVOCs were also linearly interpolated to 1 h resolution for modeling. An artificial loss process corresponding to an atmospheric lifetime of 24 h or a first-order dilution rate (kdil) of 1/86400 s−1 was introduced for all simulated species, including secondary species and radicals, to approximately simulate dry deposition and other losses (Lou et al., 2010; Tan et al., 2018b; Wang et al., 2022c). The model cases that run with the above settings with 15 constrained OVOC species are called the Base scenario. To investigate the effects of constraints of OVOCs on atmospheric chemistry, the Free scenario was conducted, with all the setting of the Base scenario except for the OVOC constraint.
2.3 Budgets of OVOCs and O3
At a given site, variations in OVOC mixing ratios are mainly influenced by in situ photochemical production and chemical loss, emissions, regional transport, and deposition (Tan et al., 2018a; Xue et al., 2014a; Zhang et al., 2021b). The change rate of observed OVOCs (RMeas) is calculated by Eq. (1). The in situ photochemical production of OVOC (RChemProd) is mainly caused by the oxidation of VOCs, while their in situ chemical loss (RChemLoss) includes photolysis and reactions with oxidants (OH, NO3, and O3) (https://mcm.york.ac.uk/MCM/, last access: 13 January 2025) (Atkinson, 2000; Atkinson and Arey, 2003; Jenkin et al., 2015; Saunders et al., 2003). The in situ net OVOC chemical production (RNetProd) (Eq. 2) and their removal by deposition (RDeps) are calculated hourly according to the OBM simulation. The OBM primarily accounts for atmospheric photochemical reactions, and deposition within the boundary layer. However, previous studies have reported that the OBM lacks an explicit representation of transport processes and emissions (Wolfe et al., 2016; Zhang et al., 2021b), making it challenging to disentangle their respective contributions. Therefore, emissions and transport are combined to a single term (REmis&Trans) to represent their contributions collectively. If the REmis&Trans is positive, it is considered a net import of emissions/transport, whereas a negative suggests a net export. The emissions and regional transport of OVOCs (REmis&Trans) are computed as Eq. (3).
where [OVOC]i represents the mixing ratios of OVOC species i constrained in OBM, 15 in total (Table S2); dt is the time step of modeling, and d[OVOC]i refers to the change in mixing ratio of OVOC species i.
Considering the oxidation of NO to NO2 by peroxyl radicals, the total oxidant (Ox= O3+ NO2) is generally used to characterize the chemical budget of O3 (Kanaya et al., 2009; Xue et al., 2014b). The total chemical production of Ox through oxidations of NO by HO2 and RO2 radicals (Tan et al., 2018b), is defined as the production of O3 (P(O3)), which is calculated according to Eq. (4):
The chemical loss rate (L(O3)) of O3 is equal to the sum of loss rates of O3 and NO2, including O3 photolysis, reactions of O3 with OH, HO2 and alkenes, as well as reactions of NO2 with OH and RO2, and the reaction of NO3 with unsaturated VOCs (Chen et al., 2020; Liu et al., 2022; Xue et al., 2016, 2014b).
The concentrations of radicals and intermediates are derived from the outputs of the OBM. The k values in Eqs. (4) and (5) rate constants of the corresponding reactions, which can be found from https://mcm.york.ac.uk/MCM/ (last access: 13 January 2025) or the study by Liu et al. (2022). The subscript “j” in Eqs. (4) and (5) denotes individual RO2 species. The subscript “i” in Eq. (5) represents individual VOC species. The net O3 production rate can be obtained from the difference between P(O3) and L(O3).
2.4 Evaluation of ozone formation potential and atmospheric oxidation capacity
Different VOC species vary in their capability to form ozone, and their potential to produce O3 can be evaluated by the maximum incremental reactivity (MIR) (Carter, 2010a). The ozone formation potential (OFP) calculated for each VOC species represents its maximum contribution to ozone production (Bufalini and Dodge, 1983). The OFP of VOCs is calculated as follows:
where OFPi is the OFP of VOC species i (µg m−3), [VOC]i is the atmospheric concentration of VOC species i (µg m−3), and MIRi is the maximum incremental reactivity coefficient of the VOC species i (g O3 (g VOCs)−1) (Table S2) from Carter, 2010a.
Atmospheric oxidation capacity (AOC) is the core driving force of complex air pollution, influencing the removal rate of trace gases and the production rates of secondary pollutants (Liu et al., 2021). AOC is calculated based on the sum of oxidation rates of oxidants (OH, O3, and NO3) with primary pollutants (VOCs, CO, and CH4) (Elshorbany et al., 2009; Geyer et al., 2001; Yang et al., 2022b). The formula is as follows:
where Yi represents primary VOCs (excluding OVOCs), CO and CH4, X represents oxidants (OH, O3 and NO3), and kYi is the bimolecular rate constant for the reaction of Yi with X. Atmospheric oxidation capacity determines the rate of Yi removal.
3.1 Meteorological and chemical conditions
The field campaign is characterized by consistent hot and sunny conditions, with an average daily maximum temperature and SSR of 32.2 ± 1.4 °C (peak at 34.1 °C) and 2.1 ± 0.4 × 10⁶ J m−2 (Figs. 2, S2a), respectively, which favors the photochemical formation of O3. A typical O3 episode was observed, with an average maximum daily 8 h average O3 (MDA8-O3) of 89.8 × 10⁻⁹ in Zibo city. According to the Chinese National Ambient Air Quality Standard Grade II (approximately 93.3 × 10⁻⁹ for 1 h average, or 74.7 × 10⁻⁹ for MDA8-O3), there are four O3 pollution days (8 to 11 August) during the campaign. The average mixing ratios of SO2, NO2, NO, and CO in Zibo are 2.8 ± 1.6, 12.0 ± 6.9, 2.8 ± 4.8, and 897 ± 670 × 10−9, respectively (Figs. 2, S3b). The mean VOC mixing ratio in this study is 44.6 ± 20.9 × 10⁻⁹, which is overall higher than that in Beijing (18.3 ± 8.9 × 10⁻⁹) from 23 July to 31 August in 2016 (Wu et al., 2023), Rizhao (9.83 × 10⁻⁹) in summer in 2022 (Zhang et al., 2023), and Xi'an (29.1 ± 8.4 × 10⁻⁹) from 20 June to July 2019 (Song et al., 2021). Compared with the median VOC levels (∼32 × 10−9) in other cities in China (Fig. 3, Table S4), VOC levels in Zibo are in the upper-middle range. Previous studies have demonstrated that industrial processes account for approximately 49 % of total VOC emissions in Shandong Province (Jiang et al., 2020; Li et al., 2017; Ren, 2011; Zheng et al., 2021). This indicates strong anthropogenic VOC emission in Zibo. Notably, VOC emission intensity in Zibo was among the highest in Shandong Province, with values > 90 t km−2 yr−1, even > 108 t km−2 yr−1 in some areas in 2016 (Jiang et al., 2020; Zhou et al., 2021). In terms of the VOC groups (Figs. 5c, S4a), alkanes and OVOCs were the two predominant groups at each site, accounting for 33.3 %–51.5 % and 30.0 %–37.8 % to the total VOCs, respectively, followed by aromatics (3.8 %–16.5 %) and alkenes (5.0 %–13.8 %). In addition, the difference between peak and valley NO2 mixing ratios was 14.4 ± 3.2 × 10⁻⁹, indicating that substantial NOx was converted to O3.
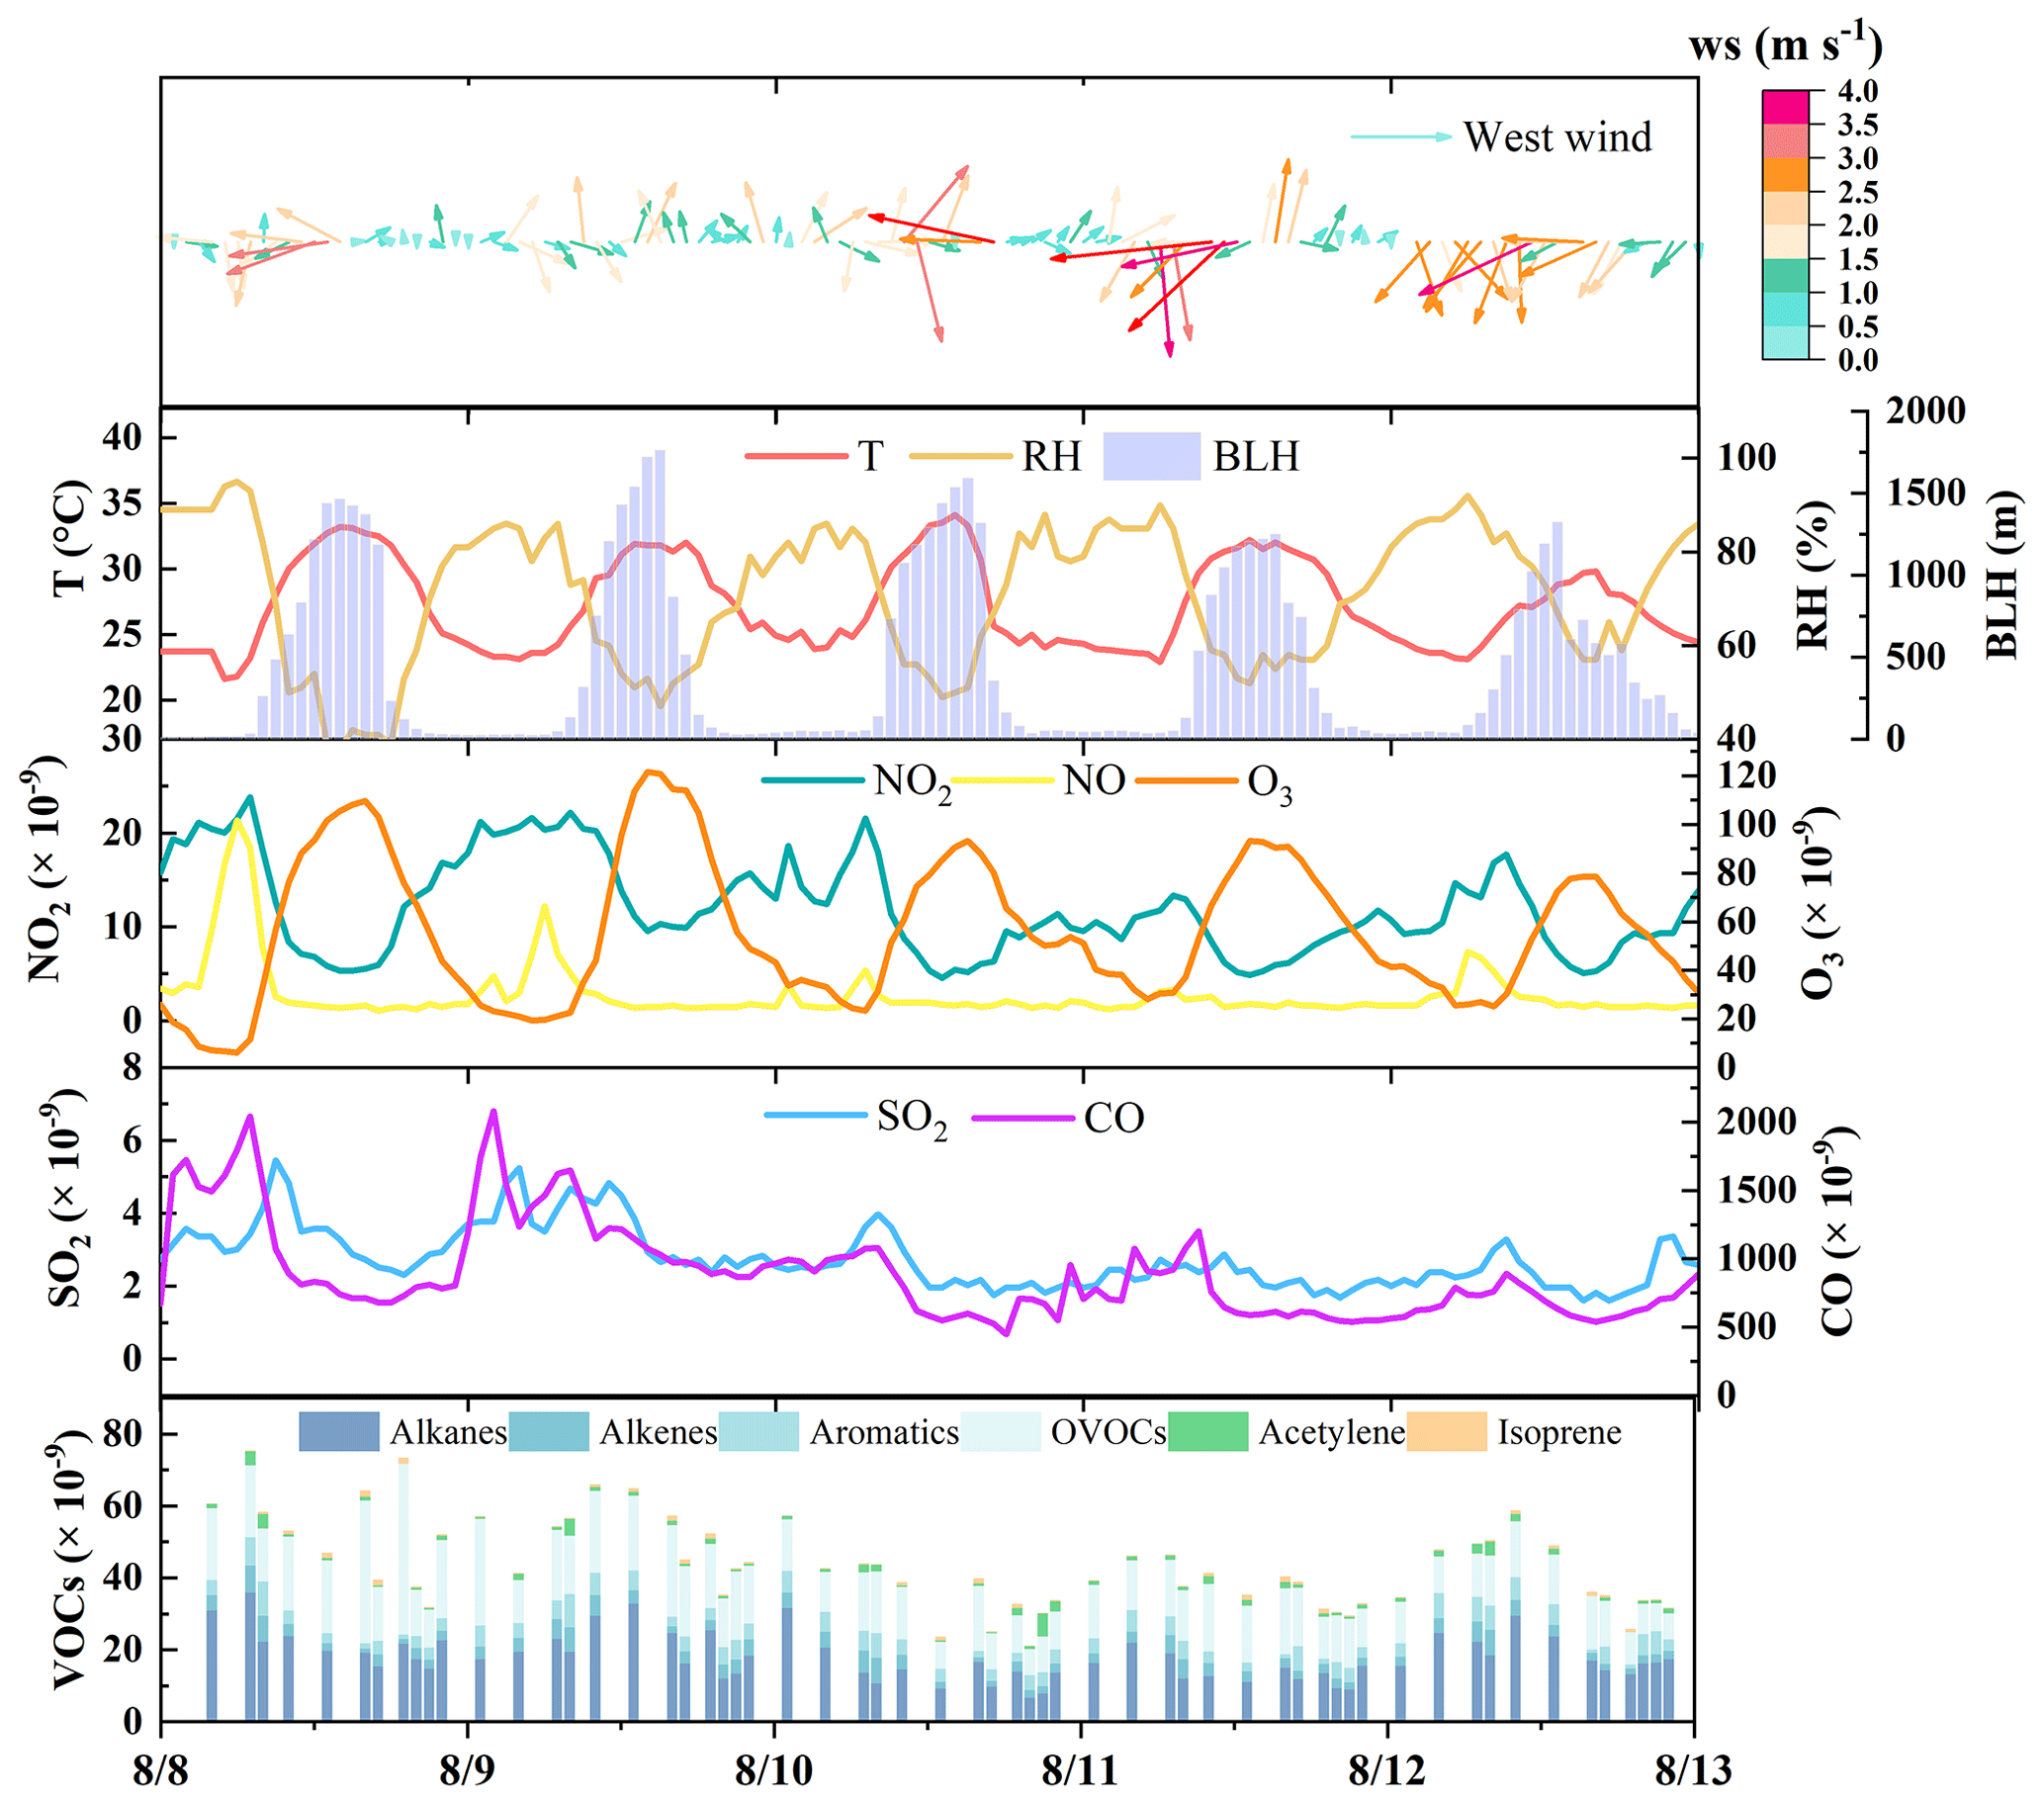
Figure 2Time profiles of pollutant mixing ratios and meteorological parameters in Zibo from 8 to 12 August 2021. The meteorological data were from ZL, the central site of Zibo, and the pollutants data were the average of the five sites. The hourly PAMS (including alkanes, alkenes, aromatics, acetylene, and isoprene) data were aligned with the h sampling intervals of the OVOCs data to ensure comparability between the two datasets.
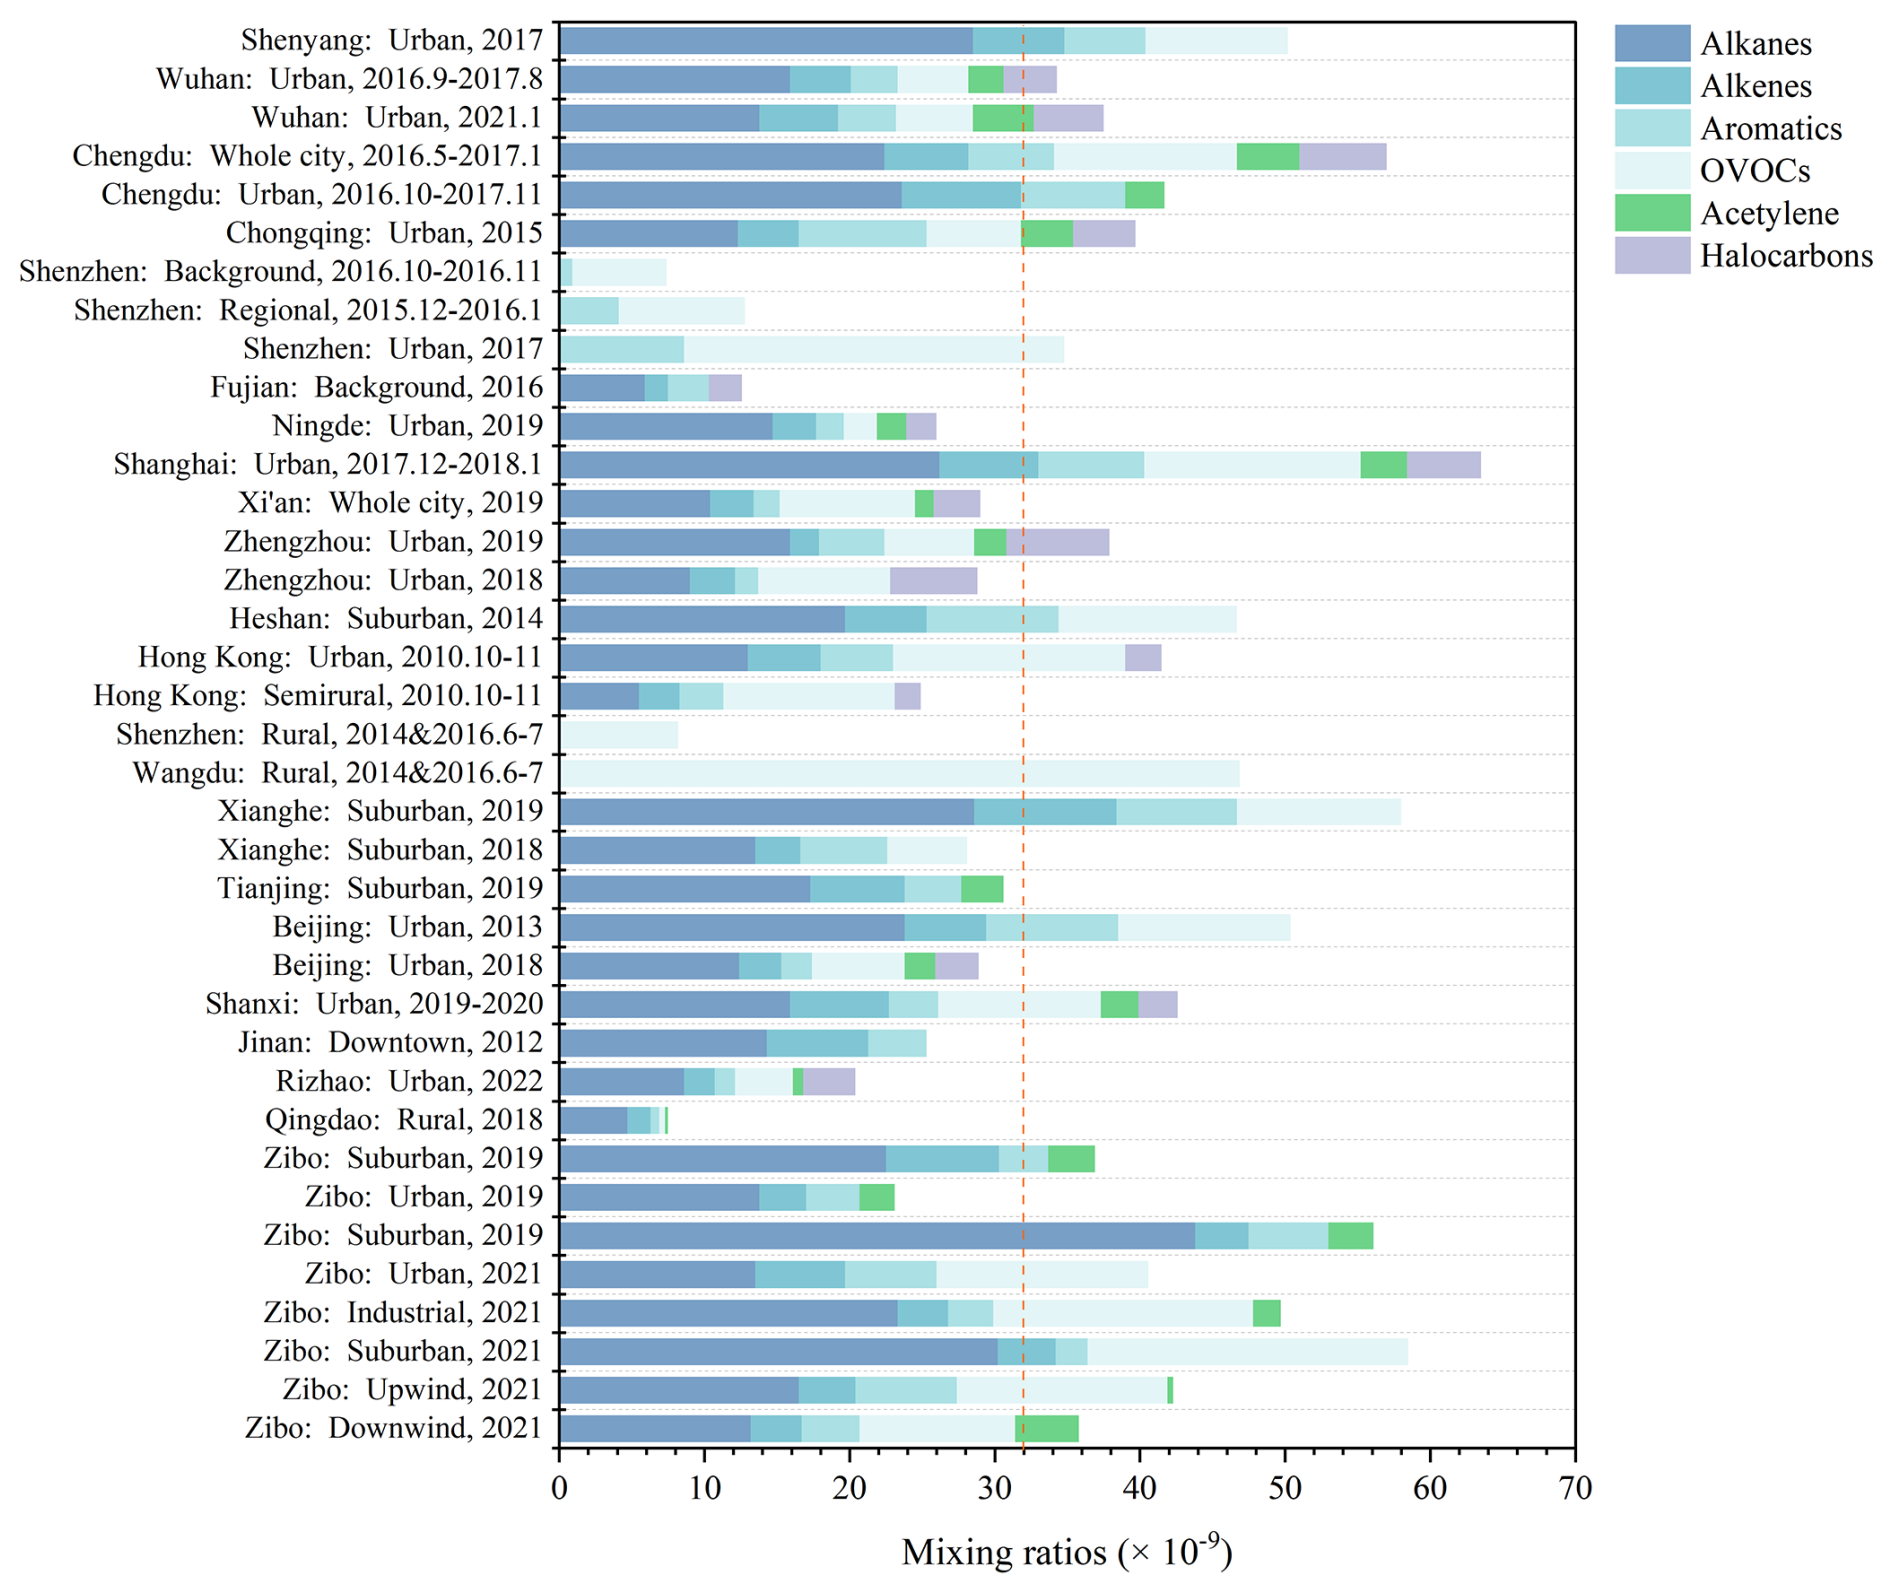
Figure 3Comparison of VOCs mixing ratios and compositions in this study with former studies based on Table S4. The red dash line represents the median levels (∼32 × 10−9) of VOCs.
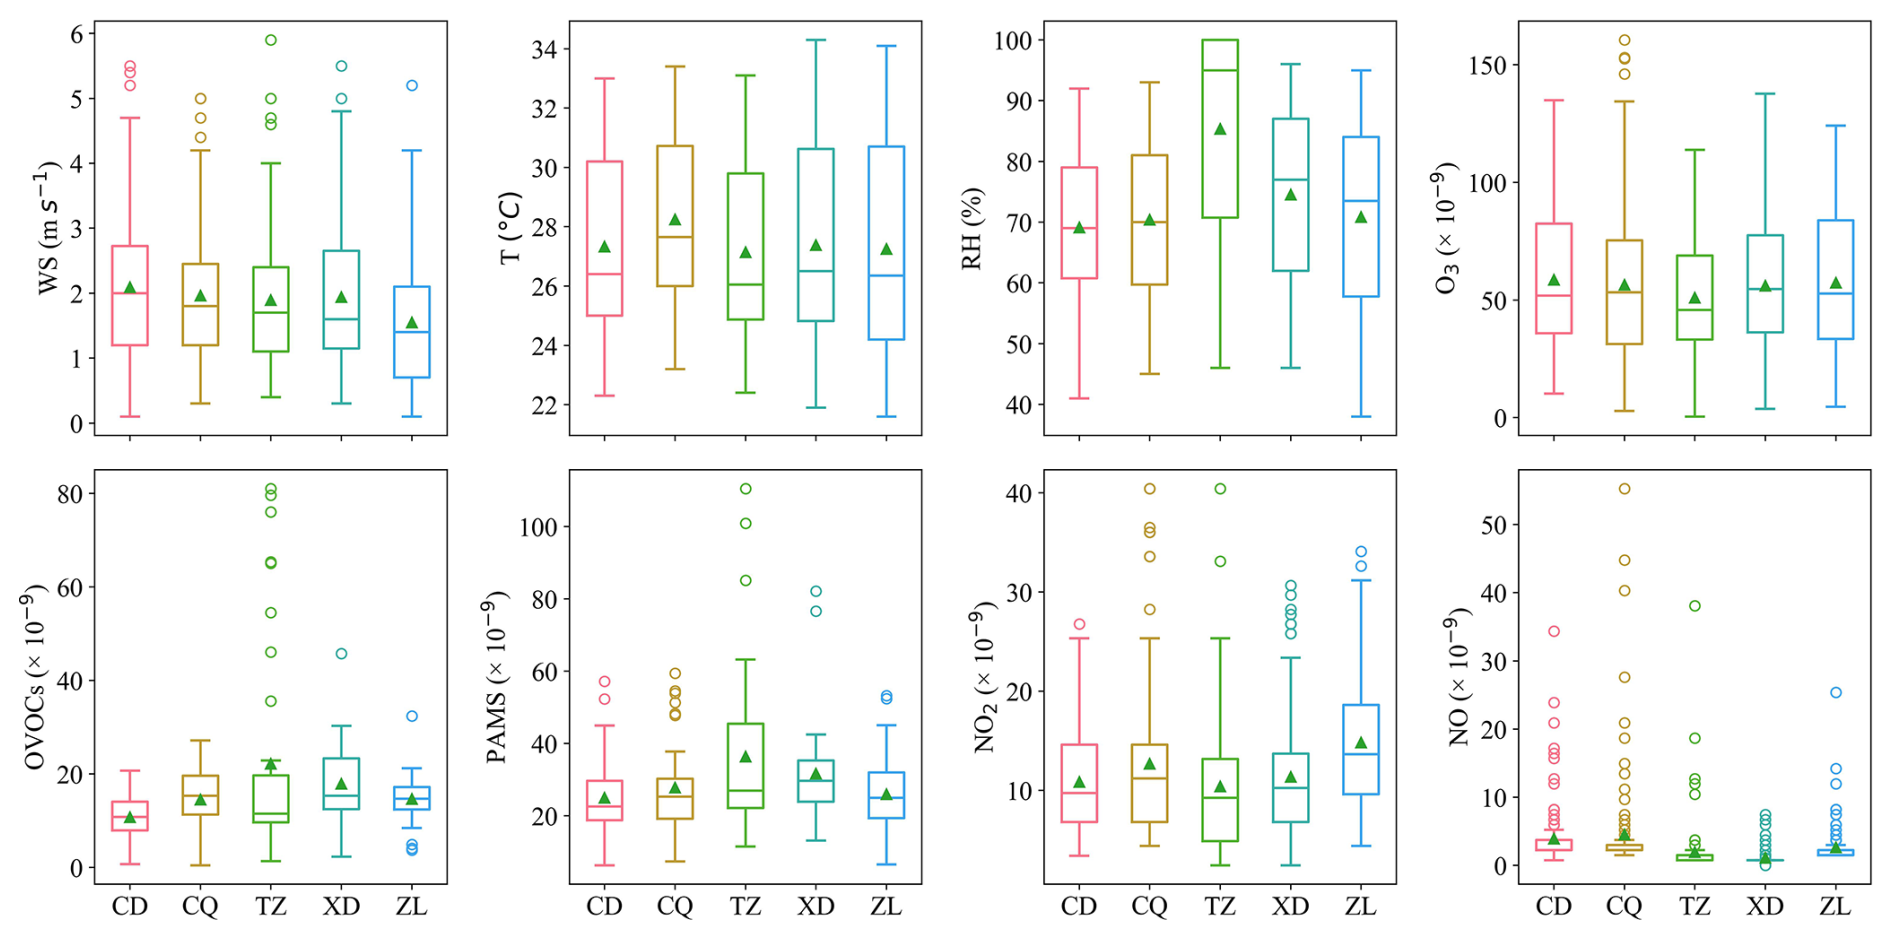
Figure 4Distribution of O3 and its precursors (OVOCs, PAMS, NO2, and NO) and meteorological parameters (WS, T, and RH) at five sites, with the green triangle being the mean value and the horizontal line in the box being the median.
Across the five sites, the O3 mixing ratios are comparable across all the sites (Tables S6, S11) (p> 0.05). However, TVOCs at the suburban site (TZ, 58.5 ± 35.0 × 10⁻⁹) are the highest (Figs. 5c, S4b), which is attributed to oil refineries near this site. The downwind site (CD) has slightly lower NO2 levels (10.8 ± 5.1 × 10⁻⁹) and lower TVOC mixing ratios (35.7 ± 12.5 × 10⁻⁹) than the urban site (ZL, 14.8 ± 6.5 and 40.6 ± 10.3 × 10⁻⁹, respectively) and upwind site (CQ, 12.7 ± 8.1 and 42.3 ± 15.4 × 10⁻⁹, respectively), and has higher O3 mixing ratio (58.6 ± 30.0 × 10⁻⁹) than the CQ and ZL stations. This may be attributed to the sequential transport of O3 and its precursors from the upwind station (CQ) to the urban station (ZL), and subsequently to the downwind station (CQ), driven by the dominant northeasterly winds (Figs. 1b, S1).
According to the time series of individual pollutant (Fig. S3b), CQ showed obvious peak mixing ratios of O3, NO2, NO, and CO than the other sites during 8–9 August, with stagnant conditions (WS < 2 m s−1), indicating stronger emissions from combustion sources and possibly fast photochemical process near CQ. In addition, XD showed high mixing ratios of CO during 8–9 August, and high daytime TVOCs levels on 9 August (09:00–14:00 LT, 90–110 × 10−9). Given CO's relatively inert nature and the absence of similar CO peaks at the other four sites, the abnormal CO peak at XD is related to strong emissions from nearby factories in the industrial park. TZ showed distinct morning and evening peaks of TVOCs at 06:00 LT (163.0 × 10⁻⁹) and 21:00 LT (120.0 × 10⁻⁹) on 8 August, and a night peak at 01:00 LT on 10 August (130.3 × 10⁻⁹), which were attributed to emissions from the neighboring oil field operations. From 10 to 12 August, as WS increased, pollutants levels at all sites decreased to similar levels. Overall, local anthropogenic emissions in Zibo were more prominent under weak wind conditions.
To compare the secondary O3 formation in each site, the ozone formation potential (OFP) of each VOCs is calculated (Eq. 6). The mean OFP in Zibo during the observation is 410.4 ± 197.2 µg m−3, with OVOCs accounting for the largest proportion (31.5 %–55.9 %), followed by aromatics (10.2 %–41.2 %). Alkanes (10.3 %–24.6 %) and alkenes (11.4 %–23.1 %) make comparable proportions, while BVOCs accounted for only 2.1 %–7.6 % of the total OFP (Fig. 5b). The one-way analysis of variance (ANOVA) results (p< 0.05) indicate significant differences (Armstrong et al., 2000) in VOC subclass contribution to OFP across the five sites. Alkanes and aromatics show larger F-values (Table S11), reflecting greater variations in the contributions to OFP across the five sites, whereas OVOC and BVOC (isoprene) exhibited lower variability. Post hoc Tukey honestly significant difference (HSD) tests were performed following ANOVA tests to further identify specific significant differences in VOC subcategories between sites (Fig. S14). The OFP of TVOCs is generally similar across stations, except for the downwind station (CD). The upwind station (CQ, 464.2 ± 162.3 µg m−3) has the highest OFP, followed by the suburban site (TZ, 456.3 ± 295.3 µg m−3), the urban site (ZL, 441.1 ± 174.5 µg m−3), the industrial site (XD, 422.9 ± 166.9 µg m−3), and the downwind site (CD, 279.4 ± 101.2 µg m−3) (Table S5). Differences in OFP levels of aromatics and alkanes at downwind station (CD), suburban station (TZ), and industrial station (XD) are minimal (Fig. S14b, c). However, significant differences in OFP contributed by OVOC at downwind station (CD) compared to suburban station (TZ) and industrial station (XD) are attributed to OVOC emission sources, regional transport, and secondary formation (Fig. S14a). Apart from CQ, OVOCs are the dominant contributors to OFP at each site, especially TZ and XD, with mean OFP of 254.9 ± 276.1 (55.9 %) and 194.7 ± 101.0 µg m−3 (46.0 %) from OVOCs, respectively. This indicates the key role of OVOCs in the formation of O3 at our observational sites. Among OVOC species, HCHO is the dominant contributor to OFP across the five sites (56.6–202.0 µg m−3). This is consistent with previous studies (Duan et al., 2008; Huang et al., 2020; Zhou et al., 2024). The top four OVOC species are formaldehyde, acetaldehyde, propionaldehyde, and butyraldehyde, which cumulatively contributed 91 %–95 % of the OFP from OVOCs (Table S5). Additionally, the variety of VOC sources, meteorological conditions, and photochemical conditions at each site lead to differences in key species of OFP at each site. At the suburban site (TZ), isoprene (34.9 µg m−3) ranks second in terms of OFP after formaldehyde (202.0 µg m−3), indicating a high effect of biogenic emissions (Mo et al., 2018; Sindelarova et al., 2014). At the industrial site (XD), the contribution of isopentane, marker of oil and gas emissions, to OFP is more prominent (as high as 66.2 µg m−3) than other sites. OFP of highly reactive aromatic hydrocarbon species, such as m/p-xylene (53.8 µg m−3) and o-xylene (23.6 µg m−3) are predominant at the upwind site (CQ), indicating the outstanding contribution of solvent-using sources. OFP contributed by alkenes is the highest at the urban site (101.8 ± 56.8 µg m−3) (Fig. 5a), with ethylene and propylene being the most key species, which is consistent with the dense vehicle emission near this site.
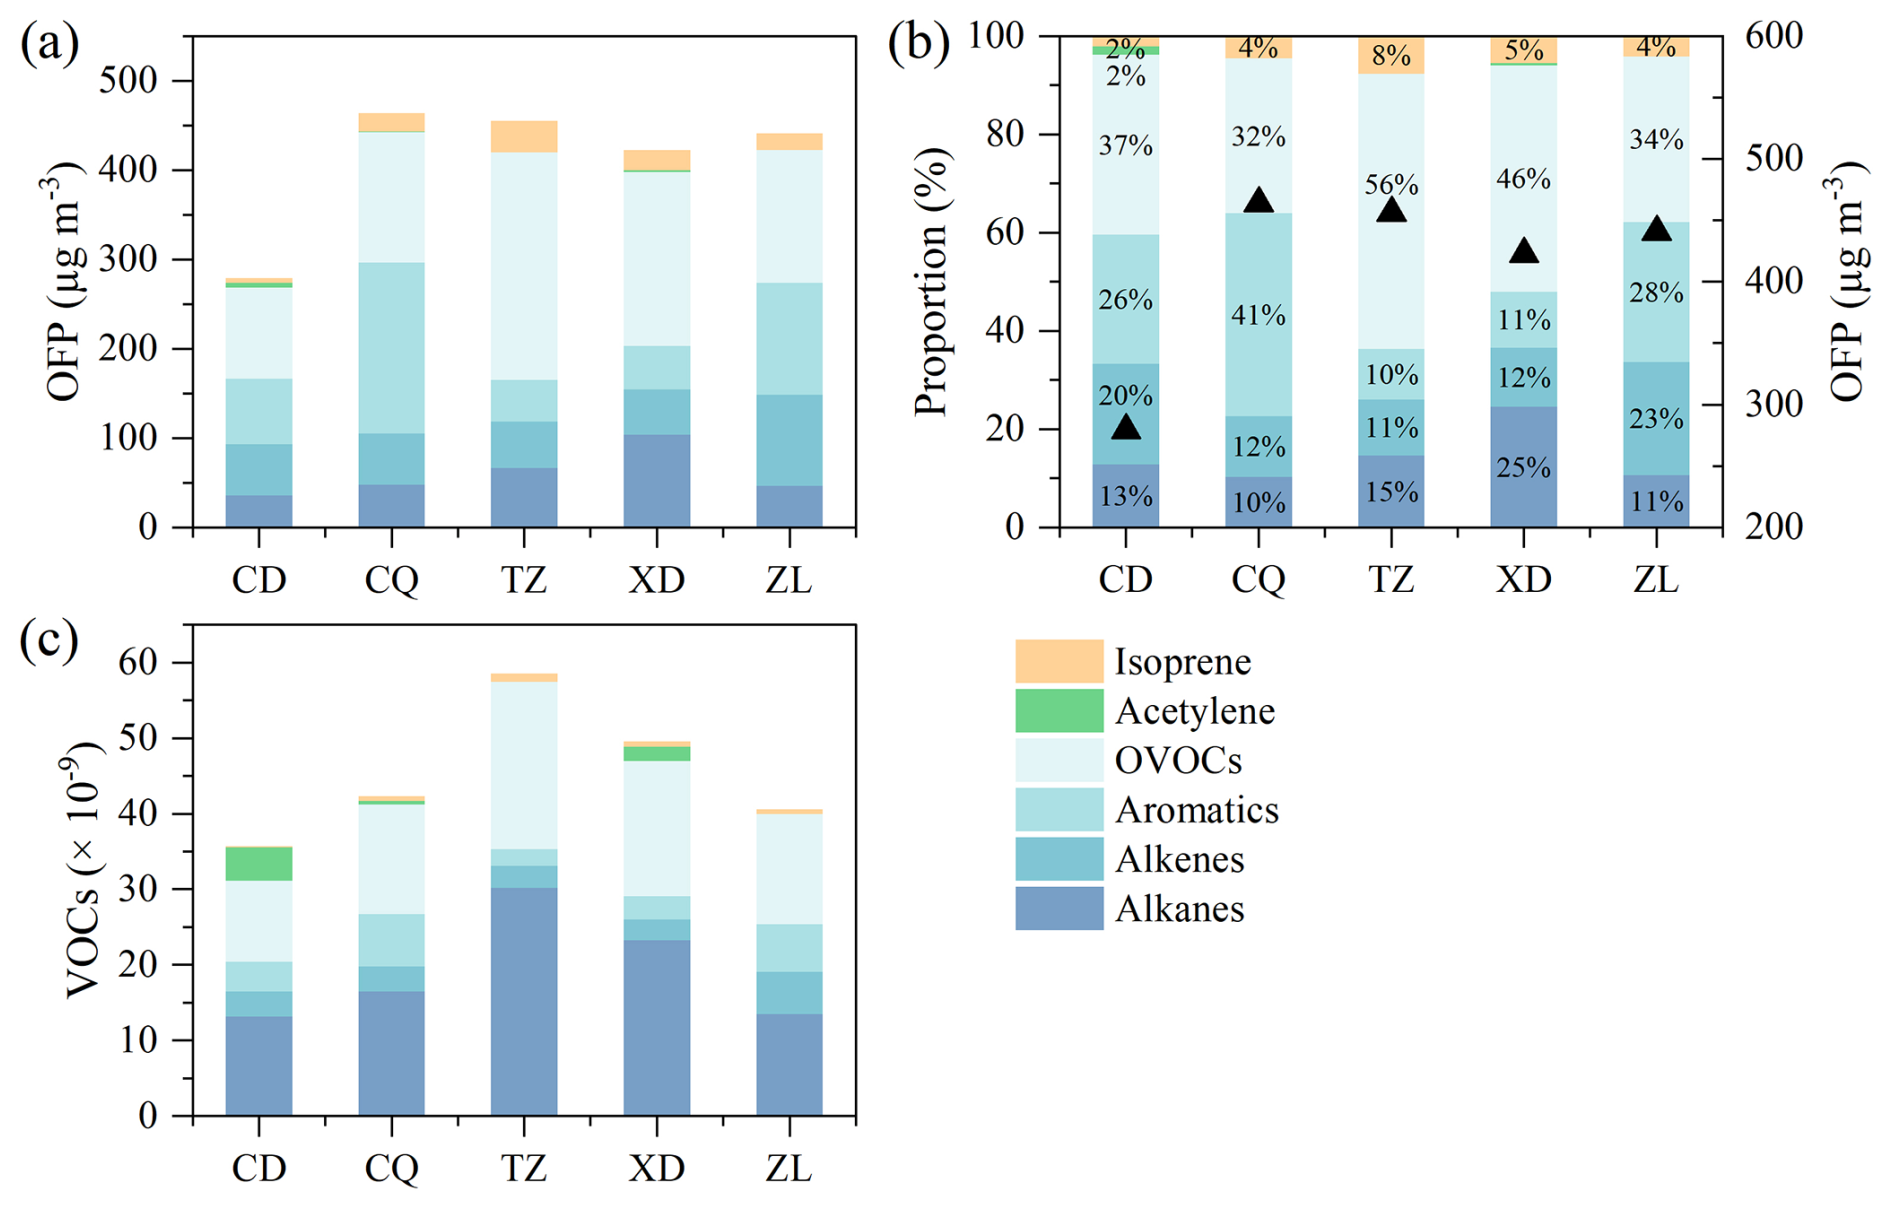
Figure 5(a) Ozone formation potential (OFP) and (b) proportions of OFP contributed by VOCs subgroups, along with (c) mixing ratios of VOCs subgroups at five sites.
3.2 Contribution of chemical generation, emissions/transport to OVOCs
OBM simulation results were used to analyze the contributions of chemical processes, and emissions/transport to OVOCs. Overall, the modeled O3 in the Base scenario exhibited good model performance at the five sites, with R values exceeding 0.85 and index of agreement values greater than 0.80 (Table S7). These metrics indicate a high level of agreement between observed and modeled data, comparable to results reported in previous studies (Qin et al., 2023; Zheng et al., 2023). The contributions of RNetProd predominantly occur during the daytime (Fig. 6). The maximum average daytime RNetProd of OVOCs was observed at ZL (5.9 ± 3.5 × 10⁻⁹ h−1), followed by CQ (4.11 ± 11.9 × 10⁻⁹ h−1), XD (3.6 ± 2.4 × 10⁻⁹ h−1), CD (3.5 ± 2.0 × 10⁻⁹ h−1), and TZ (1.9 ± 3.6 × 10⁻⁹ h−1) sites. This suggests that abundant reactive VOC emissions at urban areas as well as in the industrial areas could lead to faster generation of OVOCs. Generally, the RNetProd varied with a single peak due to photochemical formation and export transport, with the maximum value at 12:00–14:00 LT. The mean peak of RNetProd at ZL was 8.8 × 10⁻⁹ h−1, followed by XD (5.6 × 10⁻⁹ h−1), CQ (5.5 × 10⁻⁹ h−1), CD (5.1 × 10⁻⁹ h−1), and TZ (3.0 × 10⁻⁹ h−1). Generally, in the early morning hours (04:00–10:00 LT), positive RMeas at CD, CQ, and XD sites are driven by REmis&Tran import. During this period, OVOC mixing ratios show a significant upward trend, peaking between 08:00 and 10:00 LT.
Overall, OVOC mixing ratios at CD, CQ, and ZL sites were typically lower at night but higher during the daytime (Fig. 6), attributing to strong daytime photochemical generation, especially at around 07:00–10:00 LT. In contrast, TZ and XD showed higher nighttime OVOCs than that at daytime, which is due to stronger emission import during night. In addition, though RNetProd at ZL was the fastest during the daytime, the air mass transport can efficiently export OVOCs to downwind areas, leading to relatively lower OVOC mixing ratios. While at TZ, RNetProd was the lowest, but daytime OVOCs were the highest due to the predominant daytime import, especially the southwestward import on 8 August (Fig. S5f).
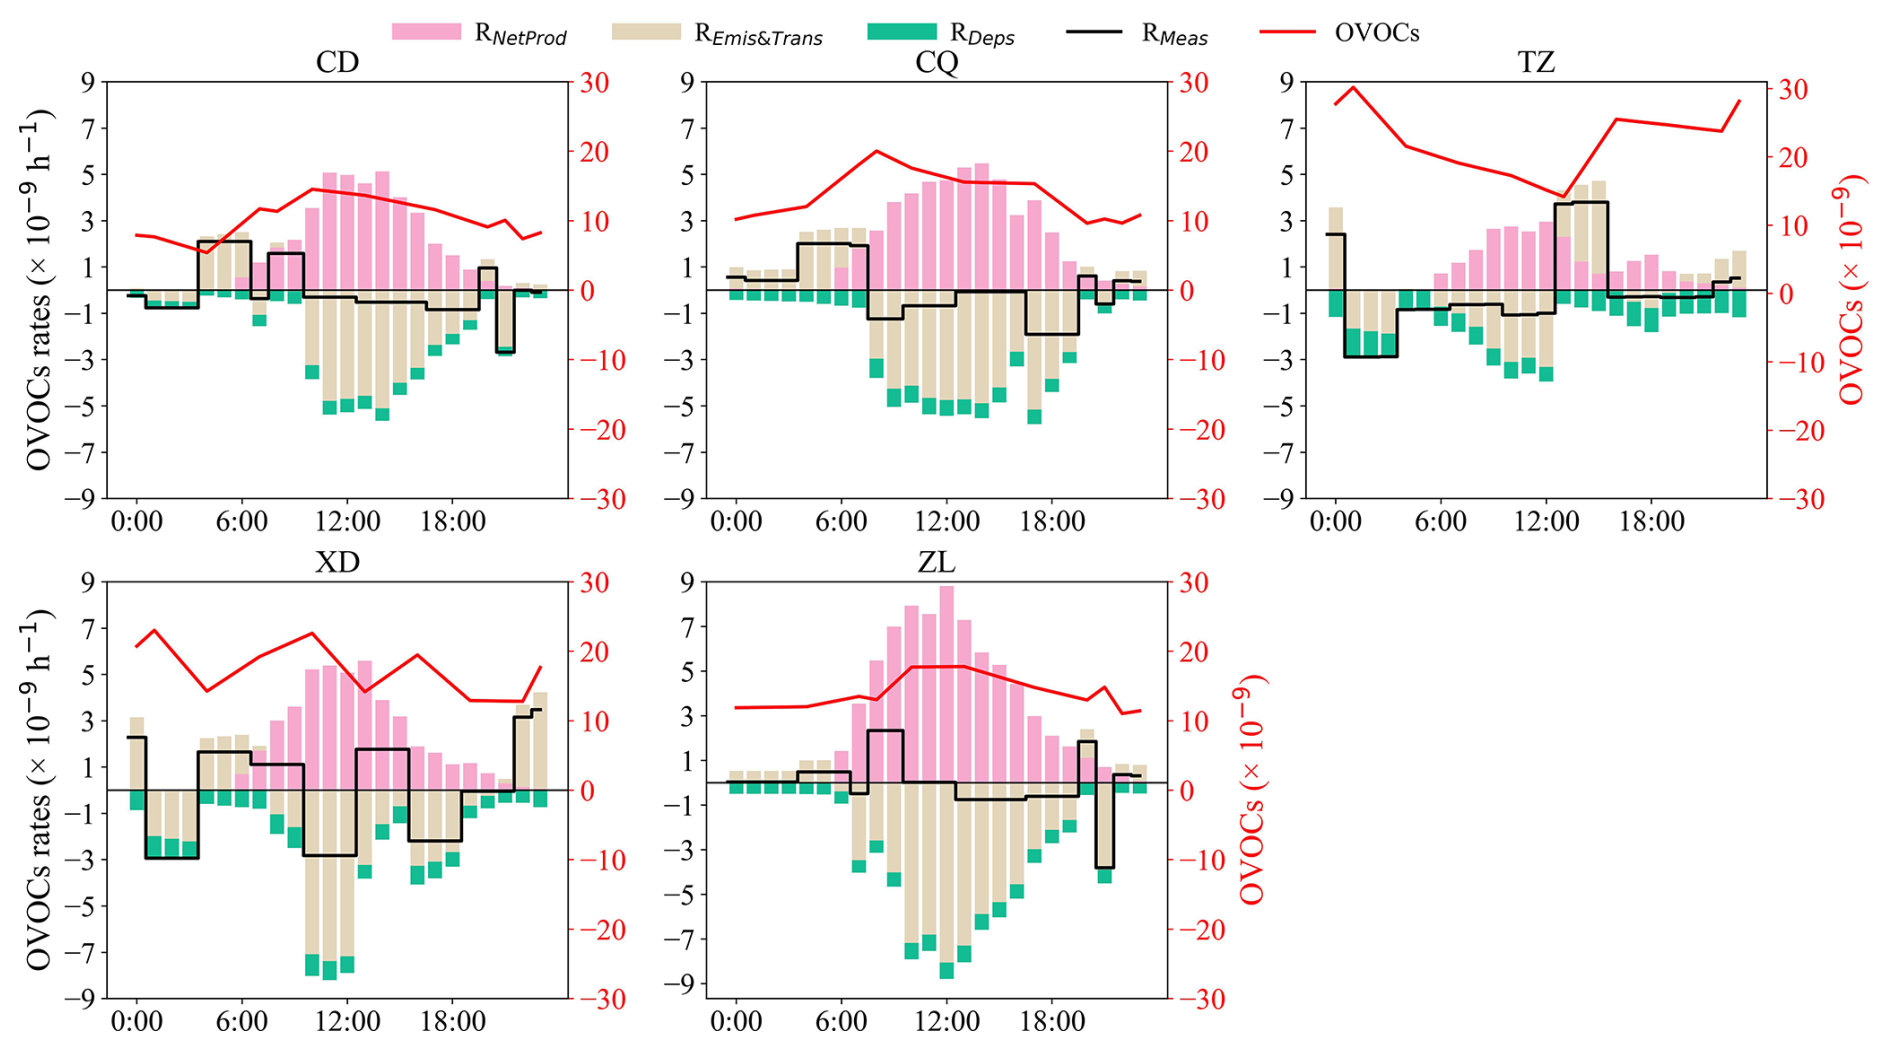
Figure 6Diurnal profiles of OVOCs contributions from local photochemical production (RNetProd), deposition (RDeps), emission/transport (REmis&Trans), and measured OVOCs formation rate (RMeas) of the five sites.
3.3 Importance of OVOC observational constraint in OBM
To investigate the effect of the constrain setting of OVOCs on OBM performance, the simulated OVOC, O3, radicals in the Free and Base scenarios are compared (Fig. 7). It has been shown that the box model, which did not take into account transport (including horizontal and vertical diffusion) and emissions, will result in overestimations of OVOCs, peroxyl radical, and PAN (Qu et al., 2021). In this study, OVOCs are overestimated by 42.1 %–126.5 % in the Free scenario compared with the Base scenario (Figs. 7a, S6c), especially HCHO (76.3 %) and benzaldehyde (737.5 %). The daytime ROx was overestimated by 6.5 %–23.3 %, with RO2 and HO2 being overestimated by 6.6 %–35.1 % and 5.3 %–20.4 %, respectively, while OH was underestimated by 1.8 %–20.9 % (Figs. 7d–f, S7b). As shown in Fig. 8a, photolysis of OVOCs (including HCHO) is the predominant source of ROx radicals (P(ROx)) in the daytime, which is consistent with the findings in Beijing (Liu et al., 2012), Shanghai (Zhang et al., 2021a), Hong Kong (Xue et al., 2016), and Mexico (Volkamer et al., 2010). To assess the effect of OVOCs on the simulation of ROx species (RO2, HO2, and OH), the chemical budgets of these species, as influenced by OVOCs, are quantified according to Liu et al. (2012) and Xue et al. (2016) (Figs. 8b, S8a).
In the Free scenario, the daytime net production of ROx (P(ROx)) was estimated to range from 0.03 to 0.14 × 10⁻⁹ h−1 compared to the Base scenario across four sites (excluding TZ), indicating an overestimation of ROx. Notably, the TZ site exhibited negative P(ROx) values, suggesting the potential existence of unaccounted ROx sources in this region. The mean daytime P(ROx) in the Free scenario was calculated as 4.8 ± 2.7 × 10⁻⁹ h−1, 18.8 % higher than that in the Base scenario (4.0 ± 2.3 × 10⁻⁹ h−1). As illustrated in Figs. 8 and S8a, the photolysis of OVOCs (including HCHO) dominates P(ROx), with a mean rate of 2.9 ± 1.9 × 10⁻⁹ h−1 in the Free scenario, 27.4 % higher than that in Base scenario (2.3 ± 1.5 × 10⁻⁹ h−1). This substantial increase in OVOC photolysis consequently amplified the formation of peroxyl radicals (RO2 and HO2). Among the production pathways, the photolysis of HCHO demonstrated the most pronounced effect on HO2 production in the Free scenario (0.1–1.9 × 10⁻⁹ h−1), with an increase of 7.8 %–151.2 % (0.1–1.2 × 10⁻⁹ h−1) in the Base scenario (0.5–1.1 × 10⁻⁹ h−1) (Fig. 8b).
The interference of OVOCs on OH is comprehensive. On the one hand, increased OVOCs tend to elevate the generation of HO2, which can directly or indirectly boost OH generation via the reaction of NO (Fig. S9). On the other hand, higher OVOCs levels can decrease OH via the reaction of OH+OVOCs (Qu et al., 2021; Tan et al., 2019b). In the Free scenario, total OH sources (including H2O2+hv, HONO+hv, O3+hv, and HO2+NO) is 7.5–12.1 × 10⁻⁹ h−1, which is 0.3–1.1 × 10⁻⁹ h−1 higher than that in the Base scenario (10.2–11.0 × 10⁻⁹ h−1) (Fig. S9). Conversely, OH destruction to peroxyl radicals in the Free scenario (7.1–11.8 × 10⁻⁹ h−1) is 0.3–2.1 × 10⁻⁹ h−1 higher than that in Base scenario (6.1–9.7 × 10⁻⁹ h−1), leading to a net OH loss of 0.1–0.9 × 10⁻⁹ h−1. This underestimation of OH without OVOCs constraint biases atmospheric oxidation capacity (AOC) by 0.1 %–10.0 % (excluding XD) (Fig. S10), affecting the evaluation of VOCs decay via OH oxidation (Li et al., 2022b).
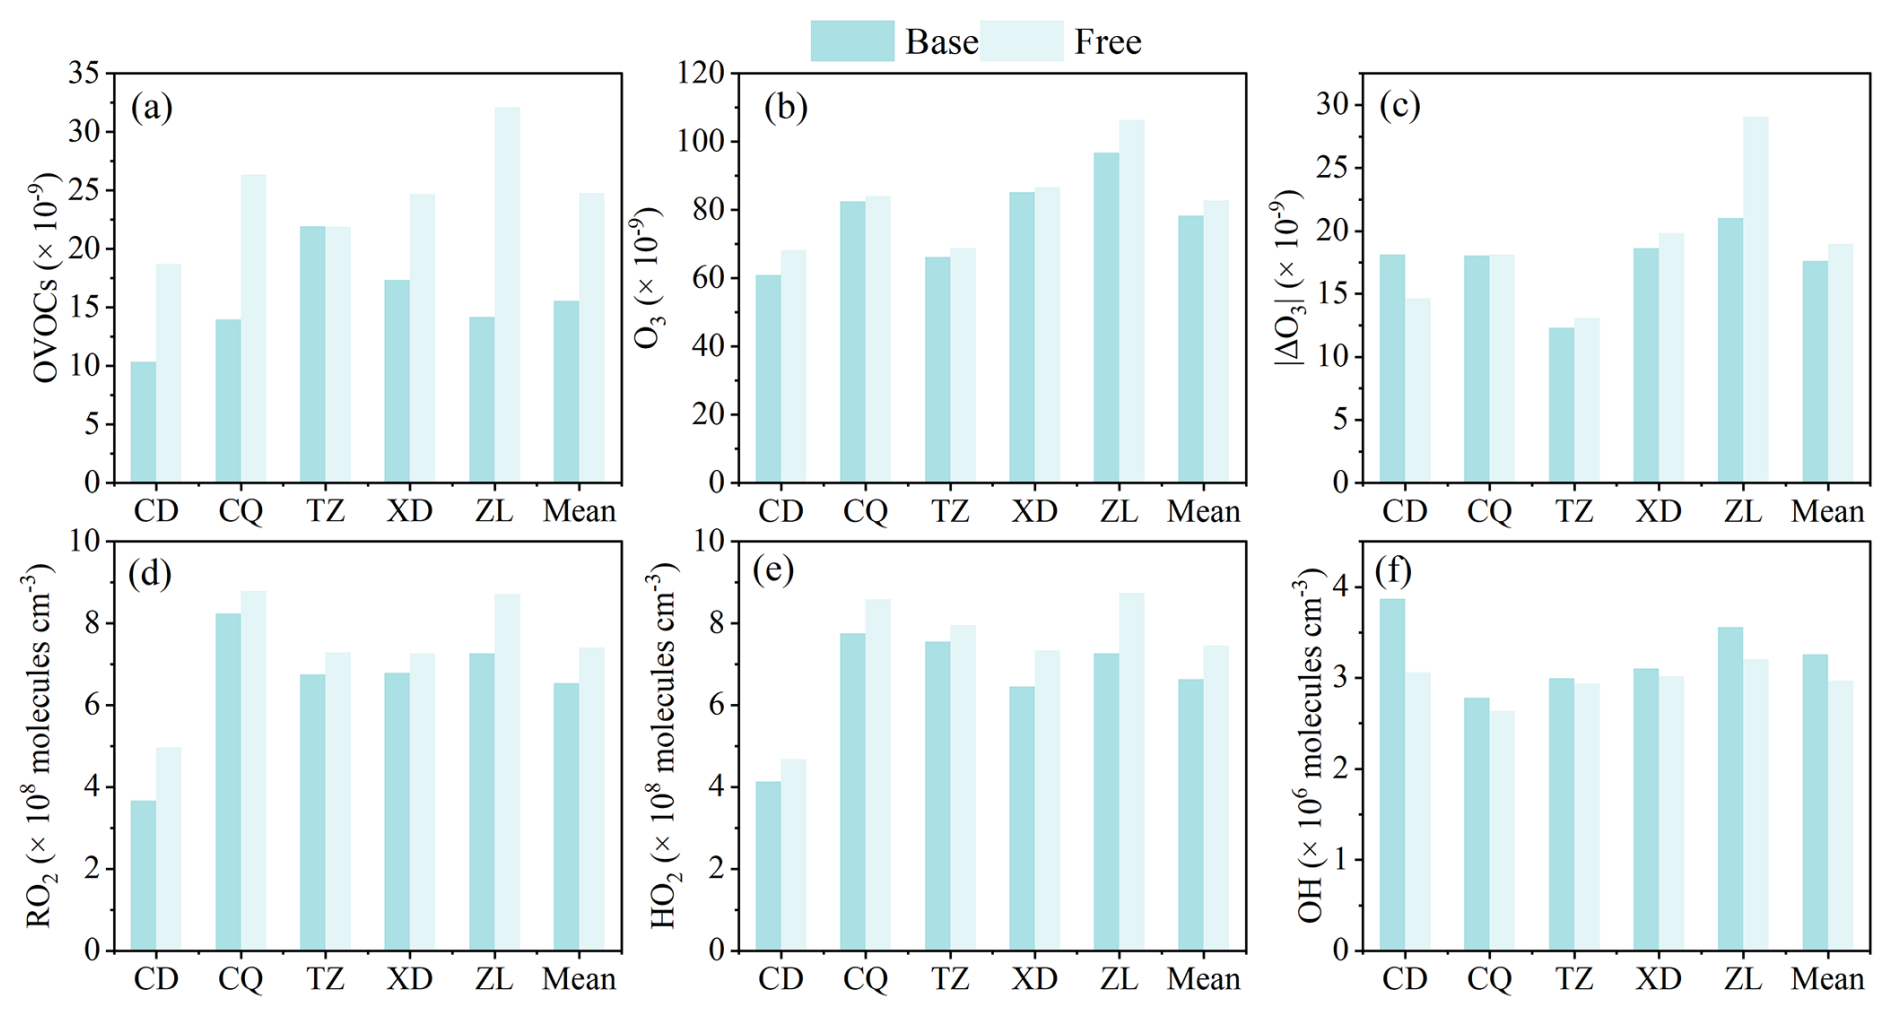
Figure 7Comparison of average (a) OVOC, (b) daytime O3, (c) daytime |ΔO3| (the gap between simulated and observed daytime (08:00–18:00 LT) O3 mixing ratios), and ROx (d RO2, e HO2, and f OH) between the Base and Free scenario simulations.
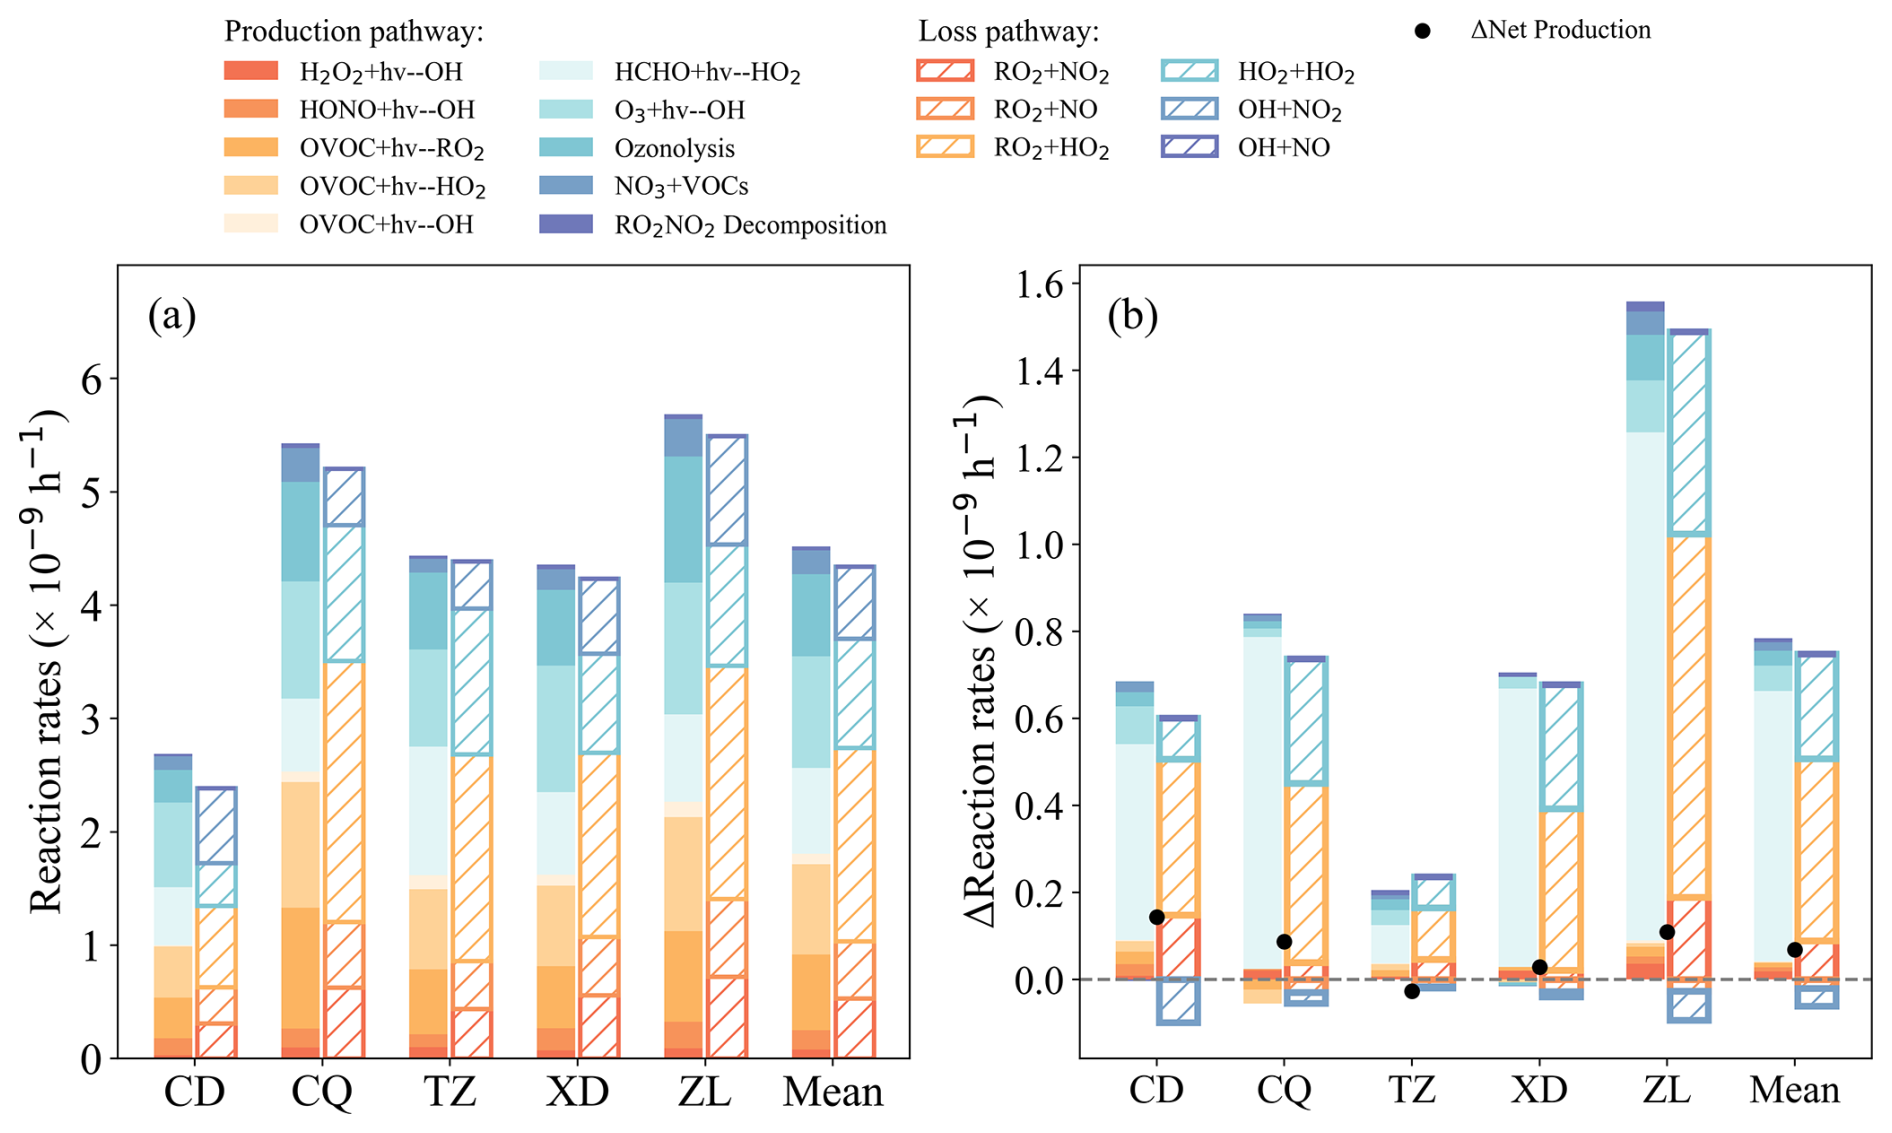
Figure 8(a) Average daytime (08:00–18:00 LT) sources and sinks of ROx in Base case and (b) the impact of OVOCs observationally constraints on ROx budget, calculated by the difference between the Free and Base scenarios.
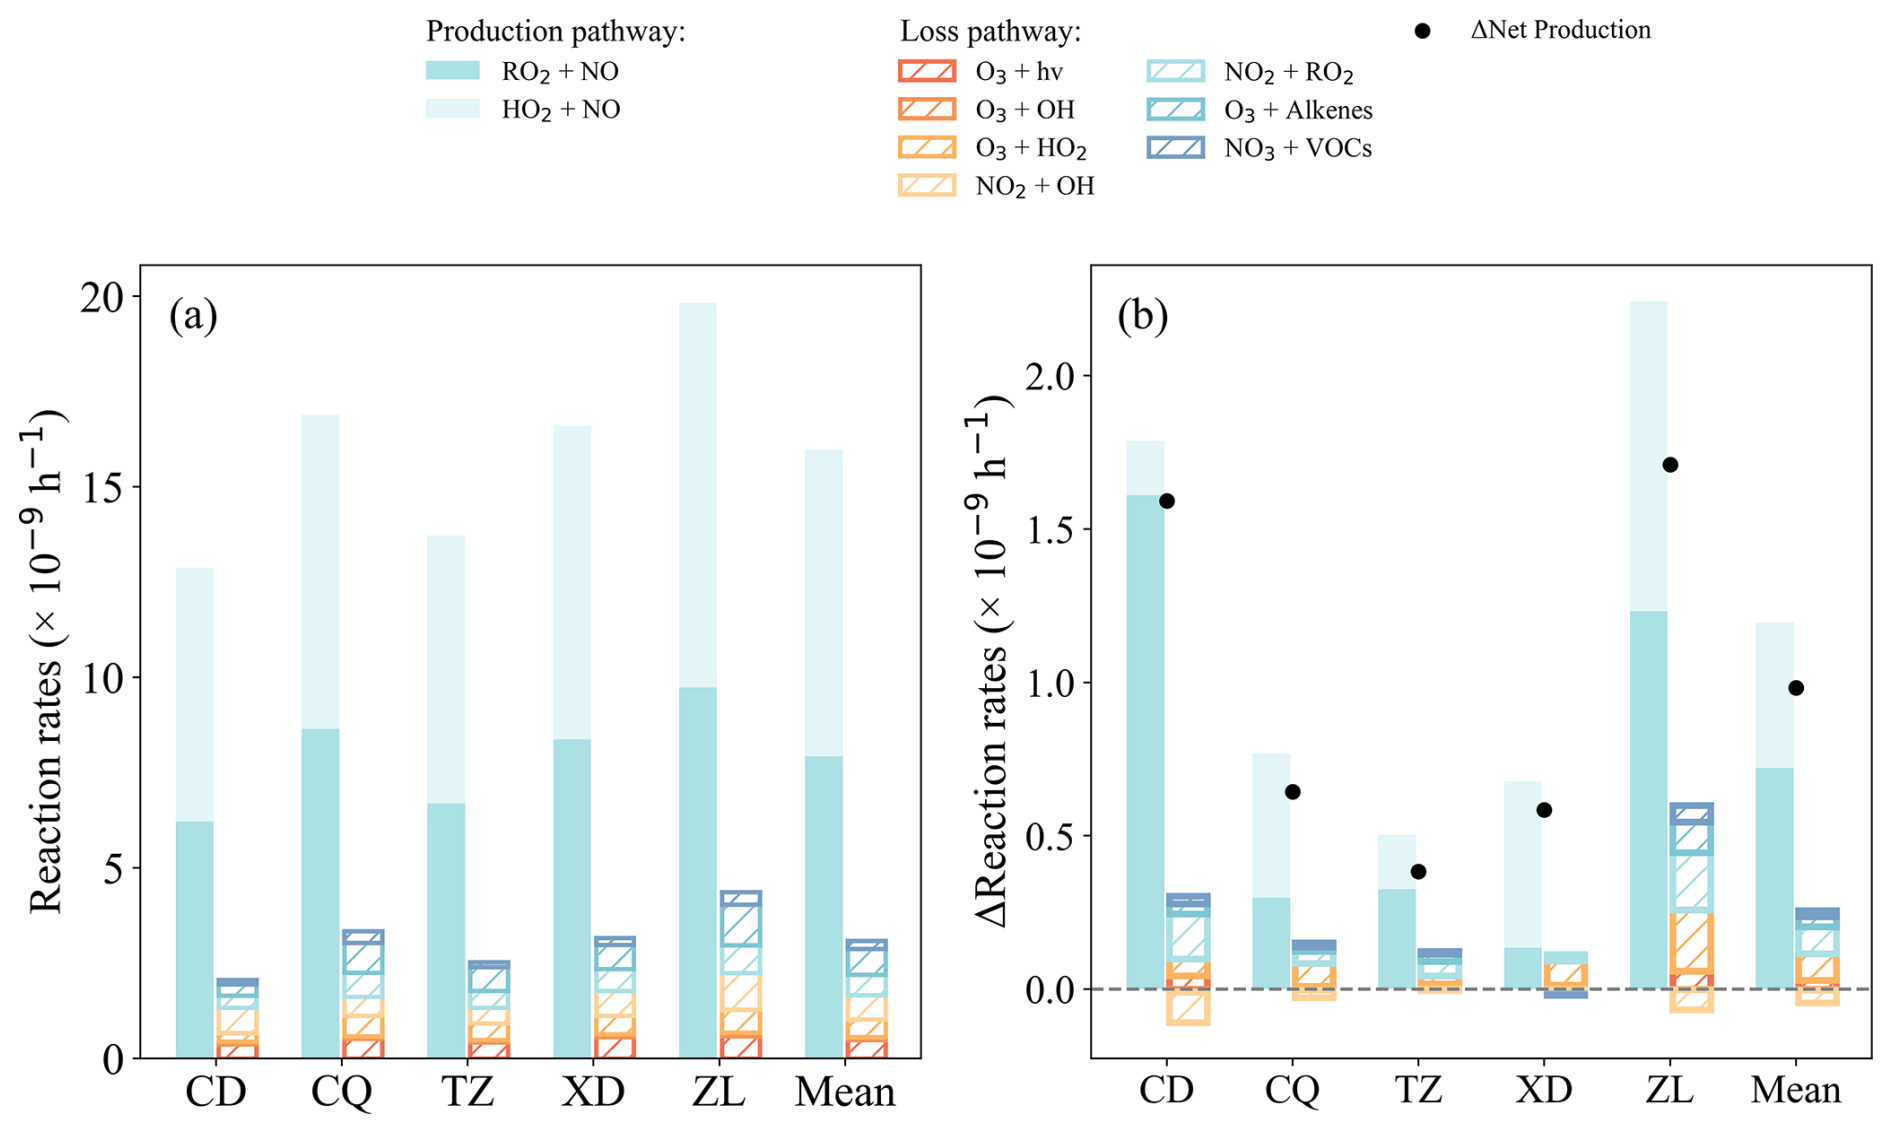
Figure 9(a) Average daytime (08:00–18:00 LT) O3 production and loss rates (× 10−9 h−1) in Base scenario and (b) the impact of OVOCs observationally constraints on O3 budget, calculated by the difference between the Free and Base scenarios.
Overall, the gap between simulated and observed daytime O3 mixing ratios (|ΔO3|) in the Free case increased by 7.5 % compared to that in the Base scenario. To better understand the influence of OVOCs on O3 formation, the rates of the main production and sink pathways of O3 in the Base and Free scenarios are summarized (Figs. 9, S8b). Compared to the Base scenario, the diurnal P(O3) in the Free scenario increases by 3.7 %–13.9 %, with the reaction rates of RO2+NO and HO2+NO increases by 1.6 %–25.9 % (0.1–1.6 × 10⁻⁹ h−1) and 2.5 %–10.0 % (0.2–1.0 × 10⁻⁹ h−1), respectively. This is attributed to the elevated RO2 and HO2 radical concentrations simulated without the constraints of OVOC observations (Fig. 7d–e). In contrast, the lower simulated concentration of OH radicals in the Free scenario results in a 0.5 %–14.8 % (0–0.1 × 10⁻⁹ h−1) decrease in the OH+O3/NO2 reaction rate. Although the L(O3) in the Free scenario is 0.4–1.7 × 10⁻⁹ h−1 higher than that in the Base scenario, it cannot offset the increase of P(O3), leading to higher net product of O3. Thus, no constraints of OVOCs could lead to overestimates of peroxyl radicals in the OBM, which in turn significantly overestimates the deviation of O3 due to the formation pathway of RO2/HO2+NO. Of course, the effect of OVOCs varies considerably in different emission and functional regions. The simulated mean daytime O3 in the Free scenario is 106.3, 86.7, 84.1, 68.8, and 68.2 × 10⁻⁹ h−1 at ZL, XD, CQ, TZ, and CD, respectively, which is 9.8 %, 1.8 %, 2.0 %, 3.9 %, and 11.9 % higher than that in the Base scenario (Fig. 7b, Table S8). The mean diurnal |ΔO3| at ZL site (29.1 × 10⁻⁹, 38.2 %) in the Free scenario was significantly higher compared to that of the Base scenario, followed by XD (19.8 × 10⁻⁹, 6.4 %), TZ (13.1 × 10⁻⁹, 6.2 %) and CQ (18.1 × 10⁻⁹, 0.6 %) (Fig. 7c, Table S8), suggesting that the absence of OVOCs constraint in OBM can significantly bias the O3 formation analysis in urban and industrial areas with complex emissions.
3.4 Uncertainty analysis
The uncertainty of the model comes mainly from the setting of NOx (Sect. S1 in the Supplement). Sensitive model runs are performed with different NOx settings to show the corresponding uncertainty. First, NOss, VOCs, OVOCs, T, RH, and BLH are constrained by the observed data, and sensitivity simulations were carried out for gradient NO2 mixing ratios (50 %, 60 %, 70 %, and 100 % of observed NO2 mixing ratios). At the four sites (except TZ), different NO2 settings produce uncertainties of −12 %–25 % for daytime O3 and −17 %–36 % for the daytime RNetProd of OVOCs. In addition, different NO2 settings produce uncertainties of −27 %–51 % for the REmis&Trans of OVOCs. This indicates that reducing the uncertainty of NO2 observations is important for further atmospheric chemistry modeling. Second, the NOss and observed NO mixing ratio were, respectively, used in the model to investigate the influence of nearby NO emissions on the OBM result (Table S3). Sensitivity tests show that directly using the observed NO data may result in an uncertainty of 3 %–20 %, 10 %–27 %, and 7.1 %–38 % for O3, RNetProd and REmis&Trans, respectively, with significantly higher uncertainties at TZ than at other stations, which may be related to the strong transient emissions of NOx.
The OH radicals are the main oxidant in the atmospheric troposphere. Most trace gases (CO, CH4, and VOCs) react with OH to produce peroxyl radicals, including HO2, and RO2. Peroxyl radicals then react with NO to promote O3. Photolysis of HONO is one of the important sources of OH radicals. However, direct measurement of HONO was not conducted in this study. The input of HONO in this study used the value of linear relationship with NO2 mixing ratios, which may cause some uncertainty. Sensitivity analyses were conducted based on the typical urban site (ZL) to quantify the effect of different HONO NO2 ratios on free radicals and O3. As shown in Fig. S12, as the ratio of HONO NO2 increased, the mixing ratio of HONO increased, and the concentration of OH produced by photolysis of HONO increased. At the same time, the peroxyl radical and O3 concentrations also increased (Table S9). At the lowest HONO NO2 ratio (0.005), the daytime OH, HO2, RO2, and O3 levels decreased by 4.6 %, 4.8 %, 6.0 %, and 3.4 %, respectively, compared to the HONO NO2 ratio of 0.02. In contrast, at the highest HONO NO2 of 0.04, the daytime OH, HO2, RO2, and O3 levels increased by 5.4 %, 5.6 %, 7.2 %, and 3.8 %, respectively, compared to the Base case.
When analyzing the contribution of chemical pathways, emission/transport and deposition to OVOCs according to Eqs. (1)–(3), the OVOC budget may be affected by the modeling time step. A sensitivity analysis was conducted at ZL, with simulations at different time steps (30, 10, and 5 min). As shown in Fig. S13, the diurnal trends of the chemical contributions (RNetProd), emission/transport (REmis&Trans) and deposition (RDeps) to OVOC are similar. The magnitude of the instantaneous change in REmis&Trans decreases when the time step is shortened. Specifically, the contributions of RNetProd and REmis&Trans to OVOC increased, while the contribution of RDeps decreased with shorter time steps (Table S10). When the time step was reduced to 5 min, the contributions of RNetProd and REmis&Trans to OVOC increased by 4.3 % and 5.0 %, respectively, while the contribution of RDeps decreased by 0.2 %. Therefore, shortening the time step in the model simulation may result in limited increased contribution from RNetProd and REmis&Trans to OVOC.
The OBM, while advantageous for its use of the near-explicit MCM and its ability to reproduce atmospheric chemistry based on observations, has several inherent limitations. First, it inadequately considers emission and transport processes (Wolfe et al., 2016), leading to uncertainties and potential biases in atmospheric chemical analysis. Future studies could differentiate the two processes using CTMs. Second, the steady-state assumption, which underpins OBM calculations, might become invalid in areas strongly influenced by nearby emissions (e.g., high-traffic and industrial intensive regions) (Wolfe et al., 2016). This may potentially cause overestimations of secondary products such as O3, ROx radicals, and OVOCs (Li et al., 2021a, 2014c). In this study, simulations use NOss as inputs, acknowledging that traffic-related NO emissions may prevent the system from reaching an approximate steady state. The associated uncertainties have been discussed above. Finally, the model may not fully capture all relevant chemical processes, such as heterogeneous reactions or the formation and the fate of intermediate species. For instance, the exclusion of ClNO2 chemistry could result in underestimating ROx and O3 production in certain environments (Riedel et al., 2014; Xia et al., 2020). Future research should focus on refining the chemical mechanisms to better approximate real atmospheric conditions.
Compared with previous studies conducted in most Chinese cities, the level of VOCs in Zibo is in the upper-middle range (> 32 × 10−9), with OVOCs being the second-largest contributor (29.4 %–36.1 %) after alkanes (34.8 %–53.3 %). Higher levels of OVOCs were observed at sites with more prominent emissions, with mixing ratios ranked as suburban (TZ, 19.7 × 10⁻⁹) > industrial (XD, 16.8 × 10⁻⁹) > urban (ZL, 14.9 × 10⁻⁹) > upwind (CQ, 13.9 × 10⁻⁹) > downwind (CD, 10.4 × 10⁻⁹). The OFP in Zibo is 410.4 ± 197.2 µg m−3, with OVOCs accounting for the largest proportion (31.5 %–55.9 %). The upwind site (CQ, 464.2 ± 162.3 µg m−3) has the highest OFP, followed by the suburban site (TZ, 456.3 ± 295.3 µg m−3), the urban site (ZL, 441.1 ± 174.5 µg m−3), the industrial site (XD, 422.9 ± 166.9 µg m−3), and the downwind site (CD, 279.4 ± 101.2 µg m−3) (Table S5). OFP contributed by OVOCs is most dominant at suburban (TZ, 254.9 µg m−3) and industrial (XD, 194.7 µg m−3) sites, followed by urban (ZL, 148.9 µg m−3), upwind (CQ, 146.2 µg m−3), and downwind (CD, 102.3 µg m−3) sites. The high levels of OVOCs and their significant contribution to OFP highlights their crucial role in O3 production across the observing stations.
Based on the OBM simulation, daytime OVOCs primarily originate from photochemical generation, while at nighttime, emissions/transport are the main sources. This diurnal pattern is closely related to the cyclical nature of human activities in urban areas (ZL), where stronger human activities such as vehicle emissions in the daytime enhance the secondary generation of OVOCs. Conversely, in industrial and suburban areas (XD, CQ, and TZ), emissions/transports dominate nighttime OVOC levels, leading to higher mixing ratios at night compared to the daytime.
Without OVOC constraint in the OBM, OVOCs are overestimated by 42.1 %–126.5 % in the Free scenario. The effect of OVOC constraint on P(ROx) is most significant at the urban site (ZL) (29.4 %), comparable to the downwind site (CD) (27.6 %), and higher than the industrial site (XD) (17.8 %), upwind site (CQ) (15.8 %), and suburban site (TZ) (4.7 %). In addition, this overestimation of OVOCs in the Free scenario accelerates the reaction of OH with OVOCs and the photolysis of OVOCs, promoting increased production of RO2 (6.6 %–35.1 %) and HO2 (5.3 %–20.4 %), which in turn leads to an overestimation of O3 (1.8 %–11.9 %) during the daytime. However, the reaction rates of OH with OVOCs are overestimated without OVOC constraint, which leads to underestimation of OH (3.4 %–12.7 %) and AOC (0.1 %–10.0 %). Therefore, to minimize the bias of numerical models, particularly in areas with complex anthropogenic activities, it is essential to intensify OVOC observations and integrate them into numerical models. These efforts are crucial for refining atmospheric photochemistry simulation, improving the accuracy of O3 formation predictions, and formulating more effective air quality management strategies for regions experiencing similar pollution challenges.
The model output is available upon request by contacting the corresponding author.
The supplement related to this article is available online at https://doi.org/10.5194/acp-25-7467-2025-supplement.
KZ, XY, RL, JX, QL, LS, JL, YY, FW, and LY conducted the field measurements. JD and KZ performed the data analysis and prepared the manuscript with contributions from all co-authors. KZ, YF, HC, LH, JT, YW and LL reviewed and edited the manuscript. All authors contributed to data interpretation and discussions.
The contact author has declared that none of the authors has any competing interests.
Publisher's note: Copernicus Publications remains neutral with regard to jurisdictional claims made in the text, published maps, institutional affiliations, or any other geographical representation in this paper. While Copernicus Publications makes every effort to include appropriate place names, the final responsibility lies with the authors.
This study was financially supported by the National Research Program for Key Issues in Air Pollution Control (DQGG202119). This work is supported by Shanghai Technical Service Center of Science and Engineering Computing, Shanghai University.
This research has been supported by the National Natural Science Foundation of China (grant no. 42375102), the Shanghai International Science and Technology Cooperation Fund (24230740200), and the National Research Program for Key Issues in Air Pollution Control (DQGG202119). This work is supported by Shanghai Technical Service Center of Science and Engineering Computing, Shanghai University.
This paper was edited by Andrea Pozzer and reviewed by two anonymous referees.
Armstrong, R. A., Slade, S. V., and Eperjesi, F.: An introduction to analysis of variance (ANOVA) with special reference to data from clinical experiments in optometry, Ophthal. Physiol. Opt., 20, 235–241, https://doi.org/10.1046/j.1475-1313.2000.00502.x, 2000.
Atkinson, R.: Atmospheric chemistry of VOCs and NOx, Atmos. Environ., 34, 2063–2101, https://doi.org/10.1016/S1352-2310(99)00460-4, 2000.
Atkinson, R. and Arey, J.: Atmospheric Degradation of Volatile Organic Compounds, Chem. Rev., 103, 4605–4638, https://doi.org/10.1021/cr0206420, 2003.
Bufalini, J. J. and Dodge, M. C.: Ozone-forming potential of light saturated hydrocarbons, Environ. Sci. Technol., 17, 308–311, https://doi.org/10.1021/es00111a013, 1983.
Carter, W.: Updated maximum incremental reactivity scale and hydrocarbon bin reactivities for regulatory applications, California Air Resources Board Contract, 1, 7–339, 2010a.
Carter, W. P. L.: A detailed mechanism for the gas-phase atmospheric reactions of organic compounds, Atmos Environ.-A Gen., 24, 481–518, https://doi.org/10.1016/0960-1686(90)90005-8, 1990.
Carter, W. P. L.: Development of the SAPRC-07 chemical mechanism, Atmos. Environ., 44, 5324–5335, https://doi.org/10.1016/j.atmosenv.2010.01.026, 2010b.
Carter, W. P. L. and Heo, G.: Development of revised SAPRC aromatics mechanisms, Atmos. Environ., 77, 404–414, https://doi.org/10.1016/j.atmosenv.2013.05.021, 2013.
Chen, T., Xue, L., Zheng, P., Zhang, Y., Liu, Y., Sun, J., Han, G., Li, H., Zhang, X., Li, Y., Li, H., Dong, C., Xu, F., Zhang, Q., and Wang, W.: Volatile organic compounds and ozone air pollution in an oil production region in northern China, Atmos. Chem. Phys., 20, 7069–7086, https://doi.org/10.5194/acp-20-7069-2020, 2020.
Chen, T., Zheng, P., Zhang, Y., Dong, C., Han, G., Li, H., Yang, X., Liu, Y., Sun, J., Li, H., Zhang, X., Li, Y., Wang, W., and Xue, L.: Characteristics and formation mechanisms of atmospheric carbonyls in an oilfield region of northern China, Atmos. Environ., 274, 118958, https://doi.org/10.1016/j.atmosenv.2022.118958, 2022.
de Gouw, J. A., Gilman, J. B., Kim, S.-W., Alvarez, S. L., Dusanter, S., Graus, M., Griffith, S. M., Isaacman-VanWertz, G., Kuster, W. C., Lefer, B. L., Lerner, B. M., McDonald, B. C., Rappenglück, B., Roberts, J. M., Stevens, P. S., Stutz, J., Thalman, R., Veres, P. R., Volkamer, R., Warneke, C., Washenfelder, R. A., and Young, C. J.: Chemistry of Volatile Organic Compounds in the Los Angeles Basin: Formation of Oxygenated Compounds and Determination of Emission Ratios, J. Geophys. Res.-Atmos., 123, 2298–2319, https://doi.org/10.1002/2017JD027976, 2018.
Del Negro, L. A., Fahey, D. W., Gao, R. S., Donnelly, S. G., Keim, E. R., Neuman, J. A., Cohen, R. C., Perkins, K. K., Koch, L. C., Salawitch, R. J., Lloyd, S. A., Proffitt, M. H., Margitan, J. J., Stimpfle, R. M., Bonne, G. P., Voss, P. B., Wennberg, P. O., McElroy, C. T., Swartz, W. H., Kusterer, T. L., Anderson, D. E., Lait, L. R., and Bui, T. P.: Comparison of modeled and observed values of NO2 and JNO2 during the Photochemistry of Ozone Loss in the Arctic Region in Summer (POLARIS) mission, J. Geophys. Res.-Atmos., 104, 26687–26703, https://doi.org/10.1029/1999JD900246, 1999.
Duan, J., Tan, J., Yang, L., Wu, S., and Hao, J.: Concentration, sources and ozone formation potential of volatile organic compounds (VOCs) during ozone episode in Beijing, Atmos. Res., 88, 25–35, https://doi.org/10.1016/j.atmosres.2007.09.004, 2008.
Edwards, P. M., Brown, S. S., Roberts, J. M., Ahmadov, R., Banta, R. M., deGouw, J. A., Dube, W. P., Field, R. A., Flynn, J. H., Gilman, J. B., Graus, M., Helmig, D., Koss, A., Langford, A. O., Lefer, B. L., Lerner, B. M., Li, R., Li, S.-M., McKeen, S. A., Murphy, S. M., Parrish, D. D., Senff, C. J., Soltis, J., Stutz, J., Sweeney, C., Thompson, C. R., Trainer, M. K., Tsai, C., Veres, P. R., Washenfelder, R. A., Warneke, C., Wild, R. J., Young, C. J., Yuan, B., and Zamora, R.: High winter ozone pollution from carbonyl photolysis in an oil and gas basin, Nature, 514, 351–354, https://doi.org/10.1038/nature13767, 2014.
Elshorbany, Y. F., Kurtenbach, R., Wiesen, P., Lissi, E., Rubio, M., Villena, G., Gramsch, E., Rickard, A. R., Pilling, M. J., and Kleffmann, J.: Oxidation capacity of the city air of Santiago, Chile, Atmos. Chem. Phys., 9, 2257–2273, https://doi.org/10.5194/acp-9-2257-2009, 2009.
Elshorbany, Y. F., Steil, B., Brühl, C., and Lelieveld, J.: Impact of HONO on global atmospheric chemistry calculated with an empirical parameterization in the EMAC model, Atmos. Chem. Phys., 12, 9977–10000, https://doi.org/10.5194/acp-12-9977-2012, 2012.
Emmerson, K. M., Carslaw, N., and Pilling, M. J.: Urban atmospheric chemistry during the PUMA campaign 2: Radical budgets for OH, HO2 and RO2, J. Atmos. Chem., 52, 165–183, https://doi.org/10.1007/s10874-005-1323-2, 2005.
Fuchs, H., Tan, Z., Lu, K., Bohn, B., Broch, S., Brown, S. S., Dong, H., Gomm, S., Häseler, R., He, L., Hofzumahaus, A., Holland, F., Li, X., Liu, Y., Lu, S., Min, K.-E., Rohrer, F., Shao, M., Wang, B., Wang, M., Wu, Y., Zeng, L., Zhang, Y., Wahner, A., and Zhang, Y.: OH reactivity at a rural site (Wangdu) in the North China Plain: contributions from OH reactants and experimental OH budget, Atmos. Chem. Phys., 17, 645–661, https://doi.org/10.5194/acp-17-645-2017, 2017.
Gentner, D. R., Worton, D. R., Isaacman, G., Davis, L. C., Dallmann, T. R., Wood, E. C., Herndon, S. C., Goldstein, A. H., and Harley, R. A.: Chemical Composition of Gas-Phase Organic Carbon Emissions from Motor Vehicles and Implications for Ozone Production, Environ. Sci. Technol., 47, 11837–11848, https://doi.org/10.1021/es401470e, 2013.
Geyer, A., Alicke, B., Konrad, S., Schmitz, T., Stutz, J., and Platt, U.: Chemistry and oxidation capacity of the nitrate radical in the continental boundary layer near Berlin, J. Geophys. Res.-Atmos., 106, 8013–8025, https://doi.org/10.1029/2000JD900681, 2001.
Gilman, J. B., Lerner, B. M., Kuster, W. C., Goldan, P. D., Warneke, C., Veres, P. R., Roberts, J. M., de Gouw, J. A., Burling, I. R., and Yokelson, R. J.: Biomass burning emissions and potential air quality impacts of volatile organic compounds and other trace gases from fuels common in the US, Atmos. Chem. Phys., 15, 13915–13938, https://doi.org/10.5194/acp-15-13915-2015, 2015.
Goldan, P. D., Kuster, W. C., Williams, E., Murphy, P. C., Fehsenfeld, F. C., and Meagher, J.: Nonmethane hydrocarbon and oxy hydrocarbon measurements during the 2002 New England Air Quality Study, J. Geophys. Res.-Atmos., 109, D21309, https://doi.org/10.1029/2003JD004455, 2004.
Goliff, W. S., Stockwell, W. R., and Lawson, C. V.: The regional atmospheric chemistry mechanism, version 2, Atmos. Environ., 68, 174–185, https://doi.org/10.1016/j.atmosenv.2012.11.038, 2013.
Guo, F., Bui, A. A. T., Schulze, B. C., Yoon, S., Shrestha, S., Wallace, H. W., Sakai, Y., Actkinson, B. W., Erickson, M. H., Alvarez, S., Sheesley, R., Usenko, S., Flynn, J., and Griffin, R. J.: Urban core-downwind differences and relationships related to ozone production in a major urban area in Texas, Atmos. Environ., 262, 118624, https://doi.org/10.1016/j.atmosenv.2021.118624, 2021.
Han, Y., Huang, X., Wang, C., Zhu, B., and He, L.: Characterizing oxygenated volatile organic compounds and their sources in rural atmospheres in China, J. Environ. Sci., 81, 148–155, https://doi.org/10.1016/j.jes.2019.01.017, 2019.
Huang, X.-F., Zhang, B., Xia, S.-Y., Han, Y., Wang, C., Yu, G.-H., and Feng, N.: Sources of oxygenated volatile organic compounds (OVOCs) in urban atmospheres in North and South China, Environ. Pollut., 261, 114152, https://doi.org/10.1016/j.envpol.2020.114152, 2020.
Jenkin, M. E., Young, J. C., and Rickard, A. R.: The MCM v3.3.1 degradation scheme for isoprene, Atmos. Chem. Phys., 15, 11433–11459, https://doi.org/10.5194/acp-15-11433-2015, 2015.
Jiang, P., Chen, X., Li, Q., Mo, H., and Li, L.: High-resolution emission inventory of gaseous and particulate pollutants in Shandong Province, eastern China, J. Clean. Prod., 259, 120806, https://doi.org/10.1016/j.jclepro.2020.120806, 2020.
Kanaya, Y., Pochanart, P., Liu, Y., Li, J., Tanimoto, H., Kato, S., Suthawaree, J., Inomata, S., Taketani, F., Okuzawa, K., Kawamura, K., Akimoto, H., and Wang, Z. F.: Rates and regimes of photochemical ozone production over Central East China in June 2006: a box model analysis using comprehensive measurements of ozone precursors, Atmos. Chem. Phys., 9, 7711–7723, https://doi.org/10.5194/acp-9-7711-2009, 2009.
Karl, T., Striednig, M., Graus, M., Hammerle, A., and Wohlfahrt, G.: Urban flux measurements reveal a large pool of oxygenated volatile organic compound emissions, P. Natl. Acad. Sci. USA, 115, 1186–1191, https://doi.org/10.1073/pnas.1714715115, 2018.
Karl, T. G., Christian, T. J., Yokelson, R. J., Artaxo, P., Hao, W. M., and Guenther, A.: The Tropical Forest and Fire Emissions Experiment: method evaluation of volatile organic compound emissions measured by PTR-MS, FTIR, and GC from tropical biomass burning, Atmos. Chem. Phys., 7, 5883–5897, https://doi.org/10.5194/acp-7-5883-2007, 2007.
Kim, S., Kim, S.-Y., Lee, M., Shim, H., Wolfe, G. M., Guenther, A. B., He, A., Hong, Y., and Han, J.: Impact of isoprene and HONO chemistry on ozone and OVOC formation in a semirural South Korean forest, Atmos. Chem. Phys., 15, 4357–4371, https://doi.org/10.5194/acp-15-4357-2015, 2015.
Legreid, G., Reimann, S., Steinbacher, M., Staehelin, J., Young, D., and Stemmler, K.: Measurements of OVOCs and NMHCs in a swiss highway tunnel for estimation of road transport emissions, Environ. Sci. Technol., 41, 7060–7066, https://doi.org/10.1021/es062309+, 2007.
Li, B., Yu, S., Shao, M., Li, X., Ho, S. S. H., Hu, X., Wang, H., Feng, R., and Fang, X.: New insights into photochemical initial concentrations of VOCs and their source implications, Atmos. Environ., 298, 119616, https://doi.org/10.1016/j.atmosenv.2023.119616, 2023.
Li, C., Liu, Y., Cheng, B., Zhang, Y., Liu, X., Qu, Y., An, J., Kong, L., Zhang, Y., Zhang, C., Tan, Q., and Feng, M.: A comprehensive investigation on volatile organic compounds (VOCs) in 2018 in Beijing, China: Characteristics, sources and behaviours in response to O3 formation, Sci. Total Environ., 806, 150247, https://doi.org/10.1016/j.scitotenv.2021.150247, 2022a.
Li, H., Ma, Y., Duan, F., He, K., Zhu, L., Huang, T., Kimoto, T., Ma, X., Ma, T., Xu, L., Xu, B., Yang, S., Ye, S., Sun, Z., An, J., and Zhang, Z.: Typical winter haze pollution in Zibo, an industrial city in China: Characteristics, secondary formation, and regional contribution, Environ. Pollut., 229, 339–349, https://doi.org/10.1016/j.envpol.2017.05.081, 2017.
Li, K., Wang, X., Li, L., Wang, J., Liu, Y., Cheng, X., Xu, B., Wang, X., Yan, P., Li, S., Geng, C., Yang, W., Azzi, M., and Bai, Z.: Large variability of O3-precursor relationship during severe ozone polluted period in an industry-driven cluster city (Zibo) of North China Plain, J. Clean Prod., 316, 128252, https://doi.org/10.1016/j.jclepro.2021.128252, 2021a.
Li, K., Jacob, D. J., Liao, H., Qiu, Y., Shen, L., Zhai, S., Bates, K. H., Sulprizio, M. P., Song, S., Lu, X., Zhang, Q., Zheng, B., Zhang, Y., Zhang, J., Lee, H. C., and Kuk, S. K.: Ozone pollution in the North China Plain spreading into the late-winter haze season, P. Natl. Acad. Sci. USA, 118, e2015797118, https://doi.org/10.1073/pnas.2015797118, 2021b.
Li, L., Chen, Y., Zeng, L., Shao, M., Xie, S., Chen, W., Lu, S., Wu, Y., and Cao, W.: Biomass burning contribution to ambient volatile organic compounds (VOCs) in the Chengdu-Chongqing Region (CCR), China, Atmos. Environ., 99, 403–410, https://doi.org/10.1016/j.atmosenv.2014.09.067, 2014a.
Li, M., Zhang, Q., Streets, D. G., He, K. B., Cheng, Y. F., Emmons, L. K., Huo, H., Kang, S. C., Lu, Z., Shao, M., Su, H., Yu, X., and Zhang, Y.: Mapping Asian anthropogenic emissions of non-methane volatile organic compounds to multiple chemical mechanisms, Atmos. Chem. Phys., 14, 5617–5638, https://doi.org/10.5194/acp-14-5617-2014, 2014b.
Li, M., Zhang, Q., Zheng, B., Tong, D., Lei, Y., Liu, F., Hong, C., Kang, S., Yan, L., Zhang, Y., Bo, Y., Su, H., Cheng, Y., and He, K.: Persistent growth of anthropogenic non-methane volatile organic compound (NMVOC) emissions in China during 1990–2017: drivers, speciation and ozone formation potential, Atmos. Chem. Phys., 19, 8897–8913, https://doi.org/10.5194/acp-19-8897-2019, 2019.
Li, X., Rohrer, F., Brauers, T., Hofzumahaus, A., Lu, K., Shao, M., Zhang, Y. H., and Wahner, A.: Modeling of HCHO and CHOCHO at a semi-rural site in southern China during the PRIDE-PRD2006 campaign, Atmos. Chem. Phys., 14, 12291–12305, https://doi.org/10.5194/acp-14-12291-2014, 2014c.
Ling, Z. H., Guo, H., Lam, S. H. M., Saunders, S. M., and Wang, T.: Atmospheric photochemical reactivity and ozone production at two sites in Hong Kong: Application of a Master Chemical Mechanism–photochemical box model, J. Geophys. Res.-Atmos., 119, 10567–10582, https://doi.org/10.1002/2014JD021794, 2014.
Liu, G., Ma, X., Li, W., Chen, J., Ji, Y., and An, T.: Pollution characteristics, source appointment and environmental effect of oxygenated volatile organic compounds in Guangdong-Hong Kong-Macao Greater Bay Area: Implication for air quality management, Sci. Total Environ., 919, 170836, https://doi.org/10.1016/j.scitotenv.2024.170836, 2024.
Liu, T., Hong, Y., Li, M., Xu, L., Chen, J., Bian, Y., Yang, C., Dan, Y., Zhang, Y., Xue, L., Zhao, M., Huang, Z., and Wang, H.: Atmospheric oxidation capacity and ozone pollution mechanism in a coastal city of southeastern China: analysis of a typical photochemical episode by an observation-based model, Atmos. Chem. Phys., 22, 2173–2190, https://doi.org/10.5194/acp-22-2173-2022, 2022.
Liu, Z., Wang, Y., Gu, D., Zhao, C., Huey, L. G., Stickel, R., Liao, J., Shao, M., Zhu, T., Zeng, L., Amoroso, A., Costabile, F., Chang, C.-C., and Liu, S.-C.: Summertime photochemistry during CAREBeijing-2007: ROx budgets and O3 formation, Atmos. Chem. Phys., 12, 7737–7752, https://doi.org/10.5194/acp-12-7737-2012, 2012.
Liu, Z., Wang, Y., Hu, B., Lu, K., Tang, G., Ji, D., Yang, X., Gao, W., Xie, Y., Liu, J., Yao, D., Yang, Y., and Zhang, Y.: Elucidating the quantitative characterization of atmospheric oxidation capacity in Beijing, China, Sci. Total Environ., 771, 145306, https://doi.org/10.1016/j.scitotenv.2021.145306, 2021.
Lou, S., Holland, F., Rohrer, F., Lu, K., Bohn, B., Brauers, T., Chang, C. C., Fuchs, H., Häseler, R., Kita, K., Kondo, Y., Li, X., Shao, M., Zeng, L., Wahner, A., Zhang, Y., Wang, W., and Hofzumahaus, A.: Atmospheric OH reactivities in the Pearl River Delta – China in summer 2006: measurement and model results, Atmos. Chem. Phys., 10, 11243–11260, https://doi.org/10.5194/acp-10-11243-2010, 2010.
Luecken, D. J., Hutzell, W. T., Strum, M. L., and Pouliot, G. A.: Regional sources of atmospheric formaldehyde and acetaldehyde, and implications for atmospheric modeling, Atmos. Environ., 47, 477–490, https://doi.org/10.1016/j.atmosenv.2011.10.005, 2012.
McDonald, B. C., de Gouw, J. A., Gilman, J. B., Jathar, S. H., Akherati, A., Cappa, C. D., Jimenez, J. L., Lee-Taylor, J., Hayes, P. L., McKeen, S. A., Cui, Y. Y., Kim, S.-W., Gentner, D. R., Isaacman-VanWertz, G., Goldstein, A. H., Harley, R. A., Frost, G. J., Roberts, J. M., Ryerson, T. B., and Trainer, M.: Volatile chemical products emerging as largest petrochemical source of urban organic emissions, Science, 359, 760–764, https://doi.org/10.1126/science.aaq0524, 2018.
Mo, Z., Shao, M., and Lu, S.: Compilation of a source profile database for hydrocarbon and OVOC emissions in China, Atmos. Environ., 143, 209–217, https://doi.org/10.1016/j.atmosenv.2016.08.025, 2016.
Mo, Z., Shao, M., Wang, W., Liu, Y., Wang, M., and Lu, S.: Evaluation of biogenic isoprene emissions and their contribution to ozone formation by ground-based measurements in Beijing, China, Sci. Total Environ., 627, 1485–1494, https://doi.org/10.1016/j.scitotenv.2018.01.336, 2018.
Mo, Z., Huang, S., Yuan, B., Pei, C., Song, Q., Qi, J., Wang, M., Wang, B., Wang, C., and Shao, M.: Tower-based measurements of NMHCs and OVOCs in the Pearl River Delta: Vertical distribution, source analysis and chemical reactivity, Environ. Pollut., 292, 118454, https://doi.org/10.1016/j.envpol.2021.118454, 2022.
Ou, J., Zheng, J., Li, R., Huang, X., Zhong, Z., Zhong, L., and Lin, H.: Speciated OVOC and VOC emission inventories and their implications for reactivity-based ozone control strategy in the Pearl River Delta region, China, Sci. Total Environ., 530, 393–402, https://doi.org/10.1016/j.scitotenv.2015.05.062, 2015.
Peng, Y., Cai, J., Feng, Y., Jiang, H., and Chen, Y.: Emission characteristic of OVOCs, I/SVOCs, OC and EC from wood combustion at different moisture contents, Atmos. Environ., 298, 119620, https://doi.org/10.1016/j.atmosenv.2023.119620, 2023.
Pfannerstill, E. Y., Arata, C., Zhu, Q., Schulze, B. C., Woods, R., Harkins, C., Schwantes, R. H., McDonald, B. C., Seinfeld, J. H., Bucholtz, A., Cohen, R. C., and Goldstein, A. H.: Comparison between Spatially Resolved Airborne Flux Measurements and Emission Inventories of Volatile Organic Compounds in Los Angeles, Environ. Sci. Technol., 57, 15533–15545, https://doi.org/10.1021/acs.est.3c03162, 2023.
Qin, Z., Xu, B., Zheng, Z., Li, L., Zhang, G., Li, S., Geng, C., Bai, Z., and Yang, W.: Integrating ambient carbonyl compounds provides insight into the constrained ozone formation chemistry in Zibo city of the North China Plain, Environ. Pollut., 324, 121294, https://doi.org/10.1016/j.envpol.2023.121294, 2023.
Qu, H., Wang, Y., Zhang, R., Liu, X., Huey, L. G., Sjostedt, S., Zeng, L., Lu, K., Wu, Y., Shao, M., Hu, M., Tan, Z., Fuchs, H., Broch, S., Wahner, A., Zhu, T., and Zhang, Y.: Chemical Production of Oxygenated Volatile Organic Compounds Strongly Enhances Boundary-Layer Oxidation Chemistry and Ozone Production, Environ. Sci. Technol., 55, 13718–13727, https://doi.org/10.1021/acs.est.1c04489, 2021.
Ren, Q.: Circular economy action programs and countermeasures for small and medium-sized resource-based cities of China-case study of Zibo City of Shandong Province, Energy Proced., 2183–2188, https://doi.org/10.1016/j.egypro.2011.03.377, 2011.
Riedel, T. P., Wolfe, G. M., Danas, K. T., Gilman, J. B., Kuster, W. C., Bon, D. M., Vlasenko, A., Li, S.-M., Williams, E. J., Lerner, B. M., Veres, P. R., Roberts, J. M., Holloway, J. S., Lefer, B., Brown, S. S., and Thornton, J. A.: An MCM modeling study of nitryl chloride (ClNO2) impacts on oxidation, ozone production and nitrogen oxide partitioning in polluted continental outflow, Atmos. Chem. Phys., 14, 3789–3800, https://doi.org/10.5194/acp-14-3789-2014, 2014.
Rieksta, J., Li, T., Davie-Martin, C. L., Aeppli, L. C. B., Hoye, T. T., and Rinnan, R.: Volatile responses of dwarf birch to mimicked insect herbivory and experimental warming at two elevations in Greenlandic tundra, Plant Environ. Interact., 4, 23–35, https://doi.org/10.1002/pei3.10100, 2023.
Sarwar, G., Luecken, D., Yarwood, G., Whitten, G. Z., and Carter, W. P. L.: Impact of an updated carbon bond mechanism on predictions from the CMAQ modeling system: Preliminary assessment, J. Appl. Meteorol. Clim., 47, 3–14, https://doi.org/10.1175/2007JAMC1393.1, 2008.
Saunders, S. M., Jenkin, M. E., Derwent, R. G., and Pilling, M. J.: Protocol for the development of the Master Chemical Mechanism, MCM v3 (Part A): tropospheric degradation of non-aromatic volatile organic compounds, Atmos. Chem. Phys., 3, 161–180, https://doi.org/10.5194/acp-3-161-2003, 2003.
Shen, L., Jacob, D. J., Zhu, L., Zhang, Q., Zheng, B., Sulprizio, M. P., Li, K., De Smedt, I., Abad, G. G., Cao, H., Fu, T.-M., and Liao, H.: The 2005-2016 Trends of Formaldehyde Columns Over China Observed by Satellites: Increasing Anthropogenic Emissions of Volatile Organic Compounds and Decreasing Agricultural Fire Emissions, Geophys. Res. Lett., 46, 4468–4475, https://doi.org/10.1029/2019GL082172, 2019.
Sindelarova, K., Granier, C., Bouarar, I., Guenther, A., Tilmes, S., Stavrakou, T., Müller, J.-F., Kuhn, U., Stefani, P., and Knorr, W.: Global data set of biogenic VOC emissions calculated by the MEGAN model over the last 30 years, Atmos. Chem. Phys., 14, 9317–9341, https://doi.org/10.5194/acp-14-9317-2014, 2014.
Song, J., Saathoff, H., Jiang, F., Gao, L., Zhang, H., and Leisner, T.: Sources of organic gases and aerosol particles and their roles in nighttime particle growth at a rural forested site in southwest Germany, Atmos. Chem. Phys., 24, 6699–6717, https://doi.org/10.5194/acp-24-6699-2024, 2024.
Song, M., Li, X., Yang, S., Yu, X., Zhou, S., Yang, Y., Chen, S., Dong, H., Liao, K., Chen, Q., Lu, K., Zhang, N., Cao, J., Zeng, L., and Zhang, Y.: Spatiotemporal variation, sources, and secondary transformation potential of volatile organic compounds in Xi'an, China, Atmos. Chem. Phys., 21, 4939–4958, https://doi.org/10.5194/acp-21-4939-2021, 2021.
Steiner, A. L., Cohen, R. C., Harley, R. A., Tonse, S., Millet, D. B., Schade, G. W., and Goldstein, A. H.: VOC reactivity in central California: comparing an air quality model to ground-based measurements, Atmos. Chem. Phys., 8, 351–368, https://doi.org/10.5194/acp-8-351-2008, 2008.
Stockwell, W. R., Kirchner, F., Kuhn, M., and Seefeld, S.: A new mechanism for regional atmospheric chemistry modeling, J. Geophys. Res.-Atmos., 102, 25847–25879, https://doi.org/10.1029/97JD00849, 1997a.
Stockwell, W. R., Kirchner, F., Kuhn, M., and Seefeld, S.: A new mechanism for regional atmospheric chemistry modeling, J. Geophys. Res.-Atmos., 102, 25847–25879, https://doi.org/10.1029/97JD00849, 1997b.
Tan, Z., Fuchs, H., Lu, K., Hofzumahaus, A., Bohn, B., Broch, S., Dong, H., Gomm, S., Häseler, R., He, L., Holland, F., Li, X., Liu, Y., Lu, S., Rohrer, F., Shao, M., Wang, B., Wang, M., Wu, Y., Zeng, L., Zhang, Y., Wahner, A., and Zhang, Y.: Radical chemistry at a rural site (Wangdu) in the North China Plain: observation and model calculations of OH, HO2 and RO2 radicals, Atmos. Chem. Phys., 17, 663–690, https://doi.org/10.5194/acp-17-663-2017, 2017.
Tan, Z., Lu, K., Jiang, M., Su, R., Dong, H., Zeng, L., Xie, S., Tan, Q., and Zhang, Y.: Exploring ozone pollution in Chengdu, southwestern China: A case study from radical chemistry to O3-VOC-NOx sensitivity, Sci. Total Environ., 636, 775–786, https://doi.org/10.1016/j.scitotenv.2018.04.286, 2018a.
Tan, Z., Rohrer, F., Lu, K., Ma, X., Bohn, B., Broch, S., Dong, H., Fuchs, H., Gkatzelis, G. I., Hofzumahaus, A., Holland, F., Li, X., Liu, Y., Liu, Y., Novelli, A., Shao, M., Wang, H., Wu, Y., Zeng, L., Hu, M., Kiendler-Scharr, A., Wahner, A., and Zhang, Y.: Wintertime photochemistry in Beijing: observations of ROx radical concentrations in the North China Plain during the BEST-ONE campaign, Atmos. Chem. Phys., 18, 12391–12411, https://doi.org/10.5194/acp-18-12391-2018, 2018b.
Tan, Z., Lu, K., Jiang, M., Su, R., Wang, H., Lou, S., Fu, Q., Zhai, C., Tan, Q., Yue, D., Chen, D., Wang, Z., Xie, S., Zeng, L., and Zhang, Y.: Daytime atmospheric oxidation capacity in four Chinese megacities during the photochemically polluted season: a case study based on box model simulation, Atmos. Chem. Phys., 19, 3493–3513, https://doi.org/10.5194/acp-19-3493-2019, 2019a.
Tan, Z., Lu, K., Hofzumahaus, A., Fuchs, H., Bohn, B., Holland, F., Liu, Y., Rohrer, F., Shao, M., Sun, K., Wu, Y., Zeng, L., Zhang, Y., Zou, Q., Kiendler-Scharr, A., Wahner, A., and Zhang, Y.: Experimental budgets of OH, HO2, and RO2 radicals and implications for ozone formation in the Pearl River Delta in China 2014, Atmos. Chem. Phys., 19, 7129–7150, https://doi.org/10.5194/acp-19-7129-2019, 2019b.
Venecek, M. A., Carter, W. P. L., and Kleeman, M. J.: Updating the SAPRC Maximum Incremental Reactivity (MIR) scale for the United States from 1988 to 2010, J. Air Waste Manage., 68, 1301–1316, https://doi.org/10.1080/10962247.2018.1498410, 2018.
Volkamer, R., Sheehy, P., Molina, L. T., and Molina, M. J.: Oxidative capacity of the Mexico City atmosphere – Part 1: A radical source perspective, Atmos. Chem. Phys., 10, 6969–6991, https://doi.org/10.5194/acp-10-6969-2010, 2010.
Wang, G., Zhu, Z., Liu, Z., Liu, X., Kong, F., Nie, L., Gao, W., Zhao, N., and Lang, J.: Ozone pollution in the plate and logistics capital of China: Insight into the formation, source apportionment, and regional transport, Environ. Pollut., 313, 20144, https://doi.org/10.1016/j.envpol.2022.120144, 2022a.
Wang, M., Zeng, L., Lu, S., Shao, M., Liu, X., Yu, X., Chen, W., Yuan, B., Zhang, Q., Hu, M., and Zhang, Z.: Development and validation of a cryogen-free automatic gas chromatograph system (GC-MS/FID) for online measurements of volatile organic compounds, Anal. Methods, 6, 9424–9434, https://doi.org/10.1039/C4AY01855A, 2014.
Wang, R., Wang, L., Yang, Y., Zhan, J., Ji, D., Hu, B., Ling, Z., Xue, M., Zhao, S., Yao, D., Liu, Y., and Wang, Y.: Comparative analysis for the impacts of VOC subgroups and atmospheric oxidation capacity on O3 based on different observation-based methods at a suburban site in the North China Plain, Environ. Res., 248, 118250, https://doi.org/10.1016/j.envres.2024.118250, 2024.
Wang, S., Yuan, B., Wu, C., Wang, C., Li, T., He, X., Huangfu, Y., Qi, J., Li, X.-B., Sha, Q., Zhu, M., Lou, S., Wang, H., Karl, T., Graus, M., Yuan, Z., and Shao, M.: Oxygenated volatile organic compounds (VOCs) as significant but varied contributors to VOC emissions from vehicles, Atmos. Chem. Phys., 22, 9703–9720, https://doi.org/10.5194/acp-22-9703-2022, 2022b.
Wang, S., Zhang, J., Zhang, Y., Wang, L., Sun, Z., and Wang, H.: Review on Source Profiles of Volatile Organic Compounds (VOCs) in Typical Industries in China, Atmosphere, 14, 878, https://doi.org/10.3390/atmos14050878, 2023.
Wang, W., Yuan, B., Peng, Y., Su, H., Cheng, Y., Yang, S., Wu, C., Qi, J., Bao, F., Huangfu, Y., Wang, C., Ye, C., Wang, Z., Wang, B., Wang, X., Song, W., Hu, W., Cheng, P., Zhu, M., Zheng, J., and Shao, M.: Direct observations indicate photodegradable oxygenated volatile organic compounds (OVOCs) as larger contributors to radicals and ozone production in the atmosphere, Atmos. Chem. Phys., 22, 4117–4128, https://doi.org/10.5194/acp-22-4117-2022, 2022c.
Wolfe, G. M., Marvin, M. R., Roberts, S. J., Travis, K. R., and Liao, J.: The Framework for 0-D Atmospheric Modeling (F0AM) v3.1, Geosci. Model Dev., 9, 3309–3319, https://doi.org/10.5194/gmd-9-3309-2016, 2016.
Wu, Y., Fan, X., Liu, Y., Zhang, J., Wang, H., Sun, L., Fang, T., Mao, H., Hu, J., Wu, L., Peng, J., and Wang, S.: Source apportionment of VOCs based on photochemical loss in summer at a suburban site in Beijing, Atmos. Environ., 293, 119459, https://doi.org/10.1016/j.atmosenv.2022.119459, 2023.
Xia, M., Peng, X., Wang, W., Yu, C., Sun, P., Li, Y., Liu, Y., Xu, Z., Wang, Z., Xu, Z., Nie, W., Ding, A., and Wang, T.: Significant production of ClNO2 and possible source of Cl2 from N2O5 uptake at a suburban site in eastern China, Atmos. Chem. Phys., 20, 6147–6158, https://doi.org/10.5194/acp-20-6147-2020, 2020.
Xia, S.-Y., Wang, C., Zhu, B., Chen, X., Feng, N., Yu, G.-H., and Huang, X.-F.: Long-term observations of oxygenated volatile organic compounds (OVOCs) in an urban atmosphere in southern China, 2014-2019, Environ. Pollut., 270, 116301, https://doi.org/10.1016/j.envpol.2020.116301, 2021.
Xu, Z., Wang, T., Xue, L. K., Louie, P. K. K., Luk, C. W. Y., Gao, J., Wang, S. L., Chai, F. H., and Wang, W. X.: Evaluating the uncertainties of thermal catalytic conversion in measuring atmospheric nitrogen dioxide at four differently polluted sites in China, Atmos. Environ., 76, 221–226, https://doi.org/10.1016/j.atmosenv.2012.09.043, 2013.
Xuan, H., Zhao, Y., Ma, Q., Chen, T., Liu, J., Wang, Y., Liu, C., Wang, Y., Liu, Y., Mu, Y., and He, H.: Formation mechanisms and atmospheric implications of summertime nitrous acid (HONO) during clean, ozone pollution and double high-level PM2.5 and O3 pollution periods in Beijing, Sci. Total Environ., 857, 159538, https://doi.org/10.1016/j.scitotenv.2022.159538, 2023.
Xue, L., Wang, T., Louie, P. K. K., Luk, C. W. Y., Blake, D. R., and Xu, Z.: Increasing External Effects Negate Local Efforts to Control Ozone Air Pollution: A Case Study of Hong Kong and Implications for Other Chinese Cities, Environ. Sci. Technol., 48, 10769–10775, https://doi.org/10.1021/es503278g, 2014a.
Xue, L., Gu, R., Wang, T., Wang, X., Saunders, S., Blake, D., Louie, P. K. K., Luk, C. W. Y., Simpson, I., Xu, Z., Wang, Z., Gao, Y., Lee, S., Mellouki, A., and Wang, W.: Oxidative capacity and radical chemistry in the polluted atmosphere of Hong Kong and Pearl River Delta region: analysis of a severe photochemical smog episode, Atmos. Chem. Phys., 16, 9891–9903, https://doi.org/10.5194/acp-16-9891-2016, 2016.
Xue, L. K., Wang, T., Gao, J., Ding, A. J., Zhou, X. H., Blake, D. R., Wang, X. F., Saunders, S. M., Fan, S. J., Zuo, H. C., Zhang, Q. Z., and Wang, W. X.: Ground-level ozone in four Chinese cities: precursors, regional transport and heterogeneous processes, Atmos. Chem. Phys., 14, 13175–13188, https://doi.org/10.5194/acp-14-13175-2014, 2014b.
Yang, C., Yao, N., Xu, L., Chen, G., Wang, Y., Fan, X., Zhou, P., Clusius, P., Tham, Y. J., Lin, Z., Chen, Y., Li, M., Hong, Y., and Chen, J.: Molecular Composition of Anthropogenic Oxygenated Organic Molecules and Their Contribution to Organic Aerosol in a Coastal City, Environ. Sci. Technol., 57, 15956–15967, https://doi.org/10.1021/acs.est.3c03244, 2023.
Yang, M., Beale, R., Liss, P., Johnson, M., Blomquist, B., and Nightingale, P.: Air–sea fluxes of oxygenated volatile organic compounds across the Atlantic Ocean, Atmos. Chem. Phys., 14, 7499–7517, https://doi.org/10.5194/acp-14-7499-2014, 2014.
Yang, X., Xue, L., Wang, T., Wang, X., Gao, J., Lee, S., Blake, D. R., Chai, F., and Wang, W.: Observations and Explicit Modeling of Summertime Carbonyl Formation in Beijing: Identification of Key Precursor Species and Their Impact on Atmospheric Oxidation Chemistry, J. Geophys. Res.-Atmos., 123, 1426–1440, https://doi.org/10.1002/2017JD027403, 2018.
Yang, X., Cheng, X., Yan, H., Sun, Y., and Zhang, G.: Ground-Level Ozone Production over an Industrial Cluster of China: a Box Model Analysis of a Severe Photochemical Pollution Episode, Pol. J. Environ. Stud., 31, 1885–1899, https://doi.org/10.15244/pjoes/143253, 2022a.
Yang, X., Lu, K., Ma, X., Gao, Y., Tan, Z., Wang, H., Chen, X., Li, X., Huang, X., He, L., Tang, M., Zhu, B., Chen, S., Dong, H., Zeng, L., and Zhang, Y.: Radical chemistry in the Pearl River Delta: observations and modeling of OH and HO2 radicals in Shenzhen in 2018, Atmos. Chem. Phys., 22, 12525–12542, https://doi.org/10.5194/acp-22-12525-2022, 2022b.
Yarwood, G., Rao, S., Yocke, M., and Whitten, G. Z.: Updates to the carbon bond chemical mechanism: CB05, Technical Report, Final Report to US EPA RT-0400675, 2005.
Yarwood, G., Jung, J., Whitten, G. Z., Heo, G., Mellberg, J., and Estes, M.: Updates to the Carbon Bond mechanism for version 6 (CB6), in: 9th Annual CMAS Conference, in: Proceedings of the 9th Annual CMAS Conference, Chapel Hill, NC, USA, 11–13 October 2010, 2010.
Yokelson, R. J., Karl, T., Artaxo, P., Blake, D. R., Christian, T. J., Griffith, D. W. T., Guenther, A., and Hao, W. M.: The Tropical Forest and Fire Emissions Experiment: overview and airborne fire emission factor measurements, Atmos. Chem. Phys., 7, 5175–5196, https://doi.org/10.5194/acp-7-5175-2007, 2007.
Zhang, K., Huang, L., Li, Q., Huo, J., Duan, Y., Wang, Y., Yaluk, E., Wang, Y., Fu, Q., and Li, L.: Explicit modeling of isoprene chemical processing in polluted air masses in suburban areas of the Yangtze River Delta region: radical cycling and formation of ozone and formaldehyde, Atmos. Chem. Phys., 21, 5905–5917, https://doi.org/10.5194/acp-21-5905-2021, 2021a.
Zhang, K., Duan, Y., Huo, J., Huang, L., Wang, Y., Fu, Q., Wang, Y., and Li, L.: Formation mechanism of HCHO pollution in the suburban Yangtze River Delta region, China: A box model study and policy implementations, Atmos. Environ., 267, 118755, https://doi.org/10.1016/j.atmosenv.2021.118755, 2021b.
Zhang, Z., Sun, Y., and Li, J.: Characteristics and sources of VOCs in a coastal city in eastern China and the implications in secondary organic aerosol and O3 formation, Sci. Total Environ., 887, 164117, https://doi.org/10.1016/j.scitotenv.2023.164117, 2023.
Zheng, B., Zhang, Q., Geng, G., Chen, C., Shi, Q., Cui, M., Lei, Y., and He, K.: Changes in China's anthropogenic emissions and air quality during the COVID-19 pandemic in 2020, Earth Syst. Sci. Data, 13, 2895–2907, https://doi.org/10.5194/essd-13-2895-2021, 2021.
Zheng, Z., Li, K., Xu, B., Dou, J., Li, L., Zhang, G., Li, S., Geng, C., Yang, W., Azzi, M., and Bai, Z.: O3–precursor relationship over multiple patterns of timescale: a case study in Zibo, Shandong Province, China, Atmos. Chem. Phys., 23, 2649–2665, https://doi.org/10.5194/acp-23-2649-2023, 2023.
Zhou, J., Zhang, C., Liu, A., Yuan, B., Wang, Y., Wang, W., Zhou, J.-P., Hao, Y., Li, X.-B., He, X., Song, X., Chen, Y., Yang, S., Yang, S., Wu, Y., Jiang, B., Huang, S., Liu, J., Peng, Y., Qi, J., Deng, M., Zhong, B., Huangfu, Y., and Shao, M.: Measurement report: Vertical and temporal variability in the near-surface ozone production rate and sensitivity in an urban area in the Pearl River Delta region, China, Atmos. Chem. Phys., 24, 9805–9826, https://doi.org/10.5194/acp-24-9805-2024, 2024.
Zhou, M., Jiang, W., Gao, W., Gao, X., Ma, M., and Ma, X.: Anthropogenic emission inventory of multiple air pollutants and their spatiotemporal variations in 2017 for the Shandong Province, China, Environ. Pollut., 288, 117666, https://doi.org/10.1016/j.envpol.2021.117666, 2021.
Zhu, J., Wang, S., Wang, H., Jing, S., Lou, S., Saiz-Lopez, A., and Zhou, B.: Observationally constrained modeling of atmospheric oxidation capacity and photochemical reactivity in Shanghai, China, Atmos. Chem. Phys., 20, 1217–1232, https://doi.org/10.5194/acp-20-1217-2020, 2020.