the Creative Commons Attribution 4.0 License.
the Creative Commons Attribution 4.0 License.
 | 15 Jul 2025
Failed cyclogenesis of a mesoscale convective system near Cabo Verde: the role of the Saharan trade wind layer among other inhibiting factors observed during the CADDIWA field campaign
Guillaume Feger
Jean-Pierre Chaboureau
Thibaut Dauhut
Julien Delanoë
Pierre Coutris
The role of the Saharan Air Layer (SAL) in Cabo Verde cyclogenesis remains uncertain. Here, we investigate the inhibiting factors leading to the failed cyclogenesis of mesoscale convective system (MCS) Pierre Henri observed during two flights of the Clouds-Atmospheric Dynamics-Dust Interactions in West Africa (CADDIWA) campaign. We use CADDIWA data and a convection-permitting simulation run with the Meso-NH model. We show that the African easterly wave in which MCS Pierre Henri is embedded forms a region of cyclonic recirculation that is relatively protected from lateral intrusions, called a marsupial pouch, which keeps the SAL away from the MCS. By contrast, a dusty, dry, and warm air layer between 0.8 and 2 km altitude, called the Saharan trade wind layer (STWL), penetrates into the convective core of MCS Pierre Henri, increasing the convective inhibition (CIN) area and contributing up to 40 % of the CIN area during the MCS' mature phase. The cold pools produced by convection also increase the CIN area and contribute up to 50 % of this area after the MCS' intense phase. Upper-tropospheric dry air, with relative humidity below 15 % between 7 and 11 km altitude, gradually penetrates into the 150 km circle around the MCS, reaching 18 % of the area during its dissipation phase and preventing the MCS' anvil expansion. The inhibiting roles of the STWL, cold pools, and upper-tropospheric dry air in leading the cyclogenesis fail to provide new insights into the complex dynamics of cyclogenesis in the Cabo Verde region and challenge the existing model of the SAL.
- Article
(8824 KB) - Full-text XML
- BibTeX
- EndNote


From June to October, African easterly waves (AEWs) are synoptic-scale disturbances formed over sub-Saharan Africa (Burpee, 1972). They travel westward into the Atlantic Ocean, where they are responsible for more than half of all tropical cyclones (Landsea, 1993). Tropical cyclogenesis from AEWs often results from a pre-existing mesoscale convective system (MCS), a feature particularly observed in the Cabo Verde region, where MCSs are embedded in the trough of AEWs (Arnault and Roux, 2011). It also depends on many other environmental conditions, including warm ocean waters, moist convective instability, weak vertical wind shear, and a relatively moist middle troposphere, which are linked, in the eastern tropical Atlantic, to the West African Monsoon flow, the African Easterly Jet (AEJ), AEW activity, and Saharan Air Layer (SAL) outbreaks. These complex dynamics make accurate forecasting of the tracks and intensities of North Atlantic tropical cyclones a persistent challenge for numerical weather prediction (Wang et al., 2018).
The SAL originates from the uplift of the Saharan mixing layer during the boreal spring and summer and is characterized by warm, stable air with low relative humidity and a high dust content (Carlson and Prospero, 1972). It spans about 1.5 to 7 km in altitude and is transported by the AEJ toward the Atlantic (Karyampudi and Carlson, 1988). The SAL's impact on cyclogenesis depends on multiple factors, alternately supporting or hindering its development and making it a subject of ongoing debate (Shu and Wu, 2009; Xian et al., 2020; Luo and Han, 2021; Sun and Zhao, 2020; Pan et al., 2018). The stronger baroclinicity along the SAL edges reinforces the meridional circulation necessary for AEW growth (Karyampudi and Carlson, 1988; Karyampudi and Pierce, 2002). A negative correlation between SAL outbreaks, evidenced by high dust loading, and Atlantic tropical cyclone activity was found using satellite data (Evan et al., 2006), reanalysis (Xian et al., 2020), and a fully coupled general circulation model (Strong et al., 2018). Using satellite imagery, Dunion and Velden (2004) proposed three mechanisms for the suppression of Atlantic tropical storm activity by the SAL: (i) the intrusion of dry air into the MCS promoting convectively driven downdrafts that contribute to stabilizing the atmosphere, (ii) the intensification of vertical wind shear caused by the SAL's mid-level easterly jet, and (iii) the trade wind inversion reinforced by the radiative heating of dust that stabilizes the environment. Shu and Wu (2009) further showed that cyclone weakening occurs when the SAL is detected in the southwestern quadrant within 360 km of the tropical cyclone's center. Comparing intensifying and weakening storms, Braun (2010) demonstrated that the SAL hindered convection in areas not crucial for cyclone development while confining it to vorticity-rich regions, resulting in little evidence for a negative impact of the SAL on cyclogenesis. The dust content of the SAL also impacts MCS dynamics, convective activity, and cloud physics (Luo and Han, 2021; Sun and Zhao, 2020; Pan et al., 2018). To analyze the impact of the SAL on deep convection over the Atlantic, air parcel theory provides a useful theoretical framework (e.g., Wong and Dessler, 2005). It shows that the warmness and dryness of the SAL raise the lifting condensation level (LCL) and the level of free convection (LFC), thus reinforcing the energy barrier for moist convection to occur.
A second synoptic feature inhibiting convection during cyclogenesis is the intrusion of dry air into the free troposphere. When considering the intrusion of dry air over the eastern Atlantic, this is often the intrusion of the low- to mid-level SAL into the cyclone (e.g., Dunion and Velden, 2004; Braun, 2010). In this case, the role of the marsupial pouch, a protected region of cyclonic recirculation that exists in the lower troposphere, is essential (Dunkerton et al., 2009). For example, Fritz and Wang (2013) examined the impacts of dry air on the formation of two tropical cyclones. They found suppression of deep convection by mid-level drying for the non-developing cyclone where a well-defined wave pouch is absent and dry air at the pouch periphery remaining away from the pouch center for the developing cyclone. The intrusion of dry air into the upper troposphere did not attract as much attention as the mid-level dry air intrusion. Hankes et al. (2015) found the presence of mid- to upper-level dry air in non-developing waves in the Cabo Verde region. They attributed the dry air to a broad trough leading to strong westerly vertical shear, which is detrimental to tropical cyclone formation. Arnault and Roux (2011) also found inhibition of non-developing waves by an unusually dry environment and strong vertical wind shear in the same region.
Cold pools produced by deep convection also play an important role in storm development. Cold pools are regions of relatively cold air at the surface, ranging from 10 to 200 km in diameter (Zuidema et al., 2017) and originating from the evaporation of rain from convective downdrafts (Charba, 1974). Their expansion can lift warmer ambient air aloft, potentially generating new convective cells (Goff, 1976; Tompkins, 2001; Schlemmer and Hohenegger, 2014). Cold pools modify near-surface thermodynamics (Zuidema et al., 2017). Inside cold pools, the cold air brought in by downdrafts stabilizes the atmosphere, causing a local suppression of convection. The duration of this convective inhibition depends on the time taken for surface fluxes to remove the negative temperature perturbation (Tompkins, 2001).
The aim of the present study is to assess the respective roles of the SAL, cold pools, and upper-tropospheric dry air in tropical cyclogenesis. To achieve this goal, we take advantage of the Clouds-Atmospheric Dynamics-Dust Interactions in West Africa (CADDIWA) field campaign that took place in September 2021 (Flamant et al., 2024). The CADDIWA project's objectives were to investigate dust effects on AEW dynamics and tropical storm formation over the North Atlantic. Here, we focus on the case of non-cyclogenesis of a MCS named Pierre Henri sampled by two flights during the campaign. Jonville et al. (2024) analyzed three AEWs, including the one in which MCS Pierre Henri was embedded. Despite the presence of a marsupial pouch developed in the AEW trough, they suggested that the SAL intrusion inside the pouch led to inhibition of the cyclogenesis of the MCS. Our study builds upon this synoptic analysis by examining the SAL intrusion in the convective core of the MCS at the mesoscale. By incorporating observational data from CADDIWA and considering secondary inhibiting factors such as cold pools and upper-tropospheric dry air, it provides a detailed assessment of why MCS Pierre Henri did not develop into a tropical cyclone. We take advantage of a convection-permitting simulation performed with the Meso-NH model to analyze the aerosols and thermodynamics of the SAL as well as the transport of Saharan air into the MCS. In particular, we describe the Saharan trade wind layer (STWL) beneath the SAL and show its major role in inhibiting the transformation of the MCS into a tropical cyclone.
The study is structured as follows: Sect. 2 describes the data. Section 3 details the synoptic context, the MCS life cycle, and the atmospheric characteristics upstream of the MCS, including the STWL, the SAL, and upper-tropospheric dry air. Section 4 analyzes the contributions of the inhibition factors, STWL, cold pools, and upper-tropospheric dry air to the dissipation of MCS Pierre Henri. Section 5 gives the conclusions.
2.1 Meso-NH simulation
The simulation is run with the Meso-NH nonhydrostatic model version 5.6 (Lac et al., 2018) in a domain of size 1730 km × 1350 km, encompassing the western African coast and the Cabo Verde islands (Fig. 1). The horizontal grid spacing is set to 3 km, allowing the model to resolve deep convection explicitly. The vertical grid has 92 levels with a grid spacing stretched from 30 m near the surface to 500 m and from 9 km to the top of the model at 26 km, with a sponge layer in the last 8 km to damp gravity waves. The simulation is run for 24 h, starting at 00:00 UTC on 11 September 2021, with the output saved every hour. Initial and 6-hourly boundary conditions are obtained from the European Centre for Medium-Range Weather Forecasts (ECMWF) operational analysis for surface and meteorological variables and from the Copernicus Atmospheric Monitoring Service (CAMS) reanalysis (Inness et al., 2019) for the aerosol distribution. The CAMS reanalysis includes aerosol mass mixing ratios over 60 vertical levels and assimilates aerosol optical depth (AOD) retrievals from the Moderate Resolution Imaging Spectroradiometer (MODIS).
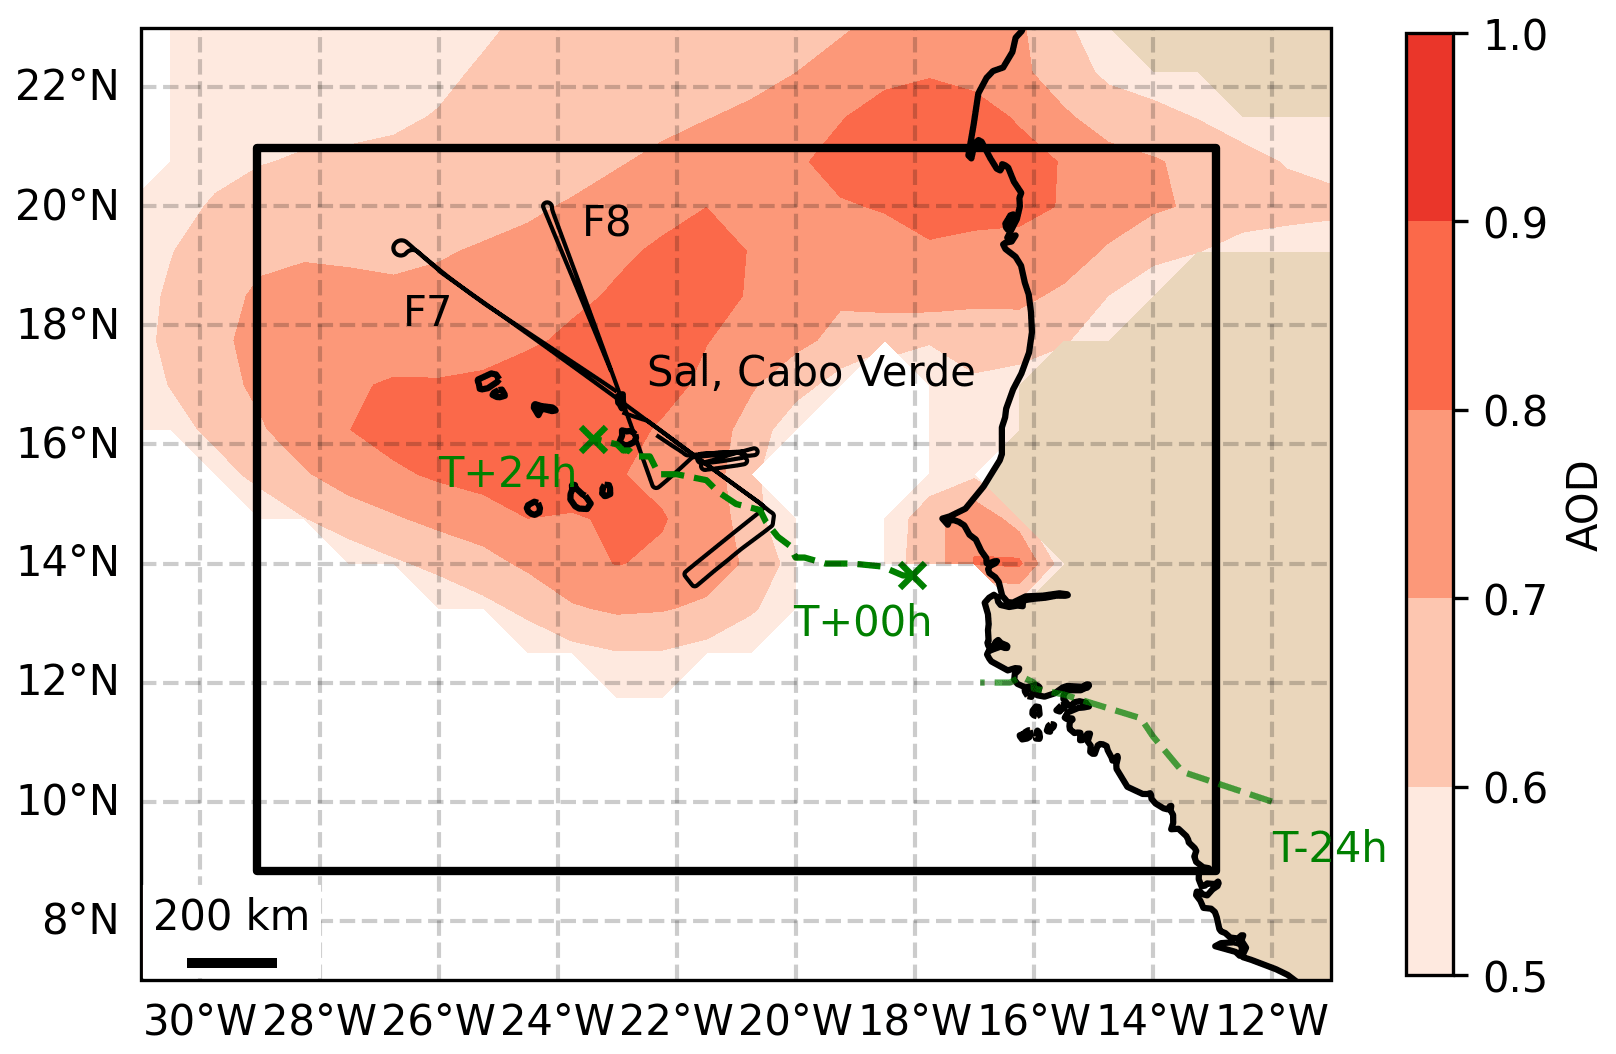
Figure 1Simulation domain (black rectangle), which includes the Cabo Verde islands and a portion of the western African continent (shaded brown). The morning (F7) and afternoon (F8) flight tracks are depicted with black lines. The MCS trajectory is represented by the green dashed line. The red shading shows the aerosol optical depth greater than 0.5, as derived from the CAMS reanalysis at 00:00 UTC on 11 September 2021.
The simulation uses the Surface Externalisée (SURFEX) scheme for surface fluxes (Masson et al., 2013), the radiative scheme taken from ECMWF (Gregory et al., 2000), and an eddy-diffusivity mass-flux scheme for shallow convection (Pergaud et al., 2009). The turbulence is parameterized using the 3D mode of a 1.5-order closure scheme (Cuxart et al., 2000) to obtain a better representation of cloud organization and lifetime (Machado and Chaboureau, 2015). The cloud microphysics is the two-moment LIMA (Liquid Ice Multiple Aerosols) scheme (Vié et al., 2016) which predicts both the concentration and mixing ratio of five hydrometeor species (cloud droplets, raindrops, ice crystals, and snow and graupel particles). LIMA is driven by the prognostic evolution of a 3D aerosol population composed of cloud condensation nuclei (CCN) and ice-freezing nuclei (IFN). Aerosol-nucleating properties are used for the formation of cloud droplets and ice crystals. A simplified initialization of the aerosol population is used, consisting of one type of CCN and one type of IFN. The CCN concentration is initialized from the sum of CAMS sea salt mode contents, while the IFN concentration is derived from the sum of the dust mode contents. Aerosol depletion by the activation process is disabled in LIMA to avoid any limiting impact on convection. To assess the convective activity and cloud organization in the simulation, synthetic brightness temperatures (BTs) at 10.8 µm are generated from model outputs using the radiative transfer model for the TIROS Operational Vertical Sounder (RTTOV) code (Saunders et al., 2018), which was integrated into Meso-NH by Chaboureau et al. (2008).
2.2 Observations
The French Falcon 20 aircraft, operated by SAFIRE (Service des Avions Français Instrumentés pour la Recherche en Environnement) for environmental research, was used extensively during the CADDIWA field campaign. Detailed information about the Falcon 20 and its research payload for CADDIWA is available in Flamant et al. (2024). This study uses data from two of the nine research flights of the campaign, i.e., flights F7 and F8, conducted in the morning and afternoon of 11 September 2021. In the following, the flight tracks and instrument payload are detailed.
Flight F7 aimed to study the dry air and dust circling ahead of MCS Pierre Henri as well as its anvil. The Falcon 20 departed Sal at 09:15 UTC, flew toward the SAL at 4 km altitude, turned back at 10:10 UTC toward the MCS at 10 km altitude, and landed at 12:43 UTC. Vaisala dropsondes were released, three before reaching the MCS (D1, D2, and D3) and two more in the MCS (D4 and D5). Flight F8 targeted the same system, adding transverse legs at different altitudes to sample the convective system. This flight had a more north–south orientation compared to F7 to capture the core of the convection. The Falcon 20 took off at 14:46 UTC, turned back towards the SAL at 15:38 UTC, and landed at 17:56 UTC. Eight dropsondes were released, including one in the upper-tropospheric dry air north of the MCS (D6).
The Falcon F20 thermodynamic probes include the Rosemount T for temperature and the FLYHT WVSS-2 for humidity. The microphysical probe set is composed of the ultra-high-sensitivity aerosol spectrometer (UHSAS-A), the forward-scattering spectrometer probe (FSSP-300), the cloud droplet probe (CDP-2), and the 2D-S stereo probe. The UHSAS-A, the FSSP-300, and the CDPs are optical-scattering aerosol particle spectrometers that count and size aerosol particles and cloud droplets. The size of each particle is derived from the scattered intensity using Rayleigh (40–300 nm) or Mie (0.3–50 µm) scattering models. The ranges of the three probes are 0.04–1, 0.3–20, and 2–50 µm, respectively. The 2D-S probe is an optical-array probe imager in the 10–1280 µm size range, with 128 photodiodes recording silhouettes of particles at high frequency (up to 20 MHz).
The Falcon F20 carries a combination of radar and lidar (RALI, Delanoë et al., 2013) instruments to remotely sense the vertical structure of aerosols and clouds. The RALI platform combines the RASTA (RAdar SysTem Airborne) radar and the LNG (Léandre New Generation) lidar. RASTA is a multibeam 95 GHz Doppler cloud radar with a range resolution of 60 m. For the CADDIWA field campaign, it was composed of three downward-looking antennas and one upward-looking antenna with an integration time of 250 ms for each one, leading to a measurement on the same antenna every second at 200 m s−1. Thanks to the Doppler capability and the three downward-looking antennas, the 3D wind field below the plane can be retrieved. The cloud mask is generated by filtering out background noise from the radar signal for each antenna using a thresholding technique and image processing to remove isolated pixels. LNG is a triple-wavelength (355, 532, and 1064 nm), dual-polarization lidar. It includes depolarization at 355 nm and has a vertical resolution of 37 m. Considering that the calibrated signal is averaged over 5 s, the horizontal resolution is 1 km for an aircraft flying at 200 m s−1, on average. Here we analyze the backscatter coefficient at 532 nm and take advantage of the RALI phase categorization product to detect clear skies.
This study also incorporates spaceborne observations, utilizing infrared imagery at a wavelength of 10.8 µm obtained from the Spinning Enhanced Visible and InfraRed Imager (SEVIRI) aboard the Meteosat second-generation geostationary satellite to analyze cloud population evolution and from the MODIS Deep Blue AOD product at 500 nm to evaluate the horizontal extent of the dust outbreak.
3.1 Synoptic context
MCS Pierre Henri evolved in a synoptic environment characterized by Saharan air to the north, a monsoon flow to the south, and, between the two, the AEJ whose position is modulated by an AEW. The AEW was first identified over the western African continent on 8 September. It propagated westward, reaching the coast south of Dakar on 10 September, weakening before crossing the coast, and redeveloping over the Atlantic Ocean at 00:00 UTC on 11 September. This redevelopment led to the formation of MCS Pierre Henri within the trough of the AEW, at the southern edge of the AEJ. The NOAA National Hurricane Center (NHC) had initially forecasted that this intense MCS would develop into a tropical storm but downgraded it to a tropical disturbance on 11 September, so it was not recorded by the NHC (Flamant et al., 2024). The MCS took a westward trajectory until 12:00 UTC on 11 September, after which it unexpectedly moved in a northwesterly direction. Throughout the day, the monsoon penetration behind the trough was intense, supplying moisture and vorticity to the low levels of the MCS. The AEJ intensity progressively weakened until the MCS dissipated around 00:00 UTC on 12 September near the island of Sal in Cabo Verde. The SAL also played a significant role in shaping the atmospheric conditions near Cabo Verde. The SAL reached the Cabo Verde islands on 9 September, raising AOD 500 nm values from 0.18 to 0.47 and further to 0.75 on 10 September at the AErosol RObotic NETwork (AERONET) Cabo Verde station at Sal. On 10 September, the MODIS AOD exceeded 0.9 between 14 and 22° N at the Cabo Verde longitudes. On 11 September, the dust plume covered over half of the simulation domain, as shown by the CAMS AOD (Fig. 1). On 12 September, the area with AOD values above 0.9 shifted northwest of Cabo Verde.
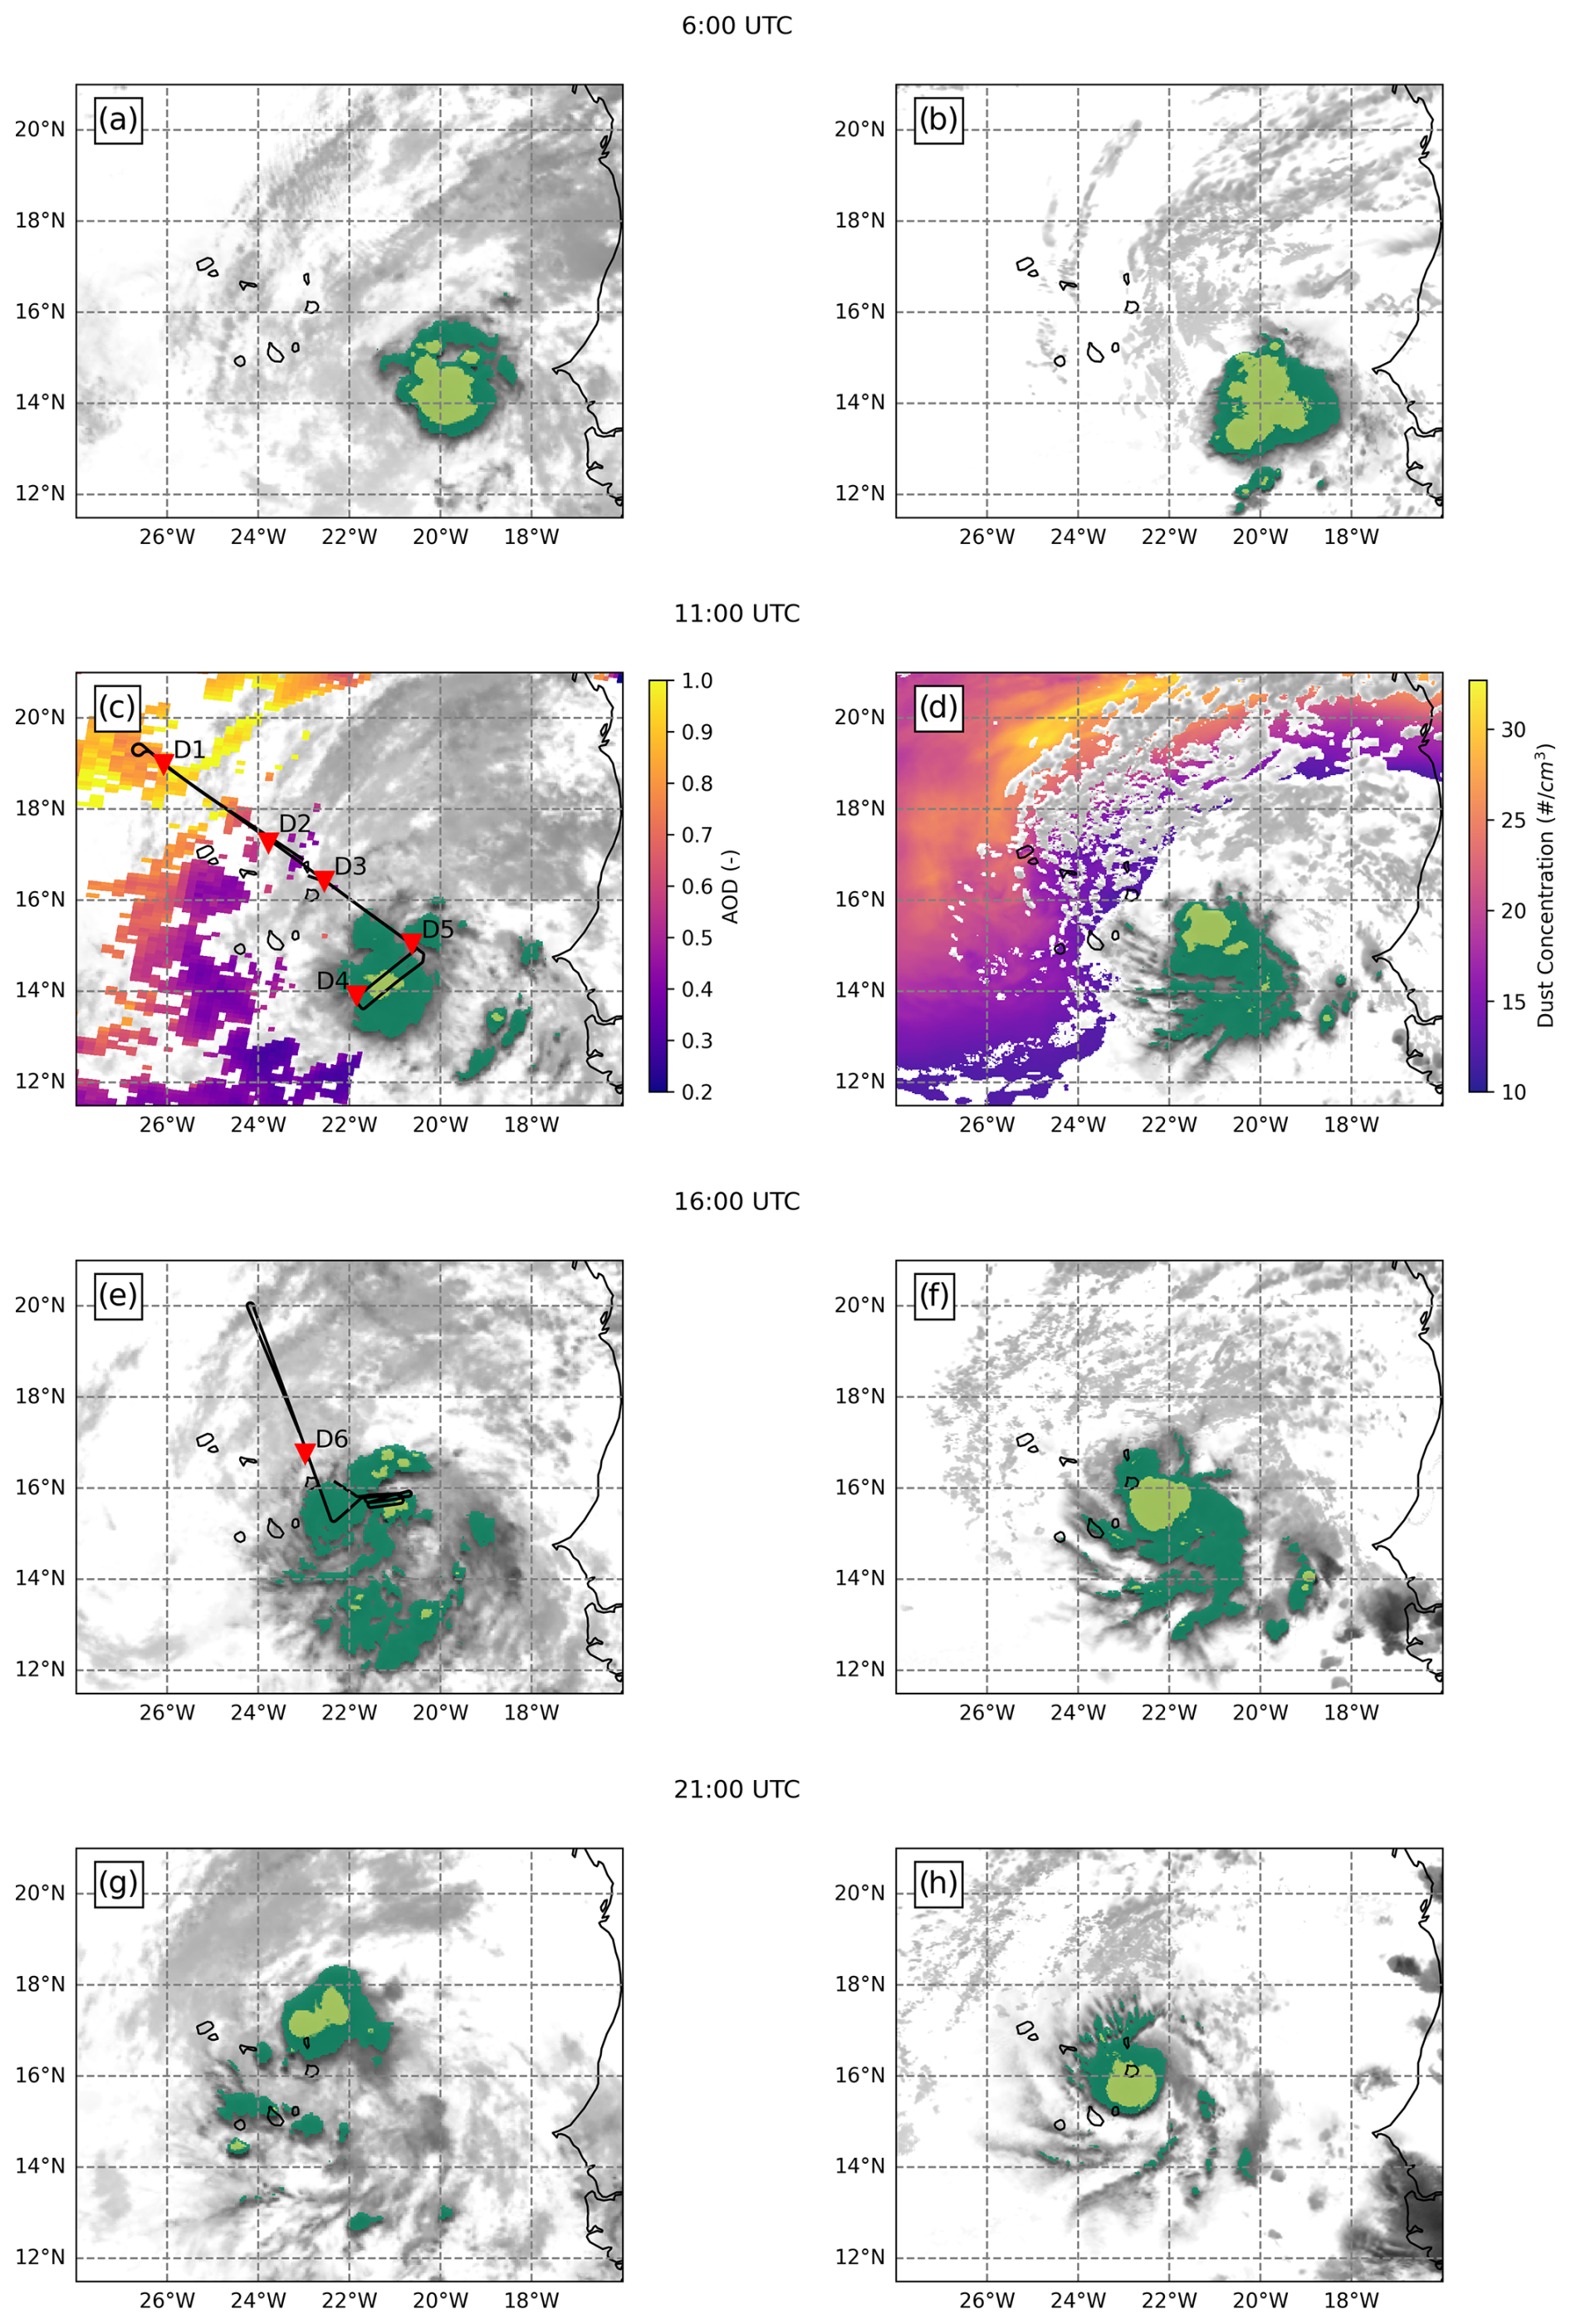
Figure 2Brightness temperature at 10.8 µm from Meteosat-11 (a, c, e, and g) and the simulation (b, d, f, and h) at (a, b) 09:00, (c, d) 11:00, (e, f) 16:00, and (g, h) 21:00 UTC on 11 September 2021. Deep convective clouds are shown in dark green (temperatures between 210 and 230 K) and light green (temperatures below 210 K). In panels (c) and (d), the colored shading shows the AOD at 550 nm from MODIS Deep Blue at 11:50 UTC and the mean dust concentration between 0 and 6 km height at 11:00 UTC. In panels (c) and (e), the black line shows the morning (F7) and afternoon (F8) flight tracks, respectively. In panel (c), the red triangles show the locations of dropsondes D1 to D6.
3.2 Life cycle of MCS Pierre Henri
The evolution of MCS Pierre Henri on 11 September and its environment are described briefly. The occurrence of deep convective clouds from observations and simulations is analyzed at four key times on 11 September (Fig. 2). Brightness temperatures at 10.8 µm between 210 and 230 K (in dark green) are classified as deep convective clouds (DCCs) and those below 210 K (in light green) as high convective clouds (HCCs). Dust content is assessed using MODIS AOD measurements at 11:50 UTC and simulated mean dust concentrations between the surface and the top of the dust plume at a height of 6 km at 11:00 UTC (Fig. 2c and d).
At 06:00 UTC, the spatial distribution of HCCs and DCCs shows that the MCS is compact and circular in shape in both observations and simulations. The extent of the HCC area exceeds 100 km2, marking an intense convective activity (Fig. 2a and b). At 11:00 UTC, it decreases to about 20 km2, showing a strong decrease in convective activity (Fig. 2c and d). Scattered convective cells are observed and simulated to the southeast of the MCS. In the model, HCCs shift northward, close to the leading edge of the MCS. The MCS is surrounded to the northwest by the SAL, which contains a large number of aerosols, as shown by MODIS AOD values of up to 1 and mean dust concentration values above 25 cm−3 between 0 and 6 km in height. At 16:00 UTC, the MCS reaches its maximal extent of DCCs (Fig. 2e and f). HCC activity is mainly observed and simulated close to the MCS' leading edge and decreases in the southern part of the MCS. The DCC extent increases, and a discontinuity between the northern active zone and the southern sector of the MCS appears. At 21:00 UTC, the MCS passes over the Cabo Verde islands (Fig. 2g and h). HCCs are confined to a small area, and DCCs dissipate in both the observations and simulations. Although the model captures this decay accurately, the simulated MCS is located approximately 2° south of its observed position. Warmer cloud formations are observed as spiral bands extending southward from HCCs, covering a larger area in the observations than in the simulation. Overall, the MCS shows a northwesterly track and decreasing activity at the end of 11 September, two features that are globally well reproduced by the simulation.
3.3 Atmospheric properties ahead of MCS Pierre Henri
In this section, we use data from F7 to describe the atmosphere northwest of the MCS. The main result is the presence of hot, dry, and dusty Saharan air at the trade wind levels in the vicinity of the MCS. This layer will be referred to as the STWL. First, we describe the thermodynamics of the atmosphere between the SAL and the MCS. Second, we analyze the origins of the SAL and STWL along the northwestern part of the F7 track. Third, we assess the vertical structure of the spatial distribution of aerosols. Finally, we examine the aerosol size distributions, from sea level to the top of the SAL, to assess their dust content.
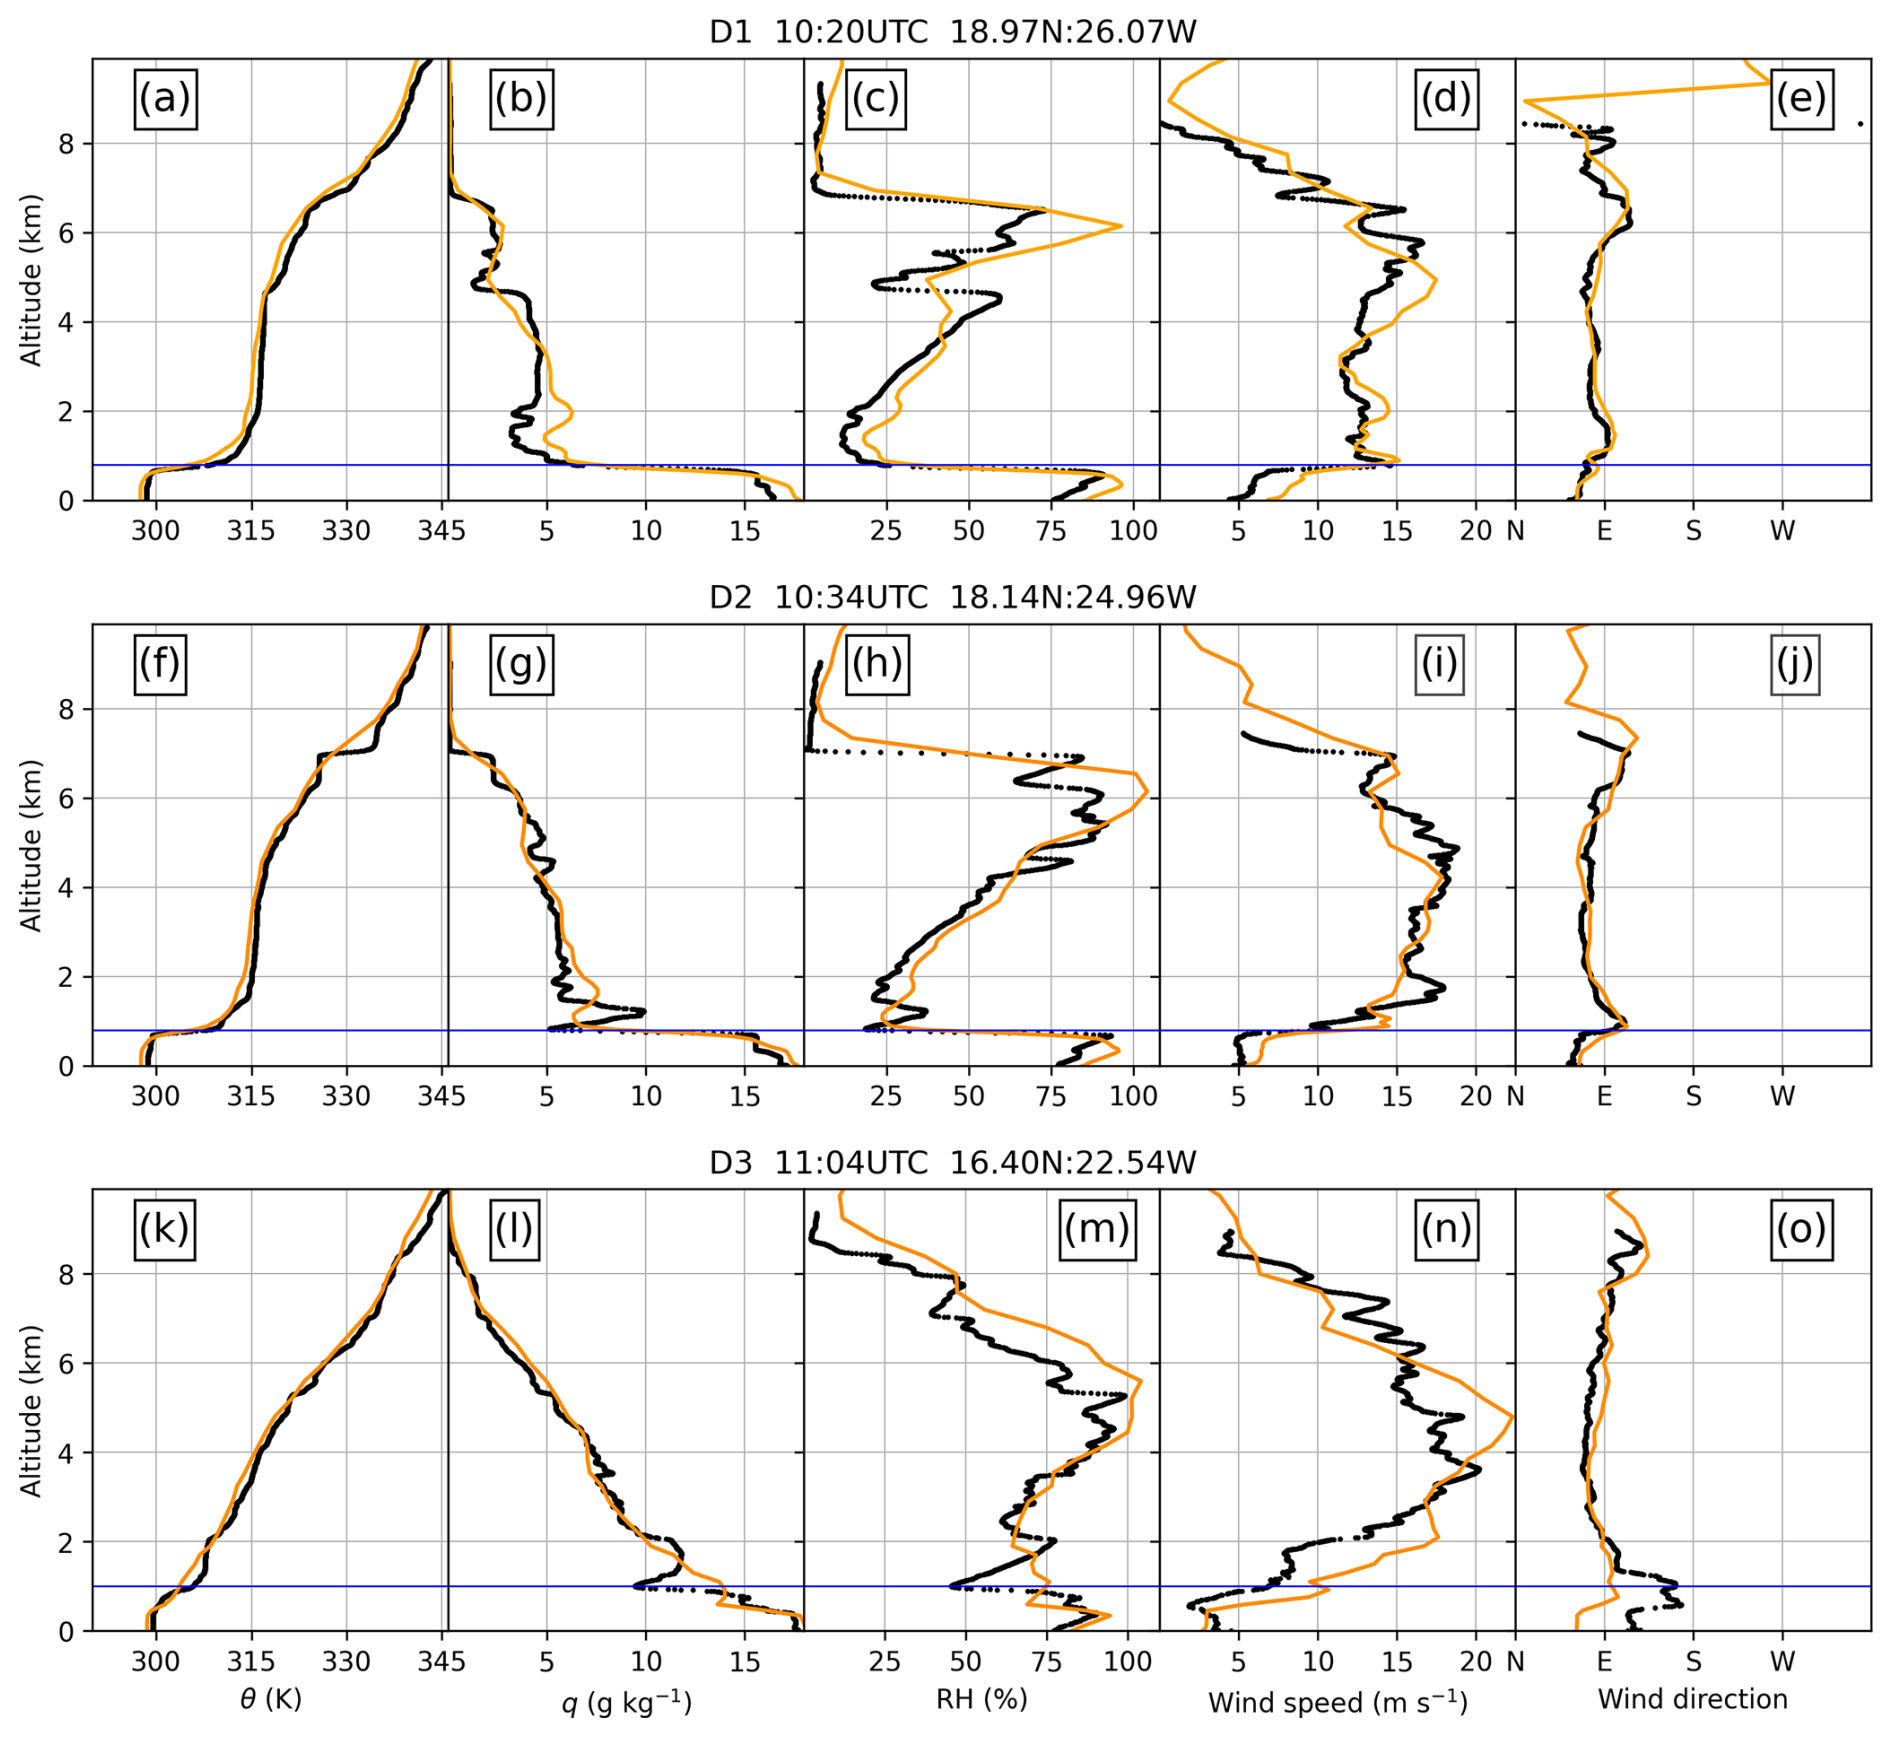
Figure 3Profiles of (a, f, and k) the potential temperature, (b, g, and l) the water vapor mixing ratio, (c, h, and m) the relative humidity, (d, i, and n) the wind speed, and (e, j, and o) the wind direction from the dropsondes (black) launched at 10:20 (top, D1), 10:34 (middle, D2), and 11:04 UTC (bottom, D3) and from the simulation (orange) at 10:00 (top and middle) and 11:00 UTC (bottom) on 11 September 2021. The blue horizontal line marks the top of the MBL.
The vertical structure of the troposphere sampled by dropsondes D1, D2, and D3 shows temperature and humidity inversions from the SAL to the nearby MCS environment (Fig. 3). The three profiles share features with the marine boundary layer (MBL) and the trade wind layer (TWL). They differ above 2 km height, where D1 and D2 exhibit characteristics of the SAL, while D3 indicates no SAL at these altitudes but provides insight into the wind circulation around the MCS. The first layer above sea level is a well-mixed MBL with a potential temperature of 299 K (Fig. 3a, f, and k) and a vapor mixing ratio of 16–17 g kg−1 (Fig. 3b, g, and l). The top of this layer is identified by the largest humidity drop (von Engeln et al., 2005) and coincides with the first inversion layer. The MBL wind direction is NNE, except for D3, where it may be affected by the topography of the island of Sal (Fig. 3o). The second layer is the STWL, from 0.8 to about 2 km height. It lies above the MBL, and its top is bounded either by the SAL (on D1 and D2) or, in the absence of the SAL, a temperature inversion (on D3 and during takeoff, as probed by onboard aircraft measurements that are not shown). The STWL is a stably stratified layer with large potential temperature gradients (6–12 K km−1) (Fig. 3a, f, and k) and dry air (3–12 g kg−1) (Fig. 3b, g, and l). Its wind direction ranges from E (Fig. 3e) to SE (Fig. 3j and o). The closer it is to the MCS, the moister and cooler it is. The third layer, observed on D1 and D2 only, is the SAL. This is a well-mixed neutral layer extending up to 4.8 km in height, with a constant potential temperature of 317 K, a vapor mixing ratio of 4–6 g kg−1, and ENE winds ranging from 12 to 18 m s−1 (Fig. 3d, e, i, and j). On D3, 200 km from the MCS, an intense circulation is evidenced by a wind speed of 20 m s−1 and a relative humidity of over 90 % around 4 km height. On D1 and D2, the fourth layer, between 4.8 and 7 km, shows a potential temperature increase from 317 to 325–333 K (Fig. 3a and f). The wind speed ranges from 12 to 18 m s−1 and exhibits greater variability, with a directional shift eastward (Fig. 3d, e, i, and j). The fifth layer, above 7 km height, appears on D1 and D2. It is characterized by a vapor mixing ratio close to zero (Fig. 3b and g), a sharp positive gradient in potential temperature (Fig. 3a and f), and low wind speeds and low vertical shear (Fig. 3d and i). The characteristics of this upper-tropospheric dry air indicate the presence of a stable layer and the absence of an upper-level trough. The model reproduces the thermodynamics observed by D1, D2, and D3 but smooths the profiles, likely due to its coarse vertical resolution. Stronger wind speeds are simulated at the D3 location due to the closer proximity of the simulated MCS at this location, whereas the observed MCS is further away (Fig. 2c and d).
The origins of the STWL and SAL are identified from 4.5 d back trajectories calculated along the northwestern track of F7 at heights of 1.5 and 3.2 km (Fig. 4) using Meso-NH forecasts made during the CADDIWA campaign (Flamant et al., 2024). Close to the island of Sal, in the southern part of the dust outbreak, the STWL originates from the southern Sahara, between 1 and 3 km, and gradually descends below 2 km before crossing the coast. The westernmost STWL air parcels arriving along the F7 track originate from an anticyclonic circulation at 25° N and gradually descend from 5 to 1.5 km (Fig. 4a). The SAL originates from northern Algeria and travels across the continent toward the Atlantic in the AEJ at altitudes between 2 and 4 km (Fig. 4b). Back trajectories along the F7 track show that the STWL is mostly composed of Saharan air, but it differs from the SAL in that it mixes air from a wider variety of sources, resulting in higher stratification and greater variability in thermodynamic properties. Visual inspection of the CAMS reanalysis of the AOD the week before F7 confirms the convergence of two distinct dust plumes near the coast the day before. Consistent with the Meso-NH back trajectories, one of the plumes originates from northern Algeria, while the other one originates from the Bodélé region and propagates westward across the southern Sahara. Both regions are well documented in the literature as major dust source areas (Karyampudi et al., 1999).
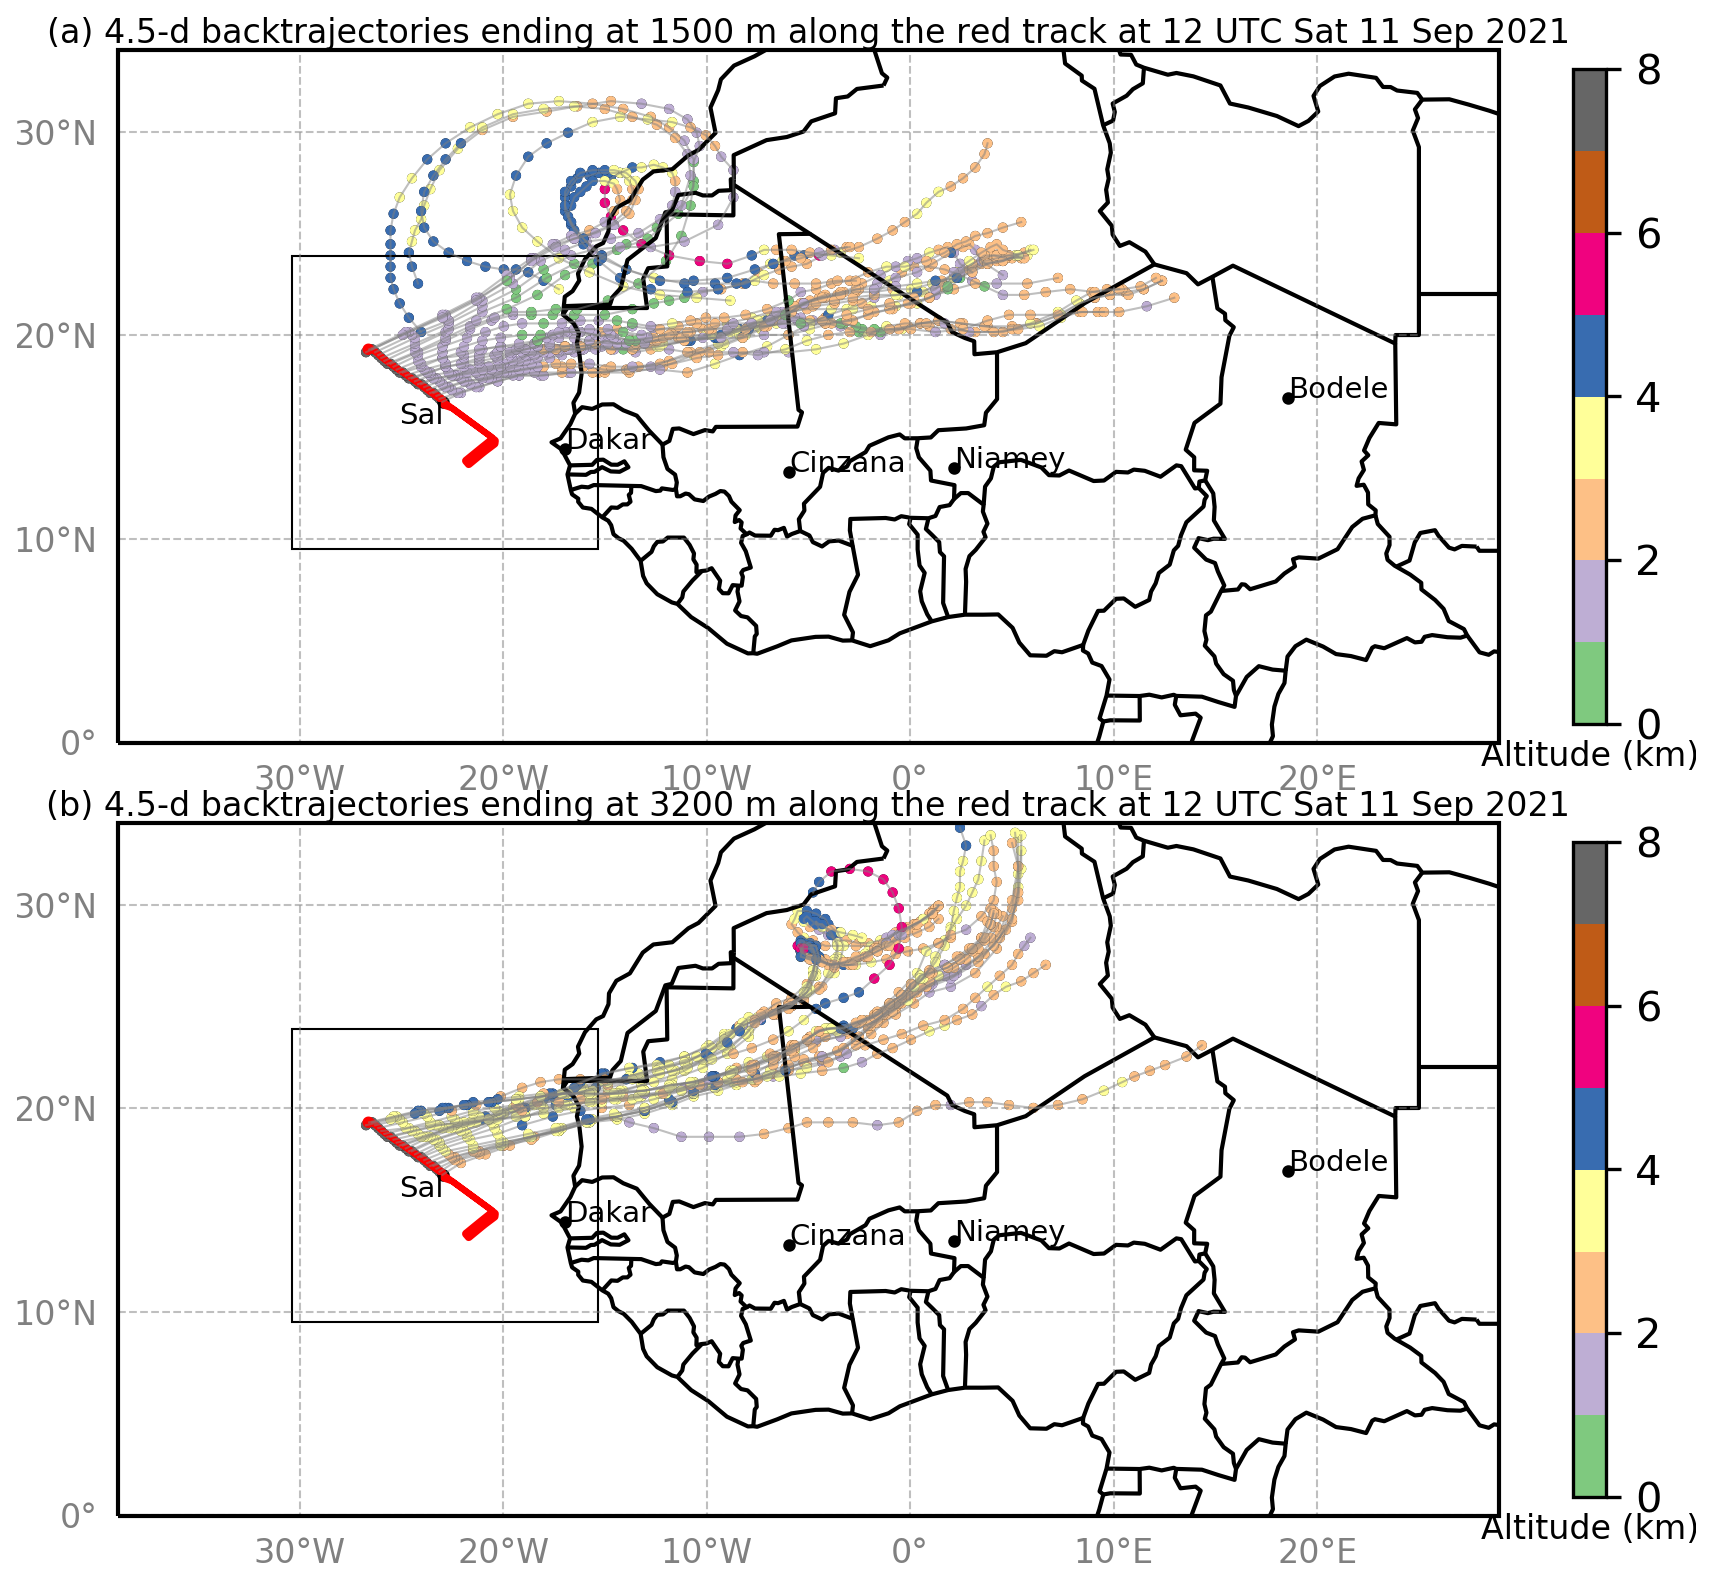
Figure 4Back trajectories of 4.5 d ending at 12:00 UTC on 11 September 2021 at (a) 1500 and (b) 3200 m along the F7 track. Dots represent the evolution of the back trajectories every 3 h.
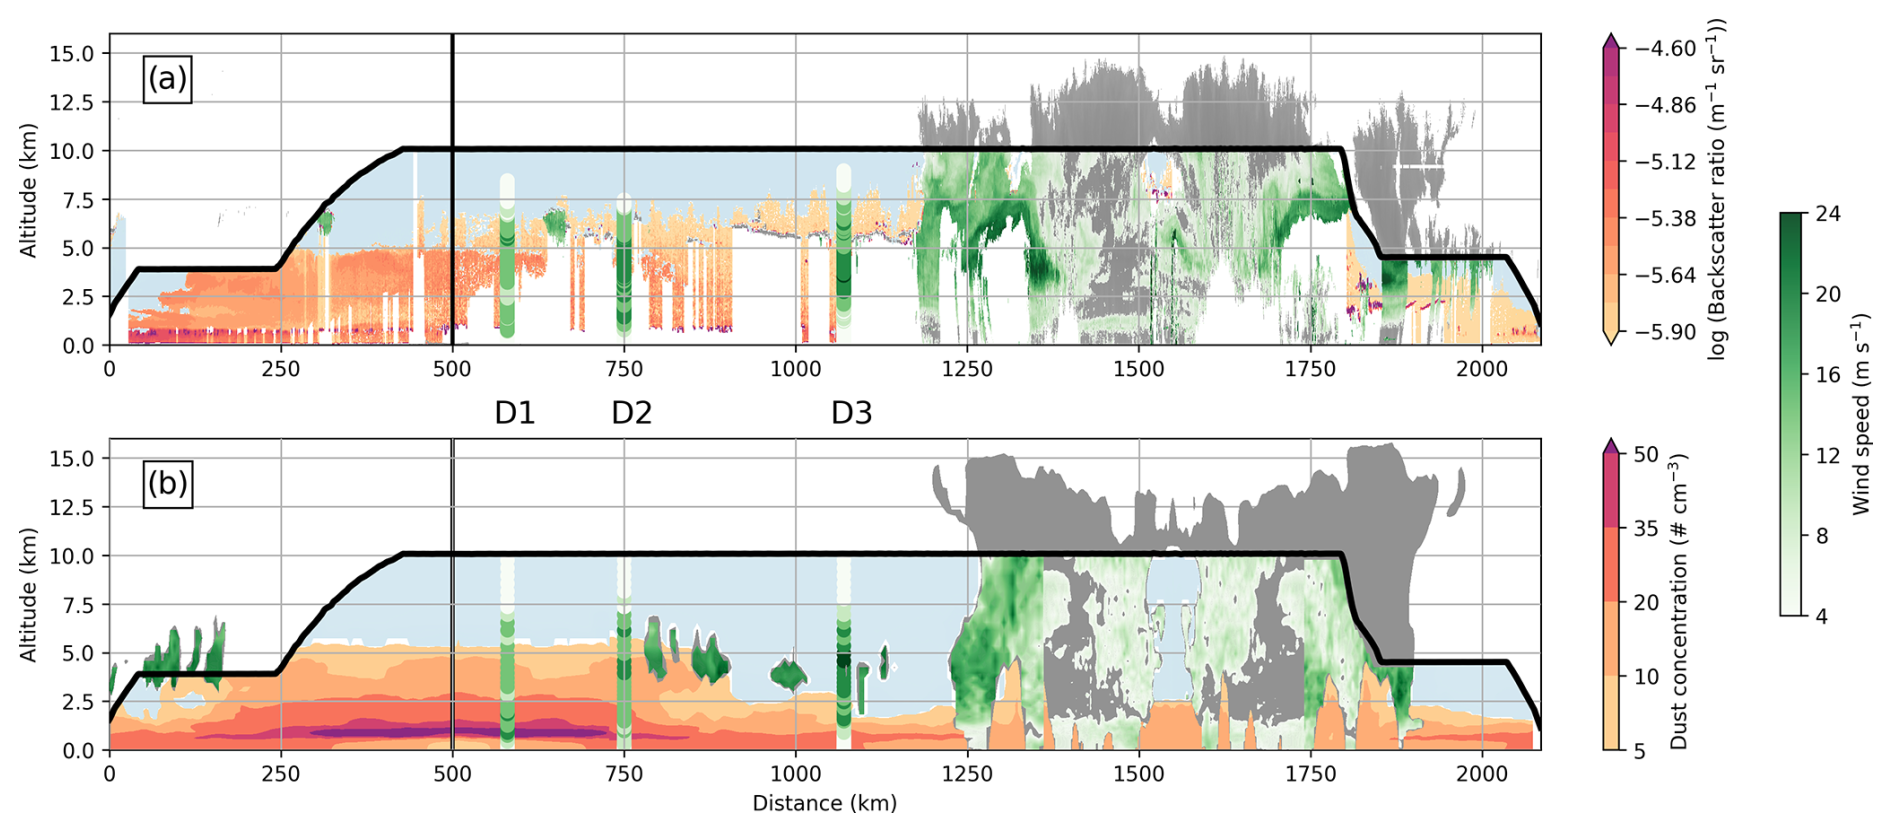
Figure 5(a) Vertical cross section of the logarithm of the backscatter coefficient at 532 nm from LNG (orange shading), reflectivity beyond −15 dBZ and supercooled water (gray), and Doppler wind speed above 4 m s−1 (green shading) from RASTA along the F7 track. Wind speeds from dropsondes D1, D2, and D3 appear in green. The clean sky from the RALI observation appears in blue. (b) Vertical cross section of simulated dust concentrations beyond 5 cm−3 (orange shading), reflectivity beyond −15 dBZ (gray), and wind speeds above 4 m s−1 in clouds and at the D1, D2, D3, and D4 locations along the F7 track. The F7 track appears in thick black lines and the u turn as a vertical line at 500 km. Observations were taken between 09:17 and 11:40 UTC and simulation outputs at 10:00, 11:00, and 12:00 UTC.
The vertical profile of the troposphere along the northern part of the F7 track is assessed further with aerosol data from LNG, along with cloud and wind speed measurements from RASTA and the dropsondes (Fig. 5a). Clouds in the MCS are indicated by RASTA reflectivities larger than −15 dBZ that extend up to a height of 14.3 km. Horizontal wind speed measurements from D3 and Doppler radar show values ranging from 0 to 4 m s−1 below 2 km height in the MCS and its surrounding environment. Within the first 90 km, two plumes of aerosols in the STWL are observed with clear air above. From 90 to 860 km, LNG backscatter coefficients at 532 nm reveal a vertical stratification of the aerosol loading that matches with the MBL, STWL, and SAL seen on D1 and D2. At 1050 km, the logarithm of the backscatter coefficient is below −5.5 , suggesting the absence of aerosols at SAL levels, consistent with the absence of a neutral layer observed in D3. From 2010 km to the end of the flight, aerosols are detected below 2 km height in the vicinity of the island of Sal. Simulated dust concentrations along the F7 track are compared to observed backscatter coefficients (Fig. 5b). From 0 to 90 km, the STWL dust concentration above 5 cm−3 extends up to 2 km height, with clear air above. The SAL dust plume appears at 90 km and vanishes after 860 km, which is consistent with the observations. The dust concentration in the MBL is always greater than 5 cm−3. The simulated STWL dust distribution shows a larger concentration of aerosols at an altitude of 1 km compared to the observational data. Simulated and sampled aerosols show that the SAL is 300 km from the MCS, while the STWL is close to the MCS due to low wind speeds below 2 km height. The simulated wind circulation is consistent with dropsonde and radar observations. Finally, the simulation shows the ubiquitous presence of aerosols below 2 km in altitude along the F7 track, notably in areas that have not been accessed or probed by CADDIWA aerosol instruments. It thus reveals the presence of aerosols beneath MCS Pierre Henri. The consistency between the observations and the simulation obtained along the F7 track gives us confidence in the realistic presence of dusty layers in the first 2 km inside the MCS.
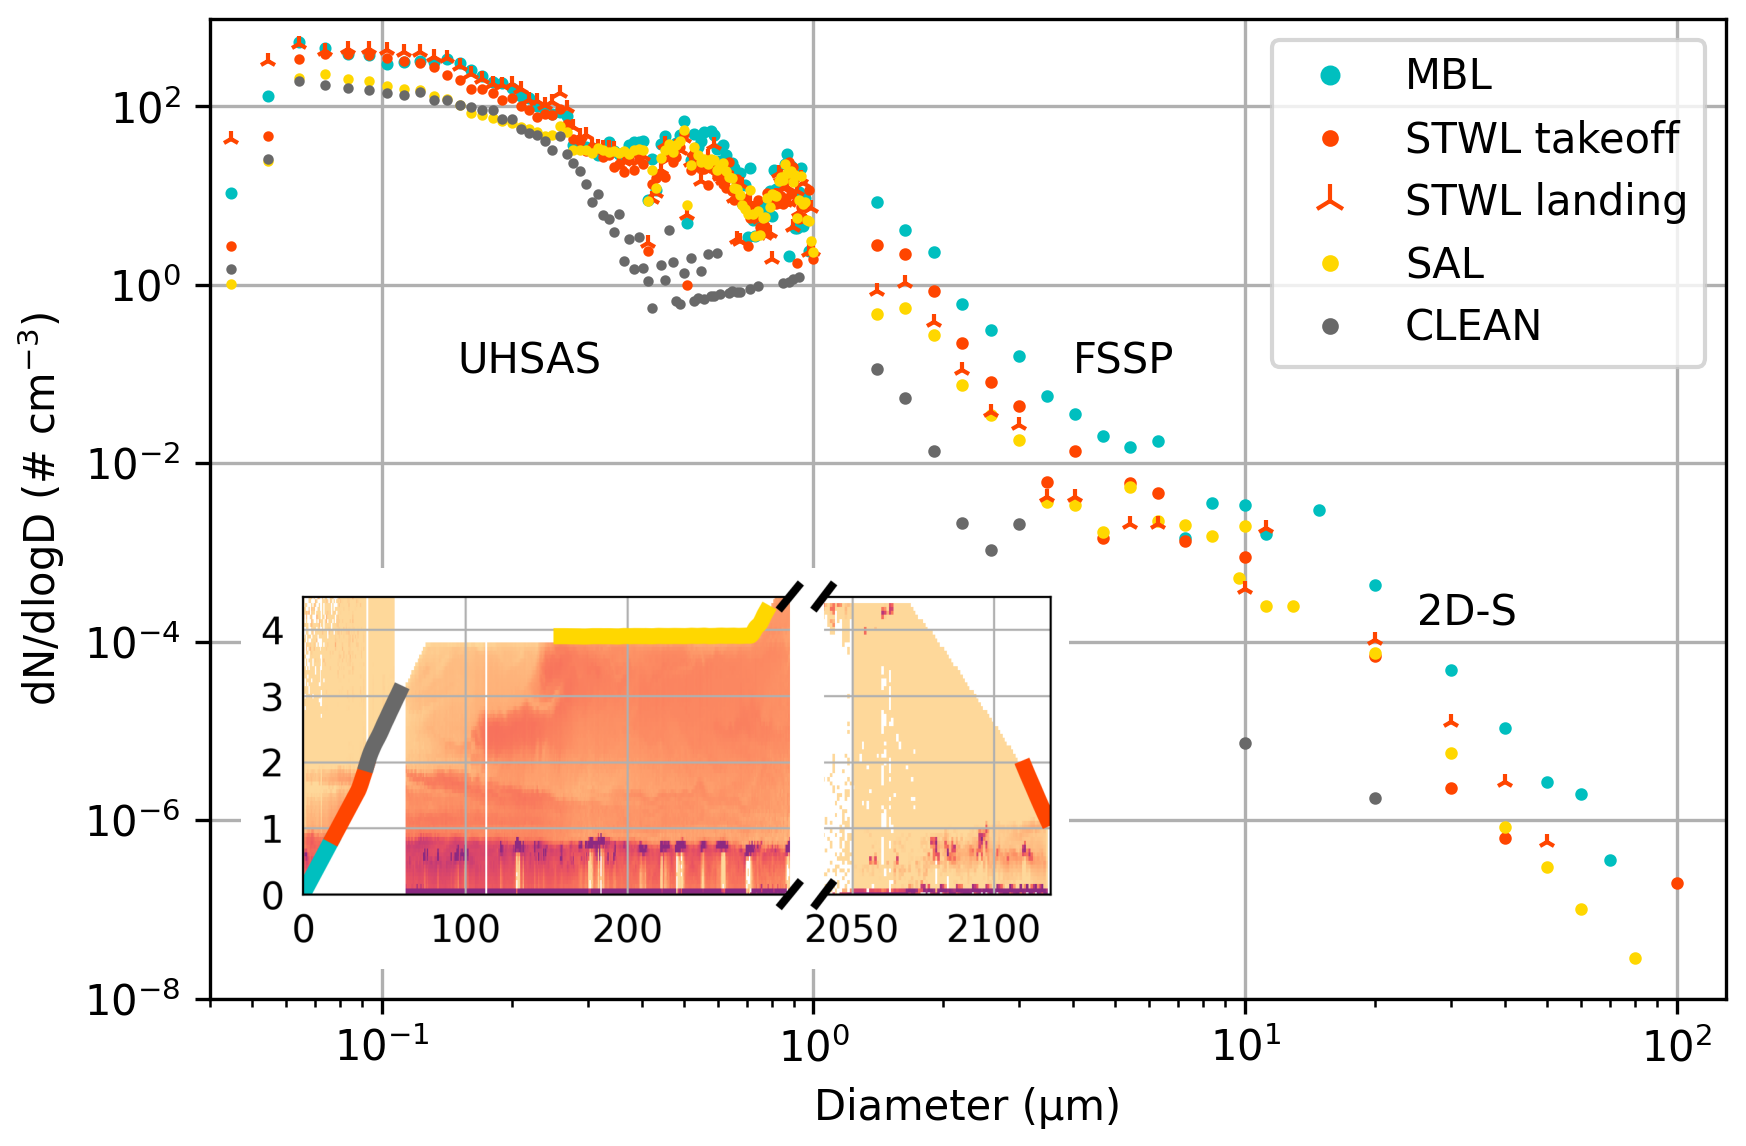
Figure 6Mean size distributions measured by the UHSAS-A, FSSP, and 2D-S microphysical probes over the five regions defined in the inset: MBL (blue), STWL (takeoff and landing, red), clear air (gray), and SAL (gold). In the insert, the red shading is the same as used in Fig. 5a.
Additional measurements of aerosol plumes are obtained from optical particle counters on board the aircraft. Aerosol size distributions are averaged in five regions (Fig. 6): the MBL (between 0 and 800 m height at 09:15 UTC), the STWL between 1 and 2 km height during takeoff (09:17 UTC) and landing (12:38 UTC), the SAL (at 4 km height from 09:17 to 09:35 UTC), and a clean-air layer (between 2 and 3.2 km height at 09:18 UTC). On the one hand, STWL aerosol concentrations at takeoff and landing have the same size distribution. These measurements, taken more than 3 h apart, suggest persistent properties of aerosols in the STWL. On the other hand, the size distribution of aerosols above 0.3 µm is similar in the MBL, STWL, and SAL compared with the clean-air layer. In particular, these layers show a similar size distribution for the two accumulation modes (0.1 to 1 µm) around 0.4 and 0.9 µm. Assuming that the SAL mainly contains dust aerosols consistent with the back trajectories shown in Fig. 4, this suggests the presence of dust in both the STWL and MBL. These three dust layers differ, however, in their size distributions for the fine (< 1 µm) and coarse (> 1 µm) aerosol modes. First, fine aerosol concentrations are relatively similar in the SAL and the clean layer, whereas they are 3 times higher in the MBL and STWL. Second, coarse aerosol concentrations (> 1 µm) are up to 10 times higher in the MBL than in the SAL and STWL and up to 100 times higher than in the clean-air layer (which is probably due to the presence of sea salt). Previous studies have documented the presence of dust within the MBL (Colarco et al., 2003) and the complexity of routes by which dusty air reaches a tropical cyclone near Cabo Verde (Schwendike et al., 2016), but none has provided the multi-instrumental observational evidence of multiple layers of dust in the vicinity of a MCS that is shown here.
The vertical distribution of aerosols in the MCS environment can be more accurately assessed through the synthesis of satellite data and CADDIWA observations. Within 100 km west of the MCS, CADDIWA measurements show that aerosol plumes are confined to altitudes below 2 km along the F7 track, and MODIS AOD values show moderate aerosol loading with values between 0.3 and 0.6 extending from 12 to 18° N (Fig. 2c). Even if the SAL does not interact directly with the MCS, it may be associated with a STWL that can affect the MCS. This highlights the need to characterize SAL edge properties, in particular the vertical distribution of aerosols. It also challenges the realism of the conceptual model of the summer SAL, often described as a dry, well-mixed layer above a relatively cool and moist trade wind layer that confines the SAL to altitudes above 1.2–1.8 km (Prospero and Carlson, 1972). Lastly, this analysis can provide insights to understand the unusual configuration observed during a major dust event where large dust loadings are observed above the MBL and below 2 km height (Marenco et al., 2018).
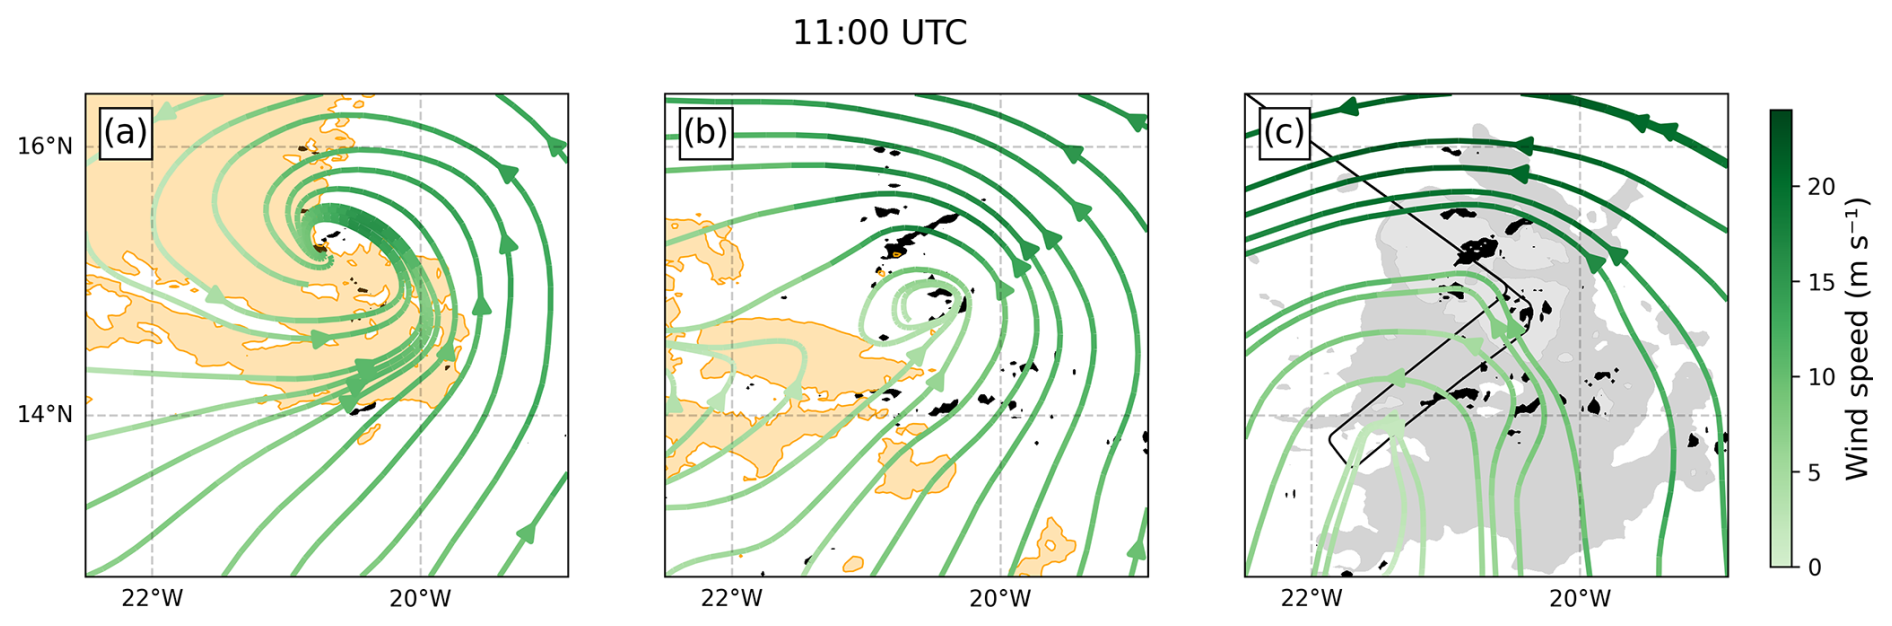
Figure 7Horizontal cross sections at 11:00 UTC in the simulation. Horizontal wind speeds (green streamlines), dust concentrations (beyond 15 cm−3 in orange shading), and vertical wind speeds (faster than 1 m s−1 in black shading) are shown for (a) 500, (b) 1500, and (c) 4000 m. In panel (c), dust concentration remains lower than 15 cm−3, and brightness temperatures between 210 and 230 K and below 210 K are shown in gray and light gray, respectively. The black line shows the F7 track of the F20 aircraft.
The impacts of convective inhibition factors on MCS Pierre Henri's life cycle are analyzed in the vicinity of its convective core. The method applied here consists in (i) defining a critical area, (ii) identifying inhibition factors in this area, and (iii) analyzing their variation and that of the MCS activity over time. The critical area is defined following the framework of Shu and Wu (2009), which identified a critical radius of 360 km centered on tropical cyclones within which SAL air intrusion inhibits cyclogenesis. As the MCS is smaller than tropical cyclones, we employed a radius of 150 km centered on the convective core associated with HCCs and referred to as D150. In the following, we show that the STWL, cold pools, and upper-tropospheric dry air inhibit the MCS development. Of these three convection inhibition factors, only the STWL and cold pools have an impact supported by air parcel theory. For that purpose, convective available potential energy (CAPE) and convective inhibition (CIN) are computed as vertically integrated measures of the buoyant energy for an air parcel ascending from 50 m above the surface. In particular, a CAPE of 1000 J kg−1 indicates a tropical atmosphere capable of sustaining convective activity (Rennó and Ingersoll, 1996), while a CIN of 1 J kg−1 is a barrier that can be overcome by an air parcel with a vertical wind speed of at least 1.4 m s−1 below the level of free convection (Reinares Martinez and Chaboureau, 2018).
4.1 STWL, cold pool, and upper-tropospheric dry air at four key times
Simulated horizontal wind circulation and dust concentrations above 15 cm−3 are analyzed in the vicinity of the convective cells of the MCS using horizontal cross sections at the MBL, STWL, and SAL levels at 11:00 UTC (Fig. 7). HCCs and DCCs associated with the MCS are also shown (Fig. 7c). At 500 m height, streamlines originating from the west and south converge within the northern part of the MCS, transporting dust-laden MBL air from the northwest and west (Fig. 7a). At 1.5 and 4 km heights, curved streamlines mark the AEW in which the MCS is embedded.
At 1.5 km height, streamlines with speeds below 10 m s−1 and dust concentrations above 15 cm−3 are present from the west up to the southwestern convective cells (Fig. 7b). An almost closed circulation pattern with an approximate diameter of 40 km is at the center of the convective cells, which prevents the STWL intrusion. However, a weak converging circulation to the southwest of the MCS facilitates the intrusion of the STWL into the nearby convective cells, as shown by the presence of dust concentrations above 15 cm−3. Maximal wind intensity values, close to 15 m s−1, were reached northeast of the MCS. At 4 km height, streamlines originate from the south and east (Fig. 7c). The wind intensity reaches its peak north of the MCS, with values surpassing 20 m s−1, and it remains steady westward. The dust concentration remains below 15 cm−3, suggesting no interaction between the SAL and the MCS at 4 km height.
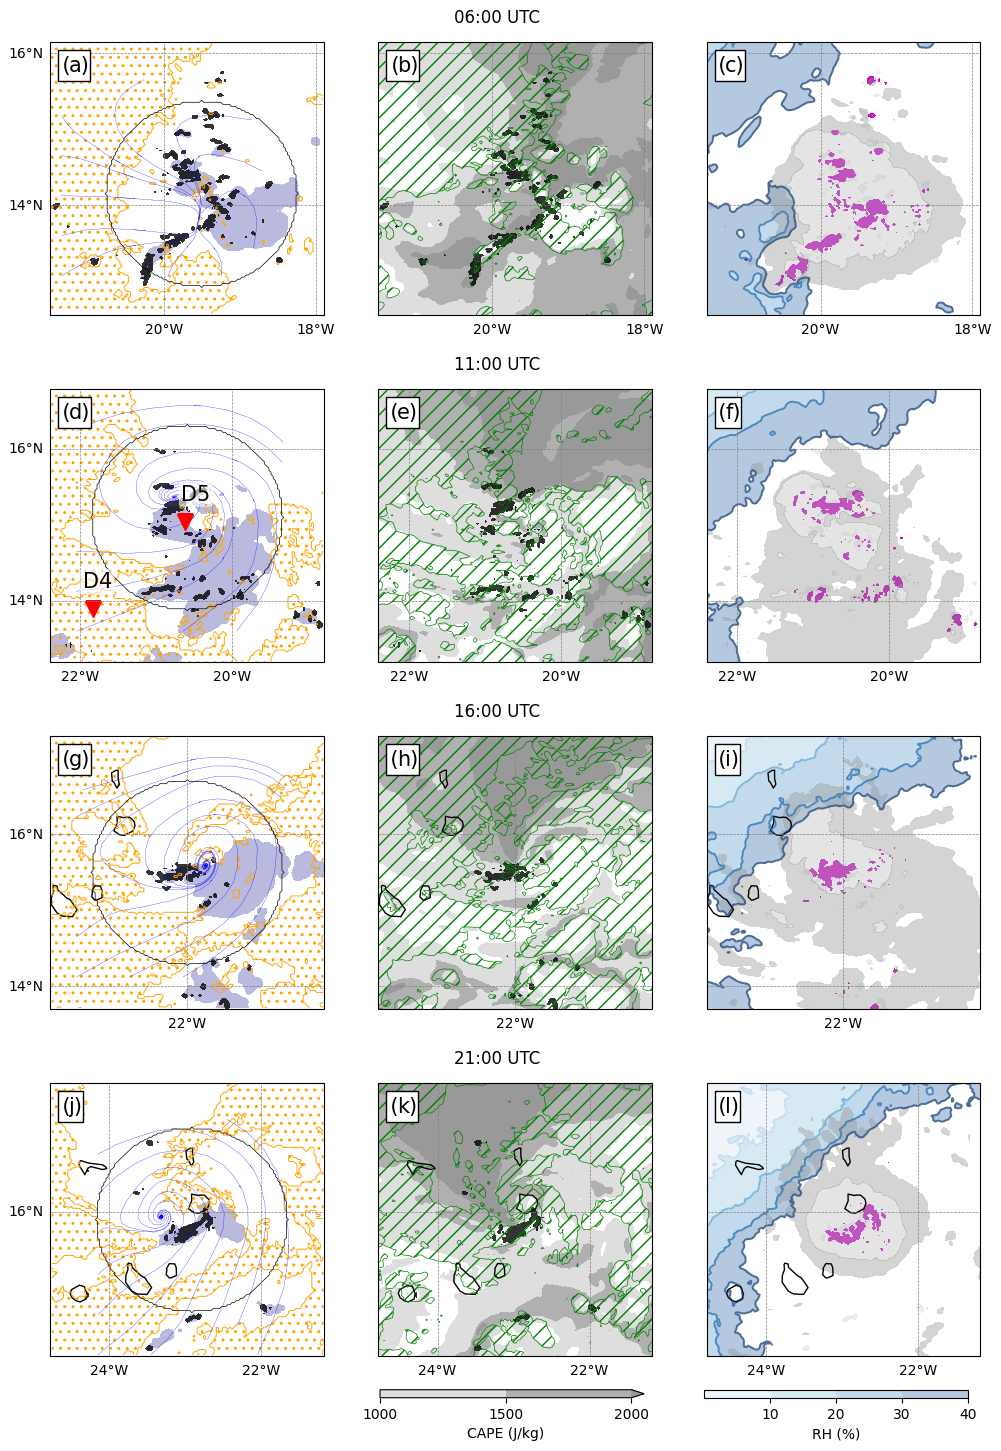
Figure 8Horizontal cross sections at (a–c) 06:00, (d–f) 11:00, (g–i) 16:00, and (j–l) 21:00 UTC in the simulation. The black shading shows the vertical wind speed at 4 km height beyond 1 m s−1 and the thin black lines the Cabo Verde coastlines. Left panels: STWL (dotted orange area when relative humidity is below 80 % and the dust concentration is beyond 10 cm−3, between 0.8 and 2 km height), cold pools (dark blue when buoyancy is below −0.03 m2 s−1 at 50 m height), streamlines at 500 m height (blue lines), and a radius of 150 km visually centered on the main convective cell at 4 km height (black circle). Middle panels: CAPE (gray shading) and CIN (green hatches when beyond 1 J kg−1). Right panels: 10.8 µm brightness temperature between 210 and 230 K (gray) and below 210 K (light gray), relative humidity averaged between 8 and 11 km height below 40 % (blue shading), and vertical wind speed at 9 km height beyond 1 m s−1 (purple shading). In panel (d), the red triangles show the D4 and D5 locations.
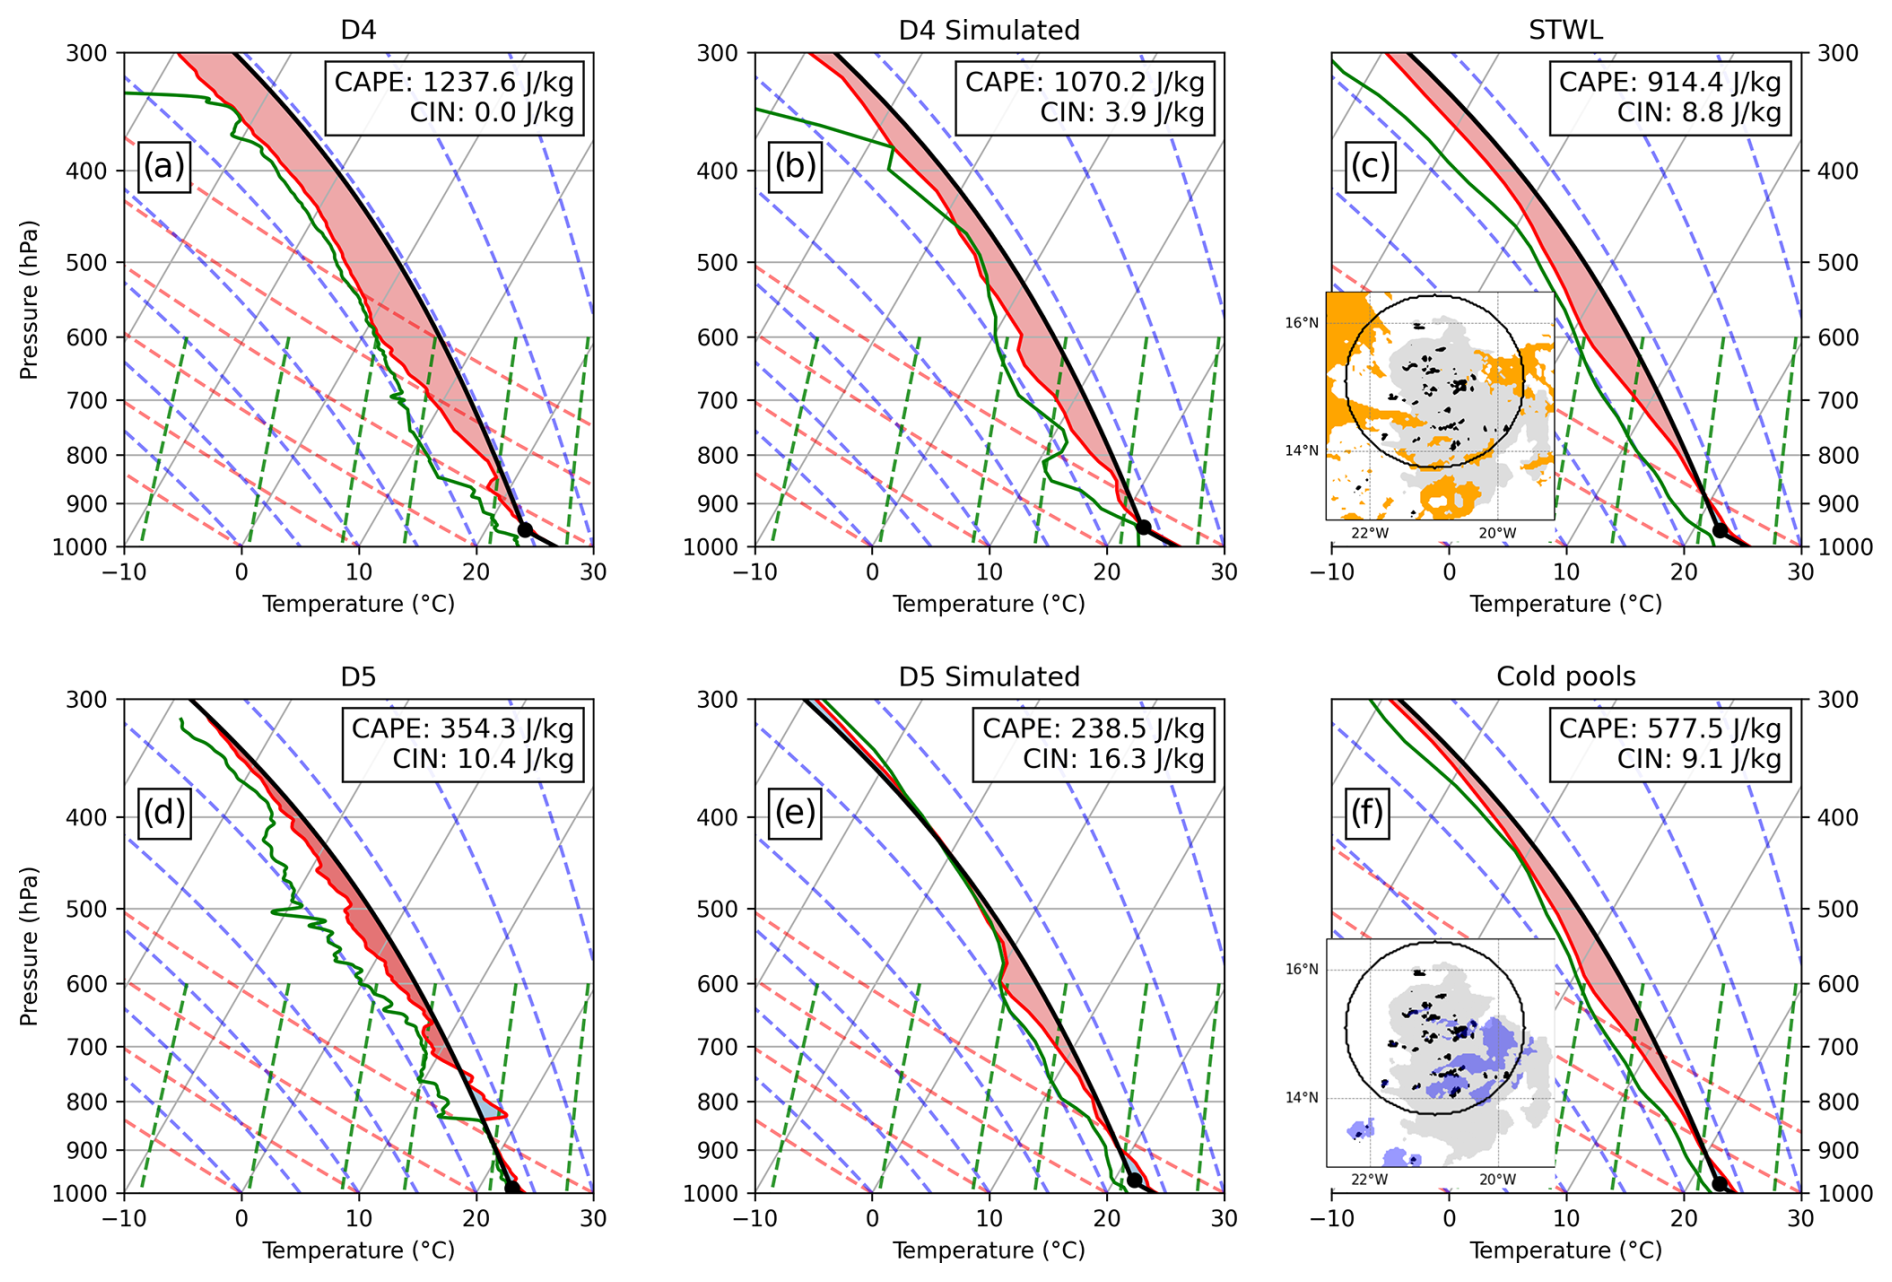
Figure 9Skew-T diagrams of (a) dropsonde D4 launched at 11:45 UTC, (b) the profile simulated at 12:00 UTC at D4's location, (c) the average profile simulated at 12:00 UTC at the STWL's location, (d) dropsonde D5 launched at 12:10 UTC, (e) the profile simulated at 12:00 UTC at D5's location, and (f) the average profile simulated at 12:00 UTC at the cold pool locations. The black, red, and green curves show the theoretical and sampled virtual air temperatures and the dew point temperature, respectively. The red shading shows the CAPE and the black dot the lifting condensation level. The insets of panels (c) and (f) show the STWL (orange) and cold pool (blue) locations, respectively, from which the average profiles are calculated, along with the vertical wind speeds at 5 km height beyond 1 m s−1 (black shading), reflectivity beyond −15 dBZ at 9 km height (gray shading), and a 150 km radius circle centered on the core of the MCS.
STWL intrusion into the MCS is investigated further with additional time and variable analyses. Here, we identify properties of three convective inhibition factors: the STWL, cold pools, and upper-tropospheric dry air. The STWL is identified by relative humidity below 80 % and dust concentration above 10 cm−3, between 0.8 and 2 km height. The 80 % threshold corresponds to the value measured by dropsonde D4 (Fig. 9a). The threshold of 10 cm−3 was chosen visually to best align with changes in both stability and relative humidity in the simulation domain. Its relatively high value means that the probability of overestimating STWL coverage is low. Cold pools are identified using a buoyancy threshold value following Tompkins (2001). They are defined as areas with buoyancy below the −0.03 m s−2 threshold, buoyancy being calculated as the fluctuation of the density potential temperature relative to the horizontal average at 50 m height in a 400 km2 square visually centered on the MCS. The choice of the buoyancy threshold does not affect the main conclusion of the study. Upper-tropospheric dry air is identified with a mean relative humidity of below 40 % between 8 and 11 km height. Overlaid horizontal cross sections from the simulation at 06:00, 11:00, 16:00, and 21:00 UTC over a 400 km2 region visually centered on the MCS are shown (Fig. 8). The STWL and cold pools are shown along with D150 and low-level circulation (Fig. 8a, d, g, and j). Factors favoring and inhibiting convective activity are assessed using CAPE and CIN (Fig. 8b, e, h, and k). The relative location of upper-tropospheric dry air, vertical wind speeds above 1 m s−1 at 9 km height, HCCs, and DCCs are analyzed (Fig. 8c, f, i, and l).
At 06:00 UTC, the STWL is to the west of the MCS, while cold pools are situated in the eastern part of D150 (Fig. 8a). Streamlines show linearly shaped convergence at low levels. CIN values above 1 J kg−1 appear in the northwestern quarter and above the cold pools, while CAPE is above 1500 J kg−1 in the eastern portion of the domain, except above the cold pools and west of the southern convective cells (Fig. 8b). Convective cells extend up to 9 km height and moisten the upper-tropospheric dry air layer to the southwest (Fig. 8c). At 11:00 UTC, patches of the STWL from the southwest reach the D150 area (Fig. 8d). The low-level circulation becomes cyclonic. The area covered by cold pools increases to the southwest of the MCS. It is partly collocated with CIN values above 1 J kg−1 (Fig. 8e). A stripe of CIN above 1 J kg−1 extends into D150 from the west, coinciding with CAPE values below 1000 J kg−1. CAPE above 2000 J kg−1 appears to the northeast and southeast of the MCS, while upper-tropospheric dry air appears northwest of the MCS (Fig. 8f). Convective cells at 4 km height are more scattered, while at 9 km height they weaken, except in the northern region of the MCS (Fig. 8e and f). At 16:00 UTC, convective cells aggregate to form a core where low-level air converges (Fig. 8g). A few convective cells appear to the south of the MCS, outside of D150. The STWL continues to intrude to the south and west of D150. The cold pool extension is reduced in D150, while the CIN zone above 1 J kg−1 and the CAPE zone below 1000 J kg−1 increase (Fig. 8h). CAPE above 2000 J kg−1 is restricted to the north of the MCS, and the upper-tropospheric relative humidity decreases to the northwest of the MCS (Fig. 8f). Convective activity at 9 km height is active at the location of the convective core. At 21:00 UTC, the convective core of the MCS is over Cabo Verde and surrounded by the STWL to the west, south, and north (Fig. 8j). The extent of the cold pools has diminished and is confined to the vicinity of the convective cells. The low-level cyclonic circulation aligns with the convective core at 4 km height. Patches of CIN exceeding 1 J kg−1 are located to the west and north of the convective core, as well as further northeast and east (Fig. 8k). CAPE above 2000 J kg−1 is restricted to the northwest of the MCS. In this sector, AEJ speed is at its highest, resulting in a wind shear above 20 m s−1 between 4 and 10 km height (not shown). This strong wind shear likely explains the almost complete absence of convective cells. The area of DCCs diminishes and the MCS overlaps with upper-tropospheric dry air to the northwest (Fig. 8l). Convective cells up to 9 km in height only persist in the convective core.
Distinct convective regimes are simulated, transitioning from organized intense convection with linearly shaped low-level convergence at 06:00 UTC to more scattered cells reducing to a primary cluster at the MCS leading edge during the second part of the day. Saharan air intrusions at STWL levels into the convective area of MCS Pierre Henri appear at all four times and increase throughout the day, mostly to the west and southwest of the cloud, suggesting that the weak southwesterly wind circulation identified in Fig. 7b is decisive for this process. The intrusion of Saharan air into the convective area caused a separation between the active cells to the north and those to the south, as evidenced by a tongue of low-CAPE and high-CIN values. This resulted in a reduction in the southern convective activity from 11:00 UTC and a dissipation of southern DCCs by 21:00 UTC. Convective cold pools are present southeast of the convective area until 16:00 UTC. Saharan air and cold pools both coincide with CIN values above 1 J kg−1, suggesting that they both contribute to the convective inhibition.
4.2 Contribution of the STWL and cold pools to convective inhibition as seen in skew-T diagrams
The contribution of the STWL and cold pools to convective inhibition at 12:00 UTC is further assessed with skew-T diagrams computed from the observed (Fig. 9a and d) and simulated (Fig. 9b and e) D4 and D5 profiles and from simulated STWL and cold pool atmospheric profiles averaged over D150 (Fig. 9c and f). Dropsonde D4 probes the atmosphere southwest of the MCS, a location where the STWL is simulated (Fig. 8d). The virtual temperature of 300 K at sea level gradually decreases until 870 hPa, where a relatively warm and dry layer is observed, as indicated by a decrease in dew point temperature and an increase in virtual temperature at this level (Fig. 9a). At 330 hPa, the dew point temperature decreases by 10 K, indicating the presence of an upper-tropospheric dry air layer. The warm and relatively dry air near the surface raises the LCL to 970 hPa, which creates favorable conditions for a large CAPE (1237 J kg−1) and a weak CIN (0 J kg−1). The profile is reproduced in the simulation but with a slightly lower surface virtual temperature, which reduces the CAPE to 1070 J kg−1 and increases the CIN to 3.9 J kg−1.
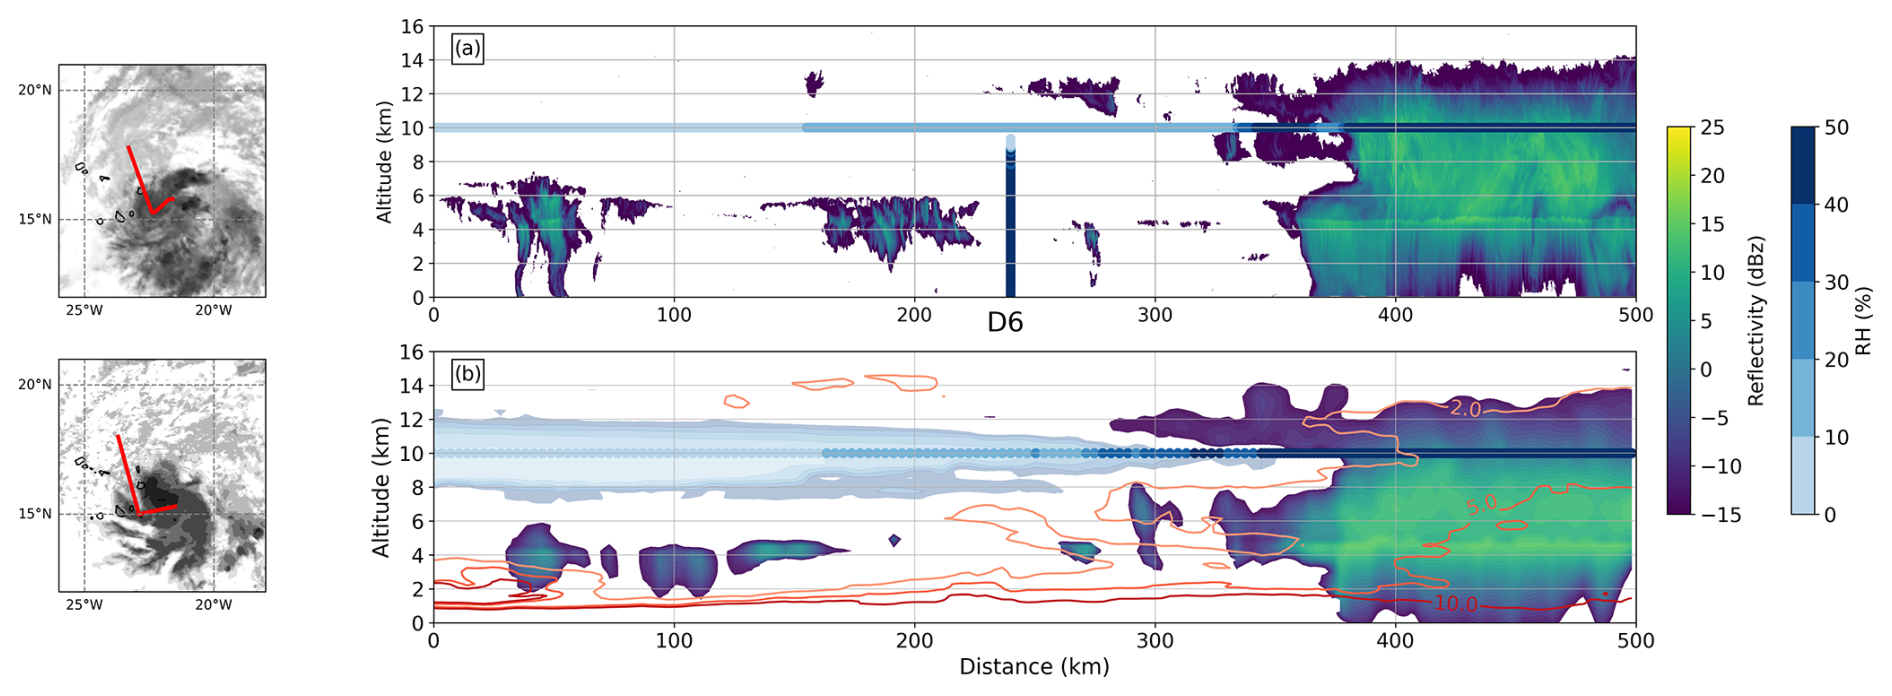
Figure 10Right panels: (a) vertical cross section of RASTA reflectivity values beyond −15 dBZ (color shading) and the relative humidity of the Falcon 20 probe (blue shading) along 500 km of the afternoon flight F8. The relative humidity from dropsonde D6 appears in blue shading at 240 km. (b) Vertical cross section of simulated reflectivity values beyond −15 dBZ (color shading), relative humidity at 10 km height (blue-shaded line), relative humidity (blue-shaded when below 50 %), and dust concentrations (red contours at 2, 5, and 10 cm−3). Observations are taken between 16:06 and 16:42 UTC and simulations at 16:00 UTC. Left panels: observed (top) and simulated (bottom) brightness temperatures at 10.8 µm at 16:00 UTC (gray shading), with the locations of the cross sections shown in the right panels (red lines).
Dropsonde D5 probes the atmosphere inside the MCS (Fig. 9d). The measured virtual temperature and dew point temperature at the surface are equal to 296.5 K, suggesting the presence of a cold pool. At 820 hPa, the dew point temperature decreases by 7 K and the temperature increases by 3 K, leading to a CIN above 10 J kg−1 and a CAPE around 350 J kg−1. The low surface virtual temperature creates favorable conditions for a large CIN and a weak CAPE, but the low altitude of the LCL induced by the surface moist environment partly balances this effect. The simulation reproduces the low surface virtual temperature and the low LCL, although the air at 820 hPa is not as dry and warm as observed (Fig. 9e). In any case, the simulated CAPE and CIN values are similar to those of D5.
Skew-T diagrams from simulated STWL and cold pool atmospheric profiles show their respective impacts on CAPE and CIN (Fig. 9c and f). At 12:00 UTC, the D150 area with CIN values greater than 1 J kg−1 is covered by 20 % STWL and 18 % cold pools. Over these regions, the mean CAPE values are 914 J kg−1 for the STWL and 577 J kg−1 for cold pools, while the mean CIN values are 8.8 and 9.1 J kg−1, respectively. Most of the STWL is located to the west and south of D150, while the cold pools are mainly within the D150 area. The CAPE for the cold pools is relatively low compared to the CAPE for the STWL due to the lower virtual temperature of the moist adiabat used to calculate the CAPE.
Our results provide observational evidence of the distinct mechanisms between the STWL and cold pools, leading to a CIN above 1 J kg−1. On the one hand, the CIN caused by the STWL is a consequence of (i) the rise in altitude of the LCL due to drier air in the STWL and below as well as (ii) the increased virtual temperature at low tropospheric levels. This finding is consistent with the Wong and Dessler (2005) outcomes based on reanalysis data. On the other hand, the CIN caused by cold pools is a consequence of the low temperature and high humidity above the surface, which lower the LCL. Similarities between observations and the simulation give high confidence in our analysis of the impact of the STWL and cold pools on convection.
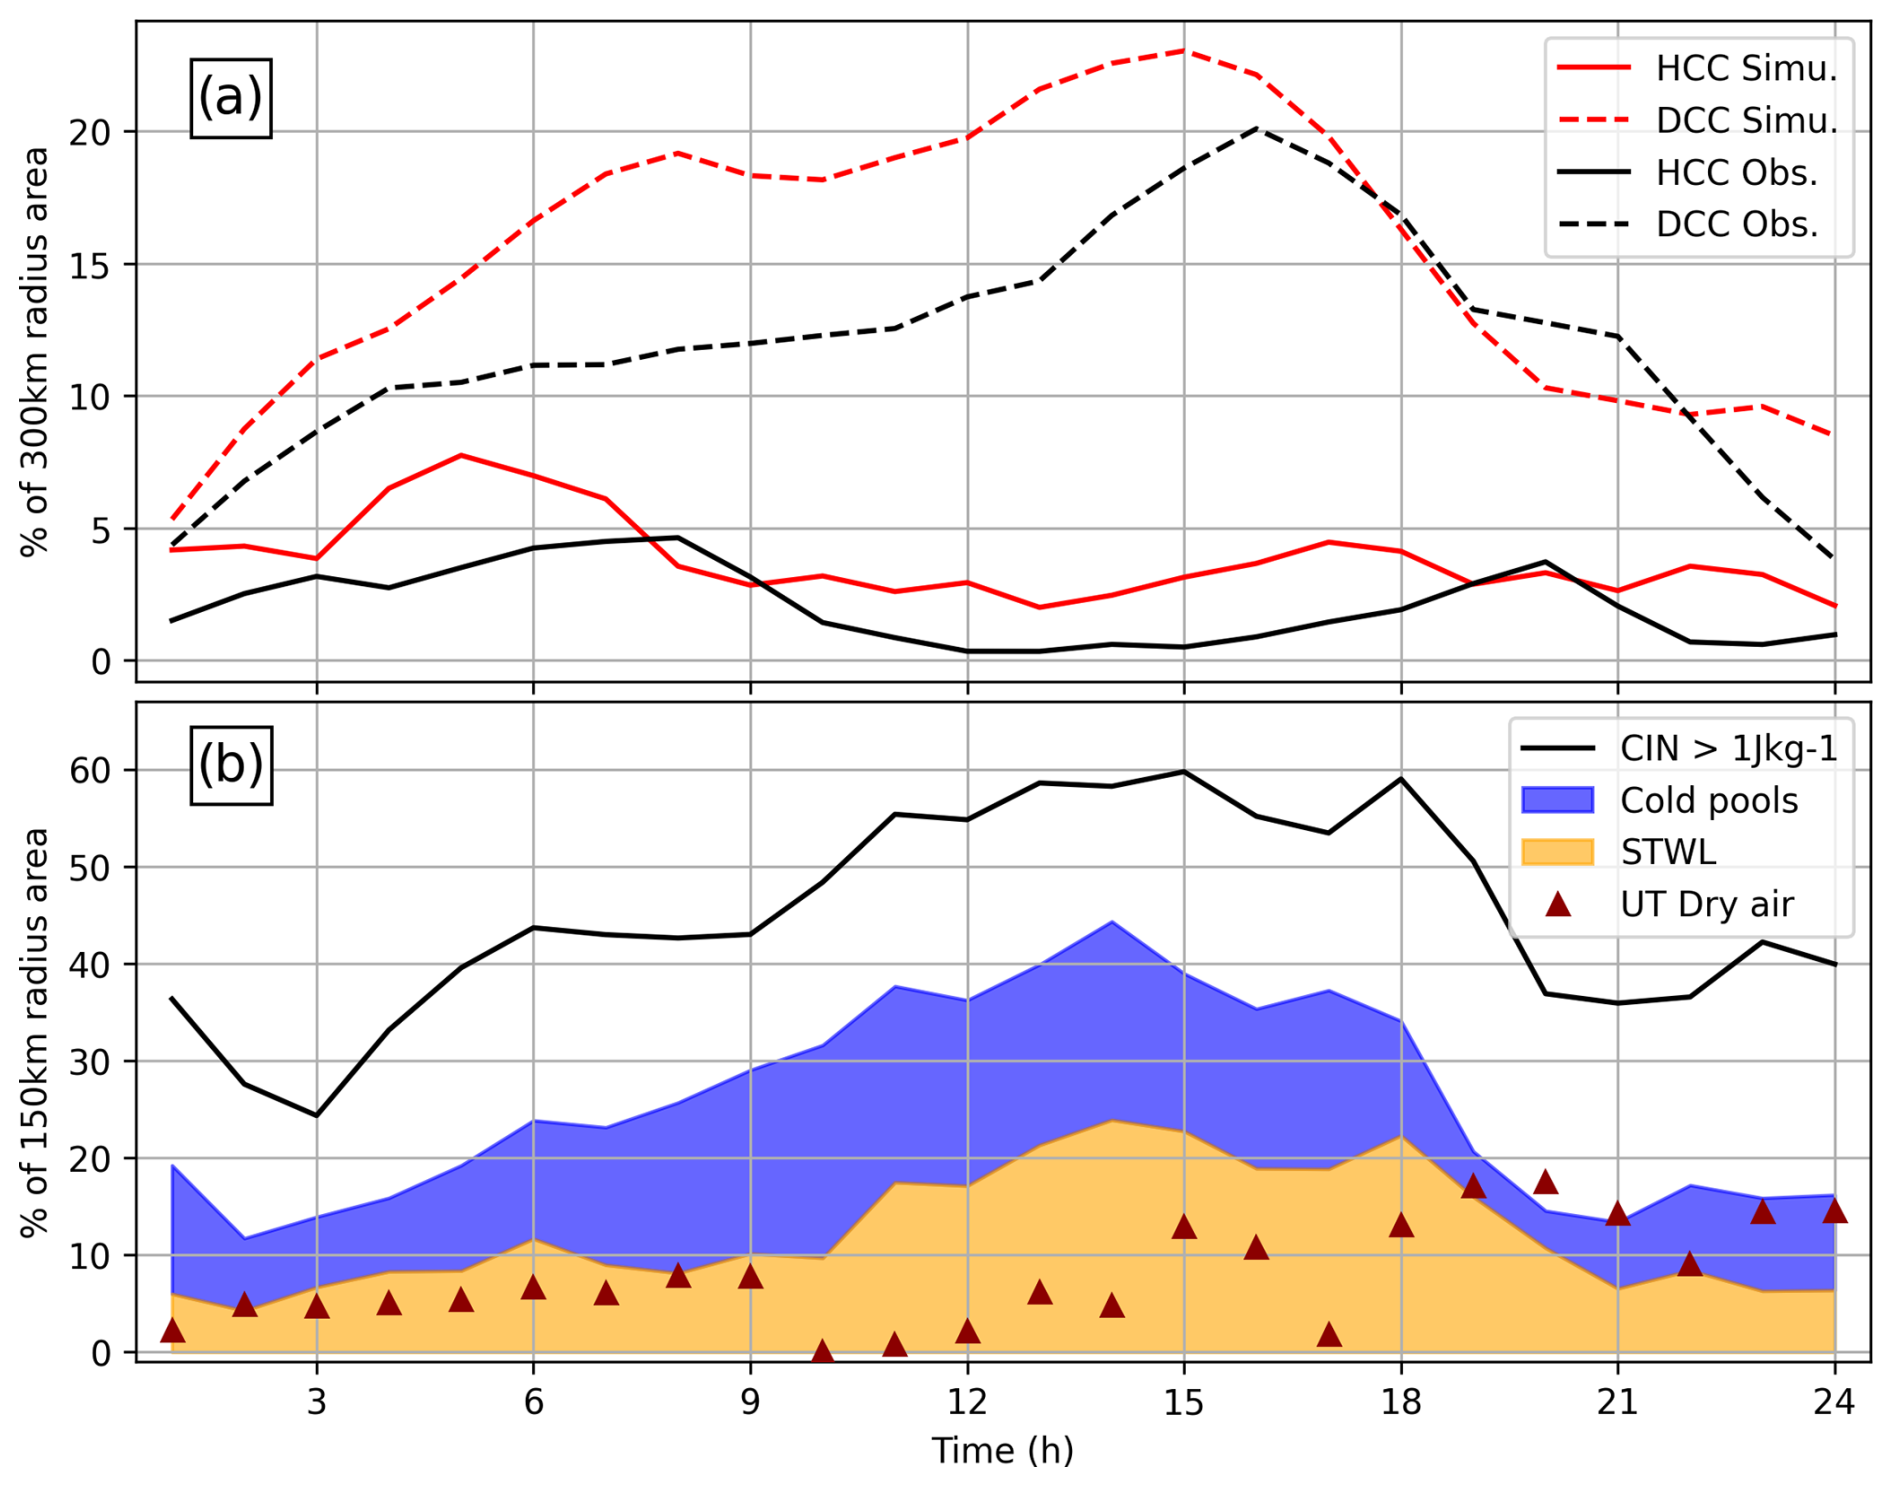
Figure 11Time evolution between 00:00 UTC on 11 September and 00:00 UTC on 12 September of the surface area percentage of (a) simulated (red) and observed (black) cloud brightness temperatures between 210 and 230 K (dashed lines) and below 210 K (solid lines) within the D300 disk as well as (b) CIN above 1 J kg−1 (black line), CIN above 1 J kg−1 attributed to the STWL (orange shading), CIN above 1 J kg−1 attributed to cold pools (blue shading), and relative humidity averaged between 8 and 11 km height below 40 % (dark-red triangles) within the D150 disk.
4.3 Upper-tropospheric dry air impact on MCS Pierre Henri's vertical structure
A layer of dry and stable air was observed between 7 and 10 km height above the SAL along F7 (Fig. 3a, c, f, and h) and in the anvil of the MCS along F8 (Fig. 10a) by the Falcon 20 relative humidity probe and dropsondes. Reflectivity and relative humidity sampled along 500 km of F8 are shown and compared to a similar 500 km section in the simulation (Fig. 10a and b). The simulated vertical section is derived along a trajectory that aligns closely with that of the aircraft, with adjustments to account for the positional discrepancies between the observed MCS and the simulated one. Reflectivity values above −15 dBZ are observed up to 7 km height in the first 340 km and up to 14 km height in the MCS from 350 to 500 km. Relative humidity values at 10 km height are below 10 % in the first 155 km and below 20 % up to 325 km. Relative humidity measured by dropsonde D6 at 240 km shows a steep vertical gradient of 50 % around 8.5 km height. Observed reflectivity values are below −15 dBZ between 350 and 385 km height from 6 to 11 km height (Fig. 10a). This feature is reproduced in the simulation with no reflectivity above −15 dBZ from 300 to 385 km, between 7.5 and 11 km. These low-reflectivity values are at the same altitude as the upper-tropospheric dry air in both observations and simulations, suggesting an impact of this air on the MCS vertical extent. The observed tongue of low-reflectivity values in the middle troposphere is longer in F8 (35 km) than in F7 (15 km), in accordance with the increased area of upper-tropospheric dry air with time in D150, as shown at 16:00 and 21:00 UTC (Fig. 8i and l). Note that simulated dust concentrations above 2 and 5 cm−3 reach altitudes of 8 and 14 km at 480 km at the location of a convective cell (Fig. 10b), showing that updrafts act as pumps lifting dust from the lower levels to the upper troposphere.
4.4 Summary
The evolution of MCS Pierre Henri from 01:00 UTC on 11 September to 00:00 UTC on 12 September can be divided into three phases based on the coverage of HCCs, DCCs, CIN above 1 J kg−1, and upper-tropospheric dry air (Fig. 11). The areas covered by HCCs and DCCs are calculated over D300, a disk with a 300 km radius centered on the DCCs, to take account of the large cloud extent of the MCS (Fig. 11a). The areas covered by CIN above 1 J kg−1 and upper-tropospheric dry air (with relative humidity below 40 % averaged between 8 and 11 km height) are calculated over D150, close to the core of the MCS. Areas of CIN above 1 J kg−1 covered by the STWL and cold pools are assigned to the two terms. Note that only 1.6 % of CIN above 1 J kg−1 is covered by both the STWL and cold pools.
The intense phase occurs from 00:00 to 07:00 UTC. The MCS is the most intense one, as shown by the fluctuations of HCCs of up to 7 % in the observation and almost 5 % in the simulation. This results in a strong increase in the areas covered by DCCs and CIN above 1 J kg−1 due to cold pools. At the same time, the coverage of CIN above 1 J kg−1 due to the STWL and that of upper-tropospheric dry air gradually increases from relatively low values. The mature phase takes place between 07:00 and 15:00 UTC. Convective activity is reduced, as shown by the decline in HCCs, while DCCs continue to increase. This indicates a lag between the convective peak and the extent of the cloud shield. CIN above 1 J kg−1 increases by up to 60 %. This is due firstly to the expansion of cold pools, with a peak reaching half the CIN coverage at around 09:00 UTC. Then, areas of CIN above 1 J kg−1 due to the STWL increase significantly until they contribute up to 40 % of the total coverage at 14:00 UTC. Upper-tropospheric dry air coverage varies with time, by up to around 10 % between 13:00 and 16:00 UTC. The decaying phase runs from 15:00 to 00:00 UTC. It is marked by a decrease in HCC activity, followed by a peak in coverage of CIN above 1 J kg−1 at 18:00 UTC, with 39 % attributed to the STWL and 20 % to cold pools. The DCC coverage drops from 20 % to less than 7 %, showing dissipation of the MCS, while the upper-tropospheric dry air coverage becomes significant, reaching 18 %.
The contribution of the Saharan air layer (SAL) and other air masses and processes to the failed cyclogenesis of MCS Pierre Henri over Cabo Verde is addressed using data from the CADDIWA campaign and a convection-permitting simulation performed with the Meso-NH mesoscale model. The joint analysis of SAL characteristics in the observations and the simulation aims to improve understanding of SAL dust effects on the MCS. On 11 September 2021, the MCS formed over the Atlantic at around 00:00 UTC, underwent an intense phase until 07:00 UTC, took a northwesterly track toward the SAL during its mature phase, declined from 15:00 UTC, and finally dissipated on 12 September. The simulation of the MCS and its environment is shown to be realistic when compared with observations from airborne measurements from the two CADDIWA flights on 11 September and with satellite imagery.
The cloud shield and updrafts of MCS Pierre Henri, the SAL, and the three factors leading to the inhibition of the MCS documented in this study are illustrated in a 3D schematic (Fig. 12). This summarizes the key inhibiting roles of the STWL, cold pools, and upper-tropospheric dry air. It is worth noting that the MCS is protected from the intrusion of SAL air. Located between 2 and 4.8 km height, the SAL is advected away from the MCS by the AEW in which the MCS is embedded. The AEW circulation acts like a marsupial pouch, protecting the MCS from SAL intrusion.
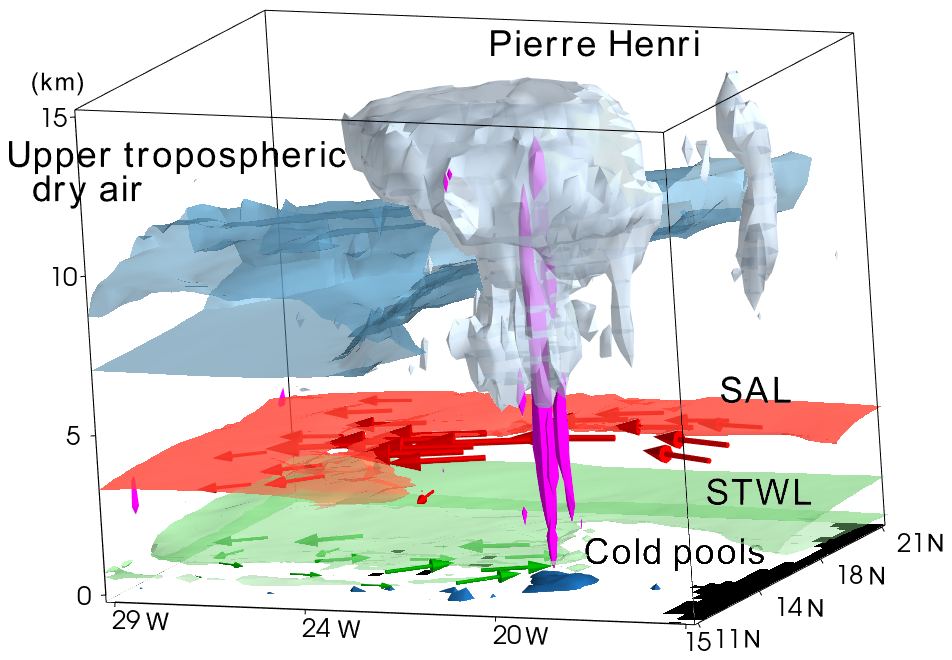
Figure 12Three-dimensional schematic of MCS Pierre Henri and its environment illustrated with simulation outputs at 11:00 UTC. The icy cloud shield of the MCS appears in gray, updrafts in magenta, cold pools in dark blue, upper-tropospheric dry air in light blue, and the topography in black. For the sake of clarity, STWL and SAL dust contents are shown at a single level, here at 1 and 3.5 km, by the green and red shadings, respectively, while their wind speeds are indicated with the green and red arrows.
The STWL is a warm, dry layer between 0.8 and 2 km containing aerosols with size distributions comparable to those of the SAL. It is observed using lidar, dropsondes, and microphysical probes at trade wind levels, which justifies the name “STWL”. It differs from the transition layer between the MBL and the SAL, often referred to as a moist, clean trade wind inversion layer. The STWL is sampled at the southern edges of the SAL and beyond. Karyampudi et al. (1999) documented a connection between the SAL and the MBL south of a dust plume near Cabo Verde (their Fig. 22). They hypothesized that this residual aerosol layer could result from dry deposition, turbulent mixing induced by vertical wind shear, and upward transport of sea salt aerosol by cumulus clouds. The high resolution of CADDIWA observations provides new insights into the vertical structure of SAL boundaries, challenging the conceptual model of the summer SAL and raising questions regarding dust transport and mixing over the Atlantic. In particular, the occurrence rate of STWL events is a topic that warrants further exploration.
The STWL is the primary inhibiting factor for MCS Pierre Henri. Its intrusion from the southwest into the convective core of the MCS is facilitated by a weak low-level convergent circulation due to the absence of a marsupial pouch at this level. The combination of dry low-level air elevating the lifting condensation level and warm air at STWL levels favors CIN by raising the level of free convection. The progressive intrusion of the STWL into the MCS during its intense and mature phases results in an increase in the areas of large CIN values within a radius of 150 km centered on the MCS convective core. The 40 % peak in CIN areas attributed to the STWL coincides with the overall decrease in the convective activity of MCS Pierre Henri and more specifically its dissipation in its southern part.
Cold pools are a second convective inhibition factor observed during the CADDIWA field campaign. Thanks to downdrafts bringing cold air into the boundary layer, cold pools enhance atmospheric stability and raise the level of free convection, thereby strengthening the CIN and reducing the CAPE. The area of the cold pools is maximal after the intense phase of the MCS, with almost half of the simulated CIN attributed to cold pools within a radius of 150 km centered on the MCS convective core. The surface extent and prolonged duration of the cold pools may be due to low surface heat fluxes, which maintain the negative temperature perturbation. The identification of the STWL and cold pools allows us to attribute around two-thirds of the CIN to these two features. The portion of CIN that remains un-attributed may, in part, result from limitations in the detection methods used to identify the STWL and cold pools. A detailed characterization of the STWL and cold pools by future campaigns would help us to better assess their role in the fates of the MCSs.
Upper-tropospheric dry air is the third inhibiting factor for MCS Pierre Henri. It is identified by a relative humidity of less than 15 % between 7 and 11 km height along the northwestern edge of the MCS. The intrusion of dry air into the MCS progressively hinders the expansion of its cloud anvil and the vertical development of its updrafts. CADDIWA observations from the afternoon flight show that the intrusion of dry air extends as far as 35 km into the MCS. At the mesoscale, upper-tropospheric dry air coverage increases within a 150 km radius from the MCS convective core over the course of the day, reaching 18 % during the dissipation phase. It is associated with low vertical wind shear, suggesting the absence of an upper-level trough, contrary to previous studies (e.g., Arnault and Roux, 2011). These results underline the need for further research into the impact of upper-tropospheric dry air on cyclogenesis. Perspectives include microphysical processes, such as the sublimation of the ice cloud anvil, mixing processes within the cloud anvil, or the inhibition of convective activity caused by the entrainment of dry air.
The realistic Meso-NH simulation of three convective inhibition processes, supported by CADDIWA observations, provides a new framework for the analysis of cyclogenesis in the Cabo Verde region. Although the size distribution of dust aerosols is simplified and their radiative impacts omitted, the simulation effectively captures the key inhibition processes that led to the dissipation of MCS Pierre Henri. Future research using the Meso-NH model will take advantage of its LIMA two-moment microphysical scheme to analyze the sensitivity of convective processes and cloud properties to mineral dust parameterizations.
This study examines the failed cyclogenesis of a single MCS. As such, it remains uncertain how representative our findings are of other storms forming in the Cabo Verde region. In this case, warm and dry Saharan air intruded to the southwest of the MCS – an area previously identified as unfavorable for cyclone intensification in the presence of SAL dry air (Shu and Wu, 2009). However, in that study, SAL dry air was characterized using relative humidity between 600 and 700 hPa and not within the STWL. It would therefore be valuable to refine this type of systematic analysis by focusing specifically on the STWL. Moreover, Shu and Wu (2009) investigated the weakening of named tropical cyclones. In contrast, there is as yet no comprehensive study of failed cyclogenesis events, such as the one presented here for a single case. Such a study is needed to better understand the wider implications of our results, particularly with regard to the influence of the STWL. A crucial aspect of such a study would be to document the vertical distribution of dust at a high resolution. Rather than relying solely on lidar data obtained during a field campaign, systematic monitoring of the STWL could be carried out using ground-based or space-based lidar systems. Combined with back-trajectory analysis, aerosol observations could potentially be identified as dust, depending on the aerosol's origin. In addition, it is essential to monitor the dryness of the STWL with specific measurements, as this is an essential characteristic of this layer.
The dropsonde data are available at https://doi.org/10.25326/375 (Flamant, 2022b), the F20 thermodynamic and dynamic core data at https://doi.org/10.25326/374 (Flamant, 2022a), the 2D-S probe data at https://doi.org/10.25326/651 (Coutris et al., 2022a), the UHSAS-A probe data at https://doi.org/10.25326/652 (Coutris et al., 2022c), and the FSSP probe data at https://doi.org/10.25326/653 (Coutris et al., 2022b). The RALI data were downloaded from https://rali.aeris-data.fr/ (RALI project, 2023), specifically the RALI TC (target classification) from https://rali.aeris-data.fr/catalogue/?uuid=1f4cb552-17f4-45e9-8ef7-fa980f7ff0f2 (Delanoë, 2025a), the RASTA wind from https://rali.aeris-data.fr/catalogue/?uuid=39b9e681-1658-4083-8b74-27b6292fbbb8 (Delanoë, 2025b), the MODIS data from the Giovanni web portal (http://disc.sci.gsfc.nasa.gov/giovanni/, NASA, 2023), and the MSG data from ICARE (https://www.icare.univ-lille.fr/, AERIS/ICARE Data and Services Center, 2023).
GF performed the simulation and analyses under the supervision of JPC and TD. JD provided the RALI observations. PC provided the microphysical observations. All of the authors prepared the paper.
The contact author has declared that none of the authors has any competing interests.
Publisher's note: Copernicus Publications remains neutral with regard to jurisdictional claims made in the text, published maps, institutional affiliations, or any other geographical representation in this paper. While Copernicus Publications makes every effort to include appropriate place names, the final responsibility lies with the authors.
This article is part of the special issue “The Joint Aeolus Tropical Atlantic Campaign (JATAC) (AMT/ACP inter-journal SI)”. It is not associated with a conference.
This work was performed using high-performance-computing resources from GENCI at TGCC (grant no. 2023-A0140111437). CADDIWA data were collected using instruments from the French Airborne Measurement Platform, a national instrumental facility partially funded by CNRS/INSU and CNES and operated by OPGC.
This paper was edited by Raphaela Vogel and reviewed by two anonymous referees.
AERIS/ICARE Data and Services Center: The Atmospheric component of the French Data Terra data infrastructure, https://www.icare.univ-lille.fr/ (last access: September 2023), 2023. a
Arnault, J. and Roux, F.: Characteristics of African easterly waves associated with tropical cyclogenesis in the Cape Verde Islands region in July–August–September of 2004–2008, Atmos. Res., 100, 61–82, https://doi.org/10.1016/j.atmosres.2010.12.028, 2011. a, b, c
Braun, S. A.: Reevaluating the role of the Saharan air layer in Atlantic tropical cyclogenesis and evolution, Mon. Weather Rev., 138, 2007–2037, https://doi.org/10.1175/2009MWR3135.1, 2010. a, b
Burpee, R. W.: The origin and structure of easterly waves in the lower troposphere of north Africa, J. Atmos. Sci., 29, 77–90, https://doi.org/10.1175/1520-0469(1972)029<0077:TOASOE>2.0.CO;2, 1972. a
Carlson, T. N. and Prospero, J. M.: Radiative heating rates for Saharan dust, J. Appl. Meteorol., 11, 283–288, https://doi.org/10.1175/1520-0469(1980)037<0193:RHRFSD>2.0.CO;2, 1972. a
Chaboureau, J.-P., Söhne, N., Pinty, J.-P., Meirold-Mautner, I., Defer, E., Prigent, C., Pardo, J.-R., Mech, M., and Crewell, S.: A midlatitude cloud database validated with satellite observations, J. Appl. Meteorol. Clim., 47, 1337–1353, https://doi.org/10.1175/2007JAMC1731.1, 2008. a
Charba, J.: Application of gravity current model to analysis of squall-line gust front, Mon. Weather Rev., 102, 140–156, https://doi.org/10.1175/1520-0493(1974)102<0140:AOGCMT>2.0.CO;2, 1974. a
Colarco, P. R., Toon, O. B., Reid, J. S., Livingston, J. M., Russell, P. B., Redemann, J., Schmid, B., Maring, H. B., Savoie, D., Welton, E. J., Campbell, J. R., Holben, B. N., and Levy, R.: Saharan dust transport to the Caribbean during PRIDE: 2. Transport, vertical profiles, and deposition in simulations of in situ and remote sensing observations, J. Geophys. Res.-Atmos., 108, 8590, https://doi.org/10.1029/2002JD002659, 2003. a
Coutris, P., Febvre, G., and Flamant, C.: CADDIWA-2021: Cloud in situ 1Hz data from 2D-S probe, Aeris [data set], https://doi.org/10.25326/651, 2022a. a
Coutris, P., Febvre, G., and Flamant, C.: CADDIWA-2021: Aerosol-cloud in-situ 1Hz data from FSSP probe, Aeris [data set], https://doi.org/10.25326/653, 2022b. a
Coutris, P., Febvre, G., and Flamant, C.: CADDIWA-2021: Aerosol in situ 1 Hz data from UHSAS probe, Aeris [data set], https://doi.org/10.25326/652, 2022c. a
Cuxart, J., Bougeault, P., and Redelsperger, J.-L.: A turbulence scheme allowing for mesoscale and large-eddy simulations, Q. J. Roy. Meteor. Soc., 126, 1–30, https://doi.org/10.1002/qj.49712656202, 2000. a
Delanoë, J.: CADDIWA-2021_RALI_radar_lidar_TC, RALI TC [data set], https://rali.aeris-data.fr/catalogue/?uuid=1f4cb552-17f4-45e9-8ef7-fa980f7ff0f2, last access: 10 July 2025a. a
Delanoë, J.: CADDIWA-2021_RASTA_WIND_L2, RALI TC [data set], https://rali.aeris-data.fr/catalogue/?uuid=39b9e681-1658-4083-8b74-27b6292fbbb8, last access: 10 July 2025b. a
Delanoë, J., Protat, A., Jourdan, O., Pelon, J., M. Papazzoni, M., Dupuy, R., Gayet, J., and Jouan, C.: Comparison of airborne in situ, airborne radar–lidar, and spaceborne radar–lidar retrievals of polar ice cloud properties sampled during the POLARCAT campaign, J. Atmos. Ocean. Tech., 30, 57–73, https://doi.org/10.1175/JTECH-D-11-00200.1, 2013. a
Dunion, J. P. and Velden, C. S.: The impact of the Saharan air layer on Atlantic tropical cyclone activity, B. Am. Meteorol. Soc., 85, 353–365, https://doi.org/10.1175/BAMS-85-3-353, 2004. a, b
Dunkerton, T. J., Montgomery, M. T., and Wang, Z.: Tropical cyclogenesis in a tropical wave critical layer: easterly waves, Atmos. Chem. Phys., 9, 5587–5646, https://doi.org/10.5194/acp-9-5587-2009, 2009. a
Evan, A. T., Dunion, J., Foley, J. A., Heidinger, A. K., and Velden, C. S.: New evidence for a relationship between Atlantic tropical cyclone activity and African dust outbreaks, Geophys. Res. Lett., 33, L19813, https://doi.org/10.1029/2006GL026408, 2006. a
Flamant, C.: CADDIWA-2021_SAFIRE-F20_SAFIRE_CORE_TDYN thermodynamic and dynamic data 1 Hz, Aeris [data set], https://doi.org/10.25326/374, 2022a. a
Flamant, C.: CADDIWA-2021_SAFIRE-F20_SAFIRE_DROPSONDE dropsonde data, Aeris [data set], https://doi.org/10.25326/375, 2022b. a
Flamant, C., Chaboureau, J.-P., Delanoë, J., Gaetani, M., Jamet, C., Lavaysse, C., Bock, O., Borne, M., Cazenave, Q., Coutris, P., Cuesta, J., Menut, L., Aubry, C., Benedetti, A., Bosser, P., Bounissou, S., Caudoux, C., Collomb, H., Donal, T., Febvre, G., Fehr, T., Fink, A. H., Formenti, P., Gomes Araujo, N., Knippertz, P., Lecuyer, E., Neves Andrade, M., Ngoungué Langué, C. G., Jonville, T., Schwarzenboeck, A., and Takeishi, A.: Cyclogenesis in the tropical Atlantic: First scientific highlights from the Clouds-Atmospheric Dynamics-Dust Interactions in West Africa (CADDIWA) field campaign, B. Am. Meteorol. Soc., 105, E387–E417, https://doi.org/10.1175/BAMS-D-23-0230.1, 2024. a, b, c, d
Fritz, C. and Wang, Z.: A numerical study of the impacts of dry air on tropical cyclone formation: A development case and a nondevelopment case, J. Atmos. Sci., 70, 91–111, https://doi.org/10.1175/JAS-D-12-018.1, 2013. a
Goff, R. C.: Vertical structure of thunderstorm outflows, Mon. Weather Rev., 104, 1429–1440, https://doi.org/10.1175/1520-0493(1976)104%3C1429:VSOTO%3E2.0.CO;2, 1976. a
Gregory, D., Morcrette, J.-J., Jakob, C., Beljaars, A. M., and Stockdale, T.: Revision of convection, radiation and cloud schemes in the ECMWF model, Q. J. Roy. Meteor. Soc., 126, 1685–1710, https://doi.org/10.1002/qj.49712656607, 2000. a
Hankes, I., Wang, Z., Zhang, G., and Fritz, C.: Merger of African easterly waves and formation of Cape Verde storms, Q. J. Roy. Meteor. Soc., 141, 1306–1319, https://doi.org/10.1002/qj.2439, 2015. a
Inness, A., Ades, M., Agustí-Panareda, A., Barré, J., Benedictow, A., Blechschmidt, A.-M., Dominguez, J. J., Engelen, R., Eskes, H., Flemming, J., Huijnen, V., Jones, L., Kipling, Z., Massart, S., Parrington, M., Peuch, V.-H., Razinger, M., Remy, S., Schulz, M., and Suttie, M.: The CAMS reanalysis of atmospheric composition, Atmos. Chem. Phys., 19, 3515–3556, https://doi.org/10.5194/acp-19-3515-2019, 2019. a
Jonville, T., Flamant, C., and Lavaysse, C.: Dynamical study of three African easterly waves in September 2021, Q. J. Roy. Meteor. Soc., 150, 2489–2509, https://doi.org/10.1002/qj.4720, 2024. a
Karyampudi, V. M. and Carlson, T. N.: Analysis and numerical simulations of the Saharan air layer and its effect on easterly wave disturbances, J. Atmos. Sci., 45, 3102–3136, https://doi.org/10.1175/1520-0469(1988)045<3102:AANSOT>2.0.CO;2, 1988. a, b
Karyampudi, V. M. and Pierce, H. F.: Synoptic-scale influence of the Saharan air layer on tropical cyclogenesis over the Eastern Atlantic, Mon. Weather Rev., 130, 3100–3128, https://doi.org/10.1175/1520-0493(2002)130<3100:SSIOTS>2.0.CO;2, 2002. a
Karyampudi, V. M., Palm, S. P., Reagen, J. A., Fang, H., Grant, W. B., Hoff, R. M., Moulin, C., Pierce, H. F., Torres, O., Browell, E. V., and Melfi, S. H.: Validation of the Saharan dust plume conceptual model using lidar, Meteosat, and ECMWF data, B. Am. Meteorol. Soc., 80, 1045–1076, https://doi.org/10.1175/1520-0477(1999)080<1045:VOTSDP>2.0.CO;2, 1999. a, b
Lac, C., Chaboureau, J.-P., Masson, V., Pinty, J.-P., Tulet, P., Escobar, J., Leriche, M., Barthe, C., Aouizerats, B., Augros, C., Aumond, P., Auguste, F., Bechtold, P., Berthet, S., Bielli, S., Bosseur, F., Caumont, O., Cohard, J.-M., Colin, J., Couvreux, F., Cuxart, J., Delautier, G., Dauhut, T., Ducrocq, V., Filippi, J.-B., Gazen, D., Geoffroy, O., Gheusi, F., Honnert, R., Lafore, J.-P., Lebeaupin Brossier, C., Libois, Q., Lunet, T., Mari, C., Maric, T., Mascart, P., Mogé, M., Molinié, G., Nuissier, O., Pantillon, F., Peyrillé, P., Pergaud, J., Perraud, E., Pianezze, J., Redelsperger, J.-L., Ricard, D., Richard, E., Riette, S., Rodier, Q., Schoetter, R., Seyfried, L., Stein, J., Suhre, K., Taufour, M., Thouron, O., Turner, S., Verrelle, A., Vié, B., Visentin, F., Vionnet, V., and Wautelet, P.: Overview of the Meso-NH model version 5.4 and its applications, Geosci. Model Dev., 11, 1929–1969, https://doi.org/10.5194/gmd-11-1929-2018, 2018. a
Landsea, C. W.: A Climatology of Intense (or Major) Atlantic Hurricanes, Mon. Weather Rev., 121, 1703–1713, https://doi.org/10.1175/1520-0493(1993)121<1703:ACOIMA>2.0.CO;2, 1993. a
Luo, H. and Han, Y.: Impacts of the Saharan air layer on the physical properties of the Atlantic tropical cyclone cloud systems: 2003–2019, Atmos. Chem. Phys., 21, 15171–15184, https://doi.org/10.5194/acp-21-15171-2021, 2021. a, b
Machado, L. A. T. and Chaboureau, J.-P.: Effect of turbulence parameterization on assessment of cloud organization, Mon. Weather Rev., 143, 3246–3262, https://doi.org/10.1175/MWR-D-14-00393.1, 2015. a
Marenco, F., Ryder, C., Estellés, V., O'Sullivan, D., Brooke, J., Orgill, L., Lloyd, G., and Gallagher, M.: Unexpected vertical structure of the Saharan Air Layer and giant dust particles during AER-D, Atmos. Chem. Phys., 18, 17655–17668, https://doi.org/10.5194/acp-18-17655-2018, 2018. a
Masson, V., Le Moigne, P., Martin, E., Faroux, S., Alias, A., Alkama, R., Belamari, S., Barbu, A., Boone, A., Bouyssel, F., Brousseau, P., Brun, E., Calvet, J.-C., Carrer, D., Decharme, B., Delire, C., Donier, S., Essaouini, K., Gibelin, A.-L., Giordani, H., Habets, F., Jidane, M., Kerdraon, G., Kourzeneva, E., Lafaysse, M., Lafont, S., Lebeaupin Brossier, C., Lemonsu, A., Mahfouf, J.-F., Marguinaud, P., Mokhtari, M., Morin, S., Pigeon, G., Salgado, R., Seity, Y., Taillefer, F., Tanguy, G., Tulet, P., Vincendon, B., Vionnet, V., and Voldoire, A.: The SURFEXv7.2 land and ocean surface platform for coupled or offline simulation of earth surface variables and fluxes, Geosci. Model Dev., 6, 929–960, https://doi.org/10.5194/gmd-6-929-2013, 2013. a
NASA: Giovanni: The Bridge Between Data and Science, NASA GESDISC, https://giovanni.gsfc.nasa.gov/giovanni/ (last access: September 2023), 2023. a
Pan, B., Wang, Y., Hu, J., Lin, Y., Hsieh, J.-S., Logan, T., Feng, X., Jiang, J. H., Yung, Y. L., and Zhang, R.: Impacts of Saharan dust on Atlantic regional climate and implications for tropical cyclones, J. Climate, 31, 7621–7644, https://doi.org/10.1175/JCLI-D-16-0776.1, 2018. a, b
Pergaud, J., Masson, V., Malardel, S., and Couvreux, F.: A parameterization of dry thermals and shallow cumuli for mesoscale numerical weather prediction, Bound. Lay. Meteorol., 132, 83–106, https://doi.org/10.1007/s10546-009-9388-0, 2009. a
Prospero, J. M. and Carlson, T. N.: Vertical and areal distribution of Saharan dust over the western equatorial north Atlantic Ocean, J. Geophys. Res., 77, 5255–5265, https://doi.org/10.1029/JC077i027p05255, 1972. a
RALI project: RALI – The airborne radar-lidar platform for cloud and aerosol observations, http://rali.aeris-data.fr/ (last access: September 2023), 2023. a
Reinares Martinez, I. and Chaboureau, J.-P.: Precipitation and mesoscale convective systems: radiative impact of dust over Northern Africa, Mon. Weather Rev., 146, 3011–3029, https://doi.org/10.1175/MWR-D-18-0103.1, 2018. a
Rennó, N. O. and Ingersoll, A. P.: Natural convection as a heat engine: A theory for CAPE, J. Atmos. Sci., 53, 572–585, https://doi.org/10.1175/1520-0469(1996)053<0572:NCAAHE>2.0.CO;2, 1996. a
Saunders, R., Hocking, J., Turner, E., Rayer, P., Rundle, D., Brunel, P., Vidot, J., Roquet, P., Matricardi, M., Geer, A., Bormann, N., and Lupu, C.: An update on the RTTOV fast radiative transfer model (currently at version 12), Geosci. Model Dev., 11, 2717–2737, https://doi.org/10.5194/gmd-11-2717-2018, 2018. a
Schlemmer, L. and Hohenegger, C.: The formation of wider and deeper clouds as a result of cold-pool dynamics, J. Atmos. Sci., 71, 2842–2858, https://doi.org/10.1175/JAS-D-13-0170.1, 2014. a
Schwendike, J., Jones, S. C., Vogel, B., and Vogel, H.: Mineral dust transport toward Hurricane Helene (2006), J. Geophys. Res.-Atmos., 121, 5538–5566, https://doi.org/10.1002/2015JD024708, 2016. a
Shu, S. and Wu, L.: Analysis of the influence of Saharan air layer on tropical cyclone intensity using AIRS/Aqua data, Geophys. Res. Lett., 36, L09809, https://doi.org/10.1029/2009GL037634, 2009. a, b, c, d, e
Strong, J. D., Vecchi, G. A., and Ginoux, P.: The climatological effect of Saharan dust on global tropical cyclones in a fully coupled GCM, J. Geophys. Res.-Atmos., 123, 5538–5559, https://doi.org/10.1029/2017JD027808, 2018. a
Sun, Y. and Zhao, C.: Influence of Saharan dust on the large-scale meteorological environment for development of tropical cyclone over North Atlantic Ocean Basin, J. Geophys. Res.-Atmos., 125, e2020JD033454, https://doi.org/10.1029/2020JD033454, 2020. a, b
Tompkins, A. M.: Organization of tropical convection in low vertical wind shears: The role of cold pools, J. Atmos. Sci., 58, 1650–1672, https://doi.org/10.1175/1520-0469(2001)058<1650:OOTCIL>2.0.CO;2, 2001. a, b, c
Vié, B., Pinty, J.-P., Berthet, S., and Leriche, M.: LIMA (v1.0): A quasi two-moment microphysical scheme driven by a multimodal population of cloud condensation and ice freezing nuclei, Geosci. Model Dev., 9, 567–586, https://doi.org/10.5194/gmd-9-567-2016, 2016. a
von Engeln, A., Teixeira, J., Wickert, J., and Buehler, S. A.: Using CHAMP radio occultation data to determine the top altitude of the Planetary Boundary Layer, Geophys. Res. Lett., 32, L06815, https://doi.org/10.1029/2004GL022168, 2005. a
Wang, Z., Li, W., Peng, M. S., Jiang, X., McTaggart-Cowan, R., and Davis, C. A.: Predictive skill and predictability of North Atlantic tropical cyclogenesis in different synoptic flow regimes, J. Atmos. Sci., 75, 361–378, https://doi.org/10.1175/JAS-D-17-0094.1, 2018. a
Wong, S. and Dessler, A.: Suppression of deep convection over the tropical North Atlantic by the Saharan Air Layer, Geophys. Res. Lett., 32, L09808, https://doi.org/10.1029/2004GL022295, 2005. a, b
Xian, P., Klotzbach, P. J., Dunion, J. P., Janiga, M. A., Reid, J. S., Colarco, P. R., and Kipling, Z.: Revisiting the relationship between Atlantic dust and tropical cyclone activity using aerosol optical depth reanalyses: 2003–2018, Atmos. Chem. Phys., 20, 15357–15378, https://doi.org/10.5194/acp-20-15357-2020, 2020. a, b
Zuidema, P., Torri, G., Muller, C., and Chandra, A.: A survey of precipitation-induced atmospheric cold pools over oceans and their interactions with the larger-scale environment, Surv. Geophys., 38, 1283–1305, https://doi.org/10.1007/s10712-017-9447-x, 2017. a, b
- Abstract
- Introduction
- Data and methods
- Overview of MCS Pierre Henri's life cycle and its environment
- STWL, cold pool, and upper-tropospheric dry air impacts on MCS Pierre Henri's life cycle
- Conclusion
- Data availability
- Author contributions
- Competing interests
- Disclaimer
- Special issue statement
- Acknowledgements
- Review statement
- References