the Creative Commons Attribution 4.0 License.
the Creative Commons Attribution 4.0 License.
 | 15 Jul 2025
Machine-learning-assisted inference of the particle charge fraction and the ion-induced nucleation rates during new particle formation events
Pan Wang
Jiandong Wang
Veli-Matti Kerminen
Jingkun Jiang
The charge state of atmospheric new particles is controlled by both their initial charge state upon formation and subsequent interaction with atmospheric ions. By measuring the charge state of growing particles, the fraction of ion-induced nucleation (FIIN) within total new particle formation (NPF) can be inferred, which is critical for understanding NPF mechanisms. However, existing theoretical approaches for predicting particle charge states suffer from inaccuracies due to simplifying assumptions; hence their ability to infer FIIN is sometimes limited. Here we develop a numerical model to explicitly simulate the charging dynamics of new particles. Our simulations demonstrate that both particle growth rate and ion concentration substantially influence the particle charge state, while ion–ion recombination becomes important when the charged particle concentrations are high. Leveraging a large set of simulations, we constructed two regression models using residual neural networks. The first model (ResFWD) predicts the charge state of growing particles with known FIIN values, while the second model (ResBWD) operates in reverse to estimate FIIN based on the charge fraction of particles at prescribed sizes. Good agreement between the regression models and benchmark simulations demonstrates the potential of our approach for analyzing ion-induced nucleation events. Sensitivity analysis further reveals that ResFWD and the benchmark simulations exhibit similar sensitivity to noises in the input parameters, but the robustness of the ResBWD simulations depends on retention of initial particle charge state at the prescribed sizes. Our study provides insights into charging dynamics of atmospheric new particles and introduces a new method for assessing ion-induced nucleation rates.
- Article
(4316 KB) - Full-text XML
-
Supplement
(1870 KB) - BibTeX
- EndNote


In the low atmosphere, ions are continuously produced by galactic cosmic rays and radioisotope decay at the earth surface (Stozhkov, 2003; Eisenbud and Gesell, 1997). Due to the high abundance of N2 and O2 in the atmosphere, the initially formed ions (primary ions) typically include , , NO+, O−, and . These primary ions subsequently go through ion–molecule reactions to form a large set of organic and inorganic secondary ions, e.g., , , , and (Yin et al., 2023). Once formed, ions can be lost by condensing on the aerosol particles, deposition to surfaces, and ion–ion recombination, leading to an typical ion concentration of 100–5000 cm−3 globally (Hirsikko et al., 2011). The ions contribute to atmospheric electricity and play an important role in the formation of aerosol particle (Golubenko et al., 2020; Kerminen et al., 2018; Yu et al., 2012).
New particle formation (NPF) is the conversion of gas molecules to nascent nanoparticles and is estimated to contribute about half of the cloud condensation nuclei on a global scale (Gordon et al., 2017; Zhao et al., 2024). Atmospheric ions can participate in NPF events during both the nucleation stage (i.e., the process in which the stable clusters are formed from gas-phase precursors) and the growth stage (in which the clusters further grow due to vapor condensation and coagulation). During nucleation, ions can induce NPF at lower vapor concentrations than neutrals by stabilizing the embryonic clusters through the presence of the charge (Kirkby et al., 2016; Yu et al., 2020). Measurements even suggest that ion-induced nucleation (IIN) might be the main mechanism for NPF in the higher troposphere and the stratosphere (Yu et al., 2008; Lee et al., 2003; Zhao et al., 2024). Atmospheric ions also play a role in particle growth by altering the charge state of the particles and affect their growth in several ways. Firstly, charged particles tend to have higher condensational growth rates (GRs) due to enhanced ion and neutral vapor condensation, which are caused by Coulombic, charge–dipole, and charge-induced dipole interactions between the particles and the condensing species (Svensmark et al., 2017; Nadykto and Yu, 2003). Second, particle charging promotes coagulation between charged particles of opposite polarities and oppress coagulation between particles of the same polarity (Mahfouz and Donahue, 2021). Third, the coagulation sink (CoagS) for charged particles can be different from that of the neutral particles, which makes charged particles less likely to grow larger.
An accurate estimation of IIN rates is a prerequisite to assess the role of ions in NPF. However, IIN rates are often challenging to measure directly because the IIN pathway must be distinguished from particle formation through neutral pathways that proceed simultaneously. Additionally, the constant interaction with atmospheric ions alters the particle charge state and makes it difficult to determine whether a given particle is charged upon formation or during growth. Therefore, the IIN rates is often deduced by comparing the charge fraction of nucleated particles to the so-called steady-state particle charge distribution, using a model that relates these two quantities given other measurables (e.g., the particle growth rate, the ion concentration) (Iida et al., 2006). Towards this end, Kerminen et al. (2007) developed an analytical equation to calculate the charge fraction of particles at a given size. By fitting the theoretical values with measured particle charge fraction at several sizes (Laakso et al., 2007), the IIN fraction can be obtained. This equation was further extended to deal with situations with different positive and negative ions concentrations (Gagné et al., 2012). However, as shown by comparison with numerical simulations (Leppä et al., 2011, 2009), the accuracy of the theoretical approach is sometimes limited by its underlying assumptions; e.g., the particle population is monodisperse and the charged fraction of the particles is substantially below unity.
Machine learning (ML) is increasingly being applied in atmospheric sciences due to its capability to deal with complex and nonlinear processes. In the study of atmospheric NPF, ML has been applied to identify NPF and non-NPF days (Su et al., 2022; Joutsensaari et al., 2018), to speed up configurational sampling of embryonic clusters (Kubečka et al., 2023), and to train force fields used in molecular dynamics simulations of NPF (Jiang et al., 2022). Conceivably, ML can also be applied to calculate the charge fraction of atmospheric new particle in lieu of the theoretical equations, with potentially higher accuracy and less restrictive assumptions. An even more ambitious goal is to directly calculate the fraction of ion-induced nucleation (FIIN) with measurable particle charge fractions using a trained ML model, hence circumventing the data fitting procedure.
In this work, we present an initial exploration of machine learning (ML) models to infer particle charge fractions and ion-induced nucleation (IIN) rates during NPF events. To achieve this goal, we couple dynamic charging simulations with a sectional model (Li et al., 2023) to simulate NPF under typical atmospheric conditions. The data generated from these benchmark simulations are then utilized to train and validate ML models. Both the accuracy and sensitivity of the ML models to input noises are discussed and compared with benchmark simulations.
2.1 The sectional model
We applied a two-dimensional sectional model (Fig. 1) to simulate the evolution of the particle size distribution (PSD) and particle charge fraction during the NPF events. We refer to this model as CDMS-ion (cluster dynamics multicomponent section model with ions) for brevity. CDMS-ion divides the particles into mass sections, and the particles within a mass section are further divided into subsections according to their charge states. All particles in the same mass section are assumed to have the same chemical composition (internally mixed). The simulated processes include particle charging, coagulation, growth, or shrinkage due to vapor condensation–evaporation and losses to pre-existing particles (i.e., coagulation sink; CoagS). Particle nucleation is not explicitly simulated; rather, prescribed nucleation rates at 1 nm are specified in the model as an input. Although particles may absorb ambient water vapor, we do not include particle hygroscopic growth in this study. Subject to the influence of a strong Kelvin effect and a complex chemical composition, the hygroscopic growth factor of atmospheric new particles has high uncertainties. Despite this neglect, water uptake may lead to increased particle growth rates in simulations compared to dry particles. The effect of higher particle growth rates on particle charging dynamics is examined thoroughly in the following.
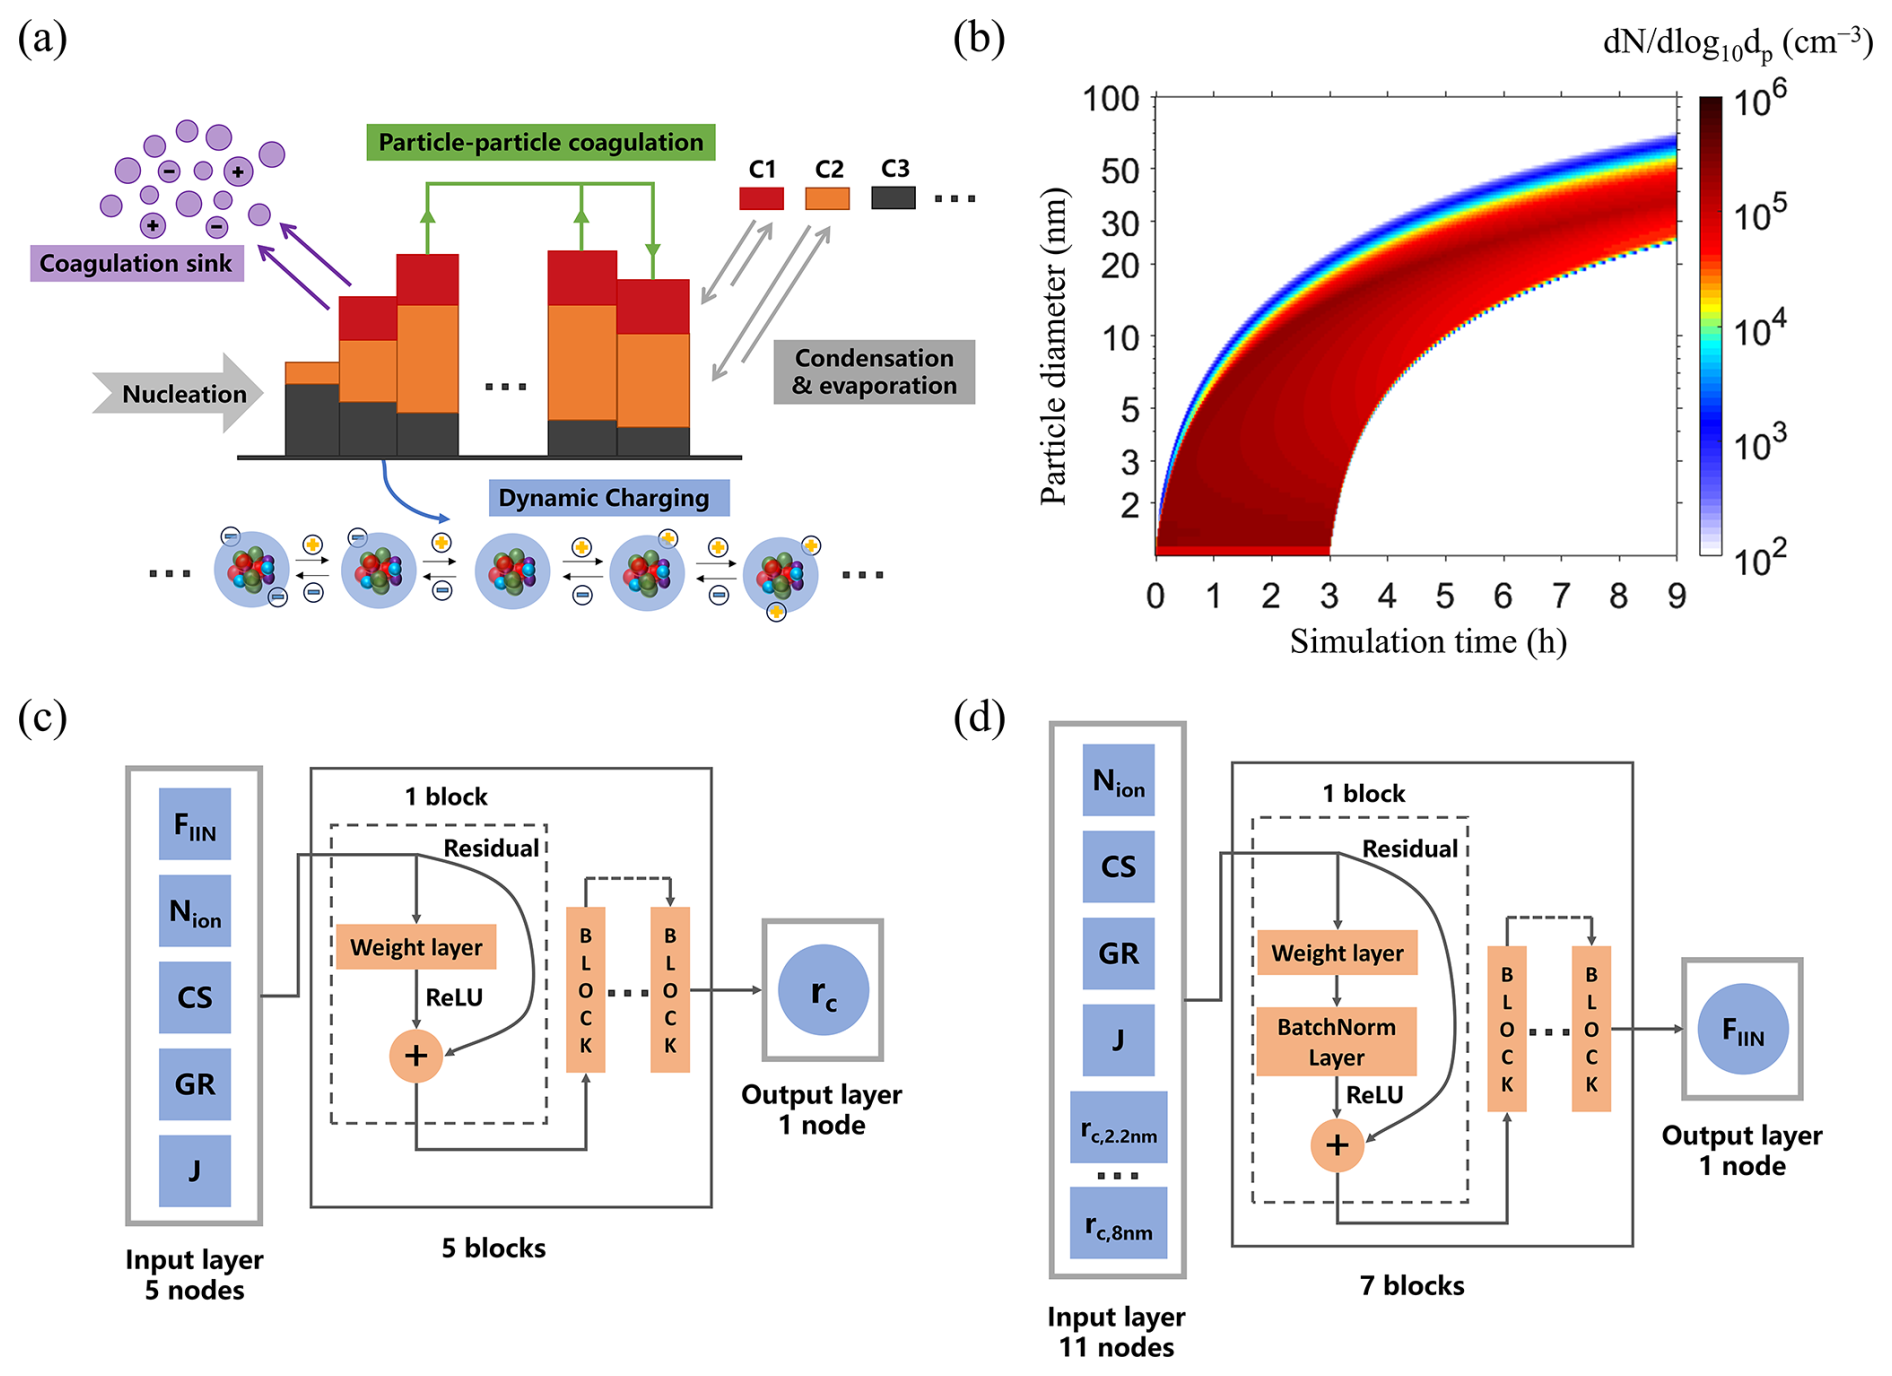
Figure 1(a) Illustration of the CDMS-ion model. (b) The evolution of the particle size distribution in a simulated NPF event. The structures of (c) ResFWD and (d) ResBWD.
The processes under consideration were simulated using an operator splitting approach, where the differential equations for distinct processes were solved sequentially within each time step, hstep. In our previous work, which did not include particle charging (Li et al., 2023), these equations were solved simultaneously. However, incorporating an additional dimension – the particle charge state – significantly increases computational costs. Therefore, in this study, we employed the operator splitting method to enhance simulation efficiency. To determine an optimal hstep, we conducted a convergence study, gradually reducing hstep and observing its effect on simulation outcomes. We found that values lower than 20 s had a negligible impact on our results. For all simulations, we utilized 126 mass sections with a geometric factor of 1.1, covering a particle size range from 1.17 to 100.50 nm. A uniform particle density of 1.4 g cm−3 was assumed.
2.2 Simulation of particle charging
The interaction between particles and atmospheric ions was simulated with a dynamic particle charging module. Neutral particles collide with ions to generate charged particles, and charged particles increase/decrease its charge by colliding with ions of the same/opposite polarity. This dynamic process is described by the following equation:
where is the concentration of particles with a diameter of dp and k charges, is the collision rate constant between these particles and positive/negative ions, and N± is the concentrations of positive or negative ions. Since we are interested in particles formed during NPF events with sizes smaller than 100 nm, we set the maximum particle charge to be ±5. The concentrations of particles with more charges are negligible under atmospherically relevant conditions (Wiedensohler, 1988).
To solve Eq. (1), the collision rate constant (cm3 s−1) needs to be calculated accurately. In this study, we used the rate coefficients developed by López-Yglesias and Flagan (2013) (see the Supplement of this work), who considered both three body trapping and image potential in their calculations. The collision rate constant was calculated with the following expression:
where is in m3 s−1, dp is in meters, denotes dimensionless fit coefficients, q is the number of charges on the particle, and Q = 23 is the maximum of q.
2.3 Vapor condensation–evaporation
Particle growth due to the condensation–evaporation of sulfuric acid and oxygenated organic molecules (OOMs) was simulated according to the following equation:
where mp is the particle mass, mi is the molecular mass of the species i, βi is the collision constant of species i with the particle, ni is the gas-phase concentration of species i, and Ei is the evaporation rate of species i from the particle.
To calculate βi in Eq. (3), we first calculated the collision rate coefficients with Eqs. (12) and (14) in Gopalakrishnan and Hogan (2011) and subsequently multiply these coefficients with an enhancement factor to account for charge–dipole interactions between the particles and vapor molecules. The expression for the enhancement factor is given by Nadykto and Yu (2003) :
where l is the dipole moment of the vapor; kb is Boltzmann's constant; T is the ambient temperature; E(r) = is the electrical field of the charged particle; εg and εp are the relative permittivity of air and the particle, respectively; ε0 is the vacuum permittivity; e0 is the elementary charge; q is the number of charges of the particle; dp and dv are the diameters of the particle and the vapor molecule, respectively; L(z) = is the Langevin function; and α is the polarizability of the molecules. In the calculation of enhancement factors involving sulfuric acid molecules, we set the dipole moment and polarizability to 2.84 Debye and 6.2 Å3, respectively (Nadykto and Yu, 2003). For collisions involving OOMs, due to the lack of information on the average dipole moment and polarizability, we calculated the enhancement factor of EFOOMs with an empirical relation developed by Kirkby et al. (2016):
where fOOMs,SA = 4 is a fitting parameter.
Within each simulation interval (20 s), we calculated the mass change of particles due to condensation/evaporation in each subsection using the approach described in Zaveri et al. (2008) and Jacobson (2005). At the end of an interval, the particles are distributed into different mass bins using the linear discrete method (Simmel and Wurzler, 2006). To implement this method, both the particle number and mass are tracked in each section. The particle charge state was preserved during particle growth.
2.4 Particle coagulation
We considered the effect of Coulombic interactions on particle coagulation. The coagulation rate coefficients were calculated with the equations developed by Gopalakrishnan and co-workers (Ouyang et al., 2012; Gopalakrishnan and Hogan, 2012, 2011; Chahl and Gopalakrishnan, 2019), who derived the rate coefficients using Langevin dynamics simulations. The expressions for the collision rate coefficients are given by
where H is the dimensionless collision rate constant, KnD is the diffusive Knudsen number, T is the ambient temperature, dp1 and dp2 are the diameters of two colliding particles, q1 and q2 are the number of elementary charges on the particles, mr is the reduced mass of the colliding particles (defined as mr = ), fr is the reduced friction factor (defined as fr = ), ηC is the continuum limit enhancement factor due to the presence of charge, ηFM is the free molecular limit enhancement factor (Gopalakrishnan and Hogan, 2012), and μ is a function of the electrostatic energy to thermal energy ratio and the diffusive Knudsen number. Expressions for ηC, ηFM, and μ are found in Eq. (6) of Gopalakrishnan and Hogan (2012) and Sect. S2 of Chahl and Gopalakrishnan (2019).
The explicit simulation of particle charge state significantly increases the computational cost of coagulation simulation as the number of coagulation pairs is proportional to the number of subsections squared. To speed up the simulation, we used the coagulation algorithm developed by Matsui et al. (2013, 2017), which is a simplified version of Jacobson's et al. (1994) semi-implicit approach . In this algorithm, after a coagulation time step Δt, the mass concentration of particles with k charges in the ith mass section is given by
where Pi,k and Li,k are the mass production and loss rates of particles due to coagulation at time t, respectively, and fcorr is a correction factor to ensure mass conservation. The expressions for Pi,k, Li,k, and fcorr are given in Sect. S1 in the Supplement. Overall, this coagulation algorithm is non-iterative for any time step and conserves total particle mass but leads to slight inaccuracies in particle number distribution (Matsui and Mahowald, 2017; Matsui, 2017).
2.5 Coagulation sink
In addition to newly formed particles, the atmospheric ions also condition the charge distribution of the pre-existing atmospheric particles and affect the magnitude of the coagulation sink (CoagS). To account for this influence of charge on CoagS, we calculated CoagS with the assumption that the pre-existing particles are at steady-state charge distribution due to interaction with atmospheric ions. This assumption is supported by field observations conducted by Li et al. (2022), which show good agreement between the particle size distributions measured by the SMPS (scanning mobility particle sizer) with and without a neutralizer. Additionally, background particles (larger in size) have a shorter characteristic charging time (see Fig. 2 below) and longer residence time in the atmosphere compared with newly formed particles, which further justifies the steady-state assumption.
The coagulation sink CoagS for particles with a diameter of dp and k charges was calculated with the following equation:
where is the collision rate coefficient of particles with a diameter of dp and k charges with background particles with a diameter of and k′ charges, ) is the steady-state fraction of particles with k′ charges among all particles with size , and is the is number-based particle size distribution of pre-existing particles. can vary with time since the properties of atmospheric ions constantly change (Chen and Jiang, 2018). In this work, however, we assume that is independent of time for the pre-existing particles since the variation of ion properties is relatively small. To be consistent with the particle charging simulations (Sect. 2.2), the values of were calculated with the rate coefficients given by López-Yglesias and Flagan (2013) by solving Eq. (1). Concerning , we assume that the background particles are lognormally distributed, with a geometric mean diameter of 100 nm and a geometric standard deviation of 1.4.
2.6 Simulation setup and key metrics
We set up our simulations to mimic typical NPF events. Specifically, we assume that new particle formation lasts for 3 h with a constant nucleation rate J. The newly formed particles enter the smallest section (particle size is about 1 nm) and start to grow due to the condensation of sulfuric acid (SA) and oxygenated organic molecules (OOMs). The SA and OOM concentrations are assumed to be constant in the simulation. SA is assumed to be non-evaporative, and the OOMs are classified into 6 bins by saturation vapor concentration C* ( in units of µg m−3). Simultaneous to condensational growth, the particles coagulate with other particles or lose to pre-existing particles. All simulations were conducted at 298.15 K and 1 atm. A typical PSD obtained from such simulations is shown in Fig. 1b.
Several factors influence the charge state of the new particles, including the atmospheric ion properties (e.g., mobility), the ion concentrations (Nion), the particle growth rate (GR), the coagulation sink (CoagS), the total nucleation rate (J), and the fraction of ion-induced nucleation (FIIN; which is equal to and ranges from 0 to 1). The atmospheric ion properties used in this work are listed in Table 1. We set positive and negative ions to have the same mass and mobility. The properties of positive and negative ions can be different (e.g., in a neutralizer), but in the atmosphere the positive and negative ions often exhibit similar mobilities (Li et al., 2022; Gautam et al., 2017). A few studies have also shown that both the ion mobility and ion composition are influenced by humidity (Oberreit et al., 2015; Liu et al., 2020; Luts et al., 2011). The clustering of water with ions may decrease the ion mobility and reduce the ion-particle collision rates. However, such an effect is difficult to quantify based on existing research; hence in the simulation we did not consider ion hydration. The value of the other factors (Nion, GR, CoagS and J) spanned ranges of typical NPF events in the atmospheric boundary layer (also shown in Table 1) (Chu et al., 2019; Kerminen et al., 2018). The ion concentration Nion and the nucleation rate J were directly specified as simulation parameters, while GR and CoagS were controlled indirectly in the simulation by scaling the SA and OOM concentrations while maintaining their relative concentration. The reported GR values in the following were obtained by first simulating particle growth (Sect. S2) and subsequently fitting the particle size as a function of time with a linear function. Therefore, the GR values reported in this study are a measure of particle growth rates due to neutral vapor condensation. We note that although GR defined in this way neglects the effect of coagulation on particle growth, it can be retrieved from the evolution of particle size distribution (Li and McMurry, 2018; Stolzenburg et al., 2005). To control CoagS, we scaled the concentration of the pre-existing aerosols while maintaining their distribution (lognormal distribution with a geometric mean diameter of 100 nm and a geometric standard deviation of 1.4).
Table 1Simulation parameters*.
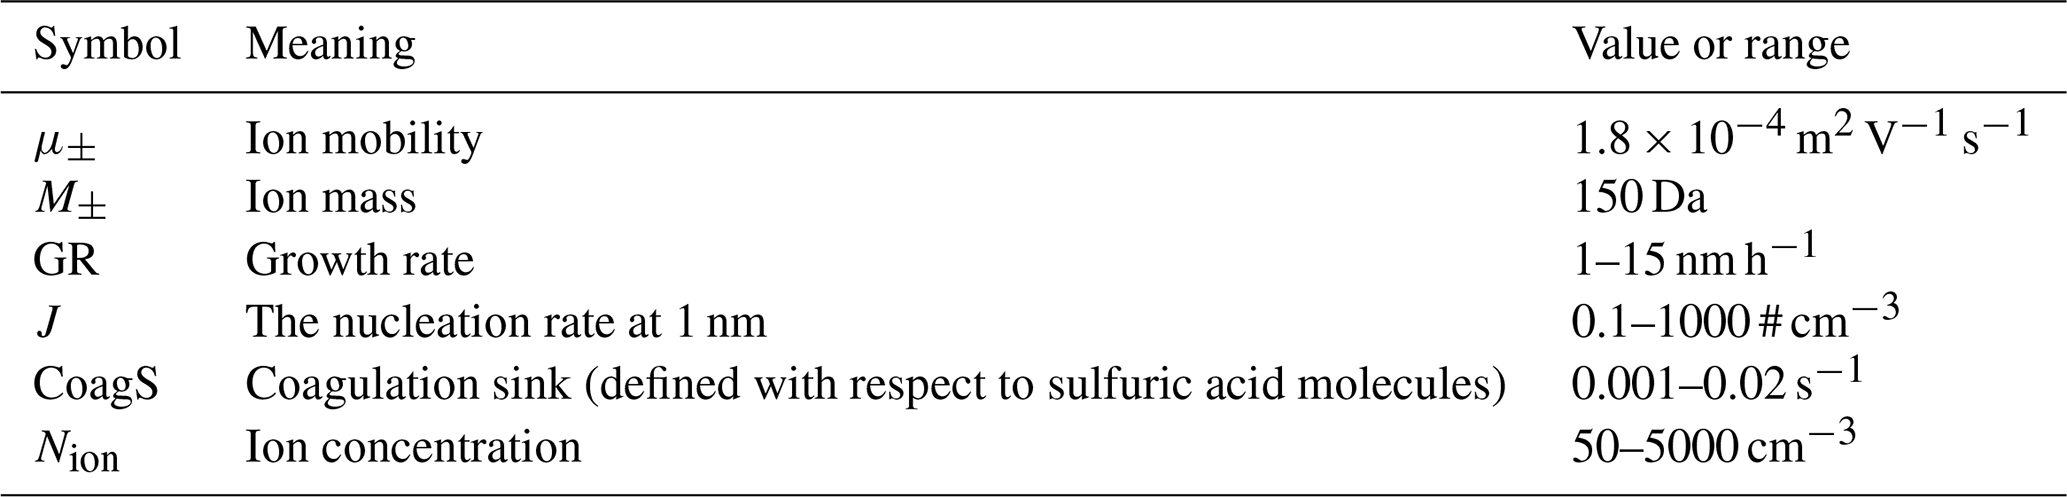
* All parameters except GR are explicitly held constant in a simulation. GR is determined from vapor condensation rates (vapor concentrations are held constant) and barely changes with particle size; hence GR can also be regarded as a constant.
To analyze the simulation results, we mainly focus on the charge ratio rc, which is defined as the ratio of the simulated fraction of singly charged particles to the steady-state value. This metric indicates to what extent the particle charge distribution deviates from the steady state: rc < 1 indicates that the particles are undercharged, and rc > 1 indicates that the particles are overcharged. The second and third metrics are the maximum number of particles during a simulation (Nmax) and the particle mode diameter (dm). Comparisons of these two metrics between simulations with and without particle charging show the effect of charging on particle survival and growth.
2.7 Analytical equation for particle charge state
Kerminen et al. (2007) derived a theoretical equation to calculate the charge state of a monodisperse nucleation mode:
where and rc,0 are the charging state at size dp and d0 (i.e., the initial particle size), respectively. K is expressed as
where α is the association rate between ions and particles of opposite polarity. In this work, we use a constant value of cm−3 s−1 for α, which is the collision rate constant between ions and particles 1 nm in diameter (calculated with Eq. 2). According to Eq. (11), the particle charge state is governed by both the initial charge state rc,0 and the parameter K, which is directly proportional to ion concentration and inversely proportional to particle growth rate. We note that rc,0 is a different concept from FIIN: the former is the ratio of the particle charge fraction to the equilibrium charge fraction at the initial particle size, while the latter refers to the ratio of particle concentration fluxes past a threshold size. These two ratios can be significantly different (Leppä et al., 2013).
2.8 Regression models with neural network
In this study, we used a residual neural network (ResNet)-based architecture to construct regression models. ResNet addresses the problem of vanishing gradients through residual connections and can accelerate network convergence (He et al., 2016). Initially introduced to enhance image recognition performance, ResNet has demonstrated broad applicability across various fields, including emulation of atmospheric chemistry solvers (Kelp et al., 2018; Liu et al., 2021).
Our first application of ResNet was to determine the charge state of new particles, assuming that J, GR, Nion, CoagS, and FIIN are already known (Fig. 1c). The network consists of six fully connected layers with 64, 128, 256, 128, 64, and 1 node, respectively, with residual connections introduced between each layer. The input layer has 5 nodes corresponding to the log 10(J), GR, log 10(Nion), CoagS, and FIIN, and the output layer has 1 node corresponding to log 10(rc) at a specific size. Log10 values of Nion, J, and rc were used because their significant variation across approximately 2 orders of magnitude. Each fully connected layer is followed by a ReLU activation function, with shortcut connections mapping the input of each layer directly to its output. The trained model is referred to as ResFWD (FWD denotes “forward”) and serves as an alternative of the Eq. (11).
In our second application of ResNet, we aimed to predict FIIN based on rc values at multiple sizes (2.2, 3, 4, 5, 6, 7, and 8 nm), alongside log 10(J), GR, log 10(Nion), and CoagS (Fig. 1d). This model's input layer consists of 11 nodes, which is more complex compared with ResFWD. Consequently, we expanded the number of fully connected layers to 8, with node counts of 64, 128, 256, 512, 256, 128, 64, and 1, respectively. Batch normalization layers were incorporated to accelerate training and enhance the model's generalization ability, while other configurations remained consistent with the first model. The resulting trained model is termed ResBWD (BWD denotes “backward”).
The dataset used to train ResFWD consists of ∼ 4 million CDMS-ion simulations, but this dataset was reduced in the training of ResBWD by removing sets of simulations (each set corresponds to a specific combination of J, GR, Nion and CoagS) in which the information of FIIN is almost lost before the particles reach 2.2 nm due to interaction with atmospheric ions (discussed in Sect. 3.3). In training all ResNet models, 80 % of the data were used for the model training and 20 % were used for model validation. The max–min normalization method was used for data pre-processing of all input and output features. The models were trained with PyTorch, with mean squared error (MSE) as the loss function. The optimizer was Adam, with a learning rate set to 0.001. The batch size was set to 2048, and the training was conducted over at least 50 epochs.
3.1 Evolution of particle charge state
In this section, we discuss some general characteristics of particle interaction with atmospheric ions, including the timescale for particles to reach steady-state charge distribution (Sect. 3.1.1), how particle charge state evolves after formation (Sect. 3.1.2 and 3.1.3), and the influence of charging on particle number concentration and growth, which is included in Sect. S5.
3.1.1 Characteristic time to reach steady-state charge distribution
To estimate the timescale for particles to achieve steady-state charge distribution under different ion concentrations, we numerically solved Eq. (1) to simulate the charge state evolution of monodisperse particles in the size range of 1–120 nm. The ion properties are listed in Table 1, and the simulation was conducted at a temperature of 298.15 K at atmospheric pressure. Below we discuss two extreme cases: initially neutral and initially fully charged particles (50 % positively charged, 50 % negatively charged). These cases correspond to the maximum timescale to reach the steady state from two different directions, while other scenarios in between would have shorter timescales. We define a characteristic time τss for particle charging (or discharging) as the time it takes for the singly charged fraction of initially neutral particles to reach () of the steady-state value or for the singly charged fraction of initially charged particles to reach () of the steady-state value. We neglect multiply charged particles in this calculation, as their fraction is low for ultrafine particles (Wiedensohler, 1988). An analytical analysis of τss is presented in Sect. S3.
Figure 2a and b show contour plots of τss at NPF-relevant particle sizes (1–100 nm) at atmospherically relevant ion concentrations (50–104 cm−3; note that throughout this work the ion concentration Nion refers to the sum of positive and negative ion concentration) for initially neutral and initially charged particles, respectively. Apparently, τss is dependent on both the particle size and the ion concentration. Theoretical analysis (Sect. S3) shows that τss can be expressed as
where f1(0) is the initial fraction of singly charged particles (of one polarity). Apparently, for particles of all sizes, τss decreases as the ion concentration increases because τss is inversely proportional to the ion concentration. Additionally, at a fixed ion concentration, τss stays relatively constant or decreases with increasing particle size. This trend is caused by the variation of the collision rate constants (2β0+β1) as the particle size increases, to which τss is also inversely proportional (Eq. 13). Further comparison between Fig. 2a and Fig. 2b reveals that τss is smaller for initially neutral particles than initially fully charged particles. As demonstrated in the Supplement, the characteristic time depends on , i.e., the distance between the initial and steady-state charge fraction. This distance is larger for initially charged particle and results in an extra term in Eq. (13).
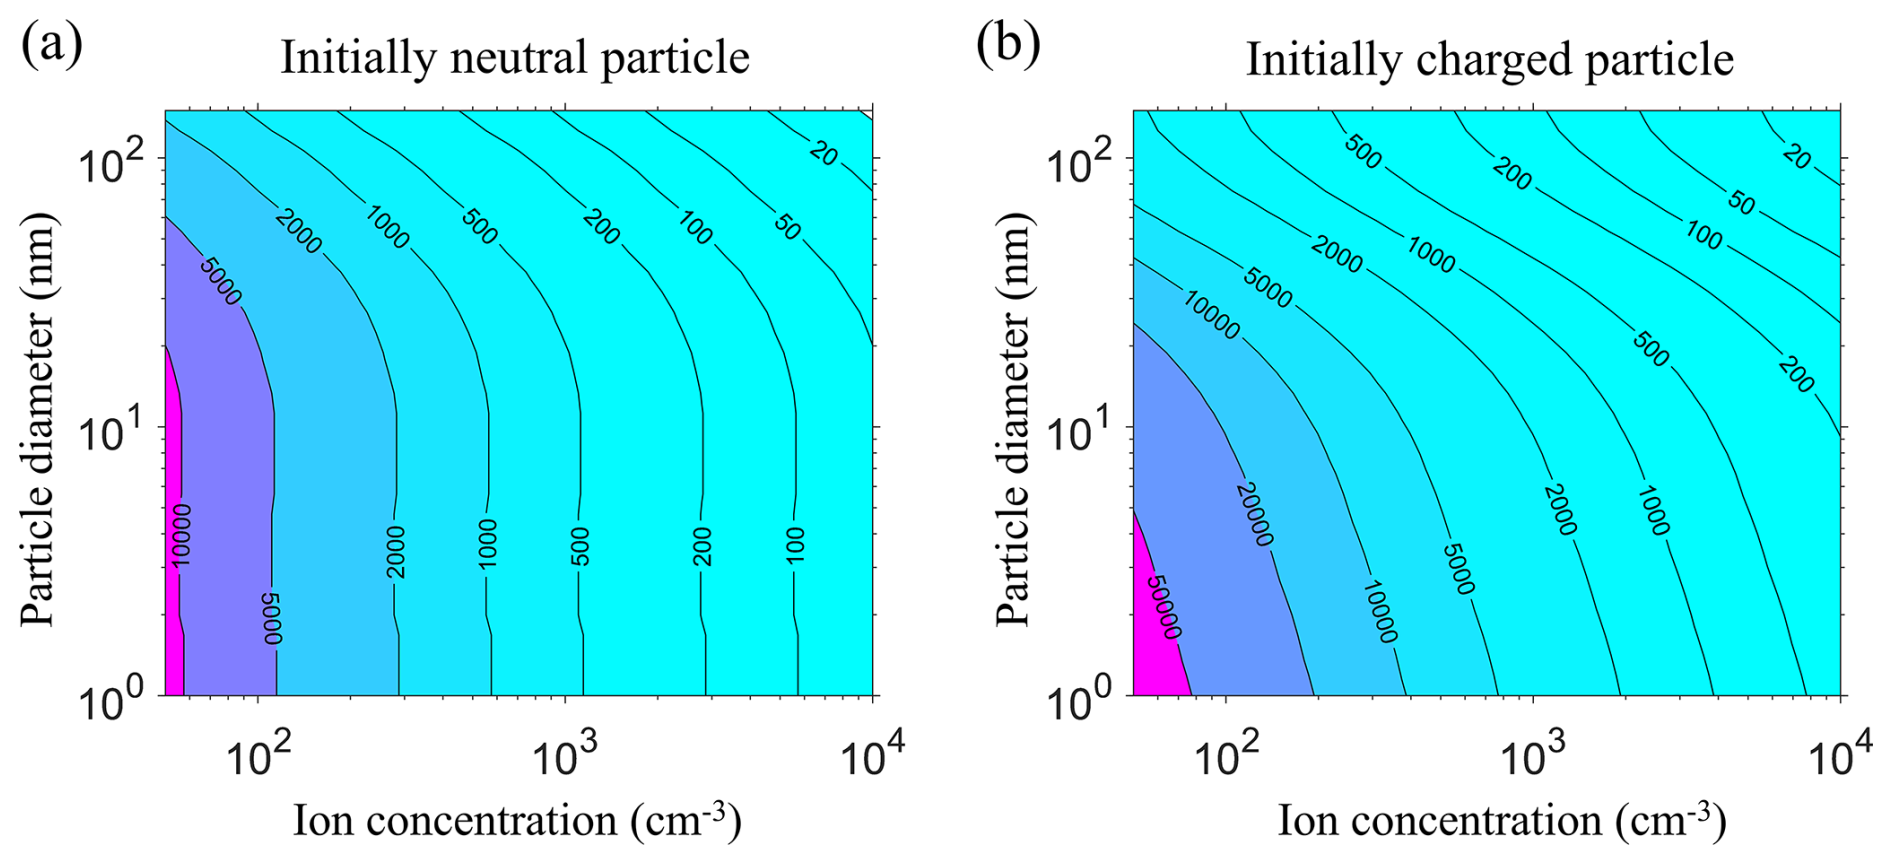
Figure 2Contour plots of the characteristic time (in seconds) for particles to reach the steady-state distribution as a function of particle diameter and ion concentration. (a) The particles are initially neutral. (b) The particles are initially singly charged (50 % positive, 50 % negative).
An uncertainty regarding τss stems from the collision rate coefficients used in its calculation. Pfeifer et al. (2023) showed that experimental and theoretical collision rate coefficients between ions and singly charged particles can differ by 1 to 2 orders of magnitude (Pfeifer et al., 2023; López-Yglesias and Flagan, 2013; Gopalakrishnan and Hogan, 2012; Gatti and Kortshagen, 2008). The rate coefficients used in this study (i.e., López-Yglesias and Flagan, 2013) are at the higher end of these rates. If the rate expressions developed by Gatti and Kortshagen (2008) or Gopalakrishnan and Hogan (2012) had been utilized, we would have anticipated a longer characteristic charging time. Additionally, we neglected the van der Waals potential between colliding entities, as its interplay with the Coulomb potential in influencing collision rates remains unclear.
The timescale τss, as illustrated in Fig. 2, ranges from tens of seconds to several hours, overlapping with the timescale for new particles to grow to a few or tens of nanometers in NPF events. Thus, during NPF and subsequent growth events, the newly formed particles cannot be assumed to be at the steady-state charge distribution without verification.
3.1.2 Neutral NPF
We next examine how the charge distribution of particles evolves when newly formed particles are electrically neutral. To understand the effect of ion concentration (Nion), the coagulation sink (CoagS), particle growth rate (GR), and nucleation rate (J) on particle charge distribution during NPF events, we calculated the ratio (rc) of the simulated fraction of singly charged particles to the steady-state value under different NPF conditions. Results at representative conditions are shown in Fig. 3. Some data points are omitted due to the exclusion of exceedingly low particle number concentrations (< 1 cm−3), which occur when both J and particle survival probability (primarily determined by GR/Coag; Kulmala et al., 2017) are low, resulting in very few particles surviving to sizes of interest. Additionally, in Fig. 3 we do not distinguish between positive and negative particles since they have the same charge fraction (we have assumed that positive and negative ions have the same concentration and properties, and hence the simulation is “symmetric” with respect to particle polarity).
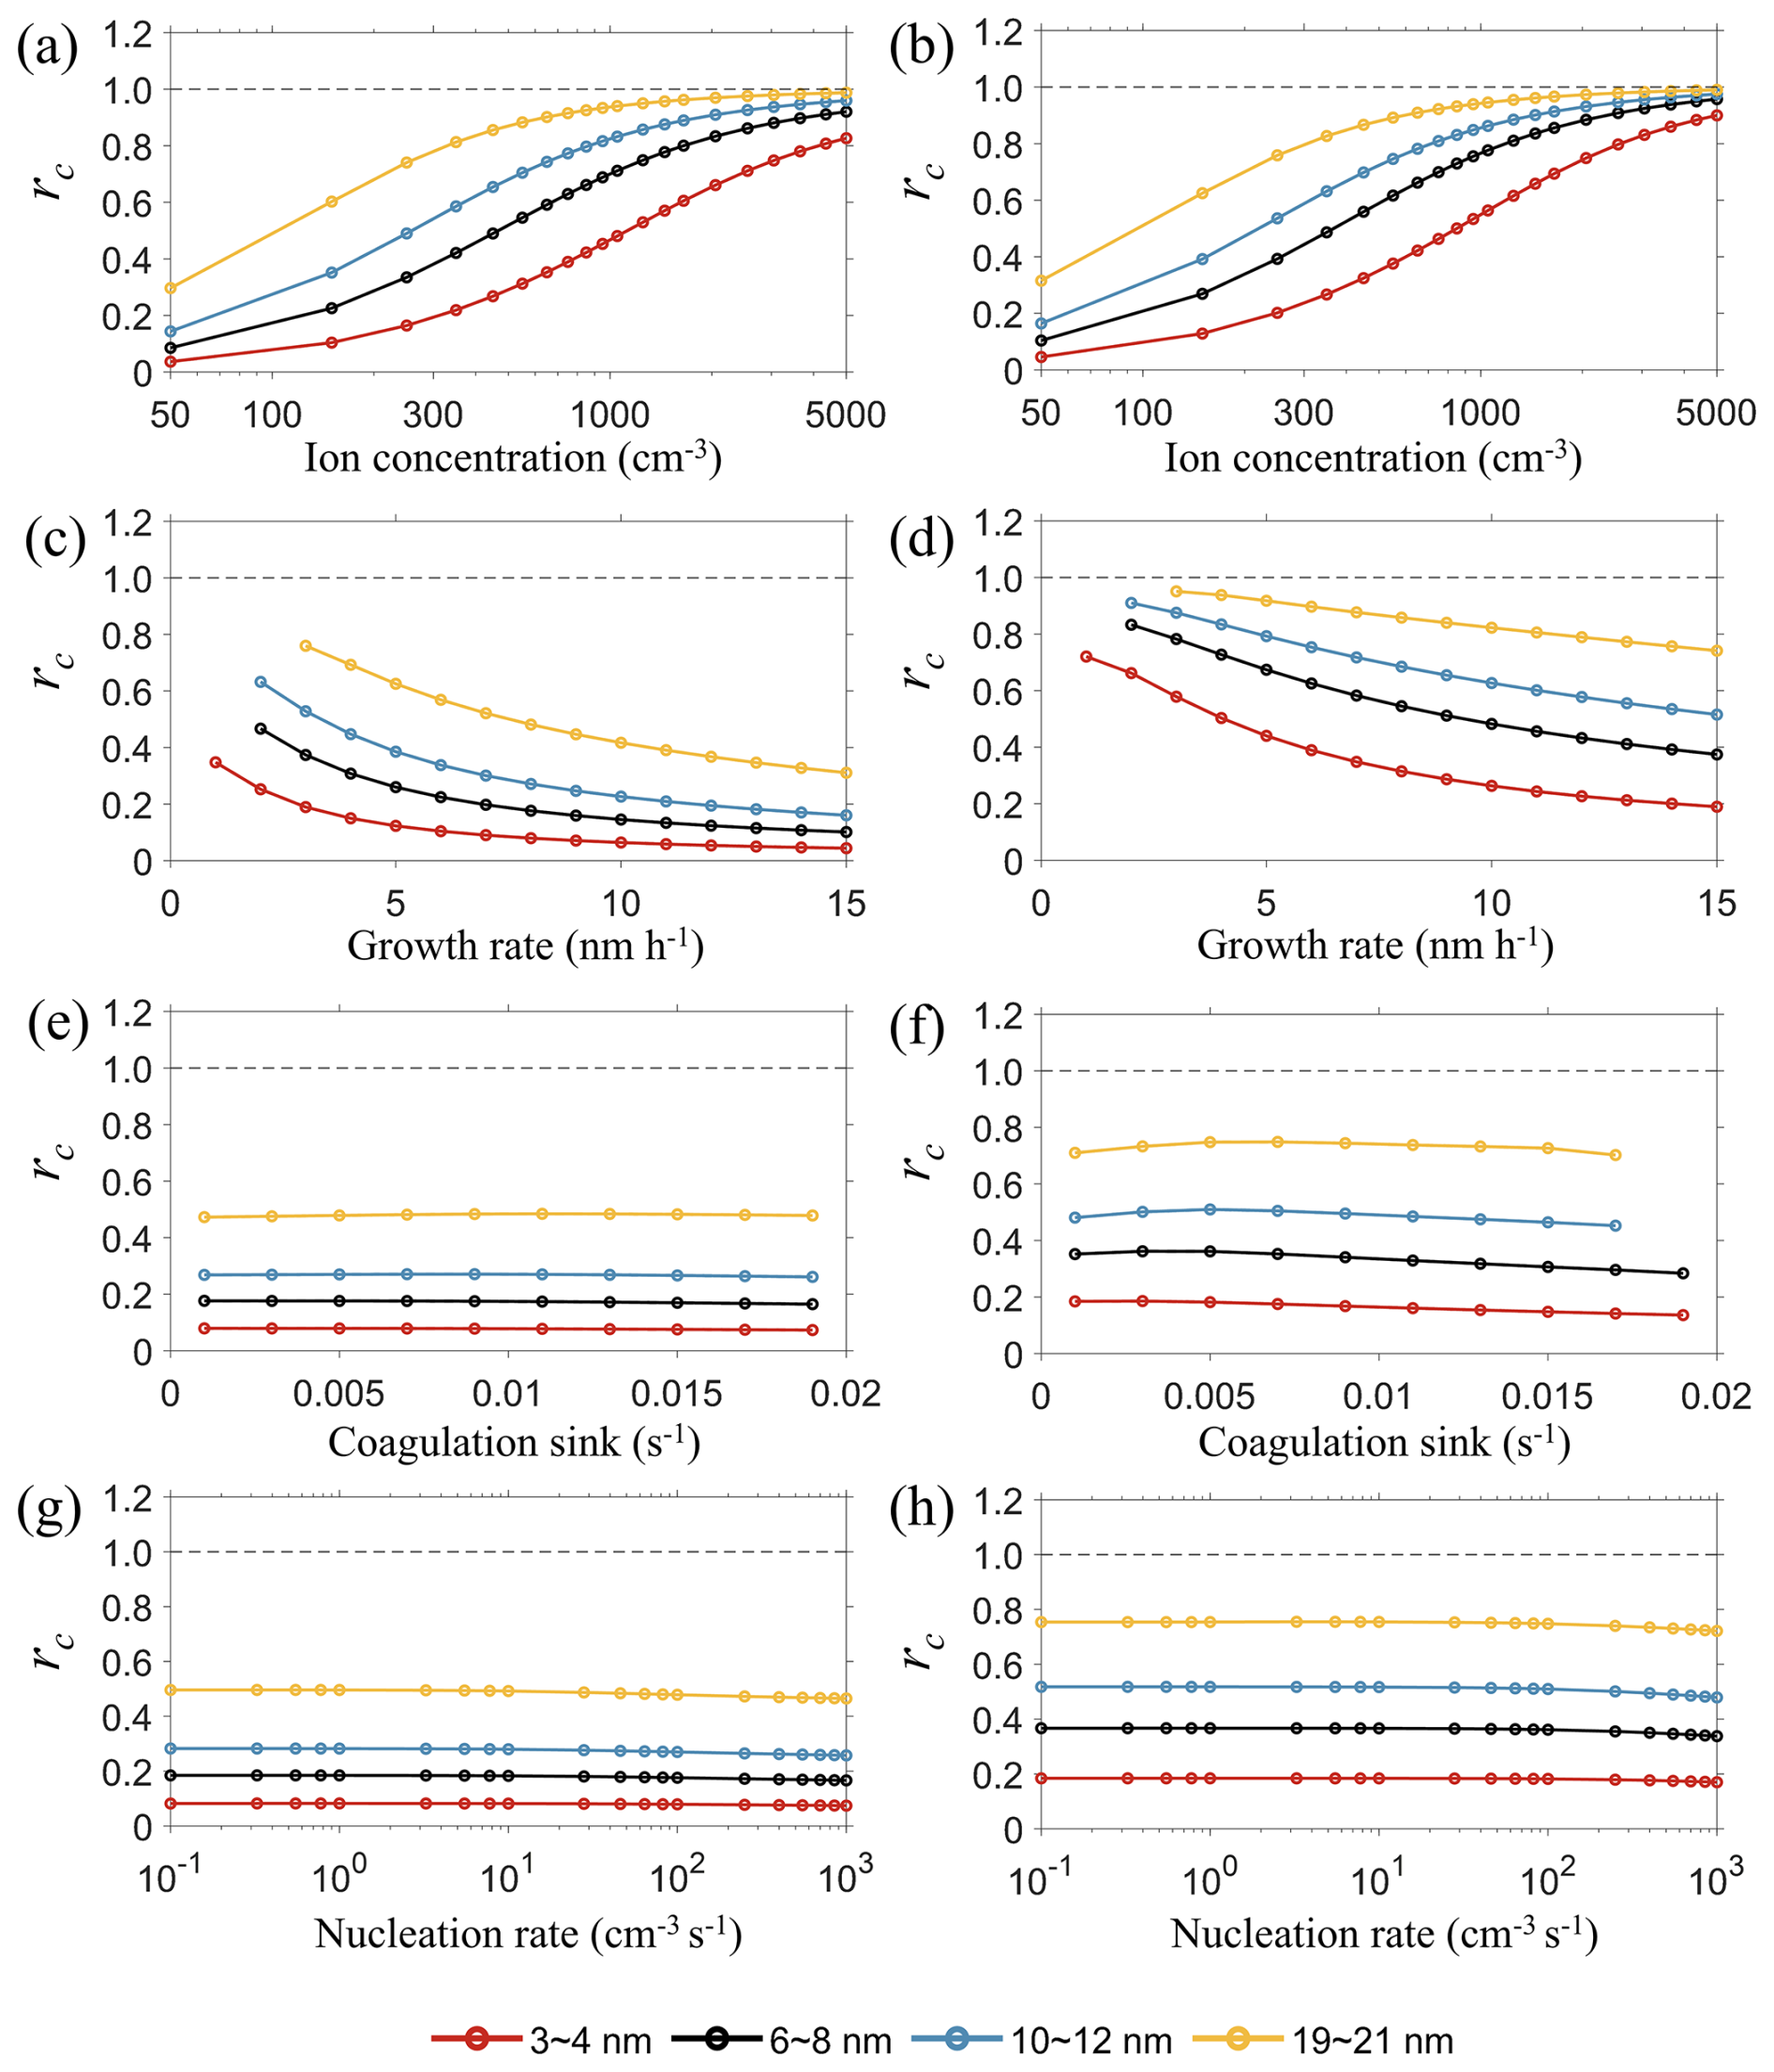
Figure 3Ratio of simulated singly charged fraction to the steady-state value (rc) as a function of dp at different simulation conditions. Different color corresponds to different size ranges. (a) J = 100 cm−3 s−1, CoagS = 0.01 s−1, GR = 4 nm h−1. (b) J = 1 cm−3 s−1, CoagS = 0.001 s−1, GR = 4 nm h−1. (c) J = 100 cm−3 s−1, CoagS = 0.005 s−1, Nion = 200 cm−3. (d) J = 100 cm−3 s−1, CoagS = 0.005 s−1, Nion = 1000 cm−3. (e) J = 100 cm−3 s−1, GR = 10 nm h−1, Nion = 250 cm−3. (f) J = 100 cm−3 s−1, GR = 4 nm h−1, Nion = 250 cm−3. (g) CoagS = 0.005 s−1, GR = 10 nm h−1, Nion = 250 cm−3. (h) CoagS = 0.005 s−1, GR = 4 nm h−1, Nion = 250 cm−3. The red, black, blue, and yellow curves represent four different particle size ranges (shown in the figure legend), with steady-state singly charged fractions of 0.0168, 0.0483, 0.0931, and 0.1975, respectively. These values are evaluated at the median of each size range, i.e., 3.5, 7, 11, and 20 nm. The absolute charge fraction of the particles can be obtained by multiplying rc by the corresponding steady-state charge fraction.
Figure 3a and b illustrate the variation of rc as a function of Nion for selected particle sizes at two conditions typical of polluted (J = 100 cm−3 s−1, CoagS = 0.01 s−1, GR = 4 nm h−1) and clean environments (J = 1 cm−3 s−1, CoagS = 0.001 s−1, GR = 4 nm h−1). Both figures demonstrate that during NPF events, rc depends on both the particle size and the ion concentration. At a fixed particle size, rc increases with Nion, which is expected as higher Nion reduces the characteristic charging time (Fig. 2) and promotes the particle charge distribution to reach the steady state. Moreover, larger particles have rc closer to 1, indicating that as particle grow, their charge fraction gradually approaches the steady-state value.
Figure 3c and d show how GR affects rc at low (Nion = 200 cm−3) and high (Nion = 1000 cm−3) ion concentrations, respectively. As GR increases, rc for a given particle size decreases, which is due to the decreased charge conditioning time by atmospheric ions (the time for particles to reach size dp is approximately ). Similar to Fig. 3a and b, smaller particles have lower rc due to their shorter interaction time with ions and longer characteristic charging time (Fig. 2a). Furthermore, rc is larger at higher ion concentrations, corroborating the trend shown in Fig. 3a and b.
The effect of CoagS on rc is shown in Fig. 3e and f for two particle growth rates. At a higher growth rate (10 nm h−1, Fig. 3e), rc remains largely unchanged as CoagS varies from 0.001 to 0.02 s−1. At a lower growth rate (4 nm h−1, Fig. 3f), CoagS has a more pronounced effect on rc, although changes at a given particle size are still smaller than 0.1. Compared with the impact of Nion and GR on rc, the influence of CoagS on rc is minor or even negligible.
Finally, Fig. 3g and h show the influence of nucleation rate J on rc at two particle growth rates. Similar to CoagS, J has an almost negligible effect on the rc at both fast (GR = 10 nm h−1, Fig. 3g) and slow (GR = 4 nm h−1, Fig. 3h) particle growth conditions. However, as J increases, there is a slightly decreasing trend of rc in Fig. 3h. This small but noticeable trend is caused by the increased coagulation between new particles, which elevates the particle growth rate and decreases the time for the particles to reach a certain size.
Overall, Fig. 3 indicates that the charge distribution of new particles deviates from the steady-state distribution during new particle formation (NPF) events. Among the four factors considered – ion concentration, particle growth rate, coagulation sink, and nucleation rate – the first two exert a strong influence on rc, while the latter two have a minor impact.
The interaction between aerosol particles and atmospheric ions can be leveraged to measure the particle size distribution (PSD). In this approach, atmospheric ions serve as aerosol neutralizers in the SMPS (Li et al., 2022; Chen and Jiang, 2018), reducing both the cost and safety risks associated with the instrument. However, a prerequisite for this method is that aerosol particles must reach a steady-state charge distribution at the time of measurement. Our analysis demonstrates that during NPF events, freshly formed neutral particles require tens of minutes to hours to achieve this steady-state distribution through interaction with atmospheric ions. To establish a characteristic size db above which the PSD can be measured without a neutralizer, we formulated a regression equation for db as a function of GR, Nion, J, and CoagS, defining db as the size at which the singly charged fraction of new particles reaches 63 % (i.e., ) of the steady-state value. The functional form of this regression, along with comparisons to simulations, is detailed in Sect. S4.
3.1.3 Initially charged particles
To understand the evolution of initially charged particles, we examine a limiting case where all particles are formed via ion-induced nucleation (i.e., FIIN = 1). We simplify our discussion by assuming equal IIN rates for both polarities. Figure 4 illustrates the behavior of the charge fraction ratio rc as a function of particle size under selected new particle formation (NPF) conditions. The evolution of rc can be categorized into three stages, as depicted by the red curve in Fig. 4a. In stage 1, rc rapidly decreases until it reaches unity. In stage 2, rc drops further to a minimum value rc,min. In stage 3, rc rebounds towards 1. This behavior can be attributed to two main effects: the collisions between particles and atmospheric ions (termed the “ion effect”), which drives the charge distribution towards rc = 1, and the coagulation of oppositely charged particles, also known as ion–ion recombination (termed the “coagulation effect”), which reduces the rc value. During stage 1, newly formed particles experience both the ion and coagulation effects, leading to a rapid decrease in charge fraction towards the steady-state value of rc = 1. In stage 2, as particles grow, the coagulation effect becomes dominant due to the increased concentration of charged particles from nucleation, resulting in a further reduction of rc to below 1. In comparison, rc remains above 1 if coagulation between particles are turned off in the simulation (Fig. S3). In stage 3, the coagulation effect diminishes for two reasons: (1) the IIN terminates and the generation of charged particles stops, and (2) the charged particles already formed are overall more neutralized as they grow. Because of the diminished coagulation effect, the ion effect drives rc towards 1.
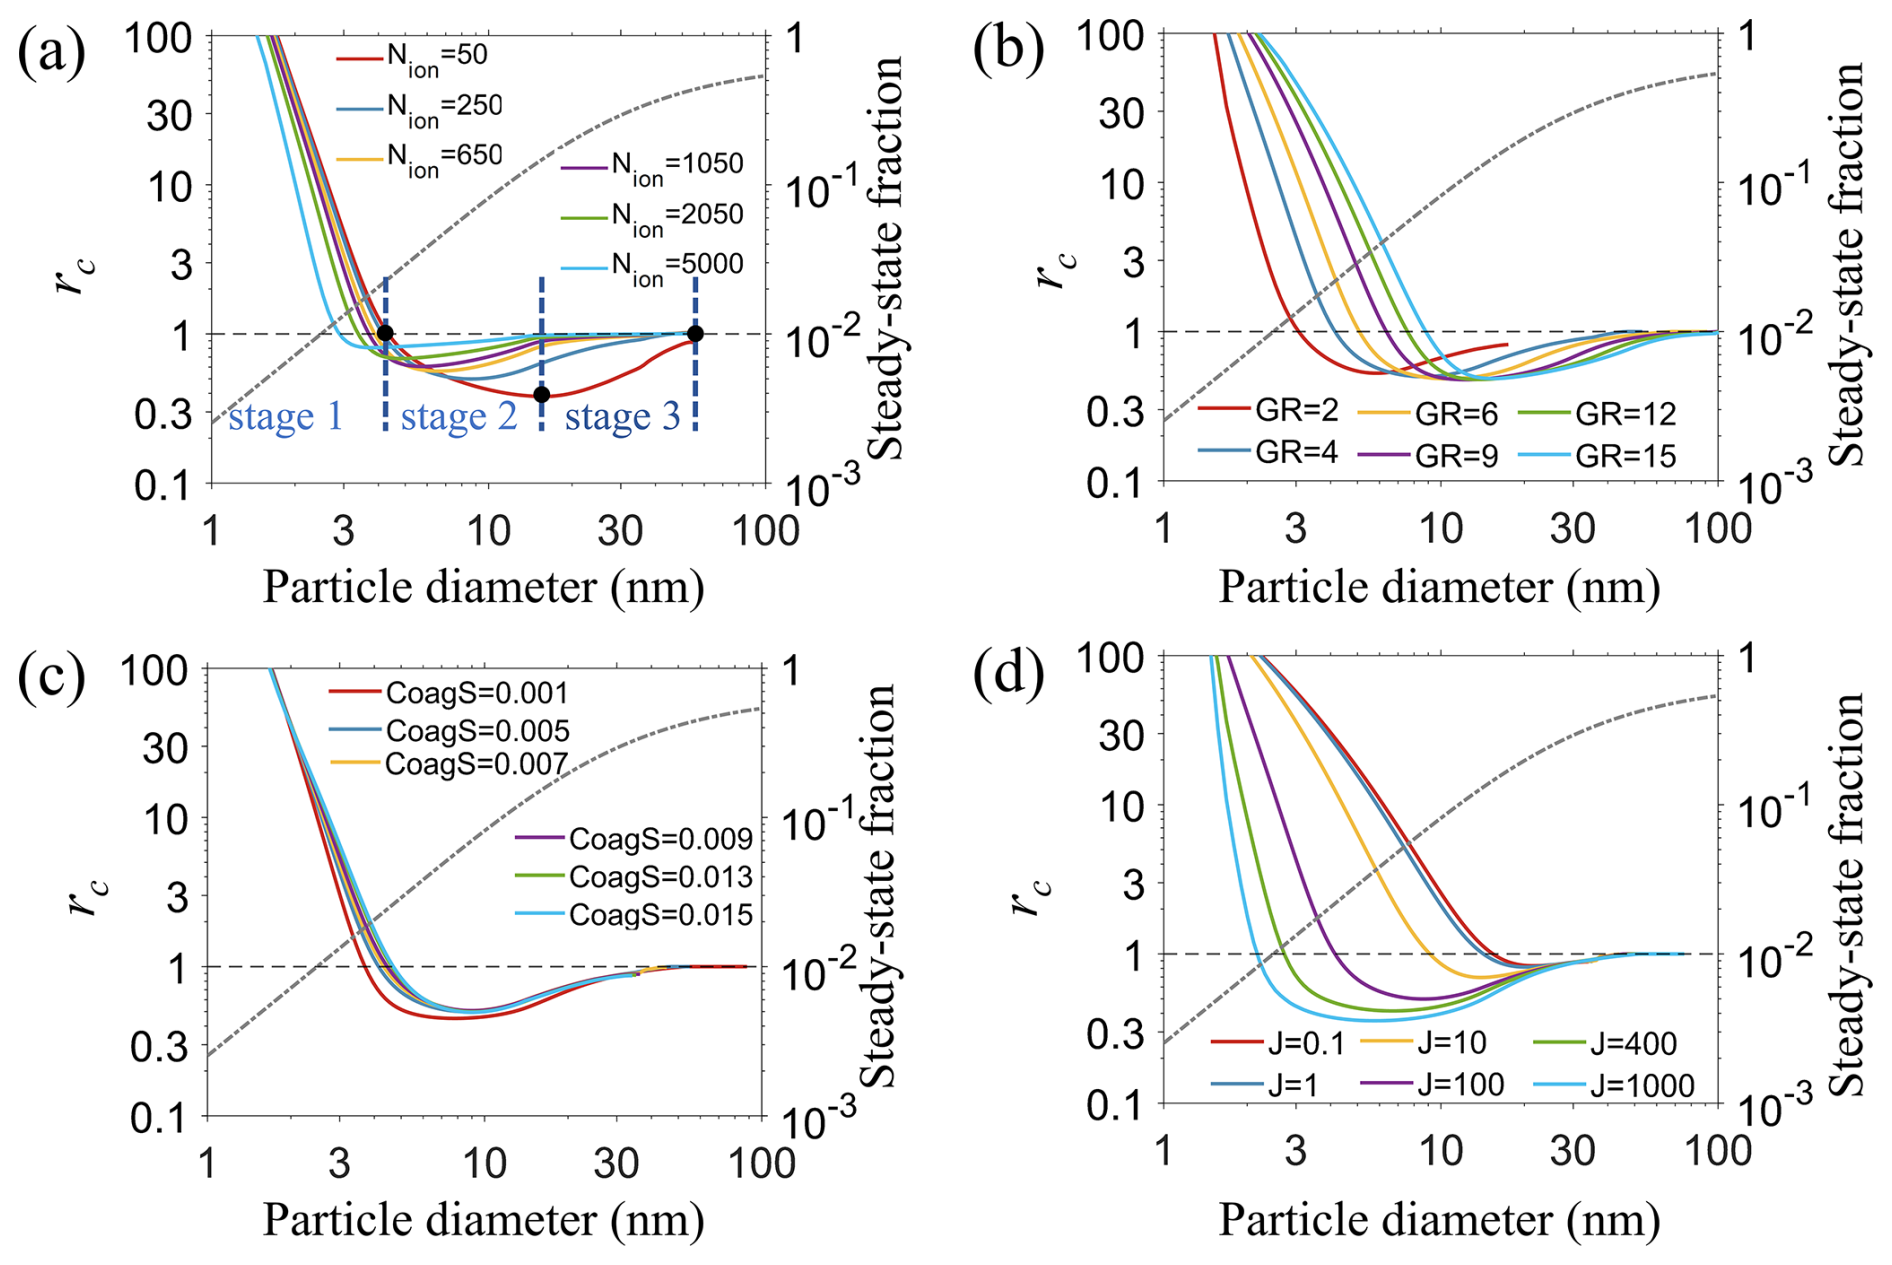
Figure 4rc as a function of particle diameter at different IIN conditions: (a) GR = 4 nm h−1, CoagS = 0.005 s−1, J = 100 cm−3 s−1, (b) Nion = 250 cm−3, CoagS = 0.005 s−1, J = 100 cm−3 s−1, (c) Nion = 250 cm−3, GR = 4 nm h−1, J = 100 cm−3 s−1, (d) Nion = 250 cm−3, CoagS = 0.005 s−1, GR = 4 nm h−1. The nucleation rate J is the sum of the formation rates of the positive and negative particles. The units for Nion, GR, CoagS, and J in the figure legends are cm−3, nm h−1, s−1, and cm−3 s−1, respectively. For reference, the steady-state singly charged fractions of particles are also plotted as a function of size (dot-dash lines, right y axis). The absolute singly charged fraction of the particles can be obtained by multiplying rc by the steady-state charge fraction.
Variation of different simulation parameters alters the rc curves to different extents. Figure 4a indicates that higher Nion increases rc,min and restores rc to the steady-state values faster than lower Nion. This phenomenon occurs because as Nion increases, the ion effect becomes greater, and the coagulation between oppositely charged particles becomes comparatively less important. Figure 4b shows that the increase in GR causes rc,min to move to the right but does not significantly change the value of rc,min. This relationship between GR and rc,min means that GR does not strongly impact the coagulation effect. Figure 4c shows that CoagS increases rc,min to a smaller extent. Higher CoagS corresponds to larger consumption of the particles and lower particle concentration, hence depressing the coagulation effect. Lastly, Fig. 4d indicates that the larger the J values, the smaller rc,min becomes. As J increases, the coagulation effect becomes appreciably stronger because it is proportional to the particle number concentration squared. The minimum rc,min values also appear at smaller sizes as the higher particle concentration causes the coagulation between the charged particles to proceed at a faster rate.
In addition to charge state, the interactions between particles and atmospheric ions can also influence particle number concentration and size during NPF events. To quantify such effects, we compared the particle number concentration and mode diameters in simulations with and without considering particle charging (Sect. S5). This comparison suggests that particle charging has almost a negligible influence on the mode diameter. However, although the particle number concentrations also remain largely unaffected during neutral NPF, it can experience a considerable decrease during IIN due to the strong coagulation between oppositely charged particles.
3.2 Prediction of particle charge fraction with ResNet
Using simulated results as training data, we developed several ResNet-based regression models, collectively referred to as ResFWD. Each of these models can predict rc value for a specific particle size. Figure 5a–d compare the rc values calculated with ResFWD, the analytical expression (i.e., Eq. 11), and CDMS-ion for FIIN < 0.2 and J < 10 cm−3 s−1. FIIN and J are limited to small values because Eq. (11) was developed to cope with the situation with a low fraction of charged particles (Kerminen et al., 2007). The rc values calculated with ResFWD (rc,ML) align closely with those simulated by CDMS-ion (rc,sim), demonstrating the neural network's ability to capture the nonlinear relationship between rc and the key parameters including FIIN, GR, Nion, J, and CoagS. In contrast, the values calculated with Eq. (11) (rc,Anal) deviate significantly from rc,sim, and this discrepancy grows larger with particle size. This suggests that as the particles grow, the simulation conditions deviate farther away from the underlying assumption of Eq. (11). As shown in Fig. S7, rc,Anal tends to be larger than rc,sim in the entire range of FIIN and J. Such overestimation of rc by the analytical equation may arise from its inability to account for the strong coagulation between charged particles, especially when a large fraction of the particle population are charged. Another cause for the overestimation could be that Eq. (11) was developed based on the charge state of the smallest particles rather than FIIN (the former is the ratio of charged particle concentration to the total particle concentration in the smallest size bin, while the latter is a ratio of fluxes). A comparison of these two values is shown in Fig. S9.
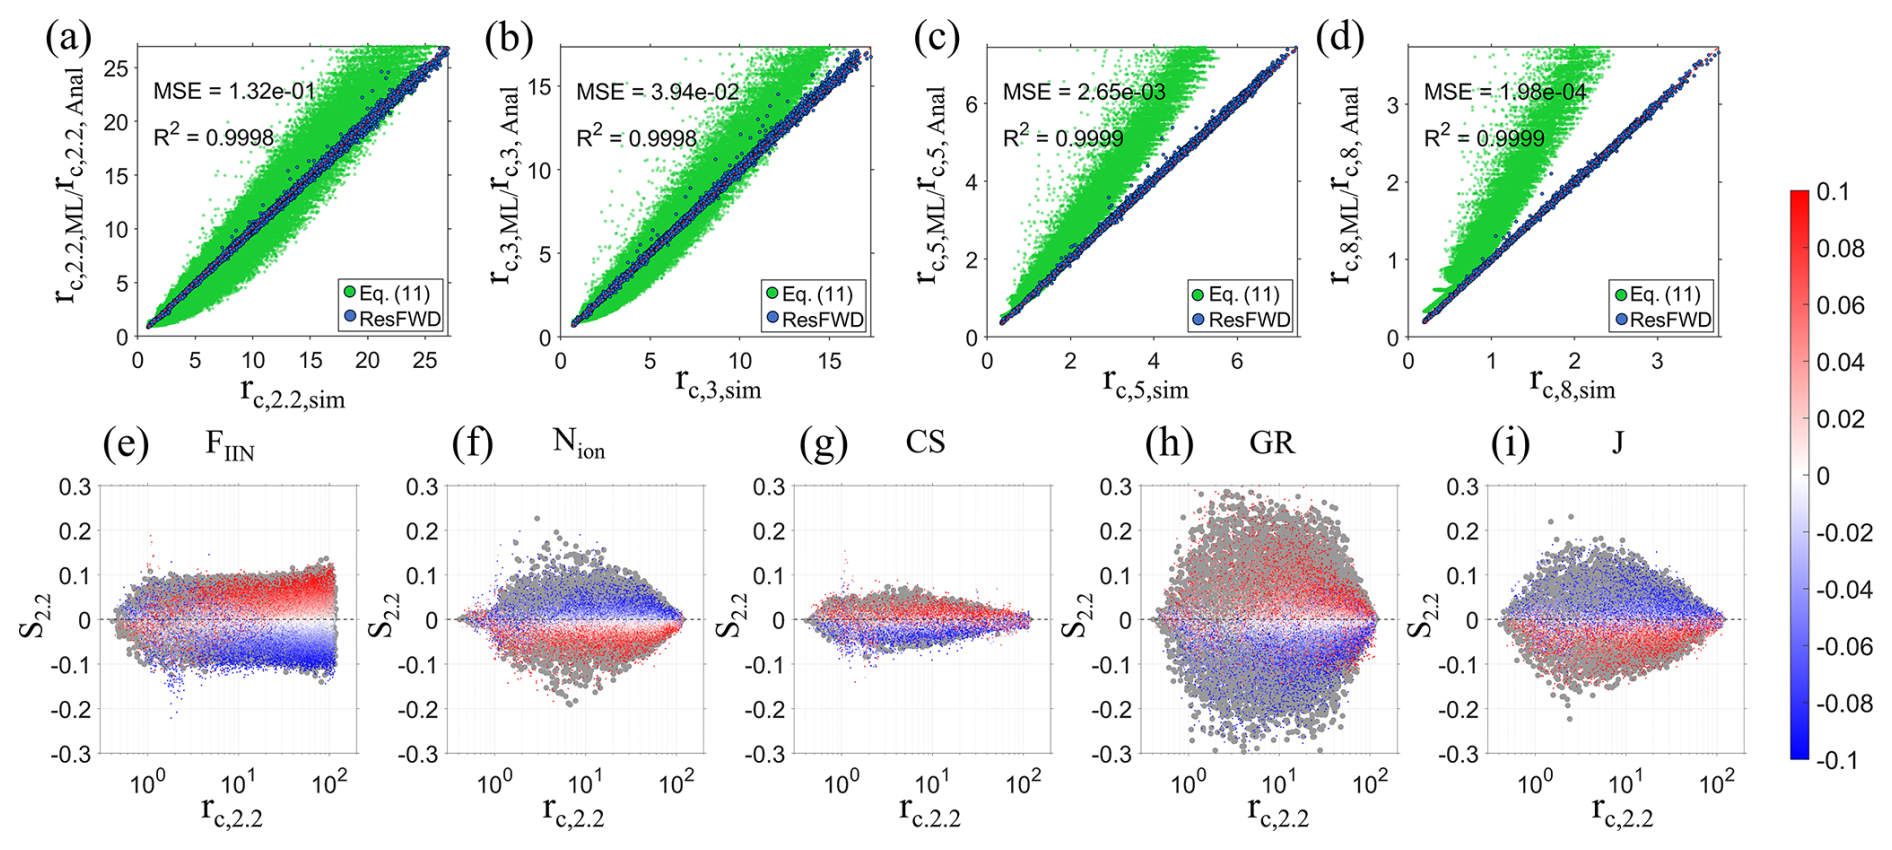
Figure 5(a–d) Comparison between the simulated rc (rc,sim), the ResFWD-predicted rc (rc,ML), and the rc calculated with Eq. (11) (rc,Anal) at particle diameters of 2.2, 3, 5, and 8 nm. The numbers in the subscript of rc denote the particle size. The R2 and MSE obtained from testing the ResFWD model against rc,sim are shown in the panels. (e–i) Sensitivity of to −10 % to 10 % variations of model input. The color bar indicates the degree of variation quantified by S2.2 = . The colored dots are calculated with ResFWD, while grey dots are obtained by changing the CDMS-ion input by either 10 % or −10 %.
Figure 5e–i present sensitivity analysis of rc,2.2 in response to variations of different model inputs. This analysis is crucial for (1) assessing whether ResFWD overfits the training data and (2) evaluating its susceptibility to input noise – an inevitable factor in field data – compared to the benchmark model CDMS-ion. In these figures, colored dots represent the fractional change in (denoted as ) when ResFWD inputs are randomly varied between −10 % and +10 %, while grey dots reflect the fractional change in (denoted as ) resulting from variations in CDMS-ion inputs at two extreme values, i.e., +10 % and −10 %. Figure 5e–i demonstrate that envelops (the grey dots put a limit on the colored dots), indicating that ResFWD exhibits a response to input noise, similar to that of CDMS-ion. Moreover, both and display comparable variations as functions of rc,2.2.
Figure 5e shows that S2.2 initially increases with rc,2.2 and subsequently stabilizes. This behavior suggests that when initial particle charge information is obscured by interactions with atmospheric ions during growth (leading to low rc,2.2 values), FIIN has a minimal effect on rc,2.2. However, when charge information is preserved during growth (higher rc,2.2 values), rc,2.2 scales near linearly with FIIN and also varies between −10 % and 10 %. Conversely, when varying Nion, GR, CoagS, and J, S2.2 initially increases with rc,2.2 and then decreases (Fig. 5f–i). This indicates that rc,2.2 is relatively insensitive to variations of these parameters when particle interactions with atmospheric ions are either highly effective (resulting in low rc,2.2 values) or ineffective (leading to high rc,2.2 values). Comparisons between Fig. 5 panels (e)–(i) further reveal that rc,2.2 is sensitive to variations in GR, Nion, and J, but not to CoagS: a 10 % variation in CoagS results in less than an 8 % change in rc,2.2. This finding aligns with Fig. 4, which indicates that simulations with differing GR, Nion, and J values yield well-separated curves, while varying CoagS values only change the curves slightly.
Despite good agreement with the benchmark model, the applicability of the ResFWD is limited by the data used for its training. For instance, we have assumed constant ion concentration during NPF, which in reality changes due to varying ion production and loss rates in the atmosphere. Observations suggest that NPF often concurs with a decrease in the concentration of small ions, and the extent of decrease varies between different field campaigns. (Note that for continental stations, the ion concentration usually has the highest value in the morning and lowest value in the afternoon, possibly due to the variation of radon concentration (Hõrrak et al., 2003). This general trend of ion concentration decrease proceeds simultaneously with many NPF events.) Data from the Tahkuse Observatory in the warm season of 1994 show that the concentration of small cluster ions (mobility between 1.3 and 3.14 cm2 V−1 s−1) decreased by approximately 20 % from 08:00 to 12:00 local time (LT) (Hõrrak et al., 2003). Huang et al. (2022) show that the concentration of ions (mobility between 0.5 and 3.14 cm2 V−1 s−1) decreases less than 25 % within during NPF events. Recently, Zhang et al. (2025) reported that the median of ion concentration (mobility between 0.5 and 3.14 cm2 V−1 s−1) decreased by less than 10 % from 09:00 and 15:00 LT during event days at the SMEAR II station, and less than 25 % at the SORPES station.
According to the field observations, it is reasonable to assume that in a typical NPF event, the ion concentration varies by ±10 % around its mean value. Based on our sensitivity analysis (Fig. 5f), a ±10 % variation of Nion leads to an uncertainty of FIIN mostly by less than ±20 %. However, to develop a rigorous quantitative relation between input variation and the particle charge fraction, further simulations with time-varying inputs are needed. Additionally, we did not consider scenarios where the mobilities and concentrations of atmospheric positive and negative ions differ, restricting the direct application of ResFWD in these cases. The applicability of ResFWD can be further expanded by training the neural network with a larger dataset that includes the above considerations.
3.3 ResNet-assisted inference of FIIN
During field measurements of atmospheric NPF, the charge fraction and its ratio to the steady-state charge fraction (rc) can be measured across different particle sizes (Leppä et al., 2013; Iida et al., 2006). To infer FIIN from these measurements, the traditional approach involves identifying the optimal FIIN value that best fits Eq. (11) to the measured rc. In this study, we utilize simulated rc values at 2.2, 3, 4, 5, 6, 7, and 8 nm as inputs to directly infer FIIN using ResBWD. Alongside particle charge fractions, additional inputs to the ResNet model include GR, Nion, J, and CoagS (Fig. 1d).
As particles grow, the information of their initial charge fraction can be obscured by interaction with atmospheric ions. This is demonstrated by the rc–dp curves in Fig. S8a, which shows that despite the different FIIN (from 0 % to 20 %), the particle charge fraction already converges to the steady-state value (i.e., rc = 1) at dp = 2.2 nm at a high ion concentration (Nion = 5000 cm−3). In this case, it becomes impossible to infer FIIN from the observed particle charge state since they are non-distinguishable. In contrast, at a lower ion concentration (Nion = 450 cm−3), the rc–dp values are still well separated at 2.2 nm; hence one can deduce FIIN from the rc in this case. In general, for closely spaced rc–dp curves at 2.2 nm, the neural network would find it difficult to utilize their difference to infer FIIN. With these considerations, we define a parameter χ as the change of particle charge fraction at 2.2 nm when FIIN changes by 1 %, which essentially characterizes the amount of information (regarding FIIN) that is still retained as the particle size reaches 2.2 nm. The larger χ is, the further apart the rc–dp curves are, and the more accurately the neural network can infer FIIN.
Figure 6a and b compare ResBWD-predicted FIIN and the true FIIN for χ = 0.11 % and χ = 0.55 %, respectively, demonstrating good agreement regardless of the χ employed. This indicates that ResBWD effectively captures the nonlinear relationship between the charge state of grown particles and FIIN, even when the initial charge information is largely lost (Fig. 6a, χ = 0.11 %). However, further sensitivity tests (Fig. 6c–h) reveal that noise in input parameters to ResBWD (i.e., random noises of rc,2.2, rc,5, rc,8 within −10 % to +10 %) results in FIIN variations primarily ranging from −10 % to +10 % for χ = 0.55 % (lower panels), whereas this variation increases to −20 % to +20 % for χ = 0.11 % (upper panels). This suggests that as initial particle charge information is more obscured due to stronger particle interactions with atmospheric ions, the deduction of FIIN from measured charge fractions becomes increasingly uncertain. In other words, when the rc–dp curves (see Fig. S8 for such curves) are closely spaced, a small variation of rc may correspond to a large variation of FIIN. At very low FIIN values (∼ 0.01), high sensitivity for both χ = 0.11 % and χ = 0.55 % is observed in Fig. 6c–h. This is as expected since the screening criterion ensures the training data have an FIIN resolution on the order of 1 %; hence at low FIIN values (close to 1 %) ResBWD is more sensitive to noises. Further comparisons of panels (d), (f), and (h) (or panels c, e, and g) indicate that rc,2.2 is a more critical parameter for FIIN inference than rc,5 and rc,8, as it retains the most information about FIIN.
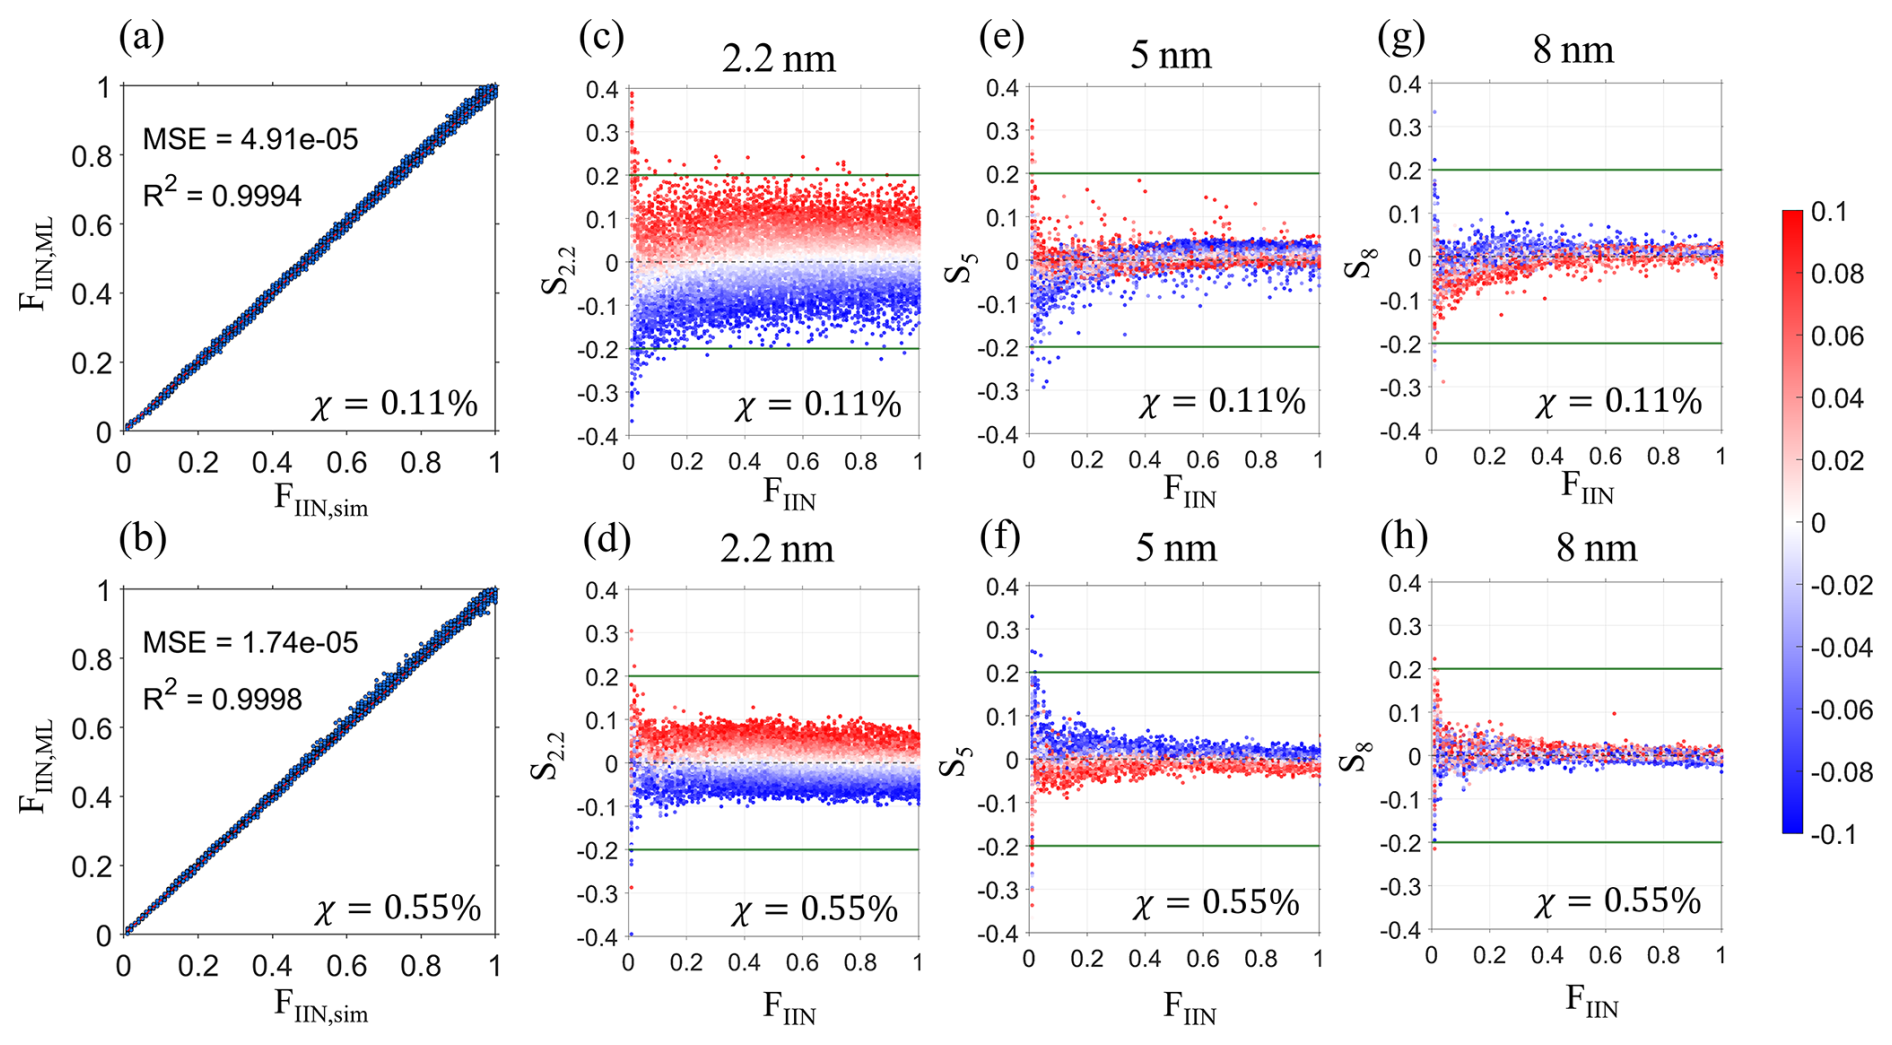
Figure 6(a–b) Comparison between the predicted FIIN by ResBWD and the true FIIN used in CDMS-ion simulation. The upper and lower panels correspond to χ values of 0.11 % and 0.55 %, respectively. (c–h) Sensitivity of FIIN to noises of inputs including rc,5, and rc,8. The sensitivity is defined as Sx = , with the subscript x denoting the size at which rc is varied. The green reference lines indicate Sx values of ±0.2.
Overall, predicting FIIN from known rc values necessitates more stringent conditions than the reverse process. This challenge stems from the loss of initial charge information as particles increase in size. To find parameter sets of GR, Nion, J, and CoagS which meet the screening criteria, the ResFWD model can be employed to calculate χ.
In this study, we developed a two-dimensional sectional model, CDMS-ion, to simulate particle growth as influenced by atmospheric ions. Using this model, we first explored the general characteristics of particle charge state evolution. Our findings reveal that particle growth rate and ion concentration have the most significant effects on particle charge. Notably, when the number concentration of charged particles is high, the ratio of the particle charge fraction to the steady-state value can drop substantially below 1 due to coagulation between oppositely charged particles. Furthermore, atmospheric new particles cannot be treated as if they are at steady-state charge distribution until they grow to a certain size (Eq. S13 in the Supplement).
Using the extensive dataset generated by CDMS-ion, we trained two types of neural network models. The first model, ResFWD, predicts the particle charge state as the particles grow, under the assumption that the fraction of ion-induced nucleation is known. This model effectively captures the nonlinearity of the particle charging process and shows good agreement with model simulations. Compared to existing analytical equations, ResFWD demonstrates improved accuracy, particularly at high FIIN and J conditions. Therefore, this approach can serve as a reliable alternative to the analytical equation when the assumptions inherent in the training data are met.
The second model, ResBWD, predicts the fraction of ion-induced nucleation using particle charge fractions measured at several sizes. This prediction is more challenging compared to ResFWD because the initial charge information of new particles may be lost as they grow. However, by restricting the application of the model to cases where initial charge information is relatively well preserved (this screening can be completed with ResFWD), we can achieve accurate predictions of FIIN with reasonable sensitivity to noises in the input parameters .
This work represents an initial effort to describe the dynamic charging process of atmospheric new particles with machine learning tools. With these tools, one can calculate the charge state of the new particles as they grow or use observed particle charge state to deduce the rates of ion-induced nucleation, which is a major particle formation mechanism on the global scale. Note that our simplifications of the NPF processes include constant nucleation rates, constant atmospheric ion concentrations, and equal ion concentrations and mobilities. Future endeavors to develop more comprehensive ML models should take these complexities into account.
All the data needed to reproduce the figures can be found at https://doi.org/10.5281/zenodo.15024817 (Wang, 2025).
The supplement related to this article is available online at https://doi.org/10.5194/acp-25-7431-2025-supplement.
CL proposed this study. PW and CL wrote the simulation program and performed the simulation. All authors participated in the discussion of the results and contributed to the writing of the paper.
At least one of the (co-)authors is a member of the editorial board of Atmospheric Chemistry and Physics. The peer-review process was guided by an independent editor, and the authors also have no other competing interests to declare.
Publisher’s note: Copernicus Publications remains neutral with regard to jurisdictional claims made in the text, published maps, institutional affiliations, or any other geographical representation in this paper. While Copernicus Publications makes every effort to include appropriate place names, the final responsibility lies with the authors.
The computations in this paper were run on the Siyuan-1 cluster supported by the Center for High Performance Computing at Shanghai Jiao Tong University.
This research has been supported by the National Key Research and Development Program of China (grant no. 2022YFC3704100), the National Natural Science Foundation of China (grant no. 22206120), the State Key Joint Laboratory of Environmental Simulation and Pollution Control, Samsung PM2.5 SRP, and the ACCC Flagship funded by the Academy of Finland (grant no. 337549).
This paper was edited by Kelley Barsanti and reviewed by two anonymous referees.
Chahl, H. S. and Gopalakrishnan, R.: High potential, near free molecular regime Coulombic collisions in aerosols and dusty plasmas, Aerosol Sci. Technol., 53, 933–957, https://doi.org/10.1080/02786826.2019.1614522, 2019.
Chen, X. and Jiang, J.: Retrieving the ion mobility ratio and aerosol charge fractions for a neutralizer in real-world applications, Aerosol Sci. Technol., 52, 1145–1155, https://doi.org/10.1080/02786826.2018.1498587, 2018.
Chu, B., Kerminen, V.-M., Bianchi, F., Yan, C., Petäjä, T., and Kulmala, M.: Atmospheric new particle formation in China, Atmos. Chem. Phys., 19, 115–138, https://doi.org/10.5194/acp-19-115-2019, 2019.
Eisenbud, M. and Gesell, T. F.: Environmental radioactivity from natural, industrial and military sources: from natural, industrial and military sources, Elsevier, ISBN 9780122351549, 1997.
Gagné, S., Leppä, J., Petäjä, T., McGrath, M. J., Vana, M., Kerminen, V.-M., Laakso, L., and Kulmala, M.: Aerosol charging state at an urban site: new analytical approach and implications for ion-induced nucleation, Atmos. Chem. Phys., 12, 4647–4666, https://doi.org/10.5194/acp-12-4647-2012, 2012.
Gatti, M. and Kortshagen, U.: Analytical model of particle charging in plasmas over a wide range of collisionality, Phys. Rev. E, 78, 046402, https://doi.org/10.1103/PhysRevE.78.046402, 2008.
Gautam, A. S., Siingh, D., and Kamra, A. K.: Statistical analysis of the atmospheric ion concentrations and mobility distributions at a tropical station, Pune, Q. J. Roy. Meteor. Soc., 143, 2116–2128, https://doi.org/10.1002/qj.3071, 2017.
Golubenko, K., Rozanov, E., Mironova, I., Karagodin, A., and Usoskin, I.: Natural Sources of Ionization and Their Impact on Atmospheric Electricity, Geophys. Res. Lett., 47, e2020GL088619, https://doi.org/10.1029/2020GL088619, 2020.
Gopalakrishnan, R. and Hogan, C. J.: Determination of the Transition Regime Collision Kernel from Mean First Passage Times, Aerosol Sci. Technol., 45, 1499–1509, https://doi.org/10.1080/02786826.2011.601775, 2011.
Gopalakrishnan, R. and Hogan, C. J.: Coulomb-influenced collisions in aerosols and dusty plasmas, Phys. Rev. E, 85, 026410, https://doi.org/10.1103/PhysRevE.85.026410, 2012.
Gordon, H., Kirkby, J., Baltensperger, U., Bianchi, F., Breitenlechner, M., Curtius, J., Dias, A., Dommen, J., Donahue, N. M., Dunne, E. M., Duplissy, J., Ehrhart, S., Flagan, R. C., Frege, C., Fuchs, C., Hansel, A., Hoyle, C. R., Kulmala, M., Kürten, A., Lehtipalo, K., Makhmutov, V., Molteni, U., Rissanen, M. P., Stozkhov, Y., Tröstl, J., Tsagkogeorgas, G., Wagner, R., Williamson, C., Wimmer, D., Winkler, P. M., Yan, C., and Carslaw, K. S.: Causes and importance of new particle formation in the present-day and preindustrial atmospheres, J. Geophys. Res.-Atmos., 122, 8739–8760, https://doi.org/10.1002/2017JD026844, 2017.
He, K., Zhang, X., Ren, S., and Sun, J.: Deep residual learning for image recognition, in: Proceedings of the IEEE Conference on Computer Vision and Pattern Recognition (CVPR), Las Vegas, NV, USA, 27–30 June 2016, IEEE, 770–778, 2016.
Hirsikko, A., Nieminen, T., Gagné, S., Lehtipalo, K., Manninen, H. E., Ehn, M., Hõrrak, U., Kerminen, V.-M., Laakso, L., McMurry, P. H., Mirme, A., Mirme, S., Petäjä, T., Tammet, H., Vakkari, V., Vana, M., and Kulmala, M.: Atmospheric ions and nucleation: a review of observations, Atmos. Chem. Phys., 11, 767–798, https://doi.org/10.5194/acp-11-767-2011, 2011.
Hõrrak, U., Salm, J., and Tammet, H.: Diurnal variation in the concentration of air ions of different mobility classes in a rural area, J. Geophys. Res.-Atmos., 108, 4653, https://doi.org/10.1029/2002JD003240, 2003.
Huang, X., Ge, X., Liu, D., Tong, L., Nie, D., Shen, F., Yang, M., Wu, Y., Xiao, H., and Yu, H.: Atmospheric particle number size distribution and size-dependent formation rate and growth rate of neutral and charged new particles at a coastal site of eastern China, Atmos. Environ., 270, 118899, https://doi.org/10.1016/j.atmosenv.2021.118899, 2022.
Iida, K., Stolzenburg, M., McMurry, P., Dunn, M. J., Smith, J. N., Eisele, F., and Keady, P.: Contribution of ion-induced nucleation to new particle formation: Methodology and its application to atmospheric observations in Boulder, Colorado, J. Geophys. Res.-Atmos., 111, D23201, https://doi.org/10.1029/2006JD007167, 2006.
Jacobson, M. Z.: A Solution to the Problem of Nonequilibrium Acid/Base Gas-Particle Transfer at Long Time Step, Aerosol Sci. Technol., 39, 92-103, https://doi.org/10.1080/027868290904546, 2005.
Jacobson, M. Z., Turco, R. P., Jensen, E. J., and Toon, O. B.: Modeling coagulation among particles of different composition and size, Atmos. Environ., 28, 1327–1338, 1994.
Jiang, S., Liu, Y.-R., Huang, T., Feng, Y.-J., Wang, C.-Y., Wang, Z.-Q., Ge, B.-J., Liu, Q.-S., Guang, W.-R., and Huang, W.: Towards fully ab initio simulation of atmospheric aerosol nucleation, Nat. Commun., 13, 6067, -10.1038/s41467-022-33783-y, 2022.
Joutsensaari, J., Ozon, M., Nieminen, T., Mikkonen, S., Lähivaara, T., Decesari, S., Facchini, M. C., Laaksonen, A., and Lehtinen, K. E. J.: Identification of new particle formation events with deep learning, Atmos. Chem. Phys., 18, 9597–9615, https://doi.org/10.5194/acp-18-9597-2018, 2018.
Kelp, M. M., Tessum, C. W., and Marshall, J. D.: Orders-of-magnitude speedup in atmospheric chemistry modeling through neural network-based emulation, arXiv [preprint], https://doi.org/10.48550/arXiv.1808.03874, 11 August 2018.
Kerminen, V.-M., Anttila, T., Petäjä, T., Laakso, L., Gagné, S., Lehtinen, K. E. J., and Kulmala, M.: Charging state of the atmospheric nucleation mode: Implications for separating neutral and ion-induced nucleation, J. Geophys. Res.-Atmos., 112, D21205, https://doi.org/10.1029/2007JD008649, 2007.
Kerminen, V.-M., Chen, X., Vakkari, V., Petäjä, T., Kulmala, M., and Bianchi, F.: Atmospheric new particle formation and growth: review of field observations, Environ. Res. Lett., 13, 103003, https://doi.org/10.1088/1748-9326/aadf3c, 2018.
Kirkby, J., Duplissy, J., Sengupta, K., Frege, C., Gordon, H., Williamson, C., Heinritzi, M., Simon, M., Yan, C., Almeida, J., Tröstl, J., Nieminen, T., Ortega, I. K., Wagner, R., Adamov, A., Amorim, A., Bernhammer, A.-K., Bianchi, F., Breitenlechner, M., Brilke, S., Chen, X., Craven, J., Dias, A., Ehrhart, S., Flagan, R. C., Franchin, A., Fuchs, C., Guida, R., Hakala, J., Hoyle, C. R., Jokinen, T., Junninen, H., Kangasluoma, J., Kim, J., Krapf, M., Kürten, A., Laaksonen, A., Lehtipalo, K., Makhmutov, V., Mathot, S., Molteni, U., Onnela, A., Peräkylä, O., Piel, F., Petäjä, T., Praplan, A. P., Pringle, K., Rap, A., Richards, N. A. D., Riipinen, I., Rissanen, M. P., Rondo, L., Sarnela, N., Schobesberger, S., Scott, C. E., Seinfeld, J. H., Sipilä, M., Steiner, G., Stozhkov, Y., Stratmann, F., Tomé, A., Virtanen, A., Vogel, A. L., Wagner, A. C., Wagner, P. E., Weingartner, E., Wimmer, D., Winkler, P. M., Ye, P., Zhang, X., Hansel, A., Dommen, J., Donahue, N. M., Worsnop, D. R., Baltensperger, U., Kulmala, M., Carslaw, K. S., and Curtius, J.: Ion-induced nucleation of pure biogenic particles, Nature, 533, 521–526, https://doi.org/10.1038/nature17953, 2016.
Kubečka, J., Neefjes, I., Besel, V., Qiao, F., Xie, H.-B., and Elm, J.: Atmospheric Sulfuric Acid–Multi-Base New Particle Formation Revealed through Quantum Chemistry Enhanced by Machine Learning, J. Phys. Chem. A, 127, 2091–2103, https://doi.org/10.1021/acs.jpca.3c00068, 2023.
Kulmala, M., Kerminen, V. M., Petäjä, T., Ding, A. J., and Wang, L.: Atmospheric gas-to-particle conversion: why NPF events are observed in megacities?, Faraday Discuss., 200, 271–288, https://doi.org/10.1039/C6FD00257A, 2017.
Laakso, L., Gagné, S., Petäjä, T., Hirsikko, A., Aalto, P. P., Kulmala, M., and Kerminen, V.-M.: Detecting charging state of ultra-fine particles: instrumental development and ambient measurements, Atmos. Chem. Phys., 7, 1333–1345, https://doi.org/10.5194/acp-7-1333-2007, 2007.
Lee, S. H., Reeves, J. M., Wilson, J. C., Hunton, D. E., Viggiano, A. A., Miller, T. M., Ballenthin, J. O., and Lait, L. R.: Particle Formation by Ion Nucleation in the Upper Troposphere and Lower Stratosphere, Science, 301, 1886–1889, https://doi.org/10.1126/science.1087236, 2003.
Leppä, J., Kerminen, V.-M., Laakso, L., Korhonen, H., Lehtinen, K. E., Gagné, S., Manninen, H. E., Nieminen, T., and Kulmala, M.: Ion-UHMA: a model for simulating the dynamics of neutral and charged aerosol particles, Boreal Environ. Res., 14, 559–575, 2009.
Leppä, J., Anttila, T., Kerminen, V.-M., Kulmala, M., and Lehtinen, K. E. J.: Atmospheric new particle formation: real and apparent growth of neutral and charged particles, Atmos. Chem. Phys., 11, 4939–4955, https://doi.org/10.5194/acp-11-4939-2011, 2011.
Leppä, J., Gagné, S., Laakso, L., Manninen, H. E., Lehtinen, K. E. J., Kulmala, M., and Kerminen, V.-M.: Using measurements of the aerosol charging state in determination of the particle growth rate and the proportion of ion-induced nucleation, Atmos. Chem. Phys., 13, 463–486, https://doi.org/10.5194/acp-13-463-2013, 2013.
Li, C. and McMurry, P. H.: Errors in nanoparticle growth rates inferred from measurements in chemically reacting aerosol systems, Atmos. Chem. Phys., 18, 8979–8993, https://doi.org/10.5194/acp-18-8979-2018, 2018.
Li, C., Li, Y., Li, X., Cai, R., Fan, Y., Qiao, X., Yin, R., Yan, C., Guo, Y., Liu, Y., Zheng, J., Kerminen, V.-M., Kulmala, M., Xiao, H., and Jiang, J.: Comprehensive simulations of new particle formation events in Beijing with a cluster dynamics–multicomponent sectional model, Atmos. Chem. Phys., 23, 6879–6896, https://doi.org/10.5194/acp-23-6879-2023, 2023.
Li, Y., Chen, X., and Jiang, J.: Measuring size distributions of atmospheric aerosols using natural air ions, Aerosol Sci. Technol., 56, 655–664, https://doi.org/10.1080/02786826.2022.2060795, 2022.
Liu, C., Zhang, H., Cheng, Z., Shen, J., Zhao, J., Wang, Y., Wang, S., and Cheng, Y.: Emulation of an atmospheric gas-phase chemistry solver through deep learning: Case study of Chinese Mainland, Atmos. Pollut. Res., 12, 101079, https://doi.org/10.1016/j.apr.2021.101079, 2021.
Liu, Y., Attoui, M., Yang, K., Chen, J., Li, Q., and Wang, L.: Size-resolved chemical composition analysis of ions produced by a commercial soft X-ray aerosol neutralizer, J. Aerosol Sci., 147, 105586, https://doi.org/10.1016/j.jaerosci.2020.105586, 2020.
López-Yglesias, X. and Flagan, R. C.: Ion–Aerosol Flux Coefficients and the Steady-State Charge Distribution of Aerosols in a Bipolar Ion Environment, Aerosol Sci. Technol., 47, 688–704, https://doi.org/10.1080/02786826.2013.783684, 2013.
Luts, A., Parts, T.-E., Hõrrak, U., Junninen, H., and Kulmala, M.: Composition of negative air ions as a function of ion age and selected trace gases: Mass- and mobility distribution, J. Aerosol Sci., 42, 820–838, https://doi.org/10.1016/j.jaerosci.2011.07.007, 2011.
Mahfouz, N. G. A. and Donahue, N. M.: Atmospheric Nanoparticle Survivability Reduction Due to Charge-Induced Coagulation Scavenging Enhancement, Geophys. Res. Lett., 48, e2021GL092758, https://doi.org/10.1029/2021GL092758, 2021.
Matsui, H.: Development of a global aerosol model using a two-dimensional sectional method: 1. Model design, J. Adv. Model. Earth Sy., 9, 1921–1947, https://doi.org/10.1002/2017MS000936, 2017.
Matsui, H. and Mahowald, N.: Development of a global aerosol model using a two-dimensional sectional method: 2. Evaluation and sensitivity simulations, J. Adv. Model. Earth Sy., 9, 1887–1920, https://doi.org/10.1002/2017MS000937, 2017.
Matsui, H., Koike, M., Kondo, Y., Moteki, N., Fast, J. D., and Zaveri, R. A.: Development and validation of a black carbon mixing state resolved three-dimensional model: Aging processes and radiative impact, J. Geophys. Res.-Atmos., 118, 2304–2326, 2013.
Nadykto, A. B. and Yu, F.: Uptake of neutral polar vapor molecules by charged clusters/particles: Enhancement due to dipole-charge interaction, J. Geophys. Res.-Atmos., 108, 4717, https://doi.org/10.1029/2003JD003664, 2003.
Oberreit, D., Rawat, V. K., Larriba-Andaluz, C., Ouyang, H., McMurry, P. H., and Hogan Jr., C. J.: Analysis of heterogeneous water vapor uptake by metal iodide cluster ions via differential mobility analysis-mass spectrometry, J. Chem. Phys., 143, 104204, https://doi.org/10.1063/1.4930278, 2015.
Ouyang, H., Gopalakrishnan, R., and Hogan, C. J.: Nanoparticle collisions in the gas phase in the presence of singular contact potentials, J. Chem. Phys., 137, 064316, https://doi.org/10.1063/1.4742064, 2012.
Pfeifer, J., Mahfouz, N. G. A., Schulze, B. C., Mathot, S., Stolzenburg, D., Baalbaki, R., Brasseur, Z., Caudillo, L., Dada, L., Granzin, M., He, X.-C., Lamkaddam, H., Lopez, B., Makhmutov, V., Marten, R., Mentler, B., Müller, T., Onnela, A., Philippov, M., Piedehierro, A. A., Rörup, B., Schervish, M., Tian, P., Umo, N. S., Wang, D. S., Wang, M., Weber, S. K., Welti, A., Wu, Y., Zauner-Wieczorek, M., Amorim, A., El Haddad, I., Kulmala, M., Lehtipalo, K., Petäjä, T., Tomé, A., Mirme, S., Manninen, H. E., Donahue, N. M., Flagan, R. C., Kürten, A., Curtius, J., and Kirkby, J.: Measurement of the collision rate coefficients between atmospheric ions and multiply charged aerosol particles in the CERN CLOUD chamber, Atmos. Chem. Phys., 23, 6703–6718, https://doi.org/10.5194/acp-23-6703-2023, 2023.
Simmel, M. and Wurzler, S.: Condensation and activation in sectional cloud microphysical models, Atmos. Res., 80, 218–236, https://doi.org/10.1016/j.atmosres.2005.08.002, 2006.
Stolzenburg, M. R., McMurry, P. H., Sakurai, H., Smith, J. N., Mauldin, R. L., Eisele, F. L., and Clement, C. F.: Growth rates of freshly nucleated atmospheric particles in Atlanta, J. Geophys. Res.-Atmos., 110, D22S05, https://doi.org/10.1029/2005JD005935, 2005.
Stozhkov, Y. I.: The role of cosmic rays in the atmospheric processes, J. Phys. G Nucl. Partic., 29, 913, https://doi.org/10.1088/0954-3899/29/5/312, 2003.
Su, P., Joutsensaari, J., Dada, L., Zaidan, M. A., Nieminen, T., Li, X., Wu, Y., Decesari, S., Tarkoma, S., Petäjä, T., Kulmala, M., and Pellikka, P.: New particle formation event detection with Mask R-CNN, Atmos. Chem. Phys., 22, 1293–1309, https://doi.org/10.5194/acp-22-1293-2022, 2022.
Svensmark, H., Enghoff, M. B., Shaviv, N. J., and Svensmark, J.: Increased ionization supports growth of aerosols into cloud condensation nuclei, Nat. Commun., 8, 2199, https://doi.org/10.1038/s41467-017-02082-2, 2017.
Wang, P.: Machine Learning Assisted Inference of the Particle Charge Fraction and the Ion-induced Nucleation Rates during New Particle Formation Events, Zenodo [data set], https://doi.org/10.5281/zenodo.15024817, 2025.
Wiedensohler, A.: An approximation of the bipolar charge distribution for particles in the submicron size range, J. Aerosol Sci., 19, 387–389, https://doi.org/10.1016/0021-8502(88)90278-9, 1988.
Yin, R., Li, X., Yan, C., Cai, R., Zhou, Y., Kangasluoma, J., Sarnela, N., Lampilahti, J., Petäjä, T., Kerminen, V.-M., Bianchi, F., Kulmala, M., and Jiang, J.: Revealing the sources and sinks of negative cluster ions in an urban environment through quantitative analysis, Atmos. Chem. Phys., 23, 5279–5296, https://doi.org/10.5194/acp-23-5279-2023, 2023.
Yu, F., Wang, Z., Luo, G., and Turco, R.: Ion-mediated nucleation as an important global source of tropospheric aerosols, Atmos. Chem. Phys., 8, 2537–2554, https://doi.org/10.5194/acp-8-2537-2008, 2008.
Yu, F., Luo, G., Liu, X., Easter, R. C., Ma, X., and Ghan, S. J.: Indirect radiative forcing by ion-mediated nucleation of aerosol, Atmos. Chem. Phys., 12, 11451–11463, https://doi.org/10.5194/acp-12-11451-2012, 2012.
Yu, F., Nadykto, A. B., Luo, G., and Herb, J.: H2SO4–H2O binary and H2SO4–H2O–NH3 ternary homogeneous and ion-mediated nucleation: lookup tables version 1.0 for 3-D modeling application, Geosci. Model Dev., 13, 2663–2670, https://doi.org/10.5194/gmd-13-2663-2020, 2020.
Zaveri, R. A., Easter, R. C., Fast, J. D., and Peters, L. K.: Model for Simulating Aerosol Interactions and Chemistry (MOSAIC), J. Geophys. Res.-Atmos., 113, D13204, https://doi.org/10.1029/2007JD008782, 2008.
Zhang, T., Qi, X., Lampilahti, J., Chen, L., Chi, X., Nie, W., Huang, X., Zou, Z., Du, W., Kokkonen, T., Petäjä, T., Lehtipalo, K., Kerminen, V.-M., Ding, A., and Kulmala, M.: Differential characterization of air ions in boreal forest of Finland and megacity of eastern China, EGUsphere [preprint], https://doi.org/10.5194/egusphere-2024-3370, 2025.
Zhao, B., Donahue, N. M., Zhang, K., Mao, L., Shrivastava, M., Ma, P.-L., Shen, J., Wang, S., Sun, J., Gordon, H., Tang, S., Fast, J., Wang, M., Gao, Y., Yan, C., Singh, B., Li, Z., Huang, L., Lou, S., Lin, G., Wang, H., Jiang, J., Ding, A., Nie, W., Qi, X., Chi, X., and Wang, L.: Global variability in atmospheric new particle formation mechanisms, Nature, 631, 98–105, https://doi.org/10.1038/s41586-024-07547-1, 2024.