the Creative Commons Attribution 4.0 License.
the Creative Commons Attribution 4.0 License.
 | 14 Jul 2025
Analysis of a saline dust storm from the Aralkum Desert – Part 1: Consistency between multisensor satellite aerosol products
Xin Xi
Zhendong Lu
Andrew M. Sayer
Jaehwa Lee
Robert C. Levy
Yujie Wang
Alexei Lyapustin
Hongqing Liu
Istvan Laszlo
Changwoo Ahn
Omar Torres
Sabur Abdullaev
James Limbacher
Ralph A. Kahn
The Aralkum Desert presents a challenging environment for satellite aerosol observations due to its very bright, heterogeneous, and dynamic surfaces and the lack of in situ constraints on region-specific aerosol properties. We survey current global satellite algorithms capable of detecting the presence, column burden, and elevation of airborne dust over the Aral Sea basin. Discrepancies and potential biases in retrieved UV aerosol index (UVAI), mid-visible and thermal infrared optical depth (AOD), and layer height due to different assumptions on surface and aerosol properties are assessed. The results indicate that (1) UVAI products consistently delineate dust plume extent but show large positive values over turbid waters and salt flats due to enhanced surface absorption. (2) MODIS and VIIRS total and coarse-mode AOD retrievals show strong agreement over the Caspian Sea despite using different aerosol optical models. Over desert surfaces, all operational AOD products misclassify fresh dust plumes as clouds and exhibit strong nonlinear relationships. The NOAA EPS algorithm retrieves significantly lower AOD than others, although the agreement improves when a dust optical model is used. The MISR research algorithm produces higher, more consistent AOD and improved particle property retrievals compared to the MISR operational product. (3) Among four IASI infrared products, the LMD algorithm performs best in detecting dust plume features over both desert and water surfaces. (4) The EPIC aerosol optical centroid height (AOCH) product overestimates dust layer altitude under low aerosol loadings but exhibits good agreement with CALIOP in detecting the elevated dust characterized by well-defined upper boundaries. MISR height retrievals also align well with CALIOP and EPIC. IASI infrared retrievals are about 0.4 km higher than EPIC over dust-laden scenes. This study underscores the value of a synergistic, multisensor approach leveraging the complementary strengths of satellite aerosol products and calls for their appropriate application and careful interpretation when characterizing saline dust from the Aralkum Desert.
- Article
(21283 KB) - Full-text XML
- BibTeX
- EndNote


Emerging from the desiccated basin of the former Aral Sea, the Aralkum Desert has evolved into one of the most active sources of windblown dust, with adverse impacts on biodiversity, agriculture, and human well-being across Central Asia (Orlovsky and Orlovsky, 2001; Xi and Sokolik, 2016). Aralkum stands out among the extensive dust sources in Asia, not only because of its anthropogenic origin but also due to the distinct chemical and mineralogical compositions of its erodible sediments. Figure 1 shows the spectral abundance of four mineral groups derived from the Earth Surface Mineral Dust Source Investigation (EMIT) instrument. EMIT reveals that Aralkum contains more abundant carbonate and sulfate minerals but less iron oxide and clay than the nearby Karakum and Taklamakan deserts. Groll et al. (2019) confirmed that dust samples collected near Aralkum contained considerably higher sulfate and chloride content than those from sandy deserts. Given its distinct mineralogical compositions, Aralkum dust is expected to be more hygroscopic and less light-absorbing than typical desert dust (Sokolik and Toon, 1999). Indeed, ground lidar measurements in Tajikistan reported significantly lower extinction-to-backscatter or lidar ratios (23 sr at 532 nm) for the salt-rich dust compared to typical desert dust (44±9 sr) (Hofer et al., 2017).
Even within the desiccated Aral Sea bed, there is substantial variability in the physiochemical properties of erodible sediments. As the Aral Sea continued shrinking, sediment grain size became progressively smaller towards the basin's lowest point, while evaporate minerals began to precipitate following a typical sequence of calcite, gypsum/anhydrite, halite, and finally potassium and magnesium salts. Consequently, distinct spatial gradients in mineralogy, grain size, and soil texture have been observed in the exposed sediments. For instance, Jiang et al. (2021) reported increasing abundances of clay and evaporite minerals but decreasing abundance of carbonates and organic carbon when moving from the older coastline towards the newly exposed seabed. Argaman et al. (2006) found that the highly erodible takyr soils dominate the outer rim of Aralkum, whereas the newly formed solonchak soils are more likely protected by salt crusts which create stable, coarse aggregates that are resistant to wind erosion.
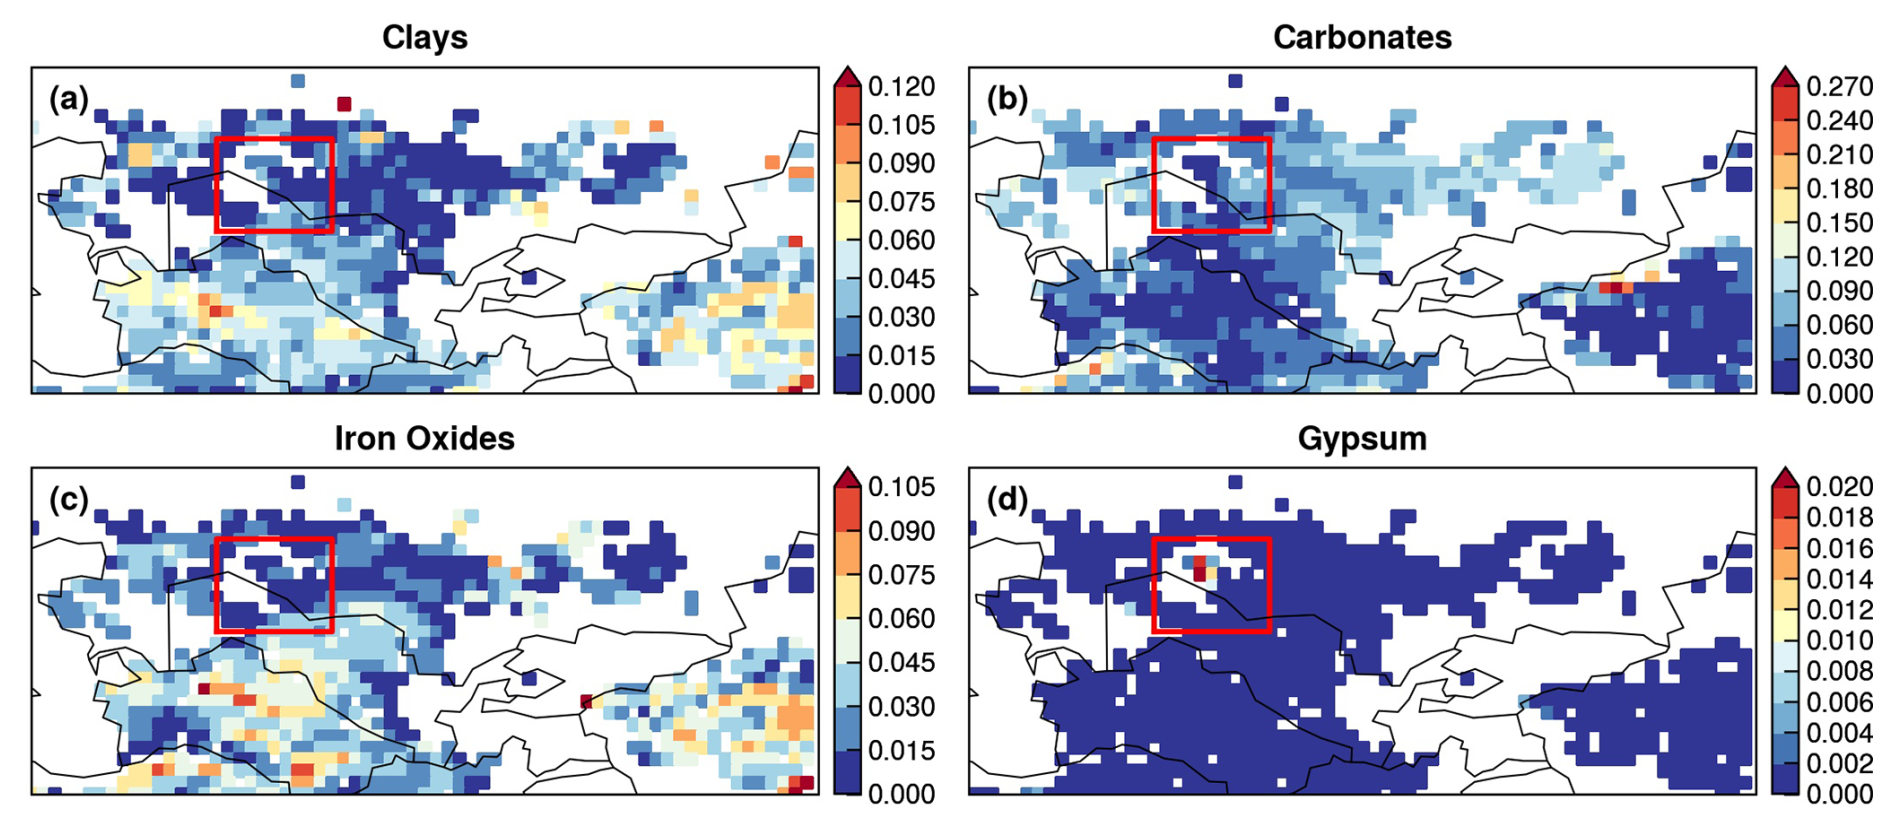
Figure 1Aggregated spectral abundance of four mineral groups based on the Earth Surface Mineral Dust Source Investigation (EMIT) L3 product: (a) clays (including chlorite, illite, muscovite, kaolinite, montmorillonite, and vermiculite); (b) carbonates (calcite and dolomite); (c) iron oxides (goethite and hematite); and (d) gypsum. Boxed regions indicate the Aralkum Desert.
Assessing the impacts of Aralkum-generated saline dust is greatly hindered by lack of in situ measurements of the physical and chemical properties of the erodible sediments (e.g., soil texture, mineralogical composition, crusting) and airborne particles (e.g., particle size distribution, shape, nonsphericity, chemical composition, mixing state, solubility). Particularly, the global network of ground-based Sun/sky photometers, AERosol RObotic NETwork (AERONET), has no operating sites near Aralkum. The two operational sites in Central Asia – Issyk-Kul and Dushanbe – are located too far away to provide representative measurements of the saline dust from Aralkum (Semenov et al., 2005; Rupakheti et al., 2020). AERONET serves two important purposes. First, it provides the climatological aerosol information needed to specify season- and region-dependent aerosol optical models used in passive satellite retrieval algorithms (Dubovik et al., 2002). Second, AERONET measurements are used as a benchmark for validating satellite retrievals. Consequently, the a priori assumptions about aerosol microphysical properties in satellite algorithms may not accurately capture the distinct particle properties over Aralkum. The lack of ground truth also prevents an evaluation of satellite product performance for the region. In general, satellite algorithms are optimized for global performance but may exhibit significant local biases when the local prevailing aerosol conditions deviate substantially from the algorithm assumptions on particle microphysical properties.
Dust event monitoring has relied on satellite retrievals over ocean basins frequently affected by continental dust outflow. For dust sources located deep within continental interiors, observing airborne dust from space is more challenging due to difficulty in separating the surface contribution from the top-of-the-atmosphere (TOA) radiance measurements. Central Asia comprises a range of dust sources with varying sediment abundance and erodibility, including sandy and hilly deserts, desert steppes, salt flats, and ephemeral or dry lakes (Xi and Sokolik, 2015a, b). These regions feature heterogeneous, dynamic surface properties and conditions (e.g., reflectivity, emissivity, land/water boundary, water turbidity), posing a major challenge for isolating aerosol signals from surface contributions. Currently, a number of techniques have been developed to facilitate aerosol retrievals over desert surfaces. However, data users may struggle with the product choice, not knowing the strengths and limitations of each product for their specific area of interest. To date, the performance of satellite aerosol products for characterizing the Aralkum dust is poorly understood. It is also unclear whether these products are consistent with each other. In this regard, a multisensor approach is preferred over the use of a single product and may provide potential insights about satellite product performance through the synergy of different observation techniques.
During 27–29 May 2018, a saline dust storm was triggered from the Aralkum Desert by a cold air outbreak, causing persistent haze, record high particulate concentrations, and salt deposition on agricultural areas (Xi, 2023). This paper documents the first part of a detailed investigation of this event, focusing on the consistency and synergy of multisensor aerosol products. We first conduct a survey of current satellite techniques and algorithms capable of detecting the presence, column burden, and vertical height of airborne dust over the Aral Sea basin (Sect. 2). The survey focuses on the theoretical basis and a priori assumptions about aerosol and surface properties associated with satellite retrievals of ultraviolet aerosol index (UVAI), mid-visible and thermal infrared aerosol optical depth (AOD), and aerosol layer height (ALH). In Sect. 3, we compare multiple UVAI, AOD (at both 0.55 and 10 µm), and ALH products to investigate the cross-sensor and cross-algorithm consistency in observing the saline dust from Aralkum on 27–29 May 2018. To avoid confusion, we will refer to the mid-visible (0.55 µm) AOD simply as AOD, while specifying the wavelength as a subscript for other cases, e.g., AOD10 for 10 µm AOD and AOD0.68 for 0.68 µm AOD. Due to lack of validation data, we focus on assessing the consistency (or lack thereof) between different products rather than their performance or accuracy. Through a synergistic analysis of multisensor satellite products, we aim to highlight the complementary strengths of various techniques, uncover their inconsistencies and limitations, and emphasize the need for their appropriate application and interpretation over the Aralkum Desert. Section 4 summarizes the findings of this study.
2.1 UVAI
UVAI was first discovered as a spectral residual quantity in the near-UV (330–380 nm), which measures the departure of observed spectral contrast from that of a pure molecular atmosphere (Herman et al., 1997). Significant changes in the spectral dependence of backscattered UV radiances were frequently associated with the presence of absorbing aerosols, such as dust, carbonaceous aerosols, and volcanic ash. This phenomenon provides a physical basis for UVAI, which yields large positive values for absorbing aerosols over ocean and land (including deserts and snow/ice-covered surfaces), as well as above clouds. This makes UVAI an excellent tracer for airborne dust (Prospero et al., 2002). Compared to a pure molecular atmosphere, dust particles reduce the spectral contrast of backscattered UV radiances by absorbing the Rayleigh scattered radiation from beneath the dust layer (Torres et al., 1998; de Graaf et al., 2005). UVAI depends on multiple factors – including AOD, ALH, absorption properties, and surface reflectivity – with higher ALH or more absorbing particles leading to larger UVAI (de Graaf et al., 2005).
In addition to absorbing aerosols, large positive UVAI may also result from non-aerosol geophysical effects such as sun glint, ocean color, and strong wavelength dependence of surface reflectivity (Herman et al., 1997). These effects, if misinterpreted as aerosol signals, can introduce biases in dust detection.
In the original UVAI definition, water clouds were treated as part of a spectrally independent Lambertian equivalent reflector (LER), resulting in small negative UVAI values. Torres et al. (2018) introduced a new approach that explicitly accounts for the Mie scattering effects of water clouds. This Mie-based approach yields near-zero UVAI over clouds and exhibits a weaker angular dependence than the LER-based definition. Multidecadal UVAI records have been generated from spaceborne UV–visible spectrometers. In this study, we compare the UVAI products from Ozone Mapping and Profiler Suite (OMPS), TROPOspheric Monitoring Instrument (TROPOMI), and Earth Polychromatic Imaging Camera (EPIC), described below.
2.1.1 OMPS
The OMPS Nadir Mapper is an imaging spectrometer on board the Suomi National Polar-orbiting Partnership (SNPP) spacecraft in a Sun-synchronous orbit with an ascending node equatorial crossing at 13:30 local solar time. OMPS measures UV radiances from 300 to 380 nm with a nadir footprint of 50×50 km2 and 110° across-track field of view, equivalent to a ground swath of 2800 km. The OMPS Nadir Mapper aerosol algorithm (NMMIEAI) reports the Mie-based UVAI at the 340 and 378.5 nm wavelengths (Torres, 2019a).
2.1.2 TROPOMI
TROPOMI is a nadir-viewing, push-broom-type grating spectrometer on board the Copernicus Sentinel 5 Precursor (S5P) mission, which flies in close formation with SNPP (less than 5 min apart) in a Sun-synchronous orbit with an ascending node equatorial crossing time of 13:30 (Veefkind et al., 2012). TROPOMI measures reflected and emitted radiation from the UV to shortwave infrared (SWIR) with a nadir footprint size of 3.5×7 km2 and a 2600 km swath width.
There are two separate UVAI products from TROPOMI, one developed by the ESA (European Space Agency) and the other developed by NASA. The NASA version uses the TropOMAER algorithm, which reports both LER- and Mie-based UVAI at 354 and 388 nm (Torres, 2021). The ESA version reports LER-based UVAI at three wavelength pairs: 354–388, 340–380, and 335–367 nm (Stein Zweers, 2022). The first two pairs were selected to continue the multidecadal heritage UVAI records, while the 335–367 nm pair was added to ensure compatibility with the future UVAI algorithm planned for the Sentinel-5 mission.
2.1.3 EPIC
EPIC is an imaging spectroradiometer on board the Deep Space Climate Observatory (DSCOVR) spacecraft, which operates in a Lissajous orbit about Lagrange-1 point in the Earth–Sun system. This allows EPIC to view the sunlit disk of Earth every 60–100 min. EPIC measures reflected radiances in 10 channels from UV to near-infrared (NIR), with a ground resolution of 8 km at 443 nm and 16 km in other bands. The EPIC EPICAERUV algorithm reports both LER- and Mie-based UVAI at the 340 and 388 nm wavelengths (Torres, 2019b).
2.2 Mid-visible AOD
Inferring column-integrated aerosol properties from reflected visible–NIR observations is an ill-posed inverse problem due to limited information content to fully characterize the atmosphere–surface system. Mid-visible AOD is generally the most readily available parameter, and consequently algorithms must rely on a priori knowledge or assumptions of the aerosol size distribution, shape, and refractive index (known as aerosol optical models). A common strategy involves using radiative transfer codes to create look-up tables (LUTs) of TOA radiances for a set of predefined aerosol optical models, surface types, and solar/viewing geometries (e.g., Remer et al., 2013a). These LUTs are then used to match measured TOA reflectances to derive optimal estimates of AOD and, in some cases, additional aerosol properties related to particle size and absorption. Aerosol retrieval using this strategy is highly sensitive to the aerosol optical models that are predefined in the algorithm and selected during the retrieval. Although these aerosol models are designed to represent season- and location-specific aerosol conditions as realistically as possible, satellite algorithms may still incorporate inconsistent or even contradictory models, especially for regions like Central Asia due to lack of observational constraints. In addition, satellite algorithms may fail to select the appropriate model during the retrieval, leading to mismatch between the assumed aerosol properties and the actual aerosol conditions. These factors can contribute to inconsistencies between retrieved AODs, including those from the same instrument.
We compare multiple AOD products from three polar-orbiting instruments on board NASA's EOS and NOAA's JPSS satellites, including the Moderate Resolution Imaging Spectroradiometer (MODIS), Multi-angle Imaging Spectroradiometer (MISR), and Visible Infrared Imaging Radiometer Suite (VIIRS). MODIS and VIIRS employ three single-view aerosol algorithms – Dark Target (DT), Deep Blue (DB), and Enterprise Processing System (EPS) – and the time-series-based Multi-Angle Implementation of Atmospheric Correction (MAIAC) algorithm. MISR utilizes two algorithms: an operational standard algorithm for generating routine global aerosol records and a research algorithm designed to explore alternative retrieval methods and additional aerosol properties on a case-by-case basis.
Below, we briefly describe the MODIS, VIIRS, and MISR aerosol algorithms, focusing on the a priori assumptions about aerosol optical models and surface reflectances. Other algorithm components (e.g., screening of clouds/sun glint/snow, spectral fitting) are not discussed.
2.2.1 MODIS and VIIRS DT over-water algorithms
The DT algorithm includes different approaches for over-land and over-water retrievals. We focus on the over-water algorithm, which is well suited for retrieving dust properties over the Caspian Sea. DT exploits the contrast of reflective aerosol layers against a dark background in the visible spectrum. Over water, the algorithm searches the LUT for the best fit of measured TOA reflectances at seven window bands from visible to SWIR and obtains solutions for both AOD and the fine-mode fraction (FMF) (Tanré et al., 1997). The ambient aerosol scene is represented as a linear combination of one fine and one coarse mode weighted by FMF. DT considers nine aerosol optical models over water: four fine aerosol models, three sea salt models, and two coarse dust models, which are derived from long-term AERONET measurements near water bodies (Remer et al., 2005). Each optical mode comprises spherical particles, with the main difference between the sea salt and dust modes being the assumed complex refractive index. During the retrieval the algorithm evaluates each of the 20 combinations of fine and coarse modes, and in addition to AOD and FMF, it reports which combination of modes led to the best fit. Due to the nonsphericity of dust particles, the current DT algorithm is known to yield biased retrievals over dusty oceanic scenes (Zhou et al., 2020b). A spheroidal dust model will be implemented in the MODIS Collection 7 as well as future versions of VIIRS (Zhou et al., 2020a).
In the MODIS product suite, DT aerosol retrieval is performed at a nominal resolution of 10×10 km2. A higher-resolution product (DT3K) was later introduced at 3×3 km2 to capture small-scale aerosol features (Remer et al., 2013b). DT3K employs the same technique as DT, but using different pixel aggregation and quality assurance (QA) rules. The DT algorithm has been ported to VIIRS, which retrieves AOD at a nominal resolution of 6×6 km2 (Sawyer et al., 2020).
2.2.2 MODIS and VIIRS DB algorithms
Inspired by the aerosol detection capability in the near-UV, the DB algorithm employs the 0.41 µm or “deep blue” band, which has lower and more homogeneous surface reflectivity than the longer visible wavelengths (Hsu et al., 2004). Aerosols are represented by a spheroidal dust model and a spherical fine-dominated anthropogenic model, which employ various single-scattering albedo (SSA) values depending on locations and seasons. The surface reflectances are determined based on a pre-calculated database over bright surfaces (e.g., deserts, urban areas) and empirical relationships between visible and SWIR bands over vegetated surfaces (Hsu et al., 2013).
DB was initially implemented to fill the data gap over bright surfaces in the MODIS aerosol product. In the VIIRS product suite, DB has been expanded to all cloud-, snow-, and ice-free land surfaces and also performs retrieval over water using the Satellite Ocean Aerosol Retrieval (SOAR) algorithm (Hsu et al., 2019; Lee et al., 2024). SOAR considers four aerosol optical models: maritime, dust, fine-dominated, and mixed, each represented by a bimodal distribution consisting of one fine and one coarse mode (Sayer et al., 2018). The dust model consists of one spherical fine mode and one spheroidal coarse mode, derived from AERONET measurements at Cape Verde (Lee et al., 2017).
2.2.3 VIIRS EPS algorithm
The EPS algorithm is developed for NOAA's next-generation polar-orbiting and geostationary meteorological satellites. Here we focus on the VIIRS EPS aerosol product described in Laszlo (2018) and more recently in Laszlo and Liu (2022). Over water, EPS is based on the MODIS heritage and represents the aerosol column as a linear combination of one fine and one coarse mode weighted by FMF, selected from four fine-mode and five coarse-mode aerosol models the same as the MODIS DT algorithm (Remer et al., 2006). The algorithm searches for the AOD and FMF that give the best match between observed and pre-calculated TOA reflectances at seven VIIRS channels (Jackson et al., 2013; Laszlo and Liu, 2022).
Over land, EPS simultaneously retrieves AOD, aerosol optical model, and Lambertian surface reflectances in selected bands by matching the observed and calculated TOA reflectance over both dark and bright (snow-free) surfaces. EPS considers four candidate aerosol optical models, three of which are spherical, fine-mode-dominated aerosols (labeled as generic, urban, and smoke) and one of which is nonspherical, coarse-mode-dominated aerosol (labeled as dust). The dust model is forcibly used for North Africa and the Arabian Peninsula to account for the dominant dust presence in these regions. The candidate aerosol models are adopted from the MODIS Collection 5 DT algorithm (Remer et al., 2006). Over bright desert surfaces, the surface reflectance is estimated from a static database of spectral reflectance ratios between VIIRS channels (Zhang et al., 2016).
2.2.4 MODIS MAIAC algorithm
Unlike the single-view approach adopted by the DT, DB, and EPS algorithms, MAIAC uses a sliding window to accumulate up to 16 d of multi-angle observations from different orbits for the same location to retrieve bidirectional surface reflectance over land (including deserts) simultaneously with aerosol properties (Lyapustin et al., 2018). MAIAC uses a dynamic minimum reflectance method to define the surface reflectance spectral ratios for each 1 km grid cell, which allows AOD retrieval over both dark and bright surfaces. The MODIS Collection 6 MAIAC algorithm uses nine aerosol optical models derived from AERONET climatology to represent the regional background aerosol conditions. For Central Asia, the background aerosol model (“Model 2”) is derived from AERONET measurements over the western US, which represents a mixture of dust and fine-mode aerosols. During the retrieval, a smoke/dust test is first applied to determine whether the background or dust model should be used. If dust is detected, the algorithm uses a spheroidal dust model (“Model 6”) derived from AERONET measurements from the Solar Village site in Saudi Arabia (Dubovik et al., 2006).
2.2.5 MISR AOD and particle property algorithms
MISR measures reflected sunlight using nine push-broom cameras with view angles of ±70.5, ±60.0, ±45.6, ±26.1, and 0° along-track, each in four spectral bands (446, 558, 672, and 866 nm) across a 380 km swath at pixel resolution between 275 m and 1.1 km, depending on the channel (Diner et al., 1998). The MISR Standard Aerosol retrieval algorithm produces AOD and constraints on column-effective particle type operationally (Garay et al., 2020). The aerosol column is represented by 74 aerosol optical models as mixtures of single-composition components, including 50 mixtures of spherical components, 20 mixtures of spherical and dust components, and 4 mixtures of dust components. The algorithm accounts for the contribution of surface bidirectional reflectance factor (BRF) based on a principal component analysis of TOA radiances (Martonchik et al., 2009).
The MISR Research Aerosol (RA) retrieval algorithm is optimized to provide constraints on particle size, sphericity, and light absorption under favorable observing conditions on a case-by-case basis (Limbacher et al., 2022). The algorithm considers a broader range of aerosol mixtures to allow more subtle particle property distinction. For the surface reflectance, two different approaches are considered: (a) surface BRF retrieved self-consistently with the atmosphere using only MISR data (similar to the standard algorithm) and (b) surface BRF contribution prescribed from the MODIS MAIAC product to separate the surface contribution. In addition, an XGBoost AI/ML approach has been developed using the retrieved and prescribed RA results, along with an aerosol microphysical property validation dataset developed by Anstett et al. (2025). The XGBoost models employed here use MISR RA prescribed + retrieved geophysical output as input, training models separately against AERONET AOD, FMF, Ångström exponent, nonsphericity, and SSA. The training dataset consists of ∼ 50 000 global MISR/AERONET over-land coincidences, with each of the coincidences containing potentially >2000 MISR pixels (retrievals). For the purposes of developing optimal AI/ML coefficients, each of these quality-assessed pixels was treated as an independent data point, yielding a total of ∼ 18 million data points that were used for training.
2.3 Thermal infrared AOD (AOD10)
Compared to visible and NIR-based techniques, aerosol retrieval in the thermal infrared (TIR) offers several advantages, such as nighttime observation and enhanced contrast of dust signals over deserts. In addition, the infrared spectrum is primarily sensitive to coarse particles (diameter > 1 µm), providing better dust detection. Split-window techniques have been used to detect dust from passive radiometers by exploiting the distinct negative brightness temperature difference between two neighboring atmospheric window channels (e.g., 10.8 and 12 µm) (Legrand et al., 2001; Lensky and Rosenfeld, 2008). Based on this approach, the dust RGB composite derived from the Spinning Enhanced Visible and InfraRed Imager (SEVIRI) is capable of tracking dust plumes every 15 min and mapping the source locations over Central Asia, as demonstrated in Xi (2023).
Hyperspectral infrared spectrometers have offered new potential to infer dust properties, including AOD10 and dust layer height. A major challenge in TIR-based retrieval is isolating the aerosol signal from the infrared emissions of the atmosphere and the underlying surface. TIR-based algorithms rely on forward model simulations of TOA radiances or brightness temperatures for a range of atmospheric profiles (e.g., temperature, water vapor), surface properties (e.g., emissivity, temperature), and dust aerosol properties (e.g., AOD10, vertical distribution, size, and refractive index). Below, we describe four different algorithms used for retrieving AOD10 from the Infrared Atmospheric Sounding Interferometer (IASI), a Fourier transform spectrometer on board the European MetOp satellite series that observes the Earth's radiation spectra from 645 to 2760 cm−1 (3.6–15.5 µm) at a spectral resolution of 0.5 cm−1 and a nadir ground resolution of 12 km. The four algorithms differ in the retrieval methods, the atmosphere and surface input data, and the dust optical models assumed in forward model calculations, among other factors.
2.3.1 LMD algorithm
The Laboratoire de Météorologie Dynamique (LMD) algorithm employs a two-step, LUT-based approach (Capelle et al., 2018). In the first step, the atmospheric state is determined using 18 IASI channels that are insensitive to the surface or aerosols. In the second step, AOD10, mean altitude, and surface temperature are retrieved by fitting observed brightness temperatures against simulations at eight aerosol-sensitive channels. These simulations incorporate a range of atmospheric profiles, surface properties (emissivity, temperature, and pressure), AOD10, altitudes, and dust microphysical properties. Dust is represented by a spherical, lognormal size distribution (effective radius, Reff=2.3 µm; standard deviation, σg=0.65) and two refractive indices from Balkanski et al. (2007) and Volz (1973), corresponding to strongly and weakly absorbing dust types, respectively. Surface emissivity is based on the monthly mean IASI retrievals by Capelle et al. (2012).
2.3.2 MAPIR algorithm
The Mineral Aerosol Profiling from Infrared Radiances (MAPIR) algorithm retrieves the vertical profiles of dust concentrations using the Rodgers optimal estimation method (Callewaert et al., 2019). The dust concentration profiles are converted to AOD10 using a Mie-calculated extinction cross section based on an assumed size distribution and refractive index. A forward model (RTTOV) is used to simulate IASI radiances based on the a priori of the state vector (i.e., dust concentration profiles at seven 1 km thick layers centered at 0.5 to 6.5 km), along with temperature and water vapor profiles derived from IASI. The dust optical model assumes a lognormal size distribution (rg=0.6 µm, σg=2) and refractive index from Volz (1973). Surface emissivity is based on a monthly climatology derived from IASI clear-sky spectra by Zhou et al. (2011).
2.3.3 ULB algorithm
The Université libre de Bruxelles (ULB) algorithm estimates dust AOD10 using a neural network approach (Clarisse et al., 2019). The algorithm first performs dust detection by computing a dust index from a linear discrimination analysis of IASI-observed spectra. The dust index is then converted to dust AOD10 via a neural network trained with synthetic spectra generated by a forward model. The forward model incorporates a representative set of atmospheric states from IASI Level-2 data, surface emissivity from Zhou et al. (2011), and a range of dust layer altitudes (from 0 to 7 km). Dust aerosol is represented by a lognormal size distribution (rg=0.5 µm, σg=2) and refractive index from Volz (1973).
2.3.4 IMARS algorithm
The Infrared Mineral Aerosol Retrieval Scheme (IMARS) algorithm performs probabilistic estimates of AOD10, composition, effective radius, and mean layer temperature (a proxy for dust layer height) based on forward model simulations of IASI-observed radiances under various dust and ice cloud conditions (Offenwanger et al., 2024). The algorithm considers 12 possible combinations of four dust mineralogical mixtures (China, central Sahara, Niger, Iowa Loess) and three size distributions. Each dust mixture is associated with predefined mineral fractions (and hence refractive indices) and particle effective radius. Surface emissivity is based on the MODIS UCSB Emissivity Library.
2.4 ALH
Aerosol vertical distribution can be retrieved from both active and passive sensors. Active sensors, such as the Cloud–Aerosol Lidar with Orthogonal Polarization (CALIOP), provide vertically resolved retrievals of aerosol volume extinction at high vertical resolutions. However, they are limited by narrow swaths and poor spatial coverage. In recent years, substantial progress has been made in retrieving ALH from passive sensors using various techniques, such as stereoscopic retrieval from polar-orbiting multi-angle or geostationary imagers (Nelson et al., 2013; Carr et al., 2020), polarimetric observations in the near-UV (Wu et al., 2016), differential optical absorption spectroscopy in oxygen absorption bands (Xu et al., 2017, 2019), and hyperspectral infrared measurements (Capelle et al., 2018; Callewaert et al., 2019; Clarisse et al., 2019; Offenwanger et al., 2024). Although passive techniques do not achieve the same level of accuracy as lidars and only estimate an effective height with limited information on the aerosol layer thickness, they provide much better spatial coverage and revisit frequency (Lu et al., 2021, 2023).
The ALH definition varies by retrieval techniques and may refer to the top of aerosol layers such as from stereoscopic techniques or an effective central height corresponding to peak aerosol extinction (Xu et al., 2017). Like AOD, ALH is an optical quantity and varies with the retrieval wavelength. Except for stereoscopic techniques, passive ALH retrievals depend on assumptions about the aerosol vertical distribution. In this study, we compare four ALH products, including the CALIOP aerosol-extinction-weighted height, EPIC aerosol optical centroid height (AOCH) product, IASI mean dust layer altitude, and MISR plume height.
2.4.1 CALIOP aerosol-extinction-weighted height
CALIOP was a nadir-viewing elastic backscatter lidar on board the Cloud–Aerosol Lidar and Infrared Pathfinder Satellite Observations (CALIPSO) and measured polarized backscatter at 532 nm and total attenuated backscatter at 532 and 1032 nm, with a vertical resolution of 30 m below 8.2 km and 60 m between 8.2 and 20.2 km (Winker et al., 2009). In the CALIOP data processing, calibrated attenuated backscatter coefficient profiles are used to detect the top and base altitudes of atmospheric features. A set of scene classification algorithms (SCAs) then classifies these features as either aerosol or cloud and determines the aerosol type and cloud phase. During this process, aerosol lidar ratios are selected to derive the aerosol extinction and backscatter coefficient profiles (Young et al., 2018). The selection of lidar ratios is based on the aerosol typing algorithm, which considers six tropospheric aerosol types – clean marine, dusty marine, dust, polluted continental/smoke, polluted dust, and elevated smoke (Kim et al., 2018). Based on the aerosol extinction profile, the ALH with respect to the mean sea level can be calculated as , where βext,i is the 532 or 1064 nm aerosol extinction coefficient (km−1) at level i, and Zi is the altitude (km) at level i (Koffi et al., 2012).
2.4.2 EPIC AOCH product
The EPIC AOCH product is derived from the spectral contrast in TOA reflectances between the oxygen (O2) absorption and continuum bands. The physical principle is that ALH affects the path length of backscattered light and the amount of light absorbed by well-mixed O2 molecules. Consequently, the spectral contrast between the O2 absorption bands and the continuum bands depends on the ALH (Xu et al., 2019). The EPIC AOCH algorithm employs pre-computed TOA reflectances for a range of AOD0.68, AOCH, surface reflectivity, and surface pressure. Three aerosol optical models are considered: smoke, Saharan dust, and Asian dust. The dust models are derived from AERONET measurements at Cape Verde and over East Asia (Xu et al., 2017). The aerosol vertical distribution assumes a quasi-Gaussian profile characterized by a centroid altitude and a fixed half-width at half-maxima of 1 km. Hence, the EPIC-retrieved AOCH represents the altitude of peak volume extinction.
2.4.3 IASI dust layer altitude
TIR-based retrieval of dust layer height employs the sensitivity of infrared radiation to the temperature of the aerosol layer, which is intrinsically linked to its mean altitude. The IASI LMD algorithm estimates the dust AOD10 and mean altitude by matching IASI observations to forward model simulations assuming eight mean layer altitudes from 750 to 5795 m (Capelle et al., 2018). Dust is assumed to be uniformly distributed within a single atmospheric layer, the thickness of which varies from 500 to 800 m. The retrieved mean altitude represents the height at which half of the AOD10 is below and half of the AOD10 is above, and it is considered an infrared optical equivalent to the centroid of the aerosol vertical profiles.
2.4.4 MISR plume height
In addition to the radiometrically derived AOD, ALH can be derived geometrically from the parallax in the MISR hyper-stereo imagery. The MISR Interactive Explorer (MINX) software performs this task interactively, on a case-by-case basis, and retrieves plume heights at 1.1 km horizontal resolution and between 250 and 500 m vertical resolution (Nelson et al., 2013). The MISR ALH retrievals identify the layer of maximum spatial contrast in the plume imagery, so the results are often skewed lower than CALIPSO, which is also sensitive to thin, less distinct aerosol layers above dense plume features (Flower and Kahn, 2017).
Torres (2019a)Torres (2019b)Torres (2021)ESA (2021)Levy and Hsu (2015a)Levy and Hsu (2015b)Levy and Hsu (2015a)Lyapustin and Wang (2022)Levy et al. (2023)Hsu (2022)Kondragunta et al. (2023)ASDC (1999)Limbacher et al. (2022)C3S CDS (2019)C3S CDS (2019)C3S CDS (2019)C3S CDS (2019)ASDC (2023)ASDC (2018)C3S CDS (2019)Table 1List of satellite aerosol products considered in this study.
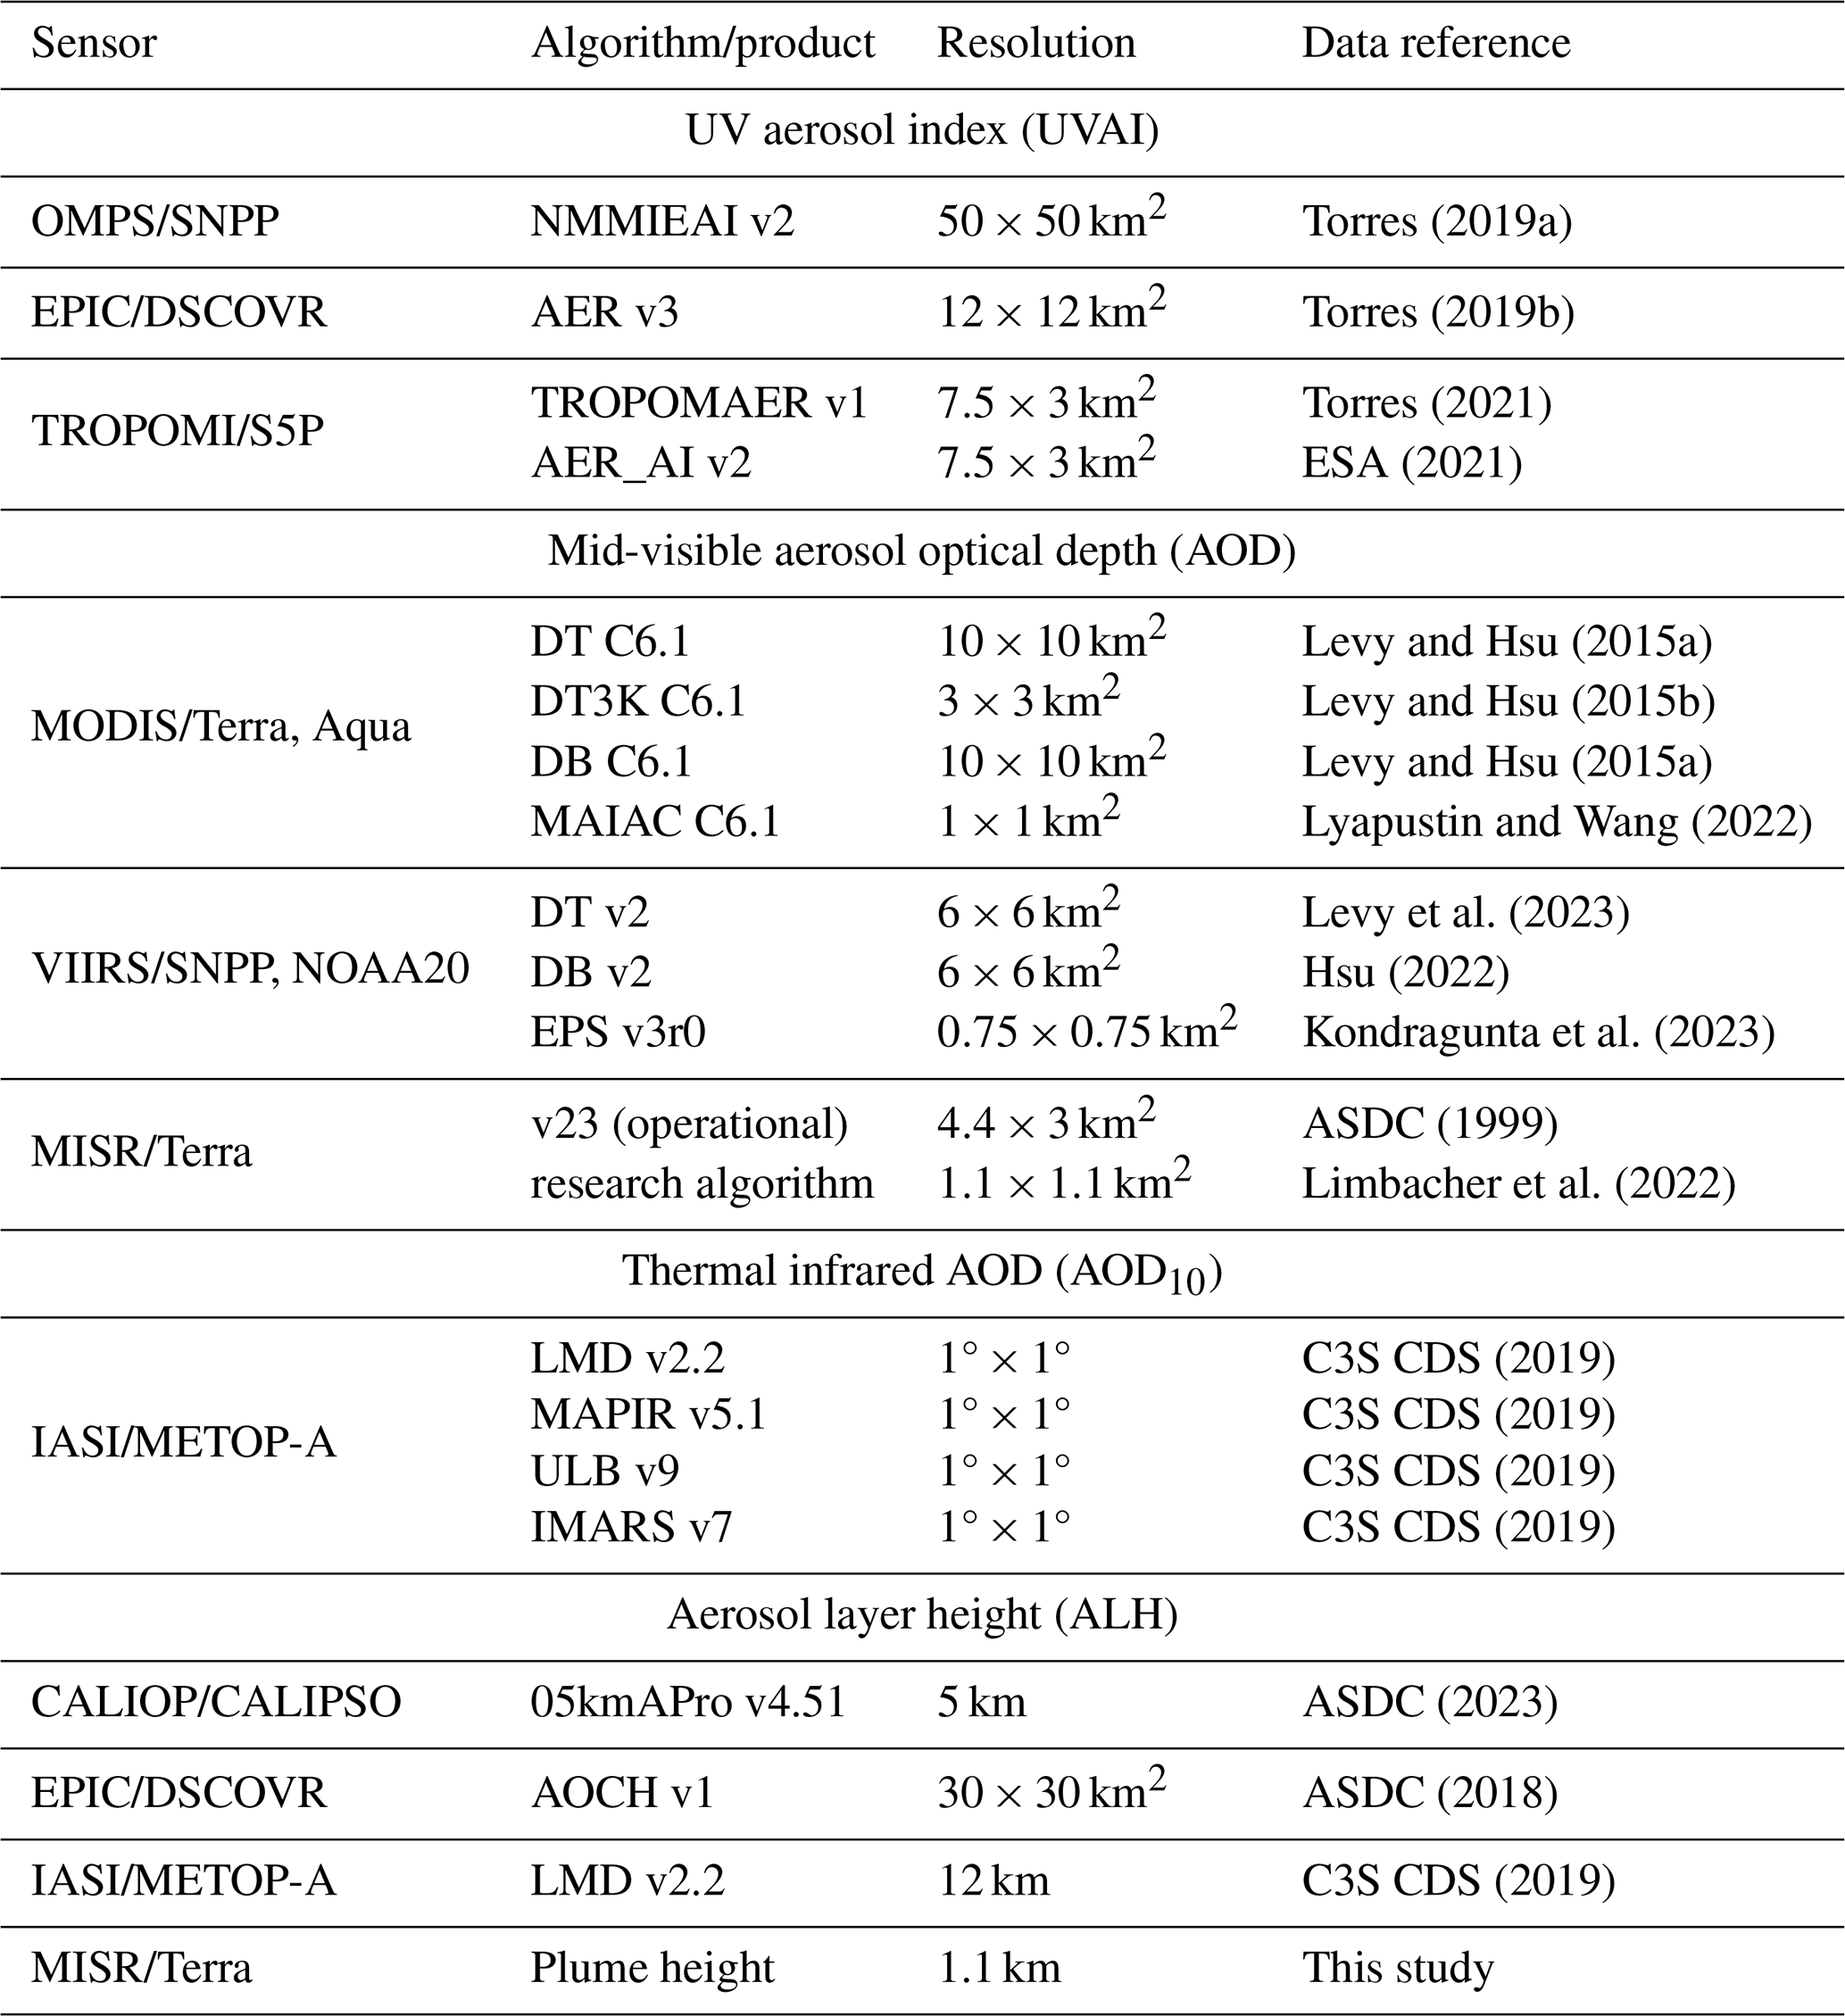
Table 1 summarizes the satellite products and parameters considered in this study. These products were chosen based on the data availability and similar overpass times over the Aralkum Desert, ensuring minimal scene differences between the sensors. While some products have duplicated parameters (e.g., the UVAI products report total and absorbing AOD), we focus on the primary and most widely used aerosol parameters from each product. The UVAI and mid-visible AOD products report particle property retrievals over desert surfaces, such as the Ångström exponent and single-scattering albedo (SSA); however, they are subject to larger uncertainties than AOD retrievals and generally not recommended for scientific studies.
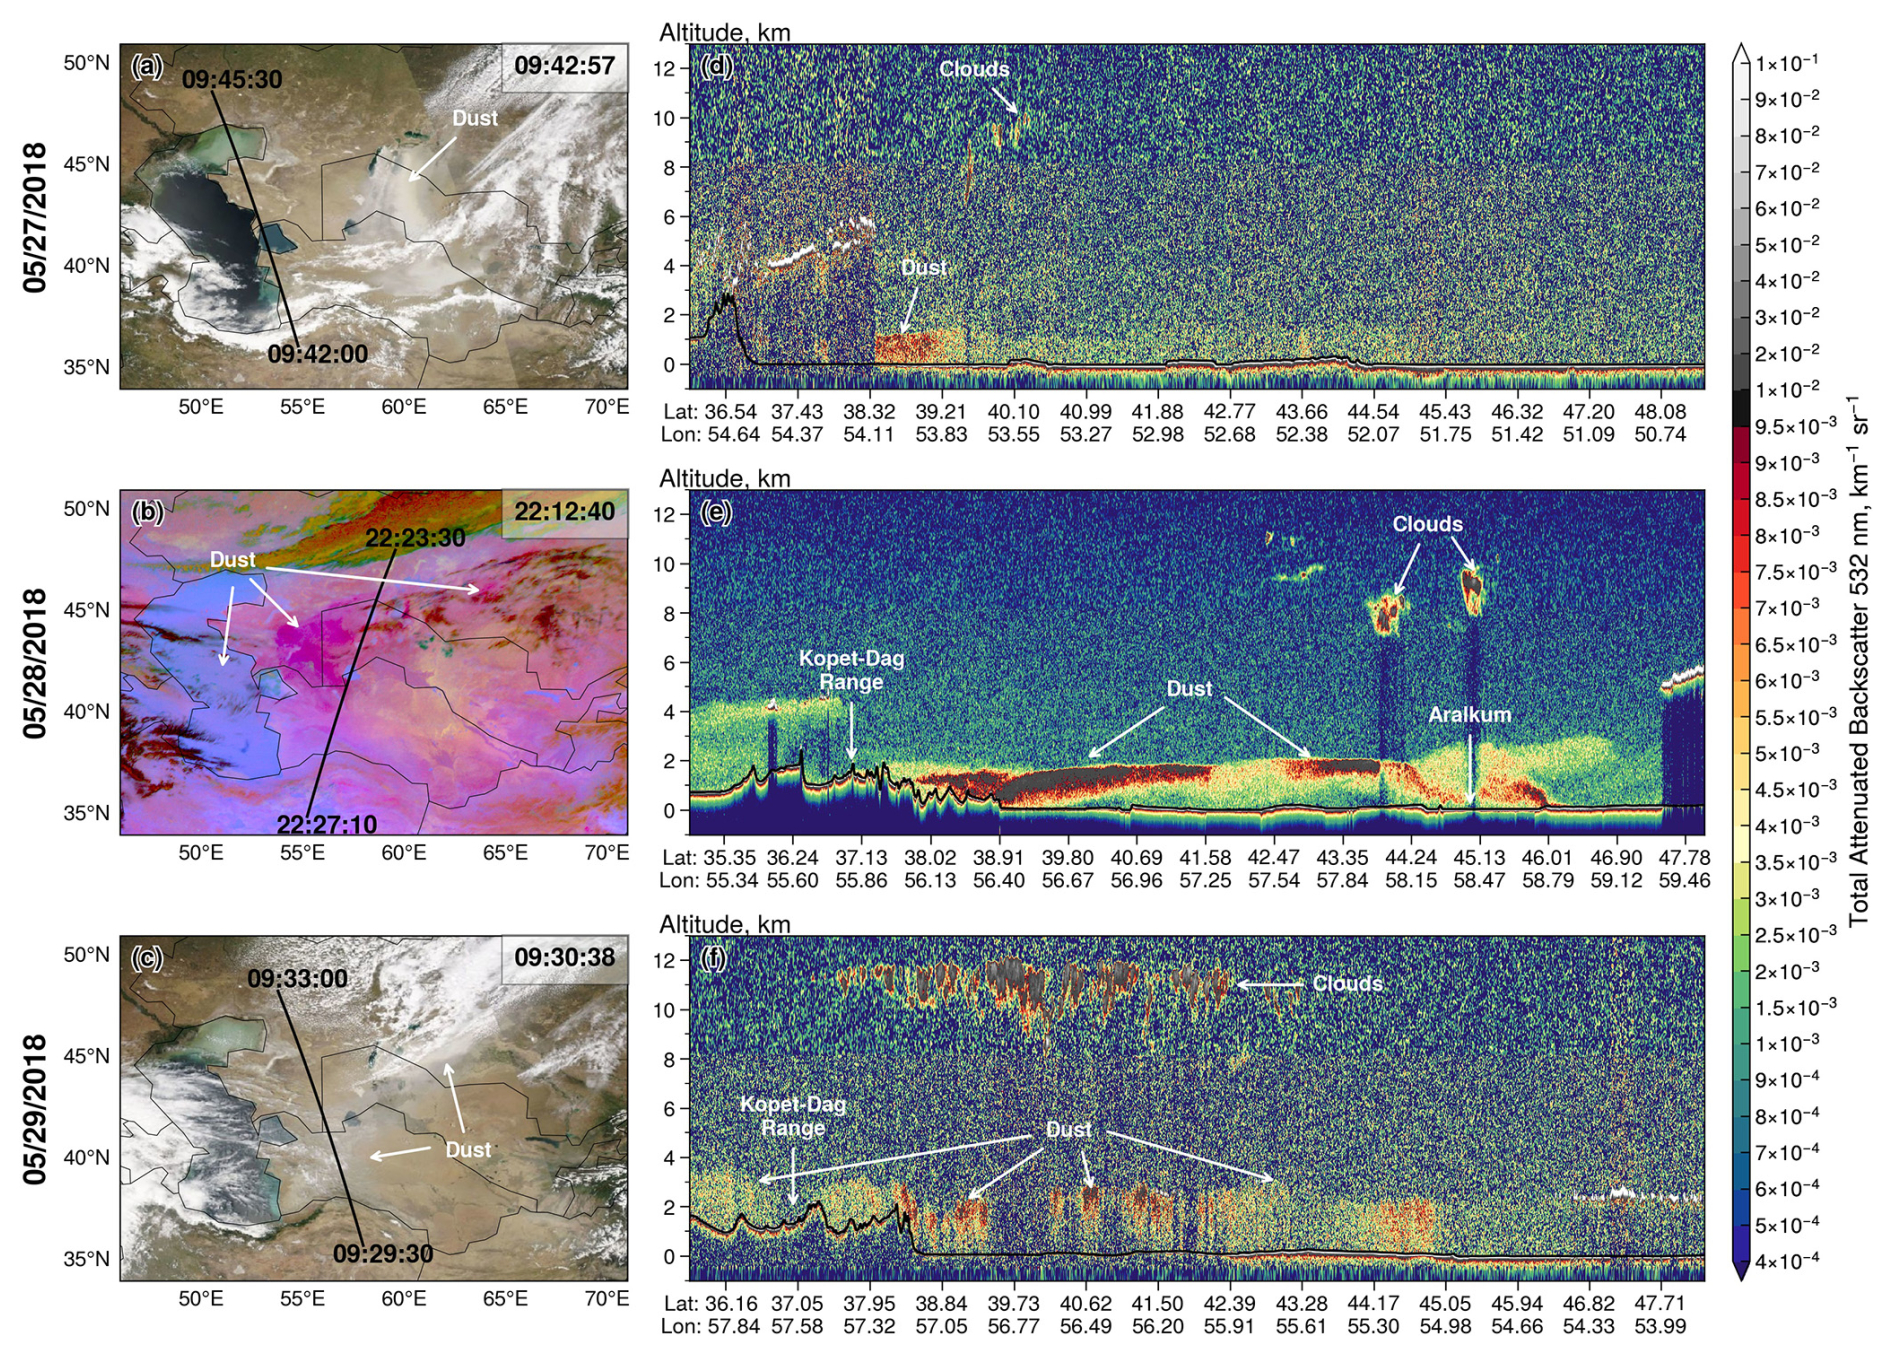
Figure 2(a–c) CALIPSO ground tracks superimposed on coincident MODIS/Aqua true color (27 and 29 May 2018) and SEVIRI dust RGB composite (28 May 2018) imagery. The ground track start and end times are labeled. MODIS and SEVIRI scan times over Aralkum (45° N, 60° E) are shown at the top right corner. (d–f) Corresponding CALIOP 532 nm total attenuated backscatter profile. Black lines indicate the ground surface.
3.1 Horizontal and vertical dust distributions
On 27 May 2018, MODIS/Aqua observed an extensive whitish dust plume originating from Aralkum and moving southeast towards Iran and Afghanistan (Fig. 2a). Although CALIOP missed the Aralkum event, it detected a shallow dust layer at an altitude of 0–1 km at the southeastern coast of the Caspian Sea (Fig. 2d). This dust likely originated from the dry channel of the ancient River Uzboy, a highly active dust source in western Turkmenistan (Nobakht et al., 2021).
On 28 May 2018, a high-pressure system developed just south of Aralkum. As shown in the nighttime SEVIRI dust RGB composite (Fig. 2b), the anticyclonic flow carried the lofted dust across the Ustyurt Plateau towards the Caspian Sea, while simultaneously lifting dust from Aralkum that dispersed eastward. CALIOP detected an extensive dust layer stretching from Aralkum to the Kopet-Dag Range (Fig. 2e). The Kopet-Dag Range acted as a physical barrier, causing dust to accumulate along the foothills. Overall, the airborne dust resided below 2 km with a sharp upper boundary, probably due to large-scale subsidence and the shallow nighttime boundary layer (e.g., due to temperature inversion). The lofted dust was concentrated within an elevated layer at 1–2 km altitude near Aralkum but extended to the ground by the gently sloping foothills. The variation of dust layer height may explain the contrasting color signatures observed in the SEVIRI imagery: the elevated dust near Aralkum displays a rich magenta hue, whereas the low-lying dust near the Kopet-Dag Range is less discernible, possibly due to reduced temperature contrast between the surface and dust aloft.
On 29 May 2018, remnants of the Aralkum dust plume continued to affect western Uzbekistan and Turkmenistan (Fig. 2c). The suspended dust was only partially detected by CALIOP due to extensive cloud cover (Fig. 2f). The dust layer extended to an altitude of 3.5 km, likely resulting from the daytime convective mixing and increased vertical motion ahead of an approaching cold front.
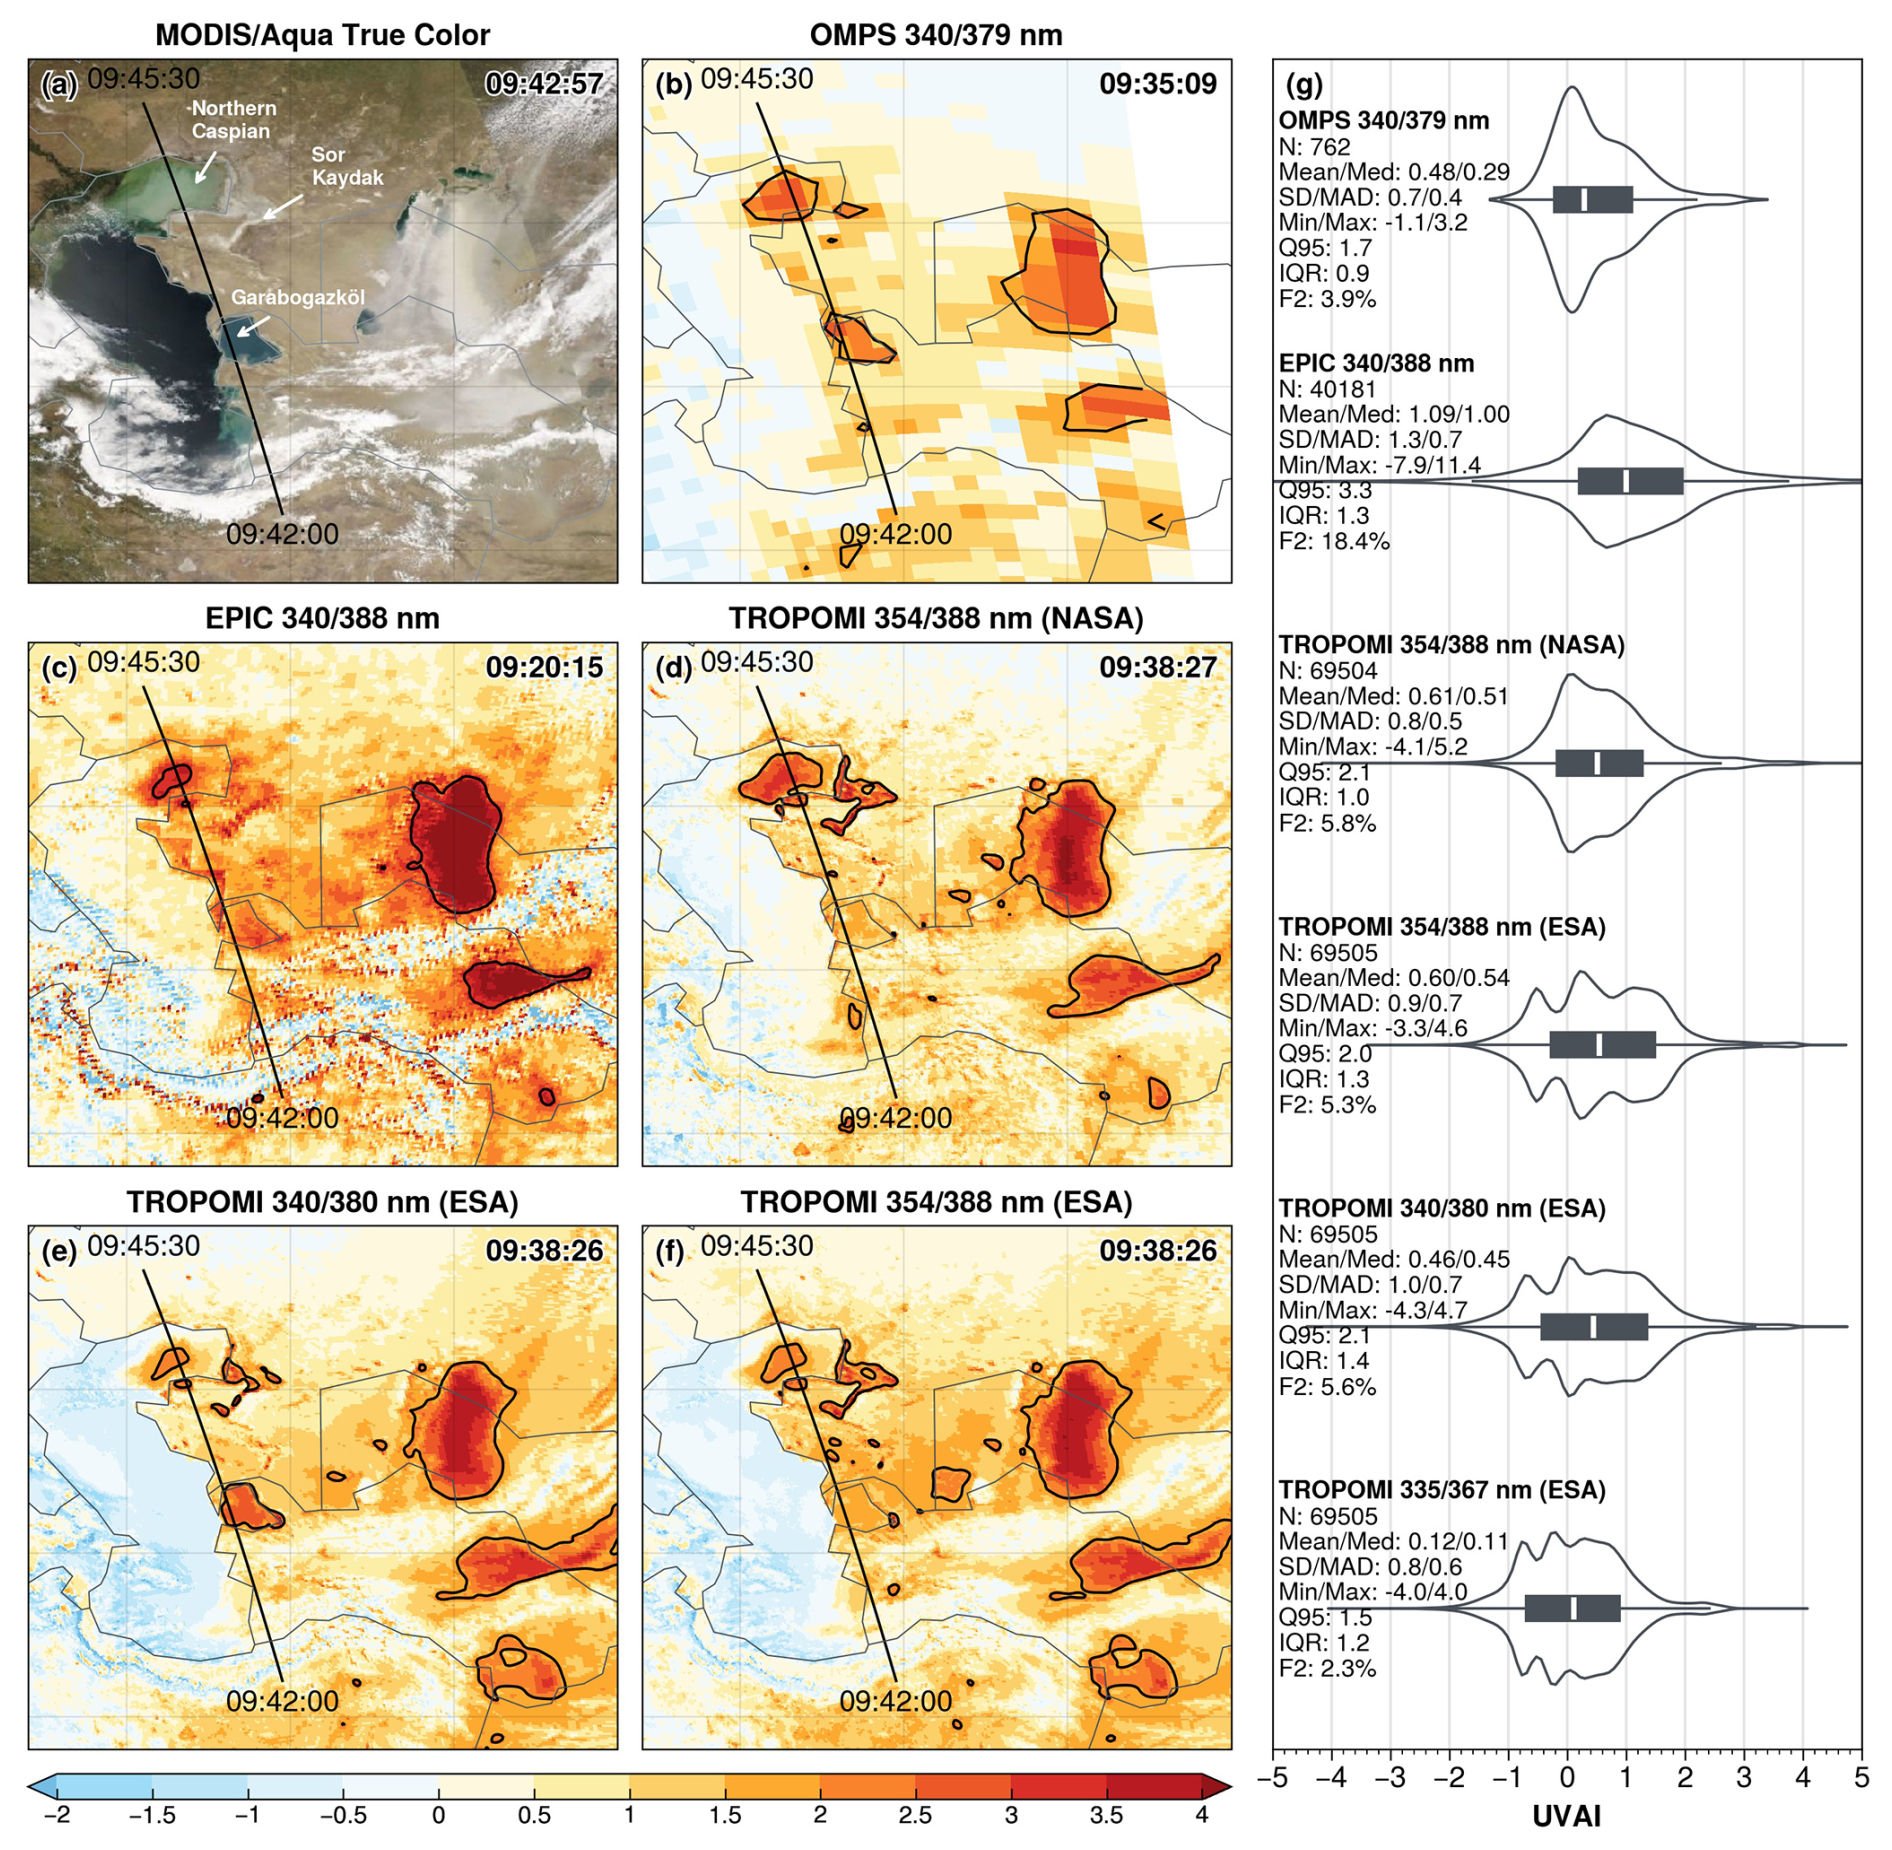
Figure 3Comparison of UVAI products on 27 May 2018: (a) MODIS/Aqua true color composite; (b–f) five UVAI products from OMPS, EPIC, and TROPOMI; and (g) violin plots and summary statistics of six UVAI products. The sensor scan times over Aralkum and the CALIPSO ground track are indicated in panels (a)–(f). Black contours in (b)–(f) indicate the 95 % percentile of UVAI values. Summary statistics in panel (g) are pixel count (N), mean, median (Med), standard deviation (SD), median absolute deviation (MAD), minimum (Min), maximum (Max), 95 % percentile (Q95), interquartile range (IQR), and proportion of UVAI ≥ 2 pixels (F2).
3.2 Comparison of UVAI products
Figure 3 compares multiple UVAI products in detecting the freshly emitted dust plume on 27 May 2018, including the OMPS, TROPOMI, and EPIC Mie-based UVAI products developed by NASA and the TROPOMI LER-based UVAI developed by the ESA. The sensor scan times over Aralkum (45° N, 60° E), as shown in each panel, are less than 20 min apart. The UVAI products display similar spatial patterns, but with significant differences in the dynamic range and statistical distributions.
Among the three NASA products (Fig. 3b–d), OMPS yields markedly lower UVAI (e.g., mean = 0.5, maximum = 3.2) compared to EPIC (1.1 and 11.4) and TROPOMI (0.6 and 5.2), likely due to its coarser spatial resolution and cloud interference. EPIC exhibits significantly higher values over dusty scenes, partly because the 340–388 nm pair is more sensitive to absorbing aerosols. Nonetheless, cloudy scenes in EPIC appear more noisy, most likely due to EPIC L1 calibration issues (personal communications with Karin Blank). Statistically, both OMPS and TROPOMI reveal a bimodal distribution with a prominent peak near zero and a secondary peak near 1. EPIC displays a unimodal distribution with a larger spread, as indicated by its standard deviation (SD), median absolute deviation (MAD), and interquartile range (IQR).
Compared to the TROPOMI 354–388 nm Mie-based UVAI from NASA, the ESA LER-based product exhibits more negative values over cloudy and dust-free scenes and consequently greater dispersion, as indicated by a trimodal distribution (Fig. 3d). The choice of the 354–388 nm versus the 340–380 nm wavelength pair in the ESA product has minor effects on the regional means, extremes, and dispersion. In contrast, the 335–367 nm pair produces significantly lower UVAI and less dispersion, indicating reduced sensitivity to aerosol absorption.
Dust detection using UVAI products often employs fixed thresholds to isolate the dust signal. For example, Prospero et al. (2002) used a UVAI threshold of 1 for North Africa and 0.7 elsewhere; Schepanski et al. (2012) used a threshold of 2 to detect major dust plumes over the Sahara. As shown in Fig. 3g, EPIC yields more than 18 % of pixels exceeding a threshold of 2 – over 3 times those observed in OMPS and TROPOMI. This disparity suggests that using a fixed UVAI threshold may lead to inconsistent detection of dust plumes. In contrast, adopting a percentile-based threshold can more effectively capture the dynamic range of each product, resulting in more coherent dust detection. As demonstrated in Fig. 3, using the 95th percentile produces a consistent delineation of the plume extent and captures three clusters of elevated UVAI values separated by clouds (see Fig. 3a).
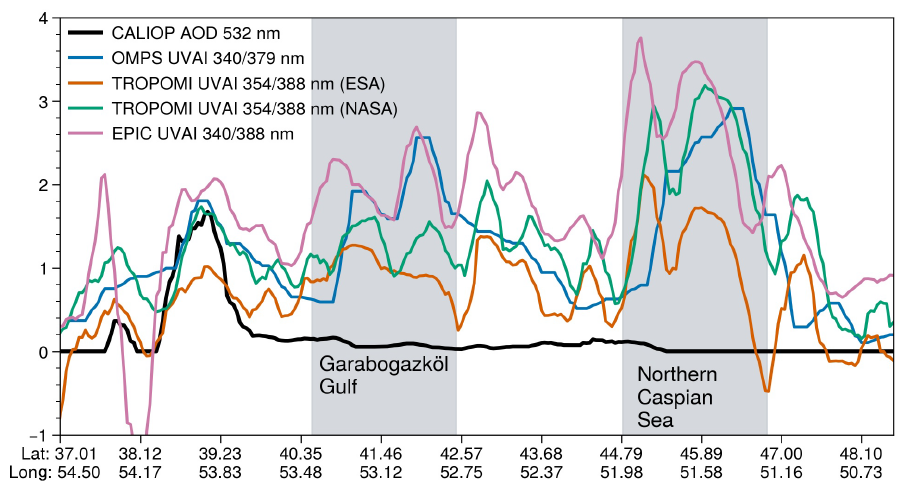
Figure 4Coincident measurements of CALIOP 532 nm AOD and various UVAI products along the eastern coast of the Caspian Sea on 27 May 2018. The CALIPSO ground track is shown in Fig. 3. Shaded areas represent the Garabogazköl Gulf and northern Caspian Sea.
A persistent feature in all UVAI products is the occurrence of large positive values along the eastern coast of the Caspian Sea, particularly over the northern Caspian Sea and Garabogazköl Gulf. To determine whether airborne dust was responsible for these anomalies, we compared multiple UVAI products with coincident CALIOP AOD0.53 measurements along the CALIPSO overpass shown in Fig. 3. To account for the along-track scan time differences (<30 min apart) between the sensors, we shifted the UVAI products to match the UVAI and AOD0.53 maxima observed at the southeastern coast of the Caspian Sea (see Fig. 2d). Next, we applied a 5 s moving averaging to smooth the co-located data, which are shown in Fig. 4.
Apparently, CALIOP detected only a very thin aerosol layer over the northern Caspian Sea and Garabogazköl Gulf. The large positive UVAI in these regions also remained stationary and persisted on dust-free days, indicating that they were unlikely caused by dust and likely related to time-invariant surface features. Due to influx of sediment-rich water from the Volga and Ural rivers (Modabberi et al., 2019; Moradi, 2022), the northern Caspian Sea displays persistent discoloration, as seen in Fig. 3a. This shallow, sediment-rich water strongly absorbs in the near-UV, producing enhanced absorption at shorter wavelengths that resembles the spectral signature of airborne dust (He et al., 2012; Lee et al., 2013). Similarly, the shallow, saline waters of Garabogazköl Gulf (with a salinity of ∼ 35 %) cause strong near-UV absorption and yield a dust-like UVAI signal, in contrast to the deep water of the Caspian Sea, which has a much lower salinity (∼ 1.3 %) and yields near-zero UVAI. Large positive UVAI values are also observed over the Sor Kaydak salt marsh due to enhanced UV absorption by salt minerals and organisms (Fig. 3). In summary, enhanced UV absorption by turbid and saline waters and salt flats causes the water-leaving UV radiances to deviate from those for a pure scattering atmosphere, thereby generating large positive UVAI that resembles the effects of airborne dust. This surface-feature-related UVAI signal may be common over ephemeral and dried lakes, which constitutes a potential source of error in using UVAI products for dust plume detection and source mapping in these regions.
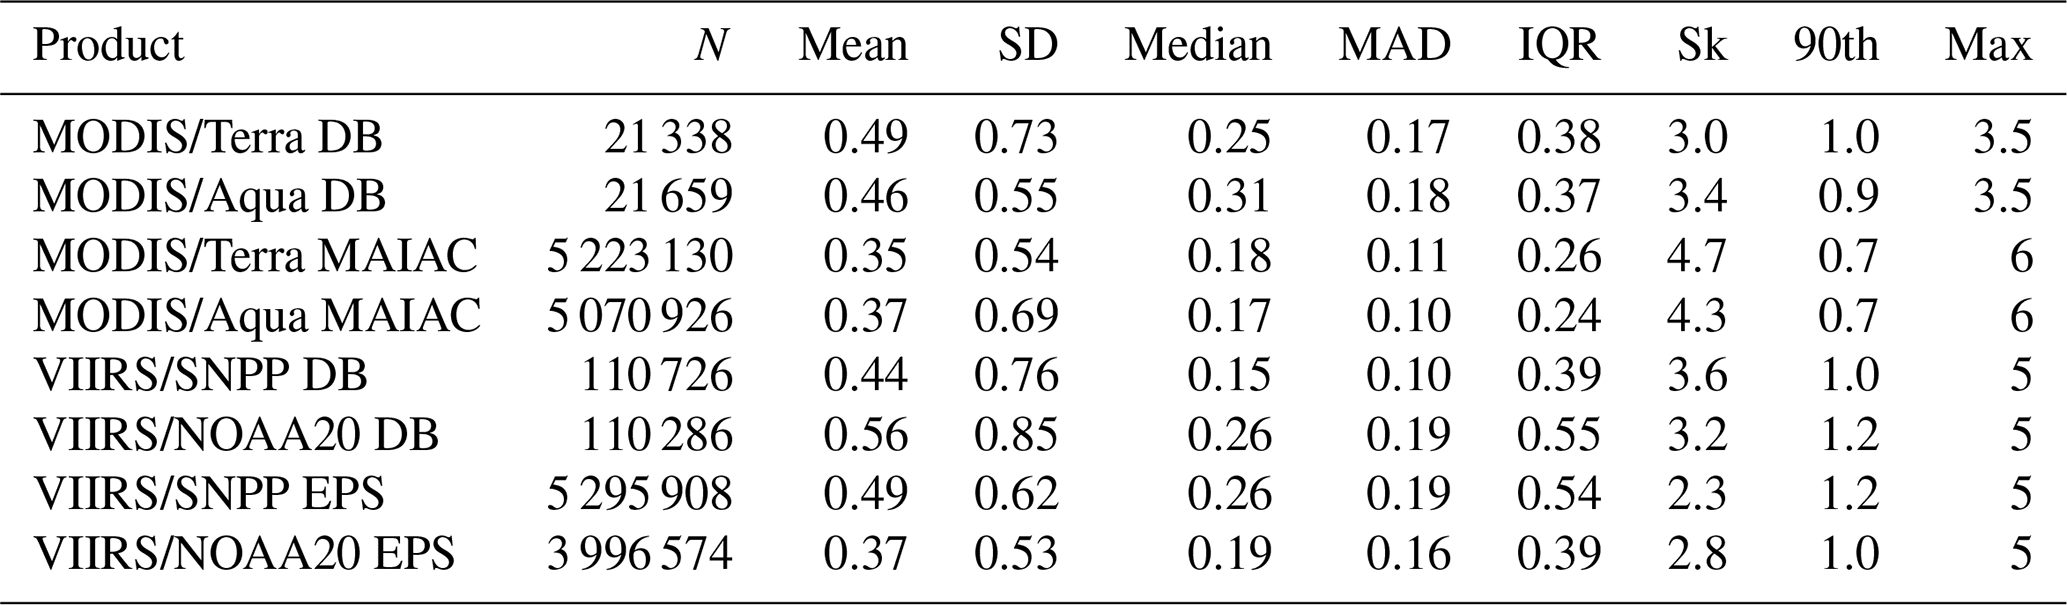
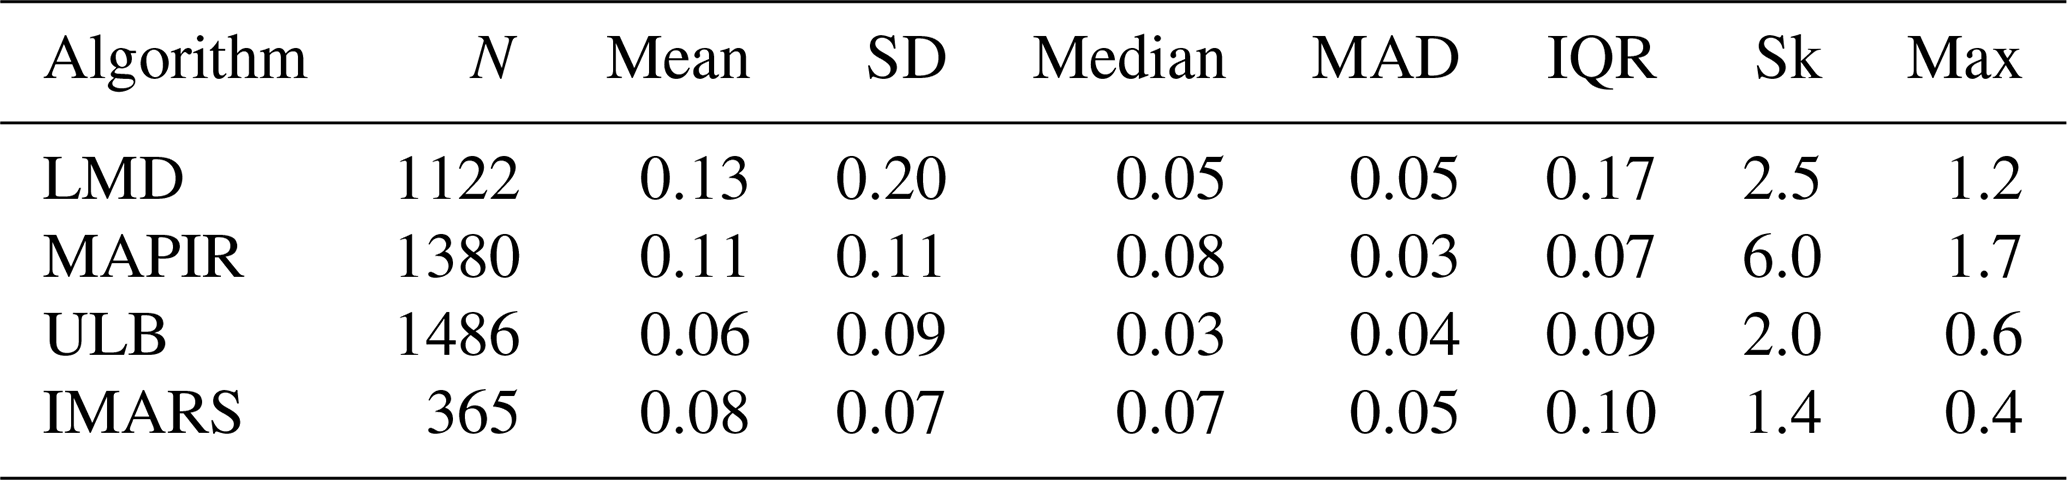
Table 2Summary statistics of eight AOD products in observing the Aralkum dust aerosol during 27–29 May 2018 based on the best-quality over-land retrievals. SD: standard deviation. MAD: median absolute deviation. IQR: interquartile range. Sk: skewness. 90th: 90th percentile.
3.3 Comparison of mid-visible AOD products
3.3.1 AOD retrieval over desert surfaces
Table 2 summarizes the statistics of eight AOD products based on the best-quality over-land retrievals between 27 and 29 May 2018. The number of pixels differs greatly among the products, indicating inconsistent sampling due to differences in spatial resolutions, screening of irretrievable scenes (e.g., clouds, snow/ice, sun glint, ocean color), and/or QA definitions. The inconsistent sampling, along with algorithm differences as discussed in Sect. 2.2, contributes to disparities in the AOD statistics. In addition, the NOAA EPS product uses L1b data from the NOAA VIIRS calibration/validation group, while the NASA DT and DB products use the L1b data from the NASA VIIRS Calibration Support Team, which may further contribute to product inconsistency.
The MODIS-retrieved AOD appears more consistent between Terra and Aqua platforms than between DB and MAIAC algorithms. In particular, the mean AOD differs by less than 10 % between Terra and Aqua but exceeds 20 % between DB and MAIAC. Compared to MAIAC, DB produces a larger upper tail, as indicated by a higher 90th percentile, and consequently a broader distribution (higher SD, MAD and IQR). MAIAC produces a narrower distribution (lower MAD and IQR) despite more extreme high values (i.e., upper limit of 6 versus 3.5 for DB).
VIIRS DB and EPS algorithms employ the same upper AOD limit (5) but display more complex patterns compared to MODIS. For VIIRS/SNPP, EPS yields a higher mean and median as well as more extreme values, while DB produces a larger SD and skewness, indicating a broader upper tail. For VIIRS/NOAA20, DB yields a larger spread (higher SD and IQR) and a larger upper tail (higher 90th percentile) than EPS, suggesting that DB captures more frequent high AOD values.
Next, we focus on comparing the MODIS/Aqua DB versus MAIAC products and VIIRS/NOAA20 DB versus EPS products. By comparing AOD retrieved from the same sensor, we can attribute the disparity to the choice of algorithms. The instruments are hereafter referred to simply as MODIS and VIIRS unless otherwise noted. Due to different spatial resolutions, the L2 products are gridded onto a uniform 0.2°×0.2° resolution by computing the mean value of all pixels within each grid cell. We only use the best-quality retrievals based on the QA rules recommended in each product.
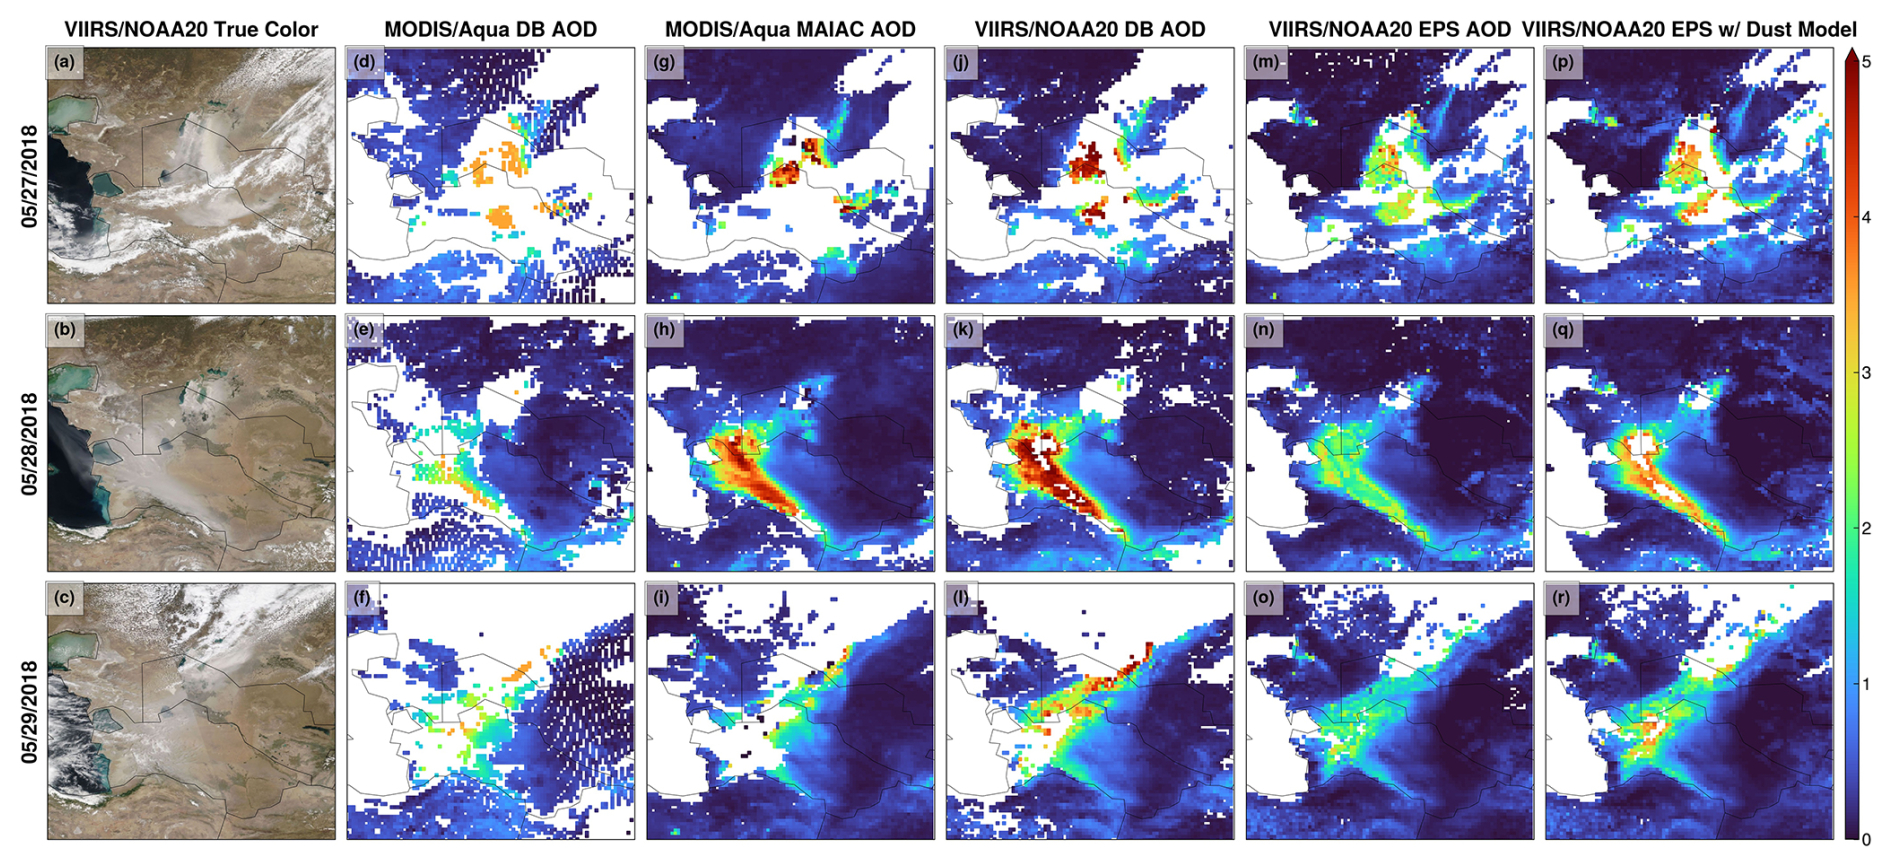
Figure 5Over-land AOD retrievals on 27–29 May 2018. (a–c) VIIRS/NOAA20 true color images, (d–f) MODIS/Aqua DB product, (g–i) MODIS/Aqua MAIAC product, (j–l) VIIRS/NOAA20 DB product, (m–o) VIIRS/NOAA20 EPS product, and (p–r) VIIRS/NOAA20 EPS product using the dust optical model as a test case.
Figure 5 displays the daily gridded AODs, along with VIIRS true color composites to help attribute missing retrievals to either clouds or incorrect cloud screening. None of the products captured the full extent of the fresh dust plume on 27 May 2018. The retrieved AOD over the dust scene also reached the upper limit defined in each algorithm. There are several reasons for defining an upper AOD limit. First, setting an upper AOD limit is necessary to minimize the effect of residual cloud contamination. Second, AOD retrieval from reflected sunlight relies on scene brightening by aerosol scattering (primarily the forward scattering of surface reflection) against a relatively dark background. At high aerosol loadings, the TOA reflectance becomes less sensitive to additional AOD increases, hence making AOD retrieval less accurate during heavy aerosol events. Lastly, AOD retrieval is performed by matching observed TOA reflectances against pre-computed values within a specific AOD range. A poor fit may result, if the aerosol burden exceeds the predefined range. Retrievals under such scenarios are often flagged as marginal quality and consequently excluded from our screening for the best-quality data. Thus, heavy dust scenes may be either retrieved but with low confidence in clear sky or classified as clouds and not retrieved.
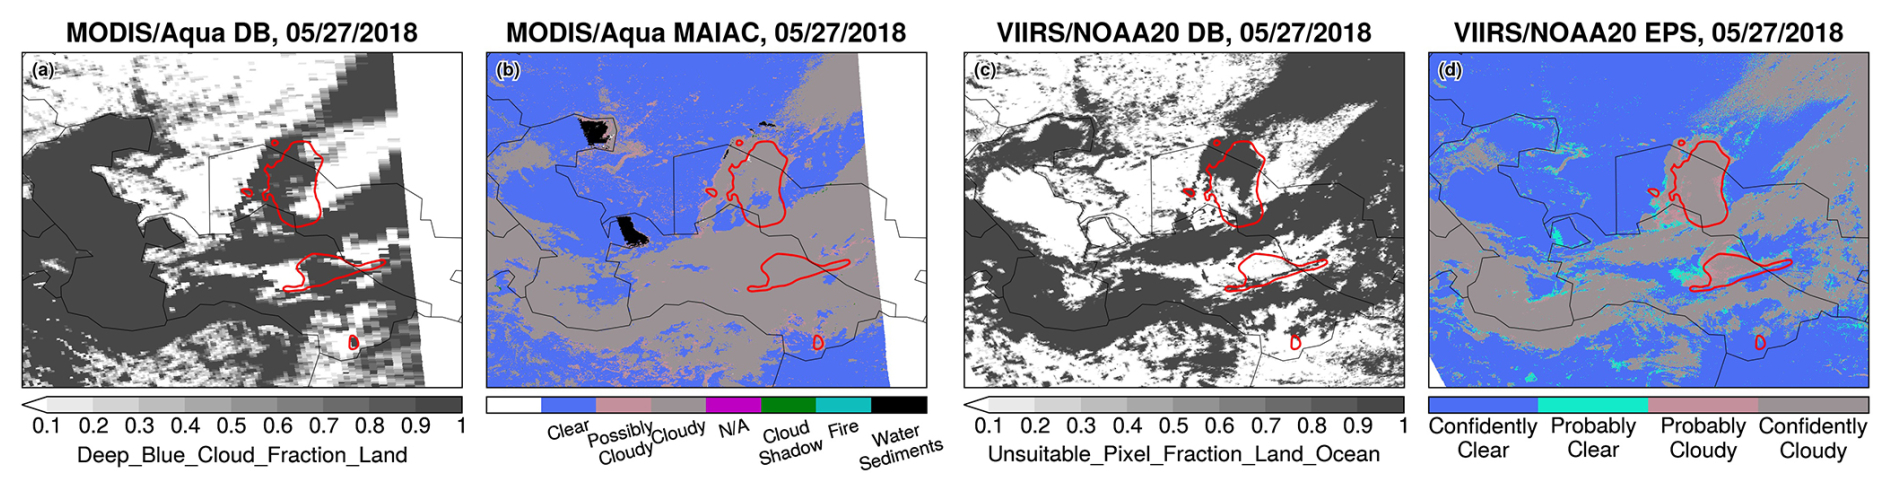
Figure 6Misclassification of freshly emitted dust as clouds on 27 May 2018. (a) Cloud fraction from MODIS/Aqua DB product, (b) cloud mask from the MODIS/Aqua MAIAC product, (c) unsuitable pixel fraction from the VIIRS/NOAA20 DB product, and (d) cloud mask from the VIIRS/NOAA20 EPS product. Red contours indicate the 95th percentile (2.1) of the TROPOMI TropOMAER UVAI product.
To check whether the freshly emitted dust on 27 May was erroneously classified as clouds, Fig. 6 displays the cloud fraction or cloud masks reported in selected granules from each product. Figure 6 reveals that the thick dust plume is mostly flagged as clouds in all products. For MODIS, DB detected parts of the plume fringes, where the retrieved AOD reached the algorithm limit (3.5). MAIAC classifies the majority of the dust scene as “cloudy”. For VIIRS, DB does not report cloud masking or fraction; instead it reports an Unsuitable_Pixel_Fraction_Land_Ocean parameter, which indicates that the dust pixels near Aralkum were not retrieved. Similarly, EPS flags the dust scene as “confidently cloudy”.
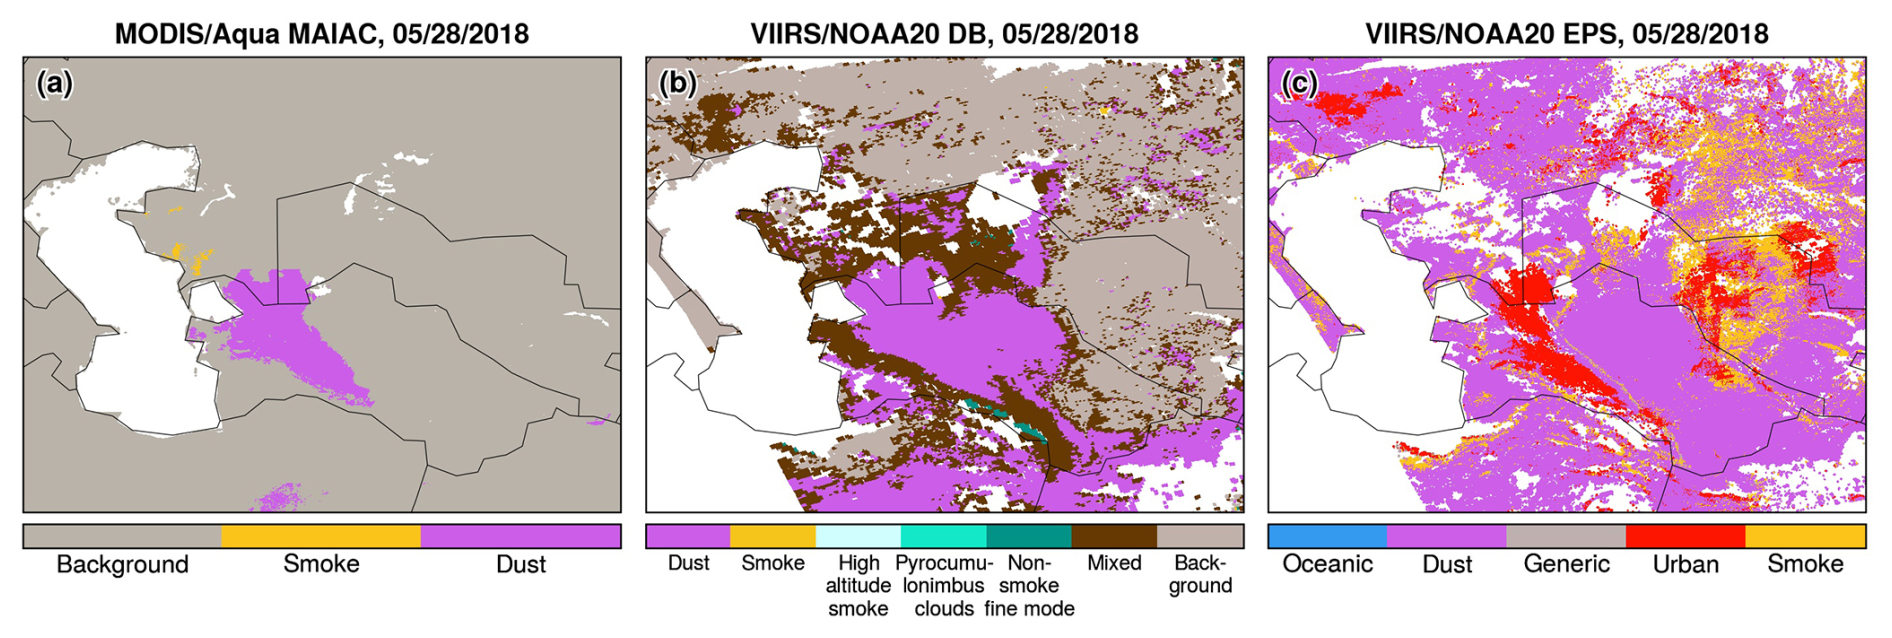
Figure 7Aerosol optical model used for over-land retrievals on 28 May 2018 in the (a) MODIS/Aqua MAIAC, (b) VIIRS/NOAA20 DB, and (c) VIIRS/NOAA20 EPS products.
On 28 May 2018, a high-pressure system produced cloud-free conditions, providing an optimal sky condition for aerosol retrieval (Fig. 5b). All products successfully captured the extensive dust layer; however, there are large differences in the AOD magnitudes. Notably, VIIRS EPS yields significantly lower (by more than 50 %) AOD than other products over dust-affected areas. As described in Sect. 2, satellite algorithms use predefined aerosol optical models (including coarse-mode dust models) to represent location- and season-dependent aerosol microphysical properties. To determine whether the dust optical model was successfully selected, Fig. 7 displays the aerosol optical model selected for retrieval in each product. MODIS DB does not report this information and is thus not shown. Both MODIS MAIAC and VIIRS DB successfully selected their respective dust models for the dust scene over western Turkmenistan. VIIRS EPS selected the urban aerosol model, presumably because the urban model produced a closer match between observed and simulated TOA reflectances.
According to Laszlo and Liu (2022), EPS first retrieves AOD in the blue channel (0.41 µm) and then scales it to longer wavelengths using the normalized spectral extinction coefficients associated with the aerosol optical model. The normalized extinction coefficient exhibits much stronger wavelength dependence in the urban model than the dust model (see Figs. 3–4 in Laszlo and Liu, 2022). For the same AOD0.41 value, the dust model would yield more than 40 % higher AOD compared to the urban model. In other words, had the dust model been selected, EPS would have retrieved higher AOD that aligns more closely with DB and MAIAC. Indeed, when we forced EPS to use the dust model, its agreement with DB and MAIAC improved, although the retrieved AODs were still lower and had more marginal-quality retrievals that were excluded from our screening procedure (Fig. 5p–r).
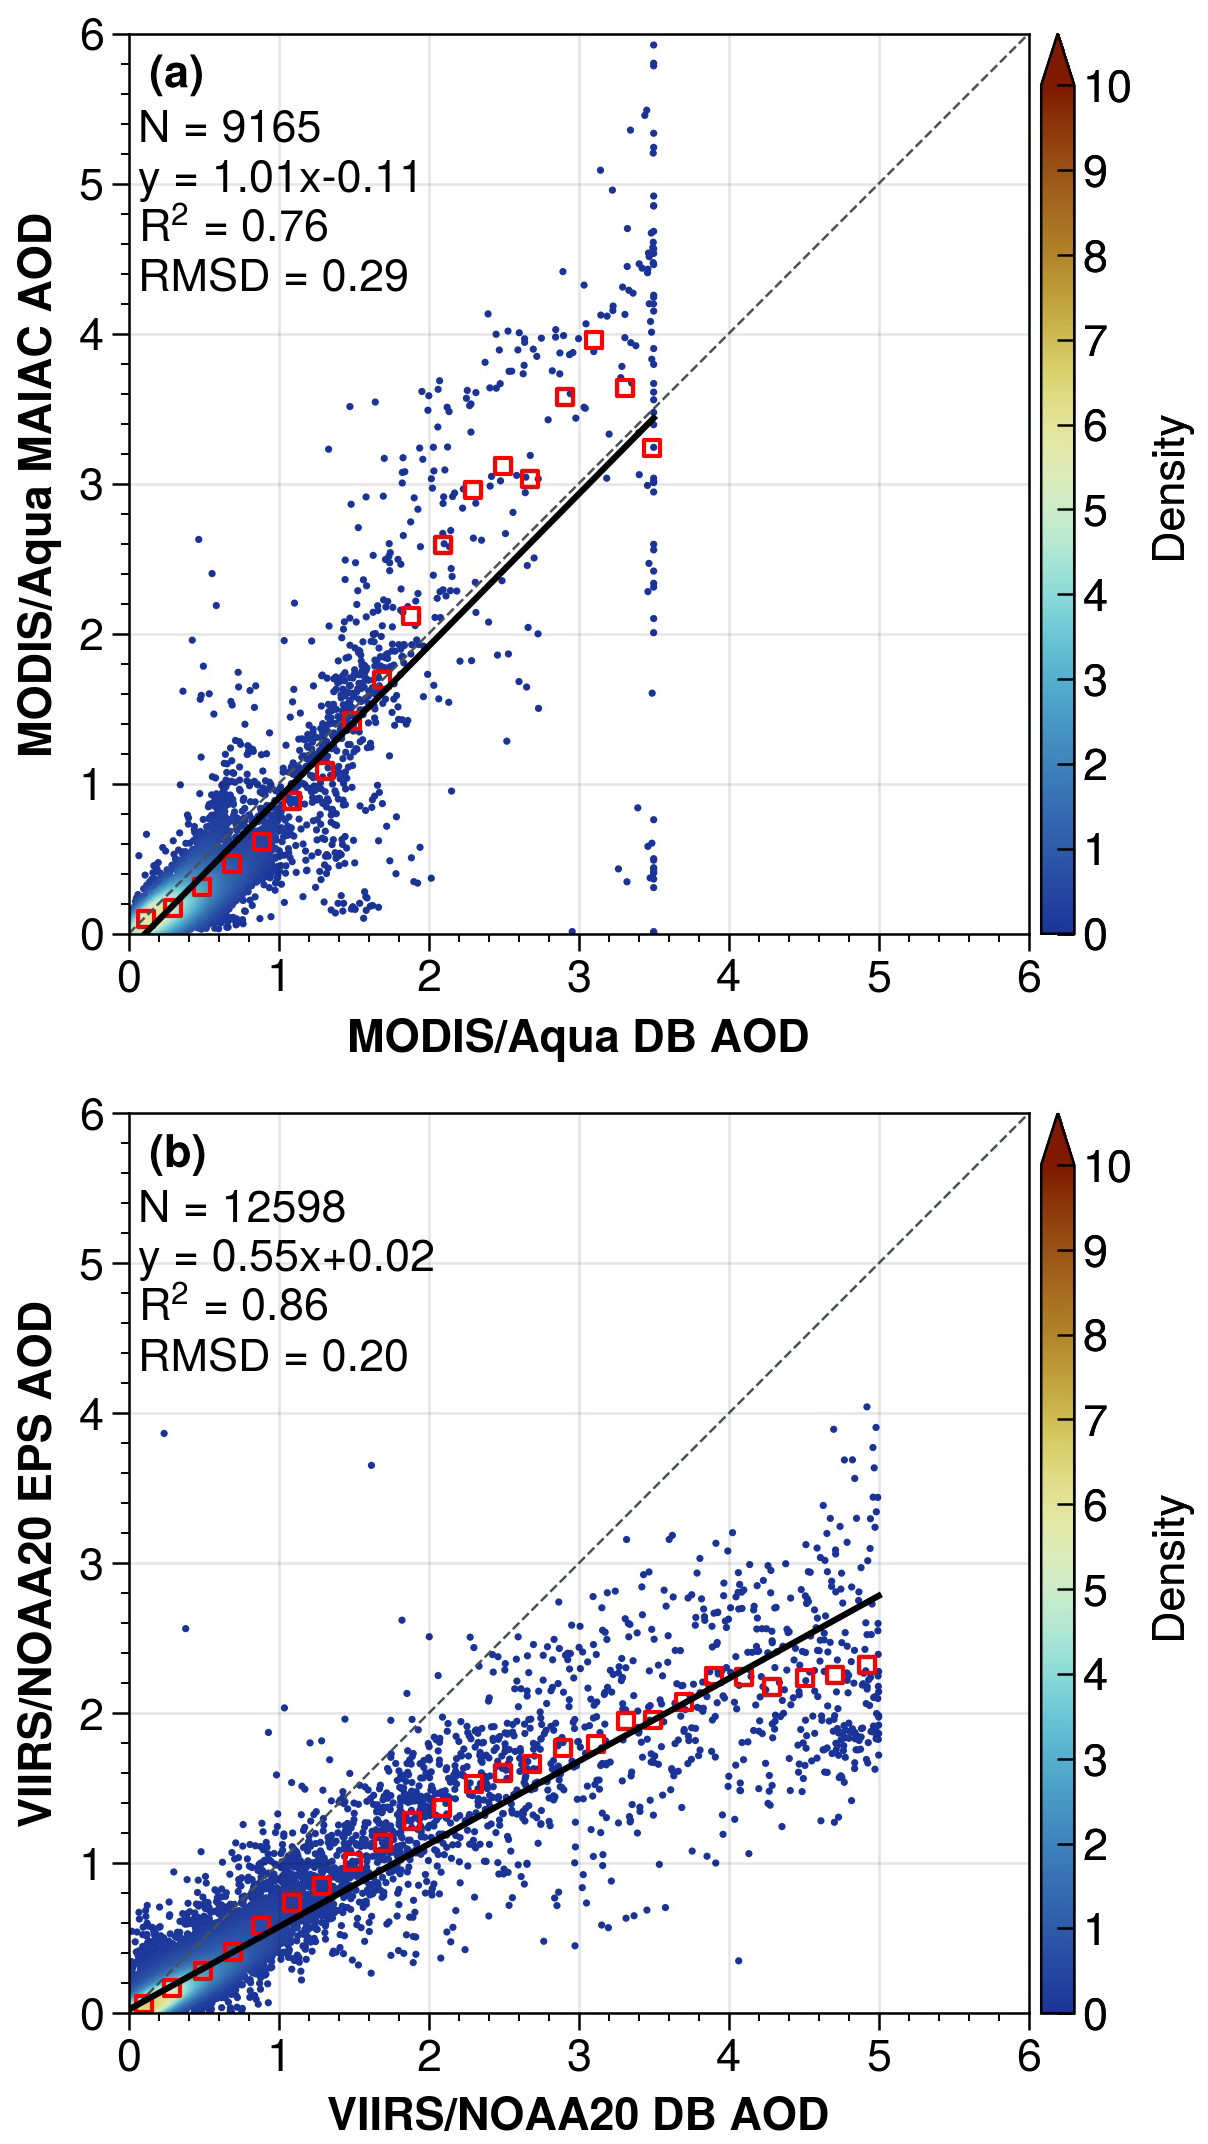
Figure 8Comparison of over-land AOD retrievals during 27–29 May 2018: (a) MODIS/Aqua MAIAC vs. DB and (b) VIIRS/NOAA20 EPS vs. DB. Black lines indicate the linear model fits. Red squares indicate bin-averaged AODs every 0.1 increment. RMSD: root mean square difference.
Using the gridded AOD products in Fig. 5, we conducted a regression analysis to further examine the consistency between aerosol algorithms. The results are shown in Fig. 8. The choice of algorithms for both MODIS and VIIRS introduces a nonlinear response in the retrieved AOD. For MODIS, MAIAC produces lower AOD than DB under low aerosol loadings (e.g., 36 % lower for AOD < 1) but higher AOD under heavy loadings (22 % higher for 2 < AOD < 3). This nonlinearity may be partly explained by MAIAC's higher spatial resolution, which yields more extreme retrievals (either very clean or heavily polluted). The higher AOD limit in MAIAC (6 vs. 3.5 for DB) may further exacerbate the discrepancies at heavy aerosol loadings, as shown in Fig. 8a. For VIIRS, EPS produces generally lower AODs than DB under all aerosol loadings, with the EPS–DB difference increasing from 37 % for AOD < 1 to 51 % for 4 < AOD < 5 (Fig. 8b). Indeed, Fig. 5m–o show that EPS yields approximately 50 % lower AODs than other algorithms over the dust scene.
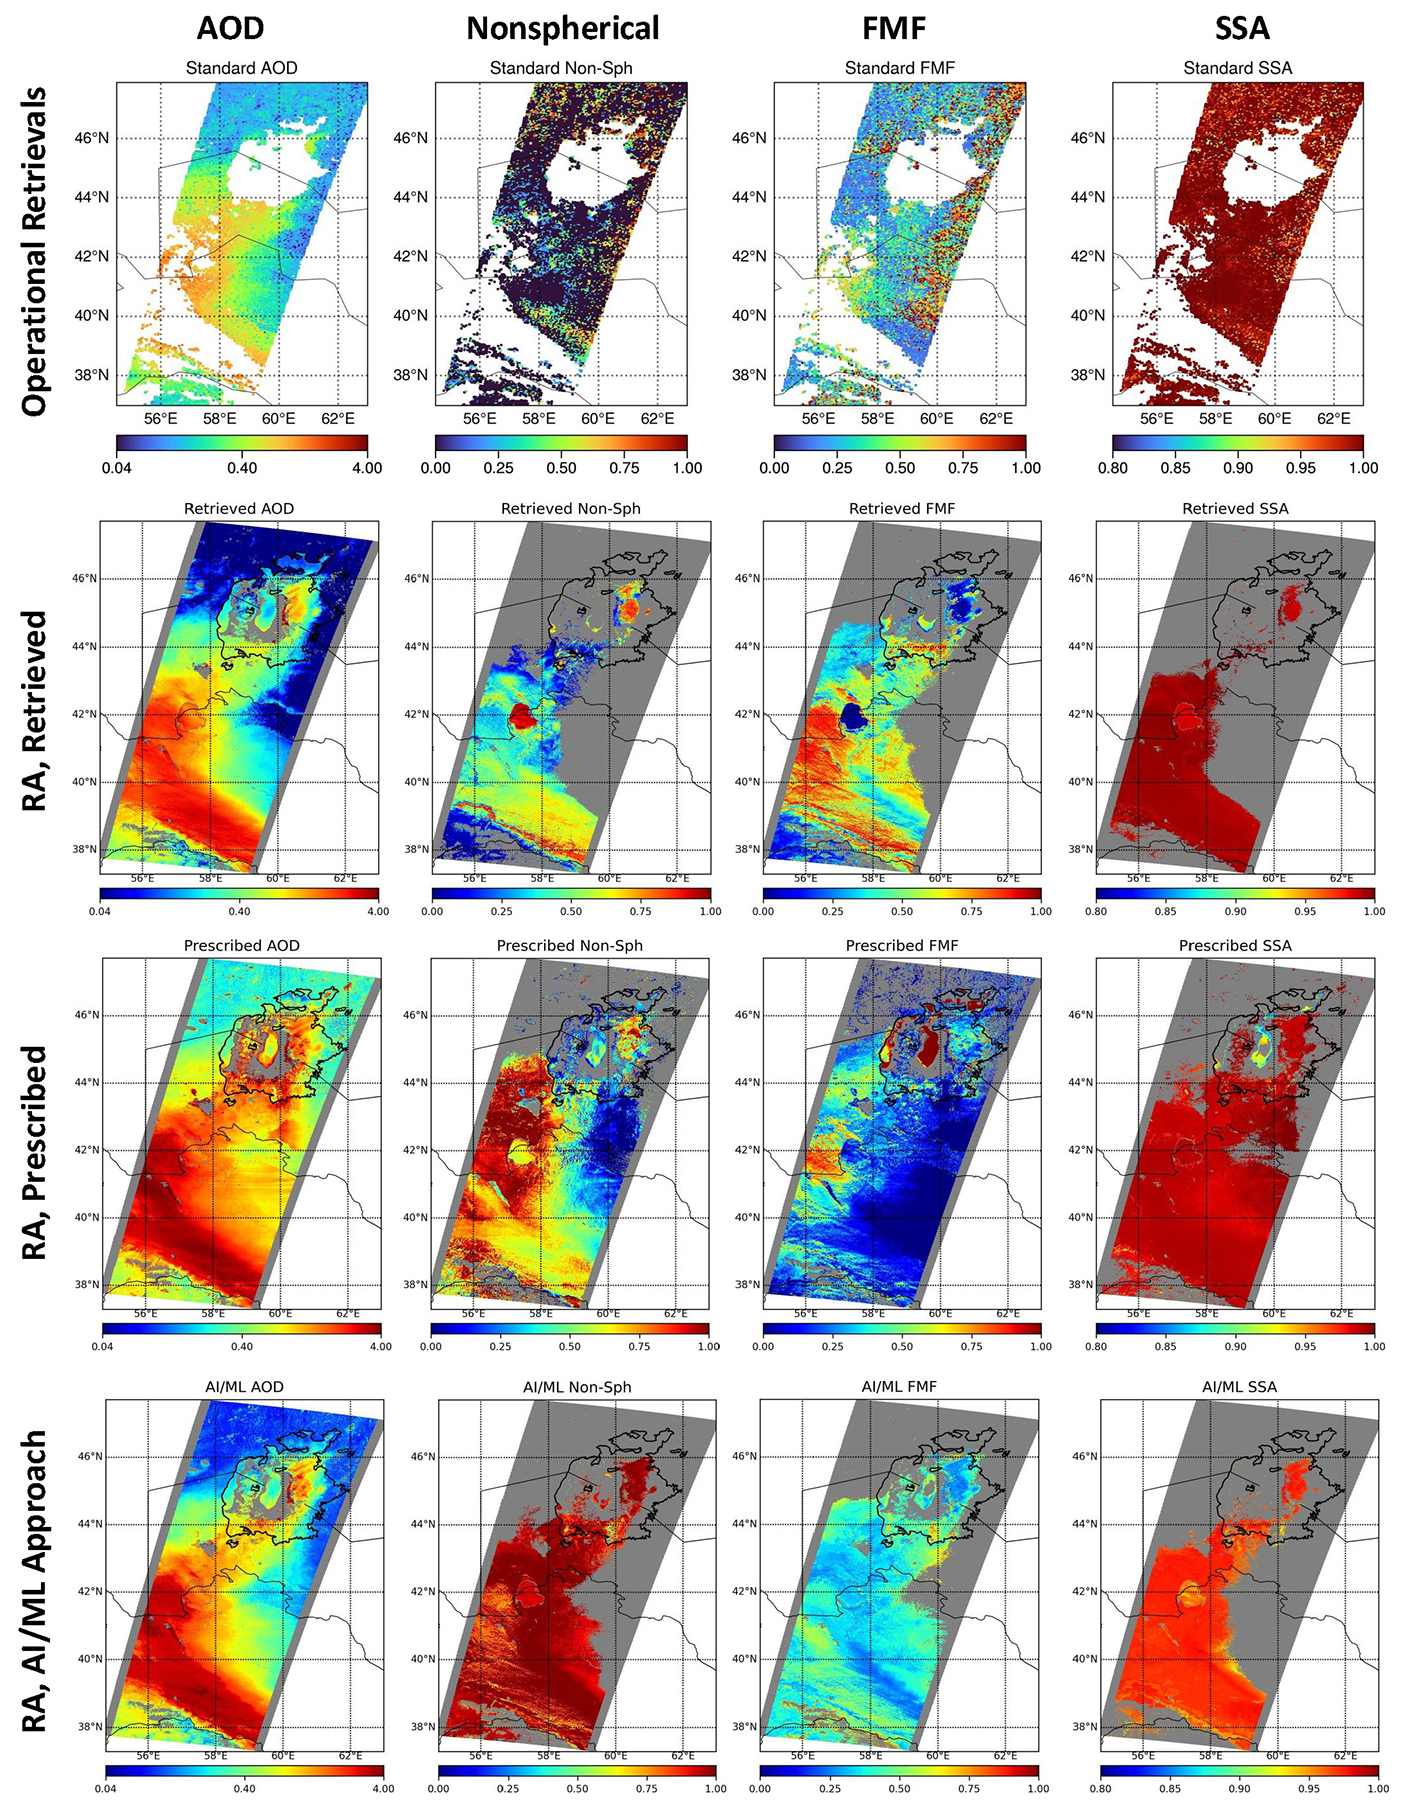
Figure 9MISR aerosol retrievals on 28 May 2018. Operational standard product (top row), research algorithm (RA) with retrieved surface reflectances from MISR data (second row), research algorithm with prescribed surface reflectances from the MODIS MAIAC product(third row), and research algorithm using an AI/ML approach (bottom row).
Figure 9 displays MISR AOD retrievals on 28 May 2018 (orbit 98092) based on the standard operational product and MISR research algorithms. The standard product exhibits several limitations. First, an outdated land/water mask was used and marked the Aral Sea as “shallow water”; as a result, no retrievals were performed over the Aralkum Desert. Second, the lofted dust over the Kopet-Dag foothills was misclassified as clouds. Lastly, the retrieved AOD is substantially lower than those from single-view sensors (Fig. 5). Kahn et al. (2010) noted that MISR tends to underestimate AOD under heavy aerosol loadings, as the weak surface reflection signal leads to poor surface–atmosphere separation and overestimation of the surface contribution to TOA radiances. Additionally, the standard product selected spherical non-absorbing aerosol mixtures for the dust scene, resulting in underestimation of the nonspherical fraction and overestimation of FMF and SSA. A key factor for the biased particle property retrieval is the lack of appropriate aerosol optical models for saline dust in the MISR standard algorithm; consequently, the particle property retrievals are of low confidence.
To explore the particle property information content of MISR observations, we ran the MISR research algorithm in three modes: (a) with the surface retrieved self-consistently with the atmosphere using only MISR data, (b) with the surface reflectance prescribed from the MODIS MAIAC product (Limbacher et al., 2022), and (c) with a modified algorithm based on an AI/ML approach. Initial statistics indicate that these models do well in the regional means. AOD is retrieved fairly consistently with all three approaches, except in the highest- and lowest-AOD regions. The agreement with single-view AOD products (Fig. 5, second row) is improved substantially. The prescribed surface results appear to perform better for extremely high AOD conditions and capture the increasing AOD gradient towards the Kopet-Dag Range. The retrieved nonspherical fraction and FMF show large discrepancies among the three approaches. The AI/ML approach performs closest to expectation in this case (i.e., NonSph > 0.8), whereas the retrieved and prescribed surface results may have underestimated the nonspherical fraction. Results for SSA are generally consistent, with SSA > 0.95 for the dust scene, except for low-AOD regions where the AI/ML SSA results are probably too low.
3.3.2 AOD retrieval over the Caspian Sea
We further compared six AOD products in observing the dust outflow to the Caspian Sea on 28 May 2018 based on the best-quality retrievals from MODIS/Aqua (DT, DT3K, and MAIAC) and VIIRS/NOAA20 (DT, DB, and EPS). All Level-2 products were gridded to a 0.1°×0.1° resolution by averaging the pixels within each grid cell. Bilinear interpolation was applied to the MODIS DT product to account for reduced pixel resolutions near sensor swath edges. The gridded AODs are displayed in Fig. 10.
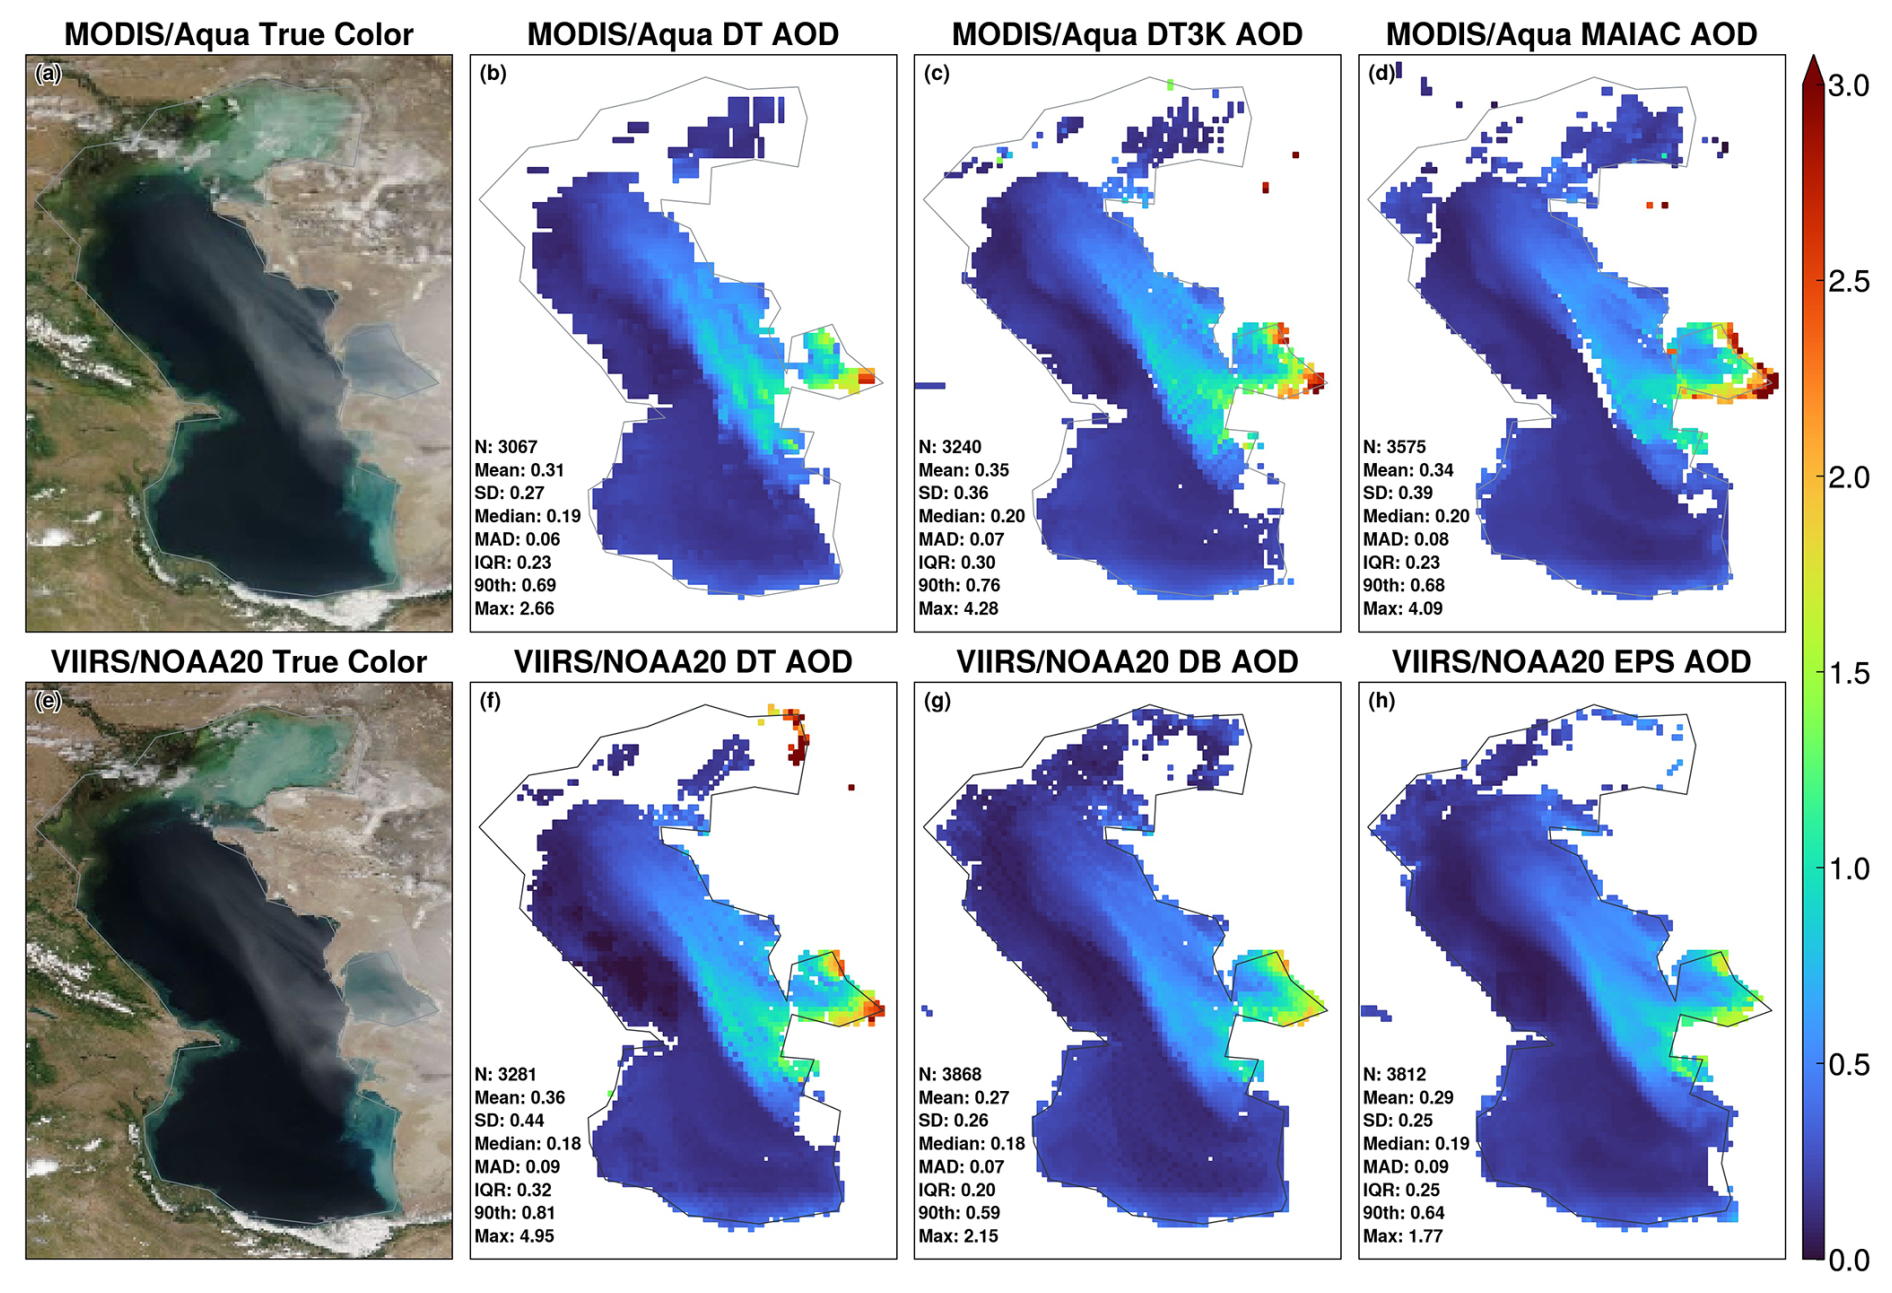
Figure 10Over-water AOD retrievals over the Caspian Sea on 28 May 2018. Top row panels are MODIS/Aqua (a) true color composite, (b) DT AOD, (c) DT3K AOD, and (d) MAIAC AOD. Bottom row panels are VIIRS/NOAA20 (e) true color composite, (f) DT AOD, (g) DB AOD, and (h) EPS AOD. All products are gridded to a 0.1°×0.1° resolution.
All products capture the enhanced aerosol burden associated with dust outflow to the Garabogazköl Gulf and Caspian Sea. Among the MODIS products, DT3K and MAIAC produce more extreme AOD than DT, resulting in higher means and greater spread (indicated by higher SD and MAD). These spurious AODs create unnatural discontinuities along coastal regions, likely due to inaccurate surface reflectance characterization. VIIRS DT retrieves very high AOD over the shallow waters and salt flats over northern Caspian Sea and to a lesser extent over the coastal region of Garabogazköl Gulf. The non-negligible surface signal from these areas deviated from the dark water surface assumption in the DT algorithm and was likely misinterpreted as aerosol signal, leading to spurious high AODs. As a result, VIIRS DT produces a higher mean, more extreme upper tail values (indicated by the 90th percentile and maximum), and a larger spread (higher SD and IQR) than DB and EPS.
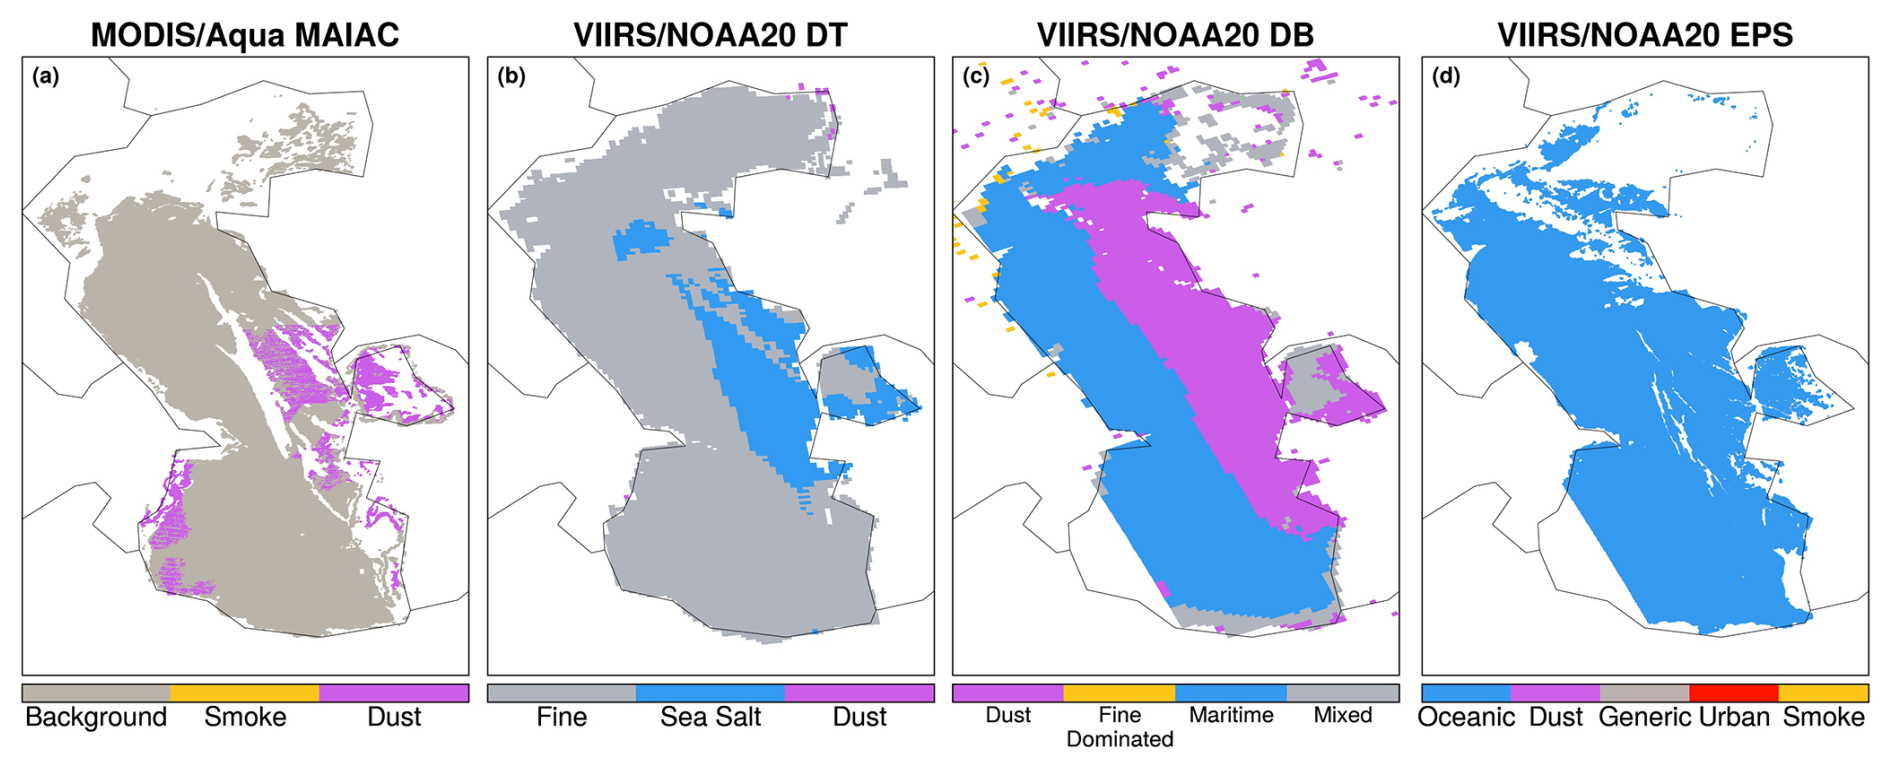
Figure 11Aerosol optical models used for AOD retrieval over the Caspian Sea on 28 May 2018 in the (a) MODIS/Aqua MAIAC, (b) VIIRS/NOAA20 DT, (c) VIIRS/NOAA20 DB, and (d) VIIRS/NOAA20 EPS products.
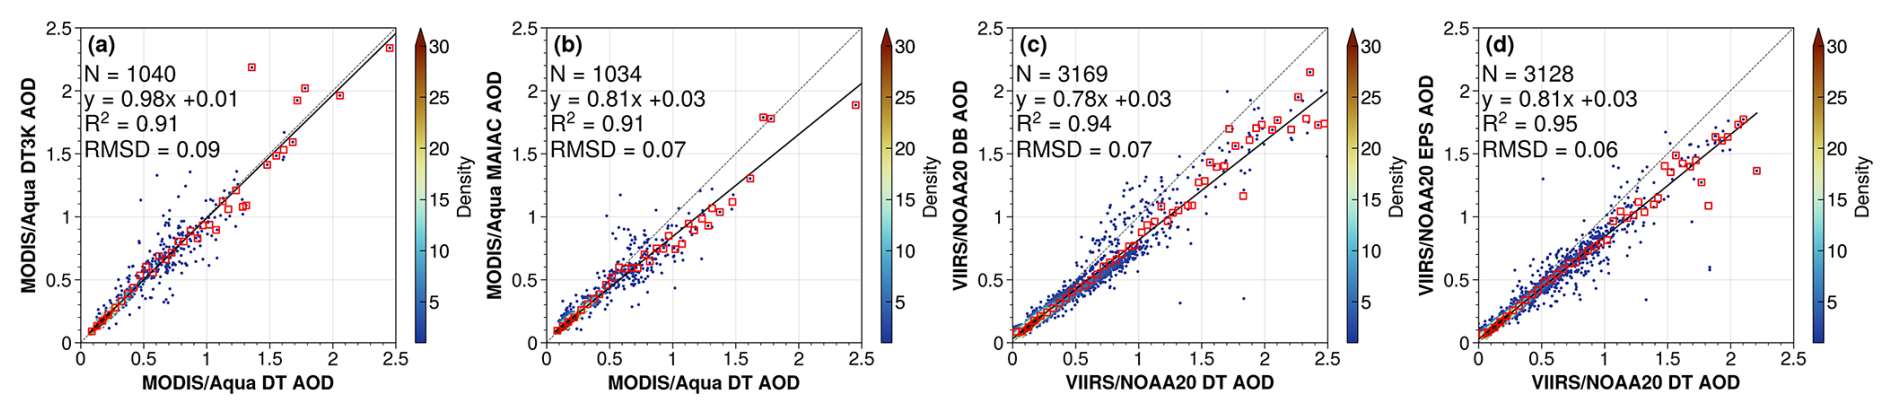
Figure 12Comparison of AOD retrievals over the Caspian Sea on 28 May 2018: (a) MODIS/Aqua DT3K vs. DT, (b) MODIS/Aqua MAIAC vs. DT, (c) VIIRS/NOAA20 DB vs. DT, and (d) VIIRS/NOAA20 EPS vs. DT. Black lines indicate the linear regression fits. Red squares indicate bin-averaged AODs at 0.05 increments. RMSD: root mean square difference.
We further examined the aerosol optical models selected during the retrieval, as shown in Fig. 11. The MAIAC spheroidal dust model (“Model 6”) was applied to only parts of the dust scene, resulting in discontinuous AOD patterns. The VIIRS DT product reports the AOD partitions among nine fine/coarse aerosol models in the “best solution”, from which we computed the relative contributions of three aerosol type: fine aerosol, sea salt, and coarse dust. The sea salt type is a dominant contributor to the AOD, suggesting that the sea salt aerosol model provides the closest fit to the dust scene in the “best solution”. VIIRS DB successfully applied its spheroidal dust model for the full extent of the dust scene and a maritime aerosol model for dust-free regions. VIIRS EPS selected its oceanic aerosol model for the full scene, again failing to select the dust model similar to the over-land retrieval. In summary, the aerosol algorithms showed varied performance in selecting aerosol optical models for AOD retrieval over the Caspian Sea.
Figure 12 compares the gridded AOD products via linear regression to assess the consistency between algorithms. Over-water retrievals exhibit stronger linear relationships and better agreement than over-land retrievals (Fig. 8), with R2>0.9 and RMSD < 0.1 in all cases. MODIS DT and DT3K products show excellent agreement with a slope of 0.98 and R2 of 0.91, while other products show slightly weaker slopes of ∼ 0.8. In general, DT yields lower AOD under clean marine conditions (AOD < 0.15) but higher AOD in dusty conditions than the MAIAC, DB, and EPS algorithms.
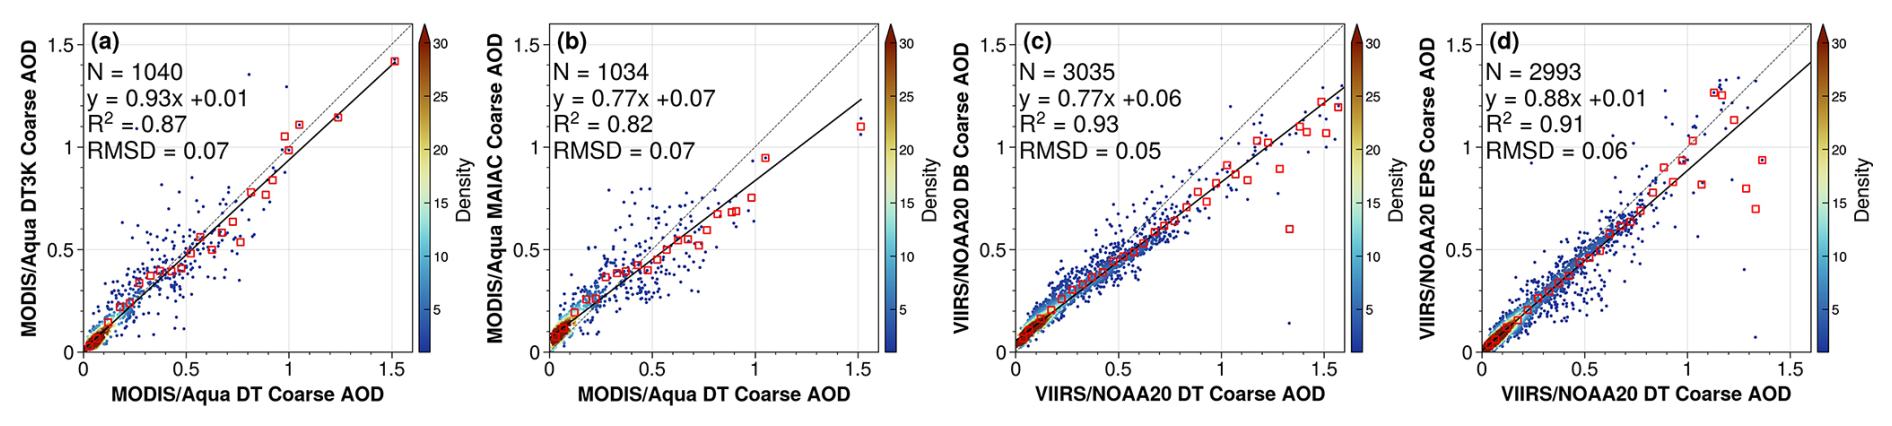
Compared to aerosol retrieval over land, over-water retrieval provides greater information content to constrain particle properties. As described in Sect. 2.2.1, over-water algorithms represent the aerosol column as a sum of a fine and a coarse mode and retrieves the total AOD and FMF. Here, we use the total AOD and FMF to compute the coarse-mode AOD from each product and perform a similar comparison as in Fig. 12. Figure 13 shows that the coarse-mode AODs exhibit strong linear relationships, with R2>0.8 and RMSD < 0.1, although the agreement is somewhat weaker than for the total AOD. Overall, DT tends to yield higher coarse-mode AOD under dust-laden conditions compared to DT3K, MAIAC, DB, and EPS.
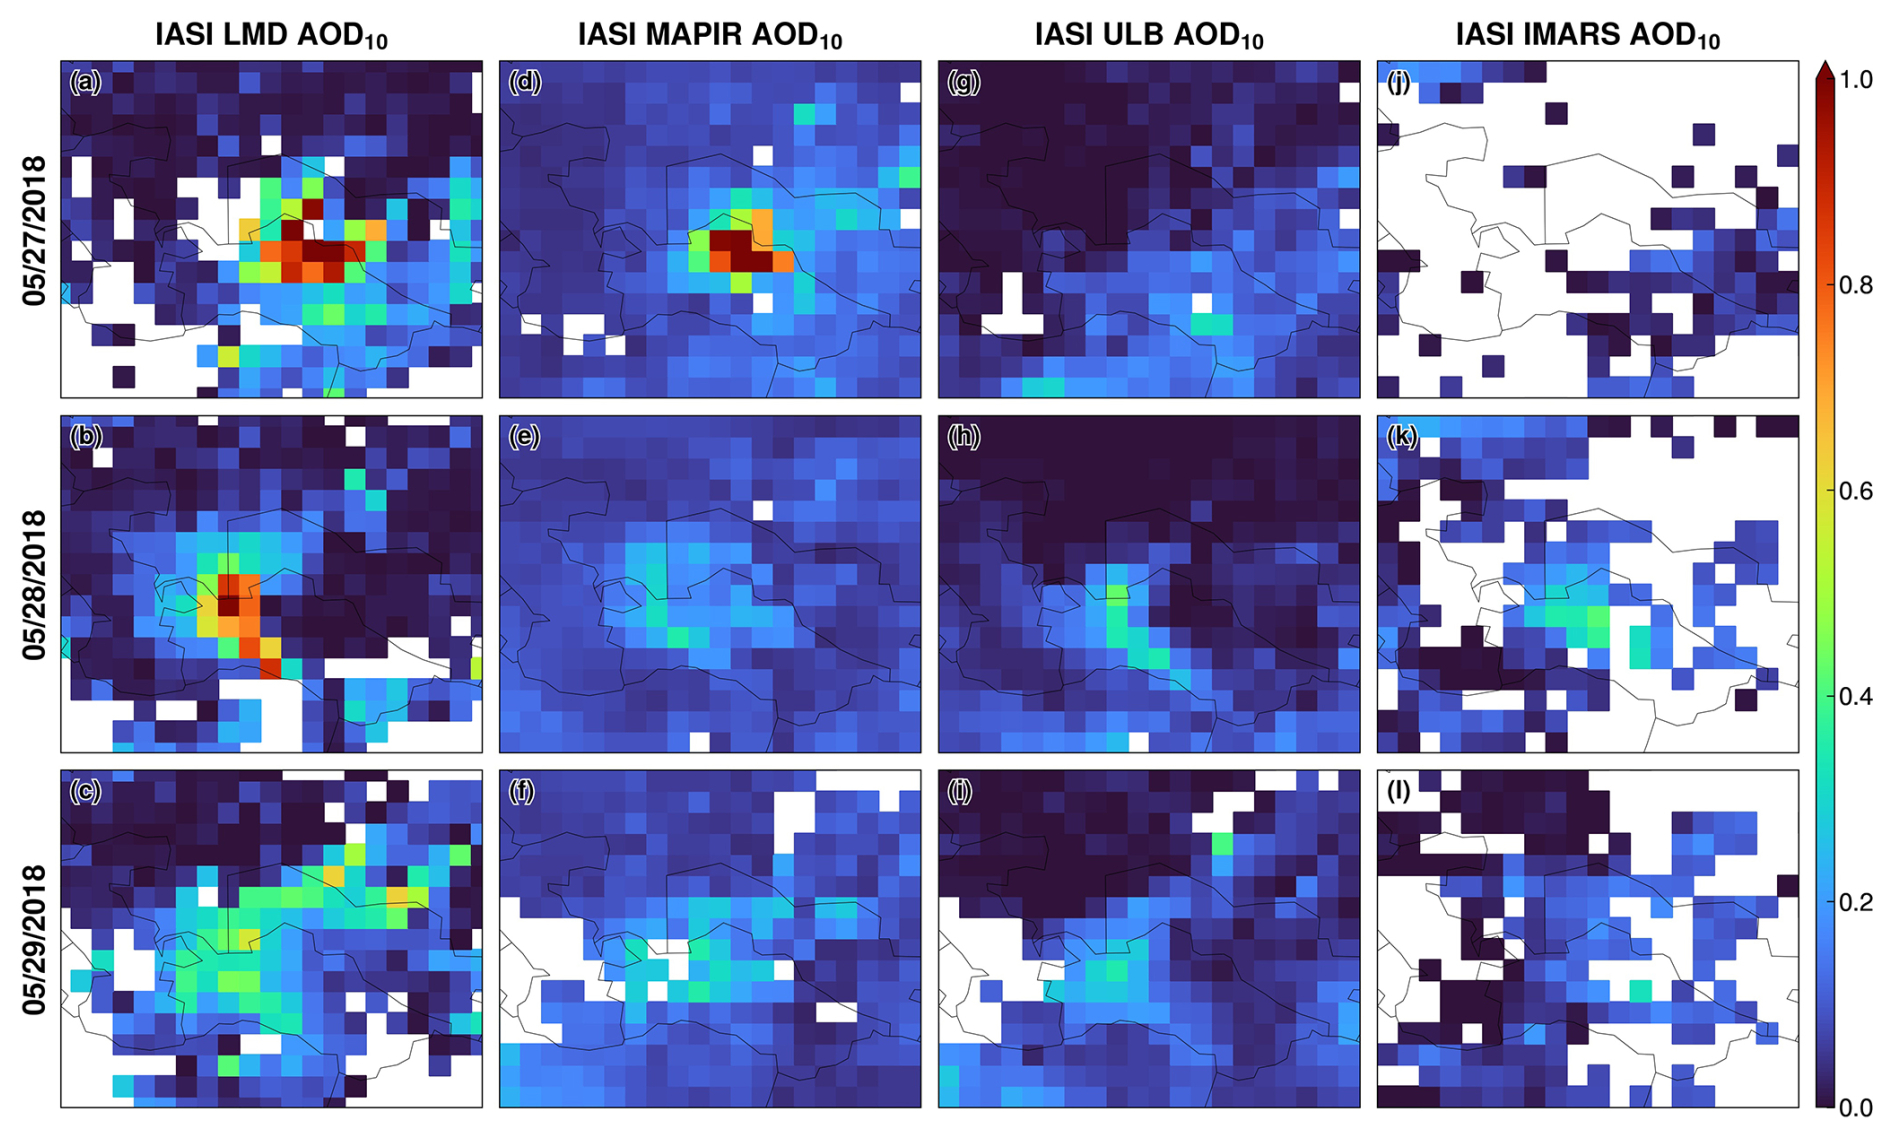
Figure 14IASI AOD10 retrievals from four algorithms on 27–29 May 2018. (a–c) LMD, (d–f) MAPIR, (g–i) ULB, and (j–l) IMARS.
Table 3Summary statistics of four IASI AOD10 products in observing the Aralkum dust aerosol during 27–29 May 2018. SD: standard deviation. MAD: median absolute deviation. IQR: interquartile range. Sk: skewness.
3.4 Comparison of infrared AOD (AOD10) products
This section compares the IASI AOD10 products from four algorithms: LMD, MAPIR, ULB, and IMARS, based on Level-3 daily 1°×1° gridded products. Table 3 summarizes the AOD10 statistics based on separate daytime (descending node) and nighttime (ascending node) retrievals on 27–29 May 2018. Figure 14 displays the daily combined AOD10 by merging the daytime and nighttime observations. The inclusion of both daytime and nighttime data substantially improved the data coverage compared to mid-visible AOD products, which rely solely on daytime observations (Fig. 5).
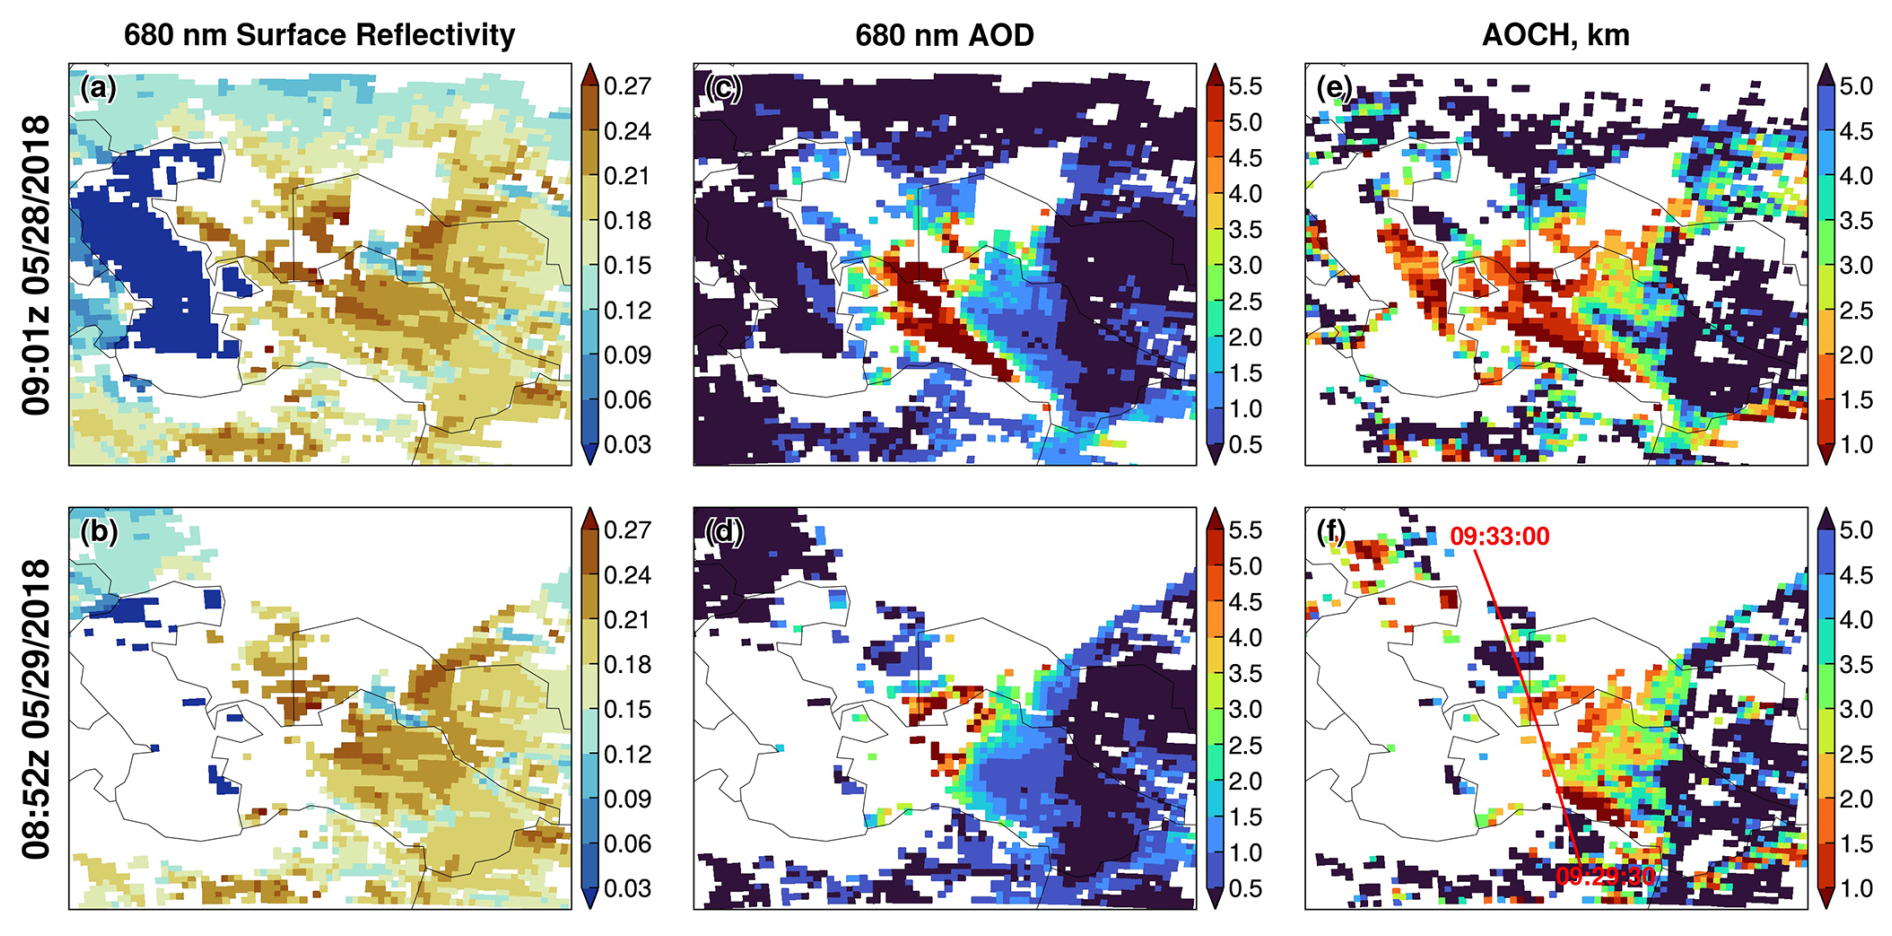
Figure 15EPIC AOCH retrievals at 09:01 Z on 28 May 2018 (a, c, e) and 08:47 Z on 29 May 2018 (b, d, f): (a, b) 680 nm surface reflectivity, (c, d) 680 nm AOD, and (e, f) AOCH. The coincident CALIPSO ground track is shown in panel (f).
Among the four algorithms, LMD has the best performance in detecting the dust plume features both over deserts and the Caspian Sea. On 27 May, LMD captured the extensive plume stretching from the Aralkum Desert to the Kopet-Dag Range (Fig. 14a), outperforming mid-visible techniques in detecting the fresh dust plume. The highest AOD10 (1.2) was observed downwind over Uzbekistan rather than in the immediate vicinity of Aralkum, likely due to difficulty in detecting the heavy dust near the source. Additionally, the retrieved AOD10 reached the upper limit of the predefined range in the LMD algorithm (0–1.4), indicating possible underestimation. Unlike mid-visible retrievals which include fine aerosol contributions, AOD10 is sensitive to coarse particles only. The AOD10-to-AOD ratio depends on the particle size distribution, particularly the relative fraction of fine and coarse modes. Using an AOD10-to-AOD ratio of 0.6 for coarse-dominated dust would imply an AOD10 of ∼ 3, or more than twice the upper limit, based on the maximum VIIRS DB AOD observed on 27 May (Fig. 5j). On 28 May, LMD successfully retrieves the suspended dust by the Kopet-Dag foothills and the dust outflow to the Caspian Sea (Fig. 14b), resulting in a spatially continuous AOD10 pattern, in contrast to mid-visible retrievals which exhibited unnatural discontinuities in coastal regions. The AOD10 on 29 May captures both the remnant dust from the previous days and the new emission event from Aralkum, consistent with VIIRS observation shown in Fig. 5c.
Compared to LMD, MAPIR yields generally higher background AOD10 over aerosol-free areas but lower AOD10 over dust-laden scenes, resulting in less distinct plume features (Fig. 5g–i). The two products exhibit moderate correlations, with R2 of 0.6 for daytime retrievals and 0.4 for nighttime retrievals. MAPIR successfully retrieved the thick dust on 27 May, although with a smaller spatial extent than LMD. MAPIR struggled in detecting dust over the complex terrains of the Ustyurt Plateau and Kopet-Dag foothills on 28–29 May, likely due to increased uncertainty in characterizing the surface properties (e.g., emissivity, temperature), to which infrared retrievals are highly sensitive over elevated terrains (Capelle et al., 2014).
Overall, ULB and IMARS exhibit poorer performance compared to LMD and MAPIR. Specifically, ULB misclassified the fresh dust plume as clouds on 27 May and retrieves very low AOD10 on 28–29 May. IMARS reported substantial missing data for dust-affected areas on all 3 d, likely due to overly restrictive cloud masking and/or low confidence associated with its probabilistic retrievals.
3.5 Comparison of ALH products
In this section, we compare four ALH products: CALIOP aerosol-extinction-weighted height, EPIC AOCH product, IASI LMD mean dust layer altitude, and MISR stereo-height retrieval. The CALIOP ALH is derived from aerosol extinction vertical profiles at 532 and 1064 nm, while the EPIC and IASI products retrieve an effective ALH using passive techniques that rely on a priori assumptions about aerosol vertical distributions (Sect. 2.4). Among the IASI products, we focus on the LMD algorithm due to its better performance in detecting the dust plume features (Fig. 14). Below, we first examine the EPIC retrievals on 28 and 29 May 2018 and use co-located CALIOP measurements for validation. The dust plume on 27 May is misclassified as clouds in the EPIC AOCH product and thus not discussed. Next, we compare the coincident retrievals from EPIC and IASI to assess the consistency between passive ALH retrievals. Finally, we present results for MISR plume height retrieval on 28 May 2018.
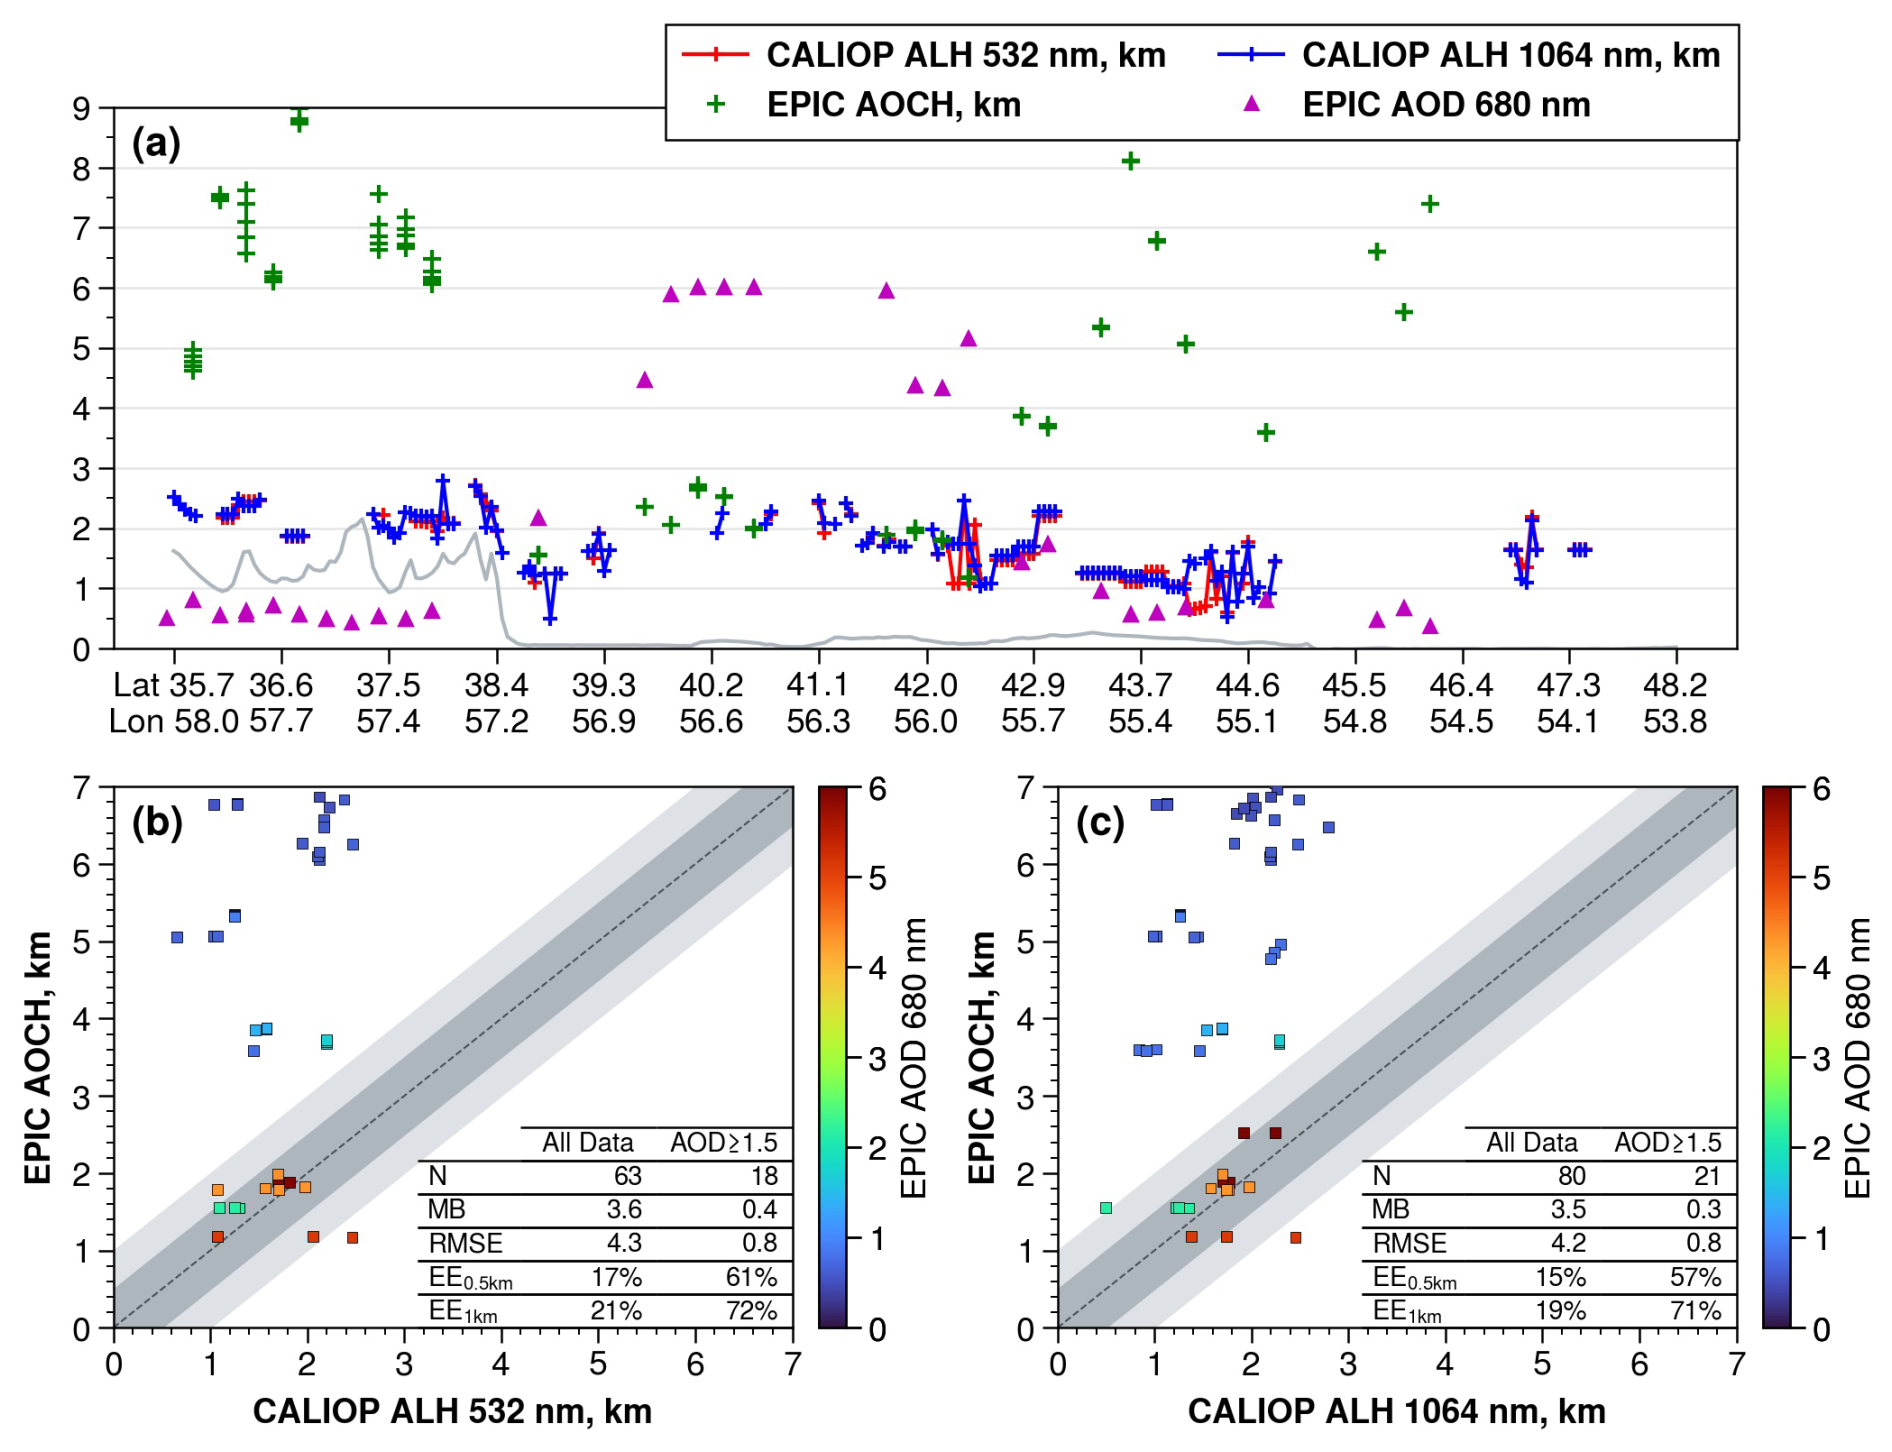
Figure 16(a) Coincident retrievals of CALIOP extinction-weighted ALH and EPIC AOCH along the CALIPSO overpass on 29 May 2018 (ground track shown in Fig. 15f). Magenta triangles are EPIC-retrieved AOD0.68. The gray line indicates the CALIPSO-detected ground surface. (b) Comparison between CALIOP 532 nm ALH and EPIC AOCH. (c) Comparison between CALIOP 1064 nm ALH and EPIC AOCH. N: number of coincident retrievals. MB: mean bias. RMSE: root mean square error. EE: percentage of co-located retrievals within expected errors of 0.5 and 1 km (shaded areas).
Figure 15 displays the 0.68 µm surface reflectivity, AOD0.68, and AOCH retrieved by EPIC. On 28 May, the low surface reflectivity and enhanced aerosol loading (i.e., AOD0.68>0.5) over the Caspian Sea provided optimal conditions for AOCH retrieval. The dust outflow was elevated to an altitude of 1.5–2.5 km (Fig. 15e), likely enhanced by orographic lifting as the lofted dust was transported over the Ustyurt Plateau.
Bright desert surfaces pose significant challenges for isolating aerosol scattering contributions to EPIC measurements. Radiative transfer simulations indicate that the sensitivity to ALH in the O2 band spectral contrast diminishes over bright surfaces, requiring high aerosol loadings to generate sufficient signal-to-noise ratios for reliable AOCH retrieval (Xu et al., 2019). As shown in Fig. 15, EPIC-retrieved AOD0.68 and AOCH exhibit opposite spatial patterns: AOCH displays unrealistically high values over low AOD0.68 areas and reasonably low values over high AOD0.68 (up to 6) areas that form a continuous pattern with the Caspian Sea retrieval. Thus, AOD0.68 provides a practical means for screening marginal-quality AOCH retrievals. Focusing on dust scenes where AOD0.68 exceeds 2, the AOCH over Turkmenistan increased from 1–1.5 km on 28 May to 2–3 km on 29 May. This temporal evolution can be explained by the evolution of meteorological conditions: a prevailing high-pressure system suppressed vertical aerosol mixing on 28 May, whereas enhanced upward motion ahead of a deepening cold front promoted convective mixing on 29 May.
The EPIC AOCH retrievals are compared against coincident CALIOP extinction-weighted ALH, as shown in Fig. 16. Generally, the CALIOP 532 nm channel is more prone to signal attenuation in the presence of dense absorbing aerosols, resulting in lower ALH than the 1064 nm channel (Torres et al., 2013). Our analysis reveals that the wavelength choice has minor effects on the CALIOP-derived ALH, with a mean difference of 0.05 km between the two channels. EPIC AOCH exhibits significant positive biases under low aerosol loadings. Using the CALIOP 532 nm ALH as a benchmark, EPIC AOCH has a mean bias of 3.6 km and an RMSE of 4.3 km, with only 17 % (21 %) of co-located retrievals within 0.5 (1.0) km agreement. However, after applying an AOD0.68 threshold of 1.5 to isolate dust-laden scenes, the AOCH accuracy significantly improved, with a much lower mean bias (0.4 km) and RMSE (0.8 km), as well as 61 % (72 %) of co-located retrievals within 0.5 (1.0) km agreement. In general, the higher the AOD0.68 threshold, the better the agreement between EPIC and CALIOP. The close agreement between EPIC and CALIOP, as well as between the two CALIOP channels, can be attributed to the well-defined upper boundary of the dust layer (as seen in Fig. 2f) such that the different techniques detected the strongest signal from the same altitude.
To compare EPIC AOCH with IASI mean dust altitude, we selected the EPIC scans closest in time (06:50 Z on 28 May and 06:41 Z on 29 May) to the daytime IASI overpasses. We applied an AOD0.68 threshold of 1.5 to EPIC AOCH over land in order to exclude marginal-quality retrievals and enhance clarity. As shown in Fig. 17a–b, the AOD0.68 threshold removes the majority of unrealistic AOCH values over land. However, EPIC displays unrealistic retrievals over the northern Caspian Sea. This bias resembles the surface-related UVAI signal shown in Fig. 3, indicating that the water-leaving radiance from shallow turbid waters may have been mistreated as aerosol signal in the EPIC algorithm. The EPIC AOCH retrievals at 06:50 and 09:01 Z on 28 May show minor changes over time, likely due to a prevailing cold anticyclone which trapped dust within the boundary layer. In contrast, the AOCH increases by ∼ 0.4 km from 06:41 to 08:52 Z on 29 May due to the lifting by an approaching cold front.
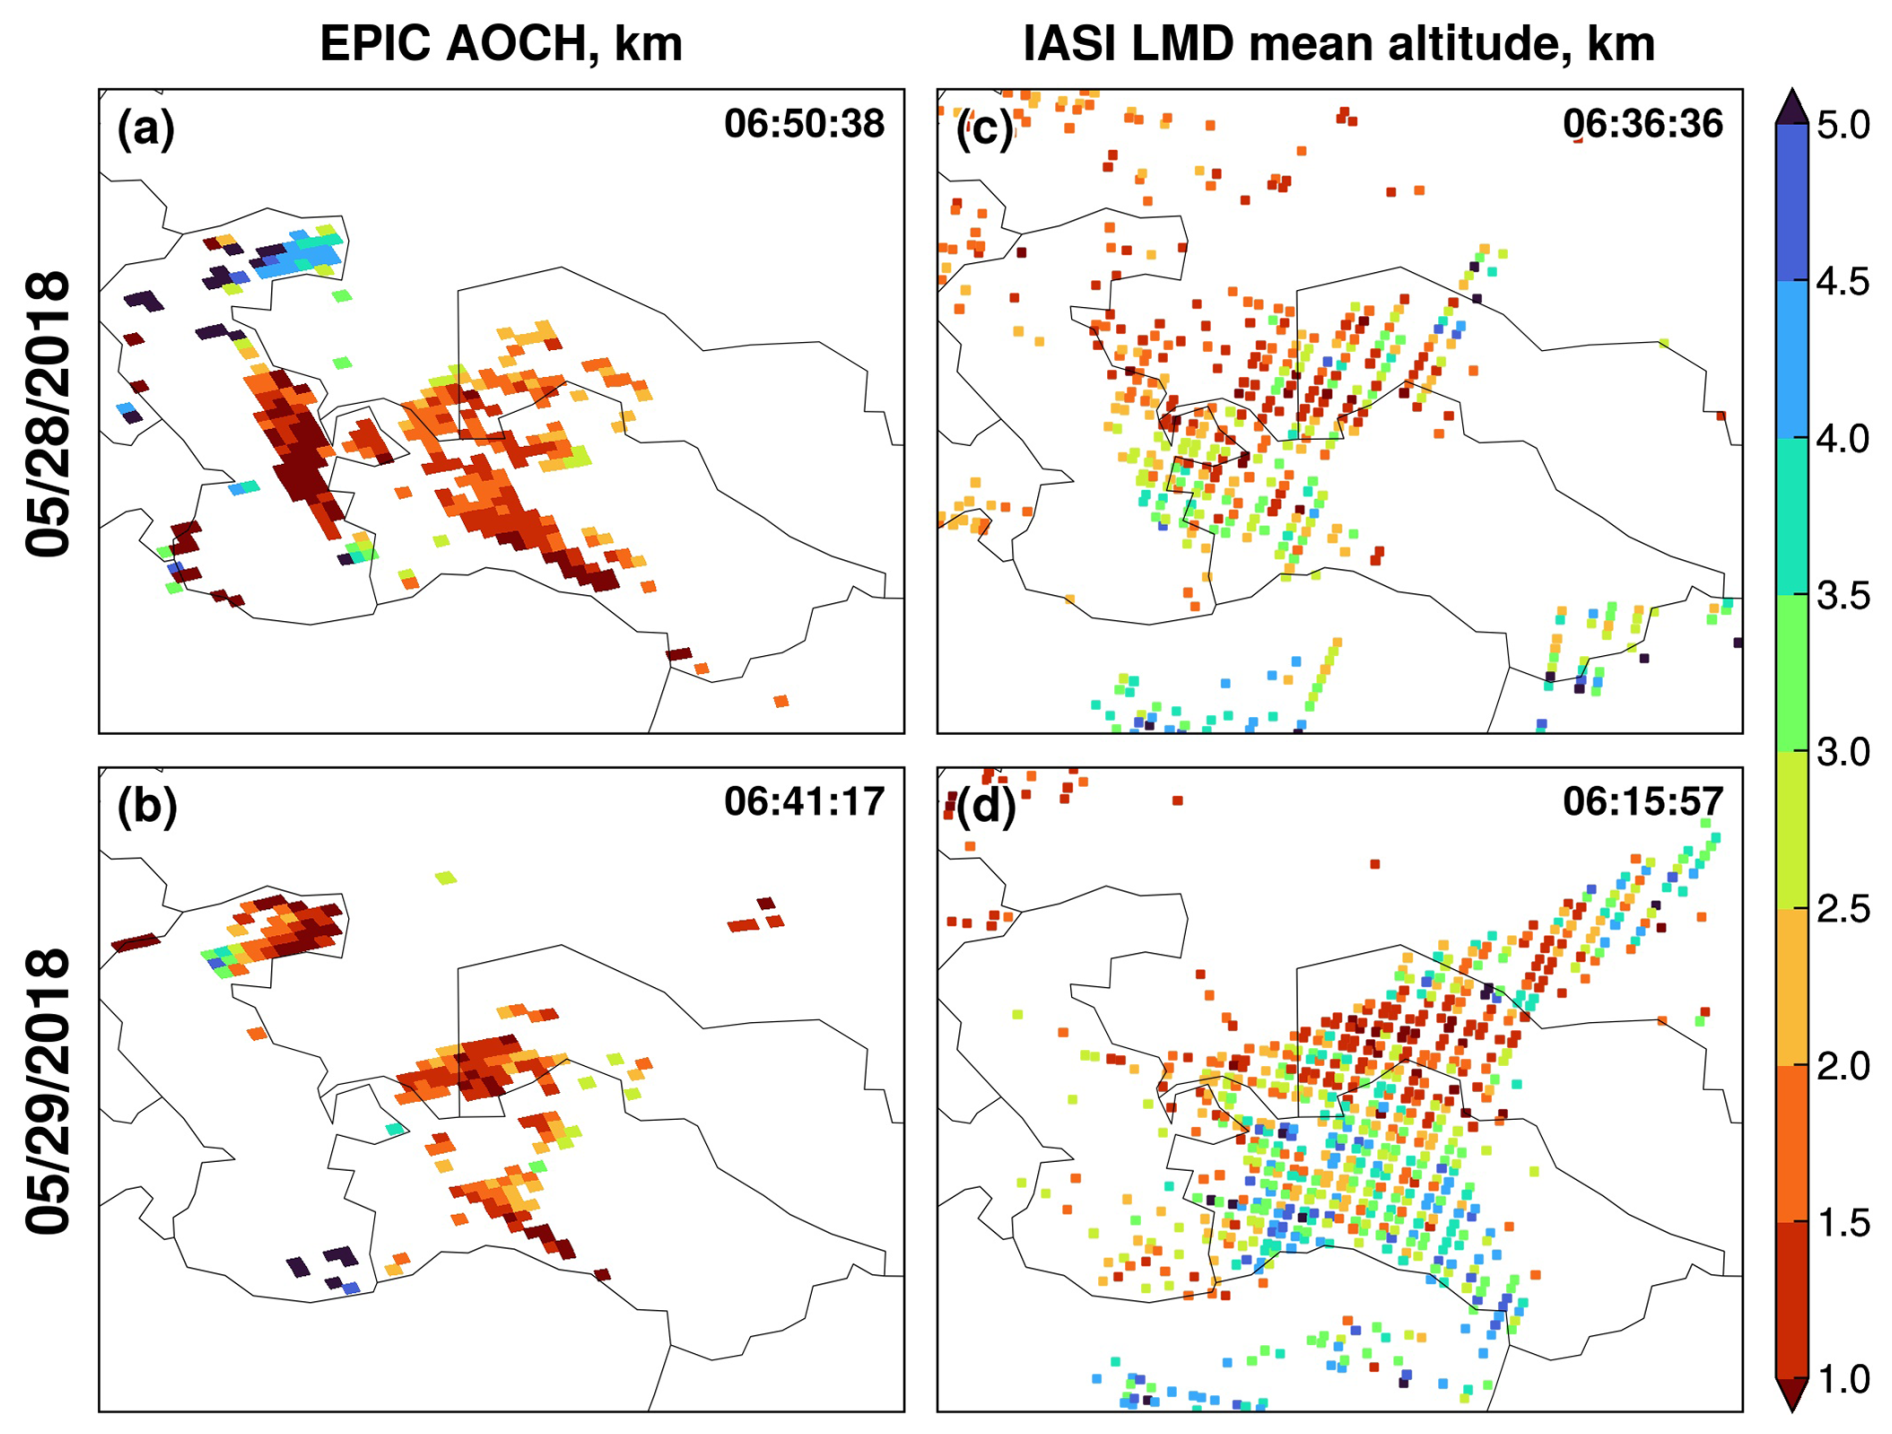
Figure 17ALH retrievals in the (a, b) EPIC AOCH and (c, d) IASI LMD products on 28–29 May 2018. Only the EPIC AOCH retrievals with AOD0.68>1.5 are shown. The sensor scan times over Aralkum (45° N, 60° E) are shown at the top right corner of each panel.
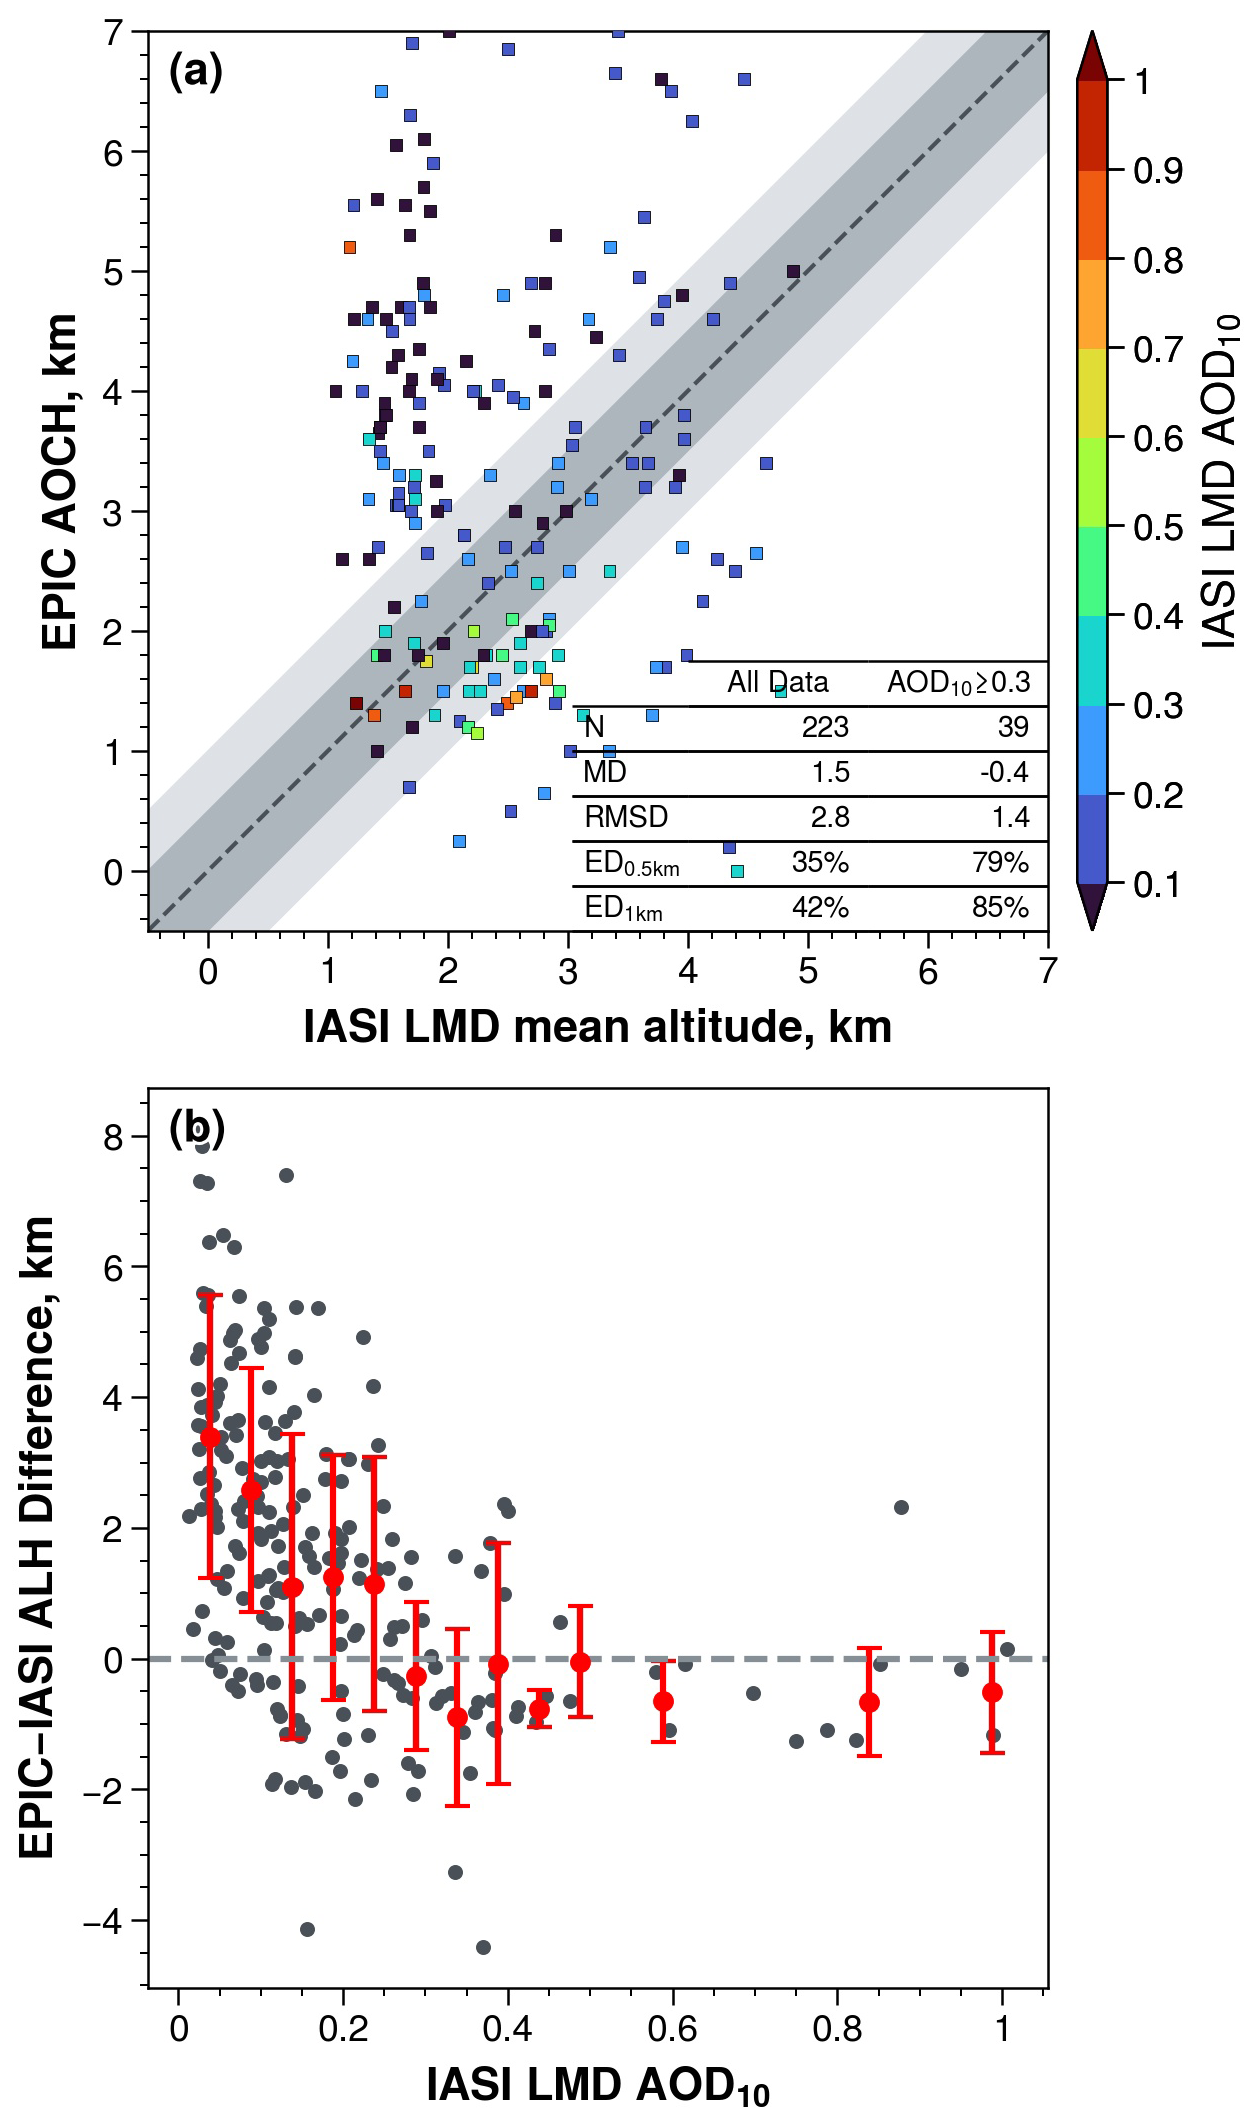
Figure 18(a) Comparison of co-located ALH retrievals by EPIC and IASI. N: number of coincident retrievals. MD: mean difference. RMSD: root mean square difference. ED: percentage of co-located retrievals within expected differences of 0.5 and 1 km (shaded areas). (b) The EPIC − IASI difference as a function of IASI-retrieved AOD10.
Figure 17c–d show that IASI generally retrieves higher ALH than EPIC in dust-laden scenes over both desert surfaces and the Caspian Sea. The EPIC and IASI Level-2 products are gridded onto a 1°×1° resolution to further assess their consistency as a function of aerosol loading. Figure 18 shows that EPIC and IASI have the poorest agreement under low aerosol loadings, wherein EPIC AOCH tends to be overestimated as discussed earlier. As aerosol loading increases, the ALH difference decreases rapidly and stabilizes at AOD10≥0.3 (Fig. 18b). Retrievals for AOD10≥0.3 show a mean EPIC–IASI difference of −0.4 km and an RMSD of 1.4 km, with 79 % (85 %) of co-located retrievals falling within 0.5 (1.0) km differences.
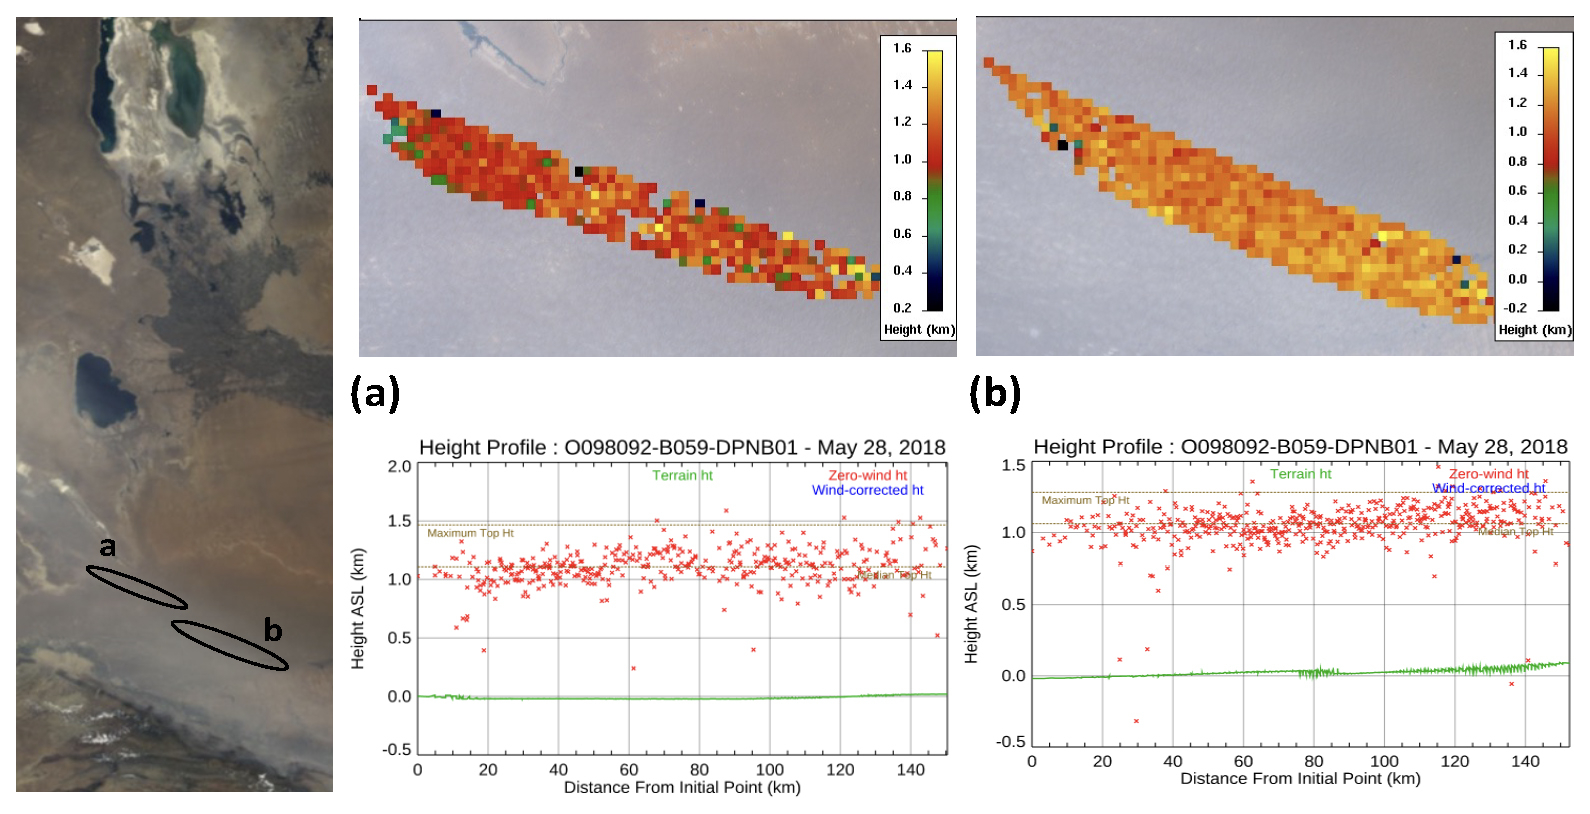
Figure 19MINX-retrieved plume height profiles (middle and right panels) based on MISR multi-angle images on 28 May 2018 (orbit 98092) for two polygon areas denoted in the nadir-view RGB image (left panel). Surface elevation is represented in green, and retrieved plume heights are represented in red.
Finally, Fig. 19 shows the stereo-height retrieval from MISR multi-angle images for two polygon regions located near the Kopet-Dag foothills. The digitized pixels in both regions indicate an elevated dust layer extending from ∼ 0.8 km above the ground to a sharp upper boundary at ∼ 1.3 km, with a median plume height of 1.1 km. This estimate is ∼ 1 km lower than the CALIOP-detected dust layer top (Fig. 2f), consistent with expected differences in these two techniques (Sect. 2.2.5). Overall, the MISR ALH retrieval aligns with CALIOP and EPIC in detecting the dust layer height at the Kopet-Dag foothills (Fig. 16a).
The Aralkum Desert has emerged as a prominent source of saline dust aerosol. While satellite-based aerosol retrievals remain the most practical means for monitoring the dust activity from Aralkum, they face considerable challenges due to the absence of local aerosol observational constraints and the region's heterogeneous and highly variable surface characteristics. Although satellite algorithms are optimized for global performance, they may exhibit greater inconsistency and biases for regions with poor algorithm representations of region-specific aerosol and surface properties. To date, the performance and consistency of satellite techniques in characterizing the saline dust from Aralkum remain poorly understood. We address this knowledge gap through two key efforts.
First, we conducted a survey of satellite techniques and algorithms capable of detecting the presence, column burden, and vertical height of airborne dust from the Aralkum Desert, focusing on four families of satellite aerosol products: UVAI, mid-visible AOD, thermal infrared AOD, and ALH. The survey identifies the diverse approaches employed by various algorithms and the differing a priori assumptions on surface properties and aerosol optical models (e.g., refractive index, particle shape, particle size distribution). In particular, the dust optical models in these algorithms are primarily derived from AERONET measurements from West Africa and the Middle East. These models may deviate substantially from the microphysical properties of Aralkum-derived aerosols, which has been found to contain distinct chemical and mineralogical compositions compared to typical desert dust, such as abundant sulfate- and carbonate-rich minerals and negligible iron oxide content.
Currently, due to lack of in situ aerosol measurements (e.g., AERONET) near Aralkum, the extent to which these dust optical models deviate from actual conditions has yet to be determined. The impact of inaccurate algorithm assumptions on the aerosol product performance is also under-explored. Addressing these knowledge gaps requires establishing routine aerosol monitoring near Aralkum, e.g., in the downwind Karakalpakstan region. Such measurements are essential not only for validating satellite products but also for developing new or refining existing aerosol optical models for saline dust aerosol.
Second, we performed a case study to assess the cross-sensor and cross-algorithm consistency in observing a saline dust event from the Aralkum Desert during 27–29 May 2018. We compared a broad range of aerosol products, including UVAI from OMPS, TROPOMI, and EPIC; mid-visible AOD from MODIS, MISR, and VIIRS; thermal infrared AOD from IASI using four different algorithms; and ALH from EPIC, CALIOP, IASI, and MISR. This synergistic, multisensor analysis allowed us to identify the complementary strengths of different techniques and uncover the product inconsistency and potential limitations. The main findings are as follows.
The UVAI products show similar spatial patterns associated with the fresh dust plume but exhibit notable differences in magnitude and dynamic range. These discrepancies can be attributed, at least in part, to the choice of wavelength pair and the treatment of the cloud-scattering effect. Using the 95th percentile as a threshold for dust detection, we find overall agreement in delineating the dust plume extent between the products. All UVAI products show large positive values over the northern Caspian Sea, Garabogazköl Gulf, and Sor Kaydak salt marsh. These dust-like signals are primarily caused by enhanced UV absorption by shallow, turbid, and saline waters, which causes the water-leaving UV radiance to deviate from a pure Rayleigh scattering atmosphere, similar to the effect of absorbing aerosols. This presents an important limitation for using UVAI to detect airborne dust and dust sources over Central Asia due to interferences of turbid/salty waters, salt marshes, and saline deserts. Caution must be used to avoid misinterpreting these surface features as dust signals.
Mid-visible AOD retrievals over desert surfaces exhibit considerable inconsistency across different sensors and algorithms. The choice of algorithms causes nonlinear relationships between the retrieved AOD from MODIS and VIIRS. Specifically, MAIAC retrieves lower AOD than DB under low aerosol loadings but higher AOD under high aerosol loadings. EPS generally produces lower AOD than DB, with their divergence increasing as aerosol loading increases. In the EPS product, an urban aerosol optical model was selected for dust retrieval, leading to significantly lower AOD compared to other algorithms. A test retrieval using the dust optical model, however, shows better agreement between EPS and other algorithms. The MISR operational product exhibits significant missing data and AOD underestimation compared to MODIS and VIIRS. In contrast, the MISR research algorithm produces higher, more consistent AODs as well as improved constraints on particle microphysical properties. Over the Caspian Sea, mid-visible AOD retrievals show better agreement between algorithms, despite the DT and EPS algorithms failing to select their dust optical models during their retrieval. Generally, DT retrieves lower AOD under clean marine conditions but higher AOD under dust-laden conditions compared to the MAIAC, DB, and EPS algorithms. Among the four IASI infrared aerosol products, the LMD product has the best performance in detecting the dust plume extent.
The high reflectivity of desert surfaces and shallow or turbid coastal waters pose a great challenge for passive ALH retrieval. The EPIC AOCH product significantly overestimates aerosol heights under low aerosol loading or background conditions. However, EPIC shows good agreement with CALIOP in detecting the dust layer with a well-defined upper boundary, resulting in a mean bias of 0.4 km and 61 % (72 %) of co-located retrievals within 0.5 km (1.0 km) differences. EPIC also shows reasonable agreement (with a mean difference of −0.4 km) with IASI infrared-based mean dust layer altitude over dust-laden scenes. The MISR plume height retrieval, derived from parallax of multi-angle images, aligns well with EPIC and CALIOP in detecting dust layer height over the Kopet-Dag foothills.
The aerosol products analyzed in the study are publicly available from the links provided in Table 1. The MISR research algorithm and plume height results are available upon request. The regridded aerosol products are available at https://doi.org/10.5281/zenodo.13994593 (Xi, 2025).
XX performed conceptualization, data curation, formal analysis, visualization, and writing of the initial draft. HL performed VIIRS EPS test retrieval. JL and RK performed MISR research algorithm and plume height retrievals. All authors contributed to data analysis and edited the paper.
The contact author has declared that none of the authors has any competing interests.
Publisher’s note: Copernicus Publications remains neutral with regard to jurisdictional claims made in the text, published maps, institutional affiliations, or any other geographical representation in this paper. While Copernicus Publications makes every effort to include appropriate place names, the final responsibility lies with the authors.
Xin Xi acknowledges support from the NASA Land-Cover and Land-Use Change (LCLUC) Program and helpful discussions with Jason Tackett on CALIPSO data. The work of Ralph Kahn is supported in part by the NASA Terra–Aqua–NPP program and the NASA Earth Observing System MISR project. The satellite data teams acknowledge funding support from multiple NASA and NOAA funding sources supporting the multidecadal development and evaluation of these data records. The authors gratefully acknowledge the Copernicus Data Space Ecosystem and NASA ASDC, LAADS DAAC, and GES DISC for maintaining and distributing the data products used in this study.
This research has been supported by the NASA Land-Cover and Land-Use Change program (grant no. 80NSSC20K1480).
This paper was edited by Qi Chen and reviewed by three anonymous referees.
Anstett, M., Limbacher, J. A., and Kahn, R. A.: A global aerosol microphysical property record from the Multi-angle Imaging SpectroRadiometer (MISR) research aerosol retrieval algorithm, in preparation, 2025. a
Argaman, E., Singer, A., and Tsoar, H.: Erodibility of some crust forming soils/sediments from the Southern Aral Sea Basin as determined in a wind tunnel, Earth Surf. Proc. Land., 31, 47–63, https://doi.org/10.1002/esp.1230, 2006. a
ASDC: MISR Level 2 Aerosol parameters V003, NASA Langley Atmospheric Science Data Center DAAC [data set], https://doi.org/10.5067/TERRA/MISR/MIL2ASAE_L2.003, 1999. a
ASDC: DSCOVR EPIC Aerosol Optical Centroid Height Version 1, NASA Langley Atmospheric Science Data Center DAAC [data set], https://doi.org/10.5067/EPIC/DSCOVR/L2_AOCH.001, 2018. a
ASDC: CALIPSO Lidar Level 2 Aerosol Profile, V4-51, NASA Langley Atmospheric Science Data Center DAAC [data set], https://doi.org/10.5067/CALIOP/CALIPSO/CAL_LID_L2_05kmAPro-Standard-V4-51, 2023. a
Balkanski, Y., Schulz, M., Claquin, T., and Guibert, S.: Reevaluation of Mineral aerosol radiative forcings suggests a better agreement with satellite and AERONET data, Atmos. Chem. Phys., 7, 81–95, https://doi.org/10.5194/acp-7-81-2007, 2007. a
C3S CDS: Aerosol properties gridded data from 1995 to present derived from satellite observation, Copernicus Climate Change Service (C3S) Climate Data Store (CDS) [data set], https://doi.org/10.24381/cds.239d815c, 2019. a, b, c, d, e
Callewaert, S., Vandenbussche, S., Kumps, N., Kylling, A., Shang, X., Komppula, M., Goloub, P., and De Mazière, M.: The Mineral Aerosol Profiling from Infrared Radiances (MAPIR) algorithm: version 4.1 description and evaluation, Atmos. Meas. Tech., 12, 3673–3698, https://doi.org/10.5194/amt-12-3673-2019, 2019. a, b
Capelle, V., Chédin, A., Péquignot, E., Schlüssel, P., Newman, S. M., and Scott, N. A.: Infrared continental surface emissivity spectra and skin temperature retrieved from IASI observations over the tropics, J. Appl. Meteorol. Clim., 51, 1164–1179, https://doi.org/10.1175/JAMC-D-11-0145.1, 2012. a
Capelle, V., Chédin, A., Siméon, M., Tsamalis, C., Pierangelo, C., Pondrom, M., Crevoisier, C., Crepeau, L., and Scott, N. A.: Evaluation of IASI-derived dust aerosol characteristics over the tropical belt, Atmos. Chem. Phys., 14, 9343–9362, https://doi.org/10.5194/acp-14-9343-2014, 2014. a
Capelle, V., Chédin, A., Pondrom, M., Crevoisier, C., Armante, R., Crepeau, L., and Scott, N. A.: Infrared dust aerosol optical depth retrieved daily from IASI and comparison with AERONET over the period 2007–2016, Remote Sens. Environ., 206, 15–32, https://doi.org/10.1016/j.rse.2017.12.008, 2018. a, b, c
Carr, J. L., Wu, D. L., Daniels, J., Friberg, M. D., Bresky, W., and Madani, H.: Geo–geo stereo-tracking of atmospheric motion vectors (AMVS) from the geostationary ring, Remote Sensing, 12, 3779, https://doi.org/10.3390/rs12223779, 2020. a
Clarisse, L., Clerbaux, C., Franco, B., Hadji-Lazaro, J., Whitburn, S., Kopp, A. K., Hurtmans, D., and Coheur, P. F.: A Decadal Data Set of Global Atmospheric Dust Retrieved From IASI Satellite Measurements, J. Geophys. Res.-Atmos., 124, 1618–1647, https://doi.org/10.1029/2018JD029701, 2019. a, b
de Graaf, M., Stammes, P., Torres, O., and Koelemeijer, R. B.: Absorbing Aerosol Index: Sensitivity analysis, application to GOME and comparison with TOMS, J. Geophys. Res.-Atmos., 110, D01201, https://doi.org/10.1029/2004JD005178, 2005. a, b
Diner, D. J., Beckert, J. C., Reilly, T. H., Bruegge, C. J., Conel, J. E., Kahn, R. A., Martonchik, J. V., Ackerman, T. P., Davies, R., Gerstl, S. A., Gordon, H. R., Muller, J. P., Myneni, R. B., Sellers, P. J., Pinty, B., and Verstraete, M. M.: Multi-angle imaging spectroradiometer (MISR) instrument description and experiment overview, IEEE T. Geosci. Remote, 36, 1072–1087, https://doi.org/10.1109/36.700992, 1998. a
Dubovik, O., Holben, B., Eck, T. F., Smirnov, A., Kaufman, Y. J., King, M. D., Tanré, D., and Slutsker, I.: Variability of Absorption and Optical Properties of Key Aerosol Types Observed in Worldwide Locations, J. Atmos. Sci., 59, 590–608, https://doi.org/10.1175/1520-0469(2002)059<0590:voaaop>2.0.co;2, 2002. a
Dubovik, O., Sinyuk, A., Lapyonok, T., Holben, B. N., Mishchenko, M., Yang, P., Eck, T. F., Volten, H., Muñoz, O., Veihelmann, B., van der Zande, W. J., Leon, J. F., Sorokin, M., and Slutsker, I.: Application of spheroid models to account for aerosol particle nonsphericity in remote sensing of desert dust, J. Geophys. Res.-Atmos., 111, D11208, https://doi.org/10.1029/2005JD006619, 2006. a
ESA: TROPOMI Level 2 Ultraviolet Aerosol Index products Version 02, ESA [data set], https://doi.org/10.5270/S5P-3dgz66p, 2021. a
Flower, V. J. and Kahn, R. A.: Assessing the altitude and dispersion of volcanic plumes using MISR multi-angle imaging from space: Sixteen years of volcanic activity in the Kamchatka Peninsula, Russia, J. Volcanol. Geoth. Res., 337, 1–15, https://doi.org/10.1016/j.jvolgeores.2017.03.010, 2017. a
Garay, M. J., Witek, M. L., Kahn, R. A., Seidel, F. C., Limbacher, J. A., Bull, M. A., Diner, D. J., Hansen, E. G., Kalashnikova, O. V., Lee, H., Nastan, A. M., and Yu, Y.: Introducing the 4.4 km spatial resolution Multi-Angle Imaging SpectroRadiometer (MISR) aerosol product, Atmos. Meas. Tech., 13, 593–628, https://doi.org/10.5194/amt-13-593-2020, 2020. a
Groll, M., Opp, C., Issanova, G., Vereshagina, N., and Semenov, O.: Physical and chemical characterization of dust deposited in the Turan Lowland (Central Asia), in: Central Asian DUst Conference (CADUC), 8–12 April 2019, Dushanbe, Tajikistan, vol. 99, ISSN 22671242, https://doi.org/10.1051/e3sconf/20199903005, 2019. a
He, X., Bai, Y., Pan, D., Tang, J., and Wang, D.: Atmospheric correction of satellite ocean color imagery using the ultraviolet wavelength for highly turbid waters, Optics Express, 20, 20754, https://doi.org/10.1364/oe.20.020754, 2012. a
Herman, J. R., Bhartia, P. K., Torres, O., Hsu, C., Seftor, C., and Celarier, E.: Global distribution of UV-absorbing aerosols from Nimbus 7/TOMS data, J. Geophys. Res.-Atmos., 102, 16911–16922, https://doi.org/10.1029/96jd03680, 1997. a, b
Hofer, J., Althausen, D., Abdullaev, S. F., Makhmudov, A. N., Nazarov, B. I., Schettler, G., Engelmann, R., Baars, H., Fomba, K. W., Müller, K., Heinold, B., Kandler, K., and Ansmann, A.: Long-term profiling of mineral dust and pollution aerosol with multiwavelength polarization Raman lidar at the Central Asian site of Dushanbe, Tajikistan: case studies, Atmos. Chem. Phys., 17, 14559–14577, https://doi.org/10.5194/acp-17-14559-2017, 2017. a
Hsu, C.: VIIRS/NOAA20 Deep Blue Aerosol L2 6-Min Swath 6 km, NASA [data set], https://doi.org/10.5067/VIIRS/AERDB_L2_VIIRS_NOAA20.002, 2022. a
Hsu, N. C., Tsay, S. C., King, M. D., and Herman, J. R.: Aerosol properties over bright-reflecting source regions, IEEE T. Geosci. Remote, 42, 557–569, https://doi.org/10.1109/TGRS.2004.824067, 2004. a
Hsu, N. C., Jeong, M. J., Bettenhausen, C., Sayer, A. M., Hansell, R., Seftor, C. S., Huang, J., and Tsay, S. C.: Enhanced Deep Blue aerosol retrieval algorithm: The second generation, J. Geophys. Res.-Atmos., 118, 9296–9315, https://doi.org/10.1002/jgrd.50712, 2013. a
Hsu, N. C., Lee, J., Sayer, A. M., Kim, W., Bettenhausen, C., and Tsay, S. C.: VIIRS Deep Blue Aerosol Products Over Land: Extending the EOS Long-Term Aerosol Data Records, J. Geophys. Res.-Atmos., 124, 4026–4053, https://doi.org/10.1029/2018JD029688, 2019. a
Jackson, J. M., Liu, H., Laszlo, I., Kondragunta, S., Remer, L. A., Huang, J., and Huang, H. C.: Suomi-NPP VIIRS aerosol algorithms and data products, J. Geophys. Res.-Atmos., 118, 12673–12689, https://doi.org/10.1002/2013JD020449, 2013. a
Jiang, H., Huang, J., Li, L., Huang, L., Manzoor, M., Yang, J., Wu, G., Sun, X., Wang, B., Egamberdieva, D., Panosyan, H., Birkeland, N. K., Zhu, Z., and Li, W.: Onshore soil microbes and endophytes respond differently to geochemical and mineralogical changes in the Aral Sea, Sci. Total Environ., 765, 142675, https://doi.org/10.1016/j.scitotenv.2020.142675, 2021. a
Kahn, R. A., Gaitley, B. J., Garay, M. J., Diner, D. J., Eck, T. F., Smirnov, A., and Holben, B. N.: Multiangle Imaging SpectroRadiometer global aerosol product assessment by comparison with the Aerosol Robotic Network, J. Geophys. Res.-Atmos., 115, D23209, https://doi.org/10.1029/2010JD014601, 2010. a
Kim, M.-H., Omar, A. H., Tackett, J. L., Vaughan, M. A., Winker, D. M., Trepte, C. R., Hu, Y., Liu, Z., Poole, L. R., Pitts, M. C., Kar, J., and Magill, B. E.: The CALIPSO version 4 automated aerosol classification and lidar ratio selection algorithm, Atmos. Meas. Tech., 11, 6107–6135, https://doi.org/10.5194/amt-11-6107-2018, 2018. a
Koffi, B., Schulz, M., Bréon, F. M., Griesfeller, J., Winker, D., Balkanski, Y., Bauer, S., Berntsen, T., Chin, M., Collins, W. D., Dentener, F., Diehl, T., Easter, R., Ghan, S., Ginoux, P., Gong, S., Horowitz, L. W., Iversen, T., Kirkevg, A., Koch, D., Krol, M., Myhre, G., Stier, P., and Takemura, T.: Application of the CALIOP layer product to evaluate the vertical distribution of aerosols estimated by global models: AeroCom phase I results, J. Geophys. Res., 117, D10201 https://doi.org/10.1029/2011JD016858, 2012. a
Kondragunta, S., Laszlo, I., and Ma, L.: NOAA JPSS Visible Infrared Imaging Radiometer Suite (VIIRS) Aerosol Optical Depth and Aerosol Particle Size Distribution Environmental Data Record (EDR) from NDE, OAA National Centers for Environmental Information [data set], https://doi.org/10.7289/V5319T4H, 2023. a
Laszlo, I.: Remote Sensing of Tropospheric Aerosol Optical Depth From Multispectral Monodirectional Space-Based Observations, in: Comprehensive Remote Sensing, edited by: Liang, S., Elsevier, Oxford, 137–196, ISBN 978-0-12-803221-3, https://doi.org/10.1016/B978-0-12-409548-9.10389-6, 2018. a
Laszlo, I. and Liu, H.: EPS Aerosol Optical Depth (AOD) Algorithm Theoretical Basis Document Version 3.4, Tech. Rep., NOAA NESDIS Center for Satellite Applications and Research, https://www.star.nesdis.noaa.gov/jpss/documents/ATBD/ATBD_EPS_Aerosol_AOD_v3.4.pdf (last access: 11 October 2024), 2022. a, b, c, d
Lee, J., Hsu, N. C., Sayer, A. M., Bettenhausen, C., and Yang, P.: AERONET-Based Nonspherical Dust Optical Models and Effects on the VIIRS Deep Blue/SOAR Over Water Aerosol Product, J. Geophys. Res.-Atmos., 122, 10384–10401, https://doi.org/10.1002/2017JD027258, 2017. a
Lee, J., Hsu, N. C., Kim, W. V., Sayer, A. M., and Tsay, S.-C.: VIIRS Version 2 Deep Blue Aerosol Products, J. Geophys. Res.-Atmos., 129, e2023JD040082, https://doi.org/10.1029/2023JD040082, 2024. a
Lee, Z., Hu, C., Shang, S., Du, K., Lewis, M., Arnone, R., and Brewin, R.: Penetration of UV-visible solar radiation in the global oceans: Insights from ocean color remote sensing, J. Geophys. Res.-Oceans, 118, 4241–4255, https://doi.org/10.1002/jgrc.20308, 2013. a
Legrand, M., Plana-Fattori, A., and N'Doumé, C.: Satellite detection of dust using the IR imagery of Meteosat 1. Infrared difference dust index, J. Geophys. Res.-Atmos., 106, 18251–18274, https://doi.org/10.1029/2000JD900749, 2001. a
Lensky, I. M. and Rosenfeld, D.: Clouds-Aerosols-Precipitation Satellite Analysis Tool (CAPSAT), Atmos. Chem. Phys., 8, 6739–6753, https://doi.org/10.5194/acp-8-6739-2008, 2008. a
Levy, R. C. and Hsu, N. C.: MODIS Atmosphere L2 Aerosol Product, NASA [data set], https://doi.org/10.5067/MODIS/MYD04_L2.006, 2015a. a, b
Levy, R. C. and Hsu, N. C.: MODIS Atmosphere L2 Aerosol Product, NASA [data set], https://doi.org/10.5067/MODIS/MOD04_3K.061, 2015b. a
Levy, R. C., Mattoo, S., Sawyer, V., and Munchak, L.: VIIRS/NOAA20 Dark Target Aerosol 6-Min L2 Swath 6 km, NASA [data set], https://doi.org/10.5067/VIIRS/AERDT_L2_VIIRS_NOAA20.002, 2023. a
Limbacher, J. A., Kahn, R. A., and Lee, J.: The new MISR research aerosol retrieval algorithm: a multi-angle, multi-spectral, bounded-variable least squares retrieval of aerosol particle properties over both land and water, Atmos. Meas. Tech., 15, 6865–6887, https://doi.org/10.5194/amt-15-6865-2022, 2022. a, b, c
Lu, Z., Wang, J., Xu, X., Chen, X., Kondragunta, S., Torres, O., Wilcox, E. M., and Zeng, J.: Hourly Mapping of the Layer Height of Thick Smoke Plumes Over the Western U.S. in 2020 Severe Fire Season, Frontiers in Remote Sensing, 2, https://doi.org/10.3389/frsen.2021.766628, 2021. a
Lu, Z., Wang, J., Chen, X., Zeng, J., Wang, Y., Xu, X., Christian, K. E., Yorks, J. E., Nowottnick, E. P., Reid, J. S., and Xian, P.: First Mapping of Monthly and Diurnal Climatology of Saharan Dust Layer Height Over the Atlantic Ocean From EPIC/DSCOVR in Deep Space, Geophys. Res. Lett., 50, e2022GL102552, https://doi.org/10.1029/2022GL102552, 2023. a
Lyapustin, A. and Wang, Y.: MODIS/Terra+Aqua Land Aerosol Optical Depth Daily L2G Global 1km SIN Grid V061, NASA EOSDIS Land Processes Distributed Active Archive Center [data set], https://doi.org/10.5067/MODIS/MCD19A2.061, 2022. a
Lyapustin, A., Wang, Y., Korkin, S., and Huang, D.: MODIS Collection 6 MAIAC algorithm, Atmos. Meas. Tech., 11, 5741–5765, https://doi.org/10.5194/amt-11-5741-2018, 2018. a
Martonchik, J. V., Kahn, R. A., and Diner, D. J.: Retrieval of aerosol properties over land using MISR observations, in: Satellite Aerosol Remote Sensing over Land, edited by: Kokhanovsky, A. and de Leeuw, G., Springer Praxis Books, Springer, Berlin, Heidelberg, 267–293, https://doi.org/10.1007/978-3-540-69397-0_9, 2009. a
Modabberi, A., Noori, R., Madani, K., Ehsani, A. H., Danandeh Mehr, A., Hooshyaripor, F., and Kløve, B.: Caspian Sea is eutrophying: The alarming message of satellite data, Environ. Res. Lett., 15, 124047, https://doi.org/10.1088/1748-9326/abc6d3, 2019. a
Moradi, M.: Interannual and intra-annual cycles of satellite-derived chlorophyll-a concentrations in the Caspian Sea, J. Great Lakes Res., 48, 143–158, https://doi.org/10.1016/j.jglr.2021.10.021, 2022. a
Nelson, D. L., Garay, M. J., Kahn, R. A., and Dunst, B. A.: Stereoscopic height and wind retrievals for aerosol plumes with the MISR INteractive eXplorer (MINX), Remote Sensing, 5, 4593–4628, https://doi.org/10.3390/rs5094593, 2013. a, b
Nobakht, M., Shahgedanova, M., and White, K.: New Inventory of Dust Emission Sources in Central Asia and Northwestern China Derived From MODIS Imagery Using Dust Enhancement Technique, J. Geophys. Res.-Atmos., 126, e2020JD033382, https://doi.org/10.1029/2020JD033382, 2021. a
Offenwanger, T., Samaras, S., and Klüser, L.: Algorithm Theoretical Basis Document Annex D Infrared Mineral Aerosol Retrieval Scheme (IMARS) Algorithm version v7.1, Tech. Rep., Copernicus Climate Change Service, http://dast.data.compute.cci2.ecmwf.int/documents/satellite-aerosol-properties/C3S2_312a_Lot2_FDDP-AER/C3S2_312a_Lot2_D-WP2-FDDP-AER_202311_ATBD_AER_Annex_D_IMARS_v3.3_final2.pdf, last access: 17 October 2024. a, b
Orlovsky, L. and Orlovsky, N.: White sand storms in Central Asia, in: Global Alarm: Dust and Sand Storms from the World’s Dry lands, edited by: Yang, Y., Squires, V., and Lu, Q., Chap. 8, 169–201, United Nations, ISBN 92112011404, 2001. a
Prospero, J. M., Ginoux, P., Torres, O., Nicholson, S. E., and Gill, T. E.: Environmental characterization of global sources of atmospheric soil dust identified with the Nimbus 7 Total Ozone Mapping Spectrometer (TOMS) absorbing aerosol product, Rev. Geophys., 40, 2-1–2-31, https://doi.org/10.1029/2000RG000095, 2002. a, b
Remer, L. A., Kaufman, Y. J., Tanré, D., Mattoo, S., Chu, D. A., Martins, J. V., Li, R. R., Ichoku, C., Levy, R. C., Kleidman, R. G., Eck, T. F., Vermote, E., and Holben, B. N.: The MODIS aerosol algorithm, products, and validation, J. Atmos. Sci., 62, 947–973, https://doi.org/10.1175/JAS3385.1, 2005. a
Remer, L. A., Didier, T. ., Kaufman, Y. J., Levy, R., and Mattoo, S.: Algorithm for remote sensing of tropospheric aerosol from MODIS: Collection 5 ATBD, Tech. Rep., NASA, Greenbelt, MD, https://modis-images.gsfc.nasa.gov/_docs/MOD04-MYD04_ATBD_C005.pdf (last access: 17 October 2024), 2006. a, b
Remer, L. A., Brogniez, C., Cairns, B., Hsu, N. C., Kahn, R., Stammes, P., Tanré, D., and Torres, O.: Recent instruments and algorithms for passive shortwave remote sensing, in: Aerosol Remote Sensing, edited by: Lenoble, J., Remer, L., and Tanre, D., vol. 9783642177, Springer Berlin Heidelberg, Berlin, Heidelberg, 185–222, ISBN 978-3-642-17725-5, https://doi.org/10.1007/978-3-642-17725-5_8, 2013a. a
Remer, L. A., Mattoo, S., Levy, R. C., and Munchak, L. A.: MODIS 3 km aerosol product: algorithm and global perspective, Atmos. Meas. Tech., 6, 1829–1844, https://doi.org/10.5194/amt-6-1829-2013, 2013b. a
Rupakheti, D., Rupakheti, M., Abdullaev, S. F., Yin, X., and Kang, S.: Columnar aerosol properties and radiative effects over Dushanbe, Tajikistan in Central Asia, Environ. Pollut., 265, 114872, https://doi.org/10.1016/j.envpol.2020.114872, 2020. a
Sawyer, V., Levy, R. C., Mattoo, S., Cureton, G., Shi, Y., and Remer, L. A.: Continuing the MODIS dark target aerosol time series with VIIRS, Remote Sensing, 12, 308, https://doi.org/10.3390/rs12020308, 2020. a
Sayer, A. M., Hsu, N. C., Lee, J., Bettenhausen, C., Kim, W. V., and Smirnov, A.: Satellite Ocean Aerosol Retrieval (SOAR) Algorithm Extension to S-NPP VIIRS as Part of the “Deep Blue” Aerosol Project, J. Geophys. Res.-Atmos., 123, 380–400, https://doi.org/10.1002/2017JD027412, 2018. a
Schepanski, K., Tegen, I., and Macke, A.: Comparison of satellite based observations of Saharan dust source areas, Remote Sens. Environ., 123, 90–97, https://doi.org/10.1016/j.rse.2012.03.019, 2012. a
Semenov, V. K., Smirnov, A., Aref'ev, V. N., Sinyakov, V. P., Sorokina, L. I., and Ignatova, N. I.: Aerosol optical depth over the mountainous region in central Asia (Issyk-Kul Lake, Kyrgyzstan), Geophys. Res. Lett., 32, L05807, https://doi.org/10.1029/2004GL021746, 2005. a
Sokolik, I. N. and Toon, O. B.: Incorporation of mineralogical composition into models of the radiative properties of mineral aerosol from UV to IR wavelengths, J. Geophys. Res.-Atmos., 104, 9423–9444, https://doi.org/10.1029/1998JD200048, 1999. a
Stein Zweers, D. C.: TROPOMI ATBD of the UV aerosol index, document number – S5P-KNMI-L2-0008-RP, Tech. Rep. 2.1.0, Royal Netherlands Meteorological Institute, De Bilt, 3731 GA, the Netherlands, https://sentinels.copernicus.eu/documents/247904/2476257 (last access: 8 July 2025), 2022. a
Tanré, D., Kaufman, Y. J., Herman, M., and Mattoo, S.: Remote sensing of aerosol properties over oceans using the MODIS/EOS spectral radiances, J. Geophys. Res.-Atmos., 102, 16971–16988, https://doi.org/10.1029/96jd03437, 1997. a
Torres, O.: OMPS-NPP L2 NM Aerosol Index swath orbital V2, Goddard Earth Sciences Data and Information Services Center (GES DISC) [data set], https://doi.org/10.5067/40L92G8144IV, 2019a. a, b
Torres, O.: DSCOVR EPIC Level 2 UV Aerosol Version 3, NASA Langley Atmospheric Science Data Center DAAC [data set], https://doi.org/10.5067/EPIC/DSCOVR/L2_AER_03, 2019b. a, b
Torres, O.: TROPOMI/Sentinel-5P Near UV Aerosol Optical Depth and Single Scattering Albedo L2 1-Orbit Snapshot 7.5 km x 3 km, NASA Goddard Space Flight Center, Goddard Earth Sciences Data and Information Services Center (GES DISC) [data set], https://doi.org/10.5067/MEASURES/AER/DATA204, 2021. a, b
Torres, O., Bhartia, P. K., Herman, J. R., Ahmad, Z., and Gleason, J.: Derivation of aerosol properties from satellite measurements of backscattered ultraviolet radiation: Theoretical basis, J. Geophys. Res.-Atmos., 103, 17099–17110, https://doi.org/10.1029/98JD00900, 1998. a
Torres, O., Ahn, C., and Chen, Z.: Improvements to the OMI near-UV aerosol algorithm using A-train CALIOP and AIRS observations, Atmos. Meas. Tech., 6, 3257–3270, https://doi.org/10.5194/amt-6-3257-2013, 2013. a
Torres, O., Bhartia, P. K., Jethva, H., and Ahn, C.: Impact of the ozone monitoring instrument row anomaly on the long-term record of aerosol products, Atmos. Meas. Tech., 11, 2701–2715, https://doi.org/10.5194/amt-11-2701-2018, 2018. a
Veefkind, J. P., Aben, I., McMullan, K., Förster, H., de Vries, J., Otter, G., Claas, J., Eskes, H. J., de Haan, J. F., Kleipool, Q., van Weele, M., Hasekamp, O., Hoogeveen, R., Landgraf, J., Snel, R., Tol, P., Ingmann, P., Voors, R., Kruizinga, B., Vink, R., Visser, H., and Levelt, P. F.: TROPOMI on the ESA Sentinel-5 Precursor: A GMES mission for global observations of the atmospheric composition for climate, air quality and ozone layer applications, Remote Sens. Environ., 120, 70–83, https://doi.org/10.1016/j.rse.2011.09.027, 2012. a
Volz, F. E.: Infrared Optical Constants of Ammonium Sulfate, Sahara Dust, Volcanic Pumice, and Flyash, Applied Optics, 12, 564, https://doi.org/10.1364/ao.12.000564, 1973. a, b, c
Winker, D. M., Vaughan, M. A., Omar, A., Hu, Y., Powell, K. A., Liu, Z., Hunt, W. H., and Young, S. A.: Overview of the CALIPSO mission and CALIOP data processing algorithms, J. Atmos. Ocean. Tech., 26, 2310–2323, https://doi.org/10.1175/2009JTECHA1281.1, 2009. a
Wu, L., Hasekamp, O., van Diedenhoven, B., Cairns, B., Yorks, J. E., and Chowdhary, J.: Passive remote sensing of aerosol layer height using near-UV multiangle polarization measurements, Geophys. Res. Lett., 43, 8783–8790, https://doi.org/10.1002/2016GL069848, 2016. a
Xi, X.: On the Geomorphic, Meteorological, and Hydroclimatic Drivers of the Unusual 2018 Early Summer Salt Dust Storms in Central Asia, J. Geophys. Res.-Atmos., 128, e2022JD038089, https://doi.org/10.1029/2022JD038089, 2023. a, b
Xi, X.: Data from “Analysis of a saline dust storm from the Aralkum Desert – Part 1: Consistency between multisensor satellite aerosol products”, Zenodo [data set], https://doi.org/10.5281/zenodo.13994593, 2025. a
Xi, X. and Sokolik, I. N.: Seasonal dynamics of threshold friction velocity and dust emission in Central Asia, J. Geophys. Res.-Atmos., 120, 1536–1564, https://doi.org/10.1002/2014JD022471, 2015a. a
Xi, X. and Sokolik, I. N.: Dust interannual variability and trend in Central Asia from 2000 to 2014 and their climatic linkages, J. Geophys. Res.-Atmos., 120, 12175–12197, https://doi.org/10.1002/2015JD024092, 2015b. a
Xi, X. and Sokolik, I. N.: Quantifying the anthropogenic dust emission from agricultural land use and desiccation of the Aral Sea in Central Asia, J. Geophys. Res.-Atmos., 121, 12270–12281, https://doi.org/10.1002/2016JD025556, 2016. a
Xu, X., Wang, J., Wang, Y., Zeng, J., Torres, O., Yang, Y., Marshak, A., Reid, J., and Miller, S.: Passive remote sensing of altitude and optical depth of dust plumes using the oxygen A and B bands: First results from EPIC/DSCOVR at Lagrange-1 point, Geophys. Res. Lett., 44, 7544–7554, https://doi.org/10.1002/2017GL073939, 2017. a, b, c
Xu, X., Wang, J., Wang, Y., Zeng, J., Torres, O., Reid, J. S., Miller, S. D., Martins, J. V., and Remer, L. A.: Detecting layer height of smoke aerosols over vegetated land and water surfaces via oxygen absorption bands: hourly results from EPIC/DSCOVR in deep space, Atmos. Meas. Tech., 12, 3269–3288, https://doi.org/10.5194/amt-12-3269-2019, 2019. a, b, c
Young, S. A., Vaughan, M. A., Garnier, A., Tackett, J. L., Lambeth, J. D., and Powell, K. A.: Extinction and optical depth retrievals for CALIPSO's Version 4 data release, Atmos. Meas. Tech., 11, 5701–5727, https://doi.org/10.5194/amt-11-5701-2018, 2018. a
Zhang, H., Kondragunta, S., Laszlo, I., Liu, H., Remer, L. A., Huang, J., Superczynski, S., and Ciren, P.: An enhanced VIIRS aerosol optical thickness (AOT) retrieval algorithm over land using a global surface reflectance ratio database, J. Geophys. Res., 121, 10717–10738, https://doi.org/10.1002/2016JD024859, 2016. a
Zhou, D. K., Larar, A. M., Liu, X., Smith, W. L., Strow, L. L., Yang, P., Schlüssel, P., and Calbet, X.: Global land surface emissivity retrieved from satellite ultraspectral IR measurements, IEEE T. Geosci. Remote, 49, 1277–1290, https://doi.org/10.1109/TGRS.2010.2051036, 2011. a, b
Zhou, Y., Levy, R. C., Remer, L. A., Mattoo, S., and Espinosa, W. R.: Dust Aerosol Retrieval Over the Oceans With the MODIS/VIIRS Dark Target Algorithm: 2. Nonspherical Dust Model, Earth and Space Science, 7, e2020EA001222, https://doi.org/10.1029/2020EA001222, 2020a. a
Zhou, Y., Levy, R. C., Remer, L. A., Mattoo, S., Shi, Y., and Wang, C.: Dust Aerosol Retrieval Over the Oceans With the MODIS/VIIRS Dark-Target Algorithm: 1. Dust Detection, Earth and Space Science, 7, e2020EA001221, https://doi.org/10.1029/2020EA001221, 2020b. a