the Creative Commons Attribution 4.0 License.
the Creative Commons Attribution 4.0 License.
 | 10 Jul 2025
Aerosol–cloud interactions in cirrus clouds based on global-scale airborne observations and machine learning models
Derek Ngo
Ryan J. Patnaude
Sarah Woods
Glenn Diskin
Cirrus cloud formation and evolution are subject to the influences of thermodynamic and dynamic conditions and aerosols. This study developed near global-scale in situ aircraft observational datasets based on 12 field campaigns that spanned from the polar regions to the tropics from 2008 to 2016. Cirrus cloud microphysical properties were investigated at temperatures ≤ −40 °C, including ice water content (IWC), ice crystal number concentration (Ni), and number-weighted mean diameter (Di). Positive correlations were found between the fluctuations of these ice microphysical properties and the fluctuations of aerosol number concentrations for larger (> 500 nm) and smaller (> 100 nm) aerosols (i.e. Na500 and Na100, respectively). Steeper linear regression slopes were seen for large aerosols compared with smaller aerosols. Machine learning (ML) models showed that using relative humidity with respect to ice (RHi) as a predictor significantly increased the accuracy of predicting cirrus occurrences compared with temperature, vertical velocity (w), and aerosol number concentrations. The ML predictions of IWC fluctuations showed higher accuracies when larger aerosols were used as a predictor compared with smaller aerosols, even though their effects were similar when predicting cirrus occurrences. To predict IWC magnitudes accurately, aerosol concentrations were particularly important at 50 to 250 s scales (i.e. 10–50 km) and showed increasing effects at low temperatures, small ice supersaturation, and strong updraughts/downdraughts. These results improve the understanding of aerosol–cloud interactions and can be used to evaluate model parameterizations of cirrus cloud properties and processes.
- Article
(14611 KB) - Full-text XML
-
Supplement
(10569 KB) - BibTeX
- EndNote


Cirrus clouds are one of the most prominent cloud types, with a wide spatial coverage over the Earth's surface. They are located in the upper troposphere around 8–17 km and are therefore composed almost entirely of ice crystals (Lynch et al., 2002). The global cirrus coverage was reported to range from 10 % to 30 % from the polar regions to the tropics, respectively, based on observations of the Cloud-Aerosol Lidar and Infrared Pathfinder Satellite Observations (CALIPSO) satellite (Sassen et al., 2008, in their Fig. 2). Wang et al. (2024) showed cirrus frequencies around 20 %–25 % at various latitudes and longitudes (in their Fig. S6) based on several satellite products (e.g. CALIPSO and CloudSat). Because of the unique features of cirrus clouds, such as their thin, patchy nature (e.g. Sassen and Campbell, 2001), their high altitudes (e.g. Lynch et al., 2002), their complex ice morphology (e.g. Schnaiter et al., 2012), and the large spatial heterogeneities of their macro- and microphysical properties (e.g. Diao et al., 2014a, b; Maciel et al., 2023), cirrus clouds pose particular challenges for both in situ and remote sensing observations. For instance, the cirrus frequencies derived from satellite data may be underestimated because many cirrus clouds were reported to have a thin optical thickness (less than 0.3) that may be too tenuous to be effectively captured by satellites (Sassen and Campbell, 2001). Representing various properties of cirrus clouds in global climate models (GCMs) is also critical for accurate estimation of the global radiation budget and future climate prediction. At the altitude range of cirrus clouds, large sensitivities of the atmospheric radiative forcing have been found in response to variations in water vapour and ice crystal concentration (e.g. Solomon et al., 2010; Tan et al., 2016). Both the macrophysical properties (e.g. spatial extent, vertical thickness of cloud layers) and microphysical properties (e.g. mass and number concentrations of ice crystals) of cirrus clouds have the potential to alter the radiative budget (Liou, 1992) and cause a significant change in climate feedback (Zhou et al., 2014).
Determining whether ice nucleation occurs is a critical step for accurately representing the radiative effect of an atmospheric column. Changing clear-sky ice supersaturation into a cirrus cloud given the same amount of total water content can produce an average increase of 2.49 W m−2 radiative flux at the top of the atmosphere, ranging from 0.56 to 7.19 W m−2 (Tan et al., 2016). Two mechanisms contribute to ice crystal formation at lower temperatures (e.g. temperatures ≤ −40 °C), that is, homogeneous freezing and heterogeneous freezing. The former mechanism spontaneously freezes dilute aerosol solutions into ice crystals without the assistance of ice nucleating particles (INPs) depending upon the temperature and water activity (Schneider et al., 2021), while the latter mechanism relies on INPs to initiate ice nucleation via freezing pathways such as immersion freezing. Even though liquid droplets can freeze instantaneously at these low temperatures, ice nucleation involving liquid aerosols and solid particles still requires relatively higher ice supersaturation (e.g. > 20 %). The freezing of liquid aerosol solutions via homogeneous freezing requires even higher thresholds of relative humidity with respect to ice (RHi) (e.g. Koop et al., 2000) compared with heterogeneous freezing. Comparatively, INPs can facilitate ice nucleation at lower RHi thresholds, although only a few types of aerosols have the capability to serve as INPs (e.g. Kanji et al., 2017, 2019). It is still contested whether deposition freezing acts as a possible heterogeneous freezing mechanism at the cirrus temperature range, as a previous study indicated that deposition freezing may be pore condensation freezing (Marcolli, 2014; David et al., 2019).
Aerosol–cloud interactions (ACIs) are important for the formation of clouds because aerosols may contribute to heterogeneous freezing by serving as INPs or contribute to homogeneous freezing as liquid aerosol solutions. Previous aircraft-based in situ measurements frequently observed mineral dust and metallic particles inside ice residuals in midlatitudinal cirrus clouds, indicating that these aerosols frequently act as INPs in the real atmosphere (Cziczo et al., 2013). Other aerosols that may not act as an INP at mixed-phase cloud temperatures (0 to −38 °C), such as sea salt, may become an effective INP at cirrus temperatures (Patnaude et al., 2021a, 2024). In addition, black carbon has been found to have large variations in its effectiveness as INPs associated with various morphological and chemical characteristics. Its effectiveness may also increase during the ageing and coating processes (e.g. Ullrich et al., 2017; Mahrt et al., 2018, 2020). The contribution and competition between homogeneous and heterogeneous freezing may vary with the pressure levels, geographical locations, and meteorological conditions (e.g. deep convection, synoptic scale forcing, and gravity waves), and the global distributions of each mechanism are not fully resolved (e.g. Cziczo et al., 2013; Mitchell et al., 2018; Lyu et al., 2023).
Quantification of ACIs has been a difficult topic because, aside from aerosols, various factors such as the thermodynamic and dynamic conditions also affect cirrus clouds (e.g. Schiller et al., 2008; Patnaude and Diao, 2020). Isolating and quantifying the contributions of individual factors on cloud microphysical properties remain challenging tasks for observational studies of the real atmosphere where environmental conditions cannot be fully controlled (e.g. D'Alessandro et al., 2023). In addition, cirrus clouds can have different origins, such as a convective liquid origin and an in situ origin, and therefore can be subject to different environmental influences during their evolution (Krämer et al., 2016; Luebke et al., 2016; Krämer et al., 2020). Previously, Patnaude and Diao (2020) showed the importance of isolating other thermodynamic and dynamical factors before quantifying ACIs, as these other factors often play a more significant role in affecting ice microphysical properties. That study allowed comparisons between larger (> 500 nm) and smaller aerosols (> 100 nm) for their correlations with cirrus microphysical properties, with implications for the possible contributions of heterogeneous and homogeneous freezing, respectively. However, the linear regression method used in that study did not allow for a direct comparison among the effects of multiple factors and therefore cannot address the question of which factors are more influential than others for cirrus cloud formation and subsequent cloud properties. Another technical drawback of that previous study was the lack of investigation of the small ice crystals due to the limitation of the cloud probe being used. That drawback led to a limited understanding of ACIs via homogeneous freezing because homogeneous freezing often forms numerous yet relatively smaller ice particles compared with heterogeneous freezing based on box model simulations (e.g. Spichtinger and Cziczo, 2010). Because of these limitations, a large in situ observational dataset that includes measurements of both smaller and larger ice crystals as well as a new method that allows the quantification and comparison of each factor need to be developed.
The limited understanding of ACIs in cirrus clouds also inhibits the development of accurate parameterizations of ice microphysical processes in GCMs. In fact, large uncertainties still exist in the simulations of the ACIs of cirrus clouds in GCMs. Previous studies comparing climate model simulations against in situ observations found an underestimation of ACIs by the simulations of the National Center for Atmospheric Research (NCAR) Community Earth System Model version 2 (CESM2)/Community Atmosphere Model version 6 (CAM6) (Patnaude et al., 2021b; Maciel et al., 2023). The ACIs of cirrus clouds are particularly underestimated at the earlier evolution stage of cirrus clouds, such as the nucleation and early growth phases (Maciel et al., 2023). Adding or reducing aerosols can further modify cirrus properties, such as the cirrus thinning scenario discussed in hypothetical geoengineering simulations (e.g. Storelvmo et al., 2013; Storelvmo and Herger, 2014; Muri et al., 2014; Gasparini and Lohmann, 2016; Lohmann and Gasparini, 2017; Liu and Shi, 2021). However, due to the complexity of the processes affecting cirrus cloud formation and evolution, more observational evidence is needed to verify the current parameterizations used in GCM simulations (e.g. Gettelman and Morrison, 2015), as well as the emerging types of parameterizations related to ice nucleation in cirrus clouds (e.g. Kärcher, 2022; Barahona et al., 2023).
This study combines several aircraft-based in situ observational datasets from multiple flight campaigns to reach near-global coverage. A new method is developed based on a machine learning (ML) approach to quantify the relationships between cirrus microphysical properties and five controlling factors – temperature, RHi, vertical velocity (w), and aerosol number concentrations of larger and smaller aerosols (Na500 and Na100, respectively). A new metric is developed to quantify the individual effects of these five factors under three separate topics: (1) How do these factors affect the occurrences of cirrus clouds? (2) How do they affect cirrus microphysical properties, in terms of the fluctuations of ice water content (IWC) being lower or higher than the average values? (3) How do they affect the distributions of IWC in cirrus clouds as a function of temperature, RHi, and w? The sections are designed as follows. Section 2 describes the observational datasets, instrumentation, and set-up of two methods to compare various factors (i.e. the delta-delta method and the ML approach). Section 3 examines each of the three topics mentioned above by quantifying and contrasting the role of individual factors under each topic. Section 4 provides the main summary of the findings and their implications for climate simulations.
2.1 In situ observations and instrumentation
A dataset focusing on the cirrus cloud temperature range was developed in this study based on seven U.S. National Science Foundation (NSF) campaigns and five National Aeronautics and Space Administration (NASA) flight campaigns. Note that many of these campaigns (especially all U.S. NSF campaigns) were not cirrus-focused, and cirrus clouds were sampled as opportunities arose en route. All data used in this study are constrained to temperatures ≤ −40 °C to eliminate the presence of supercooled water droplets. The seven NSF flight campaigns, in alphabetical order, include CONTRAST (Pan et al., 2017), NSF-DC3 (Barth et al., 2015), HIPPO (Wofsy, 2011), ORCAS (Stephens et al., 2018), PREDICT (Montgomery et al., 2012), START08 (Pan et al., 2010), and TORERO (Volkamer et al., 2015). The five NASA campaigns include ATTREX-2014 (Jensen et al., 2017a, b; Woods et al., 2018), NASA-DC3 (Barth et al., 2015), MACPEX (Rollins et al., 2014), POSIDON (Schoeberl et al., 2019), and SEAC4RS (Toon et al., 2016). The DC3 campaign was a coordinated flight campaign between NASA and NSF; thus, we use NSF-DC3 and NASA-DC3 to differentiate the two research aircraft platforms during that campaign. Specific details of these campaigns, such as the name, acronym, time, and location, are listed in Table 1. Information on the cirrus cloud observations, such as the flight hours, ranges of temperatures, altitudes, and pressures, is also given in that table. Previously, these field campaigns were also used by Maciel et al. (2023) for the analysis of various phases of cirrus evolution. By compiling observations from these flight campaigns, we aim to construct a near-global-scale dataset covering wide latitudinal regions (87° N to 75° S) and longitudinal regions (128 to 180° E and 37 to 180° W). Global maps illustrating the entire flight tracks at all temperatures are shown for individual NASA and NSF campaigns in Fig. 1. Flight tracks restricted to cirrus temperatures (≤ −40 °C) are illustrated in Figs. S1 and S2 in the Supplement for in-cloud and clear-sky conditions, respectively.
Table 1Descriptions of five NASA and seven NSF campaigns used in this work, including their names, acronyms, times, locations, and key instruments. Cirrus cloud observations, including in-cloud flight hours ≤ −40 °C and ranges of temperatures, altitudes, and pressures, are also provided.
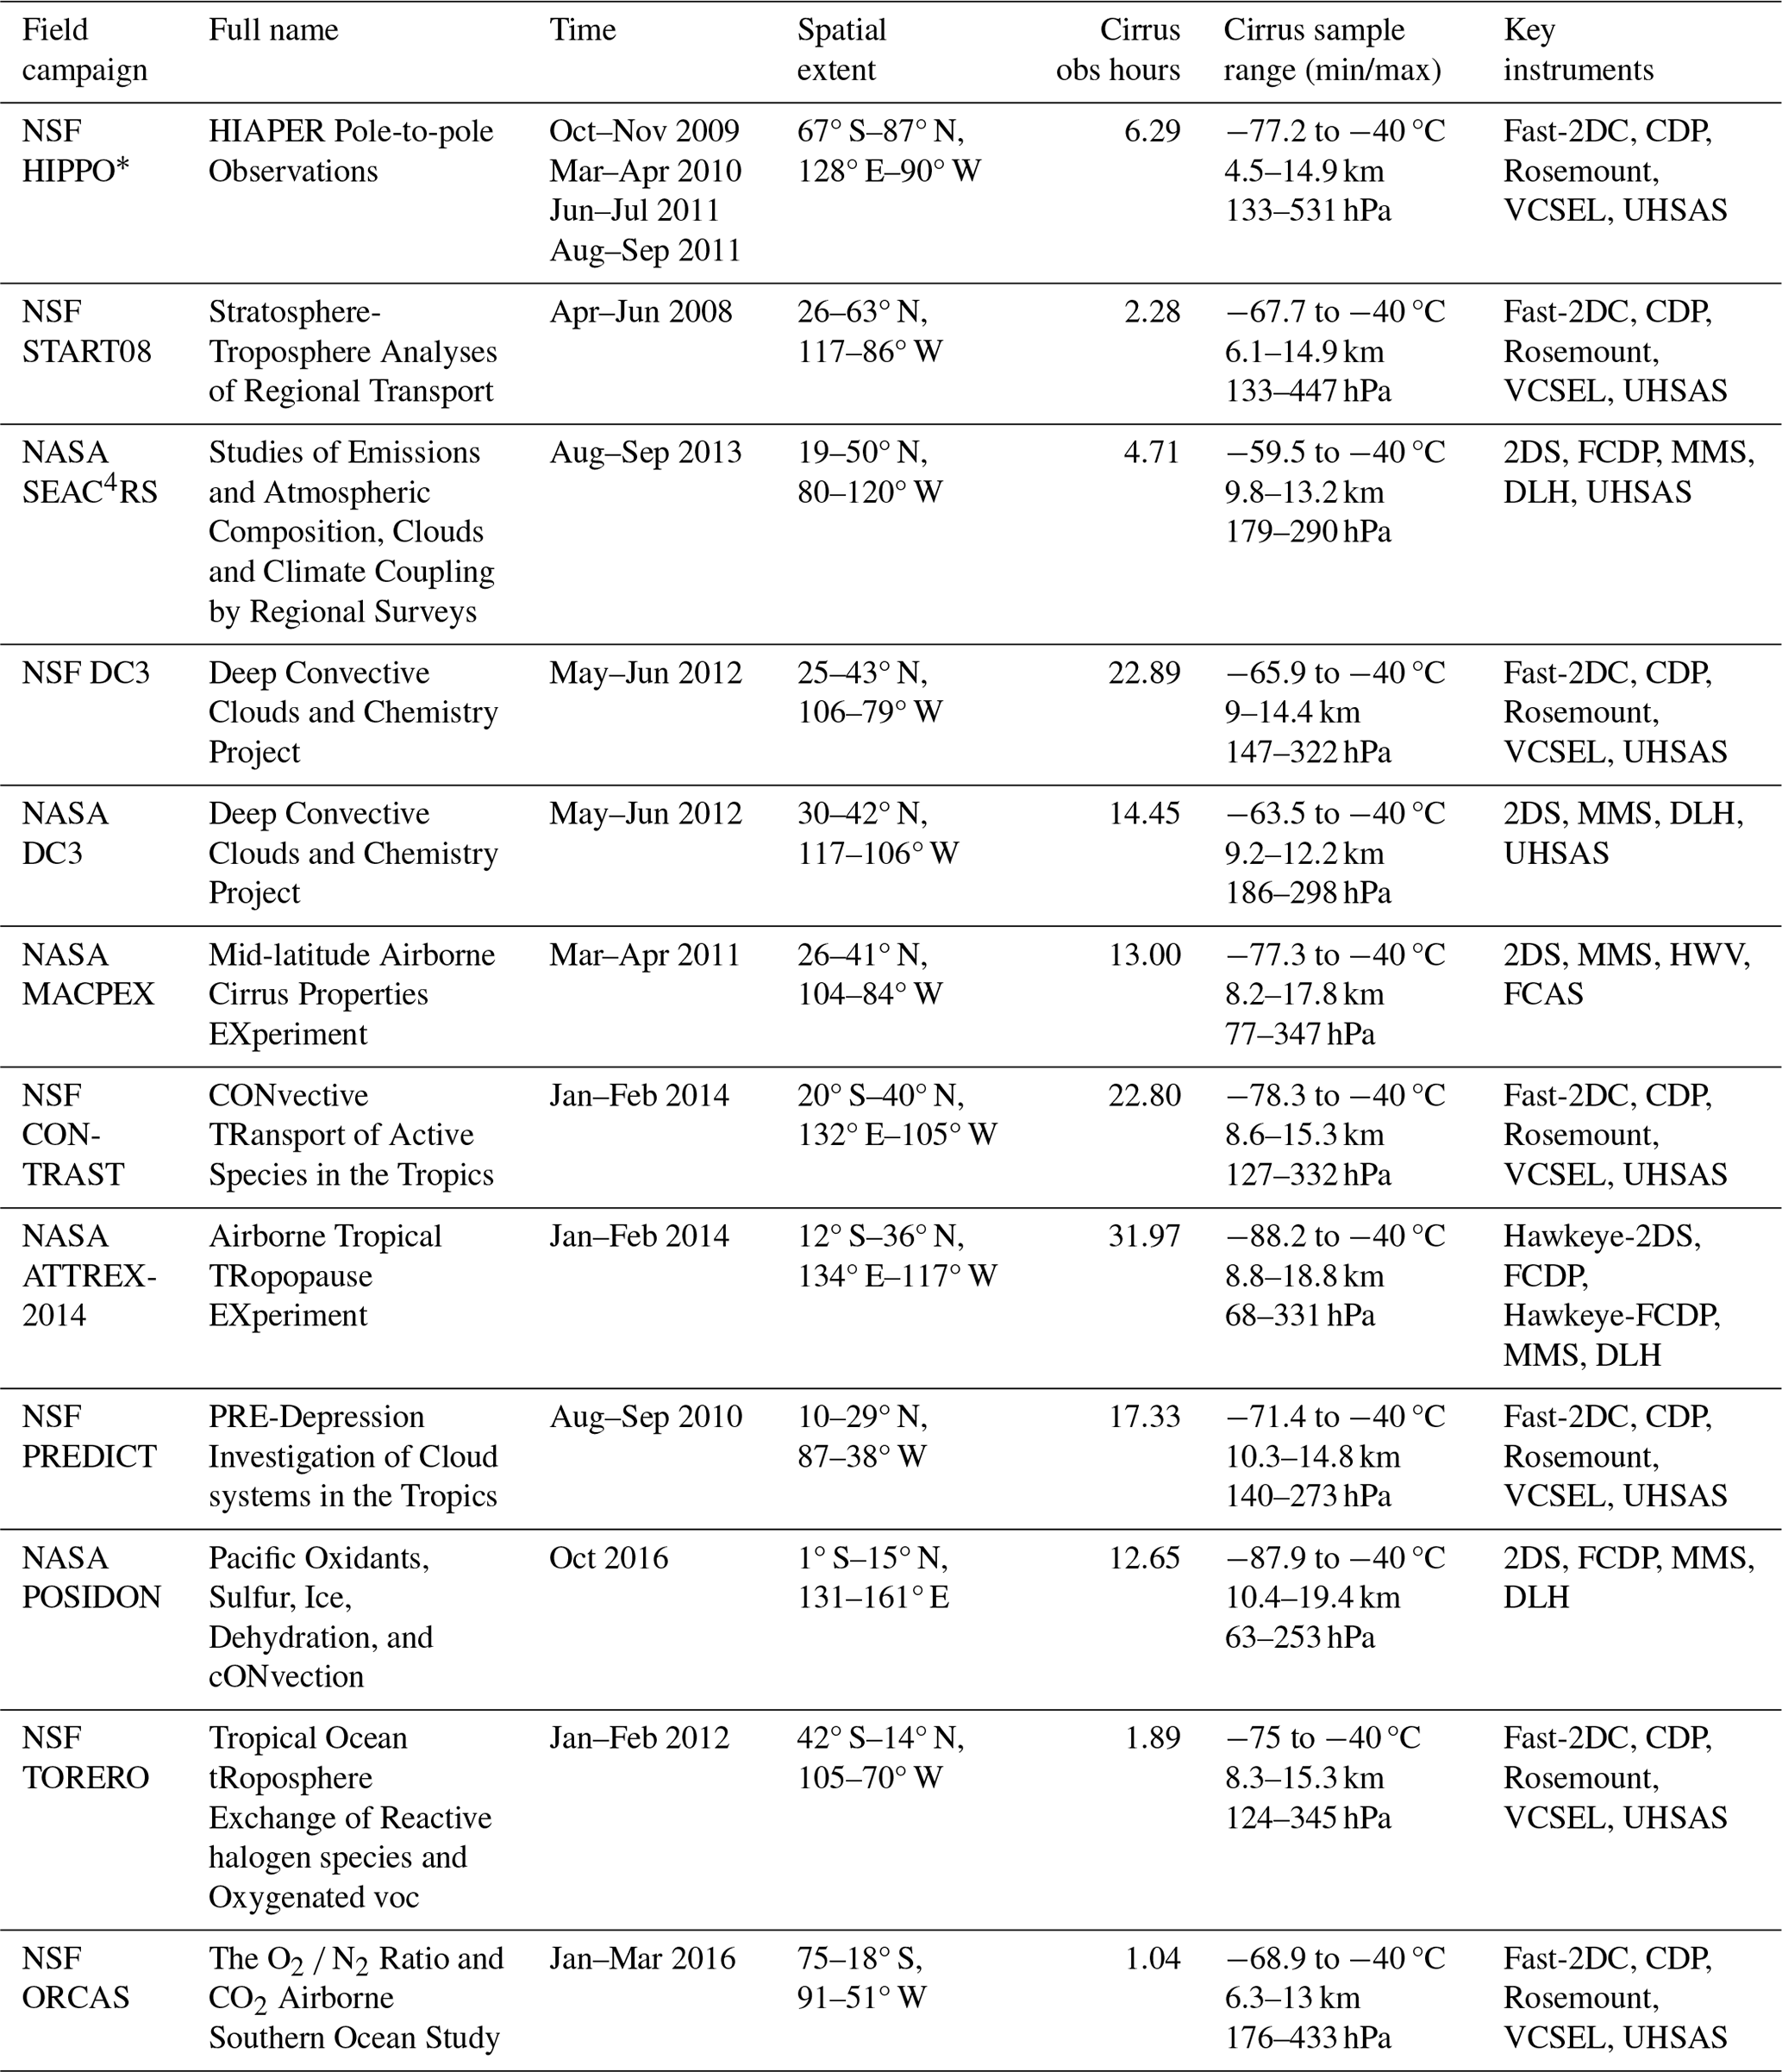
∗ Only used deployments #2 to #5.

Figure 1Global maps of research aircraft flight tracks from (a) five NASA campaigns and (b) seven NSF flight campaigns used in this observational study. The entire flight tracks at all temperatures are shown.
Because one main objective of this study is to examine the effects of key environmental conditions (such as temperature, RHi, and w) on cirrus cloud properties, a few other campaigns that targeted cirrus clouds were not included in the compiled dataset due to issues with water vapour or RHi measurements at the cirrus temperature range. For example, the U.S. Department of Energy (DOE) Small Particles in Cirrus (SPARTICUS) campaign provided targeted observations of cirrus clouds but had issues with water vapour measurements. The Learjet research aircraft also participated in the SEAC4RS campaign but did not provide good quality water vapour measurements below −30 °C due to the limitations of a chilled mirror hygrometer on board.
The seven flight campaigns funded by NSF were carried out exclusively by the NSF/NCAR High-Performance Instrumented Airborne Platform for Environmental Research (HIAPER) Gulfstream V (GV) aircraft. As mentioned above, these seven NSF flight campaigns were not specifically designed for cirrus cloud measurements. For example, HIPPO was planned for a near pole-to-pole profiling of greenhouse gases, DC3 targeted deep convective outflows, PREDICT targeted tropical cyclones, and START08 targeted the air-mass exchanges between the stratosphere and troposphere. The cirrus observations were extracted from these field campaigns because the GV aircraft often reached the upper troposphere and lower stratosphere as part of their flight planning.
A list of key variables and the instruments used to derive them is shown in Table 1. The key measurements include 1 Hz observations of basic meteorological parameters such as temperature, pressure, water vapour, and vertical velocity (w), as well as measurements of cloud ice microphysical properties and aerosol number concentrations. The ice microphysical properties to be examined include ice water content (IWC), ice crystal number concentration (Ni), and number-weighted mean diameter (Di). Here, Di is calculated based on the maximum dimension of the ice particle. On board the NSF/NCAR GV research aircraft, the Vertical-Cavity Surface-Emitting Laser (VCSEL) hygrometer was used to measure molecular number concentrations of water vapour (Zondlo et al., 2010). The Rosemount temperature probe was used to provide 1 Hz temperature observations. Two cloud probes were used for the NSF campaigns, i.e. the Fast 2-Dimensional Cloud (Fast-2DC) probe and the Cloud Droplet Probe (CDP). The CDP has a size range of 2–50 µm. The Fast-2DC has a physical measurement range of 62.5–1600 µm through a 64-photodiode array with 25 µm bin widths and mathematically reconstructs partially detected particles, with the maximum size up to 3200 µm. The Fast-2DC probe was equipped with anti-shattering tips, and shattering reduction in data post-processing was applied through an “interarrival time rejection” algorithm, which is described in Field et al. (2006), although complete elimination of shattering was not possible for the current measurement technique, especially for ice particles smaller than 100 µm (e.g. Korolev et al., 2013). Measurements of aerosol number concentrations were obtained from the Ultra-High-Sensitivity Aerosol Spectrometer (UHSAS), operating at a size range of 60–1000 nm with 99 logarithmically spaced bins.
In contrast to the NSF campaigns, the five NASA flight campaigns were obtained from several research aircraft platforms, including the NASA Global Hawk for ATTREX-2014, NASA DC-8 for SEAC4RS and NASA-DC3, and NASA WB-57 for MACPEX and POSIDON. The ATTREX, POSIDON, and MACPEX campaigns were designed to sample cirrus clouds and advance the understanding of cirrus cloud microphysical properties, while the SEAC4RS and NASA-DC3 campaigns were designed to target the evolution of gases and aerosols in deep convective outflows. Compared with the other research aircraft platforms that mostly sampled altitudes lower than 15 km, the ATTREX and POSIDON campaigns sampled mostly above 15 km on board the NASA Global Hawk aircraft and NASA WB-57, respectively. The ATTREX campaign had four deployments between 2011 and 2015, but only the 2014 deployment was used in the compiled dataset based on the availability of both ice microphysical properties and water vapour measurements.
Water vapour measurements during the ATTREX, POSIDON, DC3, and SEAC4RS campaigns were taken from the Diode Laser Hygrometer (DLH), which operates at a near-infrared wavelength of 1.4 µm. The water vapour measurements in MACPEX were sampled using the Harvard Water Vapor (HWV) instrument, which is a combination of measurement methodologies from the Lyman-α photo-fragment fluorescence instrument (LyA) and Harvard Herriott Hygrometer (HHH). Temperature measurements were based on the NASA Meteorological Measurement System (MMS) on board various research aircraft. For all the NSF and NASA campaigns, saturation pressures with respect to ice (es) were derived from temperature measurements based on the equation from Murphy and Koop (2005), which were further combined with water vapour measurements to calculate RHi.
Aerosol measurements were provided in three NASA campaigns (i.e. MACPEX, NASA-DC3, and SEAC4RS). NASA-DC3 and SEAC4RS utilized UHSAS, similar to the NSF campaigns, while MACPEX used the Focused Cavity Aerosol Spectrometer (FCAS), which measures particles within the diameter range of 70–1000 nm. The NSF START08, NASA ATTREX, and NASA POSIDON campaigns were not included in the analysis of ACIs due to the lack of aerosol measurements. Thus, these campaigns were excluded from the analysis in Figs. 5–10 and Tables 2 and 3. To examine if there are any possible artefacts in aerosol measurements for in-cloud conditions, we examined time series of 1 Hz measurements for IWC, Ni, Di, Na100, and Na500 for various campaigns (not shown). No direct correlations were found between the cloud and aerosol measurements in the cirrus regime at second-to-second resolution. Among all in-cloud samples, only 33 % contain large aerosols, while most in-cloud samples contain small aerosols. It is also unlikely that the aerosol measurements were detecting small ice crystals (a few micrometres), as the small ice crystals would grow rapidly. This speculation is also corroborated by a modelling study by Jensen et al. (2024), which showed that small ice particles (diameters < 10 µm but specifically less than 2 µm) are very transient and short-lived after ice formation in cirrus clouds. Nevertheless, when calculating the ratios between Na500 and small ice concentrations (Ni_1–3 µm) when both large aerosols and small ice were detected, the average ratios for each campaign are 24 for NASA SEAC4RS, 81 for NSF CONTRAST, 96 for NSF-DC3, 108 for HIPPO, 242 for ORCAS, 68 for PREDICT, and 716 for TORERO, indicating that it is unlikely that the sublimation or shattering of ice crystals contributes to the existence of large aerosols (i.e. Na500 > 0). Note that this ratio can be calculated only for campaigns with both aerosol and small ice measurement (by CDP, Fast-CDP (FCDP), or Hawkeye-CDP).
Table 2Summary of results for Test A, namely, predicting the occurrences of cirrus clouds. Accuracies of the predictions are shown for all cirrus, vertically quiescent cirrus, and non-quiescent cirrus in columns 1–3, respectively. All possible combinations among five predictors are shown.
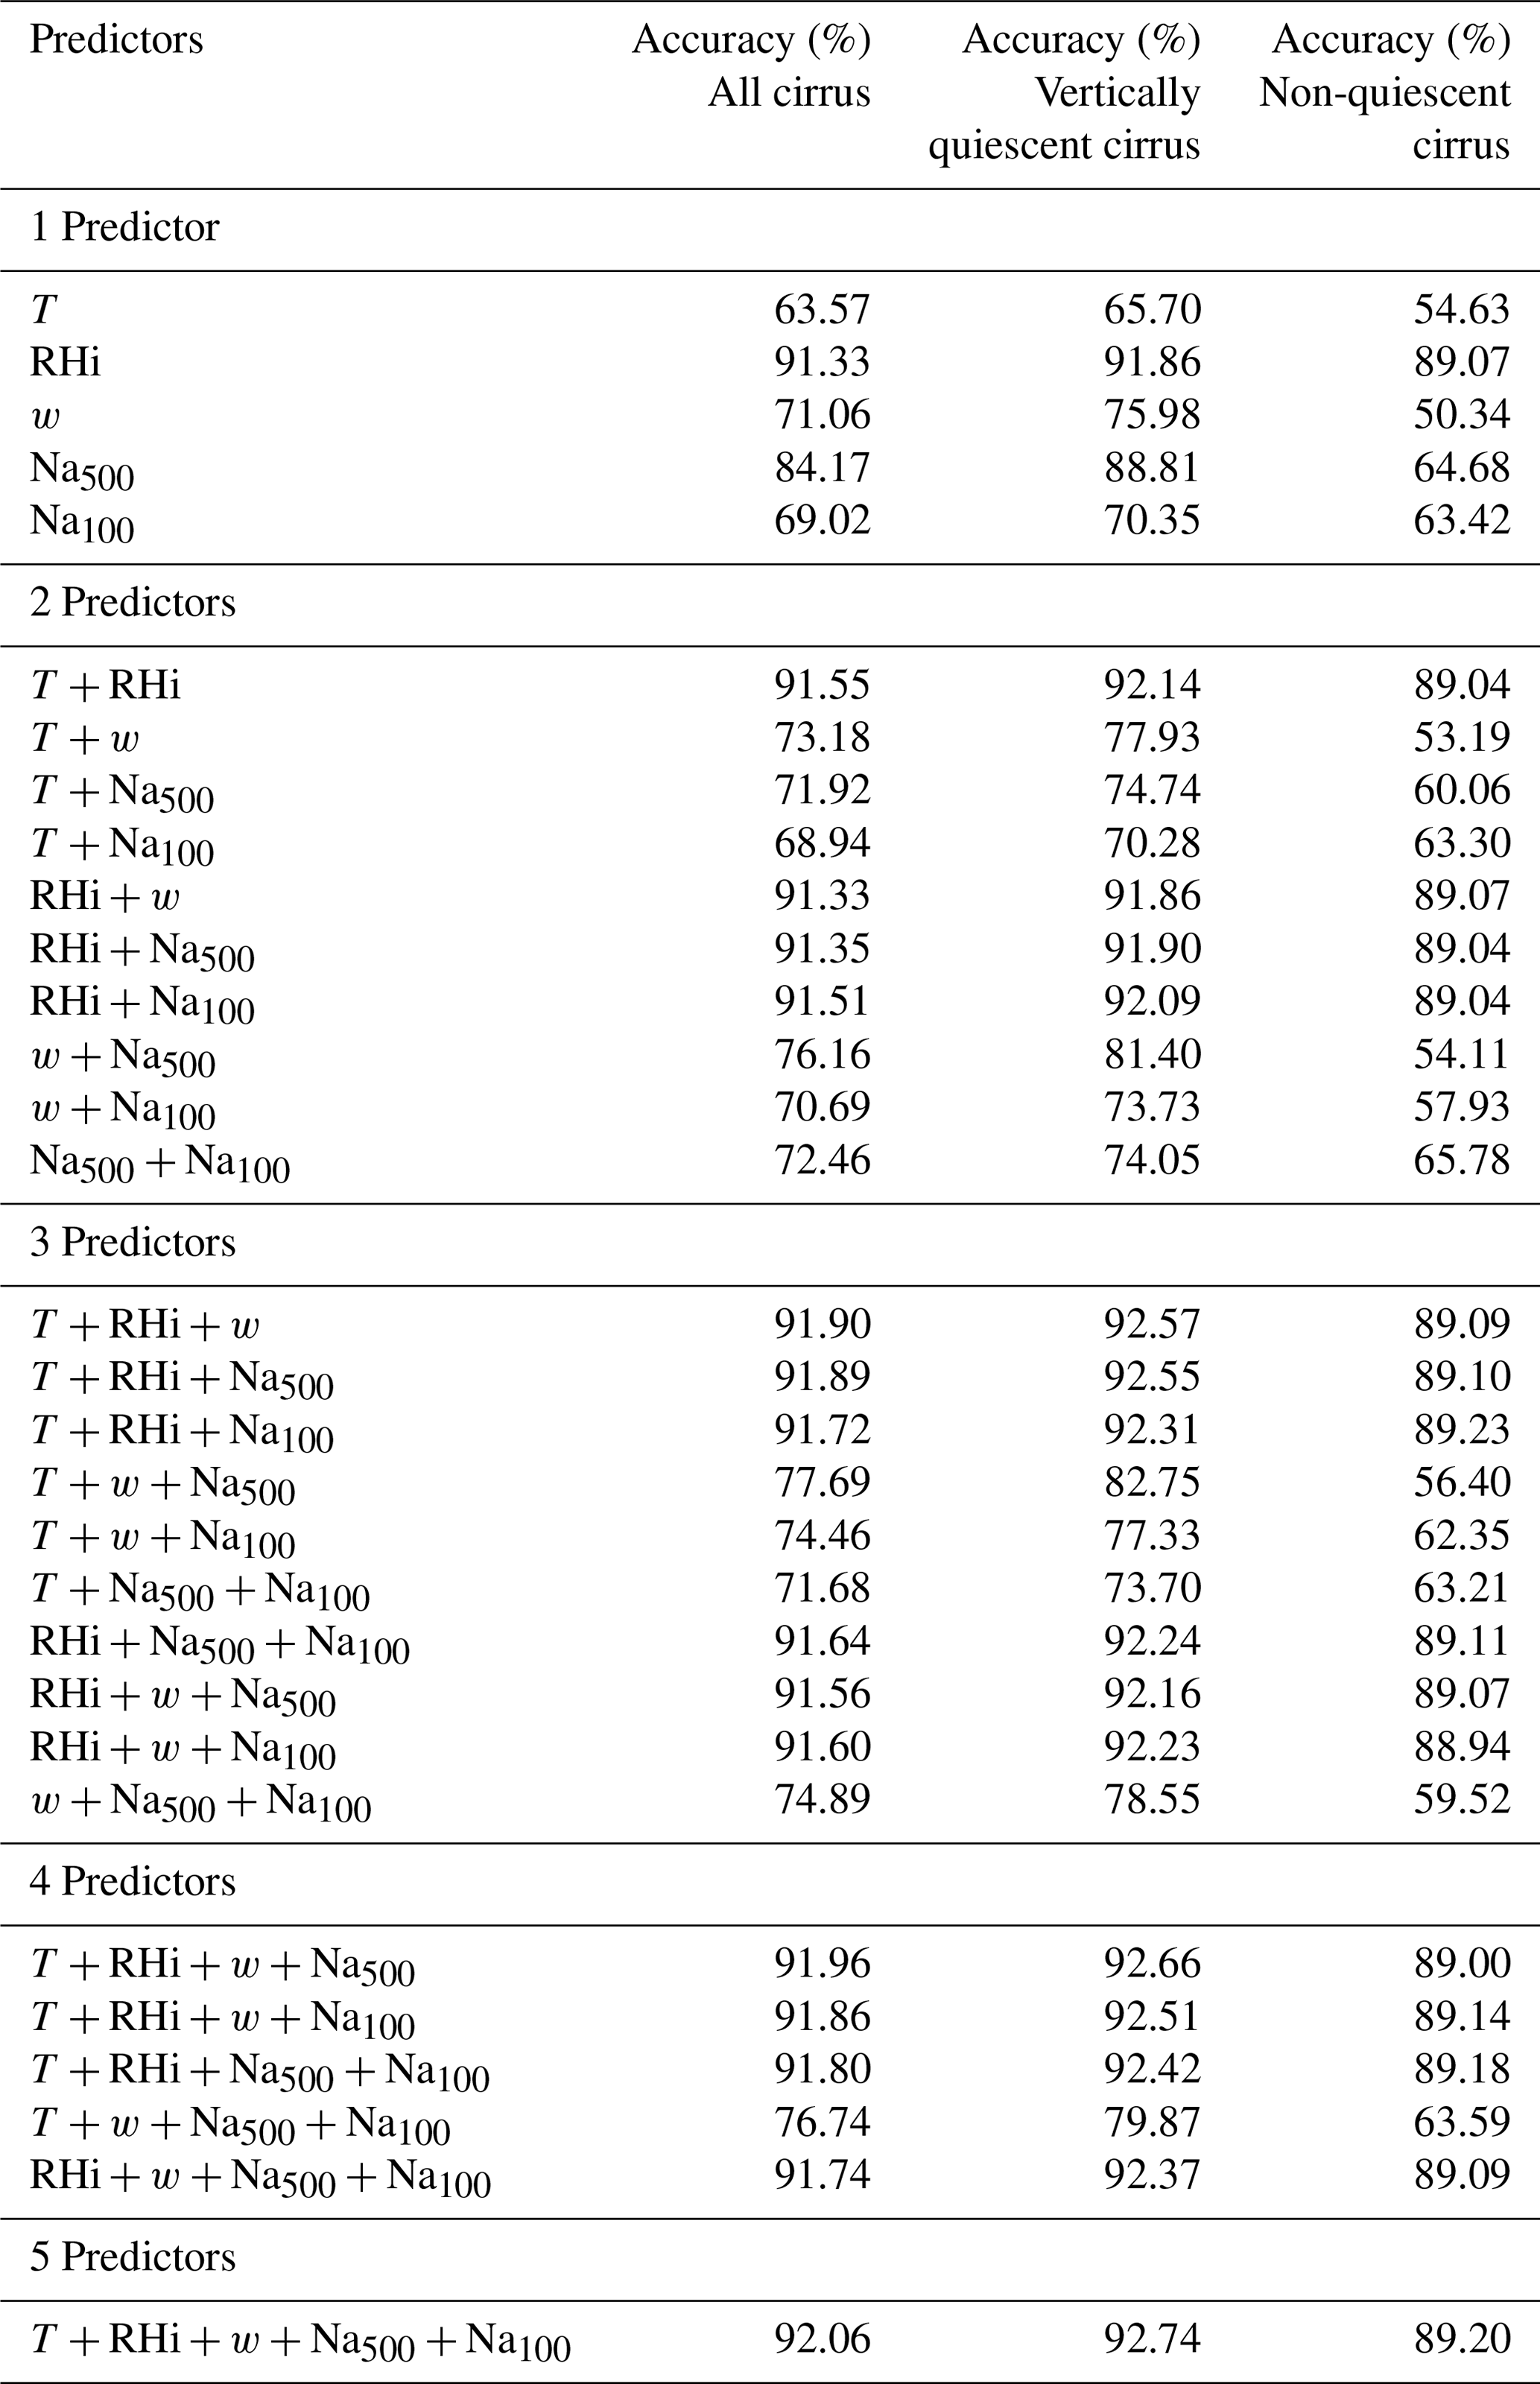
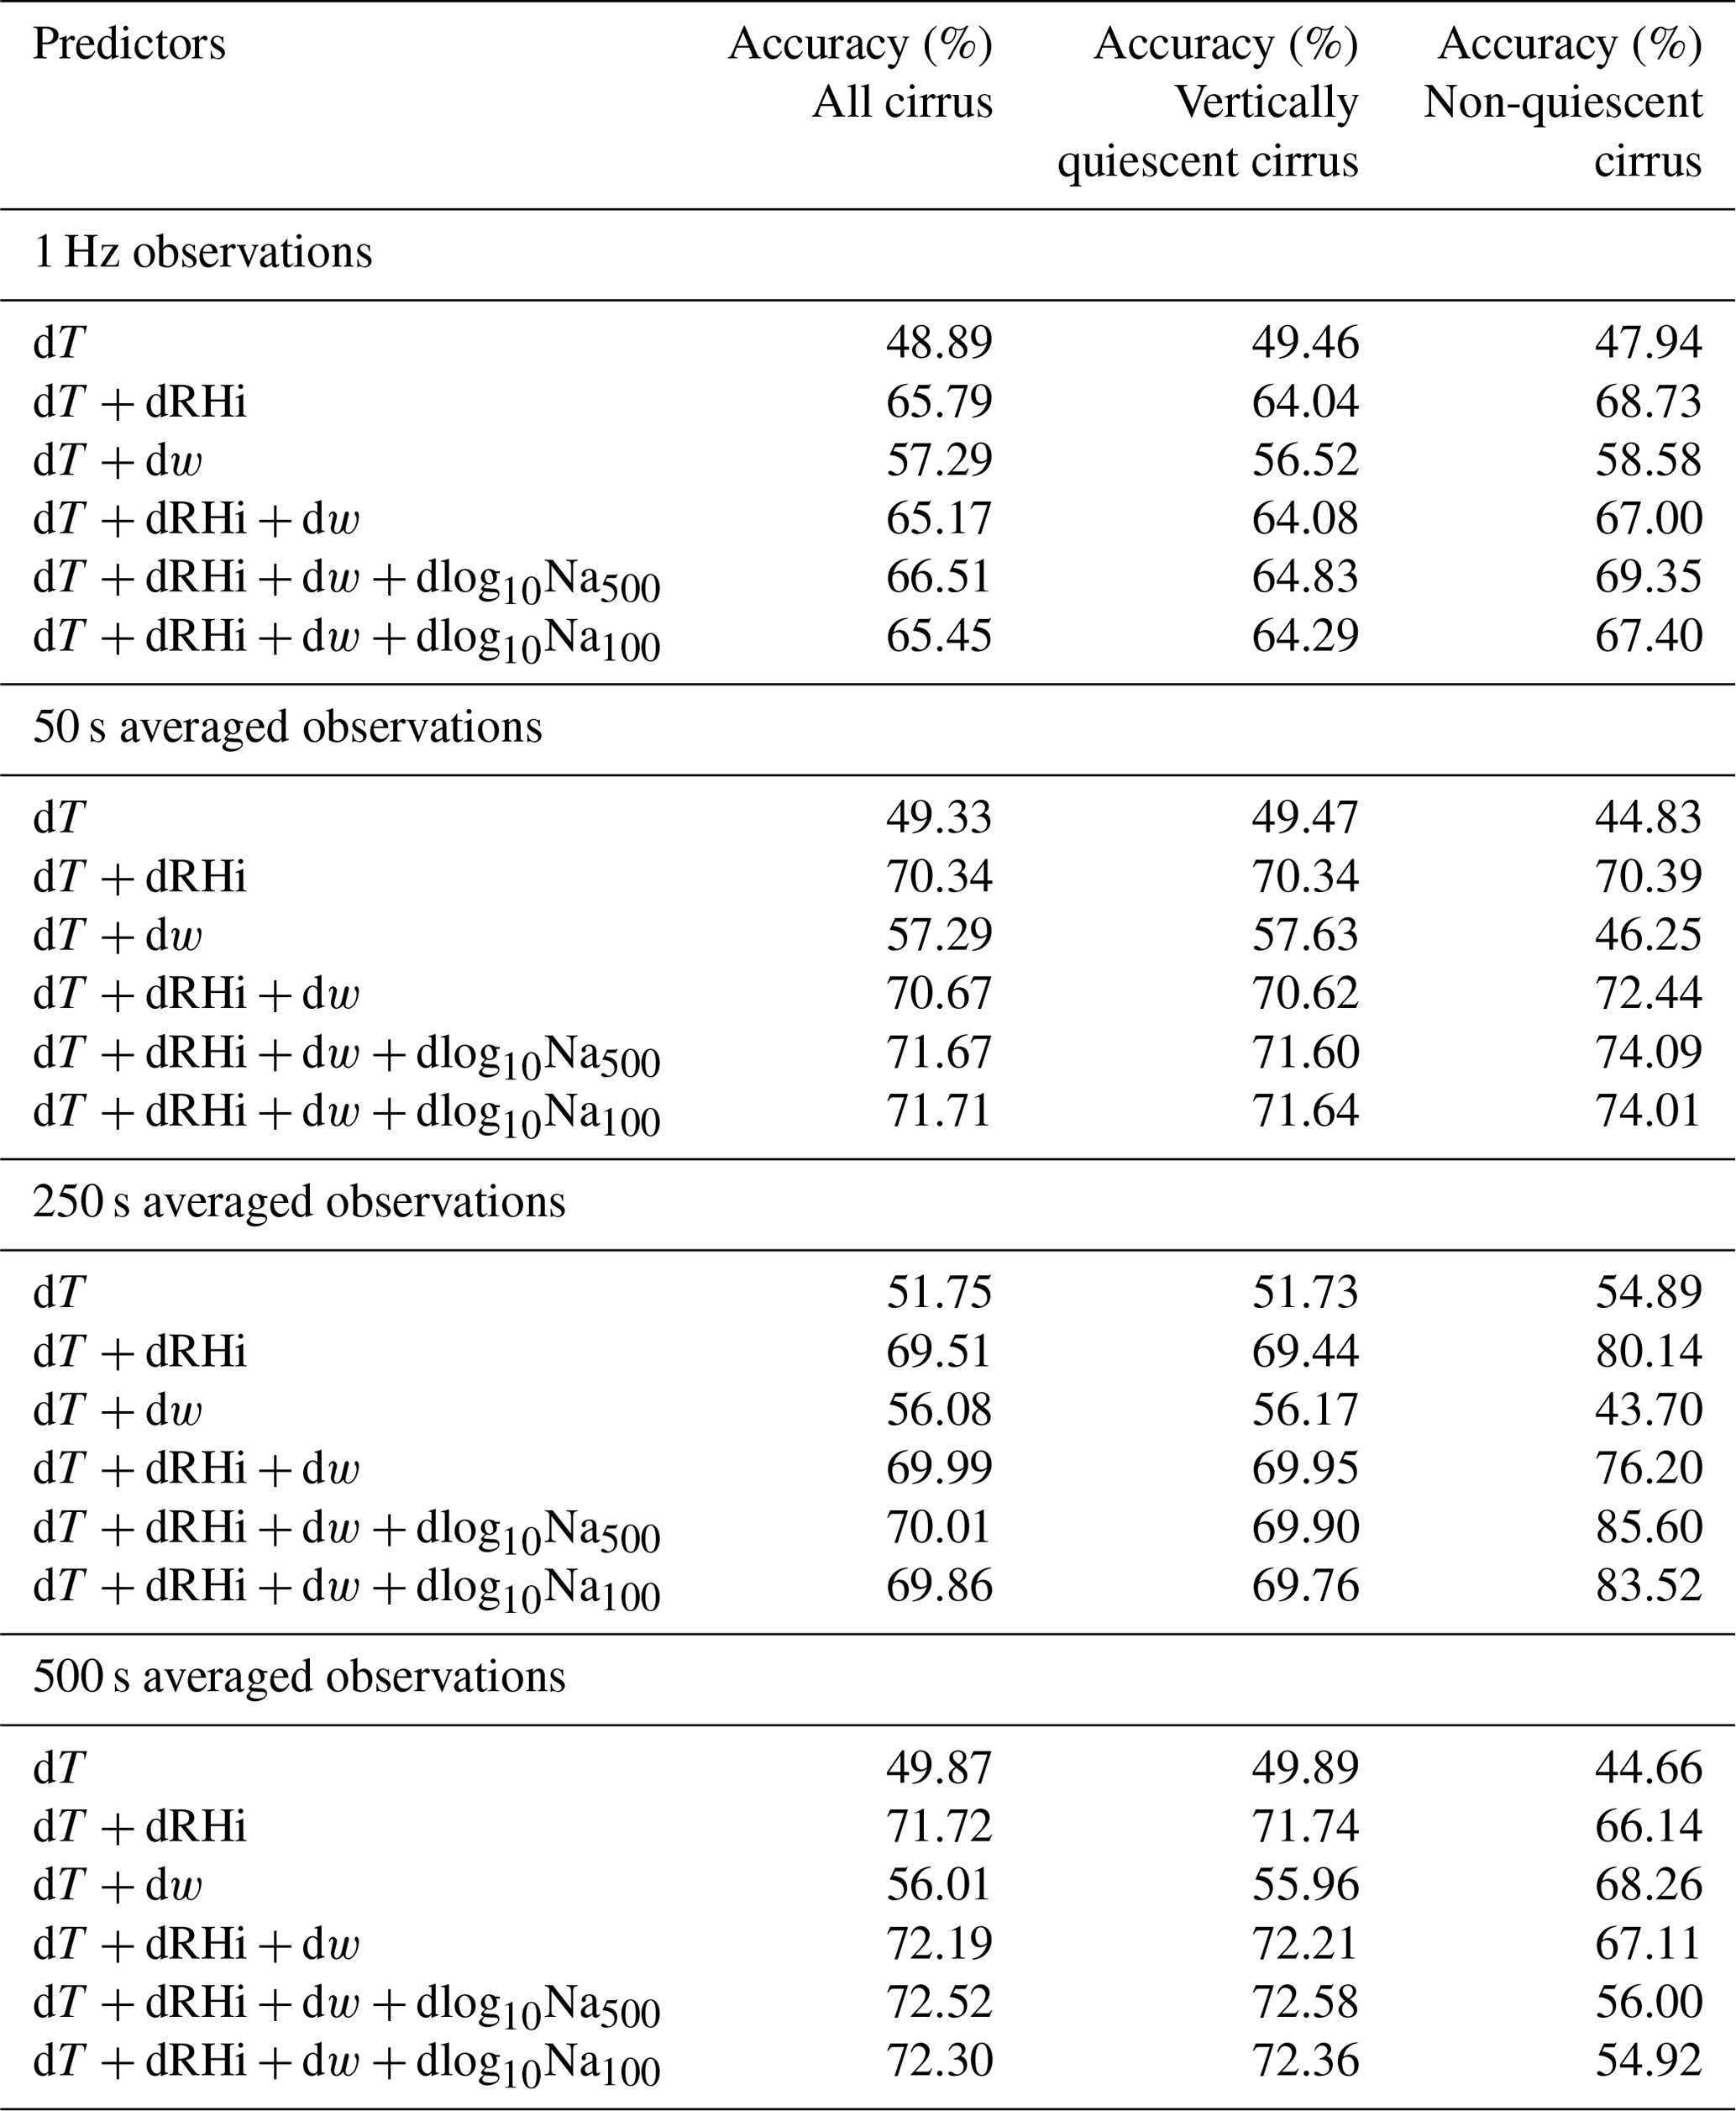
Table 3Summary of results for Test B, namely, predicting whether IWC inside cirrus clouds is higher or lower than the average IWC conditions. Similar to Table 2, accuracies of the predictions are shown for all cirrus, vertically quiescent cirrus, and non-quiescent cirrus in columns 1–3, respectively. Effects of multiple factors are analysed at different spatial scales, i.e. 1, 50, 250, and 500 s averaged conditions.
Ice particle measurements for most of the five NASA campaigns were based on two probes – the FCDP probe and the Two-Dimensional Stereo Probe (2DS). The FCDP probe has a size range of 1–50 µm. The 2DS probe has a diameter range of 5–3005 µm and uses two linear and independent 128-photodiode arrays designed to record at a 10 µm pixel resolution. Similar to the Fast-2DC probe in the NSF campaigns, anti-shattering tips were installed in the 2DS probe for these field campaigns, although the MACPEX campaign used an earlier version of a shattering probe that is slightly different compared with the ones used in later NASA campaigns. 2DS processing software also includes shattering removal algorithms (Lawson, 2011). For two research flights in ATTREX (RF03 and RF07), the FCDP probe did not provide measurements, and therefore the Hawkeye-FCDP probe was used to provide the same size range (1–50 µm) of measurements.
Several additional steps were taken to derive ice microphysical properties from the key measurements mentioned above. For the 2DS, CDP, FCDP, and Hawkeye-FCDP probes, their measurements in the first bin were discarded to avoid possible uncertainties in that bin. A similar procedure for discarding small-size particles in 2DS measurements was also applied in a previous study by Mitchell et al. (2018). For the Fast-2DC probe, the first three bins were already discarded in the archived data to minimize uncertainties, i.e. starting the particle size distributions (PSDs) at 62.5 µm. The last few bins (> 3012.5 µm) of Fast-2DC were further discarded in this work to reach a similar size range as the 2DS probe. After these procedures, the measurements of these probes were combined. That is, in the NSF campaigns, the CDP probe measurements at 2–50 µm were combined with the Fast-2DC probe measurements at 62.5–3012.5 µm, providing a final size range of 2–3012.5 µm. To quantify the impact of the remaining size gap (50–62.5 µm) of the merged NSF data, the IWC and Ni of this size gap were calculated based on ice crystal PSDs from global climate model simulations of the NCAR CESM2/CAM6. The results show that the size gap of 50–62.5 µm accounts for 4 % of IWC and 0.8 % of Ni relative to their values at 2–3200 µm, respectively. Thus, we did not attempt to interpolate the data to fill this small size gap to avoid introducing more uncertainties through the interpolation assumptions.
In the NASA ATTREX, POSIDON, and SEAC4RS campaigns, 2DS measurements were restricted to 15–3005 µm and then combined with FCDP (or Hawkeye-FCDP) measurements at 1–14.5 µm, which produced a combined size range of 1–3005 µm. Because NASA DC3 and MACPEX did not have FCDP, only 2DS measurements were used for the size range of 15–3005 µm after discarding the first bin of 2DS. In summary, the compiled dataset of all NSF campaigns provided a final range of 2–3012.5 µm, while the compiled dataset of all NASA campaigns provided a final range of 1–3005 µm. The size range of the combined dataset for all NASA + NSF campaigns was 1–3012.5 µm. The combined NASA + NSF dataset with the size range of 1–3012.5 µm was used for most of the tables and figures in this paper, including Tables 1–3, Figs. 1–3, and Figs. 5–10, and all the analyses shown in the Supplement. The separate NSF and NASA campaigns were analysed in Fig. 4 and part of Fig. 5 to contrast the differences between these campaigns.
For both NASA and NSF datasets, the in-cloud condition is defined when ice crystals have been detected in a 1 s measurement, that is, Ni > 0 for either Fast-2DC or 2DS measurements. The rest of the samples are defined as the clear-sky condition. Flight hours for each flight campaign in the cirrus temperature range (i.e. temperatures ≤ −40 °C) are shown in Table S1, including flight hours for all-sky, clear-sky, and in-cloud conditions, as well as cirrus clouds under two types of environmental conditions. For the cirrus temperature regime, 730 flight hours were obtained at temperatures ≤ −40 °C (i.e. 251 and 479 h from the NSF and NASA datasets, respectively), which include 161.6 h of in-cloud conditions (i.e. 81.6 and 80.0 h from the NSF and NASA datasets, respectively). Furthermore, IWC, Ni, and Di were calculated for the combined size range for each flight campaign. IWC was derived based on the mass-dimensional relationship following Brown and Francis (1995) for Fast-2DC, CDP, FCDP, and Hawkeye-FCDP. For the 2D-S probe, the archived IWC data in each NASA campaign were used, which are based on the parameterizations from Baker and Lawson (2006). Because the parameterizations in Baker and Lawson (2006) require additional information besides the maximum dimension, such as width, area, perimeter, and categories of ice morphology, they were not applied to the other optical array probes.
Table S2 shows the minimum and maximum range of several key variables for each campaign at cirrus cloud temperatures ≤ −40 °C. In this work, we analysed the entire range of IWC measurements including cirrus clouds that may be subvisible for satellite retrievals. We also conducted sensitivity tests using higher IWC thresholds for in-cloud conditions (i.e. IWC > 10−5, > 10−4, and > 10−3 g m−3), and the main ACI features were consistently found (to be discussed in Sect. 3.4). One should note that cirrus clouds with different magnitudes of IWC have different radiative effects. Based on the previous work of Heymsfield et al. (2003), cirrus clouds with IWCs of 10−7 and 10−5 g m−3 would have an optical depth of 3.3 × 10⁻⁵ and 0.0015, respectively, for a cirrus layer with 1 km thickness using the equation τ = 0.069(IWP)0.83, where τ is the optical depth and IWP is the ice water path. In addition, calculations of a radiative transfer model showed that cirrus radiative effects in shortwave and longwave radiation become more noticeable (i.e. < −0.25 and > 0.25 W m−2, respectively) when the cloud optical depth is larger than 0.001 (Spang et al., 2024).
2.2 Methods used to quantify influences of multiple factors on ice microphysical properties
Two main methods were used to examine the influences of various factors on the occurrences of cirrus clouds and their microphysical properties. The key variables investigated include temperature, RHi, w, Na500, and Na100. The first method is a delta-delta method (shown in Figs. 4g–r, 5, and 6). The second method is based on ML models (shown in Figs. 7–10 and Tables 2 and 3).
2.2.1 The “delta-delta” method to isolate the effects of aerosols from other effects
In the previous studies of Patnaude and Diao (2020) and Maciel et al. (2023), a “delta-delta” method was developed to individually examine the thermodynamic/dynamic effects and aerosol effects on cirrus microphysical properties. This method calculates the mean value for each temperature bin (e.g. binned by 1 °C) and then calculates the differences between each 1 s variable value within that temperature bin and the mean value of the temperature bin. Thus, the delta-delta method removes the trend of a variable as a function of temperature. Note that the delta-delta method is different from detrending the data by subtracting the averaged values from each 1 Hz data point along the time series. After applying the delta-delta method, linear regressions can be applied to quantify the correlations between fluctuations of a certain environmental factor and the fluctuations of a cirrus microphysical property. However, one limitation of such analysis is the difficulty of conducting a direct, quantitative comparison among multiple factors. Thus, to achieve a direct comparison of multiple factors, an ML approach was developed in this work.
2.2.2 Design of the machine learning (ML) models
ML models were developed to examine the influences of various factors through direct comparisons of the model prediction results. By using different combinations of predictors, prediction accuracies can be used to show the incremental values of individual variables. Three experiments were designed for the ML models (hereafter referred to as Tests A, B, and C), which aimed to answer the following scientific questions, respectively: (1) Which factor(s) are more important for the ML model to predict the occurrences of cirrus clouds? (2) Which factor(s) are more important for the ML model to predict the fluctuations of IWC inside cirrus clouds? (3) Which factor(s) are more important for the ML model to predict the distributions of IWC as a function of temperature, RHi, and w inside cirrus clouds? This section describes the technical part of the experimental setup of the ML models, including the ML model type and dataset preparation. The results of the ML analysis are shown in Sect. 3.5.
For the ML model, a random forest model was used, consisting of 100 individual and distinct decision trees based on a classification ensemble algorithm. To develop “training” and “testing” datasets for the ML models, all the observation data for each research flight were first separated into 10 consecutive flight segments. Seven of the 10 flight segments were randomly selected to be used as the training data, while the remaining three flight segments were used as the testing data. This method ensures that the training and testing datasets do not overlap and avoids possible high-frequency correlations between the training and testing datasets. Another method for separating training and testing data was also investigated, which randomly selected 70 % of the 1 Hz data of a research flight as training data and the rest (30 %) as testing data. This second-based separation may assign training and testing data points adjacent to each other at high resolution, which may lead to biases in the performance evaluation of the ML models. Thus, the segment-based separation method was used for all the analyses in this work. Nevertheless, sensitivity tests using the second-based separation method showed consistent results for the ML model performance (not shown). Another step taken to pre-process the data was the utilization of a “listwise deletion” method for data filtering. This deletion method was applied if any second of the observational datasets contained temperatures > −40 °C or if any key variable of that second showed “NAN”, in which case the entire second would be removed from the dataset.
In addition, the “Random Undersampling Boosting” (RUSBoost) algorithm was implemented to account for any imbalances of samples among various categories in the dataset to keep any training biases to a minimum. For example, in the aircraft-based observations, the flight hours of each campaign were dominated by clear-sky conditions compared with in-cloud conditions. In that case, the RUSBoost algorithm helps to account for the disproportionate sampling of in-cloud conditions by randomly boosting this under-sampled category.
3.1 Distributions of RHi and σw for cirrus clouds in two environmental conditions
The influences of thermodynamic (i.e. temperature and RHi) and dynamical conditions (w) were investigated for various types of cirrus clouds (Figs. 2 and 3). Cirrus clouds were categorized into two types of conditions, depending on the fluctuations of w in the adjacent environment. That is, for one second of measurement, if the region of ±30 s surrounding it experienced updraughts and downdraughts exceeding ±1 m s−1 (i.e. w ≤ −1 m s−1 or ≥ 1 m s−1), then this 1 s observation was defined as non-quiescent conditions. A previous study of Diao et al. (2014a) analysed the horizontal length distributions of ice supersaturated regions (ISSRs), which are the prerequisite condition of cirrus clouds. That study showed that ∼ 5% of the ISSR samples (i.e. one consecutive ISSR counted as one sample) exceed the 10 km horizontal scale, while most ISSRs are relatively small, indicating that they are significantly affected by microscale dynamics but can also be affected by mesoscale dynamics. Therefore, the spatial window of ±30 s (i.e. ∼ 12 km horizontal scale) was chosen in this work to categorize the two dynamic conditions. Previous airborne observations of cirrus clouds around convective activity (e.g. D'Alessandro et al., 2017) and gravity waves and strong turbulence (e.g. Diao et al., 2015, 2017) showed frequent occurrences of w ≤ −1 m s−1 or ≥ 1 m s−1. In addition, the rest of the observations experiencing smaller updraughts and downdraughts within ±1 m s−1 were defined as vertically quiescent conditions. The observations of cirrus clouds under non-quiescent and vertically quiescent conditions are 52 and 110 h, respectively (Table S1). Global maps and vertical profiles of cirrus cloud observations in vertically quiescent and non-quiescent conditions are depicted in Fig. S1. In addition, clear-sky samples in two environmental conditions at temperatures ≤ −40 °C are shown in Fig. S2. The vertical distributions of IWC, Ni, Di, and the water vapour volume mixing ratio under two environmental conditions are illustrated in Fig. S3. Note that because of the nature of Eulerian-view sampling of research aircraft, this separation of two types of cirrus clouds differs from the previous study that used Lagrangian trajectories of w from model simulations to separate cirrus cloud origins, i.e. convective (liquid-origin) cirrus versus in situ cirrus (Krämer et al., 2016, 2020). For instance, the high vertical velocity condition defined as non-quiescent in this work may indicate convective influences but may also be caused by other dynamic conditions such as gravity waves and strong turbulence. Thus, we did not attempt to provide a one-to-one comparison between the non-quiescent condition in this work and the convective (liquid-origin) cirrus condition in the previous work by Krämer et al. (2016, 2020).
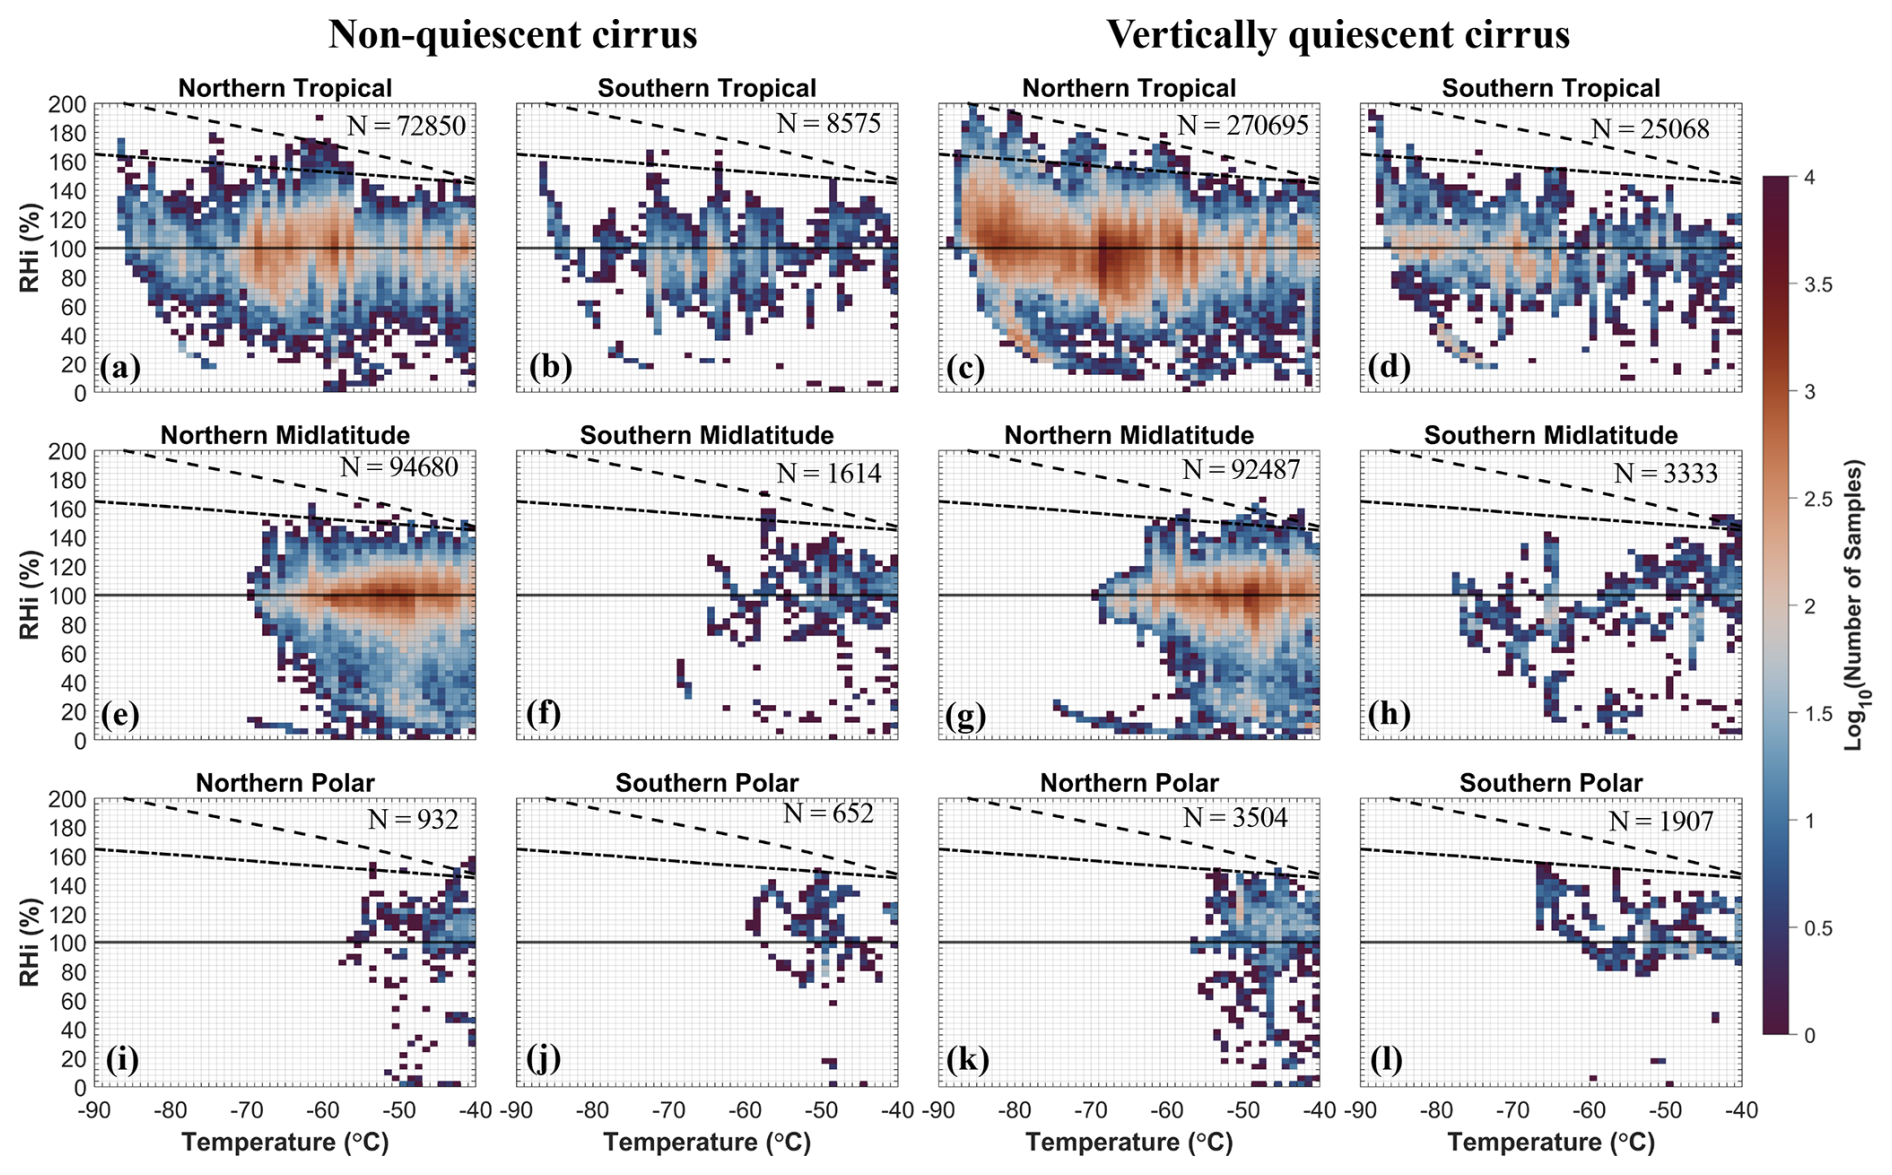
Figure 2Distributions of RHi at various temperatures in six latitudinal bands using the combined NASA and NSF dataset, separated into non-quiescent cirrus (two left columns) and vertically quiescent cirrus (two right columns). Solid black line indicates ice saturation. Dashed black line denotes the liquid saturation threshold. Dash-dotted line represents the homogeneous freezing line based on Koop et al. (2000). Colour bars denote the logarithmic-scale number of samples.
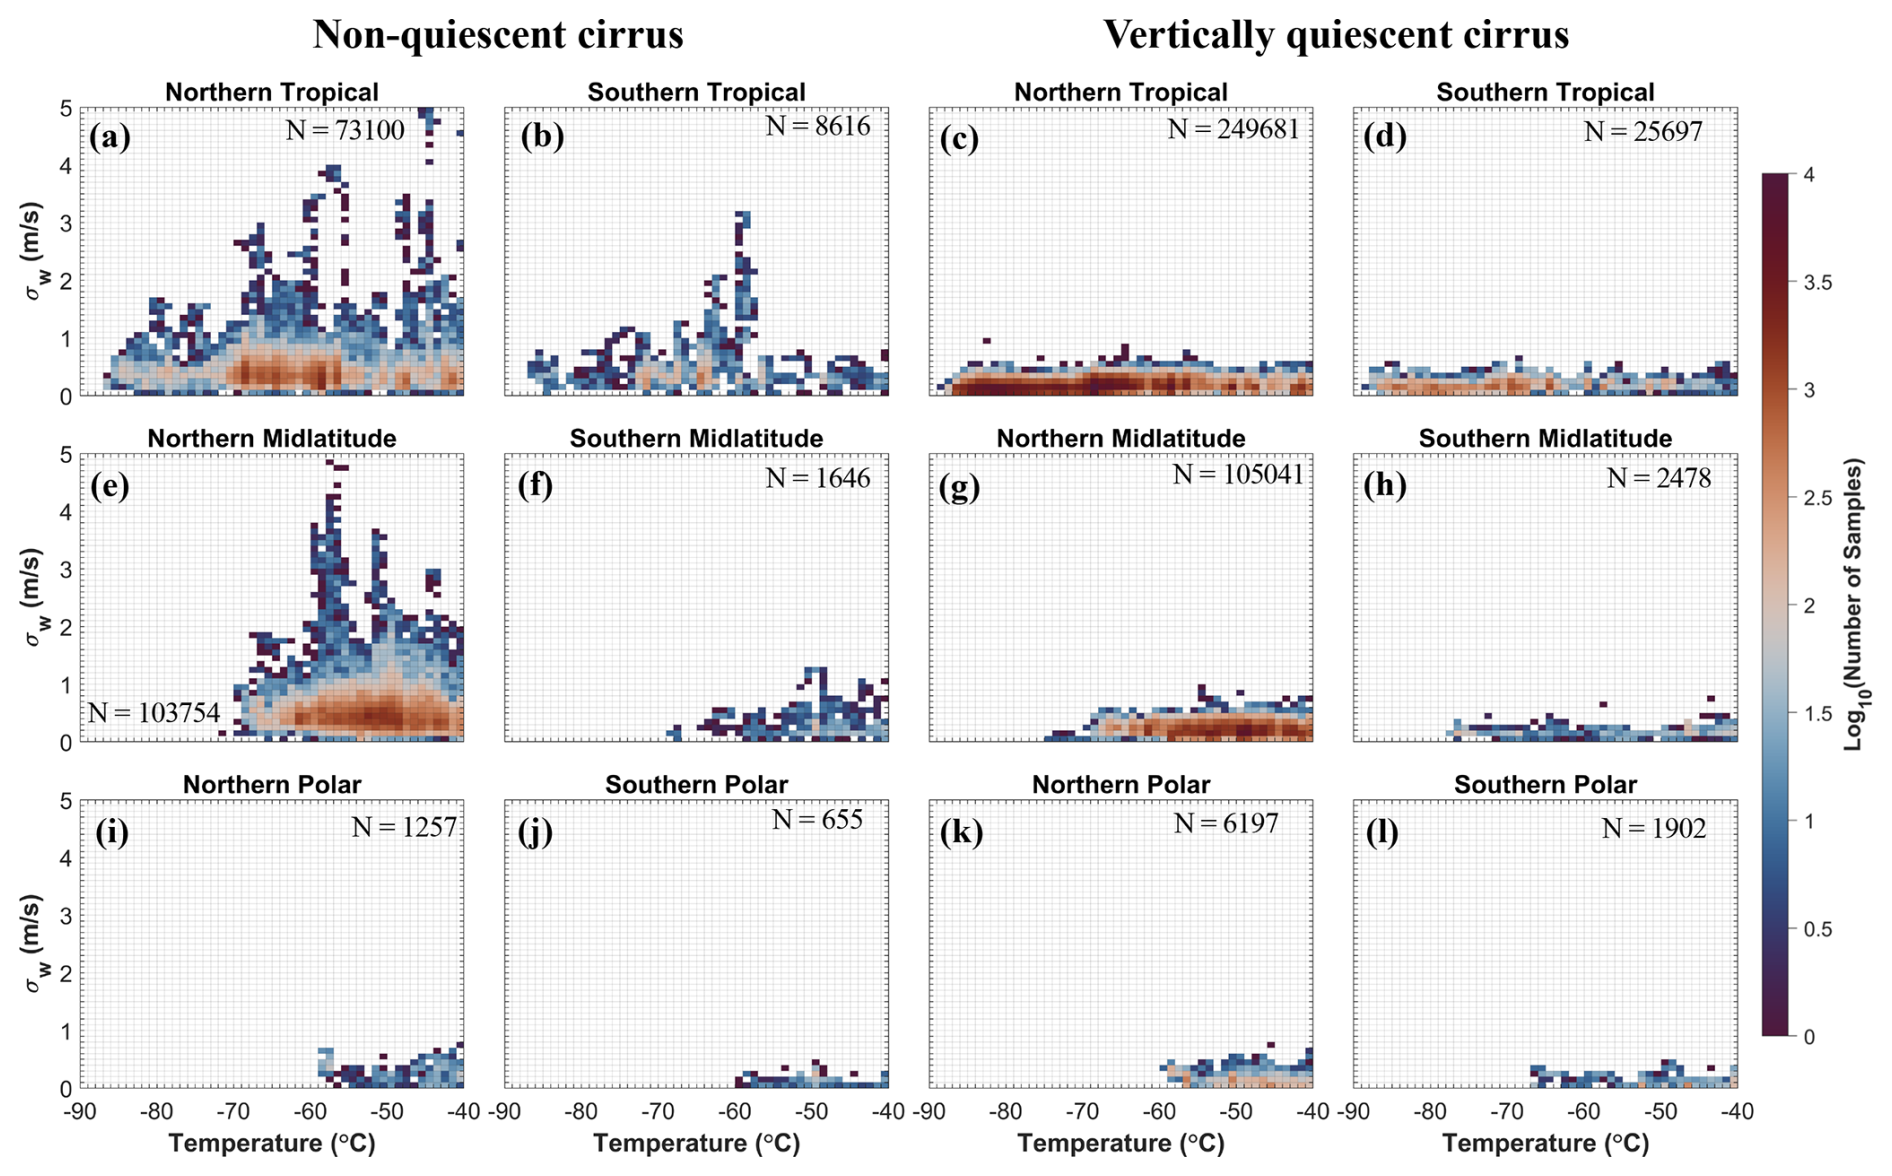
Figure 3Distributions of standard deviations of vertical velocity (σw calculated for 10 km spatial scales) at various temperatures, separated into non-quiescent cirrus (two left columns) and vertically quiescent cirrus (two right columns).
Distributions of 1 Hz observations of RHi as a function of temperature are examined for cirrus clouds under two environmental conditions separately using the combined datasets of the NASA and NSF campaigns (Fig. 2). In addition, the RHi–T distributions for clear-sky conditions under two environmental conditions are shown in Fig. S4. Six latitudinal regions were individually analysed, including the northern tropical (NT) regions, northern midlatitudes (NM), northern polar (NP) regions, southern tropical (ST) regions, southern midlatitudes (SM), and southern polar (SP) regions. The in-cloud conditions show higher frequencies of RHi concentrated within ±20 % around the ice saturation line. On the other hand, clear-sky conditions (Fig. S4) indicate higher variabilities in RHi. Higher frequencies of RHi > 140 % are seen in the tropical regions in both in-cloud and clear-sky conditions, while for the midlatitude and polar regions, the RHi samples are seen below the homogeneous freezing line (e.g. below 140 %), indicating a possible dominant role of heterogeneous freezing based on the available thermodynamic conditions. This result is consistent with the finding of Cziczo et al. (2013) and Patnaude et al. (2021b) for the extratropical regions. More occurrences of RHi exceeding the homogeneous freezing threshold (around 160 % to 190 %) are seen in the NT regions at temperatures below −55 °C in Fig. 2, consistent with the large fluctuations of vertical velocity seen in Fig. 3, indicating that this region is more likely to initiate homogeneous freezing compared with other regions. In addition, these higher RHi values in the NT regions are seen in cirrus clouds under both non-quiescent and vertically quiescent conditions, indicating that homogeneous freezing in the tropics is not only restricted to conditions with stronger updraughts and downdraughts but rather plays an important role for the formation of both types of cirrus clouds.
Similar to Fig. 2, distributions of the standard deviations of w (denoted as σw) are examined against various temperatures for both types of cirrus clouds (Fig. 3). The distributions of σw for clear-sky conditions under the non-quiescent and vertically quiescent conditions are shown in Fig. S5. Here, σw is defined as the standard deviation of w for the 1 Hz observations calculated for every 10 km of aircraft observations. Most of the cirrus clouds in the two conditions show σw within 0.5 m s−1. For the non-quiescent cirrus, the maximum σw values range from 0.5 to 5 m s−1 at various temperatures, which is a wider range compared with the vertically quiescent cirrus at 0.5 to 1 m s−1. Comparing among different regions, the highest σw values are seen in the NT and NM regions, where a few samples of σw are seen to reach a maximum at 4 to 5 m s−1.
Caution should be paid regarding the sampling domains of the field campaigns used in this analysis. Because the aircraft platforms used in these campaigns were not safe for storm penetration or sampling of highly convective conditions, cirrus clouds near the convective core are expected to be under-represented. This under-representation of convective cirrus clouds by aircraft observations was also pointed out by Krämer et al. (2020). In addition, previous studies showed that the higher Ni values were often associated with orographic gravity wave (OGW) cirrus clouds, especially over and downwind of mountain barriers, as seen in aircraft (Krämer et al., 2009) and satellite (e.g. Gryspeerdt et al., 2018; Mitchell et al., 2018) observations. The flight maps in this study (Fig. 1) show limited sampling of such regions, suggesting that the OGW cirrus clouds may be under-sampled. As a result of the under-sampling of convective and OGW cirrus clouds, the impacts of homogeneous freezing may be underestimated, as higher updraughts in these types of cirrus conditions are conducive to higher cooling rates, higher ice supersaturation, and higher frequencies of homogeneous freezing.
3.2 Thermodynamic and dynamical controlling factors on cirrus microphysical properties
Three cirrus microphysical properties (IWC, Ni, and Di) are examined separately for the NASA and NSF flight campaigns at various temperatures in Fig. 4a–c and d–f, respectively. Compared with the NSF campaigns, which sampled the minimum temperature at −78.3 °C, the NASA ATTREX and POSIDON campaigns sampled temperatures as low as −88.2 °C. For both the NASA and NSF campaigns, an increasing trend of average IWC with increasing temperatures is seen, which is consistent with previous observational studies of the IWC–T relationship (e.g. Diao et al., 2014a; Woods et al., 2018; Krämer et al., 2020; Patnaude and Diao, 2020). Both the NASA and NSF datasets show a nonlinear trend of Ni with increasing temperatures. The NSF dataset exhibits median Ni values near 101.5 L−1 or 32 L−1, which is similar to the median Ni in Krämer et al. (2020). Similar to the IWC–T relationship, a positive Di–T relationship is also seen, likely due to faster ice crystal growth under higher water vapour partial pressure and more sedimentation of larger ice crystals into lower altitudes at higher temperatures. The main difference between the NASA and NSF datasets is that the NASA dataset shows higher IWC and higher Ni by an order of magnitude of 0.5, likely due to differences in cirrus microphysical properties at different geographical locations, as previously discussed by Patnaude et al. (2021b).
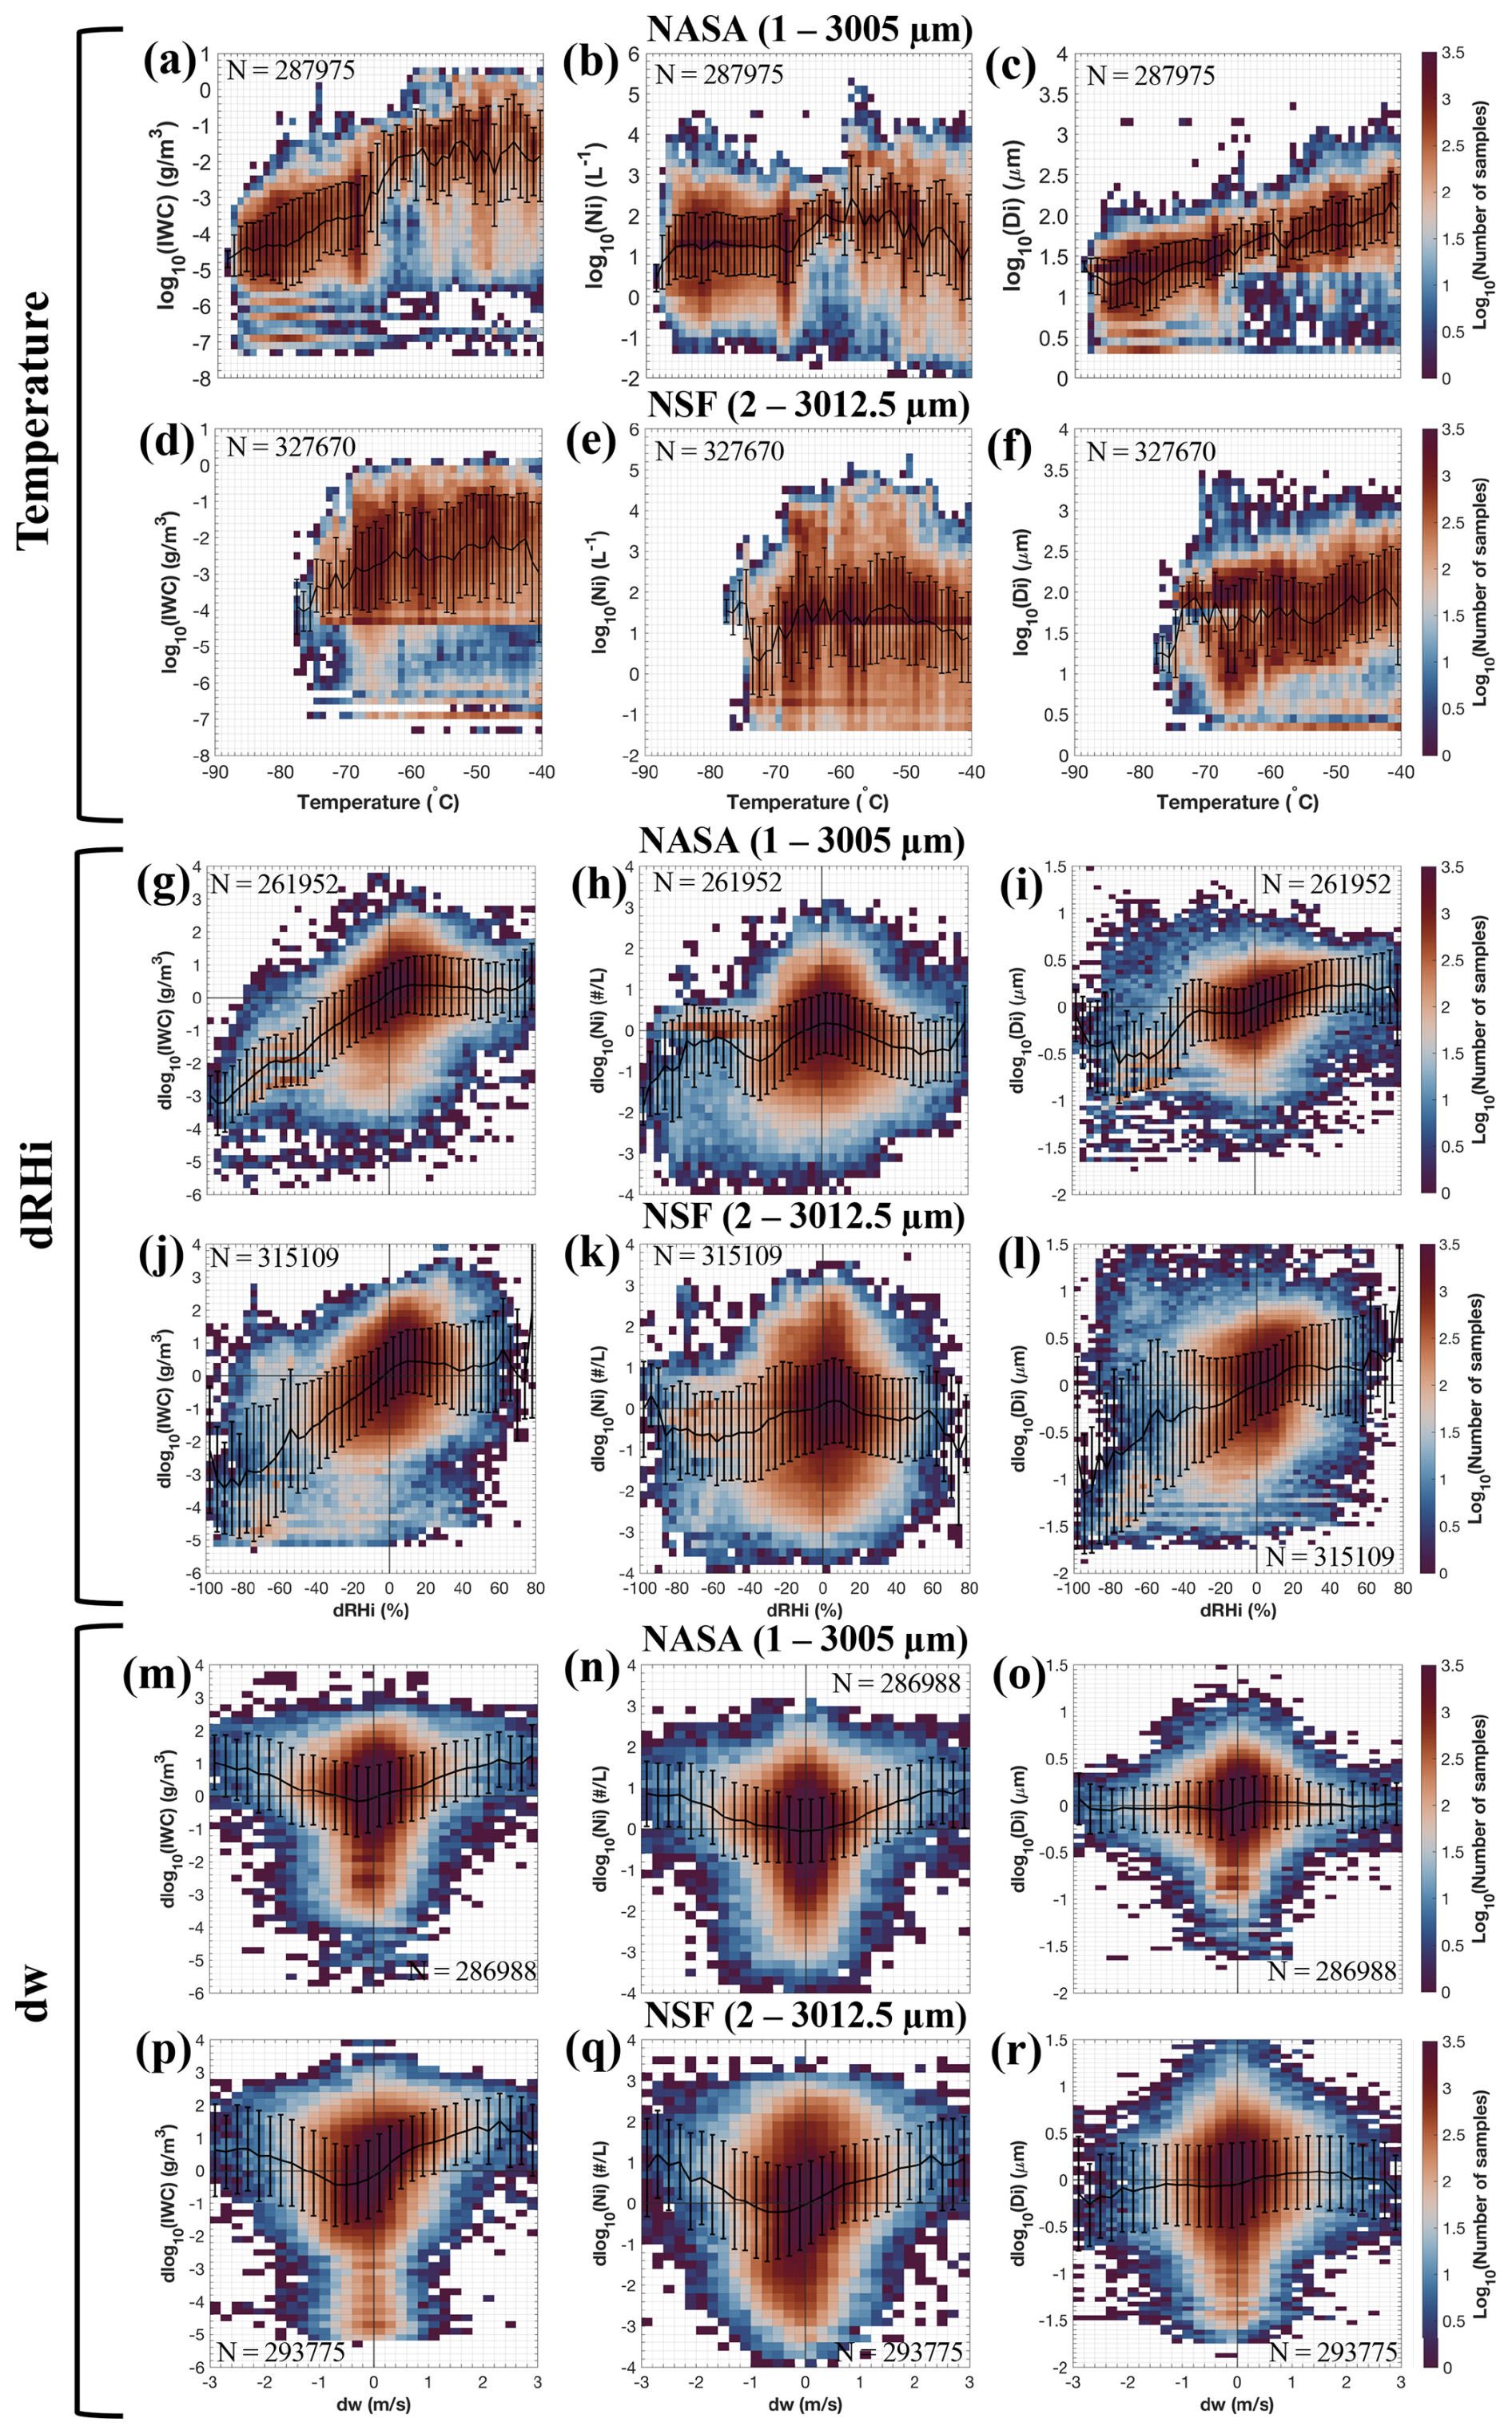
Figure 4(a–f) Distributions of IWC, Ni, and Di as a function of temperature. Relationships between the (g–l) fluctuations of RHi (calculated as dRHi) and (m–r) fluctuations of w (calculated as dw) with respect to the fluctuations of ice microphysical properties. Rows 1, 3, 5 are based on NASA campaigns, and rows 2, 4, 6 are based on NSF campaigns. Black lines and vertical bars denote the geometric means and standard deviations, respectively.
The relationships between the variability of cirrus ice microphysical properties and the variability of thermodynamic and dynamical conditions are further investigated in Fig. 4g–r. A delta-delta method is applied to various factors, similar to the method used in the study of Patnaude and Diao (2020) and Maciel et al. (2023). As described in Sect. 2.2.1, the delta value is calculated by subtracting the average value of a certain variable in each 1 °C temperature bin from every 1 s datum, which removes the average increasing or decreasing trend of a variable as a function of temperature. In addition, the average values of each 1 °C temperature bin are separately calculated for individual campaigns. Subtracting these campaign-specific average values from each 1 Hz datum further reduces the impacts of geographical locations and different measurement platforms on the delta variables.
When examining the relationships of fluctuations of IWC, Ni, and Di (i.e. dlog 10IWC, dlog 10Ni, and dlog 10Di, respectively) with respect to the fluctuations of temperature, RHi, and w (i.e. dT, dRHi, and dw, respectively), the observed relationships are much more similar between the NASA and NSF datasets, which is reflected by the similar increasing or decreasing trends and similar ranges of delta values at various conditions between the two datasets. For example, both the NASA and NSF datasets show a peak of dlog 10IWC and dlog 10Ni at dRHi slightly above 0 % (i.e. dRHi of 10 %–20 %). This result is consistent with that seen in Patnaude and Diao (2020), suggesting that the highest IWC and Ni may be reached shortly before all the ice supersaturation has been depleted through new ice particle formation and/or ice crystal growth. The decreasing trend of dlog 10IWC, dlog 10Ni, and dlog 10Di with decreasing dRHi is also consistent with the previous studies of Diao et al. (2013, 2014b), which showed a decreasing trend of IWC, Ni, and Di with decreasing RHi during the sedimentation phase of cirrus cloud evolution.
As for the relationship with vertical velocity fluctuations, the maximum dlog 10IWC and dlog 10Ni are seen at the strongest updraughts and downdraughts, while the minimum dlog 10IWC and dlog 10Ni are seen associated with weak downdraughts (i.e. dw around −0.25 to −0.75 m s−1). This result indicates that large updraughts, which often are in close proximity to large downdraughts during turbulence and gravity waves (e.g. Diao et al., 2017), may provide sustained ice supersaturated conditions and therefore lead to the continuous formation of new ice particles. As for dlog 10Di values, they reach maximum values when dRHi is around 20 % to 60 % but remain relatively constant under various dw values.
3.3 Effects of aerosols on cirrus microphysical properties
The influences of aerosols on cirrus microphysical properties are investigated in Fig. 5, which uses the delta-delta method similar to Fig. 4. Three types of datasets are examined – NASA only (rows 1 and 4), NSF only (rows 2 and 5), and the combined NASA + NSF dataset (rows 3 and 6). The ACI is separately examined for larger and smaller aerosols, i.e. Na500 and Na100, which correspond to aerosol number concentrations when the aerosol diameter is greater than 500 and 100 nm (but less than 1000 nm), respectively. Understanding the correlations of aerosols with cirrus microphysical properties can give clues to the two main ice nucleation mechanisms. Previously, aerosols larger than 500 nm were used as a proxy for INPs when the direct measurements of INP were not available (DeMott et al., 2010). Note that due to the limitations of former INP measurement techniques, that study focused on temperatures higher than −30 °C instead of the cirrus cloud regime (i.e. ≤ −40 °C). Other studies using the particle analysis by laser mass spectrometry (PALMS) instrument showed that particles with diameters > 500 nm are dominated by dust particles and nonvolatile sea-salt for number and mass concentrations (Murphy et al., 2019; Froyd et al., 2019). Both dust (e.g. Hoose and Möhler, 2012; Roesch et al., 2021) and sea salt (e.g. Patnaude et al., 2021a, 2024) have been previously reported to initiate heterogeneous freezing as INPs, which supports the speculation that Na500 may be used as a proxy for INP number concentrations.
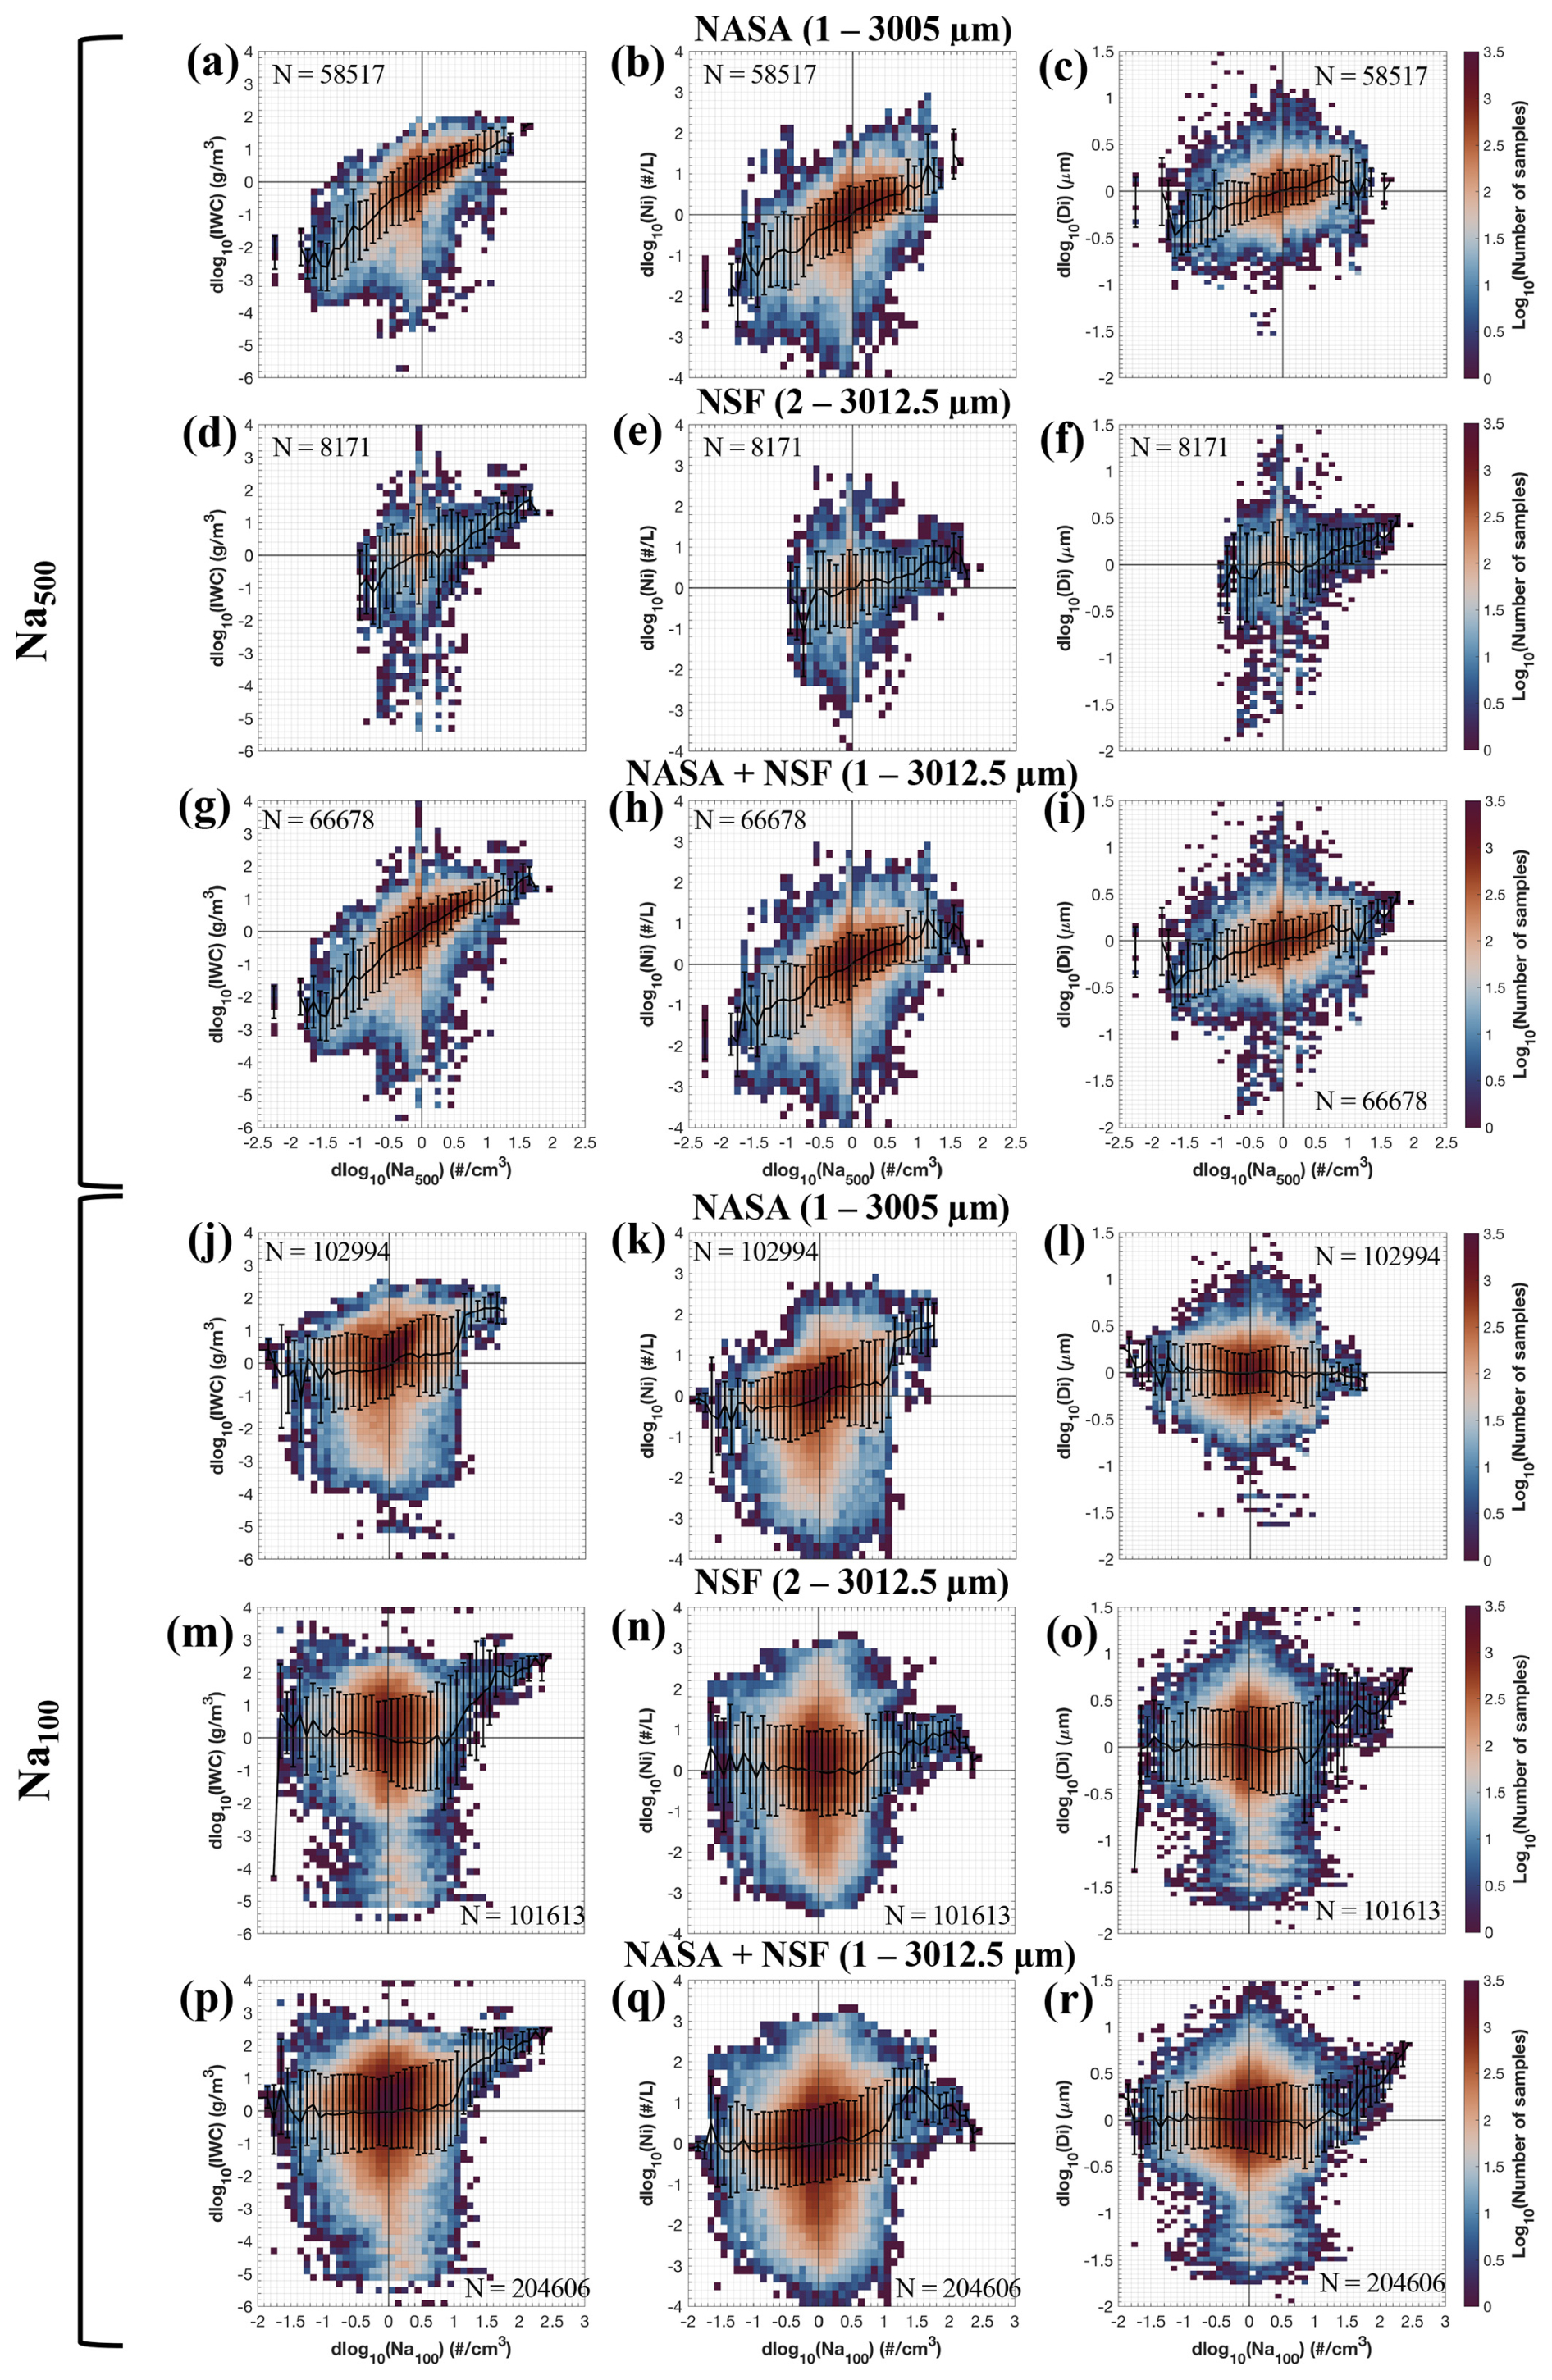
Figure 5Similar to Fig. 4 but for relationships of fluctuations of cirrus properties (i.e. dlog 10IWC, dlog 10Ni, and dlog 10Di) with respect to dlog 10(Na500) in the top three rows and dlog 10(Na100) in the bottom three rows. Rows 1 and 4 are based on NASA campaigns, rows 2 and 5 are NSF campaigns, and rows 3 and 6 are the combined NASA + NSF campaigns.
For the ACIs of larger aerosols, a nearly linear positive correlation is seen in three cirrus microphysical properties (i.e. dlog 10IWC, dlog 10Ni, and dlog 10Di) in relation to dlog 10Na500. The smaller aerosols show nonlinear correlations with cirrus microphysical properties, as illustrated by the significant increases in dlog 10IWC and dlog 10Ni values when dlog 10Na100 exceeds 1. That is, when dlog 10Na100 values are significantly above (by a factor of 10) the average values of a 1° temperature bin, significant impacts on cirrus microphysical properties are seen. This nonlinearity with Na100 may suggest a nucleation mechanism shift from homogeneous freezing to heterogeneous freezing at higher Na100. The higher Na100 may be associated with either higher concentrations of INPs or more effective INPs (or both), as a positive correlation between Na100 and Na500 was found (not shown). However, without direct INP measurements and aerosol composition measurements at the cirrus cloud levels in these former campaigns, one cannot rule out one possibility or the other.
Even though no evidence was found regarding possible artefacts of in-cloud aerosol measurements (as discussed in Sect. 2.1), we investigate the ACI relationships based on clear-sky aerosol number concentrations (Na) to further verify whether the observed ACIs would still be seen when using coarser-scale Na for clear-sky conditions only. Specifically, for each centre second, only the clear-sky segments of the surrounding 100 s are used for the calculation of clear-sky Na500 (or Na100) values. In addition, at least 10 % of the 100 s have to be clear sky and all 100 s must be ≤ −40 °C. If either of these two criteria are not satisfied, this second would be assigned NAN for the clear-sky Na value. Figure S6 shows similar positive relationships of IWC and Ni with respect to clear-sky Na500 and Na100 compared with Fig. 5, indicating that the observed ACI relationships are consistently seen regardless of using aerosol information at finer or coarser resolution and under in-cloud or clear-sky conditions. One main difference between Fig. S6 and Fig. 5 is that Fig. S6 shows fewer Na with very high or low values, due to the averaging process for the clear-sky Na calculation. This averaging process may also lead to less significant increases in IWC, Ni, and Di with respect to Na100 in Fig. S6, as the very high Na100 values are smoothed out.
In addition, when examining the distributions of Na500 at in-cloud conditions, the occurrences of large aerosols are seen at various Ni and Di ranges (Fig. S7a and b), suggesting that large aerosols are not solely observed when large or small ice crystals are available. In the Ni–Di relationship shown for the NASA SEAC4RS campaign (Fig. S7a), a group of samples was observed at relatively lower Di (∼ 10 µm) and higher Ni (100–104 L−1), with very few occurrences of large aerosols. This feature indicates possible influences of homogeneous freezing on the formation of these particles. A similar feature of high Ni and low Di values was also reported by a remote sensing study (Mitchell and Garnier, 2024). To further examine the likelihood of ice shattering affecting Na500 values, number concentrations of small ice particles (i.e. Ni_1–3 µm) and standard deviations of particle size distributions (σDi) are used to indicate the possible occurrences of ice shattering. Figure S7c shows the number of samples of Ni_1–3 µm > 0 regardless of the existence of aerosols, and Fig. S7d shows the ratio between the number of samples for incidents with possible shattering and the total samples with large aerosols. The results show that a small fraction (< 10 %) of the in-cloud Na500 samples have indicators of shattering (not definitive proof that shattering actually occurred). When comparing Na500 against Ni_1–3 µm values along time series (not shown), their ratios are generally larger than 30, indicating relatively small effects on Na500 even if shattering occurred.
In addition to a possible homogeneous freezing feature seen in Fig. S7, a time series example of NSF DC3 RF20 (Fig. S8) illustrates a possible heterogeneous freezing feature. That is, during this horizontal segment within −46 to −45 °C, Na100 data show higher values inside the cirrus segment compared with the adjacent clear-sky samples, while the Na500 data show lower values at the in-cloud condition. This feature indicates that heterogeneous freezing may have activated some of the large aerosols as INPs and formed ice crystals inside the cirrus segment.
These main features of ACIs from larger and smaller aerosols are consistently seen for the three datasets, i.e. NASA campaigns, NSF campaigns, and the combined NASA + NSF campaigns. Therefore, for the following analyses, the combined NASA + NSF datasets (i.e. 1–3012.5 µm) are used in the quantitative analyses based on linear regressions (Fig. 6) and ML models (Figs. 7–10 and Tables 2 and 3).
3.4 Quantifications of ACIs based on linear regressions
The effects of aerosols on cirrus microphysics are further quantified through linear regressions between the fluctuations of cirrus properties and the fluctuations in aerosol number concentrations in Fig. 6 for the combined NASA + NSF dataset. The ACI is individually quantified for different thermodynamic and dynamical conditions, including various ranges of temperatures from −40 to −70 °C, dRHi from below −10 % to above 10 %, and dw from below −0.5 m s−1 to above 0.5 m s−1. Geometric means of dlog 10IWC, dlog 10Ni, and dlog 10Di are calculated for each bin of dlog 10Na500 or dlog 10Na100. All information regarding slopes, intercepts, and their standard deviations for all linear regressions shown in Fig. 6 is given in Table S3.
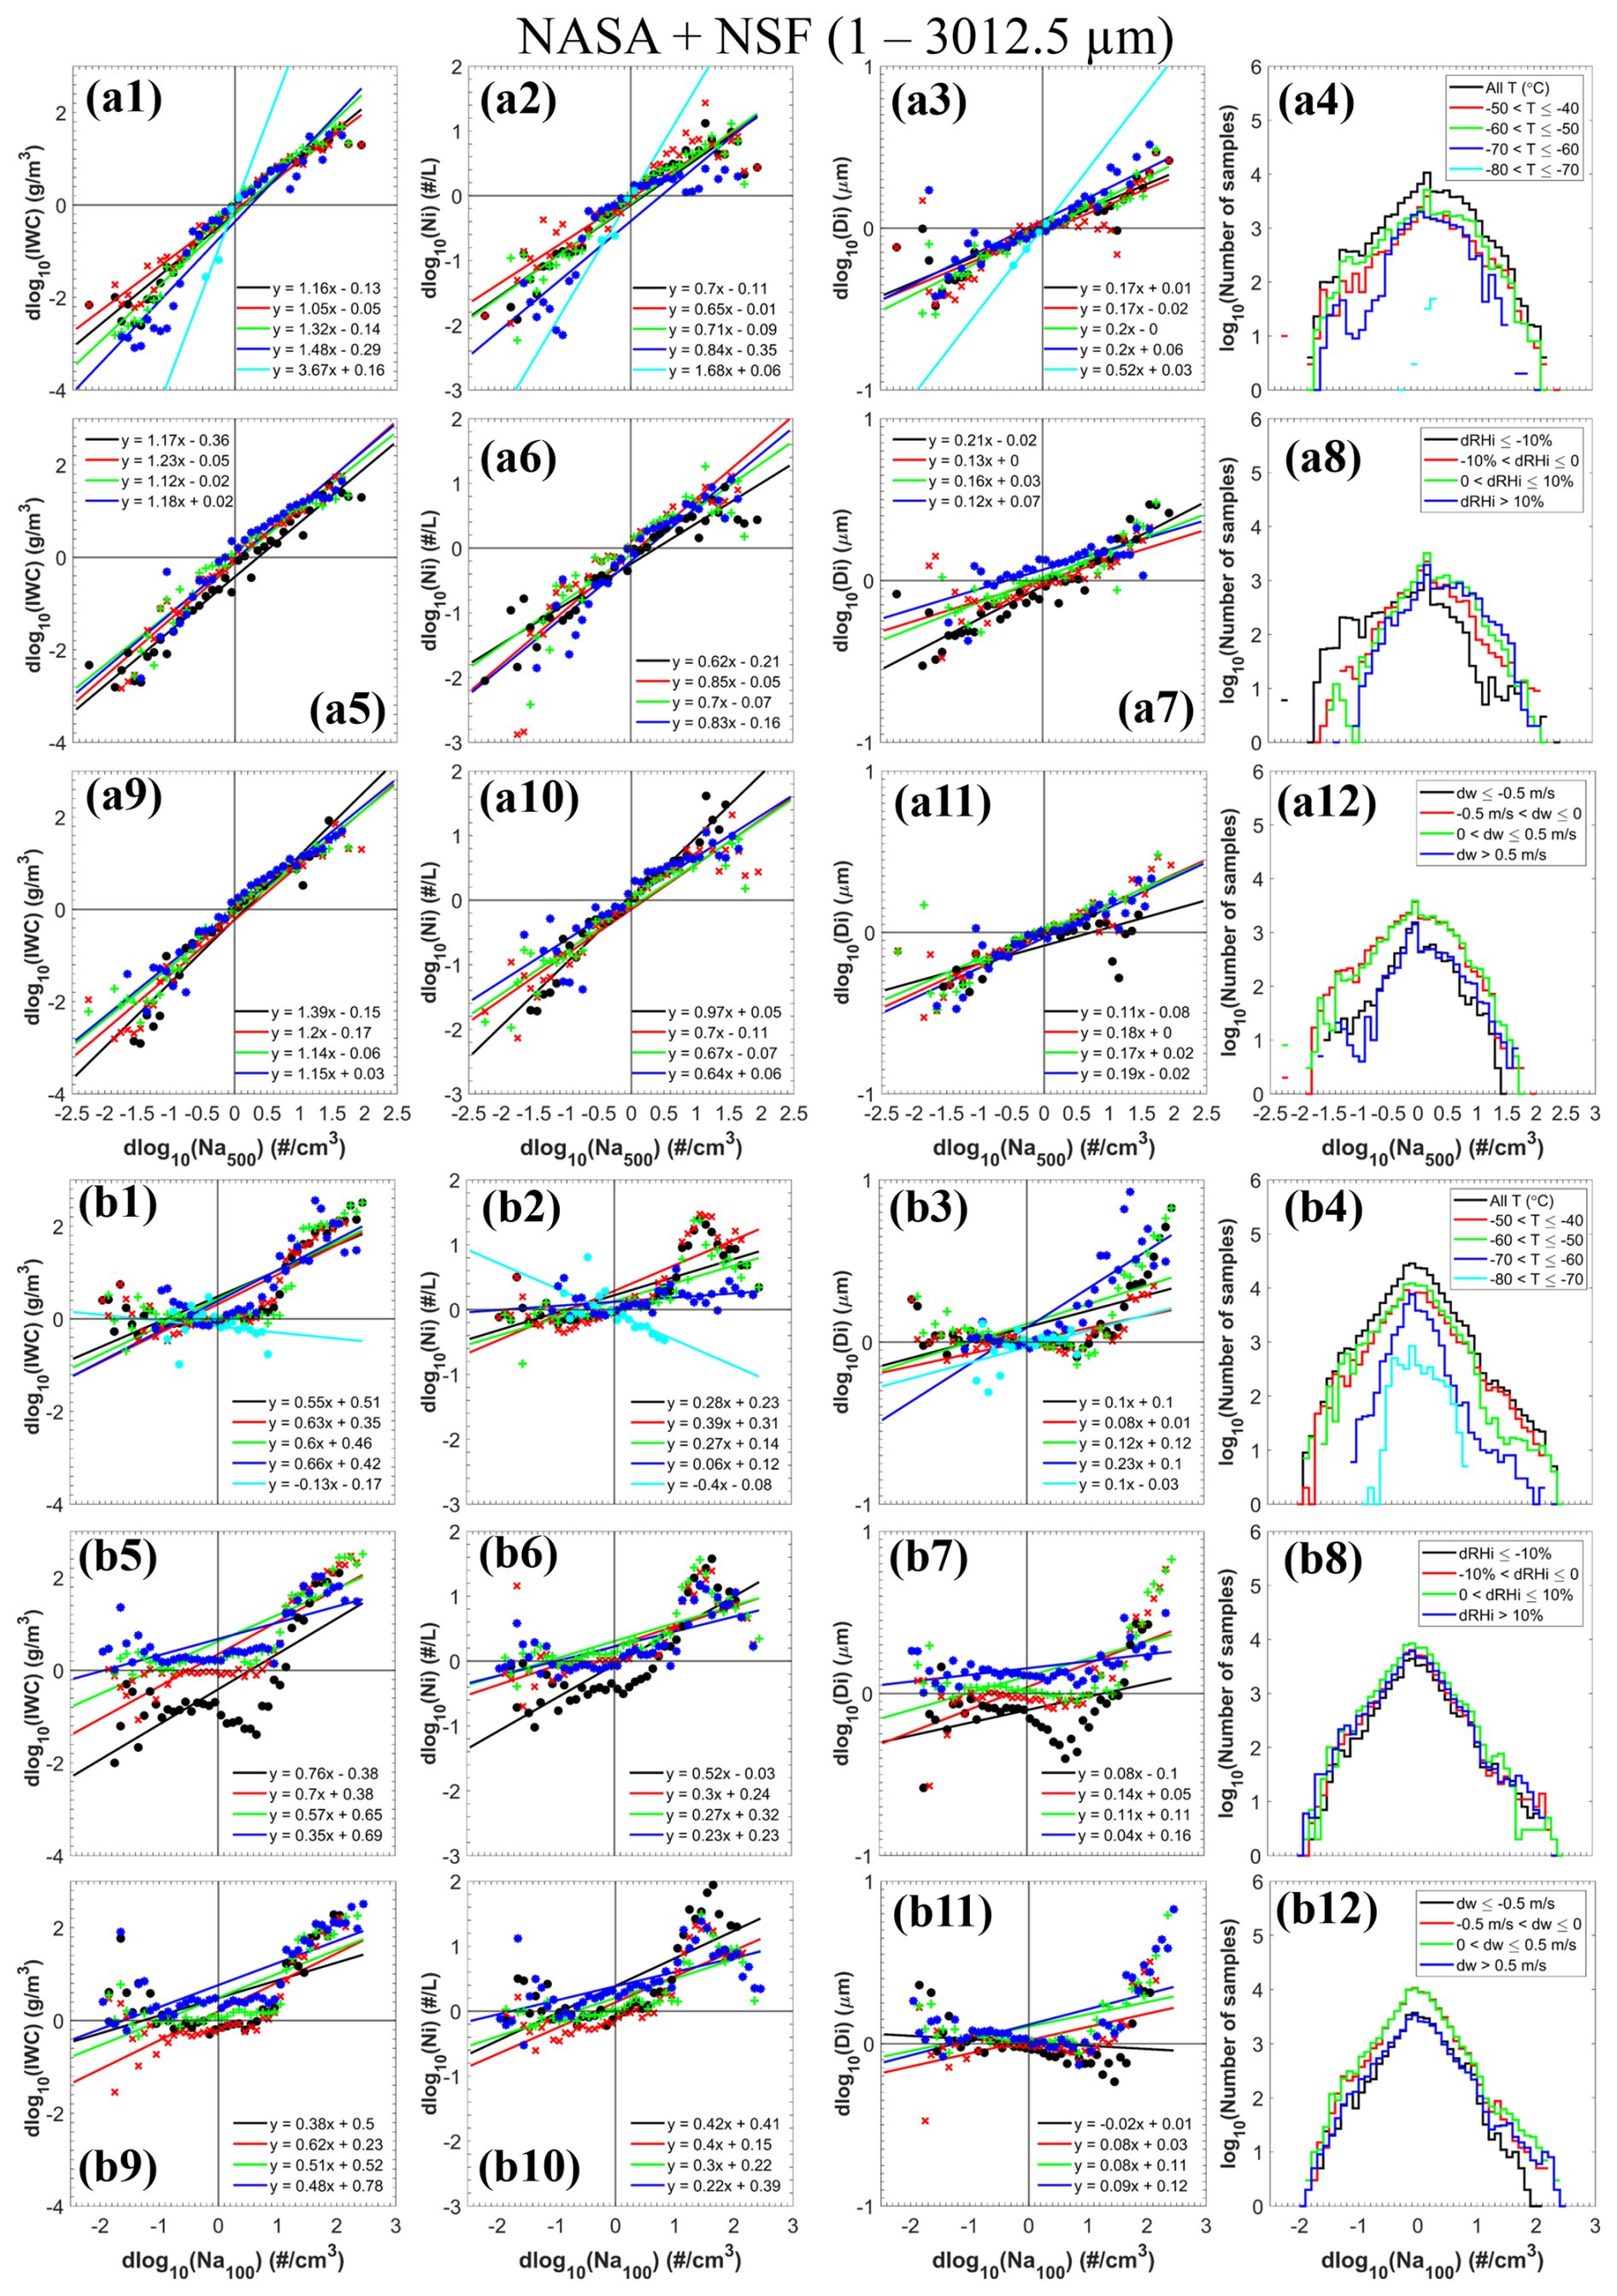
Figure 6Linear regressions quantifying the correlations of dlog 10IWC, dlog 10Ni, and dlog 10Di with respect to dlog 10(Na500) in the top three rows and dlog 10(Na500) in the bottom three rows. The analyses in Figs. 6–10 use the combined NASA + NSF datasets (1–3012.5 µm). ACIs are examined for various ranges of temperature (in rows 1 and 4), dRHi (in rows 2 and 5), and dw (in rows 3 and 6). Coloured dots represent the geometric means of ice microphysical properties in each Na bin. Slope and intercept values are shown in the legend. The last column represents the distributions of the number of samples.
Positive correlations are seen for both dlog 10Na500 and dlog 10Na100 at various temperature, dRHi, and dw ranges, except for the lowest temperature range of −80 to −70 °C, where significantly fewer samples are seen (Fig. 6b1, b2). In addition, for every range, larger positive slope values are seen in relation to dlog 10Na500 compared with dlog 10Na100, indicating stronger ACIs from the larger aerosols on three microphysical properties. In addition, when comparing among different ranges of dRHi and dw, the variabilities among the slope and intercept values for these different linear regressions with respect to larger aerosols (Fig. 6a5–a7, a9–a11) are smaller than those seen with respect to smaller aerosols (Fig. 6b5–b7, b9–b11). These results suggest that with the availability of potential INPs (using larger aerosols as an indicator), ice nucleation is less dependent upon thermodynamic and dynamic factors such as the magnitudes of RHi and the strength of updraughts. On the other hand, for smaller aerosols, activating ice nucleation has higher requirements for the appropriate thermodynamic and dynamic conditions. For the ACIs of smaller aerosols, such dependence upon thermodynamic and dynamic conditions is even stronger when relatively fewer aerosols are available, as shown by the large separation between the geometric mean of cirrus cloud properties at the lower values of dlog 10Na100. That is, when dlog 10Na100 < 0, the dlog 10IWC and dlog 10Ni values are 1–2 orders of magnitude higher at higher dRHi (i.e. dRHi > 10 %) compared with those at lower dRHi (≤ 10 %) and 0.5–1 orders of magnitude higher at stronger updraught or downdraught (i.e. dw > 0.5 or ≤ −0.5 m s−1) compared with those with weaker updraught and downdraught (i.e. dw within ±0.5 m s−1). The dlog 10Di values are also higher by a factor of 2–3 at these higher dRHi and dw ranges. As dlog 10Na100 increases, the cirrus properties converge to similar values, indicating that higher concentrations of smaller aerosols may also associate with higher INP number concentrations, thereby lowering the requirements of the high RHi and w thresholds. This result also corroborates the speculation on the association between high Na100 and INP number concentrations discussed in Sect. 3.3.
Similar to Sect. 3.3, clear-sky Na values are investigated for their correlations with ice microphysical properties. Linear regressions using clear-sky Na500 and Na100 are shown in Fig. S9. Figure S9 shows similar positive correlations compared with Fig. 6 for almost all IWC and Ni panels, except for the lower temperature ranges for small aerosols (Fig. 6b1 and b2) possibly due to fewer samples. One main difference is that Fig. S9 shows no clear trend for Di–Na relationships compared with Fig. 6, which is likely due to the lack of high Na values as a result of the averaging process for clear-sky Na calculations.
A sensitivity test is also conducted using various IWC thresholds to define in-cloud conditions, i.e. IWC > 10−5, > 10−4, and > 10−3 g m−3 in Figs. S10–S12, respectively. The slope values of the linear regressions show almost all positive values for the correlations of IWC, Ni, and Di with respect to Na500 and Na100, except for the lower temperature ranges (−80 to −60 °C in panels b1 and b2 of Figs. S10–S12), where negative correlations with Na100 are seen. This exception is likely caused by higher IWC thresholds significantly reducing the in-cloud sample size at lower temperatures, as seen in the last column of those figures.
3.5 Using machine learning (ML) models to quantify and compare thermodynamic and dynamic effects and aerosol effects on cirrus clouds
Three experiments are designed to quantify the contributions of various factors to cirrus cloud occurrence and the subsequent microphysical properties. ML models are designed to directly compare the contributions from temperature, RHi, w, Na500, and Na100. The three ML tests in this section will be referred to as Tests A, B, and C. These three tests address the three scientific questions described in Sect. 3.2. That is, Test A examines the key factors contributing to the occurrence of cirrus clouds; Test B examines the key factors contributing to whether cirrus clouds are formed with higher and lower IWC values; and Test C examines the key factors contributing to the full range of magnitudes of IWC as a function of temperature, RHi, and w. For this section, all the ML-based analyses use the combined NASA + NSF dataset, but the NSF START08, NASA ATTREX, and NASA POSIDON campaigns are not included due to the lack of aerosol measurements. A similar sensitivity test that focuses on these three campaigns using the T, RHi, and w predictors only (i.e. no aerosol predictors) is shown in Table S4. Similar results are seen compared with those in Table 2.
Test A trains the ML models to differentiate between clear-sky conditions and cirrus clouds. Because the prediction is for binary conditions (i.e. in-cloud versus out-of-cloud), Test A utilizes a binary ensemble classification algorithm for the ML models. The results are analysed based on an accuracy scale of 0 %–100 % to account for the percentage of 1 s samples being accurately predicted for its clear-sky or in-cloud condition. Individual factors (e.g. T, RHi, w, Na500, and Na100), as well as the entire set of combinations of these factors, are used as predictors in the ML models to examine which sets of variables provide more accurate predictions. Figure 7 shows six sets of predictors, including T, T + RHi, T + w, T + RHi + w, T + RHi + w + Na500, and T + RHi + w + Na100. The prediction results of the complete sets of predictors are shown in Table 2.
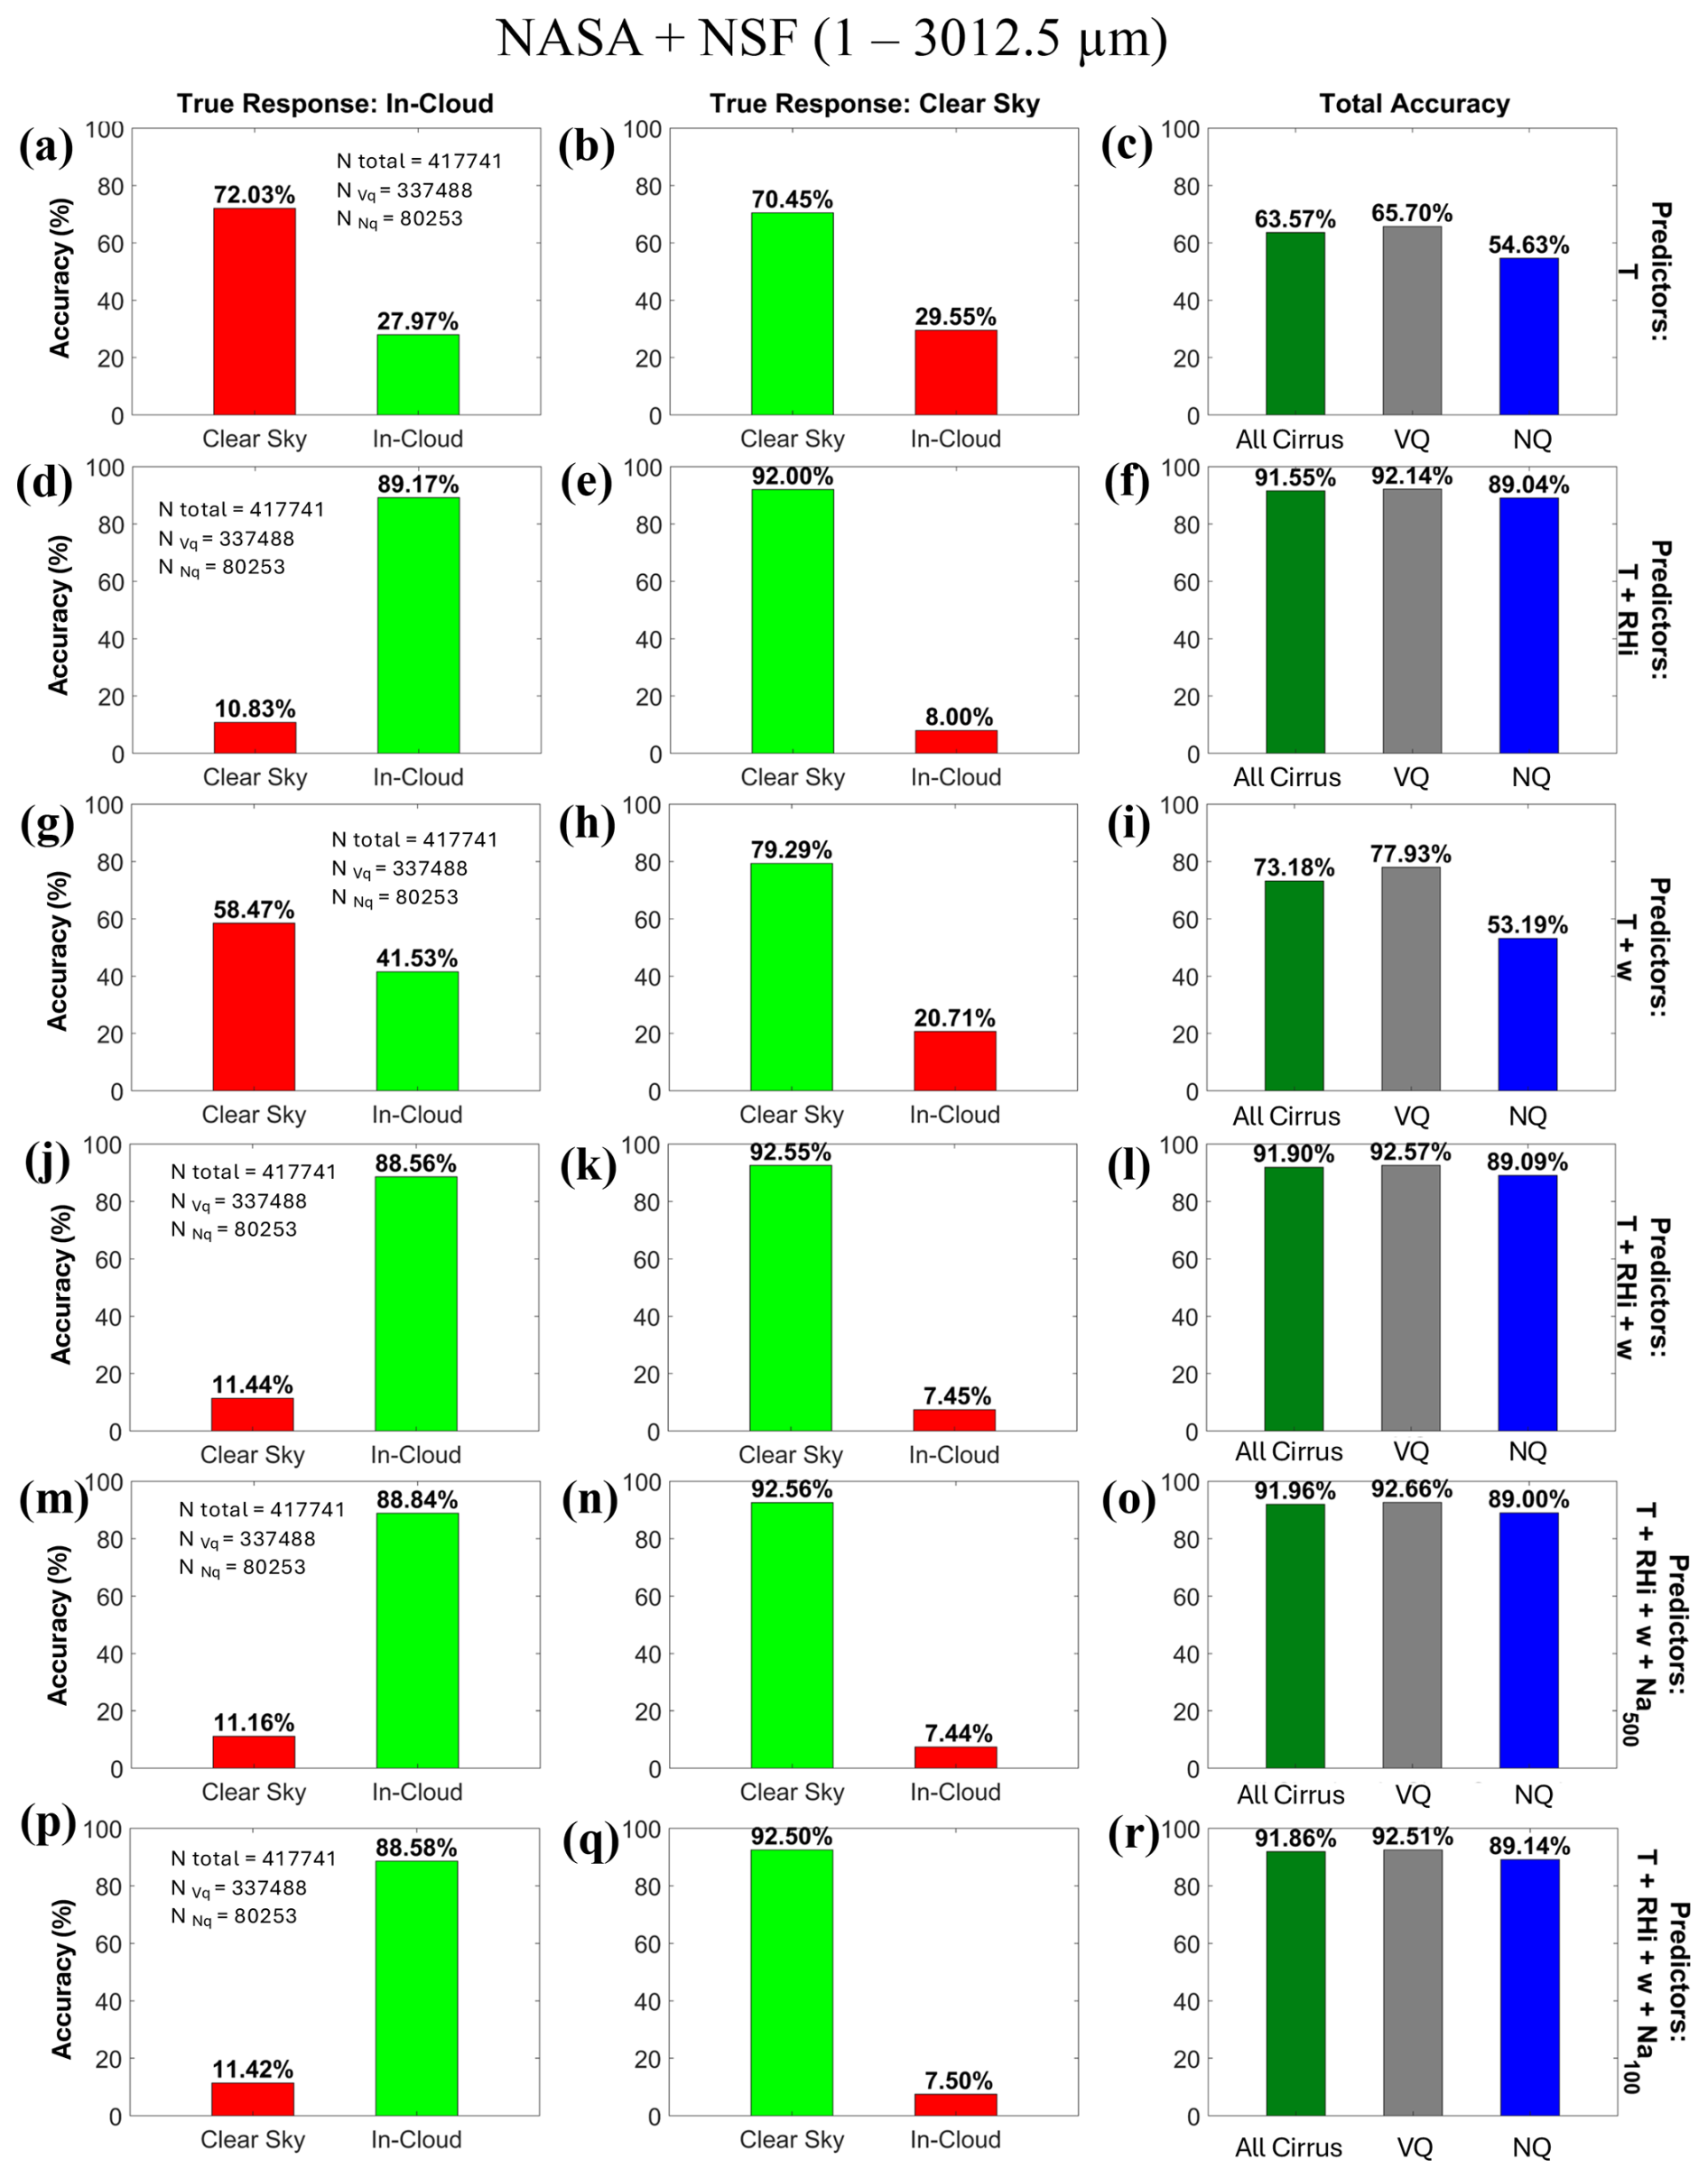
Figure 7Prediction accuracies (in %) of Test A, namely, using ML models to predict the binary condition of in-cloud or out-of-cloud for temperatures ≤ −40 °C. Columns 1 and 2 show the accuracies for predicting observed in-cloud and observed clear-sky conditions, respectively. Red and green indicate false and correct predictions, respectively. Column 3 shows the predication of three types of cirrus clouds – all cirrus, vertically quiescent (VQ) cirrus, and non-quiescent (NQ) cirrus. The set of predictors used in each test is labelled on the right-hand side of each row. ML predictions using T, RHi, and w are based on all 12 campaigns, while ATTREX and POSIDON are not included in the bottom two rows due to the lack of aerosol measurements.
The results show that when using temperature solely as a predictor, 63.57 % accuracy is seen for all cirrus clouds, while 65.70 % and 54.63 % accuracies are seen for vertically quiescent cirrus and non-quiescent cirrus, respectively. This outcome indicates that when only providing temperature as the sole predictor, the chances of predicting cirrus occurrence is close to a random guess (i.e. 50 %). Besides the temperature predictor, other factors are added incrementally to examine the added values of these predictors. Among all of them, RHi is found to be most effective for enhancing the prediction accuracy. The three types of cirrus – all cirrus, vertically quiescent cirrus, and non-quiescent cirrus – show accuracies of 91.55 %, 92.14 %, and 89.04 %, respectively, when T + RHi predictors are used. Therefore, providing the additional information of RHi enhances the prediction from the baseline T predictor by ∼ 26 % to 34 %. Comparatively, smaller increases in accuracies (by ∼ 10 % to 12%) are seen when T + w are used for all the cirrus and vertically quiescent cirrus types, which show accuracies of 73.18 % and 77.93 %, respectively. Even lower accuracy (53.19 %) of predicting the occurrences of non-quiescent cirrus clouds is seen by using the T + w predictors compared with using just the T predictor (54.63 %), likely caused by the pre-selection of dynamical conditions, which requires the existence of strong updraughts and downdraughts in the adjacent environments. That restriction already pre-selected the more favourable w conditions and therefore made the w factor less effective for enhancing the prediction accuracy any further.
When adding the predictors of aerosol information, the accuracies increase by a small amount (∼ 0.1 %–0.2 %) compared with using T + RHi + w, which are 92.06 %, 92.74 %, and 89.20 % when using T + RHi + w + Na500 + Na100 for the three types of cirrus clouds, respectively. Such increases in accuracy verify that aerosols do make a difference on the occurrence of cirrus clouds. Comparing between the larger and smaller aerosols, the differences in accuracy by using them as predictors are not very significant, which is within 0.1 %.
Table 2 shows more combinations of predictor variables, totalling to 31 sets of combinations. Using more predictors generally provides better results than using fewer predictors. All the tests that include RHi as a predictor have consistently high accuracies exceeding 91 %, which show that RHi is consistently the most important factor among all five variables. Compared with RHi, w plays a less important role in improving predictions of cirrus cloud occurrence regardless of being used as a single predictor or combined with other predictors. This result is likely caused by the fact that both water vapour concentrations and w contribute to cooling rates that further control RHi magnitude, indicating that having an accurate representation of available water vapour concentrations is important in addition to the representation of dynamical conditions. Using Na500 as a single predictor also shows a high accuracy of 84 % for all cirrus clouds, but the accuracy decreases to 72 % when using T + Na500. This result likely occurs because, when using only Na500, the ML model focuses on a small number of samples with non-zero values of Na500 for predicting in-cloud conditions, while after adding the T predictor, the ML model would need to predict cirrus occurrences using many T samples without Na500 information (i.e. Na500 = 0). To further verify if the effect of RHi ultimately represents influences from both the water vapour volume mixing ratio (q) and temperature, another series of ML tests similar to Test A were conducted by using q as the predictor (Table S5). The result shows that having q as the single predictor has lower accuracy (76 %) than RHi (91 %), while using T + q has a similar accuracy (91 %) to RHi. Because of the frequent usage of RHi in model parameterizations of ice cloud macro- and microphysical properties (e.g. Gettelman and Kinnison, 2007; Tompkins et al., 2007), RHi is used for the rest of the ML analyses in the main paper.
Test B is designed to examine what factors are more influential for the prediction of a cirrus cloud containing higher or lower IWC compared with the average conditions (Fig. 8). Only in-cloud conditions are used for Test B. Here, the predictors are calculated in terms of delta values, which are fluctuations relative to the average values of every 1° temperature bin. Similar to Test A, a binary ensemble classification algorithm is used for Test B, predicting whether IWC is higher or lower than the average IWC in each 1° temperature bin (i.e. dlog 10IWC > 0 or < 0). Comparing the respective rows between Figs. 8 and 7, the accuracies for each set of predictors for predicting dlog 10IWC > 0 or < 0 (Fig. 8) are lower than the accuracies for predicting the in-cloud or out-of-cloud conditions (Fig. 7). In fact, the accuracy of predicting the fluctuations of IWC does not exceed 86 % in any of the tests. This is likely due to the large variabilities of IWC in cirrus clouds, which can be several orders of magnitude different even within the same cirrus cloud layer. In addition, ice particle growth and the formation of new ice particles all contribute to the variations in IWC, which require the understanding of the entire evolution of cirrus clouds and the accumulative history of environmental factors that the air parcel experienced.
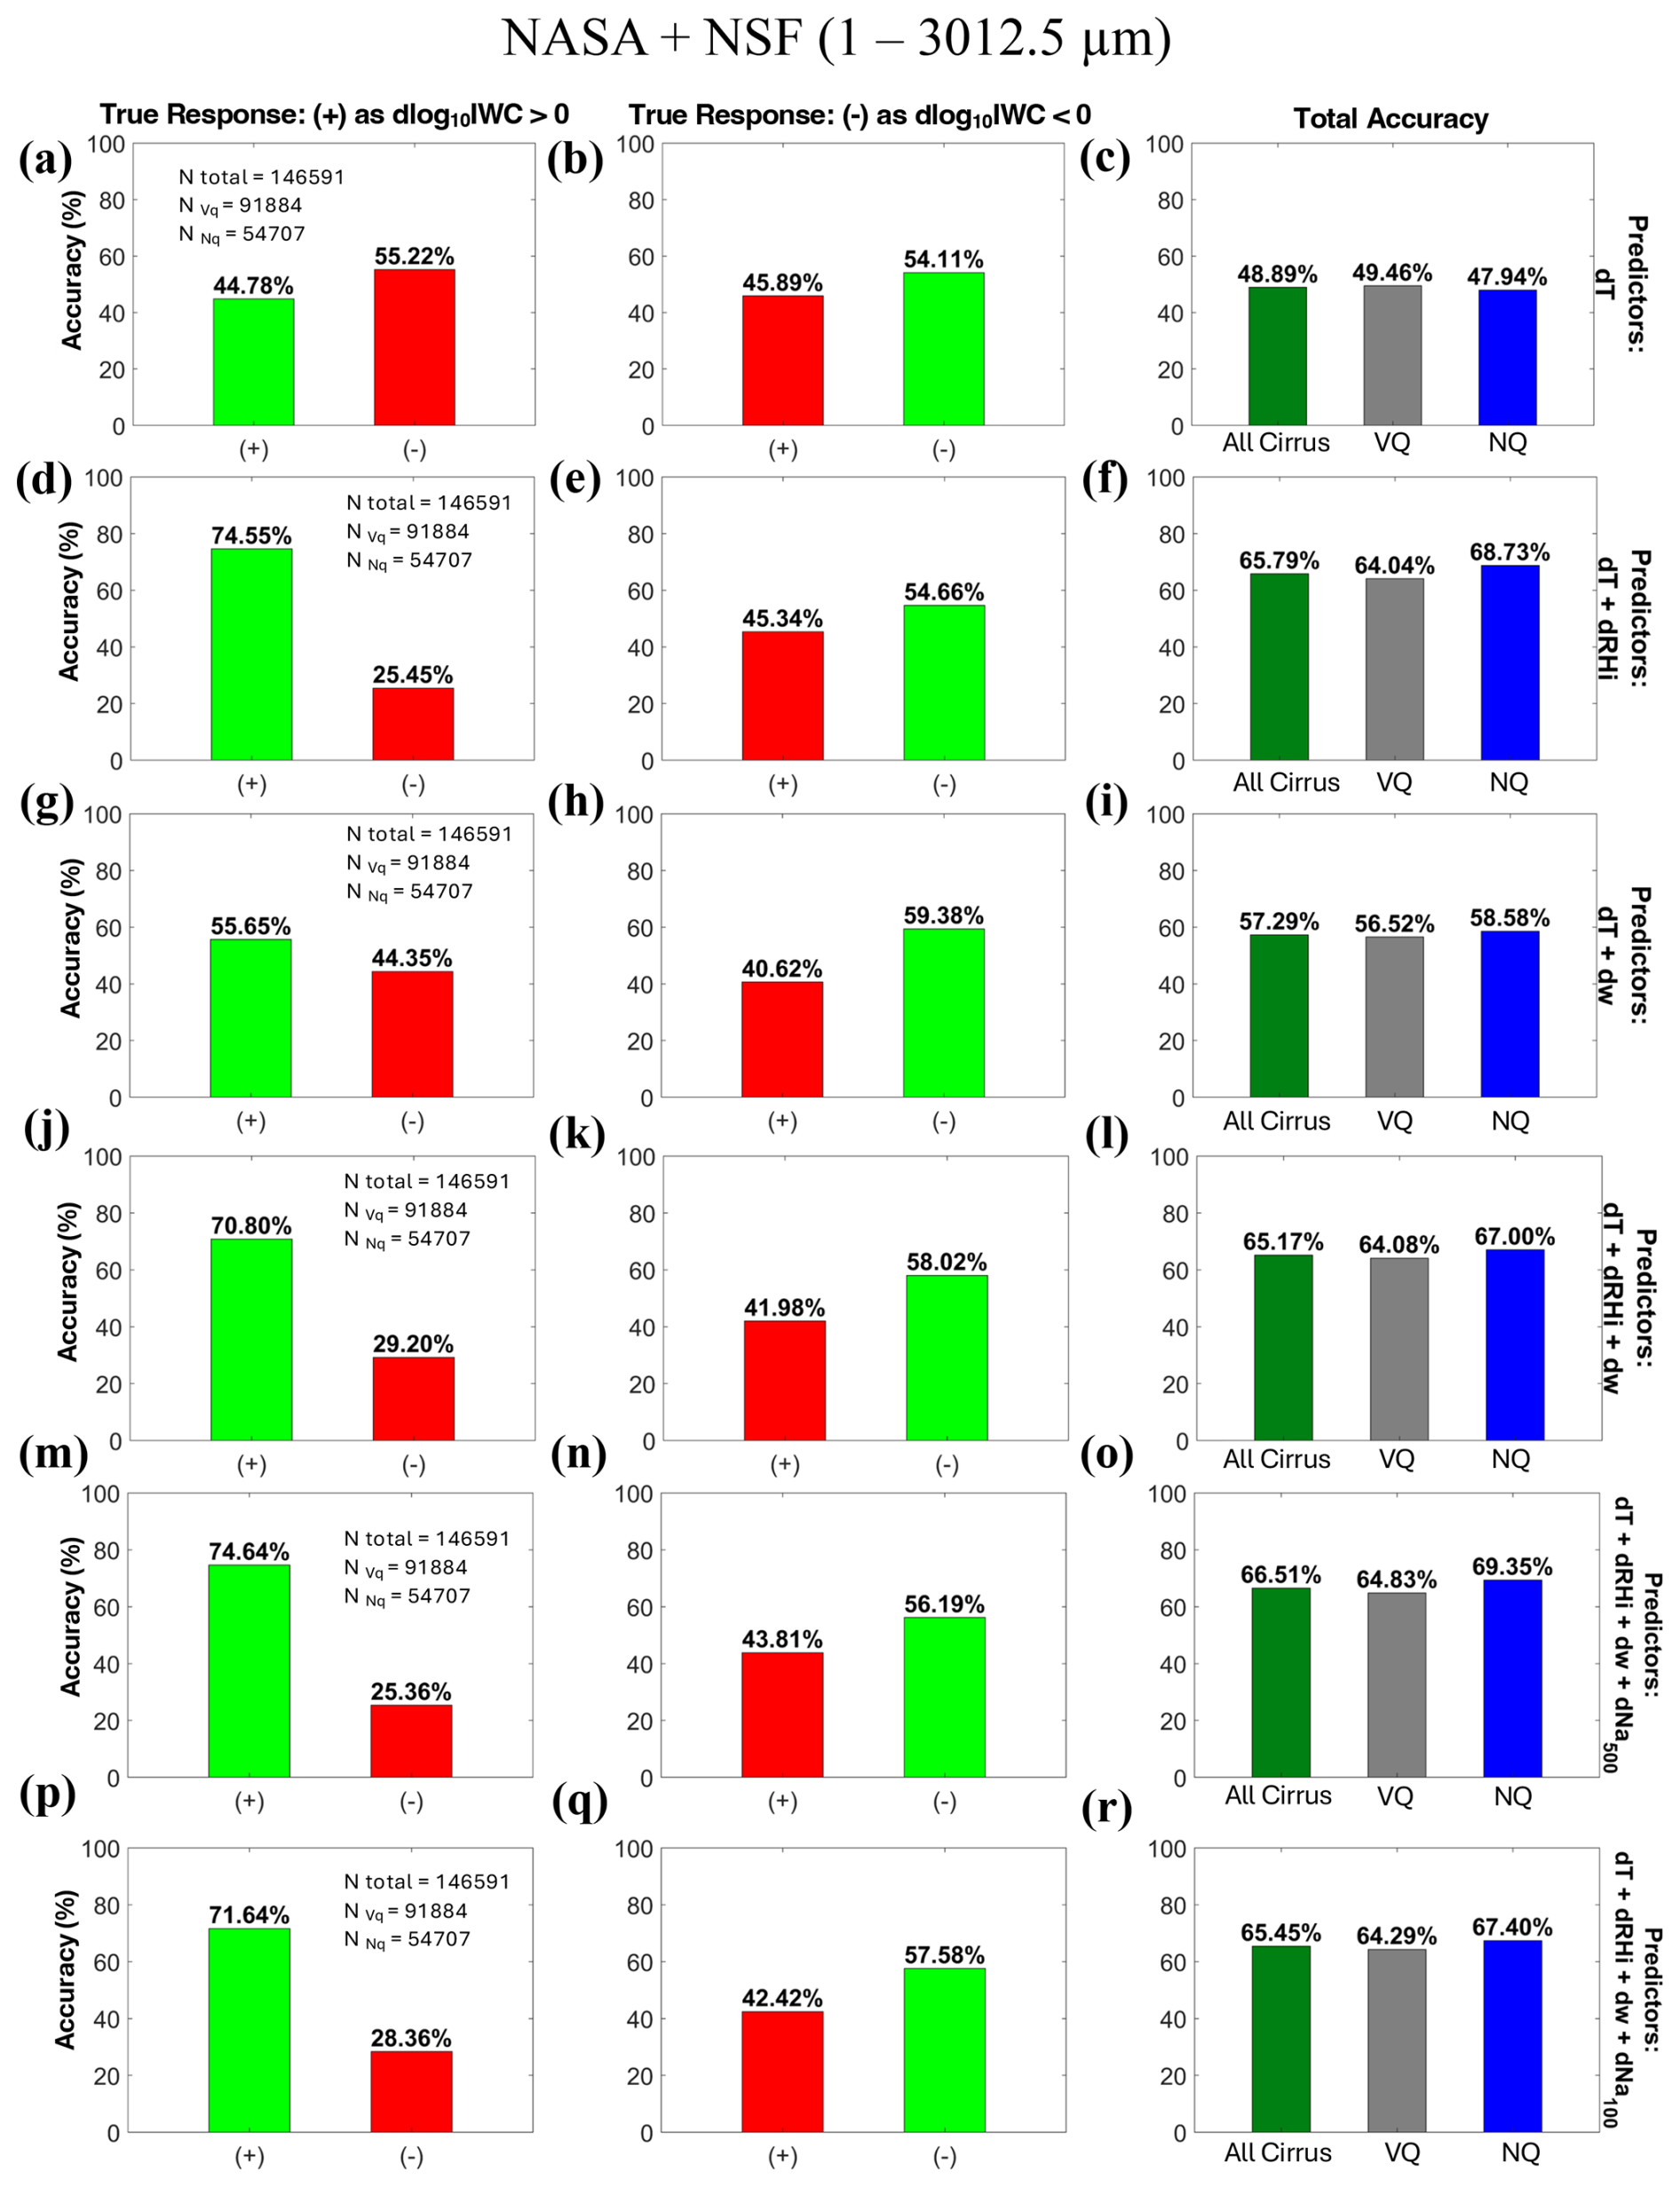
Figure 8Similar to Fig. 7 but predicting whether dlog 10IWC is positive (+) or negative (−) for in-cloud conditions. dlog 10IWC is calculated relative to the geometric mean of IWC in each 1° temperature bin inside cirrus clouds. Observations at 1 Hz are used in this analysis, compared with the coarser scales used in Table 2. Columns 1 and 2 represent the scenarios when the real observations show dlog 10IWC > 0 and < 0, respectively. Column 3 shows the overall accuracies for predicting the sign of dlog 10IWC in three types of cirrus clouds.
When using dT as the sole predictor, the prediction has accuracies around 48 % to 49 %, which are closer to a random 50 %–50 % guess. Adding dRHi to dT increases the accuracies to 64 %–69 %, which indicates smaller increases in accuracies by adding dRHi as a predictor for IWC fluctuations in Fig. 8 compared with predicting cirrus occurrences in Fig. 7. Adding dw to dT increases the accuracies to 57 % to 59 %, indicating smaller contributions from dw compared with dRHi for predicting the fluctuations of IWC inside cirrus clouds. When adding aerosol information, the accuracies increase to 66.51 %, 64.83 %, and 69.35 % for the test of dT + dRHi + dw + dlog 10Na500 and to 65.45 %, 64.29 %, and 67.40 % for dT + dRHi + dw + dlog 10Na100 for the three cirrus types (i.e. all cirrus, vertically quiescent, and non-quiescent), respectively. Comparing between the larger and smaller aerosols, the added values of dlog 10Na500 are 0.8 % to 2.4 %, while the added values of dlog 10Na100 are closer to zero around 0.2 % to 0.4 %. This result indicates that the larger aerosols play a more significant role in controlling the fluctuations of IWC compared with smaller aerosols. This result is consistent with the result shown in Fig. 6, which shows higher positive slope values for correlations with dlog 10Na500 (top three rows in Fig. 6) compared with those for dlog 10Na100 (bottom three rows in Fig. 6). The stronger effects of larger aerosols on IWC inside cirrus are also consistent with previous studies using in situ observations (e.g. Patnaude and Diao, 2020; Maciel et al., 2023). The added values of using larger aerosols as a predictor in Test B (Fig. 8) are higher than those seen in Test A (Fig. 7), indicating that larger aerosols play a relatively more important role in controlling IWC fluctuations, possibly by modifying Ni and Di via ice nucleation, as well as by modifying the ambient RHi and w via water vapour deposition and latent heat release, compared with a relatively weaker role for determining whether cirrus clouds can be formed or not.
In addition to testing the effects of key factors at 1 Hz resolution, as shown in Fig. 8, we further examined the effects of environmental factors on cirrus cloud formation at coarser scales from 10 km to 100 km in Table 3. Specifically, 50, 250, and 500 s averages of dT, dRHi, dw, dlog 10Na500, dlog 10Na100, and dlog 10IWC values are calculated surrounding each second, and these coarser-scale factors are used to predict whether the coarser-scale dlog 10IWC is above or below zero. This experiment addresses the question of whether the IWC fluctuations are affected by larger-scale conditions and what spatial scales are more impactful. Using dT + dRHi as predictors, the accuracies of predicting the sign of dlog 10IWC for vertically quiescent cirrus clouds are 64.04 %, 70.34 %, 69.44 %, and 71.74 % for 1, 50, 250, and 500 s averaged observations, respectively, indicating that the dT + dRHi predictors from 50 to 500 s scales are more influential on the IWC prediction in vertically quiescent cirrus clouds. This is likely because a higher RHi for a wider spatial scale can provide a favourable condition for ice crystal formation and growth for a larger cloud segment. For the effects of dw (using dT + dw as predictors) on vertically quiescent cirrus clouds, the accuracies are 56.52 %, 57.63 %, 56.17 %, and 55.96 %, respectively, indicating that the effects of w on IWC fluctuations extend from the microscale (i.e. ∼ 0.2 km) to mesoscale (10–100 km). On the other hand, examining the non-quiescent cirrus clouds, even though the dT + dRHi prediction provides the highest accuracy of 80.14 % by using 250 s averaged observations, the 500 s averaged observations provide the lowest accuracy of 66.14 % among all spatial scales, indicating a sudden decrease in the impacts of RHi conditions around 100 km surrounding non-quiescent cirrus clouds. When using dT + dw predictors for non-quiescent cirrus clouds, the accuracies show more variabilities, with only 43.70 % accuracy for 250 s averaged observations, indicating that the effects of dw on non-quiescent cirrus clouds originate from a smaller surrounding environment within ±25 km.
For the analysis of ACIs, the effect of Na500 is consistently higher than that of Na100. The additional values of Na500 and Na100 peak around the 50 s and 250 s scales for vertically quiescent and non-quiescent cirrus clouds, respectively, but both decrease at the 500 s scale. For non-quiescent cirrus clouds at the 500 s scale, adding aerosol information even reduces the prediction accuracy in addition to dT + dRHi + dw, likely due to these cirrus clouds being affected by thermodynamic/dynamic conditions more significantly than aerosols at that scale. These scale analysis results suggest that higher average Na500 and Na100 at the 10–50 km scale are more likely to overlap with favourable RHi and w conditions to initiate ice nucleation. On the other hand, Na averaged above 100 km shows weak ACIs, likely because that scale becomes much larger than the lengths of ice supersaturated regions, i.e. 0.1–10 km (Diao et al., 2014a), which are prerequisite conditions for ice nucleation.
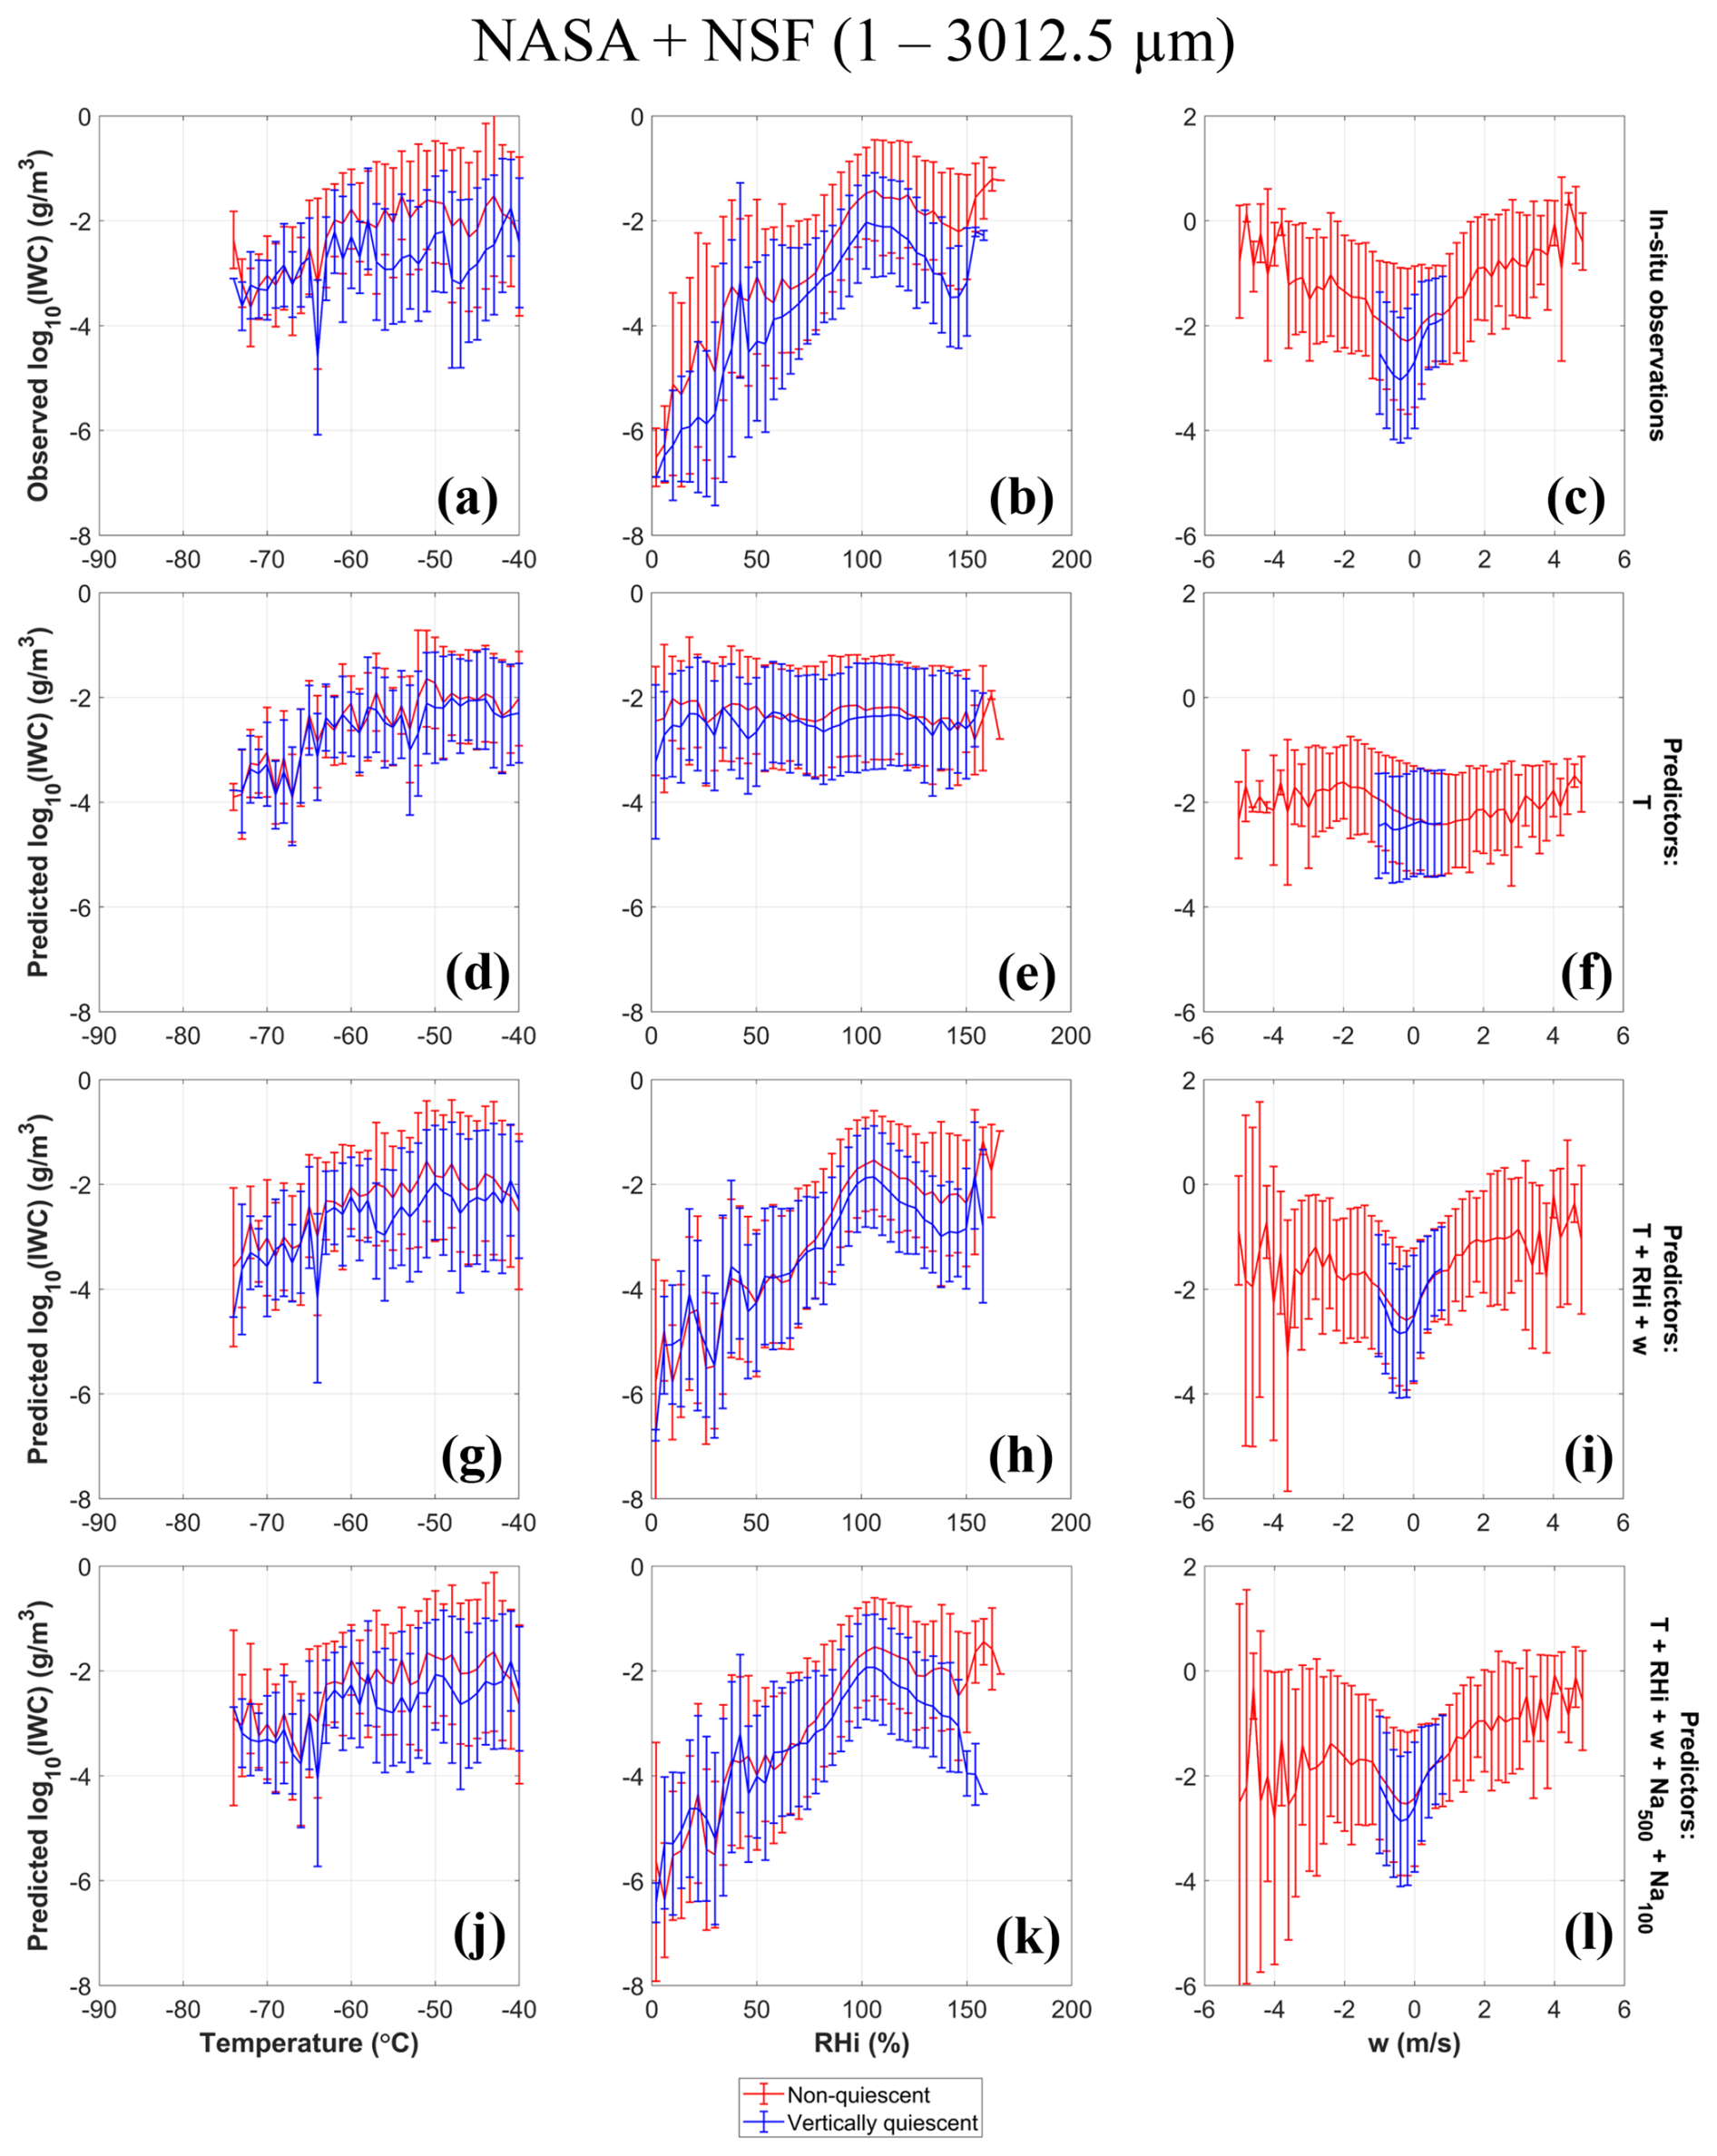
Figure 9Distributions of log 10IWC in relation to temperature, RHi, and w in columns 1–3, respectively. Various sets of predictors are used in different rows. The solid horizontal lines and the vertical bars represent the geometric means and standard deviations of (a–c) observed and (d–l) predicted log 10IWC. Red and blue represent results for non-quiescent and vertically quiescent cirrus clouds, respectively.
Test C examines the ability of the ML models to predict the distributions of IWC as a function of temperature, RHi, and w, as shown in Figs. 9 and 10. In Fig. 9, the distributions of IWC based on real in situ observations (Fig. 9a–c) show four main features: (1) an increasing trend of IWC with increasing temperatures, (2) two peaks of IWC values, one at small ice supersaturation (i.e. RHi of 110 %) that is more pronounced for quiescent cirrus clouds and another at high ice supersaturation (RHi of 150 %–160 %) that is more pronounced for non-quiescent cirrus clouds, (3) higher IWC at stronger updraughts and downdraughts, and (4) higher geometric mean IWC values in the non-quiescent cirrus clouds than in the vertically quiescent cirrus clouds by 1 order of magnitude. The higher IWC seen in non-quiescent cirrus clouds is consistent with the finding of Krämer et al. (2016) in their Fig. 13, assuming part of the non-quiescent cirrus clouds are affected by convective activity. Three sets of predictions are evaluated, including T, T + RHi + w, and T + RHi + w + Na500 + Na100. All the tests can capture the first feature (positive correlations between IWC and T), but the test using only T as a predictor cannot capture the trend with respect to RHi and w, nor can it show the different IWCs between the two types of cirrus clouds. Using T + RHi + w predictors can already capture the main differences in IWC between the two cirrus types. Adding aerosols as predictors shows larger differences in IWC values between the non-quiescent and vertically quiescent cirrus clouds, which are also more similar to the observations compared with using only T + RHi + w. This result illustrates the effects of aerosols in addition to thermodynamic and dynamic effects.
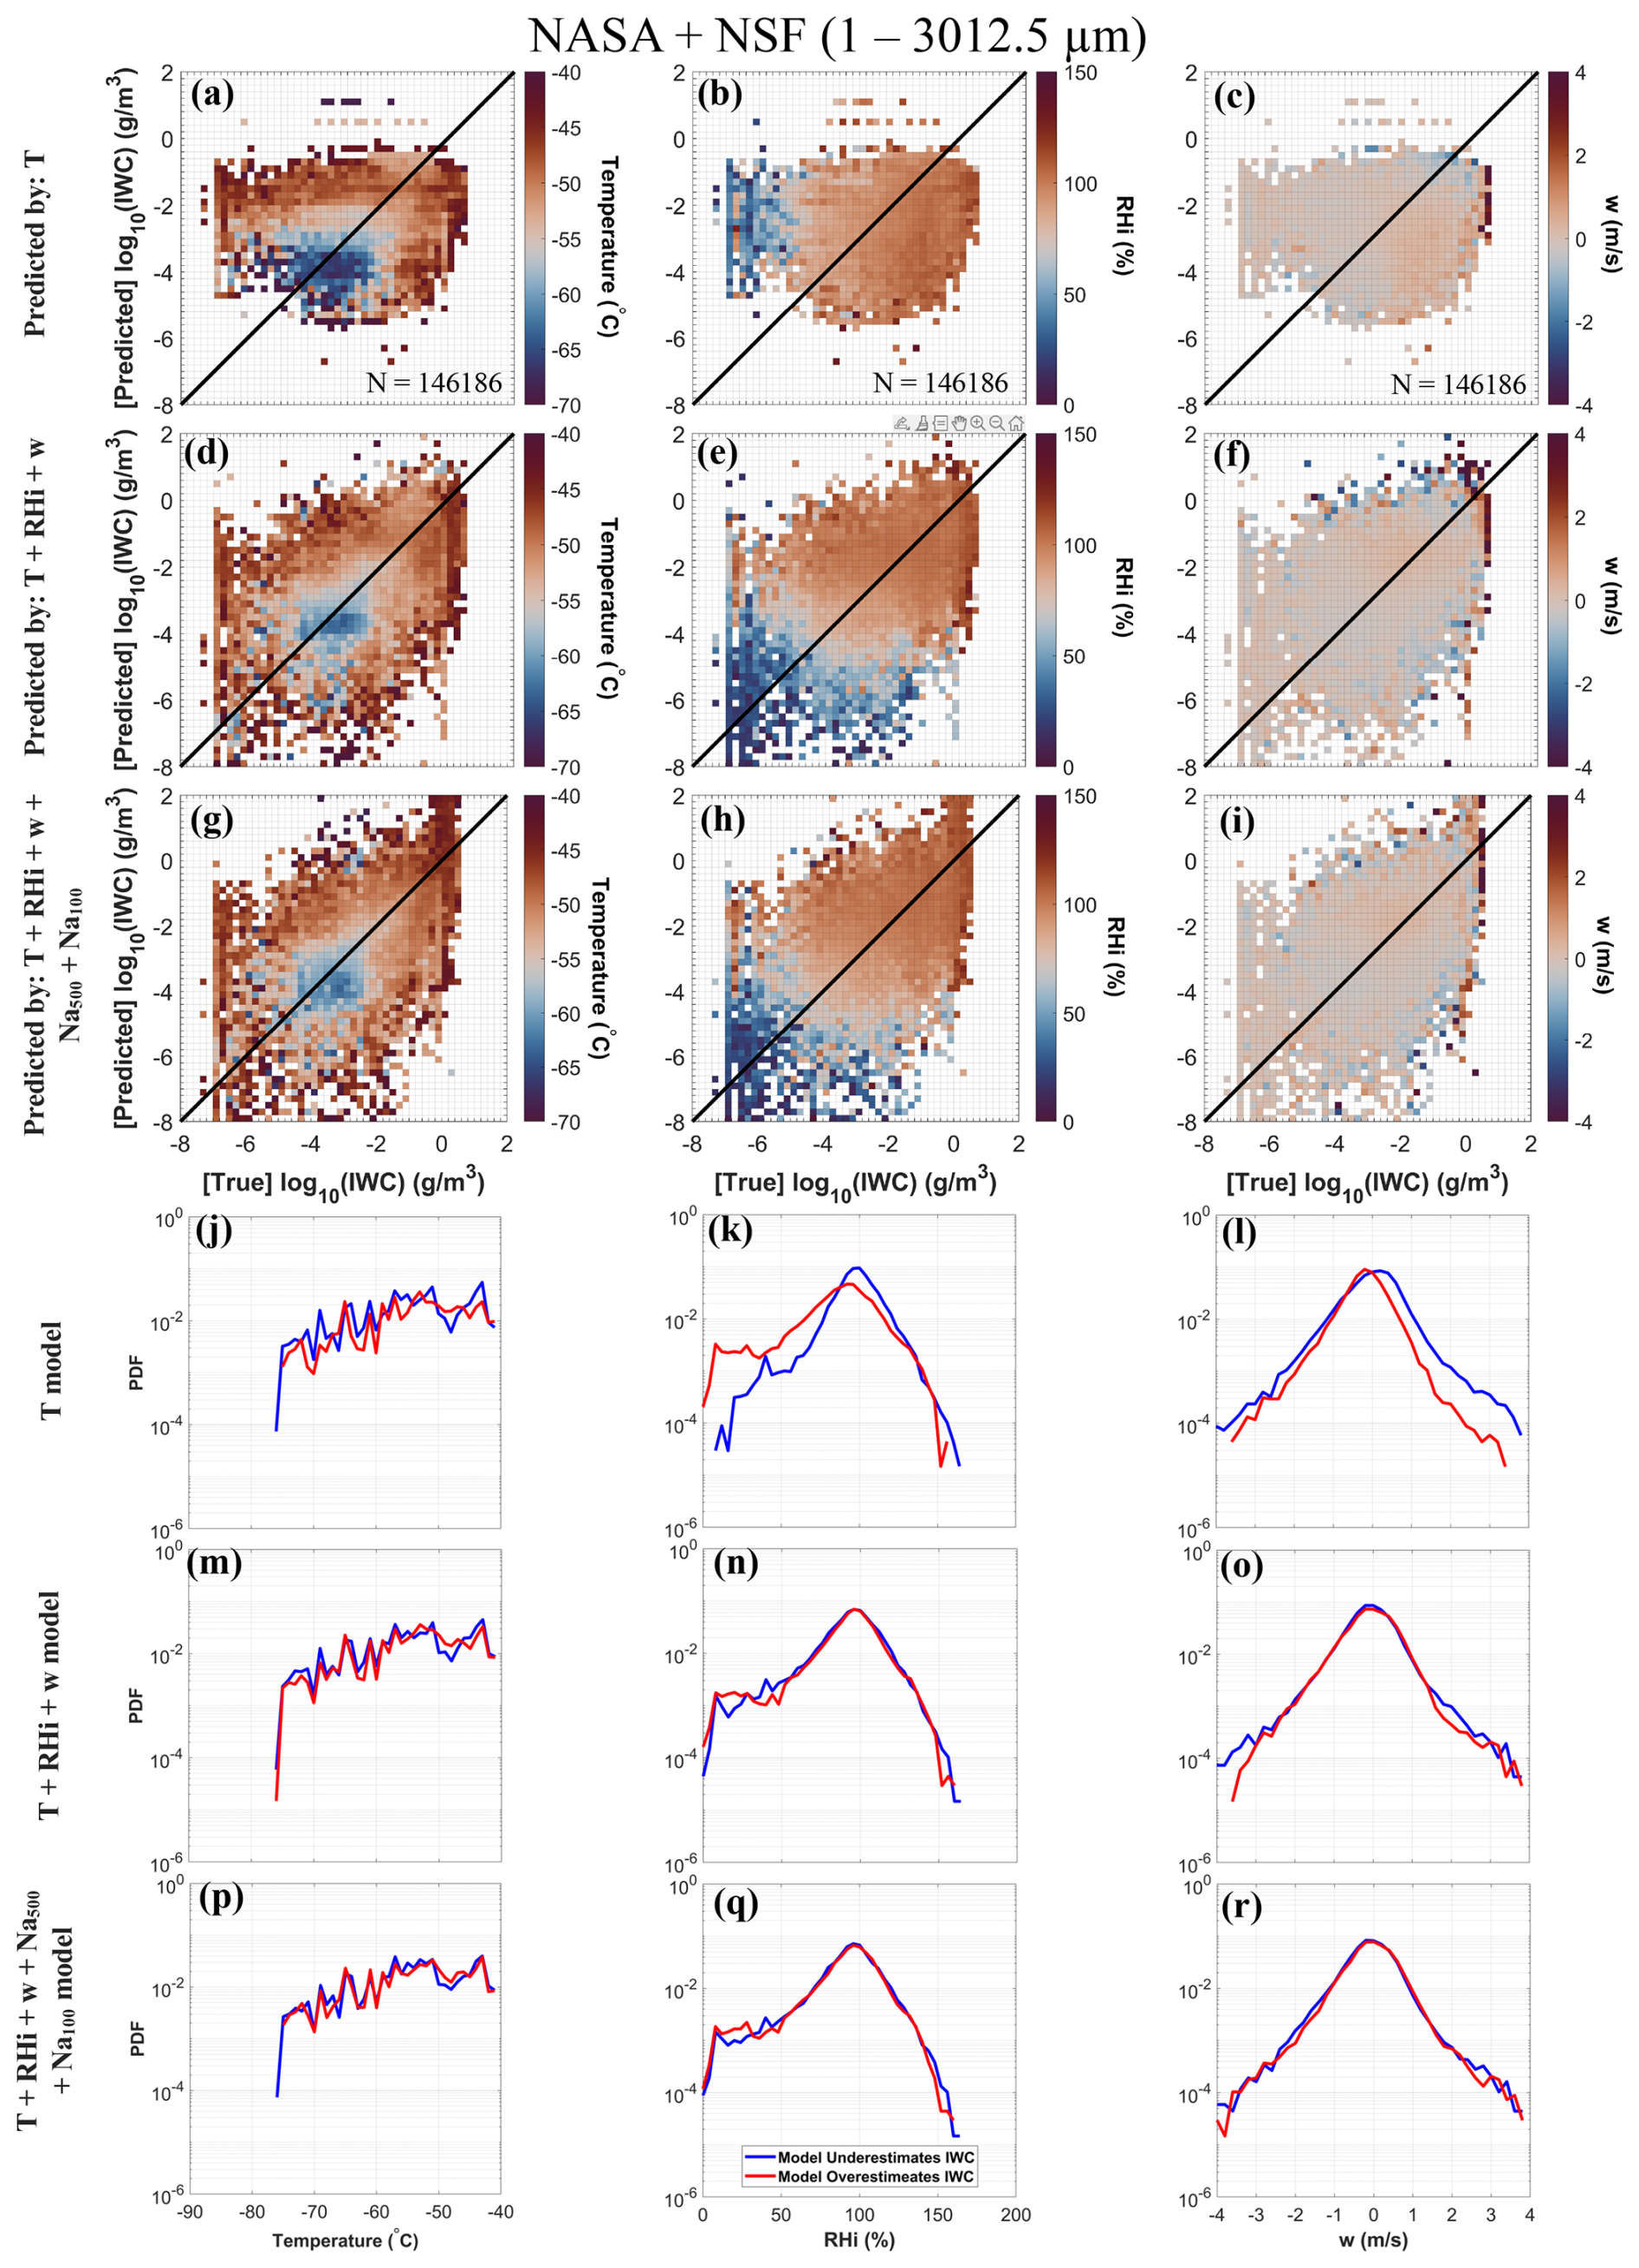
Figure 10(a–i) Distributions of predicted versus observed log 10IWC, colour-coded by the average temperature, RHi, and w in each bin for columns 1–3, respectively. (j–r) PDFs of T, RHi, and w, separated by when IWC is underestimated or overestimated by the ML model. Rows 1 and 4 are predicted by T only. Rows 2 and 5 are predicted by T + RHi + w. Rows 3 and 6 are predicted by T + RHi+ w + Na500 + Na100.
Figure 10a–i shows the comparisons of predicted IWC versus observed IWC, colour-coded by the average T, RHi, and w in columns 1–3, respectively. Three sets of predictors are used: T only (rows 1 and 4), T + RHi + w (rows 2 and 5), and T + RHi + w + Na500 + Na100 (rows 3 and 6). In addition, Fig. 10j–r compares the probability density functions (PDFs) of T, RHi, and w between the scenarios when ML models underestimate or overestimate IWC values. When RHi is not included as a predictor, the predicted IWC values are underestimated at higher RHi values (i.e. orange and red bins below the 1 : 1 line in Fig. 10b) and overestimated at lower RHi values (i.e. blue bins above 1 : 1 line). In addition, when only using T as the predictor in Fig. 10k, the ML predictions overestimating IWC (red line) show higher frequencies of subsaturated conditions and lower frequencies of ice supersaturated conditions compared with the ML predictions that underestimate IWC. Similarly, when w is excluded from the prediction, the higher IWC values associated with strong updraughts are underestimated (i.e. red bins under the 1 : 1 line in Fig. 10c). The PDFs of w also show that the underestimated IWC samples have higher frequencies of strong updraughts and downdraughts when w is not used as a predictor (Fig. 10l). The differences in PDFs of RHi and w between overestimated and underestimated IWC samples are significantly reduced when three predictors are used (i.e. T + RHi + w), as shown in Fig. 10m–o. These differences are even further reduced when Na500 and Na100 are added as the predictors in Fig. 10p–r, especially for those samples associated with lower temperatures below −60 °C (in Fig. 10p), small ice supersaturation less than 20 % (Fig. 10q), and stronger updraughts (> 1.5 m s−1) and downdraughts (< −2.5 m s−1) (Fig. 10r). These analyses demonstrate the primary importance of accurately representing the RHi and w distributions in model simulations for the entire temperature range when simulating the magnitudes of IWC in cirrus clouds, as well as the increasing importance for representing aerosol concentrations accurately for conditions with low temperatures, small ice supersaturation, and high updraughts/downdraughts.
In this study, near global-scale datasets were compiled for in situ observations of cirrus microphysical properties and their surrounding environmental conditions. The individual roles of several key factors (i.e. temperature, RHi, w, Na500, and Na100) affecting the distributions of cirrus microphysical properties were investigated. The datasets cover a wide range of latitudes, providing observations in six latitudinal bands ranging from the polar regions to the midlatitudes and the tropics.
Several approaches were developed to quantify these individual effects, including using a delta-delta method to examine the correlations between the fluctuations of environmental conditions and the fluctuations of cirrus properties, using linear regressions to quantify the effects of larger and smaller aerosols, and using random forest ML models to address the effectiveness of adding different variables as predictors for predicting the occurrences of cirrus clouds and the subsequent IWC fluctuations and magnitudes. These methods have been shown to be critical for quantifying the role of different factors. For instance, the effects of RHi and w on IWC, Ni, and Di were examined by removing the temperature effects on cirrus properties in Fig. 5. The five NASA and seven NSF campaigns show similar trends when the fluctuations of IWC, Ni, and Di were examined, including the peak of dlog 10IWC and dlog 10Ni seen at 10 % dRHi and the peak of dlog 10IWC and dlog 10Ni seen at stronger updraughts and downdraughts conditions. The calculation of delta values enables the combination of NASA and NSF datasets for linear regression analysis of ACIs (Fig. 6). The average background conditions of every 1° temperature bin were subtracted from the delta values, removing the variabilities introduced by various instruments and geographical locations.
The ML models were designed to directly compare the effects of multiple factors (Figs. 7–10 and Tables 2 and 3). Among all factors, RHi is the most important factor for predicting the occurrences of cirrus clouds and the fluctuations of IWC, although its relative contributions to the fluctuations and magnitudes of IWC are smaller compared with its dominant role for predicting cirrus occurrences. Comparing between non-quiescent and vertically quiescent cirrus clouds, the non-quiescent cirrus clouds show 1 order of magnitude higher IWC than vertically quiescent cirrus clouds. This main feature can be captured if the predictors of T + RHi + w are used, while adding aerosol information can further reduce the biases in predicted IWC magnitudes especially for low temperatures, small ice supersaturation, and high updraughts/downdraughts.
Focusing on the analysis of ACIs, both larger and smaller aerosol concentrations (Na500 and Na100) show positive correlations with the delta values of IWC, Ni, and Di when the combined NASA + NSF datasets were examined. However, larger aerosols produce stronger effects on cirrus clouds (i.e. steeper slopes) than smaller aerosols, as shown by the slopes of linear regressions (Fig. 6). In addition, near-linear correlations with positive slopes are seen between fluctuations of IWC, Ni, and Di relative to fluctuations of larger aerosols, while the correlations with smaller aerosols are nonlinear. The increasing trends of dlog 10IWC, dlog 10Ni, and dlog 10Di become more visible when the number concentrations of smaller aerosols are 10 times larger than their background conditions (i.e. dlog 10Na100 > 1). The nonlinearity of ACIs for small aerosols may be caused by the higher Na100 values being associated with higher INP concentrations, as Na100 and Na500 are positively correlated (not shown). Based on the ML analysis, the relative contributions of large aerosols for the prediction of cirrus cloud occurrences are relatively small compared with those from RHi and w (Fig. 7), but they have slightly larger influences on the prediction of IWC magnitudes (Fig. 8). The ML experiments consistently show relatively smaller effects from small aerosols compared with larger aerosols (Tables 2 and 3). The fact that near-linear correlations are seen with respect to Na500 at various IWC values across 3–4 orders of magnitudes (Figs. 6, S10–S12) as well as using both in-cloud and clear-sky Na values (Fig. S9) suggests that the ice shattering is less likely a main cause of the higher Na500 at in-cloud conditions, as higher IWC values are more likely to induce ice shattering based on previous in situ observations (McFarquhar et al., 2017).
When examining the impacts of using predictors at different spatial scales, the dT + dRHi + dw predictors are more effective at the 50 to 500 s scale than at the 1 s scale, suggesting larger impacts of thermodynamic/dynamic conditions at coarser scales than the 1 s scale. On the other hand, the effects of both types of aerosols peak at the 50 s scale for vertically quiescent cirrus clouds and at the 250 s scale for non-quiescent cirrus clouds, and both decrease at the 500 s scale, suggesting that the availability of aerosols at similar scales to the lengths of ice supersaturated regions, i.e. 0.1–10 km (Diao et al., 2014a), may lead to higher probabilities of ice nucleation.
The compiled in situ observational dataset of cirrus clouds in this study provided a complementary dataset in terms of geographical coverage to the previous study of Krämer et al. (2020). That study analysed cirrus cloud observations from 24 field campaigns, including five campaigns that were also used in this study, i.e. START08, CONTRAST, MACPEX, ATTREX-2014, and POSIDON. That study showed more samples over Europe, Africa, Australia, and South America compared with this study. When assessing the geographical coverage of both studies, we identified several regions with fewer samples – (a) the polar regions in both hemispheres, (b) the Northern Hemisphere midlatitudes over the ocean, and (c) the Southern Hemisphere midlatitudes over both ocean and land. Thus, more cirrus-oriented airborne field campaigns are needed in these regions to understand the key environmental factors controlling cirrus formation and evolution by specifically targeting the cirrus cloud system. In addition, both studies had fewer samples over mountainous regions conducive to OGW cirrus clouds, which may not cover the entire distributions of cloud properties. Previously, considerably different ice microphysical properties and widespread coverage were found in OGW cirrus clouds (e.g. Joos et al., 2008; Barahona et al., 2017; Mitchell et al., 2018; Gryspeerdt et al., 2018; Krämer et al., 2020; Lyu et al., 2023). Last but not the least, the majority of the field campaigns used in both studies (e.g. NSF campaigns) captured cirrus clouds as targets of opportunity instead of sampling them as the main scientific objective. Thus, more purposely designed comparative studies among cirrus clouds formed under various synoptic dynamical conditions (i.e. convective, orographic, and in situ cirrus) are still warranted.
Quantifying the relative role of various factors has implications for improving the simulations of cirrus clouds in GCMs. For example, capturing the fluctuations of larger aerosols is more important than capturing such information for small aerosols (Fig. 6 and Tables 2 and 3). In addition, capturing the sub-grid scale variabilities of T, RHi, w, Na500, and Na100 at 10–50 km for GCM simulations at the 1° × 1° grid scale is especially important for predicting IWC variabilities (Table 3) and for representing the differences between vertically quiescent and non-quiescent cirrus clouds (Fig. 10), which presents a challenge to sub-grid parameterizations in GCMs. Overall, this study provided two main types of metrics to quantify the contributions from multiple factors on cirrus microphysical properties, i.e. linear regressions and ML predictions. These datasets and metrics developed in this study can be applied to evaluate GCM simulations and satellite-based observations for cirrus microphysical properties and ACIs in cirrus clouds.
Observations from the seven NSF flight campaigns are accessible at https://data.eol.ucar.edu/ (last access: 15 June 2024). The DOIs for the 1 s cloud microphysical properties of NSF campaigns are also provided (https://doi.org/10.5065/D6BC3WKB, UCAR/NCAR, 2018a; https://doi.org/10.5065/D65T3HWR, UCAR/NCAR, 2018b; https://doi.org/10.5065/D6JW8C64, UCAR/NCAR, 2019a; https://doi.org/10.5065/D6QF8R6R, UCAR/NCAR, 2019b; https://doi.org/10.5065/D6V40SK6, UCAR/NCAR, 2019c; https://doi.org/10.5065/D6CZ35HX, UCAR/NCAR, 2019d; https://doi.org/10.5065/D6NZ85Z4, UCAR/NCAR, 2019e; https://doi.org/10.5065/D6668BHR, UCAR/NCAR, 2019f; https://doi.org/10.5065/D6TX3CK0, UCAR/NCAR, 2021a; https://doi.org/10.5065/D61R6NV5, UCAR/NCAR, 2021b). Observations from the five NASA flight campaigns are accessible at the following links for the ATTREX, MACPEX, NASA-DC3, POSIDON, and SEAC4RS campaigns, respectively: https://espo.nasa.gov/attrex (NASA Data, 2024a), https://espo.nasa.gov/macpex (NASA Data, 2024b), https://www-air.larc.nasa.gov/missions/dc3-seac4rs/ (NASA Data, 2024c), https://espo.nasa.gov/posidon (NASA Data, 2024d), and https://www-air.larc.nasa.gov/missions/seac4rs/ (NASA Data, 2024e).
The supplement related to this article is available online at https://doi.org/10.5194/acp-25-7007-2025-supplement.
DN and MD contributed to the development of the ideas, conducted quality control for aircraft-based observations, conducted data analysis, and wrote the paper. RJP contributed to the quality control for in situ observations. SW contributed to the field maintenance, calibration, and final data processing for the FCDP, Hawkeye-FCDP, and 2DS probes. GD supported the field measurements, calibration, and final data submission for the DLH hygrometer.
The contact author has declared that none of the authors has any competing interests.
Publisher's note: Copernicus Publications remains neutral with regard to jurisdictional claims made in the text, published maps, institutional affiliations, or any other geographical representation in this paper. While Copernicus Publications makes every effort to include appropriate place names, the final responsibility lies with the authors.
Minghui Diao, Derek Ngo, and Ryan J. Patnaude acknowledge funding from NASA ROSES-2020 80NSSC21K1457, NSF AGS #1642291, and NSF OPP #1744965 grants. Minghui Diao and Derek Ngo acknowledge funding from NASA MOSAIC programme 80NSSC24K1616. Derek Ngo and Ryan J. Patnaude also acknowledge support from the San José State University Walker Fellowship.
This research has been supported by the National Aeronautics and Space Administration (grant nos. ROSES-2020 80NSSC21K1457 and ROSES-2024 80NSSC24K1616), the Directorate for Geosciences (grant nos. NSF AGS 1642291 and NSF OPP 1744965), and San José State University (Walker Fellowship).
This paper was edited by Martina Krämer and reviewed by three anonymous referees.
Baker, B. A. and Lawson, R. P.: In Situ Observations of the Microphysical Properties of Wave, Cirrus and Anvil Clouds. Part I: Wave Clouds, J. Atmos. Sci., 63, 3160–3185, https://doi.org/10.1175/JAS3802.1, 2006.
Barahona, D., Molod, A., and Kalesse, H.: Direct estimation of the global distribution of vertical velocity within cirrus clouds, Sci. Rep., 7, 6840, https://doi.org/10.1038/s41598-017-07038-6, 2017.
Barahona, D., Breen, K. H., Kalesse-Los, H., and Röttenbacher, J.: Deep Learning Parameterization of Vertical Wind Velocity Variability via Constrained Adversarial Training, Artificial Intelligence for the Earth Systems, 3, e230025, https://doi.org/10.1175/aies-d-23-0025.1, 2023.
Barth, M. C., Cantrell, C. A., Brune, W. H., Rutledge, S. A., Crawford, J. H., Huntrieser, H., Carey, L. D., MacGorman, D., Weisman, M., Pickering, K. E., Bruning, E., Anderson, B., Apel, E., Biggerstaff, M., Campos, T., Campuzano-Jost, P., Cohen, R., Crounse, J., Day, D. A., Diskin, G., Flocke, F., Fried, A., Garland, C., Heikes, B., Honomichl, S., Hornbrook, R., Gregory Huey, L., Jimenez, J. L., Lang, T., Lichtenstern, M., Mikoviny, T., Nault, B., O'Sullivan, D., Pan, L. L., Peischl, J., Pollack, I., Richter, D., Riemer, D., Ryerson, T., Schlager, H., St. Clair, J., Walega, J., Weibring, P., Weinheimer, A., Wennberg, P., Wisthaler, A., Wooldridge, P. J., and Ziegler, C.: The deep convective clouds and chemistry (DC3) field campaign, B. Am. Meteorol. Soc., 96, 1281–1309, https://doi.org/10.1175/BAMS-D-13-00290.1, 2015.
Brown, P. R. A. and Francis, P. N.: Improved Measurements of the Ice Water Content in Cirrus Using a Total-Water Probe, J. Atmos. Ocean. Tech., 12, 410–414, https://doi.org/10.1175/1520-0426(1995)012<0410:imotiw>2.0.co;2, 1995.
Cziczo, D. J., Froyd, K. D., Hoose, C., Jensen, E. J., Diao, M., Zondlo, M. A., Smith, J. B., Twohy, C. H., and Murphy, D. M.: Clarifying the dominant sources and mechanisms of cirrus cloud formation, Science, 340, 1320–1324, https://doi.org/10.1126/science.1234145, 2013.
D'Alessandro, J. J., Diao, M., Wu, C., Liu, X., Chen, M., Morrison, H., Eidhammer, T., Jensen, J. B., Bansemer, A., Zondlo, M. A., and DiGangi, J. P.: Dynamical conditions of ice supersaturation and ice nucleation in convective systems: A comparative analysis between in situ aircraft observations and WRF simulations, J. Geophys. Res.-Atmos., 122, 2844–2866, https://doi.org/10.1002/2016JD025994, 2017.
D'Alessandro, J. J., Mcfarquhar, G. M., Stith, J. L., Jensen, J. B., Diao, M., DeMott, P. J., and Sanchez, K. J.: An evaluation of phase, aerosol-cloud interactions and microphysical properties of single- and multi-layer clouds over the Southern Ocean using in situ observations from SOCRATES, J. Geophys. Res.-Atmos., 128, e2023JD038610, https://doi.org/10.1029/2023JD038610, 2023.
David, R. O., Marcolli, C., Fahrni, J., Qiu, Y., Perez Sirkin, Y. A., Molinero, V., Mahrt, F., Brühwiler, D., Lohmann, U., and Kanji, Z. A.: Pore condensation and freezing is responsible for ice formation below water saturation for porous particles, P. Natl. Acad. Sci. USA, 116, 8184–8189, https://doi.org/10.1073/pnas.1813647116, 2019.
DeMott, P. J., Prenni, A. J., Liu, X., Kreidenweis, S. M., Petters, M. D., Twohy, C. H., Richardson, M. S., Eidhammer, T., and Rogers, D. C.: Predicting global atmospheric ice nuclei distributions and their impacts on climate, P. Natl. Acad. Sci. USA, 107, 11217–11222, https://doi.org/10.1073/pnas.0910818107, 2010.
Diao, M., Zondlo, M. A., Heymsfield, A. J., Beaton, S. P., and Rogers, D. C.: Evolution of ice crystal regions on the microscale based on in situ observations, Geophys. Res. Lett., 40, 3473–3478, https://doi.org/10.1002/grl.50665, 2013.
Diao, M., Zondlo, M. A., Heymsfield, A. J., Avallone, L. M., Paige, M. E., Beaton, S. P., Campos, T., and Rogers, D. C.: Cloud-scale ice-supersaturated regions spatially correlate with high water vapor heterogeneities, Atmos. Chem. Phys., 14, 2639–2656, https://doi.org/10.5194/acp-14-2639-2014, 2014a.
Diao, M., Zondlo, M. A., Heymsfield, A. J., and Beaton, S. P.: Hemispheric comparison of cirrus cloud evolution using in situ measurements in HIAPER Pole-to-Pole Observations, Geophys. Res. Lett., 41, 4090–4099, https://doi.org/10.1002/2014GL059873, 2014b.
Diao, M., Jensen, J. B., Pan, L. L., Homeyer, C. R., Honomichl, S., Bresch, J. F., and Bansemer, A.: Distributions of ice supersaturation and ice crystals from airborne observations in relation to upper tropospheric dynamical boundaries, J. Geophys. Res.-Atmos., 120, 5101–5121, https://doi.org/10.1002/2015JD023139, 2015.
Diao, M., Bryan, G. H., Morrison, H., and Jensen, J. B.: Ice nucleation parameterization and relative humidity distribution in idealized squall-line simulations, J. Atmos. Sci., 74, 2761–2787, https://doi.org/10.1175/JAS-D-16-0356.1, 2017.
Field, P. R., Heymsfield, A. J., and Bansemer, A.: Shattering and Particle Interarrival Times Measured by Optical Array Probes in Ice Clouds, J. Atmos. Ocean. Tech., 23, 1357–1371, https://doi.org/10.1175/JTECH1922.1, 2006.
Froyd, K. D., Murphy, D. M., Brock, C. A., Campuzano-Jost, P., Dibb, J. E., Jimenez, J.-L., Kupc, A., Middlebrook, A. M., Schill, G. P., Thornhill, K. L., Williamson, C. J., Wilson, J. C., and Ziemba, L. D.: A new method to quantify mineral dust and other aerosol species from aircraft platforms using single-particle mass spectrometry, Atmos. Meas. Tech., 12, 6209–6239, https://doi.org/10.5194/amt-12-6209-2019, 2019.
Gasparini, B. and Lohmann, U.: Why cirrus cloud seeding cannot substantially cool the planet, J. Geophys. Res., 121, 4877-4893, https://doi.org/10.1002/2015JD024666, 2016.
Gettelman, A. and Kinnison, D. E.: The global impact of supersaturation in a coupled chemistry-climate model, Atmos. Chem. Phys., 7, 1629–1643, https://doi.org/10.5194/acp-7-1629-2007, 2007.
Gettelman, A. and Morrison, H.: Advanced two-moment bulk microphysics for global models. Part I: Off-line tests and comparison with other schemes, J. Climate, 28, 1268–1287, https://doi.org/10.1175/JCLI-D-14-00102.1, 2015.
Gryspeerdt, E., Sourdeval, O., Quaas, J., Delanoë, J., Krämer, M., and Kühne, P.: Ice crystal number concentration estimates from lidar–radar satellite remote sensing – Part 2: Controls on the ice crystal number concentration, Atmos. Chem. Phys., 18, 14351–14370, https://doi.org/10.5194/acp-18-14351-2018, 2018.
Heymsfield, A. J., Matrosov, S., and Baum, B.: Ice Water Path–Optical Depth Relationships for Cirrus and Deep Stratiform Ice Cloud Layers, J. Appl. Meteor. Climatol., 42, 1369–1390, https://doi.org/10.1175/1520-0450(2003)042<1369:IWPDRF>2.0.CO;2, 2003.
Hoose, C. and Möhler, O.: Heterogeneous ice nucleation on atmospheric aerosols: a review of results from laboratory experiments, Atmos. Chem. Phys., 12, 9817–9854, https://doi.org/10.5194/acp-12-9817-2012, 2012.
Jensen, E. J., Pfister, L., Jordan, D. E., Bui, T. V., Ueyama, R., Singh, H. B., Thornberry, T. D., Rollins, A. W., Gao, R. S., Fahey, D. W., Rosenlof, K. H., Elkins, J. W., Diskin, G. S., Digangi, J. P., Lawson, R. P., Woods, S., Atlas, E. L., Navarro Rodriguez, M. A., Wofsy, S. C., Pittman, J., Bardeen, C. G., Toon, O. B., Kindel, B. C., Newman, P. A., McGill, M. J., Hlavka, D. L., Lait, L. R., Schoeberl, M. R., Bergman, J. W., Selkirk, H. B., Alexander, M. J., Kim, J. E., Lim, B. H., Stutz, J., and Pfeilsticker, K.: The NASA Airborne Tropical TRopopause EXperiment (ATTREX): High-altitude aircraft measurements in the tropical western Pacific, B. Am. Meteorol. Soc., 98, 129–143, https://doi.org/10.1175/BAMS-D-14-00263.1, 2017a.
Jensen E. J., Thornberry, T. D., Rollins, A. W., Ueyama, R., Pfister, L., Bui, T., Diskin, G. S., DiGangi, J. P., Hintsa, E., Gao, R.-S., Woods, S., Lawson, R. P., and Pittman, J.: Physical processes controlling the spatial distributions of relative humidity in the tropical tropopause layer over the Pacific, J. Geophys. Res.-Atmos., 122, 6094–6107, https://doi.org/10.1002/2017JD026632, 2017b.
Jensen, E. J., Kärcher, B., Woods, S., Krämer, M., and Ueyama, R.: The impact of gravity waves on the evolution of tropical anvil cirrus microphysical properties, J. Geophys. Res.-Atmos., 129, e2023JD039887, https://doi.org/10.1029/2023JD039887, 2024.
Joos, H., Spichtinger, P., Lohmann, U., Gayet, J.-F., and Minikin, A.: Orographic cirrus in the global climate model ECHAM5, J. Geophys. Res., 113, D18205, https://doi.org/10.1029/2007JD009605, 2008.
Kanji, Z. A., Ladino, L. A., Wex, H., Boose, Y., Burkert-Kohn, M., Cziczo, D. J., and Krämer, M.: Overview of Ice Nucleating Particles, Meteor. Mon., 58, 1.1–1.33, https://doi.org/10.1175/amsmonographs-d-16-0006.1, 2017.
Kanji, Z. A., Sullivan, R. C., Niemand, M., DeMott, P. J., Prenni, A. J., Chou, C., Saathoff, H., and Möhler, O.: Heterogeneous ice nucleation properties of natural desert dust particles coated with a surrogate of secondary organic aerosol, Atmos. Chem. Phys., 19, 5091–5110, https://doi.org/10.5194/acp-19-5091-2019, 2019.
Kärcher, B.: A Parameterization of Cirrus Cloud Formation: Revisiting Competing Ice Nucleation, J. Geophys. Res.-Atmos., 127, e2022JD036907, https://doi.org/10.1029/2022JD036907, 2022.
Koop, T., Luo, B., Tsias, A., and Peter, T.: Water activity as the determinant for homogeneous ice nucleation in aqueous solutions, Nature, 406, 611–614, https://doi.org/10.1038/35020537, 2000.
Korolev, A. V., Emery, E. F., Strapp, J. W., Cober, S. G., and Isaac, G. A.: Quantification of the Effects of Shattering on Airborne Ice Particle Measurements, J. Atmos. Ocean. Tech., 30, 2527–2553, https://doi.org/10.1175/JTECH-D-13-00115.1, 2013.
Krämer, M., Schiller, C., Afchine, A., Bauer, R., Gensch, I., Mangold, A., Schlicht, S., Spelten, N., Sitnikov, N., Borrmann, S., de Reus, M., and Spichtinger, P.: Ice supersaturations and cirrus cloud crystal numbers, Atmos. Chem. Phys., 9, 3505–3522, https://doi.org/10.5194/acp-9-3505-2009, 2009.
Krämer, M., Rolf, C., Luebke, A., Afchine, A., Spelten, N., Costa, A., Meyer, J., Zöger, M., Smith, J., Herman, R. L., Buchholz, B., Ebert, V., Baumgardner, D., Borrmann, S., Klingebiel, M., and Avallone, L.: A microphysics guide to cirrus clouds – Part 1: Cirrus types, Atmos. Chem. Phys., 16, 3463–3483, https://doi.org/10.5194/acp-16-3463-2016, 2016.
Krämer, M., Rolf, C., Spelten, N., Afchine, A., Fahey, D., Jensen, E., Khaykin, S., Kuhn, T., Lawson, P., Lykov, A., Pan, L. L., Riese, M., Rollins, A., Stroh, F., Thornberry, T., Wolf, V., Woods, S., Spichtinger, P., Quaas, J., and Sourdeval, O.: A microphysics guide to cirrus – Part 2: Climatologies of clouds and humidity from observations, Atmos. Chem. Phys., 20, 12569–12608, https://doi.org/10.5194/acp-20-12569-2020, 2020.
Lawson, R. P.: Effects of ice particles shattering on the 2D-S probe, Atmos. Meas. Tech., 4, 1361–1381, https://doi.org/10.5194/amt-4-1361-2011, 2011.
Liou, K.-N.: Radiation and cloud processes in the atmosphere. Theory, observation, and modeling, New York, NY, USA, Oxford University Press, United States, 255–339, ISBN 978-0195049107, 1992.
Liu, J. and Shi, X.: Estimating the potential cooling effect of cirrus thinning achieved via the seeding approach, Atmos. Chem. Phys., 21, 10609–10624, https://doi.org/10.5194/acp-21-10609-2021, 2021.
Lohmann, U. and Gasparini, B.: A cirrus cloud climate dial?, Science, 357, 248–249, https://doi.org/10.1126/science.aan3325, 2017.
Luebke, A. E., Afchine, A., Costa, A., Grooß, J.-U., Meyer, J., Rolf, C., Spelten, N., Avallone, L. M., Baumgardner, D., and Krämer, M.: The origin of midlatitude ice clouds and the resulting influence on their microphysical properties, Atmos. Chem. Phys., 16, 5793–5809, https://doi.org/10.5194/acp-16-5793-2016, 2016.
Lynch, D. K., Sassen, K., Starr, D. O., and Stephens, G.: Cirrus, Oxford University Press, 3–40, ISBN 978-0195130720, 2002.
Lyu, K., Liu, X., Bacmeister, J., Zhao, X., Lin, L., Shi, Y., and Sourdeval, O.: Orographic cirrus and its radiative forcing in NCAR CAM6, J. Geophys. Res.-Atmos., 128, e2022JD038164, https://doi.org/10.1029/2022JD038164, 2023.
Maciel, F. V., Diao, M., and Patnaude, R.: Examination of aerosol indirect effects during cirrus cloud evolution, Atmos. Chem. Phys., 23, 1103–1129, https://doi.org/10.5194/acp-23-1103-2023, 2023.
Mahrt, F., Marcolli, C., David, R. O., Grönquist, P., Barthazy Meier, E. J., Lohmann, U., and Kanji, Z. A.: Ice nucleation abilities of soot particles determined with the Horizontal Ice Nucleation Chamber, Atmos. Chem. Phys., 18, 13363–13392, https://doi.org/10.5194/acp-18-13363-2018, 2018.
Mahrt, F., Kilchhofer, K., Marcolli, C., Grönquist, P., David, R. O., Rösch, M., Lohmann, U., and Kanji, Z. A.: The Impact of Cloud Processing on the Ice Nucleation Abilities of Soot Particles at Cirrus Temperatures, J. Geophys. Res.-Atmos., 125, e2019JD030922, https://doi.org/10.1029/2019JD030922, 2020.
Marcolli, C.: Deposition nucleation viewed as homogeneous or immersion freezing in pores and cavities, Atmos. Chem. Phys., 14, 2071–2104, https://doi.org/10.5194/acp-14-2071-2014, 2014.
McFarquhar, G. M., Baumgardner, D., Bansemer, A., Abel, S. J., Crosier, J., French, J., Rosenberg, P., Korolev, A., Schwarzoenboeck, A., Leroy, D., Um, J., Wu, W., Heymsfield, A. J., Twohy, C., Detwiler, A., Field, P., Neumann, A., Cotton, R., Axisa, D., and Dong, J.: Processing of Ice Cloud In Situ Data Collected by Bulk Water, Scattering, and Imaging Probes: Fundamentals, Uncertainties, and Efforts toward Consistency, Meteor. Mon., 58, 11.1–11.33, https://doi.org/10.1175/amsmonographs-d-16-0007.1, 2017.
Mitchell, D. L. and Garnier, A.: Advances in CALIPSO (IIR) cirrus cloud property retrievals – Part 2: Global estimates of the fraction of cirrus clouds affected by homogeneous ice nucleation, EGUsphere [preprint], https://doi.org/10.5194/egusphere-2024-3814, 2024.
Mitchell, D. L., Garnier, A., Pelon, J., and Erfani, E.: CALIPSO (IIR–CALIOP) retrievals of cirrus cloud ice-particle concentrations, Atmos. Chem. Phys., 18, 17325–17354, https://doi.org/10.5194/acp-18-17325-2018, 2018.
Montgomery, M. T., Davis, C., Dunkerton, T., Wang, Z., Velden, C., Torn, R., Majumdar, S. J., Zhang, F., Smith, R. K., Bosart, L., Bell, M. M., Haase, J. S., Heymsfield, A., Jensen, J., Campos, T., and Boothe, M. A.: The pre-depression investigation of cloud-systems in the tropics (PREDICT) experiment: Scientific basis, new analysis tools, and some first results, B. Am. Meteorol. Soc., 93, 153–172, https://doi.org/10.1175/BAMS-D-11-00046.1, 2012.
Muri, H., Kristjánsson, J. E., Storelvmo, T., and Pfeffer, M. A.: The climatic effects of modifying cirrus clouds in a climate engineering framework, J. Geophys. Res., 119, 4174–4191, https://doi.org/10.1002/2013JD021063, 2014.
Murphy, D. M. and Koop, T.: Review of the vapour pressures of ice and supercooled water for atmospheric applications, Q. J. Roy. Meteor. Soc, 131, 1539–1565, https://doi.org/10.1256/qj.04.94, 2005.
Murphy, D. M., Froyd, K. D., Bian, H., Brock, C. A., Dibb, J. E., DiGangi, J. P., Diskin, G., Dollner, M., Kupc, A., Scheuer, E. M., Schill, G. P., Weinzierl, B., Williamson, C. J., and Yu, P.: The distribution of sea-salt aerosol in the global troposphere, Atmos. Chem. Phys., 19, 4093–4104, https://doi.org/10.5194/acp-19-4093-2019, 2019.
NASA Data: ATTREX Campaign, Archived by National Aeronautics and Space Administration, U.S. Government, NASA/LARC/SD/ASDC [data set], https://espo.nasa.gov/attrex (last access: 15 June 2024), 2024a.
NASA Data: MACPEX Campaign, Archived by National Aeronautics and Space Administration, U.S. Government, NASA/LARC/SD/ASDC [data set], https://espo.nasa.gov/macpex (last access: 15 June 2024), 2024b.
NASA Data: NASA-DC3 Campaign, Archived by National Aeronautics and Space Administration, U.S. Government, NASA/LARC/SD/ASDC [data set], https://www-air.larc.nasa.gov/missions/dc3-seac4rs/ (last access: 15 June 2024), 2024c.
NASA Data: POSIDON Campaign, Archived by National Aeronautics and Space Administration, U.S. Government, NASA/LARC/SD/ASDC [data set], https://espo.nasa.gov/posidon (last access: 15 June 2024), 2024d.
NASA Data: SEAC4RS Campaign, Archived by National Aeronautics and Space Administration, U.S. Government, NASA/LARC/SD/ASDC [data set], https://www-air.larc.nasa.gov/missions/seac4rs/ (last access: 15 June 2024), 2024e.
Pan, L. L., Bowman, K. P., Atlas, E. L., Wofsy, S. C., Zhang, F., Bresch, J. F., Ridley, B. A., Pittman, J. V., Homeyer, C. R., Romashkin, P., and Cooper, W. A.: The stratosphere-troposphere analyses of regional transport 2008 experiment, B. Am. Meteorol. Soc., 91, 327–342, https://doi.org/10.1175/2009BAMS2865.1, 2010.
Pan, L. L., Atlas, E. L., Salawitch, R. J., Honomichl, S. B., Bresch, J. F., Randel, W. J., Apel, E. C., Hornbrook, R. S., Weinheimer, A. J., Anderson, D. C., Andrews, S. J., Baidar, S., Beaton, S. P., Campos, T. L., Carpenter, L. J., Chen, D., Dix, B., Donets, V., Hall, S. R., Hanisco, T. F., Homeyer, C. R., Huey, L. G., Jensen, J. B., Kaser, L., Kinnison, D. E., Koenig, T. K., Lamarque, J. F., Liu, C., Luo, J., Luo, Z. J., Montzka, D. D., Nicely, J. M., Pierce, R. B., Riemer, D. D., Robinson, T., Romashkin, P., Saiz-Lopez, A., Schauffler, S., Shieh, O., Stell, M. H., Ullmann, K., Vaughan, G., Volkamer, R., and Wolfe, G.: The convective transport of active species in the tropics (Contrast) experiment, B. Am. Meteorol. Soc., 98, 106–128, https://doi.org/10.1175/BAMS-D-14-00272.1, 2017.
Patnaude, R. and Diao, M.: Aerosol Indirect Effects on Cirrus Clouds Based on Global Aircraft Observations, Geophys. Res. Lett., 47, e2019GL086550, https://doi.org/10.1029/2019GL086550, 2020.
Patnaude, R. J., Perkins, R. J., Kreidenweis, S. M., and DeMott, P. J.: Is Ice Formation by Sea Spray Particles at Cirrus Temperatures Controlled by Crystalline Salts?, ACS Earth Space Chem., 5, 2196–2211, https://doi.org/10.1021/acsearthspacechem.1c00228, 2021a.
Patnaude, R., Diao, M., Liu, X., and Chu, S.: Effects of thermodynamics, dynamics and aerosols on cirrus clouds based on in situ observations and NCAR CAM6, Atmos. Chem. Phys., 21, 1835–1859, https://doi.org/10.5194/acp-21-1835-2021, 2021b.
Patnaude, R. J., Moore, K. A., Perkins, R. J., Hill, T. C. J., DeMott, P. J., and Kreidenweis, S. M.: Low-temperature ice nucleation of sea spray and secondary marine aerosols under cirrus cloud conditions, Atmos. Chem. Phys., 24, 911–928, https://doi.org/10.5194/acp-24-911-2024, 2024.
Roesch, C., Roesch, M., Wolf, M. J., Zawadowicz, M. A., AlAloula, R., Awwad, Z., and Cziczo, D. J.: CCN and INP activity of middle eastern soil dust, Aeolian Res., 52, 100729, https://doi.org/10.1016/j.aeolia.2021.100729, 2021.
Rollins, A. W., Thornberry, T. D., Gao, R. S., Smith, J. B., Sayres, D. S., Sargent, M. R., Schiller, C., Krämer, M., Spelten, N., Hurst, D. F., Jordan, A. F., Hall, E. G., Vömel, H., Diskin, G. S., Podolske, J. R., Christensen, L. E., Rosenlof, K. H., Jensen, E. J., and Fahey, D. W.: Evaluation of UT/LS hygrometer accuracy by intercomparison during the NASA MACPEX mission, J. Geophys. Res., 119, 1915–1935, https://doi.org/10.1002/2013JD020817, 2014.
Sassen, K. and Campbell, J. R.: A Midlatitude Cirrus Cloud Climatology from the Facility for Atmospheric Remote Sensing. Part I: Macrophysical and Synoptic Properties, J. Atmos. Sci., 58, 481–496, https://doi.org/10.1175/1520-0469(2001)058<0481:AMCCCF>2.0.CO;2, 2001.
Sassen, K., Wang, Z., and Liu, D.: Global distribution of cirrus clouds from CloudSat/cloud-aerosol lidar and infrared pathfinder satellite observations (CALIPSO) measurements, J. Geophys. Res.-Atmos., 113, D00A12, https://doi.org/10.1029/2008JD009972, 2008.
Schiller, C., Krämer, M., Afchine, A., Spelten, N., and Sitnikov, N.: Ice water content of Arctic, midlatitude, and tropical cirrus, J. Geophys. Res.-Atmos., 113, D24208, https://doi.org/10.1029/2008JD010342, 2008.
Schnaiter, M., Büttner, S., Möhler, O., Skrotzki, J., Vragel, M., and Wagner, R.: Influence of particle size and shape on the backscattering linear depolarisation ratio of small ice crystals – cloud chamber measurements in the context of contrail and cirrus microphysics, Atmos. Chem. Phys., 12, 10465–10484, https://doi.org/10.5194/acp-12-10465-2012, 2012.
Schneider, J., Höhler, K., Wagner, R., Saathoff, H., Schnaiter, M., Schorr, T., Steinke, I., Benz, S., Baumgartner, M., Rolf, C., Krämer, M., Leisner, T., and Möhler, O.: High homogeneous freezing onsets of sulfuric acid aerosol at cirrus temperatures, Atmos. Chem. Phys., 21, 14403–14425, https://doi.org/10.5194/acp-21-14403-2021, 2021.
Schoeberl, M. R., Jensen, E. J., Pfister, L., Ueyama, R., Wang, T., Selkirk, H., Avery, M., Thornberry, T., and Dessler, A. E.: Water vapor, clouds, and saturation in the tropical tropopause layer, J. Geophys. Res.-Atmos., 124, 3984–4003, https://doi.org/10.1029/2018JD029849, 2019.
Solomon, S., Rosenlof, K. H., Portmann, R. W., Daniel, J. S., Davis, S. M., Sanford, T. J., and Plattner, G. K.: Contributions of stratospheric water vapor to decadal changes in the rate of global warming, Science, 327, 1219–1223, https://doi.org/10.1126/science.1182488, 2010.
Spang, R., Müller, R., and Rap, A.: Radiative effect of thin cirrus clouds in the extratropical lowermost stratosphere and tropopause region, Atmos. Chem. Phys., 24, 1213–1230, https://doi.org/10.5194/acp-24-1213-2024, 2024.
Spichtinger, P. and Cziczo, D. J.: Impact of heterogeneous ice nuclei on homogeneous freezing events in cirrus clouds, J. Geophys. Res., 115, D14208, https://doi.org/10.1029/2009JD012168, 2010.
Stephens, B. B., Long, M. C., Keeling, R. F., Kort, E. A., Sweeney, C., Apel, E. C., Atlas, E. L., Beaton, S., Bent, J. D., Blake, N. J., Bresch, J. F., Casey, J., Daube, B. C., Diao, M., Diaz, E., Dierssen, H., Donets, V., Gao, B. C., Gierach, M., Green, R., Haag, J., Hayman, M., Hills, A. J., Hoecker-Martínez, M. S., Honomichl, S. B., Hornbrook, R. S., Jensen, J. B., Li, R. R., McCubbin, I., McKain, K., Morgan, E. J., Nolte, S., Powers, J. G., Rainwater, B., Randolph, K., Reeves, M., Schauffler, S. M., Smith, K., Smith, M., Stith, J., Stossmeister, G., Toohey, D. W., and Watt, A. S.: The O2/N2 ratio and CO2 airborne Southern Ocean study, B. Am. Meteorol. Soc., 99, 381–402, https://doi.org/10.1175/BAMS-D-16-0206.1, 2018.
Storelvmo, T. and Herger, N.: Cirrus cloud susceptibility to the injection of ice nuclei in the upper troposphere, J. Geophys. Res., 119, 2375–2389, https://doi.org/10.1002/2013JD020816, 2014.
Storelvmo, T., Kristjansson, J. E., Muri, H., Pfeffer, M., Barahona, D., and Nenes, A.: Cirrus cloud seeding has potential to cool climate, Geophys. Res. Lett., 40, 178–182, https://doi.org/10.1029/2012GL054201, 2013.
Tan, X., Huang, Y., Diao, M., Bansemer, A., Zondlo, M. A., DiGangi, J. P., Volkamer, R., and Hu, Y.: An assessment of the radiative effects of ice supersaturation based on in situ observations, Geophys. Res. Lett., 43, 11039–11047, https://doi.org/10.1002/2016GL071144, 2016.
Tompkins, A. M., Gierens, K., and Rädel, G.: Ice supersaturation in the ECMWF integrated forecast system, Q. J. Roy. Meteorol. Soc., 133, 53–63, https://doi.org/10.1002/qj.14, 2007.
Toon, O. B., Maring, H., Dibb, J., Ferrare, R., Jacob, D. J., Jensen, E. J., Johnny Luo, Z., Mace, G. G., Pan, L. L., Pfister, L., Rosenlof, K. H., Redemann, J., Reid, J. S., Singh, H. B., Thompson, A. M., Yokelson, R., Minnis, P., Chen, G., Jucks, K. W., and Pszenny, A.: Planning, implementation, and scientific goals of the studies of emissions and atmospheric composition, clouds and climate coupling by regional surveys (SEAC4RS) field mission, J. Geophys. Res., 121, 4967–5009, https://doi.org/10.1002/2015JD024297, 2016.
UCAR/NCAR: DC3: Low Rate (LRT - 1 sps) Navigation, State Parameter, and Microphysics Flight-Level Data (NetCDF). Version 3.0, UCAR/NCAR – Earth Observing Laboratory [data set], https://doi.org/10.5065/D6BC3WKB, 2018a.
UCAR/NCAR: ORCAS: Low Rate (LRT - 1 sps) Navigation, State Parameter, and Microphysics Flight-Level Data. Version 1.1, UCAR/NCAR – Earth Observing Laboratory [data set], https://doi.org/10.5065/D65T3HWR, 2018b.
UCAR/NCAR: HIPPO2: Low Rate (LRT - 1 sps) Navigation, State Parameter, and Microphysics Flight-Level Data. Version 5.0, UCAR/NCAR – Earth Observing Laboratory [data set], https://doi.org/10.5065/D6JW8C64, 2019a.
UCAR/NCAR: HIPPO3: Low Rate (LRT - 1 sps) Navigation, State Parameter, and Microphysics Flight-Level Data. Version 5.0, UCAR/NCAR – Earth Observing Laboratory [data set], https://doi.org/10.5065/D6QF8R6R, 2019b.
UCAR/NCAR: HIPPO4: Low Rate (LRT - 1 sps) Navigation, State Parameter, and Microphysics Flight-Level Data. Version 3.0, UCAR/NCAR – Earth Observing Laboratory [data set], https://doi.org/10.5065/D6V40SK6, 2019c.
UCAR/NCAR: HIPPO5: Low Rate (LRT - 1 sps) Navigation, State Parameter, and Microphysics Flight-Level Data. Version 3.0, UCAR/NCAR – Earth Observing Laboratory [data set], https://doi.org/10.5065/D6CZ35HX, 2019d.
UCAR/NCAR: START08: Low Rate (LRT - 1 sps) Navigation, State Parameter, and Microphysics Flight-Level Data. Version 2.0, UCAR/NCAR – Earth Observing Laboratory [data set], https://doi.org/10.5065/D6NZ85Z4, 2019e.
UCAR/NCAR: TORERO: Low Rate (LRT - 1 sps) Navigation, State Parameter, and Microphysics Flight-Level Data. Version 3.0, UCAR/NCAR – Earth Observing Laboratory [data set], https://doi.org/10.5065/D6668BHR, 2019f.
UCAR/NCAR: CONTRAST: Low Rate (LRT - 1 sps) Navigation, State Parameter, and Microphysics Flight-Level Data. Version 1.3, UCAR/NCAR – Earth Observing Laboratory [data set], https://doi.org/10.5065/D6TX3CK0, 2021a.
UCAR/NCAR: PREDICT: Low Rate (LRT - 1 sps) Navigation, State Parameter, and Microphysics Flight-Level Data. Version 3.0, UCAR/NCAR – Earth Observing Laboratory [data set], https://doi.org/10.5065/D61R6NV5, 2021b.
Ullrich, R., Hoose, C., Möhler, O., Niemand, M., Wagner, R., Höhler, K., Hiranuma, N., Saathoff, H., and Leisner, T.: A new ice nucleation active site parameterization for desert dust and soot, J. Atmos. Sci., 74, 699–717, https://doi.org/10.1175/JAS-D-16-0074.1, 2017.
Volkamer, R., Baidar, S., Campos, T. L., Coburn, S., DiGangi, J. P., Dix, B., Eloranta, E. W., Koenig, T. K., Morley, B., Ortega, I., Pierce, B. R., Reeves, M., Sinreich, R., Wang, S., Zondlo, M. A., and Romashkin, P. A.: Aircraft measurements of BrO, IO, glyoxal, NO2, H2O, O2–O2 and aerosol extinction profiles in the tropics: comparison with aircraft-/ship-based in situ and lidar measurements, Atmos. Meas. Tech., 8, 2121–2148, https://doi.org/10.5194/amt-8-2121-2015, 2015.
Wang, D., Yang, C. A., and Diao, M.: Validation of satellite-based cloud phase distributions using global-scale in situ airborne observations, Earth Space Science, 11, e2023EA003355, https://doi.org/10.1029/2023EA003355, 2024.
Wofsy, S. C.: HIAPER Pole-to-Pole Observations (HIPPO): Fine-grained, global-scale measurements of climatically important atmospheric gases and aerosols, Philos. T. Roy. Soc. A, 369, 2073–2086, https://doi.org/10.1098/rsta.2010.0313, 2011.
Woods, S., Lawson, R. P., Jensen, E., Bui, T. P., Thornberry, T., Rollins, A., Pfister, L., and Avery, M.: Microphysical Properties of Tropical Tropopause Layer Cirrus, J. Geophys. Res.-Atmos., 123, 6053–6069, https://doi.org/10.1029/2017JD028068, 2018.
Zhou, C., Dessler, A. E., Zelinka, M. D., Yang, P., and Wang, T.: Cirrus feedback on interannual climate fluctuations, Geophys. Res. Lett., 41, 9166–9173, https://doi.org/10.1002/2014GL062095, 2014.
Zondlo, M. A., Paige, M. E., Massick, S. M., and Silver, J. A.: Vertical cavity laser hygrometer for the National Science Foundation Gulfstream-V aircraft, J. Geophys. Res.-Atmos., 115, D20309, https://doi.org/10.1029/2010JD014445, 2010.