the Creative Commons Attribution 4.0 License.
the Creative Commons Attribution 4.0 License.
 | 08 Jul 2025
Measurement report: Crustal materials play an increasing role in elevating particle pH – insights from 12-year records in a typical inland city of China
Hongyu Zhang
Zhangsen Dong
Xiao Li
Ruiqin Zhang
Particle acidity serves as a key determinant in atmospheric chemical processes. Emerging concerns regarding aerosol acidity trends have been highlighted amid China's sustained initiatives to mitigate emissions of both acidic and alkaline precursors, especially in North China, which is significantly affected by dust aerosol. 12-year observational data in Zhengzhou reveal that the annual average PM2.5 concentration decreased from in 2011 to in 2022, with the largest reduction in sulfate (73 %). Correspondingly, the annual particle pH increased by 0.10 units from 2011–2019. In addition, the elevated particle pH in 2015 and 2018 was notably influenced by the increase in TNHx (). Note that the crustal material concentrations and their proportions increased significantly during 2019–2022, which might be responsible for the resuspension of surrounding soil dust. Even though the TNHx concentration was decreasing, the annual average growth rate of pH values increased to 0.21 units from 2019–2022. This phenomenon is not unique to Zhengzhou, as major cities in the North China Plain have also experienced a pronounced upward trend in coarse particles after 2019. Therefore, the long-term evolution of particle acidity in North China will require comprehensive consideration of synergistic effects involving acidic precursors, ammonia, and crustal materials.
- Article
(2649 KB) - Full-text XML
-
Supplement
(2652 KB) - BibTeX
- EndNote


-
Crustal material concentrations and their proportions increased significantly during 2019–2022.
-
The resuspension of surrounding soil dust may determine the rebound of crustal material concentrations.
-
Rebound in crustal material further elevated the particle pH.
Particle acidity is a critical parameter that affects atmospheric chemistry, such as the gas–particle partitioning of semi-volatile and volatile species (Surratt et al., 2010; Guo et al., 2016), the solubility of metals (Tao and Murphy, 2019), acid-catalyzed reactions (Rengarajan et al., 2011), and acid deposition (Mao et al., 2009), thereby determining aerosol concentration and chemical composition, as well as impacting human health, ecosystems, and climate (Li et al., 2017; Pye et al., 2020; Su et al., 2020; Nenes et al., 2021). Generally, the global fine particulate matter (PM2.5, aerodynamic diameter≤2.5 µm) exhibits a bimodal pH distribution ranging from 1–3 (e.g., in the United States and Europe) (Guo et al., 2015; Battaglia et al., 2017; Masiol et al., 2020; Zhang et al., 2021) and 4–5 (e.g., in East Asia) (Kim et al., 2022; Sharma et al., 2022). The atmosphere rich in gaseous ammonia (NH3) and crustal material (CM) shows significant pH buffering effects (Wang et al., 2020; Zheng et al., 2020; Karydis et al., 2021), which is a dominant factor that drives the high particle pH in East Asia (Karydis et al., 2021; Zhang et al., 2021; Kim et al., 2022; Sharma et al., 2022).
In recent years, the changing trends in particle pH have become a research focus, especially in China, in response to air pollution control policies, i.e., Air Pollution Prevention and Control Action Plan (2013–2018) and Three-Year Action Plan (2018–2020). The annual average PM2.5 concentration in Beijing dropped by 64 % from 89.5 µg m−3 in 2013 to 32 µg m−3 in 2023 (MEP, 2023), with a clear downward trend of sulfate concentration and nitrate surpassing sulfate as the primary component (Zhai et al., 2019; Zhou et al., 2019; Li et al., 2023). The atmospheric behavior of ammonium, governed by gas–particle partitioning processes involving ammonia (NH3) as the predominant alkaline gas, demonstrates notable stability in concentration levels, with observational records showing less than 5 % interannual variation in NH3 column densities over North China during 2015–2019 (Dong et al., 2023). Under such conditions, the dominant inorganic aerosol component transitions from ammonium sulfate to ammonium nitrate. This compositional shift enhances atmospheric particulate hygroscopicity due to ammonium nitrate's superior water uptake capability, ultimately elevating particle pH levels through aqueous-phase dilution mechanisms (Wexler and Seinfeld, 1991; Pinder et al., 2007, 2008; Heald et al., 2012; Weber et al., 2016). For instance, a significant increase in the nitrate-to-sulfate molar ratio from 2014–2017 in Beijing resulted in the particle pH increasing from 4.4–5.4 (Xie et al., 2020). Moreover, increased NH3 concentrations raised particle pH by 0.3–0.4 units from 2014/2015–2018/2019 in Beijing (Song et al., 2019). Over Europe and North America, the pH increased strongly from about 2.8 and 2.2 during the 1970s to 3.9 and 3.3 in 2020, respectively, especially during the 1990s, with significantly increasing NH3 emission (Karydis et al., 2021). On the contrary, modeling results indicate a continuous decline in pH in East Asia from 1970–2020 due to sharp increases in SO2 and NOx emissions (Karydis et al., 2021). In addition, the PM2.5 pH showed a slight decrease of 0.13 from 2018–2022 summer in Beijing due to the change in total nitrate () (Li et al., 2023). Moreover, Zhou et al. (2022) found a decreasing pH trend from 2011–2019 in eastern China, primarily influenced by temperature, followed by sulfate and non-volatile cations. Similarly, Nah et al. (2023) observed a decreasing pH trend from 2011–2020 in Hong Kong SAR, attributing it to temperature and sulfate levels. Thus, concerns have been raised about the potential increase in the acidity of aerosol and precipitation due to China's ongoing efforts to reduce ammonia emissions, which pose severe health risks and acid deposition (Liu et al., 2019; Shi al., 2019).
In addition to NH3, CM is another key alkaline substance that buffers particle pH. Ca2+ can form insoluble CaSO4 with sulfate, reducing sulfate concentration in the aqueous phase of aerosol and thus lowering H+ and aerosol liquid water content (ALWC) concentrations and enhancing particle pH (Ding et al., 2019; Karydis et al., 2021). Moreover, non-volatile cations can lower the molar ratio of ammonia to sulfate, leading to an increase in particle pH (Zheng et al., 2022). Karydis et al.'s (2021) framework demonstrated that CM played a critical buffering role in sustaining aerosol pH of around 7 across the Middle East arid regions. The model sensitivity tests revealed that under hypothetical dust-free conditions (CM=0), aerosol acidity would escalate to pH∼4 due to domination. Wang et al. (2022a) reported that non-volatile cations accounted for approximately 8 %–17 % of hourly aerosol pH variation. Li et al. (2023) indicated that the buffering effect of cations was the major reason for the relatively small pH changes from 2018–2022 in Beijing, emphasizing that reducing coarse particle emissions in the future could significantly decrease particle pH. In addition, there was a rising trend in the contribution of CM to particle pH in Tianjin, China (Shi et al., 2017). Therefore, it is evident that CM has a significant impact on the variation of particle pH, especially in North China, which is significantly affected by dust aerosol, but the trend of CM concentration and its long-term implications are still lacking unfortunately.
Zhengzhou presents unique atmospheric chemistry that distinguishes it from other megacities in North China. As the capital of China's foremost agricultural province (Henan Province, contributing 18 % of national NH3 emissions), Zhengzhou's PM2.5 composition combined substantial crustal material (15±3 % in PM2.5 vs. <10 % in Beijing) with exceptional ammonia abundance (Huang et al., 2012; Liu et al., 2018; Wang et al., 2018a). This created distinct particle acidity characteristics, maintaining pH 4.5–6.0 compared to lower pH levels (3.3–5.4) in other cities like Beijing (Ding et al.,2019; Zhang et al., 2021). However, two critical research gaps persist: (1) the long-term evolution of CM under control policies remains unquantified, and (2) the role of CM in pH buffer capacity in NH3-enriched environments lacks systematic assessment.
To address these gaps, our study pioneers the first multi-decadal analysis (2011–2022) coupling PM2.5 components with thermodynamic modeling through three key innovations: (1) revealing the long-term trends of CM, (2) analyzing the variations of CM sources, and (3) exploring the pH trend and its relationship with CM. The resultant findings advance our understanding of urban aerosol acidity chemistry by underscoring the critical role of CM.
2.1 Instruments and measurements
Sampling was conducted on the fourth-floor platform at Zhengzhou University (34.75° N, 113.61° E) in Zhengzhou, China. The sampling site (Fig. S1 in the Supplement), approximately 14 m above the ground, is primarily surrounded by residential areas with well-developed transportation networks and no significant industrial sources. There are two highways located 3 km to the south and 7 km to the east. Additionally, a coal-fired power plant located 6 km to the east was shut down in 2020, and a gas-fired power plant is situated 3 km to the south.
Samples were collected using a high-volume sampler (TE-6070D, Tisch, USA) and air particulate samplers (TH-16 A, Tianhong, China) from April 2011–December 2022. Two quartz filters and two Teflon filters were used daily from 10:00 am to 09:00 am the next day, resulting in a total of 5848 samples. After excluding abnormal data due to instrument malfunctions, 4228 valid samples were obtained. Detailed information on the samples is provided in Table S1 in the Supplement. Organic carbon (OC) and elemental carbon (EC) were analyzed using a carbon analyzer (Model 5L, Sunset Laboratory, USA). Water-soluble inorganic ions (Cl−, , , Na+, , K+, Mg2+, and Ca2+) were measured using ion chromatography (ICS-90 and ICS-900 models, Dionex, USA) (Yu et al., 2017; Jiang et al., 2018). Elements were analyzed using a wavelength-dispersive X-ray fluorescence spectrometer (S8 TIGER, Bruker, Germany) to determine concentrations of Fe, Na, Mg, Al, Si, Cl, K, Ca, V, Ni, Cu, Zn, Cr, Mn, Co, Cd, Ga, As, Se, Sr, Sn, Sb, Ba, and Pb (Tremper et al., 2018). Meteorological conditions, including temperature (T), relative humidity (RH), and wind speed (WS), were obtained using an automatic weather station (Wang et al., 2019). Blank filters were also routinely analyzed with each batch of samples to detect sample contamination and provide quality assurance on the elemental concentrations. Detailed analytical methods and quality control are described in the Supplement (Text S1). The method detection limits and measurement uncertainties are summarized in Table S2 in the Supplement. The quality assurance protocol excluded temporally discrete dust storm and precipitation periods to prevent contamination of the source analysis of CM and modeling particle pH, given that such events induce non-representative extremes in both crustal element concentrations and pH values, coupled with elevated PM measurement uncertainties. The annual mean PM2.5 concentration data for cities in the North China Plain were obtained from the China National Environmental Monitoring Center (CNEMC), available at https://www.cnemc.cn/ (last access: 5 June 2024).
2.2 Data analysis
2.2.1 Mass reconstruction
The calculation method for CM is as follows (Tian et al., 2016):
where [Al], [Si], [Ca], [Fe], and [Ti] represent the concentrations of the respective elements (µg m−3), but Ti was not measured.
2.2.2 Thermodynamic model
The particle pH was calculated using the ISORROPIA-II mode (version 2.1, http://isorropia.eas.gatech.edu, last access: 20 May 2024). The input data (excluding RH≤30 %), including , TNO3 (), TNHx (), Ca2+, K+, Na+, Mg2+, Cl−, RH, and T, with the temporal resolution aligned with the sampling periods (from 10:00 am to 09:00 am the following day). The concentrations of hydrogen ions in air () and ALWC were derived from the Na+ – K+ – Ca2+ – Mg2+ – – – – Cl− – H2O equilibrium composition system. Activity coefficients for H+ and OH− were fixed at unity, while other ion pairs (e.g., H+–Cl−) employed the Kusik–Meissner parameterization for ionic activity calculations (Fountoukis and Nenes, 2007). pH values were calculated using the following formula:
where ALWCi and ALWCo refer to the ALWC for inorganic and organic components, respectively. morg denotes the mass of organic aerosol, ρw is the density of water (1.0 g cm−3), ρorg is the density of organic material (1.4 g cm−3) (Guo et al., 2015), and korg is the hygroscopicity parameter for organic aerosol (0.087) (Chang et al., 2010; Li et al., 2016). The ISORROPIA-II model operated under metastable conditions in the forward mode. Due to the lack of measured data for gaseous HNO3 and NH3, TNO3 was represented solely by . The concentration of NH3 was simulated based on a linear regression equation proposed by Wei et al. (2023), who used the same data as this study from 2013–2020:
where , , , and Cl− correspond to their respective concentrations (µg m−3). To validate the applicability of Eq. (4) for annual NH3 estimation and pH simulation in Zhengzhou, this study utilized both observed NH3 data (from a Thermo Scientific URG-9000D ambient ion monitor, USA) and calculated NH3 values derived from Eq. (4) at the same monitoring site throughout 2022, inputting them into the thermodynamic model for pH simulation. As shown in Fig. S2 in the Supplement, pH values calculated from observed and simulated NH3 exhibit good agreement (r=0.97, P<0.01). Furthermore, NH3 concentrations modeled by ISORROPIA demonstrate a significant correlation (r=0.95, P<0.01) with those simulated by Eq. (4). These results collectively demonstrate the reliability of the NH3 estimation method in this study.
2.2.3 HYSPLIT analysis
Backward trajectories were calculated using the mixed-particle Lagrangian integrated trajectory method (HYSPLIT, https://www.ready.noaa.gov/HYSPLIT_traj.php, last access: 2 April 2025). Meteorological input data were from the Global Data Assimilation System (GDAS) with 3D wind vectors, temperature, relative humidity, geopotential height, surface pressure, and boundary layer diagnostics. 24 h backward trajectories were simulated for air masses arriving at 100 m above ground level in Zhengzhou, a receptor height aligned with the city's average elevation (∼100 m above sea level) to capture near-surface pollutant transport dynamics within the boundary layer.
Trajectories from 2013–2018 and 2019–2022 were independently clustered via the angle distance algorithm to compare policy-driven variations (Wang et al., 2009). The optimal cluster number (three, Fig. S3 in the Supplement) was determined by tracking total spatial variance (TSV), with classification finalized at the inflection point preceding the second TSV surge.
3.1 Temporal variations in chemical components
Over the past 12 years, the Chinese government has implemented two major policies to mitigate air pollution: the Air Pollution Prevention and Control Action Plans (2013–2018) and the Three-Year Action Plan (2018–2020), with key targets and measures detailed in Tables S3 and S4 in the Supplement. The 2013–2018 policy prioritized end-of-pipe controls in power generation and heavy industries, mandating ≥10 % PM10 reduction nationwide and region-specific PM2.5 reduction targets (25 % for Beijing–Tianjin–Hebei, 20 % for Yangtze River Delta, and 15 % for Pearl River Delta). Subsequently, the 2018–2020 campaign shifted toward structural reforms and multi-pollutant synergistic governance, enforcing ≥15 % nationwide emission cuts and ≥18 % PM2.5 reduction in non-compliant cities relative to 2015 levels.
The long-term trends in PM2.5 concentrations and its chemical components in Zhengzhou from 2011–2022 are depicted in Fig. 1, with annual average concentrations listed in Table 1. Correspondingly, the annual average concentration of PM2.5 in Zhengzhou decreased from in 2011 to in 2022, representing a reduction of approximately 63 %. In particular, the reduction rate reached 72 % after 2013. As for chemical components, the largest reductions were observed in (79 %), decreasing from in 2013 to in 2022, followed by EC (76 %). Additionally, the concentrations of and also significantly decreased by 68 % and 56 %, respectively. The proportion of each component in PM2.5 (Fig. S4 in the Supplement) reveals a decrease in , K+, and Cl−, indicating effective control measures targeting coal and biomass combustion (Lei et al., 2021). However, the proportions of and OC in PM2.5 rose from 11 % and 12 % in 2013 % to 13 % and 17 % in 2022, respectively, similar to the trend observed in the North China Plain (Wen et al., 2018; Zhai et al., 2019; Li et al., 2023).
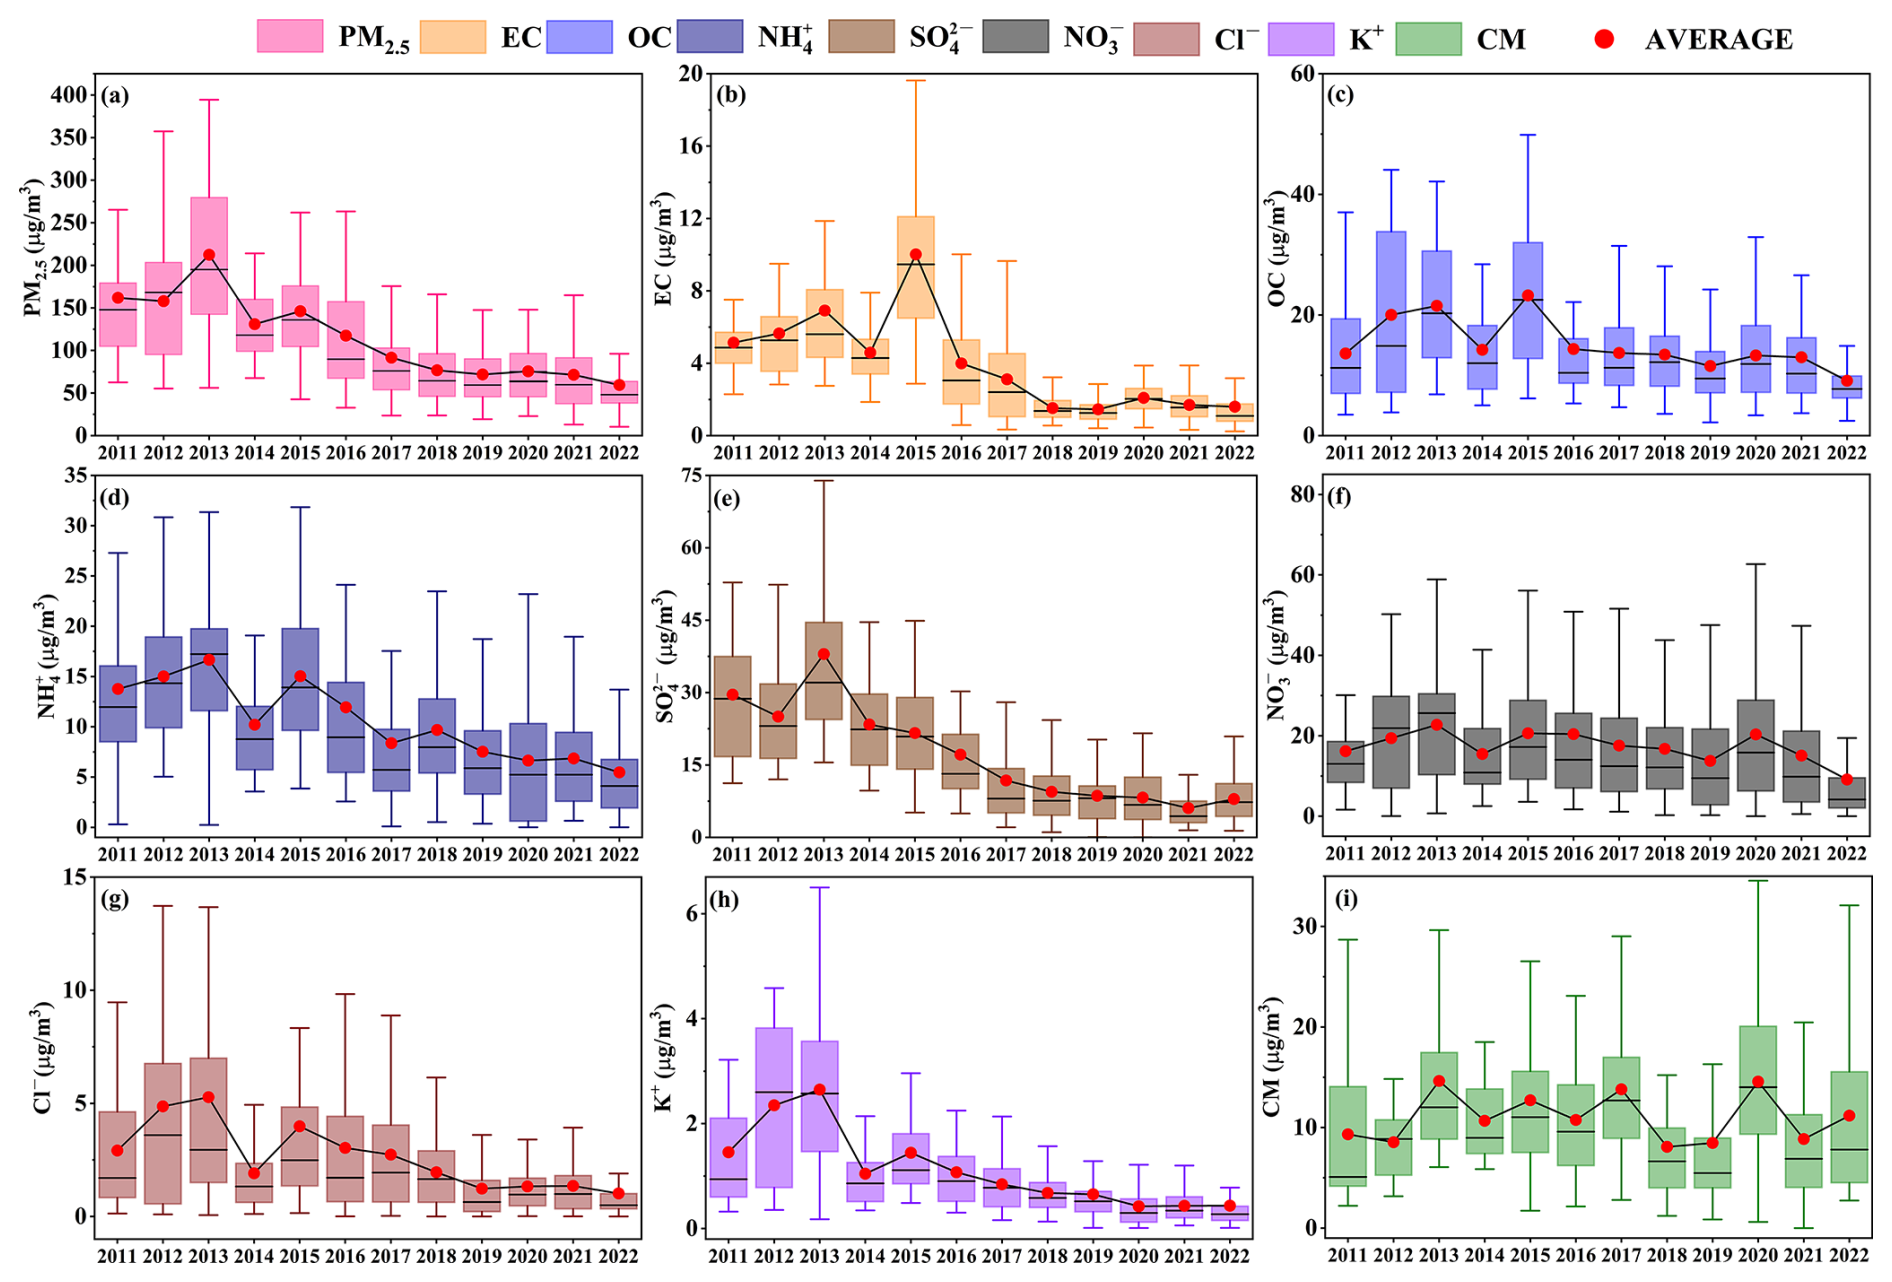
Figure 1Long-term trends in the concentrations of PM2.5 and its chemical components in from 2011–2022 in Zhengzhou. Box plots depict annual averages (red dots) and medians (black lines); the top, middle, and bottom lines represent the 75, 50, and 25 percentiles of statistical data, respectively; and the upper and lower whiskers represent the 90 and 10 percentiles of statistical data, respectively.
Table 1Annual average concentrations of PM2.5 and its components from 2011–2022 in Zhengzhou, China (µg m−3).
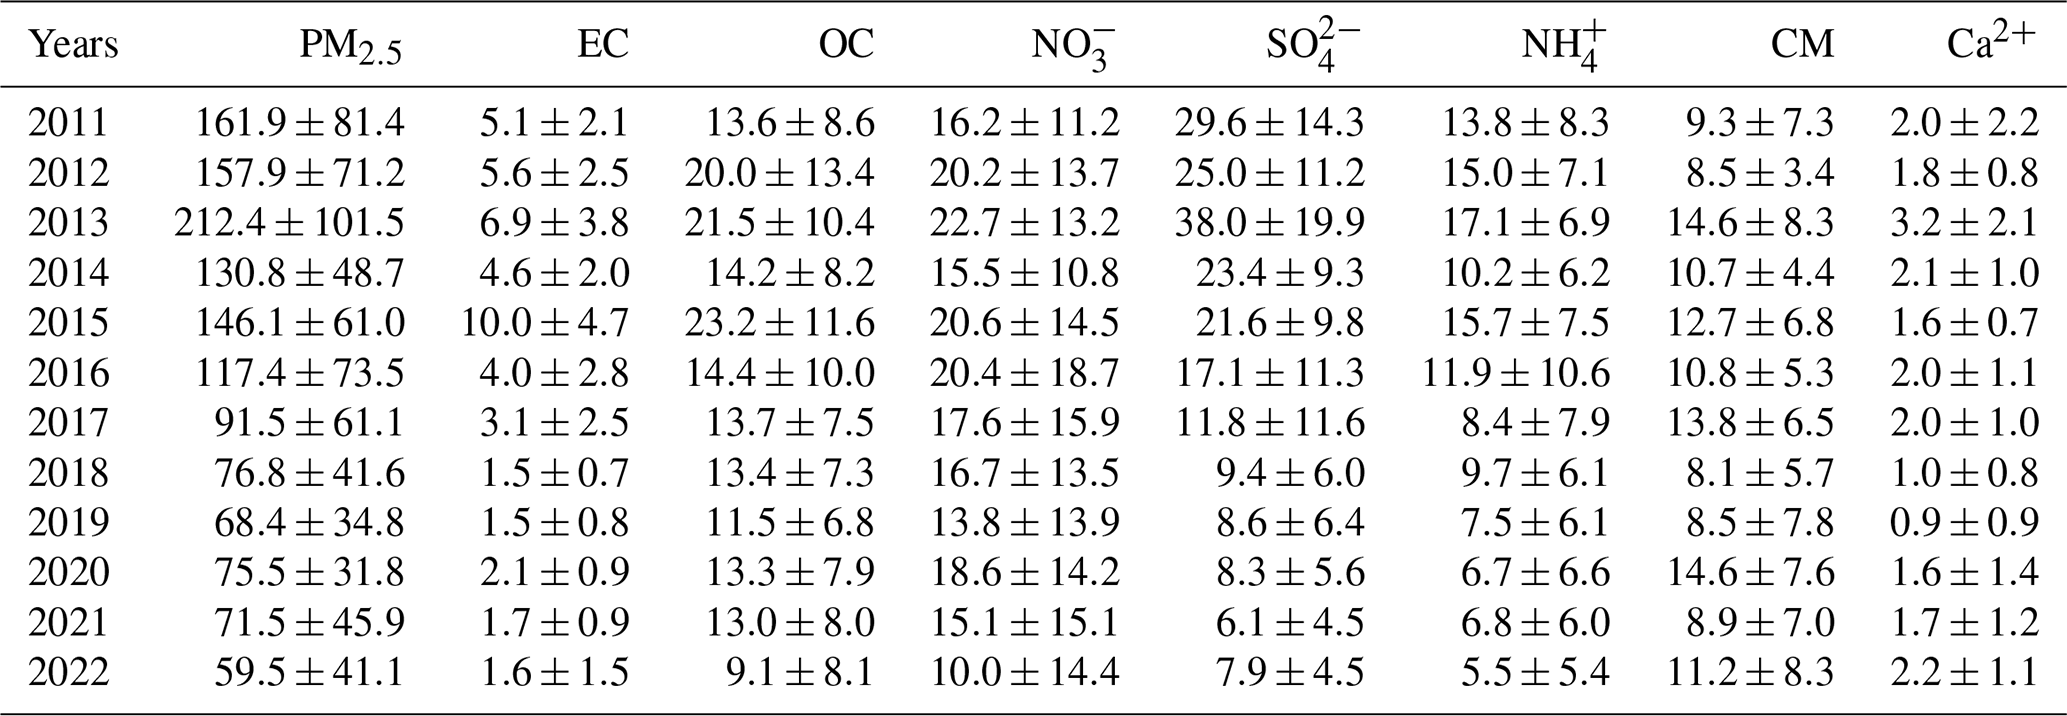
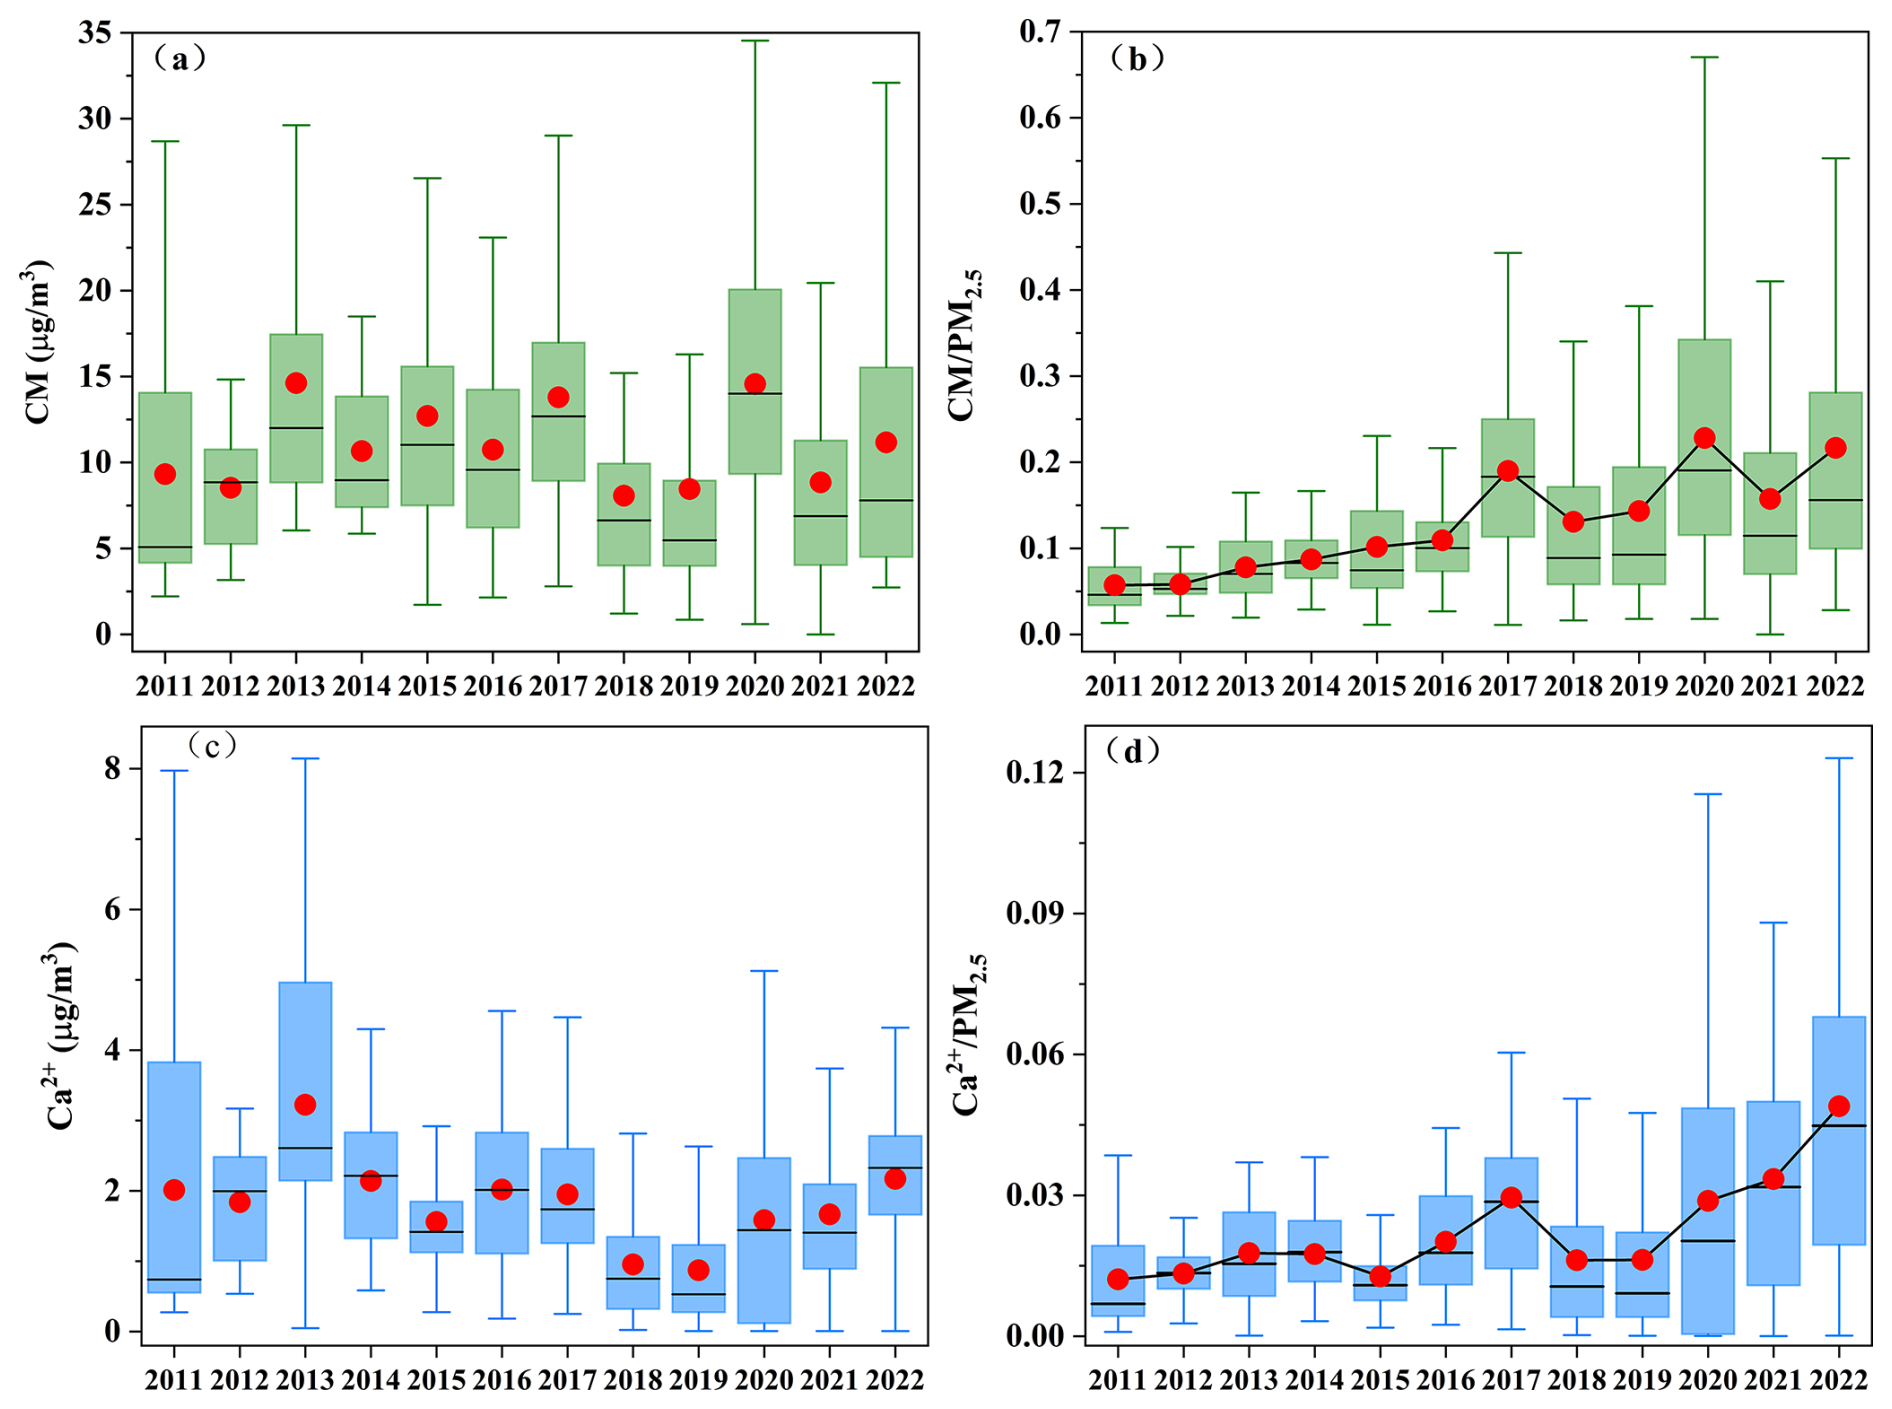
Figure 2(a, c) Long-term trends in CM and Ca2+ concentrations in Zhengzhou from 2011–2022, respectively. Box plots depict annual averages (red dots) and medians (black lines). (b, d) Long-term trends in the proportions of CM and Ca2+ in PM2.5, respectively.
3.2 Temporal variations in CM
Notably, there is no clear declining trend in the CM concentration, with a rebound observed during 2020–2022 (Fig. 1i). Furthermore, the proportion of CM in PM2.5 exhibits a significant upward trend (Fig. S4). To further analyze its trend, sampling data were divided into three periods corresponding to governmental stages: 2011–2013, when no special control measures were implemented; 2013–2019, coinciding with the implementation of the Air Pollution Prevention and Control Action Plan; and 2019–2022, coinciding with the Three-Year Action Plan. During these periods, Henan Province and the city of Zhengzhou implemented several dust control policies summarized in Table S5 in the Supplement. As shown in Fig. 2a and b, the mass concentration of CM peaked at in 2013, accounting for 8 % of PM2.5. To evaluate the interannual change trend of CM, the Mann–Kendall method, Sen's slope, and least-squares (LS) slope were comprehensively used with the results presented in Table S6 in the Supplement. From 2013–2019, the CM concentration notably decreased from 14.6±8.3 to , with an annual average decline rate of 0.81 from LS slope (0.015 from Sen's slope). Apart from control measures, the interannual meteorological analysis shows (Fig. S5 in the Supplement) WS exhibited a declining trend, with a decrease rate of 43 %, while RH showed an increasing trend at a rate of 8 % from 2013–2019, under which conditions that were unfavorable for dust resuspension (Wang et al., 2013, 2018b). Seasonal trends (Fig. S6 in the Supplement) reveal significant declines in CM during spring in 2013–2019, with WS decreasing from 2.2 m s−1 in 2013 to 1.4 m s−1 in 2019 (Fig. S7 in the Supplement) and stable RH (Fig. S8 in the Supplement). Similarly, summer CM reductions in 2013–2019 corresponded with WS declines. These patterns suggest spring–summer CM improvements resulted from the synergistic effects of meteorological changes and dust control policies. Conversely, autumn–winter seasons showed limited CM reductions despite comparable WS decreases in 2013–2019, highlighting the need for enhanced dust emission controls in Zhengzhou during these seasons. As for the individual crustal elements in Fig. S9 in the Supplement, Ca exhibited the highest average annual decline rate of 33 % during 2013–2019, followed by Al. Si showed a less pronounced decline, attributed to its association with soil dust, where control measures for exposed soil are lacking (Zhang et al., 2020). In addition, the Ca2+ concentration as depicted in Fig. 2c decreased from in 2013 to in 2019, with an approximate annual average decline rate of 0.32 ) from LS slope ( from Sen's slope) in Table S6, further demonstrating the decline in dust source. It is worth noting that the proportions of CM, Ca, Al, Fe, Si, and Ca2+ in PM2.5 showed consecutive annual increases from 2013–2019, with CM proportion increasing from 8 % in 2013 % to 14 % in 2019, indicating that CM reduction lagged behind PM2.5 reduction efforts in Zhengzhou during this period. Additionally, both concentration and proportion of Ca2+ in 2022 ( and 5 %) were higher than in other cities of China, such as Beijing (1.0 µg m−3 and 2.8 %), Tianjin (0.5 µg m−3 and 1.4 %), and Xiamen (0.48 µg m−3 and 1.5 %) (Shi et al., 2017; Xu et al., 2025; Zhang et al., 2021). These results indicate that CM remained an important component of PM2.5 in Zhengzhou.
During 2019–2022, both CM and Ca2+ concentrations exhibited significant rebounds, with annual growth rates of 0.24 and 0.4 from LS slope ( and from Sen's slope), respectively, and their proportions increased from 14 % and 2 % in 2019 % to 22 % and 5 % in 2022. CM concentrations rebounded in all seasons, particularly in winter (Fig. S6). Changes in meteorological conditions may be a significant factor contributing to these concentration rebounds, accompanied by the average WS increased by 0.14 m s−1 and RH decreased by 7 % from 2020–2022 (Figs. S5, S7, and S8), facilitating dust resuspension. Furthermore, the lack of more effective dust control measures, as indicated by the absence of significant changes in the dust control policies from the Air Pollution Prevention and Control Action Plan and Three-Year Action Plan, may be another important factor contributing to the rebound of dust.
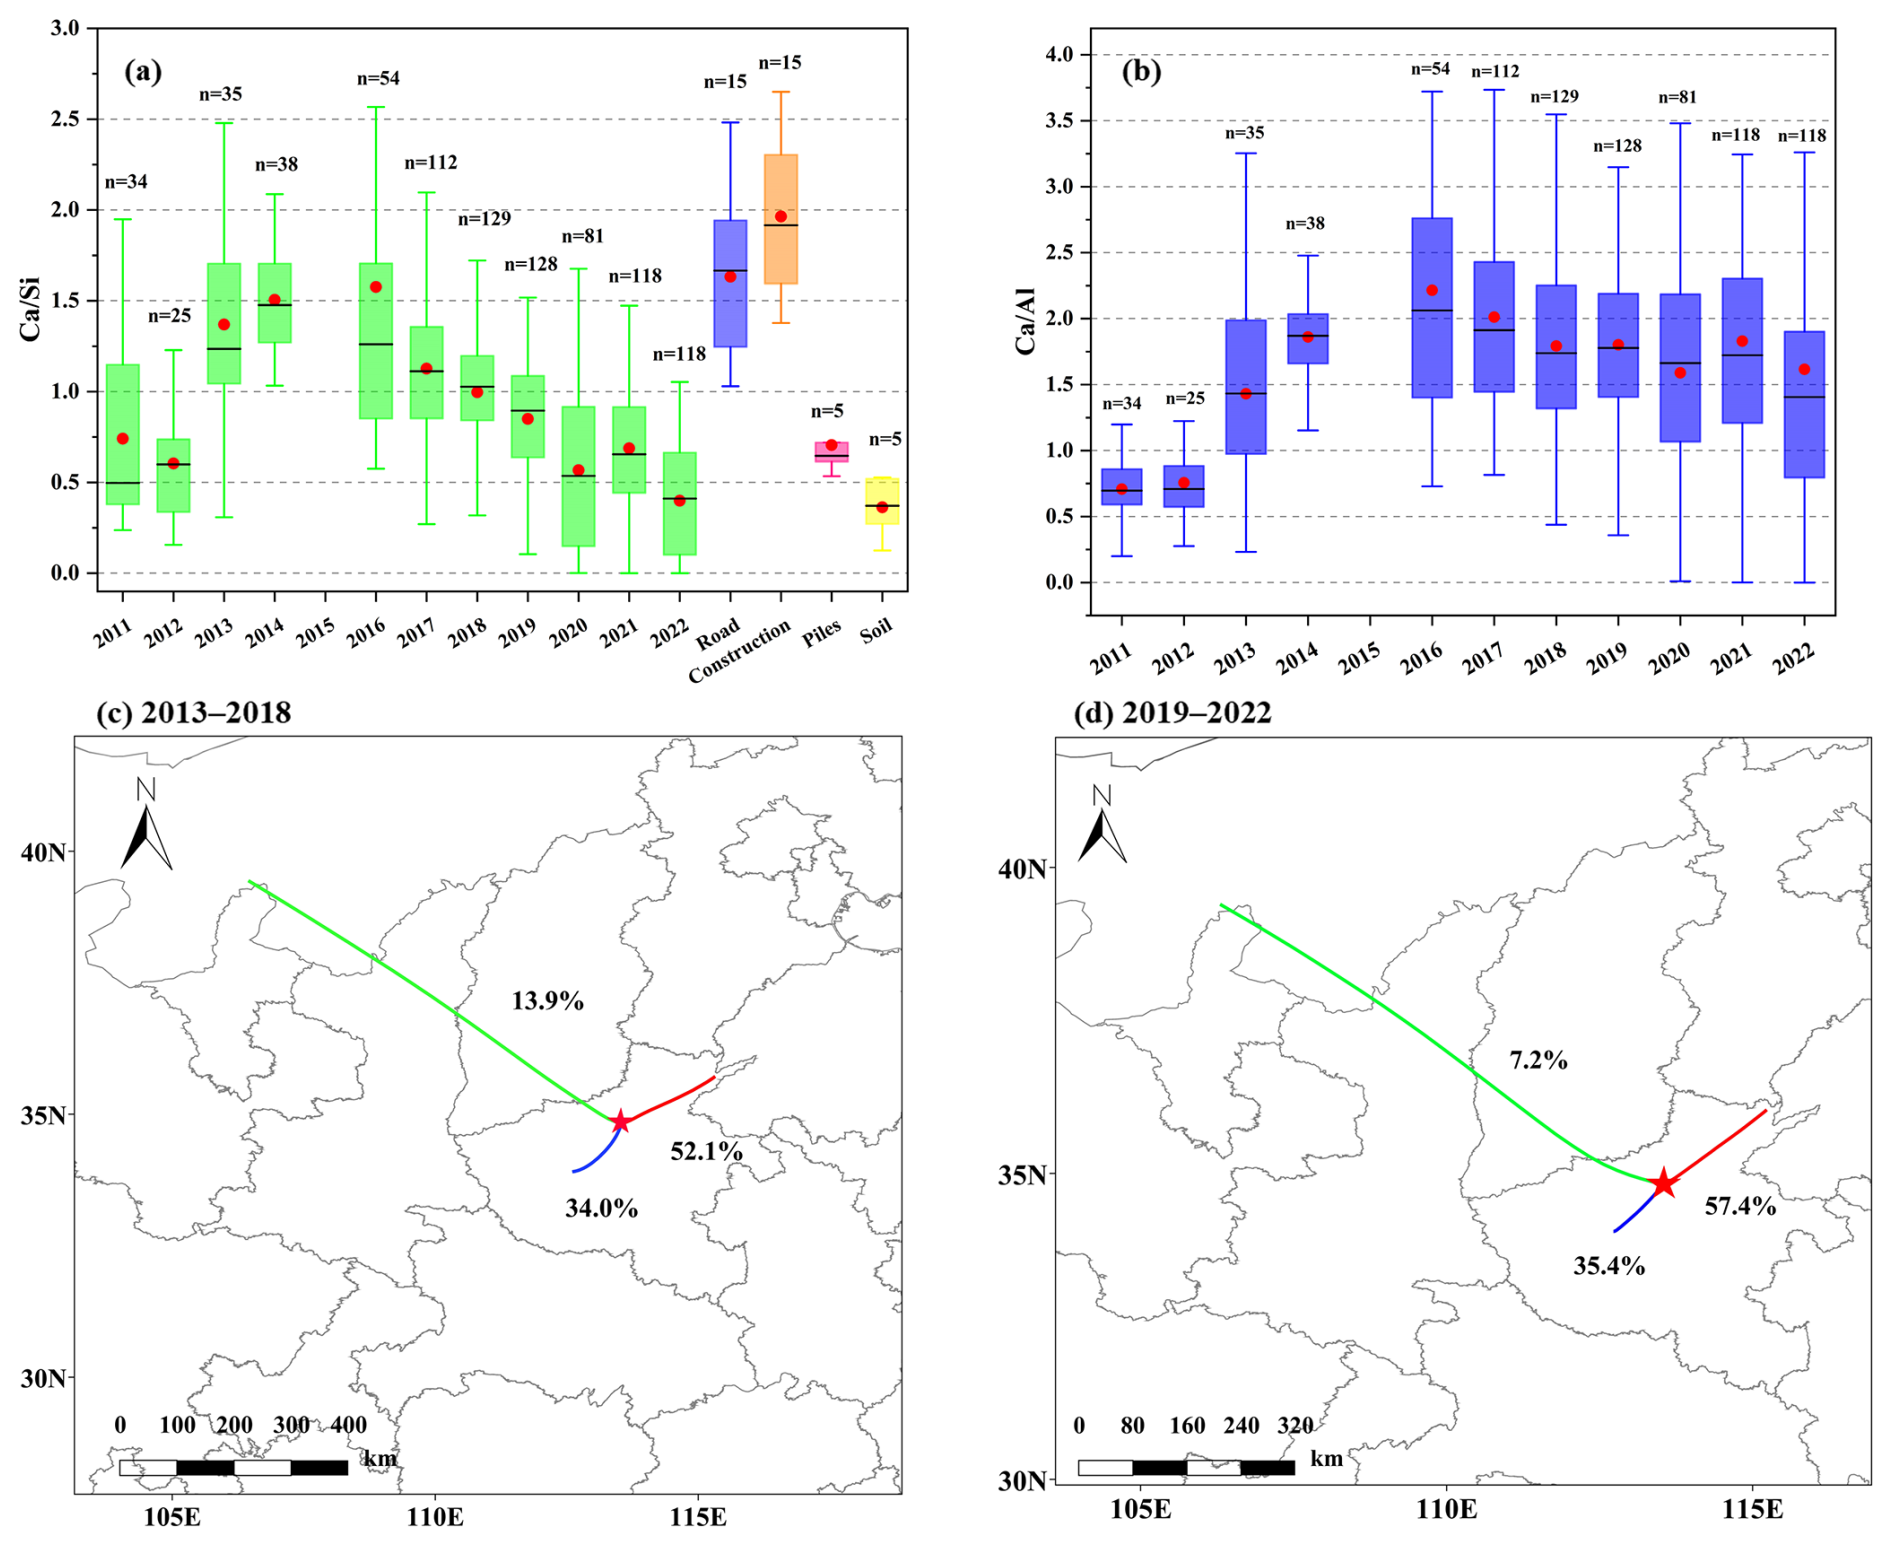
Figure 3(a) The annual ratios in Zhengzhou from 2011–2022 compared with those in various dust sources (specific values and references in Table S7). The red dots and black lines in the box plots represent the annual averages and medians, respectively, with n indicating the sample size. (b) The ratios in Zhengzhou from 2011–2022. The red dots and black lines in the box plots represent the annual averages and medians, respectively, with n indicating the sample size. (c, d) The transport pathways of CM during 2013–2018 and 2019–2022, respectively.
3.3 Sources of CM
Elemental ratios were employed to characterize the sources of CM, with the ratio widely recognized as a reliable indicator of sandy origin (Zhang et al., 2017). In addition, significant variations in ratios (Table S7 in the Supplement) were observed among different dust sources (road, construction, piles, soil). Figure 3a illustrates the trend in ratios from 2011–2022. After 2013, ratios showed a declining trend annually, with the average ratio decreasing from a peak of 1.6 in 2016 to a lowest of 0.4 in 2022. Compared with ratios from different types of dust sources, the effect of road and construction dust on CM has gradually decreased. This may be attributed to the implementation of dust control measures such as enclosure, shielding, and dust suppression at construction and demolition sites, as well as dust control on ground surfaces and roads (Table S5). During 2019–2022, the average ratio remained below 1, with a mean of 0.4 in 2022, indicating that soil dust predominantly contributed to CM. Currently, measures for controlling soil-suspended dust are limited, primarily relying on long-term strategies such as afforestation and increasing urban green coverage, thus requiring a longer process and sustained investment.
Sand dust transport serves as a significant source of CM in the North China Plain (Zhang et al., 2024). The ratio from 2016–2022 (Fig. 3b) shows minimal variation, with annual averages ranging between 1.5 and 2.5, indicating no significant changes in the source regions of sand. The transport trajectories (Fig. 3c and d) reveal that a marked decline in the contribution of long-distance sand dust transport originating from Inner Mongolia (via Shaanxi and Shanxi provinces) from 13.9 % during 2013–2018 to 7.2 % in 2019–2022. In contrast, local transport within Henan Province and short-distance transport from Shandong Province exhibited contrasting increases. These findings suggest that the rebound in CM concentrations during 2019–2022 in Zhengzhou might be responsible for the resuspension of surrounding soil dust.
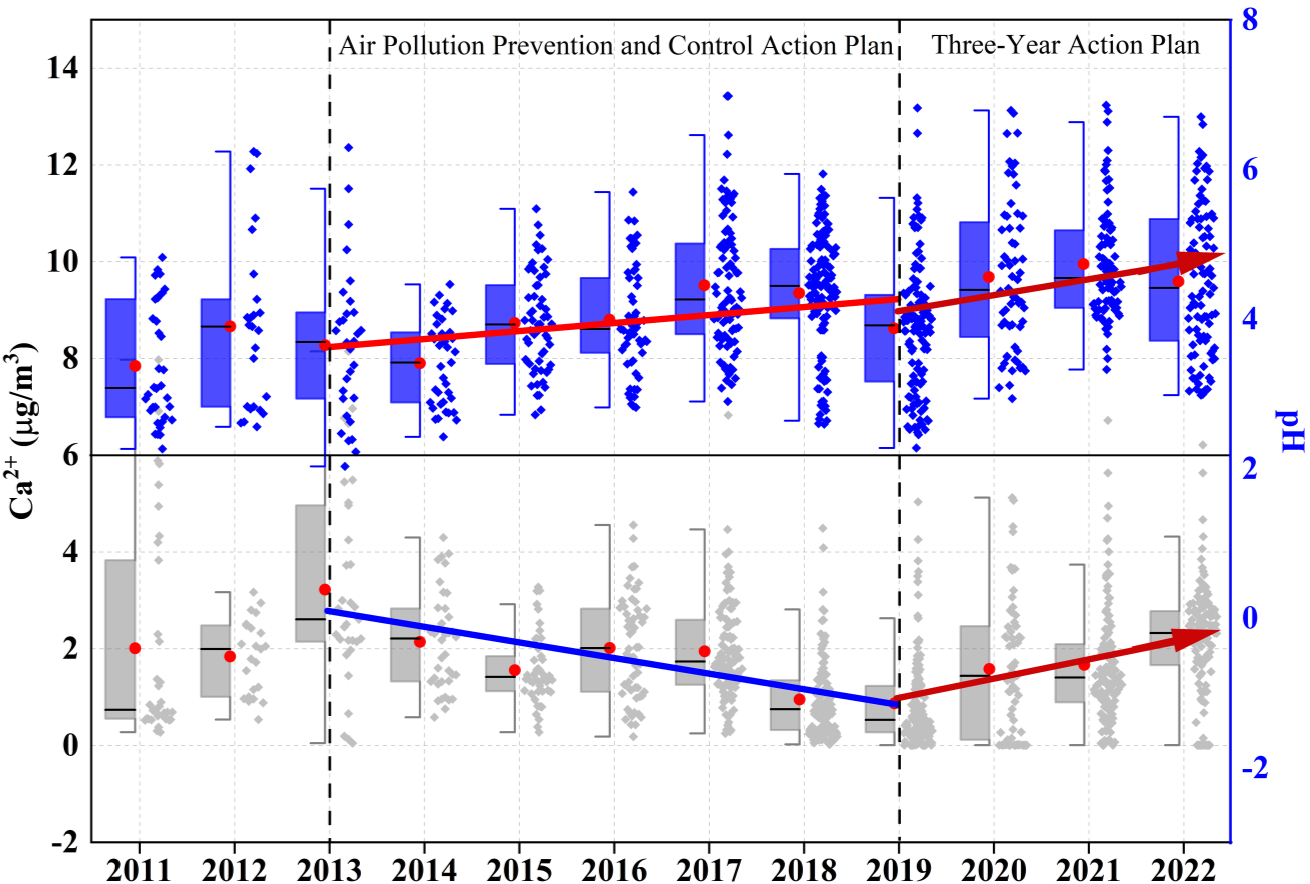
3.4 Long-term trend of particle pH
As shown in Fig. 4 and Table S6, pH values showed a clearly increasing trend after 2014. From 2013–2019, the annual pH increased by 0.11 units from the LS slope ( units from Sen's slope), reaching a maximum median value of 4.45 (mean: 4.35) in 2018. Note that the annual average growth rate of pH values increased to 0.21 units from LS slope ( units from Sen's slope) from 2019–2022, with a maximum median value of 4.42 (mean: 4.51) in 2022. Seasonally, pH values showed increasing trends in spring, summer, and autumn, and they notably increased in winter from 2020–2022 (Fig. S10 in the Supplement). The increasing trend in pH values observed in this study is similar to the findings in Beijing (Song et al., 2019; Xie et al., 2020), presumably attributable to the comparable chemical composition trends and meteorological conditions (Liu et al., 2017; Wang et al., 2022b; Xu et al., 2025). In contrast, Shanghai and Hong Kong SAR display divergent trends (Nah et al., 2023; Zhou et al., 2022). This disparity might be ascribed to the stronger buffering effect exerted by NH3 and dust in Zhengzhou than marine aerosols () in these coastal cities (Shi et al., 2017; Liu et al., 2019). Moreover, these coastal cities' warm climates amplify pH declines. Elevated temperatures reduce ALWC through moisture evaporation, concentrating H+ and directly lowering pH. Concurrently, heat-enhanced NH3 volatilization from particulate weakened acid neutralization (Zhou et al., 2022; Nah et al., 2023).
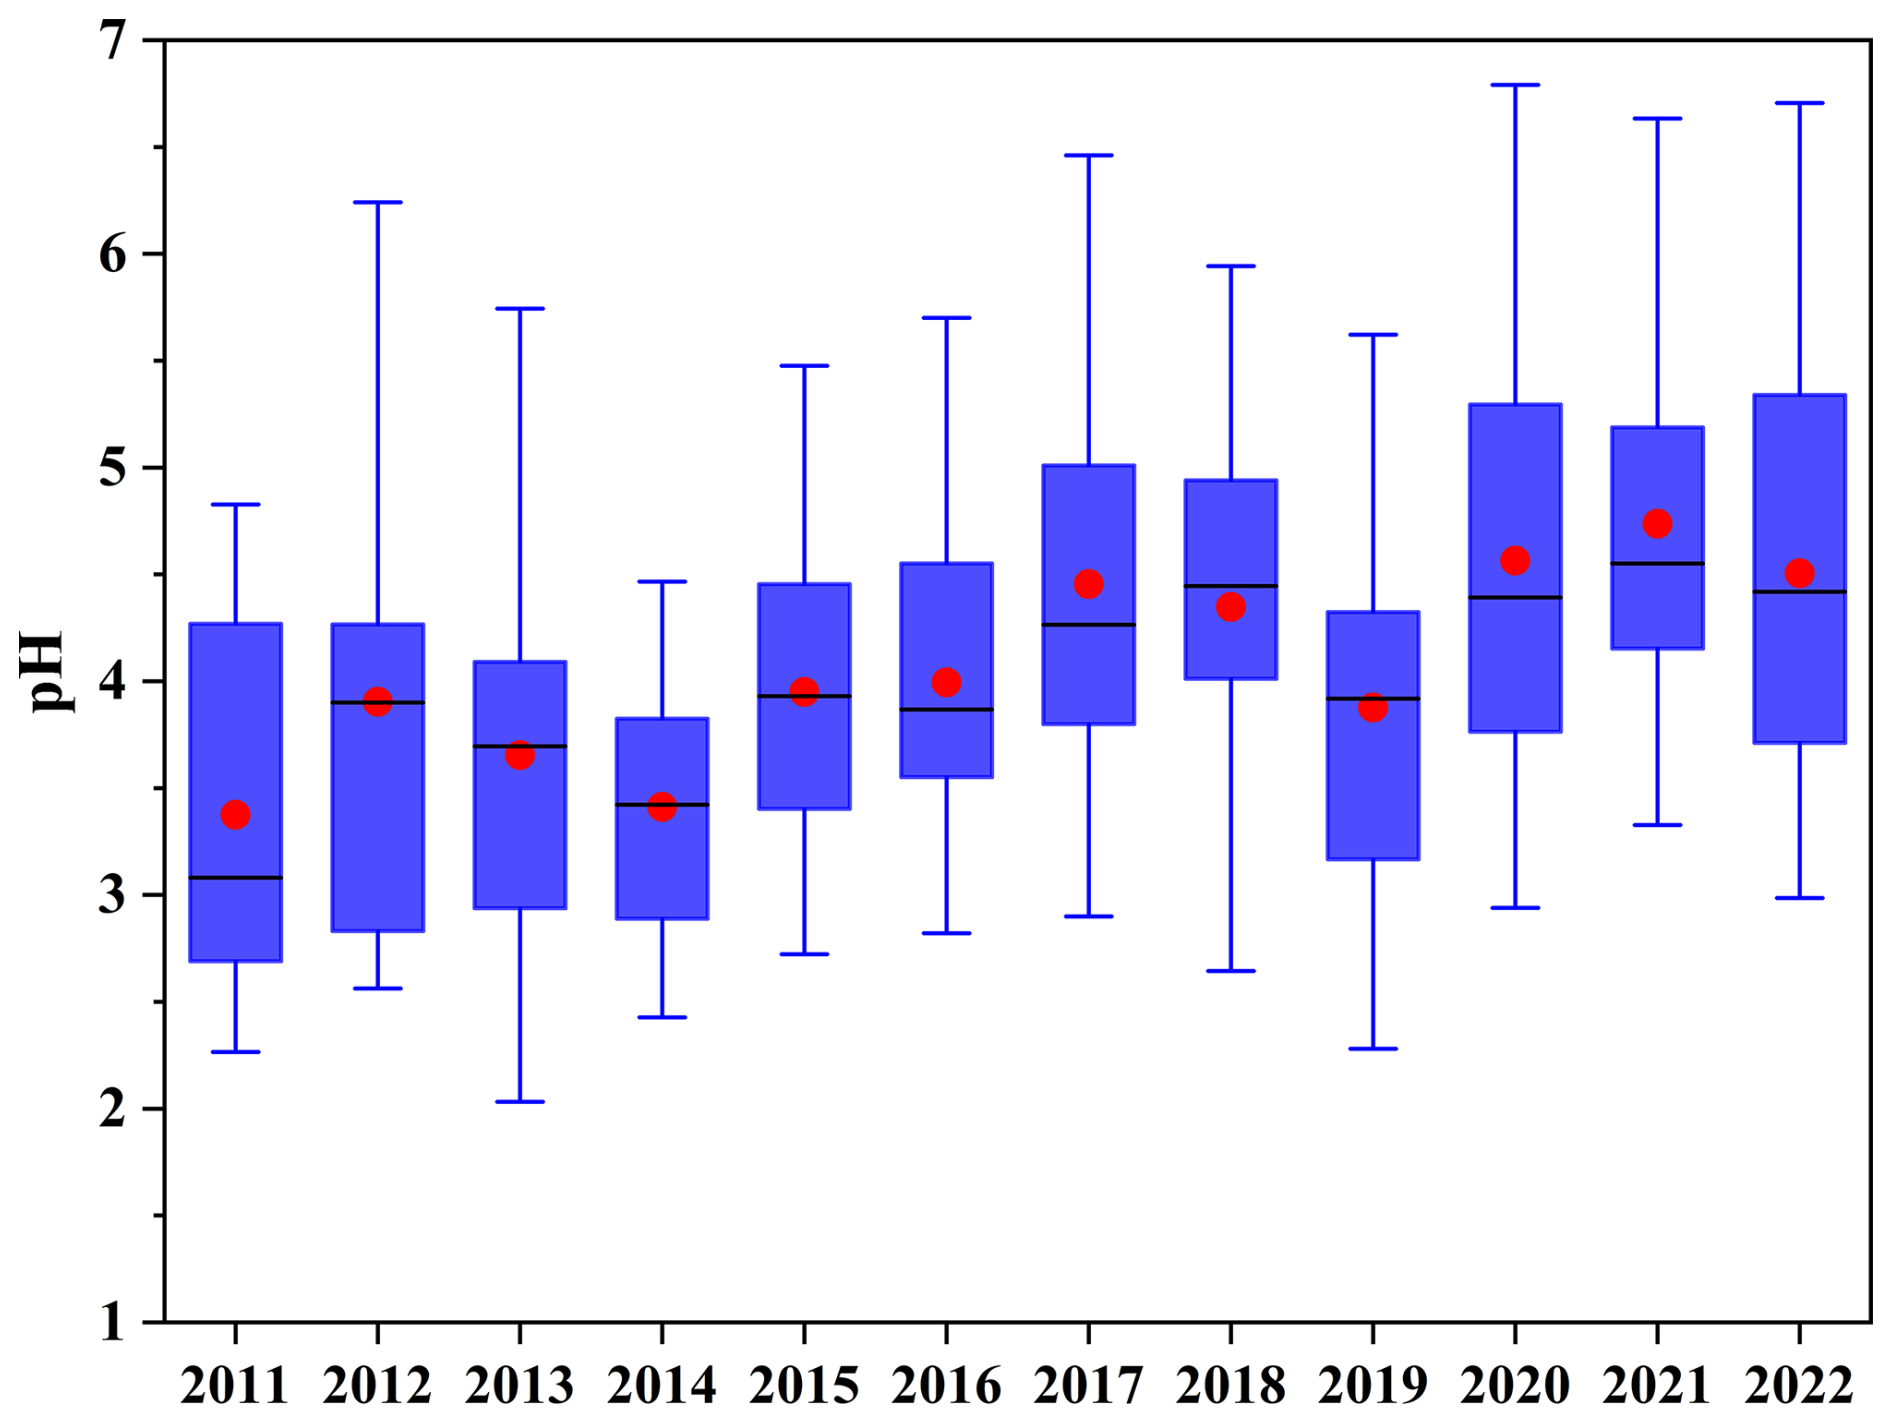
Figure 4The time series of particle pH in Zhengzhou from 2011–2022. In the box plots, red dots and black lines represent the annual mean and median values, respectively.
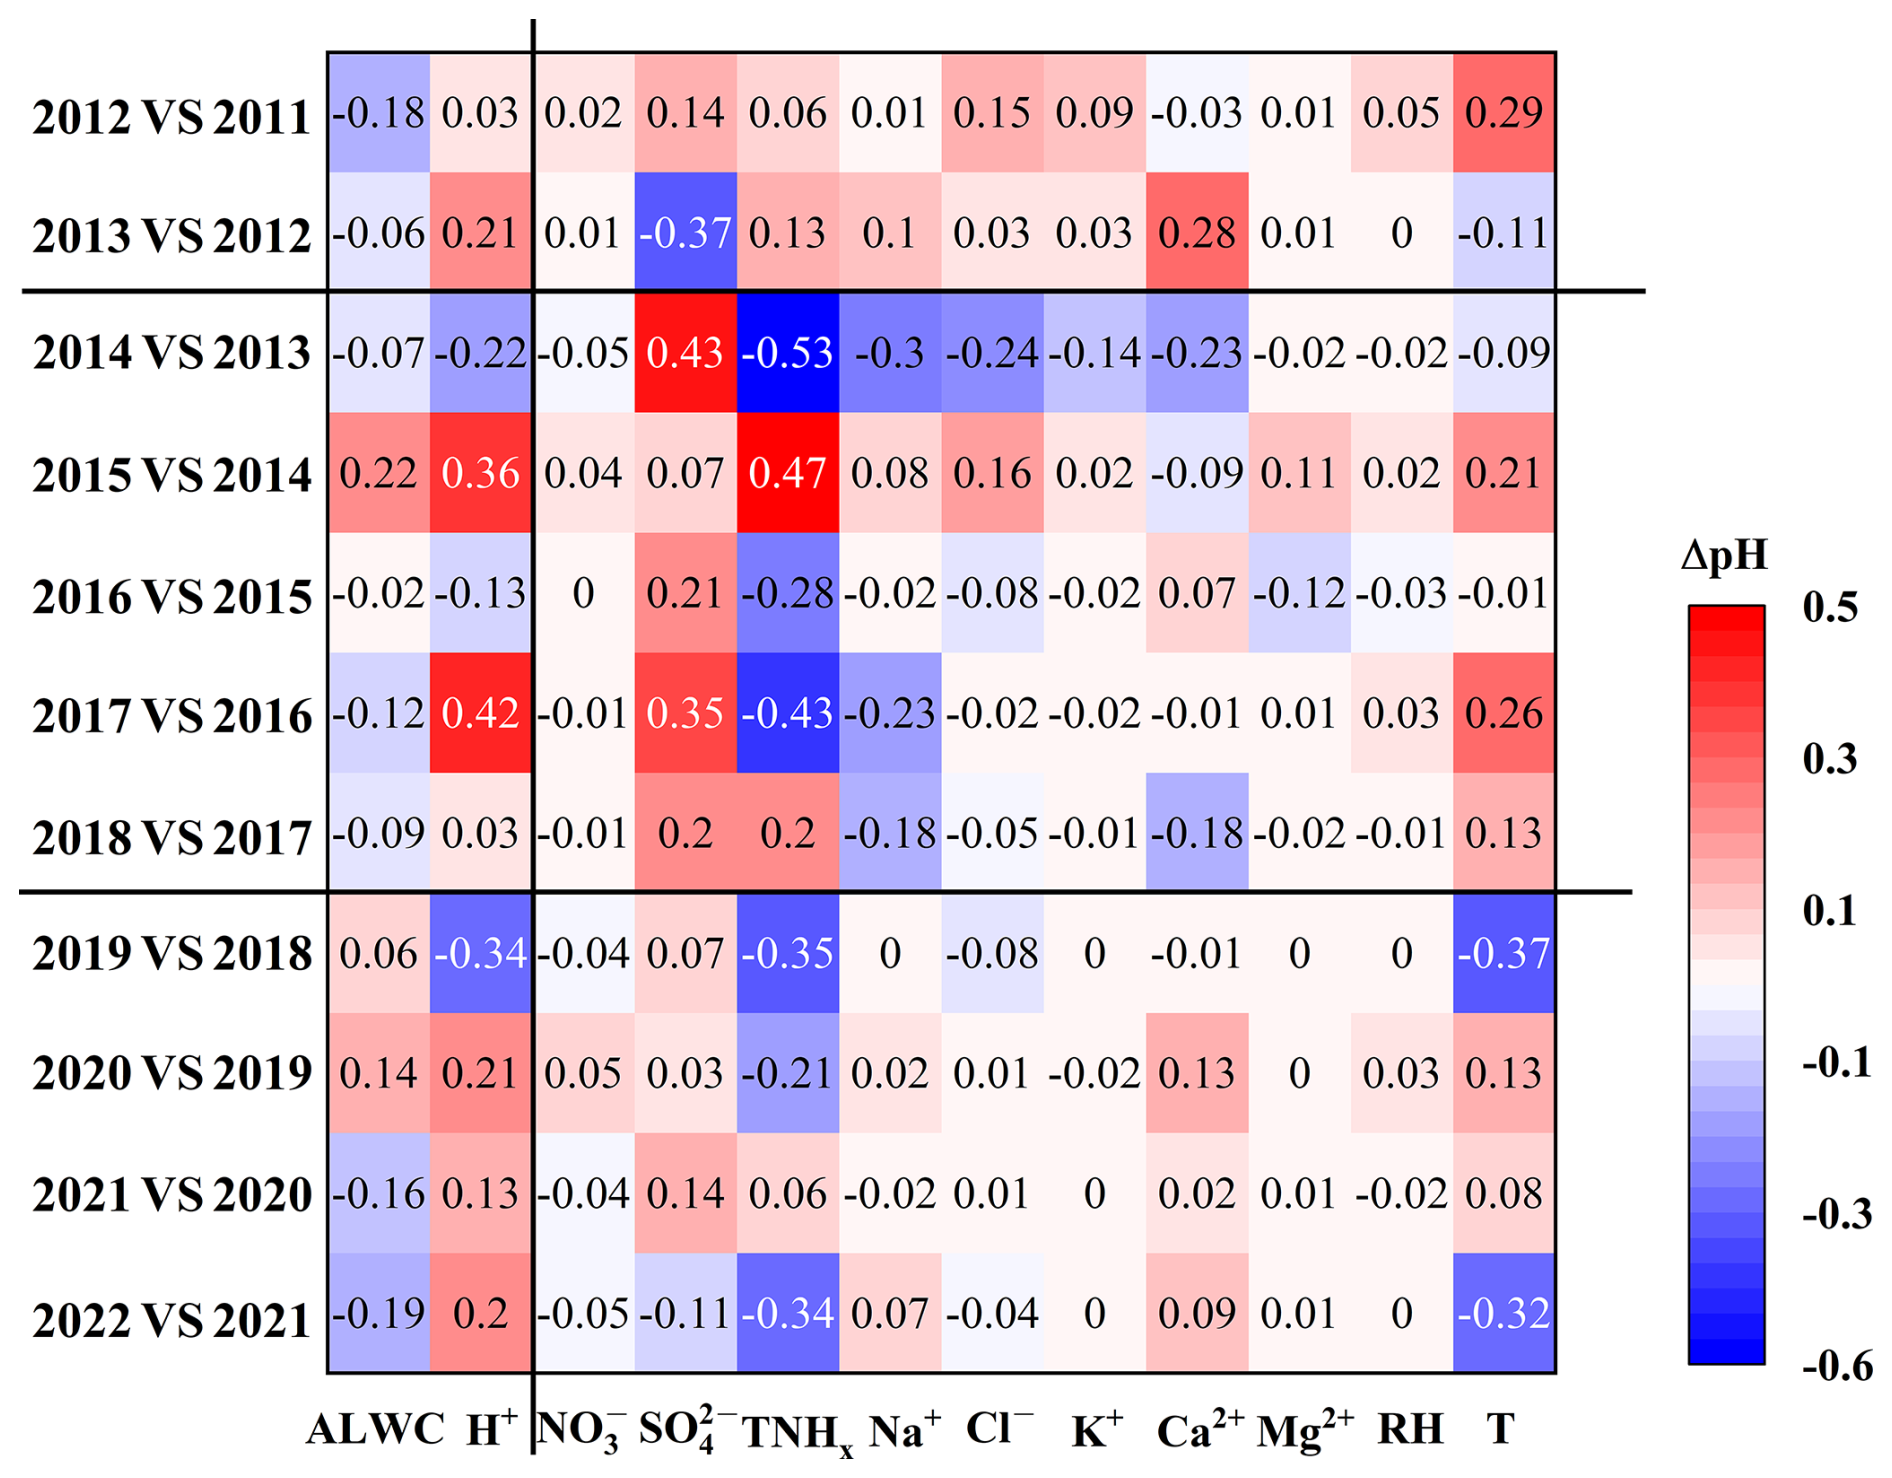
Figure 5Contribution of each component to the changes in pH (ΔpH) between adjacent years. The difference between component concentrations and meteorological parameters between adjacent years is listed in Table S8.
Sensitivity analyses were conducted to explore the dominant factors driving the elevated particle pH in Zhengzhou by giving a range for one parameter (i.e., TNHx) and average values for other parameters (i.e., , , Na+, Cl−, Ca2+, K+, Mg2+, RH, and T) input into the ISORROPIA-II model. Are shown in Fig. S11 in the Supplement, particle pH increases with the cation concentrations (e.g., TNHx, K+, Ca2+, Mg2+, and Na+) and decreases with anion concentrations (e.g., and ). Additionally, RH does not significantly affect pH, whereas an increase in T leads to a noticeable decrease in particle pH.
Based on the sensitivity analysis curves, the pH values corresponding to a variable in different years were calculated according to the average values of this variable in different years (Table S8 in the Supplement). The difference in pH values of this variable between 2 adjacent years was defined as ΔpH, which is illustrated in Fig. 5. According to Eq. (2), in addition to H+ concentration, particle pH is primarily influenced by the dilution effect of ALWC. Moreover, ALWC affects the gas–particle partitioning of semi-volatile compounds, thereby influencing particle acidity (Zuend et al., 2010; Zuend and Seinfeld, 2012). As shown in Fig. 5 and Table S8, only in 2015, 2019, and 2020 did the increases in ALWC concentration (17.6, 4.1, and 11.6 µg m−3, respectively) lead to pH increases of 0.22, 0.06, and 0.14 units. This clearly cannot fully explain the significant pH increase in Zhengzhou since 2013. Notably, since 2013, H+ concentration has shown a decreasing trend. Particularly, H+ concentrations decreased by , , and in 2013, 2015, and 2017, respectively, leading to pH increases of 0.21, 0.36, and 0.42 units. After 2019, a continuous decline in H+ concentration was observed for 3 consecutive years, resulting in pH increases of 0.21, 0.13, and 0.2 units in 2020, 2021, and 2022, respectively. These findings indicate that the increase in pH from 2019–2022 in Zhengzhou was primarily driven by the reduction in H+ concentration.
The concentration of H+ in the aerosol liquid phase is influenced by both chemical composition and meteorological conditions. To further understand the factors affecting ΔpH, we analyzed the variations in PM2.5 chemical components and meteorological parameters. Results indicate that the decline in from 2013–2018 was the primary cause of the increase in particle pH, as it decreased H+ and ALWC concentrations (Fig. S12 in the Supplement) in aerosol (Ding et al., 2019; Zhang et al., 2021). The average concentration decreased by 14.6 and 5.3 µg m−3, resulting in a pH increase of 0.43 and 0.35 units from 2013–2014 and 2016–2017, respectively, which was comparable to an increased rate of 0.3 units in East Asia due to SO2 emission controls since 2016 (Karydis et al., 2021). As another acidic ion, the decrease in nitrate concentration did not significantly contribute to the pH increases, consistent with findings from Ding et al. (2019) and Zhang et al. (2021). This is primarily because declined more slowly compared to sulfate ions and exceeded sulfate concentrations after 2016, under which conditions that nitrate-rich particles can absorb twice the amount of water that sulfate-rich particles, leading to an increase in ALWC concentration and inhibiting pH decline (Lin et al., 2020; Xie et al., 2020). On the other hand, increases in particle pH in 2015 and 2018 were notably influenced by changes in TNHx with concentrations increased by 5.5 and 1.3 µg m−3, respectively. Increased TNHx concentrations could react with or and consume a substantial amount of H+, thereby raising particulate matter pH values (Seinfeld et al., 1998; Zhang et al., 2021). Substantial decreases in T in 2015 (4.2 °C), 2017 (4.9 °C), and 2018 (2.8 °C), favoring NH3 partitioning into the particle phase and reducing H+ concentrations, drove increases in particle pH (Tao and Murphy, 2019).
During the period from 2020–2022, the influence of on particle pH gradually decreased, with a decrease in concentration from 0.3–2.3 µg m−3 (Table S8) only bringing about a pH decrease of 0.03–0.14 (Fig. 5). Moreover, a rebound in concentration to in 2022 even resulted in a decrease of 0.11 units in pH instead. On the other hand, TNHx began to show a slight annual decline (0.9–2.2 µg m−3), resulting in a significant decrease in pH (0.21–0.35). Consequently, the increase in pH values was closely related to the rise in Ca2+ concentration. Ca2+ is less volatile and competes preferentially with NH3 to neutralize anions such as to form insoluble CaSO4, which precipitates from the aerosol aqueous phase (Ding et al., 2019; Karydis et al., 2021), thereby reducing H+ concentrations (Fig. S12) and subsequently lowering particle acidity. Specifically, increases of 0.7 and 0.5 µg m−3 in Ca2+ concentrations led to pH increases of 0.13 and 0.09 units in 2020 and 2022, respectively, making Ca2+ a primary controlling factor for pH elevation.
The annual average PM2.5 concentration in Zhengzhou decreased from in 2013 to in 2022, with the largest reduction in . As for CM, their concentrations notably decreased from 2013–2019 because of effective dust control measures, as well as decreased wind speed and increased relative humidity. However, the proportions of CM in PM2.5 have shown consecutive annual increases. In addition, CM concentrations and their proportions increased significantly during 2019–2022, which might be responsible for the resuspension of surrounding soil dust. Correspondingly, the annual pH increased by 0.11 units from 2013–2019, mainly due to the decline in , increased TNHx, or decreased temperature. During the period from 2020–2022, the annual average growth rate of pH values increased to 0.21 units from 2019–2022, which was determined by the rise in Ca2+ concentration.
Control measures implemented by the Chinese government have proven effective in reducing dust, but this study reveals that the crustal materials in PM2.5 rebounded after 2019. This phenomenon is not unique to Zhengzhou, as major cities in the North China Plain have also experienced a pronounced upward trend in coarse particles after 2019 (Fig. S13 in the Supplement). Thus, crustal materials persist as a substantial constituent of atmospheric aerosols in North China, sustaining elevated particle pH levels. Extensive research has established that heightened particle pH inhibits nitrate reduction in aerosols (Ding et al., 2019; Lin et al., 2020; Wen et al., 2018), particularly significant given nitrate's predominant role in haze formation within this region. Notably, while moderately acidic aerosols demonstrate reduced health impacts, particles with pH<3 exhibit substantially greater health risks (Shi et al., 2019). Consequently, future environmental management strategies must prioritize real-time assessment of regulatory impacts on particle acidity. This necessitates an integrated approach that simultaneously addresses acidic precursors, alkaline precursors, and crustal material contributions to atmospheric acid chemistry.
All the data presented in this article can be accessed through https://doi.org/10.5281/zenodo.14032007 (Zhang, 2024).
Additional data, figures, and tables are provided, some of which are referenced directly within the manuscript, as well as detailed descriptions of field measurements and samples. The supplement related to this article is available online at https://doi.org/10.5194/acp-25-6943-2025-supplement.
SW designed this study. HZ and ZD analyzed the data and prepared the manuscript with the contributions of all coauthors. XL conducted measurements. RZ provided funding acquisition. All authors have read and agreed to the published version of the manuscript.
The contact author has declared that none of the authors has any competing interests.
Publisher's note: Copernicus Publications remains neutral with regard to jurisdictional claims made in the text, published maps, institutional affiliations, or any other geographical representation in this paper. While Copernicus Publications makes every effort to include appropriate place names, the final responsibility lies with the authors.
This work was supported by the National Key R&D Program of China (no. 2024YFC3713701), the China Postdoctoral Science Foundation (2023 M733220), the Zhengzhou PM2.5 and O3 Collaborative Control and Monitoring Project (20220347A), and the National Key R&D Program of China (no. 2017YFC0212400).
This paper was edited by Alex Lee and reviewed by two anonymous referees.
Battaglia, M. A., Douglas, S., and Hennigan, C.: Effect of the urban heat island on aerosol pH, Environ. Sci. Technol., 51, 13095–13103, https://doi.org/10.1021/acs.est.7b02786, 2017.
Chang, R. Y.-W., Slowik, J. G., Shantz, N. C., Vlasenko, A., Liggio, J., Sjostedt, S. J., Leaitch, W. R., and Abbatt, J. P. D.: The hygroscopicity parameter (κ) of ambient organic aerosol at a field site subject to biogenic and anthropogenic influences: relationship to degree of aerosol oxidation, Atmos. Chem. Phys., 10, 5047–5064, https://doi.org/10.5194/acp-10-5047-2010, 2010.
Ding, J., Zhao, P., Su, J., Dong, Q., Du, X., and Zhang, Y.: Aerosol pH and its driving factors in Beijing, Atmos. Chem. Phys., 19, 7939–7954, https://doi.org/10.5194/acp-19-7939-2019, 2019.
Dong, J., Li, B., Li, Y., Zhou, R., Gan, C., Zhao, Y., Liu, R., Yang, Y., Wang, T., and Liao, H.: Atmospheric ammonia in China: Long-term spatiotemporal variation, urban–rural gradient, and influencing factors, Sci. Total Environ., 883, 163733, https://doi.org/10.1016/j.scitotenv.2023.163733, 2023.
Fountoukis, C and Nenes, A.: ISORROPIA II: a computationally efficient thermodynamic equilibrium model for K+ - Ca2+ - Mg2+ - - Na+ - - - Cl - H2O aerosols, Atmos. Chem. Phys., 7, 4639–4659, https://doi.org/10.5194/acp-7-4639-2007, 2007.
Guo, H., Sullivan, A. P., Campuzano-Jost, P., Schroder, J. C., Lopez-Hilfiker, F. D., Dibb, J. E., Jimenez, J. L., Thornton, J. A., Brown, S. S., Nenes, A., and Weber, R. J.: Fine particle pH and the partitioning of nitric acid during winter in the northeastern United States, J. Geophys. Res.-Atmos., 121, 10355–10376, https://doi.org/10.1002/2016JD025311, 2016.
Guo, H., Xu, L., Bougiatioti, A., Cerully, K. M., Capps, S. L., Hite Jr., J. R., Carlton, A. G., Lee, S.-H., Bergin, M. H., Ng, N. L., Nenes, A., and Weber, R. J.: Fine-particle water and pH in the southeastern United States, Atmos. Chem. Phys., 15, 5211–5228, https://doi.org/10.5194/acp-15-5211-2015, 2015.
Heald, C. L., Collett Jr., J. L., Lee, T., Benedict, K. B., Schwandner, F. M., Li, Y., Clarisse, L., Hurtmans, D. R., Van Damme, M., Clerbaux, C., Coheur, P.-F., Philip, S., Martin, R. V., and Pye, H. O. T.: Atmospheric ammonia and particulate inorganic nitrogen over the United States, Atmos. Chem. Phys., 12, 10295–10312, https://doi.org/10.5194/acp-12-10295-2012, 2012.
Huang, X., Song, Y., Li, M., Li, J., Huo, Q., Cai, X., Zhu, T., Hu, M., and Zhang, H.: A high-resolution ammonia emission inventory in China, Global Biogeochem. Cy., 26, GB1030, https://doi.org/10.1029/2011GB004161, 2012.
Jiang, N., Duan, S., Yu, X., Zhang, R., and Wang, K.: Comparative major components and health risks of toxic elements and polycyclic aromatic hydrocarbons of PM2.5 in winter and summer in Zhengzhou: Based on three-year data, Atmos. Res., 213, 173–184, https://doi.org/10.1016/j.atmosres.2018.06.008, 2018.
Karydis, V. A., Tsimpidi, A. P., Pozzer, A., and Lelieveld, J.: How alkaline compounds control atmospheric aerosol particle acidity, Atmos. Chem. Phys., 21, 14983–15001, https://doi.org/10.5194/acp-21-14983-2021, 2021.
Kim, Y., Park, O., Park, S. H., Kim, M. J., Kim, J.-J., Choi, J.-Y., Lee, D., Cho, S., and Shim, S.: PM2.5 pH estimation in Seoul during the KORUS-AQ campaign using different thermodynamic models, Atmos. Environ., 268, 118787, https://doi.org/10.1016/j.atmosenv.2021.118787, 2022.
Lei, L., Zhou, W., Chen, C., He, Y., Li, Z., Sun, J., Tang, X., Fu, P., Wang, Z., and Sun, Y.: Long-term characterization of aerosol chemistry in cold season from 2013 to 2020 in Beijing, China, Environ. Pollut., 268, 115952, https://doi.org/10.1016/j.envpol.2020.115952, 2021.
Li, C., Hu, Y., Chen, J., Ma, Z., Ye, X., Yang, X., Wang, L., Wang, X., and Mellouki, A.: Physiochemical properties of carbonaceous aerosol from agricultural residue burning: Density, volatility, and hygroscopicity, Atmos. Environ., 140, 94–105, https://doi.org/10.1016/j.atmosenv.2016.05.052, 2016.
Li, W., Xu, L., Liu, X., Zhang, J., Lin, Y., Yao, X., Gao, H., Zhang, D., Chen, J., Wang, W., Harrison, R. M., Zhang, X., Shao, L., Fu, P., Nenes, A., and Shi, Z.: Air pollution-aerosol interactions produce more bioavailable iron for ocean ecosystems, Sci. Adv., 3, e1601749, https://doi.org/10.1126/sciadv.1601749, 2017.
Li, Y., Lei, L., Sun, J., Gao, Y., Wang, P., Wang, S., Zhang, Z., Du, A., Li, Z., Wang, Z., Kim, J. Y., Kim, H., Zhang, H., and Sun, Y.: Significant reductions in secondary aerosols after the Three-Year Action Plan in Beijing summer, Environ. Sci. Technol., 57, 15945–15955, https://doi.org/10.1021/acs.est.3c02417, 2023.
Lin, Y.-C., Zhang, Y.-L., Fan, M.-Y., and Bao, M.: Heterogeneous formation of particulate nitrate under ammonium-rich regimes during the high-PM2.5 events in Nanjing, China, Atmos. Chem. Phys., 20, 3999–4011, https://doi.org/10.5194/acp-20-3999-2020, 2020.
Liu, M., Huang, X., Song, Y., Tang, J., Cao, J., Zhang, X., Zhang, Q., Wang, S., Xu, T., Kang, L., Gai, X., Zhang, H., Yang, F., Wang, H., Yu, J., Lau, A., He, L., Huang, X., Duan, L., Ding, A., Xue, L., Gao, J., Liu, B., and Zhu, T.: Ammonia emission control in China would mitigate haze pollution and nitrogen deposition, but worsen acid rain, P. Natl. Acad. Sci., 116, 7760–7765, https://doi.org/10.1073/pnas.1814880116, 2019.
Liu, M., Song, Y., Zhou, T., Xu, Z., Yan, C., Zheng, M., Wu, Z., Hu, M., Wu, Y., and Zhu, T.: Fine particle pH during severe haze episodes in northern China, Geophys. Res. Lett., 44, 5213–5221, https://doi.org/10.1002/2017GL073210, 2017.
Liu, Z., Gao, W., Yu, Y., Hu, B., Xin, J., Sun, Y., Wang, L., Wang, G., Bi, X., Zhang, G., Xu, H., Cong, Z., He, J., Xu, J., and Wang, Y.: Characteristics of PM2.5 mass concentrations and chemical species in urban and background areas of China: emerging results from the CARE-China network, Atmos. Chem. Phys., 18, 8849–8871, https://doi.org/10.5194/acp-18-8849-2018, 2018.
Mao, I., Lin, C., Lin, C., Chen, Y., Sung, F., and Chen, M.: Exposure of acid aerosol for schoolchildren in metropolitan Taipei, Atmos. Environ., 43, 5622–5629, https://doi.org/10.1016/j.atmosenv.2009.07.054, 2009.
Masiol, M., Squizzato, S., Formenton, G., Khan, M. B., Hopke, P. K., Nenes, A., Pandis, S. N., Tositti, L., Benetello, F., Visin, F., and Pavoni, B.: Hybrid multiple-site mass closure and source apportionment of PM2.5 and aerosol acidity at major cities in the Po Valley, Sci. Total Environ., 704, 135287, https://doi.org/10.1016/j.scitotenv.2019.135287, 2020.
MEP (Ministry of Environment Protection): https://www.mee.gov.cn/ywdt/hjywnews/202406/t20240605_1075031.shtml, (last access: 5 June 2024), 2023.
Nah, T., Lam, Y. H., Yang, J., and Yang, L.: Long-term trends and sensitivities of PM2.5 pH and aerosol liquid water to chemical composition changes and meteorological parameters in Hong Kong, South China: Insights from 10 year records from three urban sites, Atmos. Environ., 302, 119725, https://doi.org/10.1016/j.atmosenv.2023.119725, 2023.
Nenes, A., Pandis, S. N., Kanakidou, M., Russell, A. G., Song, S., Vasilakos, P., and Weber, R. J.: Aerosol acidity and liquid water content regulate the dry deposition of inorganic reactive nitrogen, Atmos. Chem. Phys., 21, 6023–6033, https://doi.org/10.5194/acp-21-6023-2021, 2021.
Pinder, R., Adams, P., and Pandis, S.: Ammonia emission controls as a cost-effective strategy for reducing atmospheric particulate matter in the eastern United States, Environ. Sci. Technol., 41, 380–386, https://doi.org/10.1021/es060379a, 2007.
Pinder, R., Gilliland, A., and Dennis, R.: Environmental impact of atmospheric NH3 emissions under present and future conditions in the eastern United States, Geophys. Res. Lett., 35, 28, https://doi.org/10.1029/2008gl033732, 2008.
Pye, H. O. T., Nenes, A., Alexander, B., Ault, A. P., Barth, M. C., Clegg, S. L., Collett Jr., J. L., Fahey, K. M., Hennigan, C. J., Herrmann, H., Kanakidou, M., Kelly, J. T., Ku, I.-T., McNeill, V. F., Riemer, N., Schaefer, T., Shi, G., Tilgner, A., Walker, J. T., Wang, T., Weber, R., Xing, J., Zaveri, R. A., and Zuend, A.: The acidity of atmospheric particles and clouds, Atmos. Chem. Phys., 20, 4809–4888, https://doi.org/10.5194/acp-20-4809-2020, 2020.
Rengarajan, R., Sudheer, A. K., and Sarin, M. M.: Aerosol acidity and secondary organic aerosol formation during wintertime over urban environment in western India, Atmos. Environ., 45, 1940–1945, https://doi.org/10.1016/j.atmosenv.2011.01.026, 2011.
Seinfeld, J. H., Pandis, S. N., and Noone, K. J.: Atmospheric chemistry and physics: From air pollution to climate change, Phys. Today, 51, 88–90, https://doi.org/10.1063/1.882420, 1998.
Sharma, B., Jia, S., Polana, A. J., Ahmed, M. S., Haque, R. R., Singh, S., Mao, J., and Sarkar, S.: Seasonal variations in aerosol acidity and its driving factors in the eastern Indo-Gangetic Plain: A quantitative analysis, Chemosphere, 305, 135490, https://doi.org/10.1016/j.chemosphere.2022.135490, 2022.
Shi, G., Xu, J., Peng, X., Xiao, Z., Chen, K., Tian, Y., Guan, X., Feng, Y., Yu, H., Nenes, A., and Russell, A. G.: pH of aerosols in a polluted atmosphere: source contributions to highly acidic aerosol, Environ. Sci. Technol., 51, 4289–4296, https://doi.org/10.1021/acs.est.6b05736, 2017.
Shi, X., Nenes, A., Xiao, Z., Song, S., Yu, H., Shi, G., Zhao, Q., Chen, K., Feng, Y., and Russell, A. G.: High-resolution data sets unravel the effects of sources and meteorological conditions on nitrate and its gas-particle partitioning, Environ. Sci. Technol., 53, 3048–3057, https://doi.org/10.1021/acs.est.8b06524, 2019.
Song, S., Nenes, A., Gao, M., Zhang, Y., Liu, P., Shao, J., Ye, D., Xu, W., Lei, L., Sun, Y., Liu, B., Wang, S., and McElroy, M. B.: Thermodynamic modeling suggests declines in water uptake and acidity of inorganic aerosols in Beijing winter haze events during 2014/2015–2018/2019, Environ. Sci. Tech. Let., 6, 752–760, https://doi.org/10.1021/acs.estlett.9b00621, 2019.
Su, H., Cheng, Y., and Pöschl, U.: New Multiphase Chemical Processes Influencing Atmospheric Aerosols, Air Quality, and Climate in the Anthropocene, Acc. Chem. Res., 53, 2034–2043, https://doi.org/10.1021/acs.accounts.0c00246, 2020.
Surratt, J. D., Chan, A. W. H., Eddingsaas, N. C., Chan, M., Loza, C. L., Kwan, A. J., Hersey, S. P., Flagan, R. C., Wennberg, P. O., and Seinfeld, J. H.: Reactive intermediates revealed in secondary organic aerosol formation from isoprene, P. Natl. Acad. Sci., 107, 6640–6645, https://doi.org/10.1073/pnas.0911114107, 2010.
Tao, Y. and Murphy, J. G.: The sensitivity of PM2.5 acidity to meteorological parameters and chemical composition changes: 10-year records from six Canadian monitoring sites, Atmos. Chem. Phys., 19, 9309–9320, https://doi.org/10.5194/acp-19-9309-2019, 2019.
Tian, Y., Chen, G., Wang, H., Huang-Fu, Y., Shi, G., Han, B., and Feng, Y.: Source regional contributions to PM2.5 in a megacity in China using an advanced source regional apportionment method, Chemosphere, 147, 256–263, https://doi.org/10.1016/j.chemosphere.2015.12.132, 2016.
Tremper, A. H., Font, A., Priestman, M., Hamad, S. H., Chung, T.-C., Pribadi, A., Brown, R. J. C., Goddard, S. L., Grassineau, N., Petterson, K., Kelly, F. J., and Green, D. C.: Field and laboratory evaluation of a high time resolution X-ray fluorescence instrument for determining the elemental composition of ambient aerosols, Atmos. Meas. Tech., 11, 3541–3557, https://doi.org/10.5194/amt-11-3541-2018, 2018.
Wang, C., Yin, S., Bai, L., Zhang, X., Gu, X., Zhang, H., Lu, Q., and Zhang, R.: High-resolution ammonia emission inventories with comprehensive analysis and evaluation in Henan, China, 2006–2016, Atmos. Environ., 193, 11–23, https://doi.org/10.1016/j.atmosenv.2018.08.063, 2018a.
Wang, G., Chen, J., Xu, J., Yun, L., Zhang, M., Li, H., Qin, X., Deng, C., Zheng, H., Gui, H., Liu, J., and Huang, K.: Atmospheric processing at the Sea–Land interface over the South China Sea: Secondary aerosol formation, aerosol acidity, and role of sea salts, J. Geophys. Res.-Atmos., 127, e2021JD036255, https://doi.org/10.1029/2021jd036255, 2022a.
Wang, J., Gao, J., Che, F., Wang, Y., Lin, P., and Zhang, Y.: Dramatic changes in aerosol composition during the 2016–2020 heating seasons in Beijing–Tianjin–Hebei region and its surrounding areas: The role of primary pollutants and secondary aerosol formation, Sci. Total Environ., 849, 157621, https://doi.org/10.1016/j.scitotenv.2022.157621, 2022b.
Wang, L., Du, H., Chen, J., Zhang, M., Huang, X., Tan, H., Kong, L., and Geng, F.: Consecutive transport of anthropogenic air masses and dust storm plume: Two case events at Shanghai, China, Atmos. Res., 127, 22–33, https://doi.org/10.1016/j.atmosres.2013.02.011, 2013.
Wang, S., Yin, S., Zhang, R., Yang, L., Zhao, Q., Zhang, L., Yan, Q., Jiang, N., and Tang, X.: Insight into the formation of secondary inorganic aerosol based on high-time-resolution data during haze episodes and snowfall periods in Zhengzhou, China, Sci. Total Environ., 660, 47–56, https://doi.org/10.1016/j.scitotenv.2018.12.465, 2019.
Wang, S., Wang, L., Li, Y., Wang, C., Wang, W., Yin, S., and Zhang, R.: Effect of ammonia on fine-particle pH in agricultural regions of China: comparison between urban and rural sites, Atmos. Chem. Phys., 20, 2719–2734, https://doi.org/10.5194/acp-20-2719-2020, 2020.
Wang, Y. Q., Zhang, X. Y., and Draxler, R. R.: TrajStat: GIS-based software that uses various trajectory statistical analysis methods to identify potential sources from long-term air pollution measurement data, Environ. Modell. Softw., 24, 938–939, https://doi.org/10.1016/j.envsoft.2009.01.004, 2009.
Wang, Z., Pan, X., Uno, I., Chen, X., Yamamoto, S., Zheng, H., Li, J., and Wang, Z.: Importance of mineral dust and anthropogenic pollutants mixing during a long–lasting high PM event over East Asia, Environ. Pollut., 234, 368–378, https://doi.org/10.1016/j.envpol.2017.11.068, 2018b.
Weber, R., Guo, H., Russell, A., and Nenes, A.: High aerosol acidity despite declining atmospheric sulfate concentrations over the past 15 years, Nat. Geosci., 9, 282–285, https://doi.org/10.1038/ngeo2665, 2016.
Wei, Y., Wang, S., Jiang, N., Zhang, R., and Hao, Q.: Comparative multi-model study of PM2.5 acidity trend changes in ammonia-rich regions in winter: Based on a new ammonia concentration assessment method, J. Hazard. Mater., 458, 15, https://doi.org/10.1016/j.jhazmat.2023.131970, 2023.
Wen, L., Xue, L., Wang, X., Xu, C., Chen, T., Yang, L., Wang, T., Zhang, Q., and Wang, W.: Summertime fine particulate nitrate pollution in the North China Plain: increasing trends, formation mechanisms and implications for control policy, Atmos. Chem. Phys., 18, 11261–11275, https://doi.org/10.5194/acp-18-11261-2018, 2018.
Wexler, A. S. and Seinfeld, J. H.: Second-generation inorganic aerosol model, Atmos. Environ. A-Gen., 25, 2731–2748, https://doi.org/10.1016/0960-1686(91)90203-J, 1991.
Xie, Y., Wang, G., Wang, X., Chen, J., Chen, Y., Tang, G., Wang, L., Ge, S., Xue, G., Wang, Y., and Gao, J.: Nitrate-dominated PM2.5 and elevation of particle pH observed in urban Beijing during the winter of 2017, Atmos. Chem. Phys., 20, 5019–5033, https://doi.org/10.5194/acp-20-5019-2020, 2020.
Xu, K., Yin, L., Chen, Q., Liao, D., Ji, X., Zhang, K., Wu, Y., Xu, L., Li, M., Fan, X., Zhang, F., Huang, Z., Chen, J., and Hong, Y.: Quantitative analysis of influencing factors to aerosol pH and its responses to PM2.5 and O3 pollution in a coastal city, J. Environ. Sci., 151, 284–297, https://doi.org/10.1016/j.jes.2024.03.044, 2025.
Yu, F., Yan, Q., Jiang, N., Su, F., Zhang, L., Yin, S., Li, Y., Zhang, R., and Chen, L.: Tracking pollutant characteristics during haze events at background site Zhongmu, Henan Province, China, Atmos. Pollut. Res., 8, 64–73, https://doi.org/10.1016/j.apr.2016.07.005, 2017.
Zhai, S., Jacob, D. J., Wang, X., Shen, L., Li, K., Zhang, Y., Gui, K., Zhao, T., and Liao, H.: Fine particulate matter (PM2.5) trends in China, 2013–2018: separating contributions from anthropogenic emissions and meteorology, Atmos. Chem. Phys., 19, 11031–11041, https://doi.org/10.5194/acp-19-11031-2019, 2019.
Zhang, B., Shen, H., Liu, P., Guo, H., Hu, Y., Chen, Y., Xie, S., Xi, Z., Skipper, T. N., and Russell, A. G.: Significant contrasts in aerosol acidity between China and the United States, Atmos. Chem. Phys., 21, 8341–8356, https://doi.org/10.5194/acp-21-8341-2021, 2021.
Zhang, G., Ding, C., Jiang, X., Pan, G., Wei, X., and Sun, Y.: Chemical compositions and sources contribution of atmospheric particles at a typical steel industrial urban site, Sci. Rep., 10, 7654, https://doi.org/10.1038/s41598-020-64519-x, 2020.
Zhang, H.: Measurement report: Crustal materials play an increasing role in elevating particle pH: Insights from 12-year records in a typical inland city of China-Data, Zenodo [data set], https://doi.org/10.5281/zenodo.14032007, 2024.
Zhang, Z., Dong, Z., Zhang, C., Qian, G., and Lei, C.: The geochemical characteristics of dust material and dust sources identification in northwestern China, J. Geochem. Explor., 175, 148–155, https://doi.org/10.1016/j.gexplo.2016.11.006, 2017.
Zhang, Z., Kuang, Z., Yu, C., Wu, D., Shi, Q., Zhang, S., Wang, Z., and Liu, D.: Trans-boundary dust transport of dust storms in Northern China: A study utilizing ground-based lidar network and CALIPSO satellite, Remote Sens., 16, 1196, https://doi.org/10.3390/rs16071196, 2024.
Zheng, G., Su, H., and Cheng, Y.: Revisiting the key driving processes of the decadal trend of aerosol acidity in the US, Acs. Environ. Au., 2, 346–353, https://doi.org/10.1021/acsenvironau.1c00055, 2022.
Zheng, G., Su, H., Wang, S., Andreae, M. O., Pöschl, U., and Cheng, Y.: Multiphase buffer theory explains contrasts in atmospheric aerosol acidity, Science, 369, 1374–1377, https://doi.org/10.1126/science.aba3719, 2020.
Zhou, M., Zheng, G., Wang, H., Qiao, L., Zhu, S., Huang, D., An, J., Lou, S., Tao, S., Wang, Q., Yan, R., Ma, Y., Chen, C., Cheng, Y., Su, H., and Huang, C.: Long-term trends and drivers of aerosol pH in eastern China, Atmos. Chem. Phys., 22, 13833–13844, https://doi.org/10.5194/acp-22-13833-2022, 2022.
Zhou, W., Gao, M., He, Y., Wang, Q., Xie, C., Xu, W., Zhao, J., Du, W., Qiu, Y., Lei, L., Fu, P., Wang, Z., Worsnop, D. R., Zhang, Q., and Sun, Y.: Response of aerosol chemistry to clean air action in Beijing, China: Insights from two-year ACSM measurements and model simulations, Environ Pollut., 255, 113345, https://doi.org/10.1016/j.envpol.2019.113345, 2019.
Zuend, A. and Seinfeld, J. H.: Modeling the gas-particle partitioning of secondary organic aerosol: the importance of liquid-liquid phase separation, Atmos. Chem. Phys., 12, 3857–3882, https://doi.org/10.5194/acp-12-3857-2012, 2012.
Zuend, A., Marcolli, C., Peter, T., and Seinfeld, J. H.: Computation of liquid-liquid equilibria and phase stabilities: implications for RH-dependent gas/particle partitioning of organic-inorganic aerosols, Atmos. Chem. Phys., 10, 7795–7820, https://doi.org/10.5194/acp-10-7795-2010, 2010.