the Creative Commons Attribution 4.0 License.
the Creative Commons Attribution 4.0 License.
 | 30 Jun 2025
Measurement report: In-depth characterization of ship emissions during operations in a Mediterranean port
Lise Le Berre
Brice Temime-Roussel
Grazia Maria Lanzafame
Barbara D'Anna
Nicolas Marchand
Stéphane Sauvage
Marvin Dufresne
Liselotte Tinel
Thierry Leonardis
Joel Ferreira de Brito
Alexandre Armengaud
Grégory Gille
Ludovic Lanzi
Romain Bourjot
Henri Wortham
A summertime field campaign was conducted in Marseille, one of the major cruise and ferry ports in the Mediterranean, to provide comprehensive analysis of in-port ship emissions. High-temporal-resolution data were simultaneously collected from two monitoring stations deployed in the port area to examine the composition in both the gas and the particulate phases. More than 350 individual plumes were captured from a variety of ships and operational phases. Gaseous emissions are predominantly composed of NOx (86 %) and CO (12 %), with SO2 and CH4 each accounting for about 1 %. Although non-methane volatile organic compounds (NMVOCs) make up less than 0.1 % of the gaseous phase, they can be as high as 10 % under specific operational conditions. Submicron particles (PM1) are mainly composed of organics (75 %), black carbon (21 %), and sulfate (4 %) that is not balanced with ammonium. Among the ship-related characteristics investigated, the operational phase is the most influential, with a 3-fold increase in submicron particle (PM1) emissions, along with higher relative contributions of black carbon (BC) and sulfate and the detection of vanadium, nickel, and iron during manoeuvring/navigation compared to at berth. Pollutant levels in the port are higher than those found at the urban background site, with average concentrations of NOx, PM1, and particle numbers up to twice as high in the port. Analysis of the maximum concentrations reveals that pollutants such as SO2 and trace metals, including vanadium and nickel, are 2 to 10 times higher in the port area. This study provides robust support for enhancing source apportionment and emission inventories, both of which are crucial for assessing air, health, and climate impacts of shipping.
- Article
(9563 KB) - Full-text XML
-
Supplement
(3523 KB) - BibTeX
- EndNote


Maritime transport is one of the most economical modes of transport in terms of tonnes of goods or passengers carried. It has grown significantly in recent years (Toscano and Murena, 2019) due to the increase in international manufacturing, trade, and tourism (Sorte et al., 2020). Projections forecast sustained growth, with freight transport doubling in 2030 compared to 2020 (UNCTAD, 2023). While this mode of transport is a key contributor to social and economic development worldwide (Bagoulla and Guillotreau, 2020; Eyring et al., 2010), it also negatively impacts global climate and air quality in ports and coastal areas (Aardenne et al., 2013; Toscano, 2023; Viana et al., 2020). Moreover, several studies have demonstrated that emissions from maritime transport have negative effects on human health (Corbett et al., 2007; Kiihamäki et al., 2024; Liu et al., 2016; Mueller et al., 2023; Oeder et al., 2015; Wu et al., 2020; Zhang et al., 2021).
Given that other sectors (such as industry, road traffic, and heating) have significantly reduced their emissions, maritime transport now accounts for a growing proportion of total emissions. In 2018, shipping was responsible for approximately 1×10⁹ t of carbon dioxide (CO2), a potent greenhouse gas, accounting for about 3 % of global anthropogenic emissions (IMO, 2020). Projections suggest that by 2050, maritime transport could represent as much as 15 % of global CO2 emissions (Serra and Fancello, 2020). Shipping is also a relevant source of atmospheric pollutants including nitrogen oxides (NOx), sulfur oxides (SOx), carbon monoxide (CO), volatile organic compounds (VOCs), and particulate matter (PM) (Johansson et al., 2017; Sorte et al., 2020; Toscano, 2023). It is estimated that shipping accounts for 20 %–28 % of both global and European NOx and SOx emissions and for 5 % of PM10 (PM smaller than 10 µm) from European emissions (Contini and Merico, 2021; Russo et al., 2018). Research on particles emitted by ships indicates that they are mostly submicron particles, with diameters under 100 nm (Alanen et al., 2020; Jeong et al., 2023; Kuittinen et al., 2021), and are composed of black carbon (BC); organic aerosols (OA), including polycyclic aromatic hydrocarbons (PAHs); sulfate (SO); and, to a lesser extent, metals. Although PAHs and metals are emitted in smaller quantities, they are recognized for their strong health impacts (Briffa et al., 2020; Fridell et al., 2008). Ship emissions are also important sources of gaseous precursors leading to the formation of secondary organic and inorganic aerosol at local and regional scales (Celik et al., 2020; Karl et al., 2023; Lanzafame et al., 2022; Liu et al., 2022; Pérez et al., 2016).
Numerous legislative efforts have therefore been made, at both global and local levels, to reduce emissions of atmospheric pollutants linked to maritime transport. The International Maritime Organisation (IMO) adopted the International Convention for the Prevention of Pollution from Ships (MARPOL), Annex VI of which deals with the mitigation of air pollution. This convention limits emissions of SOx and NOx. Since 1 January 2020, the sulfur content in fuels should not exceed 0.5 % (compared with the previous limit of 3.5 % ). Since 2015, it must even be less than 0.1 % in Emission Control Areas (ECAs) (IMO and Green Marine Associates, 2021). Since 1 January 2021, nitrogen oxide emissions are also controlled in ECAs for ships built after 2000 (IMO and Green Marine Associates, 2021). From 1 May 2025 onwards, ECA-MED has made the use fuels with sulfur content of less than 0.1 % compulsory in the Mediterranean (UNEP/MAP, 2021). The European Union (EU) also restricts the sulfur content in fuel used by ships to 0.1 % while they are docked or anchored at all EU ports, with an exception for ships staying no longer than 2 h (EU, 2016).
These regulations have led to significant progresses in ship engines and to the introduction of after-treatment devices, such as selective non-catalytic reduction (SCR) systems and scrubbers, which serve distinct functions. SCR systems reduce NOx emissions through a catalytic reaction and do not impact sulfur emissions. In contrast, scrubbers remove sulfur from exhaust gases, allowing the use of high-sulfur fuels exceeding 0.5 % or 0.1 % while complying with SOx regulations. Open-loop scrubbers discharge treated wash water into the sea, whereas closed-loop systems recycle it. These technologies are sometimes combined to meet both NOx and SOx regulations in ECAs. These developments result in a wide array of possible combinations of after-treatment devices, fuels, and engines used. The after-treatment devices limit the quantity of pollutants emitted but also change their chemical composition (Fridell and Salo, 2016; Jeong et al., 2023; Kuittinen et al., 2024; McCaffery et al., 2021; Timonen et al., 2017, 2022; Winnes et al., 2020). In addition, various studies have demonstrated the impact of switching to cleaner fuels on shipping emissions (Alanen et al., 2020; Gysel et al., 2017; Jeong et al., 2023; Kuittinen et al., 2024; Lehtoranta et al., 2019; McCaffery et al., 2021; Yang et al., 2022; Zetterdahl et al., 2016). For example, Zetterdahl et al. (2016) showed that switching from heavy fuel oil (HFO) with a sulfur content (FSC) of 0.5 % to marine diesel oil (MDO) with 0.1 % sulfur on a specific ship resulted in a 67 % reduction in total particulate mass but no reduction in the number of particles. Kuittinen et al. (2024) detailed the changes in particulate chemical composition, including PAH and metals, for a cruise ship using HFO containing 0.7 % sulfur and marine gas oil (MGO) containing 0.1 % sulfur. Finally, other studies have emphasized the benefits of different engine categories and upgrades for the reduction of ship emissions (Fridell et al., 2008; Grigoriadis et al., 2021b; McCaffery et al., 2021; Sugrue et al., 2022; Xiao et al., 2018). Sugrue et al. (2022) observed that newer engines (built after 2016) emit 3 times less BC than engines built before 2000. Grigoriadis et al. (2021b) showed in their review of emission factors that, among engines built before 2016, slow-speed diesel (SSD) engines emit 1.5 and 2 times more NOx than medium-speed diesel (MSD) and high-speed diesel (HSD) engines, respectively. They also underscored the lack of data regarding emissions from auxiliary engines, which are used by ships while docked. McCaffery et al. (2021) nonetheless showed that NOx emissions from the main engine (SSD) of a container ship running on MGO were twice as high as those from its auxiliary engines (MSD) also operating using MGO. However, this difference cannot be attributed to the engine being main or auxiliary but are rather attributed to the engine category (SSD/MSD), as highlighted by Grigoriadis et al. (2021b).
Based on the aforementioned studies, it can be concluded that research often focuses on specific ships or on a limited set of pollutants (typically NOx, SO2, PM) and has usually been conducted during open-sea operations, thus overlooking the specific characteristics of port operations. Studying emissions during port operations is crucial, as these emissions significantly differ and more directly impact air quality and public health in port cities (Toscano, 2023; Viana et al., 2020). In fact, the contribution of ship emissions becomes more prominent as the area of focus narrows – from less than 5 % of PM2.5 on a global scale (Crippa et al., 2019) to 15 % in the Mediterranean region (Fink et al., 2023) and up to 60 % within port areas, such as the French port of Calais (Ledoux et al., 2018), where emissions from port operations become more significant. While docked, ships primarily use their auxiliary engines at optimal and stable loads, resulting in relatively steady emissions. In contrast, during manoeuvring or navigation, ships mostly rely on their main engines, which often operate at low and unstable loads, leading to fluctuating emissions. Engine startups can also cause significant emission spikes. Additionally, as previously mentioned, the use of exhaust treatment systems and different fuel types further complicates the analysis.
Considering all these elements, this study provides the physical and chemical characteristics of plumes emitted by various ships during port operations in Marseille, one of the largest ports in the Mediterranean. This coastal city faces significant anthropogenic pressure, which contributes to concerning levels of atmospheric pollution, especially fine particles (Chazeau et al., 2021). The analysis is based on high-temporal-resolution measurements to characterize the overall composition of ship emissions, both gaseous and particulate, with a particular focus on submicron particle composition. To achieve this, ship emission plumes were identified by cross-referencing historical automatic identification system (AIS) data on ship locations with meteorological conditions. Emission factors (EFs) have then been calculated accounting for ship category, operating phase, and plume age, providing crucial data to assess the impact of ship emissions in coastal areas.
2.1 Measurement sites
The measurement campaign took place in the summer of 2021 (from 30 May to 3 July) in the port of Marseille (Grand Port Maritime de Marseille, GPMM) on the French Mediterranean coast. This port is located alongside the central area of Marseille, the second-largest city in France in terms of population (INSEE, 2020). It is one of the major passenger ports in the Mediterranean, with a yearly flux of 3 million passengers via 500 cruise ship and 2200 ferry (also called ro-ro (roll on–roll off) passenger ship) calls (Marseille Fos Port, 2022, 2023). The port also receives nearly 1000 cargo ship calls, handling 77×106 t of goods (Marseille Fos Port, 2023). Freight ship traffic remains relatively constant throughout the year, with an average of 80 calls per month, while cruise and ferry traffic intensifies between April and October, with an average of 55 and 200 calls per month, respectively, compared to 25 and 150 for the rest of the year.
In 2020, worldwide maritime ship traffic, and consequently that of Marseille, suffered a sharp decline due to restrictions linked to the Covid-19 pandemic, especially for cruise ships (−92 % in Marseille; Marseille Fos Port, 2022), which remained docked for just over a year. However, in 2021, a strong recovery in traffic was recorded, with the exception of cruise traffic, which only picked up in July, and the 2019 levels were reached again in 2022 (Marseille Fos Port, 2022, 2023).
In 2021, the port of Marseille was not within an Emission Control Area (ECA) and followed the global sulfur cap of <0.5 %. However, EU regulations required ships docked for more than 2 h to limit sulfur emissions to <0.1 %, the same as in ECAs. From May 2025, the Mediterranean, including Marseille, has become an ECA (ECA-MED), enforcing a <0.1 % sulfur limit for all vessels operating within it.
Measurements were conducted simultaneously at two stations located inside the port area along the berths (Fig. 1). The two stations were chosen based on the analysis of historical weather data and exploratory measurements of air quality inside the port according to the following criteria: (i) as close as possible to ship emissions and therefore to shipping lanes (Fig. 1), (ii) limiting the influence of other sources, (iii) maximizing the probability of the station being downwind of plumes, and (iv) capturing plumes representative of the diversity of ships accessing the port of Marseille from the north or the south. Cruise and cargo ships access the port from the north, while ferries access from both the north and the south. The north channel is mainly used by ferries to and from Corsica, while the south channel is used by ferries to and from international destinations in addition to Corsica.
The first station, labelled PEB (for its proximity to the Phares et Balises facility), was located on a seawall 150 m from the northern access seaway to the port, less than 700 m south-east of the cruise terminals, 1200 m south of the container terminal, and about 800 m north-west of the ferry berths to Corsica (43°20′6.89′′ N, 5°20′21.76′′ E; 5 m a.s.l.).
The second station, labelled MAJOR (for its proximity to the Major Cathedral), was located along the Joliette berth, the main access road to the port, 250 m from the access lane to the port via the southern pass, less than 200 m north-east of the luxury cruise terminal, 150 m east of the ferry berths to Corsica, and around 350 m south-east of the berthing quays for ships travelling to and from north Africa (43°18′0.51′′ N, 5°21′48.01′′ E; 5 m a.s.l.).
These two stations are located 2500 m west and 5500 m north-west of Marseille's urban background pollution reference station (MRS-LCP) (Fig. 1).
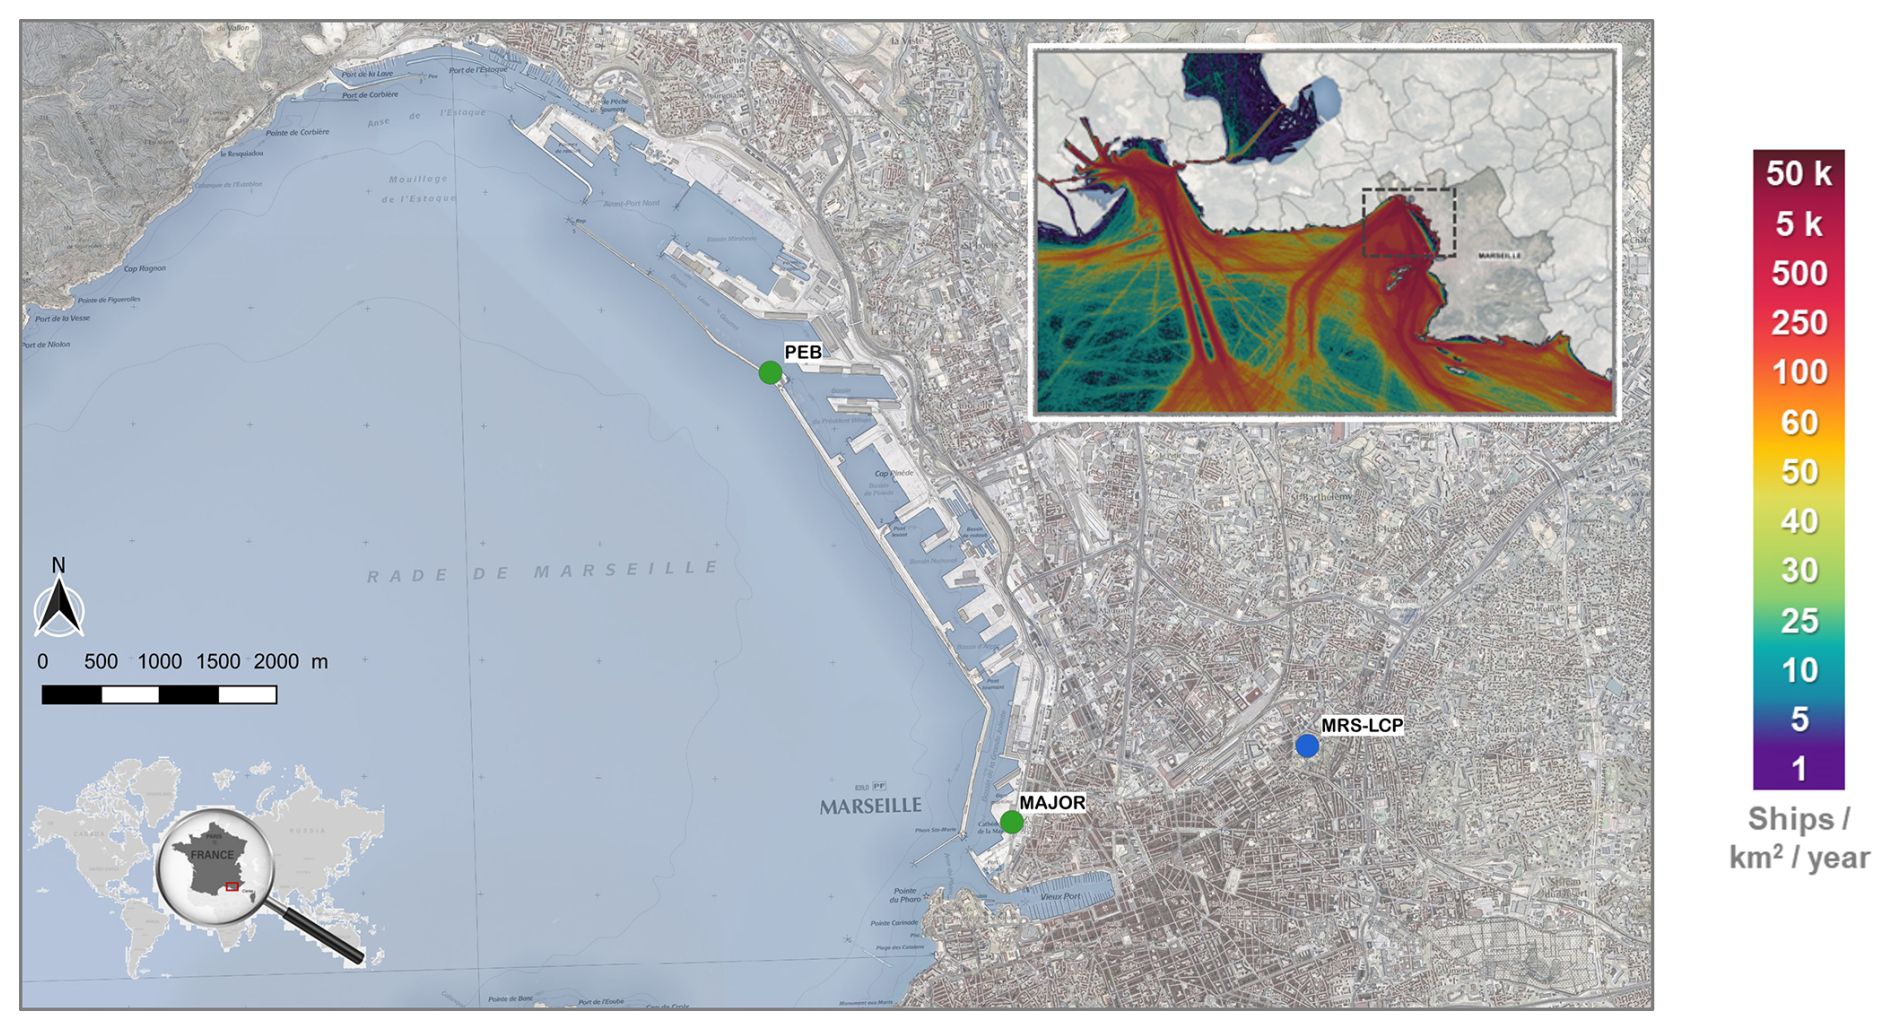
Figure 1(a) Map of the port of Marseille with the measurement stations (green filled circle) – PEB near the northern access lane and MAJOR near the southern access lane – and the urban background reference pollution station MRS-LCP (blue filled circle). The inset map shows ship traffic density on a larger scale, with the colour bar indicating the number of ships passing per year per square kilometre (MarineTraffic, 2022). Maps taken from Google satellite images (© Google Maps) and the topographic map SCAN 25 (© IGN, 2022).
2.2 Instrumentation
Table 1 lists the online instruments that were housed in the two measurement stations. The technical specifications (flow rate, detection limits, and uncertainties) and the quality controls (calibration and instrumental background) carried out to ensure the accuracy of the measurements are presented in Table S1 and Table S2. Individual sampling lines were used for most instruments, with an air intake at about 4 m above the ground level.
2.2.1 Particle-phase measurements
The chemical composition of the submicron fraction of the aerosol was studied using three different analysers. Concentrations of non-refractory species, SO, nitrate (NO), ammonium (NH), chloride (Cl−), and OA, were measured at the PEB station, with a high-resolution time-of-flight aerosol mass spectrometer (HR-ToF-AMS, Aerodyne) with a 30 s time resolution (DeWitt et al., 2015). The metal composition of the submicron particles was also determined at the PEB station using an online energy-dispersive X-ray fluorescence (EDXRF) spectrometer (Xact 625i, Cooper Environment) (Tremper et al., 2018) with a 30 min time resolution. Equivalent black carbon (BC) measurements at a 1 min time resolution were performed with a multiangle absorption photometer (MAAP 5012, ThermoFischer) (Petzold and Schönlinner, 2004) at the PEB station and with a dual-spot seven-wavelength aethalometer (AE33, Magee Scientific) (Drinovec et al., 2015) at the MAJOR station.
Particle number (PN) concentrations were measured by ultrafine condensation particle counters (CPCs) in the size range of 2.5 nm to 3 µm at PEB (CPC 3776, TSI) and from 7 to 2500 nm at MAJOR (Envi CPC 200, Palas), with a temporal resolution of 1 s. The aerosol number size distribution was measured at both sites (i) in the range of 15–660 nm using scanning mobility particle sizers (SMPSs 3936, L-DMA, CPC, TSI) with a scan time of 2 min for 105 channels and (ii) in the range of 250 nm to 3.2 µm using an optical particulate counter (OPC model 1.109, Grimm Aerosol Technik) with a scan time of 1 min for 31 channels. Particle mass concentrations (PM1, PM2.5, PM10) were also estimated by the OPC.
2.2.2 Gas-phase measurements
Non-methane volatile organic compounds (NMVOCs) were monitored with a proton transfer reaction time-of-flight mass spectrometer (PTR-ToF-MS 8000, Ionicon Analytik, Austria) at a 10 s time resolution. An overview of the PTR-ToF-MS operation and data analysis can be found in Marques et al. (2022). The main organic molecules detected during the measurement period are listed in Table S3. CO2, CO, methane (CH4), and ammonia (NH3) were measured at a temporal resolution of 5 s by a cavity ring-down spectrometer (model G2103 for NH3 and model G2401 for CO2, CO, CH4, H2O; Picarro) (Martin et al., 2016). Concentrations of regulatory gaseous pollutants were measured at a 10 s time resolution by a chemiluminescence analyser (model 200E, Teledyne API) for the combined measurement of nitrogen oxide (NOx, NO, and NO2), by an absorption spectrometry monitor (model 400E, Teledyne API) for ozone (O3), and by a fluorescence analyser (model AF22 Environment SA at PEB station and model 100E Teledyne API at MAJOR station) for sulfur dioxide (SO2).
Table 1Overview of instruments deployed during the field campaign.
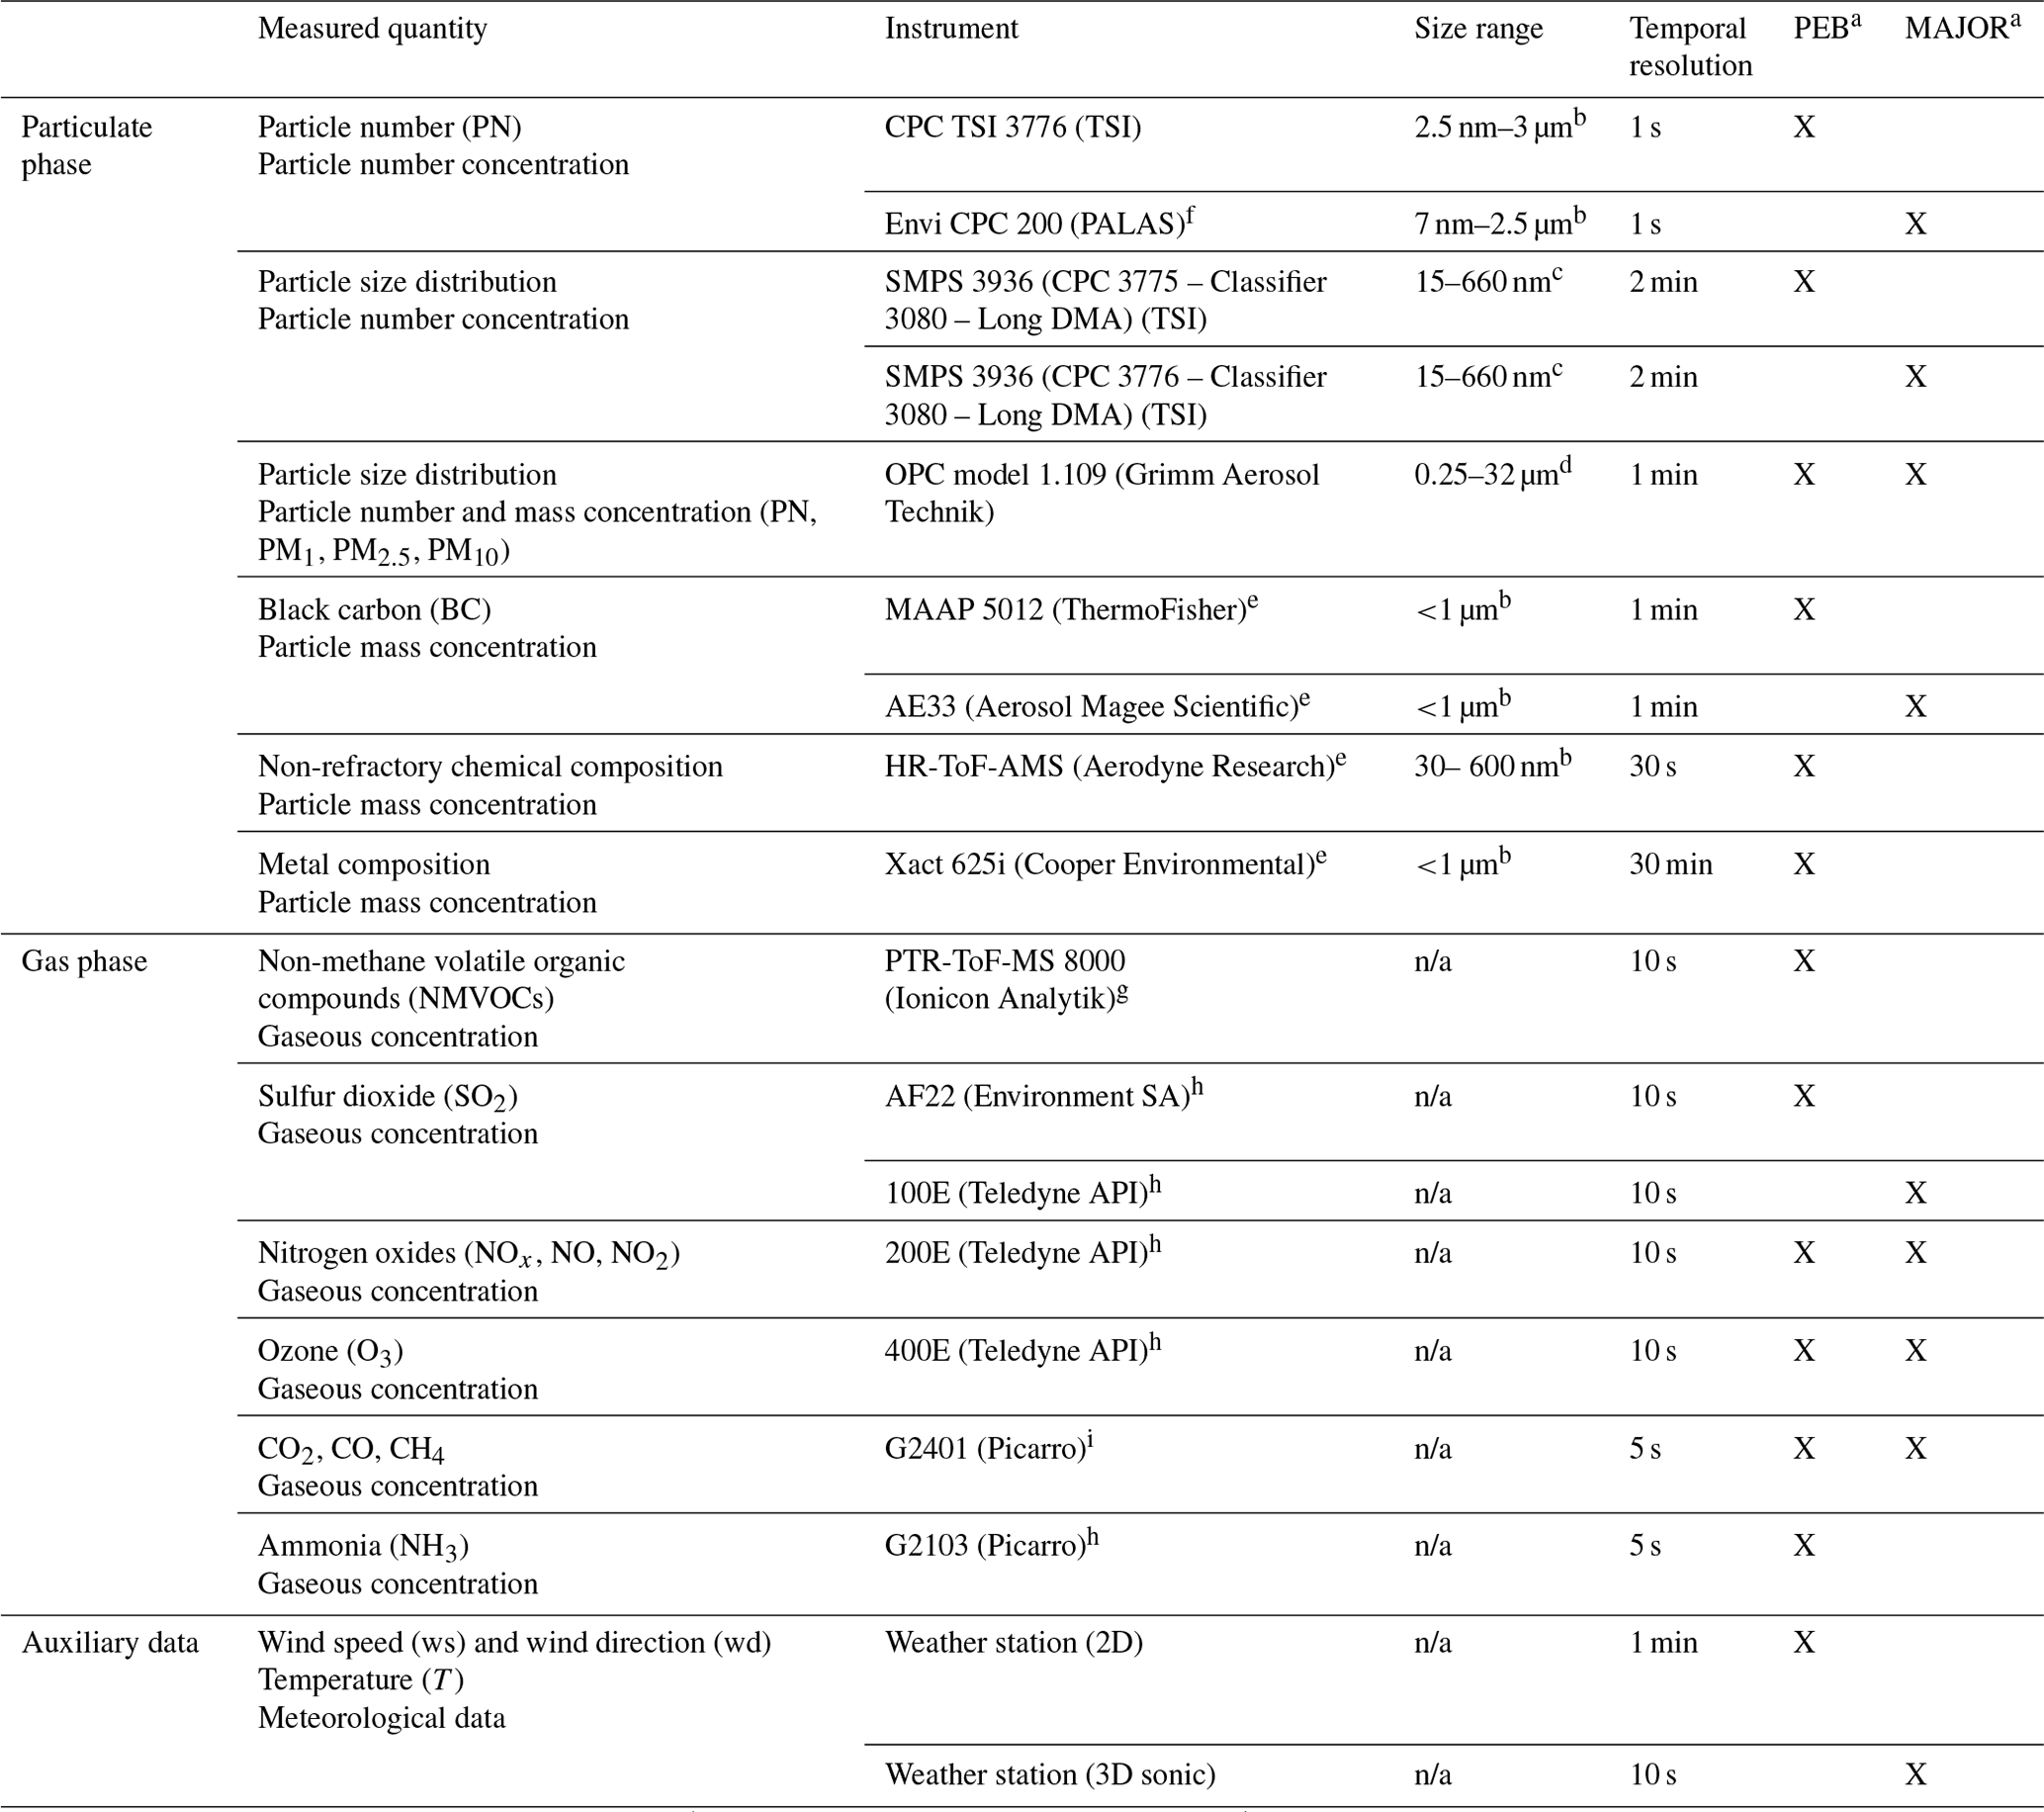
a Columns indicate the station at which the instruments were operated. b Aerodynamic diameter. c Electrical mobility diameter. d Optical diameter. e Equipped with a PM1 cut-off inlet. f Equipped with a PM2.5 cut-off inlet. g Equipped with in. silcosteel tubing. h Equipped with in. PTFE tubing. i Equipped with in. Synflex tubing. n/a: not applicable
2.2.3 Automatic identification system (AIS) data
AIS data records from all ships during the measurement period (31 May–3 July 2021) that were within a 10 km × 10 km area surrounding the port of Marseille were purchased commercially from MarineTraffic (2022). The requested AIS database contained 326 590 records, each containing the following information: the vessel's identification number (Maritime Mobile Service Identity, MMSI), position (latitude and longitude), date and time, status, heading and course angles, speed, and the last and next ports visited. To improve the quality of the AIS data, the dataset was (i) pre-processed to exclude sailing vessels and pleasure craft and to remove data redundancy and noise, (ii) interpolated at a time step of 90 s to remove trajectory outliers and recover lost AIS data using the PyVT tool developed by Li et al. (2023), and (iii) cross-referenced with the ship arrival and departure data supplied by GPMM. Additional vessel parameters such as name, category, year the vessel was built, and engine and engine power (in kW) were retrieved from the MMSI provided in the database.
2.3 Data analysis
Data processing included calibration and validation using internal analyser parameters, intercomparisons, and user interventions, as well as peak synchronization to compensate for potential variations in analyser response times.
2.3.1 Plume identification and ship assignment
Plume identification was achieved by cross-referencing measurement data with meteorological and AIS data (Ausmeel et al., 2019; Celik et al., 2020; Eger et al., 2023; Krause et al., 2023). The selection steps and criteria used are detailed below.
- 1.
Plume pre-selection was done using four typical tracers of ship activity (CO2, NOx, BC, PN) and O3.
- i.
Calculation of atmospheric background was performed using a lowpass-filtered time series in the form of a rolling median with a 60 min window size for each of the five selected pollutants. This lowpass filter describes the variability in the background concentration due to atmospheric physico-chemical processes and regional transport of pollutants but excludes the short-term variation caused by passing ships (Krause et al., 2023).
- ii.
Subtraction of the previously calculated background from the raw signal for each of the five selected pollutants was performed.
- iii.
Selection of peaks was performed based on concentration variations exceeding 3 times the average of the rolling standard deviation (σ) of the background with a 60 min window size. This variation can be negative (i.e. O3 is consumed in the plume) or positive (the other species).
- iv.
Plumes for which a peak was identified for at least three of the five selected pollutants (70 % of measured pollutants in the occasional absence of measurements for one or more pollutants) were retained.
- i.
- 2.
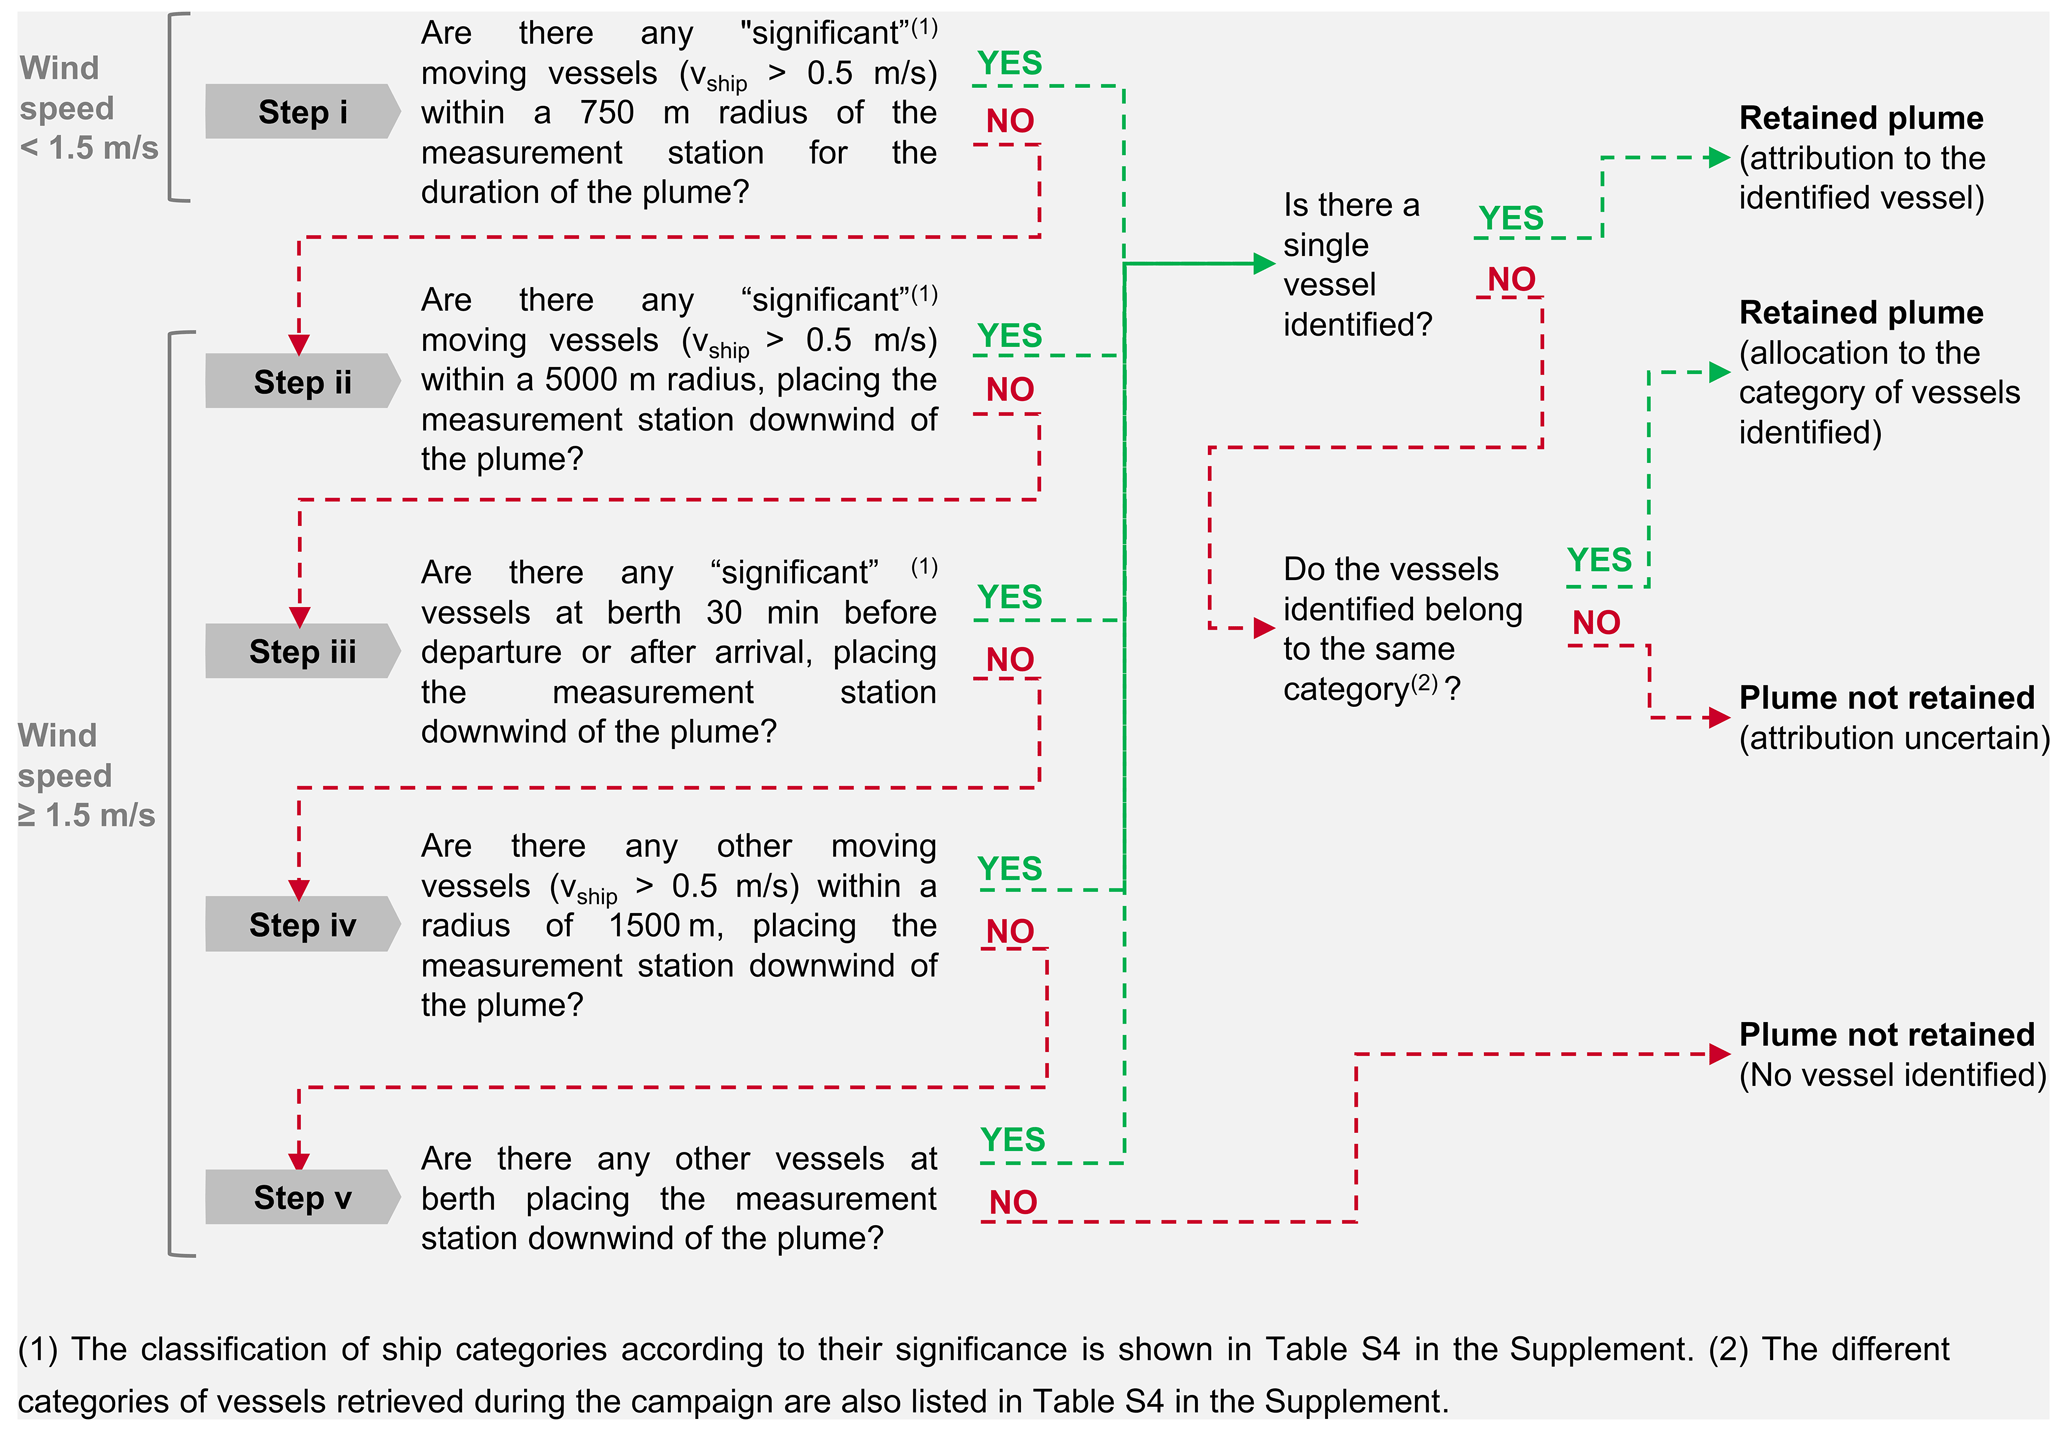
Only plumes that could be positively attributed to a single ship or ship category were selected for further analysis. To this end, each plume, ship location, and movement data point were cross-referenced with wind speed and wind direction according to the methodology outlined in Fig. 2. Step (i) essentially addresses the specific case of low wind speed. For wind speeds under 1.5 m s−1, diffusion-induced dispersion may be significant compared to advection-induced dispersion (Arya, 1995; Jeong et al., 2013; Rakesh et al., 2019). Under these conditions, it is therefore possible to capture the plume, provided that it passes close to the station. Steps (ii) to (v) use dispersion cones to narrow the ship search area (steps (ii) and (iv) for moving vessels in port and steps (iii) and (v) for vessels at berth). The wind direction used for these cones is the average of the wind directions plus or minus 15° over the target period at the measuring station.
- 3.
In a final step, fine tuning of the database was applied, with the following additional criteria.
- i.
Plumes that could not be individualized by a return to the baseline level in the quantification phase of plume characteristics, as explained in Sect. 2.3.2, were removed.
- ii.
Plumes with a duration of less than 1 min were disregarded.
- iii.
Plumes with a residence time >30 min were removed due to attribution uncertainty.
- iv.
Some plumes (12 %) from numerous pleasure craft and passenger shuttles arriving at or leaving the Vieux Port marina (located in Fig. S2) were manually recorded in the database under south-westerly wind conditions that placed the MAJOR station downwind of these emissions. This was done despite the impossibility of distinguishing the plumes individually.
- i.
2.3.2 Quantification of plume characteristics
The most common approach to characterize the chemical composition of ship plumes is that of emission factors (Ausmeel et al., 2019; Celik et al., 2020; Pirjola et al., 2014; Van Roy et al., 2022). This approach, described in detail by Celik et al. (2020), is based on the carbon balance method, which rules out plume dilution and background contributions. For each plume that was successfully assigned to a single ship or a ship category, the emission factor of each pollutant x (EFx), expressed in grams or particle number per kilogram of fuel used, was derived from Eq. (1) (Diesch et al., 2013).
where wc represents the carbon mass fraction of fuel used (fixed at 0.865 kg C kg; Celik et al., 2020; Grigoriadis et al., 2021b); is the mass fraction of carbon in CO2; [x] is the excess (above the atmospheric background) concentration of pollutant x in µg m−3 for mass concentrations and in 1012 particles cm−3 for number concentrations; [CO2] is the excess CO2 concentration in mg m−3; and the indices S and E denote the start and end of the plume, respectively.
Plume start and end dates (indices S and E) were retrieved from the point of inflection of the concentration to the time curve, i.e. when the derivative crosses zero, to avoid any subjectivity. EFs were calculated separately for each pollutant measured, accounting for the response times of each instrument (Ježek et al., 2015). Then the background to be subtracted from the signal to determine excess concentrations was defined by the mean concentrations of two 30 s background intervals before and after the peak. A toolkit has been developed in the Igor Pro 8 environment (WaveMetrics, USA) to systematically perform these calculations.
Furthermore, particle size distributions in ship emission plumes were computed by applying the same method to SMPS measurements. However, the start and end times for defining the background and plume intervals were set identically for all size classes based on those defined for the CPC analyser. This is because the CPC analyser counts the total number of particles regardless of size and provides a more accurate time resolution (10 s). As the plume duration can approach the 2 min scan time of the SMPS, additional checks were applied. For each plume, the total number of particles measured by the SMPS and the CPC were compared. Only plumes with a Pearson correlation coefficient greater than 0.7 were selected for the analysis.
2.3.3 Short-term impact of shipping plumes on ambient air concentration levels
The short-term impact of shipping plumes on ambient air concentrations levels was assessed for each single plume using Eq. (2).
with the average excess concentrations and [x](t) the excess concentrations over the plume duration period (E–S). Plume start and end dates, as well as the background corrections, have been determined using the method described in Sect. 2.3.2.
This approach has certain limitations. It excludes a significant number of ship plumes from the analysis, particularly during periods of heavy maritime traffic, which could skew the estimated additional average concentrations. However, this exclusion ensures that the results are not biased by non-ship sources resembling ships emissions (Eger et al., 2023).
3.1 Campaign overview
3.1.1 Meteorological and ship traffic conditions
Plume detection is based on both meteorological and ship traffic conditions. The meteorological conditions observed during the campaign highlight the complexity of air mass circulation in the study area. According to Fig. S1, wind directions vary considerably within the port area, especially during land and sea breezes, which are common at this time of year. Wind direction analysis during the campaign enabled us to estimate the probability of the measurement stations being downwind of Marseille port's main ship emission areas (located in Fig. S2). Combining all areas, this probability was 35 % at the PEB station and 20 % at the MAJOR station. Detailed probabilities for each zone are detailed in Table S5.
In June 2021, approximately 800 ships arrivals and departures were recorded by the GPMM. That excludes pilot boats that systematically escort vessels from the lane entrance to the mooring berth and back, as well as pleasure craft and passenger shuttles that mainly access the marinas of Vieux Port, Estaque, and the Frioul Islands (located in Fig. S2), which are located outside the GPMM sector. Most ships operating in the GPMM were dedicated to passenger transport (40 %), including ferries and cruise ships (35 % and 5 %, respectively). Cargo ships represent 25 % of the activities, while tugs and tankers accounted for 20 % and 10 % of port movements, respectively. Other vessels primarily used for sea rescue made up the remaining 5 %. On average, ship arrivals peaked early in the morning from 04:00 to 06:00 UTC, and departures were most frequent late in the afternoon from 16:00 to 18:00 UTC. This schedule varies slightly according to ship category, as shown in Fig. S3.
3.1.2 Concentrations and impact of port activities
A total of almost 110 chemical components were measured during the campaign, including 45 trace-metal elements (or metals) and 41 NMVOCs. The main statistics of pollutant concentrations measured at both PEB and MAJOR stations are reported in Table S6. Time series of the key substances and the particle size distribution over the whole campaign are given in Figs. S4 and S5.
To investigate the impact of port activities on local air quality, concentration levels of pollutants measured simultaneously at the two stations were compared with those from the MRS-LCP station (Table S6), part of the regional air quality network. This monitoring station, located in the city's centre (Fig. 1), was chosen because it serves as a reference for urban background pollution (Chazeau et al., 2021). Average concentrations of PN, PM2.5, PM1, and NOx at PEB and MAJOR were 1.5 to 2 times higher than those measured at MRS-LCP, indicating a significant influence of port activities. In contrast, average levels of other compounds were similar across all stations. Additionally, analysis of maximum concentrations and the 75th percentile reveals that pollutants such as SO2 and some metals (As, Cd, Co, Fe, Ni, Sb, Se, Sn, V, Zn, and Zr) are 2 to 10 times higher near the port than they are downtown.
To identify the sources responsible for the high concentrations in the port area, the conditional bivariate probability function (CBPF; Uria-Tellaetxe and Carslaw, 2014) was computed for measured species. The CBPF is a polar coordinate graphical method commonly used to highlight wind speeds and directions associated with high concentrations of a pollutant in order to identify emission sources (Adotey et al., 2022; Ryder et al., 2020; Toscano et al., 2022). It estimates the probability that measured concentrations exceed a predetermined threshold (in this case the 80th percentile) for a given range of wind sectors and wind speeds. As shown Fig. 4, CBPF indicates that the highest concentrations typically occur when the measurement sites are downwind of the mooring berths or of the ships' access lanes to the port (located in Fig. S2), except for OA, which also had high concentrations associated with land breezes (to and from the city). These findings are supported by analysis of the daily profiles of concentrations (Fig. S6), showing a correlation with ship arrival and departure profiles (Fig. S3) depending on the pollutants.
This correlation is particularly strong for NO, BC, PN, vanadium (V), and nickel (Ni). The increased dispersion of concentrations and maxima and the differences between mean and median concentrations during ship movements underscore the significant impact of their emissions on the concentrations measured in the port. For the other substances, such as SO2 and NMVOCs (e.g. toluene) in the gaseous phase and SO or OA in the particulate phase, correlations exist but to a lesser extent. For OA and NMVOCs (e.g. toluene), average concentrations slightly increase during ship movements but rise more notably at night (with greater dispersion and extrema) due to the nighttime land breeze regime bringing urban emissions back to the measurement station. In the case of SO2, average concentrations and peaks also slightly increase during ship movements but are enhanced over the morning and are longer than for other compounds, suggesting contributions from other sources. This could be due to sea breezes lifting emissions from the large industrial areas located 25 km north-west of Marseille, which had been previously pushed away to sea by nighttime land breezes (Chazeau et al., 2021). Unlike SO2, SO does not follow the same daily cycle, instead showing concentrations increasing in the afternoon, mainly driven by its photochemical formation cycle. It is worth noting that the reduction in sulfur content in fuels in 2020 could lead to lower contributions from ships compared to other sources. Indeed, as shown in Fig. 3b by the flat pattern of the daily profile observed after the new regulations, SO2 may become a less effective tracer of ship emissions.
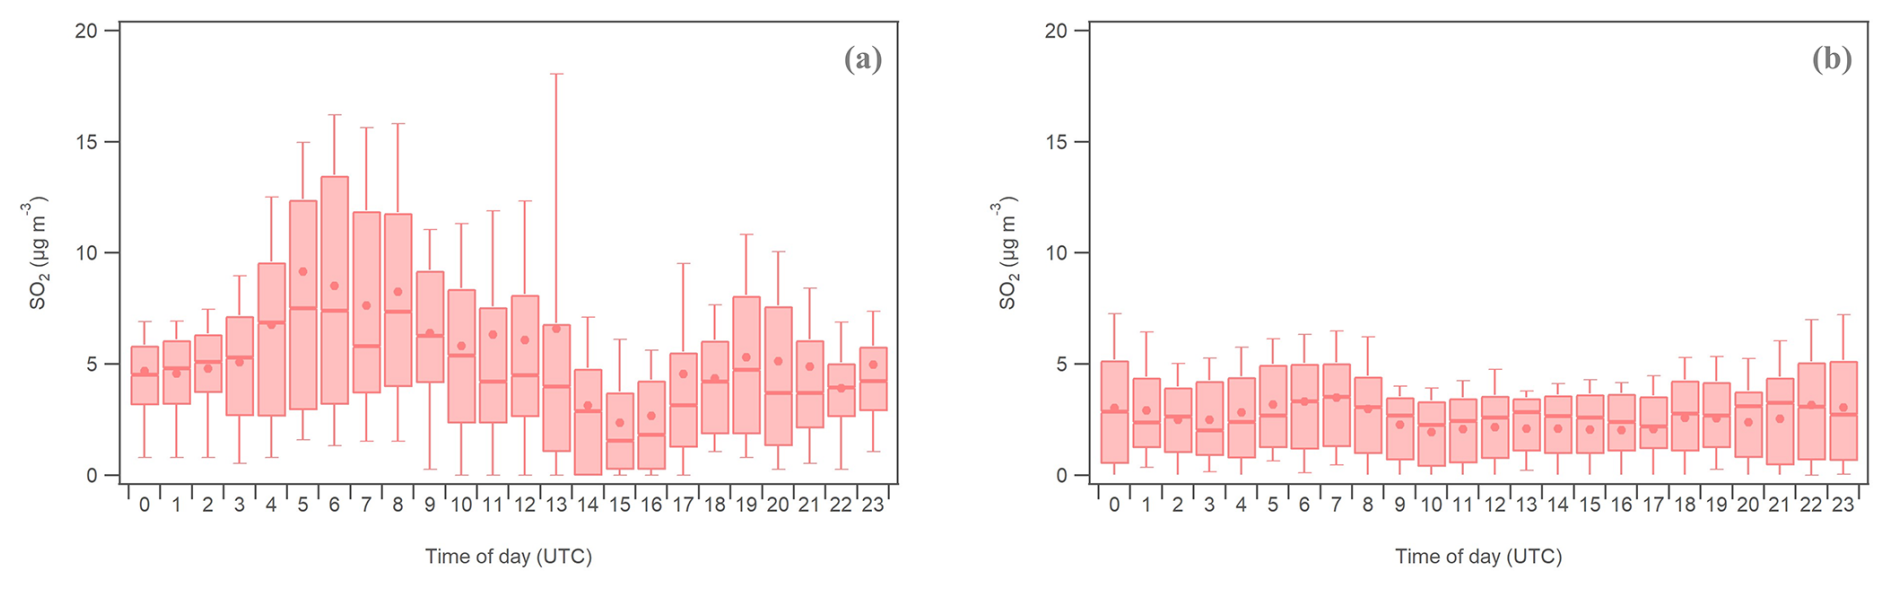
Figure 3Daily profiles of SO2 at the PEB station (a) before implementation of the new regulations concerning sulfur content in ship fuels (exploratory campaign to define the location of the stations in September 2019) and (b) after implementation of these regulations (the campaign conducted for this study in June 2021). For each boxplot, the coloured box represents the interval between the 25th percentile and the 75th percentile; the vertical lines represent the interval between the 10th percentile and the 90th percentile; and the horizontal line and circle are the median and mean, respectively.
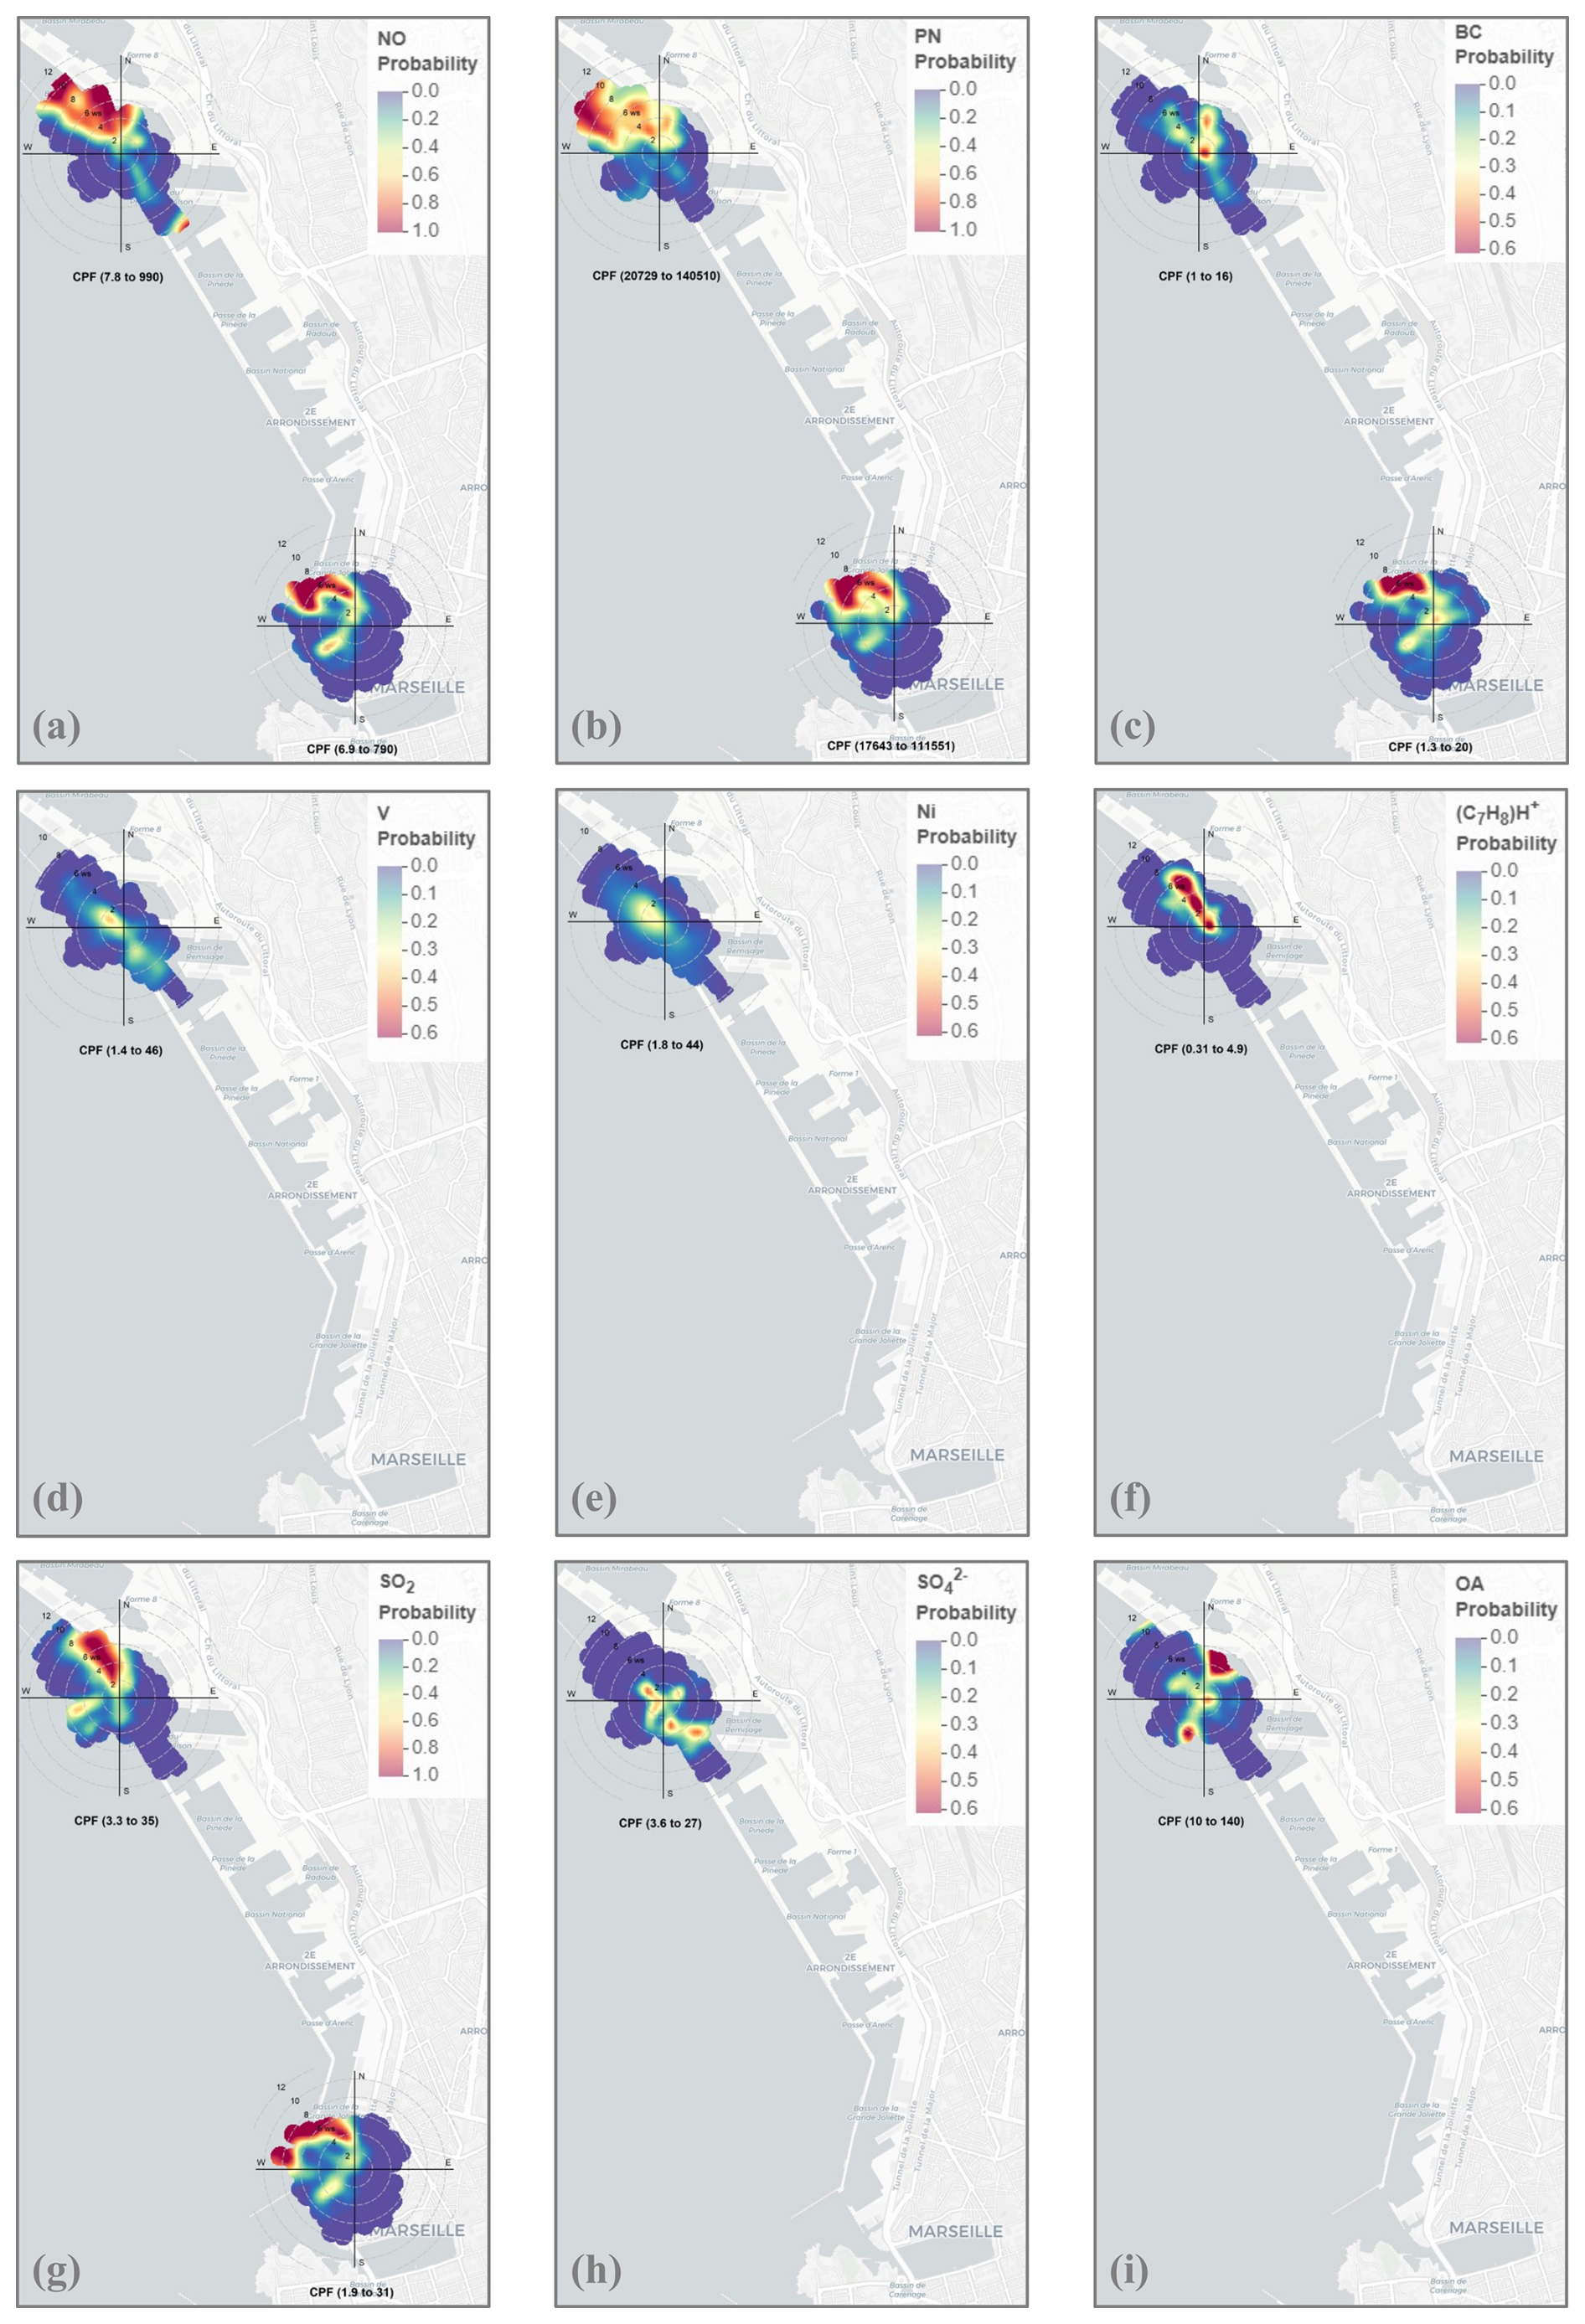
Figure 4Conditional bivariate probability function (CBPF) computed for (a) NO, (b) PN, (c) BC, (d) V, (e) Ni, (f) toluene (NMVOC), (g) SO2, (h) SO, and (i) OA during the campaign at the PEB and MAJOR stations. The radial axis indicates wind speed in m s−1, and the colour bar indicates the probability of a species being above the 80th percentile of the compound. Maps taken from © OpenStreetMap contributors 2023 © CARTO. Distributed under the Open Data Commons Open Database License (ODbL) v1.0.
3.1.3 Ship plumes
From the measurements taken at the two stations (PEB and MAJOR) and following the procedure described in Sect. 2.3.1, 118 plumes were attributed to ships at berth and 235 plumes to ships manoeuvring (ships at speeds below 2.5 m s−1 (5 kn) or navigating (ships at speeds between 2.5 and 14 m s−1) in or near the port area (less than 750 m from the coast).
The yield of plumes attributed to ships manoeuvring and/or navigating is 29 % of the number of passages recorded by the AIS data (see Sect. 3.1.1). This relatively low yield is primarily due to the dependence on wind direction at the time of the ship's passage. The plume can only be captured when the wind direction positions the measurement station downwind of the ship's emissions. This dependency, combined with the stringent criteria of the plume assignment algorithm, resulted in the exclusion of many plumes, particularly during periods of heavy ship traffic. All these precautions ensure the robustness of the emission factors (EFs), especially when analysing EFs as a function of ship characteristics. These restrictions do not affect the EF values themselves, as the number of plumes detected does not influence the EF values, which are defined through normalization by CO2.
The plume samples span eight different ship categories, among which are the three main categories operating at GPMM (ro-ro ferries, cargo ships, and cruise ships). However, plume frequency varies by category, with ro-ro ferries comparable to cruise ships, together accounting for 70 % of the sample plumes. The remaining categories in descending order of frequency include pleasure craft, cargo ships, tankers, passenger shuttles, tugs, and rescue vessels. The sample also encompasses the various operational phases observed in a port: at berth (33 %), manoeuvring (16 %), and navigating (51 %), with ships generally maintaining speeds below 5 m s−1 when not docked due to regulatory speed limits in port. This reduced speed generally corresponds to an engine load of less than 25 % (Jeong et al., 2023; Knudsen et al., 2022; Lack and Corbett, 2012). However, the breakdown of operational phases varies by ship category. For cruise ships, the at-berth phase is most common, accounting for 90 % of their time. In contrast, the navigation phase predominates for most other categories of ship (80 %) except for tankers, which show an even distribution between navigation and manoeuvring.
Figure S7 shows the example of two successive plumes from different ro-ro ferries arriving at the port. As expected, these emissions mainly consist of a blend of gaseous compounds (such as CO2, CO, NOx, SO2) and particulate compounds (BC, SO, OA), accompanied by a decrease in O3 levels. The particle size distribution from these ships shows a bimodal pattern (20 and 80 nm) for the first ship, with sulfur predominantly emitted as SO, and an unimodal pattern (20 nm) for the second ship, where sulfur is mainly emitted as SO2. Regarding metals, the 30 min time resolution of the analyser prevents us from distinguishing emissions between the two ships but reveals the presence of V, Ni, calcium (Ca), and iron (Fe). In terms of NMVOCs, only fragments of unspecified hydrocarbons are detectable.
3.2 Emission factors
The methodology described in Sect. 2.3.2 to calculate EFs from the 353 identified ship plumes was applied to all pollutants except trace-metal elements. The 30 min time step necessary to maintain acceptable detection limits is not suitable for the actual duration of the plumes, which typically range from 2 to 14 min. As depicted in Fig. S7c, this mismatch results in a single-point spike above background levels for each detected plume, unlike the continuous measurement of other compounds. Furthermore, the relatively low ΔCO2 values resulting from this time step significantly increase the uncertainties in EF calculations. Sensitivity tests conducted on NOx and PM for different temporal resolutions – from 10 s to 5 min – revealed that the median relative deviation from the finest resolution values is less than 10 % for resolutions under 2 min, 30 % for a 2 min resolution, and greater than 80 % for a 5 min resolution. For temporal resolutions greater than 1 min, the median deviation increases as plume duration decreases, as shown in Table S7.
In the following subsections, we compare EFs obtained in this study with those reported in the literature (as summarized in Table S8, which includes data from over 30 studies using various experimental methods) and those reported in the regional air quality monitoring network's emissions inventory that was used to model the atmospheric dispersion of ship emissions. Additionally, we investigate how ship-related characteristics – ship category, engine power, engine age, operating phase, ship speed, and plume age – affect gaseous and particulate emissions, as well as particle size distribution, during port operations in Marseille.
Due to the non-normal distribution of emission factors, EF values are consistently reported as medians with interquartile ranges (25th–75th percentiles). For the same reason, statistical tests for significance in group comparisons are conducted using the Kruskal–Wallis test, followed by post hoc Dunn tests with the Bonferroni correction when the groups do not share the same central tendency (Borge et al., 2022; Marmett et al., 2023).
To improve the readability of the results and graphs, specific ship characteristics have been grouped. For operational phases, manoeuvring and navigation have been combined into a single group labelled manoeuvring/navigation due to the similar emission factors observed for most pollutants in these phases. Regarding vessel categories, tankers, passenger shuttles, pilot boats, tugs, and rescue vessels have been grouped into the other category because of the limited variety and/or small number of plumes identified for these vessels. Pleasure craft were also included in this group to ensure consistency in the characterization of gaseous and particulate phases. However, since pleasure craft were only identified at the MAJOR station, no chemical characterization of the particulate phase was conducted for this category. Statistically significant differences within these groups are discussed in the main text.
In the remainder of the article, each boxplot is presented with a coloured box representing the range between the 25th and 75th percentiles, while the vertical lines denote the interval between the 10th and 90th percentiles. The horizontal line and circle indicate the median and mean, respectively, and the grey dots represent the extremes. Additionally, a table associated with each boxplot provides the number of studied plumes (NSPs), the number of quantified plumes (NQPs), the total duration of quantified plumes in hours (TDQPs), and the number of different vessels in the quantified plumes (NDVQPs).
3.2.1 Gaseous phase
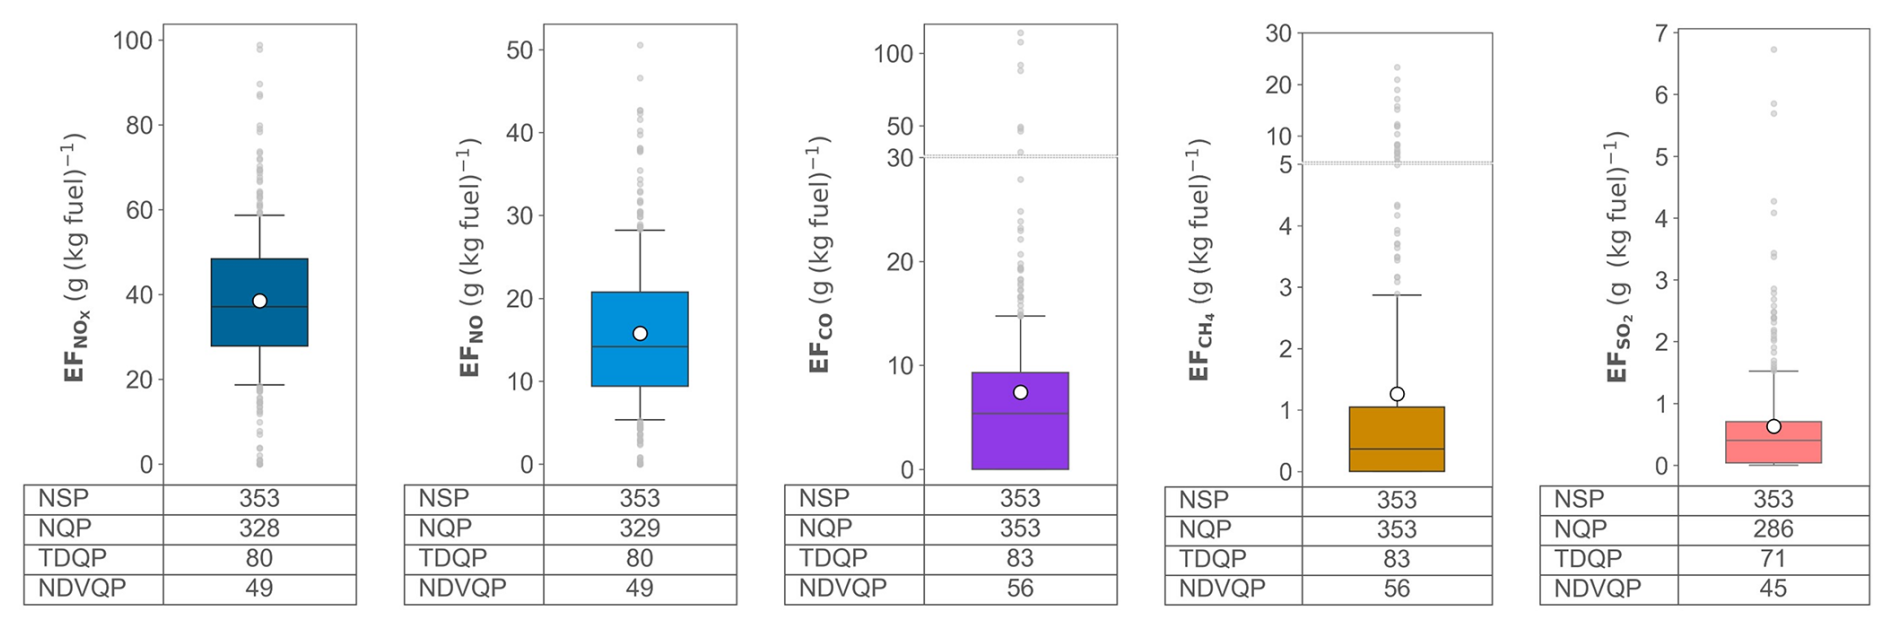
Figure 5 shows the distribution of EFs across all gaseous compounds (see Table S10 for detailed statistics). NMVOCs and NH3 are excluded from these plots because their median and percentile values are below the detection limits, except for aromatic C8 compounds and toluene. These exceptions are discussed in more detail below. The large variability in EFs observed is consistent with findings in the literature (Table S8) and is further accentuated when EFs are compared without considering the specific characteristics of the ships or the fuels used.
Nitrogen oxides (NOx)
For NOx, the median EF of the plumes studied (37 g kg (28–48)) is comparable to the low range of values reported in the literature for ships using fuel oil (average of 57 ± 26 g kg) and 2 times lower than the value from the regional emissions (80 g kg) inventory, which lies in the high range of the values in the literature. Only 2 % of the 353 EFs determined from ship plumes exceed this value.
The median EFNO (14 g kg (9–16)) is significantly lower than the values reported in the literature (average of 70 ± 34 g kg), as most of these values stem from measurements taken directly from the exhaust of ship engines, where NOx emissions are more than 90 % NO (Zhao et al., 2020). This balance is quickly altered in the atmosphere, where NO oxidizes rapidly to NO2. In this case, the oxidation reaction is driven by O3 because the initial NO concentrations in the exhaust gases are much higher than the ambient O3 concentrations, which leads to a local reduction in O3 concentrations and a decrease in the ratio (see Fig. S7a). For this reason, most studies explicitly report only the EF. Nevertheless, field campaign studies that take this oxidation into account report EFNO on the same order of magnitude as that determined in this study (7 ± 1 g kg (Celik et al., 2020) and 16 ± 11 g kg (Diesch et al., 2013)).
Our results showed that the main influence factor is the plume age (or residence time) and to a lesser extent the ship category. Beside these factors, other studies have also pointed out the influence of the operational phase, ship speed/engine load, and engine (Celik et al., 2020; Grigoriadis et al., 2021a; Huang et al., 2018; Peng et al., 2020; Sugrue et al., 2022).
As shown in Fig. 6, as plume age increases, both EF and the ratio decrease during daytime (differences between adjacent classes are not statistically significant but become so with the most widely separated classes), while remaining stable during nighttime (all the groups have the same central tendency). During daytime, the ratio decreases rapidly, from 0.9 at emission (Zhao et al., 2020) to 0.4 for the youngest plumes and 0.3 for plumes older than 15 min. This latter value is close to the one corresponding to photochemical equilibrium (0.2) suggested by Celik et al. (2020) for plumes older than 30 min. In addition, the diurnal 2-fold decrease in EF between the shortest and longest plume age suggests the existence of NOx sinks involving photochemical reactions, with radicals such as OH, HO2, and RO2 or with NMVOCs (Celik et al., 2020). These reactions could lead to the formation of nitric acid and, through heterogeneous reactions, to the production of aerosols containing nitrates or organo-nitrates.
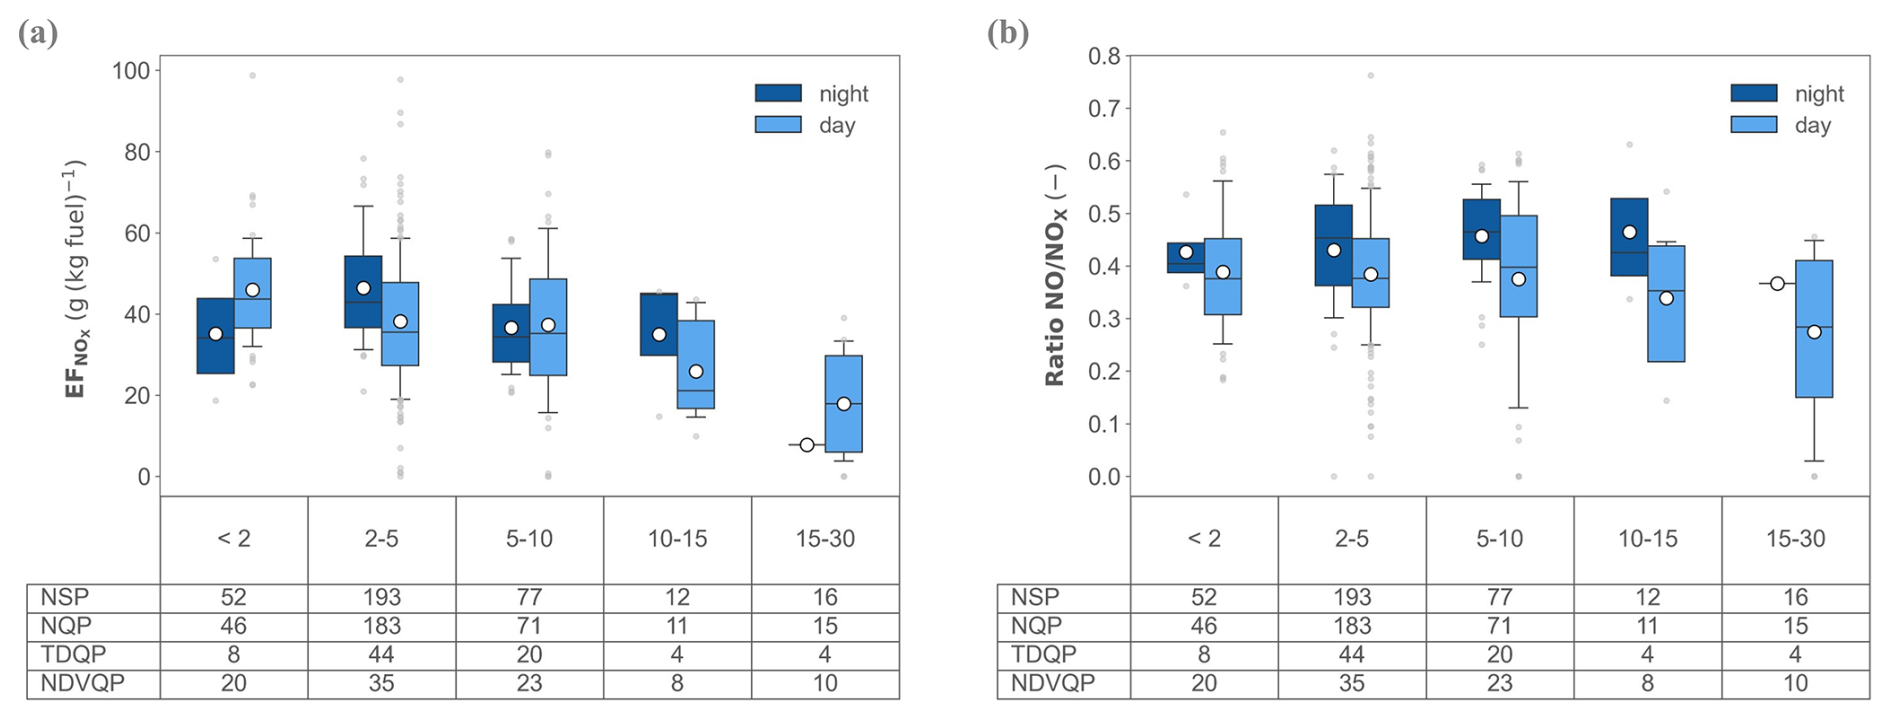
Figure 6Distribution of (a) EF and (b) the ratio as a function of plume age expressed in minutes and time of day (daytime and nighttime).
In addition, as shown in Fig. 7, the categories grouped under the other category exhibit statistically lower EF compared to cruise ships, cargo ships, and ferries. Specifically, the two categories within this group, pleasure craft and passenger shuttles, have the lowest emissions: EF is 1.3 times lower than that of all the other categories combined (31 g kg (23–35) vs. 40 g kg (32–51)). This difference is likely due to the low engine power of these ships (Sinha et al., 2003) or the type of fuel used (petrol can be used for pleasure craft). All other categories – including those within the other category group except for pleasure craft and passenger shuttles – show a similar central trend. This figure also suggests that the operational phases do not significantly affect EFs and confirms that EF values for vessels at berth or operating with an engine load below 30 % are of a similar magnitude (Grigoriadis et al., 2021a) (similar central trend). It should be noted that for ferries at berth, the observed EFs are lower due to the limited number of plumes identified, coupled with a higher proportion of plumes older than 10 min detected during the day.
Finally, analysis of the ship construction year retrieved from the AIS ship tracking data indicates that the is not affected by the tier regulations on NOx production imposed by MARPOL (Tier 0 ships built before 2000, Tier I before 2011, Tier II before 2016, and Tier III after 2016) (similar central trend). This result suggests, as previously pointed out by Knudsen et al. (2022) and Sugrue et al. (2022), that these regulations have little influence on NOx emissions, particularly in the case of low engine loads and for the Tier 0 and Tier 1 ship categories (the most represented categories (90 % of the plumes studied for which the ship construction year was known)).
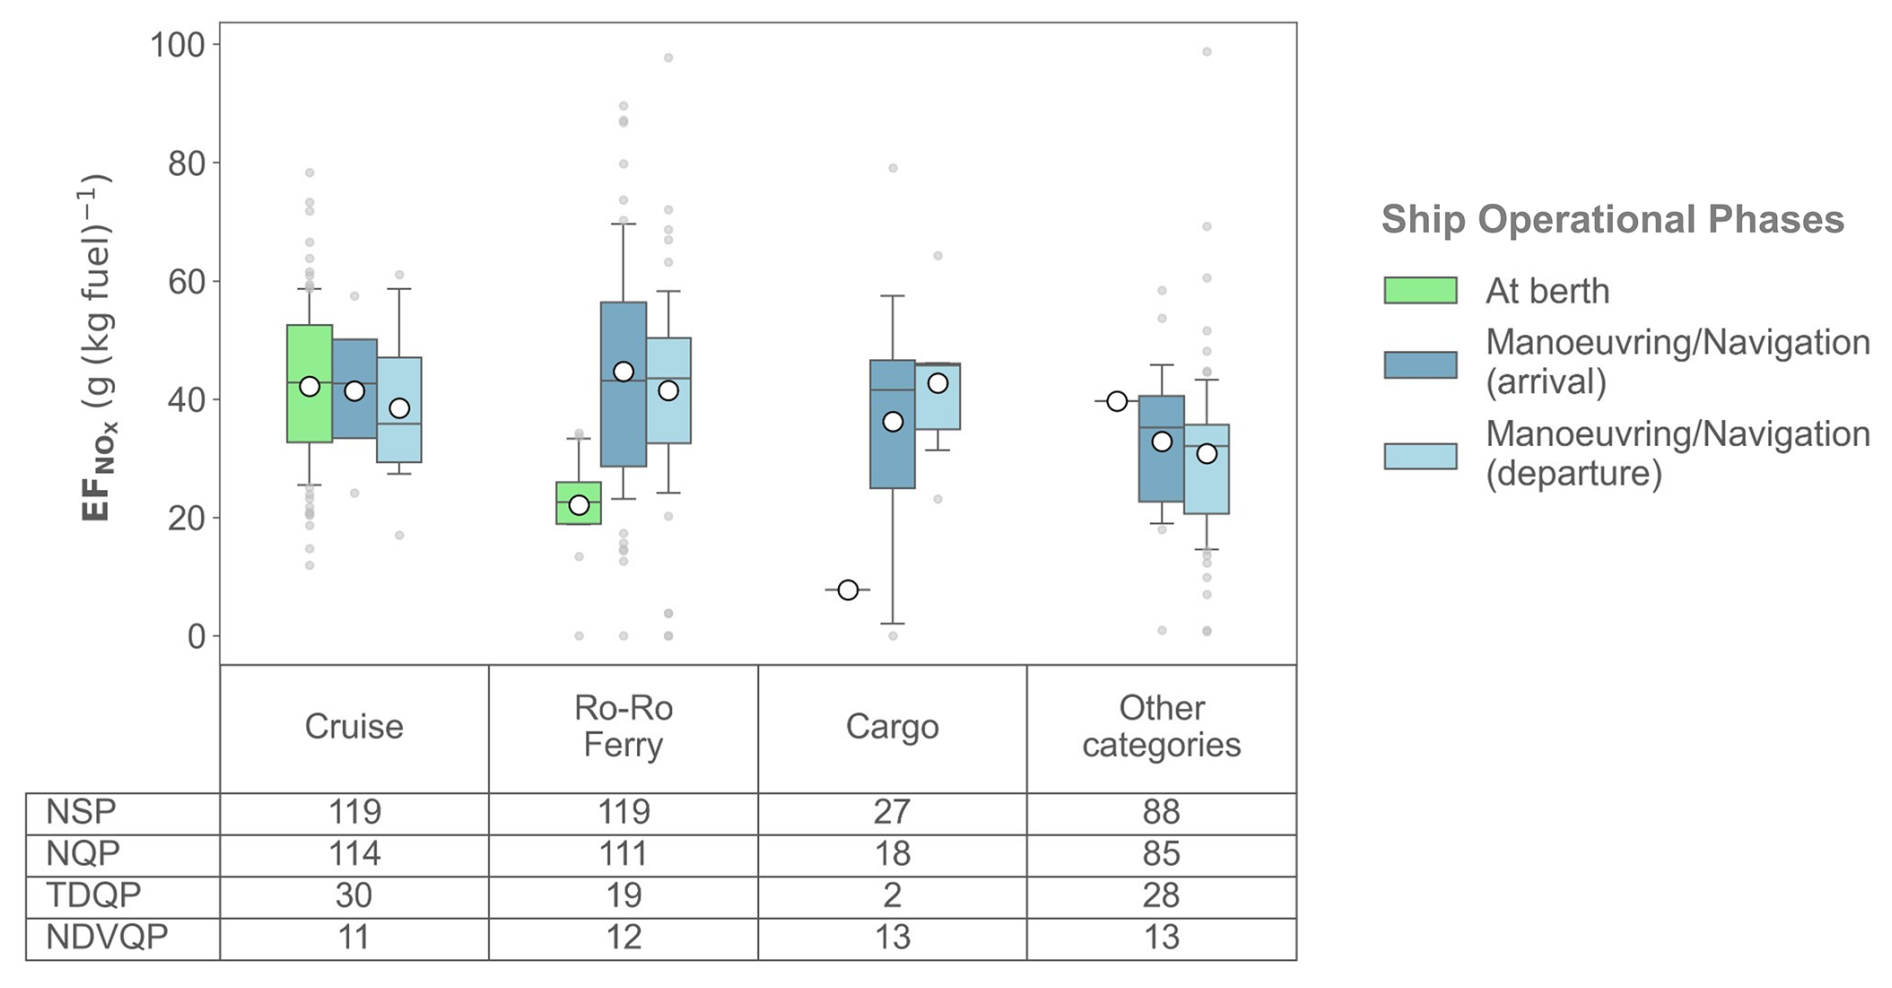
Figure 7Distribution of the NOx emission factor as a function of ship category and operational phase.
Sulfur dioxide (SO2)
The median SO2 emission factor of the plumes studied (0.4 g kg (<0.1–0.7)) is comparable to the average value reported in the literature for ships using fuel oil with sulfur contents <0.1 % (1.1 ± 1.0 g kg). It is nevertheless more than 5 times lower than the value provided by the regional emissions inventory (2.0 g kg) for the same fuel sulfur content category.
Analysis of the parameters likely to influence SO2 EFs reveals that its emissions depend mainly on the ship category and operational phase. As shown in Fig. 8, ships equipped with engines of more than 10 000 kW (cruisers, ferries, and cargo ships) emit statistically significantly more SO2 (p value < 0.05) than ships with engines of less than 4000 kW (the other category). In addition, ships at berth using their auxiliary engines generate less SO2 than ships manoeuvring/navigating using mainly their main engine. Regarding the manoeuvring/navigation phases, a significant statistical difference in SO2 emissions is observed between arrivals and departures, with higher emissions during arrivals. This distinction is more pronounced when the number of plumes identified in these phases is high, as is the case for ferries. For cruise ships, cargo ships, and tankers (included in the other category), the same trend is observed, although the number of plumes on arrival and departure is lower. The difference in SO2 emissions between arrivals and departures could reflect the transitional period when the ship makes the required fuel change in the Marseilles harbour (switching from fuels with a sulfur content of 0.5 % to 0.1 % in response to regulations) and/or could be linked to the use of open-loop scrubbers, which are required to be shut down in the Marseilles harbour. When this type of scrubber is shut down, a fuel switch from HFO to MGO is typically performed beforehand. However, a temporary increase in SO2 emissions can be observed (Teinilä et al., 2018), attributed to engine system purging during the transition process.
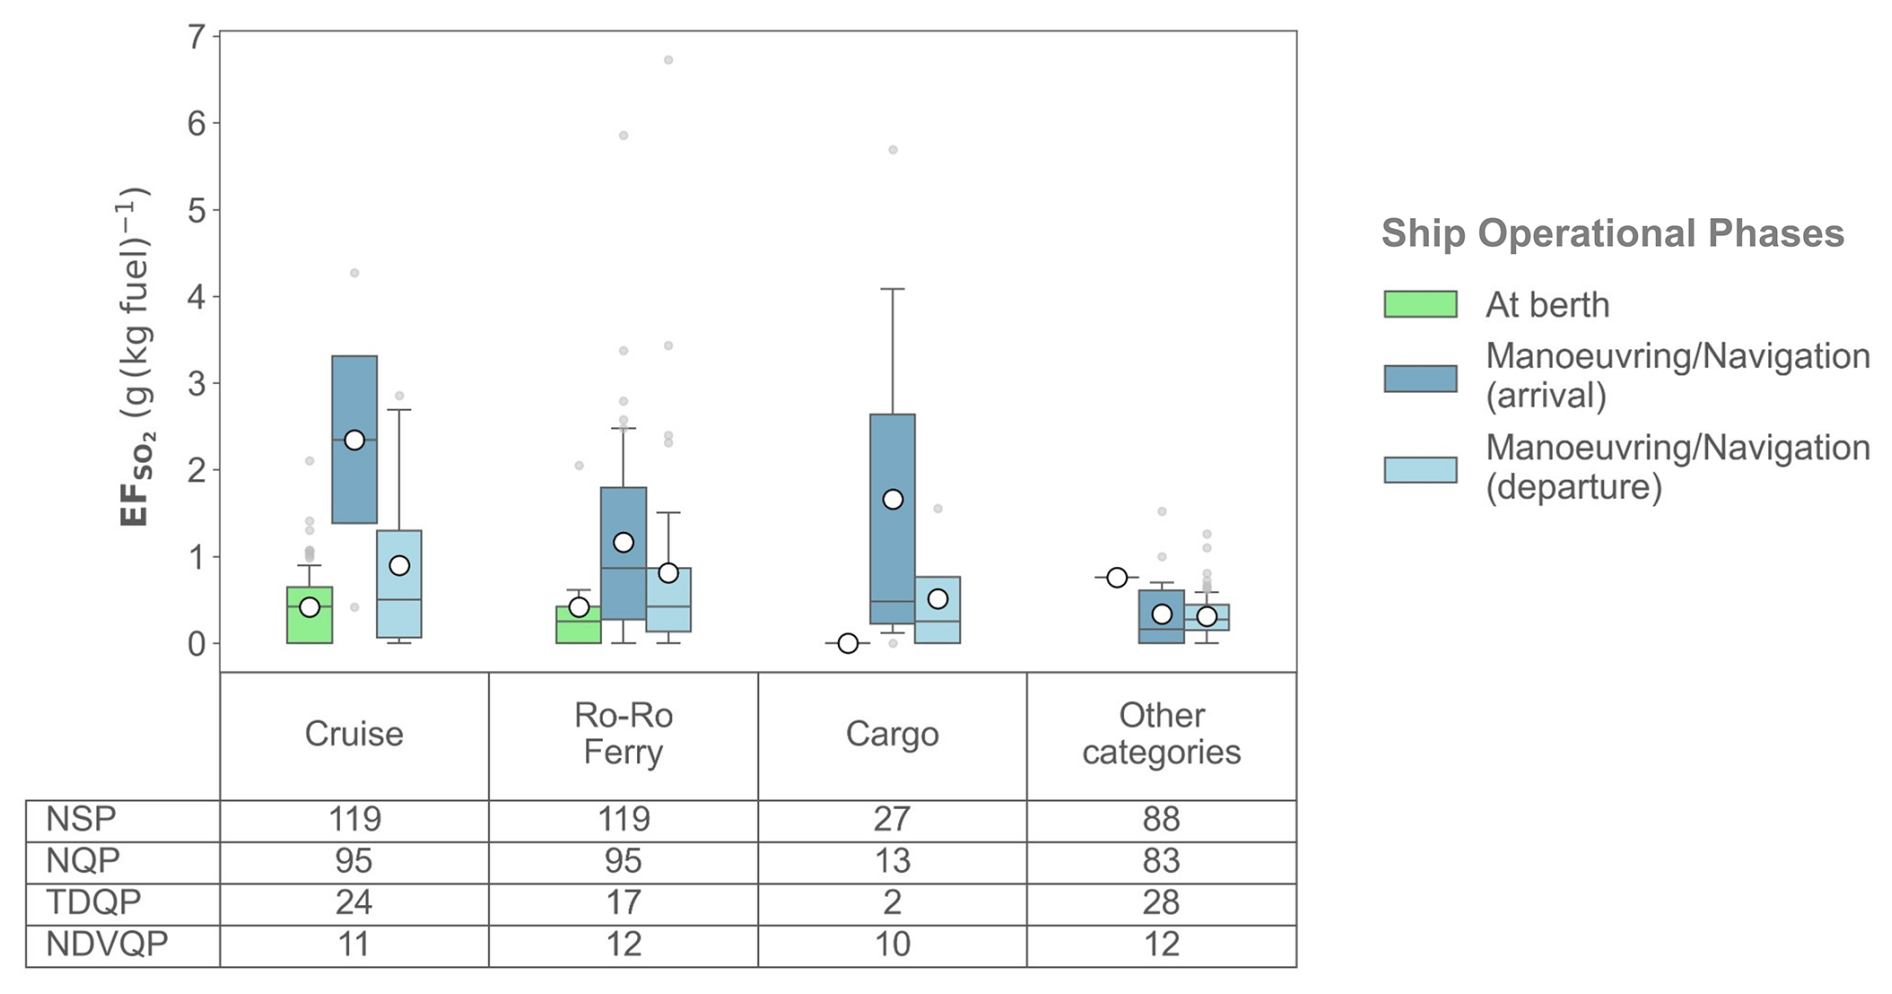
Figure 8Distribution of the SO2 emission factor as a function of ship category and operational phase.
In conclusion, as highlighted by numerous studies (Grigoriadis et al., 2021a; Huang et al., 2018; Zhao et al., 2020), SO2 emissions depend mainly on the sulfur content of the fuel used. During the campaign, all the plumes from ships at berth had sulfur contents < 0.1 %. For ships manoeuvring/navigating, sulfur levels were systematically <0.5 %, and only 10 % of the plumes measured had sulfur levels above 0.1 %, mainly including incoming ships.
Carbon monoxide (CO)
The median of the CO emission factors (EFCO) for the plumes studied (5.4 g kg (<1.3–9.3)) is comparable to the values reported in the literature for ships using fuel with a sulfur content of <0.1 % (average of 5.7 ± 8.6 g kg), as well as being comparable to the value used in the regional emissions inventory (7.5 g kg) for this type of fuel.
Analysis of the parameters likely to influence EFCO reveals that CO emissions depend mainly on the operational phase (Fig. 9). Ships at berth emit statistically less CO than ships manoeuvring/navigating (p value < 0.05). As fuel type has little or no influence on CO emissions (Petzold et al., 2011), the variation in EFCO within the operational phases is attributable to engine load. An increase in engine load leads to a rise in combustion temperature, making it more efficient and thus reducing CO (Agrawal et al., 2010; Zetterdahl et al., 2016). Ships at berth, which mainly use their auxiliary engines operating at a stable and optimal engine load, thus emit less CO than ships manoeuvring/navigating using their main engine at lower and less stable loads. The effect of combustion temperature is also reflected within the manoeuvring/navigation phase, with higher emissions observed on departure than on arrival, probably due to the cold start of the main engines and the resulting incomplete-combustion conditions. In addition, plumes with particularly high emission factors (30–100 g kg) have been observed, likely corresponding to changes in engine speed during acceleration or deceleration phases (Bai et al., 2020; Huang et al., 2018; Jiang et al., 2021), as these plumes are systematically captured at the port exit.
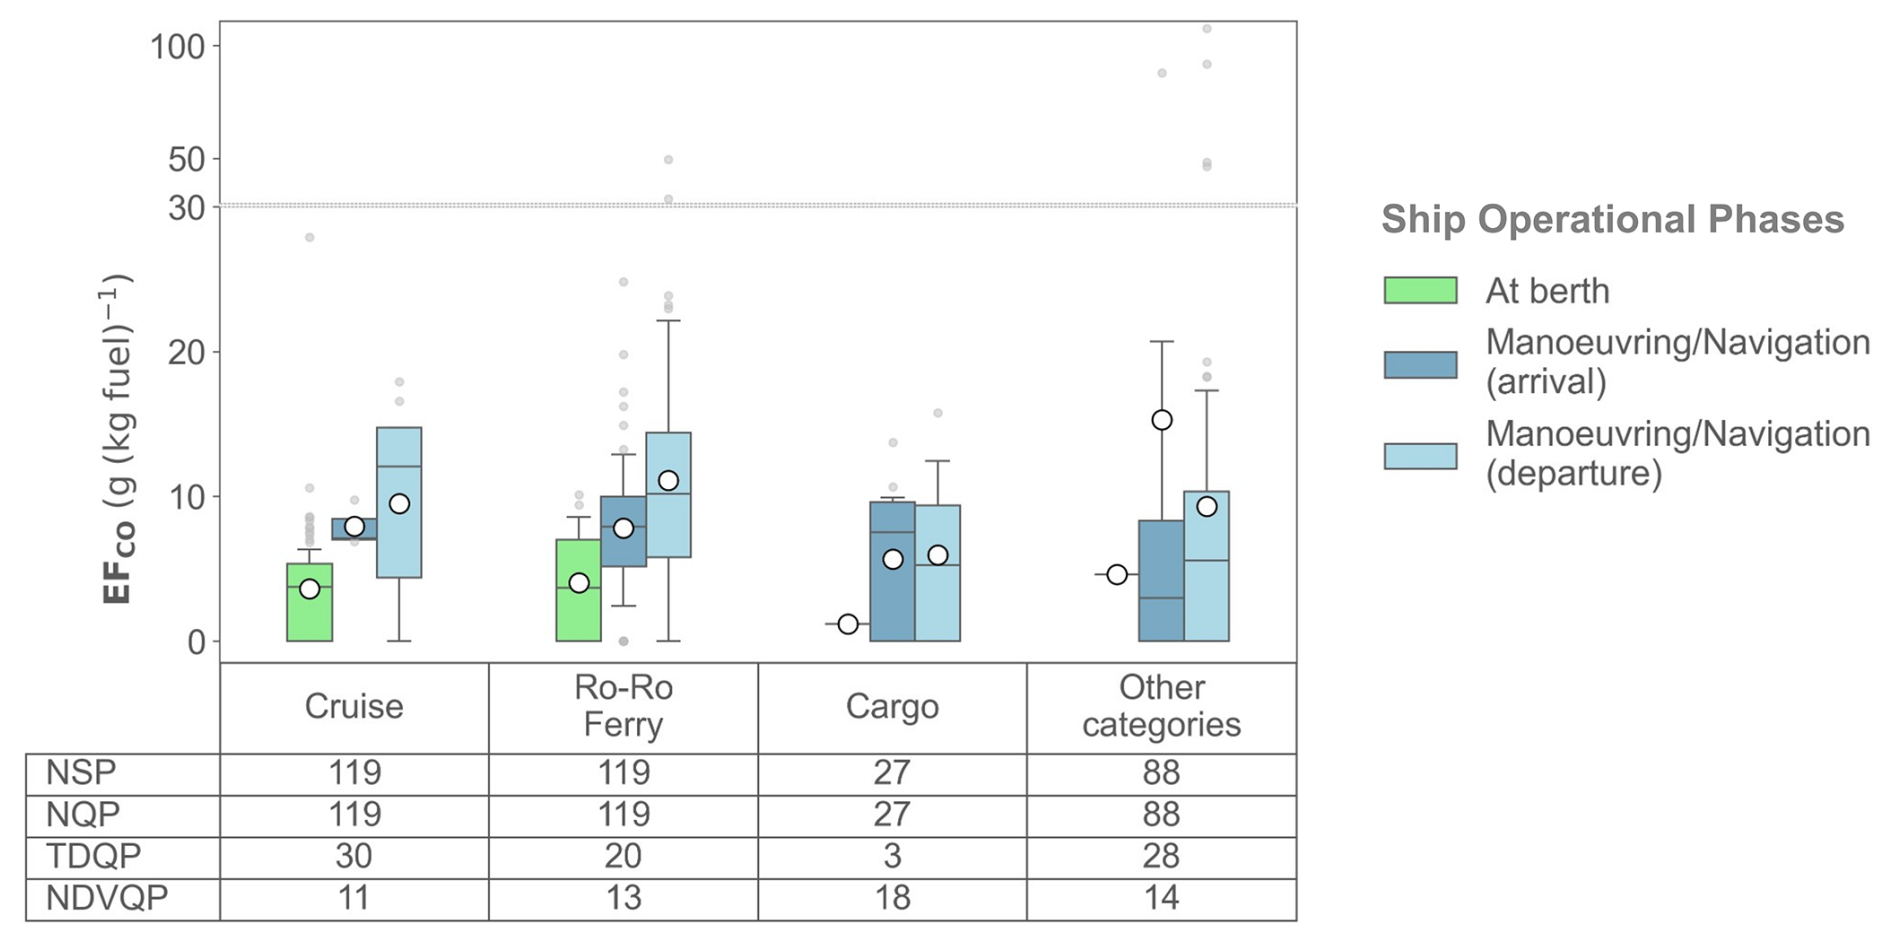
Figure 9Distribution of the CO emission factor as a function of ship category and operational phase.
Methane (CH4)
The methane median of the EFs of the plumes studied (0.4 g kg) is comparable to the EFs reported in the literature for ships using fuel oil (average of 0.2 ± 0.4 g kg) and aligns with the value used in the regional emissions inventories (0.3 g kg). However, the mean of the EFs (1.3 ± 0.3 g kg) is higher because 10 % of the plumes exhibit EFs >1.0 g kg, with some reaching up to 23 g kg. Analysis of the various ship parameters did not reveal (p value >0.05) any significant cluster driver for EFs >1.0 g kg. Furthermore, the distribution analysis of NOx and SO2 EFs does not indicate the use of methane-based fuels, such as liquefied natural gas (LNG) or gas to liquids (GTLs), which are typically associated with higher CH4 EFs but lower NOx and SO2 EFs. For further details on the other hypotheses considered based on our knowledge of the study area that could potentially be combined to explain the higher observed EFs, please refer to Table S12.
Non-methane volatile organic compounds (NMVOCs)
For the majority of NMVOCs, the mean, median, and percentile of the EFs observed with the plumes are below the detection limits (DLs), which vary between 5 and 200 mg kg depending on the compounds (Table S10). These results are consistent with EFs reported in the literature, where values derived exclusively from direct emission measurements are generally below 30 mg kg (Agrawal et al., 2008a, 2010; Huang et al., 2018; Timonen et al., 2022).
However, for certain compounds such as C8 aromatics and toluene, the 90th percentiles (P90) exceed the detection limits, suggesting that these compounds may occasionally be emitted in greater quantities. Nevertheless, due to the detection limits and measurement uncertainties for these compounds, reliably determining the parameters associated with higher emissions remains statistically challenging. However, among the parameters examined, the operational phase – and consequently the type of engines and fuel used – appears to exert the most significant influence on P90. Indeed, a detailed examination of EFs by operational phase, as shown in Table S11, indicates the following.
-
For toluene, EFs from ships in the manoeuvring phase are higher than in other operating phases. Huang et al. (2018) and Timonen et al. (2022) have also highlighted this when studying the emissions of ships (cargo ships and ro-ro ferries) during different operating phases. The study by Huang et al. (2018) further showed that, in the manoeuvring phase, the quantity of toluene emitted was 4 times higher when low-sulfur fuel (0.4 %) was used compared to when higher-sulfur fuels (1.1 %) were used.
-
C8 aromatics are emitted in greater quantities during the at-berth and manoeuvring phases, a trend also noted by Huang et al. (2018) and Timonen et al. (2022).
Ammonia (NH3)
The ammonia emission factors of the plumes analysed are systematically below the DL of 0.1 g kg, except for two plumes with EFs close to this threshold, with values of 0.12 and 0.15 g kg. These values are in line with the literature, which reports an average of 0.07 ± 0.14 g kg (across all fuel types).
Figure 10 provides an overview of the median global emission profile of gaseous phases and illustrates its variability according to the operational phases of ships, which most commonly account for the variations in emission factors (EFs) of different compounds. Ship gaseous emissions are primarily composed of NOx (86 %) and CO (12 %), while SO2 and CH4 each represent about 1 %. Other compounds, such as NMVOCs, constitute less than 0.1 % of the gaseous phase but can account for up to 10 % under certain operational conditions only identified when ships were at berth or manoeuvring, which may significantly impact the formation of secondary pollutants.
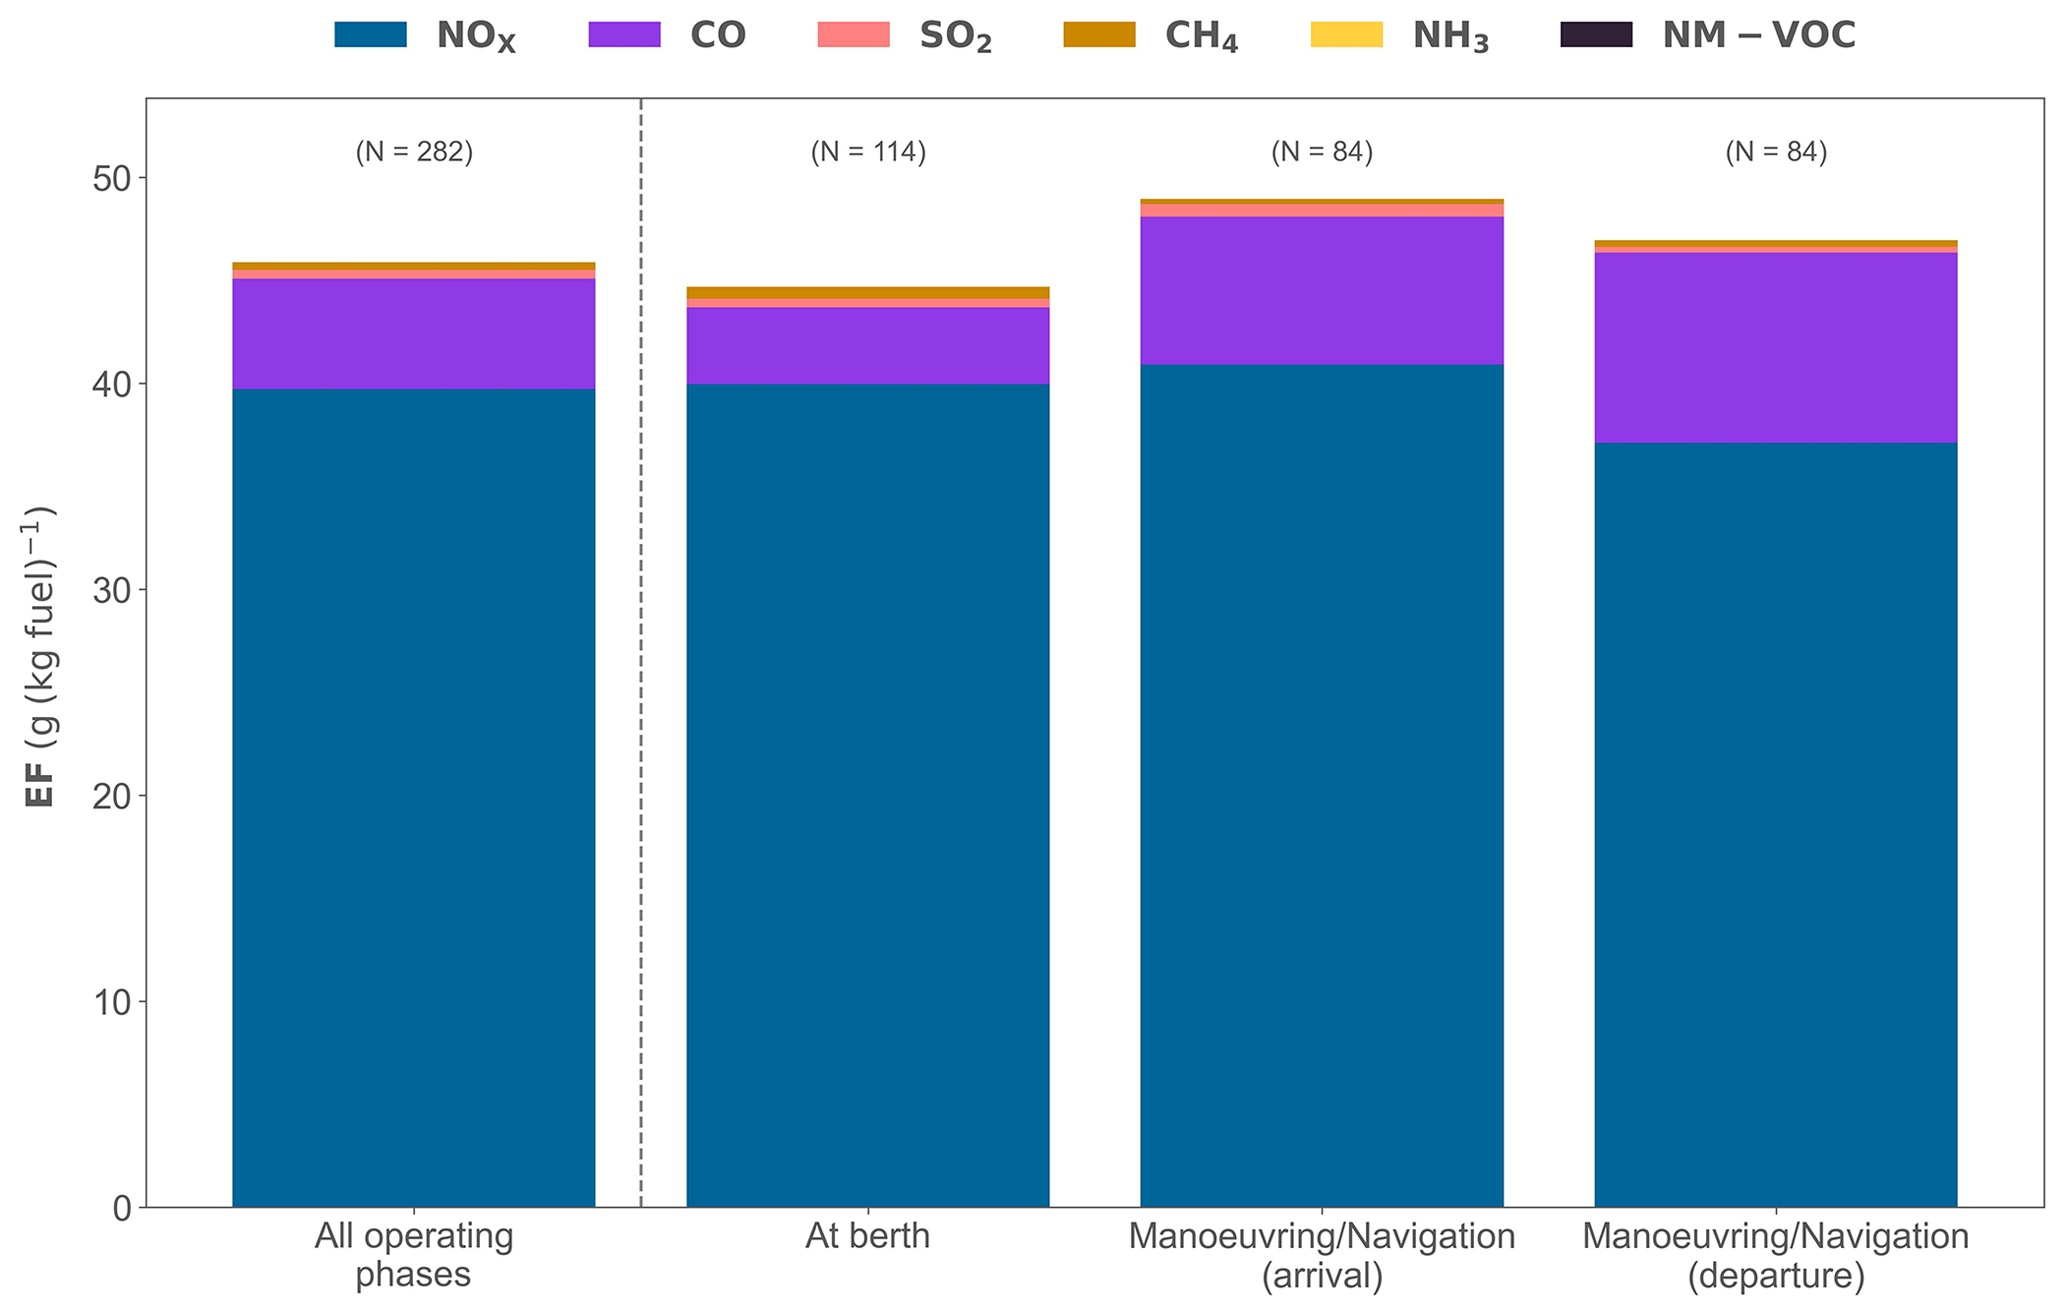
Figure 10The median gaseous composition of ship emissions as a function of operational phase. The number of plumes considered (N) is shown for each phase.
3.2.2 Particulate mass vs. particle number
EFPN obtained from particle counter measurements (CPC) and EF obtained from particle size measurements (SMPS) are illustrated using boxplots in Fig. 11 (for detailed statistical analysis, refer to Table S10).
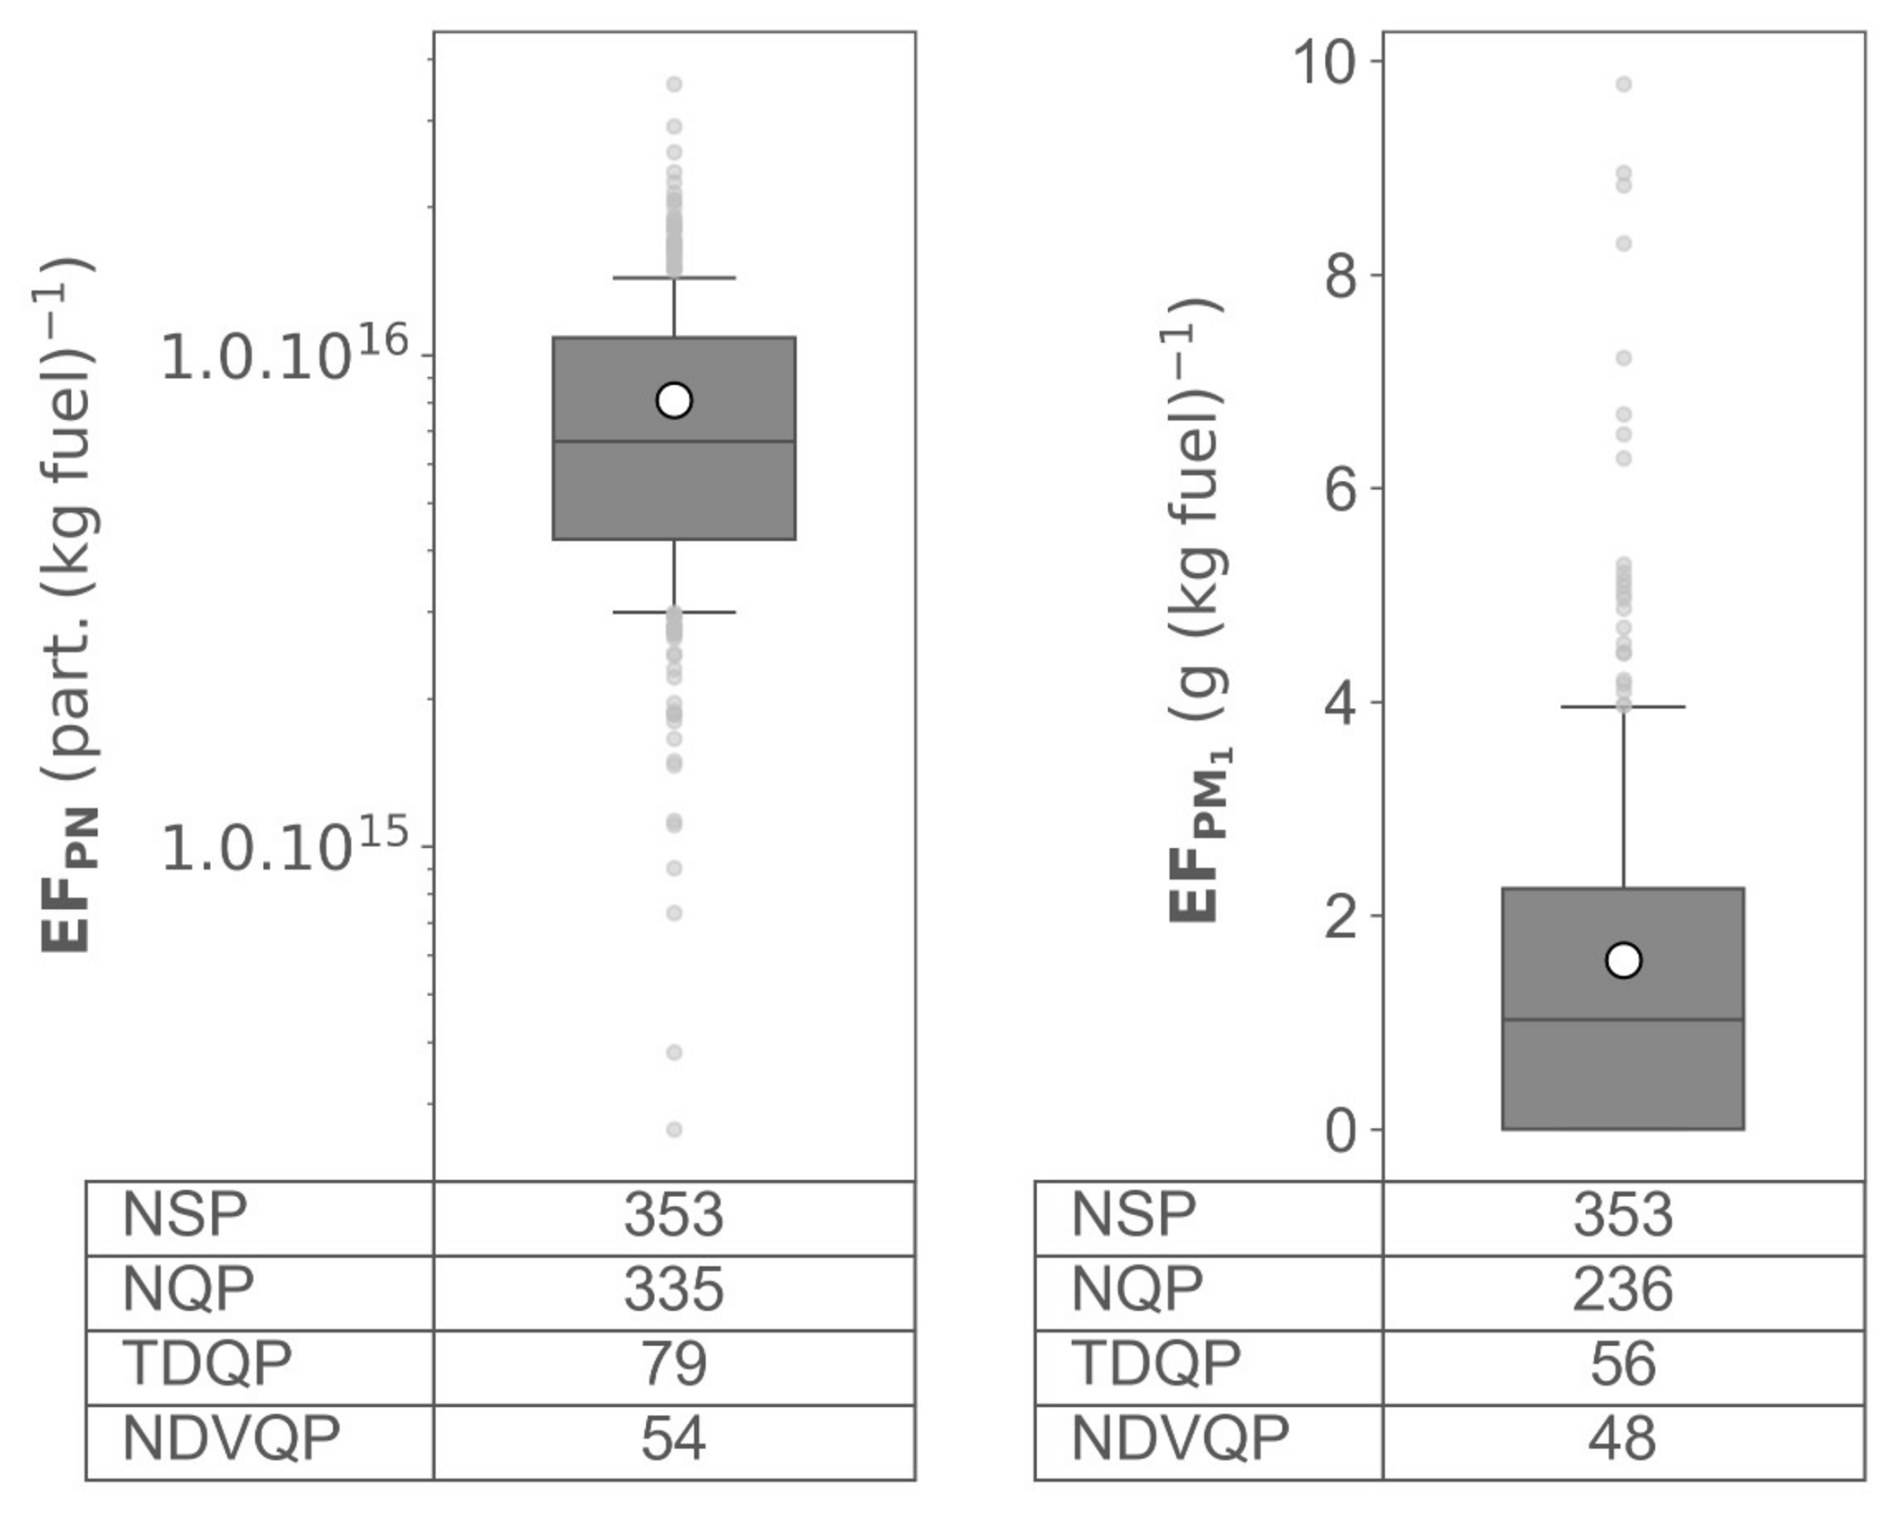
Figure 11Distribution of EFs for particulate matter by number (PN) and by mass (PM1) across all identified plumes.
The median EFPN (6.7×10¹⁵ particles kg (4.2–10.8)) is comparable to the values reported in the literature for ships using fuel oil with sulfur contents <0.1 % (mean of 8.1 ± 14.1×10¹⁵ particles kg).
Regarding the overall submicron particle mass (PM1) emission factors, the use of the SMPS analyser was preferred over the OPC one for the calculation. Inter-comparisons showed that the OPC analyser could underestimate PM1 concentrations by up to a factor of 3, particularly when the measurement sites were downwind of ship plumes, due to its inability to measure particles smaller than 250 nm in diameter. The median of the plume EF thus obtained (1.0 g kg (<0.4–2.25)) is comparable to the high range of values reported in the literature for ships using fuel oil with sulfur contents <0.1 % (average of 0.6 ± 0.2 g kg). Considering the ratio (average 0.8) derived from the OPC measurements, the estimated EF is also in line with the EF (1.4 g kg) considered in regional emissions inventories.
Analysis of the parameters likely to influence EFPN and EF reveals a statistically significant dependence of emissions on the operational phase. As shown in Fig. 12, ships at berth generate more PN and less PM1 than when they are manoeuvring/navigating (9.9×10¹⁵ particles kg (7.9–12.1) vs. 5.2×10¹⁵ particles kg (3.4–8.1) for EFPN and 0.6 g kg (<0.4–0.9) vs. 1.7 g kg (0.8–3.3) for EF). It should be noted that no systematic bias related to the age of the plumes has been observed. The distribution of plumes in the different plume age classes is similar for ships at berth and those manoeuvring/navigating.
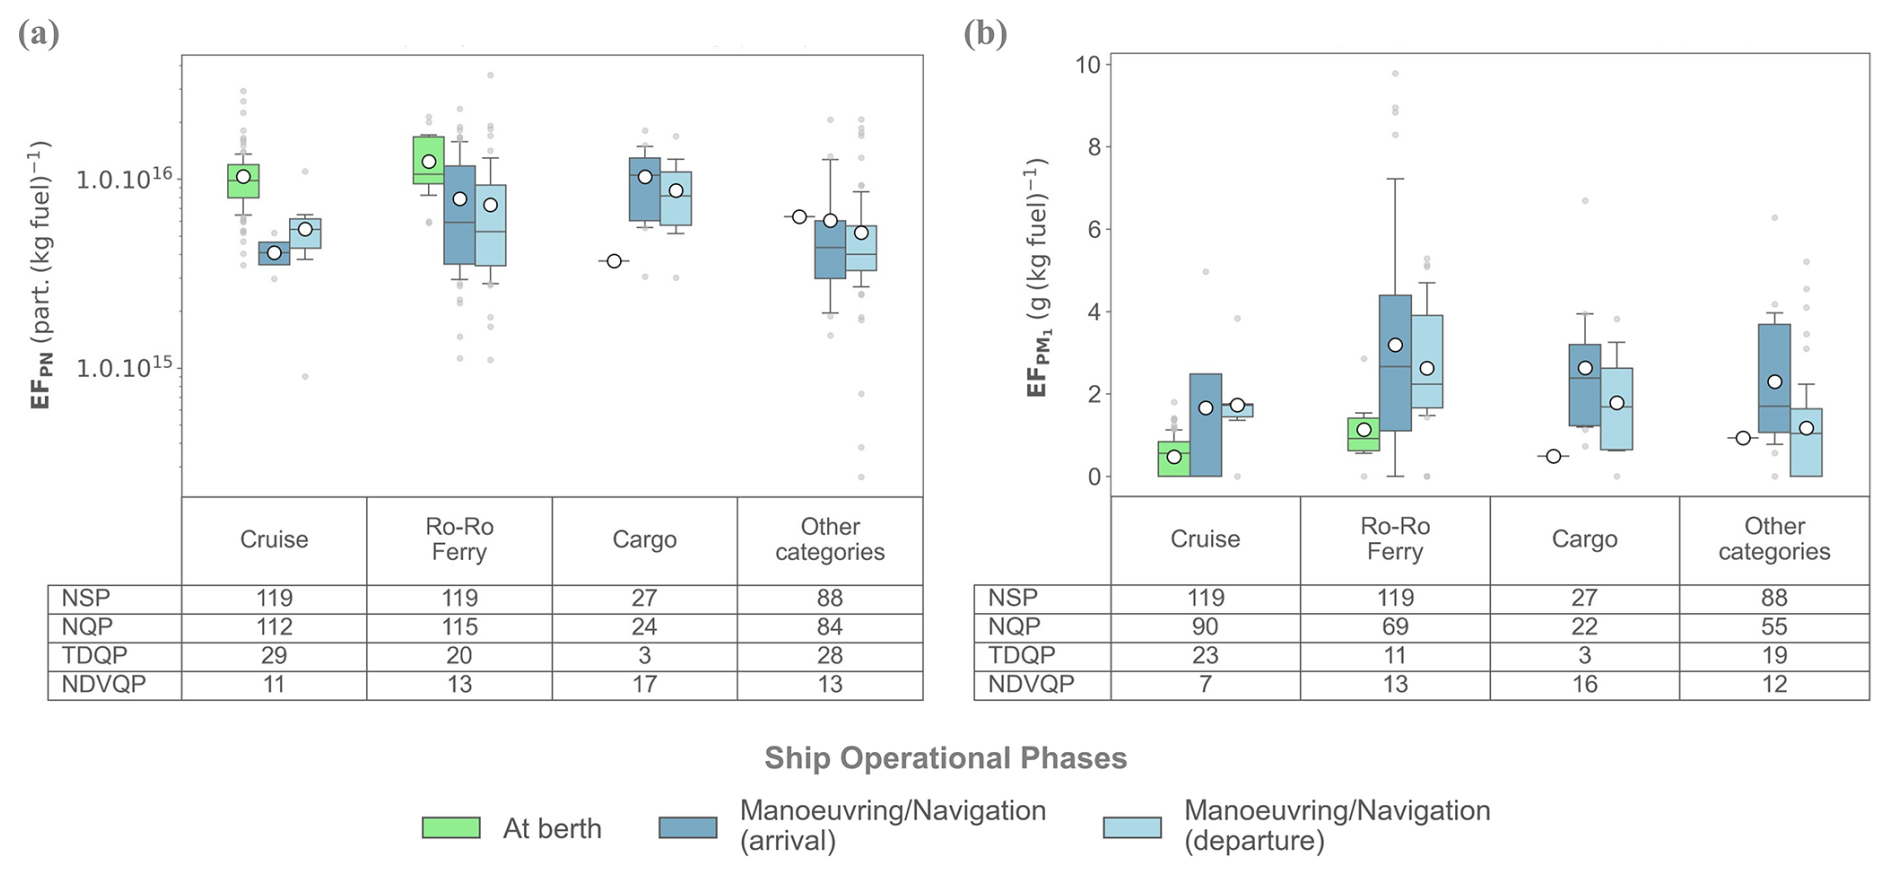
Figure 12Distribution of EFs (a) for PN and (b) for PM1 as a function of ship category and operational phase.
These variations can be explained mainly by the use of auxiliary engines operating at a stable and optimum engine speed with low-sulfur-distillate fuel (<0.1 %) at berth, whereas ships manoeuvring/navigating within the port area use their main engine at a lower (<25 %) and less stable engine load. These observations indicate that PN and PM1 emissions are influenced by engine load (Anderson et al., 2015a; Grigoriadis et al., 2021a; Zetterdahl et al., 2016) and engine speed (Diesch et al., 2013). The contrasting evolution of the mass and number of particles observed in Fig. 12 between ships at berth and manoeuvring/navigating has also been highlighted by Anderson et al. (2015b) and Chu-Van et al. (2018). This unusual development is attributable to the particle size distribution (see Sect. 3.2.4) and not to particle formation. When ships are docked, particles are mainly smaller than 50 nm in diameter, whereas when manoeuvring/navigating, a mode around 100 nm appears and may even become predominant, thus contributing more to the total mass of PM1 than finer particles do.
In addition, as is the case with SO2, a difference was observed between emissions of PN and PM1 during arrivals and departures, with arrivals showing statically higher emissions (Fig. 12). However, for cruise ships, this trend does not hold, but the small number of plumes identified for this category during these operational phases makes this result uncertain. In the analysis of the evolution of SO2, two hypotheses were considered to explain the differences between arrivals and departures: fuel transition and the shutdown of open-loop scrubbers. The fact that this distinction between arrivals and departures is equally marked for both the number and the mass of particles suggests that fuel switching is the most likely hypothesis. Indeed, emissions of PN and PM1 decrease with the sulfur content of the fuel (Celik et al., 2020; Diesch et al., 2013; Grigoriadis et al., 2021a) but also as fuel quality improves (from residual fuel oil to distillate fuel oil) (Gysel et al., 2017; McCaffery et al., 2021).
Finally, Fig. 12 also indicates that manoeuvring/navigating ferries and cargo ships equipped with engines of more than 10 000 kW emit more particles, in mass and number, than other ships with engines of less than 4000 kW (p value < 0.05). For cruise ships, which are equipped with engines similar to those of ferries and cargo ships, it is challenging to draw definitive conclusions due to the limited number of plumes identified during these operational phases, especially since the emission factors for cruise ships at berth are comparable to those of ferries.
The age of the plumes also seems to affect the number and/or mass of particles, as shown in Fig. 13. Regarding the number of particles (PN), the youngest plumes (less than 5 min old for ships at berth and less than 2 min old for ships manoeuvring/navigating) exhibit statistically higher emission factors (by factors of 1.5 and 2, respectively) compared to older plumes (p value < 0.05). This observation suggests particle accumulation and/or coagulation processes, which reduce the number of particles but increase their average size (Celik et al., 2020; Lack et al., 2009). For particulate mass (PM1), an upward trend was observed only for ships at berth. However, the results of the Kruskal–Wallis statistical tests indicate that all the groups show a similar central tendency, signifying a stability of the aerosol mass for the age range of the plumes studied in this study (<30 min). Thus, the increase in total aerosol mass due to photochemical ageing observed by several authors using reactors simulating atmospheric oxidation over periods of 2 to 6 d (Lanzafame et al., 2022; Timonen et al., 2022) was not noticeable for plumes less than 30 min old. However, the wide variability in PM1 emission factors in the different age classes precludes any definitive conclusion.
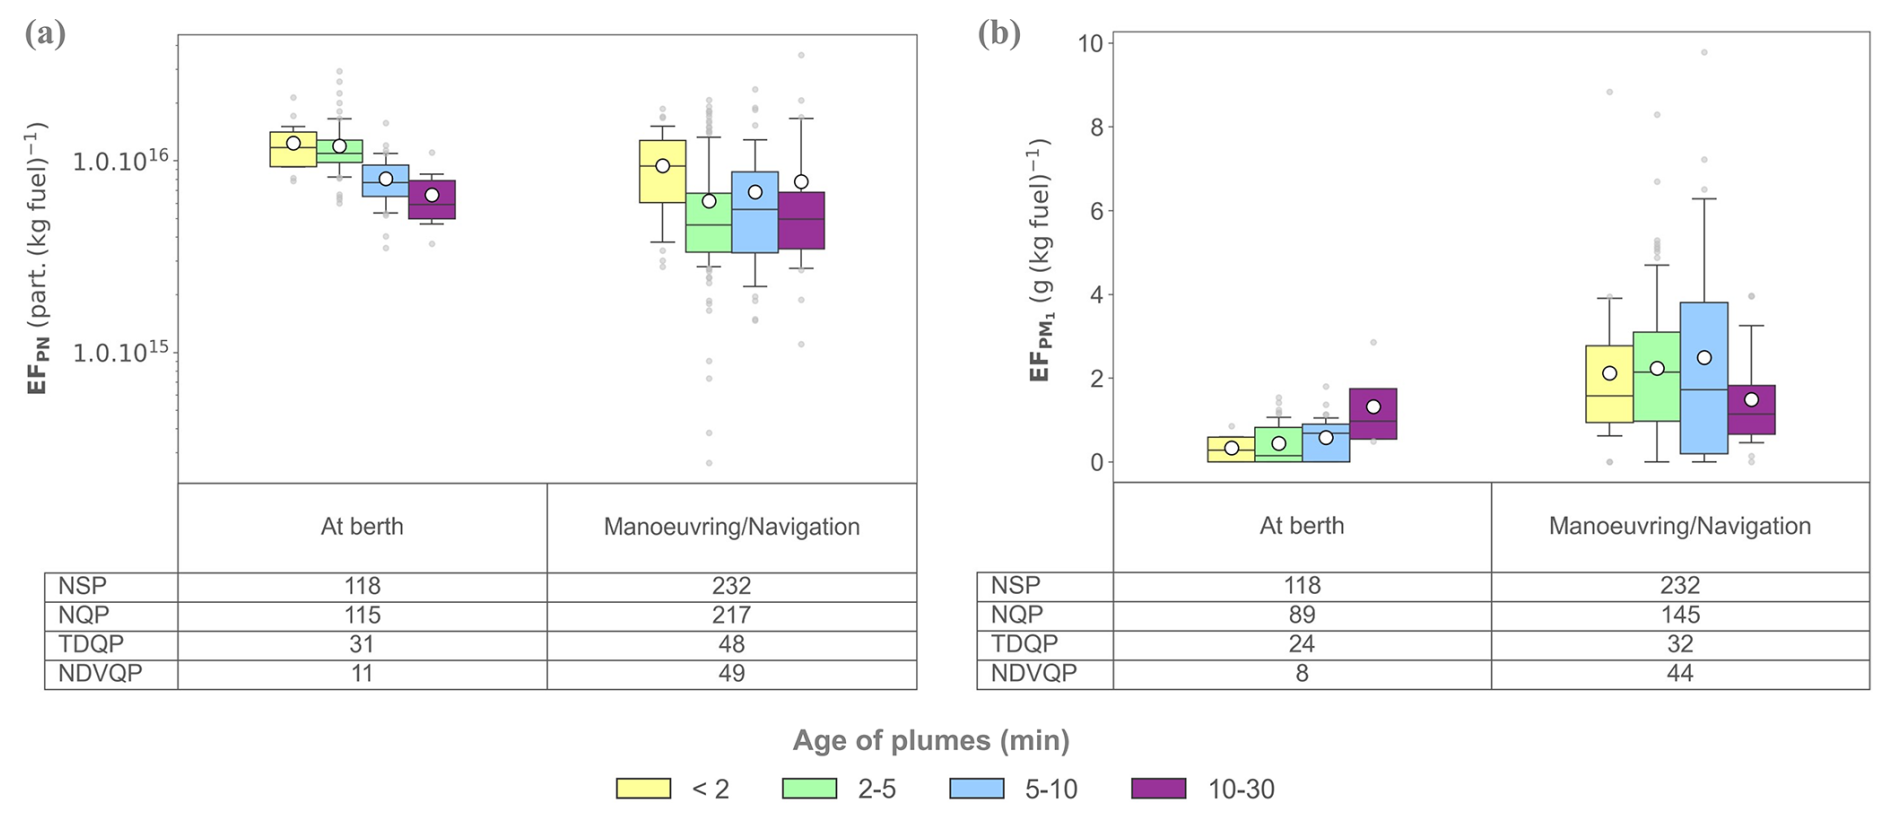
Figure 13Distribution of EFs (a) for PN and (b) for PM1 as a function of operational phase and plume age.
3.2.3 PM1 chemical composition
Figure 14 shows the boxplot analysis of the PM1 component EFs (for detailed statistical analyses, refer to Table S10). Cl− is not included in analysis, as its median and percentiles are below the DL.
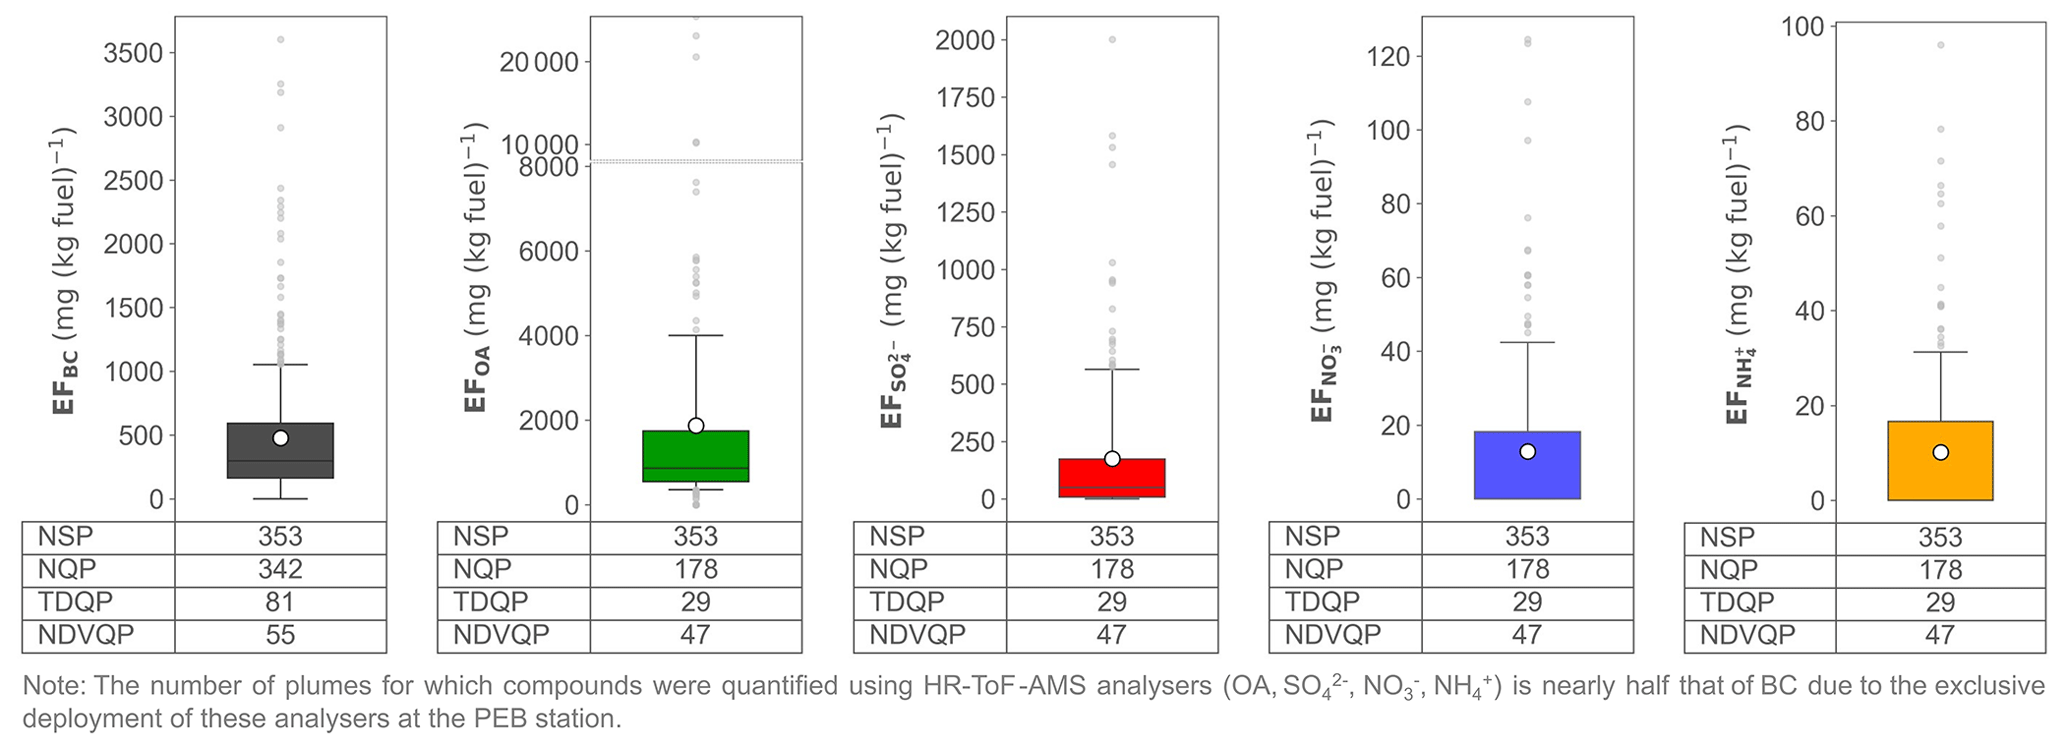
The emission factor values determined in this study are generally comparable to those documented in the literature: for BC, OA, and SO, the median EFs are 298 mg kg (163–592), 863 mg kg (543–1742), and 50 mg kg (<28–174), respectively. These values are comparable to the averages reported in the literature for ships using fuel oil with sulfur contents <0.1 % ( 238 ± 305, 624 ± 335 and 120 ± 50 mg kg, respectively; Table S8). For NO and NH, the EF medians are below the DLs (5.4 and 5.0 mg kg, respectively) but remain in agreement with the values reported in the literature for ships using fuel oil with sulfur contents <0.1 % (averages of 3 ± 6 mg kg and 2 ± 3 mg kg, respectively; Table S8).
Black carbon (BC)
Analysis of the parameters likely to influence BC emissions reveals that they mainly depend on the operational phase. Ships manoeuvring/navigating generate more BC (479 mg kg (261–801)) than ships at berth (165 mg kg (105–247)) (Fig. 15a). As for many compounds, this is linked to the low engine load and its reduced stability during navigation and manoeuvres within the port (Sugrue et al., 2022; Zhao et al., 2020). As for SO2, for these operating phases, a distinction is also observed between arrivals (601 mg kg (349–1039)) and departures (389 mg kg (230–621)), probably due to the change in fuel required when entering the port, switching to a more refined fuel in response to regulations (Grigoriadis et al., 2021a; Huang et al., 2018; McCaffery et al., 2021). Finally, for this compound, the analysis of EFs as a function of the ship construction year demonstrated the influence of the tier regulations imposed by MARPOL on BC production (Tier 0 ships built before 2000, Tier I before 2011, Tier II before 2016, and Tier III after 2016). A statistically significant decrease was observed (Fig. S8) between Tier 0 and Tier I class vessels (the categories that were most represented (90 % of the plumes studied for which the ship construction year was known)). The same trend holds for the Tier II and Tier III classes, even if it is not statistically relevant due to the small number of plumes for these categories. This result corroborates the results of Sugrue et al. (2022) and suggests that these regulations influence BC emissions, even for low engine loads. It is important to note that the distribution of the four tier classes is similar regardless of the operational phases and the age of the plumes, thus eliminating any systematic bias that might alter the previous interpretations.
The statistical tests carried out on the other parameters (category of vessel (Fig. 15a) and plume age (Fig. 16a)) indicate that all groups show a similar central tendency.
Numerous studies have been carried out on the relationship between quantities of BC and CO emitted from various combustion processes. In most cases high correlations were observed (Guo et al., 2017; Taketani et al., 2022; Zhou et al., 2009), as both components arise from incomplete combustion of carbon-based fuels, and the slope of the linear regression () was often used to identify sources such as petrol/diesel vehicles or biomass combustion (Guo et al., 2017). The correlation between the EFBC and EFCO of the plumes identified in the present study is negligible (R2<0.1), indicating that the emissions of these compounds evolve in an independent way, probably due to the use of different fuels. The study by Zhao et al. (2020) showed a very strong correlation for a cargo ship and an HFO fuel (R2=0.91) obtained at different engine loads, but the analysis of the correlation for this same ship with another type of fuel (MDO) shows a weaker correlation (R2=0.4). The correlation becomes negligible (R2<0.1) when all the various ships with different fuels (the set of EFs compiled in Table S8) are considered.
Organic aerosol (OA) and sulfates (SO)
OA and SO emissions also mainly depend on the operational phase. Ships manoeuvring/navigating emit statistically more OA and SO than ships at berth (1603 mg kg (1095–3382) vs. 611 mg kg (470–800) for OA (Fig. 15b) and 171 mg kg (55–466) vs. <28 mg kg (<28–50) for SO (Fig. 15c)). These variations can be explained mainly by the use of auxiliary engines operating at a stable and optimum engine speed with a distilled fuel with a low sulfur content (<0.1 %) at berth, whereas ships manoeuvring/navigating within the port area use their main engines at a lower engine load (<25 %), which results in less stable engine performance, with fuels potentially containing a little more sulfur.
For OA, the same as for BC, a difference was observed between EF on arrival and departure of ships (2365 mg kg (1241–4141) vs. 1399 mg kg (470–800)), with arrivals showing emissions 1.7 times higher (Fig. 15b). This statistical distinction probably results from the change in fuel required upon entering the port, involving a switch to a more refined fuel (Gysel et al., 2017; McCaffery et al., 2021). However, this phenomenon is not observed for SO (Fig. 15c). This could be related to the reduction in SO emissions due to a reduction in the sulfur content of fuels, particularly for fuels with an already low sulfur content (Gysel et al., 2017).
In addition, when they are manoeuvring/navigating, ferries have an EFOA 2 times higher than the ships in all other categories (3102 mg kg (1479–4933) vs. 1303 mg kg (807–2221)) (Fig. 15b) and an EF 4 times higher than ships in all other categories (358 mg kg (195–582) vs. 86 mg kg (<28–174)) (Fig. 15c)).
As this observation is not the same for vessels with equivalent engine power, the hypothesis considered is that this vessel category would use different fuel and/or after-treatment devices than ships in all other categories during navigation and/or manoeuvres. The validity of this hypothesis is strengthened by the fact that some ferries in the port of Marseille are equipped with scrubbers, a notable feature for this category of vessel.
The statistical tests carried out on the age of the OA and sulfate plumes (Fig. 16b, c) indicate that all the groups show a similar central trend.
Nitrates (NO)
The emission factors for NO are often below the DL (more than 60 % of measurements), and this remains true even at night. As a result, statistical analyses of the influence of the various parameters indicate a similar central tendency for all groups, regardless of the parameter analysed. The low-nitrate EFs and the absence of any significant variation in NO as a function of the age of the plume (Fig. 16d) do not support the hypothesis previously put forward about NOx sinks due to photochemical reactions leading to the production of nitrate aerosols. Moreover, according to Celik et al. (2020), the high ambient temperatures observed during the measurement campaign limit the presence of this species in the particulate phase.
Ammonium (NH)
The emission factors for NH are often below the DL (more than 60 % of measurements). The analysis of the ratio between NHmeasured and NHpredicted (Fig. S9) – indicating particle acidity (Zhang et al., 2007) – for ship plume and background conditions suggests that while background particles are fully neutralized, those from ship are not or are only partially neutralized. The neutralization level depends on the sulfate emission and consequently on the operating phase. When sulfate emissions are high (EF >250 mg kg), the near-zero slope, similar to that observed by Fossum et al. (2024), suggests that the sulfate measured is mainly in the form of sulfuric acid. For sulfate emission under this threshold, partial neutralization occurs. In these cases, ammonia concentration levels (3 ppb (2.3–3.7)) (Table S6) from city road traffic and agricultural activities are insufficient to neutralize the sulfate emitted by ship, or plumes are too young to reach equilibrium.
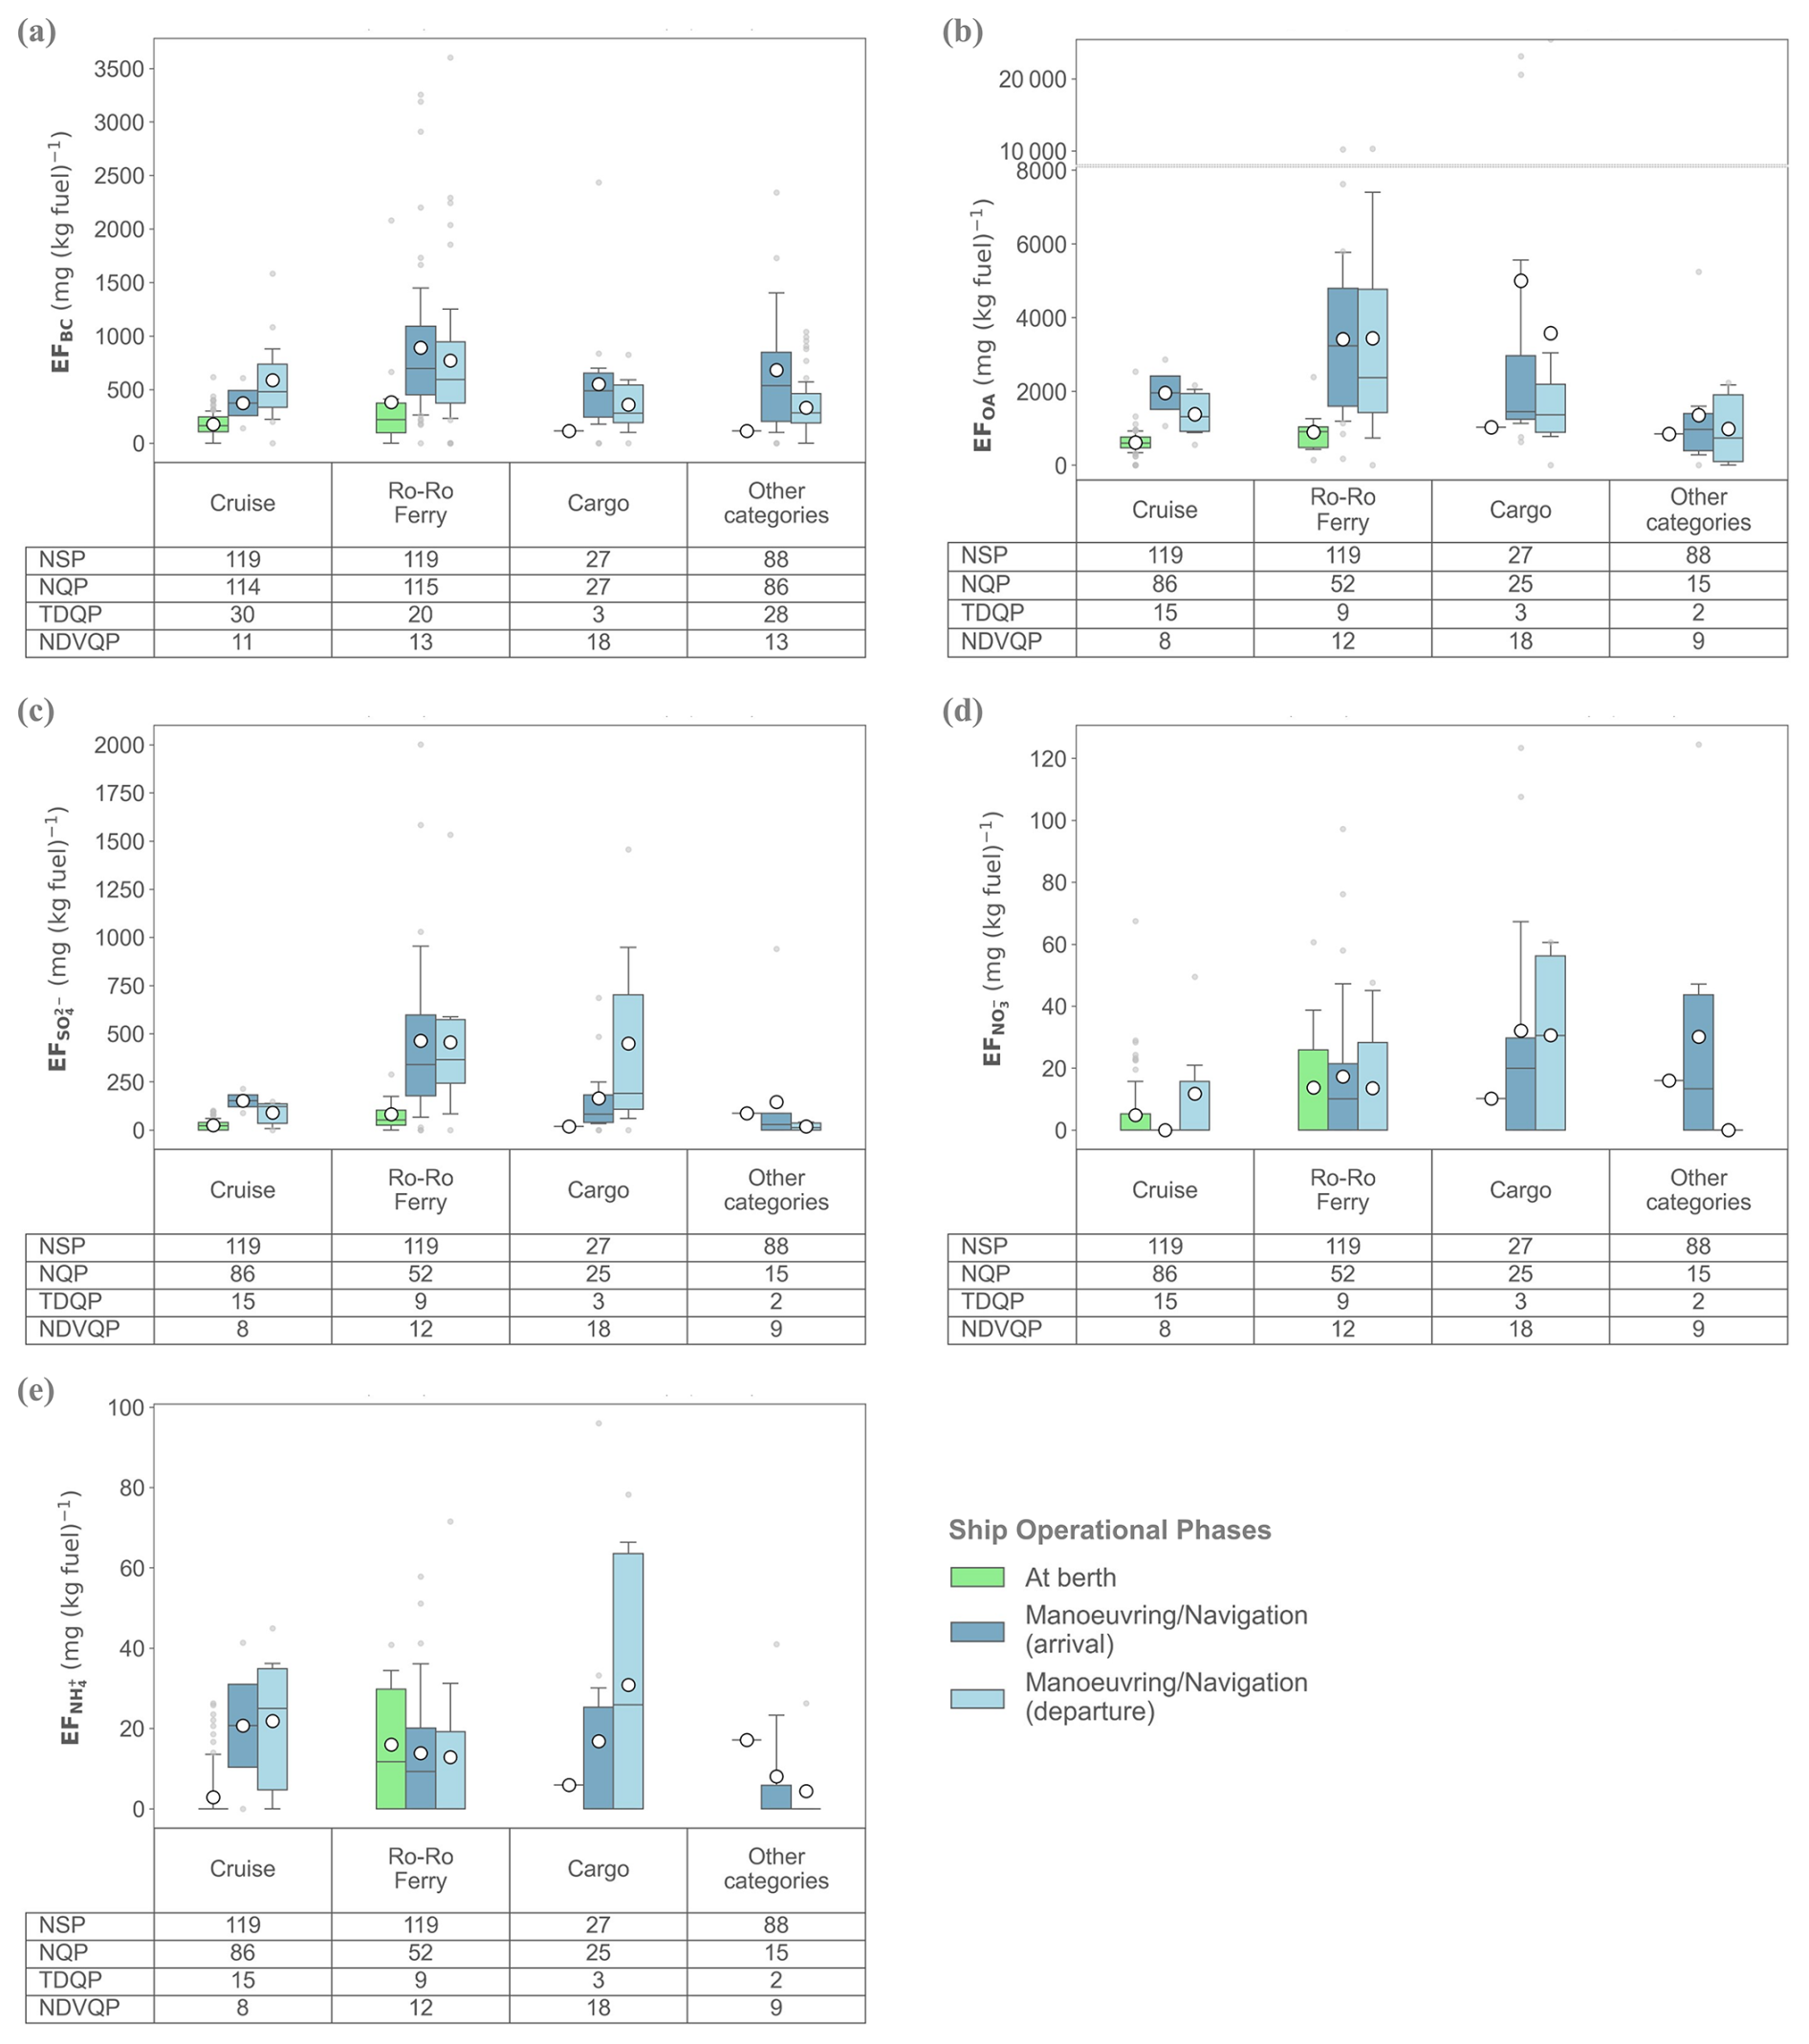
Figure 15Distribution of EFs as a function of ship category and operational phase for (a) BC, (b) OA, (c) sulfate, (d) nitrate, and (e) ammonium.
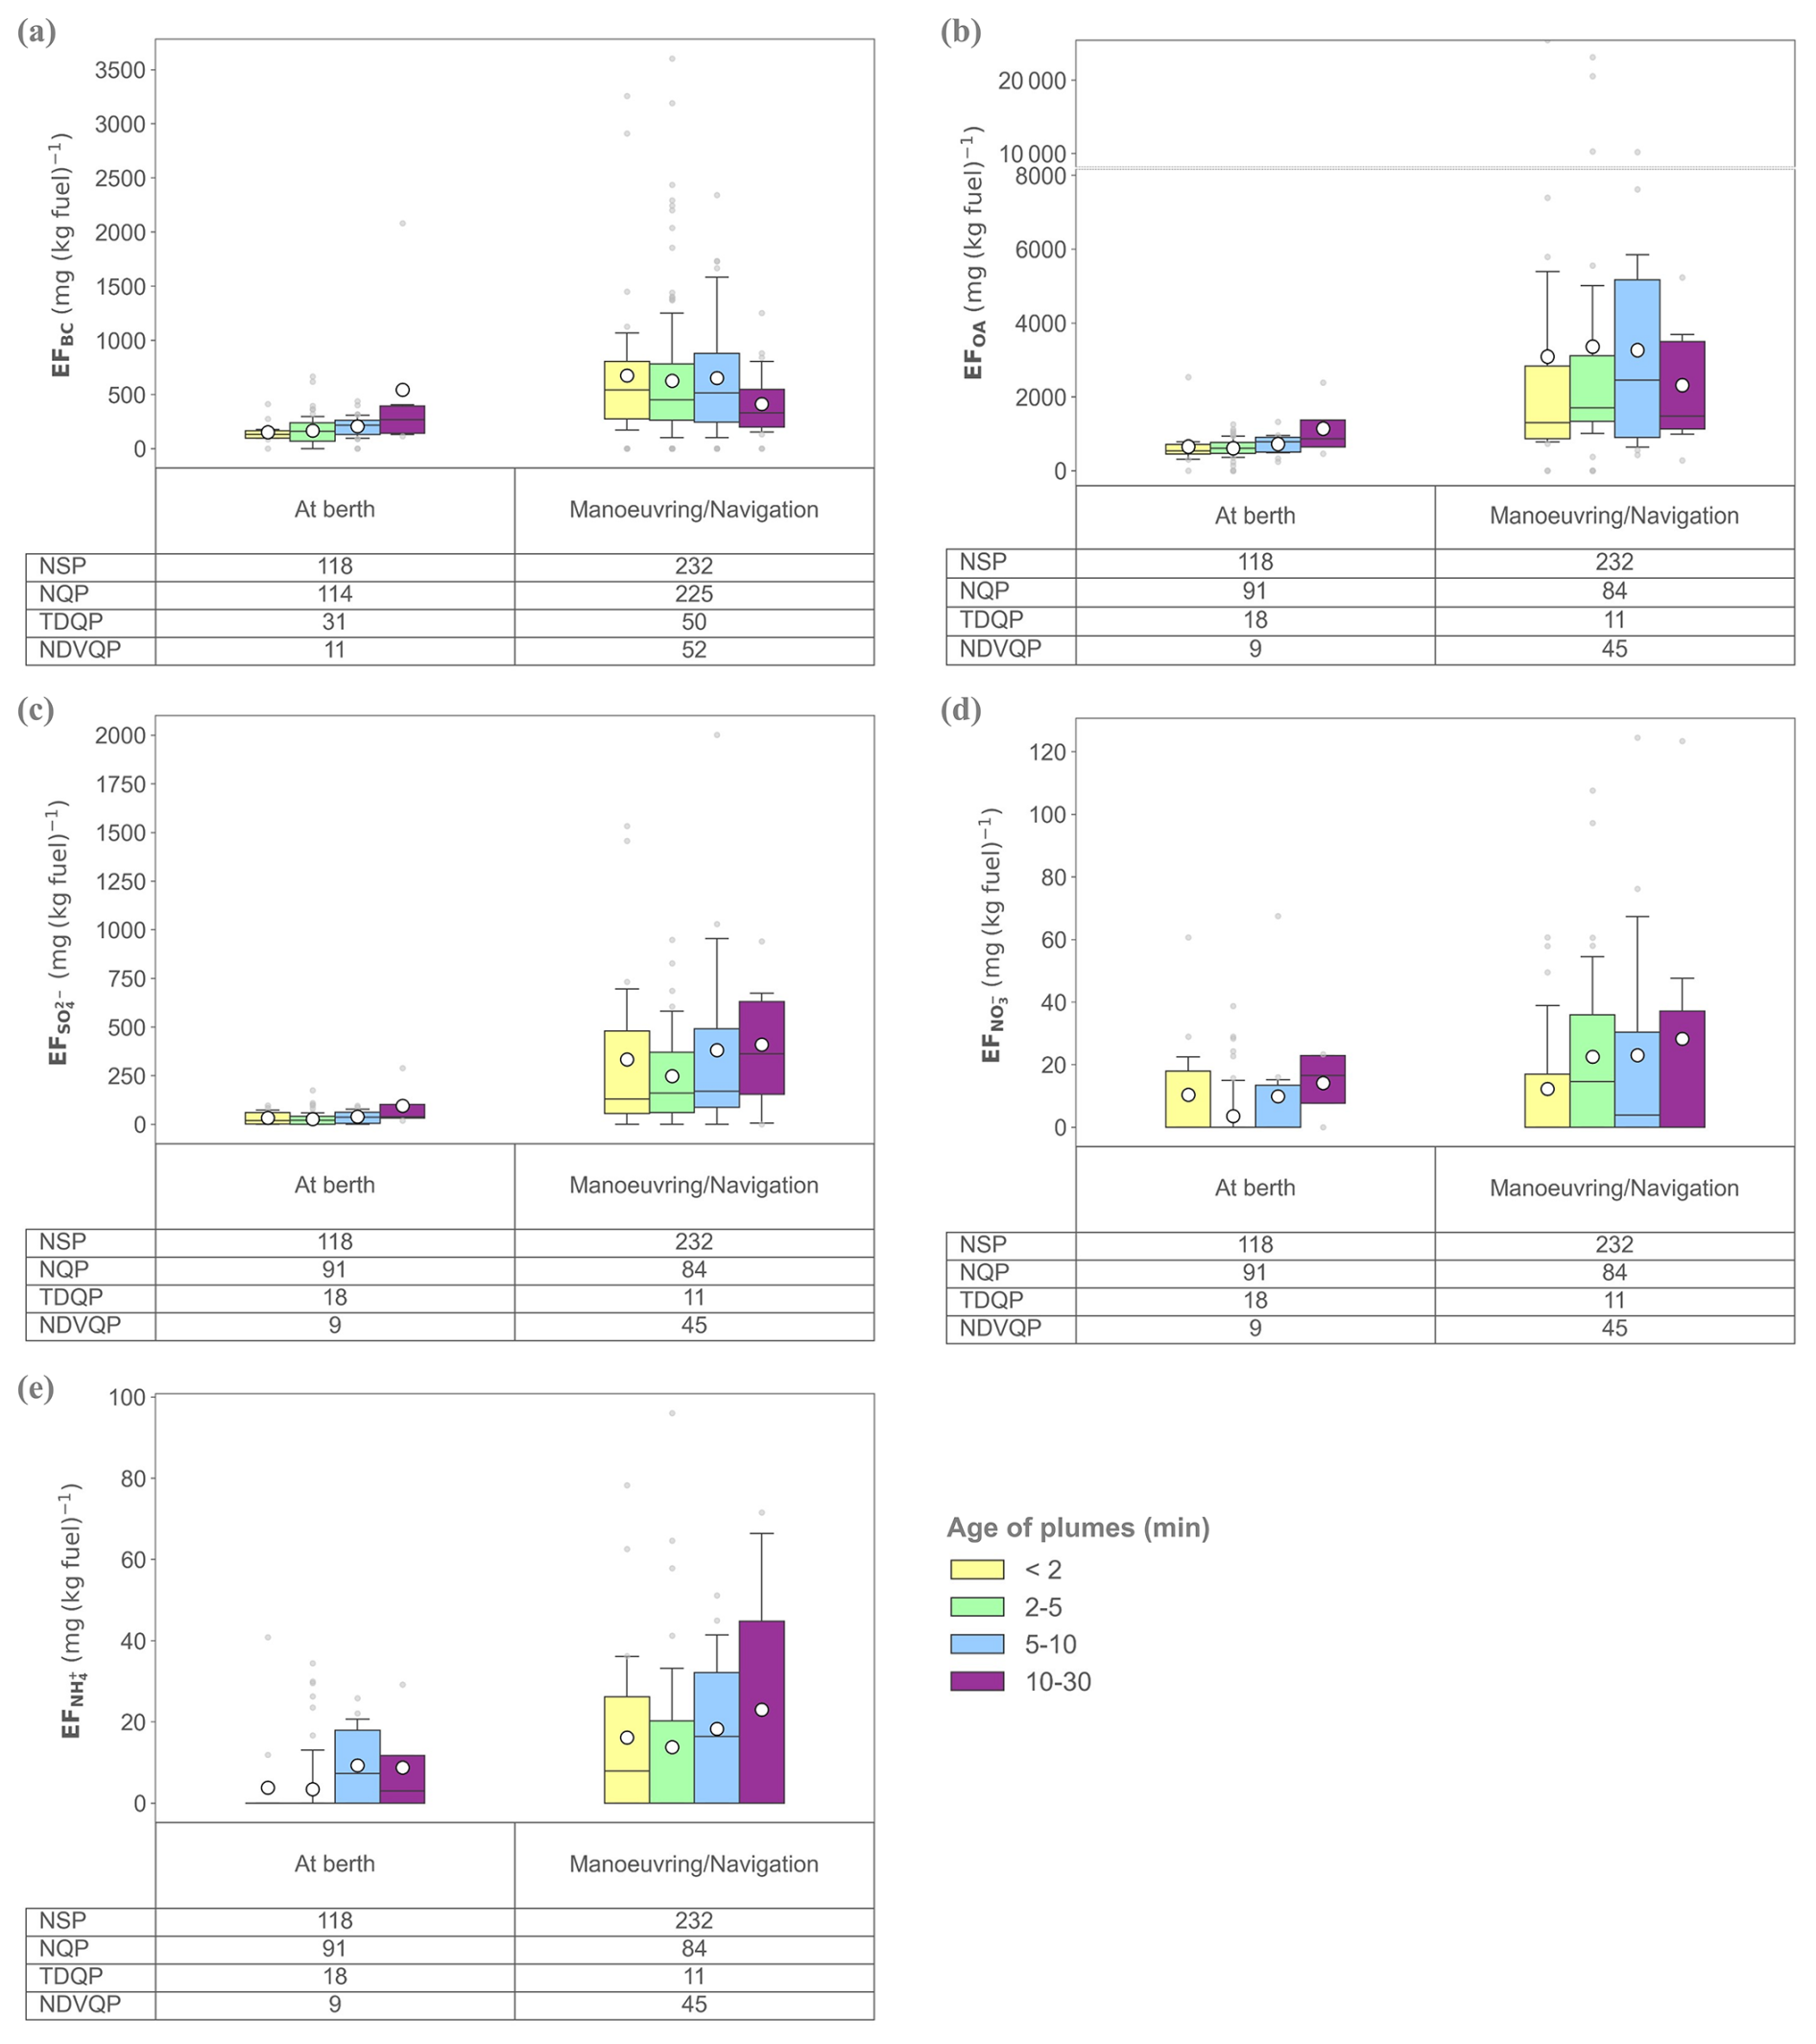
Figure 16Distribution of emission factors (EF) as a function of operational phase and plume age for (a) BC, (b) OA, (c) SO, (d) NO, and (e) NH.
In summary, Fig. 17 depicts the median chemical mass composition of PM1 emissions across different ship operational phases, which is the parameter most frequently found to affect EFs. The amount of PM1 emitted by ships can vary by a factor of 3 depending on the operational phase and tends to be more variable during the manoeuvring/navigation phases compared to when ships are docked. Particles emitted by ships across all operational phases are primarily composed of organic matter (OA, 75 %), black carbon (BC, 21 %), and sulfate (SO, 4 %). However, this composition can change with the operational phase: the proportion of black carbon increases to 34 % during manoeuvring, while the proportion of sulfate rises to 8 % during navigation and decreases to 2 % when at berth.
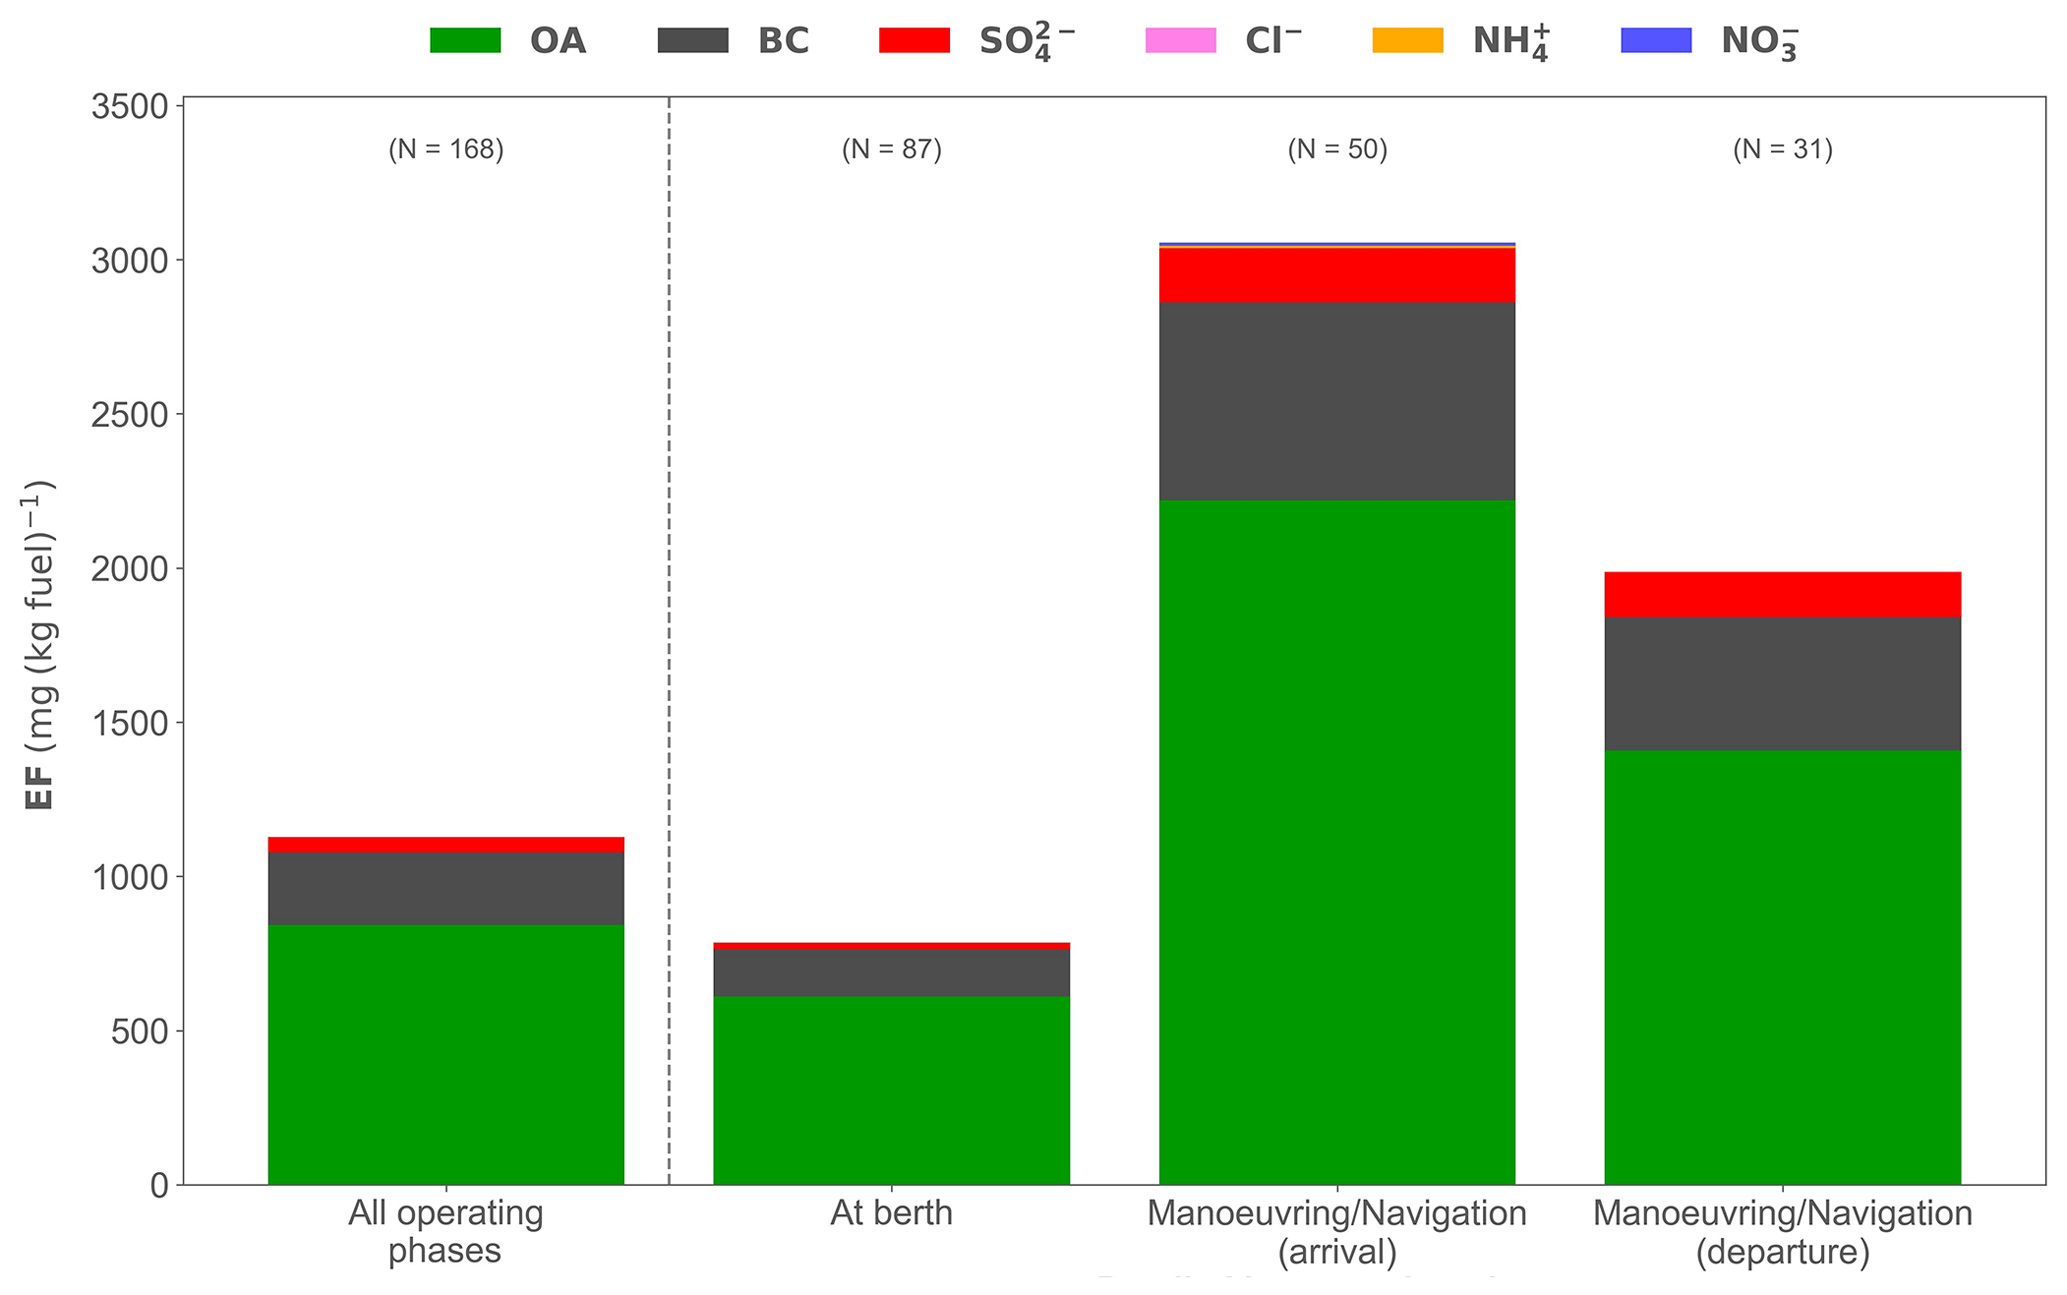
Figure 17The median ship PM1 chemical composition as a function of the ship operational phases. The number of plumes considered (N) is specified.
The PM1 chemical composition characteristics (low sulfate but high organic content) found in the present study share similarities with the organic-rich PM1 composition recently identified by positive matrix factorization (PMF) analysis of measurements made in Dublin port (Fossum et al., 2024). This suggests that the global ship plumes signature in Marseille port is dominated by ships using VLSFO (very-low-sulfur fuel oil), ULSFO (ultra-low-sulfur fuel oil), or MGO (marine gas oil) rather than HFO (heavy fuel oil) combined with a scrubber system, for which sulfate makes up 60 % of the PM1 (Fossum et al., 2024). It is noteworthy that in Marseille, the PM1 has 2-fold higher relative BC content than the organic-rich PM1 detected in Dublin port (21 % vs. 9 %). One reason for its higher value is that the field campaigns experienced different climatic conditions (summertime for Marseille vs. wintertime for Dublin). The higher temperature at Marseille (average ambient temperature of 24 °C vs. 8 °C in Dublin) could favour the evaporation of organics from the non-volatile black carbon core of the aerosol once the ship emissions are released into the air.
3.2.4 Particle size distribution
To ensure the comparability of the particle size distributions between the different plumes, the emission factors for each class of particles were normalized with respect to the maximum emission factor observed in each plume. Significant variations in EFs between plumes require this standardization.
Among the ship parameters examined, the operational phase has the most significant impact on the particle size distribution of the 158 plumes selected. For ships at berth, which operate their auxiliary engines at a stable and optimal load using low-sulfur distillate fuel (<0.1 %), the particle size distribution was found to be unimodal and centred around 30 nm (Fig. 18a). In contrast, vessels manoeuvring/navigating, which use their main engines at lower (<25 %) and less stable loads, display a bimodal distribution with modes at 35 and 100 nm (Fig. 18b). Unlike the number of particles, no significant differences are observed between arrivals and departures. The 35 nm mode is generally more prevalent, while the intensity of the 100 nm mode varies among plumes. Notably, the 100 nm mode is particularly pronounced among the ferries, a category of vessels in the port of Marseille that are known to be partially equipped with scrubbers.
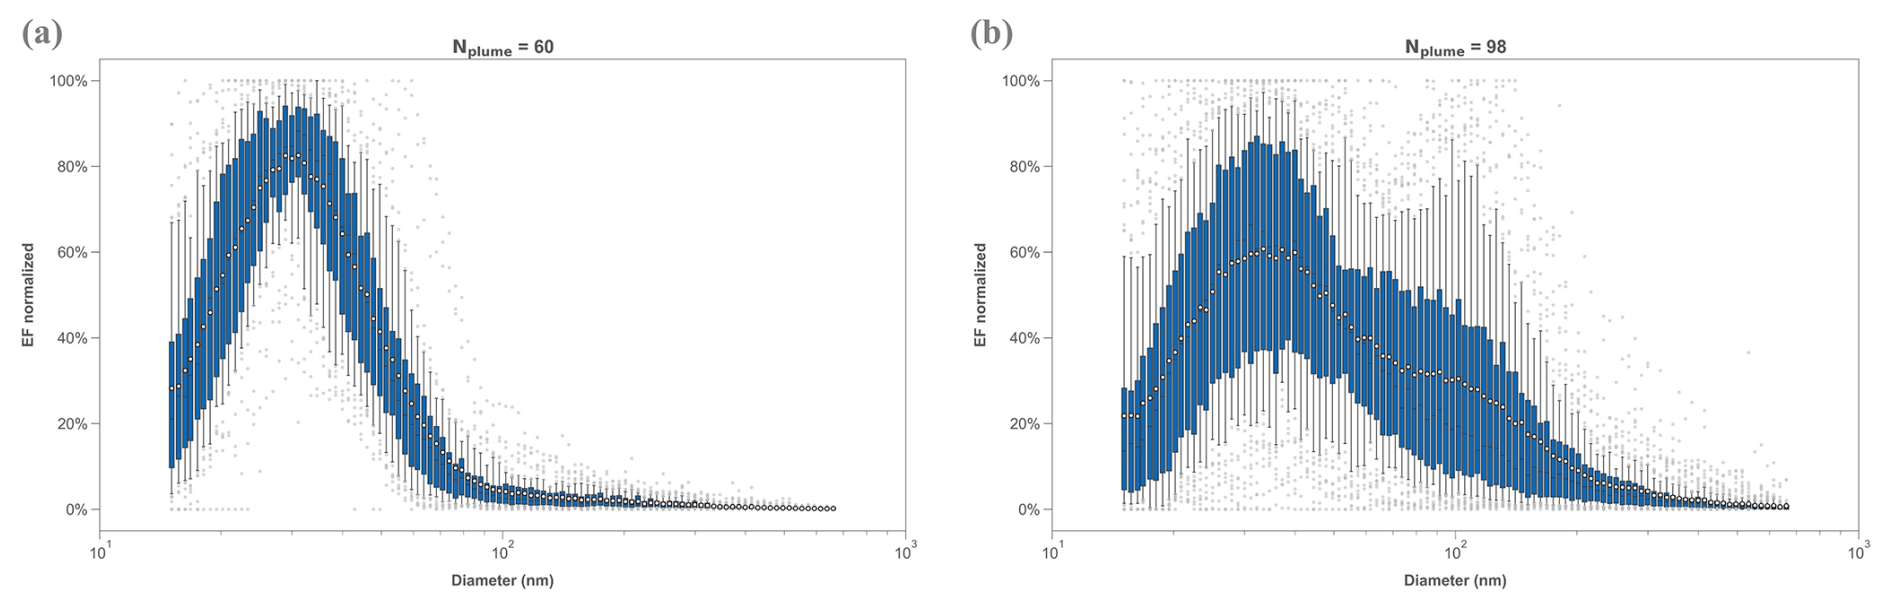
Figure 18Particle size distribution of the plumes identified during the campaign according to the operational phases (a) at berth and (b) manoeuvring/navigation.
These findings are supported by analysis of the daily profiles for mean particle diameter (Fig. S6), which shows a shift towards smaller particles (around 50 nm) during periods of ship movement. These observations are also consistent with the literature. While the specific causes of a unimodal or bimodal distribution can vary between studies, the 30 nm mode is consistently observed. According to particle morphology analyses conducted using transmission electron microscopy (Aakko-Saksa et al., 2023; Alanen et al., 2020), the 30 nm particles are spherical, non-volatile, and originate from the combustion of fuel and lubricating oils. The mode around 100 nm could be attributed to (1) incomplete combustion during manoeuvring phases, which promotes soot formation and particle coagulation (Diesch et al., 2013); (2) the use of scrubbers when the 100 nm mode is dominant (Jeong et al., 2023; Kuittinen et al., 2021; Winnes et al., 2020); or (3) the use of heavy fuel oil types (HFO, VLSHFO, ULSHFO) when the 100 nm mode is not dominant (Anderson et al., 2015a; Fossum et al., 2024). Fossum et al. (2024) demonstrated that (1) plumes from ships at berth, which used marine gas oil (MGO) fuel, had a unimodal particle size distribution centred around 30 nm, whereas (2) plumes from ships manoeuvring/navigating within port, which used ultra-low-sulfur heavy fuel oil (ULSHFO), exhibited a bimodal distribution consistent with the two modes observed in the present study. Since the type of fuel and the use of scrubbers were not specified in the AIS database, these hypotheses could not be confirmed.
The analysis of particle modal diameter evolution with plume ageing, as shown in Fig. 19, indicates a marginal increase in diameter. This finding suggests that, aside from natural dilution that gradually reduces particle concentrations within the plumes, no other significant physico-chemical processes occur over the short timescales studied (less than 30 min). However, while the increase in modal diameter is not statistically significant, this observation, along with a statistically significant decrease in EFPN, suggests that condensation or coagulation phenomena could occur and could contribute to the increase in particle modal diameter.
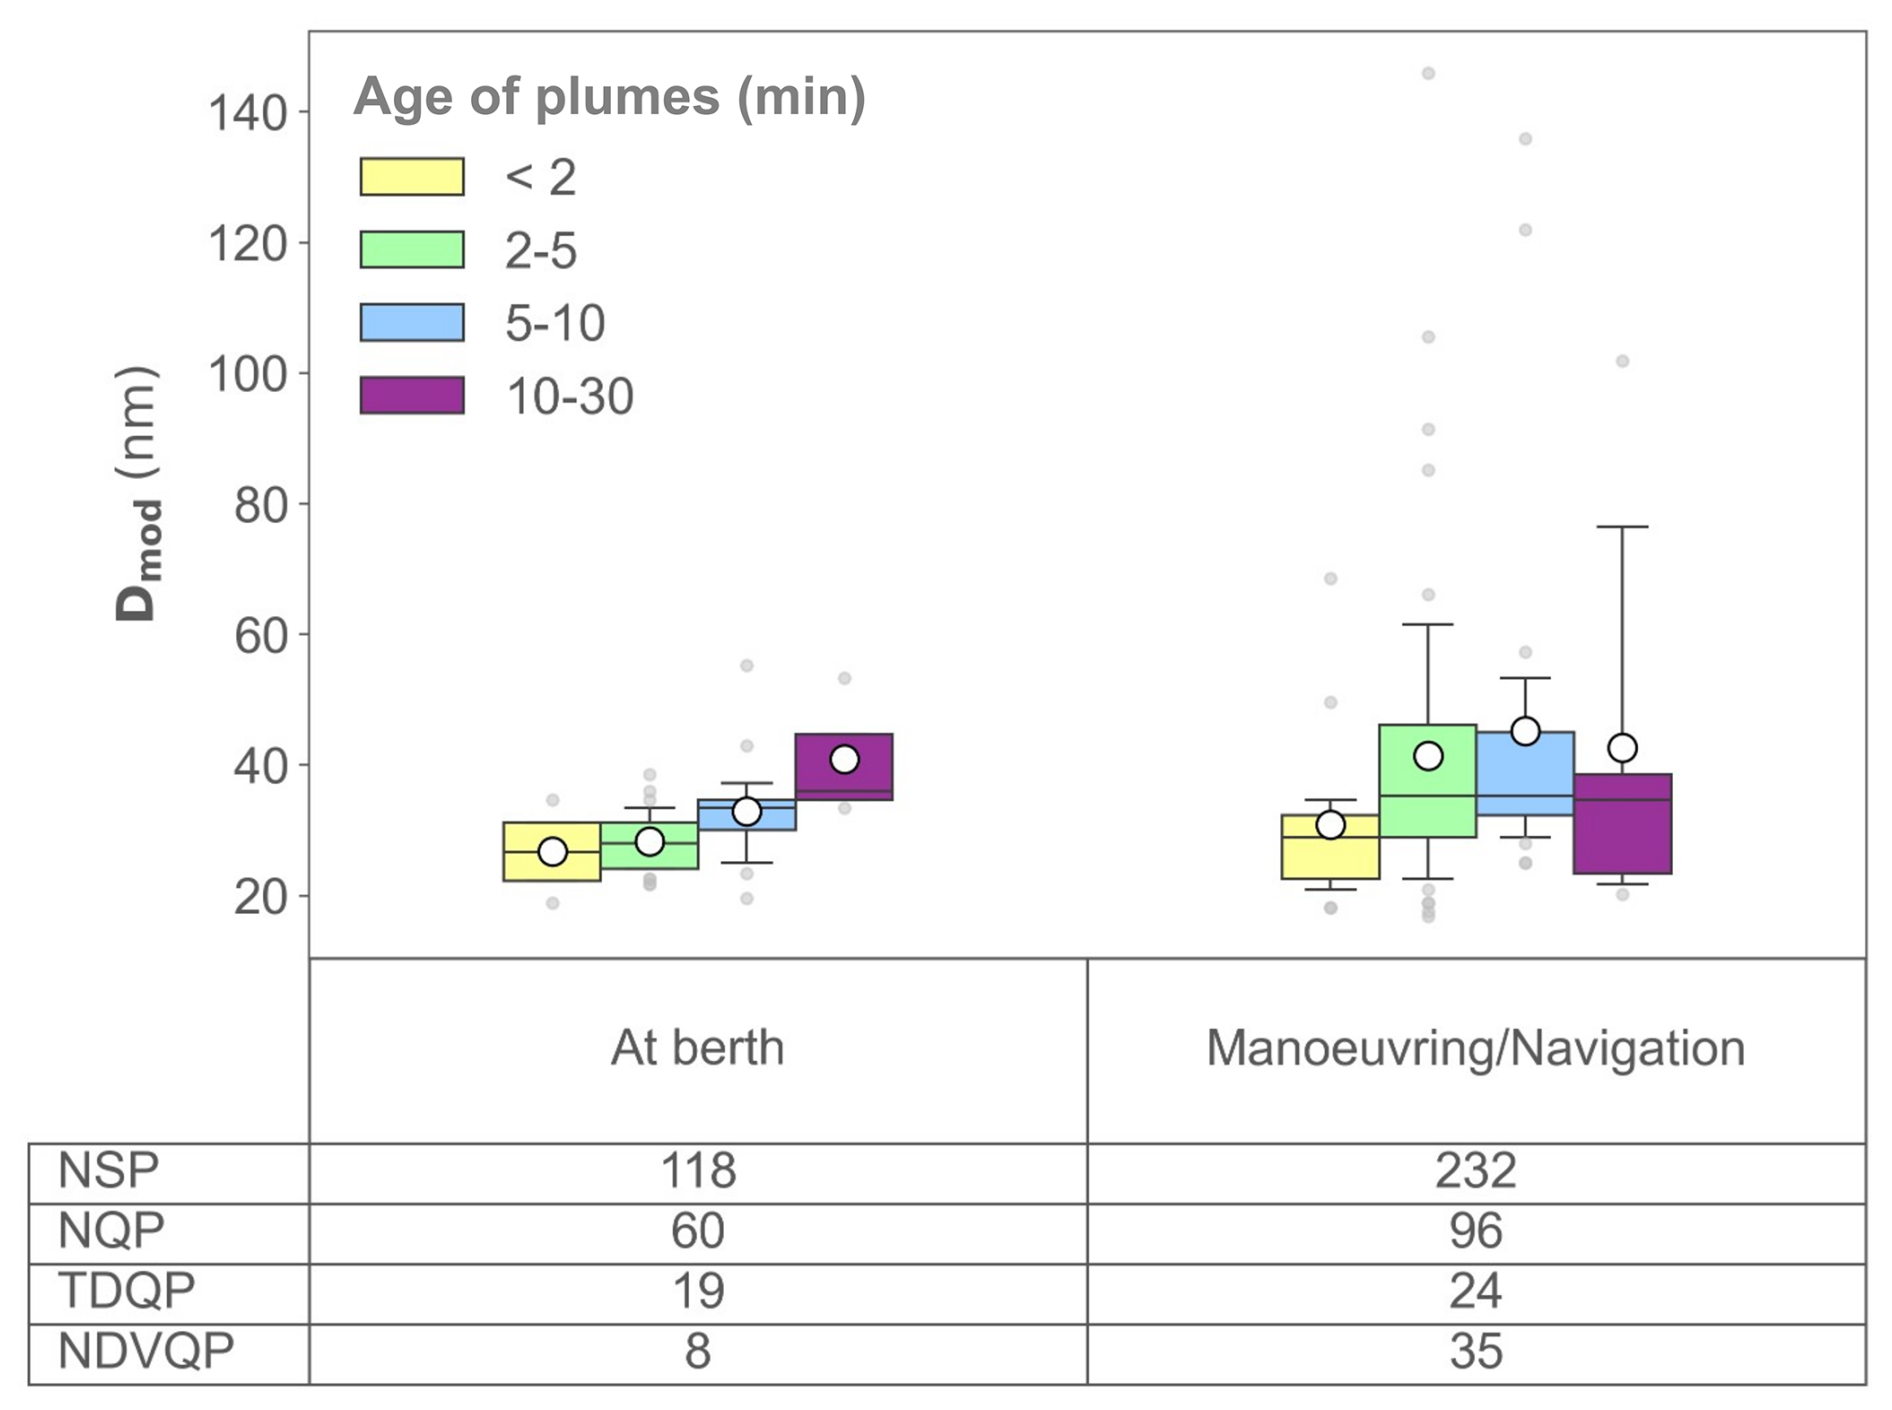
Figure 19Distribution of modal particle diameters as a function of the ship operational phase and plume age.
Furthermore, scatterplots of the EFPN measured using the CPC analyser (2.5 nm (PEB) or 7 nm (MAJOR) to 2.5 µm) vs. the SMPS analyser (15 to 660 nm) yield a slope greater than 1.3 for 30 % of the plumes analysed. This finding suggests that, for these plumes, about 30 % of the particles had a diameter smaller than 15 nm. Interestingly, the percentage of plumes associated with this feature increases as plume age decreases, consistent with the expected plume evolution in the atmosphere (e.g. 100 % of plumes from vessels at berth with an age of less than 2 min exhibit this bias compared to 40 % of plumes aged between 2 and 5 min).
The analysis of particle size distribution emitted by ships emphasizes the importance of specifically monitoring the PM1 fraction, particularly particles smaller than 150 nm. This range includes the two likely particle size modes, which could be characteristic of the fuels used by ships.
3.3 Short-term impact of shipping plumes on local air quality
Following the method described in Sect. 2.3.3, Table 2 lists the median and the 25th and 75th percentiles of enhanced concentration levels of pollutants observed downwind the 353 ship plumes identified during the campaign. Metals are included in this analysis to provide insights into their contributions even though this resolution did not allow us to determine EFs and may underestimate the average concentrations during plume events.
Table 2Absolute and relative ambient concentration enhancements downwind of the ship plumes. The 25th and 75th percentiles are indicated for each median value and are presented as follows: median [25th percentile/75th percentile].
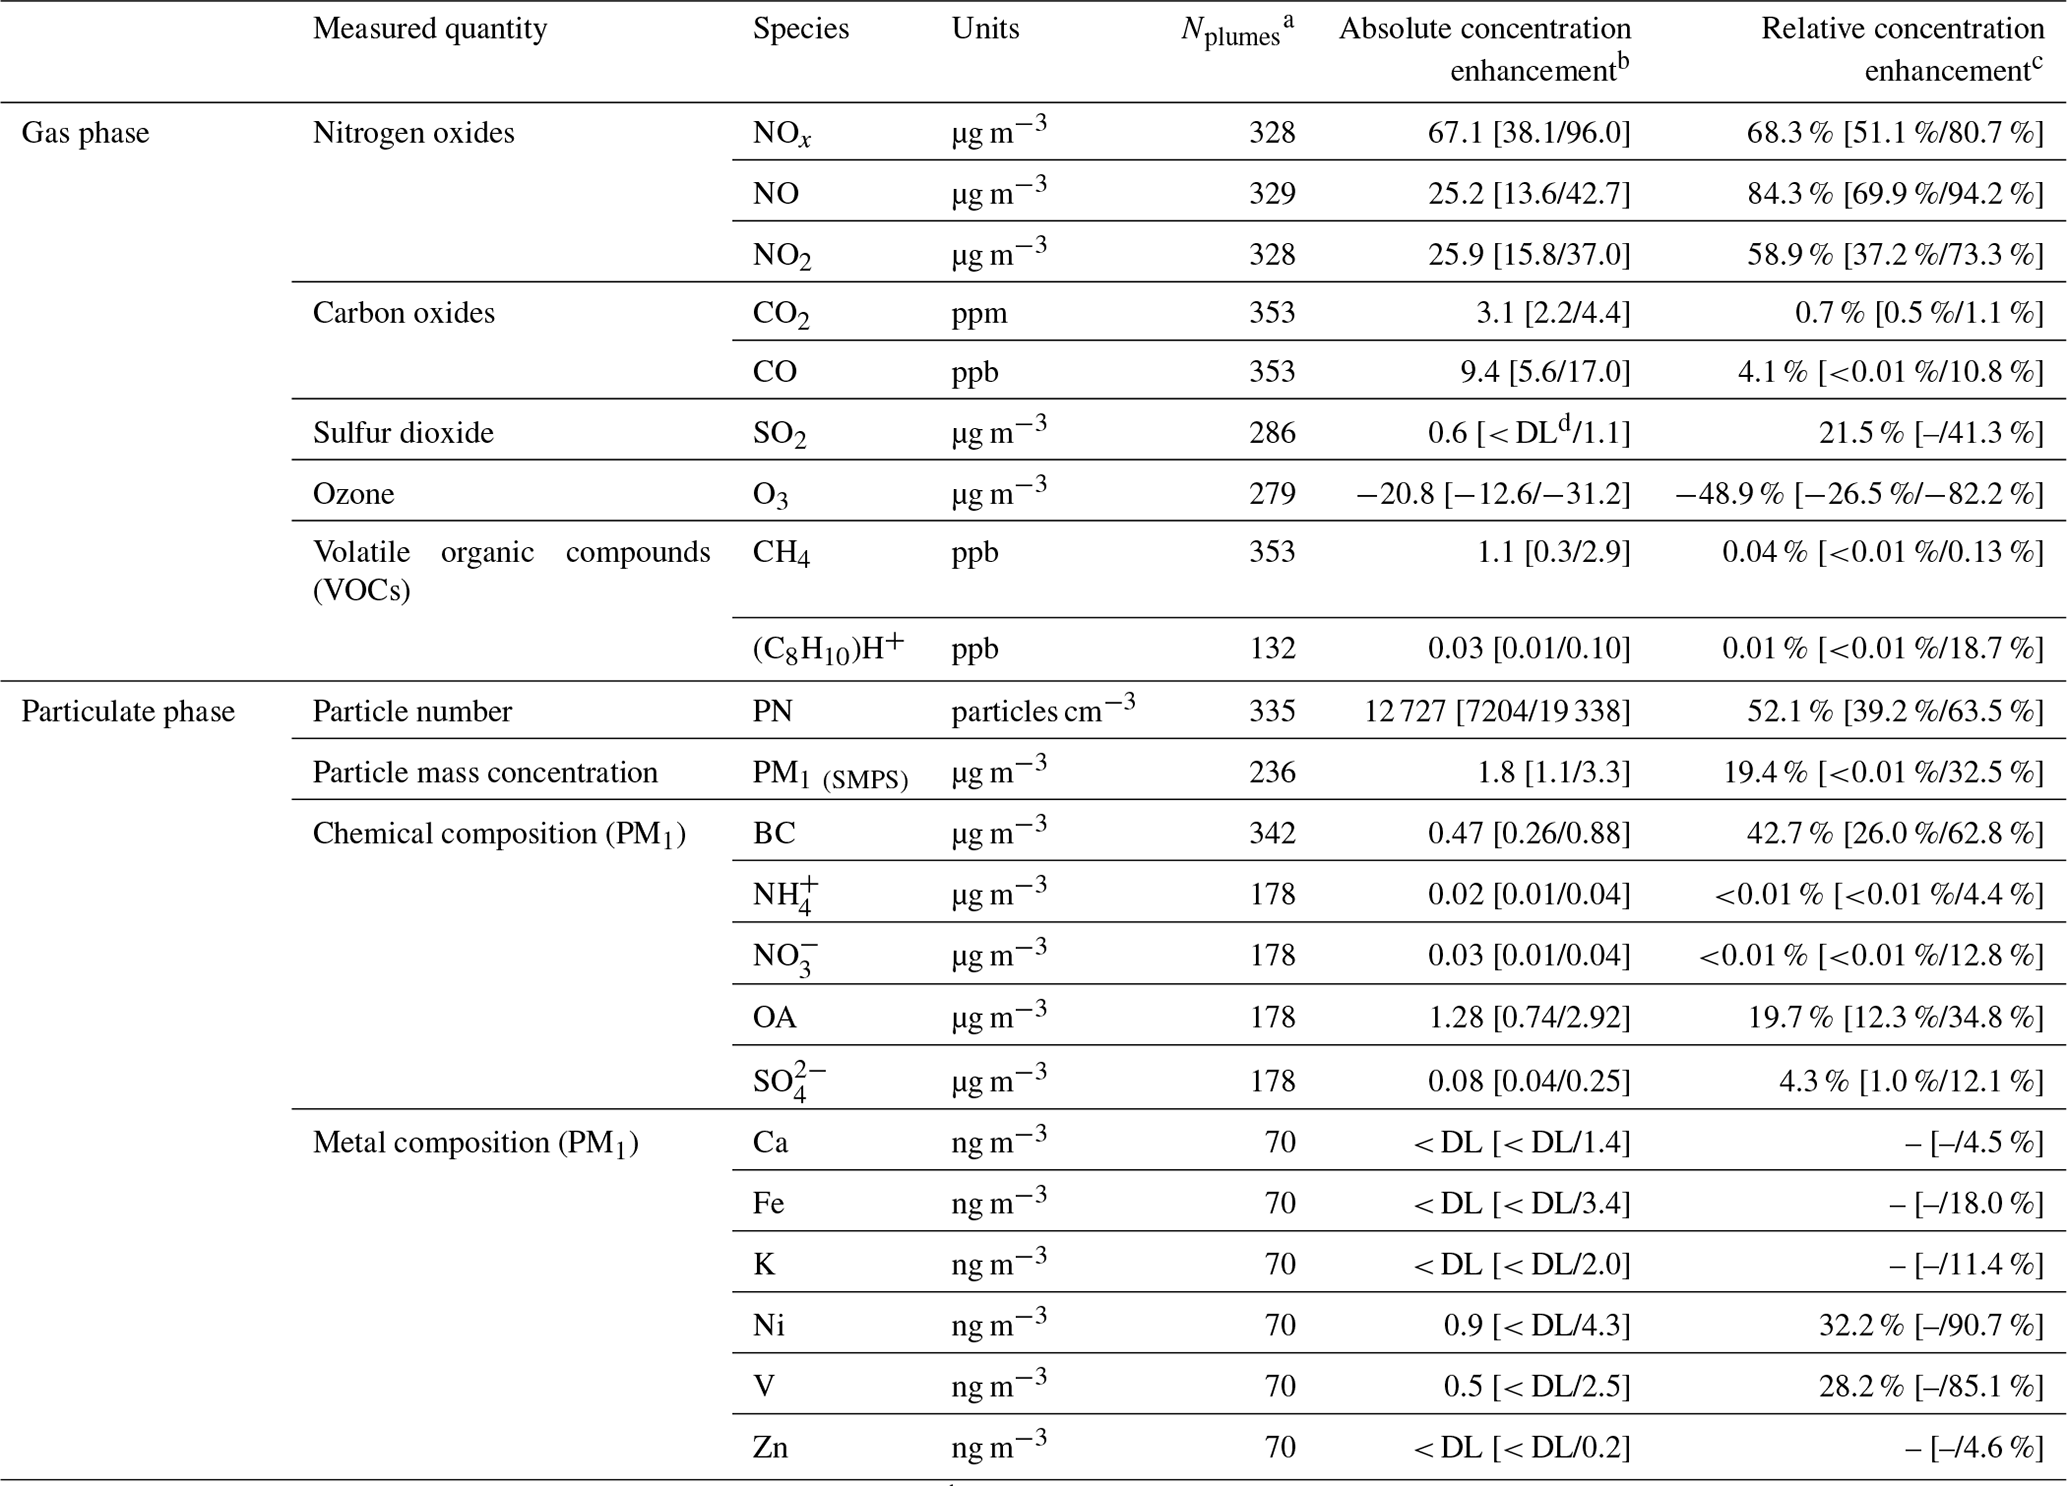
a Nplumes represents the total number of plumes used as the basis for the statistical calculations. b Statistics from the average excess concentration of each plume. c Statistics from the relative contribution of each plume relative to global concentrations. d Below the detection limit (< DL).
The level enhancement of pollutant concentrations resulting from ship emissions, as detailed in Table 2, represents the supplementary short-term exposure (∼ 10 min) that people may be exposed to when carrying out activities near the port such as walking, exercising, or dining outdoors. Significant increases in concentration, typically ranging from a factor of 2 to 4, are observed between the 25th and 75th percentiles. These fluctuations are influenced by parameters that play a crucial role in the dilution of plumes (mainly wind speed and the distance between the measurement station and the ship) in addition to those previously identified as having a significant impact on emission factors (operating phase, ship category, plume age). It is consequently essential to include many plumes under various meteorological conditions that are representative of the area under study to accurately estimate the impact of ship plume emissions on local air quality.
During plume events, ships significantly contribute to ambient concentrations, with median contributions exceeding 50 % for NOx and PN; greater than about 20 % for SO2, PM1, BC, OA, Ni, and V; and about 4 % for CO and SO. Unlike other pollutants, O3 decreases during plume events by an amount nearly equal to the NO2 increase, which results from the reaction between NO and O3; this decrease contributes to a lowering of the O3 levels by 50 %. While the other species exhibit limited median contributions from shipping, some, like aromatic C8 NMVOCs, NO, Fe, and K, occasionally reach significant levels (75th percentiles ranging from 10 % to 20 %). Meanwhile, concentrations of CO2 and CH4 are negligible in terms of air quality impact yet continue to be relevant as contributors to greenhouse gases. Enhanced concentrations found in this study for PM, PN, and NO2 are 8–15 times higher than those reported by Ausmeel et al. (2020) at a coastal site on the Falsterbo peninsula in southern Sweden during summer despite using the same methodology. This discrepancy is partly due to the greater distance between the shipping lanes and the measurement station in the Ausmeel et al. (2020) study (10 km vs. 250 m), which further dilutes the plumes. The results of this study are comparable to those reported by Toscano et al. (2022) and Ledoux et al. (2018) from monitoring stations located in the ports of Naples (Italy) and Calais (France), respectively, and located 200 and 500 m from the shipping lanes. They compared concentrations measured downwind of ship emissions with those from other sectors, benefiting from well-defined wind sectors. Toscano et al. (2022) reported increases in concentrations of pollutants attributed to passenger ships at berth, with NO, NO2, NOx, and SO2 levels rising by 23.4, 23.6, 59.6, and 1.3 µg m−3, respectively. Similarly, Ledoux et al. (2018) observed increases in concentrations of pollutants linked to passenger ships at berth and during manoeuvring, with NO, NO2, and SO2 levels increasing by 28.4, 28.4, and 16.1 µg m−3, respectively. Regarding SO2, the additional concentrations reported by Ledoux et al. (2018) were significantly higher because their study was conducted in 2014, when sulfur content in fuels (FSC) in this area was still only limited to 1 %. In contrast, this study and that of Toscano et al. (2022) took place in 2021, when FSC was restricted to 0.1 % within port limits and 0.5 % outside. This drastic reduction aligns with observations following the shift to fuels with less than 0.5 % sulfur in Marseille in 2020 (Fig. 3).
Among the trace metals, only V and Ni show non-zero median contributions (30 %). This corresponds to median additional concentrations of 0.5 and 0.9 ng m−3, respectively, leading to a ratio of about 0.5. This ratio aligns with the ratio that has recently arisen from the use of lower-sulfur-content fuels since 2020 in all ocean areas. Before 2020, the ratio often associated with ship emissions ranged between 2 and 3 (Pandolfi et al., 2011; Viana et al., 2009; Yu et al., 2021), but a shift towards a ratio <2 has been observed. Fossum et al. (2024) observed a ratio between 0 and 2, and Yu et al. (2021) reported a ratio of 0.5 (the ratios in this study range between 0.1 and 2). Moreover, the analysis of additional metal concentrations categorized by operating phase (Table S13), the parameter identified as having the greatest influence on emission factors, highlights significant differences depending on the operating phase. For ships at berth, the additional metal concentrations are systematically not detected, with only potassium (K) being occasionally detected (75th percentile = 1.5 ng m−3). For the manoeuvring/navigation phases, excluding ships at berth doubles the median contribution of V and Ni, bringing it to approximately 70 %. In addition, as with the emission factors, a distinction can also be made between arrivals and departures. A factor of 2 is observed between the additional concentrations during arrivals and departures. However, this result should be interpreted with caution, as, unlike emission factors, excess concentrations depend on plume dilution, particularly since ship arrivals mainly occur early in the morning when meteorological conditions are less favourable for pollutant dispersion. Separating by operational phase also makes the presence of iron (Fe) in ship emissions during the manoeuvring/navigation phases more systematic. For these phases, the median contributions of ships are 11 % during arrivals and 5 % during departures compared to 0 % across all operational phases.
Our findings highlight the need to incorporate measurements of ultrafine particles (UFPs) and their chemical components, including black carbon (BC) and metals, into air quality assessments. These particulate fractions, which are significantly emitted by ships, are crucial for evaluating human exposure risks (WHO, 2021). Furthermore, quantifying the composition of these particles – particularly BC and metals, which are also released in notable quantities by ships – is essential for assessing the associated health risks for populations (Briffa et al., 2020, p. 4; Rönkkö et al., 2023).
Emissions from ships play a significantly important role in the exposure of human populations to atmospheric pollutants in port areas. However, these emissions are not well understood, especially after the advancements in ship engine design and the implementation of purification technologies due to regulatory restrictions. Considering these elements, a measurement campaign has been conducted in Marseille, one of the largest ports in the Mediterranean Sea, which has become an Emission Control Area (ECA) for SOx in 2025. Measurements were taken at two stations within the port area in June 2021, capturing high-resolution data on the chemical composition of both the gaseous phase (e.g. SO2, CO2, NOx, CH4) and the particulate phase (e.g. BC, OA, SO), as well as the particle size distribution. In total, nearly 110 compounds were measured simultaneously, including 45 trace-metal elements and 41 NMVOCs, creating a unique and comprehensive database.
The comparison of concentrations measured at sites within the port area (PEB and MAJOR) with those from the MRS-LCP station, which serves as a reference for urban background pollution for the regional air quality network and the analysis of their temporal evolution, clearly demonstrates the impact of port activities on pollutant levels. For PN, PM2.5, PM1, and NOx, the influence is significant, with average concentrations being 1.5 to 2 times higher near the port. In contrast, for pollutants such as SO2 and certain metals (As, Cd, Co, Fe, Ni, Sb, Se, Sn, V, Zn, and Zr), only the peak concentrations are affected, with maxima 2 to 10 times higher near the port compared to downtown areas.
In addition, a method based on cross-referencing measurement data with meteorological and AIS records, which include ship positions, was developed and applied to identify ship emission plumes and characterize their physical and chemical composition. In total, more than 350 ship plumes were identified to determine the emission factors (EFs) of particle- and gas-phase species. These EFs were calculated as quantities that account for plume dilution and refer to the amount of fuel burned. Generally, the ship EFs determined in this study, which primarily cover their port operations (docking, berthing, and entering or leaving the port), are consistent with the values documented in the literature.
These EFs were also used to explore how various ship-related characteristics influence emissions. The study found that the operational phase of the ships is the most influential parameter, related to the fact that ships at berth operate their auxiliary engines at a stable and optimal load using low-sulfur distillate fuel (<0.1 %), while those manoeuvring/navigating use their main engines at lower (<25 %) and less stable loads. Additionally, the ship categories and the age of the plume can also affect these EFs.
In terms of chemical composition, ship gaseous emissions are predominantly composed of NOx (86 %) and CO (12 %). SO2 and CH4 each represent about 1 %. Other compounds, such as NMVOCs, constitute less than 0.1 % of the gaseous phase but can account for up to 10 % under certain operational conditions; we note that the impact of these species on secondary pollution can be significant. Regarding the particulate phase, the quantity of particles emitted by ships can vary by a factor of 3 depending on the operational phase, with higher emissions during the manoeuvring/navigation phases compared to at berth. Particles emitted by ships across all operating phases are mainly composed of OA (75 %), BC (21 %), and SO (4 %). The proportion of BC and sulfate increases to 34 % and 8 %, respectively, during the manoeuvring and navigation phases. The study also shows that combining PM1 size distribution analysis with the chemical composition (organic fraction, sulfate, black carbon, and the vanadium/nickel ratio) can help identify the different types of fuels used by ships, as well as the exhaust gas cleaning systems installed on vessels.
Finally, the additional concentrations from ship emissions represent the supplementary short-term exposure (∼ 10 min) that people may experience when carrying out activities near the port. This indicates that during a plume event, ships contribute significantly to ambient concentrations of certain pollutants, with median contributions exceeding 50 % for NOx and PN; around 20 % for SO2, PM1, BC, OA, Ni, and V; and approximately 4 % for CO and SO. A more detailed analysis conducted on metals for which the estimation of EFs was not possible due to the analyser's resolution time highlights the fact that metals are not appropriate tracers of ship pollution when ships are at berth. However, certain metals such as V, Ni, and Fe appear to be good tracers during the manoeuvring/navigation phases. The median ratio of 0.5 obtained is consistent with the new ratios established following the use of lower-sulfur-content fuels since 2020 in all oceans.
The results from this study provide robust support to assess air quality in port areas and improve source apportionment through detailed emission profiles. The EFs determined allow for the integration of chemical speciation into emission inventories based on ship operational phases and categories, enabling a more precise estimation beyond traditional approaches relying mainly on engine power or fuel consumption. They can also serve as a baseline for studying the benefits of implementing an Emission Control Area (ECA) for SOx in the Mediterranean Sea in 2025.
Concentration datasets from the study are available at https://doi.org/10.57932/90ffebbe-94c3-4356-a073-78ec9e014b1d (Le Berre et al., 2024). Toolkits used in this study are available upon request from the authors Brice Temime-Roussel (brice.temime-roussel@univ-amu.fr) and Lise Le Berre (lise.le-berre@univ-amu.fr).
The supplement related to this article is available online at https://doi.org/10.5194/acp-25-6575-2025-supplement.
NM, SS and HW designed the measurement campaign. BD'A took responsibility for the scientific coordination of the field campaign, with AA, BTR, LLB, and GML contributing to the search for measurement stations and obtaining authorization to install the measurement instruments in the port. The measurements and their processing were conducted by BTR, LLB, GML, SS, LT, TL, JRB, GG, LL, and RB. LLB carried out data analysis (compilation of databases, development of the peak detection algorithm, development of a toolkit for estimating emission factors, and analysis of plume composition and the parameters influencing it) and wrote the paper. BTR and HW reviewed the paper. All authors have read and approved the submitted version of the paper.
The contact author has declared that none of the authors has any competing interests.
Publisher’s note: Copernicus Publications remains neutral with regard to jurisdictional claims made in the text, published maps, institutional affiliations, or any other geographical representation in this paper. While Copernicus Publications makes every effort to include appropriate place names, the final responsibility lies with the authors.
The authors would like to warmly thank the port of Marseille for allowing us to install the measuring instruments on the berth throughout the campaign. In particular, we are grateful to Eric Beroule, Mickaël Parra, and Magali Deveze for their administrative and technical support in preparing and carrying out the PAREA field campaign. The authors gratefully acknowledge the MASSALYA instrumental platform (Aix Marseille Université, https://lce.univ-amu.fr/equipes/massalya last access: 15 September 2024) and MRS-LCP background urban supersite of Marseille (AtmoSud) for the provision of measurements used in this publication. They would also like to thank Irène Xueref-Rémy from the IMBE laboratory for the loan of her CO/CO2 analyser (Picarro G2401) and standard gas cylinders and for her technical support with them.
The measurement campaign was supported by the French Agency for Ecological Transition (ADEME) as part of the PAREA project of the CORTEA research programme (grant no. 1966C0015). The data analysis received financial support from the Provence-Alpes-Côte-d'Azur regional air quality monitoring network (AtmoSud) and from ADEME through the funding of Lise Le Berre's PhD (grant no. TEZ19-029). The exploratory campaigns to determine the station locations were supported by European Union's Horizon 2020 research and innovation programme under grant agreement no. 814893 (the project “Shipping Contributions to Inland Pollution Push for the Enforcement of Regulations”, SCIPPER).
This paper was edited by Luis A. Ladino and reviewed by two anonymous referees.
Aakko-Saksa, P. T., Lehtoranta, K., Kuittinen, N., Järvinen, A., Jalkanen, J.-P., Johnson, K., Jung, H., Ntziachristos, L., Gagné, S., Takahashi, C., Karjalainen, P., Rönkkö, T., and Timonen, H.: Reduction in greenhouse gas and other emissions from ship engines: Current trends and future options, Prog. Energ. Combust., 94, 101055, https://doi.org/10.1016/j.pecs.2022.101055, 2023.
Aardenne, J. V., Colette, A., Degraeuwe, B., Hammingh, P., Viana, M., De Vlieger, I., and European Environment Agency: The impact of international shipping on European air quality and climate forcing, European Environment Agency, Publications Office of the European Union, Luxembourg, 84 pp., https://doi.org/10.2800/75763, 2013.
Adotey, E. K., Burkutova, L., Tastanova, L., Bekeshev, A., Balanay, M. P., Sabanov, S., Rule, A. M., Hopke, P. K., and Amouei Torkmahalleh, M.: Quantification and the sources identification of total and insoluble hexavalent chromium in ambient PM: A case study of Aktobe, Kazakhstan, Chemosphere, 307, 136057, https://doi.org/10.1016/j.chemosphere.2022.136057, 2022.
Agrawal, H., Welch, W. A., Miller, J. W., and Cocker, D. R.: Emission Measurements from a Crude Oil Tanker at Sea, Environ. Sci. Technol., 42, 7098–7103, https://doi.org/10.1021/es703102y, 2008a.
Agrawal, H., Welch, W. A., Henningsen, S., Miller, J. W., and Cocker III, D. R.: Emissions from main propulsion engine on container ship at sea, J. Geophys. Res.-Atmos., 115, D23205, https://doi.org/10.1029/2009JD013346, 2010.
Alanen, J., Isotalo, M., Kuittinen, N., Simonen, P., Martikainen, S., Kuuluvainen, H., Honkanen, M., Lehtoranta, K., Nyyssönen, S., Vesala, H., Timonen, H., Aurela, M., Keskinen, J., and Rönkkö, T.: Physical Characteristics of Particle Emissions from a Medium Speed Ship Engine Fueled with Natural Gas and Low-Sulfur Liquid Fuels, Environ. Sci. Technol., 54, 5376–5384, https://doi.org/10.1021/acs.est.9b06460, 2020.
Anderson, M., Salo, K., Hallquist, Å. M., and Fridell, E.: Characterization of particles from a marine engine operating at low loads, Atmos. Environ., 101, 65–71, https://doi.org/10.1016/j.atmosenv.2014.11.009, 2015a.
Anderson, M., Salo, K., and Fridell, E.: Particle- and Gaseous Emissions from an LNG Powered Ship, Environ. Sci. Technol., 49, 12568–12575, https://doi.org/10.1021/acs.est.5b02678, 2015b.
Arya, S. P.: Modeling and Parameterization of Near-Source Diffusion in Weak Winds, J. Appl. Meteorol., 34, 1112–1122, 1995.
Ausmeel, S., Eriksson, A., Ahlberg, E., and Kristensson, A.: Methods for identifying aged ship plumes and estimating contribution to aerosol exposure downwind of shipping lanes, Atmos. Meas. Tech., 12, 4479–4493, https://doi.org/10.5194/amt-12-4479-2019, 2019.
Ausmeel, S., Eriksson, A., Ahlberg, E., Sporre, M. K., Spanne, M., and Kristensson, A.: Ship plumes in the Baltic Sea Sulfur Emission Control Area: chemical characterization and contribution to coastal aerosol concentrations, Atmos. Chem. Phys., 20, 9135–9151, https://doi.org/10.5194/acp-20-9135-2020, 2020.
Bagoulla, C. and Guillotreau, P.: Maritime transport in the French economy and its impact on air pollution: An input-output analysis, Mar. Policy, 116, 103818, https://doi.org/10.1016/j.marpol.2020.103818, 2020.
Bai, C., Li, Y., Liu, B., Zhang, Z., and Wu, P.: Gaseous Emissions from a Seagoing Ship under Different Operating Conditions in the Coastal Region of China, Atmosphere, 11, 305, https://doi.org/10.3390/atmos11030305, 2020.
Borge, R., Jung, D., Lejarraga, I., de la Paz, D., and Cordero, J. M.: Assessment of the Madrid region air quality zoning based on mesoscale modelling and k-means clustering, Atmos. Environ., 287, 119258, https://doi.org/10.1016/j.atmosenv.2022.119258, 2022.
Briffa, J., Sinagra, E., and Blundell, R.: Heavy metal pollution in the environment and their toxicological effects on humans, Heliyon, 6, e04691, https://doi.org/10.1016/j.heliyon.2020.e04691, 2020.
Celik, S., Drewnick, F., Fachinger, F., Brooks, J., Darbyshire, E., Coe, H., Paris, J.-D., Eger, P. G., Schuladen, J., Tadic, I., Friedrich, N., Dienhart, D., Hottmann, B., Fischer, H., Crowley, J. N., Harder, H., and Borrmann, S.: Influence of vessel characteristics and atmospheric processes on the gas and particle phase of ship emission plumes: in situ measurements in the Mediterranean Sea and around the Arabian Peninsula, Atmos. Chem. Phys., 20, 4713–4734, https://doi.org/10.5194/acp-20-4713-2020, 2020.
Chazeau, B., Temime-Roussel, B., Gille, G., Mesbah, B., D'Anna, B., Wortham, H., and Marchand, N.: Measurement report: Fourteen months of real-time characterisation of the submicronic aerosol and its atmospheric dynamics at the Marseille–Longchamp supersite, Atmos. Chem. Phys., 21, 7293–7319, https://doi.org/10.5194/acp-21-7293-2021, 2021.
Chu-Van, T., Ristovski, Z., Pourkhesalian, A. M., Rainey, T., Garaniya, V., Abbassi, R., Jahangiri, S., Enshaei, H., Kam, U.-S., Kimball, R., Yang, L., Zare, A., Bartlett, H., and Brown, R. J.: On-board measurements of particle and gaseous emissions from a large cargo vessel at different operating conditions, Environ. Pollut., 237, 832–841, https://doi.org/10.1016/j.envpol.2017.11.008, 2018.
Contini, D. and Merico, E.: Recent Advances in Studying Air Quality and Health Effects of Shipping Emissions, Atmosphere, 12, 92, https://doi.org/10.3390/atmos12010092, 2021.
Corbett, J. J., Winebrake, J. J., Green, E. H., Kasibhatla, P., Eyring, V., and Lauer, A.: Mortality from Ship Emissions: A Global Assessment, Environ. Sci. Technol., 41, 8512–8518, https://doi.org/10.1021/es071686z, 2007.
Crippa, M., Janssens-Maenhout, G., Guizzardi, D., Van Dingenen, R., and Dentener, F.: Contribution and uncertainty of sectorial and regional emissions to regional and global PM2.5 health impacts, Atmos. Chem. Phys., 19, 5165–5186, https://doi.org/10.5194/acp-19-5165-2019, 2019.
DeWitt, H. L., Hellebust, S., Temime-Roussel, B., Ravier, S., Polo, L., Jacob, V., Buisson, C., Charron, A., André, M., Pasquier, A., Besombes, J. L., Jaffrezo, J. L., Wortham, H., and Marchand, N.: Near-highway aerosol and gas-phase measurements in a high-diesel environment, Atmos. Chem. Phys., 15, 4373–4387, https://doi.org/10.5194/acp-15-4373-2015, 2015.
Diesch, J.-M., Drewnick, F., Klimach, T., and Borrmann, S.: Investigation of gaseous and particulate emissions from various marine vessel types measured on the banks of the Elbe in Northern Germany, Atmos. Chem. Phys., 13, 3603–3618, https://doi.org/10.5194/acp-13-3603-2013, 2013.
Drinovec, L., Močnik, G., Zotter, P., Prévôt, A. S. H., Ruckstuhl, C., Coz, E., Rupakheti, M., Sciare, J., Müller, T., Wiedensohler, A., and Hansen, A. D. A.: The “dual-spot” Aethalometer: an improved measurement of aerosol black carbon with real-time loading compensation, Atmos. Meas. Tech., 8, 1965–1979, https://doi.org/10.5194/amt-8-1965-2015, 2015.
Eger, P., Mathes, T., Zavarsky, A., and Duester, L.: Measurement report: Inland ship emissions and their contribution to NOx and ultrafine particle concentrations at the Rhine, Atmos. Chem. Phys., 23, 8769–8788, https://doi.org/10.5194/acp-23-8769-2023, 2023.
EU: Directive (EU) 2016/802 of the European Parliament and of the Council of 11 May 2016 relating to a reduction in the sulphur content of certain liquid fuels (codification), OJ L, 132, https://eur-lex.europa.eu/eli/dir/2016/802/oj/eng (last access: 1 July 2024), 2016.
Eyring, V., Isaksen, I. S. A., Berntsen, T., Collins, W. J., Corbett, J. J., Endresen, O., Grainger, R. G., Moldanova, J., Schlager, H., and Stevenson, D. S.: Transport impacts on atmosphere and climate: Shipping, Atmos. Environ., 44, 4735–4771, https://doi.org/10.1016/j.atmosenv.2009.04.059, 2010.
Fink, L., Karl, M., Matthias, V., Oppo, S., Kranenburg, R., Kuenen, J., Jutterström, S., Moldanova, J., Majamäki, E., and Jalkanen, J.-P.: A multimodel evaluation of the potential impact of shipping on particle species in the Mediterranean Sea, Atmos. Chem. Phys., 23, 10163–10189, https://doi.org/10.5194/acp-23-10163-2023, 2023.
Fossum, K. N., Lin, C., O'Sullivan, N., Lei, L., Hellebust, S., Ceburnis, D., Afzal, A., Tremper, A., Green, D., Jain, S., Byčenkienė, S., O'Dowd, C., Wenger, J., and Ovadnevaite, J.: Two distinct ship emission profiles for organic-sulfate source apportionment of PM in sulfur emission control areas, Atmos. Chem. Phys., 24, 10815–10831, https://doi.org/10.5194/acp-24-10815-2024, 2024.
Fridell, E. and Salo, K.: Measurements of abatement of particles and exhaust gases in a marine gas scrubber, P. I. Mech. Eng. M-J. Eng., 230, 154–162, https://doi.org/10.1177/1475090214543716, 2016.
Fridell, E., Steen, E., and Peterson, K.: Primary particles in ship emissions, Atmos. Environ., 42, 1160–1168, https://doi.org/10.1016/j.atmosenv.2007.10.042, 2008.
Grigoriadis, A., Mamarikas, S., Ioannidis, I., Majamäki, E., Jalkanen, J.-P., and Ntziachristos, L.: Development of exhaust emission factors for vessels: A review and meta-analysis of available data, Atmospheric Environment: X, 12, 100142, https://doi.org/10.1016/j.aeaoa.2021.100142, 2021a.
Grigoriadis, A., Mamarikas, S., Ntziachristos, L., Majamäki, E., Jalkanen, J.-P., and Fridell, E.: SCIPPER PROJECT D4.1 – New set of emission factors and activity information, Aristotle University of Thessaloniki, Thessaloniki, Greece, 48 pp., https://www.scipper-project.eu/library/ (last access: 18 December 2023), 2021b.
Guo, Q., Hu, M., Guo, S., Wu, Z., Peng, J., and Wu, Y.: The variability in the relationship between black carbon and carbon monoxide over the eastern coast of China: BC aging during transport, Atmos. Chem. Phys., 17, 10395–10403, https://doi.org/10.5194/acp-17-10395-2017, 2017.
Gysel, N. R., Welch, W. A., Johnson, K., Miller, W., and Cocker, D. R. I.: Detailed Analysis of Criteria and Particle Emissions from a Very Large Crude Carrier Using a Novel ECA Fuel, Environ. Sci. Technol., 51, 1868–1875, https://doi.org/10.1021/acs.est.6b02577, 2017.
Huang, C., Hu, Q., Wang, H., Qiao, L., Jing, S., Wang, H., Zhou, M., Zhu, S., Ma, Y., Lou, S., Li, L., Tao, S., Li, Y., and Lou, D.: Emission factors of particulate and gaseous compounds from a large cargo vessel operated under real-world conditions, Environ. Pollut., 242, 667–674, https://doi.org/10.1016/j.envpol.2018.07.036, 2018.
IMO: Fourth IMO Greenhouse Gas Study, IMO, 581 pp., https://wwwcdn.imo.org/localresources/fr/MediaCentre/HotTopics/Documents/MEPC 75-7-15-Rapport final.pdf (last access: 10 July 2024), 2020.
IMO and Green Marine Associates: Clause-by-Clause analysis of MARPOL Annex VI, IMO, 19 pp., https://greenvoyage2050.imo.org/wp-content/uploads/2022/09/Clause-by-clause-analysis-of-2021-Revised-MARPOL-Annex-VI-EN_Final-min.pdf (last access: 11 October 2023), 2021.
INSEE (Ed.): Tables of the French economy, 2020th edn., INSEE, Paris, 266 pp., https://www.insee.fr/fr/statistiques/fichier/4318291/TEF2020.pdf (last access: 11 October 2023), 2020.
Jeong, H., Park, M., Hwang, W., Kim, E., and Han, M.: The effect of calm conditions and wind intervals in low wind speed on atmospheric dispersion factors, Ann. Nucl. Energy, 55, 230–237, https://doi.org/10.1016/j.anucene.2012.12.018, 2013.
Jeong, S., Bendl, J., Saraji-Bozorgzad, M., Käfer, U., Etzien, U., Schade, J., Bauer, M., Jakobi, G., Orasche, J., Fisch, K., Cwierz, P. P., Rüger, C. P., Czech, H., Karg, E., Heyen, G., Krausnick, M., Geissler, A., Geipel, C., Streibel, T., Schnelle-Kreis, J., Sklorz, M., Schulz-Bull, D. E., Buchholz, B., Adam, T., and Zimmermann, R.: Aerosol emissions from a marine diesel engine running on different fuels and effects of exhaust gas cleaning measures, Environ. Pollut., 316, 120526, https://doi.org/10.1016/j.envpol.2022.120526, 2023.
Ježek, I., Drinovec, L., Ferrero, L., Carriero, M., and Močnik, G.: Determination of car on-road black carbon and particle number emission factors and comparison between mobile and stationary measurements, Atmos. Meas. Tech., 8, 43–55, https://doi.org/10.5194/amt-8-43-2015, 2015.
Jiang, H., Peng, D., Wang, Y., and Fu, M.: Comparison of Inland Ship Emission Results from a Real-World Test and an AIS-Based Model, Atmosphere, 12, 1611, https://doi.org/10.3390/atmos12121611, 2021.
Johansson, L., Jalkanen, J.-P., and Kukkonen, J.: Global assessment of shipping emissions in 2015 on a high spatial and temporal resolution, Atmos. Environ., 167, 403–415, https://doi.org/10.1016/j.atmosenv.2017.08.042, 2017.
Karl, M., Ramacher, M. O. P., Oppo, S., Lanzi, L., Majamäki, E., Jalkanen, J.-P., Lanzafame, G. M., Temime-Roussel, B., Le Berre, L., and D'Anna, B.: Measurement and Modeling of Ship-Related Ultrafine Particles and Secondary Organic Aerosols in a Mediterranean Port City, Toxics, 11, 771, https://doi.org/10.3390/toxics11090771, 2023.
Kiihamäki, S.-P., Korhonen, M., Kukkonen, J., Shiue, I., and Jaakkola, J. J. K.: Effects of ambient air pollution from shipping on mortality: A systematic review, Sci. Total Environ., 945, 173714, https://doi.org/10.1016/j.scitotenv.2024.173714, 2024.
Knudsen, B., Lallana, A. L., and Ledermann, L.: NOx emission from ships in Danish waters: assessment of current emission levels and potential enforcement models, Danish Environmental Protection Agency, Odense, Denmark, 46 pp., ISBN 978-87-7038-384-4, https://www2.mst.dk/Udgiv/publications/2022/01/978-87-7038-384-4.pdf (last access: 2 December 2022), 2022.
Krause, K., Wittrock, F., Richter, A., Busch, D., Bergen, A., Burrows, J. P., Freitag, S., and Halbherr, O.: Determination of NOx emission rates of inland ships from onshore measurements, Atmos. Meas. Tech., 16, 1767–1787, https://doi.org/10.5194/amt-16-1767-2023, 2023.
Kuittinen, N., Jalkanen, J.-P., Alanen, J., Ntziachristos, L., Hannuniemi, H., Johansson, L., Karjalainen, P., Saukko, E., Isotalo, M., Aakko-Saksa, P., Lehtoranta, K., Keskinen, J., Simonen, P., Saarikoski, S., Asmi, E., Laurila, T., Hillamo, R., Mylläri, F., Lihavainen, H., Timonen, H., and Rönkkö, T.: Shipping Remains a Globally Significant Source of Anthropogenic PN Emissions Even after 2020 Sulfur Regulation, Environ. Sci. Technol., 55, 129–138, https://doi.org/10.1021/acs.est.0c03627, 2021.
Kuittinen, N., Timonen, H., Karjalainen, P., Murtonen, T., Vesala, H., Bloss, M., Honkanen, M., Lehtoranta, K., Aakko-Saksa, P., and Rönkkö, T.: In-depth characterization of exhaust particles performed on-board a modern cruise ship applying a scrubber, Sci. Total Environ., 946, 174052, https://doi.org/10.1016/j.scitotenv.2024.174052, 2024.
Lack, D. A. and Corbett, J. J.: Black carbon from ships: a review of the effects of ship speed, fuel quality and exhaust gas scrubbing, Atmos. Chem. Phys., 12, 3985–4000, https://doi.org/10.5194/acp-12-3985-2012, 2012.
Lack, D. A., Corbett, J. J., Onasch, T., Lerner, B., Massoli, P., Quinn, P. K., Bates, T. S., Covert, D. S., Coffman, D., Sierau, B., Herndon, S., Allan, J., Baynard, T., Lovejoy, E., Ravishankara, A. R., and Williams, E.: Particulate emissions from commercial shipping: Chemical, physical, and optical properties, J. Geophys. Res.-Atmos., 114, D00F04, https://doi.org/10.1029/2008JD011300, 2009.
Lanzafame, G. M., Le Berre, L., Temime-Rousell, B., D'Anna, B., Simonen, P., Dal Maso, M., Hallquist, Å. M., and Mellqvist, J.: SCIPPER PROJECT D3.4 – Shipping Contributions to Inland Pollution Push for the Enforcement of Regulations, Aristotle University of Thessaloniki, Thessaloniki, Greece, 35 pp., https://www.scipper-project.eu/library/ (last access: 18 December 2023), 2022.
Le Berre, L., Temime-Roussel, B., Lanzafame, G. M., D'Anna, B., Marchand, N., Sauvage, S., Dufresne, M., Tinel, L., Leonardis, T., Ferreira de Brito, J., Armengaud, A., Gille, G., Lanzi, L., Bourjot, R., and Wortham, H.: Time series of high temporal resolution observations of atmospheric pollutants in a Mediterranean port in June 2021, EaSy Data [data set], https://doi.org/10.57932/90ffebbe-94c3-4356-a073-78ec9e014b1d, 2024.
Ledoux, F., Roche, C., Cazier, F., Beaugard, C., and Courcot, D.: Influence of ship emissions on NOx, SO2, O3 and PM concentrations in a North-Sea harbor in France, J. Environ. Sci., 71, 56–66, https://doi.org/10.1016/j.jes.2018.03.030, 2018.
Lehtoranta, K., Aakko-Saksa, P., Murtonen, T., Vesala, H., Kuittinen, N., Rönkkö, T., Ntziachristos, L., Karjalainen, P., Timonen, H., and Teinilä, K.: Particle and Gaseous Emissions from Marine Engines Utilizing Various Fuels and Aftertreatment Systems: 29th CIMAC World Congress on Combustion Engine, in: CIMAC Technical Paper Database, CIMAC CONGRESS 19, Vancouver, 14, https://www.cimac.com/publications/technical-database/index.html (last access: 16 April 2024), 2019.
Li, Y., Ren, H., and Li, H.: PyVT: A toolkit for preprocessing and analysis of vessel spatio-temporal trajectories, SoftwareX, 21, 101316, https://doi.org/10.1016/j.softx.2023.101316, 2023.
Liu, H., Fu, M., Jin, X., Shang, Y., Shindell, D., Faluvegi, G., Shindell, C., and He, K.: Health and climate impacts of ocean-going vessels in East Asia, Nat. Clim. Change, 6, 1037–1041, https://doi.org/10.1038/nclimate3083, 2016.
Liu, Z., Chen, Y., Zhang, Y., Zhang, F., Feng, Y., Zheng, M., Li, Q., and Chen, J.: Emission Characteristics and Formation Pathways of Intermediate Volatile Organic Compounds from Ocean-Going Vessels: Comparison of Engine Conditions and Fuel Types, Environ. Sci. Technol., 56, 12917–12925, https://doi.org/10.1021/acs.est.2c03589, 2022.
MarineTraffic: Density Maps, https://www.marinetraffic.com/en/ais/home/centerx:5.1/centery:43.3/zoom:11, last access: 31 December 2022.
Marmett, B., Carvalho, R. B., Silva, G. N. da, Dorneles, G. P., Romão, P. R. T., Nunes, R. B., and Rhoden, C. R.: The role of O3 exposure and physical activity status on redox state, inflammation, and pulmonary toxicity of young men: A cross-sectional study, Environ. Res., 231, 116020, https://doi.org/10.1016/j.envres.2023.116020, 2023.
Marques, B., Kostenidou, E., Valiente, A. M., Vansevenant, B., Sarica, T., Fine, L., Temime-Roussel, B., Tassel, P., Perret, P., Liu, Y., Sartelet, K., Ferronato, C., and D'Anna, B.: Detailed Speciation of Non-Methane Volatile Organic Compounds in Exhaust Emissions from Diesel and Gasoline Euro 5 Vehicles Using Online and Offline Measurements, Toxics, 10, 184, https://doi.org/10.3390/toxics10040184, 2022.
Marseille Fos Port: GPMM ship calls dataset: 2018–2021, Marseille Fos Port [data set], 2022.
Marseille Fos Port: Annual report 2022, Marseille Fos Port, Marseille, 11 pp., https://www.marseille-port.fr/sites/default/files/2023-09/RA_2022.pdf (last access: 11 October 2023), 2023.
Martin, N. A., Ferracci, V., Cassidy, N., and Hoffnagle, J. A.: The application of a cavity ring-down spectrometer to measurements of ambient ammonia using traceable primary standard gas mixtures, Appl. Phys. B, 122, 219, https://doi.org/10.1007/s00340-016-6486-9, 2016.
McCaffery, C., Zhu, H., Karavalakis, G., Durbin, T. D., Miller, J. W., and Johnson, K. C.: Sources of air pollutants from a Tier 2 ocean-going container vessel: Main engine, auxiliary engine, and auxiliary boiler, Atmos. Environ., 245, 118023, https://doi.org/10.1016/j.atmosenv.2020.118023, 2021.
Mueller, N., Westerby, M., and Nieuwenhuijsen, M.: Health impact assessments of shipping and port-sourced air pollution on a global scale: A scoping literature review, Environ. Res., 216, 114460, https://doi.org/10.1016/j.envres.2022.114460, 2023.
Oeder, S., Kanashova, T., Sippula, O., Sapcariu, S. C., Streibel, T., Arteaga-Salas, J. M., Passig, J., Dilger, M., Paur, H.-R., Schlager, C., Mülhopt, S., Diabaté, S., Weiss, C., Stengel, B., Rabe, R., Harndorf, H., Torvela, T., Jokiniemi, J. K., Hirvonen, M.-R., Schmidt-Weber, C., Traidl-Hoffmann, C., BéruBé, K. A., Wlodarczyk, A. J., Prytherch, Z., Michalke, B., Krebs, T., Prévôt, A. S. H., Kelbg, M., Tiggesbäumker, J., Karg, E., Jakobi, G., Scholtes, S., Schnelle-Kreis, J., Lintelmann, J., Matuschek, G., Sklorz, M., Klingbeil, S., Orasche, J., Richthammer, P., Müller, L., Elsasser, M., Reda, A., Gröger, T., Weggler, B., Schwemer, T., Czech, H., Rüger, C. P., Abbaszade, G., Radischat, C., Hiller, K., Buters, J. T. M., Dittmar, G., and Zimmermann, R.: Particulate Matter from Both Heavy Fuel Oil and Diesel Fuel Shipping Emissions Show Strong Biological Effects on Human Lung Cells at Realistic and Comparable In Vitro Exposure Conditions, PLOS ONE, 10, e0126536, https://doi.org/10.1371/journal.pone.0126536, 2015.
Pandolfi, M., Gonzalez-Castanedo, Y., Alastuey, A., de la Rosa, J. D., Mantilla, E., de la Campa, A. S., Querol, X., Pey, J., Amato, F., and Moreno, T.: Source apportionment of PM10 and PM2.5 at multiple sites in the strait of Gibraltar by PMF: impact of shipping emissions, Environ. Sci. Pollut. Res., 18, 260–269, https://doi.org/10.1007/s11356-010-0373-4, 2011.
Peng, W., Yang, J., Corbin, J., Trivanovic, U., Lobo, P., Kirchen, P., Rogak, S., Gagné, S., Miller, J. W., and Cocker, D.: Comprehensive analysis of the air quality impacts of switching a marine vessel from diesel fuel to natural gas, Environ. Pollut., 266, 115404, https://doi.org/10.1016/j.envpol.2020.115404, 2020.
Pérez, N., Pey, J., Reche, C., Cortés, J., Alastuey, A., and Querol, X.: Impact of harbour emissions on ambient PM10 and PM2.5 in Barcelona (Spain): Evidences of secondary aerosol formation within the urban area, Sci. Total Environ., 571, 237–250, https://doi.org/10.1016/j.scitotenv.2016.07.025, 2016.
Petzold, A. and Schönlinner, M.: Multi-angle absorption photometry – a new method for the measurement of aerosol light absorption and atmospheric black carbon, J. Aerosol Sci., 35, 421–441, https://doi.org/10.1016/j.jaerosci.2003.09.005, 2004.
Petzold, A., Lauer, P., Fritsche, U., Hasselbach, J., Lichtenstern, M., Schlager, H., and Fleischer, F.: Operation of Marine Diesel Engines on Biogenic Fuels: Modification of Emissions and Resulting Climate Effects, Environ. Sci. Technol., 45, 10394–10400, https://doi.org/10.1021/es2021439, 2011.
Pirjola, L., Pajunoja, A., Walden, J., Jalkanen, J.-P., Rönkkö, T., Kousa, A., and Koskentalo, T.: Mobile measurements of ship emissions in two harbour areas in Finland, Atmos. Meas. Tech., 7, 149–161, https://doi.org/10.5194/amt-7-149-2014, 2014.
Rakesh, P. T., Venkatesan, R., Srinivas, C. V., Baskaran, R., and Venkatraman, B.: Performance evaluation of modified Gaussian and Lagrangian models under low wind speed: A case study, Ann. Nucl. Energy, 133, 562–567, https://doi.org/10.1016/j.anucene.2019.07.010, 2019.
Rönkkö, T., Saarikoski, S., Kuittinen, N., Karjalainen, P., Keskinen, H., Järvinen, A., Mylläri, F., Aakko-Saksa, P., and Timonen, H.: Review of black carbon emission factors from different anthropogenic sources, Environ. Res. Lett., 18, 033004, https://doi.org/10.1088/1748-9326/acbb1b, 2023.
Russo, M. A., Leitão, J., Gama, C., Ferreira, J., and Monteiro, A.: Shipping emissions over Europe: A state-of-the-art and comparative analysis, Atmos. Environ., 177, 187–194, https://doi.org/10.1016/j.atmosenv.2018.01.025, 2018.
Ryder, O. S., DeWinter, J. L., Brown, S. G., Hoffman, K., Frey, B., and Mirzakhalili, A.: Assessment of particulate toxic metals at an Environmental Justice community, Atmospheric Environment: X, 6, 100070, https://doi.org/10.1016/j.aeaoa.2020.100070, 2020.
Serra, P. and Fancello, G.: Towards the IMO's GHG Goals: A Critical Overview of the Perspectives and Challenges of the Main Options for Decarbonizing International Shipping, Sustainability, 12, 3220, https://doi.org/10.3390/su12083220, 2020.
Sinha, P., Hobbs, P. V., Yokelson, R. J., Christian, T. J., Kirchstetter, T. W., and Bruintjes, R.: Emissions of trace gases and particles from two ships in the southern Atlantic Ocean, Atmos. Environ., 37, 2139–2148, https://doi.org/10.1016/S1352-2310(03)00080-3, 2003.
Sorte, S., Rodrigues, V., Borrego, C., and Monteiro, A.: Impact of harbour activities on local air quality: A review, Environ. Pollut., 257, 113542, https://doi.org/10.1016/j.envpol.2019.113542, 2020.
Sugrue, R. A., Preble, C. V., Tarplin, A. G., and Kirchstetter, T. W.: In-Use Passenger Vessel Emission Rates of Black Carbon and Nitrogen Oxides, Environ. Sci. Technol., 56, 7679–7686, https://doi.org/10.1021/acs.est.2c00435, 2022.
Taketani, F., Miyakawa, T., Takigawa, M., Yamaguchi, M., Komazaki, Y., Mordovskoi, P., Takashima, H., Zhu, C., Nishino, S., Tohjima, Y., and Kanaya, Y.: Characteristics of atmospheric black carbon and other aerosol particles over the Arctic Ocean in early autumn 2016: Influence from biomass burning as assessed with observed microphysical properties and model simulations, Sci. Total Environ., 848, 157671, https://doi.org/10.1016/j.scitotenv.2022.157671, 2022.
Teinilä, K., Aakko-Saksa, P., Jalkanen, J.-P., Karjalainen, P., Bloss, M., Laakia, J., Saarikoski, S., Vesala, H., Pettinen, R., Koponen, P., Kuittinen, N., Piimäkorpi, P., and Timonen, H.: Effect of aftertreatment on ship particulate and gaseous components at ship exhaust, VTT Technical Research Centre of Finland, https://cris.vtt.fi/en/publications/effect-of-aftertreatment-on-ship-particulate-and-gaseous-componen (last access: 16 April 2024), 2018.
Timonen, H., Aakko-Saksa, P., Kuittinen, N., Karjalainen, P., Murtonen, T., Lehtoranta, K., Vesala, H., Bloss, M., Saarikoski, S., Koponen, P., Piimäkorpi, P., and Rönkkö, T.: Black carbon measurement validation onboard (SEAEFFECTS BC WP2), VTT Technical Research Centre of Finland, https://cris.vtt.fi/en/publications/black-carbon-measurement-validation-onboard-seaeffects-bc-wp2 (last access: 16 April 2024), 2017.
Timonen, H., Teinilä, K., Barreira, L. M. F., Saarikoski, S., Simonen, P., Dal Maso, M., Keskinen, J., Kalliokoski, J., Moldonova, J., Salberg, H., Merelli, L., D'Anna, B., Temime-Roussel, B., Lanzafame, G. M., Mellqvist, J., Keskinen, J., Weisheit, J., and Fridell, E.: SCIPPER PROJECT D3.3 – Ship on-board emissions characterisation, Aristotle University of Thessaloniki, Thessaloniki, https://www.scipper-project.eu/library/ (last access: 22 April 2024), Greece, 2022.
Toscano, D.: The Impact of Shipping on Air Quality in the Port Cities of the Mediterranean Area: A Review, Atmosphere, 14, 1180, https://doi.org/10.3390/atmos14071180, 2023.
Toscano, D. and Murena, F.: Atmospheric ship emissions in ports: A review. Correlation with data of ship traffic, Atmospheric Environment: X, 4, 100050, https://doi.org/10.1016/j.aeaoa.2019.100050, 2019.
Toscano, D., Murena, F., Quaranta, F., and Mocerino, L.: Impact of ship emissions at a high receptor point in the port of Naples, Atmos. Environ., 286, 119253, https://doi.org/10.1016/j.atmosenv.2022.119253, 2022.
Tremper, A. H., Font, A., Priestman, M., Hamad, S. H., Chung, T.-C., Pribadi, A., Brown, R. J. C., Goddard, S. L., Grassineau, N., Petterson, K., Kelly, F. J., and Green, D. C.: Field and laboratory evaluation of a high time resolution x-ray fluorescence instrument for determining the elemental composition of ambient aerosols, Atmos. Meas. Tech., 11, 3541–3557, https://doi.org/10.5194/amt-11-3541-2018, 2018.
UNCTAD: Review of Maritime Transport 2023: Towards a Green and Just Transition, United Nations, https://doi.org/10.18356/9789213584569, 2023.
UNEP/MAP: Report of the 22nd Ordinary Meeting of the Contracting Parties to the Convention for the Protection of the Marine Environment and the Coastal Region of the Mediterranean and its Protocols, COP22, Antalya, Turkey, 987, https://www.unep.org/unepmap/meetings/cop-decisions/cop22-outcome-documents (last access: 12 May 2024), 2021.
Uria-Tellaetxe, I. and Carslaw, D. C.: Conditional bivariate probability function for source identification, Environ. Modell. Softw., 59, 1–9, https://doi.org/10.1016/j.envsoft.2014.05.002, 2014.
Van Roy, W., Van Nieuwenhove, A., Scheldeman, K., Van Roozendael, B., Schallier, R., Mellqvist, J., and Maes, F.: Measurement of Sulfur-Dioxide Emissions from Ocean-Going Vessels in Belgium Using Novel Techniques, Atmosphere, 13, 1756, https://doi.org/10.3390/atmos13111756, 2022.
Viana, M., Amato, F., Alastuey, A., Querol, X., Moreno, T., García Dos Santos, S., Herce, M. D., and Fernández-Patier, R.: Chemical Tracers of Particulate Emissions from Commercial Shipping, Environ. Sci. Technol., 43, 7472–7477, https://doi.org/10.1021/es901558t, 2009.
Viana, M., Rizza, V., Tobías, A., Carr, E., Corbett, J., Sofiev, M., Karanasiou, A., Buonanno, G., and Fann, N.: Estimated health impacts from maritime transport in the Mediterranean region and benefits from the use of cleaner fuels, Environ. Int., 138, 105670, https://doi.org/10.1016/j.envint.2020.105670, 2020.
WHO: WHO global air quality guidelines: particulate matter (PM2.5 and PM10), ozone, nitrogen dioxide, sulfur dioxide and carbon monoxide, WHO European Centre for Environment and Health, Bonn, Germany, ISBN 978-92-4-003422-8, https://www.who.int/publications/i/item/9789240034228 (last access: 7 September 2024), 2021.
Winnes, H., Fridell, E., and Moldanová, J.: Effects of Marine Exhaust Gas Scrubbers on Gas and Particle Emissions, Journal of Marine Science and Engineering, 8, 299, https://doi.org/10.3390/jmse8040299, 2020.
Wu, S.-P., Cai, M.-J., Xu, C., Zhang, N., Zhou, J.-B., Yan, J.-P., Schwab, J. J., and Yuan, C.-S.: Chemical nature of PM2.5 and PM10 in the coastal urban Xiamen, China: Insights into the impacts of shipping emissions and health risk, Atmos. Environ., 227, 117383, https://doi.org/10.1016/j.atmosenv.2020.117383, 2020.
Xiao, Q., Li, M., Liu, H., Fu, M., Deng, F., Lv, Z., Man, H., Jin, X., Liu, S., and He, K.: Characteristics of marine shipping emissions at berth: profiles for particulate matter and volatile organic compounds, Atmos. Chem. Phys., 18, 9527–9545, https://doi.org/10.5194/acp-18-9527-2018, 2018.
Yang, N., Deng, X., Liu, B., Li, L., Li, Y., Li, P., Tang, M., and Wu, L.: Combustion Performance and Emission Characteristics of Marine Engine Burning with Different Biodiesel, Energies, 15, 5177, https://doi.org/10.3390/en15145177, 2022.
Yu, G., Zhang, Y., Yang, F., He, B., Zhang, C., Zou, Z., Yang, X., Li, N., and Chen, J.: Dynamic Ratio in the Ship-Emitted Particles Driven by Multiphase Fuel Oil Regulations in Coastal China, Environ. Sci. Technol., 55, 15031–15039, https://doi.org/10.1021/acs.est.1c02612, 2021.
Zetterdahl, M., Moldanová, J., Pei, X., Pathak, R. K., and Demirdjian, B.: Impact of the 0.1 % fuel sulfur content limit in SECA on particle and gaseous emissions from marine vessels, Atmos. Environ., 145, 338–345, https://doi.org/10.1016/j.atmosenv.2016.09.022, 2016.
Zhang, Q., Jimenez, J. L., Worsnop, D. R., and Canagaratna, M.: A Case Study of Urban Particle Acidity and Its Influence on Secondary Organic Aerosol, Environ. Sci. Technol., 41, 3213–3219, https://doi.org/10.1021/es061812j, 2007.
Zhang, Y., Eastham, S. D., Lau, A. K., Fung, J. C., and Selin, N. E.: Global air quality and health impacts of domestic and international shipping, Environ. Res. Lett., 16, 084055, https://doi.org/10.1088/1748-9326/ac146b, 2021.
Zhao, J., Zhang, Y., Yang, Z., Liu, Y., Peng, S., Hong, N., Hu, J., Wang, T., and Mao, H.: A comprehensive study of particulate and gaseous emissions characterization from an ocean-going cargo vessel under different operating conditions, Atmos. Environ., 223, 117286, https://doi.org/10.1016/j.atmosenv.2020.117286, 2020.
Zhou, X., Gao, J., Wang, T., Wu, W., and Wang, W.: Measurement of black carbon aerosols near two Chinese megacities and the implications for improving emission inventories, Atmos. Environ., 43, 3918–3924, https://doi.org/10.1016/j.atmosenv.2009.04.062, 2009.