the Creative Commons Attribution 4.0 License.
the Creative Commons Attribution 4.0 License.
 | 24 Jun 2025
Sources and trends of black carbon aerosol in the megacity of Nanjing, eastern China, after the China Clean Action Plan and Three-Year Action Plan
Abudurexiati Abulimiti
Yanlin Zhang
Mingyuan Yu
Yihang Hong
Yu-Chi Lin
Chaman Gul
Fang Cao
Black carbon (BC) is an essential component of particulate matter (PM), with a significant impact on climate change. Few studies have investigated the long-term changes in BC and its sources, particularly considering primary emissions of BC, which is crucial for developing effective mitigation strategies. Here, 3-year BC observations (2019–2021) are reported in Nanjing, a polluted city in the Yangtze River Delta (YRD) region, eastern China. The results revealed that the average BC concentration was 2.5 ± 1.6 µg m−3, peaking in winter, with approximately 80 % attributed to liquid fuel combustion. Based on 3-year monitoring data, the random forest (RF) algorithm was employed to reconstruct BC concentrations in Nanjing from 2014 to 2021. Source apportionment was conducted on the reconstructed time series, which revealed a significant decrease (p < 0.05) in BC levels over the 8-year period, primarily due to reduced emissions from liquid fuels. Compared to the earlier control policy period (P1: 2013–2017), BC concentrations declined more steeply after 2018 (P2) due to reduced solid fuel burning. The seasonal analysis indicated significant reductions (p < 0.05) in BC, BCliquid (black carbon from liquid fuel combustion) and BCsolid (black carbon from solid fuel combustion) during winter, with BCliquid accounting for 77 % of the reduction. Overall, emission reduction was the dominant factor in lowering BC levels, contributing between 62 % and 86 %, though meteorological conditions played an increasingly important role in P2, particularly for BC and BCliquid. Our results demonstrate that targeted control measures for liquid fuel combustion are necessary, as it is a major driver of BC reduction, and highlight the non-negligible influence of meteorological factors on long-term BC variations.
- Article
(3392 KB) - Full-text XML
-
Supplement
(1290 KB) - BibTeX
- EndNote


Black carbon (BC), also known as elemental carbon (EC), is a carbonaceous component of particulate matter (PM) produced through incomplete combustion processes, including domestic cooking, heating and coke making (Bond et al., 2013; Liu et al., 2020a). BC particles significantly influence the Earth's energy balance and are major contributors to global warming due to their strong absorption of solar radiation across visible–infrared wavelengths (Ramanathan and Carmichael, 2008; IPCC, 2023). Additionally, the presence of BC particles in the atmosphere reduces atmospheric visibility and causes air quality to deteriorate, especially in urban areas, due to their significant absorption properties (Ding et al., 2016). Exposure to BC aerosols has also been linked to increased health risks, such as heart attacks and cardiovascular diseases (Sarigiannis et al., 2015; Li et al., 2019). Owing to BC's short atmospheric lifetime of only 3 to 14 d, much shorter than that of greenhouse gases, which can persist for decades, reducing BC emissions can quickly mitigate global warming and benefit human health.
Accurate quantification of BC from different sources is essential to propose efficient mitigation strategies. Various methods in the past have been applied to BC source apportionment, including emission inventories (Zhu et al., 2020), radiocarbon isotope analysis (Zhang et al., 2014; Yu et al., 2023), and receptor models (Zong et al., 2016). However, uncertainties arise due to a lack of reliable emission factors, and receptor models require additional aerosol composition data. The radiocarbon source apportionment method is limited by its low temporal resolution, which hinders its ability to capture the dynamic changes in BC sources. In contrast, the Aethalometer model, with its high temporal resolution and rapid analysis, has been widely adopted for quantifying BC derived from liquid fuel (BCliquid) and solid fuel (BCsolid) combustion (Lin et al., 2021; Sandradewi et al., 2008; Helin et al., 2018).
To address the severe air pollution issue, the Chinese government implemented the “China Clean Action Plan” during 2013–2017 and the “Three-Year Action Plan” during 2018–2020. Several studies in recent years have focused on long-term BC mass concentrations in major cities or regions of China to evaluate the impact of emission reduction measures implemented by the Chinese government (Sun et al., 2022a; He et al., 2023). However, while most of these studies document changes in BC concentrations, few have explored the specific contributions of different BC sources. Such an understanding is essential for identifying the drivers behind observed changes and for developing targeted mitigation strategies. Moreover, comprehensive datasets of BC are crucial for a better understanding of BC mass concentration variations and their implications for air quality policy. However, newly established monitoring stations often lack sufficient long-term observations, making it difficult to evaluate historical variations in BC concentrations. This limitation hinders efforts to understand BC dynamics in regions with limited prior monitoring, ultimately complicating the formulation of effective emission reduction policies. Chemical transport models (CTMs), which integrate meteorological conditions and emission inventories, are effective in simulating near-surface BC concentrations over short-term periods (Cheng et al., 2019; Zhou et al., 2023). Nonetheless, their computational intensity and time-consuming nature often limit their application to long-term simulation. In contrast, the prediction of PM or other air pollutants can be efficiently achieved through statistical models that establish relationships between measured values and various variables, including co-emitted pollutants, air humidity and air temperature. Recently, the historical values of nitrate δ15N and PM2.5 have been accurately reproduced based on the statistical relationships established between measured variables and other influencing factors (Fan et al., 2023; Zhao et al., 2020; Wu et al., 2024). This method provides a relatively straightforward approach for simulating historical air pollutants and is accurate enough for examining their long-term variations.
The long-term variation in atmospheric aerosol composition can be attributed to both meteorological conditions and emissions. CTMs are one of the often-used tools to quantify the impact of meteorology and emission on aerosols, as they consider the physical and chemical processes that air pollutants undergo during their time in the atmosphere (Li et al., 2023; Zhang et al., 2019; Du et al., 2022). However, the accuracy of CTMs is often constrained by their initial conditions and the uncertainty in emission inventories as well as in models' underlying assumptions. Another commonly used method for separating the influences of meteorology and emissions on target atmospheric pollutants is the Kolmogorov–Zurbenko (KZ) filter. For example, Sun et al. (2022b) found that the meteorological contribution to the PM2.5 trend presented a distinct spatial pattern over the Twain-Hu Basin, with northern positive rates up to 61 % and southern negative rates down to −25 %. Chen et al. (2019) reported that anthropogenic emissions contributed to 80 % of reduction in PM2.5 in Beijing from 2013 to 2017. Compared to CTMs, the KZ filter is easier to operate and is suitable for long-term datasets of air pollutants, making it a practical tool for analyzing trends in atmospheric pollutants.
In the present study, a 3-year BC mass concentration measurement was conducted to clarify BC characteristics and quantify contributions from different sources. The measured BC values at two wavelengths (370 and 880 nm) were used in a random forest model to establish the nonlinear relationships with predictor variables, such as air pollutants and meteorological factors. Historical BC concentrations at the two wavelengths were reconstructed from 2014–2021 using the trained models to investigate the long-term temporal variation in BC and sources, with a focus on the two distinct emission reduction periods: the China Clean Action Plan and the Three-Year Action Plan. Finally, the impacts of meteorology and emissions on the long-term trend of BC were quantified to provide deeper insights into the factors driving its historical changes.
2.1 Sampling site and data
Nanjing is located in the eastern part of China and is a vital industrial and economic center. The sampling instrument used for monitoring BC mass concentration was positioned on the rooftop of a seven-story building at the campus of the Nanjing University of Information Science and Technology (NUSIT; 32.21° N, 118.72° E; Fig. S1 in the Supplement), Nanjing, China. The sampling site represents a typical urban atmosphere, encircled by local roads with an expressway approximately 1 km away. Moreover, a steel manufacturing plant and a petroleum chemical factory were about 5 km away from the sampling site. Traffic and industrial emissions are the primary sources of air pollution at the sampling site. Nanjing experiences four dominant seasons each year: winter (December–February), spring (March–May), summer (June–August) and autumn (September–November).
A dual-spot Aethalometer (AE33, Magee Scientific) was used to measure BC mass concentration from January 2019 to December 2021. The flow rate of AE33 was set to 5 L min−1, and the inlet cutoff size was 2.5 µm throughout the entire period. In brief, aerosol particles were collected on a filter tape automatically, and light attenuations (ATNs) were measured in seven distinct spectral regions (370, 470, 520, 590, 660, 880, 950 nm) with a time resolution of 1 min. The ATNs were then converted to BC mass concentrations with seven different mass absorption cross sections (18.47, 14.54, 13.14, 11.58, 10.35, 7.77, 7.19 m2 g−1). In this study the BC concentration calculated by the 880 nm spectral region was used, as BC is the predominant absorber at this wavelength (Drinovec et al., 2015). The BC data were missing due to instrument maintenance from 13 to 31 July 2020 and from 23 July to 26 September 2021. Hourly averaged concentrations of PM2.5, carbon monoxide (CO), sulfur dioxide (SO2) and nitrogen dioxide (NO2) were obtained from the China National Air Quality Monitoring Station, located approximately 10 km from the sampling site. Hourly resolution meteorological data, including temperature (T), relative humidity (RH), wind speed (WS), wind direction (WD) and boundary layer height (BLH), were sourced from the ERA5 reanalysis datasets provided by the European Centre for Medium-Range Weather Forecasts (ECMWF).
2.2 Aethalometer measurements and source apportionment
The absorption Ångström exponent (AAE) describes the spectral dependence of BC and is determined through a power-law fit between light absorption (babs(λ)) and seven wavelengths; the equation can be written as
where β is a constant dependent on aerosol mass concentration and size distribution. Subsequently, the Aethalometer model is utilized to quantify the contribution of liquid and solid fuels to BC. The model assumes that ambient BC primarily originates from liquid fuel and solid fuel combustion, with BC from two distinct combustion sources having differing light absorption spectra. Hence, the total light absorption at 880 nm is attributed to liquid-fuel-generated BC (BCliquid) and solid-fuel-derived BC (BCsolid). The relationships between babs(λ), λ and AAE can thus be expressed as follows:
where AAEliquid and AAEsoild are the AAE values of BC from liquid and solid fuel combustion and λ1 and λ2 are different wavelengths. The selection of wavelengths can impact source apportionment results. Considering that brown carbon exhibits strong absorption at 370 nm and that BC source apportionments at 470 and 950 nm are more consistent with using radiocarbon techniques (Zotter et al., 2017), the absorptions at 470 and 950 nm were ultimately chosen for source apportionment. Moreover, the source apportionment results of the Aethalometer model highly depend on the selection of AAE pairs, with the value of AAE being determined by the type of biomass, combustion processes and long-range transport conditions (Gul et al., 2021). The effect of different AAE values on the results is discussed in Sect. 3.3.2 (“Source diagnostic tracers”). Combining Eqs. (2)–(4), we can obtain the contribution of solid fuel combustion (BB %) to total BC:
Then, BCsolid can be obtained as follows:
Finally, BCliquid can be calculated as
2.3 Building the random forest model and tuning hyperparameters
The random forest (RF) machine learning algorithm is utilized to reproduce historical time series data of BC. RF, a model comprising hundreds of decision trees, splits data based on informative features to avoid overfitting. However, decision trees can easily overfit, resulting in inaccurate model predictions. RF selects random samples of observation data for each decision tree, a common problem in decision trees, using random data samples for each tree. The RF algorithm has been effectively applied in atmospheric chemistry studies for predicting PM10 and organic carbon (OC) in different regions (Grange et al., 2018; Qin et al., 2022), demonstrating its strong predictive capabilities.
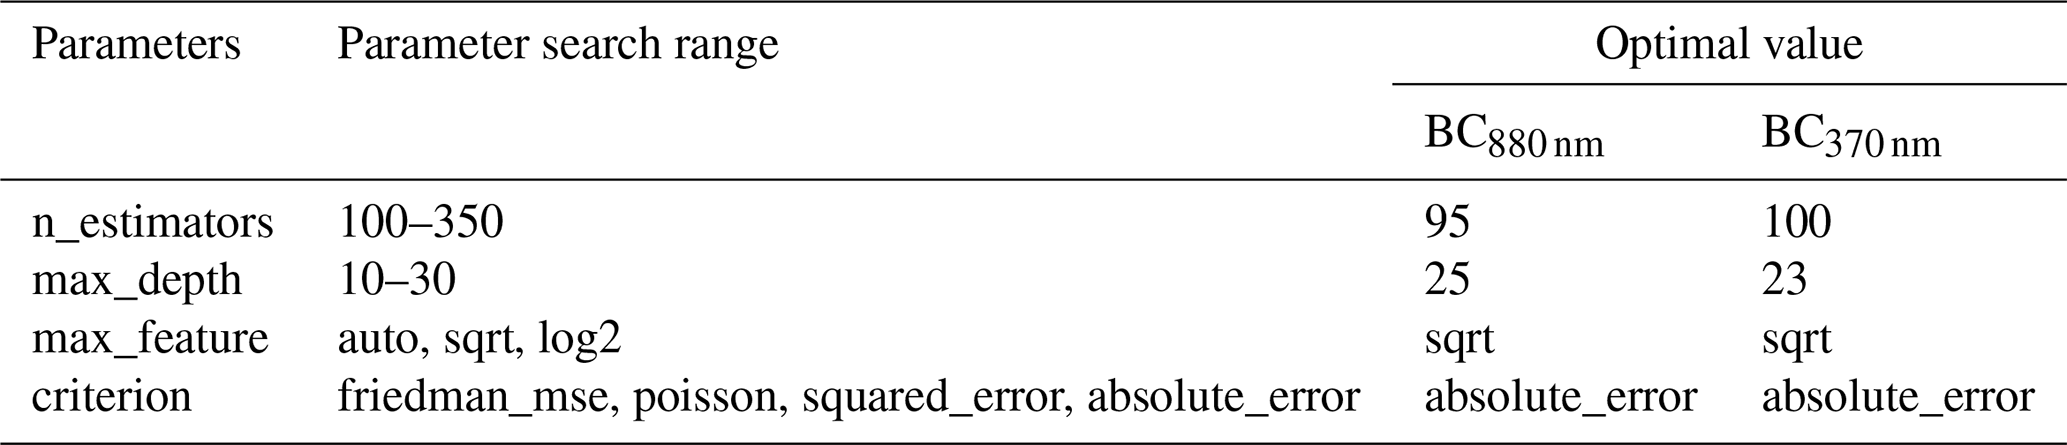
In this work, the BC concentrations from 2019–2021 (target variables) along with pollutant gases (SO2, CO, NO2) and meteorology factors such as T, RH, WS, WD and BLH (independent variables) were input into the RF models. Although precipitation plays a key role in the wet scavenging of BC (Liu et al., 2020b; Ding et al., 2024), its inclusion in the RF model showed a minimal contribution to predicting BC concentrations. The relatively low contribution of precipitation can be attributed to the fact that its impact on BC typically appears over a longer timescale and the model input is based on hourly precipitation, which may not adequately capture the cumulative effect. Furthermore, including precipitation in the model had no significant impact on its predictive performance; therefore, precipitation was excluded from the RF model. To train the RF model and assess the predictive ability of RF model, the whole dataset was randomly divided into training and testing sets at a ratio of 8:2. Given that observational data followed a lognormal distribution, most of the data are concentrated within a specific interval, resulting in poor model performance for extreme values. To ensure a good model performance, some data augmentation methods were used to achieve data balance by interpolating or duplicating less frequent data, ensuring that the overall dataset roughly follows a uniform distribution (Hong et al., 2023; Huang et al., 2023). To obtain optimal hyperparameter values, 10-fold cross-validation was utilized on the training sets, dividing the datasets into 10 subsamples, with 9 subsamples used for training and 1 subsample for testing. The model performance of the 10-fold cross-validation is shown in Figs. S2 and S3. The results indicate that the RF-predicted BC at 880 nm correlated well with the observations, with an average R2 of 0.97, MAE varying from 0.29 to 0.30 and RMSE ranging from 0.47 to 0.54. For BC at 370 nm, the cross-validation results were also robust, with a mean R2 of 0.98, MAE values ranging from 0.37 to 0.41, and RMSE values varying from 0.57 to 0.74, confirming the stability and reliability of the model. Optimized parameters for the models were chosen based on the best mean square error (MSE), root mean square error (RMSE) and R squared (R2) values obtained from the 10-fold cross-validation. Finally, the test sets were input into the models and their predictive abilities were evaluated. The optimized parameters selected for the models are presented in Table 1. The BC monitored by Aethalometer at 370 nm wavelength was also predicted by RF models with the same independent variables to explore changes in BC sources in Nanjing from 2014 to 2021.
2.4 Kolmogorov–Zurbenko filter
The KZ filter, a method for decomposing time series data into distinct components, is widely utilized in air pollutants studies to differentiate the influence of meteorology and emission strength on the long-term trend of air pollutants (Wise and Comrie, 2005; Yin et al., 2019; Chen et al., 2019). Since the original concentration of BC follows a lognormal distribution, the data (χ) were transformed into natural logarithmic form (X = ln (χ)) before applying the KZ filter, allowing the data to follow a normal distribution (Zheng et al., 2023). The KZ filter assumes that the original time series of a certain air pollutant comprises short-term, seasonal and long-term components. Thus, the original time series of BC [X(t)] can be expressed as
Here, E(t) represents the long-term component, mainly affected by climate, the long-range transport of air pollutants and emission intensity changes due to shifts in energy structure. S(t) is the seasonal component, attributed to variations in meteorological conditions and emission intensity across different seasons. W(t) is the short-term component driven by weather patterns and fluctuations in local-scale emissions.
The KZ filter is a low-pass filter characterized by a window length (m) and iterations (p). Different m and p values can be used to separate each component of an air pollutant. KZ(15,5) can eliminate cycles that are less than 33 d and obtain the baseline component of the original data. The W(t) can be easily obtained by subtracting XBL(t) from X(t). Therefore, the long-term, short-term and seasonal components can be extracted as follows:
XBL is assumed to consist of its repeated climatological seasonal cycle () and residuals (ε).
contains most of the seasonality in XBL, while ε consists of E(t) along with minor seasonal variability unconsidered in . Applying a KZ filter with a window length of 365 and an iteration of 3 (KZ(365,3)) to ε, E(t) and S(t) can be obtained:
Emissions and meteorological condition changes can influence the long-term trend of BC; the long-term component can be assumed to consist of emission-related () and meteorology-related () components. Thus, XBL can be expressed as follows:
To derive the in Eq. (12), the multiple linear regression model was applied to the baseline component of BC and the baseline components of six meteorological factors comprising T, RH, WS, WD, BLH and surface pressure (SP). Then, the formulas can be written as follows:
where a0 denotes the intercepts of multiple linear regression model outcomes. METBL denotes the baseline components of meteorology factors which are obtained by KZ(15,5). ε′ is the sum of emission-related long-term variability and some minor seasonal variability unexplained by the multiple linear regression model. Therefore, can be extracted by applying KZ(365,3) to ε′. Then, can be obtained by subtracting from the long-term component (E(t)) (Seo et al., 2018).
3.1 General characteristics of BC in Nanjing
Figure 1a shows the hourly (dots) and daily (line) mean variation in BC, PM2.5 mass concentrations, and the proportion of BC to PM2.5 in Nanjing. A 400-fold variation was found in the hourly BC concentration, which ranged from 0.04 to 16.05 µg m−3. Daily BC levels fluctuated much less than the hourly concentration, from the lowest value of 0.40 µg m−3 (15 May 2021) to the highest value of 9.58 µg m−3 (24 January 2019). The average BC level during the whole sampling period was 2.52 ± 1.62 µg m−3. Figure 1b illustrates the frequency distributions of hourly BC concentrations during different sampling periods. Over 3 years, BC distributions shifted toward lower values. In 2019, the most frequent BC concentrations were observed in the 2–3 µg m−3 range, accounting for 26.2 % of samples. In 2020 and 2021, most BC levels were found in the 1–2 µg m−3 range, with frequencies of 38.0 % and 41.9 %, respectively. BC levels exceeding 7 µg m−3 accounted for 5.1 %, 0.8 % and 0.01 % in the 3 years. PM2.5 showed a similar variation to BC, with a significant correlation (r=0.74, p < 0.05) observed between daily PM2.5 and BC concentrations during the sampling period. The hourly ratio of BC to PM2.5 varied from 0.6 % to 26 %, with an annual average of 10 %. Compared to a previous study conducted in the Yangtze River Delta, the BC PM2.5 ratio in Nanjing was much higher than in Shanghai (5.6 %) (Wei et al., 2020), implying greater importance of primary emissions in Nanjing.
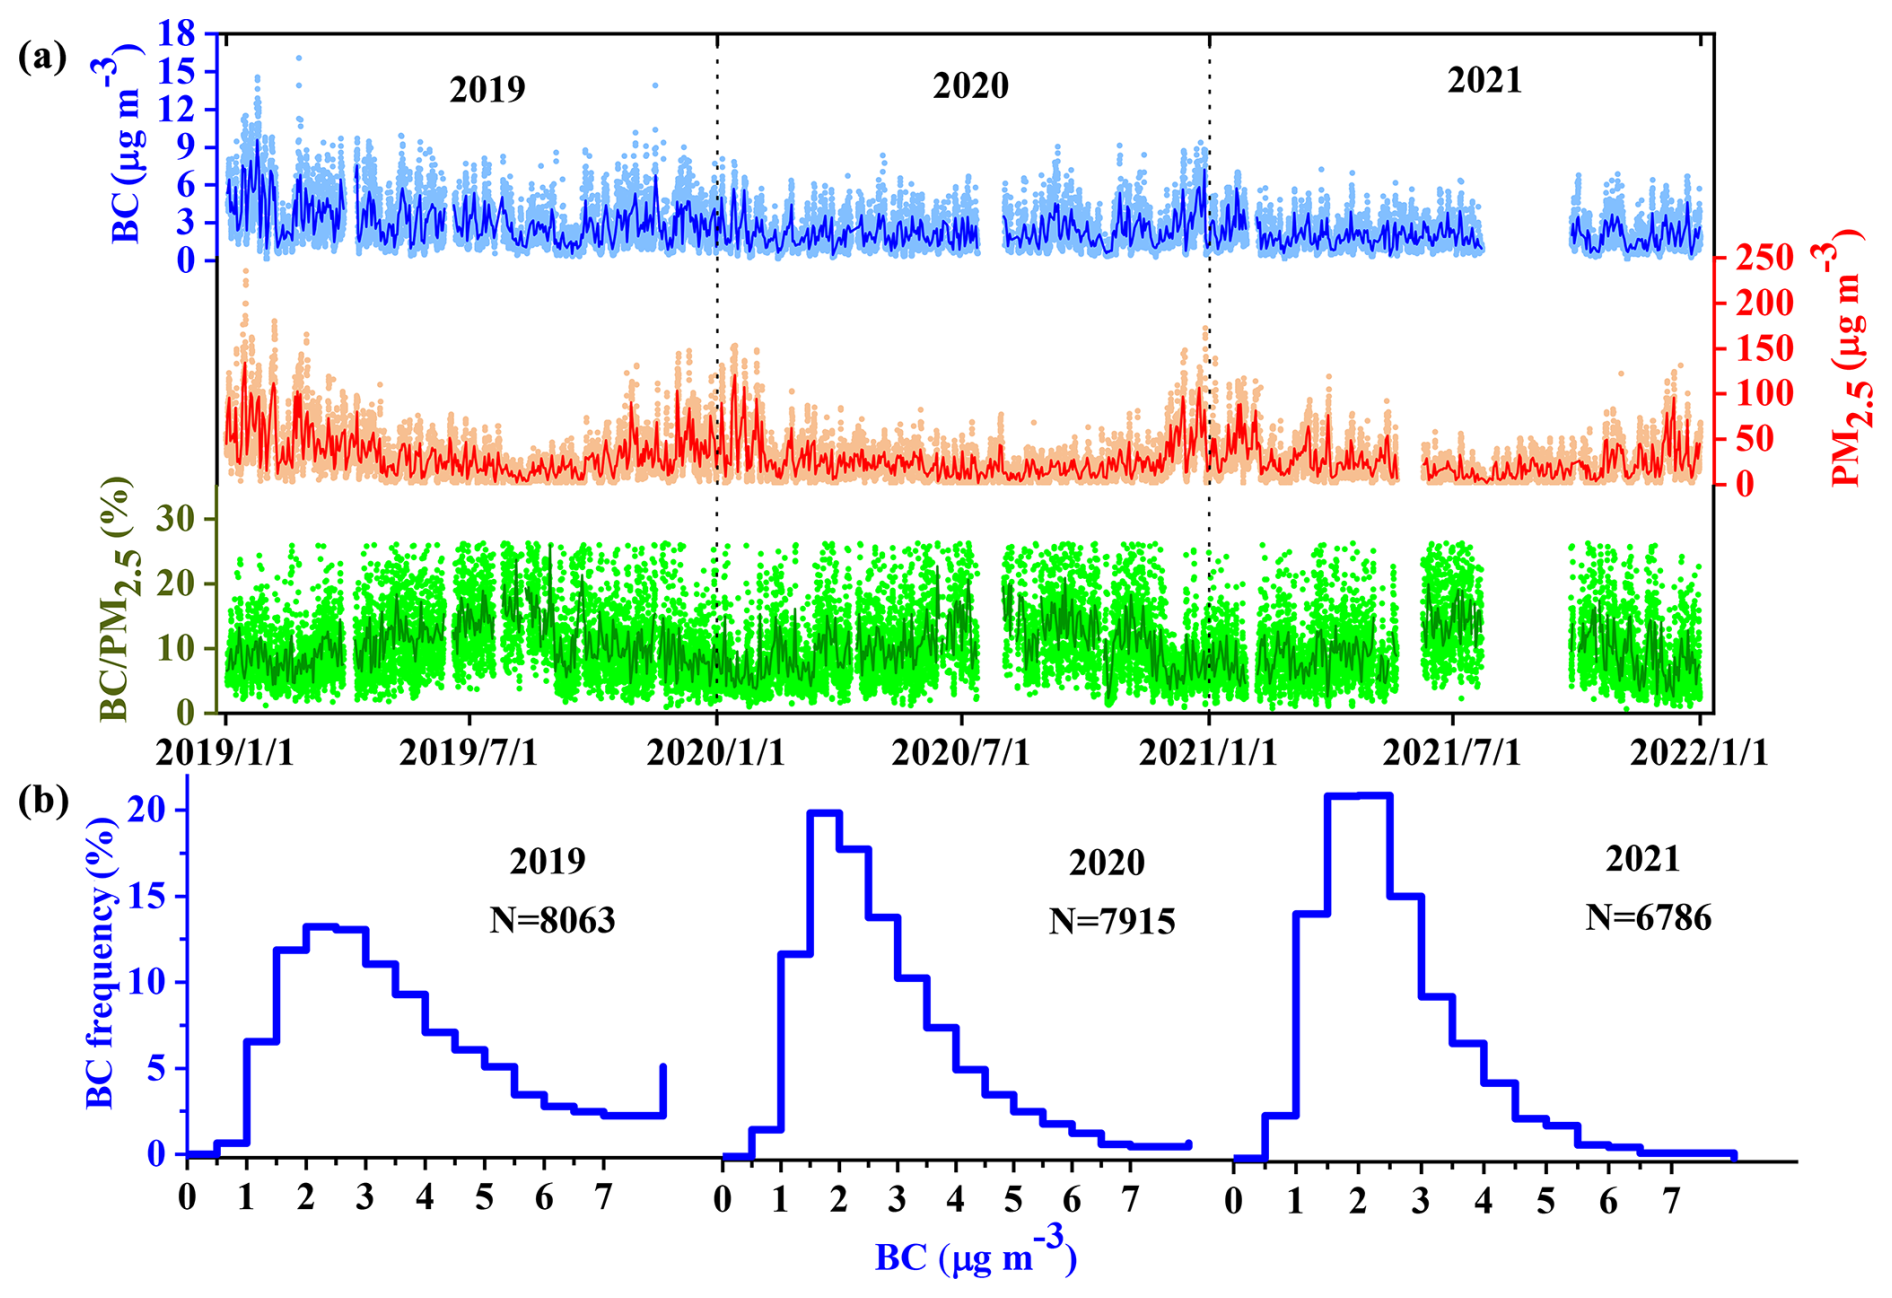
Figure 1(a) Hourly (dots) and daily (line) concentration of BC, PM2.5 and BC PM2.5 and (b) frequency of BC for each year during 2019, 2020 and 2021. N represents the number of hourly BC concentration values for 1 year.
Table 2 lists long-term (equal to or more than 1 year) BC mass concentrations monitored by the optical method in Nanjing and other sampling sites around the world from previous studies. Nanjing's 3-year average BC level was the lowest among previous studies performed in Nanjing, indicating that primary emissions in Nanjing are decreasing year by year. While BC levels in other southern Chinese cities like Shanghai and Wuhan were at least 12.0 % lower than those in Nanjing, they were at least 13.9 % higher in northern Chinese cities like Beijing and Baoji. Additionally, BC concentrations in Nanjing were 5 times higher than in the baseline station of Mt. Waliguan.
Table 2Comparison of BC mass concentration in Nanjing with other sites.
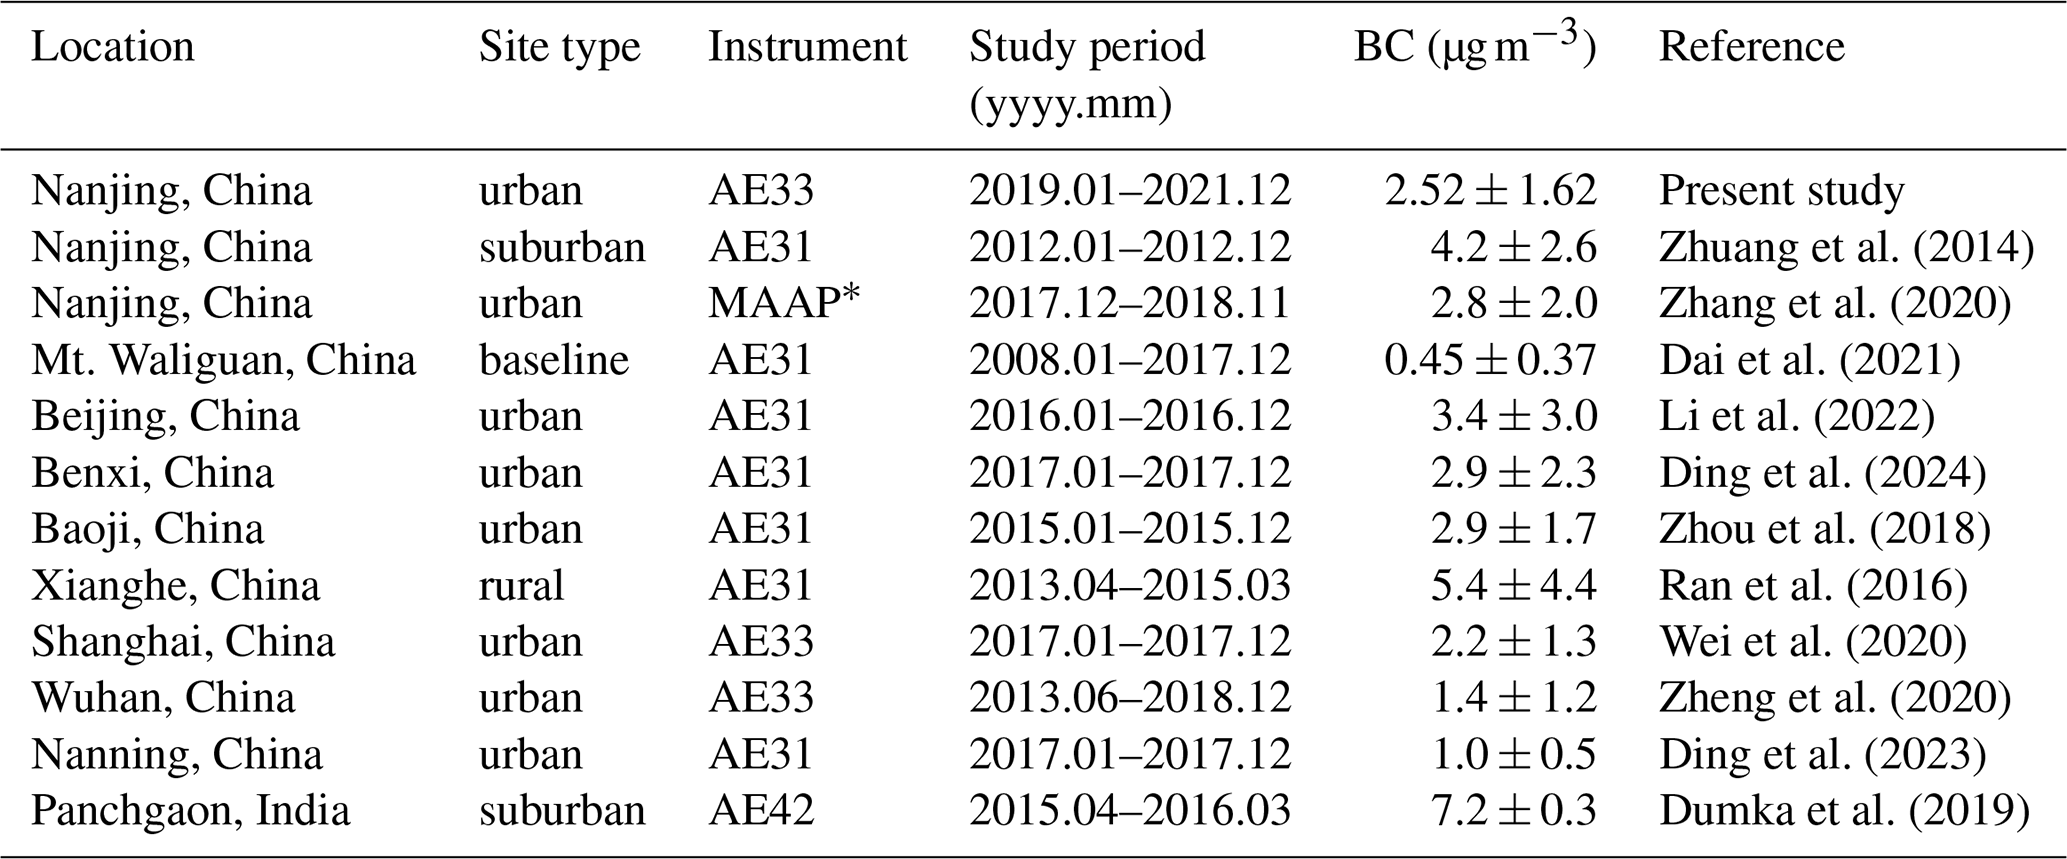
∗ MAAP: multi-angle absorption photometer.
3.2 Temporal variation in BC mass concentrations in Nanjing
3.2.1 Interannual, seasonal and monthly variations
The annual, seasonal and monthly variations in BC mass concentrations are illustrated in Fig. 2. The annual average BC mass concentration in 2019 (3.2 ± 2.0 µg m−3) was higher than in 2020 (2.3 ± 1.4 µg m−3) and 2021 (2.0 ± 1.1 µg m−3). A significant reduction of 28.1 % in the BC mass concentration was observed from 2019 to 2020, much higher than the reduction (13.0 %) observed during 2020–2021. Consistently with BC, PM2.5 concentrations reduced more sharply during 2019–2020 (24.1 %) than in 2020–2021 (6.2 %). To prevent the spread of COVID-19, a series of lockdown measures were imposed in China in late January 2020, resulting in a remarkable decrease in concentrations of air pollutants (Bauwens et al., 2020; Li et al., 2020; Wang et al., 2020).
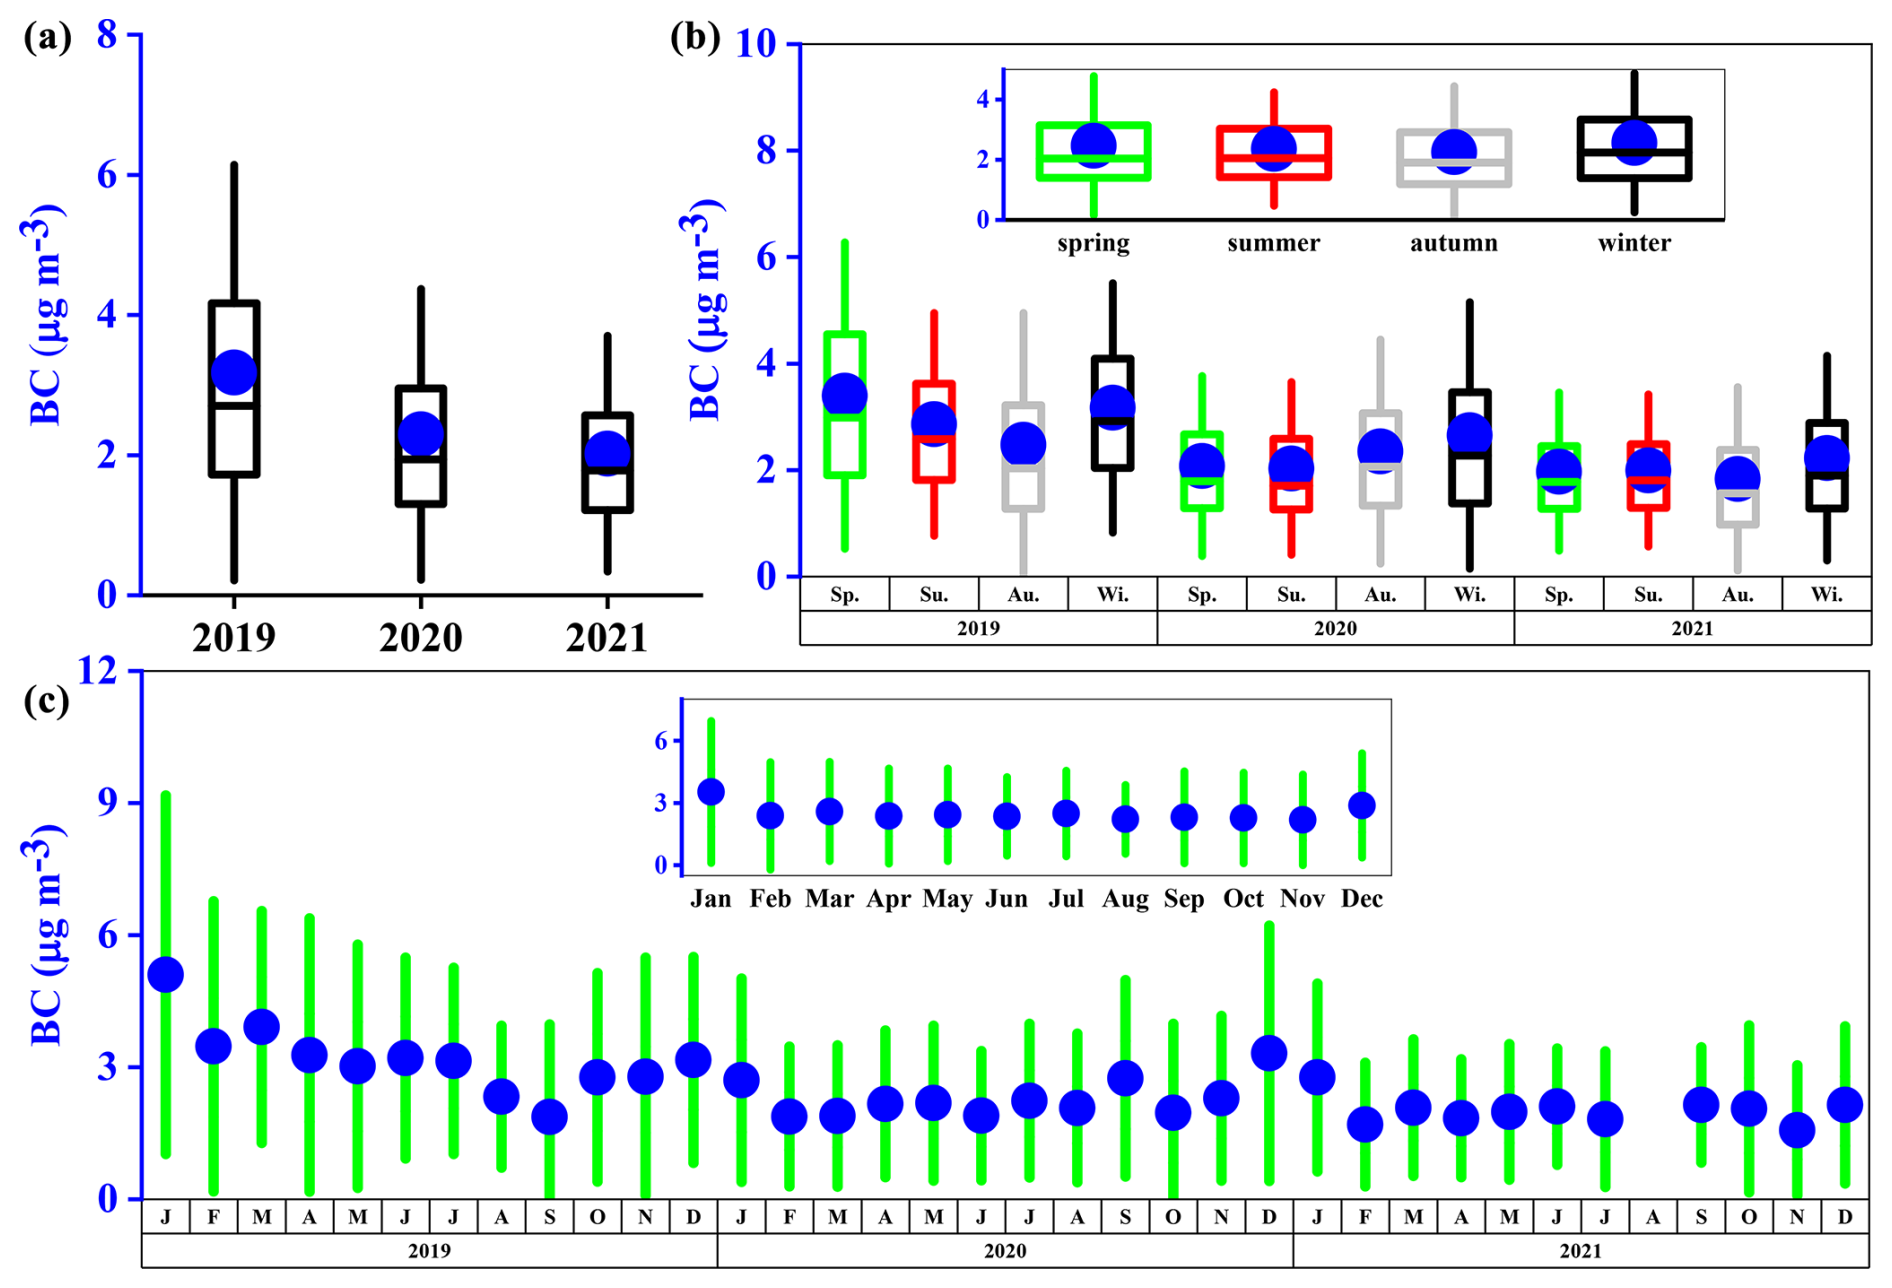
Figure 2(a) Interannual, (b) seasonal and (c) monthly variations in BC. The insets in panels (b) and (c) are overall average seasonal and monthly values. The blue dots represent average BC values. The rectangles in panels (a) and (b) represent the 25 % and 75 % quantiles. The vertical lines in panels (a)–(c) represent 10 % and 90 % quantiles.
Seasonally, the highest averaged BC level over 3 years occurred in winter (2.9 ± 2.0 µg m−3), with no obvious variation identified in spring (2.5 ± 1.5 µg m−3), summer (2.4 ± 1.4 µg m−3) or autumn (2.3 ± 1.5 µg m−3), suggesting a generally locally dominated source of BC emissions. The results of bivariate polar plots showed the highest BC levels in low wind speeds (WS < 4 m s−1) in all seasons (Fig. S4), further indicating that local sources are the predominant contributors to atmospheric BC in Nanjing. High BC mass concentrations in winter are mainly caused by enhanced emissions during cold weather and deteriorating meteorological dispersion conditions in low temperatures. A similar seasonal pattern was also found in previous studies conducted in other Yangtze River Delta cities like Shanghai and Hefei (Chang et al., 2017; Zhang et al., 2015). Seasonal average concentrations of BC varied from 1.83 (autumn of 2021) to 3.40 µg m−3 (spring of 2019) across different years. In 2019, the BC concentration in spring (3.4 ± 1.9 µg m−3) was higher than in winter (2.6 ± 1.5 µg m−3), likely due to decreased human activities during the lockdown period. In contrast to the spring of 2019, higher levels of BC were found in winter during 2020 and 2021.
The monthly mean concentrations of BC showed relatively large variation, ranging from 1.6 (November of 2021) to 5.1 µg m−3 (January of 2019). The highest monthly average BC levels were found in January (3.5 ± 2.3 µg m−3), followed by December (2.9 ± 1.7 µg m−3). The monthly variation pattern of BC is consistent with previous studies in Nanjing, which reported the highest BC levels in January and December (Zhang et al., 2020; Xiao et al., 2020). Additionally, the BC concentration in January was 37 % higher than in August (2.2 ± 1.1 µg m−3), attributed to relatively low emission strength and higher precipitation in summer in Nanjing.
3.2.2 Diurnal variation in BC
The diurnal variations in BC mass concentrations for each year are plotted in Fig. 3a. The diurnal cycles of BC, like those in previous studies conducted in Nanjing (Xiao et al., 2020; Zhang et al., 2020; Zhuang et al., 2014), exhibited bimodal distributions in the whole study period. BC mass concentrations remained relatively flat at midnight and then increased from 03:00 LT (local time) to 07:00 LT. After reaching the highest value at 07:00 LT, BC levels decreased, reaching the lowest values at 16:00 LT, then increased again, and higher values were maintained in the evening. The bimodal diurnal patterns of BC were attributed to the intensity of emissions and variations in meteorological conditions (Cao et al., 2009). The morning peak of BC was mainly caused by vehicle emissions during the rush hour, as indicated by the similar diurnal cycles of CO and NO2 (Fig. S5). After the morning peak, the boundary layer height developed and WS increased, increasing atmospheric dilution capability and lowering the BC levels. After 14:00 LT, due to a decrease in boundary layer height and WS, BC was gathered on the surface layer, resulting in higher BC loading from the evening to midnight. The peak BC concentration in 2019 was 29 % and 38 % higher than in 2020 and 2021, respectively, indicating air quality in Nanjing is getting better due to the strict implementation of air pollution control plans. Additionally, the impact of COVID-19 lockdown measures during selected years also contributed to the reduction in BC concentrations.
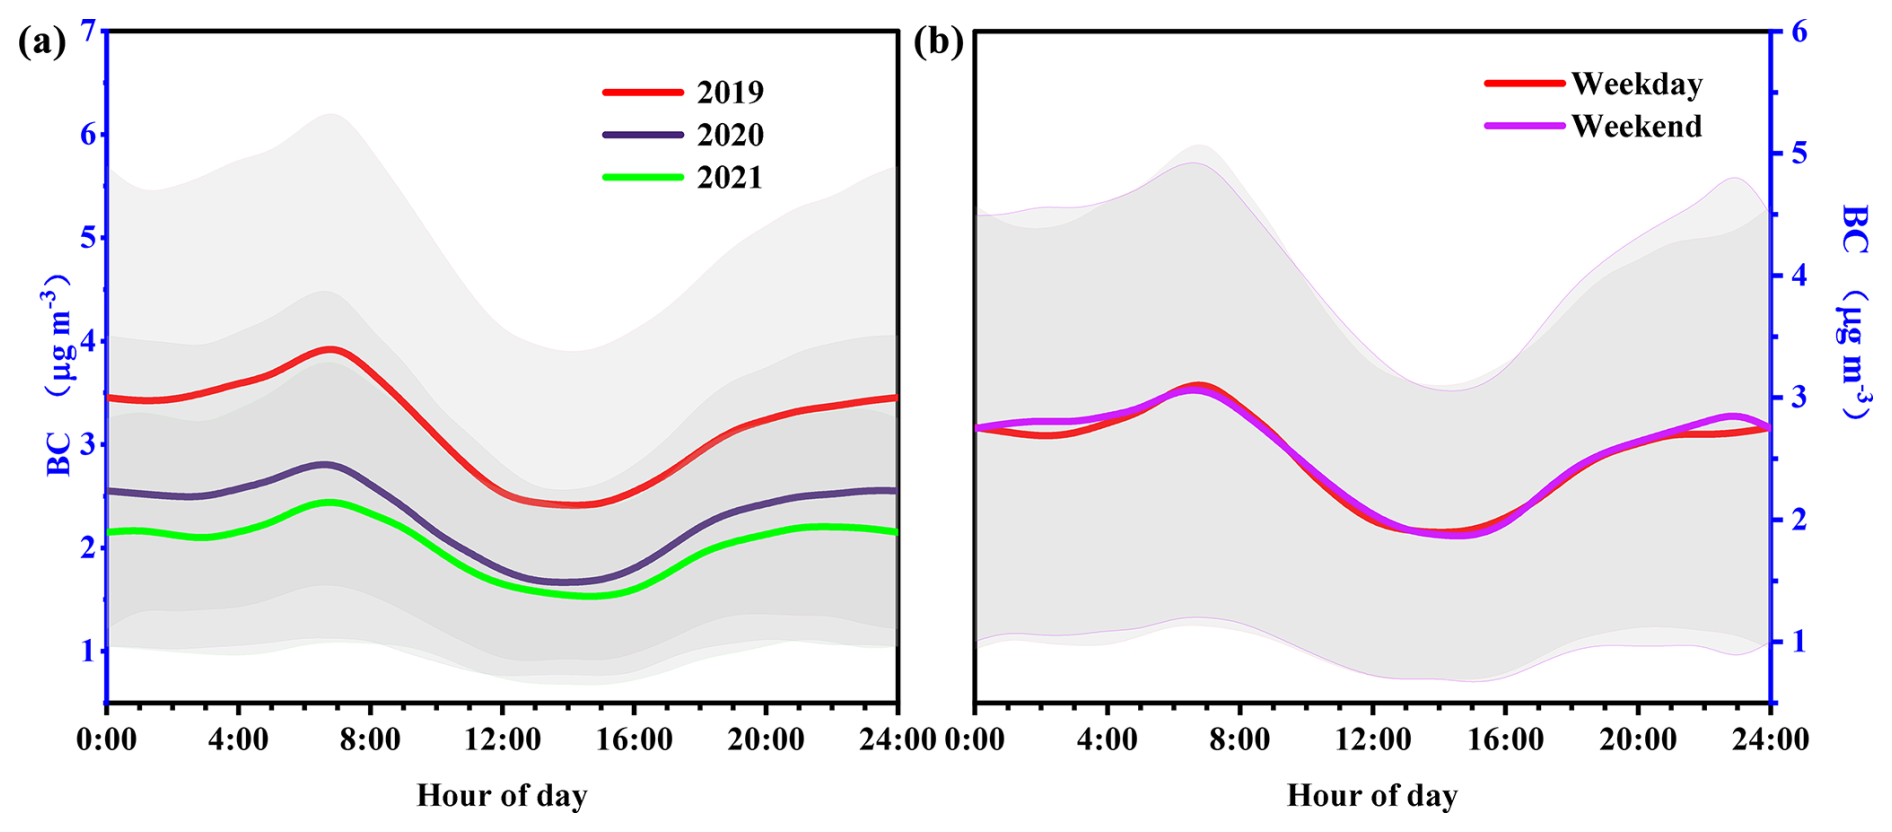
Figure 3Diurnal variation in BC (a) for each year during 2019–2020 and (b) during weekdays and weekends. Shaded areas represent the standard deviation at each time of day.
To further explore the impacts of human activities on ambient BC concentrations, the diurnal variation in BC was separately investigated for weekdays and weekends. As shown in Fig. 3b, the diurnal patterns of BC on both weekdays and weekends exhibited bimodal distributions, with similar peak times in morning vehicle rush hours (07:00 LT), suggesting that local emission sources of BC in northern Nanjing do not differ significantly between weekdays and weekends.
3.3 Source apportionment of BC
3.3.1 Source apportionment of BC by the Aethalometer model
The AAE values, calculated by a power-law fit between light absorbance and seven wavelengths, followed a lognormal distribution in 3 years, with an hourly variation ranging from 0.71 to 2.59 (Fig. S6). The 3-year average AAE value was 1.25 ± 0.14, with the highest value of 1.28 ± 0.13 in 2021, which was 4.0 % and 4.3 % higher than those values in 2019 and 2020, respectively, indicating similar BC emission sources during the sampling period. Seasonally, the lowest AAE value of 1.13 ± 0.14 was found in summer, while the highest AAE value of 1.32 ± 0.11 appeared in winter. The monthly variation in AAE showed a valley in the summer months (particularly in July) and high values in winter (December), suggesting that Nanjing was predominantly influenced by traffic-related liquid fuel burning in summer and coal-related combustion in winter.
To quantify the relative contribution of liquid and solid fuel combustion to BC concentration, the Aethalometer model, as mentioned in Sect. 2.2, was applied. The Aethalometer model was initially used for BC source apportion in Europe, where fossil fuel and biomass burning emissions were two major sources. However, China's energy structure differs from Europe's, with coal combustion still playing a significant role. Liu et al. (2018) summarized AAE values from different coal-burning sources in China, finding that AAE values of coal burning were close to those of biomass combustion. Thus, AAE values of 1.0 for liquid fuel (AAEliquid) and 2.0 for solid fuel (AAEsolid) were selected for this work. The same AAE pairs were also used for source apportionment of BC in a previous study carried out in Nanjing (Lin et al., 2021). Figure 4 shows the time series of absolute BC concentrations derived from liquid and solid fuel combustion, along with a depiction of their relative contributions to BC in different seasons for each year. The 3-year average concentration of BCliquid was 2.0 ± 0.5 µg m−3, approximately 4 times that of BCsolid. Liquid fuel combustion is the dominant source of BC in Nanjing, with 79 % of BC generated from the consumption of liquid fuel. Interannually, the contributions of liquid fuel ranged from 76 % to 81 %, which is comparable to other cities in China such as Wuhan (81 %) and Shanghai (88 %–94 %) (Zheng et al., 2020; Wei et al., 2020). The contribution of liquid fuel burning to BC was highest in summer (85 %), in contrast to the lowest value observed in winter (72 %) and much higher than that of Beijing (35.7 %) (Li et al., 2022). Beijing is heavily affected by heating activities in winter, such as power plants and residential heating using coal and biomass, resulting in higher solid fuel emissions. The seasonal average contribution of BB varied by 5 % (from 19 % to 24 %), influenced by coal-fired emissions from surrounding factories and the long-range transport of domestic cooking emissions in rural areas in the Yangtze River Delta region (Wei et al., 2020).
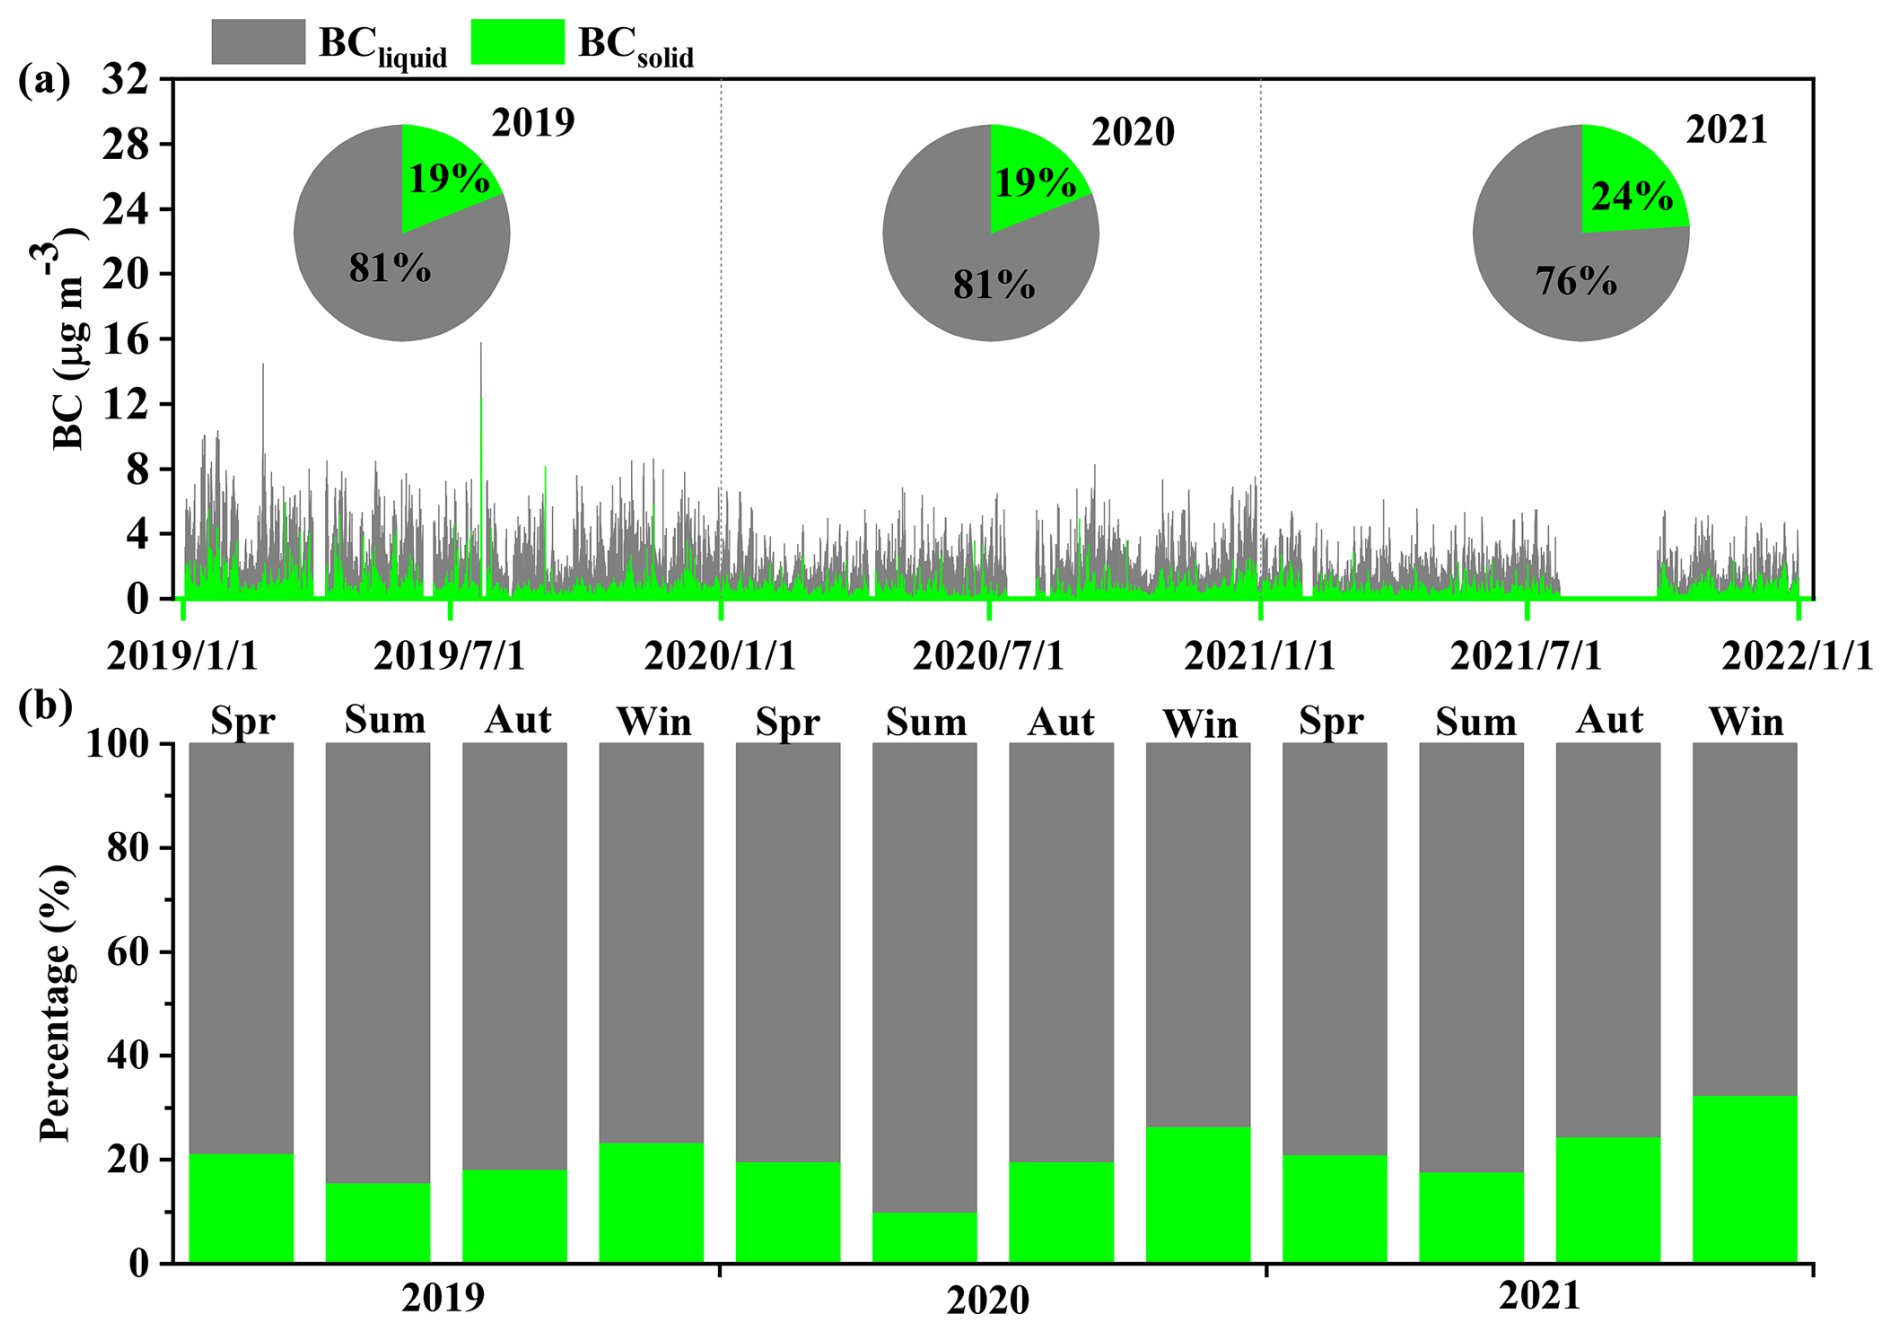
Figure 4(a) Hourly variation in BCliquid and BCsolid (date format: yyyy/m/d) and (b) their relative contribution to BC. The pie charts in panel (a) show the annual average relative contribution of BCliquid and BCsolid to BC.
It is important to highlight that the results of the Aethalometer model are highly dependent on the determination of AAE values, with AAEliquid ranging from 0.8 to 1.1 and AAEsolid values ranging from 1.8 to 2.2, as widely used in this model (Helin et al., 2018; Dumka et al., 2019; Fuller et al., 2014). To estimate the uncertainty in the Aethalometer model, we calculated source apportionment results using different AAE pairs; the results are shown in Table S1 in the Supplement. An uncertainty estimation of 11.0 % for BCliquid was found in this work. Although there are uncertainties in source apportionment results, our results indicate that liquid fuel combustion is the main source of BC in Nanjing during the study period.
3.3.2 Source diagnostic tracers
The ratios of BC PM2.5 and BC CO have been utilized to estimate emission sources in previous studies since they can vary when emitted from different sources (Chow et al., 2011; Zhang et al., 2009). The proportion of BC in PM2.5 is higher in traffic sources than that from other sources (such as residential coal combustion and forest fires). As listed in Table S2, higher BC PM2.5 ratios were found for heavy-duty diesel (33 %–74 %) and light-duty diesel (62 %–64 %), followed by those emissions from agricultural burning (6 %–13 %) and forest fire (3 %) (Table S2) (Chow et al., 2011). The highest ratio of BC PM2.5 appeared in summer (13 %), while the lowest was observed in winter (8 %), suggesting an increase in biomass and coal burning during winter. Previous studies reported that the BC CO ratio was lower for traffic emissions (0.52 %) than those from industry (0.72 %), power plants (1.77 %), and residential sources (3.71 %) (Table S2) (Zhang et al., 2009). The average ratios of BC CO in spring, summer, autumn and winter were 0.39 %, 0.49 %, 0.49 % and 0.31 %, respectively, further suggesting that the traffic source was dominant in Nanjing (Table 3).
Table 3Mass ratios and correlations between BC and other pollutants.
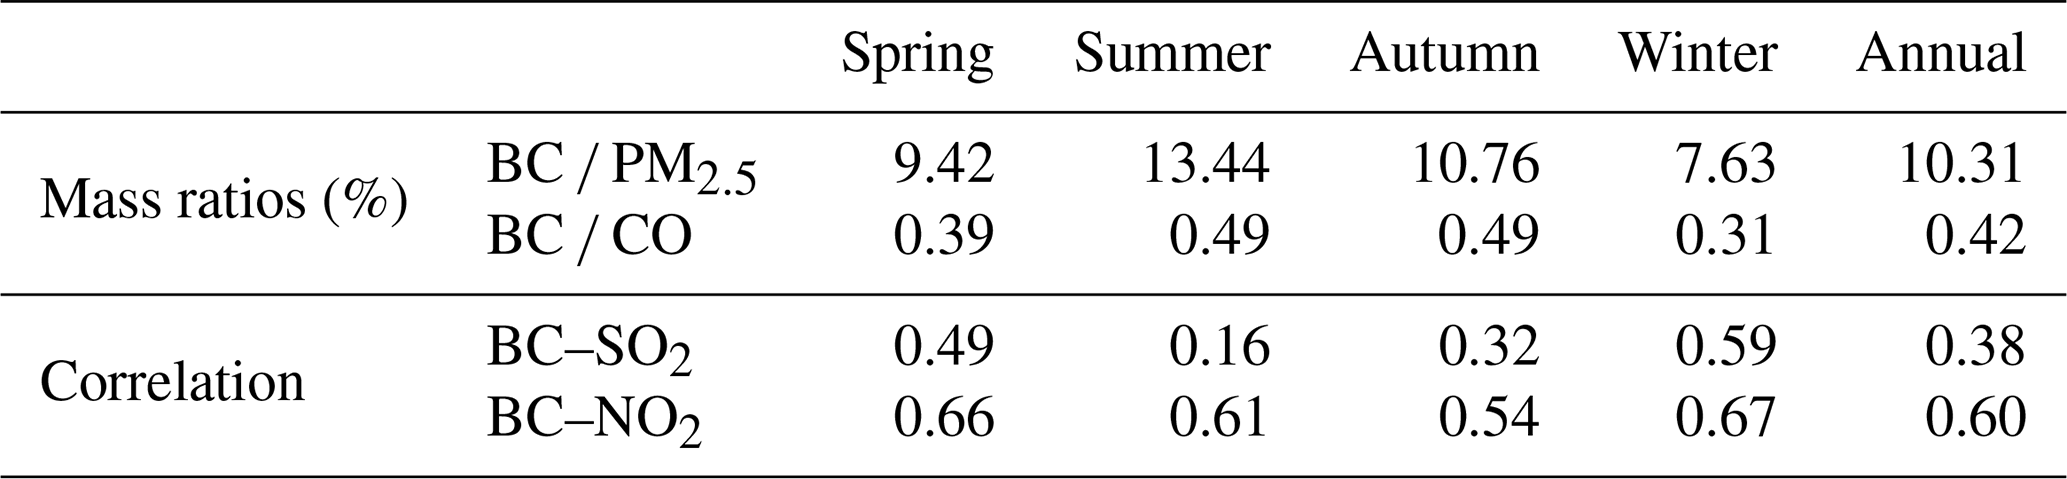
To further support the source apportionment results of BC, a correlation analysis was conducted between BC and trace gases such as SO2, and NO2, mainly derived from coal combustion and vehicle emissions, respectively. As listed in Table 3, the correlations of BC with NO2 (0.54–0.67) were higher than the correlations of BC with SO2 (0.16–0.59), further indicating the dominance of traffic emissions in Nanjing.
3.4 Long-term trend of BC
3.4.1 Black carbon simulation results
After training the RF models with optimal hyperparameters, the models for BC at 880 and 370 nm were evaluated on test sets to assess predictive performance. The density scatterplot as displayed in Fig. 5 shows the relationship between the test set and the RF model predictions. The results showed that the RF model explained over 90 % of the variation in BC concentrations, with R2 values of 0.90 and 0.91 between the monitored and predicted results at 370 and 880 nm, respectively. The RF model's predictions for the test dataset were close to those for the training dataset, indicating consistent performance across both datasets and demonstrating the RF model's stability and reliability. In addition to evaluating the RF model using the test set, further validation was conducted using Tracking Air Pollution in China (TAP) (10 km × 10 km, http://tapdata.org.cn, last access: 13 June, 2025, Liu et al., 2022) data. The predicted BC values at 880 nm from the RF model showed good agreement with the TAP dataset, with an R2 of 0.72 (Fig. S7). Using the trained model and available predictors, hourly BC concentration at the sampling site can be accurately reconstructed for any given period, consistent with AE33.
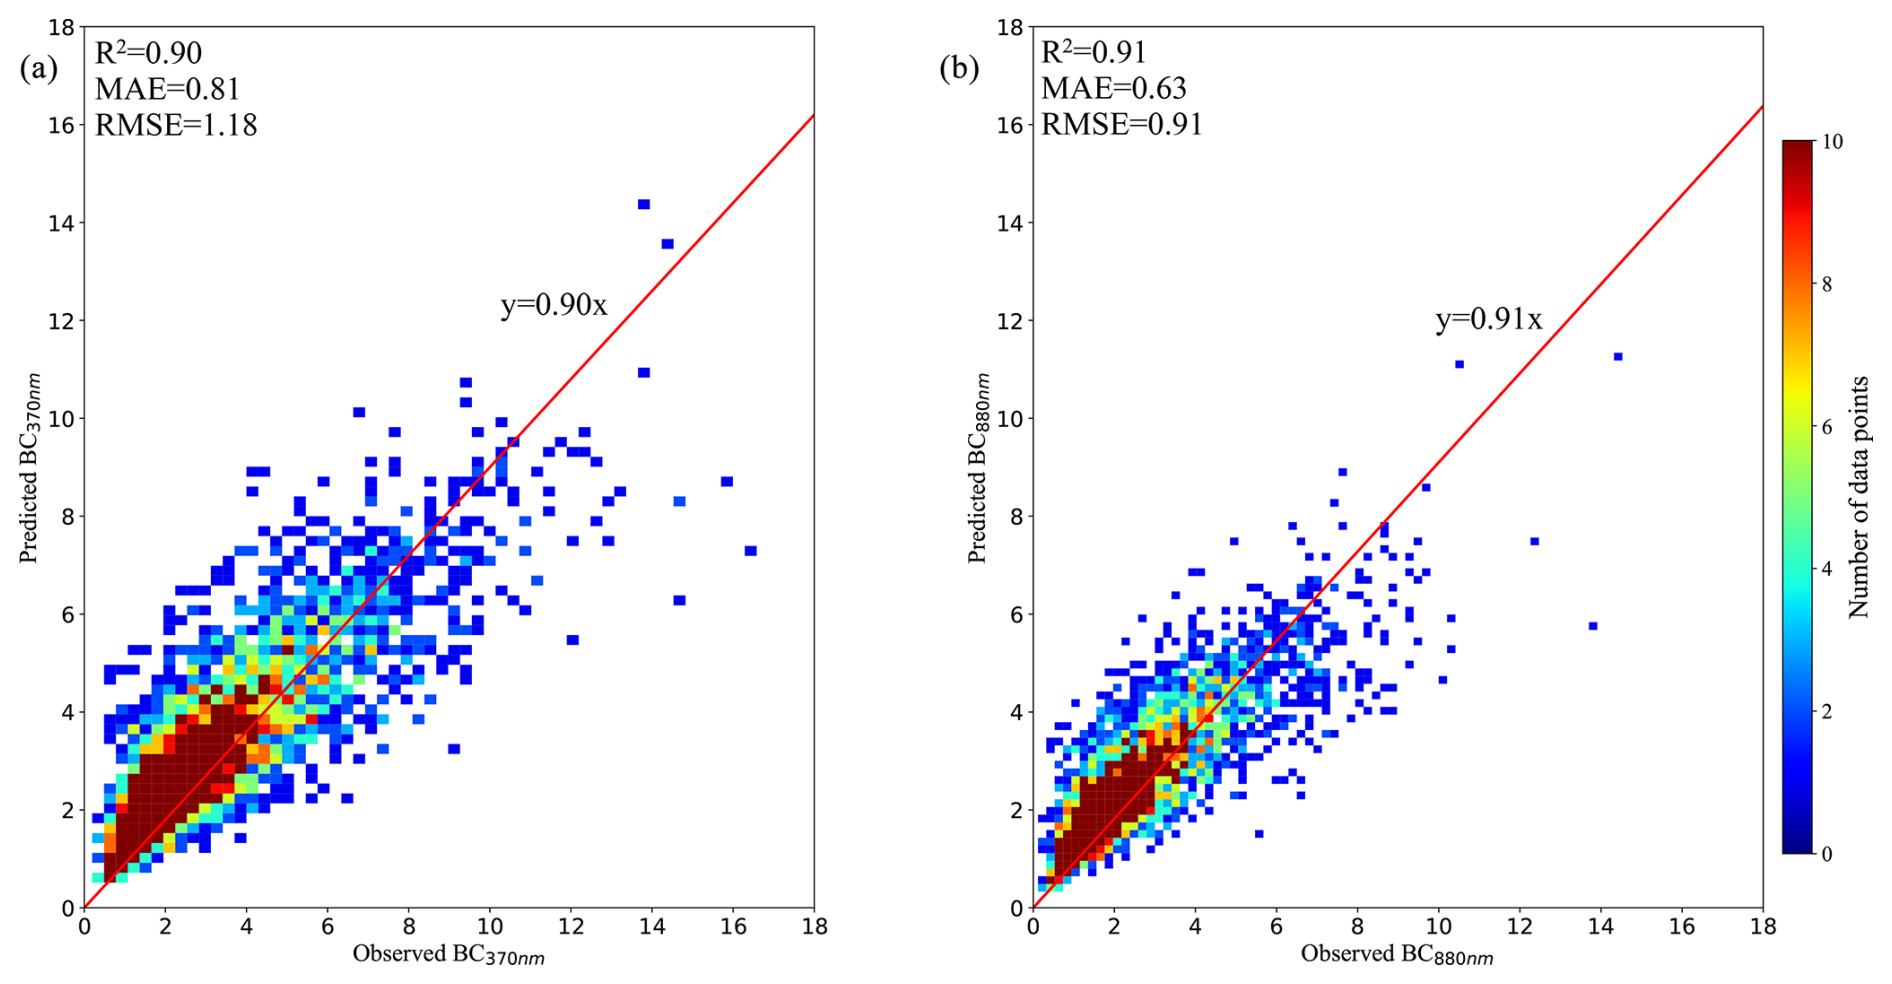
Figure 5Density scatterplots of hourly observed and modeled BC at (a) 370 nm and (b) 880 nm from the test dataset.
After training the RF models with input data, Shapley Additive exPlanations (SHAP) values were used to assess the importance of each predictor for model outcomes (Lundberg and Lee, 2017). Figure S8 presents the ranked average SHAP values for each predictor for BC at the two wavelengths. NO2, BLH and SO2 were identified as having the greatest impact on model's prediction. As with BC, NO2 and SO2 are primarily emitted from incomplete combustion processes involving fossil fuels (Lee et al., 2017; Yao et al., 2002). As a result, BC, NO2 and SO2 are often co-emitted by factories or traffic near the sampling site. BLH determines the diffusion capacity of the atmosphere; a lower BLH means stronger atmospheric stability, resulting in increased BC levels in the surface air. Unlike BLH, the contribution of other meteorology predictors, such as T, RH, WS and WD, were relatively low compared to those of pollutant gases. One possible reason for this is meteorological condition changes may not have an immediate effect on atmospheric BC levels; instead, there may be a certain lag in their effects.
3.4.2 Long-term temporal variation in BC
Meteorological data and air pollutant concentrations were used in the trained RF model to estimate BC concentrations at 370 and 880 nm from 2014 to 2021. The Aethalometer model was then applied to the simulated BC to explore the long-term temporal variation in source-specific BC. It is important to highlight that the results of the Aethalometer model are highly dependent on the determination of AAE values, with AAEliquid ranges between 0.8 and 1.1 and AAEsolid ranges between 1.8 and 2.2, as widely used in this model (Helin et al., 2018; Dumka et al., 2019; Fuller et al., 2014; Jing et al., 2019). To assess the model's uncertainty, source apportionment was conducted using various AAE pairs (Fig. S9). The results revealed that liquid fuel remained a dominant source of BC even when different AAE paired values were used, with the pattern of source apportionment results consistent across different AAE combinations. AAEliqiud = 1 and AAEsolid = 2 were used in this study, as the same combination of AAE values was utilized in Nanjing and other sites in China (Ding et al., 2024; Liu et al., 2018; Lin et al., 2021). Additionally, the uncertainty in source apportionment was estimated based on the relative differences between results obtained with other AAE values and those set to 1 and 2. As a result, the uncertainty in the BCliquid was estimated to be 10 %. Between 2014 and 2021, average BC concentrations decreased by 35.7 % from 3.12 ± 1.39 µg m−3 in 2014 to 2.04 ± 0.33 µg m−3 in 2021. The statistical significance of the reduction in BC and source-specific BC was assessed using the Mann–Kendall test on monthly median values, with results presented in Fig. 6. A significant decreasing trend (p < 0.01) in BC concentrations was observed, with a slope of −0.13 . Similar reductions have also been reported across various regions in China since 2013 (He et al., 2023; Sun et al., 2022a; Chow et al., 2022; Dai et al., 2023). Significant decreases were also observed in BCliquid (p < 0.01) and BCsolid (p < 0.05) concentrations. From 2014 to 2021, BCliquid decreased by 38.4 % (from 2.55 ± 1.14 to 1.57 ± 0.89 µg m−3 in 2021) at an absolute rate of −0.10 , while BCsolid decreased by 20.3 % (from 0.59 ± 0.52 to 0.47 ± 0.33 µg m−3) at a rate of −0.03 . The contributions of different sources to the overall BC reduction were estimated by comparing the absolute decrease slopes of BCliquid and BCsolid to the overall BC decrease slope. It was found that 77 % of total BC reduction was due to the decreased liquid fuel combustion, highlighting the significant role of BCliquid in reducing BC concentrations from 2014 to 2021. Pollutants commonly co-emitted with BC, such as NO2, CO and SO2, exhibited significant declining trends (p < 0.05) during the study period (Fig. S10). In contrast, the BC PM2.5 ratio showed a significant increasing trend (p < 0.01), suggesting that while emission reduction policies have been effective in decreasing precursors of secondary aerosol (, , ), stricter regulations regarding BC emissions may also be necessary. The variation in the BC CO ratio was not significant, with the mean value remaining stable at approximately 0.38 % throughout the period.
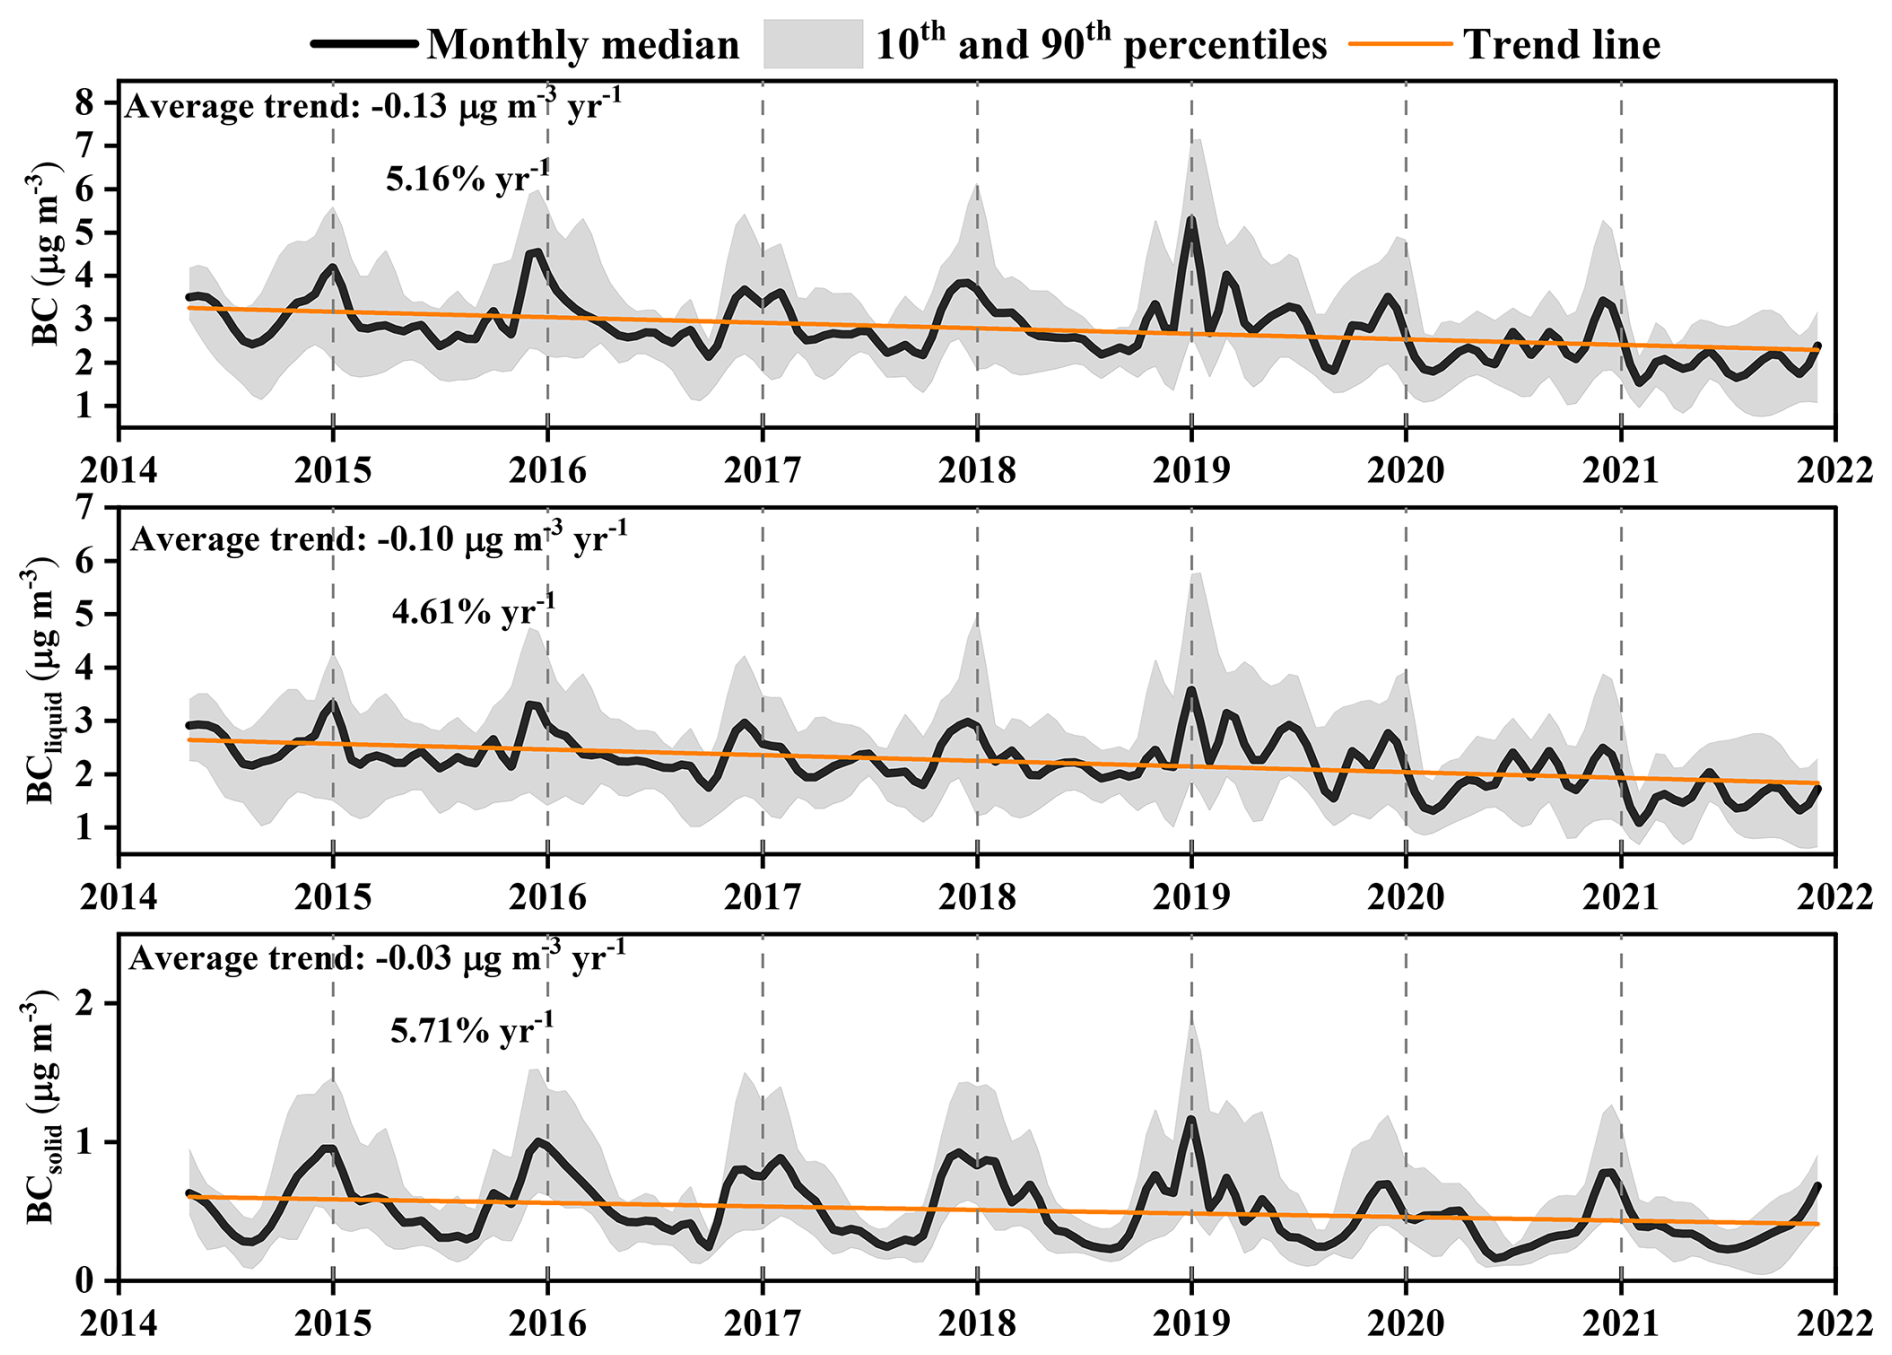
Figure 6Trends in BC, BCliquid and BCsolid at the sampling site. The solid black line represents the monthly medians, the grey shading represents the 10th and 90th monthly percentiles, and the orange line is the fitted long-term trend.
Throughout the study period, BC concentrations exhibited two distinct declining trends, which align with the implementation of the Air Pollution and Control Action Plan (2013–2017, P1) and the Three-Year Action Plan (starting in 2018, P2) by the Chinese government. To compare the decreasing trends of BC in the two periods, the absolute trends were normalized by the average values for each period. The change rates of BC and other air pollutants are shown in Table 4. During P1, the relative slopes of BC and BCliquid were −4.18 % yr−1 (p < 0.1) and −4.26 % yr−1 (p < 0.05), respectively, with BCliquid accounting for 83 % of the total decrease in atmospheric BC concentrations. Since the decrease in BCsolid is insignificant, the actual contribution of BCliquid may be higher than estimated. Compared to P1, the decline in BC, BCliquid and BCsolid concentration during P2 was much steeper, reaching −11.2 % yr−1 (p < 0.01), −10.3 % yr−1 (p < 0.01) and −11.6 % yr−1 (p < 0.1), respectively. During P2, reductions in both BCliquid and BCsolid contributed to the overall decrease in BC concentration, with BCliquid still being the dominant factor, accounting for 72 % of the total reduction. SO2 and NO2, which shared the same sources as BC, also decreased more rapidly in P2 (−33.2 % yr−1 and −8.7 % yr−1) compared to P1 (−10.1 % yr−1 and −1.3 % yr−1), suggesting that air pollutants have been decreasing much faster since 2018 than they were before.
Table 4The change rates of BC and other air pollutants during different periods.
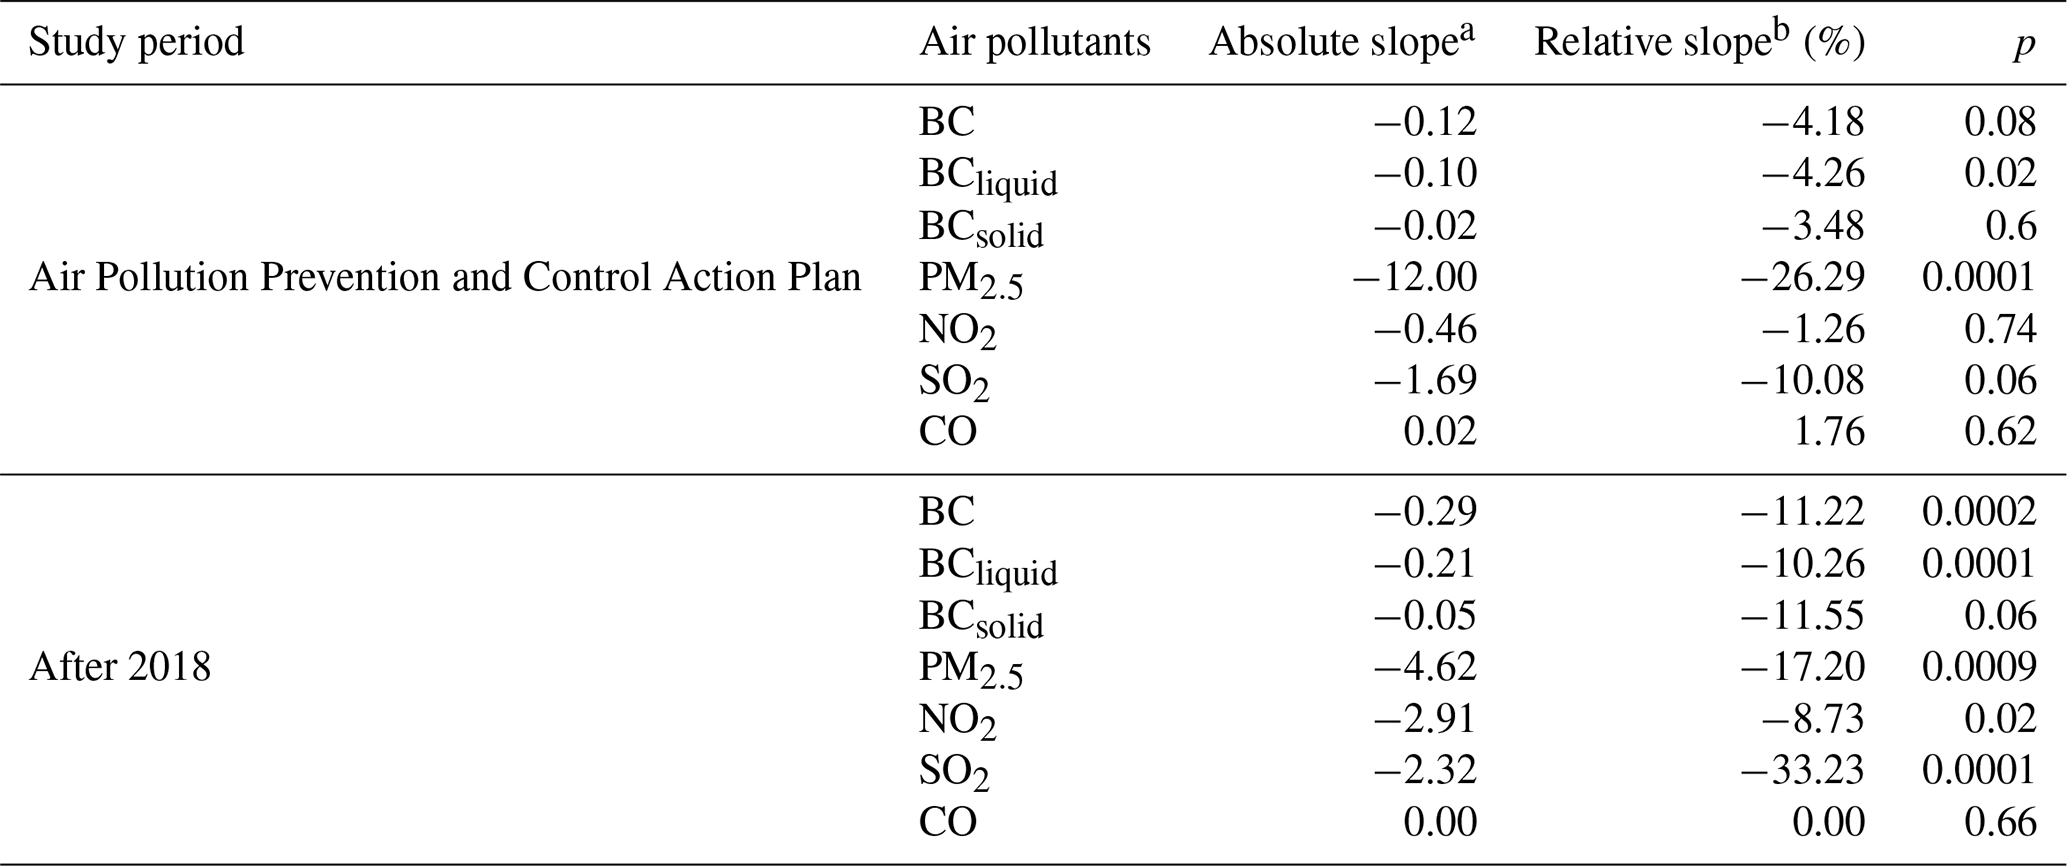
a . b % yr−1.
The seasonal trends in BC and its different sources were further investigated in Nanjing. As shown in Fig. 7, significant reductions in BC concentrations were observed across all seasons. The decreasing slopes of BC in spring (−7.2 % yr−1, p < 0.01) and winter (−10.0 % yr−1, p < 0.01) were steeper than those in summer (−5.07 % yr−1, p < 0.05) and autumn (−4.9 % yr−1, p < 0.05). The reduction rate of PM2.5 in spring (−15.9 % yr−1, p < 0.01), summer (−25.4 %, p < 0.01) and autumn (−20.0 % yr−1, p < 0.01) was 3 to 6 times that of BC (Table S3). In winter, the reduction rate (−14.2 % yr−1, p < 0.01) was closer to that of BC, suggesting that the reduction in primary pollutants in Nanjing during winter might be more effective than in other seasons. The seasonal variation in BCliquid showed distinct trends across different seasons. Significant reductions were observed in spring, summer, autumn and winter, with absolute slopes of −7.6 % yr−1 (p < 0.01), −4.1 % yr−1 (p < 0.05), −5.1 % yr−1 (p < 0.01) and −10.5 % yr−1 (p < 0.01), respectively. The reduction rate of BCliquid in summer was the lowest compared to other seasons, potentially attributable to increased traffic activity associated with the peak tourism season. BCsolid showed a similar decreasing slope in spring (−8.7 % yr−1, p < 0.05) and winter (−8.5 % yr−1, p < 0.01), while summer exhibited a relatively high reduction (−12.2 % yr−1, p < 0.01). The more pronounced decline in BCsolid during the summer can be attributed to the seasonal variation in significant BCsolid emission sources in Nanjing, such as biomass burning activities, which are minimal during this period. The reduction in BCsolid in autumn was insignificant, which may be influenced by the long-range transport of biomass burning, as well as by increased agricultural activities during this season. It is worth noting that BCliquid contributed 92 % to the overall BC reduction in autumn. However, since the decreasing trend of BCsolid in autumn was not statistically significant, the contributions may have been underestimated.
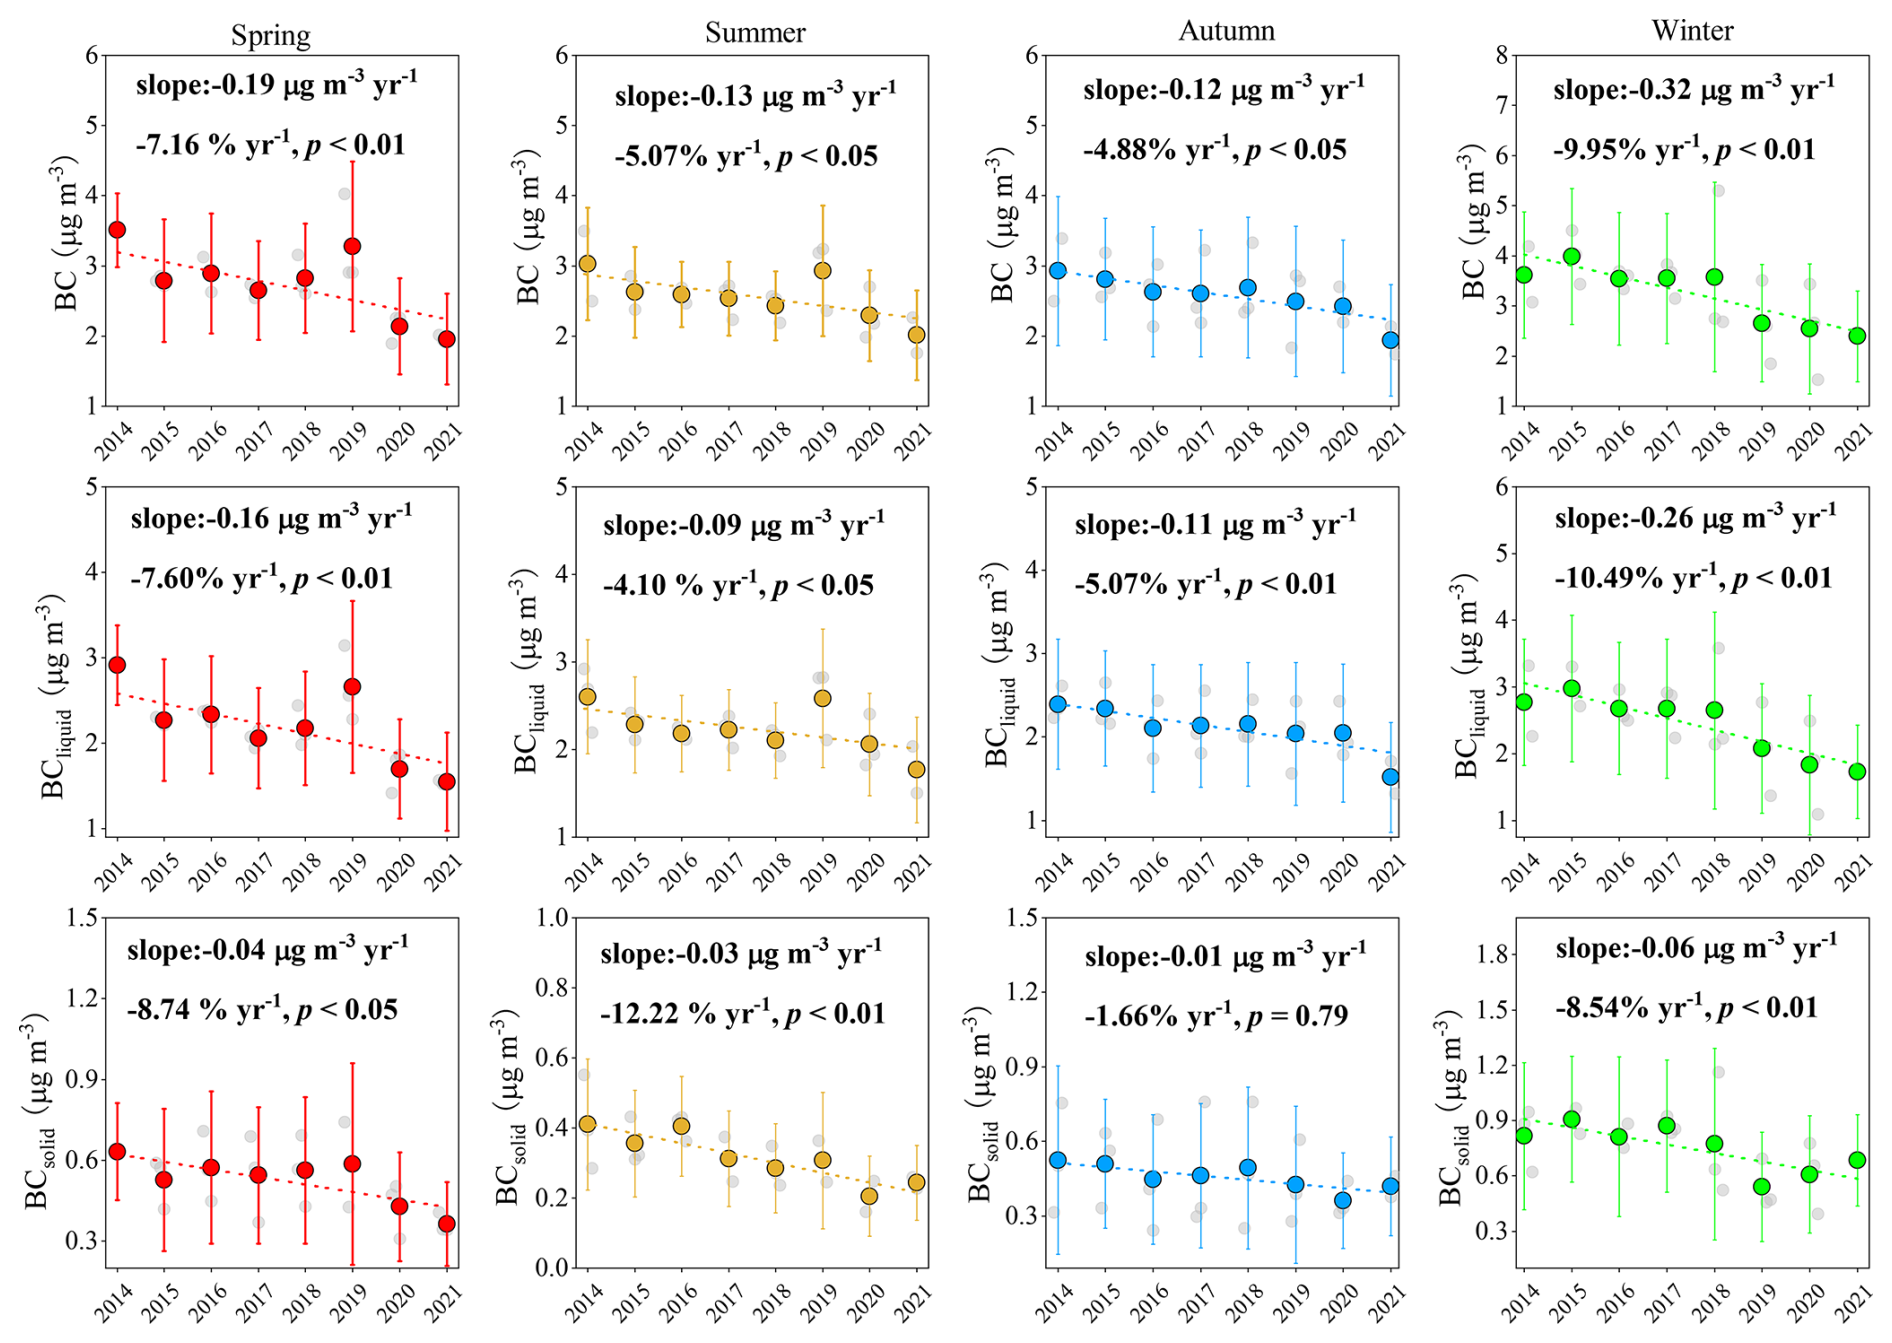
Figure 7Seasonal variation in (top row) BC, (middle row) BCliquid and (bottom row) BCsolid in spring, summer, autumn and winter. The circles in different colors represent the average concentration of BC, BCliquid and BCsolid. The vertical lines represent the standard deviations of BC, BCliquid and BCsolid. The grey circles in each panel represent the monthly average values.
3.4.3 The impact of emission and meteorology
In addition to changes in emissions, meteorological conditions can also affect the long-term trends of pollutants by influencing their long-range transport and processes of dry and wet deposition. To explore these impacts on the long-term trends of BC, the KZ filter was applied to distinguish between emission-related () and meteorology-related () trends. The daily averaged log-transformed original time series along with the decoupled short-term, baseline and seasonal components of BC are depicted in Fig. S11. The short-term component of BC displays notable fluctuations, while the seasonal component shows a clear cycle, with higher levels in winter and lower levels in summer. The largest variances for BC (69 %), BCliquid (73 %) and BCsolid (52 %) are found in the short-term component, reflecting the essential role of synoptic weather in the daily variations in primary aerosol content in Nanjing (Table S4). BCsolid exhibits seasonal dependence with a relatively high seasonal component (40 %) compared to BC (16 %) and BCliquid (12 %). The sum of variances explained by the short-term, seasonal and long-term components for BC, BCliquid and BCsolid is 93 %, 92 % and 92 %, respectively. A total variance close to 100 % indicates that these three components are largely independent of each other, suggesting that most of the meteorological influence has been effectively accounted and removed (Chen et al., 2019; Sun et al., 2022b; Zheng et al., 2020). To separate emission-related () and meteorology-related components () from the long-term component (ELT), multiple linear regression was conducted using the baseline component of meteorological parameters and BC. The model incorporating these meteorological parameters accurately reproduced the baseline of BCsolid (R2 = 0.84, p < 0.001). In contrast, it was less effective in explaining the baseline for BC (R2 = 0.59, p < 0.001) and BCliquid (R2 = 0.51, p < 0.001), suggesting that local emission changes across different seasons play an important role in impacting BC and BCliquid in Nanjing.
Figure S12 exhibits the long-term variation in and for BC, BCliquid and BCsolid, and the corresponding linear trends are summarized in Table 5. It is important to note that the linear trend slope of ELT represents the relative change rate (% yr−1) of the baseline concentration, since the original time series of BC was log-transformed before applying the KZ filter. To convert the fractional change rate into an absolute change rate (), it is multiplied by the average baseline concentration (not log-transformed). The ELT of BC and its distinct source exhibited significant (p < 0.01) declining trends, with slopes of −0.1, −0.08 and −0.02 for BC, BCliquid and BCsolid, respectively. BCliquid was the dominant contributor to BC reduction, accounting for 80 % of the overall decrease, suggesting that when the influence of seasonal and synoptic variations is excluded, its contribution to BC temporal variations becomes more evident. The emission-related components of BC, BCliquid and BCsolid exhibited similar long-term trends (Fig. S12). From 2014 to 2016, the emission-related trends remained relatively stable, reaching a lower level by the end of 2017. Subsequently, the emission-related components of BC, BCliquid and BCsolid increased, peaking in 2019, followed by a sharp decline until mid-2020 and then rebounding to another peak at the end of 2021, which may be related to the recovery of production activities following the pandemic. In contrast, meteorology-related trends of BC and BCliquid showed a sharp decrease after 2020, while BCsolid exhibited a downward trend between 2014 and 2021, with meteorology-related trends of BCsolid following a fluctuating downward pattern. In addition, the relative contributions of and to BC reduction were quantified by calculating the ratio of their absolute slopes to the slope of ELT (Zheng et al., 2023). Both meteorological conditions and emission reductions played crucial roles in reducing BC and its sources. While emission reductions dominated the decrease in BC concentrations throughout the study period, their relative influence compared to meteorological conditions varied between the P1 (before 2018) and P2 (after 2018) phases. As shown in Fig. 8, emission reductions played a more prominent role, contributing 78 %, 62 % and 86 % to the reductions in BC, BCliquid and BCsolid, respectively. However, during P2, meteorological conditions played a leading role in reducing BC and BCliquid, contributing 66 % and 70 %, respectively. Moreover, meteorology conditions had a notable impact on BCsolid in P2, with its contribution increasing from 14 % in P1 to 31 %. This suggests that the rapid reduction in BC in P2 was largely due to favorable meteorological conditions, which played a crucial role in facilitating its decline. It is worth noting that the impact of meteorological conditions on BCliquid and BCsolid differs significantly, especially in P2. While meteorology contributed 70 % to the reduction in BCliquid, its impact on BCsolid was only 31 %. This difference is because BCliquid, mainly from vehicle exhaust, remains stable year-round, whereas BCsolid, from activities like biomass burning and coal combustion, varies seasonally. The results of significance analysis further confirmed that there was no significant difference in BCliquid and BCsolid, while significant (p < 0.05) differences were observed in autumn and winter, when BCsolid emissions are more pronounced due to increased biomass burning and coal combustion activities (Fig. S13). This seasonal variability in emission sources explains the differing impacts of meteorology on BCliquid and BCsolid.
Table 5Linear trends of the long-term components of BC and its sources including BCliquid and BCsolid.
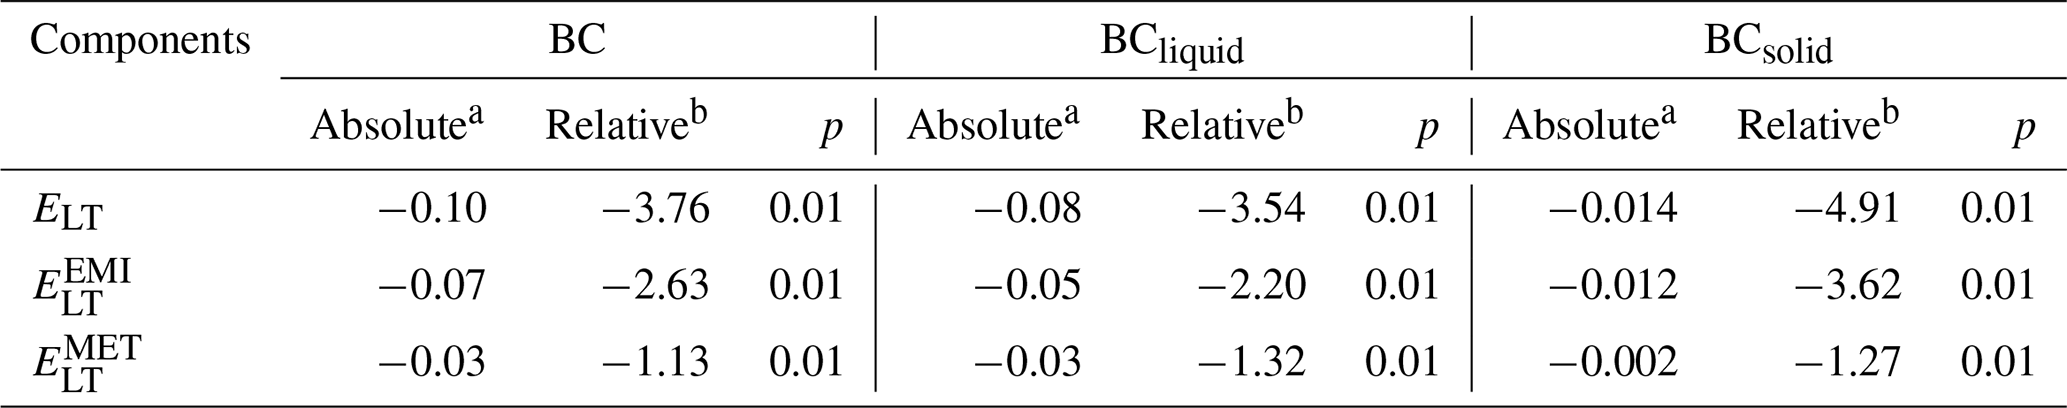
a . b % yr−1.
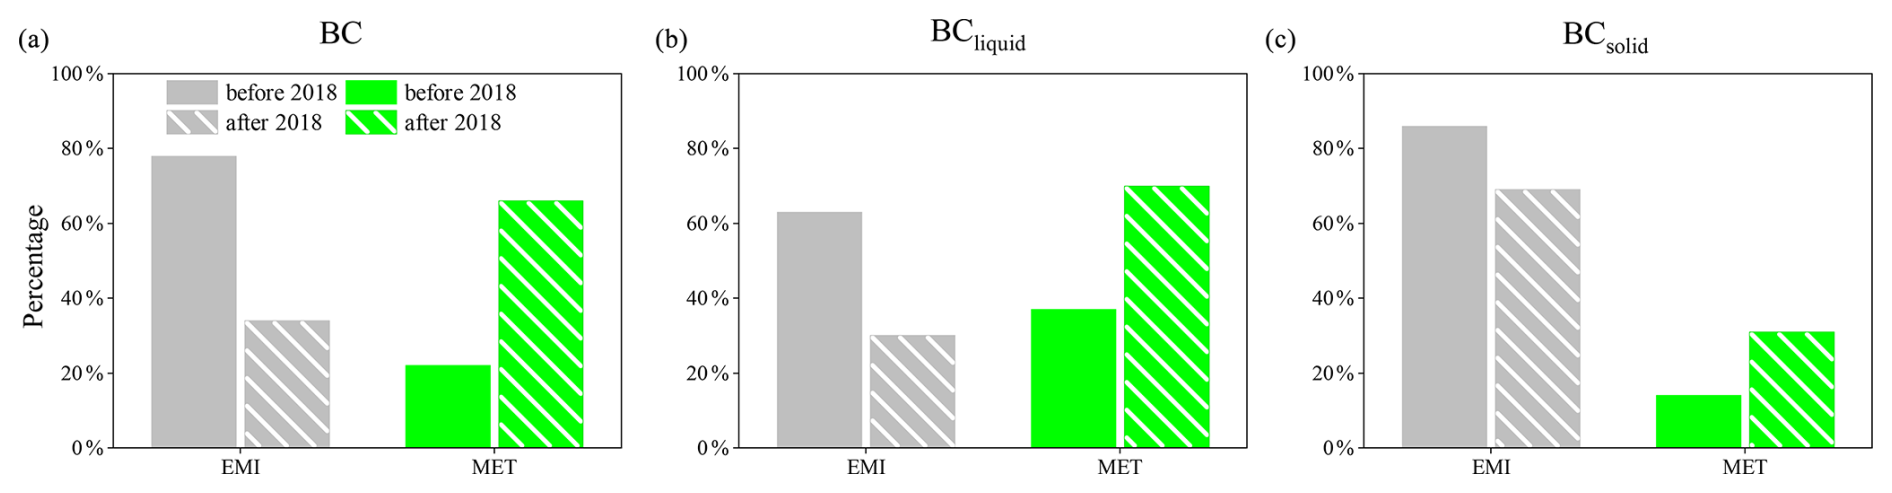
Figure 8Contributions of emission reduction policies and meteorological conditions to the decrease in BC concentrations before and after 2018. The (a)–(c) panels represent BC, BCliquid and BCsolid, respectively.
In this work, BC mass concentrations were continuously monitored in Nanjing, China, from 2019 to 2021. Combining observations with random forest algorithms, the BC concentrations from 2014–2021 were reconstructed to explore the long-term trends of BC and its sources during two distinct emission reduction periods. The results showed that BC concentrations were analyzed to reveal BC's characteristics and sources. The annual average BC mass concentration during the study period was 2.5 ± 1.6 µg m−3. Relatively high BC mass concentrations were found in winter, while no clear variation was observed during other seasons, implying a locally dominant BC source. Diurnal variations showed a bimodal pattern, with lower concentrations in the daytime and higher values at night, primarily influenced by traffic rush hours and boundary layer heights. Liquid fuel combustion contributed more than 75 % to BC in all years, with the highest contribution appearing in summer (85 %) and the lowest in winter (72 %).
The RF models explained over 90 % of the variation and accurately captured the seasonal cycle of BC at both wavelengths, demonstrating the strong predictive capability of the trained models. The long-term trends of BC, BCliquid and BCsolid all exhibited significant (p < 0.05) declines, with BCliquid contributing the most to the overall BC reduction, accounting for 77 % of the total decrease over the entire period. Notably, BC levels decreased most rapidly during winter, while the reduction in summer was much slower. The trend in BC reduction varied between two distinct phases: in P2 (after 2018), BC levels declined much more steeply compared to those in P1 (2014–2017), indicating that policies aimed at replacing coal with cleaner energy have been particularly effective in reducing primary pollutants. Over the entire period, emission reduction was the primary driver of BC reduction, contributing to BC, BCliquid and BCsolid reduction, with contributions of 70 %, 63 % and 86 %, respectively, while meteorological conditions accounted for 30 %, 37 % and 24 %, respectively. Although emission reduction dominated BC reduction over the entire period, the contributions of emission reduction and meteorological conditions to BC reduction differed between the two phases. In P1, emission reduction played a dominant role, while in P2, meteorological conditions became the primary driver of BC reduction. Our results highlight that to further reduce atmospheric BC, targeted policies should be implemented to restrict liquid fuel combustion, especially during the summer. Additionally, the impact of meteorological factors on BC concentrations should not be overlooked during emission reduction efforts.
The hourly meteorological reanalysis data of ERA5 are available from the ECMWF at https://doi.org/10.24381/cds.adbb2d47 (Hersbach et al., 2023). Hourly averaged concentrations of PM2.5, CO, SO2 and NO2 were obtained from China National Environmental Monitoring Centre https://quotsoft.net/air/ (CNEMC, 2025). All the observational and predicted data were openly accessible at the Open Science Framework at https://doi.org/10.17605/OSF.IO/8N32T (Abulimiti, 2025).
The supplement related to this article is available online at https://doi.org/10.5194/acp-25-6161-2025-supplement.
YZ designed the research. FC, MY and CG took part in data analysis and revised and commented on the paper. AA wrote the paper. YH analyzed the data. All authors contributed to the discussion of this paper.
The contact author has declared that none of the authors has any competing interests.
Publisher's note: Copernicus Publications remains neutral with regard to jurisdictional claims made in the text, published maps, institutional affiliations, or any other geographical representation in this paper. While Copernicus Publications makes every effort to include appropriate place names, the final responsibility lies with the authors.
The authors gratefully acknowledge the financial support of the National Natural Science Foundation of China.
This work was supported by the National Natural Science Foundation of China (grant nos. 42192512, 42325304, 42107123).
This paper was edited by Fangqun Yu and reviewed by Shuo Ding and one anonymous referee.
Abulimiti, A.: Data, OSF [data set], https://doi.org/10.17605/OSF.IO/8N32T, 2025.
Bauwens, M., Compernolle, S., Stavrakou, T., Müller, J.-F., van Gent, J., Eskes, H., Levelt, P. F., van der A, R., Veefkind, J. P., Vlietinck, J., Yu, H., and Zehner, C.: Impact of Coronavirus Outbreak on NO2 Pollution Assessed Using TROPOMI and OMI Observations, Geophys. Res. Lett., 47, e2020GL087978, https://doi.org/10.1029/2020GL087978, 2020.
Bond, T. C., Doherty, S. J., Fahey, D. W., Forster, P. M., Berntsen, T., DeAngelo, B. J., Flanner, M. G., Ghan, S., Kärcher, B., Koch, D., Kinne, S., Kondo, Y., Quinn, P. K., Sarofim, M. C., Schultz, M. G., Schulz, M., Venkataraman, C., Zhang, H., Zhang, S., Bellouin, N., Guttikunda, S. K., Hopke, P. K., Jacobson, M. Z., Kaiser, J. W., Klimont, Z., Lohmann, U., Schwarz, J. P., Shindell, D., Storelvmo, T., Warren, S. G., and Zender, C. S.: Bounding the role of black carbon in the climate system: A scientific assessment, J. Geophys. Res.-Atmos., 118, 5380–5552, https://doi.org/10.1002/jgrd.50171, 2013.
Cao, J. J., Zhu, C. S., Chow, J. C., Watson, J. G., Han, Y. M., Wang, G. H., Shen, Z. X., and An, Z. S.: Black carbon relationships with emissions and meteorology in Xi'an, China, Atmos. Res., 94, 194–202, https://doi.org/10.1016/j.atmosres.2009.05.009, 2009.
Chang, Y., Deng, C., Cao, F., Cao, C., Zou, Z., Liu, S., Lee, X., Li, J., Zhang, G., and Zhang, Y.: Assessment of carbonaceous aerosols in Shanghai, China – Part 1: long-term evolution, seasonal variations, and meteorological effects, Atmos. Chem. Phys., 17, 9945–9964, https://doi.org/10.5194/acp-17-9945-2017, 2017.
Chen, Z., Chen, D., Kwan, M.-P., Chen, B., Gao, B., Zhuang, Y., Li, R., and Xu, B.: The control of anthropogenic emissions contributed to 80 % of the decrease in PM2.5 concentrations in Beijing from 2013 to 2017, Atmos. Chem. Phys., 19, 13519–13533, https://doi.org/10.5194/acp-19-13519-2019, 2019.
Cheng, J., Su, J., Cui, T., Li, X., Dong, X., Sun, F., Yang, Y., Tong, D., Zheng, Y., Li, Y., Li, J., Zhang, Q., and He, K.: Dominant role of emission reduction in PM2.5 air quality improvement in Beijing during 2013–2017: a model-based decomposition analysis, Atmos. Chem. Phys., 19, 6125–6146, https://doi.org/10.5194/acp-19-6125-2019, 2019.
China National Environmental Monitoring Centre (CNEMC): https://air.cnemc.cn:18007/, last access: 18 June 2025.
Chow, J. C., Watson, J. G., Lowenthal, D. H., Antony Chen, L. W., and Motallebi, N.: PM2.5 source profiles for black and organic carbon emission inventories, Atmos. Environ., 45, 5407–5414, https://doi.org/10.1016/j.atmosenv.2011.07.011, 2011.
Chow, W. S., Liao, K., Huang, X. H. H., Leung, K. F., Lau, A. K. H., and Yu, J. Z.: Measurement report: The 10-year trend of PM2.5 major components and source tracers from 2008 to 2017 in an urban site of Hong Kong, China, Atmos. Chem. Phys., 22, 11557–11577, https://doi.org/10.5194/acp-22-11557-2022, 2022.
Dai, M., Zhu, B., Fang, C., Zhou, S., Lu, W., Zhao, D., Ding, D., Pan, C., and Liao, H.: Long-Term Variation and Source Apportionment of Black Carbon at Mt. Waliguan, China, J. Geophys. Res.-Atmos., 126, e2021JD035273, https://doi.org/10.1029/2021JD035273, 2021.
Dai, T., Dai, Q., Ding, J., Liu, B., Bi, X., Wu, J., Zhang, Y., and Feng, Y.: Measuring the Emission Changes and Meteorological Dependence of Source-Specific BC Aerosol Using Factor Analysis Coupled With Machine Learning, J. Geophys. Res.-Atmos., 128, e2023JD038696, https://doi.org/10.1029/2023JD038696, 2023.
Ding, A. J., Huang, X., Nie, W., Sun, J. N., Kerminen, V.-M., Petäjä, T., Su, H., Cheng, Y. F., Yang, X.-Q., Wang, M. H., Chi, X. G., Wang, J. P., Virkkula, A., Guo, W. D., Yuan, J., Wang, S. Y., Zhang, R. J., Wu, Y. F., Song, Y., Zhu, T., Zilitinkevich, S., Kulmala, M., and Fu, C. B.: Enhanced haze pollution by black carbon in megacities in China, Geophys. Res. Lett., 43, 2873–2879, https://doi.org/10.1002/2016GL067745, 2016.
Ding, S., Liu, D., Zhao, D., Tian, P., Huang, M., and Ding, D.: Characteristics of atmospheric black carbon and its wet scavenging in Nanning, South China, Sci. Total Environ., 904, 166747, https://doi.org/10.1016/j.scitotenv.2023.166747, 2023.
Ding, S., Zhao, D., Tian, P., and Huang, M.: Source apportionment and wet scavenging ability of atmospheric black carbon during haze in Northeast China, Environ. Pollut., 357, 124470, https://doi.org/10.1016/j.envpol.2024.124470, 2024.
Drinovec, L., Močnik, G., Zotter, P., Prévôt, A. S. H., Ruckstuhl, C., Coz, E., Rupakheti, M., Sciare, J., Müller, T., Wiedensohler, A., and Hansen, A. D. A.: The ”dual-spot” Aethalometer: an improved measurement of aerosol black carbon with real-time loading compensation, Atmos. Meas. Tech., 8, 1965–1979, https://doi.org/10.5194/amt-8-1965-2015, 2015.
Du, H., Li, J., Wang, Z., Chen, X., Yang, W., Sun, Y., Xin, J., Pan, X., Wang, W., Ye, Q., and Dao, X.: Assessment of the effect of meteorological and emission variations on winter PM2.5 over the North China Plain in the three-year action plan against air pollution in 2018–2020, Atmos. Res., 280, 106395, https://doi.org/10.1016/j.atmosres.2022.106395, 2022.
Dumka, U. C., Kaskaoutis, D. G., Devara, P. C. S., Kumar, R., Kumar, S., Tiwari, S., Gerasopoulos, E., and Mihalopoulos, N.: Year-long variability of the fossil fuel and wood burning black carbon components at a rural site in southern Delhi outskirts, Atmos. Res., 216, 11–25, https://doi.org/10.1016/j.atmosres.2018.09.016, 2019.
Fan, M.-Y., Hong, Y., Zhang, Y.-L., Sha, T., Lin, Y.-C., Cao, F., and Guo, H.: Increasing Nonfossil Fuel Contributions to Atmospheric Nitrate in Urban China from Observation to Prediction, Environ. Sci. Technol., 57, 18172–18182, https://doi.org/10.1021/acs.est.3c01651, 2023.
Fuller, G. W., Tremper, A. H., Baker, T. D., Yttri, K. E., and Butterfield, D.: Contribution of wood burning to PM10 in London, Atmos. Environ., 87, 87–94, https://doi.org/10.1016/j.atmosenv.2013.12.037, 2014.
Grange, S. K., Carslaw, D. C., Lewis, A. C., Boleti, E., and Hueglin, C.: Random forest meteorological normalisation models for Swiss PM10 trend analysis, Atmos. Chem. Phys., 18, 6223–6239, https://doi.org/10.5194/acp-18-6223-2018, 2018.
Gul, C., Mahapatra, P. S., Kang, S., Singh, P. K., Wu, X., He, C., Kumar, R., Rai, M., Xu, Y., and Puppala, S. P.: Black carbon concentration in the central Himalayas: Impact on glacier melt and potential source contribution, Environ. Pollut., 275, 116544, https://doi.org/10.1016/j.envpol.2021.116544, 2021.
He, C., Niu, X., Ye, Z., Wu, Q., Liu, L., Zhao, Y., Ni, J., Li, B., and Jin, J.: Black carbon pollution in China from 2001 to 2019: Patterns, trends, and drivers, Environ. Pollut., 324, 121381, https://doi.org/10.1016/j.envpol.2023.121381, 2023.
Helin, A., Niemi, J. V., Virkkula, A., Pirjola, L., Teinilä, K., Backman, J., Aurela, M., Saarikoski, S., Rönkkö, T., Asmi, E., and Timonen, H.: Characteristics and source apportionment of black carbon in the Helsinki metropolitan area, Finland, Atmos. Environ., 190, 87–98, https://doi.org/10.1016/j.atmosenv.2018.07.022, 2018.
Hersbach, H., Bell, B., Berrisford, P., Biavati, G., Horányi, A., Muñoz Sabater, J., Nicolas, J., Peubey, C., Radu, R., Rozum, I., Schepers, D., Simmons, A., Soci, C., Dee, D., and Thépaut, J.-N.: ERA5 hourly data on single levels from 1940 to present, Copernicus Climate Change Service (C3S) Climate Data Store (CDS) [data set], https://doi.org/10.24381/cds.adbb2d47, 2023.
Hong, Y., Zhang, Y., Bao, M., Fan, M., Lin, Y. C., Xu, R., Shu, Z., Wu, J. Y., Cao, F., Jiang, H., Cheng, Z., Li, J., and Zhang, G.: Nitrogen-Containing Functional Groups Dominate the Molecular Absorption of Water-Soluble Humic-Like Substances in Air From Nanjing, China Revealed by the Machine Learning Combined FT-ICR-MS Technique, J. Geophys. Res.-Atmos., 128, e2023JD039459, https://doi.org/10.1029/2023JD039459, 2023.
Huang, Z.-J., Li, H., Luo, J.-Y., Li, S., and Liu, F.: Few-Shot Learning-Based, Long-Term Stable, Sensitive Chemosensor for On-Site Colorimetric Detection of Cr(VI), Anal. Chem., 95, 6156–6162, https://doi.org/10.1021/acs.analchem.3c00604, 2023.
IPCC: Climate Change 2022 – Impacts, Adaptation and Vulnerability: Working Group II Contribution to the Sixth Assessment Report of the Intergovernmental Panel on Climate Change, Cambridge University Press, Cambridge, https://doi.org/10.1017/9781009325844, 2023.
Jing, A., Zhu, B., Wang, H., Yu, X., An, J., and Kang, H.: Source apportionment of black carbon in different seasons in the northern suburb of Nanjing, China, Atmos. Environ., 201, 190–200, https://doi.org/10.1016/j.atmosenv.2018.12.060, 2019.
Lee, B. P., Louie, P. K. K., Luk, C., and Chan, C. K.: Evaluation of traffic exhaust contributions to ambient carbonaceous submicron particulate matter in an urban roadside environment in Hong Kong, Atmos. Chem. Phys., 17, 15121–15135, https://doi.org/10.5194/acp-17-15121-2017, 2017.
Li, L., Li, Q., Huang, L., Wang, Q., Zhu, A., Xu, J., Liu, Z., Li, H., Shi, L., Li, R., Azari, M., Wang, Y., Zhang, X., Liu, Z., Zhu, Y., Zhang, K., Xue, S., Ooi, M. C. G., Zhang, D., and Chan, A.: Air quality changes during the COVID-19 lockdown over the Yangtze River Delta Region: An insight into the impact of human activity pattern changes on air pollution variation, Sci. Total Environ., 732, 139282, https://doi.org/10.1016/j.scitotenv.2020.139282, 2020.
Li, R., Han, Y., Wang, L., Shang, Y., and Chen, Y.: Differences in oxidative potential of black carbon from three combustion emission sources in China, J. Environ. Manage., 240, 57–65, https://doi.org/10.1016/j.jenvman.2019.03.070, 2019.
Li, W., Liu, X., Duan, F., Qu, Y., and An, J.: A one-year study on black carbon in urban Beijing: Concentrations, sources and implications on visibility, Atmos. Pollut. Res., 13, 101307, https://doi.org/10.1016/j.apr.2021.101307, 2022.
Li, Y., Lei, L., Sun, J., Gao, Y., Wang, P., Wang, S., Zhang, Z., Du, A., Li, Z., Wang, Z., Kim, J. Y., Kim, H., Zhang, H., and Sun, Y.: Significant Reductions in Secondary Aerosols after the Three-Year Action Plan in Beijing Summer, Environ. Sci. Technol., 57, 15945–15955, https://doi.org/10.1021/acs.est.3c02417, 2023.
Lin, Y.-C., Zhang, Y.-L., Xie, F., Fan, M.-Y., and Liu, X.: Substantial decreases of light absorption, concentrations and relative contributions of fossil fuel to light-absorbing carbonaceous aerosols attributed to the COVID-19 lockdown in east China, Environ. Pollut., 275, 116615, https://doi.org/10.1016/j.envpol.2021.116615, 2021.
Liu, D., He, C., Schwarz, J. P., and Wang, X.: Lifecycle of light-absorbing carbonaceous aerosols in the atmosphere, npj Climate and Atmospheric Science, 3, 40, https://doi.org/10.1038/s41612-020-00145-8, 2020a.
Liu, D., Ding, S., Zhao, D., Hu, K., Yu, C., Hu, D., Wu, Y., Zhou, C., Tian, P., Liu, Q., Wu, Y., Zhang, J., Kong, S., Huang, M., and Ding, D.: Black Carbon Emission and Wet Scavenging From Surface to the Top of Boundary Layer Over Beijing Region, J. Geophys. Res.-Atmos., 125, e2020JD033096, https://doi.org/10.1029/2020JD033096, 2020b.
Liu, S., Geng, G., Xiao, Q., Zheng, Y., Liu, X., Cheng, J., and Zhang, Q.: Tracking Daily Concentrations of PM2.5 Chemical Composition in China since 2000, Environ. Sci. Technol., 56, 16517–16527, https://doi.org/10.1021/acs.est.2c06510, 2022.
Liu, Y., Yan, C., and Zheng, M.: Source apportionment of black carbon during winter in Beijing, Sci. Total Environ., 618, 531–541, https://doi.org/10.1016/j.scitotenv.2017.11.053, 2018.
Lundberg, S. M. and Lee, S.-I.: A unified approach to interpreting model predictions, Adv. Neur. Inf., 30, 4765–4774, https://doi.org/10.5555/3295222.3295230, 2017.
Qin, Y., Ye, J., Ohno, P., Liu, P., Wang, J., Fu, P., Zhou, L., Li, Y. J., Martin, S. T., and Chan, C. K.: Assessing the Nonlinear Effect of Atmospheric Variables on Primary and Oxygenated Organic Aerosol Concentration Using Machine Learning, ACS Earth Space Chem., 6, 1059–1066, https://doi.org/10.1021/acsearthspacechem.1c00443, 2022.
Ramanathan, V. and Carmichael, G.: Global and regional climate changes due to black carbon, Nat. Geosci., 1, 221–227, https://doi.org/10.1038/ngeo156, 2008.
Ran, L., Deng, Z. Z., Wang, P. C., and Xia, X. A.: Black carbon and wavelength-dependent aerosol absorption in the North China Plain based on two-year aethalometer measurements, Atmos. Environ., 142, 132–144, https://doi.org/10.1016/j.atmosenv.2016.07.014, 2016.
Sandradewi, J., Prévôt, A. S. H., Szidat, S., Perron, N., Alfarra, M. R., Lanz, V. A., Weingartner, E., and Baltensperger, U.: Using Aerosol Light Absorption Measurements for the Quantitative Determination of Wood Burning and Traffic Emission Contributions to Particulate Matter, Environ. Sci. Technol., 42, 3316–3323, https://doi.org/10.1021/es702253m, 2008.
Sarigiannis, D., Karakitsios, S. P., Zikopoulos, D., Nikolaki, S., and Kermenidou, M.: Lung cancer risk from PAHs emitted from biomass combustion, Environ. Res., 137, 147–156, https://doi.org/10.1016/j.envres.2014.12.009, 2015.
Seo, J., Park, D.-S. R., Kim, J. Y., Youn, D., Lim, Y. B., and Kim, Y.: Effects of meteorology and emissions on urban air quality: a quantitative statistical approach to long-term records (1999–2016) in Seoul, South Korea, Atmos. Chem. Phys., 18, 16121–16137, https://doi.org/10.5194/acp-18-16121-2018, 2018.
Sun, J., Wang, Z., Zhou, W., Xie, C., Wu, C., Chen, C., Han, T., Wang, Q., Li, Z., Li, J., Fu, P., Wang, Z., and Sun, Y.: Measurement report: Long-term changes in black carbon and aerosol optical properties from 2012 to 2020 in Beijing, China, Atmos. Chem. Phys., 22, 561–575, https://doi.org/10.5194/acp-22-561-2022, 2022a.
Sun, X., Zhao, T., Bai, Y., Kong, S., Zheng, H., Hu, W., Ma, X., and Xiong, J.: Meteorology impact on PM2.5 change over a receptor region in the regional transport of air pollutants: observational study of recent emission reductions in central China, Atmos. Chem. Phys., 22, 3579–3593, https://doi.org/10.5194/acp-22-3579-2022, 2022b.
Wang, Y., Yuan, Y., Wang, Q., Liu, C., Zhi, Q., and Cao, J.: Changes in air quality related to the control of coronavirus in China: Implications for traffic and industrial emissions, Sci. Total Environ., 731, 139133, https://doi.org/10.1016/j.scitotenv.2020.139133, 2020.
Wei, C., Wang, M. H., Fu, Q. Y., Dai, C., Huang, R., and Bao, Q.: Temporal Characteristics and Potential Sources of Black Carbon in Megacity Shanghai, China, J. Geophys. Res.-Atmos., 125, e2019JD031827, https://doi.org/10.1029/2019JD031827, 2020.
Wise, E. K. and Comrie, A. C.: Extending the Kolmogorov–Zurbenko Filter: Application to Ozone, Particulate Matter, and Meteorological Trends, J. Air Waste Manage., 55, 1208–1216, https://doi.org/10.1080/10473289.2005.10464718, 2005.
Wu, B., Wu, C., Ye, Y., Pei, C., Deng, T., Li, Y. J., Lu, X., Wang, L., Hu, B., Li, M., and Wu, D.: Long-term hourly air quality data bridging of neighboring sites using automated machine learning: A case study in the Greater Bay area of China, Atmos. Environ., 321, 120347, https://doi.org/10.1016/j.atmosenv.2024.120347, 2024.
Xiao, S., Yu, X., Zhu, B., Kumar, K. R., Li, M., and Li, L.: Characterization and source apportionment of black carbon aerosol in the Nanjing Jiangbei New Area based on two years of measurements from Aethalometer, J. Aerosol Sci., 139, 105461, https://doi.org/10.1016/j.jaerosci.2019.105461, 2020.
Yao, X., Chan, C. K., Fang, M., Cadle, S., Chan, T., Mulawa, P., He, K., and Ye, B.: The water-soluble ionic composition of PM2.5 in Shanghai and Beijing, China, Atmos. Environ., 36, 4223–4234, https://doi.org/10.1016/S1352-2310(02)00342-4, 2002.
Yin, C., Deng, X., Zou, Y., Solmon, F., Li, F., and Deng, T.: Trend analysis of surface ozone at suburban Guangzhou, China, Sci. Total Environ., 695, 133880, https://doi.org/10.1016/j.scitotenv.2019.133880, 2019.
Yu, M., Zhang, Y.-L., Xie, T., Song, W., Lin, Y.-C., Zhang, Y., Cao, F., Yang, C., and Szidat, S.: Quantification of fossil and non-fossil sources to the reduction of carbonaceous aerosols in the Yangtze River Delta, China: Insights from radiocarbon analysis during 2014–2019, Atmos. Environ., 292, 119421, https://doi.org/10.1016/j.atmosenv.2022.119421, 2023.
Zhang, L., Shen, F., Gao, J., Cui, S., Yue, H., Wang, J., Chen, M., and Ge, X.: Characteristics and potential sources of black carbon particles in suburban Nanjing, China, Atmos. Pollut. Res., 11, 981–991, https://doi.org/10.1016/j.apr.2020.02.011, 2020.
Zhang, Q., Streets, D. G., Carmichael, G. R., He, K. B., Huo, H., Kannari, A., Klimont, Z., Park, I. S., Reddy, S., Fu, J. S., Chen, D., Duan, L., Lei, Y., Wang, L. T., and Yao, Z. L.: Asian emissions in 2006 for the NASA INTEX-B mission, Atmos. Chem. Phys., 9, 5131–5153, https://doi.org/10.5194/acp-9-5131-2009, 2009.
Zhang, Q., Zheng, Y., Tong, D., Shao, M., Wang, S., Zhang, Y., Xu, X., Wang, J., He, H., Liu, W., Ding, Y., Lei, Y., Li, J., Wang, Z., Zhang, X., Wang, Y., Cheng, J., Liu, Y., Shi, Q., Yan, L., Geng, G., Hong, C., Li, M., Liu, F., Zheng, B., Cao, J., Ding, A., Gao, J., Fu, Q., Huo, J., Liu, B., Liu, Z., Yang, F., He, K., and Hao, J.: Drivers of improved PM2.5 air quality in China from 2013 to 2017, P. Natl. Acad. Sci. USA, 116, 24463–24469, https://doi.org/10.1073/pnas.1907956116, 2019.
Zhang, X., Rao, R., Huang, Y., Mao, M., Berg, M. J., and Sun, W.: Black carbon aerosols in urban central China, J. Quant. Spectrosc. Ra., 150, 3–11, https://doi.org/10.1016/j.jqsrt.2014.03.006, 2015.
Zhang, Y.-L., Li, J., Zhang, G., Zotter, P., Huang, R.-J., Tang, J.-H., Wacker, L., Prévôt, A. S. H., and Szidat, S.: Radiocarbon-Based Source Apportionment of Carbonaceous Aerosols at a Regional Background Site on Hainan Island, South China, Environ. Sci. Technol., 48, 2651–2659, https://doi.org/10.1021/es4050852, 2014.
Zhao, C., Wang, Q., Ban, J., Liu, Z., Zhang, Y., Ma, R., Li, S., and Li, T.: Estimating the daily PM2.5 concentration in the Beijing-Tianjin-Hebei region using a random forest model with a 0.01° × 0.01° spatial resolution, Environ. Int., 134, 105297, https://doi.org/10.1016/j.envint.2019.105297, 2020.
Zheng, H., Kong, S. F., Zheng, M. M., Yan, Y., Yao, L., Zheng, S., Yan, Q., Wu, J., Cheng, Y., Chen, N., Bai, Y., Zhao, T., Liu, D., Zhao, D., and Qi, S.: A 5.5-year observations of black carbon aerosol at a megacity in Central China: Levels, sources, and variation trends, Atmos. Environ., 232, 117581, https://doi.org/10.1016/j.atmosenv.2020.117581, 2020.
Zheng, H., Kong, S., Zhai, S., Sun, X., Cheng, Y., Yao, L., Song, C., Zheng, Z., Shi, Z., and Harrison, R. M.: An intercomparison of weather normalization of PM2.5 concentration using traditional statistical methods, machine learning, and chemistry transport models, npj Climate and Atmospheric Science, 6, 214, https://doi.org/10.1038/s41612-023-00536-7, 2023.
Zhou, B., Wang, Q., Zhou, Q., Zhang, Z., Wang, G., Fang, N., Li, M., and Cao, J.: Seasonal Characteristics of Black Carbon Aerosol and its Potential Source Regions in Baoji, China, Aerosol Air Qual. Res., 18, 397–406, https://doi.org/10.4209/aaqr.2017.02.0070, 2018.
Zhou, Y., Ma, X., Tian, R., and Wang, K.: Seasonal transition of Black carbon aerosols over Qinghai-Tibet Plateau: Simulations with WRF-Chem, Atmos. Environ., 308, 119866, https://doi.org/10.1016/j.atmosenv.2023.119866, 2023.
Zhu, C., Kanaya, Y., Takigawa, M., Ikeda, K., Tanimoto, H., Taketani, F., Miyakawa, T., Kobayashi, H., and Pisso, I.: FLEXPART v10.1 simulation of source contributions to Arctic black carbon, Atmos. Chem. Phys., 20, 1641–1656, https://doi.org/10.5194/acp-20-1641-2020, 2020.
Zhuang, B. L., Wang, T. J., Liu, J., Li, S., Xie, M., Yang, X. Q., Fu, C. B., Sun, J. N., Yin, C. Q., Liao, J. B., Zhu, J. L., and Zhang, Y.: Continuous measurement of black carbon aerosol in urban Nanjing of Yangtze River Delta, China, Atmos. Environ., 89, 415–424, https://doi.org/10.1016/j.atmosenv.2014.02.052, 2014.
Zong, Z., Wang, X., Tian, C., Chen, Y., Qu, L., Ji, L., Zhi, G., Li, J., and Zhang, G.: Source apportionment of PM2.5 at a regional background site in North China using PMF linked with radiocarbon analysis: insight into the contribution of biomass burning, Atmos. Chem. Phys., 16, 11249–11265, https://doi.org/10.5194/acp-16-11249-2016, 2016.
Zotter, P., Herich, H., Gysel, M., El-Haddad, I., Zhang, Y., Močnik, G., Hüglin, C., Baltensperger, U., Szidat, S., and Prévôt, A. S. H.: Evaluation of the absorption Ångström exponents for traffic and wood burning in the Aethalometer-based source apportionment using radiocarbon measurements of ambient aerosol, Atmos. Chem. Phys., 17, 4229–4249, https://doi.org/10.5194/acp-17-4229-2017, 2017.