the Creative Commons Attribution 4.0 License.
the Creative Commons Attribution 4.0 License.
 | 12 Jun 2025
Short-lived organic nitrates in a suburban temperate forest: an indication of efficient assimilation of reactive nitrogen by the biosphere?
Simone T. Andersen
Rolf Sander
Patrick Dewald
Laura Wüst
Tobias Seubert
Gunther N. T. E. Türk
Jan Schuladen
Max R. McGillen
Chaoyang Xue
Abdelwahid Mellouki
Alexandre Kukui
Vincent Michoud
Manuela Cirtog
Mathieu Cazaunau
Astrid Bauville
Hichem Bouzidi
Paola Formenti
Cyrielle Denjean
Jean-Claude Etienne
Olivier Garrouste
Christopher Cantrell
Jos Lelieveld
Alkyl nitrates (ANs) and peroxycarboxylic nitric anhydrides (PANs) are important reservoirs of reactive nitrogen that contribute significantly to the rate of formation and growth of secondary organic aerosols and support the transport of reactive nitrogen from polluted areas to remote areas. It is therefore critical to understand their sources and sinks in different environments. In this study we use measurements of OH, O3, NO3 reactivity, volatile organic compounds, ∑ANs and ∑PANs during the ACROSS (Atmospheric ChemistRy Of the Suburban foreSt) campaign to investigate different production and loss processes of ANs and PANs in a temperate forest. During the daytime OH-initiated processes were the dominant source of ANs (69 %–72 %), followed by NO3 (18 %–20 %) and O3 (8 %–12 %). During the nighttime the contribution from OH decreased to 43 %–53 %, and NO3 increased to 26 %–40 % with that of O3 largely unchanged. Of the measured ∑PANs, 48 %–78 % were modelled to be peroxyacetic nitric anhydride (PAN, commonly known as peroxyacetyl nitrate). Physical loss (e.g. deposition) was an important sink for both ANs and PANs and contributed significantly to the very short lifetimes of 1–4 h for ANs and 0.08–1.5 h for PANs observed during the campaign.
- Article
(1973 KB) - Full-text XML
-
Supplement
(1523 KB) - BibTeX
- EndNote


Approximately 1000 Tg of biogenic volatile organic compounds (BVOCs) is emitted into the atmosphere annually, whereof ∼ 50 % is isoprene and ∼ 15% is monoterpenes (Guenther et al., 2012). The oxidation of BVOCs is initiated by ozone (O3) and the hydroxyl (OH) and nitrate (NO3) radicals. When BVOCs are oxidized in the presence of (largely anthropogenic) NOx, they lead to the formation of alkyl nitrates (RONO2, ANs) and peroxycarboxylic nitric anhydrides (RC(O)O2NO2, PANs) as illustrated in Fig. 1. Note that the term PANs includes the most common carboxylic nitrate (CH3C(O)O2NO2, commonly referred to as PAN). ANs are produced in the daytime in a minor branch of the reaction between organic peroxy radicals (RO2), which do not have an α-carbonyl group and nitrogen oxide (NO, Lightfoot et al., 1992), and through the reaction of unsaturated BVOCs with NO3 during the nighttime. Recent studies suggest that the NO3-initiated oxidation of BVOCs during the day could also be an important pathway for the formation of alkyl nitrates (Liebmann et al., 2019; Ayres et al., 2015; Liebmann et al., 2018a, b; Dewald et al., 2024). PANs are formed when α-carbonyl peroxy radicals (RC(O)O2) react with nitrogen dioxide (NO2). The stability of PANs is highly temperature-dependent, resulting in boundary layer lifetimes of the order of hours at temperate mid-latitudes with respect to dissociation to RC(O)O2 and NO2 (IUPAC Task Group, 2024).
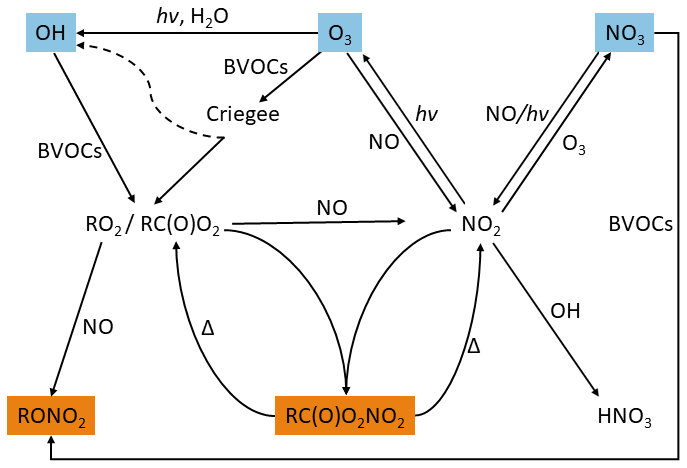
Figure 1Schematic diagram showing the formation of PANs (RC(O)O2NO2) and ANs (RONO2) from the oxidation of VOCs by OH, O3 and NO3. Reactions of RO2 not relevant to the formation of RC(O)O2NO2 and RONO2 have been left out. Note that the scheme does not attempt to capture all formation routes of the primary oxidants, especially those of the OH radical, which may additionally be formed in, for example, reactions of HO2 with NO and photolysis of HONO.
The yield of alkyl nitrates in the RO2 + NO reaction strongly depends on the composition of BVOCs in the atmosphere, the oxidant that initiates the degradation of the BVOC (OH, O3 or NO3), and the ratio of NO to other reactants with which the RO2 can react such as NO2, HO2 and other RO2 (IUPAC Task Group, 2024; Perring et al., 2013; Wennberg et al., 2018; Hallquist et al., 1999; Fry et al., 2014). The yield of the PANs formed from the corresponding α-carbonyl peroxy radical depends only on the fraction of RC(O)O2 that reacts with NO2 as opposed to reacting with HO2 or NO. Production and loss processes of ANs and PANs are described in detail through reaction mechanisms and equations in Sect. 3.1–3.3 and 3.6, respectively.
The formation of ANs and PANs serves to sequester reactive nitrogen (NOx = NO + NO2) into reservoir species, which can release NOx following transport to regions remote from NOx sources; both can also be removed from the lowermost atmosphere through deposition, which thus represents a sink of NOx in the atmosphere. As NO2 is formed from primary emitted NO and its photolysis drives the formation of O3, understanding the fate of NOx is critical for predicting O3 levels in the troposphere. It has additionally been shown that ANs contribute significantly to the rate of formation and growth of secondary organic aerosols (SOAs), thereby impacting human health and air quality (Hallquist et al., 2009; Shiraiwa et al., 2017; Kanakidou et al., 2005).
This study investigates the production and loss of PANs and ANs in an anthropogenically impacted temperate forest using field measurements of BVOCs, oxidants (OH, O3 and NO3), products (PANs and ANs) and meteorological data. The lifetimes of PANs and ANs are derived from their production rates and measured total mixing ratios.
2.1 Site description
The measurements used in this study were conducted at the Rambouillet forest site located approximately 50 km southwest of Paris, France (48.687° N, 1.704° E), during the ACROSS (Atmospheric ChemistRy Of the Suburban foreSt) campaign between 13 June and 25 July 2022 (Cantrell and Michoud, 2022). The forest consists of approximately 70 % oak, 20 % pine, and small contributions from beech and chestnut. The top of the forest canopy around the site was approximately 20–25 m. A 40 m measurement tower and multiple containers with a large variety of instruments were located in a roughly quadratic clearing (26.5 m × 26.3 m, ∼ 697 m2) as shown in Fig. S1 in the Supplement. The 48 h HYSPLIT back trajectories showed that the air masses sampled during the campaign passed either over the Atlantic Ocean or continental regions in Europe before reaching the site (Draxler and Rolph, 2011; Andersen et al., 2024). All the instruments used in this study are described briefly below.
2.2 Measurements
2.2.1 Reactive nitrogen and O3
NO2, total peroxycarboxylic nitric anhydrides (∑PANs), total alkyl nitrates (∑ANs), NO3 reactivity () and O3 were measured by instruments inside the MPIC (Max Planck Institute for Chemistry) container with co-located inlets sampling from a high-volume-flow stainless-steel tube (10 m3 min−1; 15 cm diameter, 0.2 s residence time) taking air from a height of 5.4 m above ground.
A five-channel thermal dissociation cavity ring-down spectrometer (5CH-TD-CRDS, Sobanski et al., 2016) was used to measure NO2, ∑PANs and ∑ANs. NO2 was measured directly at 408 nm with a limit of detection (LOD) of 9.7 parts per trillion by volume (pptv) for 1 min averaging (3σ) and a total uncertainty of 7 % + 9.7 pptv + (20 pptv × ). ∑PANs and ∑ANs were thermally dissociated to NO2 by heating their separate inlets to 448 and 648 K, respectively, followed by detection of NO2 at 408 nm. Numerical simulations were run for both ∑PANs and ∑ANs to correct for NO2 loss via recombination with RO2, the reactions of peroxy radicals with ambient NO, NO oxidation to NO2 by O3, and pyrolysis of O3 (Thieser et al., 2016; Sobanski et al., 2016). The majority of the correction factors for both ∑PANs and ∑ANs were between 0.9 and 1.2 as shown in Fig. S2, which is consistent with low NOx levels. The LOD was determined to be 6.3 and 8.6 pptv for ∑PANs and ∑ANs for 10 min averaging (3σ of the noise on the zero measurements), respectively, and the total uncertainty was 21 % + 6.3 pptv and 28 % + 8.6 pptv. A time series of NO2, ∑PANs and ∑ANs is shown in Fig. 2. Two additional cavities, operated at 662 nm, measured NO3 and (via thermal dissociation to NO3, 373 K) N2O5 (Sobanski et al., 2016). NO3 was throughout the campaign below the LOD of 0.25 pptv for 1 min averaging, and N2O5 was only detected above the LOD of 0.9 pptv on five nights, and only one of those nights had consistently high N2O5 for more than an hour. NO3 and N2O5 data are therefore not presented or used in this study.
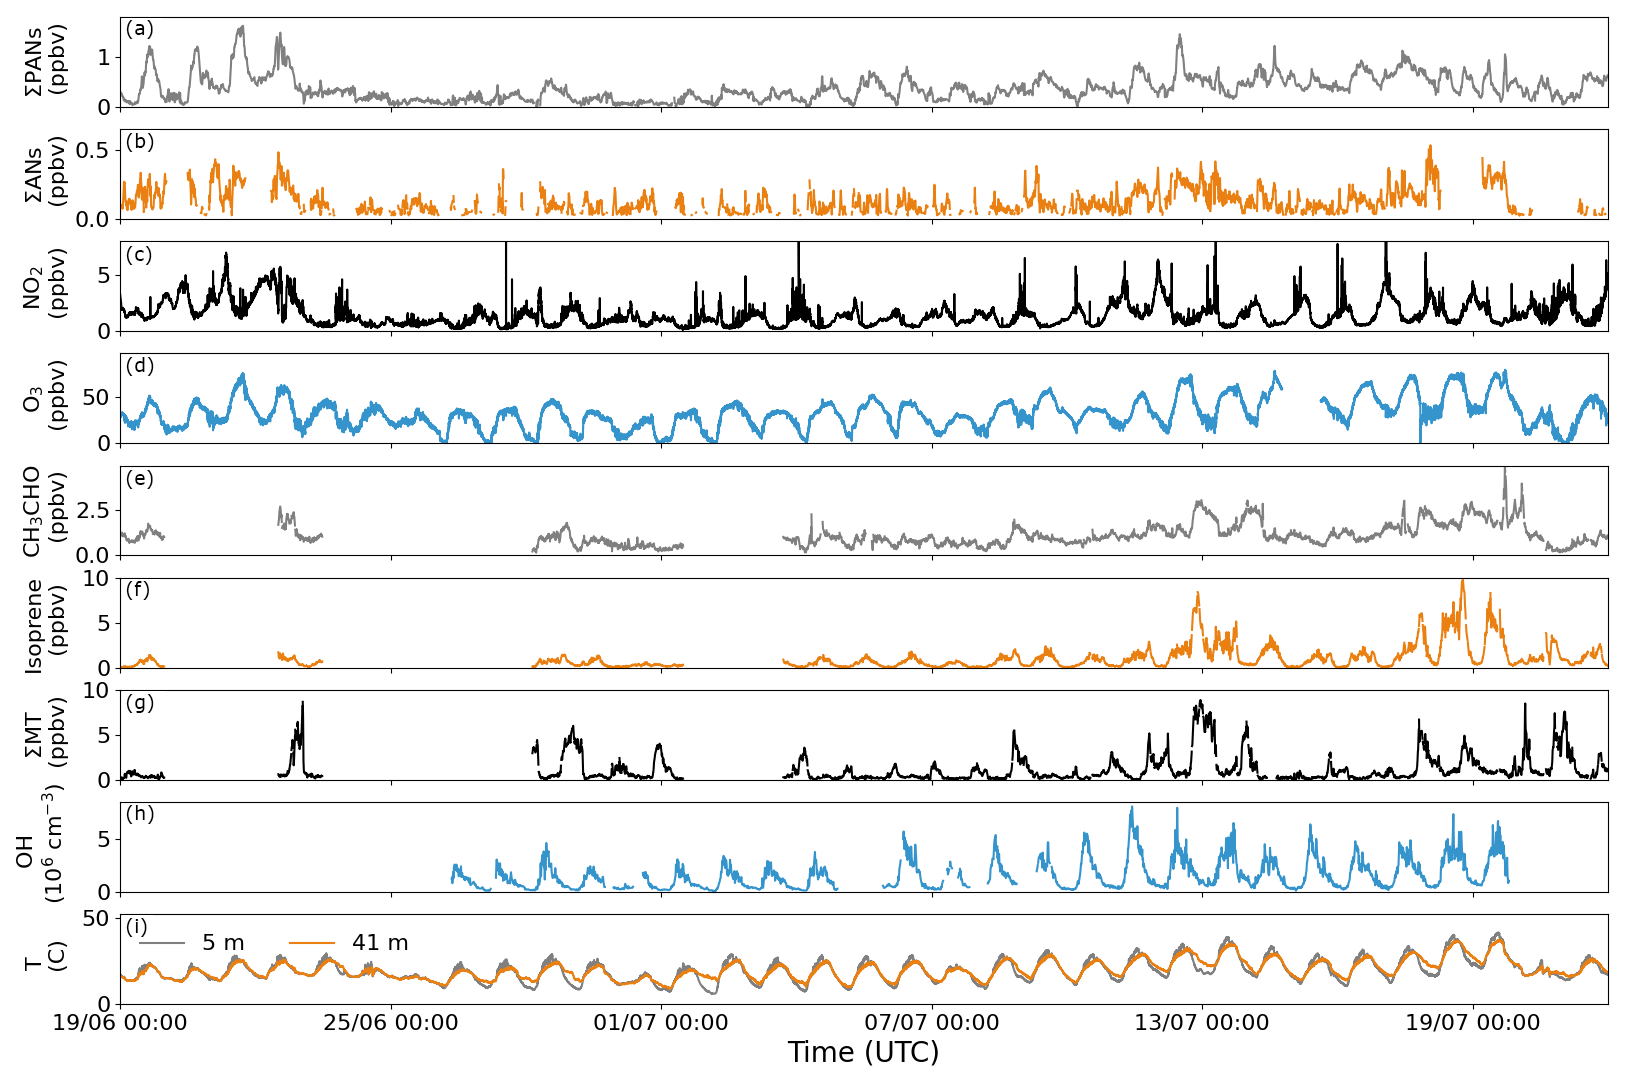
Figure 2Time series of 10 min averages of ∑PANs, ∑ANs, acetaldehyde, isoprene, and sum of monoterpenes (∑MT); 12 min averages of OH radicals; and 1 min averages of NO2, O3, and temperature at 5 and 41 m during the ACROSS campaign.
A second CRDS instrument was used primarily to measure the NO3 reactivity towards VOCs in the forest, but it also has a cavity operated at 405 nm for the measurement of NO2 (Liebmann et al., 2018b). The ambient NO3 reactivity was quantified by a CRDS measurement (at 662 nm) of in situ-generated NO3 after its residence in a flow tube reactor when mixed with either synthetic or ambient air. A numerical simulation procedure was used to correct the measurements for competing reactions taking place inside the flow tube in order to extract the VOC contribution to the measured NO3 consumption. A detailed analysis of the NO3 reactivity measurements is presented in Dewald et al. (2024). During the ACROSS campaign, the reactivity of NO3 towards organics was dominated by those of biogenic origin, so henceforth we refer to this as kBVOC.
O3 was measured with a commercial instrument (2B Technologies model 205) using UV absorption at ∼ 254 nm. The LOD is 2 ppbv for 10 s averaging time. A time series of O3 can be observed in Fig. 2.
NO was measured using a commercial chemiluminescence instrument (Ecophysics CLD 780 TR, henceforth CLD) with an LOD of 10 pptv for 1 min averaging time. The sampling height for NO measurements was about 3.2 m above the ground surface, and the inlet was approximately 17 m from the MPIC container at the ICARE-LPC2E container in Fig. S1. The NO measurements were corrected for a change in the CLD sensitivity during the campaign caused by an interruption in the instrument's oxygen supply as described in Andersen et al. (2024).
2.2.2 OH and XO2 (HO2 + RO2)
The OH radical was measured by its conversion (via reaction with isotopically labelled SO2) to H2SO4, which was subsequently detected using nitrate chemical ionization mass spectrometry (Eisele and Tanner, 1991). The lower limit of detection for OH radicals at signal-to-noise ratio () = 3 and a 15 min integration time was 5 × 10⁴ molec. cm−3. The sum of peroxy radicals, XO2 = HO2 + RO2, was measured by their conversion to OH in the presence of NO. The OH calibration coefficient was determined using N2O actinometry and OH generation in a turbulent flow reactor by photolysis of N2O or H2O at 184.9 nm (Kukui et al., 2008). The calibration of HO2, CH3O2 and other RO2 was performed by adding into the calibration reactor CO, CH4 (or other RO2 precursors) converting OH to RO2. The overall estimated calibration accuracy (2σ) for OH is about 25 % and about 30 % for calibrated XO2, although the uncertainty of the XO2 measurements is typically higher due to variable detection efficiency (i.e. yields of OH) of different XO2. Peroxy radicals derived from terpene oxidation will be detected with a lower efficiency than, for example, short-chained RO2 so that the XO2 measurements during ACROSS should be regarded as lower limits. The lower limit of detection for XO2 radicals at = 3 and a 4 min integration time is 2 × 10⁶ molec. cm−3. The background signal is determined by adding OH and a XO2 scavenger, NO2 in this case, before their conversion to H2SO4. As discussed in Kukui et al. (2021), formation of H2SO4 in the reaction of stabilized Criegee intermediates (SCI) with SO2 in the conversion reactor may lead to some positive interference in radical measurements. However, this interference estimated to correspond to several 104 cm−3 of radicals concentrations is negligible compared to measured OH concentrations. A detailed description of the instrument and calibration system has been presented elsewhere (Kukui et al., 2008, 2021). During the ACROSS field campaign the instrument was installed in the ICARE-LPC2E shipping container with the chemical conversion reactor fixed to the roof of the container via an interface cap covered with a polytetrafluorethylene (PTFE) sheet. The sampling aperture of the chemical conversion reactor (3 mm diameter) was positioned 50 cm above the roof and about 3 m above the ground surface. A detailed analysis of the OH measurements will be presented in a forthcoming publication.
2.2.3 Photolysis frequencies and meteorology
Spectral radiometers (Metcon GmbH) were installed near the high-volume-flow stainless-steel tube on top of the MPIC container and on top of the tower to measure actinic fluxes, which were converted to photolysis frequencies using recommended absorption spectra and quantum yields (IUPAC Task Group, 2024; Burkholder et al., 2020) as described in Meusel et al. (2016). Note that upwelling radiation is not accounted for, resulting in a potential underestimation of the photolysis frequencies of 5 %–10 %. A comparison of the two measurement heights is shown in Fig. S3. It is clear that the measurements below the canopy are significantly impacted by shading from trees in the morning and afternoon as well as by the tower around midday. Differences between the two measurements when both instruments are in direct sunlight are caused by integration of solar flux over one complete hemisphere (basically above the height of the integrating dome), which is influenced by trees at angles close to horizontal.
Ambient temperature was measured at four different heights on the tower: 5, 13, 21 and 41 m using temperature sensors from ATEXIS (PT1000) and Thermo Est (PT100). Relative humidity was measured at 5 m using a Vaisala humidity sensor (HMP45A).
2.2.4 Biogenic volatile organic compounds (BVOCs)
The LISA (Laboratoire Interuniversitaire des Systèmes Atmosphériques) Proton Transfer Reaction Time of Flight Mass Spectrometer (PTR-ToF-MS, hereafter called PTRMS), manufactured by Kore Technology Ltd., was used for monitoring concentrations of VOCs. Air samples were drawn at a flow rate of approximately 300 mL min−1 through a 3 m long Silcosteel®-coated stainless-steel tube (2.1 mm inner diameter) from an inlet height of 4.6 m in the LISA observation container shown in Fig. S1. Calibration was performed approximately every 3 d using VOC standards (5–20 ppb) from a certified National Physical Laboratory (NPL) calibration mixture with nominally 1 ppmv ± 5 % of several trace gases, including acetaldehyde, methanol, ethanol, isoprene, acetone, dimethyl sulfide, acetonitrile and 3-carene. Humidity corrections were applied for each trace gas. Mixing ratios of non-calibrated trace gases were retrieved from reactor conditions, rate constants, fragmentations and ion transmissions determined using the same NPL standard cylinder. The time series of acetaldehyde, isoprene and total monoterpenes (∑MT) are shown in Fig. 2.
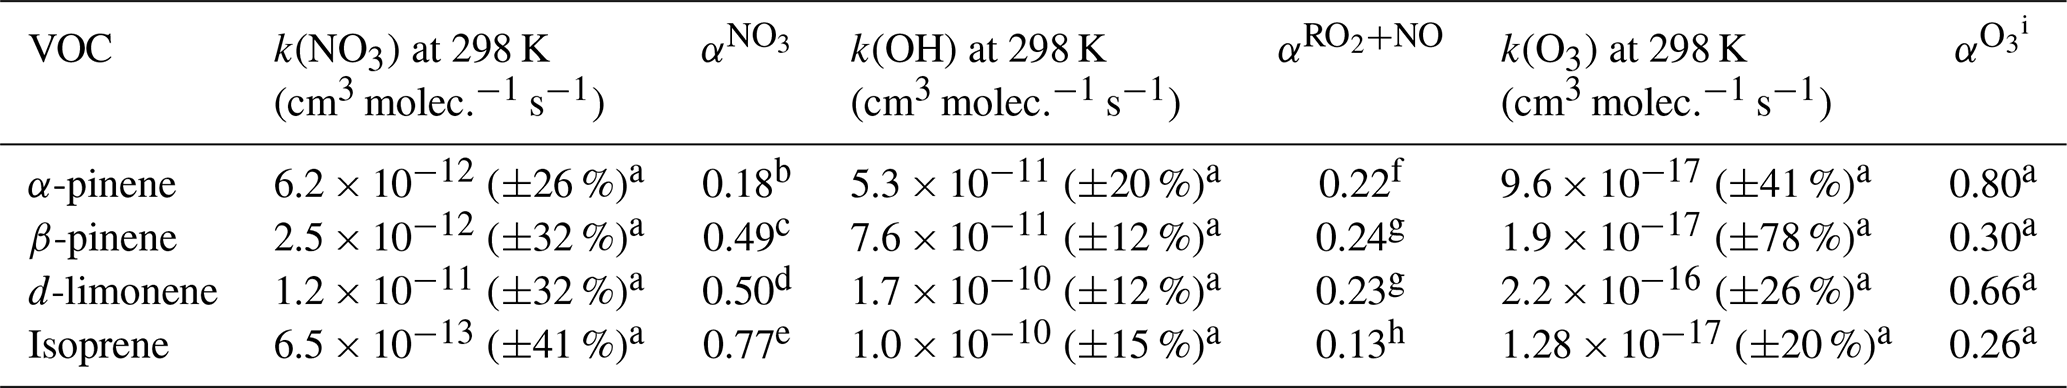
As there were no measurements of speciated monoterpenes due to instrumental issues with the gas chromatography instrument deployed during the campaign, different potential monoterpene mixtures were determined using the measured reactivity of NO3 towards BVOCs (kBVOC) after subtracting the reactivity due to isoprene () as described in Eq. (1). Here, keffective is an effective rate coefficient for the reaction of NO3 with an assumed monoterpene mixture. keffective was determined by adding all the fractional contributions (ai) from different monoterpenes as described in Eq. (2), where is the rate coefficient with NO3 for monoterpene i, which are listed in Table 1. The estimated ∑MT from Eq. (1) using different keffective can then be compared to the total mixing ratios measured by the PTRMS.
Only limonene, α-pinene and β-pinene were used to determine the potential mixtures since the box model used (see below) contained schemes for their degradation only. Four examples of potential mixtures constrained by the measured NO3 reactivity and consistent (for parts of the day) with the measured sum of monoterpenes (∑MT) from the PTRMS were determined by varying the fractional contribution (ai) of limonene between 0 % and 30 %. Mixture 1 is 30 % limonene, 10 % β-pinene and 60 % α-pinene. Mixture 2 is 20 % limonene, 15 % β-pinene and 65 % α-pinene. Mixture 3 is 10 % limonene, 5 % β-pinene, and 85 % α-pinene. Mixture 4 is 57 % β-pinene and 43 % α-pinene. All four scenarios are plotted together with the measured ∑MT over a 48 h period in Fig. 3b. Here the three scenarios, which include limonene, can be observed to agree well with the measurements except when a temperature inversion occurred (Fig. 3a). The same kind of discrepancy is observed every night with a temperature inversion, which is shown in Fig. 3c, where Mixture 2 is plotted against the measured ∑MT for the entire campaign and coloured by the difference in temperature (ΔT) between the top of the tower (41 m) and measurement height (5 m). A significant temperature inversion can result in the formation of a shallow nocturnal surface layer with weak vertical mixing. In contrast, the fourth mixture, which does not include limonene, does agree well with the measured ∑MT when a temperature inversion is observed, but it would require a much larger (than measured by the PTRMS) total mixing ratio of monoterpenes when no temperature inversion is observed.
Table 1Rate coefficients and relevant yields for the calculation of ∑PANs.
: yield of ANs from NO3 + BVOC in air.
: yield of ANs from RO2 + NO for the specific BVOC when the RO2 is formed from BVOC + OH.
: yield of RO2 from the ozonolysis of BVOC in air.
a Rate coefficients and yields recommended by IUPAC (IUPAC Task Group, 2024; Mellouki et al., 2021; Cox et al., 2020).
b Average of Wängberg et al. (1997), Berndt and Böge (1997), Hallquist et al. (1999), Spittler et al. (2006), Fry et al. (2014), and DeVault et al. (2022). c Average of Hallquist et al. (1999), Fry et al. (2009, 2014), Claflin and Ziemann (2018), and DeVault et al. (2022).
d Average of Hallquist et al. (1999), Spittler et al. (2006), Fry et al. (2011, 2014), and DeVault et al. (2022).
e Average of Barnes et al. (1990), Berndt and Boge (1997), Perring et al. (2009), Kwan et al. (2012), Rollins et al. (2009), and Schwantes et al. (2015).
f Average of the yields given by Nozière et al. (1999) and Rindelaub et al. (2015).
g Perring et al. (2013).
h Recommended by Wennberg et al. (2018) based on multiple studies.
i Set equal to the OH yield of the ozonolysis since a RO2 is formed with each OH.
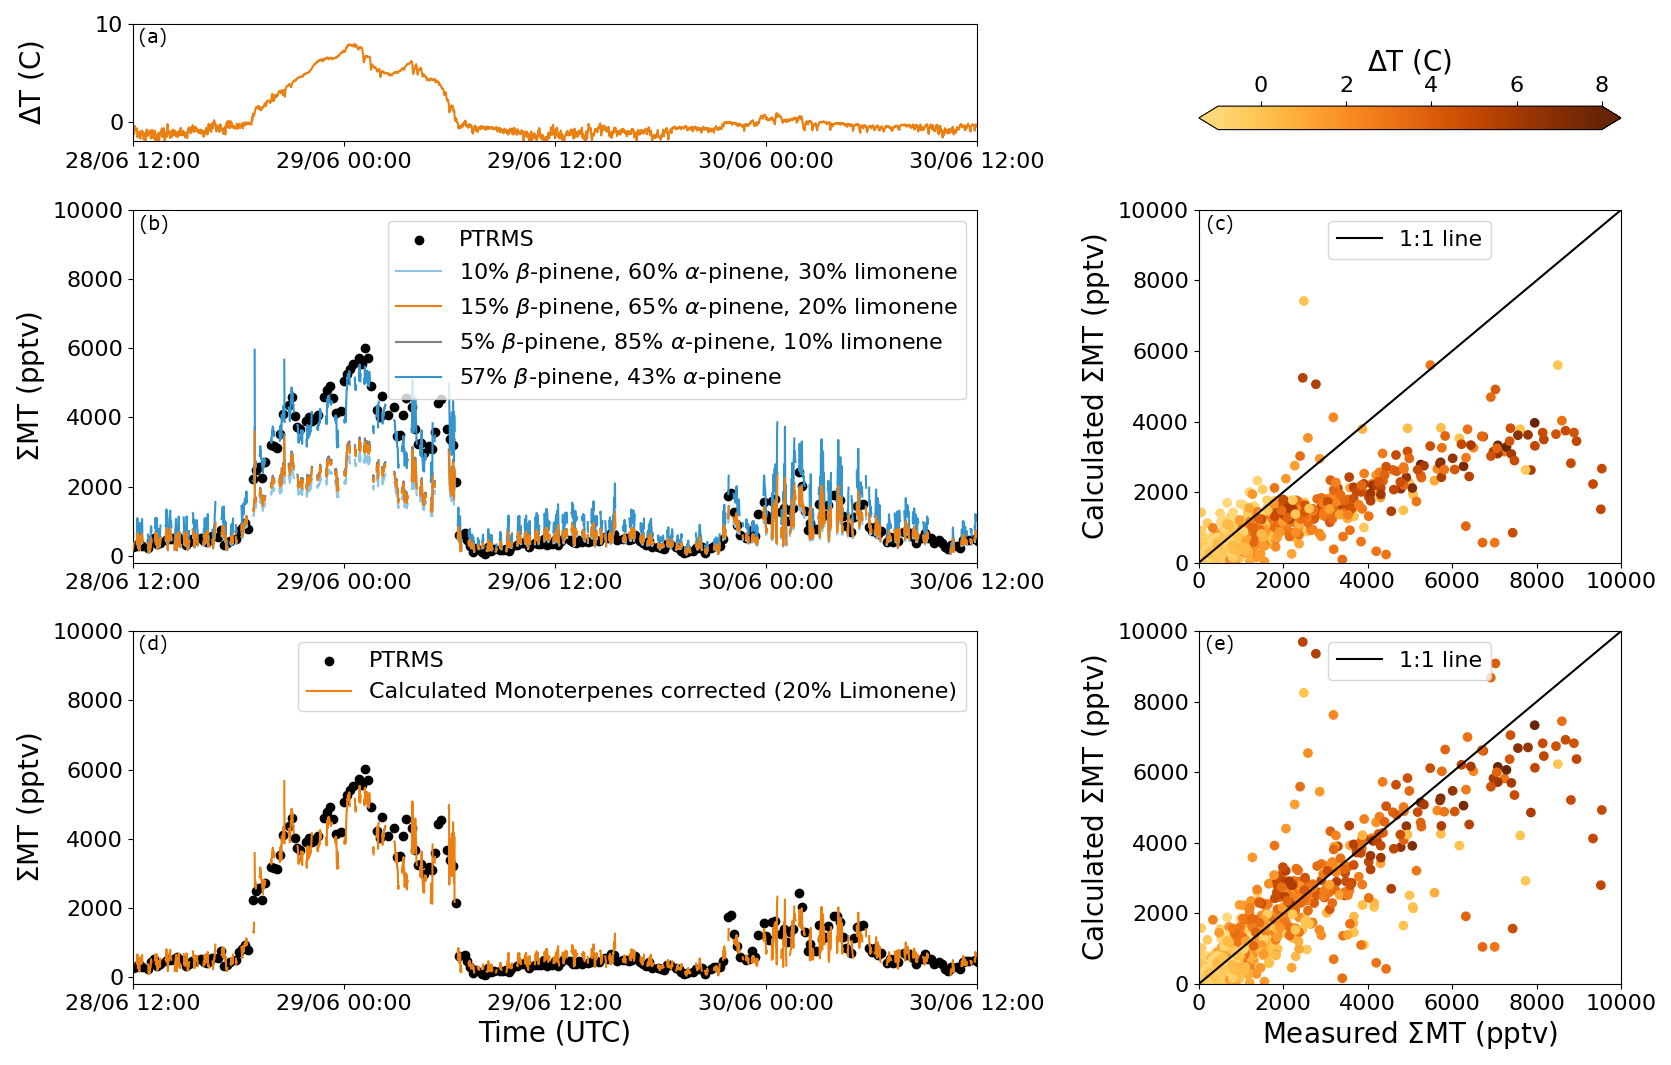
Figure 3NO3-reactivity-based estimation of monoterpene mixtures during ACROSS. Panel (a) shows the difference in temperature between 41 and 5 m (ΔT = T41 m−T5 m) for 48 h during ACROSS. Panel (b) shows the measured sum of monoterpenes (∑MT) and that calculated using Eq. (1) with four different monoterpene mixtures. Panel (c) shows calculated against measured ∑MT for the scenario with 20% limonene coloured by ΔT. Panel (d) shows the scenario with 20 % limonene from panel (c) using the mixture of 57 % β-pinene and 43 % α-pinene when ΔT > 1 °C, and panel (e) shows the scatter plot after performing the correction for temperature inversions.
As BVOCs continue to be emitted at night, weak vertical mixing leads to a strong gradient in monoterpene mixing ratios with higher values at low heights above ground level. As the gradient (both horizontally and vertically) will depend on the lifetime of each monoterpene, the mixture of monoterpenes measured by the NO3 reactivity instrument (at 5.4 m) might not be the same as that emitted by the vegetation at different heights. In Fig. S4, the average derived diel profiles of the lifetime of α-pinene, β-pinene and limonene when taking reactions with OH, O3 and NO3 into account using the rate coefficients in Table 1 are plotted. During the daytime all three monoterpenes have short lifetimes of around 0.5–1.5 h; however, during the nighttime, limonene clearly has the shortest lifetime, whereas β-pinene has a slightly longer lifetime than α-pinene. On nights with ΔT > 1 °C (26 % of the total measurements between 17 June and 22 July 2022), limonene is therefore assumed not to be sampled by the NO3 reactivity instrument due to the slow vertical and horizontal mixing, and monoterpene mixtures 1–3 are changed to 57 % β-pinene and 43 % α-pinene (Mixture 4), which can be seen in Fig. 3d for Mixture 2. This correction aligns the calculated and measured ∑MT throughout the entire campaign (Fig. 3e). It should also be noted that the NO3 reactivity and PTRMS measurements were not co-located, and there could therefore also be a gradient between the measurements, which we do not take into account as the magnitude of this gradient is unknown.
2.3 Box model
To simulate PANs numerically, we have used the atmospheric chemistry box model CAABA/MECCA (Chemistry As A Boxmodel Application/Module Efficiently Calculating the Chemistry of the Atmosphere) by Sander et al. (2019). The code is based on model version 4.7.0, and it has been adapted to simulate the ACROSS campaign. To allow for a detailed calculation of monoterpenes and PANs, reactions were exported from the Master Chemical Mechanism version 3.3.1 (MCM, https://mcm.york.ac.uk, last access: 7 October 2024), including the MCM species APINENE, BPINENE, C3H8, C5H8, CH3CHO, CH4, LIMONENE and NC4H10 in the marklist. This resulted in a gas-phase chemical mechanism with 1536 species and 4550 reactions. The set-up of the individual model runs will be described in Sect. 3.7.
3.1 AN production from NO3 reactions with BVOCs
NO3 radicals are produced from the reaction between NO2 and O3 (Reaction R1) and are usually lost rapidly during the daytime to photolysis and reactions with unsaturated BVOCs and NO (Reactions R2–R4). Reactions between NO3 radicals and unsaturated BVOCs lead to the formation of alkyl nitrates (ANs, Reaction R3a) as well as other products (Reaction R3b). During the nighttime, ground-level NO3 mixing ratios can vary greatly from < 1 to > 100 pptv depending on atmospheric composition (Ng et al., 2017; Brown and Stutz, 2012). During ACROSS, the NO3 reactivity within the canopy was generally high during the nighttime due to the emission of biogenic volatile organic compounds (BVOCs, by vegetation) and NO (from soil) into a shallow, poorly mixed nocturnal surface layer (Dewald et al., 2024; Andersen et al., 2024). This led to NO3 mixing ratios, at the ground, of < 0.5 pptv, which were generally lower than the limit of detection of instrumentation at the site.
The total production rate of ANs from the NO3-initiated oxidation of unsaturated BVOCs can be calculated using Eq. (3), where [NO3]SS is the NO3 concentration at steady state and , and [Ci] are the AN yield, the rate coefficient and BVOC concentration for compound i, respectively. [NO3]SS is determined from the production and loss terms described by Reactions (R1)–(R4) as described in Eq. (4), where [NO], [NO2] and [O3] are the concentrations of NO, NO2 and O3, respectively; k1 and k4 are the rate coefficients of Reactions (R1) and (R4), respectively; kBVOC is the first-order loss frequency for NO3 towards BVOCs; and is the photolysis frequency of NO3 radicals (Liebmann et al., 2019). This calculation ignores physical losses of NO3 (e.g. deposition), which will not compete with its reactive losses in this environment.
3.2 AN production from OH reactions with BVOCs
During the daytime, primary OH radicals are produced, e.g. from the photolysis of O3 followed by the reaction between O(1D) and water vapour (Reactions R5–R6) with secondary production through reaction of HO2 (formed in peroxy radical (RO2) reactions) with NO. In the absence of photochemistry, OH concentrations are generally lower during the nighttime than during the daytime, with average hourly concentrations of around 3.5–5 × 10⁵ molec. cm−3 observed across the campaign. The most important nighttime source of OH radicals is generally believed to be the reaction between unsaturated VOCs and ozone, e.g. Reactions (R11)–(R12). As will be shown in a forthcoming publication, the nighttime OH levels are broadly consistent with measured OH reactivity, HO2 recycling via reaction of HO2 with NO and production via the ozonolysis of terpenoids. When OH reacts with BVOCs in the presence of O2, peroxy radicals are produced (Reaction R7), which can then react with NO to give alkyl nitrates (Reaction R8a), as well as alkoxy radicals and NO2 (Reaction R8b). Additional competing processes that lower the yield of ANs from RO2 are reactions with itself and other RO2 (Reaction R9) and reaction with HO2 (Reaction R10).
The total production rate of ANs from OH-initiated oxidation of BVOCs is described in Eq. (5), where [OH] is the OH concentration, is the fraction of the organic peroxy radicals from BVOCs which (via Reaction R8a) forms an alkyl nitrate when reacting with NO, and [Ci] are the rate coefficient and BVOC concentration for compound i, respectively, and β is the fraction of peroxy radicals that reacts with NO (rather than RO2 or HO2) as described in Eq. (6) (Liebmann et al., 2019). β was calculated using the measured XO2 (HO2+RO2) and NO together with a generic rate coefficient for Reaction (R8), 8 × 10⁻¹² cm3 molec.−1 s−1, and a generic rate coefficient for the combination of Reactions (R9) and (R10), = cm3 molec.−1 s−1 (IUPAC Task Group, 2024; Lightfoot et al., 1992). k8 was set to this value because the vast majority of organic peroxy radicals react with NO with a rate coefficient of 8 ± 1 × 10⁻¹² cm3 molec.−1 s−1 (IUPAC Task Group, 2024; Lightfoot et al., 1992). Since we do not have separate measurements of RO2 and HO2, an effective rate coefficient of 1 × 10⁻¹¹ cm3 molec.−1 s−1 was chosen. This was derived by considering the MCM rate coefficients (2.3 × 10⁻¹¹ cm3 molec.−1 s−1 at 298 K) for Reaction (R10) and 2–3 × 10⁻¹² cm3 molec.−1 s−1 for reactions between isoprene-derived peroxy radicals and other RO2 and calculating the geometric mean. As we do not know the contributions of HO2 and RO2 to XO2, this is clearly a coarse approximation. We therefore undertook a sensitivity test in which the effective rate coefficient was varied by a factor of 2 in both directions to establish the uncertainty in β using median mixing ratios across the entire campaign of NO (41 pptv) and XO2 (6 × 10⁸ molec. cm−3). When halving the effective rate coefficient, β is increased by 30 %, thereby increasing the production rate, and when doubling the effective rate coefficient, β is decreased by 30 %, thereby decreasing the production rate.
3.3 AN production from O3 reactions with BVOCs
Ozone (O3) addition to an unsaturated BVOC forms a primary ozonide (POZ, Reaction R11), which in the presence of O2 can rapidly decompose via Criegee intermediates to OH and organic peroxy radicals (RO2) (Reaction R12a). The POZ can also react through other processes that do not result in organic peroxy radicals (Reaction R12b). The RO2 formed in Reaction (R12a) further reacts through Reactions (R8)–(R10) as described above.
Equation (7) describes the total production rate of ANs from the O3-initiated oxidation of unsaturated BVOCs, where [O3] is the O3 concentration; is the yield of RO2 from Reactions (R11)–(R12a); is the fraction of the organic peroxy radicals (from BVOCs) formed in Reaction (R12a), which when reacting with NO form an alkyl nitrate; and [Ci] are the rate coefficient and BVOC concentration for compound i, respectively; and β is the fraction of peroxy radicals that react with NO as described in Eq. (6) (Liebmann et al., 2019), calculated as described in Sect. 4.2. Here we assume that the yield of ANs from RO2 + NO is independent of whether RO2 is formed by OH- or O3-initiated oxidation.
3.4 Relative importance of OH, O3 and NO3 oxidation for the production of ANs
To analyse the production and loss processes of alkyl nitrates during the ACROSS campaign, the measurements have been separated into two phases: phase 1 (lower photochemical activity) from 28 June to 7 July 2022 and phase 2 (higher photochemical activity) from 8 to 20 July 2022. Average diel profiles of O3, NO2, NO, temperature, OH radicals and isoprene for the two phases are plotted in Fig. 4. Phase 1 is characterized by low levels of oxidants and organics and a maximum average daytime temperature of around 25 °C, whereas phase 2 is characterized by higher levels of oxidants and organics due to generally higher temperatures (maximum average daytime temperature of around 30 °C). The average monoterpene mixtures for the two phases are displayed in Fig. 5 for the mixture with 20 % limonene, 15 % β-pinene and 65 % α-pinene when no temperature inversion is observed and 57 % β-pinene and 43 % α-pinene when temperature inversions higher than 1 °C are observed. The monoterpene mixtures derived for Mixture 1 and Mixture 3 using 57 % β-pinene and 43 % α-pinene when temperature inversions higher than 1 °C are observed are plotted in Fig. S5. During the daytime the average mixture reflects the percentages used for each scenario, whereas during the nighttime, the mixture is dominated by β-pinene and α-pinene during both phases, associated with the temperature inversions observed on many nights.
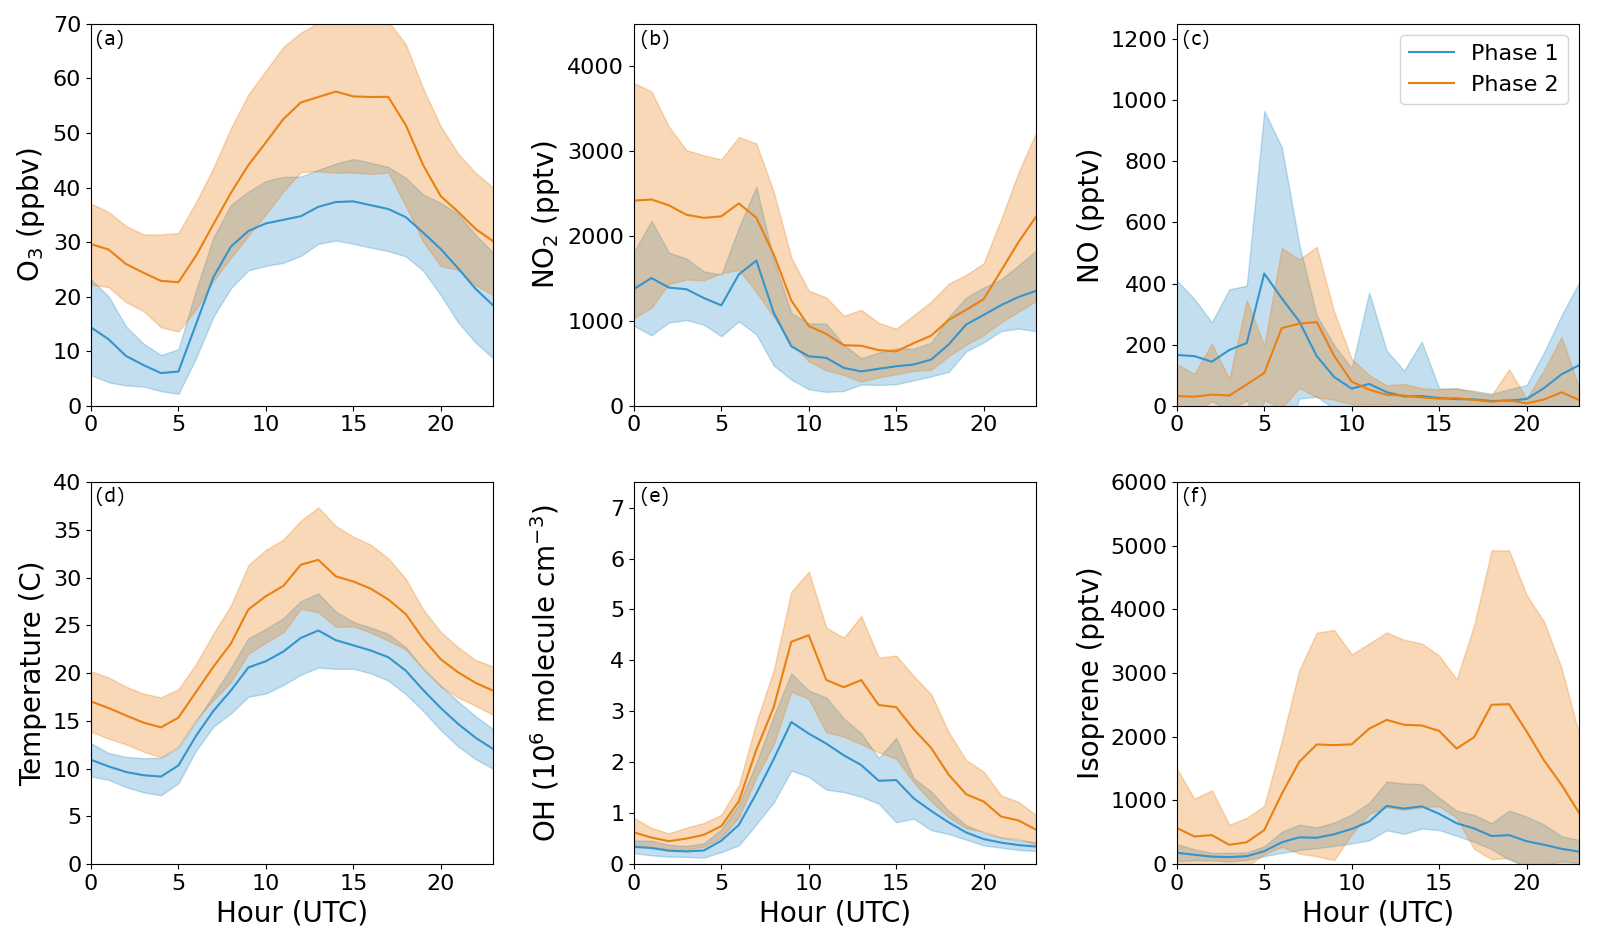
Figure 4Diel profiles of O3, NO2, NO, temperature, OH and isoprene for the two phases used to analyse organic nitrates during the ACROSS campaign; phase 1 from 28 June to 7 July 2022 and phase 2 from 8 to 20 July 2022. The shaded area is ±1σ.
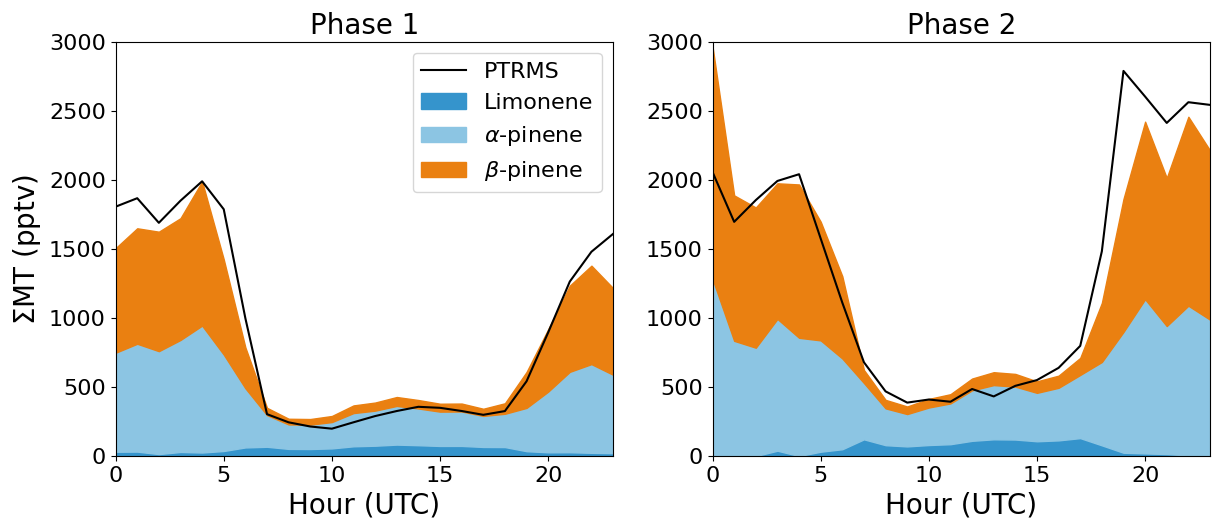
Figure 5Average diel profiles of the PTRMS measurements of the sum of monoterpenes (black) and the calculated, average mixture of limonene (dark blue), α-pinene (light blue) and β-pinene (orange) for the scenario with 20 % limonene.
The diel profile of the ∑AN production rates from NO3-, OH- and O3-initiated oxidation using the rate coefficients and yields in Table 1 and the monoterpene mixture in Fig. 5 is shown in Fig. 6a and b for phases 1 and 2, respectively. The total AN production during phase 1 is fairly constant at 35–75 pptv h−1 throughout the diel profile. In contrast, phase 2 shows large variation with 80–100 pptv h−1 in the early morning between 01:00 and 05:00 UTC (03:00–07:00 LT) and 220–280 pptv h−1 around late morning to midday between 07:00 and 12:00 UTC (09:00–14:00 LT). For both phases, the variability in the ∑AN production rate from O3- and NO3-initiated oxidation of BVOCs is small compared to that of the OH-initiated oxidation. The calculated O3-initiated ∑AN production rate varied from 4–15 and 12–25 pptv h−1 for phase 1 and 2, respectively, and the derived NO3-initiated ∑AN production rate varied from 4–22 and 22–62 pptv h−1 for phase 1 and 2, respectively. The differences between the two phases are therefore caused by the OH-initiated oxidation, which is relatively stable during phase 1 at 13–61 pptv h−1 across the diel profile due to the lower daytime levels of OH and BVOCs (see Fig. 4), but it varies between 30–70 pptv h−1 during the nighttime and 100–230 pptv h−1 during the daytime during phase 2. The production rates are associated with uncertainties, which have been evaluated using the average midday measurements and derived monoterpene mixing ratios in Table S1 in the Supplement, the uncertainties in rate coefficients (see Tables 1 and S2), and measurement uncertainties and yield uncertainties (see Table S2) for the three monoterpene mixtures containing limonene. The results are summarized in Table S3 and show that the uncertainty varies only a little within the different monoterpene mixtures. At midday the propagated uncertainty of the NO3-, O3- and OH-initiated production rates and the total production rate is around 35 %, 40 %, 30 % and 26 %, respectively.
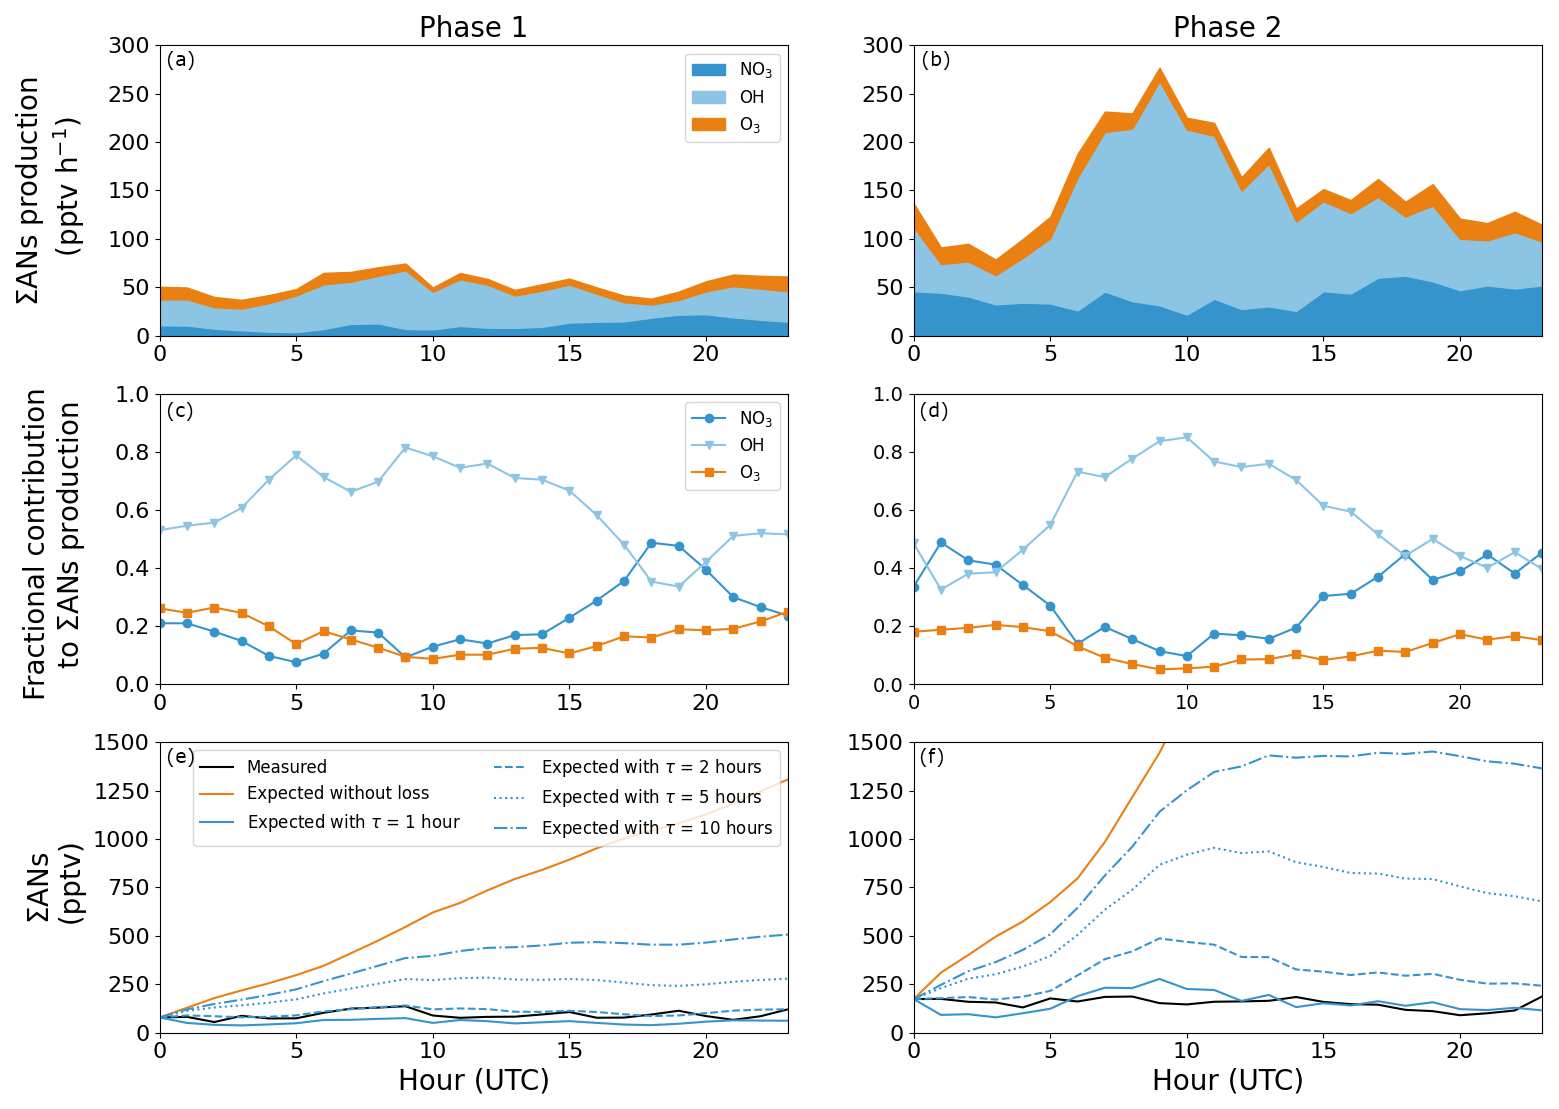
Figure 6Panels (a) and (b) show the mean diel profiles of the ∑AN production rates from NO3-, OH- and O3-initiated oxidation of a monoterpene mixture consisting of 20 % limonene, 15 % β-pinene and 65 % α-pinene for phase 1 and 2, respectively. The fractional contribution to the ∑ANs for each oxidant is plotted in panels (c) and (d). Panels (e) and (f) show the average diel profile across the two phases for the measured alkyl nitrates (black), expected alkyl nitrates with (blue) and without (orange) any losses, where the different blue lines were calculated using different effective lifetimes of the alkyl nitrates.
Figure 6c and d show the fractional contributions of NO3-, OH- and O3-initiated oxidation to the ∑AN production rate for phase 1 and 2, respectively. OH clearly dominates during the daytime (06:00–18:00 UTC) with, on average, 69 %–72 % for both phases, followed by NO3 with 18 %–20 % and O3 with 8 %–12 %. During the nighttime (18:00–06:00 UTC), the picture is not as clear: during phase 1 OH-initiated oxidation is still the dominant AN production pathway with, on average, 53 %, and the remainder is close to evenly split at 21 % and 26 % between O3- and NO3-initiated oxidation, respectively. During the nighttime during phase 2, OH- and NO3-initiated oxidation contributed similarly with 43 % and 40 % of the total AN production rate, respectively, leaving only 17 % for O3-initiated processes. All the fractional contributions are associated with uncertainties around 40 %–50% when propagating the uncertainties in the individual and total production rates at midday. The differences between the two phases during the nighttime can be explained by the availability of the precursors, where there is approximately double the amount of O3 and NO2 during phase 2, leading to a higher production rate of NO3 radicals and thereby an increased AN production rate from NO3-initiated oxidation.
Both phases give significantly different fractions during both the daytime and the nighttime from those observed by Liebmann et al. (2019) in a boreal forest, where, in the absence of measurements, OH was calculated from the actinic flux, which thus resulted in zero OH during the nighttime. However, both studies agree on NO3 oxidation being a significant source of ANs, both during the daytime and the nighttime. If [NO3]SS were calculated using photolysis frequencies measured above the clearing instead of inside the clearing, the contribution from NO3-initiated oxidation would be reduced in the morning and evening (see Fig. S3 for comparison of above (tower) and inside (ground) the clearing). Further, as discussed by Dewald et al. (2024) the relative contributions of, for example, OH and NO3 would be significantly modified to favour NO3 if we considered the greatly reduced photolysis frequencies of NO3 and OH precursors in non-cleared parts of the forest.
3.5 AN loss and lifetime
Neglecting the role of transport, we now combine the diel profile of the total production rate of ANs (described above) with the average measured diel profile of ANs to evaluate the loss processes and lifetime of the ANs using Eq. (8). PANs is the production rate of ANs, [ANs]0 is the average AN mixing ratio at 00:00 UTC, and kL(ANs) is the loss rate of the ANs, which is defined as the inverse of the lifetime of the ANs .
The AN mixing ratio at any subsequent time to [ANs]0 can then be calculated as described in Eq. (9) with the variation of kL(ANs) to match the observed AN mixing ratio.
Figure 6e and f show the average diel profiles of the measured ANs in black for phase 1 and 2, respectively. The orange lines show how the AN mixing ratios would have increased if there were no chemical or transport-induced loss throughout the day, and the blue lines show how the diel profiles would look when applying lifetimes of 1–10 h for the ANs. The best fit to the measured diel profile of ANs results from using an effective lifetime in the clearing of 1.5 ± 1 h throughout the diel cycle for both phases despite the very different production rates described above. Table 2 gives an overview of the average daytime and nighttime loss rate frequencies and the resulting effective lifetimes. No difference was observed between daytime and nighttime during phase 1, and only a small difference within the uncertainties was observed during phase 2.
Table 2Overview of the thermal, physical and total loss frequencies (and lifetimes) of ANs and PANs needed to explain the measured ANs and PANs during ACROSS.
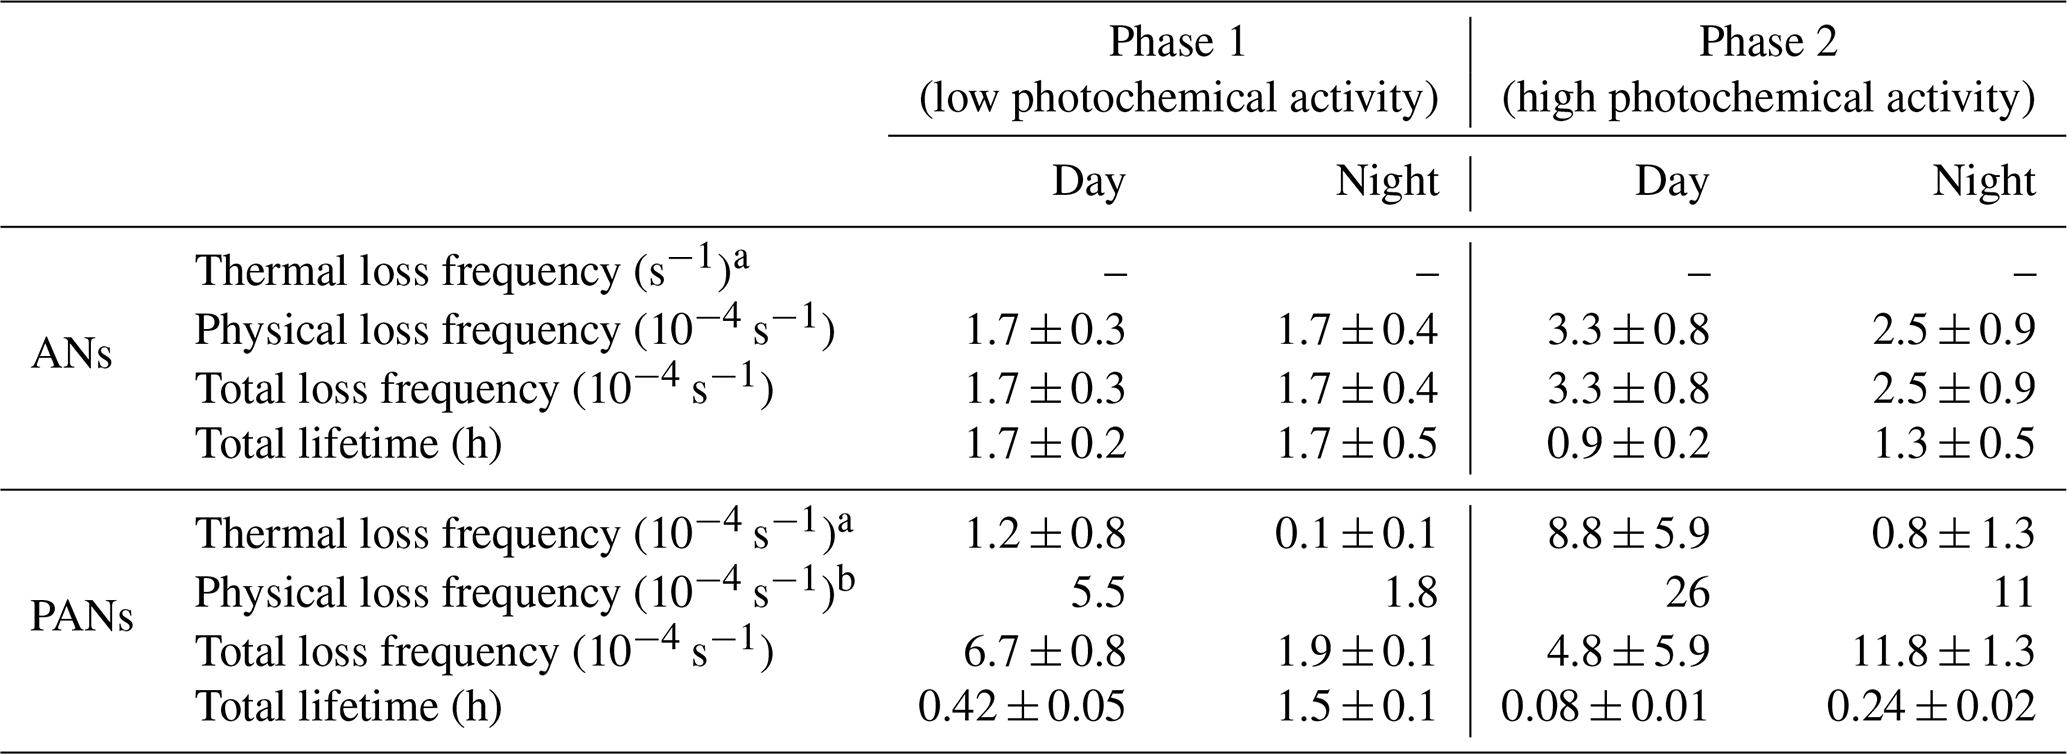
Day is defined as 06:00–18:00 UTC (08:00–20:00 LT). Night is defined as 18:00–06:00 UTC (20:00–08:00 LT).
All values except the modelled physical loss frequencies for PANs are given as the mean ± 1σ. The ANs are based on hourly averages for each phase, and the PANs are based on modelled loss frequencies for 1 d during each phase.
a The thermal loss frequency has been corrected for the fractional recombination of CH3C(O)O2 with NO2.
b In total four model runs were conducted to examine the two phases and to differentiate between day and night.
The total AN production rate resulting from the three different monoterpene mixtures derived in Sect. 3.2.4 (plotted in Fig. S6a for the two phases) clearly shows that the choice of mixture does not have a significant impact on the total production rate. This means that the determined lifetime for the two phases of 1.5 ± 1 h is consistent across all three mixtures, as can be observed in Fig. S6c. This lifetime is similar to the 2 ± 3 h estimated in a boreal forest (Liebmann et al., 2019) and that determined for isoprene nitrates using flux measurements over the Ozark Mountains (Wolfe et al., 2015).
In Sect. 3.7, it is shown that the box model described in Sect. 2.3 predicts the mixing ratio of XO2 to be up to 4 times higher than the measured XO2 depending on the day, which is related in part to the variable detection efficiency of different RO2 by the XO2 instrument. Strictly speaking the XO2 measurements represent a lower limit in regions with high biogenic contribution to RO2. Owing to the large uncertainty associated with the measurements, we have also calculated the total AN production rate and the lifetime of ANs for the three monoterpene mixtures when applying 4 times the measured XO2. The results (Fig. S6b and d) show that β and thus PANs decrease when increasing XO2, which results in an increase in the calculated lifetime from 1.5 ± 1 to 2.5 ± 1.5 h, which remains consistent with the previous observations described above.
3.6 PANs major production and loss processes
A dominant fraction of the measured PANs is expected to be in the form of peroxyacetic nitric anhydride (CH3C(O)O2NO2, also known as peroxyacetyl nitrate, PAN), which is formed in the reaction between the peroxyacetyl radical (CH3C(O)O2) and NO2 (Reaction R13). In the boundary layer, CH3C(O)O2 is produced directly from the OH-initiated oxidation of acetaldehyde (CH3CHO, Reaction R14) and the photolysis of dicarbonyls such as methylglyoxal (CH3C(O)CHO, Reaction R15; Crowley et al., 2018) and from the oxidation of BVOCs such as isoprene (via methacrolein (CH2C(CH3)CHO, MACR) and methyl vinyl ketone (CH2CHC(O)CH3, MVK)) and α-pinene after multiple reaction steps.
In forest environments in the summer, when isoprene emissions are high, peroxy methacrylic nitric anhydride (CH2C(CH3)C(O)O2NO2, MPAN), an OH-initiated oxidation product of MACR (Reactions R16–R17), will contribute to the total peroxy nitrates. Note that CH2C(CH3)C(O)O2 can also isomerize (Crounse et al., 2012), which is not included in the MCM. With an annual average propane (C3H8) measurement around 507 pptv in La Tardière, France, in 2018 (Ge et al., 2024), peroxypropionic nitric anhydride (CH3CH2C(O)O2NO2, PPN), an OH-initiated oxidation product of propanal (CH3CH2CHO, Reactions R18–R19), is expected to be present as well.
For PAN, MPAN, PPN and any other PANs, the production rate strongly depends on the concentration of NO, hydroperoxyl radicals (HO2) and other peroxy radicals (RO2) that can lead to competing Reactions (R20)–(R21) to, for example, Reactions (R13), (R17) and (R19). XO2 represents the sum of HO2 + RO2.
PANs are permanently removed through deposition (Reaction R22) and can be lost through thermal decomposition (Reaction R23) reforming RC(O)O2, which can subsequently react as described above (Reactions R20–R21). Larger and/or unsaturated PANs, such as MPAN, can also be lost through oxidation (Reaction R24).
The thermal decomposition of PANs is strongly temperature-dependent, resulting in lifetimes with respect to Reaction (R23) from 7.5 h at 283 K and 40 min at 298 K (IUPAC Task Group, 2024). The effective lifetime increases from that calculated from the thermal decomposition rate coefficient when regeneration of PANs through, for example, Reactions (R13), (R17) and (R19) occurs. Thermal decomposition is thus expected to be the dominant loss process of PANs at high temperatures in the presence of NO and/or XO2. However, during the nighttime, when the temperature is lower and the mixing ratios of NO and XO2 also are lower, deposition can play an important role, depending on boundary layer height, humidity and surfaces.
3.7 Measured and modelled PANs
Figure 7a plots the measured mixing ratio for ΣPANs (= PAN + MPAN + PPN + other PANs) for which maximum daytime mixing ratios are between 100 and 1600 pptv. The large variability is presumably caused by the observed variability in temperature, concentrations of oxidants and BVOCs. The temperature fluctuations measured during the campaign result in a thermal lifetime of the PANs that spans 2 orders of magnitude, from 15 h at 279 K to 3 min at 314 K as shown in Fig. 7b.
Figure 7Time series of ∑PANs (a) and the thermal lifetime of PAN (b) during ACROSS, where kdec is the temperature-dependent rate coefficient for the thermal decomposition of PAN using the expression preferred by the IUPAC panel (IUPAC Task Group, 2024). Days marked in grey are used for analysis in Fig. 8.
Due to the many different production pathways of PANs, we used a detailed chemical box model (see Sect. 2.3 for details) to assess the contributions of various precursors and compare to the measured ΣPANs. As the calculated thermal loss rate varies significantly from day to day, 2 single days (marked in grey in Fig. 7), where measurements of OH, O3, NO, NO2 and BVOCs are available, have been modelled instead of using average diel profiles as in the AN analysis. One day (4 July 2022) is in phase 1 from the AN analysis, where the temperature reaches around 27 °C (300 K), resulting in a thermal lifetime of 25 min (without considering recombination) and during which the mixing ratios of precursors (oxidants and BVOCs) were low. The second day (13 July 2022) is in phase 2 from the AN analysis, where the temperature has a maximum of around 39 °C (312 K), resulting in a thermal lifetime of around 5 min (without considering recombination) and higher precursor levels than during the first day.
The box model was constrained by measurements (20 min running averages) of temperature, humidity, JNO2, J(O1D), OH, O3, NO, NO2, isoprene, and acetaldehyde (CH3CHO), as well as the prescribed 20 % limonene monoterpene mixture described above. Note that varying the fraction of limonene did not change the modelled ΣPANs significantly. The model was additionally initiated using average CO and pressure for the modelled day, 507 pptv propane (C3H8), 193 pptv n-butane (n-C4H10) and 107 pptv isobutane (i-C4H10) (Ge et al., 2024). To ensure that all the trace gases not constrained in the model were in steady state, a spin-up time of 9 d was used. The thermal losses of PANs were included in the model as described above, and an additional first-order loss term (physical losses from, for example, deposition) was varied in two separate model runs to get satisfactory model–measurement agreement for ∑PANs during the daytime (06:00–18:00 UTC) and the nighttime (18:00-06:00 UTC) for the individual days. The PANs identified in the MCM are listed in Table S4, and the fractional contributions of PAN, MPAN and PPN to the total are described in the Supplement.
3.7.1 Modelled loss rates optimized to match nighttime observations of PANs
The modelled PANs, separated into PAN and other PANs when optimized for nighttime, are plotted for the low and high precursor day in Fig. 8a and b together with the measured mixing ratios. Reasonable agreement between the measured and modelled ∑PANs can be observed for both the high and low precursor day during the nighttime, but it overestimates part of the day. The daytime was therefore modelled separately (see below).
Figure 8The measured and modelled ∑PANs, when optimizing for nighttime agreement, are plotted for 2 individual days: one with low precursors (a) and one with high precursors (b). The optimized physical loss for each day is shown in panels (c) and (d) together with the thermal decomposition when taking recombination into account using both the measured and modelled mixing ratio of XO2.
The physical loss frequencies required to align the modelled ∑PANs during the nighttime with the observations were 1.8 × 10⁻⁴ and 1.1 × 10⁻³ s−1 for the low and high precursor day, respectively. By comparison the nighttime loss frequency attributable to thermal decomposition when taking recombination into account (at temperatures of 10–20 °C; see Fig. 8c and d) is negligible. The resulting average nighttime lifetime (1.5 and 0.24 h, see Table 2) is therefore determined almost solely by physical losses.
3.7.2 Modelled loss rates optimized to match daytime observations of PANs
When optimizing for daytime agreement in the model (see Fig. S7a and b), reasonable agreement can be observed between 06:00–18:00 for the high precursor day. For the low precursor day, the model overestimates the measurement between 06:00 and 12:00 UTC and underestimates between 12:00 and 18:00 UTC. The physical loss frequencies required to align the modelled ∑PANs during the daytime with the observations were 5.5 × 10⁻⁴ and 2.6 × 10⁻³ s−1 for the low and high precursor day, respectively.
The results shown above indicate that daytime physical losses are significantly higher than during the nighttime, for which there are several potential explanations. The high daytime values could be explained by a reduction in the surface resistance to foliar uptake when plant stomata are open (similar to O3; Shepson et al., 1992) or a reduction in the transport resistance to uptake due to turbulent mixing. Rapid vertical mixing (venting) out of the canopy would also contribute to the net physical losses during daytime (Bohn, 2006) if significant concentration gradients existed. However, as effects of venting were not observed for alkyl nitrates (i.e. no significant difference between physical loss frequency during day and night was observed), we do not consider venting to be significant.
The overall loss of PANs is caused by a combination of physical losses such as deposition, as well as (during the daytime) transport and thermal decomposition, which are plotted together in Fig. S7c and d. The thermal lifetime derived in Fig. 7b from the thermal decomposition rate coefficient needs to be modified to account for reformation via reaction between RC(O)O2 and NO2. The correction factor () is described in Eq. (10) and represents the fraction of RC(O)O2 formed from the thermal decomposition that does not lead to reformation of PANs.
where ki is the rate coefficient for reaction (Ri), and [NO2], [NO] and [XO2] are the concentrations of NO2, NO and XO2 (HO2 + RO2). As seen in Eq. (10), this correction factor requires information not only on NO and NO2 but also on XO2 concentrations. In the box model, NO and NO2 are constrained to the measurements, whereas XO2 is calculated. The modelled XO2 is compared to the measured value in Fig. S8 for the 2 chosen days. On the low precursor day, the model and measurements agree well, but on the high precursor day, the model predicts that XO2 should be 4 times higher than the measurements at midday. As the measured XO2 is strictly a lower limit, the effective thermal decomposition rate coefficient for PAN (considering recombination of CH3C(O)O2 with NO2; see above) was therefore calculated using both the measured and the modelled XO2 to evaluate the uncertainty in this parameter. If the measured XO2 were correct (and the modelled values were too high on the day during phase 2), the modelled derived physical loss frequency would be too low and would have to be incremented by the difference in effective thermal decomposition frequencies (approximately 5 × 10⁻⁴ s−1). Thermal decomposition accounts for approximately 40 % of the total loss when using modelled XO2 and optimizing for daytime agreement (see Fig. S7c and d). The 40 % contribution of thermal loss is inconsistent with the observations of Wolfe et al. (2009), who showed through flux measurements that thermal losses of PAN were dominant. Combining physical and thermal loss rates results in daytime lifetimes of 0.42 ± 0.05 and 0.08 ± 0.01 h for the low and high precursor day, respectively. These are significantly shorter than those determined during the nighttime (see above or Table 2).
Measurements of NOx, O3, BVOCs, the sum of alkyl nitrates (∑ANs) and the sum of peroxycarboxylic nitric anhydrides (∑PANs) have been used to analyse the sources, sinks and lifetimes of ANs and PANs in a temperate forest influenced by anthropogenic emissions.
The AN analysis has been performed for two phases. The first phase is characterized by relatively low temperatures, oxidants, NO and BVOCs compared to the entire campaign, and the second phase was characterized by higher temperatures, oxidants, NO and BVOCs. This led to significantly different production rates but very similar lifetimes. The production was dominated by OH-initiated reactions at midday for both phases, but large differences were estimated during the nighttime. NO3-initiated reactions play a similarly important role to OH during the nighttime for the second phase; however, for the first phase OH still dominates during the nighttime. NO3-initiated reactions have also been shown to be important during the daytime despite the rapid photolysis. The lifetime for both phases was short at 1–4 h, which agrees with previous studies in forest environments.
For the PANs analysis, a box model was used to simulate 2 individual days: one in the first phase of the AN analysis and one in the second phase. Two constant physical loss terms are applied for each of the 2 d optimized to match the average daytime and nighttime mixing ratios. For the low precursor day (4 July 2022), loss frequencies of 5.5 × 10⁻⁴ and 1.8 × 10⁻⁴ s−1 were used to align measurement and model for daytime and nighttime, respectively, while for the high precursor day (13 July 2022) 2.6 × 10⁻³ and 1.1 × 10⁻³ s−1 were used. This resulted in lifetimes of around 20 and 4 min at midday for the low and high precursor day, respectively, where thermal decomposition contributed approximately 40 %. Peroxyacetic nitric anhydride (PAN) represents 48 %–78% of ∑PANs according to the box model, with the highest fractions predicted during the daytime.
Lifetimes of organic nitrates in the forested environment are very short. A potential reason for the short lifetime is dry deposition to, for example, soil and foliar surfaces. If deposition were the cause of the short lifetimes, this would be consistent with a picture of the forest ecosystem capturing essential nitrogen-containing nutrients originating from anthropogenic sources and transferring them to the biosphere.
All measurements from the ACROSS campaign, including NOx (https://doi.org/10.25326/705, Andersen and Crowley, 2023a; https://doi.org/10.25326/512, Xue et al., 2023), O3 (https://doi.org/10.25326/707, Crowley, 2023), organic nitrates (https://doi.org/10.25326/706, Andersen and Crowley, 2023b), NO3 reactivity (https://doi.org/10.25326/545, Dewald and Crowley, 2023), BVOCs (https://doi.org/10.25326/685, Michoud et al., 2024), meteorological quantities (https://doi.org/10.25326/437, Denjean, 2023), photolysis frequencies (https://doi.org/10.25326/774, Dusanter and Jamar, 2023), OH (https://doi.org/10.25326/510, Kukui, 2023a) and peroxy radicals (https://doi.org/10.25326/509, Kukui, 2023b), can be found at https://across.aeris-data.fr/catalogue/ (last access: 31 August 2024). Model output (https://doi.org/10.17617/3.NZ3XZG, Sander and Andersen, 2025) can be found at https://edmond.mpg.de (last access: 23 May 2025).
The supplement related to this article is available online at https://doi.org/10.5194/acp-25-5893-2025-supplement.
All authors contributed with measurements. Data analysis was conducted by STA with contributions from JNC. RS did the box modelling. CC and VM organized the field campaign with contributions from the individual group leads. STA and JNC developed the manuscript with contributions from all authors.
The contact author has declared that none of the authors has any competing interests.
Publisher’s note: Copernicus Publications remains neutral with regard to jurisdictional claims made in the text, published maps, institutional affiliations, or any other geographical representation in this paper. While Copernicus Publications makes every effort to include appropriate place names, the final responsibility lies with the authors.
This article is part of the special issue “Atmospheric Chemistry of the Suburban Forest – multiplatform observational campaign of the chemistry and physics of mixed urban and biogenic emissions”. It is not associated with a conference.
Simone T. Andersen is thankful to the Alexander von Humboldt Foundation for funding her stay at MPIC.
Patrick Dewald gratefully acknowledges the Deutsche Forschungsgemeinschaft.
We thank Sebastien Dusanter and Marina Jamar from IMT Nord Europe, France, for supplying photolysis frequency measurements on the tower.
The ACROSS project has received funding from the French National Research Agency (ANR) under the investment programme integrated into France 2030, with the reference ANR-17-MPGA-0002, and it was supported by the French National programme LEFE (Les Enveloppes Fluides et l'Environnement) of the CNRS/INSU (Centre National de la Recherche Scientifique/Institut National des Sciences de l'Univers). CNRS-INSU provides support to the PEGASUS platform as a national facility. Data from the ACROSS campaign and the PEGASUS facility are hosted by the French AERIS atmosphere Data and Services Centre.
This research has been supported by the Alexander von Humboldt-Stiftung (postdoc fellowship), the Deutsche Forschungsgemeinschaft (project “MONOTONS”, project no. 522970430), and the Agence Nationale de la Recherche (grant no. ANR-17-MPGA-0002).
The article processing charges for this open-access publication were covered by the Max Planck Society.
This paper was edited by Sergey A. Nizkorodov and reviewed by two anonymous referees.
Andersen, S. T. and Crowley, J. N.: ACROSS_MPIC_RambForest_5ch-NO2_1min_L2, Aeris [data set], https://doi.org/10.25326/705, 2023a.
Andersen, S. T. and Crowley, J. N.: ACROSS_MPIC_RambForest_5ch-PNs-ANs_10min_L2, Aeris [data set], https://doi.org/10.25326/706, 2023b.
Andersen, S. T., McGillen, M. R., Xue, C., Seubert, T., Dewald, P., Türk, G. N. T. E., Schuladen, J., Denjean, C., Etienne, J.-C., Garrouste, O., Jamar, M., Harb, S., Cirtog, M., Michoud, V., Cazaunau, M., Bergé, A., Cantrell, C., Dusanter, S., Picquet-Varrault, B., Kukui, A., Mellouki, A., Carpenter, L. J., Lelieveld, J., and Crowley, J. N.: Measurement report: Sources, sinks, and lifetime of NOx in a suburban temperate forest at night, Atmos. Chem. Phys., 24, 11603–11618, https://doi.org/10.5194/acp-24-11603-2024, 2024.
Ayres, B. R., Allen, H. M., Draper, D. C., Brown, S. S., Wild, R. J., Jimenez, J. L., Day, D. A., Campuzano-Jost, P., Hu, W., de Gouw, J., Koss, A., Cohen, R. C., Duffey, K. C., Romer, P., Baumann, K., Edgerton, E., Takahama, S., Thornton, J. A., Lee, B. H., Lopez-Hilfiker, F. D., Mohr, C., Wennberg, P. O., Nguyen, T. B., Teng, A., Goldstein, A. H., Olson, K., and Fry, J. L.: Organic nitrate aerosol formation via NO3 + biogenic volatile organic compounds in the southeastern United States, Atmos. Chem. Phys., 15, 13377–13392, https://doi.org/10.5194/acp-15-13377-2015, 2015.
Barnes, I., Bastian, V., Becker, K. H., and Tong, Z.: Kinetics and products of the reactions of nitrate radical with monoalkenes, dialkenes, and monoterpenes, J. Phys. Chem., 94, 2413–2419, https://doi.org/10.1021/j100369a041, 1990.
Berndt, T. and Boge, O.: Gas-phase reaction of NO3 radicals with isoprene: A kinetic and mechanistic study, Int. J. Chem. Kinet., 29, 755–765, https://doi.org/10.1002/(SICI)1097-4601(1997)29:10<755::AID-KIN4>3.0.CO;2-L, 1997.
Berndt, T. and Böge, O.: Products and mechanism of the gas-phase reaction of NO3 radicals with α-pinene, J. Chem. Soc. Faraday T., 93, 3021–3027, https://doi.org/10.1039/A702364B, 1997.
Bohn, B.: Solar spectral actinic flux and photolysis frequency measurements in a deciduous forest, J. Geophys. Res.-Atmos., 111, D15303, https://doi.org/10.1029/2005JD006902, 2006.
Brown, S. S. and Stutz, J.: Nighttime radical observations and chemistry, Chem. Soc. Rev., 41, 6405–6447, 2012.
Burkholder, J. B., Sander, S. P., Abbatt, J., Barker, J. R., Cappa, C., Crounse, J. D., Dibble, T. S., Huie, R. E., Kolb, C. E., Kurylo, M. J., Orkin, V. L., Percival, C. J., Wilmouth, D. M., and Wine, P. H.: Chemical Kinetics and Photochemical Data for Use in Atmospheric Studies, Evaluation No. 19, JPL Publication 19-5, Jet Propulsion Laboratory, Pasadena, http://jpldataeval.jpl.nasa.gov (last access: 25 October 2024), 2020.
Cantrell, C. and Michoud, V.: An Experiment to Study Atmospheric Oxidation Chemistry and Physics of Mixed Anthropogenic–Biogenic Air Masses in the Greater Paris Area, B. Am. Meteorol. Soc., 103, 599–603, https://doi.org/10.1175/BAMS-D-21-0115.1, 2022.
Claflin, M. S. and Ziemann, P. J.: Identification and Quantitation of Aerosol Products of the Reaction of β-Pinene with NO3 Radicals and Implications for Gas- and Particle-Phase Reaction Mechanisms, J. Phys. Chem. A, 122, 3640–3652, https://doi.org/10.1021/acs.jpca.8b00692, 2018.
Cox, R. A., Ammann, M., Crowley, J. N., Herrmann, H., Jenkin, M. E., McNeill, V. F., Mellouki, A., Troe, J., and Wallington, T. J.: Evaluated kinetic and photochemical data for atmospheric chemistry: Volume VII – Criegee intermediates, Atmos. Chem. Phys., 20, 13497–13519, https://doi.org/10.5194/acp-20-13497-2020, 2020.
Crounse, J. D., Knap, H. C., Ørnsø, K. B., Jørgensen, S., Paulot, F., Kjaergaard, H. G., and Wennberg, P. O.: Atmospheric Fate of Methacrolein. 1. Peroxy Radical Isomerization Following Addition of OH and O2, J. Phys. Chem. A, 116, 5756–5762, https://doi.org/10.1021/jp211560u, 2012.
Crowley, J.: ACROSS_MPIC_RambForest_O3_10min_L1, Aeris [data set], https://doi.org/10.25326/707, 2023.
Crowley, J. N., Pouvesle, N., Phillips, G. J., Axinte, R., Fischer, H., Petäjä, T., Nölscher, A., Williams, J., Hens, K., Harder, H., Martinez-Harder, M., Novelli, A., Kubistin, D., Bohn, B., and Lelieveld, J.: Insights into HOx and ROx chemistry in the boreal forest via measurement of peroxyacetic acid, peroxyacetic nitric anhydride (PAN) and hydrogen peroxide, Atmos. Chem. Phys., 18, 13457–13479, https://doi.org/10.5194/acp-18-13457-2018, 2018.
Denjean, C.: ACROSS_CNRM_RambForest_MTO-1MIN_L2, Aeris [data set], https://doi.org/10.25326/437, 2023.
DeVault, M. P., Ziola, A. C., and Ziemann, P. J.: Products and Mechanisms of Secondary Organic Aerosol Formation from the NO3 Radical-Initiated Oxidation of Cyclic and Acyclic Monoterpenes, ACS Earth Space Chem., 6, 2076–2092, https://doi.org/10.1021/acsearthspacechem.2c00130, 2022.
Dewald, P. and Crowley, J. N.: ACROSS_MPIC_RambForest_KNO3_10min_L2, Aeris [data set], https://doi.org/10.25326/545, 2023.
Dewald, P., Seubert, T., Andersen, S. T., Türk, G. N. T. E., Schuladen, J., McGillen, M. R., Denjean, C., Etienne, J.-C., Garrouste, O., Jamar, M., Harb, S., Cirtog, M., Michoud, V., Cazaunau, M., Bergé, A., Cantrell, C., Dusanter, S., Picquet-Varrault, B., Kukui, A., Xue, C., Mellouki, A., Lelieveld, J., and Crowley, J. N.: NO3 reactivity during a summer period in a temperate forest below and above the canopy, Atmos. Chem. Phys., 24, 8983–8997, https://doi.org/10.5194/acp-24-8983-2024, 2024.
Draxler, R. R. and Rolph, G. D.: HYSPLIT (HYbrid Single-Particle Lagrangian Integrated Trajectory) Model, NOAA Air Resources Laboratory (ARL) READY Website, Silver Spring, MD, http://ready.arl.noaa.gov/HYSPLIT.php (last access: 13 April 2023), 2011.
Dusanter, S. and Jamar, M.: ACROSS_IMTNE_RambForest_Jvalues_AboveCanopy_L2, Aeris [data set], https://doi.org/10.25326/774, 2023.
Eisele, F. L. and Tanner, D. J.: Ion-Assisted Tropospheric Oh Measurements, J. Geophys. Res.-Atmos., 96, 9295–9308, 1991.
Fry, J. L., Draper, D. C., Barsanti, K. C., Smith, J. N., Ortega, J., Winkle, P. M., Lawler, M. J., Brown, S. S., Edwards, P. M., Cohen, R. C., and Lee, L.: Secondary Organic Aerosol Formation and Organic Nitrate Yield from NO3 Oxidation of Biogenic Hydrocarbons, Environ. Sci. Technol., 48, 11944–11953, https://doi.org/10.1021/es502204x, 2014.
Fry, J. L., Kiendler-Scharr, A., Rollins, A. W., Wooldridge, P. J., Brown, S. S., Fuchs, H., Dubé, W., Mensah, A., dal Maso, M., Tillmann, R., Dorn, H.-P., Brauers, T., and Cohen, R. C.: Organic nitrate and secondary organic aerosol yield from NO3 oxidation of β-pinene evaluated using a gas-phase kinetics/aerosol partitioning model, Atmos. Chem. Phys., 9, 1431–1449, https://doi.org/10.5194/acp-9-1431-2009, 2009.
Fry, J. L., Kiendler-Scharr, A., Rollins, A. W., Brauers, T., Brown, S. S., Dorn, H.-P., Dubé, W. P., Fuchs, H., Mensah, A., Rohrer, F., Tillmann, R., Wahner, A., Wooldridge, P. J., and Cohen, R. C.: SOA from limonene: role of NO3 in its generation and degradation, Atmos. Chem. Phys., 11, 3879–3894, https://doi.org/10.5194/acp-11-3879-2011, 2011.
Ge, Y., Solberg, S., Heal, M. R., Reimann, S., van Caspel, W., Hellack, B., Salameh, T., and Simpson, D.: Evaluation of modelled versus observed non-methane volatile organic compounds at European Monitoring and Evaluation Programme sites in Europe, Atmos. Chem. Phys., 24, 7699–7729, https://doi.org/10.5194/acp-24-7699-2024, 2024.
Guenther, A. B., Jiang, X., Heald, C. L., Sakulyanontvittaya, T., Duhl, T., Emmons, L. K., and Wang, X.: The Model of Emissions of Gases and Aerosols from Nature version 2.1 (MEGAN2.1): an extended and updated framework for modeling biogenic emissions, Geosci. Model Dev., 5, 1471–1492, https://doi.org/10.5194/gmd-5-1471-2012, 2012.
Hallquist, M., Wangberg, I., Ljungstrom, E., Barnes, I., and Becker, K. H.: Aerosol and product yields from NO3 radical-initiated oxidation of selected monoterpenes, Environ. Sci. Technol., 33, 553–559, https://doi.org/10.1021/es980292s, 1999.
Hallquist, M., Wenger, J. C., Baltensperger, U., Rudich, Y., Simpson, D., Claeys, M., Dommen, J., Donahue, N. M., George, C., Goldstein, A. H., Hamilton, J. F., Herrmann, H., Hoffmann, T., Iinuma, Y., Jang, M., Jenkin, M. E., Jimenez, J. L., Kiendler-Scharr, A., Maenhaut, W., McFiggans, G., Mentel, Th. F., Monod, A., Prévôt, A. S. H., Seinfeld, J. H., Surratt, J. D., Szmigielski, R., and Wildt, J.: The formation, properties and impact of secondary organic aerosol: current and emerging issues, Atmos. Chem. Phys., 9, 5155–5236, https://doi.org/10.5194/acp-9-5155-2009, 2009.
IUPAC Task Group: Evaluated kinetic and photochemical data, Aeris, https://iupac.aeris-data.fr/, last access: 25 October 2024.
Kanakidou, M., Seinfeld, J. H., Pandis, S. N., Barnes, I., Dentener, F. J., Facchini, M. C., Van Dingenen, R., Ervens, B., Nenes, A., Nielsen, C. J., Swietlicki, E., Putaud, J. P., Balkanski, Y., Fuzzi, S., Horth, J., Moortgat, G. K., Winterhalter, R., Myhre, C. E. L., Tsigaridis, K., Vignati, E., Stephanou, E. G., and Wilson, J.: Organic aerosol and global climate modelling: a review, Atmos. Chem. Phys., 5, 1053–1123, https://doi.org/10.5194/acp-5-1053-2005, 2005.
Kukui, A.: ACROSS_LPC2E_Rambforest_OH_L2, Aeris [data set], https://doi.org/10.25326/510, 2023a.
Kukui, A.: ACROSS_LPC2E_Rambforest_RO2_L2, Aeris [data set], https://doi.org/10.25326/509, 2023b.
Kukui, A., Ancellet, G., and Le Bras, G.: Chemical ionisation mass spectrometer for measurements of OH and Peroxy radical concentrations in moderately polluted atmospheres, J. Atmos. Chem., 61, 133–154, https://doi.org/10.1007/s10874-009-9130-9, 2008.
Kukui, A., Chartier, M., Wang, J., Chen, H., Dusanter, S., Sauvage, S., Michoud, V., Locoge, N., Gros, V., Bourrianne, T., Sellegri, K., and Pichon, J.-M.: Role of Criegee intermediates in the formation of sulfuric acid at a Mediterranean (Cape Corsica) site under influence of biogenic emissions, Atmos. Chem. Phys., 21, 13333–13351, https://doi.org/10.5194/acp-21-13333-2021, 2021.
Kwan, A. J., Chan, A. W. H., Ng, N. L., Kjaergaard, H. G., Seinfeld, J. H., and Wennberg, P. O.: Peroxy radical chemistry and OH radical production during the NO3-initiated oxidation of isoprene, Atmos. Chem. Phys., 12, 7499–7515, https://doi.org/10.5194/acp-12-7499-2012, 2012.
Liebmann, J., Karu, E., Sobanski, N., Schuladen, J., Ehn, M., Schallhart, S., Quéléver, L., Hellen, H., Hakola, H., Hoffmann, T., Williams, J., Fischer, H., Lelieveld, J., and Crowley, J. N.: Direct measurement of NO3 radical reactivity in a boreal forest, Atmos. Chem. Phys., 18, 3799–3815, https://doi.org/10.5194/acp-18-3799-2018, 2018a.
Liebmann, J., Sobanski, N., Schuladen, J., Karu, E., Hellén, H., Hakola, H., Zha, Q., Ehn, M., Riva, M., Heikkinen, L., Williams, J., Fischer, H., Lelieveld, J., and Crowley, J. N.: Alkyl nitrates in the boreal forest: formation via the NO3-, OH- and O3-induced oxidation of biogenic volatile organic compounds and ambient lifetimes, Atmos. Chem. Phys., 19, 10391–10403, https://doi.org/10.5194/acp-19-10391-2019, 2019.
Liebmann, J. M., Muller, J. B. A., Kubistin, D., Claude, A., Holla, R., Plass-Dülmer, C., Lelieveld, J., and Crowley, J. N.: Direct measurements of NO3 reactivity in and above the boundary layer of a mountaintop site: identification of reactive trace gases and comparison with OH reactivity, Atmos. Chem. Phys., 18, 12045–12059, https://doi.org/10.5194/acp-18-12045-2018, 2018b.
Lightfoot, P. D., Cox, R. A., Crowley, J. N., Destriau, M., Hayman, G. D., Jenkin, M. E., Moortgat, G. K., and Zabel, F.: Organic peroxy radicals - kinetics, spectroscopy and tropospheric chemistry, Atmos. Environ. A-Gen., 26, 1805–1961, 1992.
Mellouki, A., Ammann, M., Cox, R. A., Crowley, J. N., Herrmann, H., Jenkin, M. E., McNeill, V. F., Troe, J., and Wallington, T. J.: Evaluated kinetic and photochemical data for atmospheric chemistry: volume VIII – gas-phase reactions of organic species with four, or more, carbon atoms (≥ C4), Atmos. Chem. Phys., 21, 4797–4808, https://doi.org/10.5194/acp-21-4797-2021, 2021.
Meusel, H., Kuhn, U., Reiffs, A., Mallik, C., Harder, H., Martinez, M., Schuladen, J., Bohn, B., Parchatka, U., Crowley, J. N., Fischer, H., Tomsche, L., Novelli, A., Hoffmann, T., Janssen, R. H. H., Hartogensis, O., Pikridas, M., Vrekoussis, M., Bourtsoukidis, E., Weber, B., Lelieveld, J., Williams, J., Pöschl, U., Cheng, Y., and Su, H.: Daytime formation of nitrous acid at a coastal remote site in Cyprus indicating a common ground source of atmospheric HONO and NO, Atmos. Chem. Phys., 16, 14475–14493, https://doi.org/10.5194/acp-16-14475-2016, 2016.
Michoud, V., Bouzidi, H., Formenti, P., Bauville, A., Cazaunau, M., Alage, S., Cirtog, M., De Haan, D., and Rafla, M.: ACROSS_2022_RambForest_LISA_PTRMS_VOCs_Belowcanopy_10min_20220617 - 20220723, Aeris [data set], https://doi.org/10.25326/685, 2024.
Ng, N. L., Brown, S. S., Archibald, A. T., Atlas, E., Cohen, R. C., Crowley, J. N., Day, D. A., Donahue, N. M., Fry, J. L., Fuchs, H., Griffin, R. J., Guzman, M. I., Herrmann, H., Hodzic, A., Iinuma, Y., Jimenez, J. L., Kiendler-Scharr, A., Lee, B. H., Luecken, D. J., Mao, J., McLaren, R., Mutzel, A., Osthoff, H. D., Ouyang, B., Picquet-Varrault, B., Platt, U., Pye, H. O. T., Rudich, Y., Schwantes, R. H., Shiraiwa, M., Stutz, J., Thornton, J. A., Tilgner, A., Williams, B. J., and Zaveri, R. A.: Nitrate radicals and biogenic volatile organic compounds: oxidation, mechanisms, and organic aerosol, Atmos. Chem. Phys., 17, 2103–2162, https://doi.org/10.5194/acp-17-2103-2017, 2017.
Nozière, B., Barnes, I., and Becker, K.-H.: Product study and mechanisms of the reactions of α-pinene and of pinonaldehyde with OH radicals, J. Geophys. Res.-Atmos., 104, 23645–23656, https://doi.org/10.1029/1999JD900778, 1999.
Perring, A. E., Pusede, S. E., and Cohen, R. C.: An observational perspective on the atmospheric impacts of alkyl and multifunctional nitrates on ozone and secondary organic aerosol, Chem. Rev., 113, 5848–5870, https://doi.org/10.1021/cr300520x, 2013.
Perring, A. E., Wisthaler, A., Graus, M., Wooldridge, P. J., Lockwood, A. L., Mielke, L. H., Shepson, P. B., Hansel, A., and Cohen, R. C.: A product study of the isoprene+NO3 reaction, Atmos. Chem. Phys., 9, 4945–4956, https://doi.org/10.5194/acp-9-4945-2009, 2009.
Rindelaub, J. D., McAvey, K. M., and Shepson, P. B.: The photochemical production of organic nitrates from alpha-pinene and loss via acid-dependent particle phase hydrolysis, Atmos. Environ., 100, 193–201, https://doi.org/10.1016/j.atmosenv.2014.11.010, 2015.
Rollins, A. W., Kiendler-Scharr, A., Fry, J. L., Brauers, T., Brown, S. S., Dorn, H.-P., Dubé, W. P., Fuchs, H., Mensah, A., Mentel, T. F., Rohrer, F., Tillmann, R., Wegener, R., Wooldridge, P. J., and Cohen, R. C.: Isoprene oxidation by nitrate radical: alkyl nitrate and secondary organic aerosol yields, Atmos. Chem. Phys., 9, 6685–6703, https://doi.org/10.5194/acp-9-6685-2009, 2009.
Sander, R. and Andersen, S. T.: ACROSS_Mecca_model_output, Edmond [data set], https://doi.org/10.17617/3.NZ3XZG, 2025.
Sander, R., Baumgaertner, A., Cabrera-Perez, D., Frank, F., Gromov, S., Grooß, J.-U., Harder, H., Huijnen, V., Jöckel, P., Karydis, V. A., Niemeyer, K. E., Pozzer, A., Riede, H., Schultz, M. G., Taraborrelli, D., and Tauer, S.: The community atmospheric chemistry box model CAABA/MECCA-4.0, Geosci. Model Dev., 12, 1365–1385, https://doi.org/10.5194/gmd-12-1365-2019, 2019.
Schwantes, R. H., Teng, A. P., Nguyen, T. B., Coggon, M. M., Crounse, J. D., St. Clair, J. M., Zhang, X., Schilling, K. A., Seinfeld, J. H., and Wennberg, P. O.: Isoprene NO3 Oxidation Products from the RO2 + HO2 Pathway, J. Phys. Chem. A, 119, 10158–10171, https://doi.org/10.1021/acs.jpca.5b06355, 2015.
Shepson, P. B., Bottenheim, J. W., Hastie, D. R., and Venkatram, A.: Determination of the relative ozone and PAN deposition velocities at night, Geophys. Res. Lett., 19, 1121–1124, https://doi.org/10.1029/92gl01118, 1992.
Shiraiwa, M., Ueda, K., Pozzer, A., Lammel, G., Kampf, C. J., Fushimi, A., Enami, S., Arangio, A. M., Fröhlich-Nowoisky, J., Fujitani, Y., Furuyama, A., Lakey, P. S. J., Lelieveld, J., Lucas, K., Morino, Y., Pöschl, U., Takahama, S., Takami, A., Tong, H., Weber, B., Yoshino, A., and Sato, K.: Aerosol Health Effects from Molecular to Global Scales, Environ. Sci. Technol., 51, 13545–13567, https://doi.org/10.1021/acs.est.7b04417, 2017.
Sobanski, N., Schuladen, J., Schuster, G., Lelieveld, J., and Crowley, J. N.: A five-channel cavity ring-down spectrometer for the detection of NO2, NO3, N2O5, total peroxy nitrates and total alkyl nitrates, Atmos. Meas. Tech., 9, 5103–5118, https://doi.org/10.5194/amt-9-5103-2016, 2016.
Spittler, M., Barnes, I., Bejan, I., Brockmann, K. J., Benter, T., and Wirtz, K.: Reactions of NO3 radicals with limonene and alpha-pinene: Product and SOA formation, Atmos. Environ., 40, 116–127, https://doi.org/10.1016/j.atmosenv.2005.09.093, 2006.
Thieser, J., Schuster, G., Schuladen, J., Phillips, G. J., Reiffs, A., Parchatka, U., Pöhler, D., Lelieveld, J., and Crowley, J. N.: A two-channel thermal dissociation cavity ring-down spectrometer for the detection of ambient NO2, RO2NO2 and RONO2, Atmos. Meas. Tech., 9, 553–576, https://doi.org/10.5194/amt-9-553-2016, 2016.
Wängberg, I., Barnes, I., and Becker, K. H.: Product and Mechanistic Study of the Reaction of NO3 Radicals with α-Pinene, Environ. Sci. Technol., 31, 2130–2135, 1997.
Wennberg, P. O., Bates, K. H., Crounse, J. D., Dodson, L. G., McVay, R. C., Mertens, L. A., Nguyen, T. B., Praske, E., Schwantes, R. H., Smarte, M. D., St Clair, J. M., Teng, A. P., Zhang, X., and Seinfeld, J. H.: Gas-Phase Reactions of Isoprene and Its Major Oxidation Products, Chem. Rev., 118, 3337–3390, https://doi.org/10.1021/acs.chemrev.7b00439, 2018.
Wolfe, G. M., Thornton, J. A., Yatavelli, R. L. N., McKay, M., Goldstein, A. H., LaFranchi, B., Min, K.-E., and Cohen, R. C.: Eddy covariance fluxes of acyl peroxy nitrates (PAN, PPN and MPAN) above a Ponderosa pine forest, Atmos. Chem. Phys., 9, 615–634, https://doi.org/10.5194/acp-9-615-2009, 2009.
Wolfe, G. M., Hanisco, T. F., Arkinson, H. L., Bui, T. P., Crounse, J. D., Dean-Day, J., Goldstein, A., Guenther, A., Hall, S. R., Huey, G., Jacob, D. J., Karl, T., Kim, P. S., Liu, X., Marvin, M. R., Mikoviny, T., Misztal, P. K., Nguyen, T. B., Peischl, J., Pollack, I., Ryerson, T., St. Clair, J. M., Teng, A., Travis, K. R., Ullmann, K., Wennberg, P. O., and Wisthaler, A.: Quantifying sources and sinks of reactive gases in the lower atmosphere using airborne flux observations, Geophys. Res. Lett., 42, 8231–8240, https://doi.org/10.1002/2015GL065839, 2015.
Xue, C., Mcgillen, M., and Mellouki, A.: ACROSS_ICARE_ RambForest_NO_L2, Aeris [data set], https://doi.org/10.25326/512, 2023.