the Creative Commons Attribution 4.0 License.
the Creative Commons Attribution 4.0 License.
 | 12 Jun 2025
Surface-observation-constrained high-frequency coal mine methane emissions in Shanxi, China, reveal more emissions than inventories, consistent with satellite inversion
Fan Lu
Pravash Tiwari
Chang Ye
Yanan Shan
Qing Xu
Shuo Wang
Qiansi Tu
This work focuses on Changzhi, Shanxi, China, a city and surrounding rural region with one of the highest atmospheric concentrations of methane (CH4) worldwide (campaign-wide minimum, mean, standard deviation, and max observations: 2.0, 2.9, 1.3, and 16 ppm) due to a rapid increase in the mining, production, and use of coal over the past decade. An intensive 15 d surface observation campaign of CH4 concentration is used to drive a new analytical, mass-conserving method to compute and attribute CH4 emissions. Observations made in concentric circles at 1, 3, and 5 km around a high-production high gas coal mine yielded emissions of 0.73, 0.28, and 0.15 ppm min−1, respectively. For attribution a two-box mass-conserving model was used to identify the known mine's emissions from 0.042–5.3 ppm min−1 and a previously unidentified mine's emission from 0.22–7.9 ppm min−1. These results demonstrate the importance of simultaneously quantifying both the spatial and temporal distribution of CH4 emissions to better control regional-scale CH4 emissions. Results of the attribution are used in tandem with observations of boundary layer height to quantify policy-relevant emissions from the two coal mines as 6860 ± 3520 and 1010 ± 347 kg h−1, respectively. Both mines display a fat-tailed distribution, with respective 25th percentile, median, and 75th percentile values of [1600, 3070, 10 500] and [755, 1090, 1420] kg h−1. These findings are demonstrated to be higher than CH4 emissions from equivalent oil and gas operations in the USA, with one about double and the other similar to day-to-day emissions inverted over 5 years using TROPOMI over the same region.
- Article
(9965 KB) - Full-text XML
-
Supplement
(1659 KB) - BibTeX
- EndNote


Emissions of methane (CH4) contribute the second most to direct anthropogenic longwave radiative forcing (Etminan et al., 2016; Li et al., 2022). Since CH4 has a lifetime from 9.5 to 12.5 years (Li et al., 2022; Prather et al., 2012), controlling CH4 emissions can provide an opportunity to mitigate peak loading and slow the rate of net global warming. Emissions from fossil fuel are one of the largest sources of anthropogenic CH4 (Kirschke et al., 2013; Saunois et al., 2020a). China is the world's largest producer and consumer of coal (U.S. Energy Information Administration, 2025); coal mines contribute up to 33 %–40 % of China's CH4 emissions (Janssens-Maenhout et al., 2017; Miller et al., 2019; Peng et al., 2016). Although China enacted coal mine CH4 (CMM) regulations in 2010, CMM continues to grow (Kerr and Yang, 2009; Miller et al., 2019). CH4 emission estimates remain uncertain in both space and time (Brandt et al., 2014; Saunois et al., 2020b). They also generally have a fat-tailed distribution, wherein a small number of samples have extremely large emissions that overwhelm emissions under average conditions (Duren et al., 2019; Plant et al., 2022). For these reasons, new approaches to quantify and reduce uncertainty and attribute CH4 emissions are necessary and can provide support for policies aiming to control and mitigate CMM (Cao, 2017).
Bottom-up (BU) quantification of emissions requires a priori knowledge of source locations and diversity, which tends not to represent real-world conditions. Top-down (TD) approaches analyze concentration data with improving accuracy (Allen, 2014; Rigby et al., 2019; Varon et al., 2018; Vaughn et al., 2018), specifically combining surface (Heerah et al., 2021; Katzenstein et al., 2003; Shi et al., 2023), aircraft (Karion et al., 2013; Shi et al., 2022; Tong et al., 2023; Vinković et al., 2022), and/or satellite (Wecht et al., 2014) CH4 observations with atmospheric models. Some TD approaches use physically realistic but complex chemical transport models (Bloom et al., 2017), others use plume models (Goldsmith et al., 2012), and others still use data-driven approaches (Buchwitz et al., 2017). Uncertainties in whether or not to consider the basic formulation of plume models as being reasonable under the observed conditions are rarely addressed holistically or in detail, including but not limited to stable wind speed and direction (Varon et al., 2018), no outside sources intersecting the plume (Varon et al., 2018), no significant enhancement in the background concentrations (Irakulis-Loitxate et al., 2021), no pooling or other non-linear behavior within the plume (Bruno et al., 2024), or where to draw the boundaries of a plume (He et al., 2024). Similarly, large-scale chemical transport models tend to be quite rigid, with internal parameters and processes not being variable, even if on the subgrid scale this may introduce considerable uncertainty (Cohen and Prinn, 2011; Cohen and Wang, 2014; Qin et al., 2023; Hu et al., 2024; Lu et al., 2025).
Airborne remote sensing is a highly technical and costly approach to record CH4 fluxes from landfills, coal basins, and oil and gas production (Krautwurst et al., 2021, 2017; Kuhlmann et al., 2023), which suffers from not being able to monitor CH4 emissions over long periods of time or in regions where the source is not well constrained (Brandt et al., 2014; Gorchov Negron et al., 2020; Hiller et al., 2014; Mehrotra et al., 2017; Molina et al., 2010). Satellite remote sensing can measure CH4 under specific orbits where the source is known and identified (Jacob et al., 2016, 2022; Plant et al., 2022; Varon et al., 2018; Zhang et al., 2020) but only after being calibrated by upward looking remotely sensed measurements (Tu et al., 2022) and only when the atmosphere is rain, cloud, and aerosol free (Cohen and Prinn, 2011; Reuter et al., 2019; Sadavarte et al., 2021). TROPOMI and GOSAT have both been shown to be data-rich at times (Butz et al., 2012; Hu et al., 2018; Jacob et al., 2016) but severely limited at other times (Butz et al., 2012; Kuze et al., 2009). Even when these satellites have sufficient data to compute emissions from other species, frequently CH4 emissions cannot be computed (Li et al., 2023; Qin et al., 2023) due to insufficient signal strength and uncertainties which are both non-understood and mis-constrained (Povey and Grainger, 2015).
Ground-based remote sensing provides higher accuracy compared to satellite observations (Heerah et al., 2021; Luther et al., 2022; Tu et al., 2022). EM27/SUN measurements have approximated CH4 emissions in Poland (Luther et al., 2019, 2022). However, these instruments are expensive, require calibration, and have limited data collection due to solar signal strength.
This work employs a high-frequency surface-based observation platform of CH4 concentration, which is portable, economical, and unaffected by most environmental factors. The observations are combined with a new mass-conserving methodology based on temporal transformation of the spatially derived mass-conserving framework successfully applied to NO2 (Li et al., 2023; Qin et al., 2023). This work focuses on Shanxi, one of the densest coal mining regions in the world, accounting for approximately 10 % total global coal production (Lin and Liu, 2010; Qin et al., 2024). Continuous observations were made around known coal mines and unknown sources and of background conditions. The two-box model used the high-frequency emissions calculated using these data to drive the attribution of emissions to the known mine and a second low production mine previously thought to be insignificant. The results provide insights into the spatial distribution of CH4 emissions, demonstrate rapid adoption of practical methods globally, and enable source attribution.
2.1 Study site and campaign design
Changzhi, Shanxi, is located in a basin, with coal mines and associated coal use industries densely distributed throughout both flat central regions and around the mountainous edges (Fig. 1), many of which are classified as high-CH4-emitting mines. Due to this combination, province-wide background CH4 concentrations are very high and have large variation in time. This study mainly focuses on two coal mines: one mine is classified as having high amounts of CH4 emissions per unit of production and an annual coal production of 4×10⁶ t (CM-A), and the other is unclassified for CH4 emissions per unit of production and as having an annual coal production of 3×10⁶ t (CM-B) (Qin et al., 2024). Instruments were positioned along concentric circles located 1, 3, and 5 km from CM-A, over an approximation of the four ordinal directions: east, west, south, and north (Fig. 2). All locations were planned to be far away from known anthropogenic sources, leading to a net total of 12 measurement points. As later discovered, CM-B is located approximately 1 km southwest of the measurement point located at 5 km west.
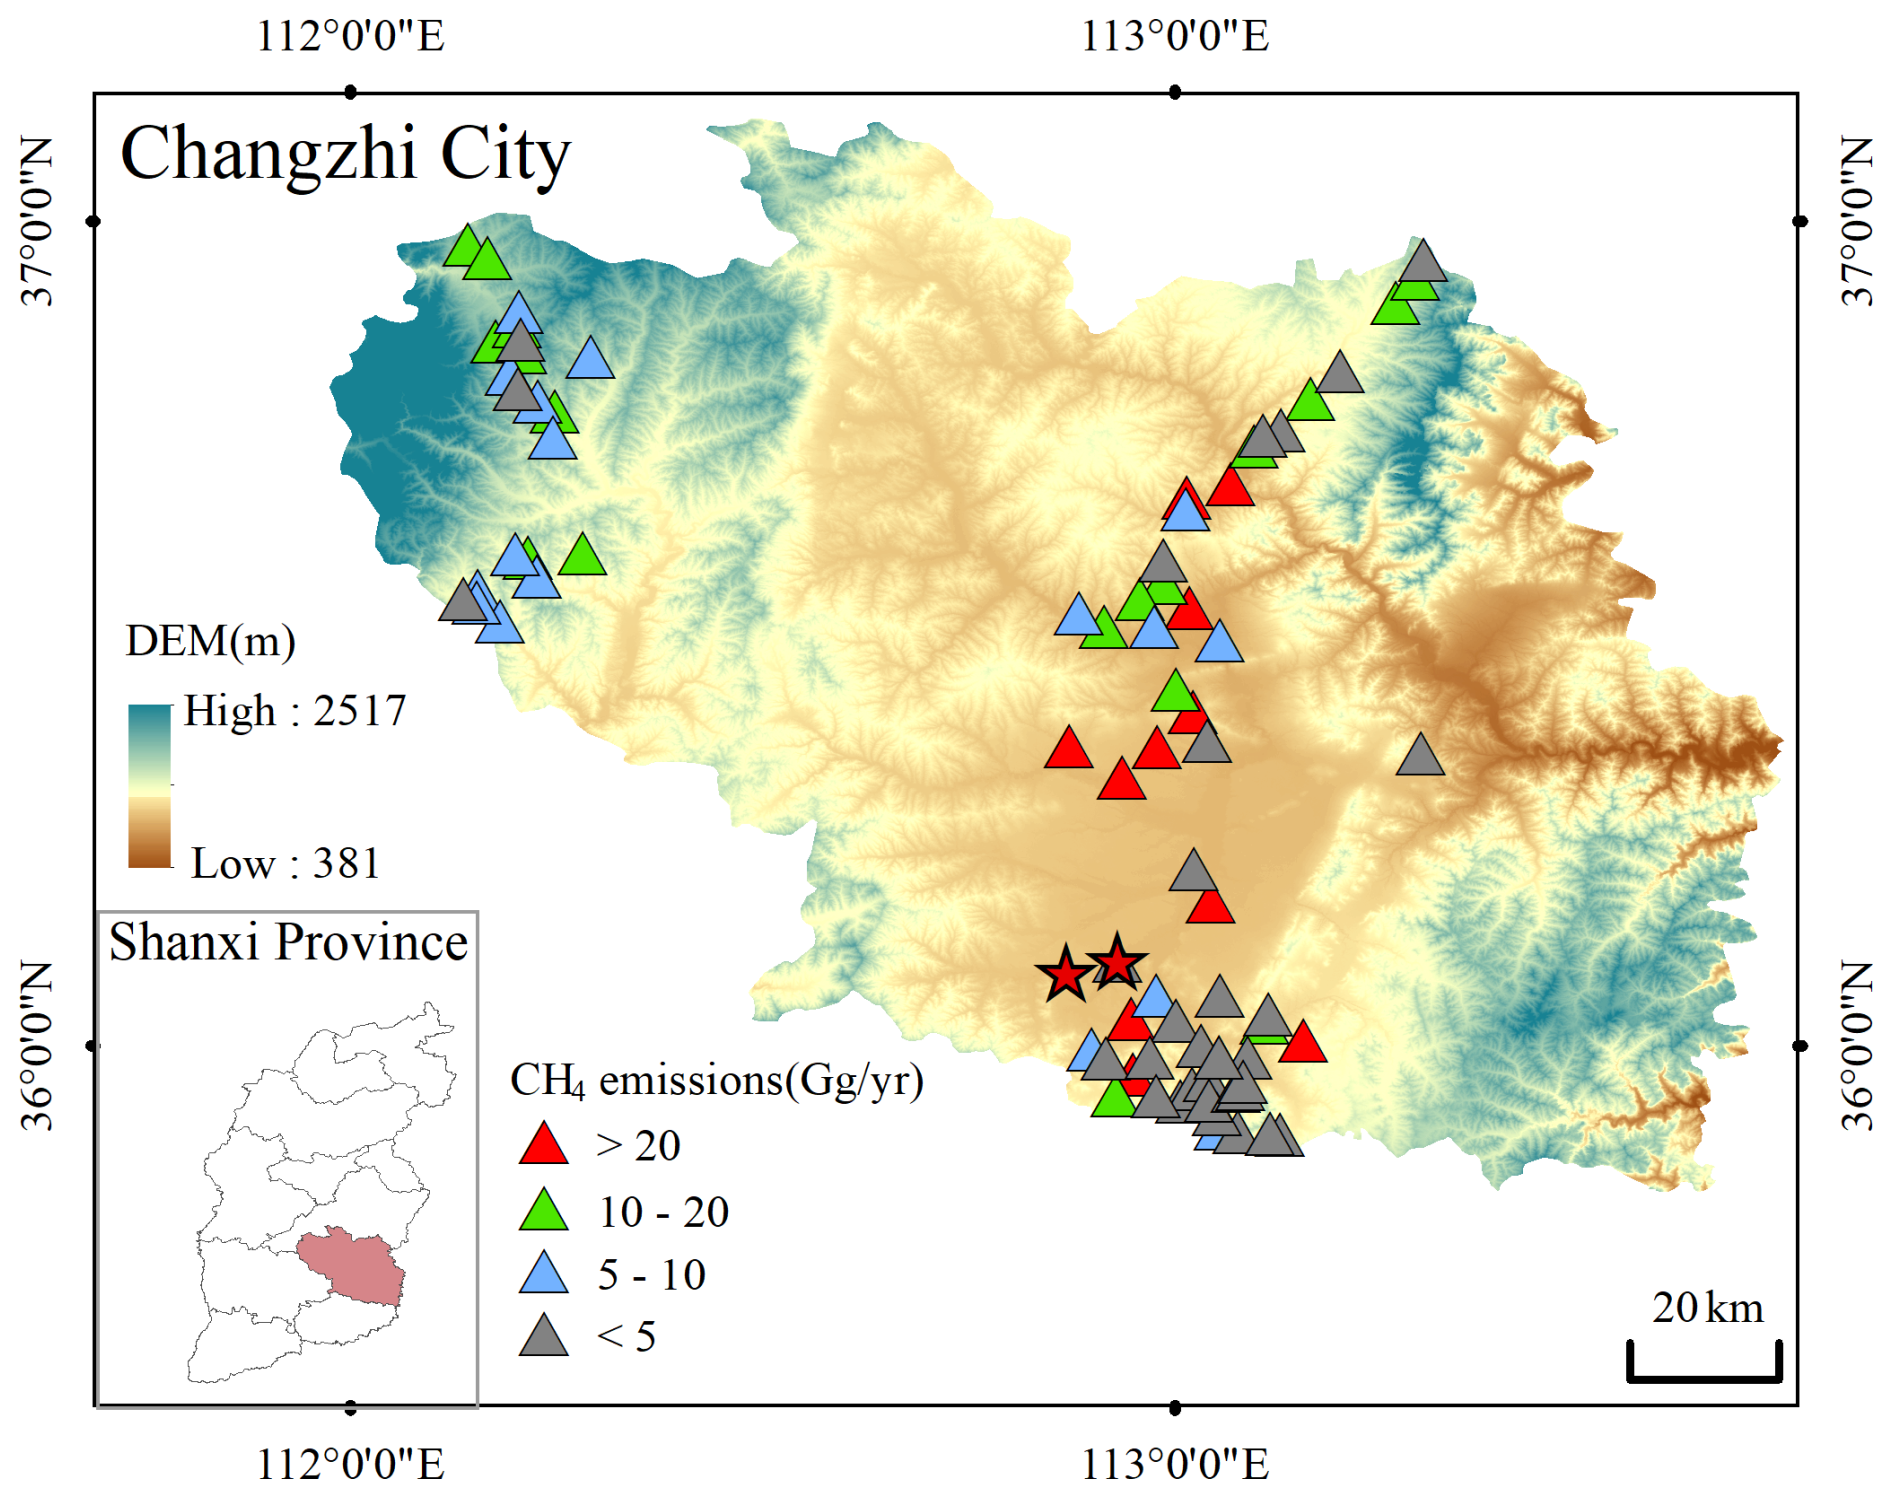
Figure 1Topographic map of Changzhi and its location in Shanxi Province (bottom left). The triangles represent the locations of all individual coal mines (including underground and abandoned mines), where the triangle color represents the emissions amount: high (red), middle (green), low (blue), and very low (grey). The red stars represent the two coal mines in this work.
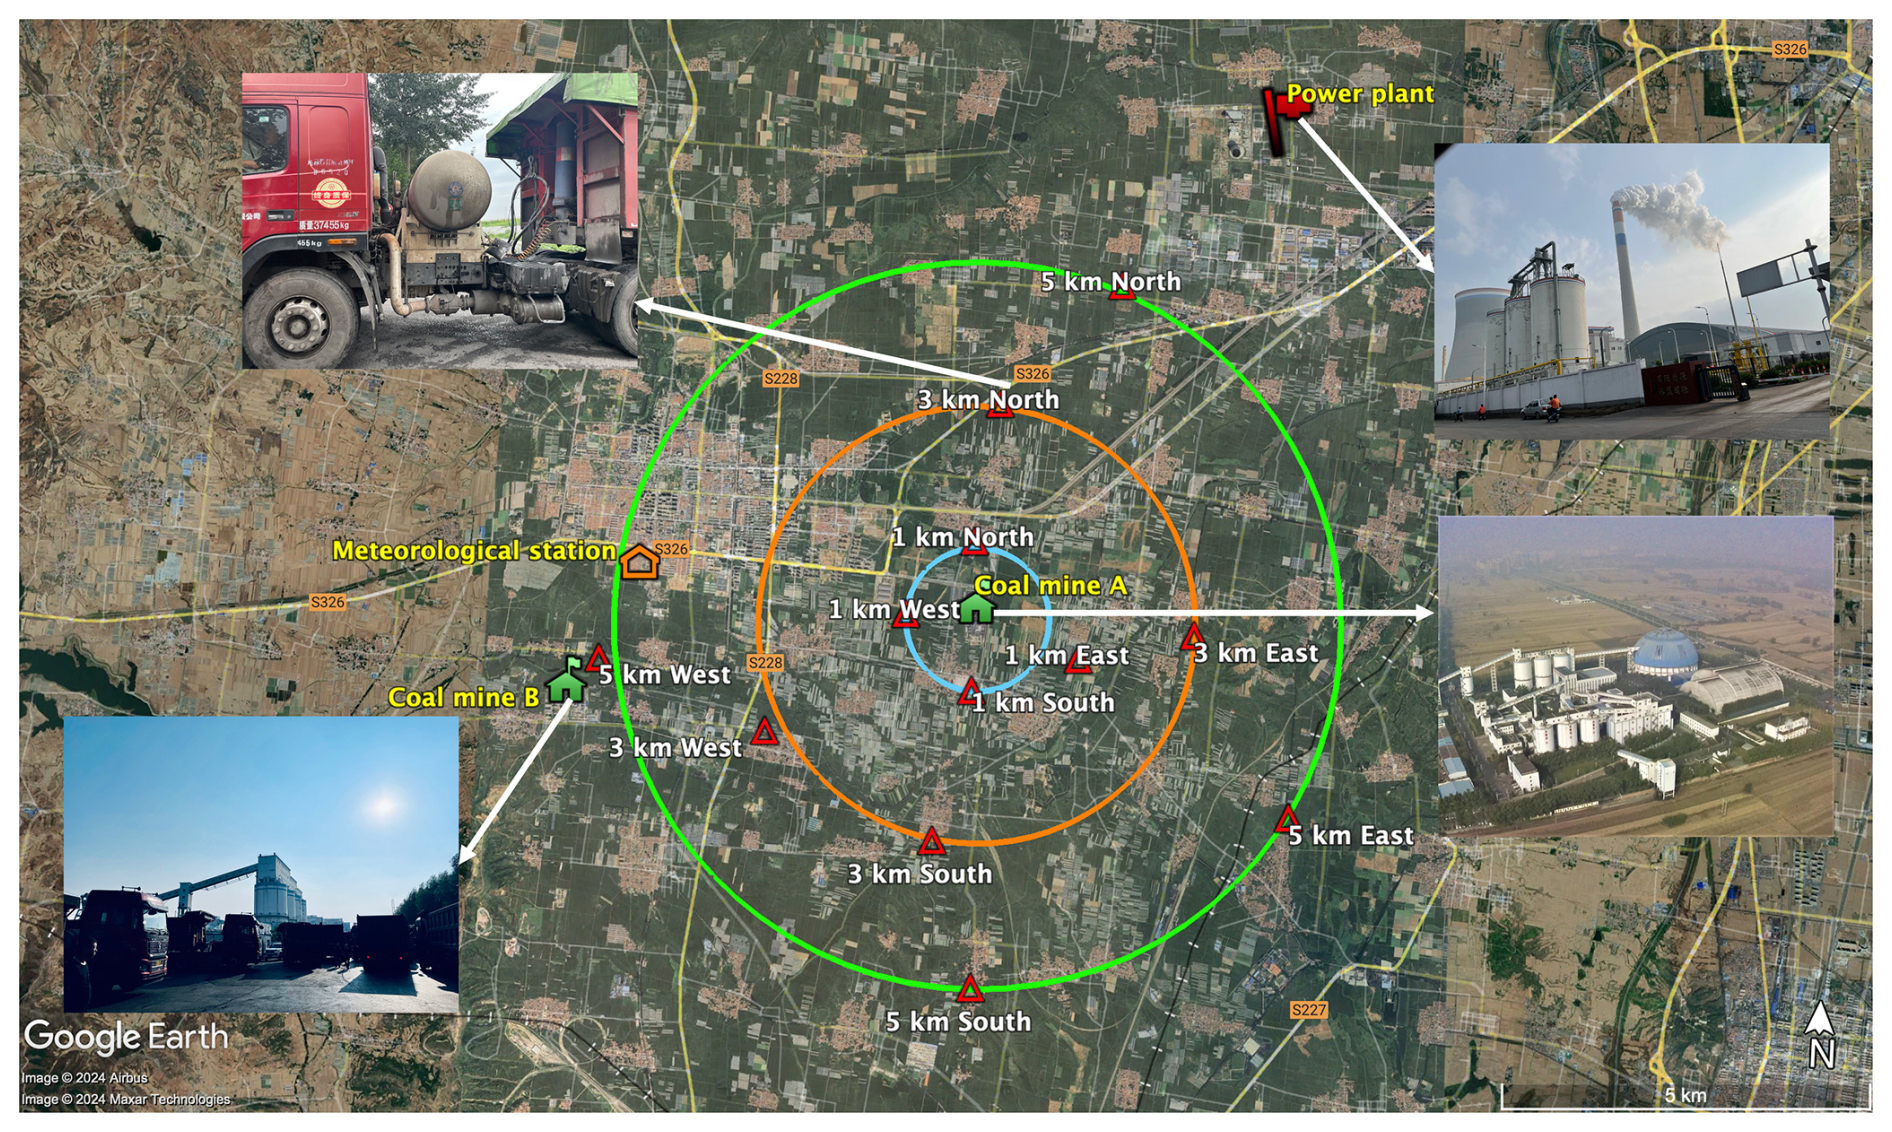
Figure 2Locations of four individual coal mines ( filled green houses), a power plant (red flag), and the 12 observation locations presented in this work (double-outlined red triangles). Distances from CM-A are given as concentric circles at 1 km (blue), 3 km (orange), and 5 km (green).
2.2 Measuring CH4 concentration
Atmospheric CH4 concentrations at 5 m above the surface were observed daily at 1 Hz from 08:30 to 17:00 local time (LT) in August 2022 using two portable greenhouse gas analyzers (LGR-915-0011, California, USA). Three different locations (1, 3, and 5 km) were selected daily along a single direction from the CM-A, allowing a more consistent and precise calculation of the spatial gradient (Table S1 in the Supplement). In order to reduce the time error, two portable greenhouse gas analyzers were used to randomly select the three observation points during the daily measurements and without fixed sequence. During field experiments, each day in a background location, we confirmed that the standard baseline was found within its reliable range. Further, to ensure measurement consistency when the instrument's location was changed, after relocation, we rechecked the condition against the standard baseline. In addition, the instrument was allowed to stabilize and any air from the previous location was flushed out, with the first 10 min of measurement data discarded to ensure that only local air was observed.
The CH4 concentration data were averaged minute by minute to match observed wind data and subsequently used to compute CH4 emissions. As shown in Figs. S1 and S2 in the Supplement, the CH4 concentration data are highly correlated with rapid changes in both the wind speed and direction.
Observations made in clean locations with a wind direction not from the mine are subsequently considered for background sites. The lowest and least variable CH4 concentration observations are found on 23 August in the south (2.08 ± 0.08 ppm) (Fig. S2). It is important to note that although this site has the minimum concentrations observed in this work, these values are significantly higher than the global latitude-band background. Three other locations and days were observed with relatively low mean and not significantly large variation: 19 August in the east (2.63 ± 0.35 ppm), 22 August in the east (2.65 ± 0.51 ppm) (Fig. S1), and 22 August in the south (2.60 ± 0.55 ppm) (Fig. S2). These results highlight the importance of accurately determining background concentrations in mass-balance emissions estimates. Unlike satellite-based emissions assessments, which often rely on separating plumes from global latitude bands or climatological background states (Buchwitz et al., 2017; Irakulis-Loitxate et al., 2021; Lauvaux et al., 2022; Sadavarte et al., 2021), in situ measurements typically determine background concentrations by sampling upwind or outside the plume (Brantley et al., 2014). In this study, we have taken the spirit of the latter approach a step further, to ensure that concentrations observed as relatively clean are actually representative of locally background air. This ensures that our background concentrations were representative of the local conditions not influenced directly by the site of interest (Fig. S2). This method provides a more accurate approach when the baseline itself also changes, as in the specific locations sampled in this work.
2.3 Meteorological data
The wind speed and direction were obtained from local meteorological stations with a temporal frequency of 1 min. As shown in Figs. 3 and 4 the overall wind was dominated by a southerly direction (38.0 % of observations between 150 and 210°) and found to be moderately slow (69.9 % of observations were between 1 and 4 m s−1). The 10th and 90th percentiles of wind direction (54 and 312°) and wind speed (1 and 5.1 m s−1), respectively, indicate that high-frequency sampling reveals that a small number of relatively large changes are observed, which are expected to lead to a “fat-tailed” type of distribution of subsequently computed CH4 emissions (Delkash et al., 2016).
The temperature and pressure data were measured by a handheld meteorological instrument (HWS1000, ZOGLAB, China) with an accuracy of ± 0.5 °C for temperature and ± 0.5 hPa for pressure, ensuring reliable data collection. The meteorological instrument was calibrated according to the manufacturer's guidelines prior to use. Measurements were taken at 5 s intervals to capture temporal variations in the atmospheric conditions. The temperature and pressure data were averaged minute by minute to match observed wind data and subsequently used to convert CH4 emissions units (ppm min−1) into policy-relevant units (kg h−1). The boundary layer data were obtained from https://doi.org/10.5281/zenodo.6498004 (Guo et al., 2022) based on a merging of reanalysis data with observations (Guo et al., 2024).
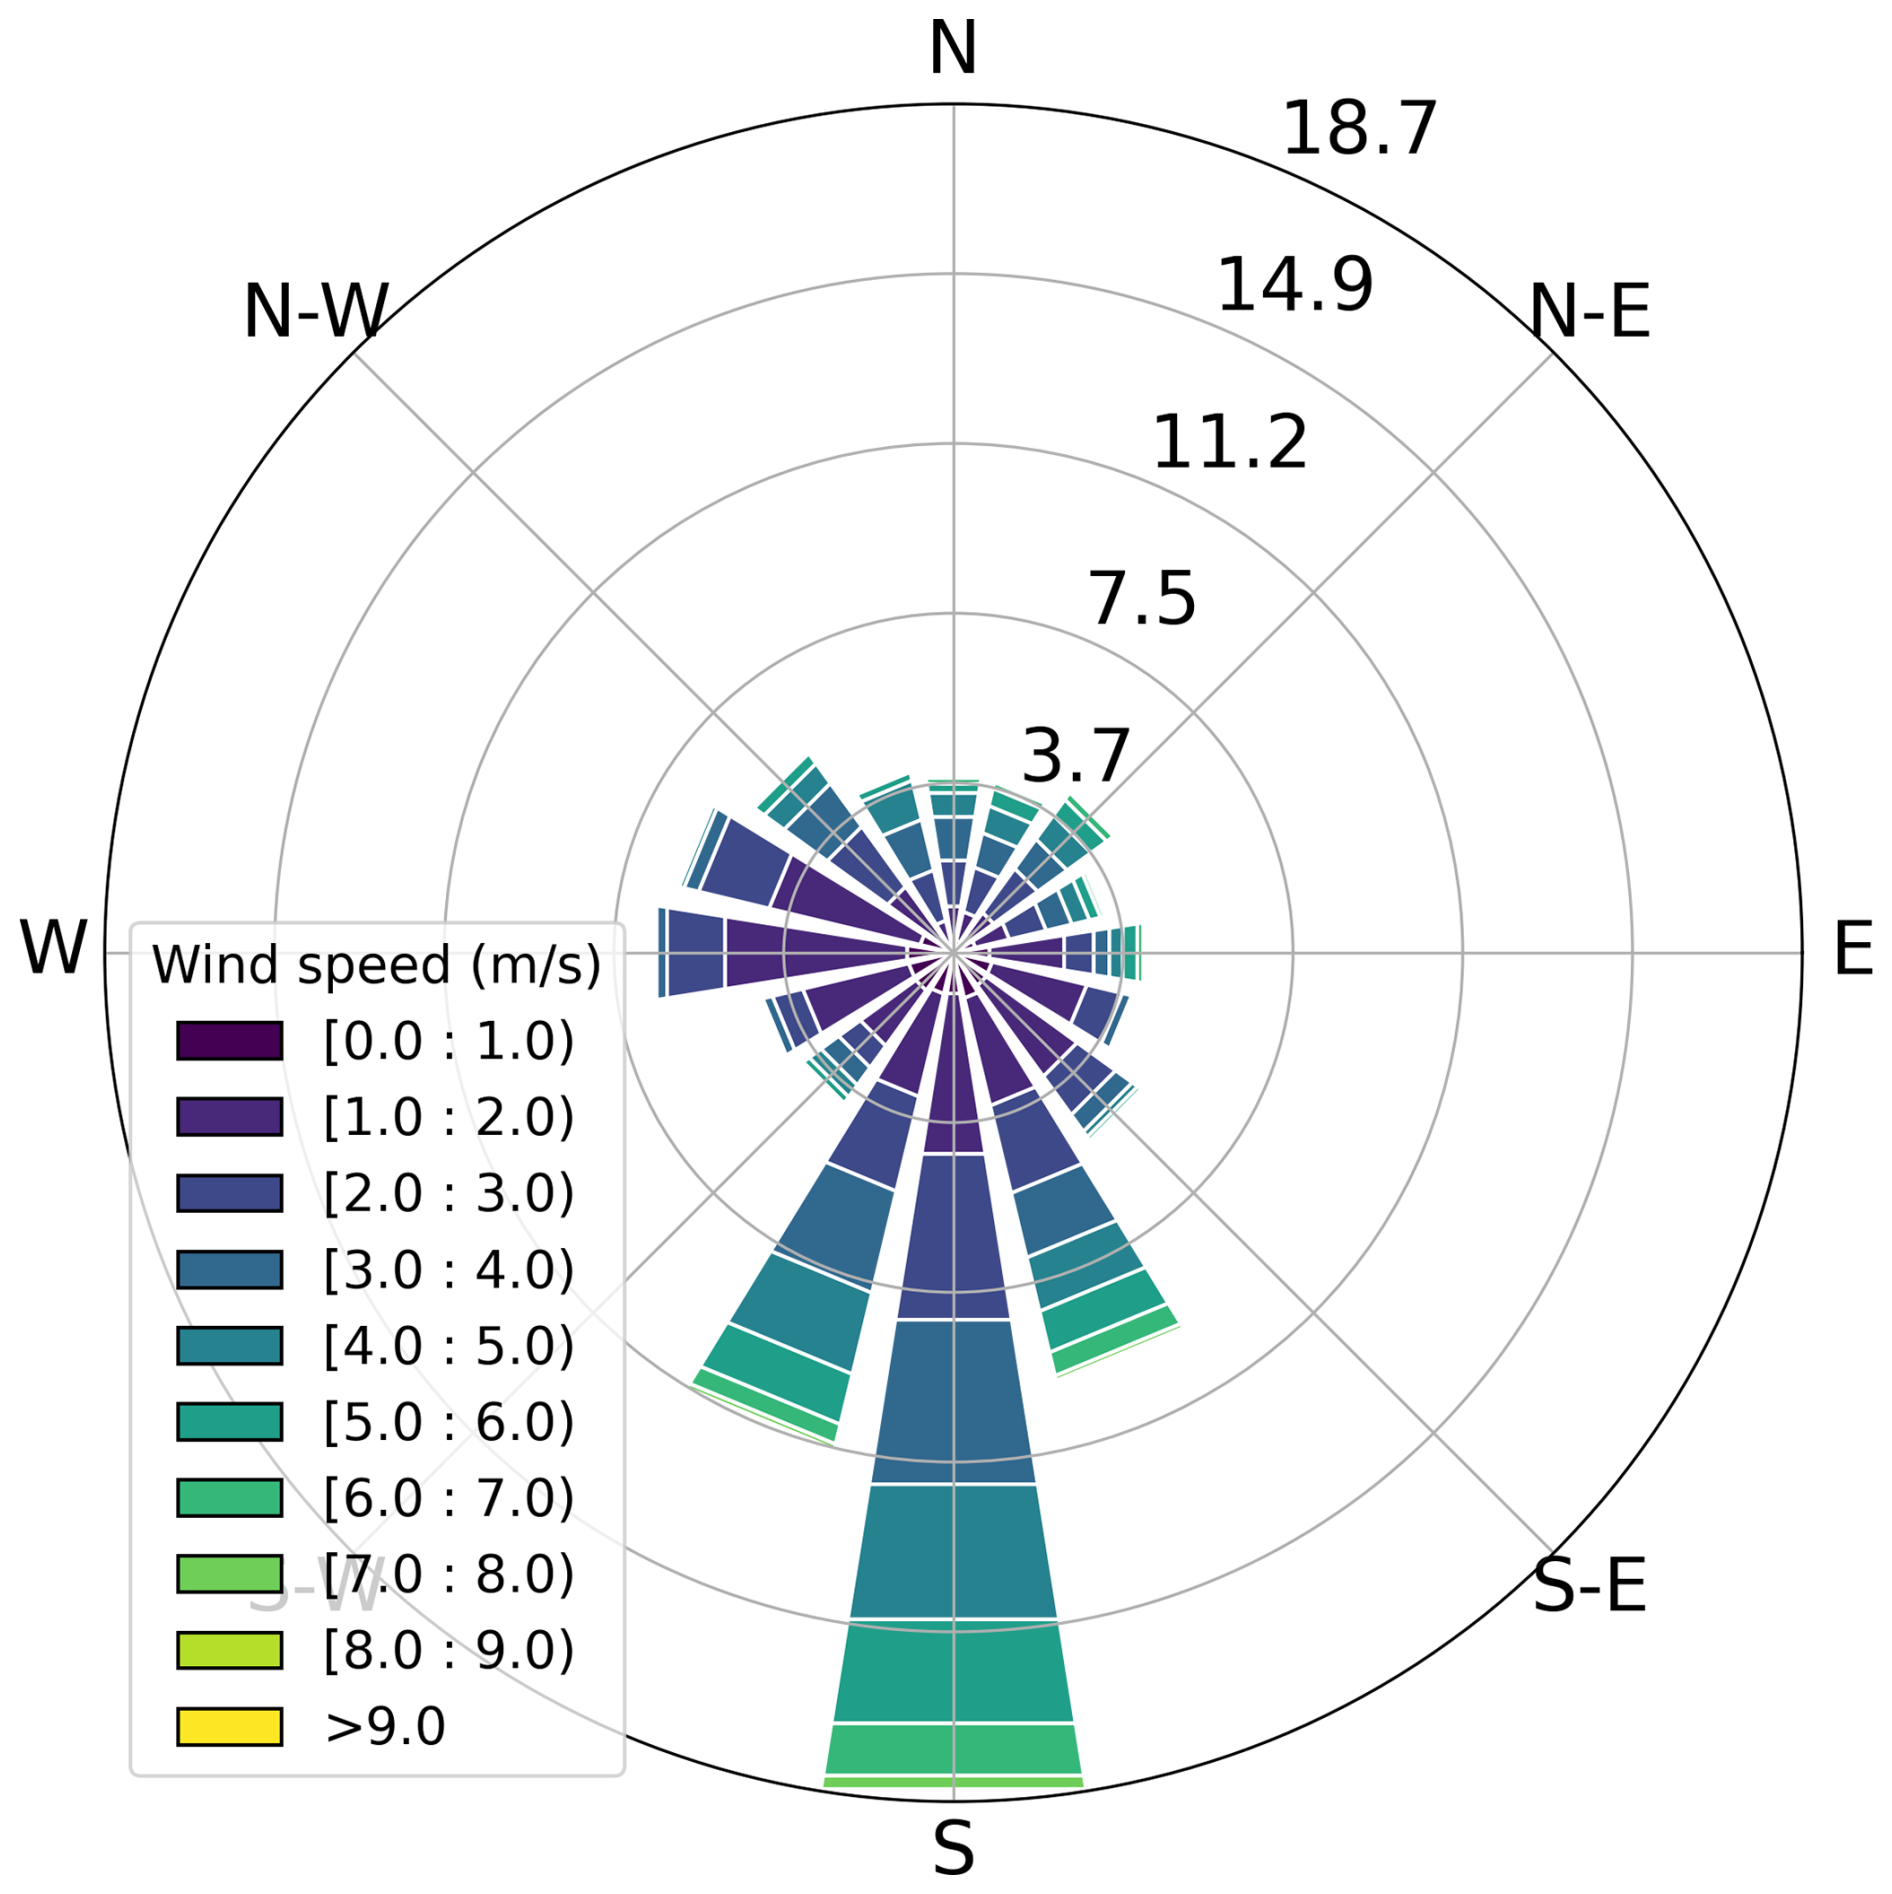
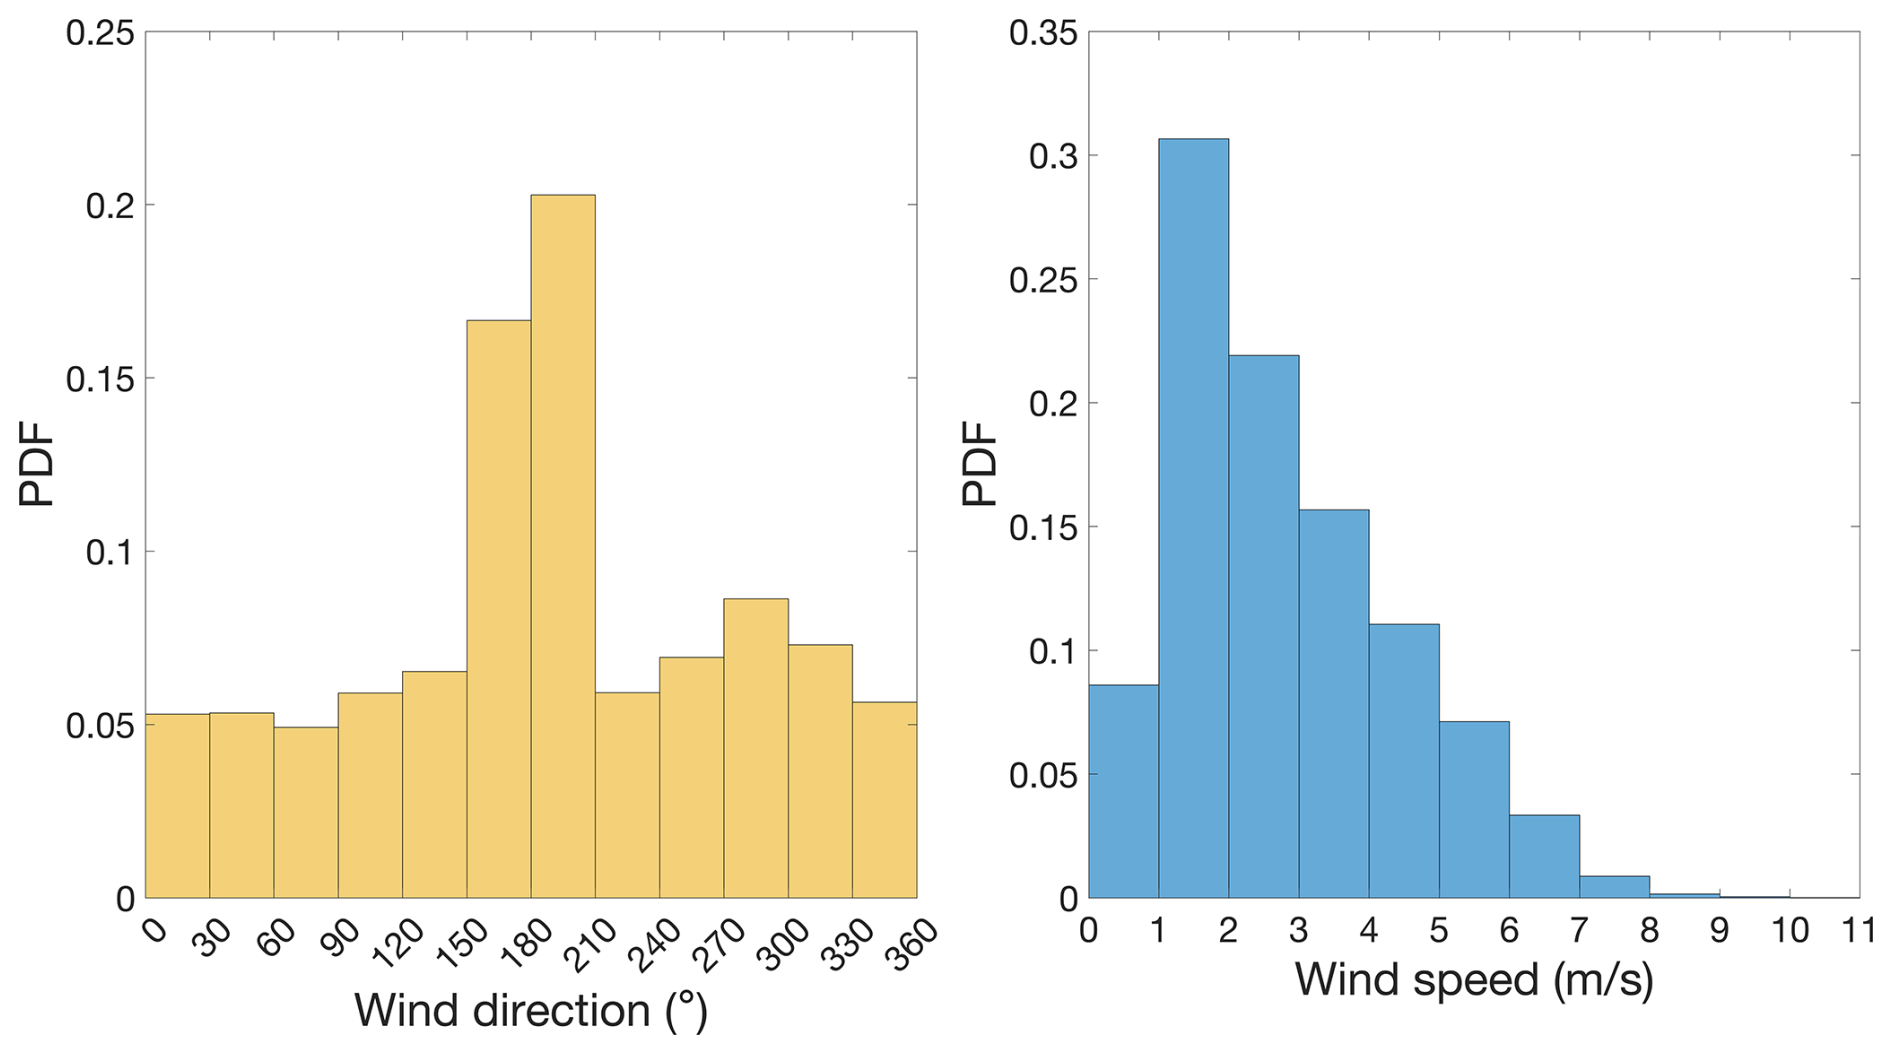
Figure 4Probability density function (PDF) for all observed wind direction (yellow) and wind speed (blue) from 10 to 25 August 2022.
2.4 Quantitative estimation of CH4 emissions
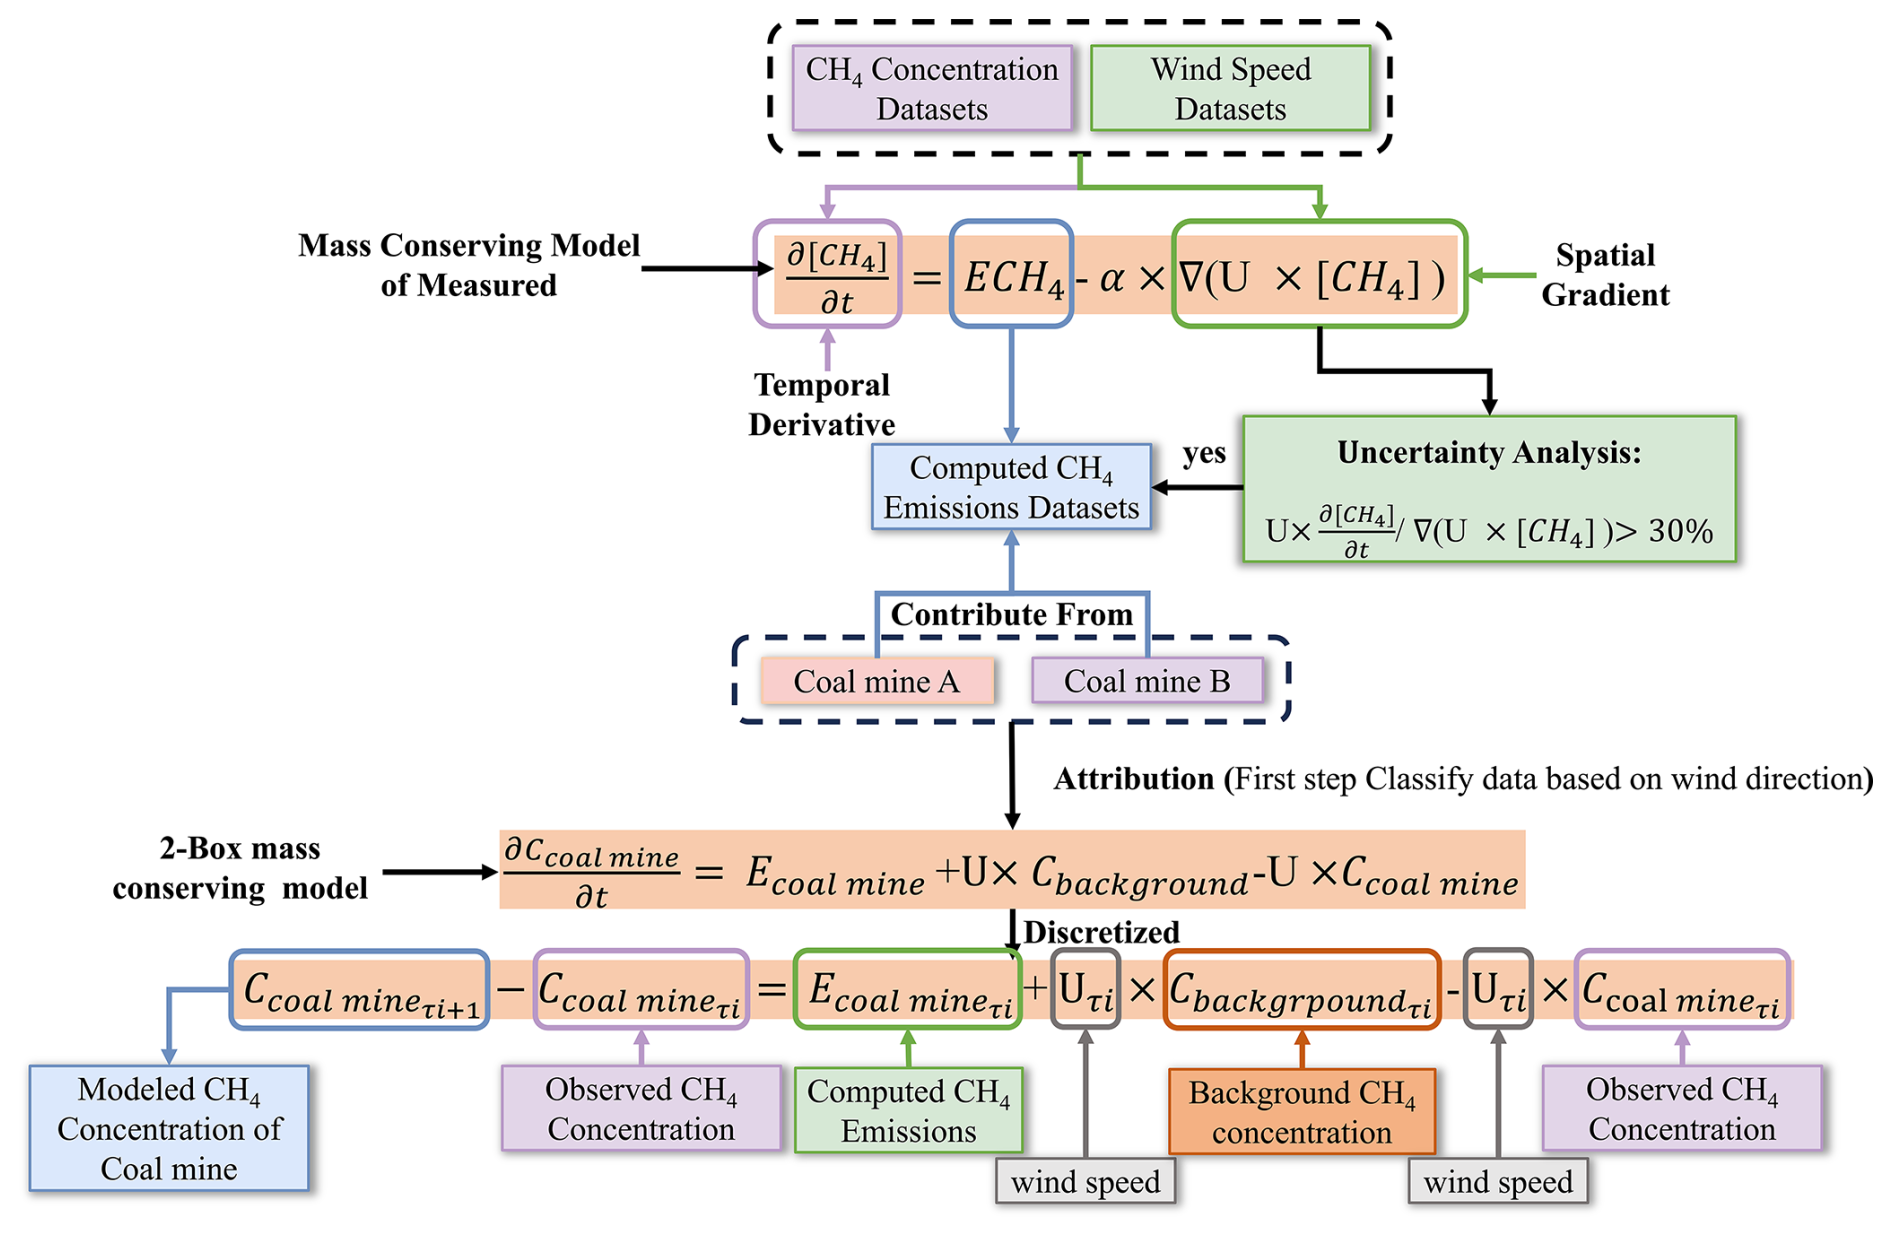
A mass-conserving approach was used to estimate the CH4 emissions using high-frequency observations of CH4 concentrations and meteorological data, hereafter called the Mass Conserving Model of Measured CMM (MCM2). This approach is based on previous dynamic emissions estimates of tropospheric atmospheric column observations of short-lived NO2 (Li et al., 2023; Qin et al., 2023) and CH4 (Hu et al., 2024) but has never been applied to surface observations or at minute-frequency scale. Adopting this approach to solve for CH4 emissions is done starting with the continuity equation for the conservation of mass (Eq. 1), reorganizing the individual terms and converting coordinates from space to time (Eq. 2) and finally combining the terms (Eq. 3) as follows:
where [CH4 ] is the CH4 concentration (ppm), is the temporal derivative operator, ECH4 is the CH4 emissions flux (ppm min−1), U is the wind speed (m s−1), and the ∇ is a mathematical gradient operator acting on spatially distributed variables. However, when considering motion along one dimension, the relationship between distance, speed, and time can be used to rewrite the spatial derivatives of ∇([CH4]) and ∇(U) as temporal derivatives (Brasseur and Jacob, 2017), where α is a conversion coefficient between distance and wind speed.
The gradient term used in these equations takes into account the local topography of Shanxi, which is known for its significant features and surrounding mountains. These geographical features can impact the transport and dispersion of CH4, and their effects are incorporated into the wind field in the continuity equation. Notably, when dealing with a non-divergent wind field, the gradient term simplifies to the term (U×∇[CH4]) (Sun, 2022). Uncertainty analysis was conducted before calculating the CH4 emissions to ensure only reliable data were used, since observed variation of CH4 concentrations over time is influenced not only by CH4 emissions but also changes in wind speed and pressure. Specifically, represents the change in CH4 concentrations influenced by pressure, while represents the change in CH4 concentrations influenced by advection. Furthermore, since there is uncertainty in the observations, this work takes a conservative approach and only considers data when the threshold given by Eq. (4) is observed to be influenced by emissions (a lower threshold can be selected like 25 % or 15 %, but uncertainty will increase).
The remaining data (approximately 22 %, presented as red circle indicators in Fig. 5) are not processed in the emissions calculation as the signal is most likely due to a combination of observational uncertainty and white noise (Prinn et al., 1987; Conrad et al., 2023).
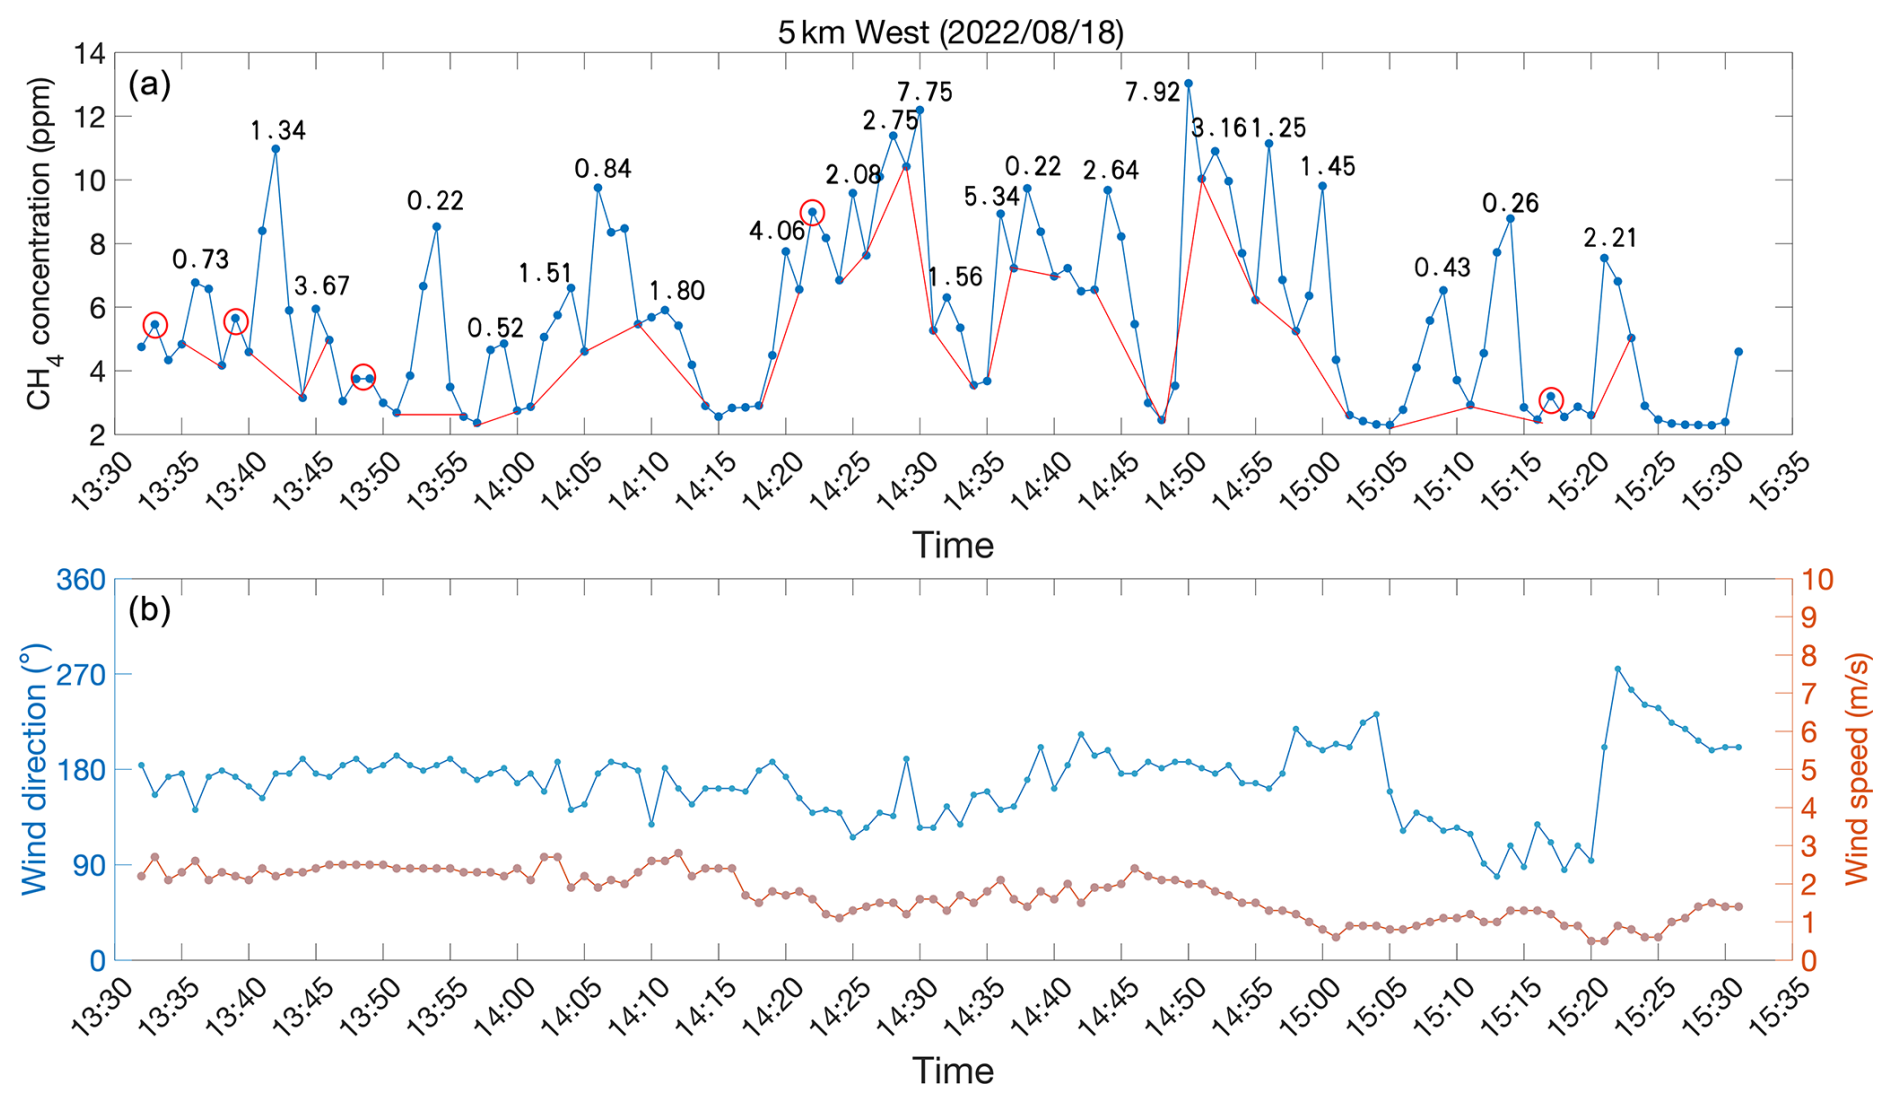
Figure 5Time series of CH4 concentrations (top, blue), background concentrations (top, red), wind direction (bottom, blue), and wind speed (bottom, red) measured 5 km west of CM-A on 18 August 2022. MCM2-computed CH4 emissions (top, numbers) (ppm min−1) are computed for all regions where the observations are enhanced compared with the background for at least three consecutive observations and which further pass the noise threshold (Eq. 4).
2.5 Uncertainty analysis
In order to reduce the uncertainty of the CH4 emissions estimation, only data above the threshold given by Eq. (4) are considered. Prior to this, uncertainty analysis was also conducted on the relevant variables in actual experiments. As shown in Fig. 6, a 5 % uncertainty was assigned to both the CH4 concentrations and wind speed data, and the CH4 emissions were calculated. The uncertainty analysis results indicate that the probability distribution of all possible calculated emissions is consistent, and the errors are smaller than 5 % in each case, consistent with Eq. (3), leading to a dampening of the uncertainty, as also observed in a study by Qin et al. (2024). Therefore, we believe that the results of CH4 emissions in this study can be trusted.
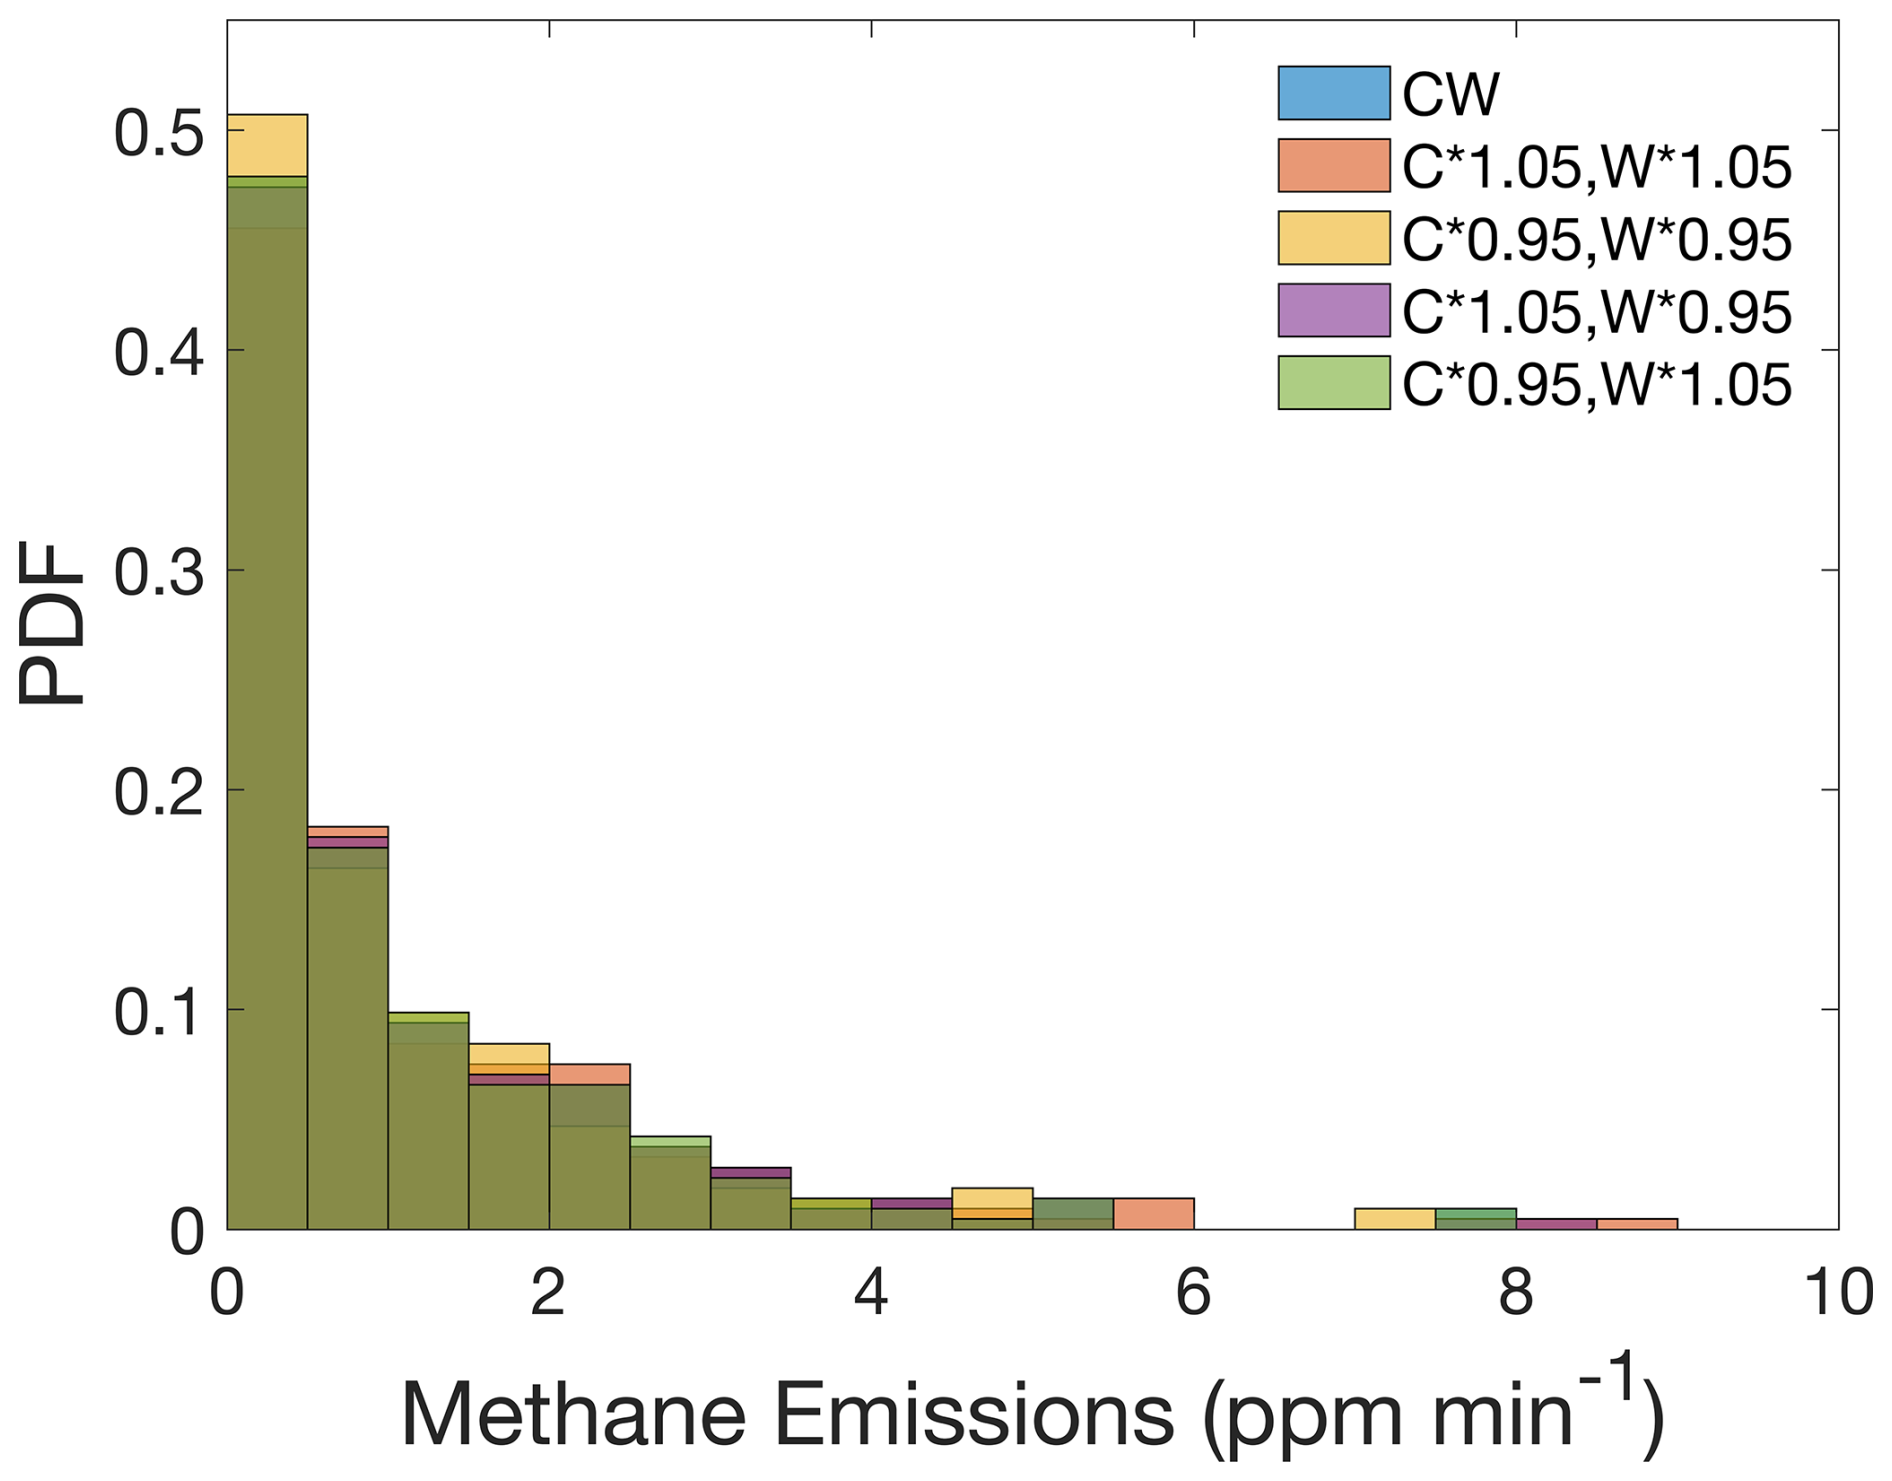
Figure 6The PDFs of uncertainty analysis results (C represents CH4 concentrations, W represents wind speed).
2.6 Attribution analysis
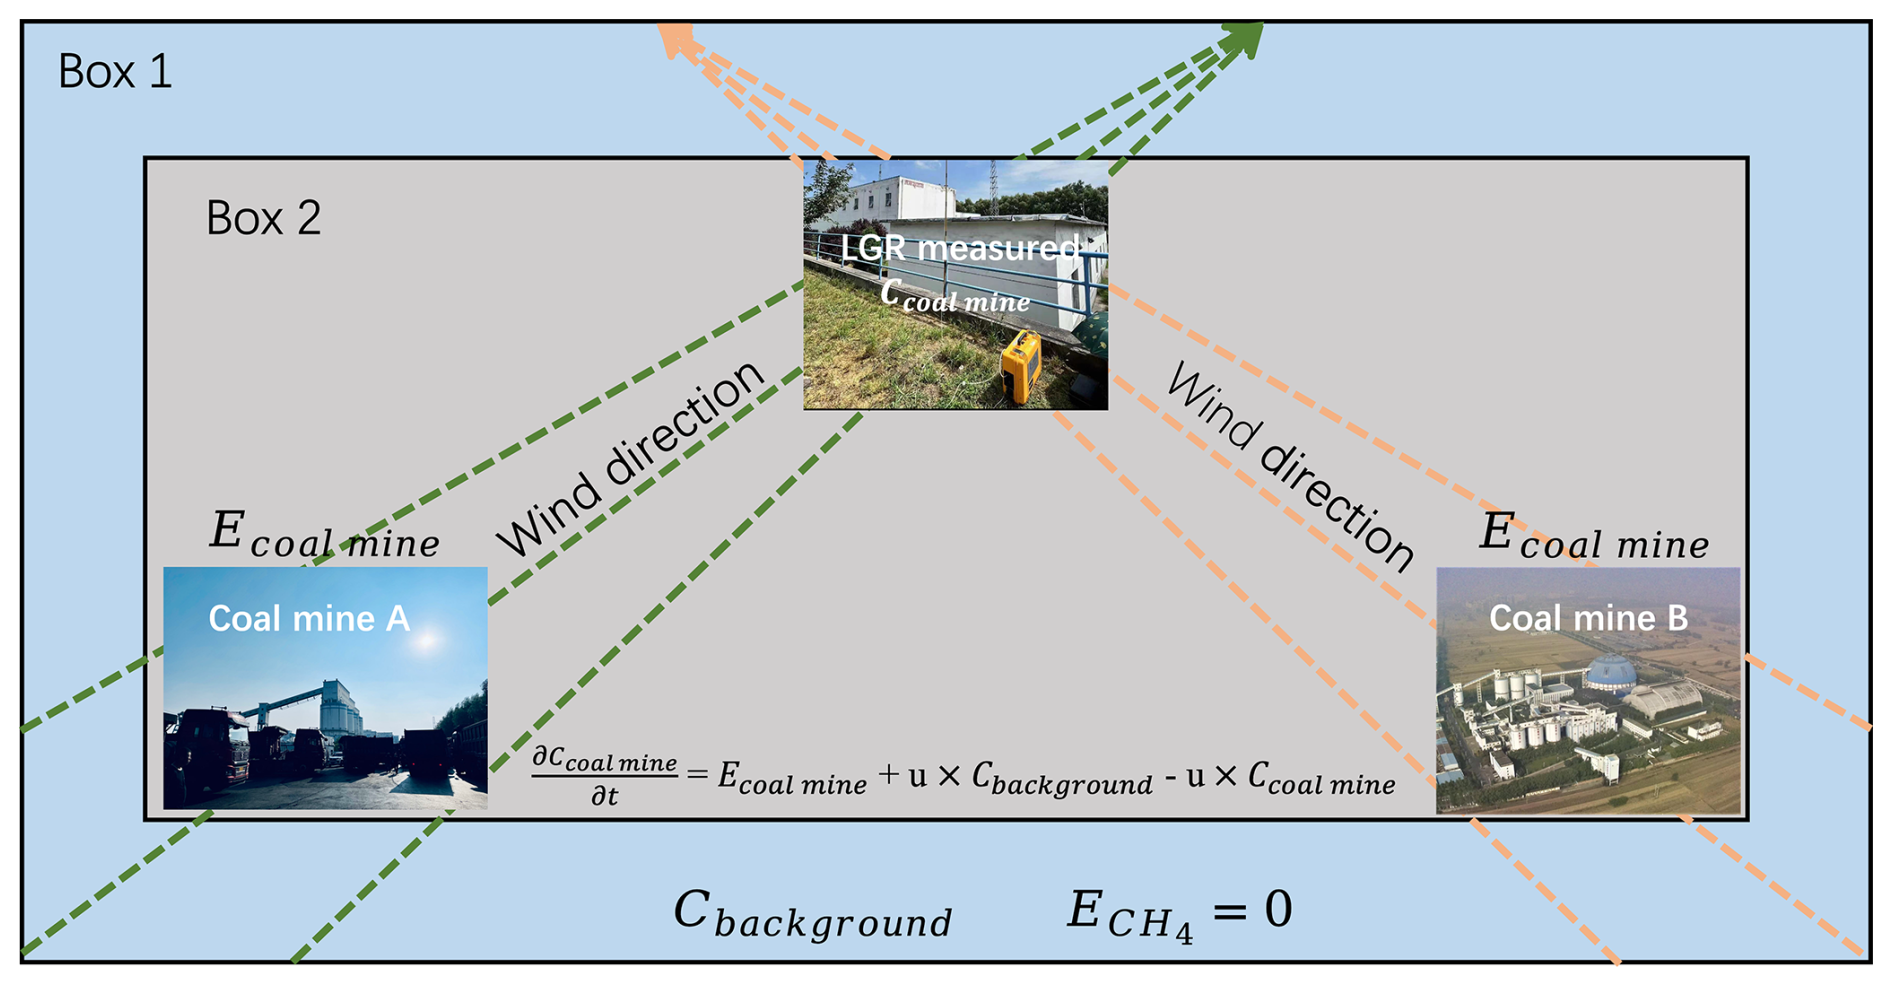
A two-box mass-conserving model (based on Eq. 5) was used to attribute CH4 emissions from the more than one suspected source of CH4 emissions at 5 km west. An overview of the MCM2 and two-box mass-conserving model used in this work is provided in Fig. 7. The changes in CH4 concentrations (Ccoal mine (ppm)) over time t (min) at the observation point are driven by CH4 emissions (Ecoal mine (ppm min−1)) from the upwind coal mine and the CH4 concentration blown from the coal mine by the wind U (m s−1) and the CH4 background concentration (Cbackground (ppm)), as demonstrated in Fig. 7.
All observed CH4 concentration data and estimated CH4 emissions data are used when wind direction is capable of transporting the CH4 from either CM-A or CM-B towards the observation site (Fig. 10), while the remaining data are not used. A discretized version of Eq. (5) is given in Eq. (6) and solved using a first-order finite-difference approach:
where τi and τi+1 are the current and next time step, and the other terms are defined as in Eq. (5).
All possible sets of steady-state CH4 concentrations are computed using all possible combinations of CH4 emissions and observed CH4 concentrations as boundary and initial conditions and running the equation forward to equilibrium.
The probability distribution is analyzed by comparing the modeled CH4 concentrations' probability density function (PDF) with the observed CH4 concentrations' PDF. Differences between the PDFs are clearly associated with the different wind directions, and hence geophysical locations of the CH4 emissions sources can be distinguished.
2.7 Converting emissions into policy-relevant units
In order to compare the emissions with some other studies, the units (ppm min−1) were converted into policy-relevant units (kg h−1), although as outlined below, this conversion leads to a larger uncertainty range. According to the attribution analysis in Sect. 2.6, when the wind direction is located within a 60° arc of coal mine A or coal mine B (Fig. 8), the respective CH4 emissions which successfully passed attribution were assigned to the respective coal mine. Therefore, based on the wind direction, the CH4 emissions of coal mine A reported in this study use all of the data from the north 1 km CH4 station, the CH4 emissions of coal mine B considered all of the data from the west 5 km CH4 station, and the background data came from all of the non-emissions data adopting the following equation (Eq. 7) to convert the units from ppm min−1 to kg h−1:
where is the CH4 emissions with units of kg h−1; ECH4 is the CH4 emissions with units of ppm min−1; ρair is the dry gas density (kg m3) (based on Eq. 8); H is the height of the vertical rise that the emissions undergo within their first minute (m); A is the area (m2) swept over an arc (Fig. 9), which ranges linearly from 60° under slow wind conditions to 30° over very fast wind conditions, based on the wind speed when the direction is found to lead to successful attribution; P is the atmosphere pressure (Pa) over the sampling duration; Mair is the molecular weight of dry air, which is a fixed constant (28.97×10⁻³ kg mol−1); R is the universal gas constant (8.314 J mol−1 k−1); and T is the air temperature (K) over the sampling duration.
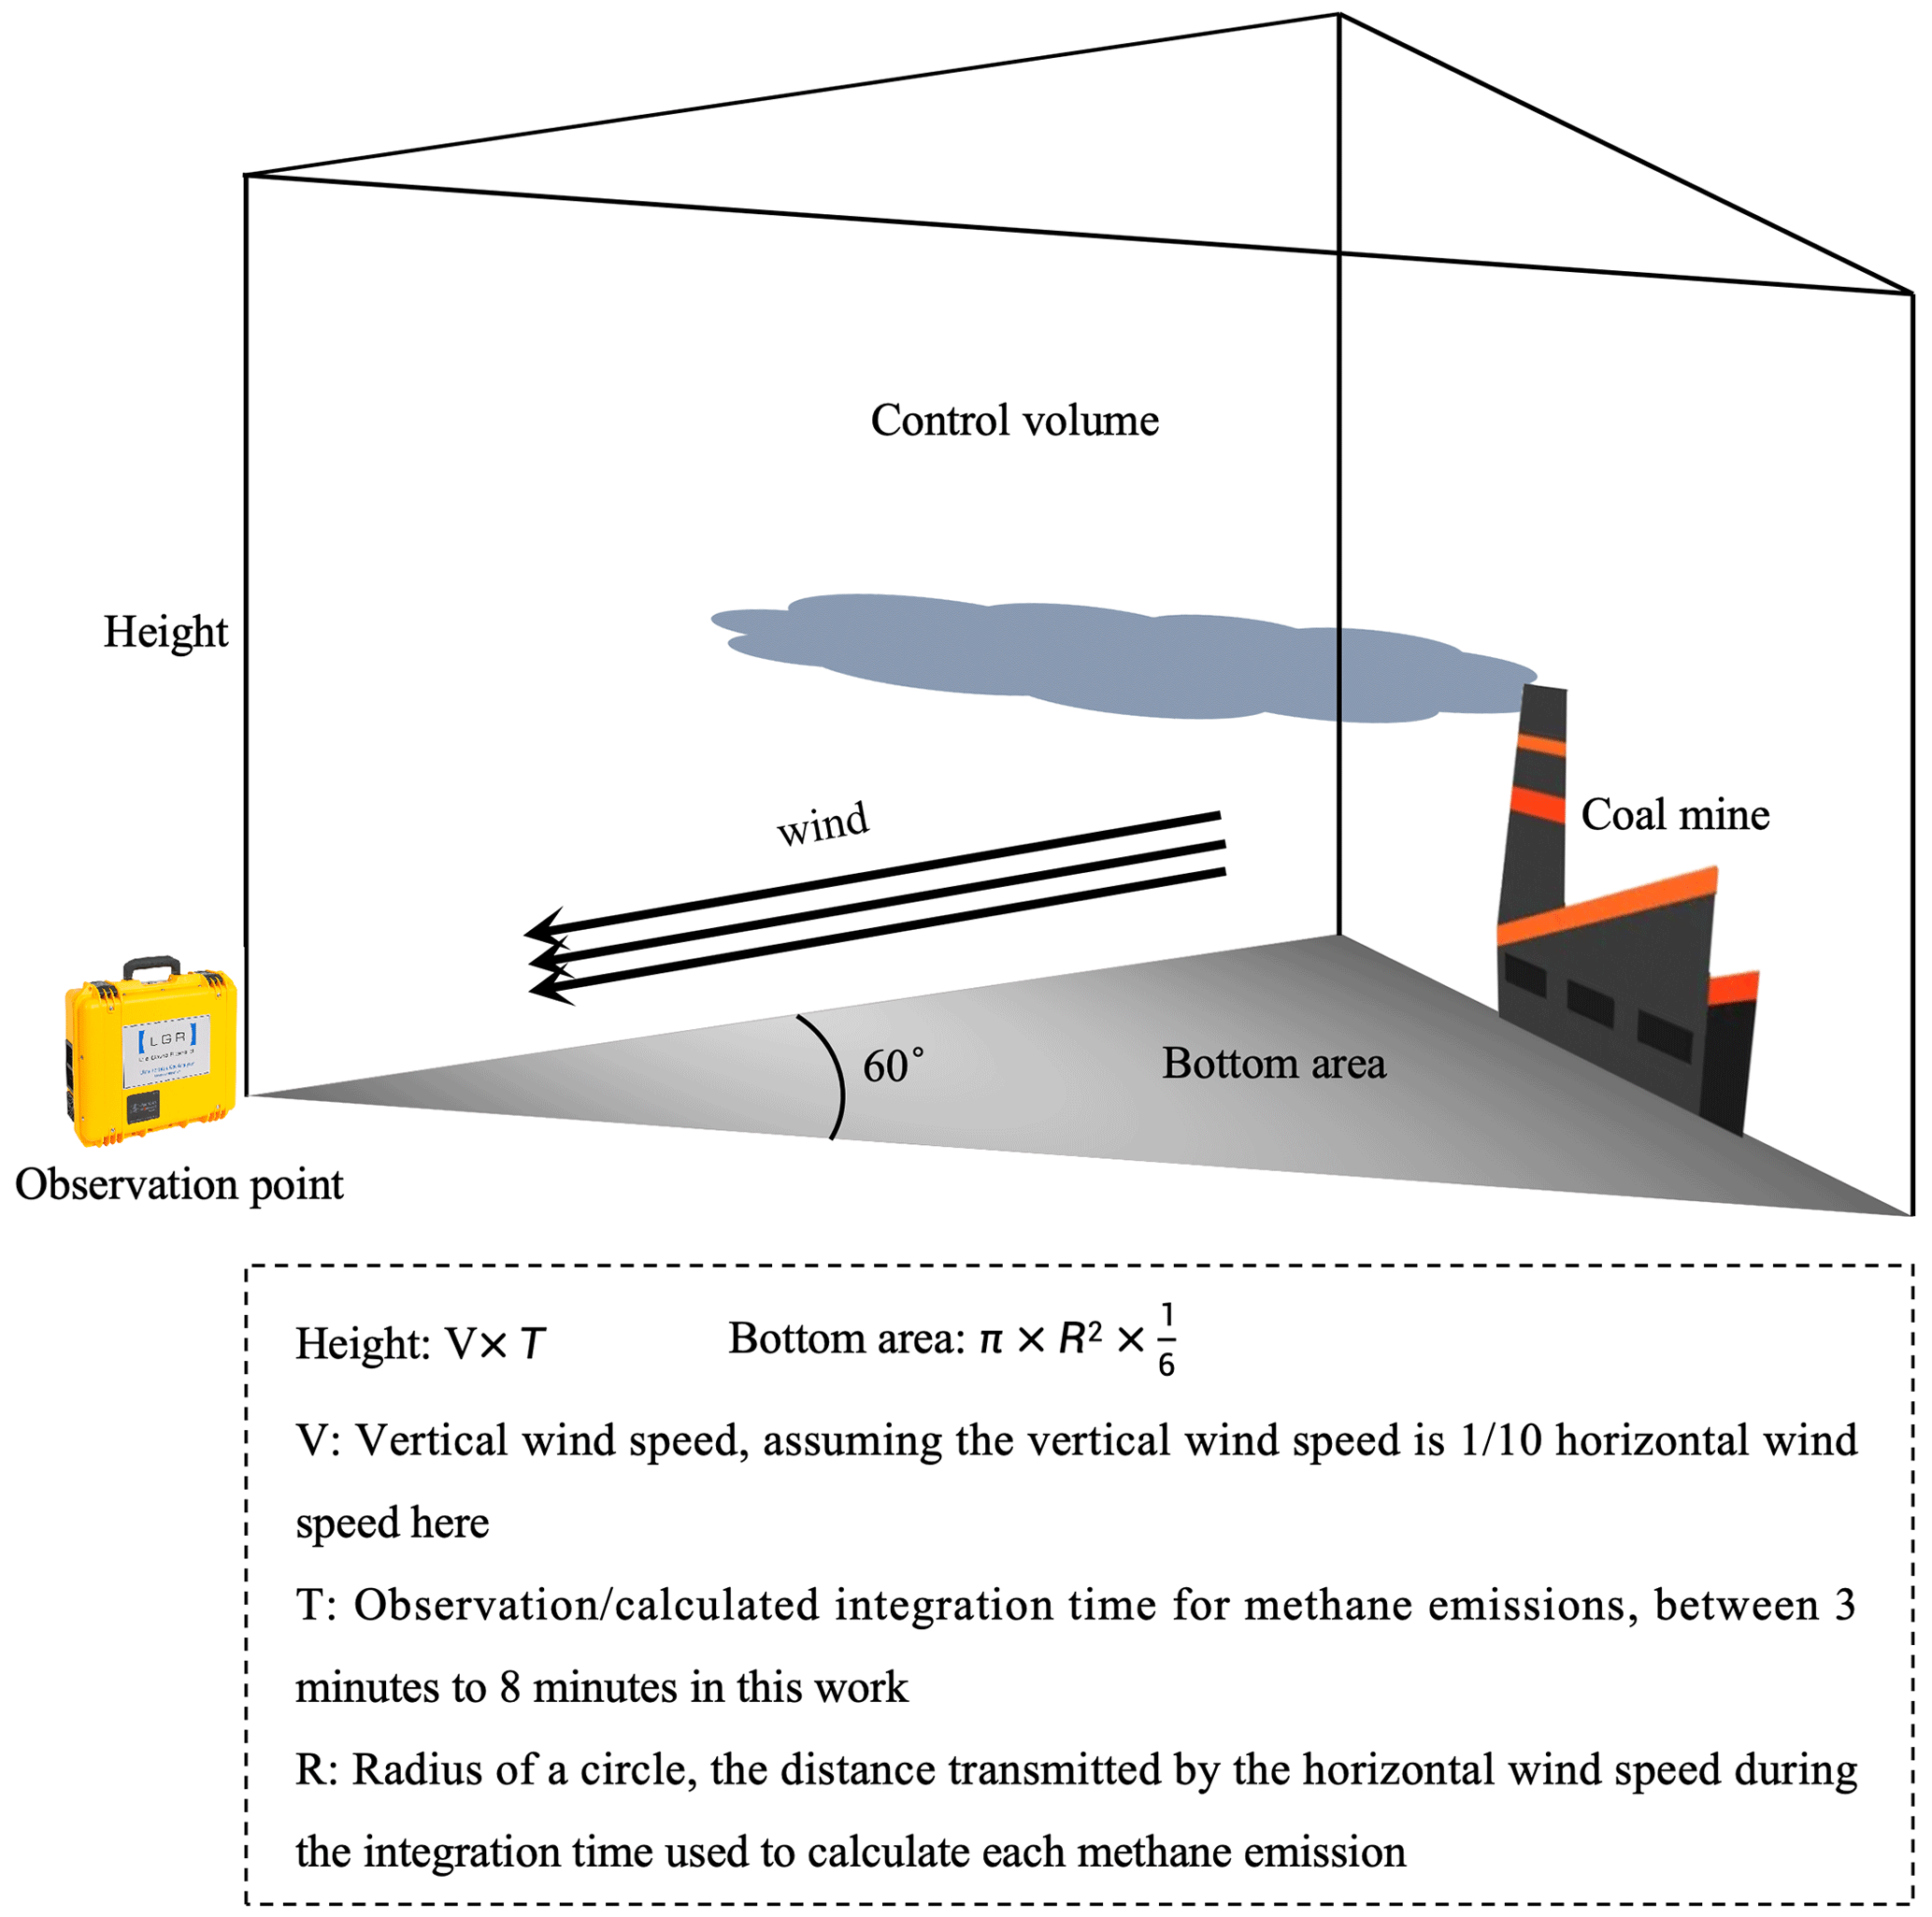
Two different assumptions are made for the vertical extent of the plume rise, since the emissions are computed minute by minute, which is shorter than the adjustment time throughout the entire boundary layer (Vaughn et al., 2018; Zinchenko et al., 2002). The first is to assume it has mixed within the bottom one-fourth of the boundary layer, and the second is that it has mixed based on a steady vertical rise equal to one-tenth of the horizontal wind. In this work, results using both assumptions will be presented.
3.1 Spatial distribution characteristics of CH4 concentration around coal mine
Time series of CH4 concentration, wind speed, and direction at 1, 3, and 5 km north of CM-A are given in Fig. 10. The wind direction predominantly blew from CM-A towards the observation point (wind direction is between 150 and 210°), for about 60 % of the daily observation time. Only 1 d (15 August) was observed at 1 km north with a significant amount of wind from the west (wind direction is between 240 and 300°), accounting for approximately 92.8 % of the observation time on that day. Consistent with CM-A being the major source at 1 km, when the wind blew from the south, the CH4 concentration (3.45 ± 0.79 ppm) both was higher and had a larger variation than when the wind blew from the west (2.40 ± 0.17 ppm) which was similar to background conditions. This is consistent with there being no known significant sources to the west of this observation location, as shown in Fig. 2. Similarly, under wind conditions that were faster than average, from the direction of CM-A (on 21 August the mean wind was 5.70 m s−1 with 14.9 % of observations faster than 7 m s−1), the observed CH4 concentrations were slightly lower, yet similarly variable (3.17 ± 0.82 ppm). All of these findings are consistent with transport dominating the CH4 concentrations at 1 km north and high-frequency wind and CH4 concentration observations being required in tandem to compute the required spatial gradients in the CH4 emissions; otherwise there is no basis to objectively separate the effects of the emitting region (CM-A) from the background.
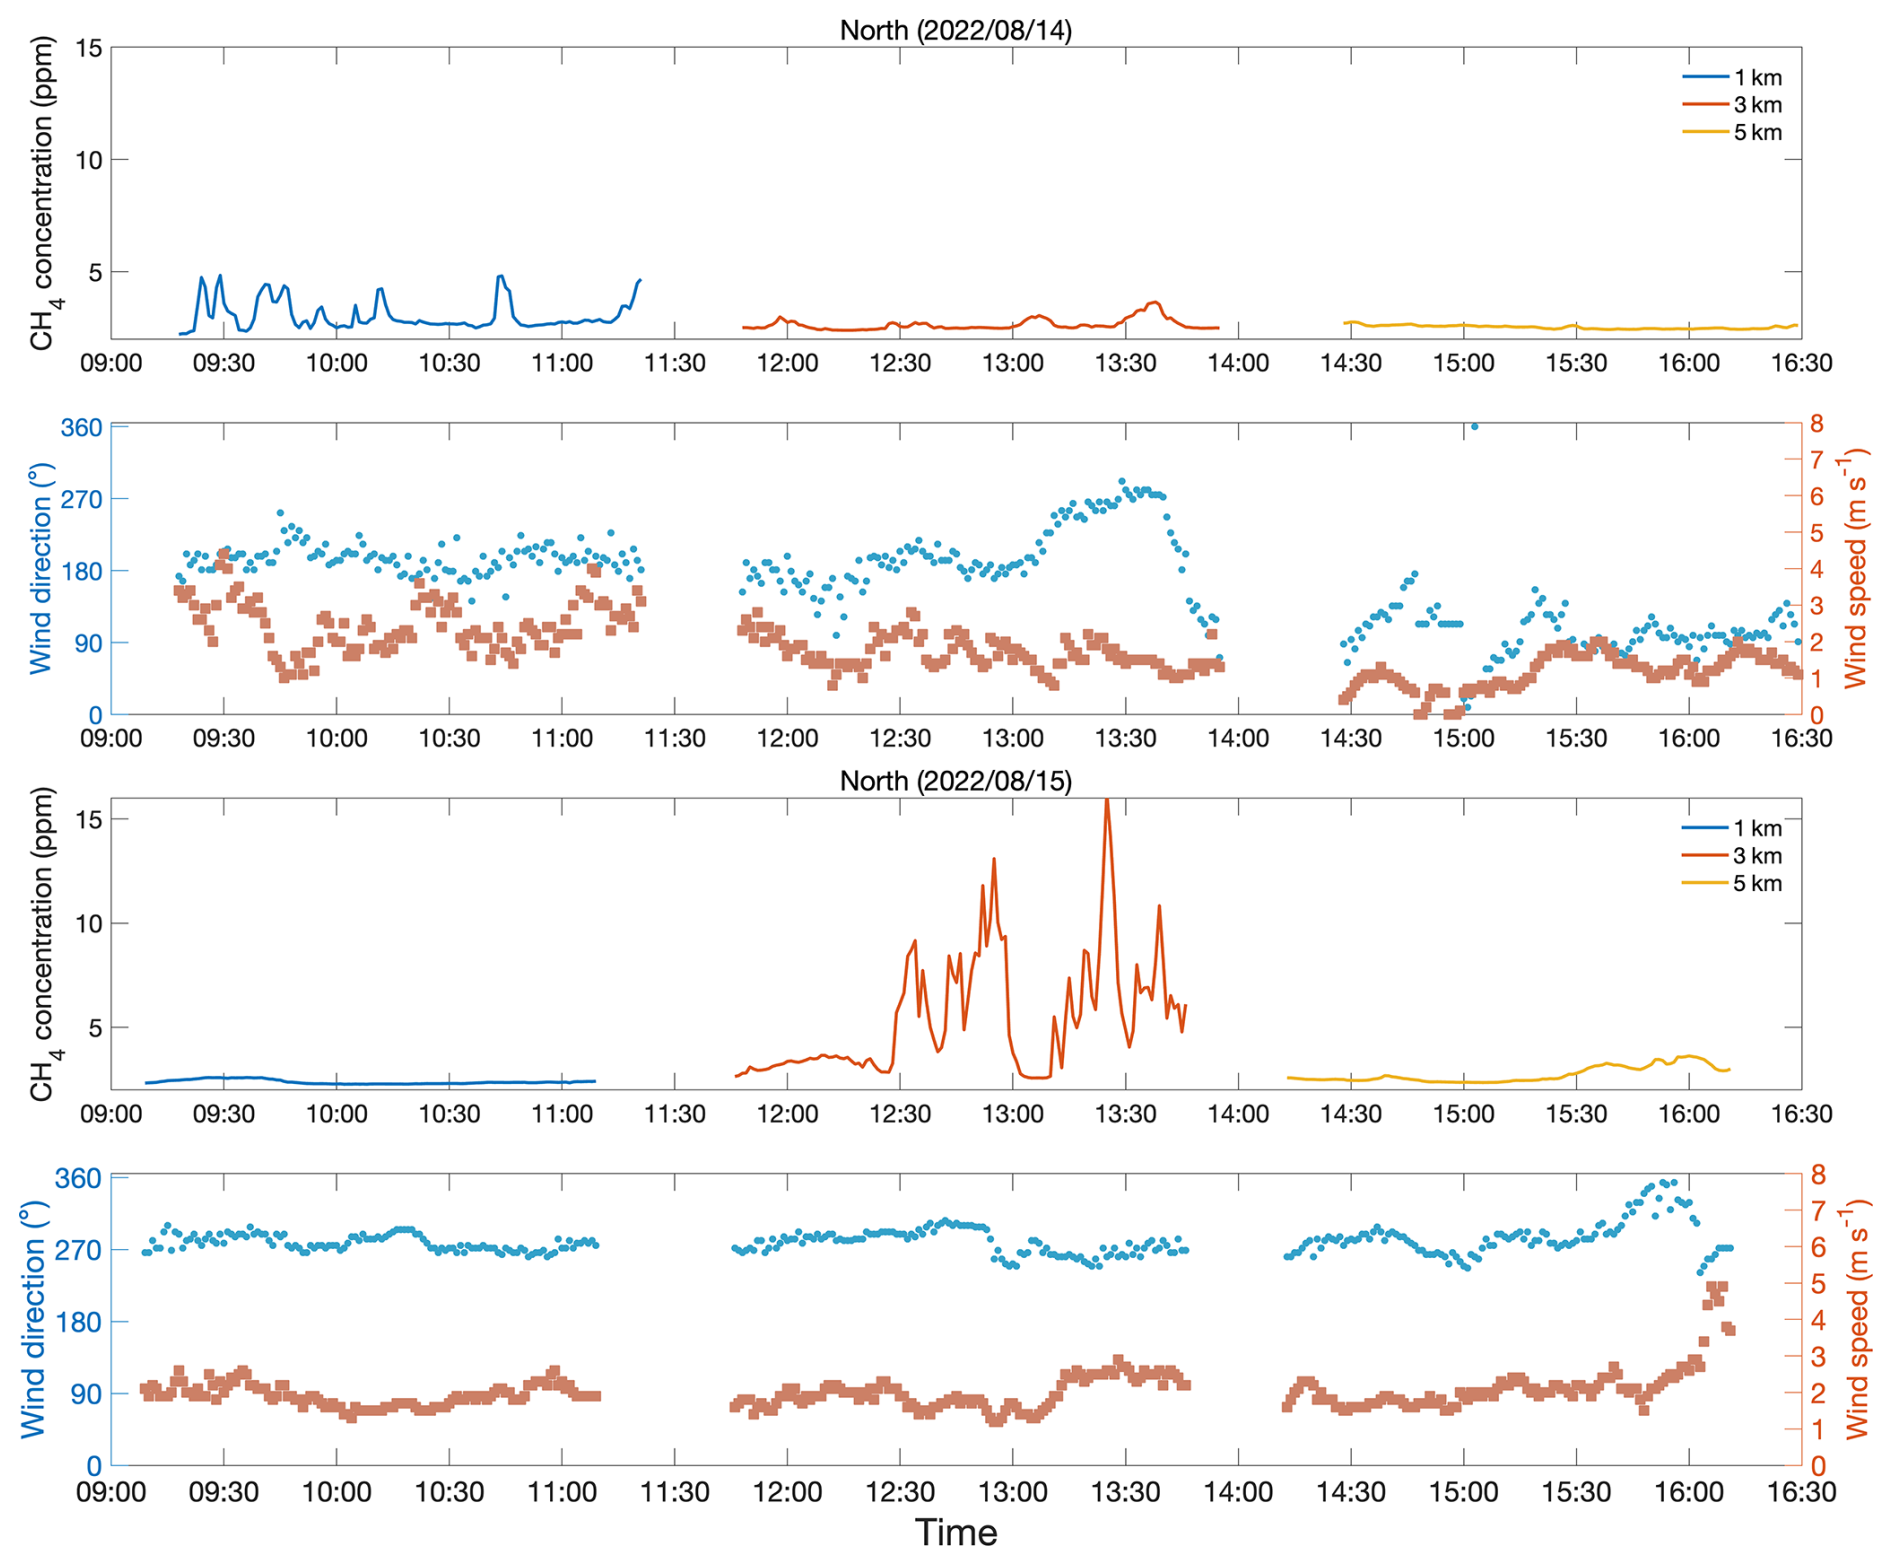
Figure 10Time series of CH4 concentrations (ppm), wind speed (m s−1), and wind direction (°) measured at 1 km (blue line), 3 km (red line), and 5 km (yellow line) located north of CM-A on 2 different days.
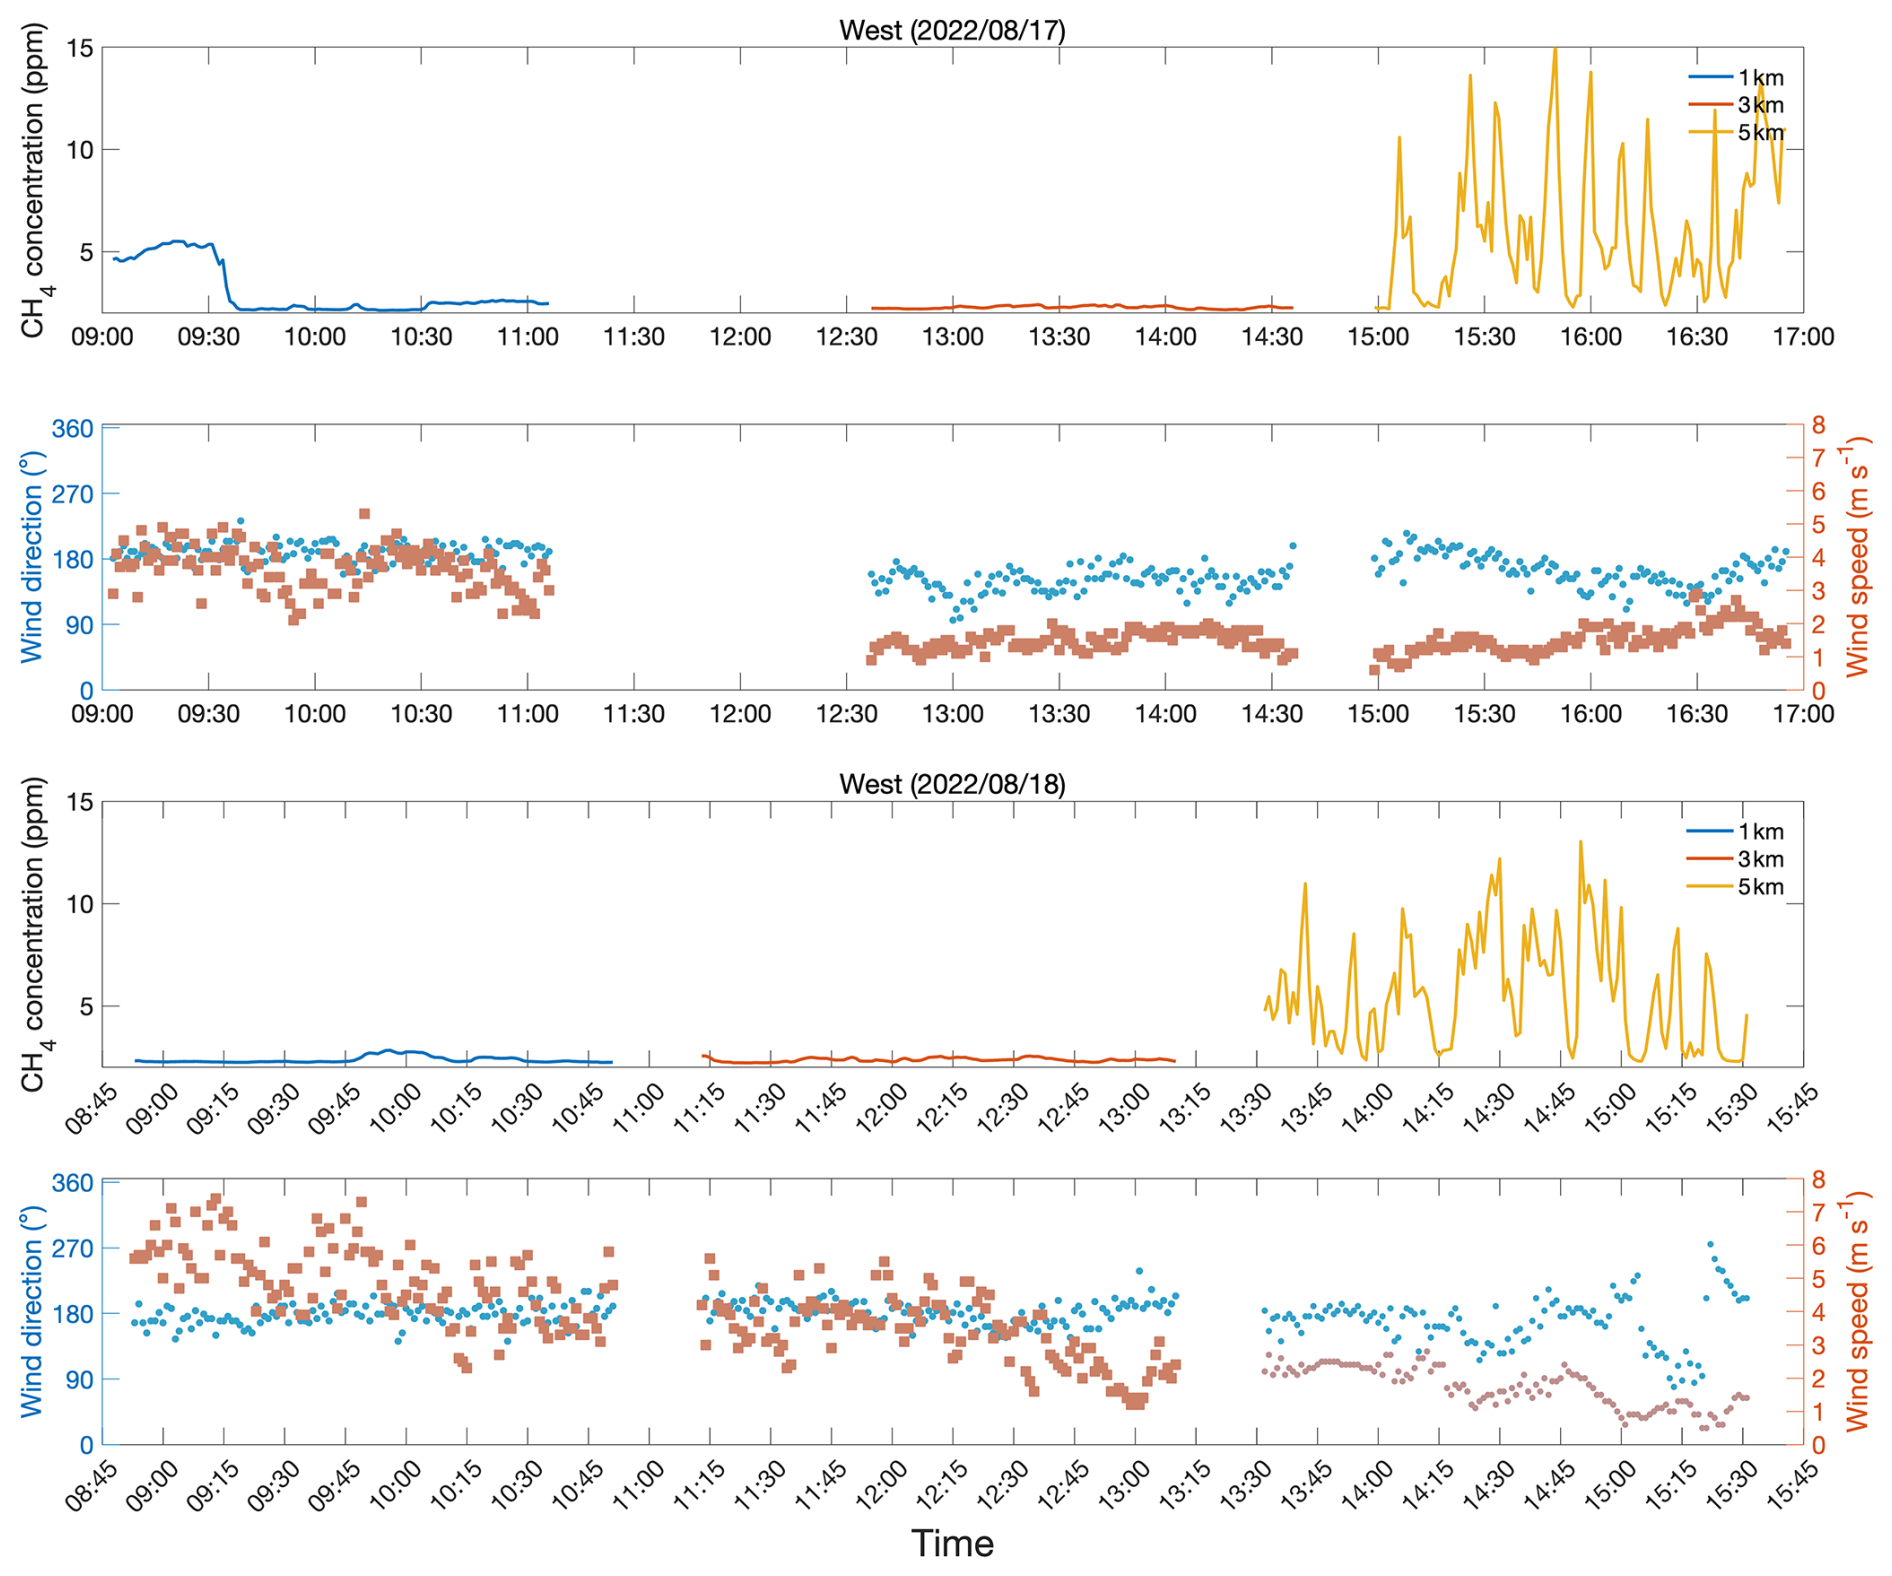
Figure 11Time series of CH4 concentrations (ppm), wind speed (m s−1), and wind direction (°) measured at 1 km (blue line), 3 km (red line), and 5 km (yellow line) located north of CM-A on 2 different days.
A similar set of findings were observed at 3 km north, while 5 km north is generally similar to the CH4 background concentrations. At 3 km north, when the wind was from the south (59.3 % of data), the CH4 concentration was lower and more variable (3.16 ± 1.48 ppm, with 78.7 % of observations below 3.0 ppm) than at 1 km north, consistent with advection from CM-A and a relatively stable atmosphere, with a small contribution from diffusion between the plume and the background. When the wind blew from other directions, the distribution of CH4 concentrations broadened considerably, with a range from the background (2.25 ppm) through to extremely polluted conditions (16.2 ppm). One subset of this was observed on 15 August (observed over a total of 61 min of observations, 6.68 % of the total observations at 3 km north) when the wind was from the west and slow, where the CH4 concentration was 5.44 ± 2.82 ppm, as depicted in Fig. 10. The data on this day aligned with the presence of a major highway west of the observation site, which was observed in person to have heavy traffic consisting of vehicles carrying coal (which could still be outgassing) as well as others powered by compressed natural gas (CNG) (Fig. 2). At 5 km north the overall CH4 concentrations (2.40 ± 0.28 ppm) were generally lower than at 3 km and had much lower variability, consistent with background CH4.
Time series of CH4 concentrations measured at 1, 3, and 5 km west of CM-A and corresponding wind direction and speed are given in Fig. 11. Overall, the main wind direction is from the south 98.4 % of the time at 1 km, 74.5 % of the time at 3 km, and 70.2 % of the time at 5 km, and the wind speed was very high when measuring CH4 at 1 km west, with an average value of 4.28 ± 1.13 m s−1 and a maximum of 7.4 m s−1. This set of findings is consistent with clean upwind sources. Accordingly, at 1 km west, the observed CH4 concentrations were slightly higher than CH4 background concentrations and had similar variability to 1 and 3 km north (2.71 ± 0.94 ppm and 86.5 % of the data below 3 ppm). At 3 km west, CH4 concentrations were observed to be similar to the CH4 background concentrations (2.32 ± 0.09 ppm). The only exception was found at 1 km west between 09:00 and 09:30 LT on 17 August, in which all of the observations of CH4 concentrations were greater than 4 ppm. Since the areas to the west of 1 km west mostly contain farmland, there were no expected strong sources of CH4, as shown in Fig. 2. This indicates that during this special short time, the observed slow increase and rapid fall-off in CH4 concentrations must be due an unidentified sources or a change in the boundary layer or vertical mixing structure.
Following this, it was anticipated that the 5 km west site would exhibit background types of conditions; however the observed data deviate significantly. Wind speed was low (1.63 ± 0.54 m s−1, maximum 3.0 m s−1); CH4 concentrations both were very high and exhibited substantial temporal variability (5.83 ± 2.99 ppm, 66.7 % of CH4 concentration data exceeding 4 ppm, and peak of 15.3 ppm); and 70.2 % of the CH4 concentration observations were from the south, as demonstrated in Fig. 12d, e, and f. From Fig. 1, it can be seen that there is another coal mine (CM-B) located about 1 km away from the 5 km west measurement point, to the southwest, although CM-B has an annual production of about 3×10⁶ t (smaller than CM-A) and is not considered to be high gas (like CM-A) and therefore was not previously considered important. The overlap of high CH4 concentrations with low a priori emissions suggests that formal attribution is essential to quantitatively confirm whether CM-B is the source responsible for both typical conditions at 5 km west, as well as the long-range transport event at 1 km west.
CH4 concentrations and wind observations in all directions except to the west, and except for the small number of special events documents above, exhibit PDFs that show there is a decrease in CH4 concentrations the further the distance from CM-A (Figs. 12 and 13), indicating that CM-A is consistent with the major CH4 emission sources in these regions. These decreases in CH4 concentrations were observed in terms of the median, mean, distribution width, and percentage over 4.0 ppm all decreasing from 1 km north to 3 km north and again from 3 km north to 5 km north.
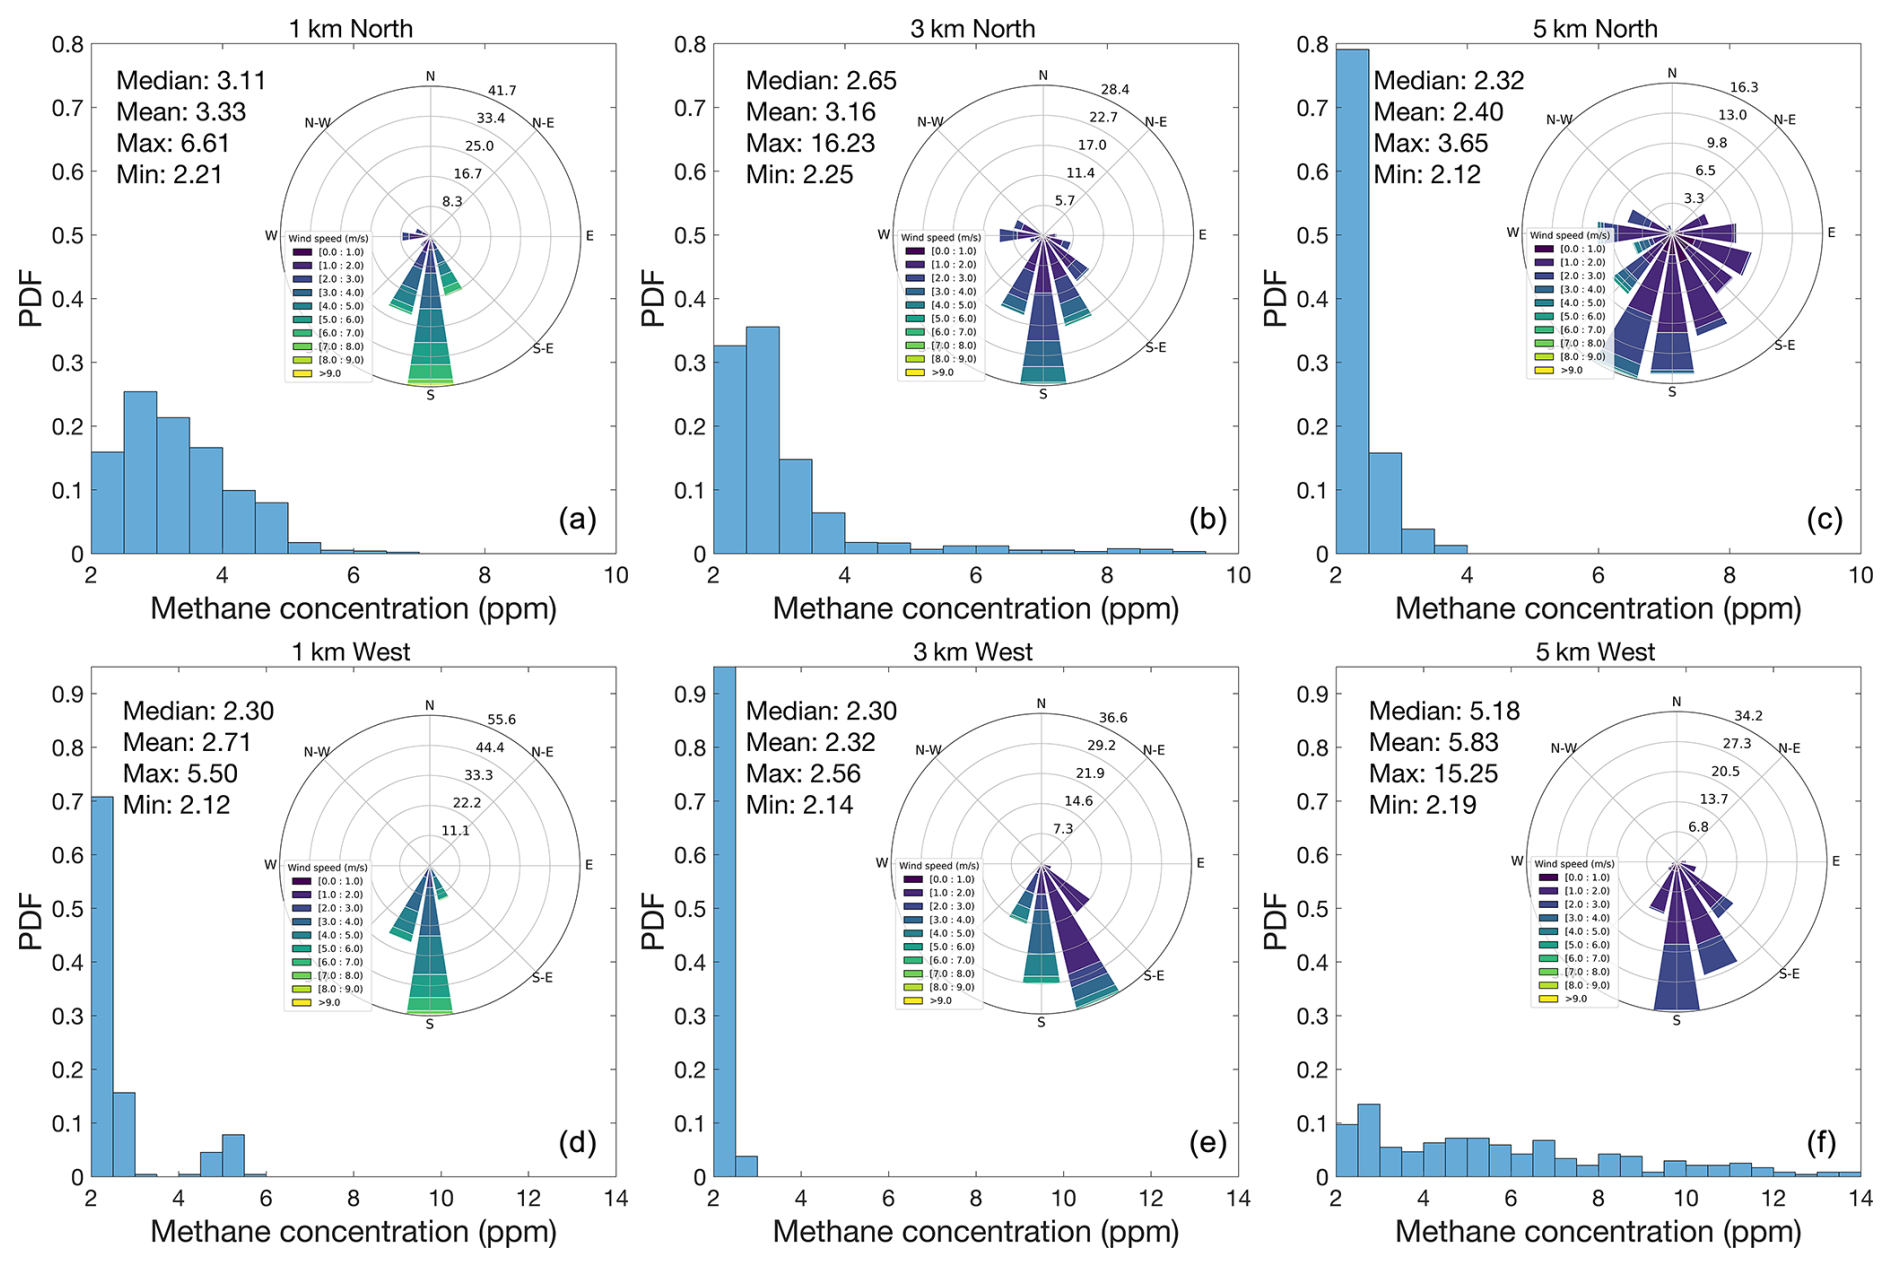
Figure 12Probability density map for CH4 concentrations and wind rose measured at 1 km north (a), 1 km west (d), 3 km north (b), 3 km west (e), 5 km north (c), and 5 km west (f) of CM-A and corresponding wind rose chart.
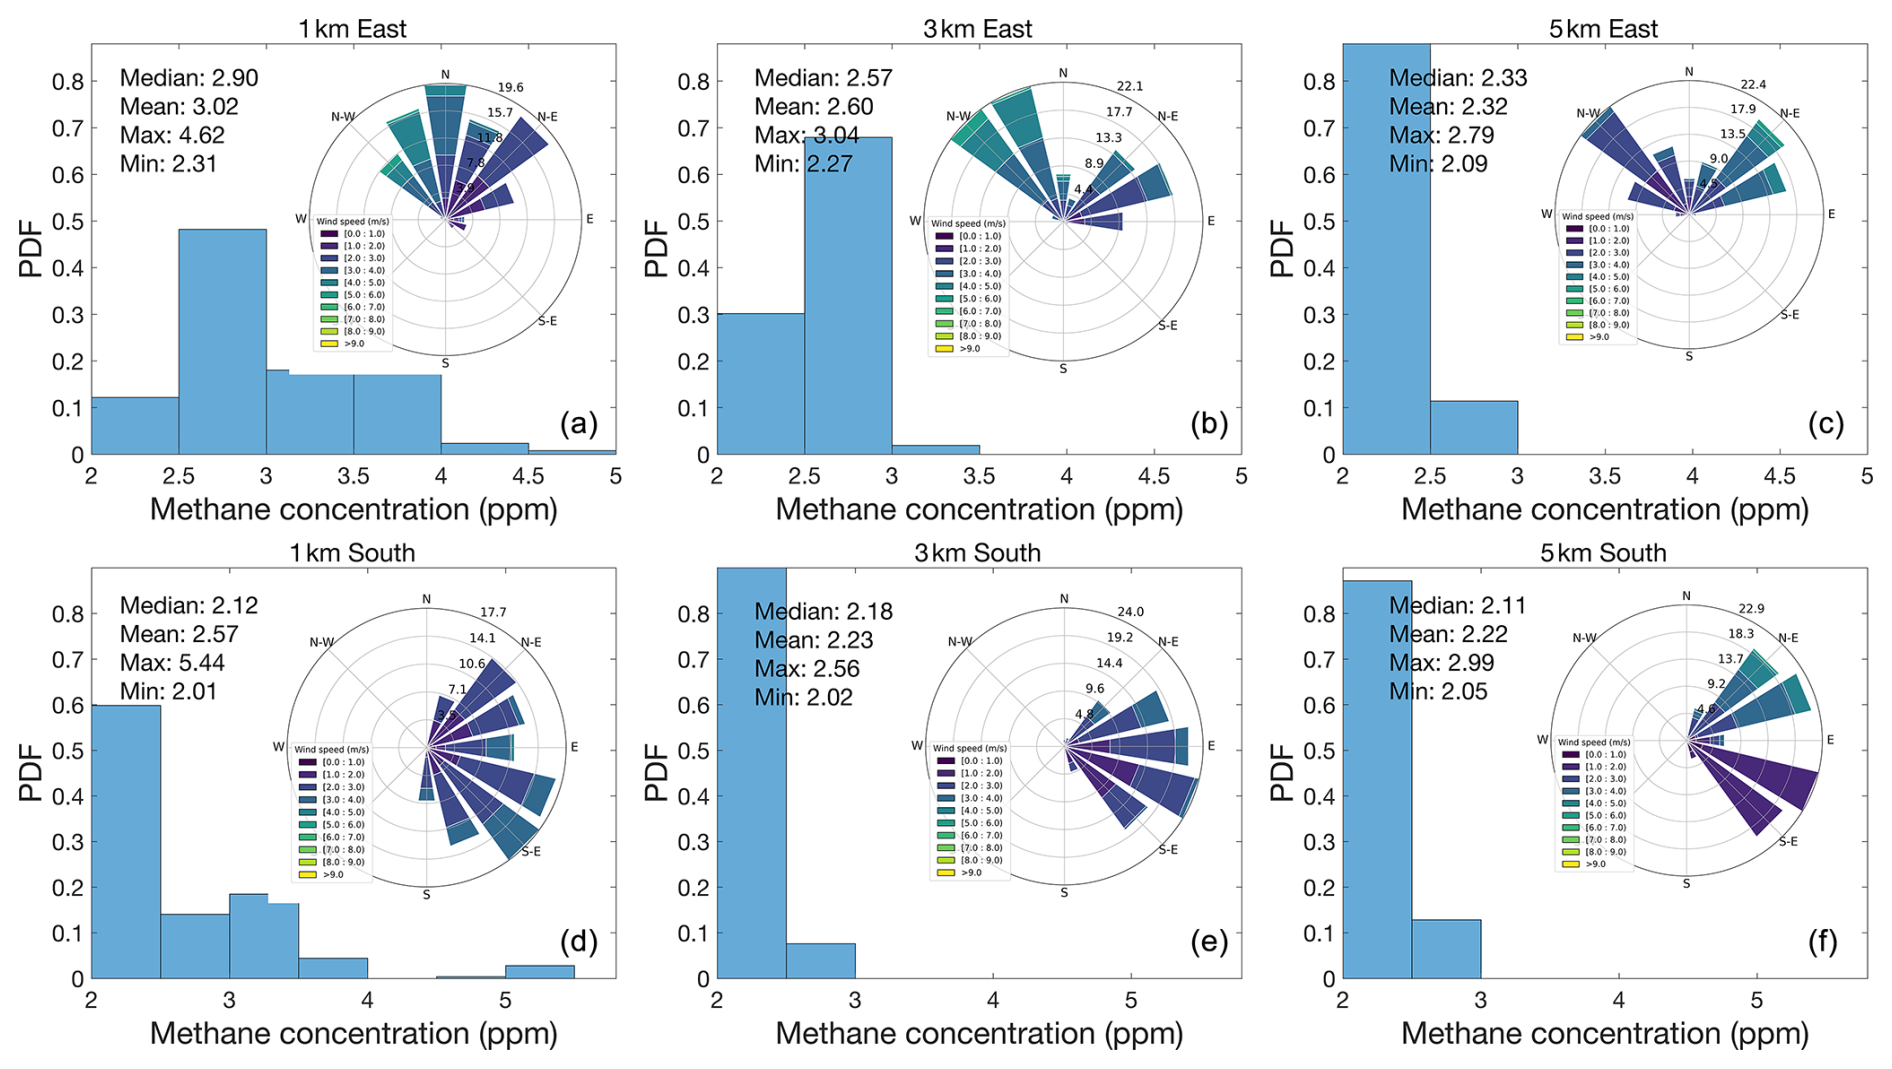
Figure 13Probability density map for CH4 concentrations and wind rose measured at 1 km east (a), 1 km south (d), 3 km east (b), 3 km south (e), 5 km east (c), and 5 km south (f) of CM-A and corresponding wind rose chart.
The observed CH4 concentration gradient as one moves westward from CM-A is inconsistent with the other ordinal directions (Fig. 12d, e, f). While there was a small decrease in the mean and distribution breadth from 1 km west to 3 km west, there was a large increase in the median, mean, distribution width, and percentage over 4.0 ppm from 3 km west to 5 km west. Furthermore, the data at 5 km west were found to be skewed differently than at the other sites, with approximately 70 % of the CH4 concentration data greater than 4.0 ppm. The data clearly indicate that the 5 km west site behaves more like a CH4 emission source region than even the 1 km north site.
3.2 Quantification and emission characteristics of CMM
The CH4 emissions have been estimated at each of the observation points, with 25.7 % of CH4 concentration observations yielding emissions results. The PDFs of the CH4 emissions (Figs. 14 and 15) reveal that the three stations in the north and the 5 km west station all are relatively high and variable, while the remainder are relatively low and non-variable. Among all the CH4 emissions results, the highest median, mean, maximum, and breadth of the distribution are all observed at 5 km west. In addition, the 3 km south location has the lowest CH4 emissions of all points observed (by median), with a respective median, mean, maximum, and percentage greater than 1.0 ppm min−1 of (0.03, 0.26, 0.90 ppm min−1, 0 %) (Fig. 15), and is subsequently considered representative of CH4 background emissions in this work. It is important to note that there is no area within this region that has 0 ppm min−1 emissions and that the minimum CH4 concentration on average is about 2.23 ppm (Fig. 13), both of which are considered very high or polluted compared with most other current studies (Irakulis-Loitxate et al., 2021; Sadavarte et al., 2021).
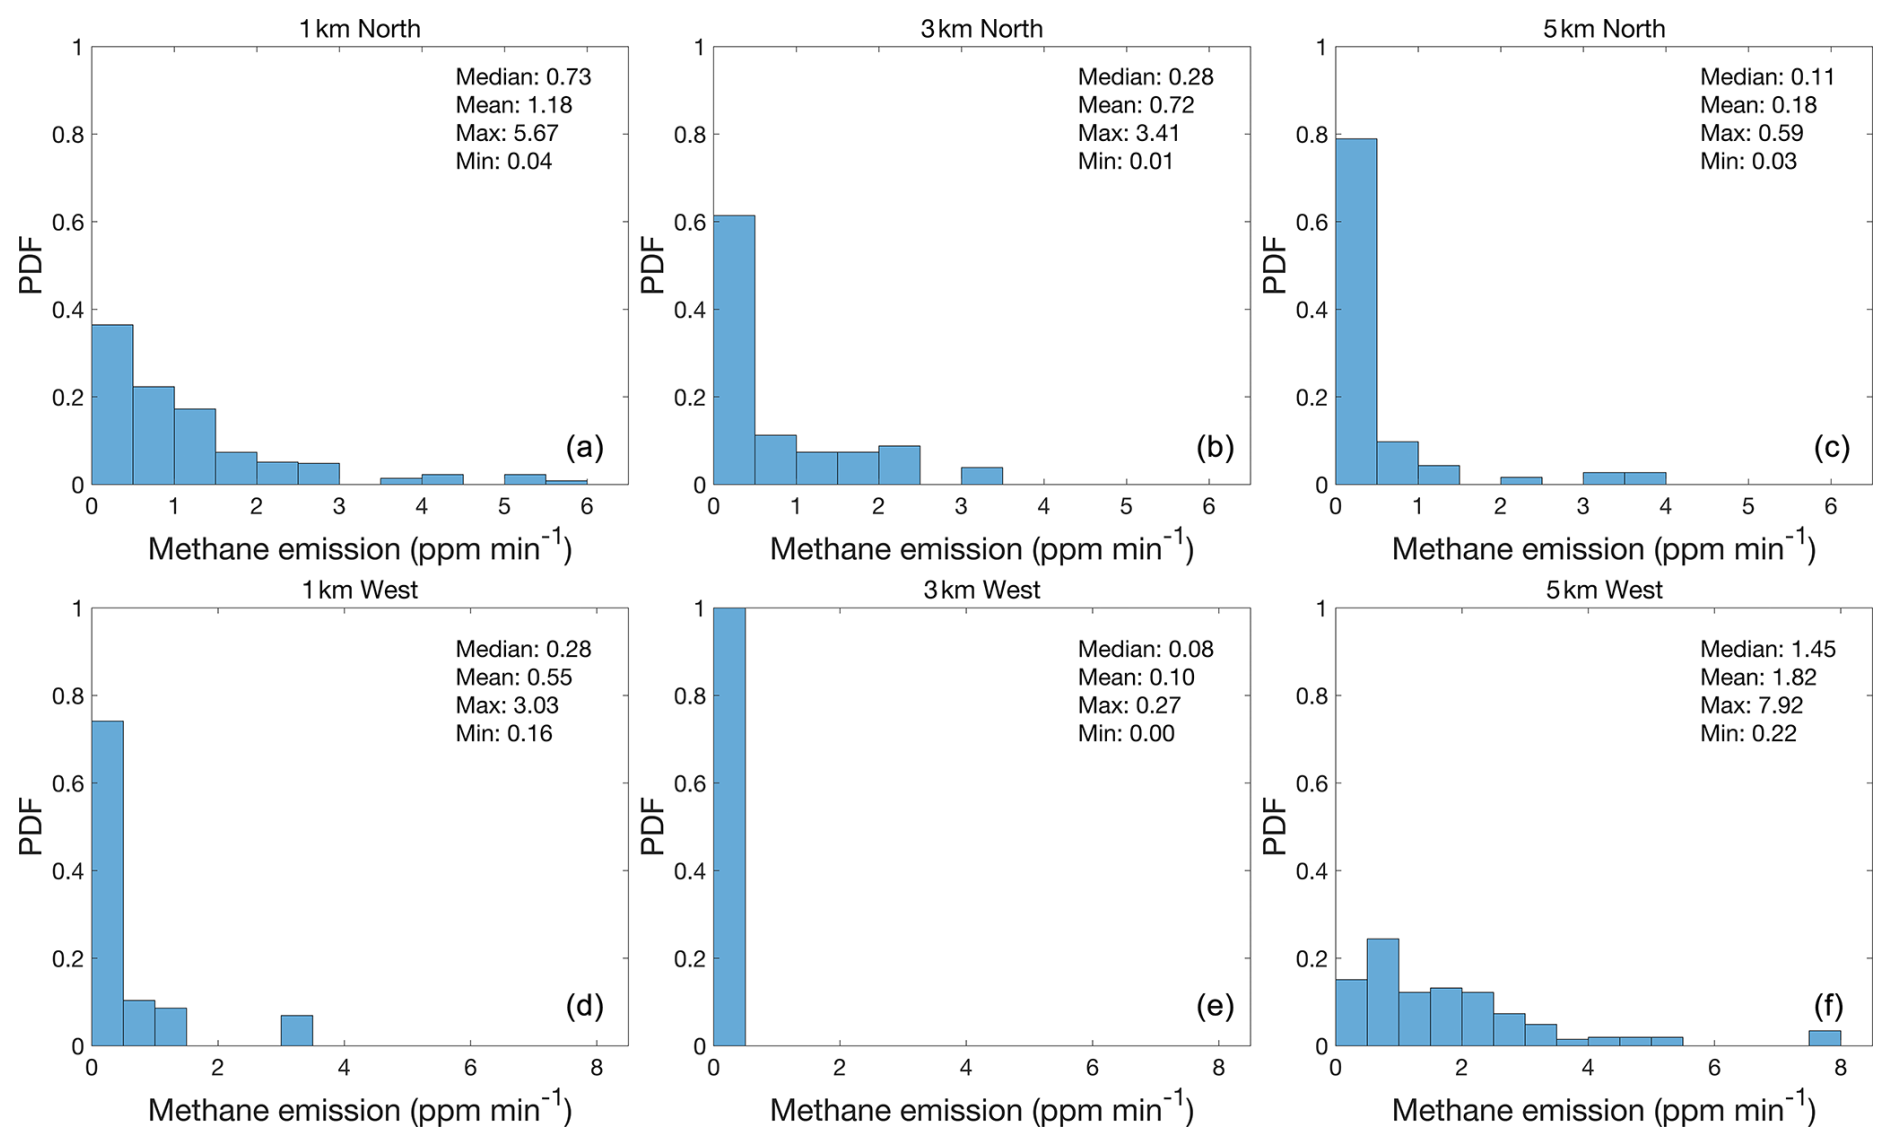
Figure 14Probability density functions (PDFs) of CH4 emissions located at 1 km north (a), 3 km north (b), 5 km north (c), 1 km west (d), 3 km west (e), and 5 km west (f) of CM-A, including median, mean, maximum, and minimum statistics.
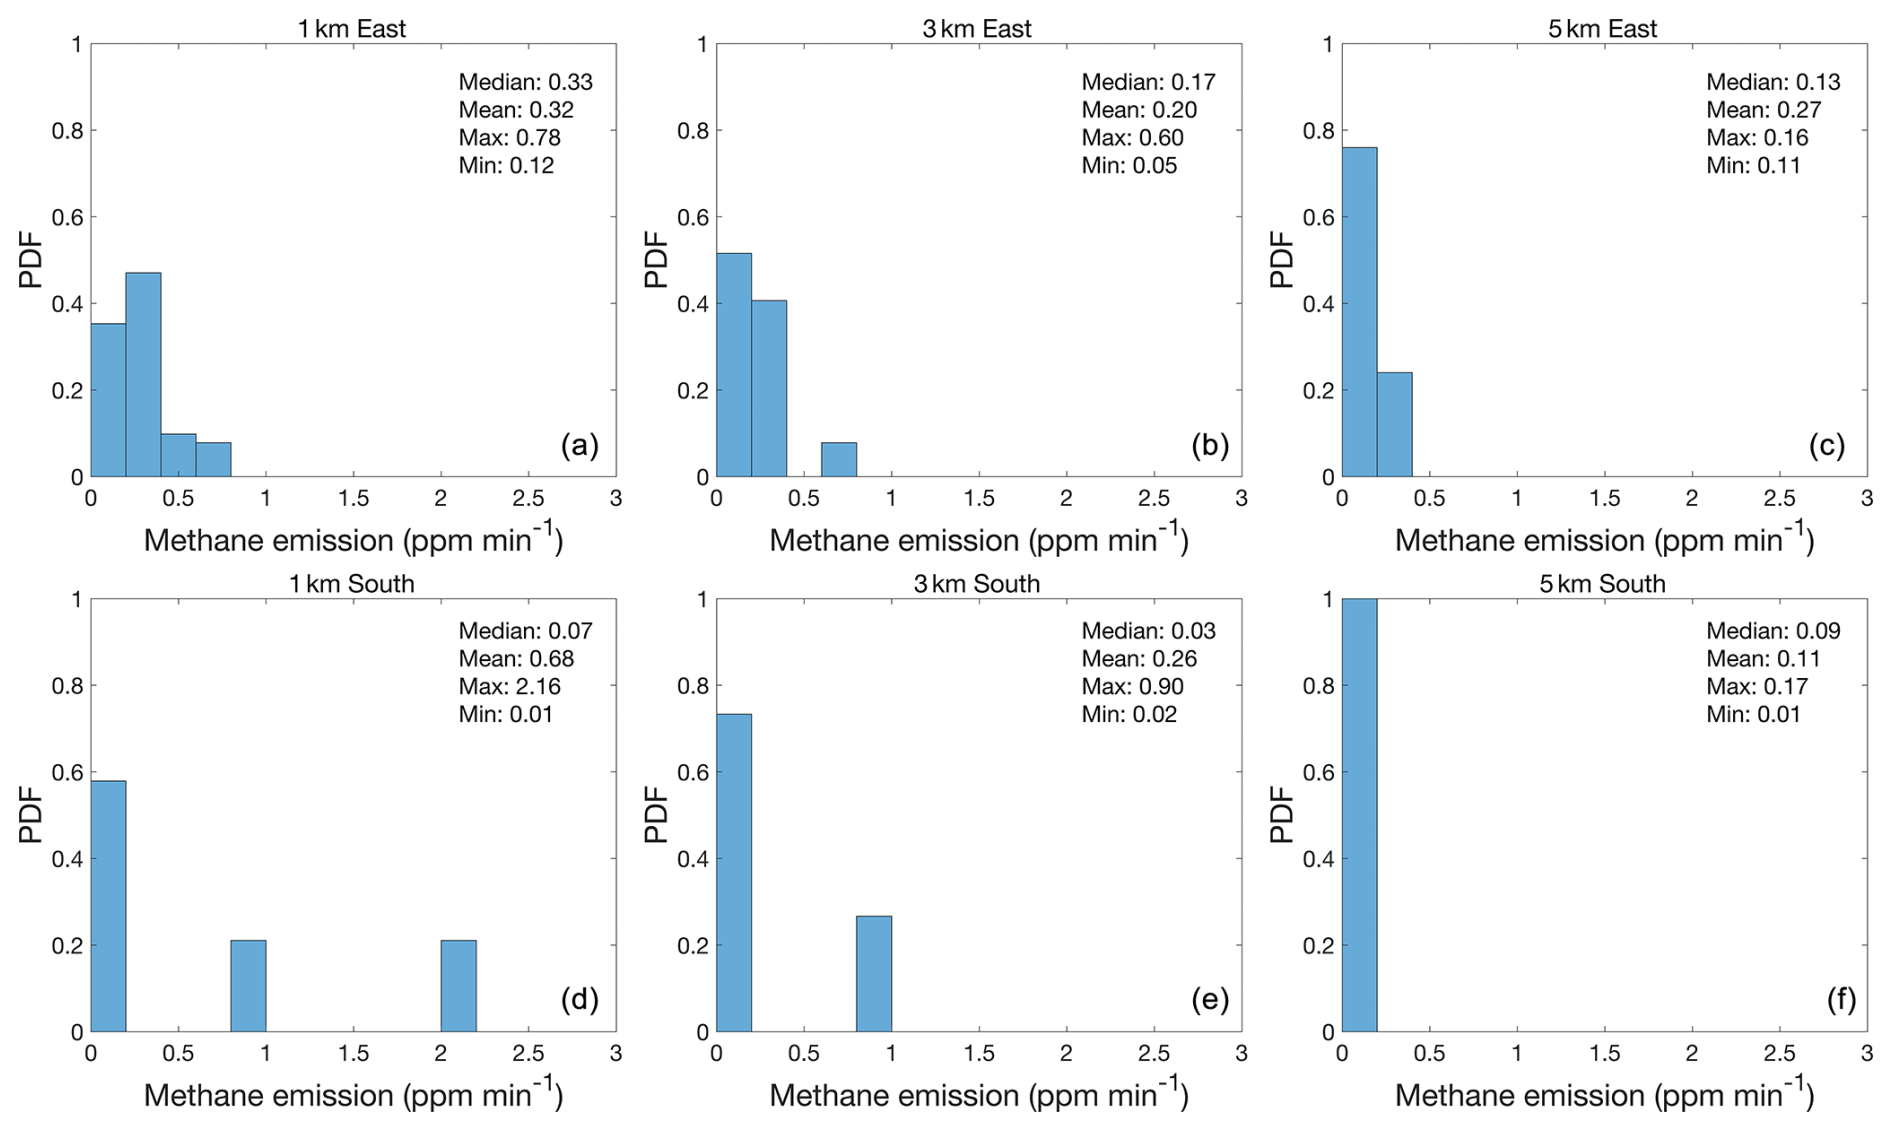
Figure 15Probability density functions (PDFs) of CH4 emissions located at 1 km east (a), 3 km east (b), 5 km east (c), 1 km south (d), 3 km south (e), and 5 km south (f) of CM-A, including median, mean, maximum, and minimum statistics.
The spatial distribution characteristics of the CH4 emissions is similar to that of the CH4 concentration observations (Fig. 14). First, there is a decrease as observation points move northward along the axis away from CM-A, with the median, mean, maximum, and percentage of emissions greater than 1.0 ppm min−1 at 1 km north (0.73, 1.18, and 5.67 ppm min−1 and 42 %) all larger than at 3 km north (0.28, 0.72, and 3.41 ppm min−1 and 29 %). The CH4 emissions values at 3 km north are also larger than those at 5 km north, which, respectively, are 0.11, 0.18, and 0.59 ppm min−1 and 0 %. The subset of CH4 emissions under low wind speed conditions exhibited a larger decline from 1 to 3 km and from 3 to 5 km. The observations are further consistent with transport from a single dominant source located at CM-A being the primary driving factor and diffusion from other industrial sources in Changzhi city center being a secondary factor. Consistent with there being few to no sources impacting the 1 km west and 3 km west sites, except for considerably less transport from CM-A, the CH4 emissions PDFs at these sites (Fig. 14) demonstrate low CH4 emissions and low variability, with the respective median, mean, maximum, and percentage of CH4 emissions greater than 1.0 ppm min−1 at 1 km west being 0.28, 0.55, and 3.03 ppm min−1 and 16 % and at 3 km west being even lower (0.08, 0.10, and 0.27 ppm min−1 and 0 %). However, the CH4 emissions values at 5 km west were the highest and most variable of all results in this work, with the respective statistics being 1.45, 1.82, and 7.92 ppm min−1 and 60 %. Furthermore, the skewness of the distribution at 5 km west (which has 30 % of the CH4 emissions above 2.0 ppm min−1) is much larger than at 1 km north (which only has 15 % of emissions above 2.0 ppm min−1). Combining these pieces of information, at first look it seems that the site at 5 km west is not related to the CH4 emissions from CM-A or at best is a mixture of CH4 emissions from CM-A and those at another site, herein proposed to be CM-B. The remainder of this study focuses on disentangling and attributing contributions from CM-A and CM-B at 5 km west, with the observations at the remaining sites ruled out in terms of having a contribution from CM-B.
3.3 Attribution of CH4 emissions
This work applied the two-box model at the 5 km west site and quantified the contribution of both CM-A and CM-B CH4 emissions to the observed CH4 concentration distributions as given in Fig. 16. First, the results of the two-box model produce CH4 concentration PDFs which overlap with the overall observed CH4 concentration PDF, indicating that the results are reasonable. Second, space of the CH4 emissions from the two different two coal mines does not overlap and covers two independent portions of the observed CH4 concentrations PDF. Specifically, the 30 %, 50 %, and 70 % values of CH4 concentrations observed at 5 km west are 3.68, 5.18, and 6.86 ppm, respectively. The CH4 emissions from CM-A yield a CH4 concentration of less than 4 ppm most of the time, with a minimum of 30 %, 50 %, and 70 % and a maximum concentration of 2.96, 3.15, 3.31, and 4.60 ppm, while the CH4 emissions from CM-B yield a CH4 concentration more than 5 ppm most of the time, with a minimum of 30 %, 50 %, and 70 % and a maximum concentration of 4.76, 5.20, 5.68, and 6.18 ppm.
Overall, the CH4 emissions from CM-B cover the observed CH4 concentration values well from the range of 50 % to 70 %, with a single high value around the 90 % value, while the CH4 emissions from CM-A cover the observed CH4 concentration values well in the range from 10 % to 30 %. One weakness is that the length of observation time is not as comprehensive as at the other observation sites, and therefore it is possible that had more observation time been made, the CH4 contributions from CM-B would have filled more of the space between the 70 % and 90 % levels, and some combination of sources from CM-A and CM-B would have better filled the space between the 30 % and 50 % levels. The results indicate to a high degree of certainty that the effect of CH4 emissions from the two respective coal mines on CH4 concentrations at west 5 km is distinct, with CM-A the source of emissions in the lower range of the CH4 concentration distribution and CM-B the source for emissions in the higher CH4 concentration range, covering values in the middle and upper range. Improvements in modeling, additional observations, consideration of possible contributions from additional missing sources, and consideration of longer-range transport could add further improvement and better explore the intermediate range of observed concentrations.
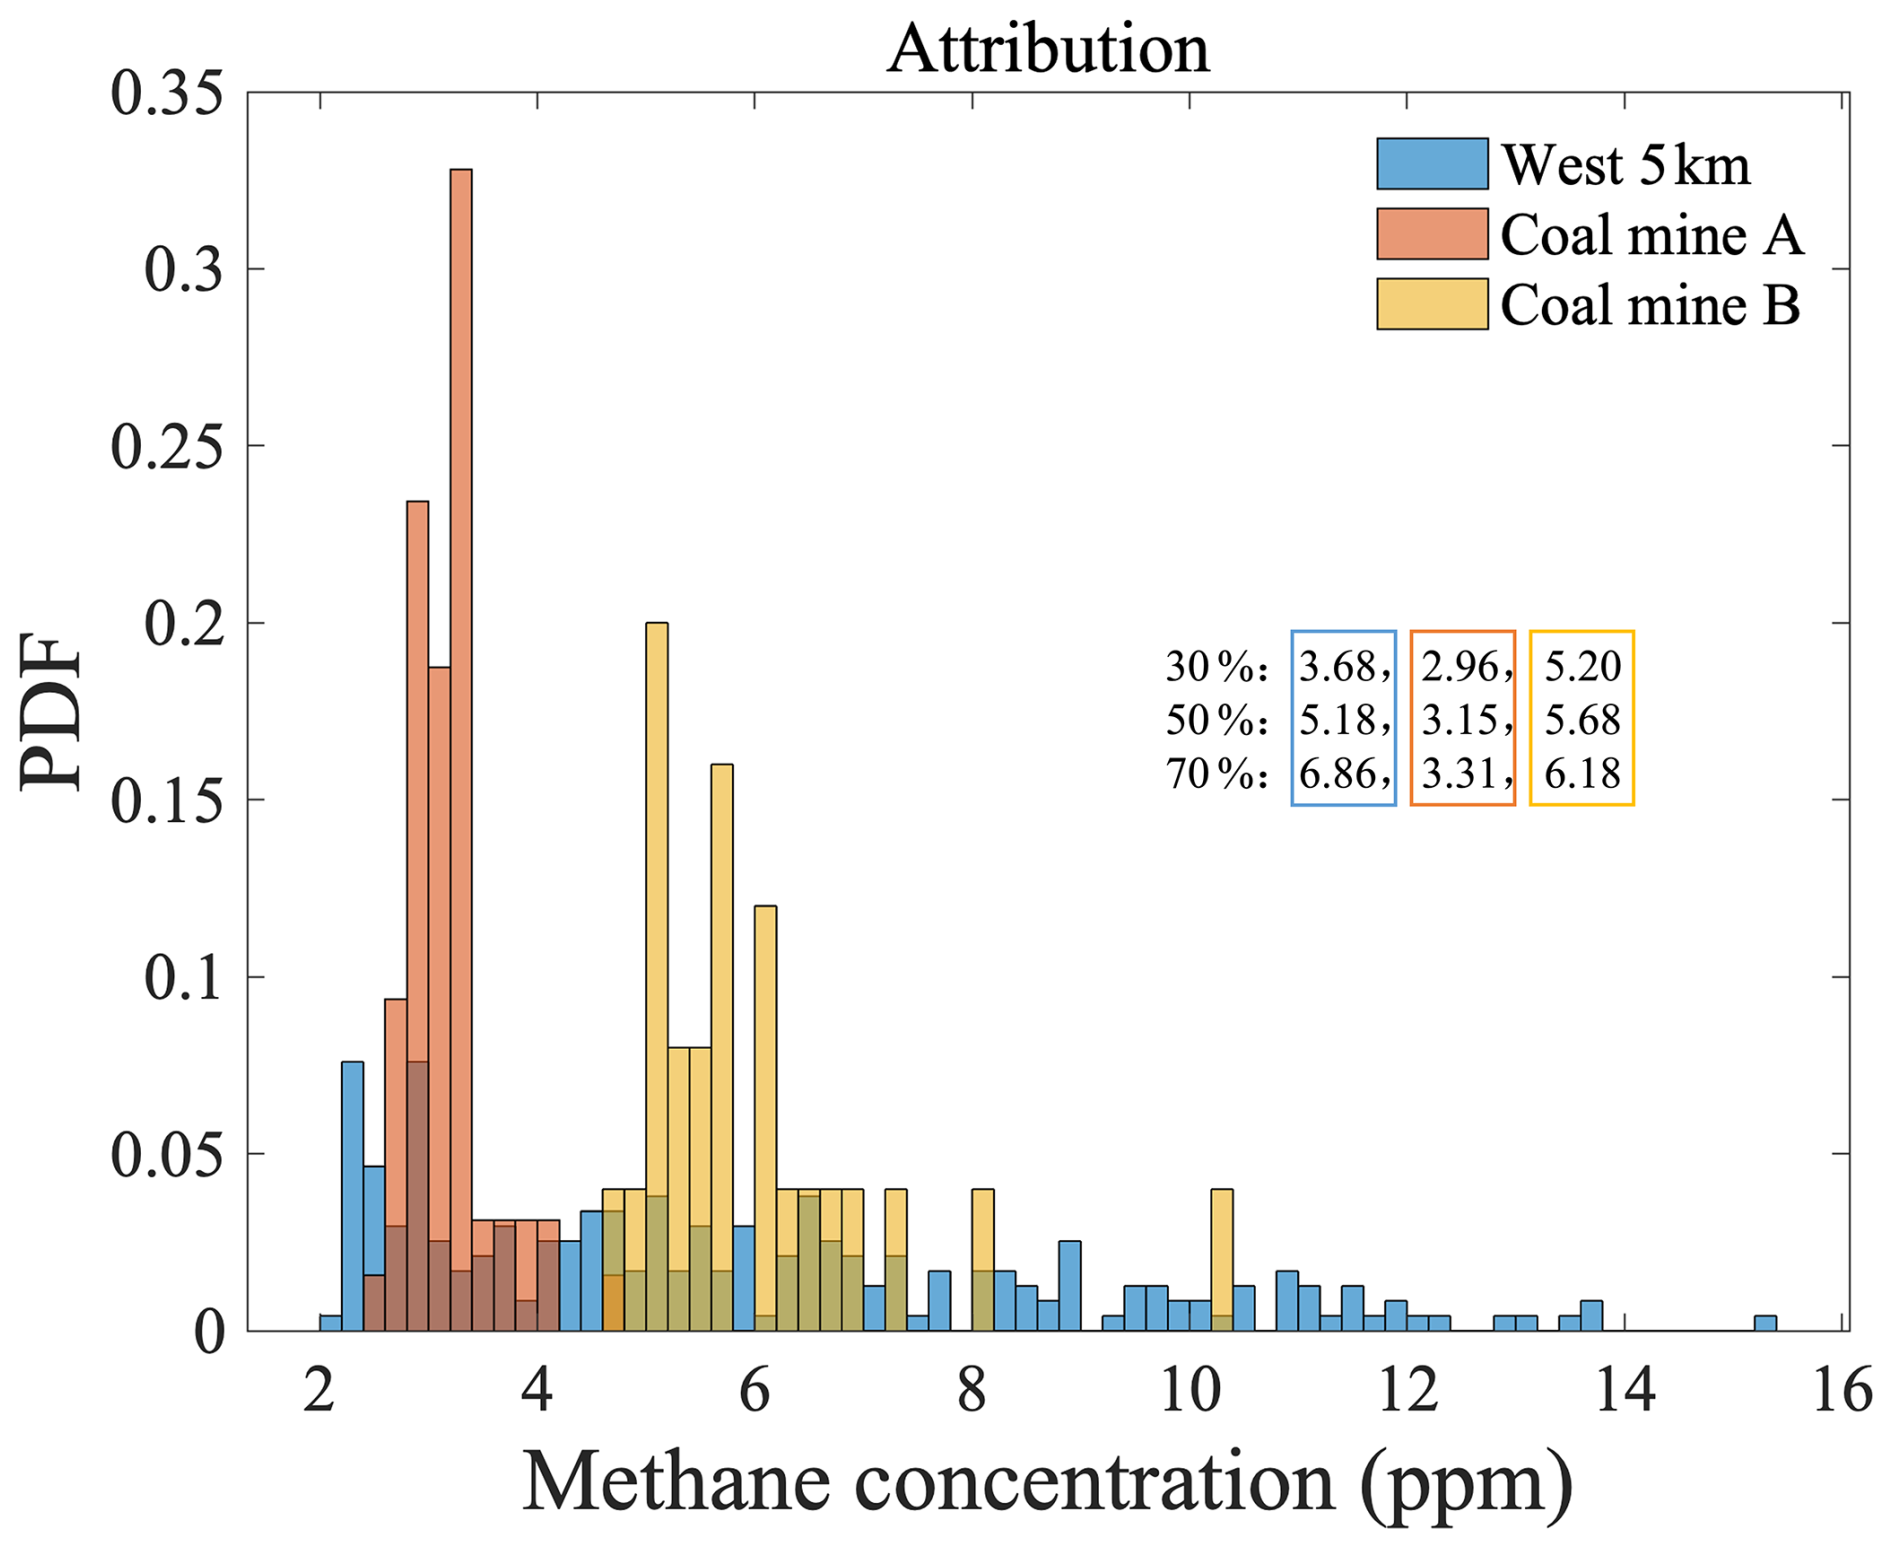
Figure 16Probability density functions (PDFs) of CH4 concentrations (a) observed at the wet 5 km site (blue), and concentrations simulated by the two-box model resulting from emissions attributed to (b) coal mine A (red), and (c) coal mine B (orange). The respective 30th, 50th, and 70th percentiles of the distributions are given in text, outlined by the corresponding color box.
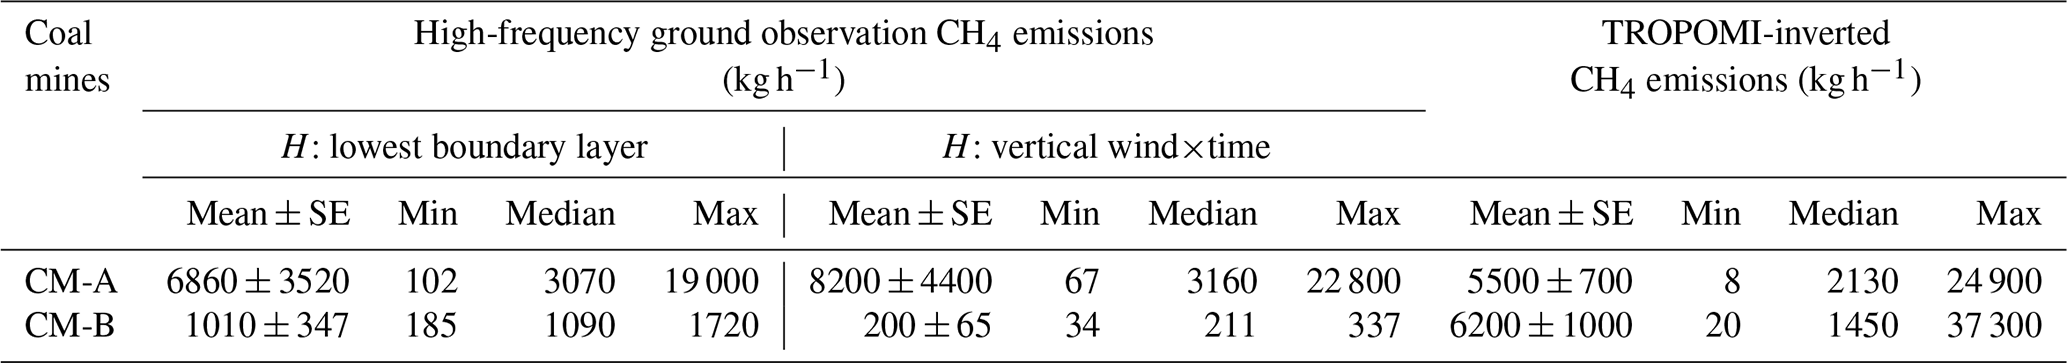
Table 1The CH4 emissions (kg h−1) of CM-A and CM-B using different observation methods and statistical methods, H means the height.
3.4 Policy-relevant emissions
In order to compare the values of CH4 emissions from the Shanxi coal mines computed in Sect. 2.7, the units ppm min−1 are transformed into units of kg h−1 via a conversion factor based on Eqs. (7) and (8). This conversion increases the overall uncertainty, since it involves approximations of the area swept, the boundary layer height, and and other uncertainties. In this study, average CH4 emissions from CM-A and CM-B are 6860 ± 3520 and 1010 ± 347 kg h−1, and the CH4 emissions range from 102 to 19 000 kg h−1 and 185 to 1720 kg h−1, respectively (Table 1). Both mines display a fat-tailed distribution, with respective 25th percentile, median, and 75th percentile values of [1600, 3070, 10 500] kg h−1 and [755, 1086, 1416] kg h−1, respectively. These findings are demonstrated to be higher than CH4 emissions from equivalent oil and gas operations in the USA (Chen et al., 2022), with one site being roughly double and the other similar to and slightly lower than day-to-day emissions inverted over 5 years from TROPOMI (Hu et al., 2024) over the same region. This is consistent with the fact that the results herein target very high frequency and spatially confined emissions, while satellites provide day-to-day values over a larger pixel area, as well as associated significant uncertainties involved in the conversion from parts per million (ppm) to kilograms (kg). Specifically, at CM-A, the minimum value (102 kg h−1) of CH4 emissions is greater than the minimum value (8 kg h−1) of CH4 emissions inverted from TROPOMI, and the maximum value (19.0 t h−1) of CH4 emissions is less than the maximum value (24.9 t h−1) of CH4 emissions from TROPOMI. Similarly, at CM-B, the minimum value (185 kg h−1) of CH4 emissions is greater than the minimum value (20 kg h−1) of CH4 emissions inverted from TROPOMI, and the maximum value (1720 kg h−1) of CH4 emissions is much smaller than the maximum value (37.3 t h−1) of CH4 emissions from TROPOMI. In this study, observations were made within 1 km of the coal mines on a minute-to-minute basis, while TROPOMI observed the XCH4 over a spatial scale (5.5 × 7 km2), and on a day-to-day average basis, the higher temporal resolution of our in situ measurements offers an advantage in capturing short-term variations and extreme values within the study period when compared with TROPOMI's results, due to both the fat-tailed distribution and the strong temporal variation of the observations. For this reason, it is likely that the sampling time (2 d) at CM-B was insufficient to fully capture the fat tail of the CH4 emissions. The estimation of CH4 emissions from coal mine B in this study carries multiple sources of uncertainty. First, the site has a smaller number of data than the other sites and therefore may be less statistically representative. Second, the site generally has a lower production level and is thought to have a lower emission; however, its method of venting is also not known, and there could be other such reasons for it having very variable emissions over time. Third, the TROPOMI emissions themselves are occurring on different grids, which have different properties in terms of surface albedo, aerosols, and other factors, and therefore will be more uncertain at site B than site A, since site A was constrained using ground truth data. Finally, there likely are additional sources in the same upwind regions and direction but further from the observations than site B, which would require additional measurements in the other three ordinal directions from site B to further disentangle this. More accurate CH4 emission would require additional monitoring data over a longer time, as well as in the other three ordinal directions around site B. Furthermore, coal mine B has a relatively small coal production compared to coal mine A. Given that coal mine B is only about 6 km away from coal mine A and shares the same geological environment, its CH4 emissions should theoretically be lower than those from coal mine A but only assuming if the ventilation technology and work schedules were consistent with each other, for which we have no a priori information.
This study presents a high-frequency ground observation campaign and a new analytical top-down emissions estimation approach to quantify the emissions of CH4 from a high gas coal mine region with multiple mines. The base observations are made using a portable greenhouse gas analyzer in connection with meteorological and other optical measurements. Observations have been made over 15 d at a frequency of 1 Hz, at various locations of known distance from an existing high-production coal mine. The high-frequency observations are then used in connection with a mass-conserving modeling platform to estimate the CH4 emissions rate. A mass-conserving two-box model was used for attribution analysis in this study. The results show that the spatial characteristics of CH4 concentration/emissions are consistent with the distance from a well characterized of single coal mine within 5 km distance, and CH4 emissions demonstrate clear first-order effects of both transport and diffusion, with CH4 emission rates of 0.73, 0.28, and 0.15 ppm min−1 at 1, 3, and 5 km downwind, respectively. At 5 km north the overall CH4 concentration (2.40 ± 0.28 ppm) was generally lower than at 3 km and had much lower variability, consistent with background CH4, which demonstrates that the CMM emissions mainly affect the surrounding area within 5 km distance. However, the overlap of two coal mines (CM-A and CM-B) has a far more complex distribution of CH4 emissions intensity, ranging as high as 1.82 ppm min−1, which is much higher than the emissions of single source at any directions. In addition, the background concentration of surface CH4 in the mining areas is very high compared with other studies, with a value always at or above 2.23 ppm. Finally, in order to compare these results with results from other parts of the world, the subset of emissions which successfully underwent attribution were converted into units of kg h−1 using an approximation of the volume swept by the wind and other approximations of the atmosphere. The resulting values were found to be 6860 ± 3520 and 1010 ± 347 kg h−1, respectively, which are higher than CH4 emissions from equivalent oil and gas operations in the USA, and in one case are higher than but in the other case similar to day-to-day emissions inverted from 5 years of TROPOMI over the same region.
This work demonstrates that high-frequency surface observations of CH4, in combination with high-frequency observations of wind, can provide deep insights into emissions by accounting for high-frequency changes in space and time at the same time, which tend to be missing from models which used more idealized approaches (such as average plume shapes and sizes, levels of coal production, and interpreting gradients from a small number of fixed images). A significant source of CH4 emissions from a previously unknown or improperly classified mine may pose a vastly different range of observed concentration as well as computed emissions than expected. The importance of observations at both high frequency and regional spatial coverage is demonstrated, and a set of practical methods that are freely open and can be adopted and modified rapidly are provided. The approach to source attribution used herein can provide insights to policymakers to formulate regional emission control policies and provide a check or an a priori assumption for the new generation of advance satellite-based top-down emissions estimates, while demonstrating that spatial attribution is a critical next step for satellite approximations and CH4 control policies.
All underlying data herein are freely available for review and use (after appropriate citation) at https://doi.org/10.6084/m9.figshare.24464149 (Fan et al., 2025).
The supplement related to this article is available online at https://doi.org/10.5194/acp-25-5837-2025-supplement.
KQ, JBC, and FL designed the research; FL, CY, and YS collected the data; JBC and FL analyzed the data; QT, WH, and QX provided the support for data analysis and drawing; QH and SW gave suggestions for running the two-box model; and FL wrote the manuscript with inputs from JBC, QH, and PT. All authors discussed the results and contributed to the final paper.
The contact author has declared that none of the authors has any competing interests.
Publisher's note: Copernicus Publications remains neutral with regard to jurisdictional claims made in the text, published maps, institutional affiliations, or any other geographical representation in this paper. While Copernicus Publications makes every effort to include appropriate place names, the final responsibility lies with the authors.
We sincerely appreciate all the scientists, engineers, and students who participated in the field campaigns, maintained the measurement instruments, and helped with and collection and processing of the data.
This study was funded by the National Natural Science Foundation of China (grant no. 42407354) and the Fundamental Research Funds for the Central Universities (grant no. 2024QN11081).
This paper was edited by Eduardo Landulfo and reviewed by two anonymous referees.
Allen, D. T.: Methane emissions from natural gas production and use: reconciling bottom-up and top-down measurements, Curr. Opin. Chem., 5, 78–83, https://doi.org/10.1016/j.coche.2014.05.004, 2014.
Bloom, A. A., Bowman, K. W., Lee, M., Turner, A. J., Schroeder, R., Worden, J. R., Weidner, R., McDonald, K. C., and Jacob, D. J.: A global wetland methane emissions and uncertainty dataset for atmospheric chemical transport models (WetCHARTs version 1.0), Geosci. Model Dev., 10, 2141–2156, https://doi.org/10.5194/gmd-10-2141-2017, 2017.
Brandt, A. R., Heath, G. A., Kort, E. A., O'Sullivan, F., Pétron, G., Jordaan, S. M., Tans, P., Wilcox, J., Gopstein, A. M., Arent, D., Wofsy, S., Brown, N. J., Bradley, R., Stucky, G. D., Eardley, D., and Harriss, R.: Methane Leaks from North American Natural Gas Systems, Science, 343, 733–735, https://doi.org/10.1126/science.1247045, 2014.
Brantley, H. L., Thoma, E. D., Squier, W. C., Guven, B. B., and Lyon, D.: Assessment of methane emissions from oil and gas production pads using mobile measurements, Environ. Sci. Technol., 48, 14508–14515, https://doi.org/10.1021/es503070q, 2014.
Brasseur, G. P. and Jacob, D. J.: Model Equations and Numerical Approaches, in: Modeling of atmospheric chemistry, Cambridge University Press Publishing, 84–91, https://doi.org/10.1017/9781316544754.005, 2017.
Bruno, J. H., Jervis, D., Varon, D. J., and Jacob, D. J.: U-Plume: automated algorithm for plume detection and source quantification by satellite point-source imagers, Atmos. Meas. Tech., 17, 2625–2636, https://doi.org/10.5194/amt-17-2625-2024, 2024.
Buchwitz, M., Schneising, O., Reuter, M., Heymann, J., Krautwurst, S., Bovensmann, H., Burrows, J. P., Boesch, H., Parker, R. J., Somkuti, P., Detmers, R. G., Hasekamp, O. P., Aben, I., Butz, A., Frankenberg, C., and Turner, A. J.: Satellite-derived methane hotspot emission estimates using a fast data-driven method, Atmos. Chem. Phys., 17, 5751–5774, https://doi.org/10.5194/acp-17-5751-2017, 2017.
Butz, A., Galli, A., Hasekamp, O., Landgraf, J., Tol, P., and Aben, I.: TROPOMI aboard Sentinel-5 Precursor: Prospective performance of CH4 retrievals for aerosol and cirrus loaded atmospheres, Remote Sens. Environ., 120, 267–276, https://doi.org/10.1016/j.rse.2011.05.030, 2012.
Cao, X.: Policy and regulatory responses to coalmine closure and coal resources consolidation for sustainability in Shanxi, China, J. Clean. Prod., 145, 199–208, https://doi.org/10.1016/j.jclepro.2017.01.050, 2017.
Chen, Y., Sherwin, E. D., Berman, E. S. F., Jones, B. B., Gordon, M. P., Wetherley, E. B., Kort, E. A., and Brandt, A. R.: Quantifying Regional Methane Emissions in the New Mexico Permian Basin with a Comprehensive Aerial Survey, Environ. Sci. Technol., 56, 4317–4323, https://doi.org/10.1021/acs.est.1c06458, 2022.
Cohen, J. B. and Prinn, R. G.: Development of a fast, urban chemistry metamodel for inclusion in global models, Atmos. Chem. Phys., 11, 7629–7656, https://doi.org/10.5194/acp-11-7629-2011, 2011.
Cohen, J. B. and Wang, C.: Estimating global black carbon emissions using a top-down Kalman Filter approach, J. Geophys Res.-Atmos., 119, 307–323, https://doi.org/10.1002/2013JD019912, 2014.
Conrad, B. M., Tyner, D. R., and Johnson, M. R.: Robust probabilities of detection and quantification uncertainty for aerial methane detection: Examples for three airborne technologies, Remote Sens. Environ., 288, 113499, https://doi.org/10.1016/j.rse.2023.113499, 2023.
Delkash, M., Zhou, B., Han, B., Chow, F. K., Rella, C. W., and Imhoff, P. T.: Short-term landfill methane emissions dependency on wind, Waste Manage., 55, 288–298, https://doi.org/10.1016/j.wasman.2016.02.009, 2016.
Duren, R. M., Thorpe, A. K., Foster, K. T., Rafiq, T., Hopkins, F. M., Yadav, V., Bue, B. D., Thompson, D. R., Conley, S., Colombi, N. K., Frankenberg, C., McCubbin, I. B., Eastwood, M. L., Falk, M., Herner, J. D., Croes, B. E., Green, R. O., and Miller, C. E.: California's methane super-emitters, Nature, 575, 180–184, https://doi.org/10.1038/s41586-019-1720-3, 2019.
Etminan, M., Myhre, G., Highwood, E. J., and Shine, K. P.: Radiative forcing of carbon dioxide, methane, and nitrous oxide: A significant revision of the methane radiative forcing, Geophys. Res. Lett., 43, 12614–12623, https://doi.org/10.1002/2016GL071930, 2016.
Fan, L., Qin, K., and Cohen, J. B.: Dataset for “Surface Observation Constrained High Frequency Coal Mine Methane Emissions in Shanxi China Reveal More Emissions than Inventories, Consistency with Satellite Inversion”, figshare [data set], https://doi.org/10.6084/m9.figshare.24464149.v1, 2025.
Goldsmith, C. D., Chanton, J., Abichou, T., Swan, N., Green, R., and Hater, G.: Methane emissions from 20 landfills across the United States using vertical radial plume mapping, J. Air Waste Manage., 62, 183–197, https://doi.org/10.1080/10473289.2011.639480, 2012.
Gorchov Negron, A. M., Kort, E. A., Conley, S. A., and Smith, M. L.: Airborne Assessment of Methane Emissions from Offshore Platforms in the U.S. Gulf of Mexico, Environ. Sci. Technol., 54, 5112–5120, https://doi.org/10.1021/acs.est.0c00179, 2020.
Guo, J., Zhang, J., Shao, J., Chen, T., Bai, K., Sun, Y., Li, N., Wu, J., Li, R., Li, J., Guo, Q., Cohen, J. B., Zhai, P., Xu, X., and Hu, F.: A merged continental planetary boundary layer height dataset based on high-resolution radiosonde measurements, ERA5 reanalysis, and GLDAS, Earth Syst. Sci. Data, 16, 1–14, https://doi.org/10.5194/essd-16-1-2024, 2024.
Guo, J., Zhang, J., and Shao, J.: A Harmonized Global Continental High-resolution Planetary Boundary Layer Height Dataset Covering 2017–2021, Zenodo [data set], https://doi.org/10.5281/zenodo.6498004, 2022.
Heerah, S., Frausto-Vicencio, I., Jeong, S., Marklein, A. R., Ding, Y., Meyer, A. G., Parker, H. A., Fischer, M. L., Franklin, J. E., Hopkins, F. M., and Dubey, M.: Dairy Methane Emissions in California's San Joaquin Valley Inferred With Ground-Based Remote Sensing Observations in the Summer and Winter, J. Geophys. Res.-Atmos., 126, e2021JD034785, https://doi.org/10.1029/2021JD034785, 2021.
He, T.-L., Boyd, R. J., Varon, D. J., and Turner, A. J.: Increased methane emissions from oil and gas following the Soviet Union's collapse, P. Natl. Acad. Sci. USA, 121, e2314600121, https://doi.org/10.1073/pnas.2314600121, 2024.
Hiller, R. V., Neininger, B., Brunner, D., Gerbig, C., Bretscher, D., Künzle, T., Buchmann, N., and Eugster, W.: Aircraft-based CH4 flux estimates for validation of emissions from an agriculturally dominated area in Switzerland, J. Geophys. Res.-Atmos., 119, 4874–4887, https://doi.org/10.1002/2013JD020918, 2014.
Hu, H., Landgraf, J., Detmers, R., Borsdorff, T., Aan de Brugh, J., Aben, I., Butz, A., and Hasekamp, O.: Toward Global Mapping of Methane With TROPOMI: First Results and Intersatellite Comparison to GOSAT, Geophys. Res. Lett., 45, 3682–3689, https://doi.org/10.1002/2018GL077259, 2018.
Hu, W., Qin, K., Lu, F., Li, D., and Cohen, J. B.: Merging TROPOMI and eddy covariance observations to quantify 5 years of daily CH4 emissions over coal-mine dominated region, Int. J. Coal Sci. Technol., 11, 56, https://doi.org/10.1007/s40789-024-00700-1, 2024.
Irakulis-Loitxate, I., Guanter, L., Liu, Y.-N., Varon, D. J., Maasakkers, J. D., Zhang, Y., Chulakadabba, A., Wofsy, S. C., Thorpe, A. K., Duren, R. M., Frankenberg, C., Lyon, D. R., Hmiel, B., Cusworth, D. H., Zhang, Y., Segl, K., Gorroño, J., Sánchez-García, E., Sulprizio, M. P., Cao, K., Zhu, H., Liang, J., Li, X., Aben, I., and Jacob, D. J.: Satellite-based survey of extreme methane emissions in the Permian basin, Sci. Adv., 7, eabf4507, https://doi.org/10.1126/sciadv.abf4507, 2021.
Jacob, D. J., Turner, A. J., Maasakkers, J. D., Sheng, J., Sun, K., Liu, X., Chance, K., Aben, I., McKeever, J., and Frankenberg, C.: Satellite observations of atmospheric methane and their value for quantifying methane emissions, Atmos. Chem. Phys., 16, 14371–14396, https://doi.org/10.5194/acp-16-14371-2016, 2016.
Jacob, D. J., Varon, D. J., Cusworth, D. H., Dennison, P. E., Frankenberg, C., Gautam, R., Guanter, L., Kelley, J., McKeever, J., Ott, L. E., Poulter, B., Qu, Z., Thorpe, A. K., Worden, J. R., and Duren, R. M.: Quantifying methane emissions from the global scale down to point sources using satellite observations of atmospheric methane, Atmos. Chem. Phys., 22, 9617–9646, https://doi.org/10.5194/acp-22-9617-2022, 2022.
Janssens-Maenhout, G., Crippa, M., Guizzardi, D., Muntean, M., Schaaf, E., Dentener, F., Bergamaschi, P., Pagliari, V., Olivier, J. G. J., Peters, J. A. H. W., van Aardenne, J. A., Monni, S., Doering, U., and Petrescu, A. M. R.: EDGAR v4.3.2 Global Atlas of the three major Greenhouse Gas Emissions for the period 1970–2012, Earth Syst. Sci. Data Discuss. [preprint], https://doi.org/10.5194/essd-2017-79, 2017.
Karion, A., Sweeney, C., Pétron, G., Frost, G., Michael Hardesty, R., Kofler, J., Miller, B. R., Newberger, T., Wolter, S., Banta, R., Brewer, A., Dlugokencky, E., Lang, P., Montzka, S. A., Schnell, R., Tans, P., Trainer, M., Zamora, R., and Conley, S.: Methane emissions estimate from airborne measurements over a western United States natural gas field, Geophys. Res. Lett., 40, 4393–4397, https://doi.org/10.1002/grl.50811, 2013.
Katzenstein, A. S., Doezema, L. A., Simpson, I. J., Blake, D. R., and Rowland, F. S.: Extensive regional atmospheric hydrocarbon pollution in the southwestern United States, P. Natl. Acad. Sci. USA, 100, 11975–11979, https://doi.org/10.1073/pnas.1635258100, 2003.
Kerr, T. and Yang, M.: Coal mine methane in China: A budding asset with the potential to bloom, IEA Information Paper, 1–35, https://www.iea.org/reports/coal-mine-methane-in-china-a-budding-asset-with-the-potential-to-bloom (last access: 6 June 2025), 2009.
Kirschke, S., Bousquet, P., Ciais, P., Saunois, M., Canadell, J. G., Dlugokencky, E. J., Bergamaschi, P., Bergmann, D., Blake, D. R., Bruhwiler, L., Cameron-Smith, P., Castaldi, S., Chevallier, F., Feng, L., Fraser, A., Heimann, M., Hodson, E. L., Houweling, S., Josse, B., Fraser, P. J., Krummel, P. B., Lamarque, J.-F., Langenfelds, R. L., Le Quéré, C., Naik, V., O'Doherty, S., Palmer, P. I., Pison, I., Plummer, D., Poulter, B., Prinn, R. G., Rigby, M., Ringeval, B., Santini, M., Schmidt, M., Shindell, D. T., Simpson, I. J., Spahni, R., Steele, L. P., Strode, S. A., Sudo, K., Szopa, S., van der Werf, G. R., Voulgarakis, A., van Weele, M., Weiss, R. F., Williams, J. E., and Zeng, G.: Three decades of global methane sources and sinks, Nat. Geosci., 6, 813–823, https://doi.org/10.1038/ngeo1955, 2013.
Krautwurst, S., Gerilowski, K., Jonsson, H. H., Thompson, D. R., Kolyer, R. W., Iraci, L. T., Thorpe, A. K., Horstjann, M., Eastwood, M., Leifer, I., Vigil, S. A., Krings, T., Borchardt, J., Buchwitz, M., Fladeland, M. M., Burrows, J. P., and Bovensmann, H.: Methane emissions from a Californian landfill, determined from airborne remote sensing and in situ measurements, Atmos. Meas. Tech., 10, 3429–3452, https://doi.org/10.5194/amt-10-3429-2017, 2017.
Krautwurst, S., Gerilowski, K., Borchardt, J., Wildmann, N., Gałkowski, M., Swolkień, J., Marshall, J., Fiehn, A., Roiger, A., Ruhtz, T., Gerbig, C., Necki, J., Burrows, J. P., Fix, A., and Bovensmann, H.: Quantification of CH4 coal mining emissions in Upper Silesia by passive airborne remote sensing observations with the Methane Airborne MAPper (MAMAP) instrument during the CO2 and Methane (CoMet) campaign, Atmos. Chem. Phys., 21, 17345–17371, https://doi.org/10.5194/acp-21-17345-2021, 2021.
Kuhlmann, G., Brunner, D., Emmenegger, L., Schwietzke, S., Zavala-Araiza, D., Thorpe, A., Hueni, A., and Röckmann, T.: Quantifying methane super-emitters from oil and gas production in Romania with the AVIRIS-NG imaging spectrometer, EGU General Assembly 2023, Vienna, Austria, 24–28 Apr 2023, EGU23-6751, https://doi.org/10.5194/egusphere-egu23-6751, 2023.
Kuze, A., Suto, H., Nakajima, M., and Hamazaki, T.: Thermal and near infrared sensor for carbon observation Fourier-transform spectrometer on the Greenhouse Gases Observing Satellite for greenhouse gases monitoring, Appl. Opt., 48, 6716–6733, https://opg.optica.org/ao/abstract.cfm?URI=ao-48-35-6716, 2009.
Lauvaux, T., Giron, C., Mazzolini, M., d'Aspremont, A., Duren, R., Cusworth, D., Shindell, D., and Ciais, P.: Global assessment of oil and gas methane ultra-emitters, Science, 375, 557–561, https://doi.org/10.1126/science.abj4351, 2022.
Li, Q., Fernandez, R. P., Hossaini, R., Iglesias-Suarez, F., Cuevas, C. A., Apel, E. C., Kinnison, D. E., Lamarque, J.-F., and Saiz-Lopez, A.: Reactive halogens increase the global methane lifetime and radiative forcing in the 21st century, Nat. Commun., 13, 2768, https://doi.org/10.1038/s41467-022-30456-8, 2022.
Li, X., Cohen, J. B., Qin, K., Geng, H., Wu, X., Wu, L., Yang, C., Zhang, R., and Zhang, L.: Remotely sensed and surface measurement- derived mass-conserving inversion of daily NOx emissions and inferred combustion technologies in energy-rich northern China, Atmos. Chem. Phys., 23, 8001–8019, https://doi.org/10.5194/acp-23-8001-2023, 2023.
Lin, B.-Q. and Liu, J.-H.: Estimating coal production peak and trends of coal imports in China, Energ. Policy, 38, 512–519, https://doi.org/10.1016/j.enpol.2009.09.042, 2010.
Lu, L., Cohen, J. B., Qin, K., Li, X., and He, Q.: Identifying missing sources and reducing NOx emissions uncertainty over China using daily satellite data and a mass-conserving method, Atmos. Chem. Phys., 25, 2291–2309, https://doi.org/10.5194/acp-25-2291-2025, 2025.
Luther, A., Kleinschek, R., Scheidweiler, L., Defratyka, S., Stanisavljevic, M., Forstmaier, A., Dandocsi, A., Wolff, S., Dubravica, D., Wildmann, N., Kostinek, J., Jöckel, P., Nickl, A.-L., Klausner, T., Hase, F., Frey, M., Chen, J., Dietrich, F., Nȩcki, J., Swolkień, J., Fix, A., Roiger, A., and Butz, A.: Quantifying CH4 emissions from hard coal mines using mobile sun-viewing Fourier transform spectrometry, Atmos. Meas. Tech., 12, 5217–5230, https://doi.org/10.5194/amt-12-5217-2019, 2019.
Luther, A., Kostinek, J., Kleinschek, R., Defratyka, S., Stanisavljević, M., Forstmaier, A., Dandocsi, A., Scheidweiler, L., Dubravica, D., Wildmann, N., Hase, F., Frey, M. M., Chen, J., Dietrich, F., Nȩcki, J., Swolkień, J., Knote, C., Vardag, S. N., Roiger, A., and Butz, A.: Observational constraints on methane emissions from Polish coal mines using a ground-based remote sensing network, Atmos. Chem. Phys., 22, 5859–5876, https://doi.org/10.5194/acp-22-5859-2022, 2022.
Mehrotra, S., Faloona, I., Suard, M., Conley, S., and Fischer, M. L.: Airborne Methane Emission Measurements for Selected Oil and Gas Facilities Across California, Environ. Sci. Technol., 51, 12981–12987, https://doi.org/10.1021/acs.est.7b03254, 2017.
Miller, S. M., Michalak, A. M., Detmers, R. G., Hasekamp, O. P., Bruhwiler, L. M. P., and Schwietzke, S.: China's coal mine methane regulations have not curbed growing emissions, Nat. Commun., 10, 303, https://doi.org/10.1038/s41467-018-07891-7, 2019.
Molina, L. T., Madronich, S., Gaffney, J. S., Apel, E., de Foy, B., Fast, J., Ferrare, R., Herndon, S., Jimenez, J. L., Lamb, B., Osornio-Vargas, A. R., Russell, P., Schauer, J. J., Stevens, P. S., Volkamer, R., and Zavala, M.: An overview of the MILAGRO 2006 Campaign: Mexico City emissions and their transport and transformation, Atmos. Chem. Phys., 10, 8697–8760, https://doi.org/10.5194/acp-10-8697-2010, 2010.
Peng, S., Piao, S., Bousquet, P., Ciais, P., Li, B., Lin, X., Tao, S., Wang, Z., Zhang, Y., and Zhou, F.: Inventory of anthropogenic methane emissions in mainland China from 1980 to 2010, Atmos. Chem. Phys., 16, 14545–14562, https://doi.org/10.5194/acp-16-14545-2016, 2016.
Plant, G., Kort, E. A., Murray, L. T., Maasakkers, J. D., and Aben, I.: Evaluating urban methane emissions from space using TROPOMI methane and carbon monoxide observations, Remote Sen. Environ., 268, 112756, https://doi.org/10.1016/j.rse.2021.112756, 2022.
Povey, A. C. and Grainger, R. G.: Known and unknown unknowns: uncertainty estimation in satellite remote sensing, Atmos. Meas. Tech., 8, 4699–4718, https://doi.org/10.5194/amt-8-4699-2015, 2015.
Prather, M. J., Holmes, C. D., and Hsu, J.: Reactive greenhouse gas scenarios: Systematic exploration of uncertainties and the role of atmospheric chemistry, Geophys. Res. Lett., 39, L09803, https://doi.org/10.1029/2012GL051440, 2012.
Prinn, R., Cunnold, D., Rasmussen, R., Simmonds, P., Alyea, F., Crawford, A., Fraser, P., and Rosen, R.: Atmospheric Trends in Methylchloroform and the Global Average for the Hydroxyl Radical, Science, 238, 945–950, https://doi.org/10.1126/science.238.4829.945, 1987.
Qin, K., Lu, L., Liu, J., He, Q., Shi, J., Deng, W., Wang, S., and Cohen, J. B.: Model-free daily inversion of NOx emissions using TROPOMI (MCMFE-NOx) and its uncertainty: Declining regulated emissions and growth of new sources, Remote Sens. Environ., 295, 113720, https://doi.org/10.1016/j.rse.2023.113720, 2023.
Qin, K., Hu, W., He, Q., Lu, F., and Cohen, J. B.: Individual coal mine methane emissions constrained by eddy covariance measurements: low bias and missing sources, Atmos. Chem. Phys., 24, 3009–3028, https://doi.org/10.5194/acp-24-3009-2024, 2024.
Reuter, M., Buchwitz, M., Schneising, O., Krautwurst, S., O'Dell, C. W., Richter, A., Bovensmann, H., and Burrows, J. P.: Towards monitoring localized CO2 emissions from space: co-located regional CO2 and NO2 enhancements observed by the OCO-2 and S5P satellites, Atmos. Chem. Phys., 19, 9371–9383, https://doi.org/10.5194/acp-19-9371-2019, 2019.
Rigby, M., Park, S., Saito, T., Western, L. M., Redington, A. L., Fang, X., Henne, S., Manning, A. J., Prinn, R. G., Dutton, G. S., Fraser, P. J., Ganesan, A. L., Hall, B. D., Harth, C. M., Kim, J., Kim, K. R., Krummel, P. B., Lee, T., Li, S., Liang, Q., Lunt, M. F., Montzka, S. A., Mühle, J., O'Doherty, S., Park, M. K., Reimann, S., Salameh, P. K., Simmonds, P., Tunnicliffe, R. L., Weiss, R. F., Yokouchi, Y., and Young, D.: Increase in CFC-11 emissions from eastern China based on atmospheric observations, Nature, 569, 546–550, https://doi.org/10.1038/s41586-019-1193-4, 2019.
Sadavarte, P., Pandey, S., Maasakkers, J. D., Lorente, A., Borsdorff, T., Denier van der Gon, H., Houweling, S., and Aben, I.: Methane Emissions from Superemitting Coal Mines in Australia Quantified Using TROPOMI Satellite Observations, Environ. Sci. Technol., 55, 16573–16580, https://doi.org/10.1021/acs.est.1c03976, 2021.
Saunois, M., Stavert, A. R., Poulter, B., Bousquet, P., Canadell, J. G., Jackson, R. B., Raymond, P. A., Dlugokencky, E. J., Houweling, S., Patra, P. K., Ciais, P., Arora, V. K., Bastviken, D., Bergamaschi, P., Blake, D. R., Brailsford, G., Bruhwiler, L., Carlson, K. M., Carrol, M., Castaldi, S., Chandra, N., Crevoisier, C., Crill, P. M., Covey, K., Curry, C. L., Etiope, G., Frankenberg, C., Gedney, N., Hegglin, M. I., Höglund-Isaksson, L., Hugelius, G., Ishizawa, M., Ito, A., Janssens-Maenhout, G., Jensen, K. M., Joos, F., Kleinen, T., Krummel, P. B., Langenfelds, R. L., Laruelle, G. G., Liu, L., Machida, T., Maksyutov, S., McDonald, K. C., McNorton, J., Miller, P. A., Melton, J. R., Morino, I., Müller, J., Murguia-Flores, F., Naik, V., Niwa, Y., Noce, S., O'Doherty, S., Parker, R. J., Peng, C., Peng, S., Peters, G. P., Prigent, C., Prinn, R., Ramonet, M., Regnier, P., Riley, W. J., Rosentreter, J. A., Segers, A., Simpson, I. J., Shi, H., Smith, S. J., Steele, L. P., Thornton, B. F., Tian, H., Tohjima, Y., Tubiello, F. N., Tsuruta, A., Viovy, N., Voulgarakis, A., Weber, T. S., van Weele, M., van der Werf, G. R., Weiss, R. F., Worthy, D., Wunch, D., Yin, Y., Yoshida, Y., Zhang, W., Zhang, Z., Zhao, Y., Zheng, B., Zhu, Q., Zhu, Q., and Zhuang, Q.: The Global Methane Budget 2000–2017, Earth Syst. Sci. Data, 12, 1561–1623, https://doi.org/10.5194/essd-12-1561-2020, 2020a.
Saunois, M., Stavert, A. R., Poulter, B., Bousquet, P., Canadell, J. G., Jackson, R. B., Raymond, P. A., Dlugokencky, E. J., Houweling, S., Patra, P. K., Ciais, P., Arora, V. K., Bastviken, D., Bergamaschi, P., Blake, D. R., Brailsford, G., Bruhwiler, L., Carlson, K. M., Carrol, M., Castaldi, S., Chandra, N., Crevoisier, C., Crill, P. M., Covey, K., Curry, C. L., Etiope, G., Frankenberg, C., Gedney, N., Hegglin, M. I., Höglund-Isaksson, L., Hugelius, G., Ishizawa, M., Ito, A., Janssens-Maenhout, G., Jensen, K. M., Joos, F., Kleinen, T., Krummel, P. B., Langenfelds, R. L., Laruelle, G. G., Liu, L., Machida, T., Maksyutov, S., McDonald, K. C., McNorton, J., Miller, P. A., Melton, J. R., Morino, I., Müller, J., Murguia-Flores, F., Naik, V., Niwa, Y., Noce, S., O'Doherty, S., Parker, R. J., Peng, C., Peng, S., Peters, G. P., Prigent, C., Prinn, R., Ramonet, M., Regnier, P., Riley, W. J., Rosentreter, J. A., Segers, A., Simpson, I. J., Shi, H., Smith, S. J., Steele, L. P., Thornton, B. F., Tian, H., Tohjima, Y., Tubiello, F. N., Tsuruta, A., Viovy, N., Voulgarakis, A., Weber, T. S., van Weele, M., van der Werf, G. R., Weiss, R. F., Worthy, D., Wunch, D., Yin, Y., Yoshida, Y., Zhang, W., Zhang, Z., Zhao, Y., Zheng, B., Zhu, Q., Zhu, Q., and Zhuang, Q.: The Global Methane Budget 2000–2017, Earth Syst. Sci. Data, 12, 1561–1623, https://doi.org/10.5194/essd-12-1561-2020, 2020b.
Shi, T., Han, Z., Han, G., Ma, X., Chen, H., Andersen, T., Mao, H., Chen, C., Zhang, H., and Gong, W.: Retrieving CH4-emission rates from coal mine ventilation shafts using UAV-based AirCore observations and the genetic algorithm–interior point penalty function (GA-IPPF) model, Atmos. Chem. Phys., 22, 13881–13896, https://doi.org/10.5194/acp-22-13881-2022, 2022.
Shi, T., Han, G., Ma, X., Mao, H., Chen, C., Han, Z., Pei, Z., Zhang, H., Li, S., and Gong, W.: Quantifying factory-scale CO2/CH4 emission based on mobile measurements and EMISSION-PARTITION model: cases in China, Environ. Res. Lett., 18, 034028, https://doi.org/10.1088/1748-9326/acbce7, 2023.
Sun, K.: Derivation of Emissions From Satellite-Observed Column Amounts and Its Application to TROPOMI NO2 and CO Observations, Geophys. Res. Lett., 49, e2022GL101102, https://doi.org/10.1029/2022GL101102, 2022.
Tong, X., van Heuven, S., Scheeren, B., Kers, B., Hutjes, R., and Chen, H.: Aircraft-Based AirCore Sampling for Estimates of N2O and CH4 Emissions, Environ. Sci. Technol., 57, 15571–15579, https://doi.org/10.1021/acs.est.3c04932, 2023.
Tu, Q., Hase, F., Schneider, M., García, O., Blumenstock, T., Borsdorff, T., Frey, M., Khosrawi, F., Lorente, A., Alberti, C., Bustos, J. J., Butz, A., Carreño, V., Cuevas, E., Curcoll, R., Diekmann, C. J., Dubravica, D., Ertl, B., Estruch, C., León-Luis, S. F., Marrero, C., Morgui, J.-A., Ramos, R., Scharun, C., Schneider, C., Sepúlveda, E., Toledano, C., and Torres, C.: Quantification of CH4 emissions from waste disposal sites near the city of Madrid using ground- and space-based observations of COCCON, TROPOMI and IASI, Atmos. Chem. Phys., 22, 295–317, https://doi.org/10.5194/acp-22-295-2022, 2022.
U.S. Energy Information Administration: China – Country Analysis, U.S. Energy Information Administration, https://www.eia.gov/international/analysis/country/CHN, last access: 7 June 2025.
Varon, D. J., Jacob, D. J., McKeever, J., Jervis, D., Durak, B. O. A., Xia, Y., and Huang, Y.: Quantifying methane point sources from fine-scale satellite observations of atmospheric methane plumes, Atmos. Meas. Tech., 11, 5673–5686, https://doi.org/10.5194/amt-11-5673-2018, 2018.
Vaughn, T. L., Bell, C. S., Pickering, C. K., Schwietzke, S., Heath, G. A., Pétron, G., Zimmerle, D. J., Schnell, R. C., and Nummedal, D.: Temporal variability largely explains top-down/bottom-up difference in methane emission estimates from a natural gas production region, P. Natl. Acad. Sci. USA, 115, 11712–11717, https://doi.org/10.1073/pnas.1805687115, 2018.
Vinković, K., Andersen, T., de Vries, M., Kers, B., van Heuven, S., Peters, W., Hensen, A., van den Bulk, P., and Chen, H.: Evaluating the use of an Unmanned Aerial Vehicle (UAV)-based active AirCore system to quantify methane emissions from dairy cows, Sci. Total Environ., 831, 154898, https://doi.org/10.1016/j.scitotenv.2022.154898, 2022.
Wecht, K. J., Jacob, D. J., Sulprizio, M. P., Santoni, G. W., Wofsy, S. C., Parker, R., Bösch, H., and Worden, J.: Spatially resolving methane emissions in California: constraints from the CalNex aircraft campaign and from present (GOSAT, TES) and future (TROPOMI, geostationary) satellite observations, Atmos. Chem. Phys., 14, 8173–8184, https://doi.org/10.5194/acp-14-8173-2014, 2014.
Zhang, Y., Gautam, R., Pandey, S., Omara, M., Maasakkers, J. D., Sadavarte, P., Lyon, D., Nesser, H., Sulprizio, M. P., Varon, D. J., Zhang, R., Houweling, S., Zavala-Araiza, D., Alvarez, R. A., Lorente, A., Hamburg, S. P., Aben, I., and Jacob, D. J.: Quantifying methane emissions from the largest oil-producing basin in the United States from space, Sci. Adv., 6, eaaz5120, https://doi.org/10.1126/sciadv.aaz5120, 2020.
Zinchenko, A. V., Paramonova, N. N., Privalov, V. I., and Reshetnikov, A. I.: Estimation of methane emissions in the St. Petersburg, Russia, region: An atmospheric nocturnal boundary layer budget approach, J. Geophys. Res.-Atmos., 107, ACH 2-1–ACH 2-11, https://doi.org/10.1029/2001JD001369, 2002.