the Creative Commons Attribution 4.0 License.
the Creative Commons Attribution 4.0 License.
 | 26 May 2025
Underappreciated contributions of biogenic volatile organic compounds from urban green spaces to ozone pollution
Haofan Wang
Yuejin Li
Yang Zhang
Qi Fan
Chong Shen
Senchao Lai
Yan Zhou
Tao Zhang
Dingli Yue
The use of urban green spaces (UGSs), such as parks and gardens, is widely promoted as a strategy to improve the urban atmospheric environment. However, this study reveals that it can exacerbate urban ozone (O3) levels under certain conditions, as demonstrated by a September 2017 study in Guangzhou, China. Using the Weather Research and Forecasting model with the Model of Emissions of Gases and Aerosols from Nature (WRF-MEGAN) and the Community Multiscale Air Quality (CMAQ) model, we assessed the impact of UGS-related biogenic volatile organic compound (BVOC) emissions (hereafter referred to as UGS-BVOC emissions) on urban O3. Our findings indicate that the UGS-BVOC emissions in Guangzhou amounted to 666 Gg (), with isoprene (ISOP) and monoterpene (TERP) contributing remarkably to the total UGS-BVOC emissions. Compared to anthropogenic VOC (AVOC) and BVOC emissions, UGS-BVOC emissions account for ∼33.45 % in the city center, and their inclusion in the model reduces ISOP underestimation. The study shows improved simulation mean biases for MDA8 (maximum daily 8 h average) O3, from −3.63 to −0.75 ppb in the city center. Integrating UGS-BVOC emissions and UGS-LUCC emissions (where LUCC denotes land use cover change) enhances surface monthly mean O3 by 1.7–3.7 ppb () and adds up to 8.9 ppb (+10.0 %) to MDA8 O3 during pollution episodes. UGS-BVOC emissions alone increase monthly mean O3 by 1.0–1.4 ppb () in urban areas and contribute up to 2.9 ppb (+3.3 %) to MDA8 O3 during pollution episodes. These impacts can extend to surrounding suburban and rural areas through regional transport, highlighting the need to accurately account for UGS-BVOC emissions to better manage air quality.
- Article
(2717 KB) - Full-text XML
-
Supplement
(4400 KB) - BibTeX
- EndNote


Exposure to air pollution now accounts for more fatalities than malaria, tuberculosis, and HIV/AIDS combined (Lelieveld et al., 2020). As a result, the World Health Organization has declared air pollution the most significant environmental threat to human health (WHO, 2021). Notably, over 70 % of the global health burden of air pollution stems from human-made emissions, leading to a policy focus predominantly on reducing these emissions (Chowdhury et al., 2022; Lelieveld et al., 2019). Despite proactive measures to curb anthropogenic emissions, the incidence of ozone episodes is escalating alongside rapid urbanization (Lu et al., 2020; Yim et al., 2019). Numerous studies have investigated the effects of land use cover change (LUCC) on air quality during urbanization using numerical models, and the majority of these studies have concluded that urbanization exacerbates air pollution (Qiu et al., 2023; Wang et al., 2022). However, work that depends on numerical models usually faces the coarse-resolution land use cover data limitation (Ma et al., 2019, 2022), which leads these studies to frequently overlook a passive abatement approach distinct from reducing anthropogenic sources – namely, the cultivation of urban green spaces (UGSs) (Cohen et al., 2017).
The widely accepted notion that UGSs can enhance air quality has been substantiated by various strands of literature, including public health (Burnett et al., 2018), urban planning (Solomon, 2007), and ecosystem services (Lohmann et al., 2010). This concept is not only prevalent in scholarly circles but has also gained traction in popular media and is echoed in international standards and policy frameworks. For instance, the United Nations System of Environmental–Economic Accounting advocates for vegetation as a nature-based approach to mitigate air pollution (Le Page et al., 2015). Vegetation primarily contributes to air pollution reduction through two mechanisms: deposition and dispersion (Shindell et al., 2012). Deposition involves the absorption of air pollutants onto vegetative surfaces, while dispersion refers to the reduction in air pollutant concentrations through aerodynamic effects caused by vegetation (Tiwari and Kumar, 2020; Wang et al., 2019b). Notably, Ramanathan et al. (2001) reported that dispersion effects are significantly more impactful than deposition, with the former exceeding the latter by an order of magnitude, using a radiative forcing modeling method.
However, the efficacy of dispersion effects resulting from UGS-related LUCC (UGS-LUCC) with respect to reducing air pollution is not straightforward. These effects can, under certain conditions, even increase local air pollution concentrations. These conditions are influenced by several factors, such as the specific structure of UGSs' vegetation properties (e.g., height and leaf density), the site context (e.g., street canyon geometry and proximity to emission sources), and prevailing meteorological conditions (e.g., wind speed and direction) (Jin et al., 2017; Tomson et al., 2021; Yang et al., 2020). For example, dense tree canopies might impede ventilation in urban street canyons, while porous vegetation barriers in open-road settings could potentially intensify roadside air pollution concentrations (Chen et al., 2021; Jin et al., 2014). Furthermore, Seinfeld et al. (1998) underscored the complexity of these interactions and demonstrated that vegetation could exert nonlinear effects on meteorological processes. These effects are particularly evident in their impact on the planetary boundary layer height (PBLH) and the turbulent transport and advection of pollutants, which in turn influence dispersion conditions.
UGSs also have a complex role in air quality due to their production of biogenic volatile organic compounds (BVOCs). For instance, in cities like Los Angeles, UGS-BVOC emissions contribute to a quarter of the secondary organic aerosol formation on hot days (Schlaerth et al., 2023). While Guenther et al. (2012) noted that the majority of BVOC emissions are from natural land cover, Ma et al. (2022) indicated that UGS-BVOC emissions can be significantly higher in metropolitan areas, ranging from 1 to 30 times those from natural land use cover. This evidence suggests a dual nature of UGS vegetation in urban environments: (1) it can mitigate air pollution under certain conditions; (2) conversely, there is substantial experimental and modeling evidence showing that it can exacerbate pollution under different circumstances (Allen and Ingram, 2002; Burnett et al., 2018; Cohen et al., 2017). Moreover, metropolitan areas often encounter VOC-limited conditions, or NOx saturation, where even minimal BVOC emissions can lead to notable O3 production (Wang et al., 2019c). Additionally, urban areas typically experience higher temperatures than their surrounding natural landscapes due to the urban heat island effect (IPCC, 2023). This increase in temperature is likely to further amplify UGS-BVOC emissions (Zhou et al., 2015), influencing O3 concentrations significantly. This interaction might explain why many regional numerical models underestimate urban surface ozone levels, as they often lack the high-resolution land use cover data necessary to accurately estimate UGS-BVOC emissions (Qiu et al., 2023; Wang et al., 2021; Wu et al., 2020).
Currently, there is a growing research interest in characterizing the air quality impacts of UGSs. While Arghavani et al. (2019) investigated the effects of UGSs on gaseous air pollutants in Tehran using the Weather Research and Forecasting model with Chemistry (WRF-Chem), their focus was on the impact of meteorological changes on O3 resulting from UGSs (i.e., UGS-LUCC effects), rather than the UGS-BVOC emission effects on O3. In contrast, Schlaerth et al. (2023a) addressed the influence of UGS-BVOC emissions on O3 in Los Angeles, and their findings indicate that UGS-BVOC emissions may increase O3 by 0.95 ppb during the daytime and decrease it by 0.41 ppb at night. Despite Schlaerth et al. (2023a) illustrating the significance of UGS-BVOC emissions on O3 concentrations, they did not investigate the impact of UGS-LUCC effects.
Surface O3 is generally formed through chemical reactions of VOCs and NOx in the presence of sunlight. The nonlinear correlation between O3 and concentrations of BVOC and NOx underscores the importance of examining potential interactions between UGS-BVOC emissions and anthropogenic emissions. Furthermore, recent studies have highlighted the significance of UGS-LUCC effects and UGS-BVOC emission effects. Given the rise in urban O3 pollution, investigating the influence of UGS-LUCC effects and UGS-BVOC emission effects on O3 can assist in rationalizing UGS planning and formulating air quality mitigation strategies. However, there is a lack of quantification regarding the combined effects of UGS-LUCC and UGS-BVOC emissions on O3.
Situated in South China, Guangzhou city (Fig. 1) has been rapidly expanding since the initiation of the “Reform and Opening-up” policy, undergoing swift urbanization (Yao and Huang, 2023). Being a key city in the Guangdong–Hong Kong–Macao Greater Bay Area, city planning in Guangzhou has placed significant emphasis on UGS development. In this study, we aim to reconstruct the leaf area index (LAI) dataset for urban areas and estimate UGS-BVOC emissions by utilizing the Model of Emissions of Gases and Aerosols from Nature version 3.1 (MEGANv3.1) (Guenther et al., 2020). Subsequently, employing the Weather Research and Forecast model version 4.1.1 (WRFv4.1.1) (Salamanca et al., 2011) coupled with the Community Multiscale Air Quality model version 5.4 (CMAQv5.4) (https://zenodo.org/record/7218076, last access: 15 May 2025), we intend to (1) estimate the improvements in the CMAQ simulation performance due to consideration of UGS-LUCC and UGS-BVOC emissions and (2) investigate UGS-LUCC effects, UGS-BVOC emission effects, and their combined impacts on O3 over Guangzhou by configuring sensitivity cases.
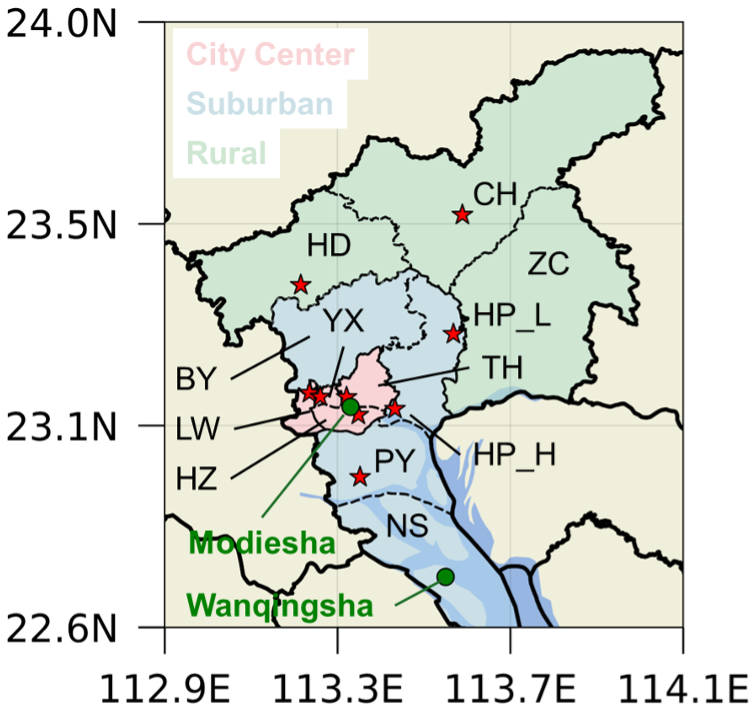
Figure 1The innermost domain of WRF-CMAQ, showing the various areas and the air quality station locations. Modiesha and Wanqingsha are the observation sites for isoprene.
2.1 Leaf area index and land cover dataset
The default LAI dataset to drive the MEGANv2.1 model and can also be used for MEGANv3.1 is derived from the enhanced Moderate Resolution Imaging Spectroradiometer (MODIS)/MOD15A2H in 2003 with a 1 km spatial resolution (Myneni et al., 2015). As MODIS/MOD15A2H assigns an LAI value of zero to urban areas, MEGANv3.1 compensates by averaging the LAI values in the vicinity of the urban area. However, this approach introduces considerable uncertainty in the estimation of UGS-BVOC emissions. Hence, we opted for the Global Land Surface Satellite (GLASS) LAI product for MEGANv3.1 in 2017 with a 500 m spatial resolution; this product is derived from MODIS surface reflectance data using the bidirectional long short-term memory (Bi-LSTM) model, which leverages existing global LAI products (Ma and Liang, 2022) and effectively incorporates the temporal and spectral information of MODIS surface reflectance. Consequently, the valid values of these data extend to urban areas, making them suitable for simulating UGS-BVOC emissions.
In this study, UGSs are delineated as vegetation areas within the urban grid, and the urban grids are derived from MODIS/MCD12Q1 (Friedl and Sulla-Menashe, 2019) in 2017, which corresponds to the simulation period with a 500 m spatial resolution. Furthermore, a high-resolution (10 m) land cover dataset in 2017 was also obtained from the Geographic Remote Sensing Ecological Network Platform (accessible at http://www.gisrs.cn/infofordata?id=1c089287-909e-4394-b07f-c7004be60884, last access: 15 May 2025) and was employed to depict the spatial patterns of UGSs. The processed land cover dataset is illustrated in Fig. S1 in the Supplement. Meanwhile, the use of high-resolution land use cover data is pivotal for accurately depicting the intricate details of land use cover, especially in areas broadly classified as urban by coarse-resolution data (i.e., MCD12Q1), and this refined approach allows for a more precise differentiation of UGSs. Specifically, we maintain a consistent urban area definition across both land use cover datasets, anchored by the urban delineation provided by the MCD12Q1 dataset. However, the coarse resolution of MCD12Q1 is insufficient for detailed spatial characterization of UGSs. To address this limitation, we employ the high-resolution dataset to refine the characterization of non-urban surfaces within the urban boundaries (i.e., UGSs) defined by MCD12Q1. This approach yields a sophisticated land cover dataset with a 10 m spatial resolution that retains the urban extent delineated by MCD12Q1 while incorporating detailed representations of UGSs absent in the original dataset. Consequently, while both datasets encompass identical urban extents, the default dataset lacks representation of UGSs, in contrast to the high-resolution dataset, which includes detailed depictions of UGSs.
2.2 MEGANv3.1 configuration
The calculation of BVOC emissions was performed utilizing MEGANv3.1 (accessible at https://bai.ess.uci.edu/megan, last access: 15 May 2025), which is a newly updated version. MEGANv3.1 estimates BVOC emissions as the product of an emission factor and an emission activity factor (Guenther et al., 2020):
In this equation, E is the net emission flux () and EF is the weighted average of the emission factor () for each vegetation type calculated by the Emission Factor Processor (EFP). The emission activity factor (γ) considers emission responses to changes in environmental and phenological conditions. Compared with earlier versions, γ in MEGANv3.1 adds quantifications for responses to high and low temperature, high wind speed, and air pollution (O3).
In this equation, the activity factor denotes the emission response to canopy temperature/light (γTP), leaf age (γLA), soil moisture (γSM), high temperature (γHT), low temperature (γLT), high wind speed (γHW), ambient CO2 concentration (), bidirectional exchange (γBD), O3 exposure (), and the leaf area index (LAI). In this study, was not considered in the BVOC emission estimation. It is worth noting that MEGANv3.1 uses the 2 m temperature variable from the WRF model to calculate BVOC emissions.
Hence, the input data to drive MEGANv3.1 comprise meteorological variables (e.g., temperature, solar radiation, relative humidity, and soil moisture), LAI, and three types of land cover data (i.e., ecotype, growth form, and relative vegetation composition for each ecotype/growth form). The growth-form datasets in MEGANv3.1 contain considerations of evergreen broadleaf forests, grasslands, and crops, which cover all types of UGSs in Guangzhou city (Fig. S1). Meteorological data used in this study were obtained from the WRF model simulations. In addition, the LAI dataset and the default land cover information, both provided by MEGANv3.1, are described in detail in Sect. 2.1.
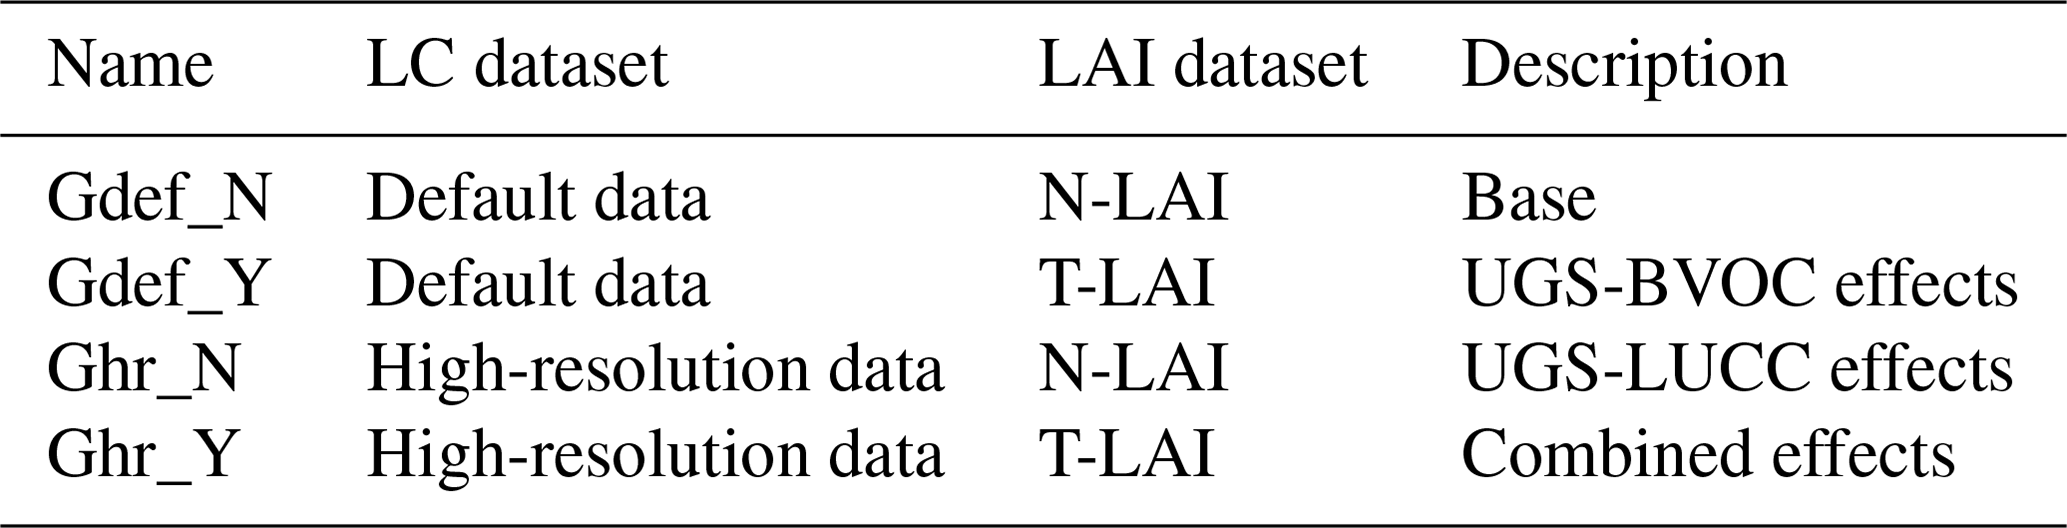
Table 1Case configurations. The default land cover (LC) datasets are derived from MODIS/MCD12Q1, while the high-resolution LC datasets use MODIS/MCD12Q1 for natural areas and the 10 m resolution datasets from the Geographic Remote Sensing Ecological Network Platform for urban areas. N-LAI (non-urban leaf area index) indicates that the model uses LAI data without the urban LAI, whereas T-LAI (total LAI) includes the urban LAI. The “Description” column explains the purpose of each case.
2.3 WRF-CMAQ and case configuration
Both the WRFv4.1.1 model and the CMAQv5.4 model are compiled and operated on a server with a Linux environment. The WRFv4.1.1 model was employed to simulate meteorological conditions, utilizing initial and boundary conditions sourced from the NCEP 1°×1° Final (FNL) reanalysis dataset (National Centers for Environmental Prediction, National Weather Service, NOAA, U.S. Department of Commerce, 2000). As illustrated in Fig. S2 in the Supplement, four nested domains with respective horizontal resolutions of 27, 9, 3, and 1 km were employed. The outermost domain encompasses mainland China, while the innermost domain zooms in on Guangzhou city. The physical parameterization configured for the WRF simulation is listed in Table S1 in the Supplement. CMAQv5.4 utilized meteorological fields provided by WRF to model O3 concentrations. The initial and boundary conditions for the CMAQ model were derived from the default profiles representing a clean atmosphere. In addition, we acquired anthropogenic emissions for the CMAQ domain from the Multi-resolution Emission Inventory for China (MEIC) 2017, developed by Tsinghua University, which contains monthly gridded (0.25°×0.25°) emission information for anthropogenic emissions. Moreover, the CMAQ model was configured with the Carbon Bond 6 (CB06) chemical mechanism (Luecken et al., 2019) and AERO7 module (Pye et al., 2017). In this study, we incorporated the Modular Emission Inventory Allocation Tools for the Community Multiscale Air Quality model (MEIAT-CMAQ; https://github.com/Airwhf/MEIAT-CMAQ, last access: 15 May 2025) to allocate spatial and species-specific emissions within the raw inventories, addressing discrepancies in resolution and species compared to the modeled configurations. Moreover, MEIAT-CMAQ can directly generate the hourly model-ready emission files for CMAQ via temporal allocation. The model simulation spanned a month, from 21 August 2017 to 30 September 2017. To mitigate bias resulting from meteorological and chemical drift, the initial 10 d period of this simulation was designated as spin-up and was not included in the analysis for this study. Given the spatial heterogeneity in the distribution of UGSs across different areas, this study categorizes Guangzhou into city center, suburban, and rural regions (Fig. 1). Specifically, the city center area comprises the Haizhu (HZ), Liwan (LW), Yuexiu (YX), and Tianhe (TH) districts. The city center region has more UGS areas due to the higher urban land use and land cover fraction (Fig. S1) compared to the suburban and rural regions. The suburban area encompasses the Huangpu (HP), Baiyun (BY), Panyu (PY), and Nansha (NS) districts. Lastly, the rural region includes the Zengcheng (ZC), Conghua (CH), and Huadu (HD) districts. To facilitate clear differentiation between the two sites in the HP region, they have been designated as HP_L and HP_H, respectively.
In this study, four distinct cases (as listed in Table 1) were established to investigate the impacts of UGS-LUCC, UGS-BVOC, and their combined effects on ozone simulation. These cases also focused on the performance of the CMAQ simulation and the influence on O3 episodes. The Gdef_N case, considered to be the base case, employs default land use cover data – specifically, data excluding UGSs – and uses the LAI dataset with urban areas omitted (N-LAI). In contrast, the Gdef_Y case is similar to Gdef_N but incorporates the LAI dataset that includes urban areas (T-LAI). This adjustment allows for the assessment of the UGS-BVOC emission effects on O3 concentrations. The Ghr_N case mirrors Gdef_N but differs in that it integrates high-resolution land use cover data, which encompass UGS land use cover. This case aims to examine the UGS-LUCC effects on O3 concentrations. Finally, the Ghr_Y case combines high-resolution land use cover data with the LAI dataset inclusive of urban areas, thereby enabling an exploration of the combined effects of UGS-BVOC emissions and UGS-LUCC on O3 concentrations.
2.4 Observation dataset
We use the hourly ground-level meteorological observations, encompassing 2 m temperature (T2) and 10 m wind speed (WS10), sourced from national basic meteorological stations provided by the Guangdong Provincial Meteorological Service (Fig. S3 in the Supplement). Hourly ambient concentrations of O3, CO, and NO2 from national monitoring stations are gathered from the China National Environmental Monitoring Centre (CNEMC; http://www.cnemc.cn, last assess: 15 May 2025). The real-time hourly concentration of O3 was measured using the ultraviolet absorption spectrometry method and differential optical absorption spectroscopy at each monitoring site. NO2 concentrations are measured using the molybdenum converter method, which is known to have positive interferences from NO2 oxidation products (Dunlea et al., 2007). The instrumental operation, maintenance, data assurance, and quality control were properly conducted based on the most recent revisions of China Environmental Protection Standards (Zhang and Cao, 2015), and the locations of these air quality stations are depicted in Fig. 1. Additionally, meteorological data also undergo thorough quality control. Subsequently, they are utilized to assess the model performance of WRF-CMAQ.
For the isoprene (ISOP) evaluation, we use observation data from the Modiesha (23.11° N, 113.33° E) and Wanqingsha (22.71° N, 113.55° E) sites (Fig. 1), where an online gas chromatography–flame ionization detector/mass spectrometry detector system (GC-FID/MSD, TH 300B, Wuhan) is used to measure VOCs in the ambient atmosphere. The system has a sampling rate of 60 mL min−1 for 5 min per sample, with a sampling frequency of once per hour (Meng et al., 2022). The ISOP observation data undergo rigorous quality control and can be used for evaluating simulated ISOP concentrations. It is worth noting that the ISOP observational data for the Modiesha site cover September 2017, whereas the Wanqingsha site has data coverage from 7 to 30 September 2017.
3.1 Model evaluation
Evaluation of the WRF-CMAQ model performance is undertaken via comparison against ground-level observations, and the evaluation metrics of meteorological parameters are listed in Table S2 in the Supplement, which shows that the meteorological fields were faithfully reproduced in this study and can be used to drive the air quality model.
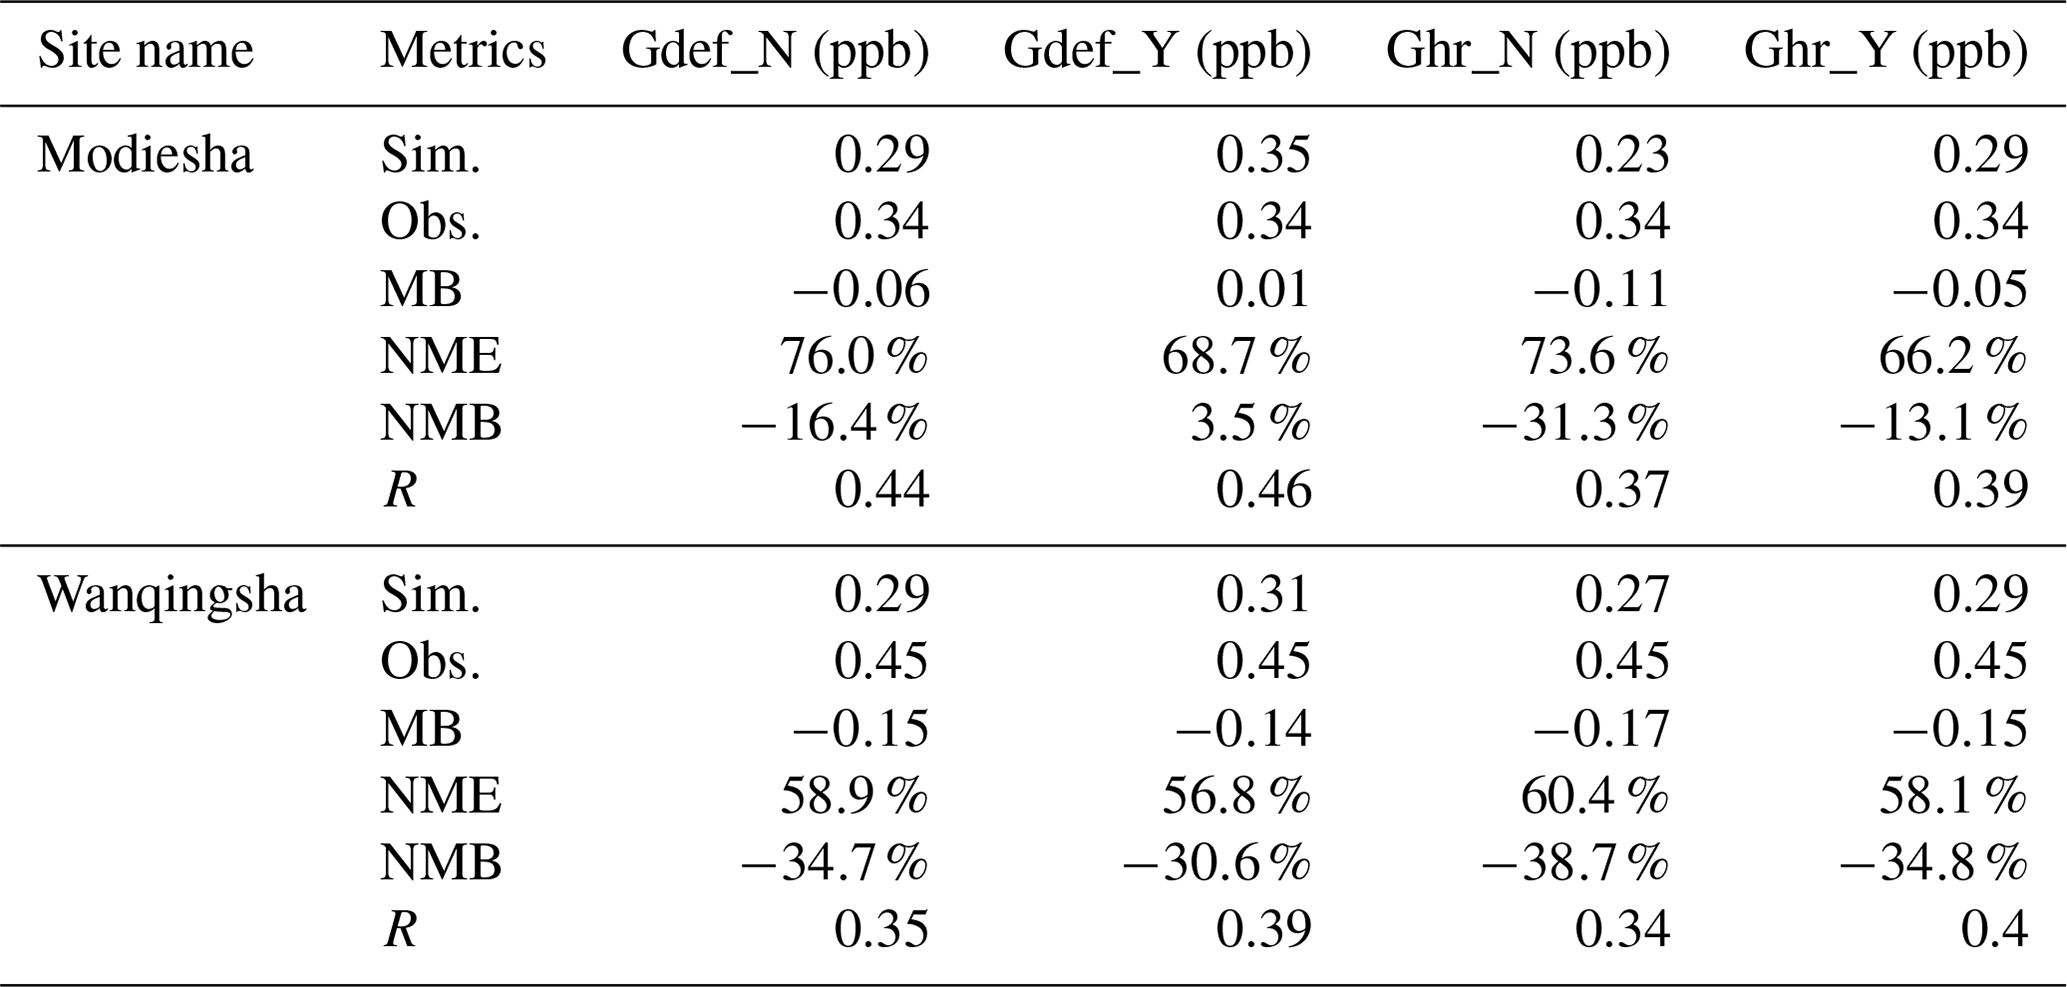
ISOP and monoterpene (TERP) are the major species present in BVOC emissions, making their concentration assessment a feasible and convincing method for indirectly validating the accuracy of BVOC emission estimates. Table 2 presents the mean concentrations of ISOP derived from various cases juxtaposed with the observed average concentrations. This comparative analysis at the Modiesha site reveals that there is an augmentation in the ISOP concentration from 0.29 to 0.35 ppb and from 0.23 to 0.29 ppb under distinct land use cover cases (Gdef and Ghr), relative to an observed concentration of 0.34 ppb, after the incorporation of UGS-BVOC emissions. Meanwhile, the evaluation at the Wanqingsha site, where the observed mean ISOP concentration was 0.45 ppb from 7 to 30 September 2017, shows that the modeled ISOP concentrations increased from 0.29 to 0.31 ppb and from 0.27 to 0.29 ppb under distinct land use cover cases (Gdef and Ghr) when UGS-BVOC emissions were included. Additionally, all cases successfully capture the hourly ISOP concentrations when compared to observations at both the Modiesha and Wanqingsha sites (Fig. S4 in the Supplement). This increment signifies a substantial diminution in the discrepancy between the modeled and observed concentrations attributable to UGS-BVOC emissions. Analogously, the integration of UGS-BVOC emissions yields a refinement in the estimation accuracy of ISOP concentrations at the Modiesha site, as evidenced by a reduced bias.
These findings reveal that ISOP concentrations are underestimated by 16.4 % and 34.7 % at the respective Modiesha and Wanqingsha sites when UGS-BVOCs are excluded, suggesting the important role of UGS-BVOC emissions in modeling. Moreover, numerous studies have highlighted the significant role of ISOP in O3 formation within the Pearl River Delta (PRD) region, including Guangzhou. For instance, Zheng et al. (2009) demonstrated that ISOP has the highest ozone formation potential among all VOCs. Therefore, incorporating UGS-BVOCs into ISOP concentration estimates is crucial for accurately modeling regional O3 levels.
Table 2The evaluation results for the monthly mean ISOP concentrations. The “Gdef_N”, “Gdef_Y”, “Ghr_N”, and “Ghr_Y” columns show the various metrics from comparing the hourly observation and simulation values during September 2017 for the Modiesha site and from 7 to 30 September 2017 for the Wanqingsha site.
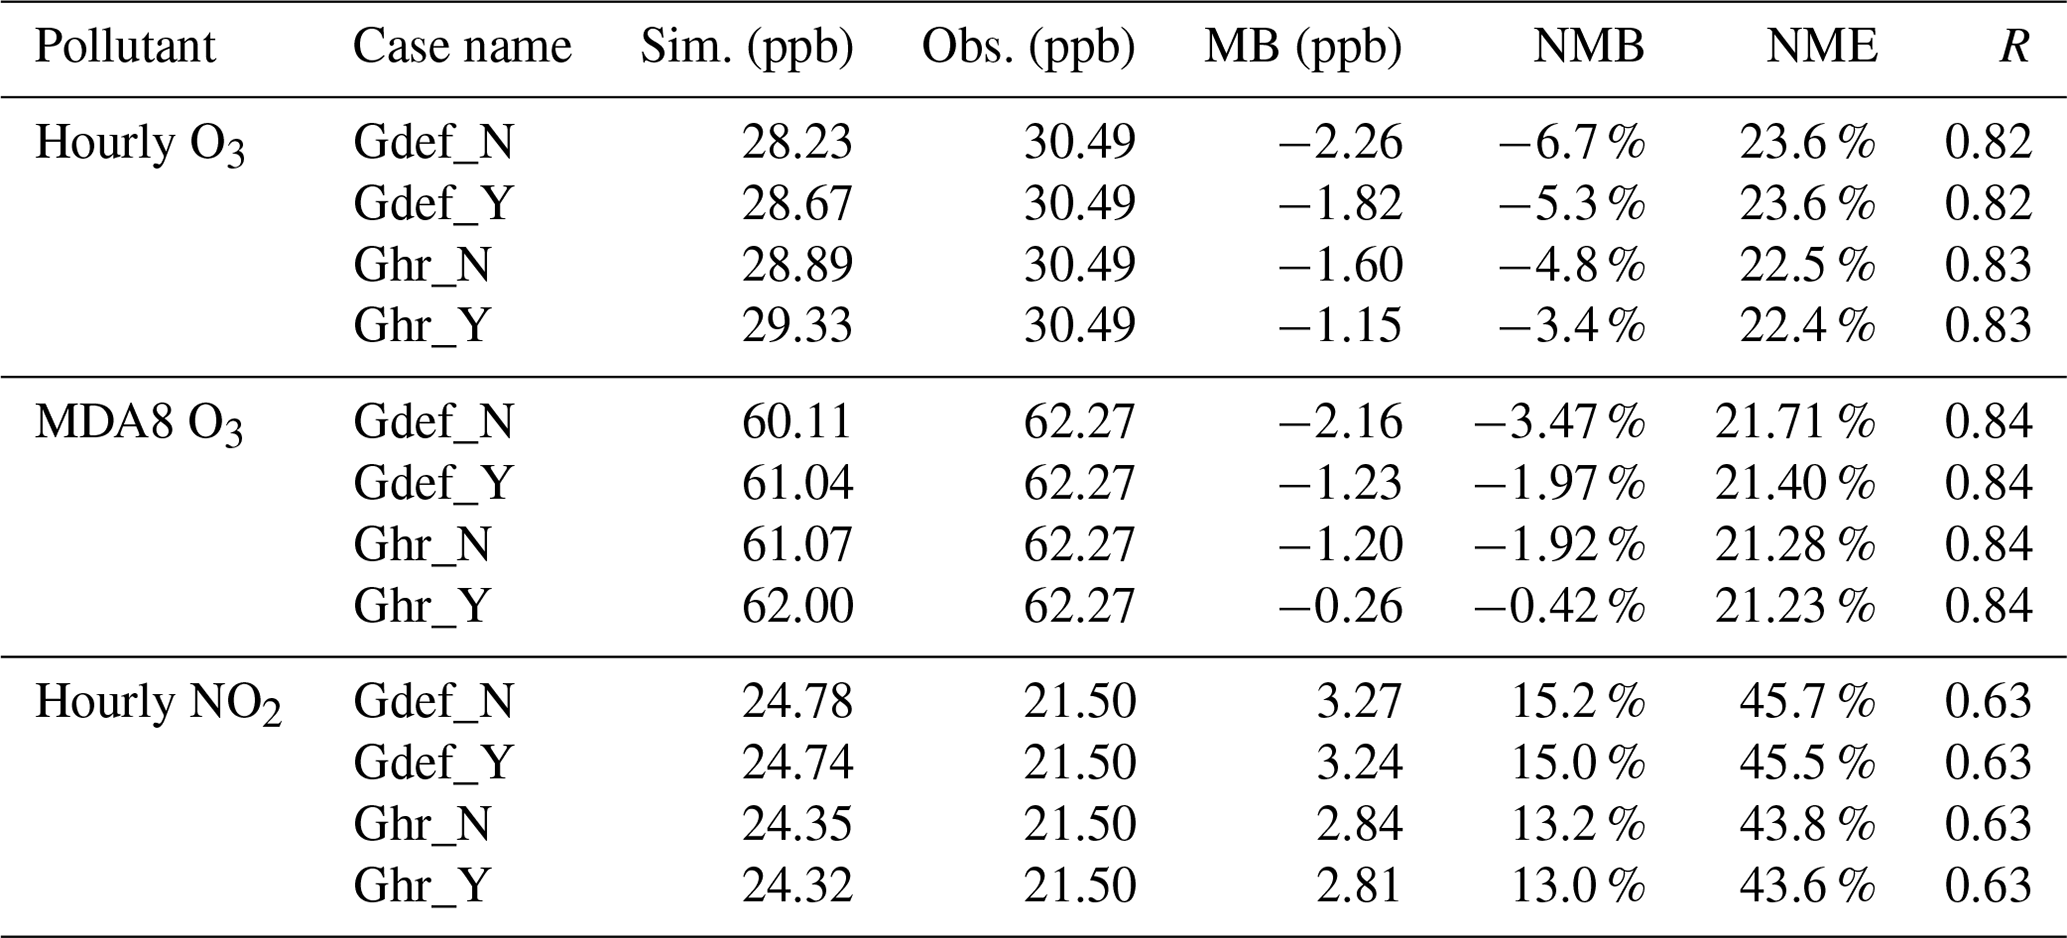
Additionally, various statistical metrics were used to assess the performance of the hourly O3, MDA8 (maximum daily 8 h average) O3, and NO2 concentrations from the CMAQ simulation (Emery et al., 2017). These metrics comprise the correlation coefficient (R), normalized mean bias (NMB), and normalized mean error (NME). The formulas for these metrics are listed in Table S3 in the Supplement. As shown in Table 3, the modeling performance for all cases is reasonable, albeit with some degree of underestimation. Despite these discrepancies, the model demonstrates sufficient reliability and can be effectively used in the subsequent study. Meanwhile, the mean bias (MB) values of MDA8 O3 across various cases indicate a substantial improvement in the CMAQ simulation when UGS-BVOC, UGS-LUCC, and their combined effects are considered. Specifically, the MB values of MDA8 O3 decrease from −2.16 ppb in the Gdef_N case to −0.26 ppb in the Ghr_Y case, demonstrating that incorporating UGS-BVOC, UGS-LUCC, and their combined effects can enhance the accuracy of predicted daytime O3 concentrations. In addition, we also evaluate the simulation performance for NO2 in each case, and the results suggest that all models have R values above 0.63 and that, while there is some overestimation, the NMB is 15.0 %, 15.2 %, 13.0 %, and 13.2 % for Gdef_N, Gdef_Y, Ghr_N, and Ghr_Y, respectively. It should be emphasized that integrating UGS-BVOC into the model can slightly improve the accuracy of NO2 predictions, reducing the MB from 3.27 to 3.24 ppb and from 2.84 to 2.81 ppb for the Gdef and Ghr cases, respectively. The improvement in NO2 prediction is attributed to the inclusion of UGS-BVOC emissions in the CMAQ model, which enhances NO2 involvement in O3 formation. This process leads to lower simulated NO2 concentrations, reducing the MBs compared to observations.
Table 3Evaluation results of the simulated monthly mean hourly O3, MDA8 O3, and hourly NO2 mixing ratios for each case during September 2017.
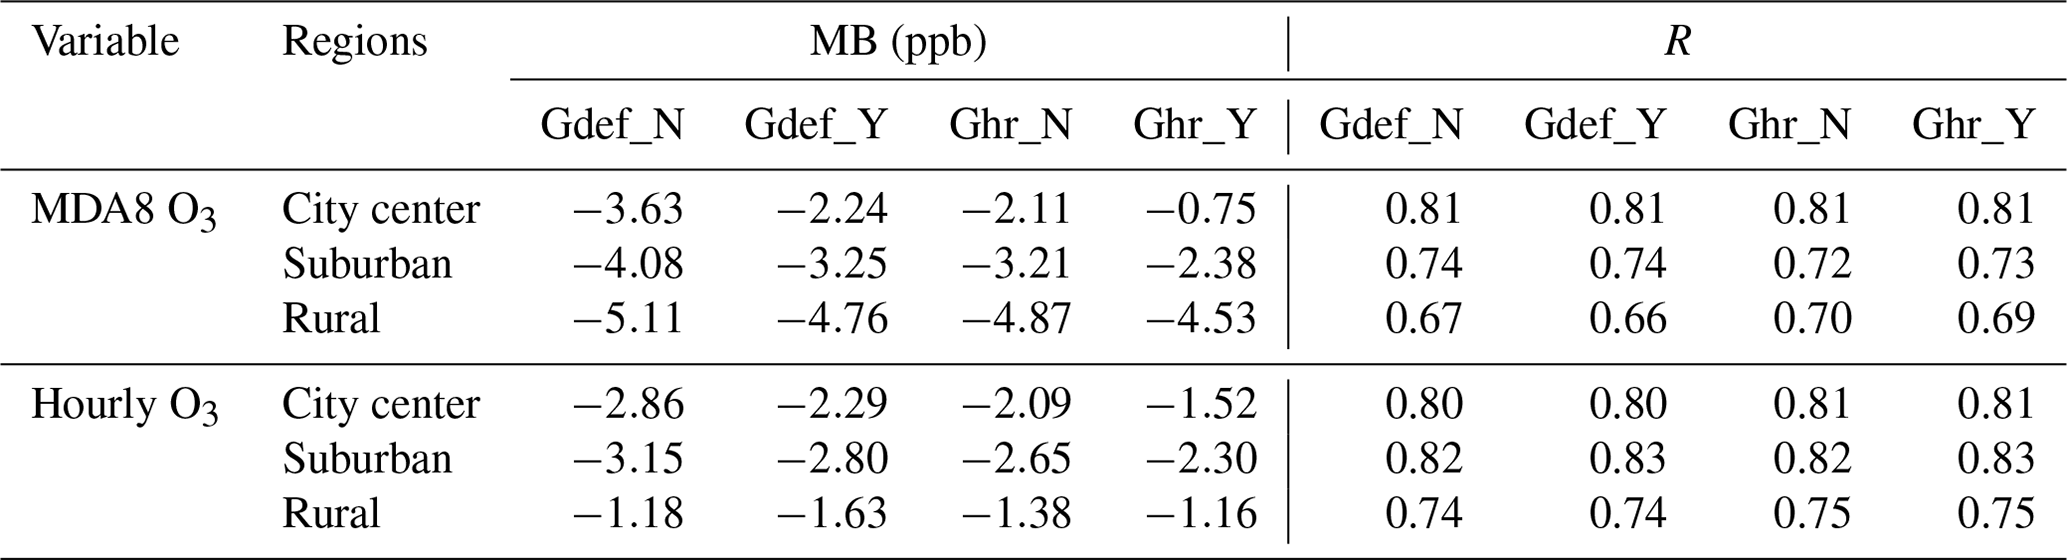
In terms of O3, UGS-BVOC emissions, UGS-LUCC, and their combined effects show differing performance in various regions (Table 4). These results indicate that the inclusion of UGS-BVOC emissions significantly influences MDA8 O3 and hourly O3 concentrations in the city center region, and this effect, primarily observed when comparing the Gdef_Y with Gdef_N and Ghr_Y with Ghr_N cases, is largely due to the VOC-limited areas prevalent in Guangzhou (He et al., 2024). By integrating UGS-BVOC emissions and UGS-LUCC into the models (comparing the Ghr_Y and Gdef_N cases), the MB values of MDA8 O3 and hourly O3 in all regions, including a notable improvement in the city center region from −3.63 to −0.75 and from −2.86 to −1.52 ppb, respectively, are reduced. Additionally, UGS-BVOC emissions slightly enhance the R values of MDA8 O3 and hourly O3 in the city center and suburban regions, indicating a more accurate daytime trend and diurnal cycle representation, respectively. The UGS-LUCC effects, as seen when comparing the Ghr_N and Gdef_N cases, also greatly improve model biases and the combined effects of both UGS-BVOC and UGS-LUCC (comparing the Ghr_Y and Gdef_N cases), substantially ameliorating model biases in the city center and suburban regions.
Table 4Evaluation results of simulated monthly mean hourly O3 and MDA8 O3 mixing ratios in the city center, suburban areas, and rural areas for each case during September 2017.
3.2 Estimation of UGS-BVOC emissions under different land use covers
This study comprehensively summarizes UGS-BVOC emissions across various species for all regions in Guangzhou city in September. Given that the variances in UGS-BVOC emissions due to different land use covers are relatively minor, Table 5 presents emissions driven by the default land use cover. For a detailed breakdown of emissions attributable to varied land use covers, refer to Table S4 in the Supplement. A review of the data reveals that TERP and ISOP rank as the species with the highest emissions, with respective proportions of 20.46 % and 31.91 % in this study, aligning with the findings of previous work (Cao et al., 2022; Guenther et al., 2012). Furthermore, Table 5 reveals that UGS-BVOC emissions in Guangzhou amounted to 666 Gg () in September, with ISOP and TERP contributing remarkably to the total UGS-BVOC emissions. In comparison to anthropogenic VOC (AVOC) and BVOC emissions, UGS-BVOC emissions account for approximately 33.45 % of the emissions in the city center region. Regionally, the suburban area registered the highest UGS-BVOC emissions in Guangzhou, peaking at 367 Gg. This was followed closely by the rural and city center regions, recording emissions of 174 and 126 Gg, respectively.
Table 5Summary of UGS-BVOC emissions in Guangzhou city in September 2017 by default land use cover.
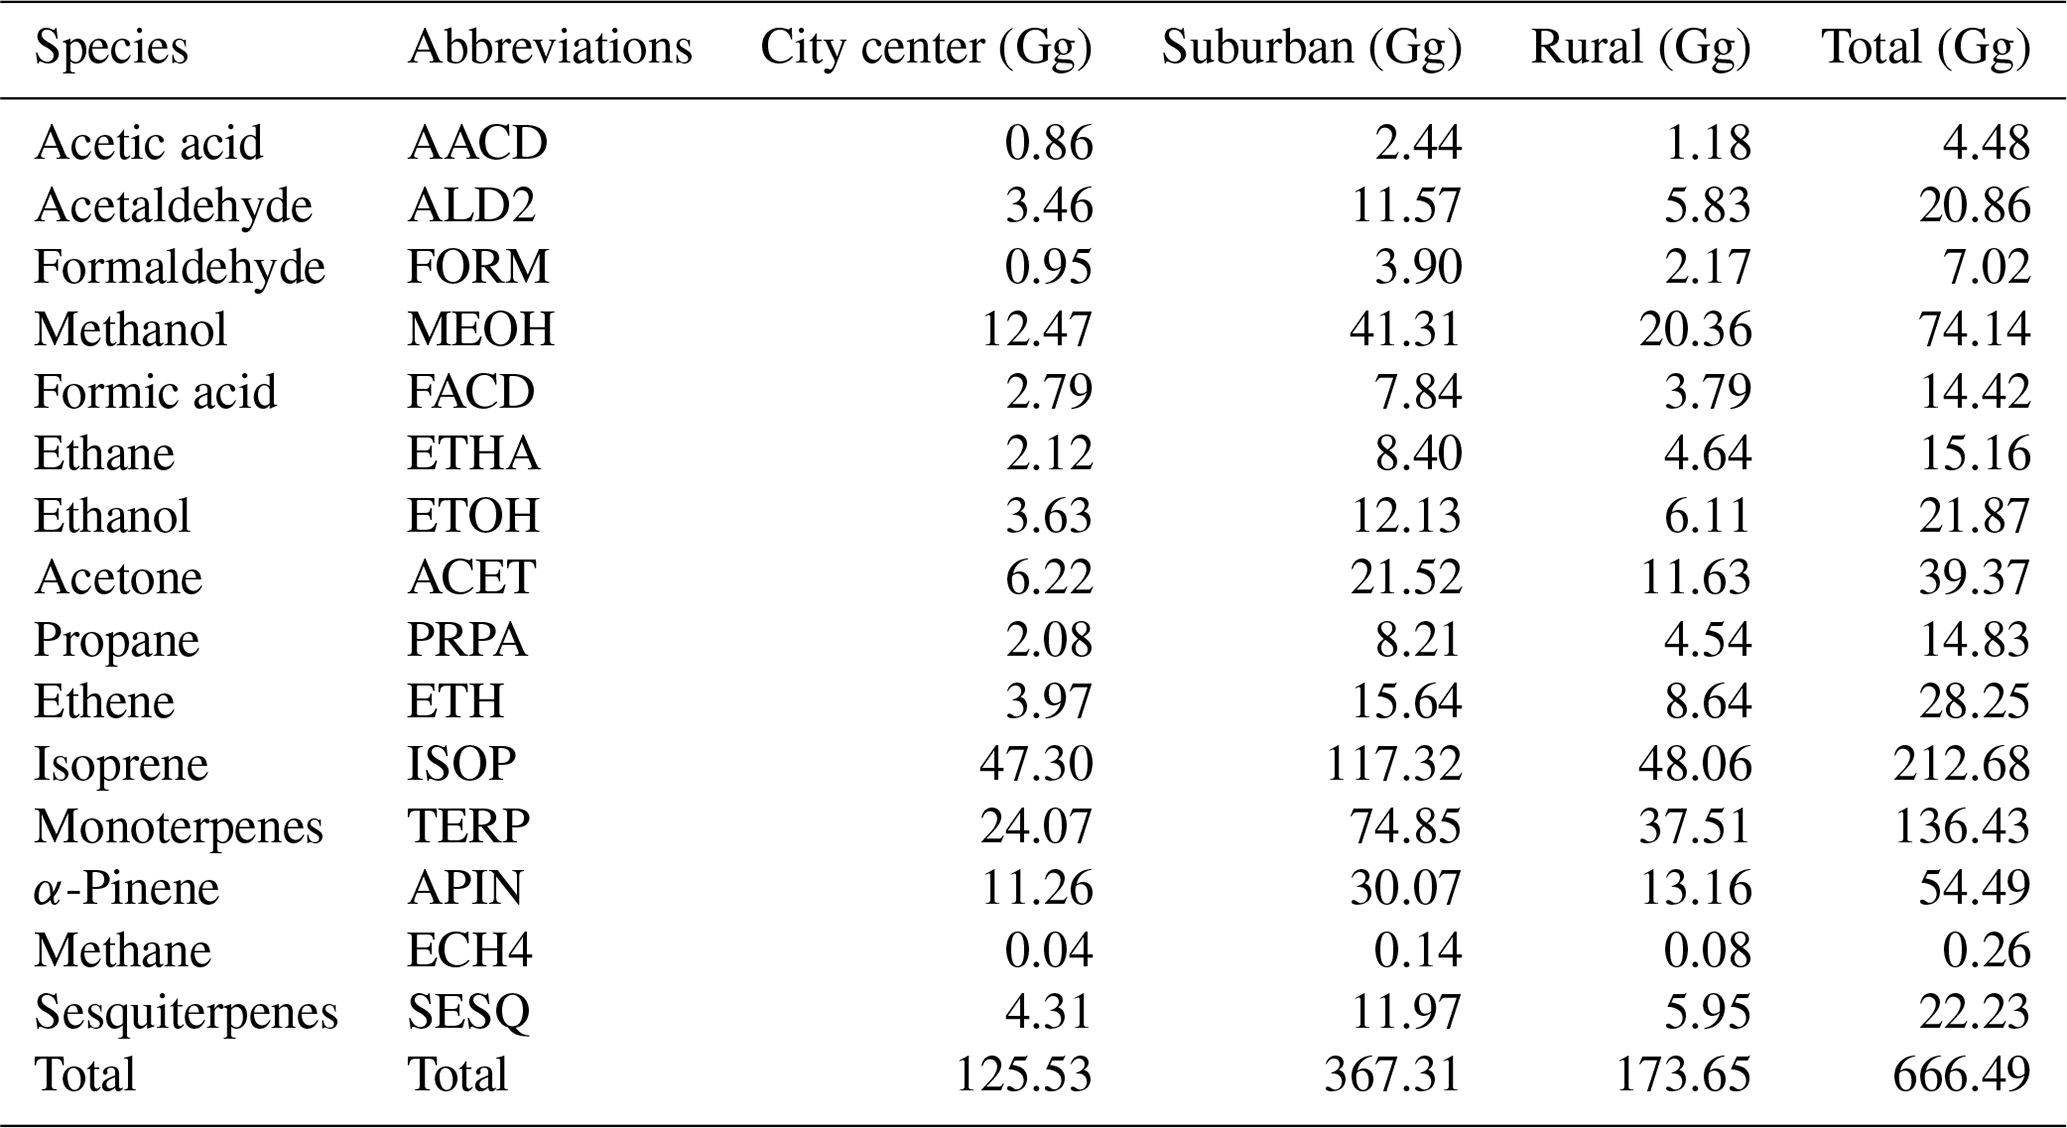
Figure 2a provides a detailed illustration of UGS-BVOC emissions across various regions in Guangzhou city, driven by default land use cover data, and compares these with the estimates derived from high-resolution land use cover data; this shows that the suburban region exhibits the highest UGS-BVOC emissions among the three studied regions, totaling 367.31 Gg. This predominance is linked to the larger extent of UGSs in the suburban region, as depicted in Fig. 3a, while the emissions in the city center and rural regions are reported at 125.53 and 173.65 Gg, respectively. Moreover, UGS-LUCC is instrumental in modulating BVOC emissions, leading to an uptick in the city center and rural regions and precipitating a decline in the suburban region. Notably, a slight (0.05 %) increase in solar radiation (SOL_RAD in Fig. 2c), attributable to a reduced urban fraction in the Ghr dataset, results in augmented solar exposure. Concurrently, a marginal (0.02 %) reduction in surface temperature (SFC_TMP in Fig. 2d), facilitated by increased vegetation albedo cooling effects, underpins the decrease in UGS-BVOC emissions within suburban regions. This phenomenon underscores the critical role of lowered SFC_TMP – driven by vegetation's higher albedo – in curtailing emissions stemming from UGS-LUCC. Temperature-dependent BVOC emissions are among the well-known key temperature-dependent mechanisms influencing ozone levels, alongside other processes, including changes in chemical reaction rates, soil NOx emissions, dry deposition, and PAN (peroxyacetyl nitrate) decomposition, as demonstrated in Li et al. (2024). Moreover, in the city center context, the diminished urban fraction enhances SOL_RAD and SFC_TMP, promoting higher emissions, a trend mirrored to a lesser extent in the rural region following the update of land use cover data to Ghr. Figure 2b offers a clear depiction of the proportion of UGS-BVOC emissions relative to non-UGS area BVOC emissions in each region of Guangzhou city; this shows that UGS-BVOC emissions in the city center area constitute 57.34 % of the total BVOC emissions in this region because of the larger urban proportions in the city center (Fig. 3), while the UGS-BVOC emission proportions in suburban and rural areas are 19.44 % and 1.86 %, respectively. This indicates a significant contribution of UGS-BVOC emissions in the city center region. Furthermore, when examining the relative differences in the BVOC emissions resulting from various land use covers across the city, the changes are found to be minimal, which suggests that meteorological alterations from land use cover do not majorly influence the proportion of UGS-BVOC emissions emanating from Guangzhou. Thus, factors other than land use changes might be more critical in shaping the distribution and intensity of UGS-BVOC emissions in urban settings.
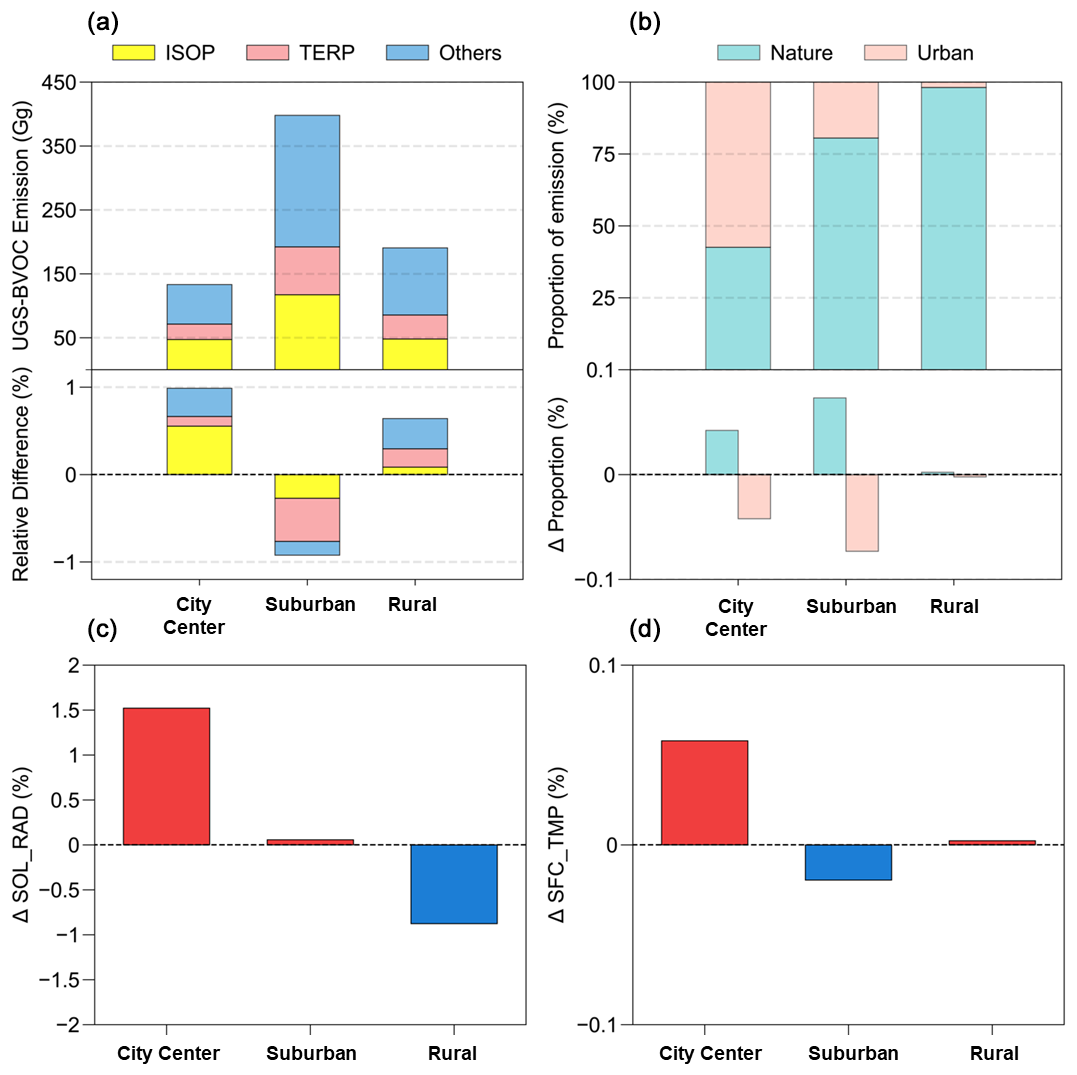
Figure 2(a) The UGS-BVOC emissions of each species (upper panel) and the relative difference (Ghr − Gdef) from various land use covers (lower panel), (b) the proportion of the BVOC emissions from urban and natural areas (upper panel) and the relative proportion difference (Ghr − Gdef) from various land use covers (lower panel), and the relative difference in (c) solar radiation and (d) surface temperature in each region driven by various land use cover datasets. All values in these figures are from September 2017.
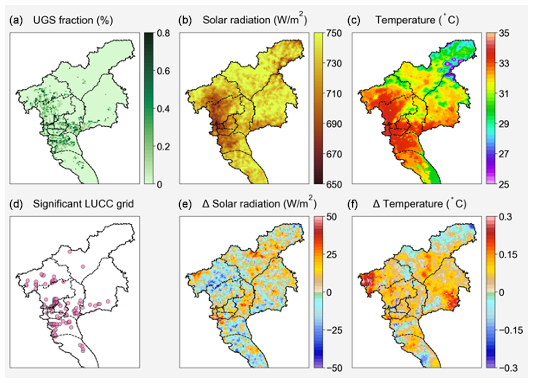
Figure 3The (a) UGS fraction map and (b, c) the meteorological fields during September 2017 from the Ghr_N case. Panel (d) is the grid locations where the land use experienced significant changes, while panels (e) and (f) are the respective differences in solar radiation and temperature during the analysis period (1–30 September 2017) for various land use cover data (Ghr − Gdef).
Figure 4a and b collectively highlight the patterns of UGS-BVOC emissions across different land use covers, pinpointing the emission hot spots in the city center and suburban regions, which effectively illustrate how land use cover influences UGS-BVOC emissions in various parts of the city. Additionally, Fig. 4c shows the disparities in the UGS-BVOC emissions attributed to different land use cover datasets. It reveals that the variations in emissions are predominantly concentrated in the identified hot spots. Moreover, Fig. 4c indicates that employing high-resolution land cover data typically results in marginally higher estimates of UGS-BVOC emissions, with an increase ranging between 0.8 % and 2.9 %. Figure 3e and f illustrate that, despite a marginal reduction in solar radiation within the city center region, a minor temperature elevation modestly boosts UGS-BVOC emissions, thereby inferring that the increase in temperature from UGS-LUCC causes the rise in UGS-BVOC emissions.
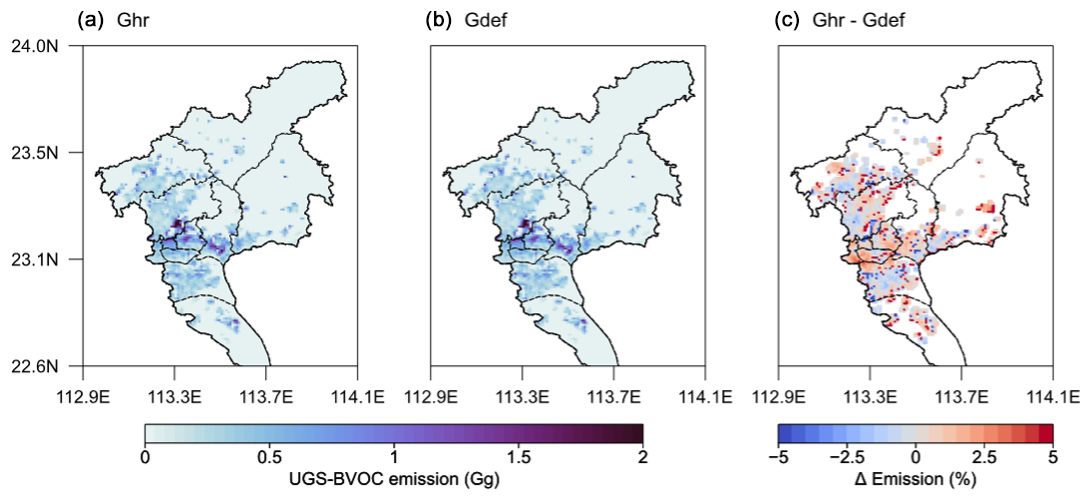
Figure 4The UGS-BVOC emission maps in September 2017 for (a) default land use cover and (b) high-resolution land use cover as well as (c) the differences in various UGS-BVOC emissions.
As illustrated in Fig. S1 in the Supplement, UGSs in Guangzhou comprise three primary types of vegetation: evergreen broadleaf forests, which are composed of evergreen broadleaf trees (EBTs); cropland; and grasslands. This classification has enabled a more nuanced understanding of how different types of UGS vegetation influence UGS-BVOC emissions. Figure 5 reveals that EBTs predominate the urban vegetation landscape in Guangzhou and are associated with higher rates of UGS-BVOC emissions as their coverage increases. Conversely, an increase in the proportion of cropland correlates with reduced UGS-BVOC emissions, highlighting its minimal contribution to the overall UGS-BVOC emissions in Guangzhou. Grasslands exhibit a variable impact on BVOC emissions: when they constitute over 80 % of the UGS, the emission rates are relatively low; however, when grassland coverage ranges between 60 % and 80 %, BVOC emissions surpass those of cropland within the same percentage range. Overall, EBTs emerge as the primary contributors to UGS-BVOC emissions, with grasslands and croplands making lesser contributions.
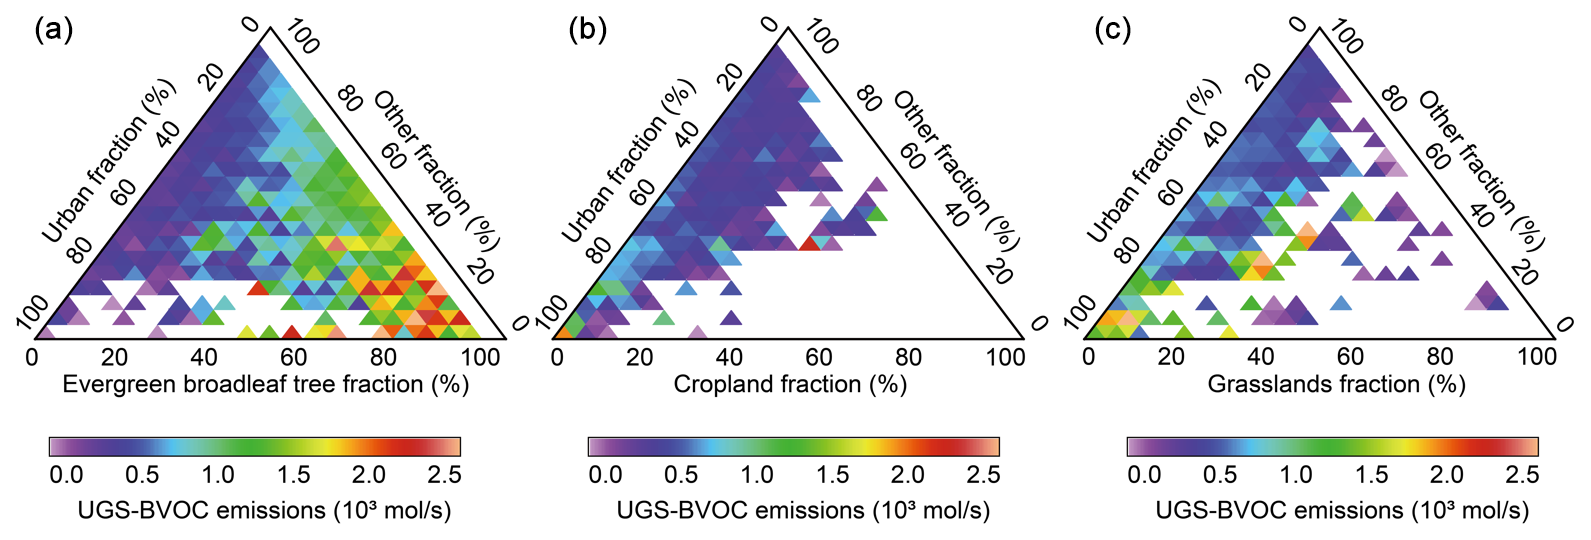
Figure 5Ternary heat map for various vegetation in UGSs; the UGS-BVOC emission rate is shown, and the invalid value represents no UGS-BVOC emissions.
In addition to the proportion of UGSs, UGS-BVOC emissions in Guangzhou city are significantly influenced by meteorological factors such as surface temperature and solar radiation (Guenther et al., 2020). To elucidate the spatial heterogeneity of UGS-BVOC emissions, this study analyzes variations in these key factors. The simulation results shown in Fig. 3a illustrate the distribution pattern of UGSs, which are predominantly located in the city center. These areas contribute a higher percentage of UGS-BVOC emissions compared to other regions. Interestingly, as indicated in Fig. 3b, the city center region receives less solar radiation than other regions, likely due to the shading effect of urban canopies. Conversely, the city center region exhibits elevated temperatures attributable to the urban heat island effect, leading to an increase in UGS-BVOC emissions. Thus, while the distribution of UGSs contributes to the variation in UGS-BVOC emissions across different regions, the more significant factor is the enhanced UGS-BVOC emission due to higher temperatures in densely urbanized areas. The spatial dynamics of the UGS-BVOC emissions are significantly shaped by two key meteorological factors: solar radiation and surface temperature. These elements independently play a crucial role in determining both the spatial pattern and the intensity of the UGS-BVOC emissions. Solar radiation directly influences the rate of photosynthesis and, consequently, the production of BVOCs, while temperature affects not only the physiological processes of vegetation but also the volatilization rate of these compounds (Fuhrer et al., 1997; Lombardozzi et al., 2015). The intricate interplay between these factors leads to spatial variations in the UGS-BVOC emissions, with areas receiving higher solar radiation and experiencing warmer temperatures typically exhibiting more intense BVOC emissions.
This section has conclusively demonstrated that, during the high-O3 season (September), the contribution of UGS-BVOC in Guangzhou is substantial and cannot be overlooked; moreover, a notable finding is the strong spatial heterogeneity in these emissions across the city. The analysis also highlights the fact that high-resolution land use cover data increase the estimation of UGS-BVOC emissions in the city center region.
3.3 Impact of UGS-LUCC and UGS-BVOC emissions on ozone concentrations
The study evaluates the effects of UGS-BVOC emissions and UGS-LUCC on MDA8 O3 concentrations in Guangzhou, both individually and in combination. Figure 6 presents the absolute contributions from various cases, while the relative differences are shown in Fig. S5 in the Supplement. The analysis reveals that UGS-BVOC emissions alone (Fig. 6a) primarily affect the city center region, increasing MDA8 O3 concentrations by 1.0–1.4 ppb (), which incrementally aligns with findings from Los Angeles, where Schlaerth et al. (2023) reported a contribution of 1.2 ppb from UGS-BVOC to urban MDA8 O3 levels. Wang et al. (2019) reported that VOC levels can be highly sensitive in VOC-limited regions, where sufficient NOx concentrations mean that even a small disturbance in VOCs can cause significant changes in O3 concentrations. Similarly, metropolitan areas, such as Guangzhou, often experience VOC-limited conditions or NOx saturation (Wang et al., 2019c). Consequently, the UGS-BVOC case results in an overall increase in MDA8 O3. In contrast, the sole impact of the UGS-LUCC effect (Fig. 6b) is more extensive, influencing both the city center and suburban regions and resulting in a general increase of approximately 1.1–2.0 ppb () in MDA8 O3 levels, which can be attributed to the higher temperature and solar radiation (Fig. 3e and f). In Guangzhou, the transformation of urban surfaces to natural vegetation due to UGS-LUCC results in lower albedo and, consequently, lower temperatures. However, this change also reduces the height of the urban canopy, diminishing its shading effects with respect to solar radiation and, paradoxically, leading to higher temperatures in some regions. Therefore, considering the UGS-LUCC effect, the decreased urban canopy height could lead to elevated temperatures, thereby potentially increasing ozone production. However, the most significant results emerge under the combined effect of UGS-BVOC and UGS-LUCC (Fig. 6c), where a substantial increase in the O3 concentration, ranging from 1.7 to 3.7 ppb (), is observed across both the city center and suburban regions. The observed increase suggests a potentially significant influence of UGS-BVOC emissions and UGS-LUCC on ozone levels, indicating that these factors may play an important role in ozone pollution research and should be carefully considered. This finding underscores the essential role that integrated urban planning and environmental management play in controlling ozone pollution within metropolitan regions. By considering UGS-BVOC emissions in air quality models and management plans, managers can make more informed decisions to mitigate ozone levels and improve regional air quality.
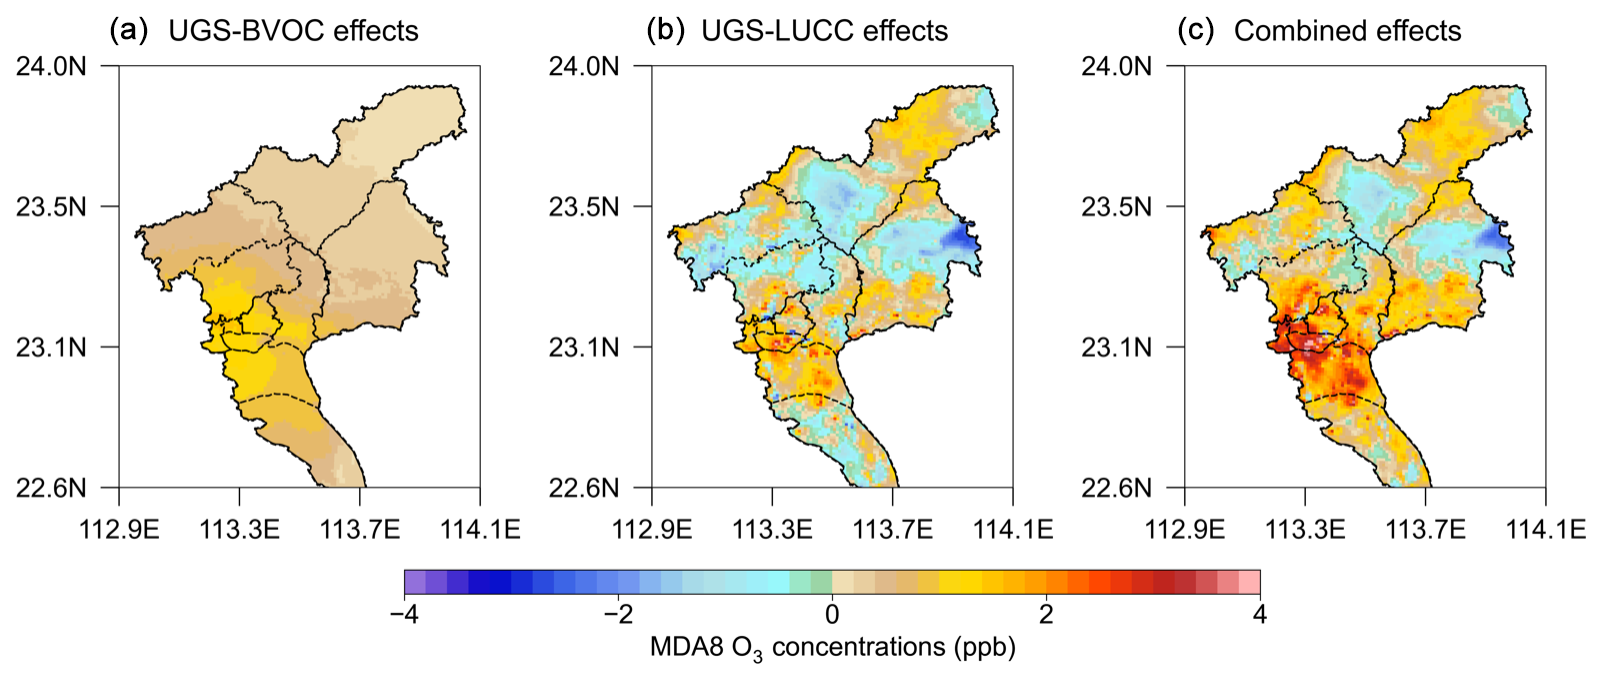
Figure 6Maps of UGS-BVOC effects (a), LUCC effects (b), and combined effects (c) in MDA8 O3. Each map shows the difference in average MDA8 O3 concentrations for each case (Gdef_Y, Ghr_N, and Ghr_Y) relative to the Gdef_N case during September 2017.
Previous studies have established that O3 episodes are often accompanied by high temperatures and intense solar radiation, conditions that can exacerbate UGS-BVOC emissions, critically affecting air quality model performance (Shan et al., 2023; Soleimanian et al., 2023). In this study, an O3 episode is defined as a period of 2 or more consecutive days with MDA8 O3 concentrations exceeding 160 µg m−3 (∼80 ppb) (Wu et al., 2020). Our analysis, as depicted in Fig. 7a, identified two such episodes in Guangzhou city during September: the first from 16 to 21 September and the second from 26 to 28 September. The Gdef_N case successfully captures these episodes but tends to underestimate MDA8 O3 during these episodes. Figure 7b and c highlight a notable reduction in wind speed during both episodes, particularly during the second episode. Despite some diffusion enhancement due to an increased PBLH with rising surface temperatures (Fig. S6 in the Supplement), the surface temperature hike concurrently fosters O3 production. Consequently, the episodes were dominated by a combination of temperature increases, which elevated O3 concentrations, and wind speed decreases. Furthermore, Fig. 7c illustrates that there was a significant spike in carbon monoxide (CO) concentrations during these episodes. CO, often used as a tracer in studies, indicates the worsening of diffusion conditions, leading to the accumulation of NO2 – a primary O3 precursor – thereby culminating in O3 episodes in Guangzhou city.
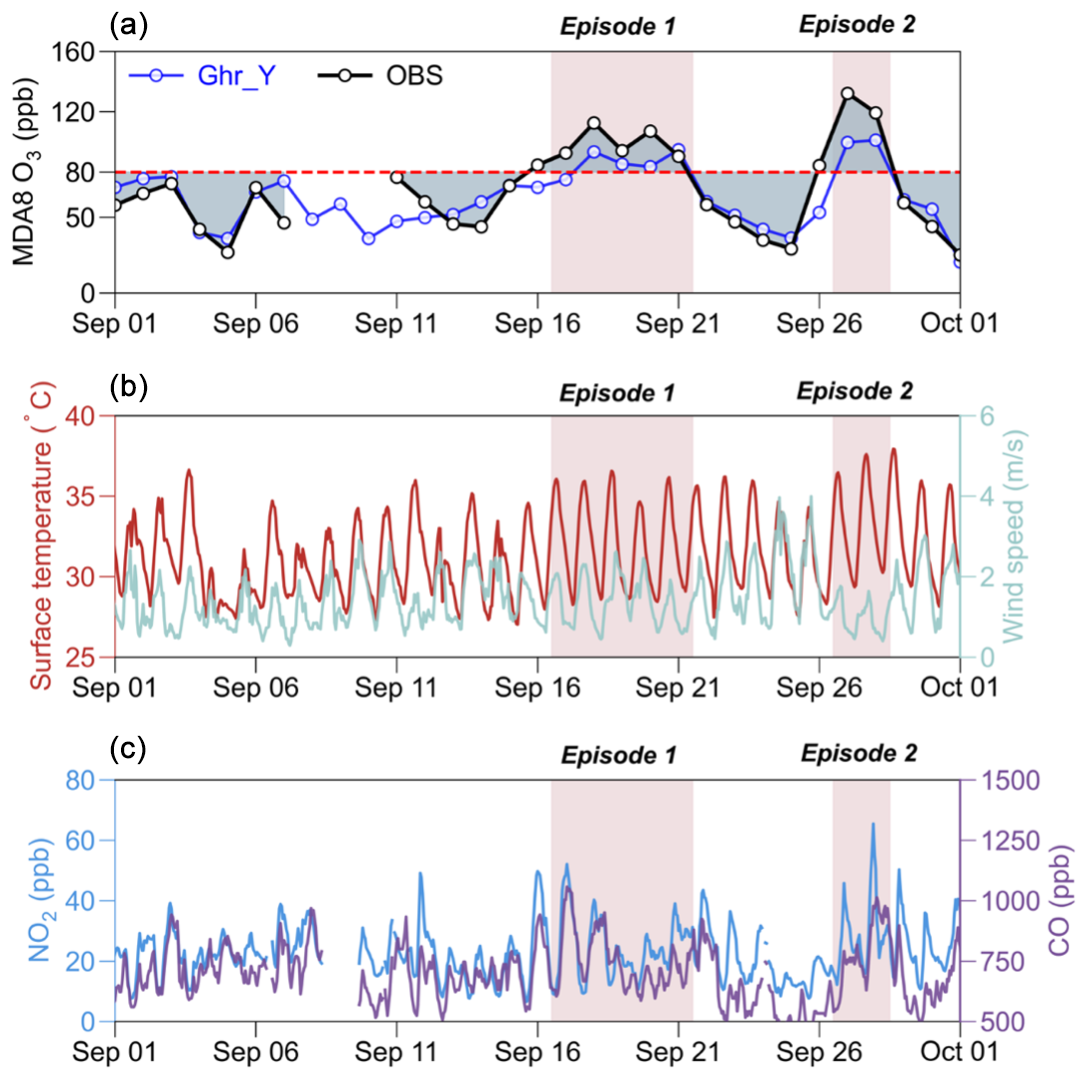
Figure 7Panel (a) shows the comparison, for September 2017, between the average values from simulation result grids that have air quality stations produced by the Gdef_N case and the average observation values for MDA8 O3. Panel (b) presents the meteorological fields from the average values of the simulation result grids, which have the same locations as the air quality stations. Panel (c) presents the observed average values for NO2 and CO concentrations from all air quality stations.
Figure 8 presents the assessment of O3 episode simulations. The Gdef_N case initially underestimated O3 concentrations, leading to an evaluation of improvements using three cases: UGS-LUCC (Ghr_N), UGS-BVOC emissions (Gdef_Y), and their combined effects (Ghr_Y). The analysis, focusing on the city center, suburban, and rural stations, reveals that all cases tend to underestimate O3 levels between both episodes. However, incorporating UGS-BVOC emissions into the model results in a notable increase in mean simulated MDA8 O3 concentrations, particularly in the city center and suburban regions. For the sites in the city center region, the mean simulated MDA8 O3 increased by +1.6 and +2.9 ppb (+1.8 % and +3.3 %, respectively), while for suburban sites, the increase was +1.0 ppb (+1.1 %) and +1.6 ppb (+1.9 %), with rural sites experiencing a smaller increase of only +0.5 ppb (+0.5 %) and +0.5 ppb (+0.7 %). This trend indicates a more pronounced impact in the city center and suburban regions compared to the rural region. Notably, the influence of UGS-BVOC emissions on MDA8 O3 in Episode 2 (+2.9 ppb) was significantly greater than in Episode 1 (+1.6 ppb), suggesting that the meteorological conditions in Episode 2 were more conducive to UGS-BVOC emissions, particularly in the city center region, which is usually a VOC-limited area.
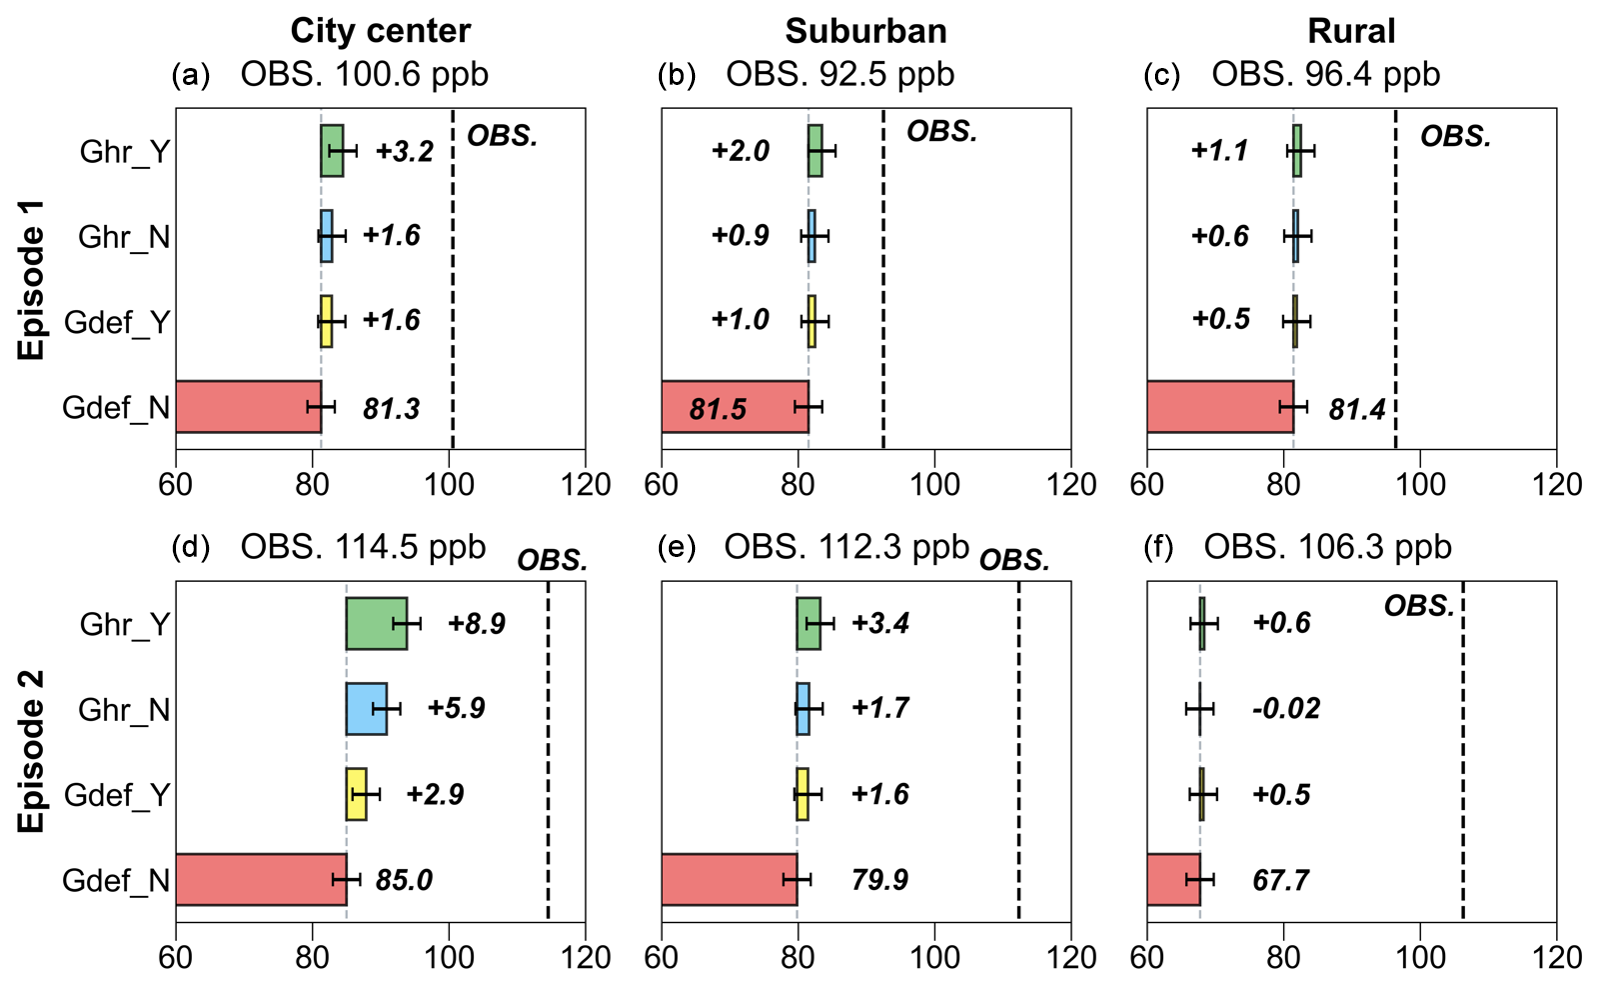
Figure 8Comparison of simulated versus observed mean MDA8 O3 concentrations across different cases for two episodes. The figure is organized into columns representing the city center (four sites), suburban (three sites), and rural (two sites) settings (columns 1–3, respectively) and rows indicating comparisons for Episode 1 and Episode 2 (rows 1 and 2, respectively).
In Episode 1, UGS-LUCC effects on O3 concentrations were comparable to those of UGS-BVOC emissions; however, in Episode 2, UGS-LUCC effects led to a near doubling of urban MDA8 O3, with an increase of 5.9 ppb (+6.48 %) compared to the UGS-BVOC emissions. This indicates that UGS-LUCC effects play a non-negligible role in O3 pollution studies, and the response to such changes under different meteorological conditions varies significantly. Furthermore, due to the limited proportion of UGSs in suburban and rural areas, the increased effect of UGSs on O3 is less pronounced in these regions and nearly negligible in Episode 2. While UGS-BVOC emissions alone have a modest effect on O3 concentrations, their impact can become significant when combined with the UGS-LUCC effects. For instance, the combined effects in the city center region increased by 3.2 ppb (+3.7 %) and 8.9 ppb (+10.0 %) during Episode 1 and Episode 2, respectively.
Figure 9 presents maps of each effect on MDA8 O3 in both episodes. The influence of UGS-BVOC emissions (Fig. 9a and d) on the MDA8 O3 concentration during Episode 1 and Episode 2 ranges from 0 to 2.0 and from 0 to 3.5 ppb, respectively, with the city center region witnessing the most significant impact. This variance can be primarily ascribed to the heightened temperatures during Episode 2 (Fig. 7b), which create conditions more conducive to ozone generation through UGS-BVOC emissions. Furthermore, the UGS-LUCC effect's maximal contribution to the urban MDA8 O3 levels could escalate to 2.2 ppb in Episode 1 and to 23.7 ppb in Episode 2, while the combined effects of UGS-LUCC and UGS-BVOC emissions are projected to enhance MDA8 O3 concentrations to 4.8 and 25.2 ppb for the respective episodes. This marked increase in the episodes' contributions can be linked to the differential responsiveness of land use data under various meteorological conditions. Notably, while the contribution from the UGS-BVOC effect during Episode 2 substantially exceeds that of Episode 1, the incremental impact of UGS-LUCC on the combined effect in Episode 2 is notably smaller than in Episode 1. This phenomenon indicates that the escalated UGS-BVOC emissions in Episode 2 may start to incrementally inhibit ozone production rates.
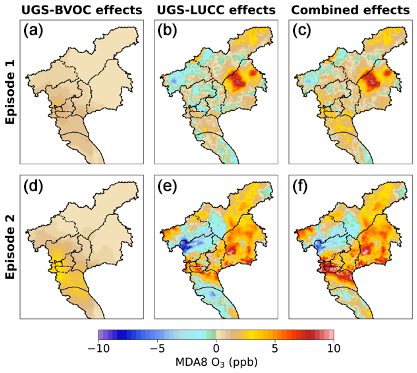
Figure 9The UGS-BVOC effects (a, d), the UGS-LUCC effects (b, e), and the combined effects (c, f) in Episode 1 and Episode 2, respectively.
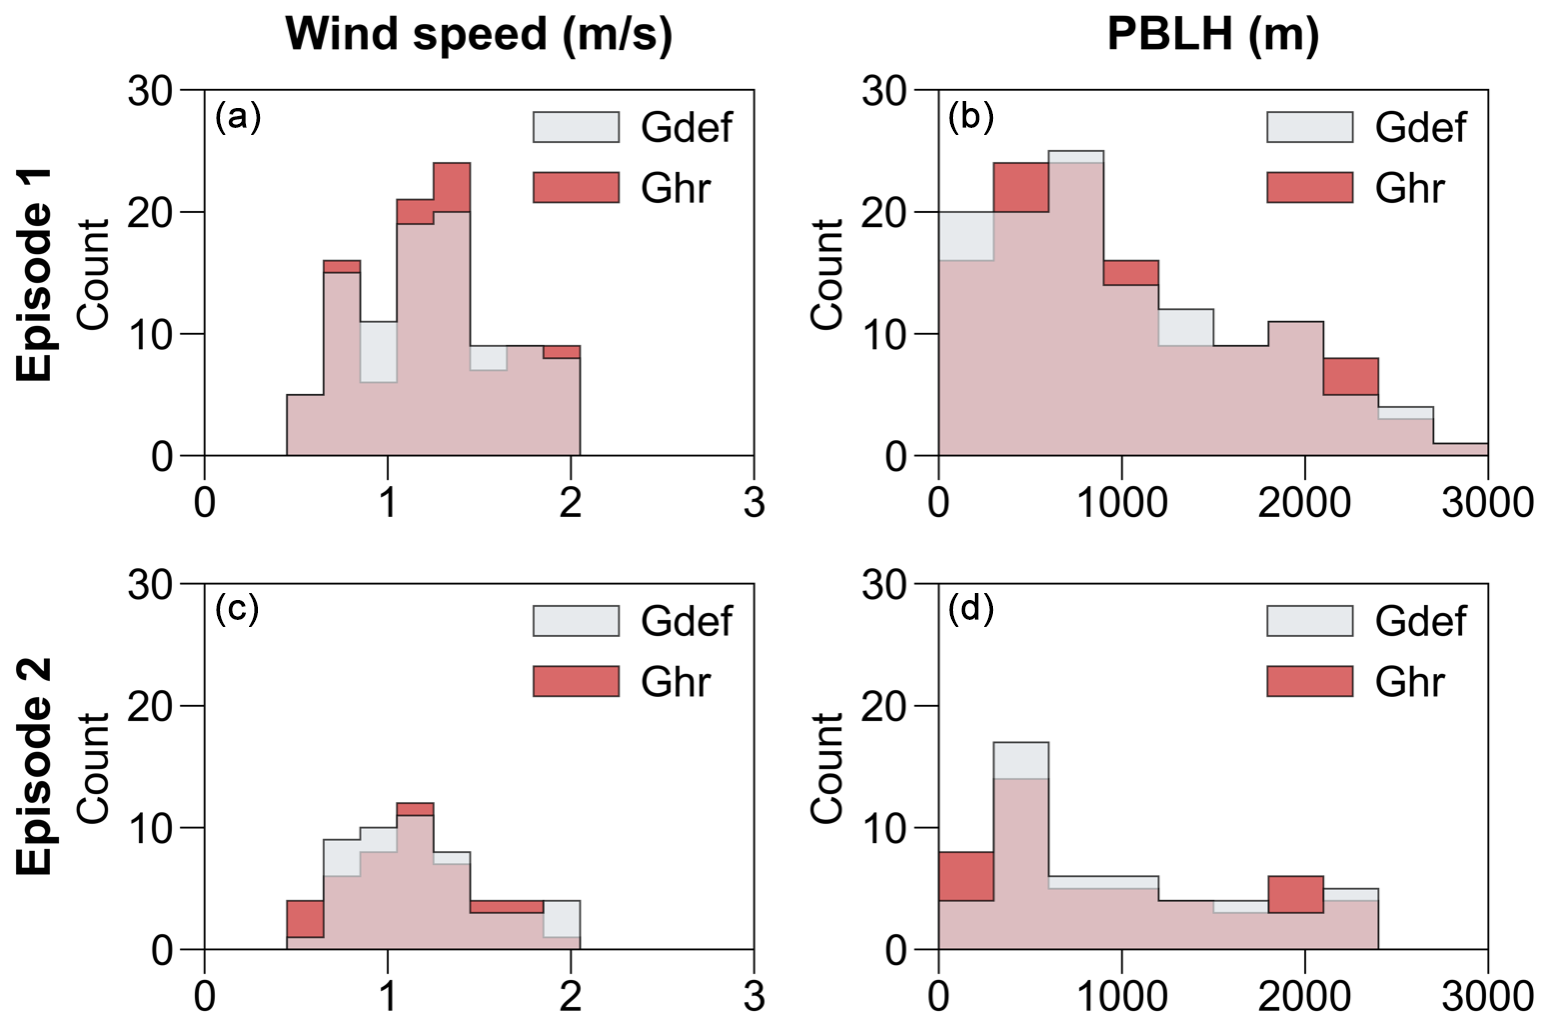
Figure 10The frequency of wind speed (column 1) and the PBLH (column 2) in Episode 1 (a, b) and Episode 2 (c, d) driven by different land use cover datasets.
Figure 8 reveals that both observed O3 episodes were primarily caused by reduced diffusion conditions. Notably, the impact of the UGS-LUCC effects varied significantly between the two episodes. Analysis of meteorological variables, specifically wind speed and the PBLH, which are crucial for diffusion, demonstrate distinct patterns. Figure 10 illustrates that UGS-LUCC effects led to a notable increase in the frequency of higher wind speeds (1.2–1.4 m s−1) and a simultaneous decrease in the frequency of lower wind speeds (0.9–1.1 m s−1) during Episode 1. This shift in the wind speed distribution suggests an overall increase in average wind speed due to the UGS-LUCC effects during this episode. In contrast, Episode 2 experiences a significant decrease in wind speed frequency of 0.7–1.1 m s−1, with an increase in the lower range of 0.5–0.7 m s−1. This suggests that UGS-LUCC effects further reduce the already low wind speeds in Episode 2. Concerning the PBLH, UGS-LUCC effects are observed to elevate the PBLH during Episode 1, which led to a decrease in the PBLH during Episode 2. Therefore, UGS-LUCC effects are markedly more pronounced in Episode 2 than in Episode 1, contributing to a more substantial alteration of the meteorological conditions affecting air dispersion and, consequently, O3 formation.
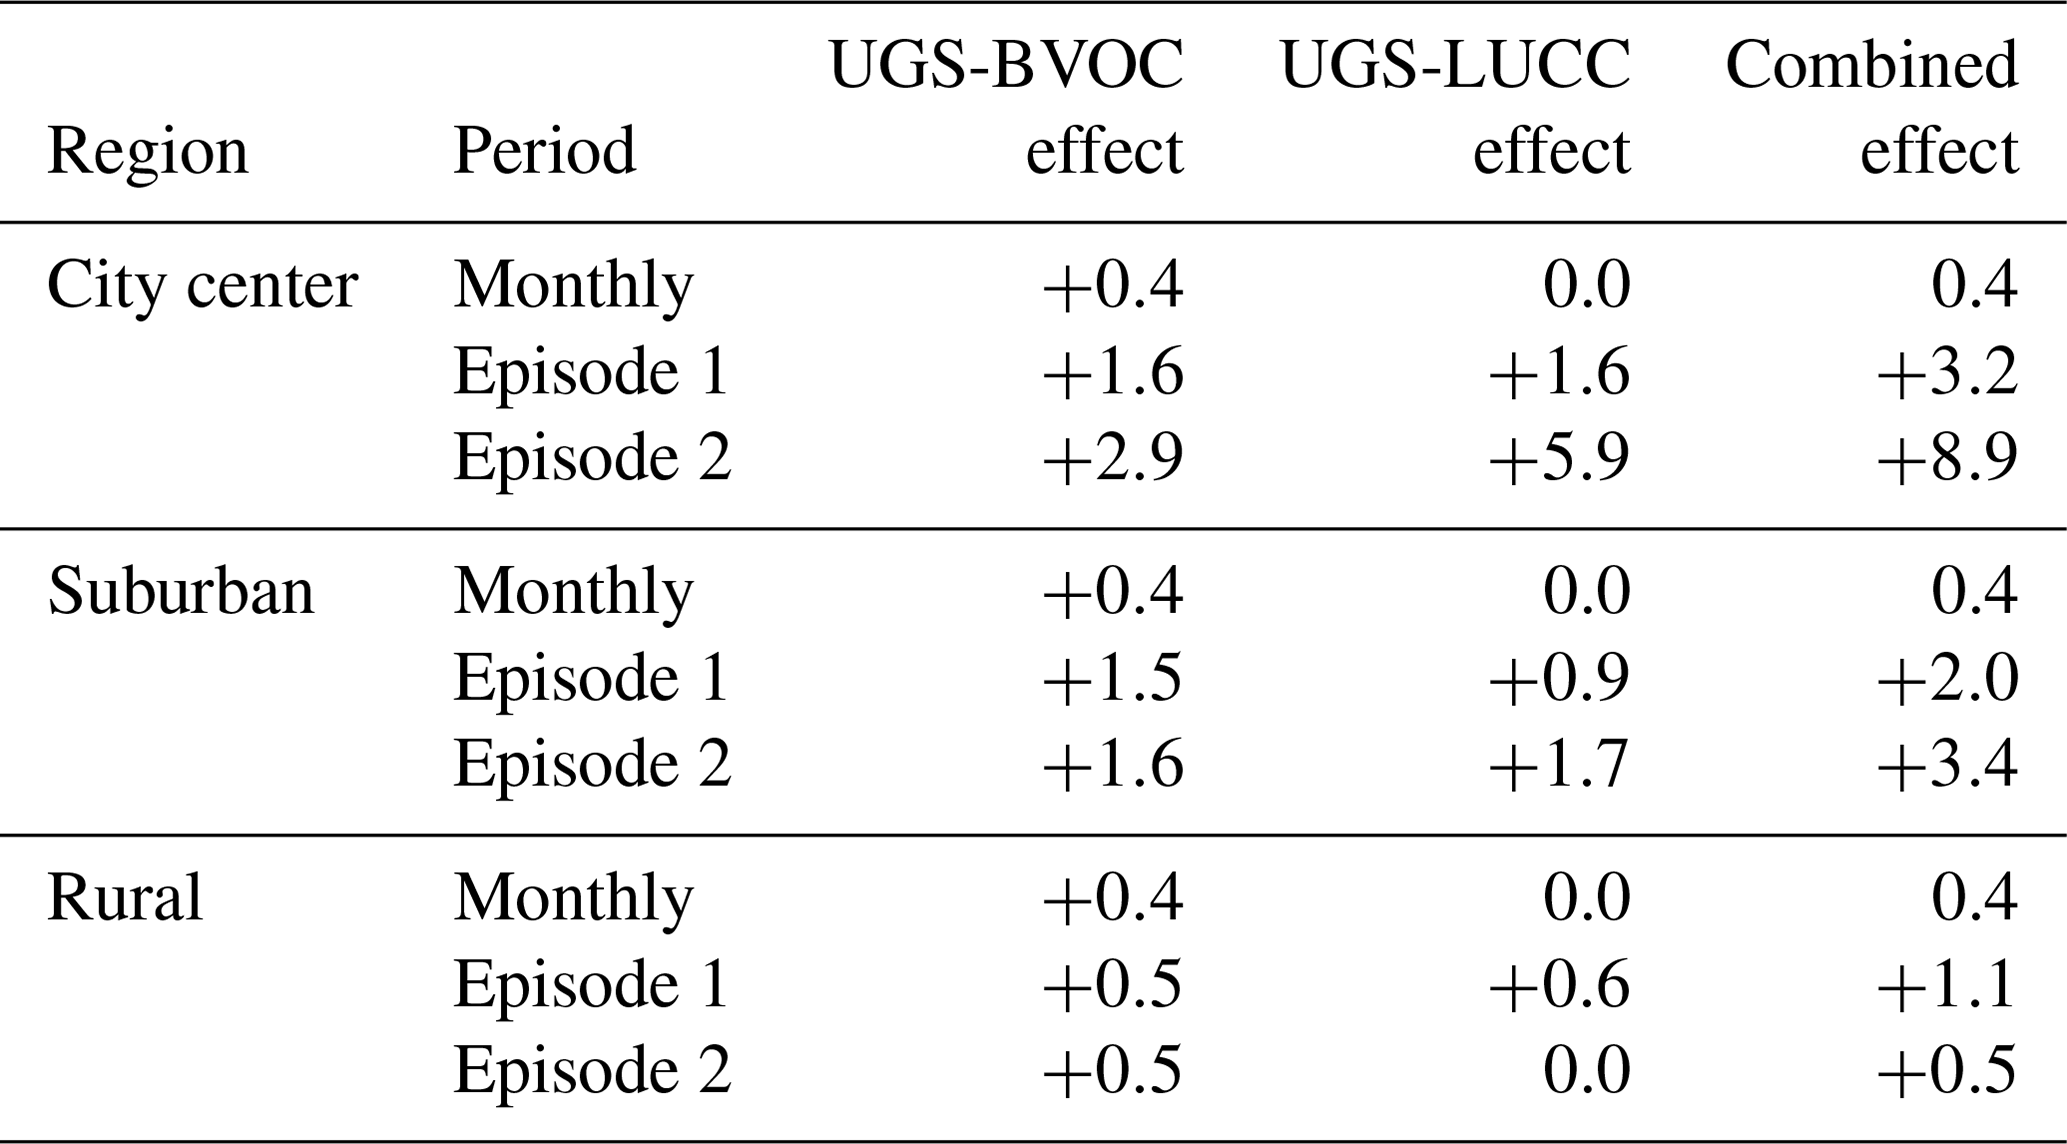
Table 6 presents the overall results for the impacts of UGS-LUCC and UGS-BVOC emissions on MDA8 O3 concentrations. The effects show slight variations across different regions during September, while the effects during the two episodes exhibit more significant changes. In the city center region, which shows the largest changes, the UGS-BVOC effect shows increases of +1.6 ppb in Episode 1 and of +5.9 ppb in Episode 2, indicating that the UGS-BVOC effects influence MDA8 O3 concentrations in the city center during ozone episodes, while their impact is minimal in suburban and rural regions. These results highlight the important effects of UGS-LUCC and UGS-BVOC emissions in urban areas, especially during O3 pollution periods.
Table 6Summary of average MDA8 O3 concentrations (ppb) for various effects during September 2017.
Rapid urbanization is accompanied by a higher frequency of ozone episodes. It has been increasingly recognized that UGSs can potentially exacerbate ozone pollution under specific conditions due to UGS-LUCC and UGS-BVOC emissions. Guangzhou, located in southern China and known as a pioneer city with respect to the Reform and Opening-up policy, has experienced rapid urbanization over the past 30 years, leading to increased challenges regarding ozone pollution. Despite efforts to reduce anthropogenic emissions, ozone episodes occur with relatively high frequency in the area. This study selected September 2017, a month with a high incidence of ozone episodes in Guangzhou, to (1) estimate UGS-BVOC emissions using the WRF-MEGAN model and (2) quantitatively assess the impact of UGS-LUCC, UGS-BVOC emissions, and their combined effects on two ozone episodes in September 2017 using the CMAQ model. The major findings of this work are as follows:
-
In September 2017, UGS-BVOC emissions in Guangzhou totaled 666 Gg, with ISOP and TERP as the major species, emitting 213 and 136 Gg, respectively. Spatially, UGS-BVOC emissions were predominantly located in the city center region, which was attributed to the more extensive distribution of UGSs in that area. The study also indicates that meteorological changes caused by UGS-LUCC do not significantly affect UGS-BVOC emissions. Instead, the formation of the emission spatial distribution and intensity is closely related to local surface temperature and solar radiation. This understanding underscores the importance of considering local solar radiation and temperature conditions when assessing and modeling the distribution of UGS-BVOC emissions, as they are pivotal in driving the spatial characteristics of these emissions.
-
Considering that the UGS-BVOC and UGS-LUCC effects can effectively mitigate the underestimation of surface ozone concentrations by regional air quality models, although other factors such as inaccuracies in emissions inventories, chemical mechanisms, and meteorological inputs may also contribute to these underestimations. For instance, incorporating UGS-BVOC emissions results in an increase in ISOP concentration from 0.29 to 0.35 ppb and from 0.23 to 0.29 ppb under different land use cases (Gdef and Ghr, respectively), compared to an observed concentration of 0.34 ppb. This significant enhancement in ISOP concentrations – the predominant component in BVOCs and the most crucial VOC for O3 formation in the PRD – highlights two key points. Firstly, it indicates an improvement in the accuracy of BVOC concentration simulations. Secondly, this precise estimation of BVOCs and the consideration of UGS-LUCC has notably shifted the MB of MDA8 O3 simulations from −3.63 to −0.75 ppb in the city center region. Additionally, the simulation of NO2 concentrations also shows slight improvements, with the MB decreasing from 3.27 to 2.81 ppb upon accounting for UGS-BVOC emissions and UGS-LUCC. Given that the UGSs are often located in densely populated urban regions, their inclusion in air quality simulations is crucial for accurately modeling urban air quality.
-
UGS-BVOC emissions have a significant impact on ozone concentrations, with increases ranging from 1.0 to 1.4 ppb (+2.3 % to +3.2 %) in the city center region. However, when considering the combined UGS-LUCC and UGS-BVOC effects, the impact on MDA8 O3 concentrations becomes remarkable, with values ranging from 1.7 to 3.7 ppb (+3.8 % to +8.5 %) in the city center region. This indicates the importance of considering both UGS-LUCC and UGS-BVOC impacts when discussing the influence of UGSs on air quality. As UGSs exhibit different effects in various ozone episodes, it is found that the impact of UGSs on ozone levels is related to specific meteorological conditions. In the episodes in this study, the combined effects on MDA8 O3 can reach up to 8.9 ppb in the city center region.
However, some uncertainties and limitations remain in this study. First, the 10 m resolution land use and land cover data still cannot fully capture the spatial pattern of UGSs in Guangzhou. As shown in Fig. S2, although UGSs in Guangzhou are primarily composed of EBTs, most of these EBTs are distributed along urban edges. This may result from distortions in the definition of urban extent, such as misclassifying mixed urban–vegetation grids as urban grids, caused by the coarse resolution of the 1 km land use and land cover data. The fuzzy definition of urban boundaries could lead to non-UGS areas being misclassified as UGSs, potentially resulting in an overestimation of UGS-BVOC emissions. Second, due to resolution limitations, only larger patches of grassland, cropland, and woodland are recognized as UGSs, while smaller UGS vegetation, such as street trees, often goes undetected at a 10 m resolution. This omission can lead to an underestimation of UGS-BVOC emissions. Third, the 10 m and 1 km resolution land use and land cover data, along with the growth-form and ecotype data, use simplified categorizations for grids, which cannot fully capture the diversity of vegetation species within UGSs. As different vegetation species have varying emission factors, this simplification introduces some errors. Similarly, the oversimplified classification of land grids limits this study's ability to provide specific planning strategies for UGSs at the species level. Nevertheless, it can highlight the importance of considering UGS-BVOC emissions and UGS-LUCC in air pollution prevention and control policies. Finally, Guangzhou, the study area, is a highly urbanized Chinese metropolis with a VOC-limited region (Gong et al., 2018; Liu et al., 2018; Zhou et al., 2011). As a result, even a relatively small amount of VOC emissions, such as those from UGS-BVOC sources, can significantly impact ozone concentrations. Therefore, policymakers in Guangzhou should prioritize addressing the role of UGS-BVOC emissions in air pollution prevention and control. In other cities, particularly those with advanced urban development, high NOx emissions – often resulting from factors like high motor vehicle ownership – can lead to VOC-limited conditions. In such areas, it is equally important to emphasize the role of UGS-BVOC emissions in ozone pollution. In contrast, cities with lower NOx emissions that are identified as NOx-limited regions may experience a minimal impact from UGS-BVOC emissions on ozone concentrations.
This study on ozone pollution in Guangzhou provides key insights for other cities into integrating UGSs with air quality management. By including UGS-BVOC emissions and UGS-LUCC in the air quality model, the study demonstrates improved accuracy in predicting surface ozone concentrations, which can aid urban planners and environmental policymakers in refining their strategies to better address urban air pollution. Moreover, these findings encourage cities to integrate urban forestry into their land use planning and air quality frameworks, promoting environmental sustainability amid rapid urbanization.
The WRF (Weather Research and Forecasting) model code can be obtained from the official repository at https://doi.org/10.5065/D68S4MVH (Skamarock et al., 2008). The CMAQ (Community Multiscale Air Quality) model code is accessible at https://doi.org/10.5281/zenodo.7218076 (US EPA, 2022). The model output data used for analysis and plotting and the code used for simulations can be made available upon request (Haofan Wang, wanghf58@mail2.sysu.edu.cn).
The supplement related to this article is available online at https://doi.org/10.5194/acp-25-5233-2025-supplement.
HW conceived the study, carried out the model simulations, and drafted the manuscript. YuL completed the data visualization. YiL conceived and supervised the study and reviewed and edited the paper. XL and YZha provided useful comments on the paper. QF supervised and funded the study. CS provided the meteorological data for model evaluation. SL, YZho, TZ, and DY provided the observation data for the evaluation of isoprene simulation.
The contact author has declared that none of the authors has any competing interests.
Publisher's note: Copernicus Publications remains neutral with regard to jurisdictional claims made in the text, published maps, institutional affiliations, or any other geographical representation in this paper. While Copernicus Publications makes every effort to include appropriate place names, the final responsibility lies with the authors.
The authors would like to thank the MEIC team from Tsinghua University for providing the anthropogenic emissions for this study. We also wish to thank Tianhe-2 for providing the computer resources.
This work is jointly funded by the Innovation Group Project of Southern Marine Science and Engineering Guangdong Laboratory (Zhuhai; grant no. 311024001), the Guangdong Major Project of Basic and Applied Basic Research (grant no. 2020B0301030004), the Guangdong Basic and Applied Basic Research Foundation (grant nos. 2023A1515110103 and 2023A1515010162), the National Natural Science Foundation of China (grant no. 42375182), the Science and Technology Program of Guangdong Province (Science and Technology Innovation Platform Category; grant no. 2019B121201002), and the Science and Technology Planning Project of Guangzhou (grant no. 2023A04J1544).
This paper was edited by Barbara Ervens and reviewed by five anonymous referees.
Allen, M. R. and Ingram, W. J.: Constraints on future changes in climate and the hydrologic cycle, Nature, 419, 224–232, https://doi.org/10.1038/nature01092, 2002.
Arghavani, S., Malakooti, H., and Bidokhti, A. A.: Numerical evaluation of urban green space scenarios effects on gaseous air pollutants in Tehran Metropolis based on WRF-Chem model, Atmos. Environ., 214, 116832, https://doi.org/10.1016/j.atmosenv.2019.116832, 2019.
Burnett, R., Chen, H., Szyszkowicz, M., Fann, N., Hubbell, B., Pope, C. A., Apte, J. S., Brauer, M., Cohen, A., Weichenthal, S., Coggins, J., Di, Q., Brunekreef, B., Frostad, J., Lim, S. S., Kan, H., Walker, K. D., Thurston, G. D., Hayes, R. B., Lim, C. C., Turner, M. C., Jerrett, M., Krewski, D., Gapstur, S. M., Diver, W. R., Ostro, B., Goldberg, D., Crouse, D. L., Martin, R. V., Peters, P., Pinault, L., Tjepkema, M., van Donkelaar, A., Villeneuve, P. J., Miller, A. B., Yin, P., Zhou, M., Wang, L., Janssen, N. A. H., Marra, M., Atkinson, R. W., Tsang, H., Quoc Thach, T., Cannon, J. B., Allen, R. T., Hart, J. E., Laden, F., Cesaroni, G., Forastiere, F., Weinmayr, G., Jaensch, A., Nagel, G., Concin, H., and Spadaro, J. V.: Global estimates of mortality associated with long-term exposure to outdoor fine particulate matter, P. Natl. Acad. Sci. USA, 115, 9592–9597, https://doi.org/10.1073/pnas.1803222115, 2018.
Cao, J., Situ, S., Hao, Y., Xie, S., and Li, L.: Enhanced summertime ozone and SOA from biogenic volatile organic compound (BVOC) emissions due to vegetation biomass variability during 1981–2018 in China, Atmos. Chem. Phys., 22, 2351–2364, https://doi.org/10.5194/acp-22-2351-2022, 2022.
Chen, X., Wang, X., Wu, X., Guo, J., and Zhou, Z.: Influence of roadside vegetation barriers on air quality inside urban street canyons, Urban For. Urban Gree., 63, 127219, https://doi.org/10.1016/j.ufug.2021.127219, 2021.
Chowdhury, S., Pozzer, A., Haines, A., Klingmueller, K., Muenzel, T., Paasonen, P., Sharma, A., Venkataraman, C., and Lelieveld, J.: Global health burden of ambient PM2.5 and the contribution of anthropogenic black carbon and organic aerosols, Environ. Int., 159, 107020, https://doi.org/10.1016/j.envint.2021.107020, 2022.
Cohen, A. J., Brauer, M., Burnett, R., Anderson, H. R., Frostad, J., Estep, K., Balakrishnan, K., Brunekreef, B., Dandona, L., Dandona, R., Feigin, V., Freedman, G., Hubbell, B., Jobling, A., Kan, H., Knibbs, L., Liu, Y., Martin, R., Morawska, L., Pope, C. A., Shin, H., Straif, K., Shaddick, G., Thomas, M., van Dingenen, R., van Donkelaar, A., Vos, T., Murray, C. J. L., and Forouzanfar, M. H.: Estimates and 25 year trends of the global burden of disease attributable to ambient air pollution: an analysis of data from the Global Burden of Diseases Study 2015, Lancet, 389, 1907–1918, https://doi.org/10.1016/S0140-6736(17)30505-6, 2017.
Dunlea, E. J., Herndon, S. C., Nelson, D. D., Volkamer, R. M., San Martini, F., Sheehy, P. M., Zahniser, M. S., Shorter, J. H., Wormhoudt, J. C., Lamb, B. K., Allwine, E. J., Gaffney, J. S., Marley, N. A., Grutter, M., Marquez, C., Blanco, S., Cardenas, B., Retama, A., Ramos Villegas, C. R., Kolb, C. E., Molina, L. T., and Molina, M. J.: Evaluation of nitrogen dioxide chemiluminescence monitors in a polluted urban environment, Atmos. Chem. Phys., 7, 2691–2704, https://doi.org/10.5194/acp-7-2691-2007, 2007.
Emery, C., Liu, Z., Russell, A. G., Odman, M. T., Yarwood, G., and Kumar, N.: Recommendations on statistics and benchmarks to assess photochemical model performance, J. Air Waste Manag., 67, 582–598, https://doi.org/10.1080/10962247.2016.1265027, 2017.
Friedl, M. and Sulla-Menashe, D.: MCD12Q1 MODIS/Terra+Aqua Land Cover Type Yearly L3 Global 500 m SIN Grid V006, https://doi.org/10.5067/MODIS/MCD12Q1.006, 2019.
Fuhrer, J., Skärby, L., and Ashmore, M. R.: Critical levels for ozone effects on vegetation in Europe, Environ. Pollut., 97, 91–106, https://doi.org/10.1016/S0269-7491(97)00067-5, 1997.
Gong, J., Hu, Z., Chen, W., Liu, Y., Wang, J., Liu, Z., Doherty, R. M., Wild, O., Hollaway, M., and O'Connor, F. M.: Urban expansion dynamics and modes in metropolitan Guangzhou, China, Atmos. Chem. Phys., 72, 100–109, https://doi.org/10.1016/j.landusepol.2017.12.025, 2018.
Guenther, A. B., Jiang, X., Heald, C. L., Sakulyanontvittaya, T., Duhl, T., Emmons, L. K., and Wang, X.: The Model of Emissions of Gases and Aerosols from Nature version 2.1 (MEGAN2.1): an extended and updated framework for modeling biogenic emissions, Geosci. Model Dev., 5, 1471–1492, https://doi.org/10.5194/gmd-5-1471-2012, 2012.
Guenther, A., Jiang, X., Shah, T., Huang, L., Kemball-Cook, S., and Yarwood, G.: Model of Emissions of Gases and Aerosol from Nature Version 3 (MEGAN3) for Estimating Biogenic Emissions, in: Air Pollution Modeling and its Application XXVI, edited by: Mensink, C., Gong, W., and Hakami, A., Springer International Publishing, Cham, 187–192, https://doi.org/10.1007/978-3-030-22055-6_29, 2020.
He, C. Q., Zou, Y., Lv, S. J., Flores, R. M., Yan, X. L., Deng, T., and Deng, X. J.: The importance of photochemical loss to source analysis and ozone formation potential: Implications from in-situ observations of volatile organic compounds (VOCs) in Guangzhou, China, Atmos. Environ., 320, 120320, https://doi.org/10.1016/j.atmosenv.2023.120320, 2024.
IPCC (Intergovernmental Panel On Climate Change): Climate Change 2021 – The Physical Science Basis: Working Group I Contribution to the Sixth Assessment Report of the Intergovernmental Panel on Climate Change, 1st ed., Cambridge University Press, https://doi.org/10.1017/9781009157896, 2023.
Jin, S., Guo, J., Wheeler, S., Kan, L., Che, S., Fu, X., Liu, J., Ban-Weiss, G. A., Zhang, J., Huang, X., Ouyang, B., Popoola, O., Tao, S., Tiwari, A., Kumar, P., Xing, Y., and Brimblecombe, P.: Evaluation of impacts of trees on PM2.5 dispersion in urban streets, Atmos. Environ., 99, 277–287, https://doi.org/10.1016/j.atmosenv.2014.10.002, 2014.
Jin, S., Guo, J., Wheeler, S., Kan, L., Che, S., Fu, X., Liu, J., Ban-Weiss, G. A., Zhang, J., Huang, X., Ouyang, B., Popoola, O., Tao, S., Tiwari, A., Kumar, P., Xing, Y., and Brimblecombe, P.: Effects of canyon geometry on the distribution of traffic-related air pollution in a large urban area: Implications of a multi-canyon air pollution dispersion model, Atmos. Environ., 165, 111–121, https://doi.org/10.1016/j.atmosenv.2017.06.031, 2017.
Lelieveld, J., Klingmüller, K., Pozzer, A., Burnett, R. T., Haines, A., and Ramanathan, V.: Effects of fossil fuel and total anthropogenic emission removal on public health and climate, P. Natl. Acad. Sci. USA, 116, 7192–7197, https://doi.org/10.1073/pnas.1819989116, 2019.
Lelieveld, J., Pozzer, A., Pöschl, U., Fnais, M., Haines, A., and Münzel, T.: Loss of life expectancy from air pollution compared to other risk factors: a worldwide perspective, Cardiovasc. Res., 116, 1910–1917, 2020.
Le Page, Y., Morton, D., Bond-Lamberty, B., Pereira, J. M. C., and Hurtt, G.: HESFIRE: a global fire model to explore the role of anthropogenic and weather drivers, Biogeosciences, 12, 887–903, https://doi.org/10.5194/bg-12-887-2015, 2015.
Li, S., Lu, X., and Wang, H.: Anthropogenic emission controls reduce summertime ozone-temperature sensitivity in the United States, EGUsphere [preprint], https://doi.org/10.5194/egusphere-2024-1889, 2024.
Liu, Z., Doherty, R. M., Wild, O., Hollaway, M., and O'Connor, F. M.: Contrasting chemical environments in summertime for atmospheric ozone across major Chinese industrial regions: the effectiveness of emission control strategies, Atmos. Chem. Phys., 21, 10689–10706, https://doi.org/10.5194/acp-21-10689-2021, 2021.
Lohmann, U., Rotstayn, L., Storelvmo, T., Jones, A., Menon, S., Quaas, J., Ekman, A. M. L., Koch, D., and Ruedy, R.: Total aerosol effect: radiative forcing or radiative flux perturbation?, Atmos. Chem. Phys., 10, 3235–3246, https://doi.org/10.5194/acp-10-3235-2010, 2010.
Lombardozzi, D. L., Bonan, G. B., Smith, N. G., Dukes, J. S., and Fisher, R. A.: Temperature acclimation of photosynthesis and respiration: A key uncertainty in the carbon cycle-climate feedback, Geophys. Res. Lett., 42, 8624–8631, https://doi.org/10.1002/2015GL065934, 2015.
Lu, X., Zhang, L., Wang, X., Gao, M., Li, K., Zhang, Y., Yue, X., and Zhang, Y.: Rapid Increases in Warm-Season Surface Ozone and Resulting Health Impact in China Since 2013, Environ. Sci. Tech. Let., 7, 240–247, https://doi.org/10.1021/acs.estlett.0c00171, 2020.
Luecken, D. J., Yarwood, G., and Hutzell, W. T.: Multipollutant modeling of ozone, reactive nitrogen and HAPs across the continental US with CMAQ-CB6, Atmos. Environ., 201, 62–72, https://doi.org/10.1016/j.atmosenv.2018.11.060, 2019.
Ma, H. and Liang, S.: Development of the GLASS 250 m leaf area index product (version 6) from MODIS data using the bidirectional LSTM deep learning model, Remote Sens. Environ., 273, 112985, https://doi.org/10.1016/j.rse.2022.112985, 2022.
Ma, M., Gao, Y., Wang, Y., Zhang, S., Leung, L. R., Liu, C., Wang, S., Zhao, B., Chang, X., Su, H., Zhang, T., Sheng, L., Yao, X., and Gao, H.: Substantial ozone enhancement over the North China Plain from increased biogenic emissions due to heat waves and land cover in summer 2017, Atmos. Chem. Phys., 19, 12195–12207, https://doi.org/10.5194/acp-19-12195-2019, 2019.
Ma, M., Gao, Y., Ding, A., Su, H., Liao, H., Wang, S., Wang, X., Zhao, B., Zhang, S., Fu, P., Guenther, A. B., Wang, M., Li, S., Chu, B., Yao, X., and Gao, H.: Development and Assessment of a High-Resolution Biogenic Emission Inventory from Urban Green Spaces in China, Environ. Sci. Technol., 56, 175–184, https://doi.org/10.1021/acs.est.1c06170, 2022.
Meng, Y., Song, J., Zeng, L., Zhang, Y., Zhao, Y., Liu, X., Guo, H., Zhong, L., Ou, Y., Zhou, Y., Zhang, T., Yue, D., and Lai, S.: Ambient volatile organic compounds at a receptor site in the Pearl River Delta region: Variations, source apportionment and effects on ozone formation, J. Environ. Sci., 111, 104–117, https://doi.org/10.1016/j.jes.2021.02.024, 2022.
Myneni, R., Knyazikhin, Y., and Park, T.: MOD15A2H MODIS/Terra leaf area Index/FPAR 8-Day L4 global 500 m SIN grid V006, NASA EOSDIS Land Process, https://doi.org/10.5067/MODIS/MYD15A2H.006, DAAC, 2015.
National Centers for Environmental Prediction, National Weather Service, NOAA, U.S. Department of Commerce: NCEP FNL Operational Model Global Tropospheric Analyses, continuing from July 1999, https://doi.org/10.5065/D6M043C6, 2000.
Pye, H. O. T., Murphy, B. N., Xu, L., Ng, N. L., Carlton, A. G., Guo, H., Weber, R., Vasilakos, P., Appel, K. W., Budisulistiorini, S. H., Surratt, J. D., Nenes, A., Hu, W., Jimenez, J. L., Isaacman-VanWertz, G., Misztal, P. K., and Goldstein, A. H.: On the implications of aerosol liquid water and phase separation for organic aerosol mass, Atmos. Chem. Phys., 17, 343–369, https://doi.org/10.5194/acp-17-343-2017, 2017.
Qiu, J., Fang, C., Tian, N., Wang, H., and Wang, J.: Impacts of land use and land cover changes on local meteorology and PM2.5 concentrations in Changchun, Northeast China, Atmos. Res., 289, 106759, https://doi.org/10.1016/j.atmosres.2023.106759, 2023.
Ramanathan, V., Crutzen, P. J., Kiehl, J. T., and Rosenfeld, D.: Aerosols, Climate, and the Hydrological Cycle, Science, 294, 2119–2124, https://doi.org/10.1126/science.1064034, 2001.
Salamanca, F., Martilli, A., Tewari, M., and Chen, F.: A Study of the Urban Boundary Layer Using Different Urban Parameterizations and High-Resolution Urban Canopy Parameters with WRF, J. Appl. Meteorol. Clim., 50, 1107–1128, https://doi.org/10.1175/2010JAMC2538.1, 2011.
Schlaerth, H. L., Silva, S. J., and Li, Y.: Characterizing Ozone Sensitivity to Urban Greening in Los Angeles Under Current Day and Future Anthropogenic Emissions Scenarios, J. Geophys. Res.-Atmos., 128, e2023JD039199, https://doi.org/10.1029/2023JD039199, 2023.
Seinfeld, J. H., Pandis, S. N., and Noone, K.: Atmospheric Chemistry and Physics: From Air Pollution to Climate Change, Phys. Today, 51, 88–90, https://doi.org/10.1063/1.882420, 1998.
Shan, D., Du, Z., Zhang, T., Zhang, X., Cao, G., Liu, Z., Yao, Z., Tang, K., and Liang, S.: Variations, sources, and effects on ozone formation of VOCs during ozone episodes in 13 cities in China, Front. Environ. Sci., 10, 1084592, https://doi.org/10.3389/fenvs.2022.1084592, 2023.
Shindell, D., Kuylenstierna, J. C. I., Vignati, E., van Dingenen, R., Amann, M., Klimont, Z., Anenberg, S. C., Muller, N., Janssens-Maenhout, G., Raes, F., Schwartz, J., Faluvegi, G., Pozzoli, L., Kupiainen, K., Höglund-Isaksson, L., Emberson, L., Streets, D., Ramanathan, V., Hicks, K., Oanh, N. T. K., Milly, G., Williams, M., Demkine, V., Fowler, D., Shindell, D., Kuylenstierna, J. C. I., Vignati, E., van Dingenen, R., Amann, M., Klimont, Z., Anenberg, S. C., Muller, N., Janssens-Maenhout, G., Raes, F., Schwartz, J., Faluvegi, G., Pozzoli, L., Kupiainen, K., Höglund-Isaksson, L., Emberson, L., Streets, D., Ramanathan, V., Hicks, K., Oanh, N. T. K., Milly, G., Williams, M., Demkine, V., Fowler, D., Shindell, D., Kuylenstierna, J. C. I., Vignati, E., van Dingenen, R., Amann, M., Klimont, Z., Anenberg, S. C., Muller, N., Janssens-Maenhout, G., Raes, F., Schwartz, J., Faluvegi, G., Pozzoli, L., Kupiainen, K., Höglund-Isaksson, L., Emberson, L., Streets, D., Ramanathan, V., Hicks, K., Oanh, N. T. K., Milly, G., Williams, M., Demkine, V., and Fowler, D.: Simultaneously Mitigating Near-Term Climate Change and Improving Human Health and Food Security, Science, 335, 183–189, https://doi.org/10.1126/science.1210026, 2012.
Skamarock, W., Klemp, J., Dudhia, J., Gill, D. O., Barker, D., Duda, M. G., Huang, X.-Y., Wang, W., and Powers, J. G.: A Description of the Advanced Research WRF Version 3, University Corporation for Atmospheric Research [data set], https://doi.org/10.5065/D68S4MVH (Original work published 2008), 2008.
Soleimanian, E., Wang, Y., Li, W., Liu, X., Griggs, T., Flynn, J., Walter, P. J., and Estes, M. J.: Understanding ozone episodes during the TRACER-AQ campaign in Houston, Texas: The role of transport and ozone production sensitivity to precursors, Sci. Total Environ., 900, 165881, https://doi.org/10.1016/j.scitotenv.2023.165881, 2023.
Solomon, S.: Climate change 2007 – the physical science basis: Working group I contribution to the fourth assessment report of the IPCC, Cambridge university press, ISBN 92-9169-122-4, 2007.
Tiwari, A. and Kumar, P.: Integrated dispersion-deposition modelling for air pollutant reduction via green infrastructure at an urban scale, Sci. Total Environ., 723, 138078, https://doi.org/10.1016/j.scitotenv.2020.138078, 2020.
Tomson, M., Kumar, P., Barwise, Y., Perez, P., Forehead, H., French, K., Morawska, L., and Watts, J. F.: Green infrastructure for air quality improvement in street canyons, Environ. Int., 146, 106288, https://doi.org/10.1016/j.envint.2020.106288, 2021.
US EPA Office of Research and Development: CMAQ (5.4), Zenodo [data set], https://doi.org/10.5281/zenodo.7218076, 2022.
Wang, H., Liu, Z., Zhang, Y., Yu, Z., and Chen, C.: Impact of different urban canopy models on air quality simulation in Chengdu, southwestern China, Atmos. Environ., 267, 118775, https://doi.org/10.1016/j.atmosenv.2021.118775, 2021.
Wang, H., Liu, Z., Wu, K., Qiu, J., Zhang, Y., Ye, B., and He, M.: Impact of Urbanization on Meteorology and Air Quality in Chengdu, a Basin City of Southwestern China, Front. Ecol. Evol., 10, 845801, https://doi.org/10.3389/fevo.2022.845801, 2022.
Wang, N., Lyu, X., Deng, X., Huang, X., Jiang, F., and Ding, A.: Role of vegetation in deposition and dispersion of air pollution in urban parks, Atmos. Environ., 201, 73–83, https://doi.org/10.1016/j.atmosenv.2018.12.027, 2019b.
Wang, P., Chen, Y., Hu, J., Zhang, H., and Ying, Q.: Attribution of Tropospheric Ozone to NOx and VOC Emissions: Considering Ozone Formation in the Transition Regime, Environ. Sci. Technol., 53, 1404–1412, https://doi.org/10.1021/acs.est.8b05981, 2019c.
WHO: WHO global air quality guidelines: particulate matter (PM2.5 and PM10), ozone, nitrogen dioxide, sulfur dioxide and carbon monoxide, World Health Organization, ISBN 9789240034228, 2021.
Wu, K., Yang, X., Chen, D., Gu, S., Lu, Y., Jiang, Q., Wang, K., Ou, Y., Qian, Y., Shao, P., and Lu, S.: Estimation of biogenic VOC emissions and their corresponding impact on ozone and secondary organic aerosol formation in China, Atmos. Res., 231, 104656, https://doi.org/10.1016/j.atmosres.2019.104656, 2020.
Yang, H., Chen, T., Lin, Y., Buccolieri, R., Mattsson, M., Zhang, M., Hang, J., and Wang, Q.: Integrated impacts of tree planting and street aspect ratios on CO dispersion and personal exposure in full-scale street canyons, Build. Environ., 169, 106529, https://doi.org/10.1016/j.buildenv.2019.106529, 2020.
Yao, Z. and Huang, G.: Effects of Land Use Changes Across Different Urbanization Periods on Summer Rainfall in the Pearl River Delta Core Area, Int. J. Disast. Risk Sc., 14, 458–474, https://doi.org/10.1007/s13753-023-00497-8, 2023.
Yim, S. H. L., Wang, M., Gu, Y., Yang, Y., Dong, G., and Li, Q.: Effect of Urbanization on Ozone and Resultant Health Effects in the Pearl River Delta Region of China, J. Geophys. Res.-Atmos., 124, 11568–11579, https://doi.org/10.1029/2019JD030562, 2019.
Zhang, Y. and Cao, F.: Fine particulate matter (PM2.5) in China at a city level, Sci. Rep.-UK, 5, 14884, https://doi.org/10.1038/srep14884, 2015.
Zheng, J., Shao, M., Che, W., Zhang, L., Zhong, L., Zhang, Y., and Streets, D.: Speciated VOC Emission Inventory and Spatial Patterns of Ozone Formation Potential in the Pearl River Delta, China, Environ. Sci. Technol., 43, 8580–8586, https://doi.org/10.1021/es901688e, 2009.
Zhou, D., Zhao, S., Zhang, L., Sun, G., and Liu, Y.: The footprint of urban heat island effect in China, Sci. Rep.-UK, 5, 11160, https://doi.org/10.1038/srep11160 2015.
Zhou, K., Zhang, W., Wang, Z., Cao, W., and Peng, S.: The influence of urbanization on atmospheric environmental quality in Guangzhou, China, 2011 Int. Conf. Electr. Technol. Civ. Eng. ICETCE, 22–24 April 2011, 3667–3670, https://doi.org/10.1109/ICETCE.2011.5776281, 2011.