the Creative Commons Attribution 4.0 License.
the Creative Commons Attribution 4.0 License.
 | 09 May 2025
Modelling of atmospheric variability in gas and aerosols during the ACROSS campaign 2022 of the greater Paris area: evaluation of the meteorology, dynamics and chemistry
Ludovico Di Antonio
Matthias Beekmann
Guillaume Siour
Vincent Michoud
Christopher Cantrell
Astrid Bauville
Antonin Bergé
Mathieu Cazaunau
Servanne Chevaillier
Manuela Cirtog
Joel F. de Brito
Paola Formenti
Cecile Gaimoz
Olivier Garret
Aline Gratien
Valérie Gros
Martial Haeffelin
Lelia N. Hawkins
Simone Kotthaus
Gael Noyalet
Diana L. Pereira
Jean-Eudes Petit
Eva Drew Pronovost
Véronique Riffault
Chenjie Yu
Gilles Foret
Jean-François Doussin
Claudia Di Biagio
Understanding the interaction of anthropogenic and biogenic emissions around large urban agglomerations remains an important question for atmospheric research and the key question of the ACROSS (Atmospheric Chemistry of the Suburban Forest) project. ACROSS is based on an intensive field campaign in the Paris area, including ground-based measurements in the urban inner centre and suburban and forested sites and measurements made on board aircraft, during the exceptionally hot and dry summer of 2022. In addition, 3D modelling represents an important tool in ACROSS, and here we use the available measurements from the campaign together with observations from air quality and meteorological networks to evaluate the WRF–CHIMERE model simulation for the ACROSS period. We find that the WRF model is able to reproduce the meteorological variability during the campaign, in particular during two heatwaves. The model reproduces the daily ozone maxima well but overestimates PM2.5 by a factor of 1.5–2, partly due to an overestimation of secondary aerosol, both organic and inorganic. For organic aerosol in the Île-de-France area, the biases are reduced to about ±20 %. These differences are in contrast with those of the existing literature and might have been increased by the hot conditions of summer 2022. For case studies during two heatwave days, the model shows the sources for two organic aerosol peaks above 20–30 µg m−3, on one occasion due to biogenic secondary organic aerosol formation in different forests around Paris and on another occasion due to the advection of wildfire aerosols in combination with secondary formation mainly from forest-emitted biogenic volatile organic compounds (BVOCs).
- Article
(18735 KB) - Full-text XML
-
Supplement
(5543 KB) - BibTeX
- EndNote


Megacities and large urban agglomerations are important hotspots of air pollution (e.g. Baklanov et al., 2010; Molina and Molina, 2004). Several key questions remain concerning their interaction with regional pollution, for instance the share of pollution produced locally within urban areas and that imported from outside (Pandolfi et al., 2020; Lenschow et al., 2001). This aspect has been addressed for several megacities, such as Mexico City (Calderón-Garcidueñas et al., 2015), New York (Sun et al., 2011), London (Harrison et al., 2012) and Paris (Beekmann et al., 2015), evidencing a generally unexpectedly large regional contribution to urban pollution. For instance, Beekmann et al. (2015) show that regional inflow contributes up to 70 % of the fine particulate matter (PM2.5) concentrations for the Paris agglomeration. In addition, a recent analysis of long-term aerosol optical depth (AOD) measurements from the high-resolution MAIAC (Multi-Angle Implementation of Atmospheric Correction) product over 21 large European cities shows that, although most of the aerosol load comes from regional sources, urban emissions contribute to the degradation of air quality by increasing AOD levels by 57 %, 55 %, 39 % and 32 % on average for large metropolitan agglomerations such as Barcelona, Lisbon, Paris and Athens, respectively (Di Antonio et al., 2023d).
A second important question concerns the impact and fate of concentrated urban emissions on regional pollution levels. From airborne observations in the plume of the Paris megacity during the MEGAPOLI campaign, Freney et al. (2014) showed that anthropogenic secondary organic aerosol (ASOA) accumulates as air masses move away from the urban agglomeration. The EMeRGe (Effect of Megacities on the transport and transformation of pollutants on the Regional to Global scales) campaign documented chemical outflow from European megacities (Andrés Hernández et al., 2022) and from biomass burning plumes originating over what is referred to in the paper as Indochina (Lin et al., 2023). A still-debated question is the interaction between anthropogenic emissions, typically from the urban agglomeration, and biogenic emissions, from within, but also from surrounding, forested areas, which are typical of megacities. Both types of emissions tend to enhance secondary pollutants (e.g. ozone, particulate matter), and it is important to quantify the contribution of each source. A large number of interactions (i.e. of additional effects beyond simple mixing) have been theoretically predicted, observed and modelled. For instance, both anthropogenic and biogenic species affect the oxidant capacity of the atmosphere (OH, NO3, Cl, O3), which determines the production of secondary pollutants from anthropogenic and biogenic precursors (Sartelet et al., 2012; Shrivastava et al., 2019). The yield of biogenic secondary organic aerosol (BSOA) formation can be both increased and decreased in the presence of anthropogenic emissions (Liu et al., 2021). For instance, under a set of specific anthropogenic–biogenic conditions, namely low NO levels, in the presence of acidic aerosols, often involving sulfate, isoprene forms BSOA with a high yield (e.g. Carlton et al., 2018).
The interaction of anthropogenic and biogenic emissions in and around a large urban agglomeration is the central scientific question of the French and international ACROSS project (Atmospheric Chemistry of the Suburban Forest; https://across.aeris-data.fr/, last access: 24 April 2024) (Cantrell and Michoud, 2022), focusing on the Paris agglomeration. With about 12 million inhabitants, the Paris agglomeration is one of the largest megacities in Europe. It is surrounded by flat terrain including several large forested domains and is thus an ideal natural laboratory to study anthropogenic–biogenic emission interactions. Some key questions of the ACROSS project are as follows:
-
How do anthropogenic–biogenic interactions impact primary pollutant oxidation pathways and secondary pollutant formation?
-
How do they affect the organic carbon, reactive nitrogen and radical budgets?
-
How do these interactions affect the optical and hygroscopic aerosol properties and, as a consequence, their radiative effects?
A large multi-site and multi-platform field campaign was held from 15 June to 25 July 2022 to answer these questions. The campaign deployment consisted of three main instrumented supersites on a NE–SW transect going from the Paris centre to a suburban and a forested site and several secondary sites with less complete instrumentation to study specific processes or to characterize the spatial variability in major pollutants. The French ATR 42 research aircraft was deployed to document the evolution of the Paris pollution plume at the regional scale. Summer 2022 over western Europe was exceptionally hot and dry and is considered a proxy for future climate conditions (Ribes et al., 2022). Indeed, the ACROSS campaign was characterized by two strong heatwaves towards the beginning and the end of the measurements period and a more temperate period in between. These meteorological conditions varying between extremes, together with two episodes of transport of African dust over Europe and the high occurrence of fires during the period (Menut et al., 2023), also made the campaign especially interesting to study from the perspective of climate change and its impact on atmospheric composition and air quality.
Regional 3D simulation with the WRF–CHIMERE model system (Menut et al., 2021) was performed covering the ACROSS field campaign domain and the whole of France for the June–July 2022 period in order to support interpretation of campaign data: from local to regional scales or focusing on specific processes. In this paper, we present the configuration of the WRF–CHIMERE model simulation and first analysis of its output dataset. Based on several examples, we derive the spatio-temporal variability in pollutants during the ACROSS campaign using a combination of model data and observations. In order to assess the robustness of the model output for its use in subsequent studies and with particular emphasis on the challenging conditions during the ACROSS period, a thorough model evaluation is presented. This evaluation relies not only on the already-available in situ measurements from the ACROSS campaign in the Île-de-France area, but also on long-term in situ measurements from established networks. A particular focus is placed on the evaluation of the meteorological simulations by the WRF–CHIMERE modelling system. This work shows how different transport patterns and meteorological conditions, especially during the two heatwaves, affected regional concentrations of major pollutants such as ozone and PM2.5 through the interaction of anthropogenic and biogenic emissions.
2.1 WRF–CHIMERE model configuration
The WRF–CHIMERE model (Menut et al., 2021; https://www.lmd.polytechnique.fr/chimere/, last access: 3 January 2025) is a 3D regional Eulerian chemistry-transport model (CTM), which has been applied for both research and forecasting purposes over France and over many other countries (Cholakian et al., 2018; Ferreyra et al., 2016; Lachatre et al., 2020; Tuccella et al., 2019). In this work we used a coupled version of WRF version 3.7.1 (Skamarock et al., 2008) and CHIMERE v2020r3 (WRF–CHIMERE). WRF version 3.7.1 is the version for which coupling to CHIMERE has been performed (Menut et al., 2021). CHIMERE v2020r3 was the most recent version when this work was started. Three one-way nested domains with spatial resolutions of 30, 6 and 2 km have been considered (Fig. 1). The 30 km domain covers the European continent and extends to the Sahara in order to be able to catch Saharan dust transport events over Europe. The 6 km domain covers metropolitan France, while the 2 km domain covers the Paris area and the Île-de-France region where the ACROSS field campaign was conducted. The simulation extends from 15 June to 25 July 2022, with 2 weeks of model spin-up. The 30 and 6 km domains of the CHIMERE model have 15 vertical layers between the surface and 300 hPa, while 10 levels are used for the 2 km domain up to 500 hPa. Although the total number of vertical layers is lower compared to the larger domains, they are still denser near the surface, where detailed resolution is most critical. Indeed, differences between the two configurations are generally small at the three campaign sites (mean bias between the 6 and 2 km simulations at the three campaign sites ranging between −0.4 and 0.07 µg m−3 for organics, between −0.04 and 0.02 µg m−3 for sulfate, between −0.01 and 0.03 µg m−3 for ammonium, between 0.02 and 0.08 µg m−3 for nitrate, and between −0.002 and 0.001 µg m−3 for chloride; see Fig. S1 in the Supplement). While the 6 km resolution simulations are used for comparisons with meteorological or pollutant observations over France, the finer-scale 2 km resolution simulation is used for comparisons with campaign observations, especially in Sect. 4.4. In order to run the CHIMERE model, the meteorological data; initial and boundary conditions for the chemistry; anthropogenic, biogenic and fire emissions; and land use have to be provided. All the data sources adopted for this work are summarized in Table 1. WRF v 3.7.1 coupled with the CHIMERE model provides the meteorological data online (i.e. meteorological fields are exchanged at every physical time step of 10 min with the CTM for the three domains). In this study, the National Centers for Environmental Predictions (NCEP) analysis with 1° × 1° spatial resolution has been used to constrain the meteorological initial and boundary conditions. The microphysics follow the Thompson scheme (Thompson et al., 2008), while the Yonsei University (YSU) planetary boundary layer (PBL) scheme, which utilizes the thermodynamic layer detection based on the bulk Richardson number, was adopted for the planetary boundary layer height (PBLH) estimation (Hong, 2010). Radiation fluxes are calculated using the Rapid Radiative Transfer Model for GCMs (RRTMG, where GCMs denotes general circulation models; Iacono et al., 2008). The nudging (i.e. the simulated meteorology relaxed towards large-scale analysis) has been activated outside the PBL every 6 h of simulation for wind fields, temperature and relative humidity with a nudging coefficient of 0.0005 s−1.
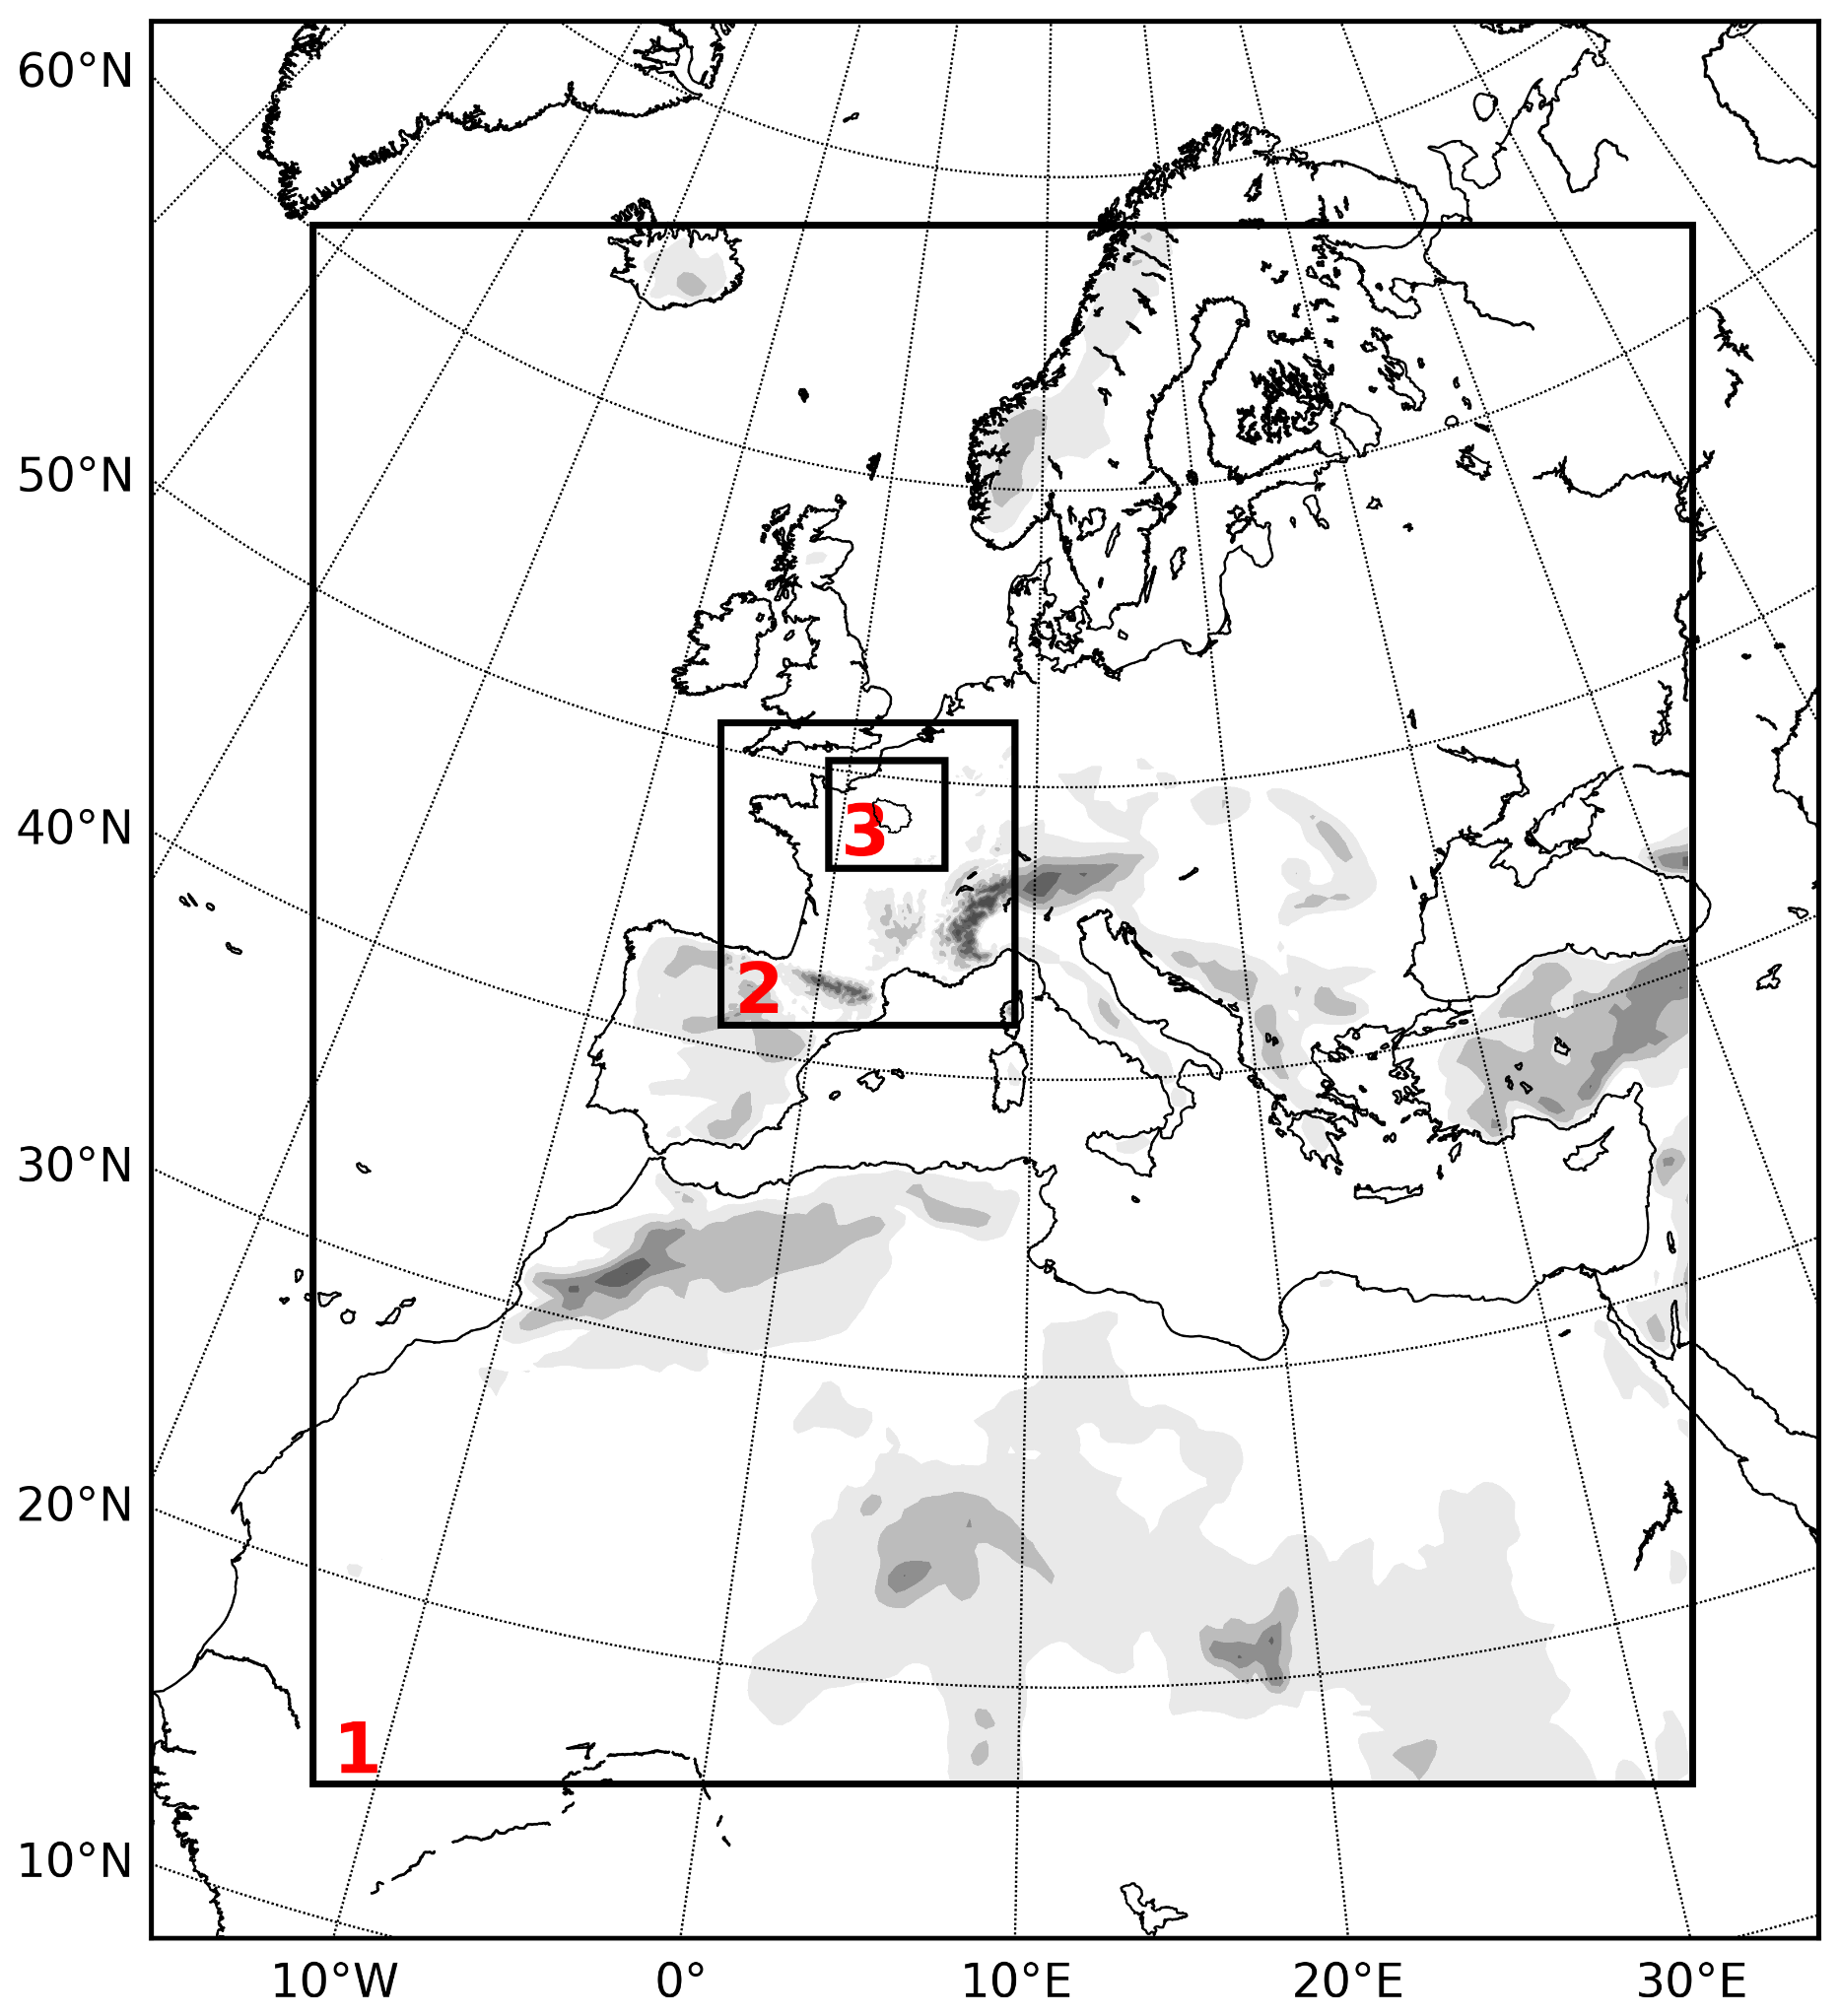
Figure 1Map of the three nested domains configured for the WRF–CHIMERE simulation during the ACROSS campaign 2022. The first domain (1) is at 30 × 30 km spatial resolution, the second (2) is at 6 × 6 km spatial resolution and the third (3) is at 2 × 2 km spatial resolution covering an area centred over the Île-de-France region. The boundaries of the Île-de-France region are drawn in black within domain 3. The digital elevation model from the WRF output is shown in greyscale.
Table 1Summary of the WRF–CHIMERE model inputs for the ACROSS field campaign 2022 simulation.
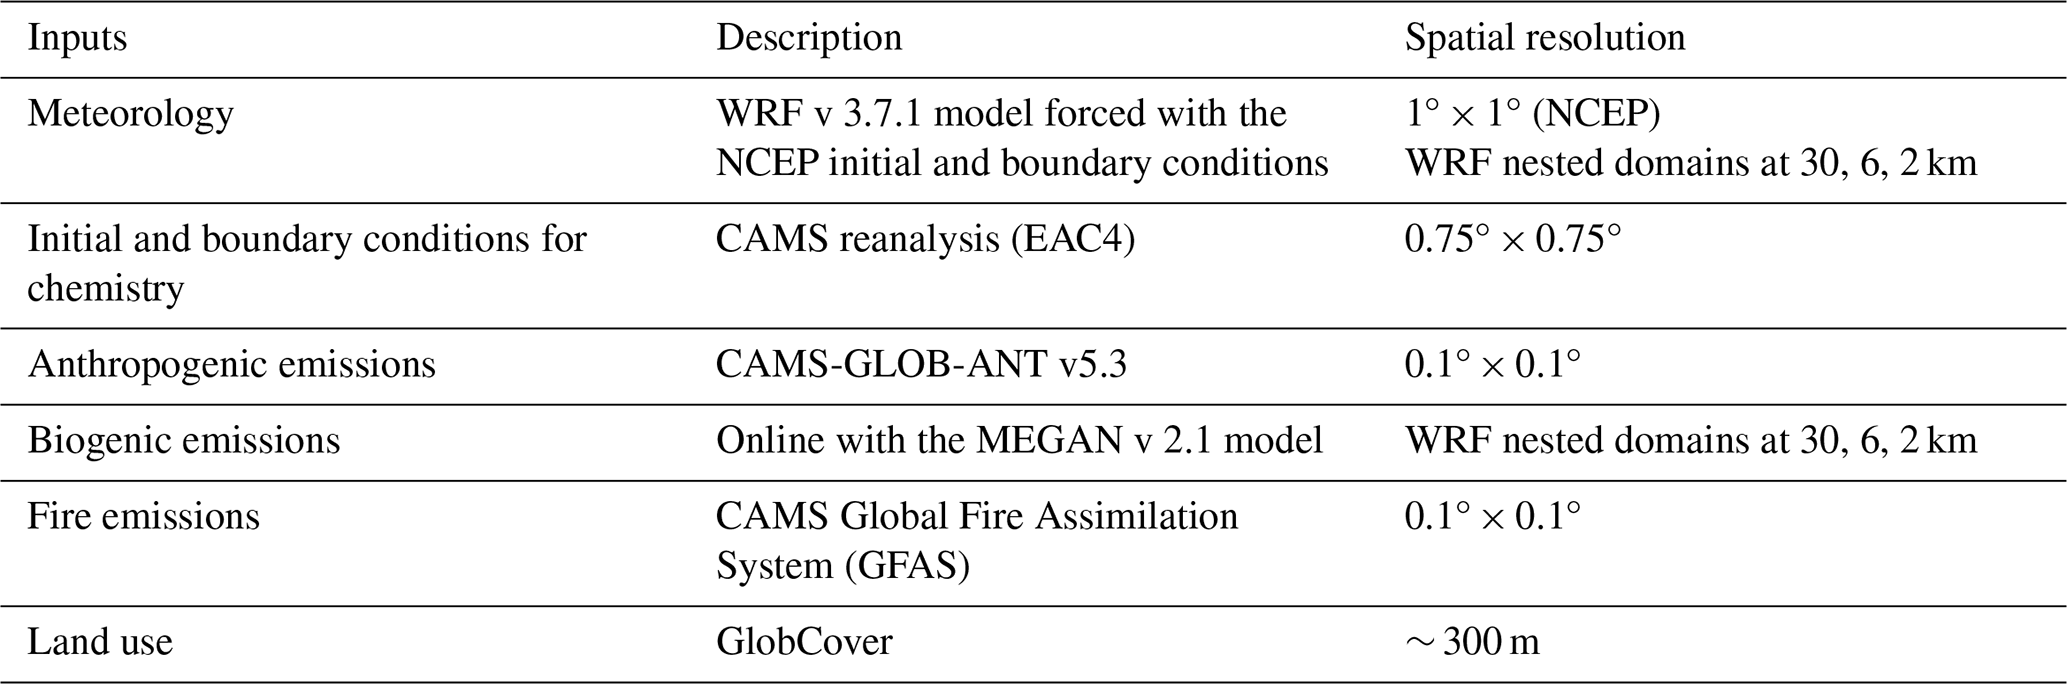
Gas and aerosol initial and boundary conditions applied to the WRF–CHIMERE model are taken from the CAMS global reanalysis product at 0.75° × 0.75° spatial resolution. Anthropogenic emissions are provided by the CAMS-GLOB-ANT v5.3 products with a 0.1° × 0.1° spatial resolution for 17 activity sectors (Soulie et al., 2024) and are then reported to the 11 SNAP (Selected Nomenclature for reporting of Air Pollutants) sectors. For each activity sector, a chemical volatile organic compound (VOC) profile is used from Passant (2002), and VOCs are then regrouped into those present in the SAPRC chemical mechanism used. The gas-phase chemistry mechanism adopted for the ACROSS campaign is SAPRC-07A, a reduced scheme based on the SAPRC mechanism from Carter (2010). The biogenic emissions are simulated with the Model of Emissions of Gases and Aerosols from Nature (MEGAN) v 2.1 module (Guenther et al., 2006) implemented within the CHIMERE model. Biogenic emissions depend on several parameters: the short-wave radiation, the surface temperature simulated by the WRF model and the leaf area index (LAI) derived from MODIS observations (Yuan et al., 2011). In this study we use the LAI referring to the 2013 year with a temporal resolution of 8 d and the emission factors from Sindelarova et al. (2014). The emission scheme of biogenic VOCs considers a dependence on temperature and radiation but not on soil humidity, and so the possible effects of dryness are not taken into account. Fire emissions are taken from the CAMS Global Fire Assimilation System (GFAS; Kaiser et al., 2012) and are processed with the emiFIRES_CAMS v2020r1 pre-processor (provided by the CHIMERE developers; https://www.lmd.polytechnique.fr/chimere/, last access: 3 July 2024). The land use is based on GlobCover with a spatial resolution of about 300 m (Arino et al., 2008).
The CHIMERE aerosol module simulates the aerosol concentration through a sectional bin approach. In this work, 10 bins between the 0.01 and 40 µm diameter range have been employed. Of the 10 bins, 6 fall into the submicron fraction of the size distribution. The lower and upper cut-off diameters of the nearest bin to 1 µm are 0.5 and 1.1 µm, respectively. The simulated aerosol species include black carbon (assumed to be elemental carbon), sulfate, nitrate, dust, sea salt, primary particulate matter (PPM), and different primary organic aerosol (POA) and secondary organic aerosol (SOA) species.
For nucleation, the parameterization of Kulmala et al. (1998) for sulfuric acid is used. For coagulation, we follow a formulation of coagulation kernels by Debry et al. (2007). For condensation and evaporation, we use a kinetic–thermodynamic approach. For distribution of the condensing fluxes into the different size bins of pre-existing particles, we use the so-called “bulk equilibrium approach” (Pandis et al., 1993) for small particles below 1.25 µm. The total flux to the bulk phase is calculated by
where Ji (µg m−3 s−1) is the absorption or desorption flux of species i, τi (s) is a characteristic time of the mass transfer set to 2 h, Gi is the bulk gas-phase concentration of species i and is the gas-phase concentration of species i at thermodynamic equilibrium. For condensation (Gi > ), the bulk condensation flux Ji is distributed into different size bins using the kinetic of condensation given by Seinfeld and Pandis (1998):
with numberbin the number of particles inside the bin, the mean diameter of the bin, Di the diffusion coefficient for species i in air, Mi its molecular weight, and f(Kn,α) a correction due to non-continuum effects and imperfect surface accommodation. For inorganic species (SO, NO, Cl−, NH, Na+), the thermodynamic equilibria are calculated with the ISORROPIA v1 scheme (Nenes et al., 1998); for the organic semi-volatile species, they are calculated using Pankow (1994) partitioning theory considering all organic aerosol species to be pre-existing organic aerosol. The condensation and evaporation fluxes calculated with the kinetic–thermodynamic equation are solved for a chemical time step of 5 min and using the iterative two-step numerical solver (Verwer, 1994) with two iterations. The Kelvin effect, increasing the vapour pressure over a convex surface, is not taken into account and would be difficult to implement in the bulk scheme calculation used. Tests showed that adding the Kelvin effect would only significantly affect the very small particles of a few nanometres in size.
SOAs are simulated based on the volatility basis set (VBS) scheme (Donahue et al., 2006), allowing functionalization (transfer of organic gases to lower-volatility bins) processes to be taken into account. The scheme was later extended to include fragmentation (transfer to higher-volatility bins) and non-volatile aerosol formation (Shrivastava et al., 2013, 2015), as adapted by Cholakian et al. (2018) for use in CHIMERE.
Initial reaction rates of BSOA (mono- and sesquiterpenes, isoprene) and ASOA (aromatics, olefins, alkanes) precursors with OH, NO3 and O3 and the yields of semi-volatile compounds for 4 volatility bins in the 1–1000 µg m−3 saturation concentration C* range are described in Sect. S1 and in Appendix H.11 of the CHIMERE model documentation (https://www.lmd.polytechnique.fr/chimere/docs/CHIMEREdoc_v2023.pdf, last access: 3 January 2025). The temperature-dependent reaction rates are those used in the SAPRC-07A chemical mechanism (Carter, 2010). Yields for both high- and low-NOx conditions for the four volatility bins are those given by Murphy and Pandis (2009) and Lane et al. (2008) and are adopted for CHIMERE in Zhang et al. (2013) and Cholakian et al. (2018). Following this initial formulation of the VBS scheme, these yields are uniform, independent of the initial oxidant attack (see discussion in Sect. 6). While the yield of these semi-volatile species is temperature independent, their actual saturation concentration follows a temperature dependence given by the Clausius–Clapeyron equation with an enthalpy ΔH of 30 kJ mol−1.
In the VBS scheme, formed semi-volatile species can undergo further gas-phase “chemical ageing reactions”. In functionalization reactions, these compounds are further oxidized and acquire lower volatility (Murphy and Pandis, 2009; Lane et al., 2008). Fragmentation processes correspond to the breakup of oxidized organic aerosol (OA) compounds in the atmosphere into smaller and thus more volatile molecules. Fragmentation occurs at a 75 % rate independent of the subsequent volatility (Shrivastava et al., 2015), leaving 25 % to functionalization. These percentages are based on the best agreement between simulated and measured SOA as described in Shrivastava et al. (2013). Finally, non-volatile aerosol species are formed in the particle phase, as the reactions mimic oligomerization reactions and formation of so-called glassy aerosol (Shrivastava et al., 2015). These processes have been included into CHIMERE by Zhang et al. (2013) (functionalization) and Cholakian et al. (2018) (fragmentation and formation of non-volatile SOA), considering a 1 h timescale for transformation of ASOA and BSOA species into non-volatile aerosol. They are described in Sect. S1 and in Appendix H.11 of the CHIMERE documentation (https://www.lmd.polytechnique.fr/chimere/docs/CHIMEREdoc_v2023.pdf, last access: 3 January 2025).
In the VBS scheme, primary organic aerosol is considered semi-volatile. Volatility profiles for traffic and residential emissions for nine volatility bins according to their saturation concentration C* ranging from 10−2 to 106 µg m−3 given by Robinson et al. (2007) are implemented in CHIMERE. Semi-volatile POA species transferred into the gas phase or organic species of intermediate volatile emitted in the gas phase can undergo chemical ageing reactions (functionalization, fragmentation and non-volatile species formation) as described before for ASOA and BSOA species. For POA-derived species, this process is only activated for compounds that have undergone three oxidation reactions (O3POA). Reaction rates and product yields are again taken from Robinson et al. (2007), Shrivastava et al. (2015), Zhang et al. (2013) and Cholakian et al. (2018). These reaction sets are given in Sect. S2 and in Appendix H.6 in the documentation of the CHIMERE model (https://www.lmd.polytechnique.fr/chimere/docs/CHIMEREdoc_v2023.pdf, last access: 3 January 2025). Note that POAs from fire emissions have been considered chemically inert, as uncertainties in the volatility distribution of fire emissions are large (Sinha et al., 2023).
2.2 Datasets for model evaluation
Datasets available to discuss the campaign period analysis and for model evaluation integrate ACROSS field campaign ground-based observations and larger-scale databases. In addition to ACROSS, several projects contribute to the multi-project initiative PANAME, with a centralized database developed by AERIS (https://paname.aeris-data.fr/, last access: 3 July 2024), such as the ACTRIS EU Green Deal project RI-URBANS (https://riurbans.eu/, last access: 3 July 2024).
In situ surface observations of the aerosol refractory and non-refractory chemical composition in the PM1 fraction and aerosol-based mixed-layer height (MLH; see Kotthaus et al., 2023, for a discussion of the atmospheric boundary layer (ABL) sublayer definition) were retrieved at the three ground-based sites of the ACROSS campaign:
- i.
The Paris Rive Gauche (PRG) site (48.8277° N, 2.3806° E) is hosted at the Lamarck building at Université Paris Cité in the southeastern part of the Paris administrative borders in a dense urban environment; instruments were installed on the seventh floor of the building.
- ii.
The SIRTA (Site Instrumental de Recherche par Télédétection Atmosphérique; 48.7090° N, 2.1488° E) site, located around 20 km southwest of the Paris administrative borders, is a suburban site due to its lower population density in a mixed environment of forest and urban areas as well as agricultural fields and traffic roads (Bedoya-Velásquez et al., 2019; Zhang et al., 2019; Chahine et al., 2018; Haeffelin et al., 2005).
- iii.
The Rambouillet forest supersite (48.6866° N, 1.7045° E; hereafter RambForest), is located around 50 km southwest of the Paris administrative borders in the middle of the Rambouillet national forest, which is a mixed forest with deciduous and evergreen trees. Measurements have been performed not only at the ground level, within the forest canopy, as part as the operations of the Portable Gas and Aerosol Sampling Units (PEGASUS) mobile facility, but also at the top of a 40 m high tower, above the canopy, which is about 25 m high.
Data from the three ACROSS measurement sites include the following:
-
Submicron (PM1) aerosol non-refractory composition (organic, nitrate, sulfate, ammonium, chloride) is measured either by a time-of-flight aerosol chemical speciation monitor (ToF-ACSM, Aerodyne Research Inc.; Fröhlich et al., 2013; 6 min resolution) at the PRG and SIRTA sites or by a high-resolution ToF aerosol mass spectrometer (HR-ToF-AMS, Aerodyne Research Inc.; DeCarlo et al., 2006; 3 min resolution) at RambForest (Di Biagio et al., 2025; Ferreira de Brito et al., 2023b, a). The uncertainty in the total non-refractory mass concentration from the ACSM is evaluated to be around 25 % (Budisulistiorini et al., 2014; Crenn et al., 2015).
-
Equivalent black carbon (eBC) concentrations from a dual-spot Aethalometer (AE33, Aerosol Magee Scientific, 1 min resolution) (Di Antonio et al., 2023b) were processed by applying a site-invariant multiple-scattering coefficient Cref of 2.45 as recommended by the pan-European ACTRIS (Aerosol, Clouds and Trace Gases Research Infrastructure) programme (ACTRIS, 2023; Savadkoohi et al., 2023).
-
Elemental carbon (EC) and organic carbon (OC) concentrations in the PM1 fraction obtained by thermo-optical analysis on quartz filter (Pallflex Tissuquartz) samples were collected in the daytime (from 04:00 to 20:00 UTC) and nighttime (from 20:00 to 04:00 UTC) at PRG and RambForest (Pereira et al., 2024), using a continuous high-volume aerosol sampler DHA-80 (DIGITEL enviro-sense, Switzerland), and were analysed following the EUSAAR-2 protocol (Cavalli et al., 2010). Organic matter (OM) was calculated assuming an OM-to-OC ratio of 1.8 (Sciare et al., 2011).
-
Refractory black carbon (rBC) concentrations at RambForest were obtained from a single-particle soot photometer (SP2, DMT, 1 min resolution) (Yu and Formenti, 2023).
-
The mixed-layer height (MLH) was derived automatically from profile observations obtained by a network of automatic lidars and ceilometers (ALCs) operated in synergy with the PANAME initiative (Kotthaus et al., 2023). At SIRTA, ALC profile data (Lufft CHM15k) are processed using the STRATfinder algorithm (Kotthaus et al., 2020). However, this algorithm has limited sensitivity below 230 m, making nighttime comparisons less reliable. The data also undergo additional quality control measures, developed in the context of RI-URBANS and the ABL Testbed project (https://ablh.aeris-data.fr/, last access: 3 July 2024).
-
PM1, PM2.5 and PM10 aerosol concentrations are obtained at PRG from a Fidas 200E instrument at 1 min resolution (Di Antonio et al., 2023c).
In addition to the surface observations of the ACROSS sites, the aerosol submicron non-refractory composition and eBC hourly data from ACSM and AE33 measurements over the whole of France have been extracted from the GEOD'AIR (GEstion des données d'Observation de la qualité de l'AIR) database (https://www.geodair.fr/, last access: 3 July 2024), which is fed by regional air quality monitoring networks. Measurements from nine sites were considered (Table S1). The AE33 eBC data were treated assuming a Cref of 2.45 (ACTRIS, 2023; Savadkoohi et al., 2023).
Hourly surface level observations of PM2.5, PM10, NO2 and O3 across Europe from the European Environmental Agency (EEA) database (EEA, 2025) were further considered to assess aerosol and ozone concentrations.
Finally, the Met Office Integrated Data Archive System (MIDAS) (Met Office, 2012), which includes Météo-France surface observations, was considered for the surface hourly meteorological parameters (temperature, pressure, relative humidity, wind direction and speed) used to validate the surface meteorology of the WRF–CHIMERE simulations.
2.3 HYSPLIT back trajectories
In this work, we use HYSPLIT as a tool to visualize the origin of air masses in a qualitative manner and to support the analysis of modelled pollutant fields. HYSPLIT v5.2.0 (Stein et al., 2015) back-trajectory simulations at the ACROSS ground-based sites (PRG, SIRTA and RambForest) were performed for the entire field campaign period using the WRF–CHIMERE meteorological fields as input for the domains shown in Fig. 1 (Siour and Di Antonio, 2023). The back trajectories have a time resolution of 10 min, which represents the exchange time between the WRF and CHIMERE models due to the coupling. The procedure of calculation is described in detail at https://across.aeris-data.fr/catalogue (last access: 3 January 2025).
3.1 Evolution of the meteorological situation during the ACROSS campaign – between heatwaves and oceanic flux
Here we give a first overview of the different meteorological conditions during the ACROSS campaign period based on in situ meteorological measurements at the suburban SIRTA site and aerosol measurements at the urban background PRG site and also at a broader scale from meteorological observations and analysis data over western Europe. Hourly averaged air temperatures at the suburban SIRTA site (Fig. 2b) allowed a broad classification into three periods: (1) a first heatwave period from 15 to 18 June with daily temperature maxima (Tmax) between nearly 30 °C and more than 36 °C; (1) a second long-lasting colder period from 19 June to 11 July with Tmax between 15 and 25 °C; and (3) a second heatwave period from 12 to 23 July with a mixture of very hot, but also colder, days, with Tmax varying between 22 and 38 °C. The relative humidity (RH) is strongly anti-correlated with temperature, as expected, and varied from as low as 20 %–30 % during the hottest days to more than 90 % during the colder nights. EUMETSAT satellite images available at https://www.wetterzentrale.de (last access: 11 April 2024) show mainly clear-sky conditions during 15 to 18 June and 12 to 18 July and mixed cloudy and clear-sky conditions from 19 June to 11 July and from 19 to 23 July over the Île-de-France region.
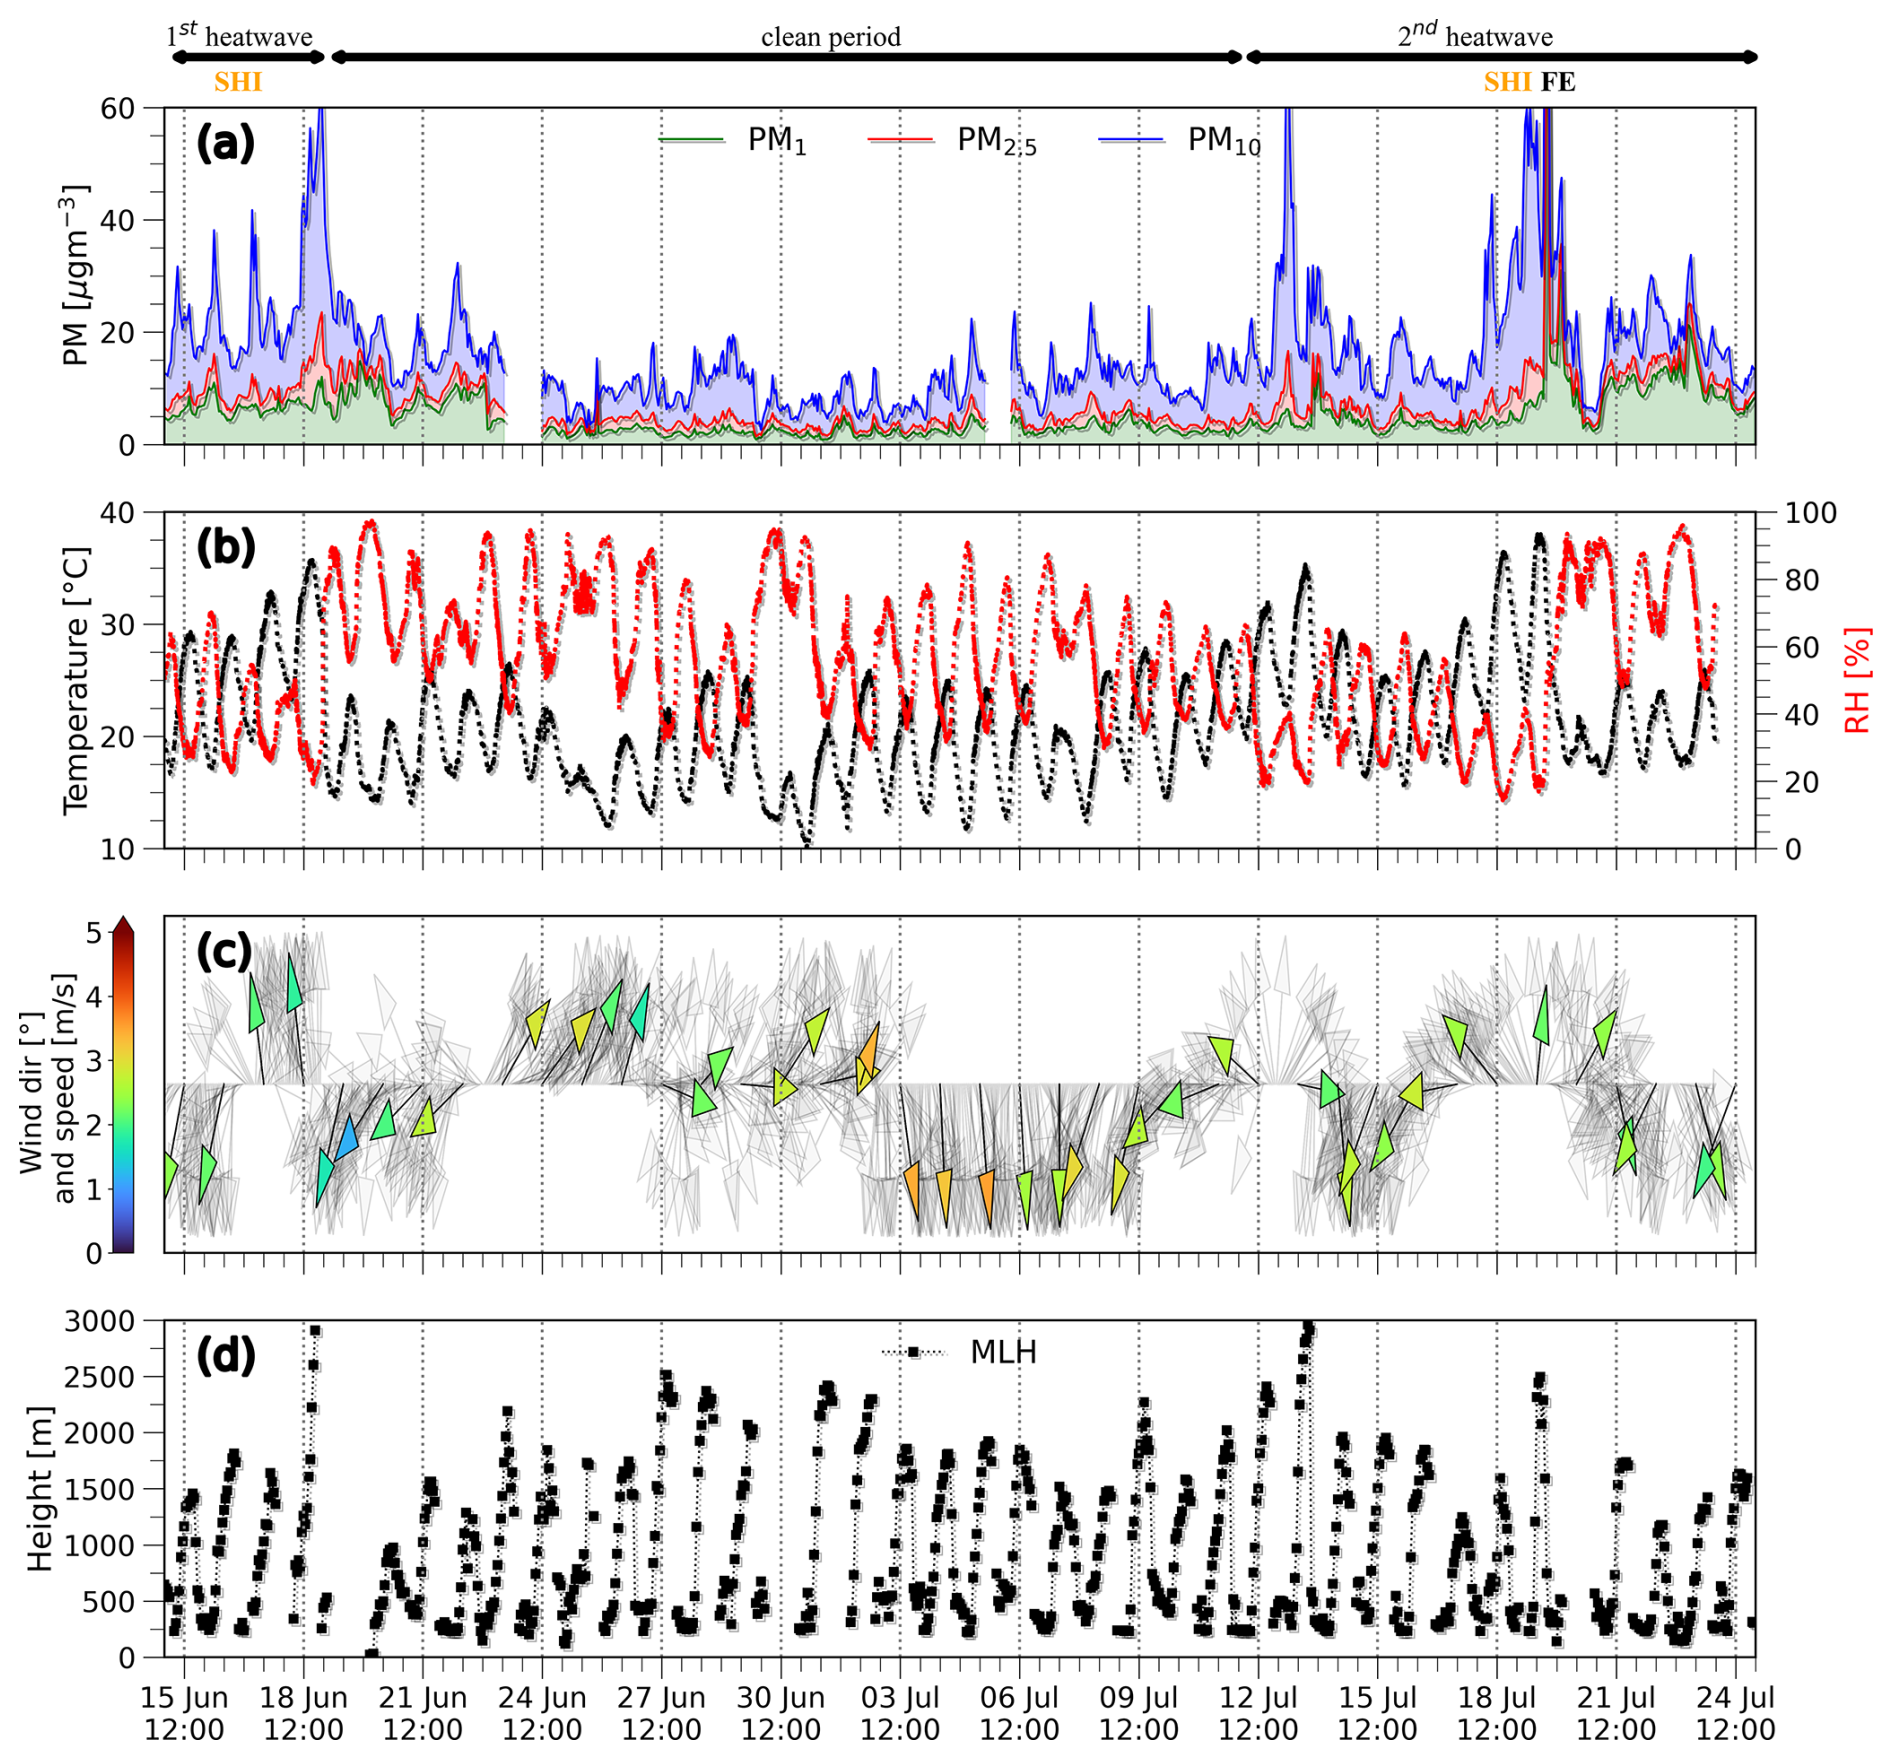
Figure 2Temporal variations in observations during the ACROSS campaign for (a) particulate matter concentration (PM1, PM2.5, PM10) at the Paris Rive Gauche (PRG) urban background site; (b) temperature and relative humidity at the SIRTA site; (c) wind speed and direction at the SIRTA site, where the shaded and coloured arrows represent the hourly and daily wind direction averages, respectively; and (d) the mixed-layer height (MLH) from Kotthaus et al. (2023), during the ACROSS campaign 2022. SHI stands for “Saharan dust intrusion”, and “FE” stands for “fire episode”. The arrows represent daily average winds.
3.1.1 First heatwave period (15–18 June 2022)
During the 2 hottest days of the first heatwave on 17 and 18 June, moderate winds from the southeast (SE) (Fig. 2c) were measured at the SIRTA site. This corresponds to a generally southerly advection of hot and dry Mediterranean air masses and possibly a Saharan origin linked to a cut-off low located west of the Iberian Peninsula and a ridge over France visible in the 500 hPa geopotential map of 18 June at 12:00 UTC (Fig. 3a). Daily temperature maxima over France were mostly over 35 °C except for in some mountainous or coastal areas, even reaching above 40 °C in the southwest (SW) of France (Fig. 3o). This southerly advection is also well depicted in the 850 hPa temperature map (not shown), making evident that the French heatwave area was well connected to the Saharan heat reservoir. Linked to this is long-range transport of Saharan dust to northern France visible through a large contribution to coarse dust aerosol (up to 40 µg m−3, PM10–PM2.5 concentrations, Fig. 2a) at PRG on 18 June, presumably indicative of coarse dust aerosol.
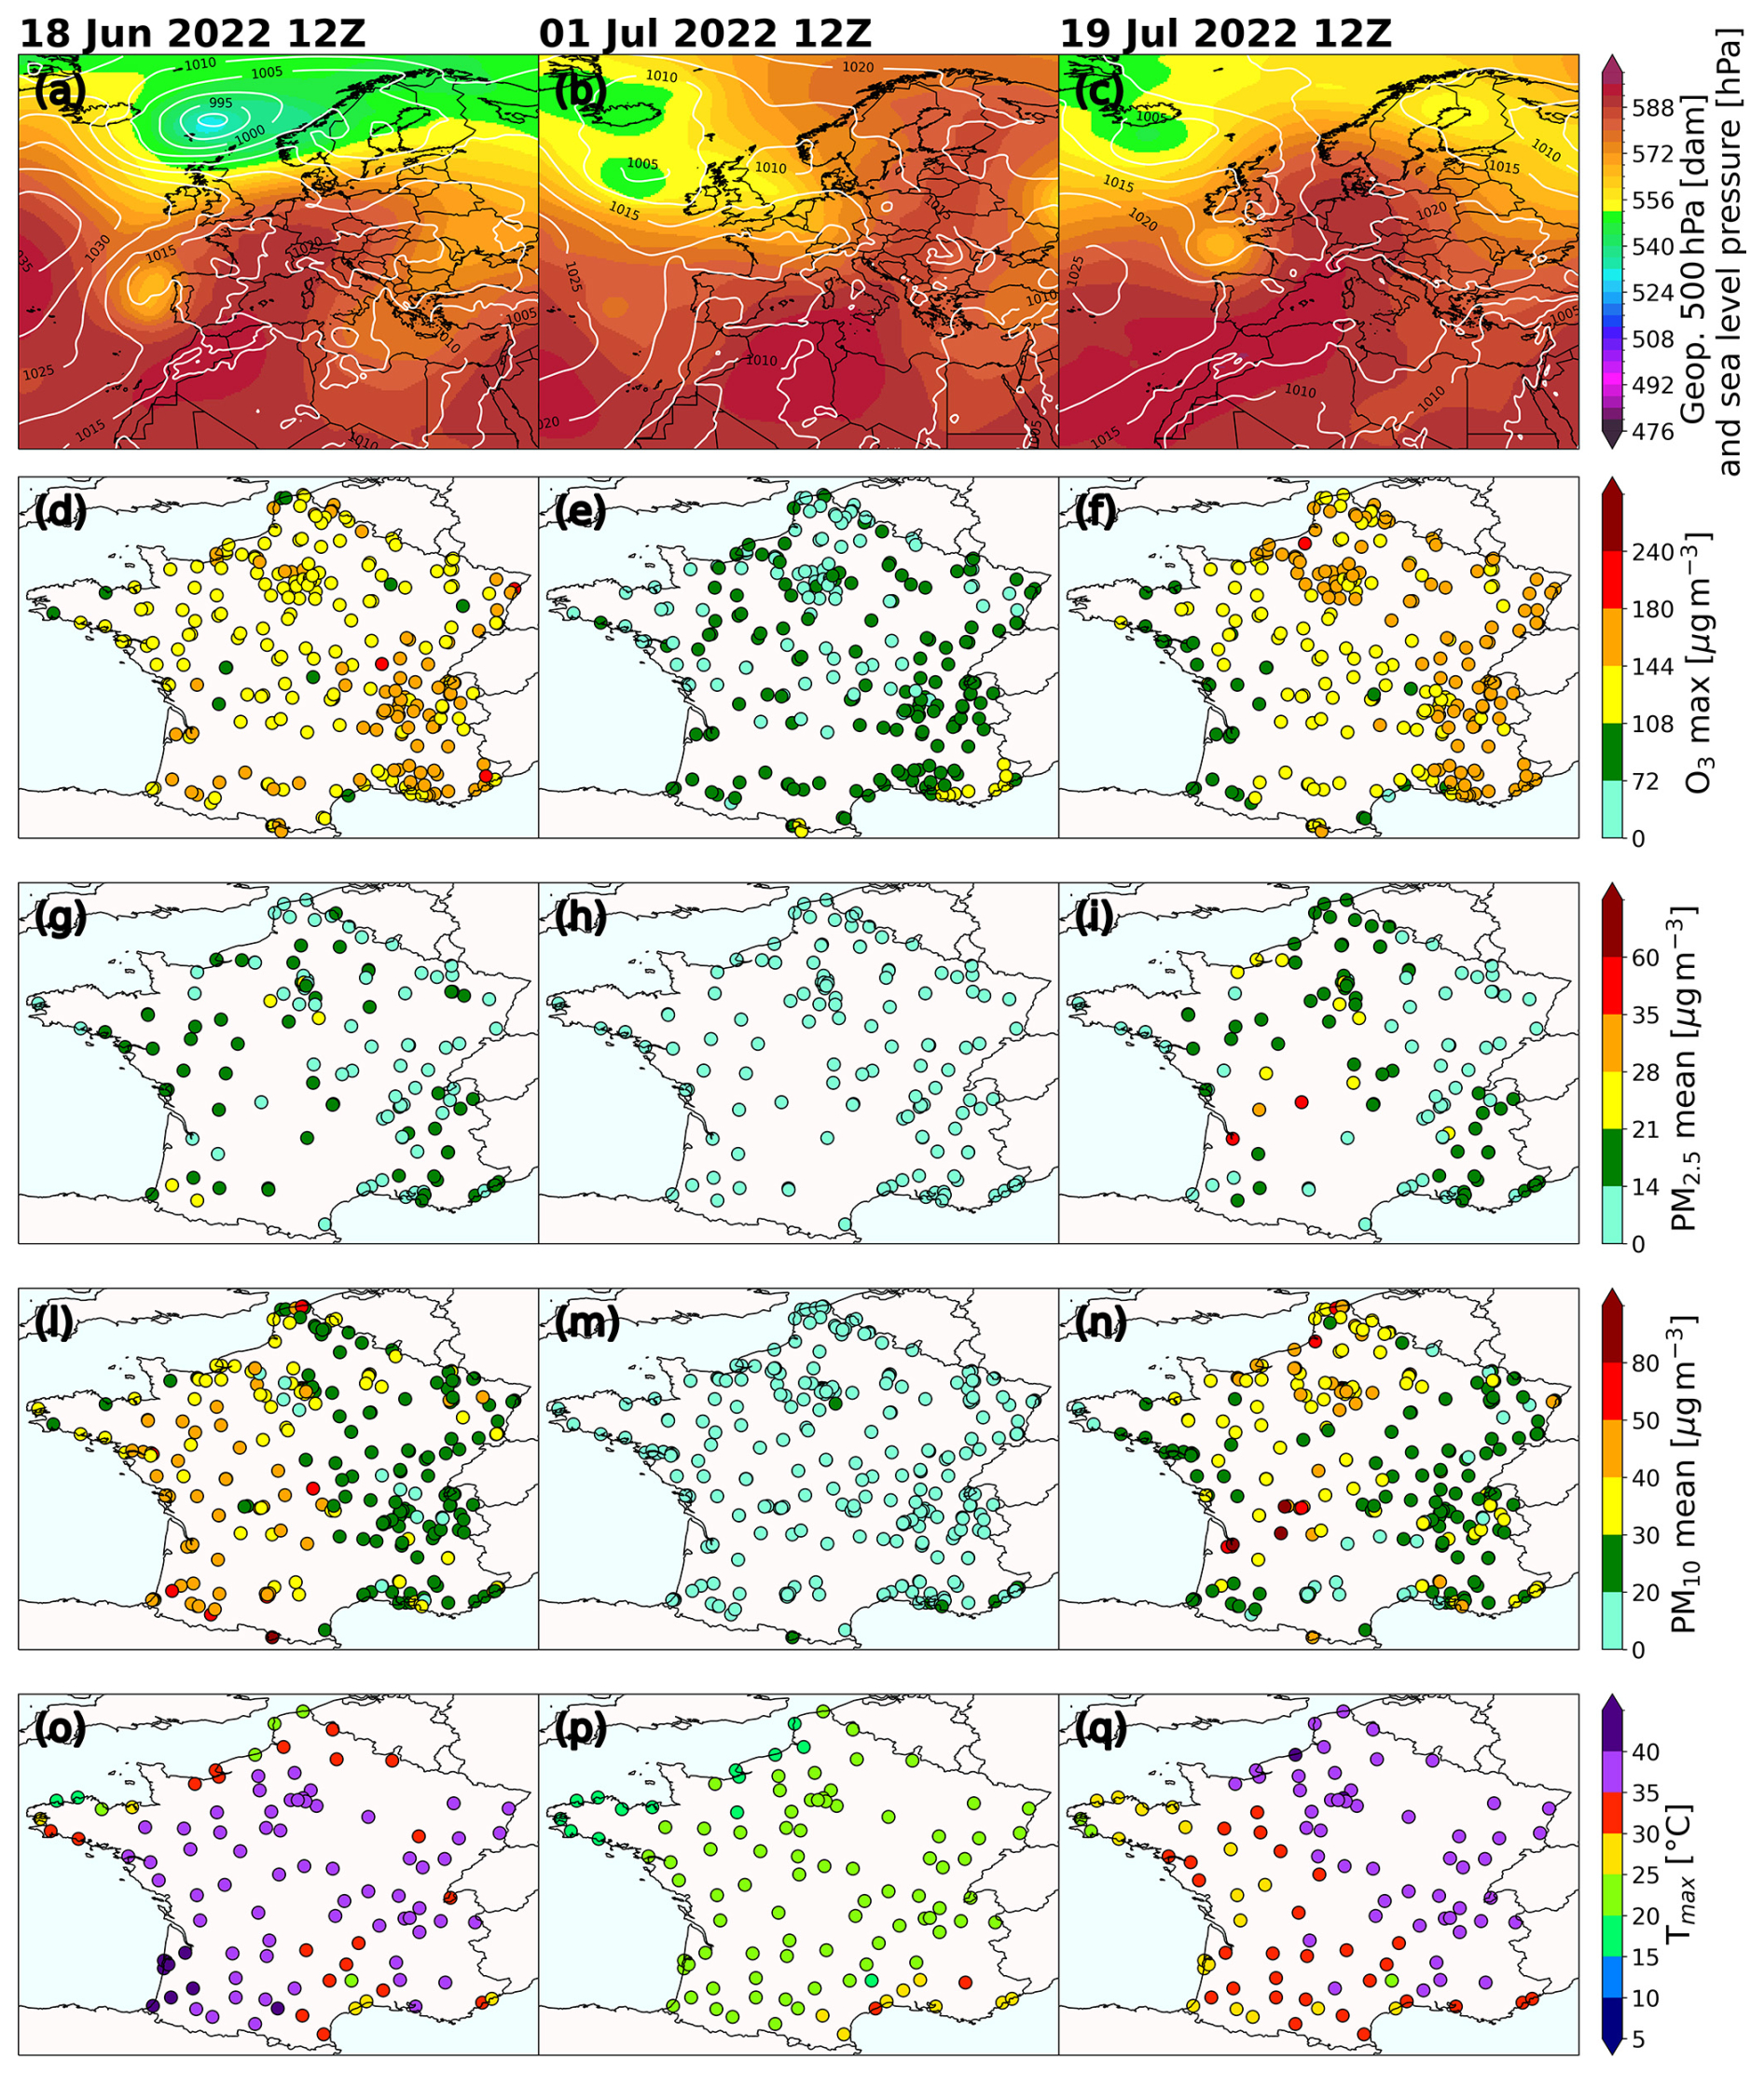
Figure 3Several meteorological variables and major pollutant concentrations at 12:00 UTC for (left column) 18 June, (middle column) 1 July and (right column) 19 July 2022, representative of the three main periods observed during the ACROSS campaign. Panels (a)–(c) represent geopotential height and surface pressure from the ERA5 reanalysis (Hersbach et al., 2023b, a); panels (d)–(f) represent the daily maximum O3; panels (g)–(i) represent the daily mean PM2.5; panels (l)–(n) represent the daily mean PM10; panels (o)–(q) represent the daily maximum temperature. The O3, PM2.5 and PM10 data are from the EEA database, while temperature data are from the MIDAS database.
3.1.2 Clean period (19 June–11 July 2022)
During the following colder and cleaner period, different sub-periods could be identified based on wind speed and direction variations: initially from 19 to 22 June, with moderate winds (1–3 m s−1) coming from the north (N) to NE bringing continental air masses to Paris, in addition to local pollution, resulting in still-elevated PM2.5 levels of 10 to 15 µg m−3 that are nearly comparable to those during the first heatwave period. Then, from 23 June to 2 July, southwesterly and westerly winds brought clean oceanic air masses to the sites and northern France. A typical 500 hPa geopotential field for this period (Fig. 3b) shows a low-pressure system extending from Iceland to the British Isles and Benelux and a high-pressure system over the Mediterranean Sea, resulting in the westerly flow. Daily temperature maxima were in the 15–20 and 20–25 °C ranges over France (Fig. 3p). A last period from 3 to 11 July, characterized again by mainly northerly and slightly stronger winds (3–4 m s−1), led again to clean conditions (PM2.5 at PRG from 3–7 µg m−3).
3.1.3 Second heatwave (12 to 25 July 2022)
The second heatwave period from 12 July onwards again showed varying meteorological conditions but included four hot to very hot days with Tmax between 32 and 38 °C (Fig. 2b) and in general southerly winds of moderate speed (from 2 to 3 m s−1, Fig. 2c). For the hottest day on 19 July, the 12:00 UTC 500 hPa geopotential field shows a cut-off low west of Brittany and a pronounced ridge extending northwards up to southern Scandinavia (Fig. 3c). The 850 hPa maps again show a warm tongue over western and central Europe related to the Saharan heat reservoir (not shown). This ridge system is moving eastwards, letting, at its rear, relatively cold air masses enter southwestern France, with Tmax in the range of 25–35 °C, while Tmax is in the range of 35–40 °C over eastern France (Fig. 3q). The southward winds are again linked to Saharan dust transport for 13 and 19 July, again indicated by large coarse PM10 of about 50 µg m−3 at the PRG site (Fig. 2a). The widespread dry conditions over western France induced strong forest fires (Menut et al., 2023), which were subsequently advected to the Paris region for several hours in the evening of 19 July and led to enhanced PM2.5 concentrations (> 60 µg m−3 at the PRG site).
3.2 Evaluation of the WRF meteorology
The ability of the WRF model to simulate major meteorological variables was assessed for the following parameters: the mean and maximum daily temperature, wind speed and direction, and mixed-layer height (MHL). Daily maximum air temperature at 2 m above ground level (a.g.l.) (Tmax) is in general well simulated, with biases during the period below ±1 °C for the majority of the sites. This statement holds for both the entire campaign period and the three previously identified meteorological periods (Fig. 4a–d). Larger biases (exceeding ±2 °C) are encountered for mountainous areas along an axis from the eastern Pyrenees to the Alps, through the Massif Central and the French Jura. Considering the average of all sites, the mean bias error (MBE) for the whole period is −0.53 °C, which is slightly larger for the first and second heatwave periods (−0.74 and −0.64 °C, Fig. S4). The average correlation over the whole period and across all sites is 0.93 (Fig. S3). Daily maximum temperatures are especially well simulated for the high-temperature periods, as can be seen for the 90th percentiles in Fig. S4. For the mean daily temperature, differences between simulations and observations are in general smaller than those for Tmax (MBE = −0.32 ,°C, Fig. S4e).
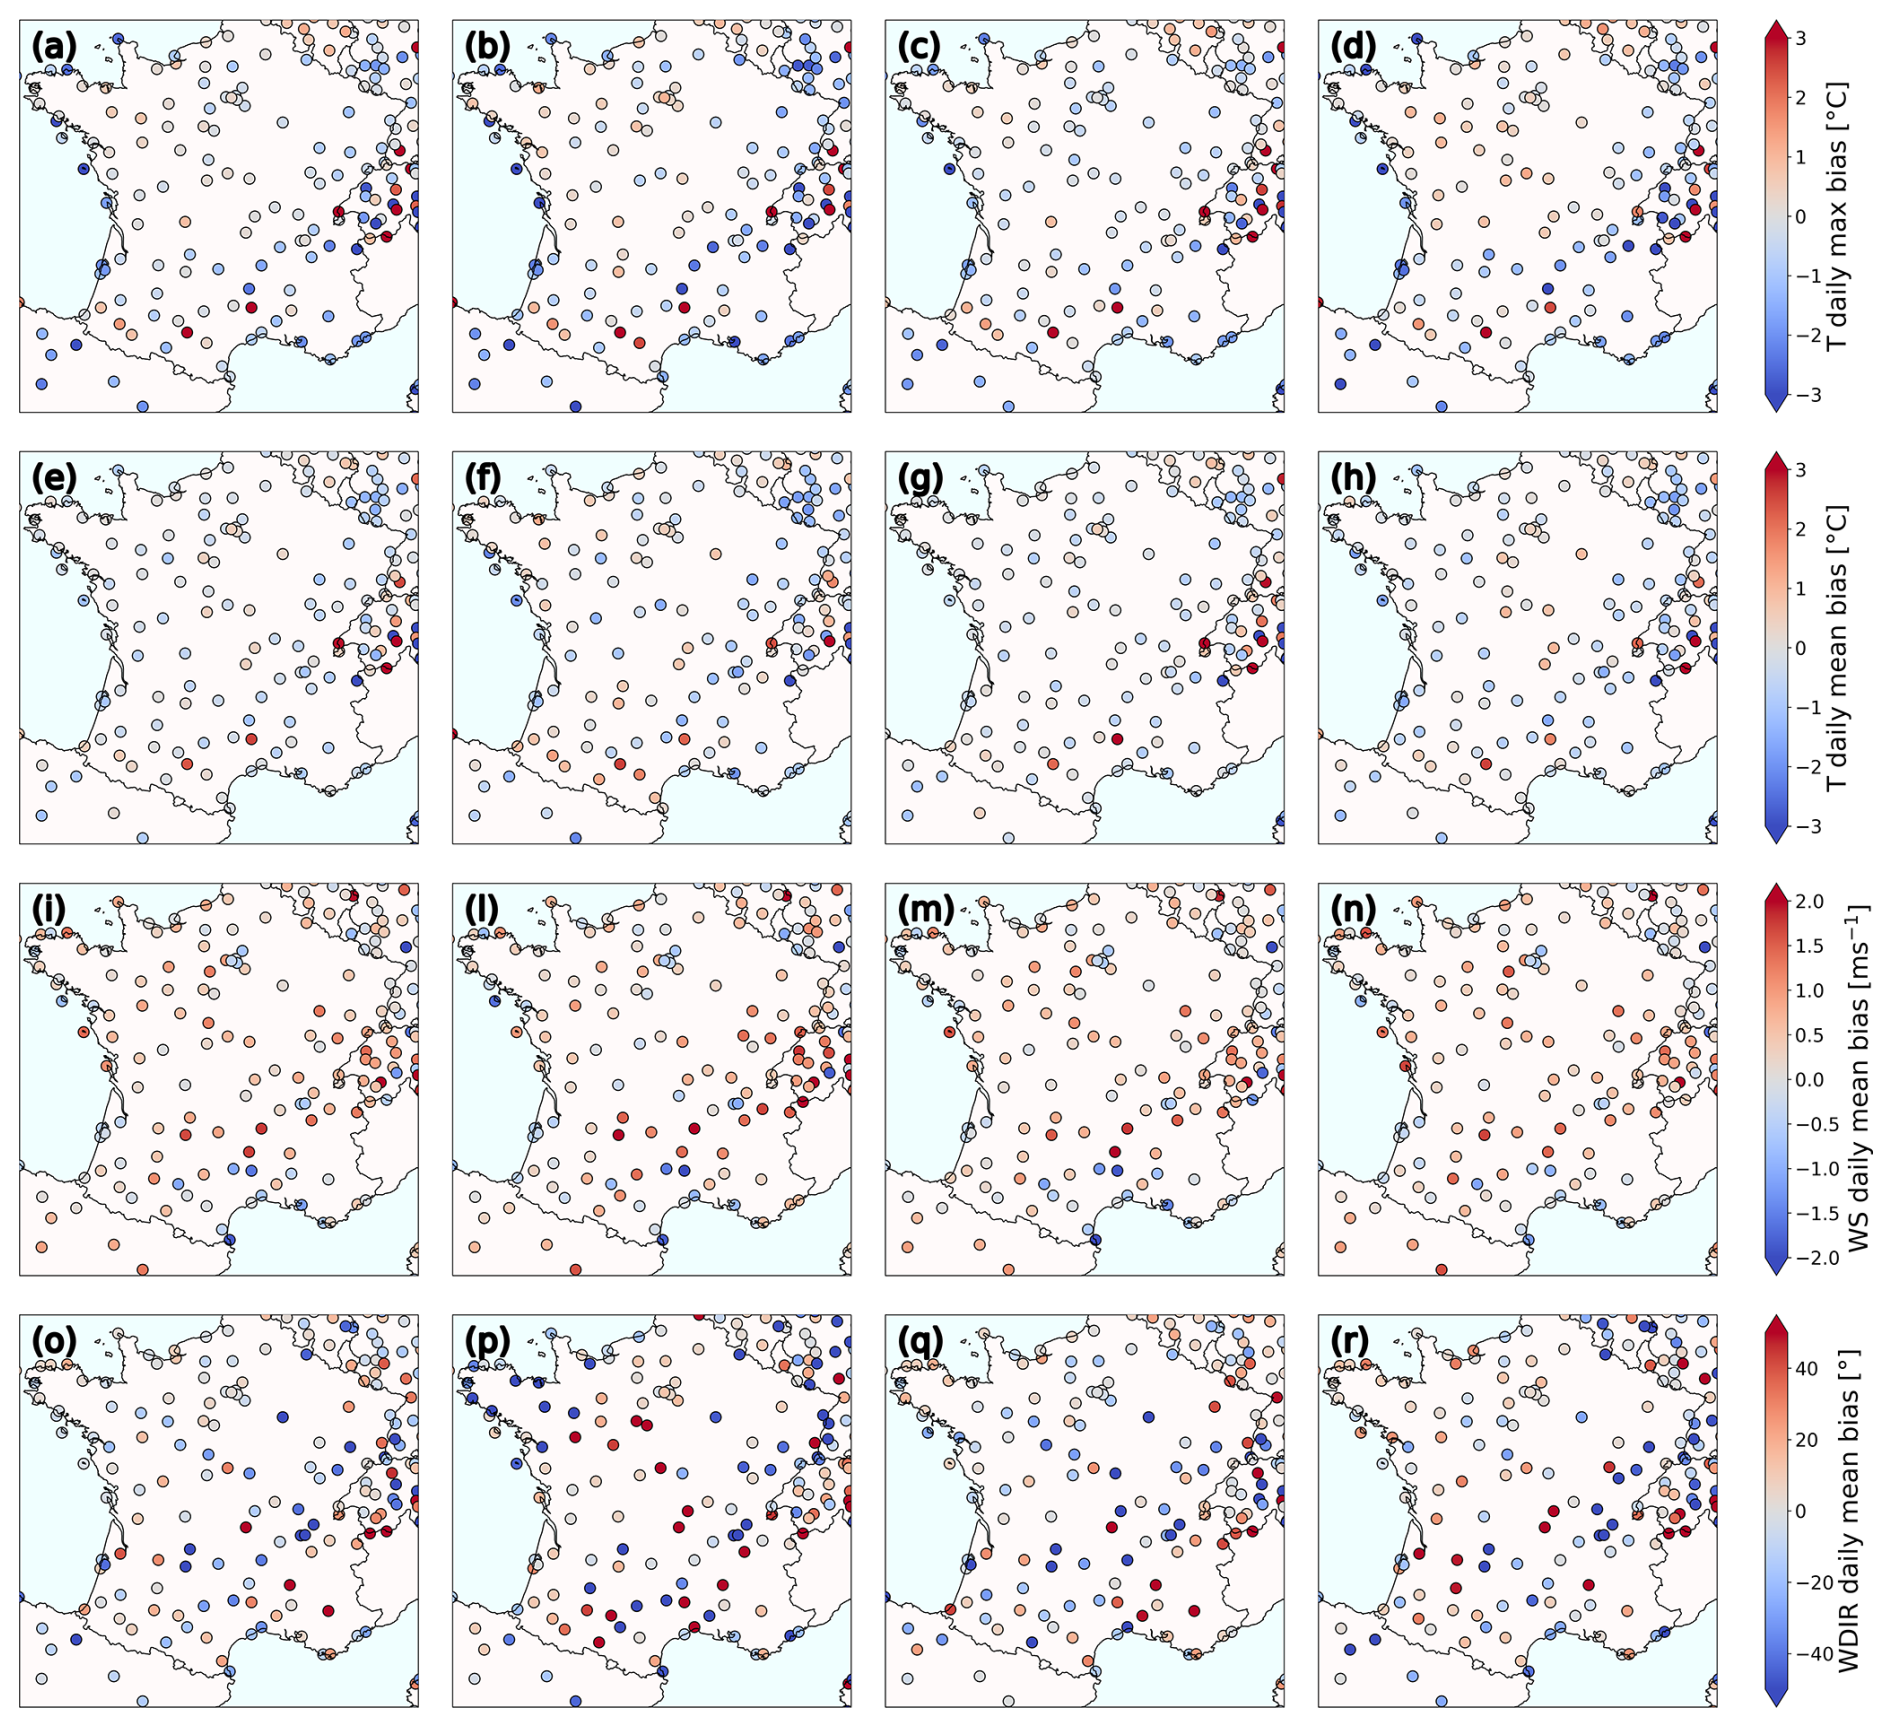
Figure 4Daily bias obtained by comparing model output to observations from the MIDAS database for (left column) the full period, (middle left column) the first heatwave, (middle right column) the clean period and (right column) the second heatwave for the (a–d) max temperature, (e–h) mean temperature, (i–n) wind speed (WS) and (o–r) wind direction (WDIR).
Concerning the 10 m surface wind speed, a slight overestimation is generally observed for the ensemble of sites with respect to MIDAS observations: biases are most often within the ±1 m s−1 range for the different periods (Fig. 4i–n). On the contrary, for the Île-de-France region, a slight underestimation of up to about −0.5 m s−1 is noted for most of the sites. On average for all sites in the model domain, a positive bias of +0.3 m s−1 is observed when compared to the MIDAS sites (Fig. S4i). This overestimation is more pronounced for light-wind days. For both wind speed and wind direction, the correlation is above 0.9 (Fig. S3). Average daily RMSE values for the above meteorological variables are also reported in Fig. S5, showing values of less than 1.5 °C for daily max and mean temperature, about 1 m s−1 for the daily mean wind speed, and less than 10° for the daily mean wind direction over the Île-de-France region for the full campaign period.
The observed daily evolution of the MLH at the suburban SIRTA site is well reproduced overall by the planetary boundary layer height (PBLH) derived from WRF model fields, with daily maxima in the early afternoons and minimum values at night (Fig. 5a). Correlations of hourly values are 0.77, 0.92 and 0.88 for the three periods, respectively (Fig. 5b–d). Daily maxima are captured (±200 m) for the majority of days; however, for about a third of cases, the simulated PBLH remains below the observed MLH by more than 200 m. An inaccurate simulation of PBLH can lead to a poor representation of surface aerosol concentrations (Du et al., 2020). This could be the case for the 2 very hot days with Tmax higher than 33 °C (18 June and 13 July); the observed MLH at SIRTA nearly reached 3 km, while simulated PBLHs were only 1600 and 1900 m, respectively. For 18 June, it is generally challenging to define the MLH that was derived using atmospheric aerosol as a tracer because, on this day, the elevated layer of Saharan dust was entrained into the convective boundary layer during the day. The MLH observational product is hence associated with a certain uncertainty on that day, which could explain the discrepancy in the PBLH determined from model data using a thermodynamic approach. On 13 July, no elevated aerosol layer was present above the atmospheric boundary layer and the observed MLH was very well defined. For this day, the underestimated simulated PBLH could contribute to the overestimated OA peak (Fig. 9a). Further investigation is needed to understand the lower PBLH obtained from the model results. Given the MLH measurement product analysed here is mostly limited to layer height information above 230 m (Kotthaus et al., 2020), insights into the nocturnal stratification remain limited. The simulated PBLH frequently reports values below 200 m a.g.l. and as low as 20 m, i.e. the first possible level from WRF. These consistent nighttime biases are more a result of the measurement product limitations, and no conclusions can be drawn about the uncertainty in the modelled nocturnal layer heights from this comparison.
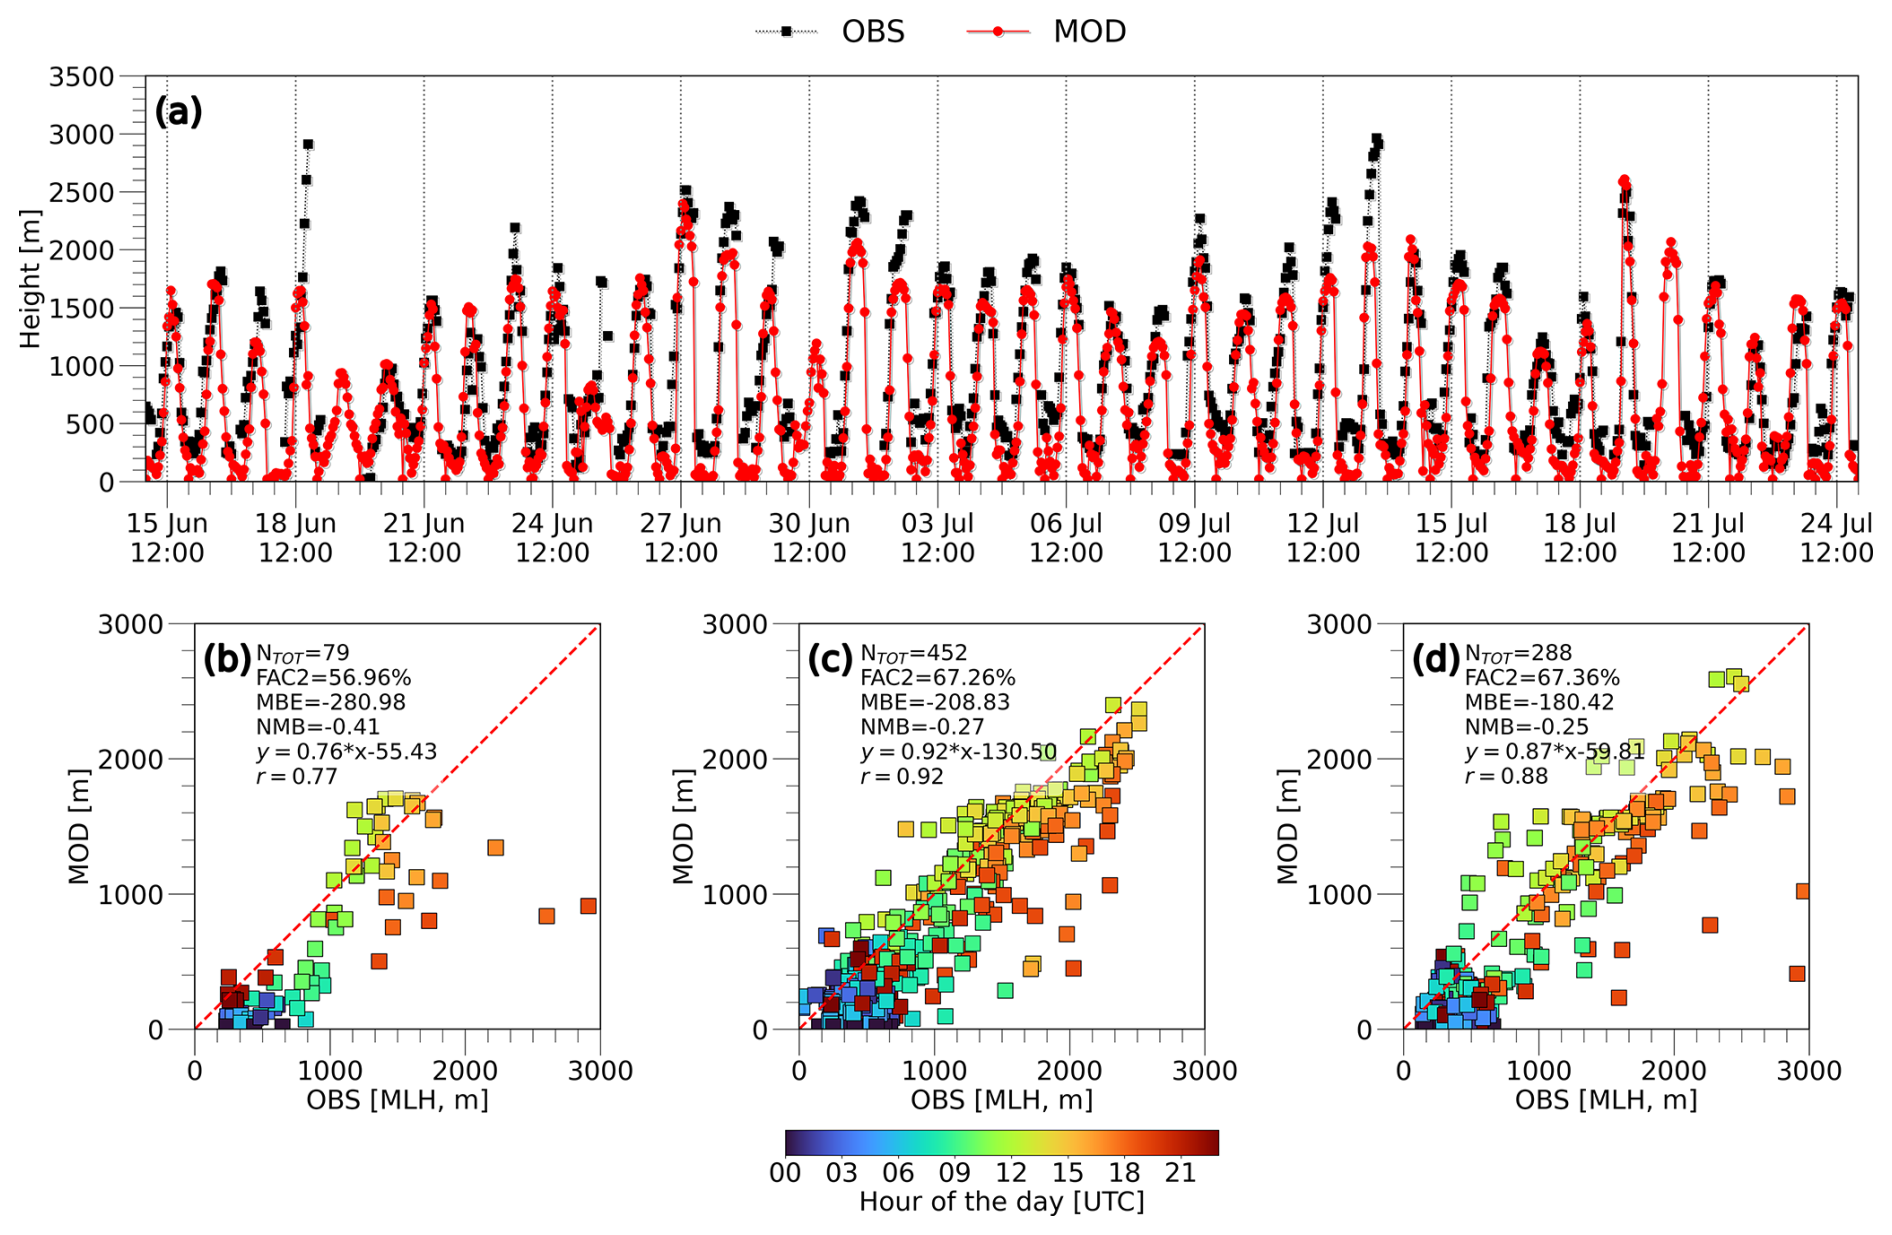
Figure 5(a) Comparison of the mixed-layer height (MLH) time series at SIRTA between model simulations (MOD) and observations (OBS); scatter plots of the modelled PBLH versus observed MLH, coloured by the hour of the day for the first heatwave (b), the clean period (c) and the second heatwave (d). FAC2 denotes the fraction of points within a factor-of-2 limit.
4.1 Analysis of regulated pollutants at a regional scale over France
In this section, the broad features of the evolution of major pollutants, O3, NOx, PM2.5 and PM10, at the regional scale over France during the campaign period are presented. We rely on observations from the French air quality networks (in particular on sites representing background conditions) for examples of typical or significant days during the three periods (Fig. 3). First we analysed the spatio-temporal evolution of the daily ozone maximum (O3max) as a tracer of photo-chemical activity during the three periods (Fig. 3d–f). As expected, O3max is much larger during the heatwave days than during the clean period (Ancellet et al., 2024) due to pollution accumulation and continental transport. On 18 June, the day with the largest O3max values during the first heatwave period, daily ozone maxima were in the range of 108–144 µg m−3 for western and central France including the Île-de-France region. They were in the 144–180 µg m−3 range in southeastern France, where some sites exceeded the French pollution information threshold of 180 µg m−3 (hourly mean). Nevertheless, this heatwave period did not correspond to a major ozone pollution episode in the Île-de-France region and the northern half of France, despite hot temperatures and low winds. HYSPLIT backward trajectories (arriving at 12:00 UTC in the centre of Paris, 500 m height; Fig. S2, top) show that air masses had turned clockwise around the Île-de-France region. The air masses had stayed over relatively low emission areas over rural France and the south of England on the 2 previous days, which may explain the relatively moderate ozone peaks.
During the following intermediate clean period, air masses were of oceanic origin, with daily ozone maxima below 108 and even down to 72 µg m−3 on 1 July. During the second heatwave, on 19 July, daily O3 maxima showed a pronounced SW–NE gradient. In northern France (including Île-de-France) and southeastern France, values were in the 144–180 µg m−3 range, while they remained below 108 µg m−3 along the SW French coastline (Fig. 3e). This pattern was in good spatial correlation with the Tmax field for this day (Fig. 3f). Indeed, the ozone heat pools moved eastwards, allowing clean oceanic air masses to enter into SW France on their backs.
For particulate matter (PM2.5 in Fig. 3g–i, PM10 in Fig. 3l–n), concentrations were again larger during the heatwave periods. On 18 June, daily average PM10 concentrations showed a pronounced E–W gradient, with values in the eastern part of the country mostly in the 20–30 µg m−3 range, while they reached 30–40 µg m−3 in the NW and 40–50 µg m−3 in SW France. Those elevated values are most likely due to dust transport from the Sahara, considering the enhanced simulated AOD for this day over SW France and the Mediterranean region (Fig. S2, bottom row), and are concomitant with heat advection from the same region. As already mentioned, PM10 peaks are also observed at the PRG urban site during the afternoon of 18 June (Fig. 2a). HYSPLIT back trajectories for this day starting at 2 km height show air masses originating in Morocco 3 d before (Fig. S2, top). The PM E–W gradient is still visible for PM2.5, daily average concentrations being in the range of 0–14 µg m−3 for most of the sites in eastern France, while it is in the range of 14–21 µg m−3 for many sites in the western part and even in the 21–28 µg m−3 range for some sites in the Île-de-France region.
During the intermediate clean period, on 1 July, the PM2.5 daily averages were below 14 µg m−3 (Fig. 3h) and the PM10 below 20 µg m−3 (Fig. 3m).
During the second heatwave, the largest PM2.5 daily averages above 35 µg m−3 occurred at several sites in SW France (Fig. 3i) due to the high fire activity in this region, caused by repeated dry and hot weather conditions. They were still enhanced in Île-de-France and the NW of France, in the 14–21 and 21–28 µg m−3 ranges, respectively, probably partly related to fire plume transport to these regions (see discussion in Sect. 5.2). PM10 daily averages show large values at the same sites in SW France (PM10 higher than 30 µg m−3), probably again due to long-range dust transport (Fig. 3n).
4.2 Model evaluation for major pollutants at the French scale
This section presents the evaluation of the WRF–CHIMERE model simulations' ability to reproduce the absolute concentrations of ozone, NO2, PM2.5 and PM10 and their spatio-temporal variability at the 6 km horizontal resolution.
The statistical analysis over the whole campaign period indicates that the daily maximum ozone concentrations are reasonably well simulated by the WRF–CHIMERE model, which is able to represent their spatial and temporal variability. For most of the French sites, negative O3 biases fall into the 0–5 µg m−3 range, while they reached up to 20 µg m−3 during the first heatwave in the Île-de-France region (Fig. 6a–d). They are also larger in mountain regions, such as over the Alps. For all sites, ozone shows an average mean bias error (MBE) of −3 µg m−3, corresponding to a normalized mean bias (NMB) of −4 % (Fig. S7a). This result shows that the agreement is rather homogeneous for the different percentiles of ozone concentrations. For all the sites and daily ozone maxima, the spatio-temporal correlation is 0.84 (Fig. S6a), with relatively small spatial heterogeneity (Fig. S6a). This is similar to results of an earlier European-scale comparison during three spring and summer seasons (r= 0.83–0.84) (Honoré et al., 2008).
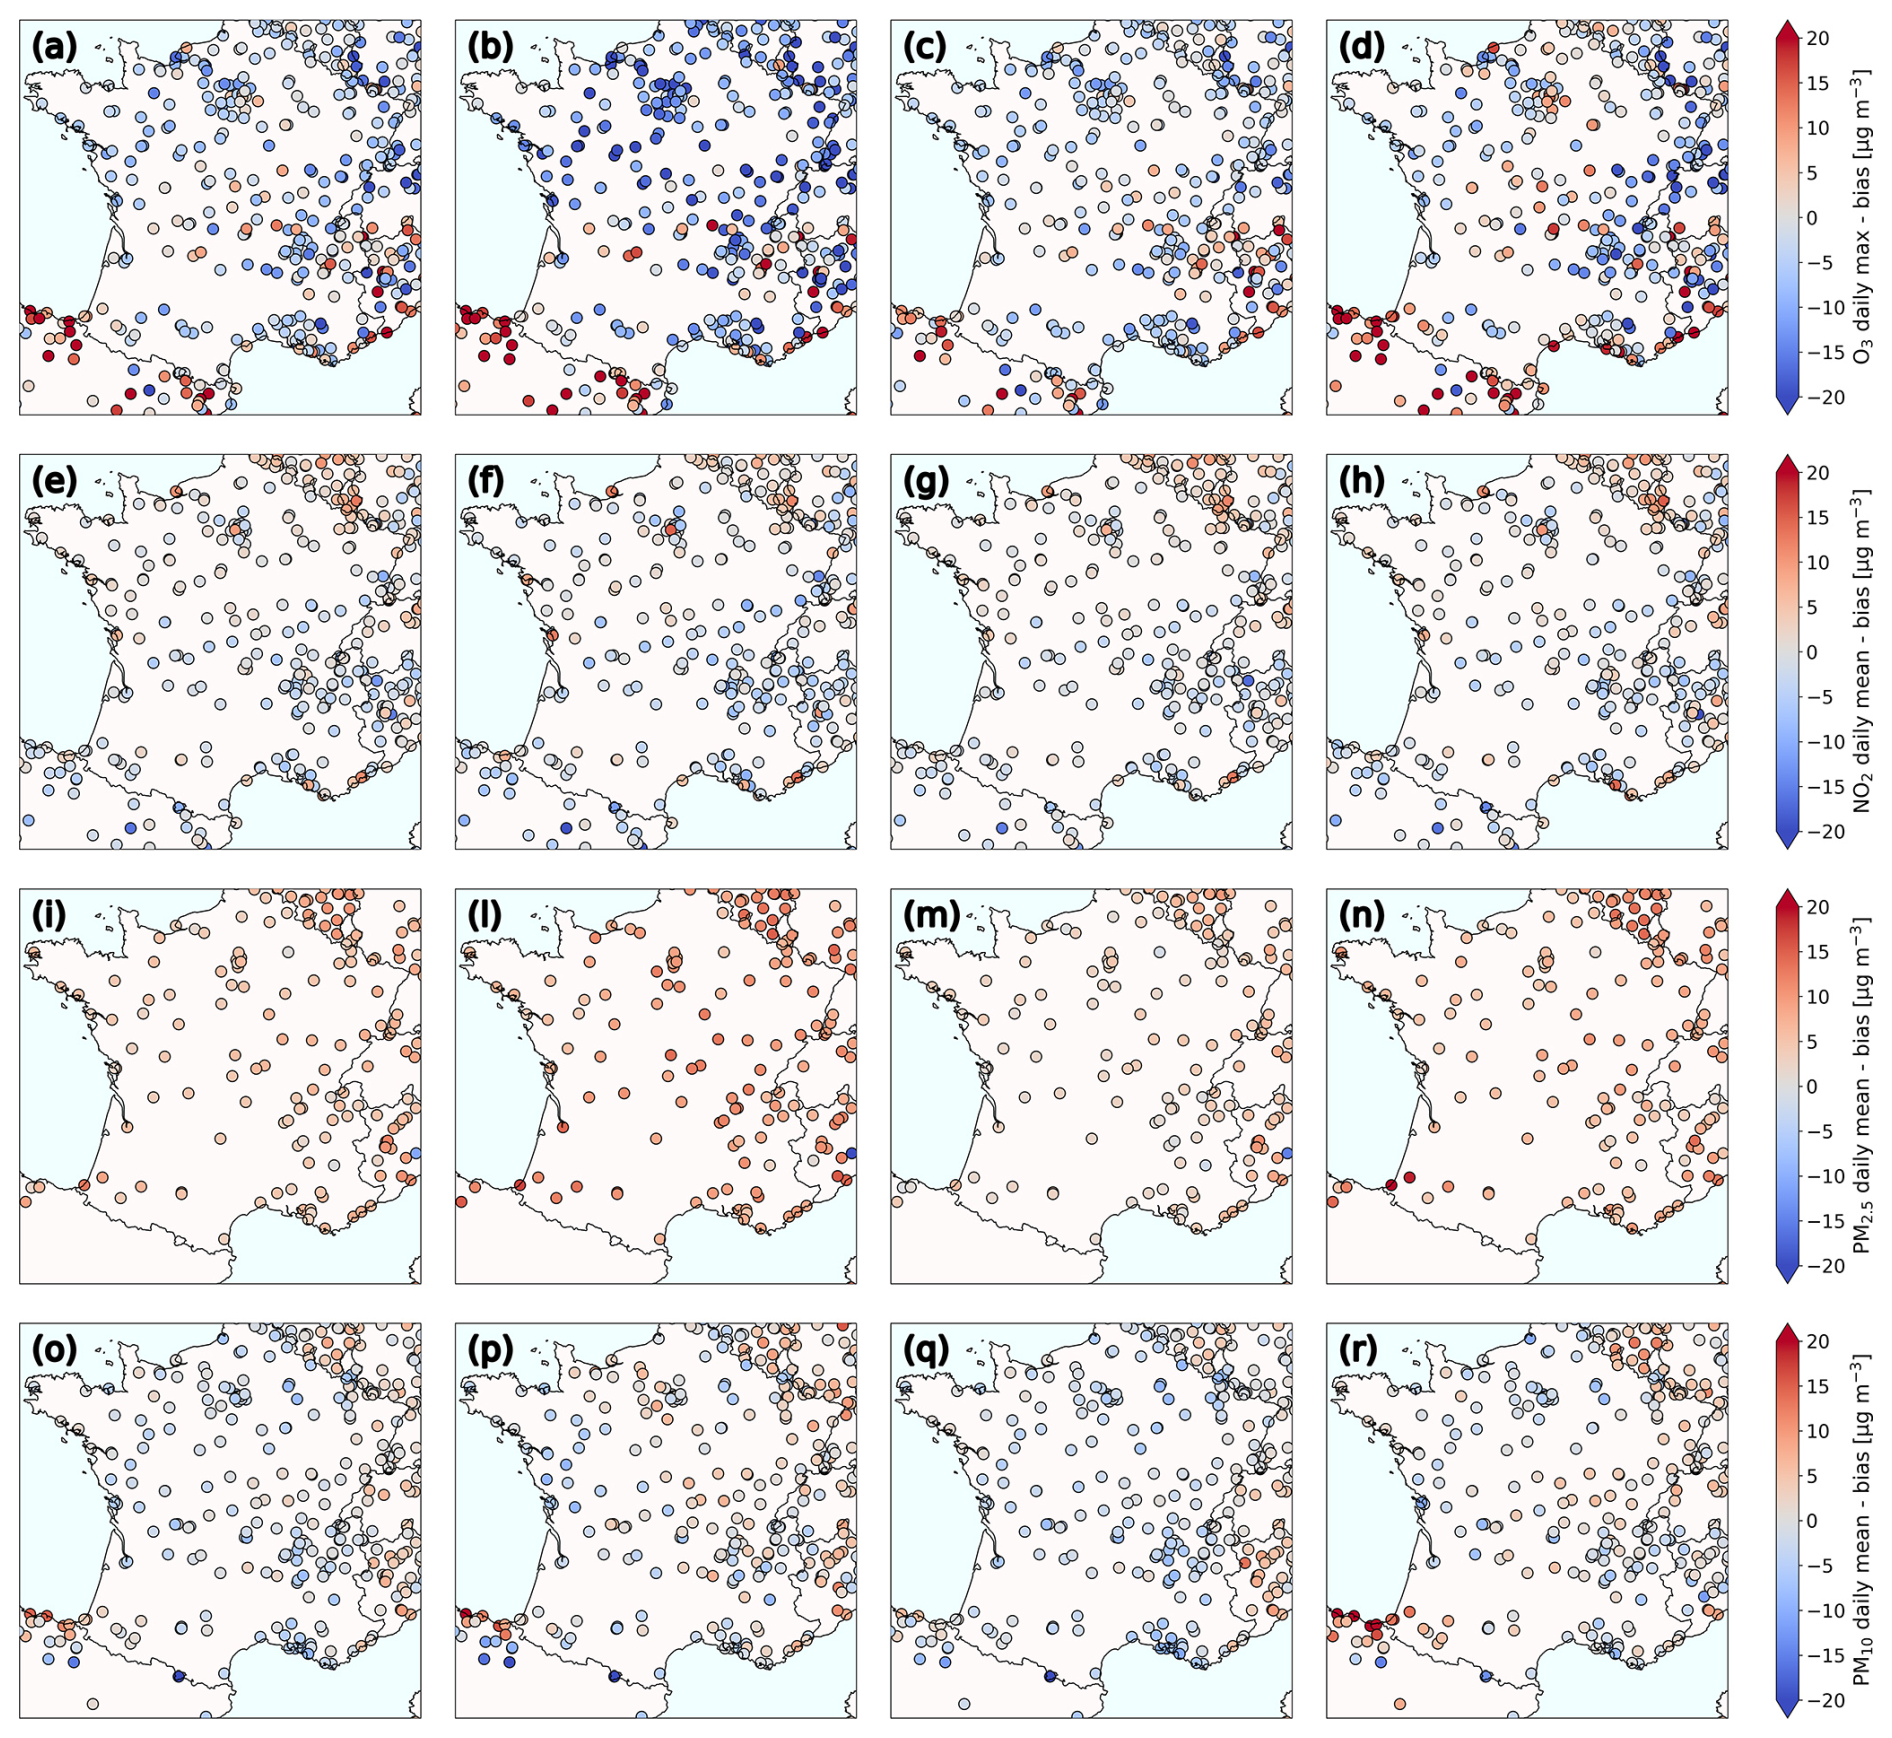
Figure 6Daily biases obtained by comparing model output to the EEA observations for the full period (left column), the first heatwave (middle left column), the clean period (middle right column) and the second heatwave (right column) for the (a–d) O3 daily max, (e–h) NO2 mean, (i–n) PM2.5 mean and (o–r) PM10 mean.
For NO2 daily means, average biases are between −5 and +5 µg m−3. Negative biases prevail in the Île-de-France region (Fig. 6e–h), maybe due to the fact that urban features are not well enough resolved in the simulation with a 6 km resolution. The mean bias over all sites is −0.7 µg m3 (Fig. S7e), mean NMB is −6 % and correlation is 0.51 but with a strong spatial heterogeneity. As a matter of fact, sites in the Alpine regions in SE France or over the Massif Central mountains in central France show close-to-zero or even negative correlations, indicating that the WRF–CHIMERE model does not capture the NO2 variability well for sites affected by complex orography (Fig. S6e).
For PM10, biases in average concentrations during the campaign are similar for most of the sites and close to zero or slightly negative (down to −5 µg m−3) (Fig. 6o). The mean bias (MBE) is negative (−1.3 µg m−3) and corresponds to an NMB of −8 % (Fig. S7o). The negative bias is larger during the clean period (NMB; −17 %), while it is only −5 % and +2 % during the first and second heatwaves (Fig. S7p and r). The fraction of comparisons with a difference of less than a factor of 2 is always large, generally above 90 %. Correlation is high (r= 0.8), with a rather homogeneous distribution among sites (0.6–0.9).
Conversely, the PM2.5 fraction is overestimated in WRF–CHIMERE simulations. For most of the sites, this overestimation falls within the 0–5 µg m−3 range on average for the whole campaign (Fig. 6i), but it is even larger during the first heatwave and in the Île-de-France region (5–10 µg m−3, Fig. 5l). The mean average positive bias is 6.0 µg m−3 (MBE), which corresponds to an NMB of +73 % (Fig. S7i). The average temporal correlation is as large as 0.84, with a rather homogeneous distribution among the sites (0.7–0.95, Fig. S6i); thus WRF–CHIMERE is able to reproduce the spatio-temporal PM2.5 variability despite this overestimation. Due to the slight underestimation of PM10 and the pronounced overestimation of PM2.5, the coarse PM (PM10–PM2.5) is underestimated, even though an explicit comparison was not performed.
4.3 Analysis and model evaluation of aerosol chemical composition at the French scale
The aerosol chemical composition is analysed to provide further insight into the submicron (PM1) fraction. The analysis is based on ACSM and Aethalometer (AE33) measurements performed at an approximate PM1 cut-off sampling head employed within the French GEOD'AIR network (see Table S1) and is compared to the simulated submicron aerosol composition. Figure 7 shows overall broad agreement in the simulated and observed chemical composition. For most of the sites, the organic fraction makes up 60 %–70 % of the PM1 mass, followed by sulfate (15 %–25 %), nitrate, ammonium and black carbon (less than 10 % with the exception of nitrate for one site). These observations are compared to size bins integrated up to 1.1 µm in CHIMERE simulations.
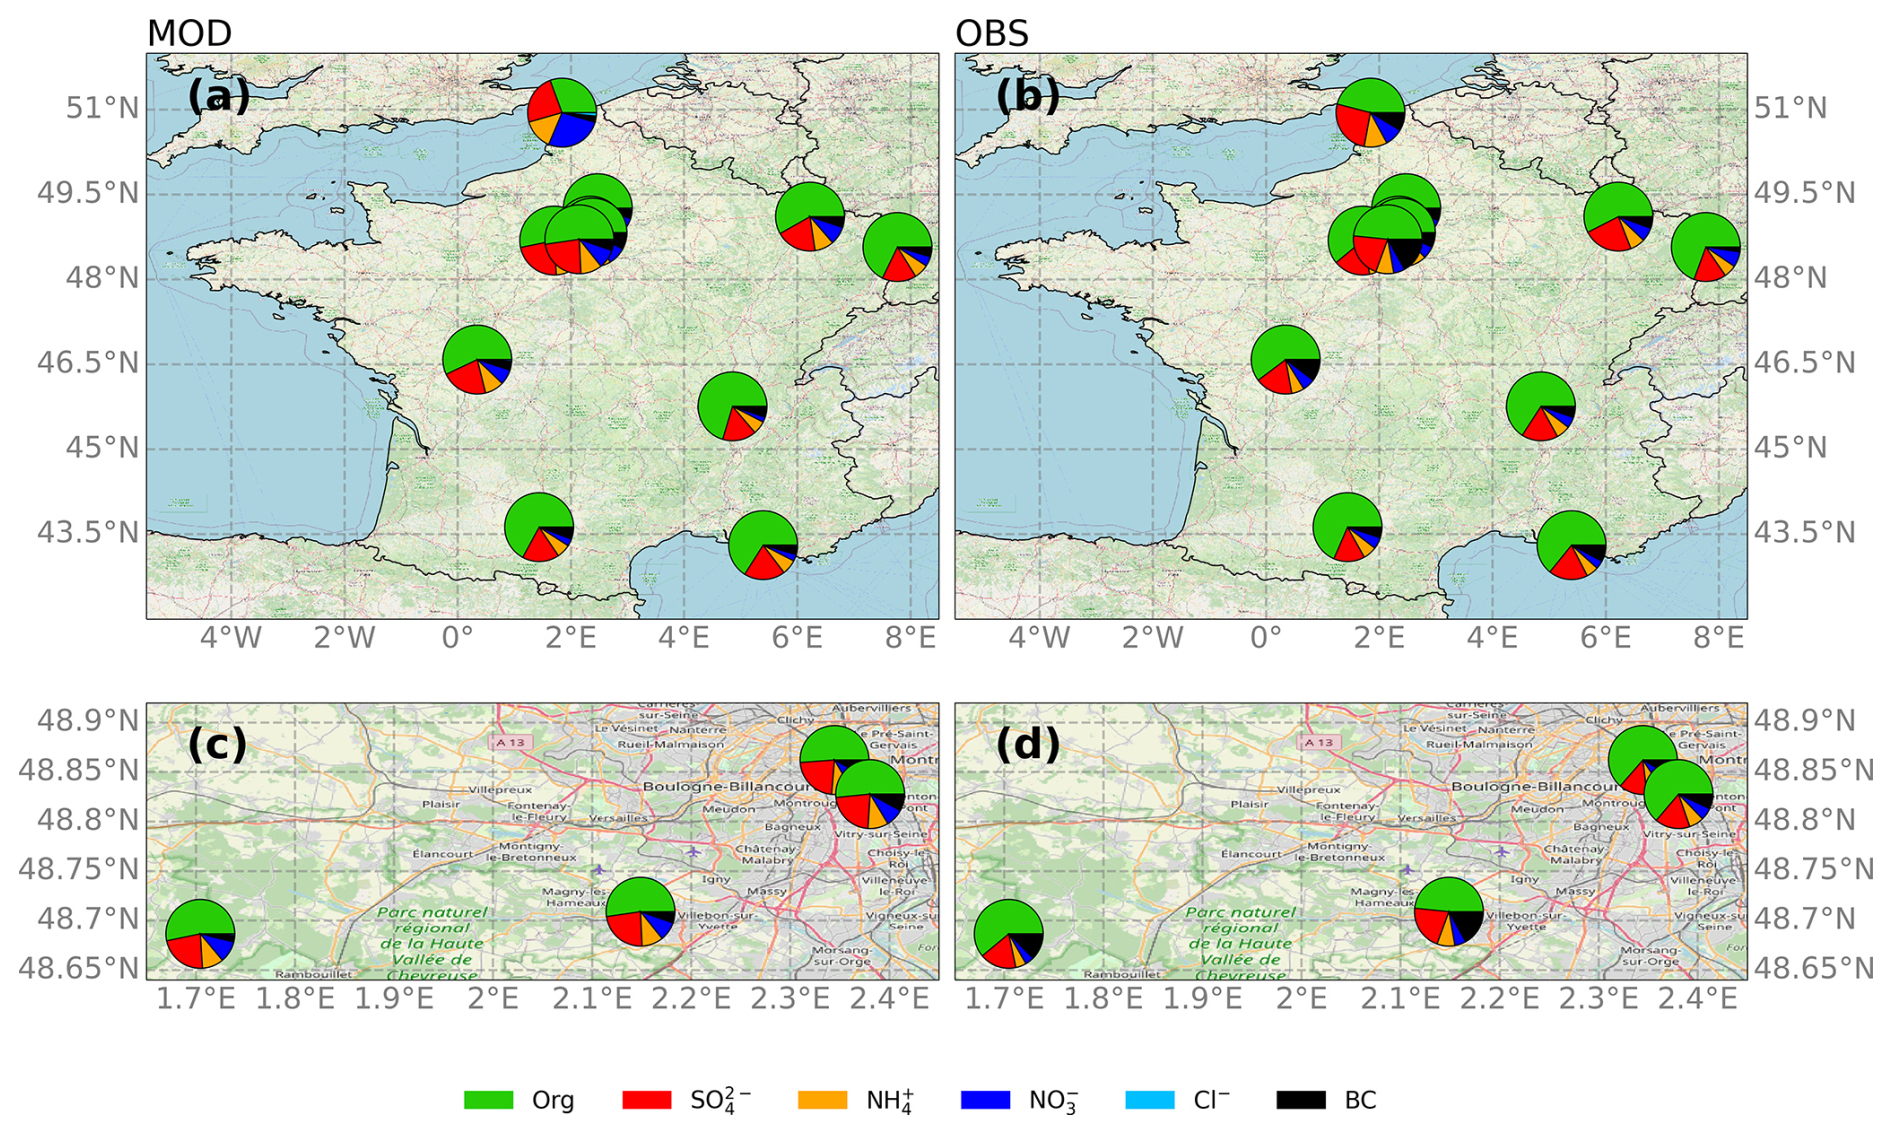
Figure 7Average PM1 aerosol composition from (a) the WRF–CHIMERE model (MOD) and (b) the GEOD'AIR database and the PRG, SIRTA and RambForest sites (OBS). Panels (c) and (d) represent a zoomed-in view over the Île-de-France region. Map data source: © OpenStreetMap contributors 2024. Distributed under the Open Data Commons Open Database License (ODbL) v1.0.
Statistical evaluation presented in Fig. 8 shows a systematic overestimation of the organic fraction (+21 % in terms of NMB), sulfate (+16 %), ammonium (+37 %) and nitrate (+53 %), but the fraction is only 7 % for BC. For nitrate, the overestimation is most striking: the fraction of simulations shows nitrate concentrations in the 10 µg m−3 range, as compared to observations of only a few µg m−3. Reasons for this behaviour need to be further investigated. It could be due to poorly captured ammonium nitrate partitioning or related to the fact that part of nitrate is captured in larger particles of terrigenous origin and then is not detected by the ACSM, a process which is not included in the simulations. These overestimations are modulated by meteorological conditions. They are stronger for the organic fraction under heatwave conditions and are especially larger for peak concentrations, probably triggering excessive production of BSOA. On the contrary, for secondary inorganic aerosol, overestimations are stronger during the clean period (Fig. 8). Correlation is about 0.4 for all species except organic aerosol (r= 0.6). Overall, this analysis of different submicron species is coherent with the PM2.5 overestimations previously made evident, although the extent of overestimation is smaller. Thus, aerosol species other than those analysed here (non-refractory species and BC), such as dust or primary mineral particles, are probably overestimated to an even greater extent. Unfortunately, no measurements for these species were available during the campaign period. In the Discussion, Sect. 6, we put the results for organic aerosol into the context of previous intercomparison exercises and of uncertainties inherent to the model formulation of the VBS scheme and in biogenic VOC (BVOC) emission models/inventories.
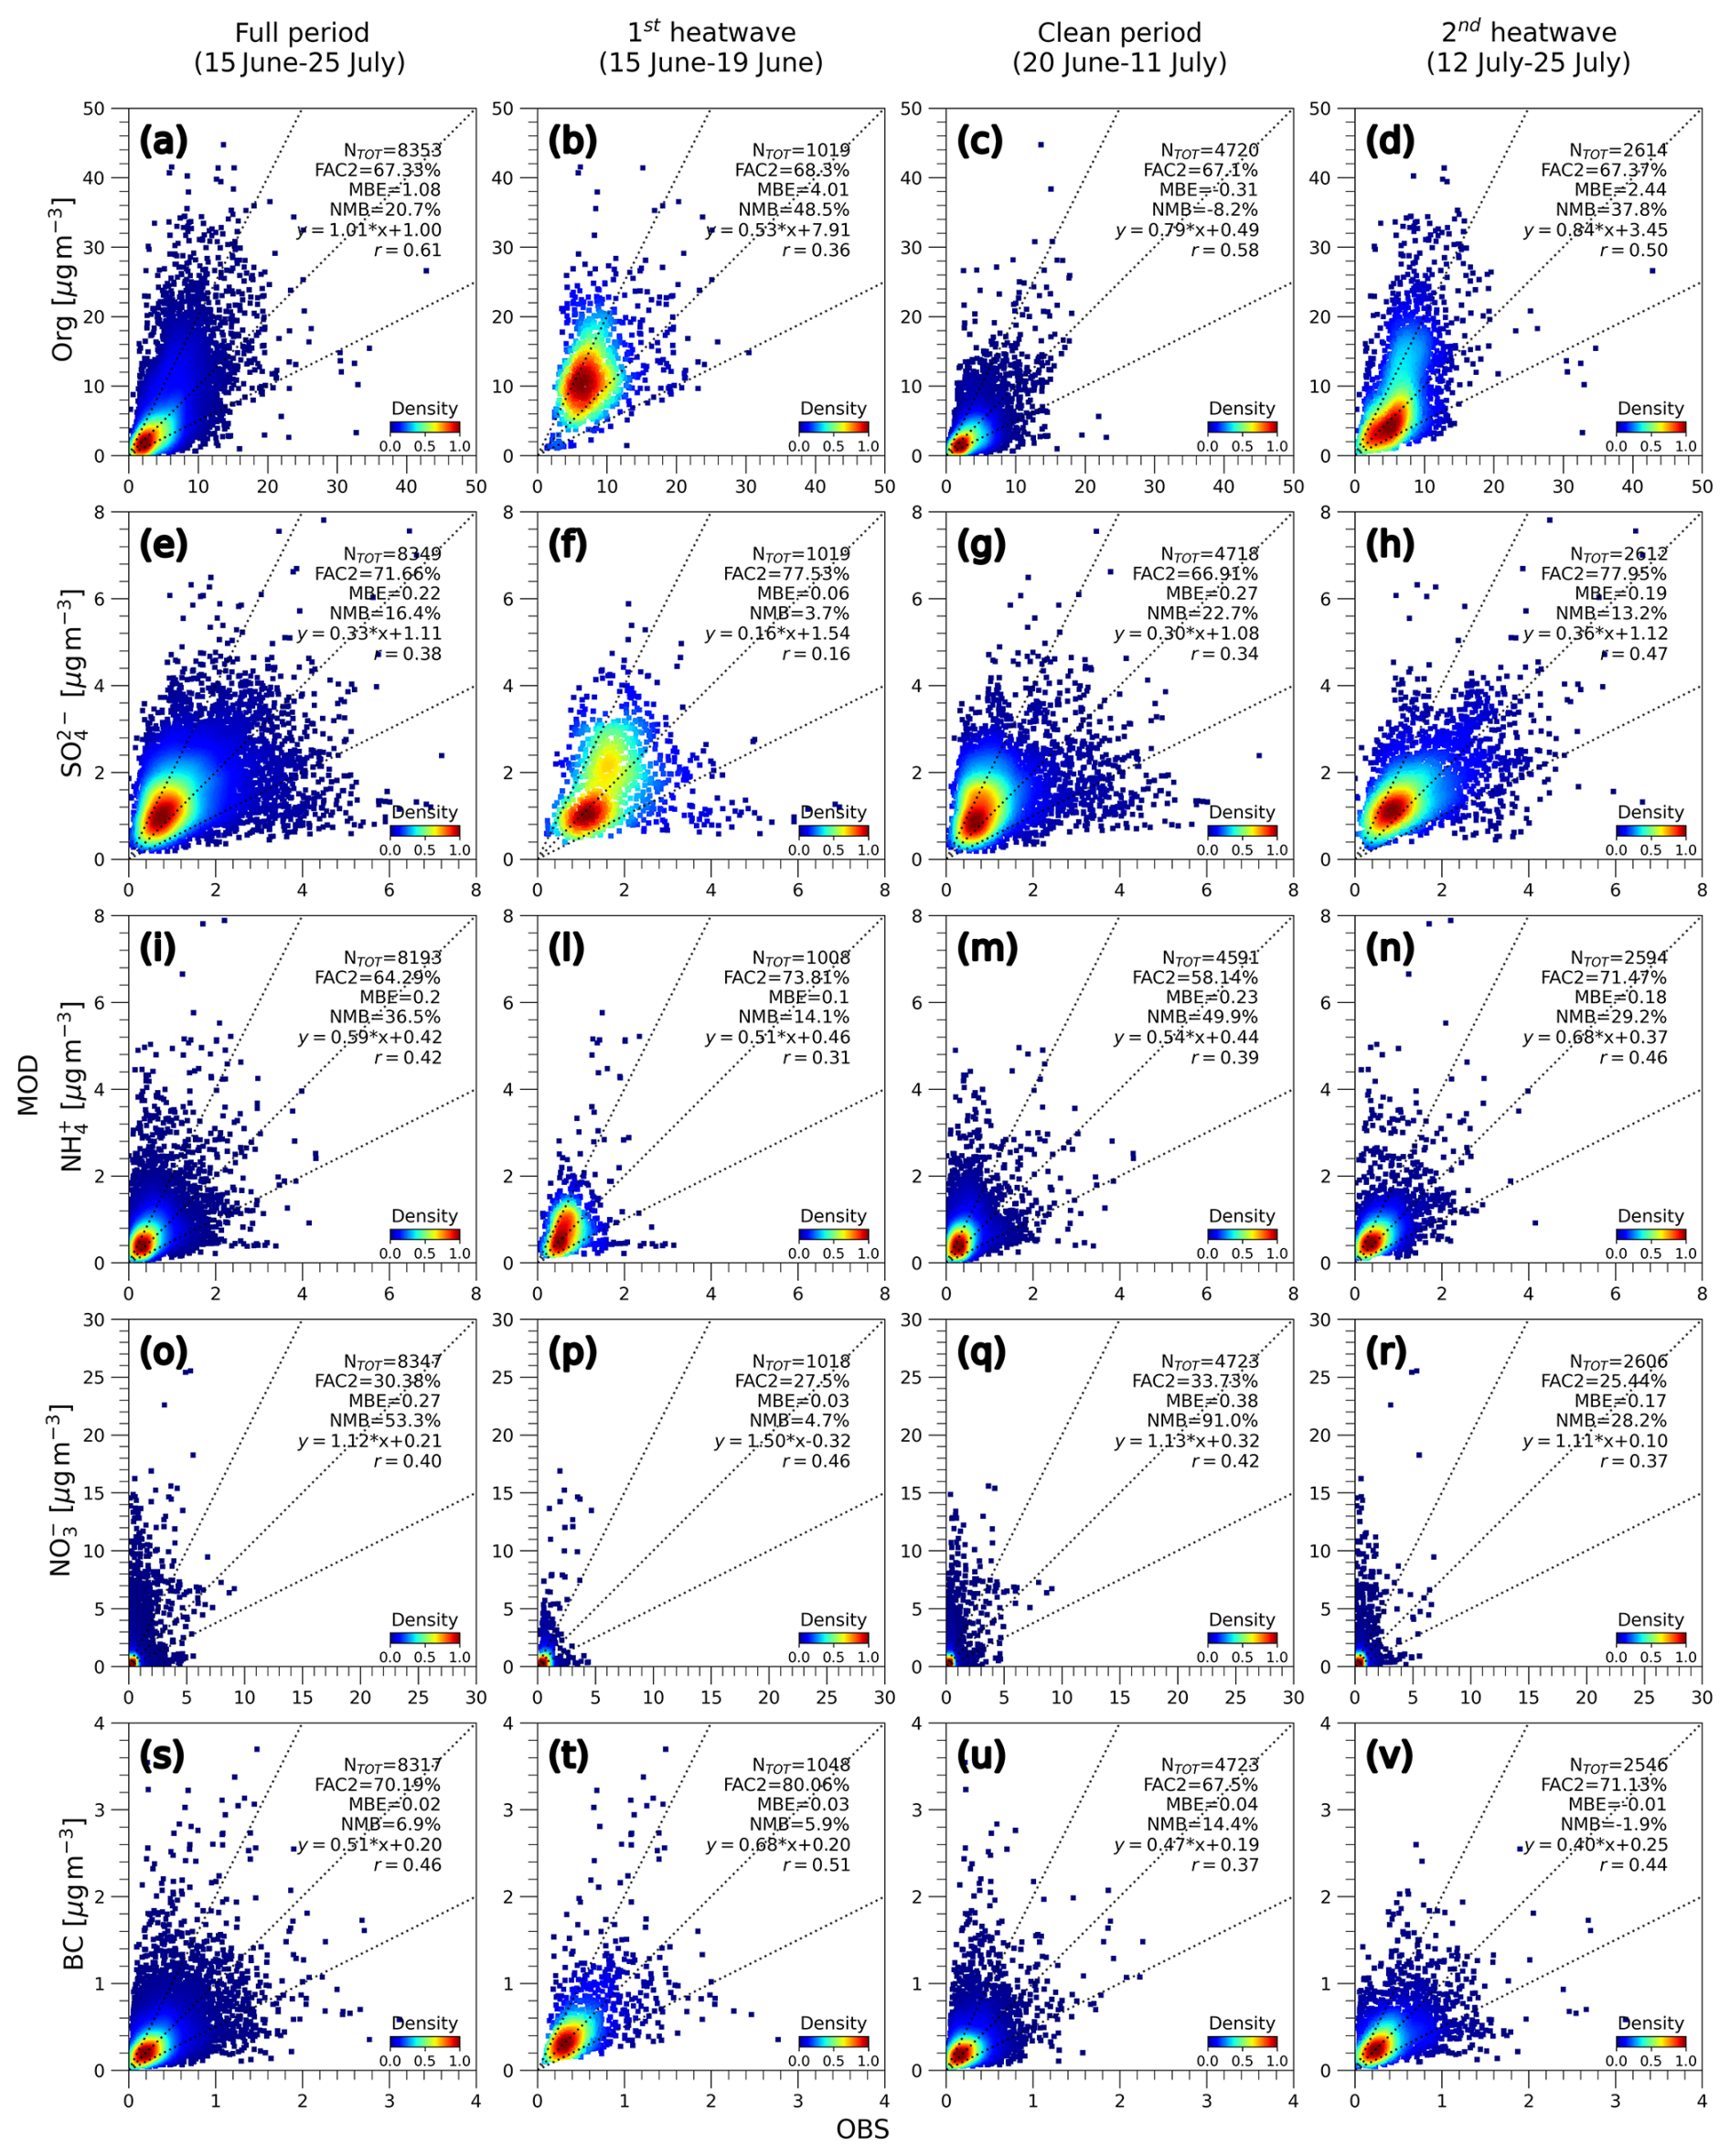
Figure 8Comparison of simulated chemical composition to observations from the GEOD'AIR database and the PRG, SIRTA and RambForest ACROSS sites for (a, e, i, o, s) the full period, (b, f, l, p, t) the first heatwave, (c, g, m, q, u) the clean period and (d, h, n, r, v) the second heatwave. Statistical metrics are calculated from data merged for all sites: Ntot, number of observations; FAC2, fraction of points within a factor-of-2 limit; MBE, mean bias error; NMB, normalized mean bias; linear fit equation; and r, correlation coefficient.
4.4 Analysis and model evaluation of aerosol chemical composition at the ACROSS sites in the greater Paris area
The ACSM- and AMS-derived PM1 non-refractive aerosol chemical composition measurements for PRG (Fig. S8), SIRTA (Fig. S9) and RambForest (Fig. S10) and the corresponding simulations at 2 km horizontal resolution show many similarities. Across all sites, organic aerosol is the most abundant species, driving the PM1 variability with enhanced concentrations during the two heatwave periods. For most days, sulfate is the second most abundant species, while pronounced nitrate peaks appear on specific days.
In contrast to the data of the French GEOD'AIR sites, organic aerosol is no longer systematically overestimated by simulations at the three ACROSS sites (Fig. 9). Reasons for this behaviour are not clear and need to be further investigated. For the whole set of available measurements, relative biases (in terms of NMB) are −20 % for PRG, −3 % for SIRTA and +21 % for RambForest (Tables 2, S2, S3 and S4). From Figs. 9 and S8–S10, a tendency for overestimations for PM1 chemical species is noted during heatwave periods. Conversely, during the clean period, relative biases are negative in general. For instance, for SIRTA, the NMB is +23 % and +9 % for the first and second heatwaves, while it is −25 % for the clean period (Table S3). Similar tendencies are observed for the other two sites (Tables S2 and S4). Stronger positive biases during the heatwave periods have already been noted in the previous section for the GEOD'AIR dataset.
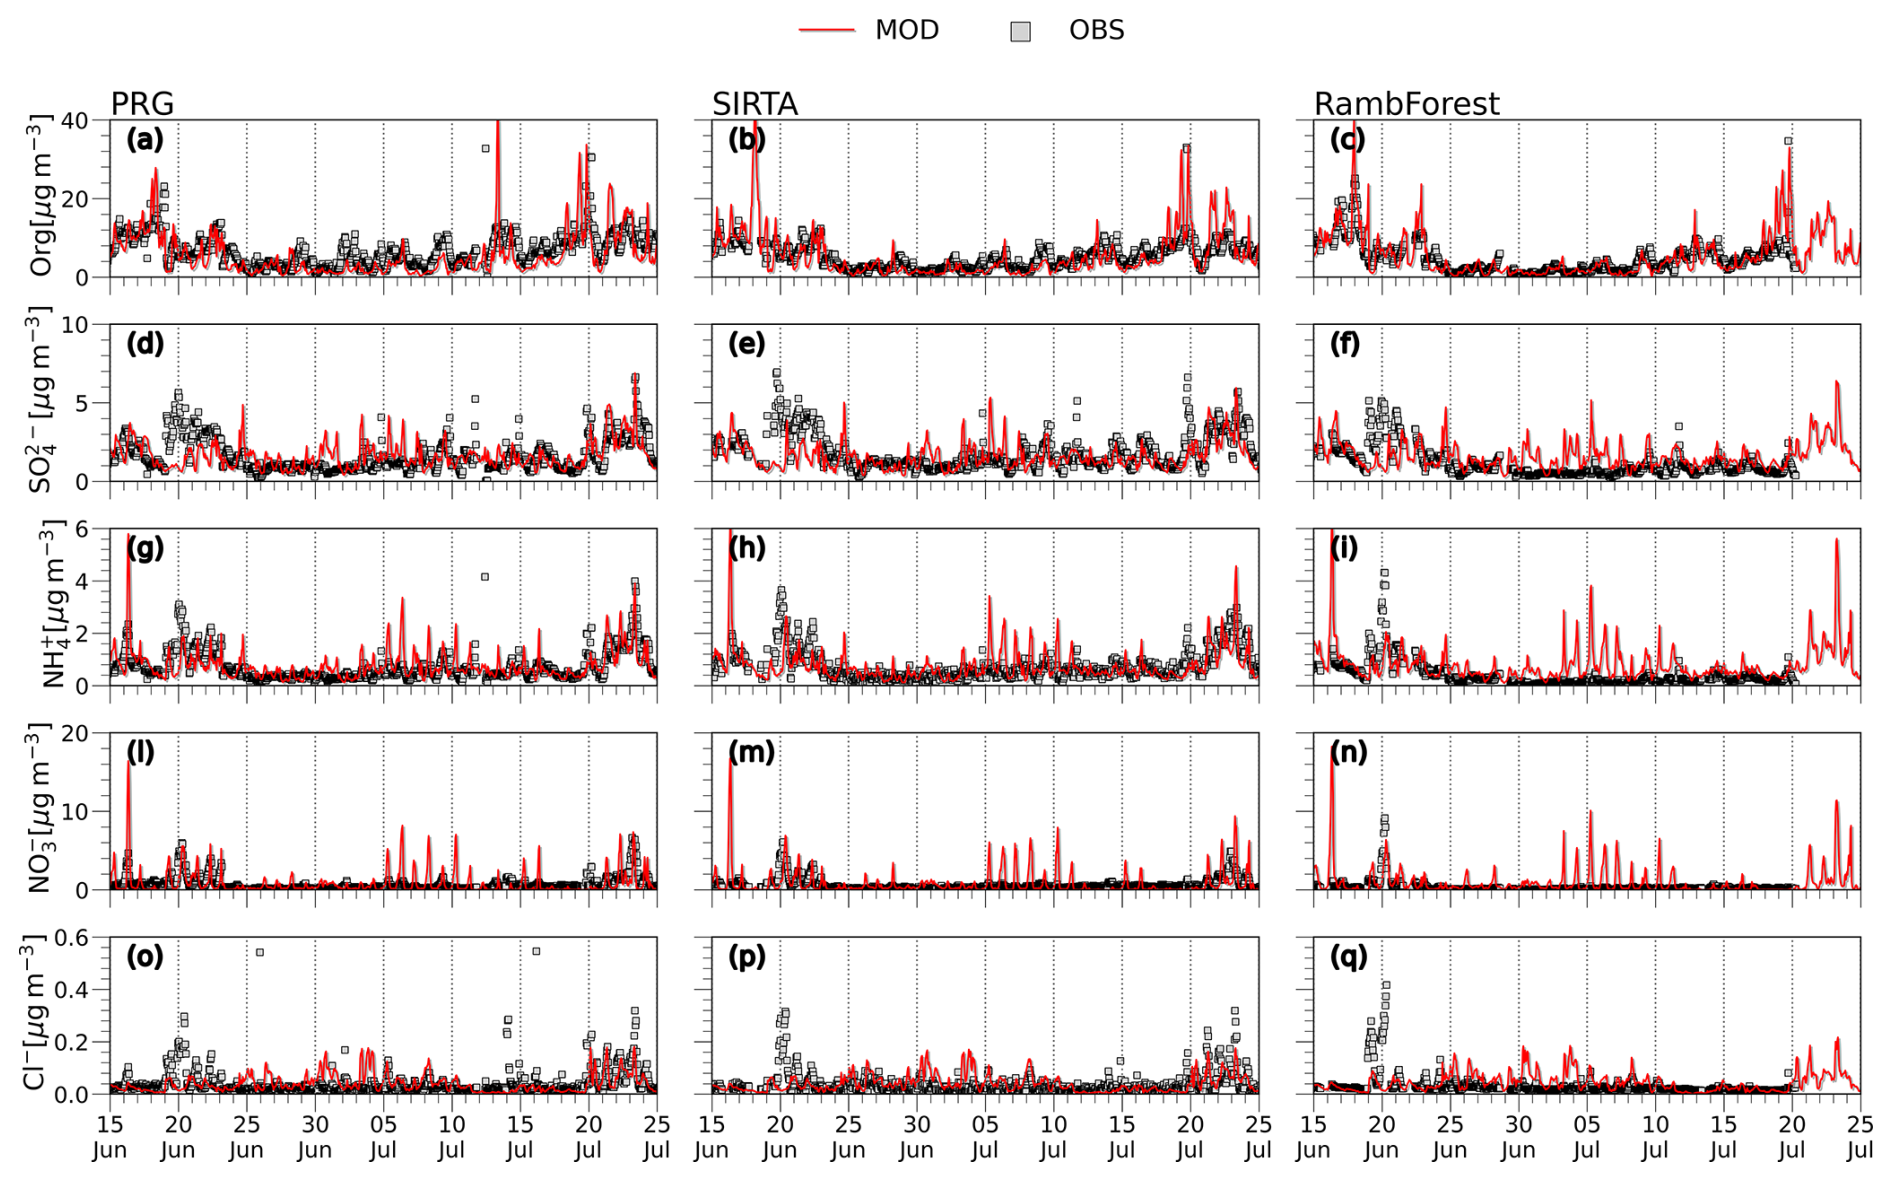
Figure 9Comparison of simulated chemical composition (MOD) to observations (OBS) at the PRG (ToF-ACSM model), SIRTA (ToF-ACSM model) and RambForest (HR-ToF-AMS model) sites for organics, sulfate, nitrate, ammonium and chloride. For the RambForest site, only data from the AMS below the canopy are shown for plot readability. Further details on the comparison are available in Figs. S6–S8 for the PRG, SIRTA and RambForest sites.
Several simulated strong organic aerosol (OA) peaks show only weaker signatures in the observations. For instance, OA peaks in the nighttime morning hours from 17 to 18 June exceeding 40 µg m−3 are simulated at RambForest and SIRTA and peaks of approximately 30 µg m−3 are simulated at PRG. The observed peak is only up to 25 µg m−3 at RambForest, while observations are missing at SIRTA and concentrations are about 15 µg m−3 at PRG with a rather flat diurnal variation. These enhanced values are due to the advection of a plume of large BSOA concentrations originating in several forested areas south of Île-de-France, as will be further discussed in Sect. 5.1. These overestimated OA peaks could be related, as said before, to uncertainties in BVOC emissions and the formulation of organic aerosol in the model (see Discussion, Sect. 6).
A strong and again sharp, yet unobserved, OA peak is simulated during the morning hours of 13 July at the PRG site and not at SIRTA and RambForest (Fig. 9a–c). It is mainly constituted of ASOA (Fig. S11). This discrepancy could be due to complex meteorological conditions, with light winds (2–3 m s−1) changing direction from south to west and a low simulated boundary layer height in the morning of 13 July.
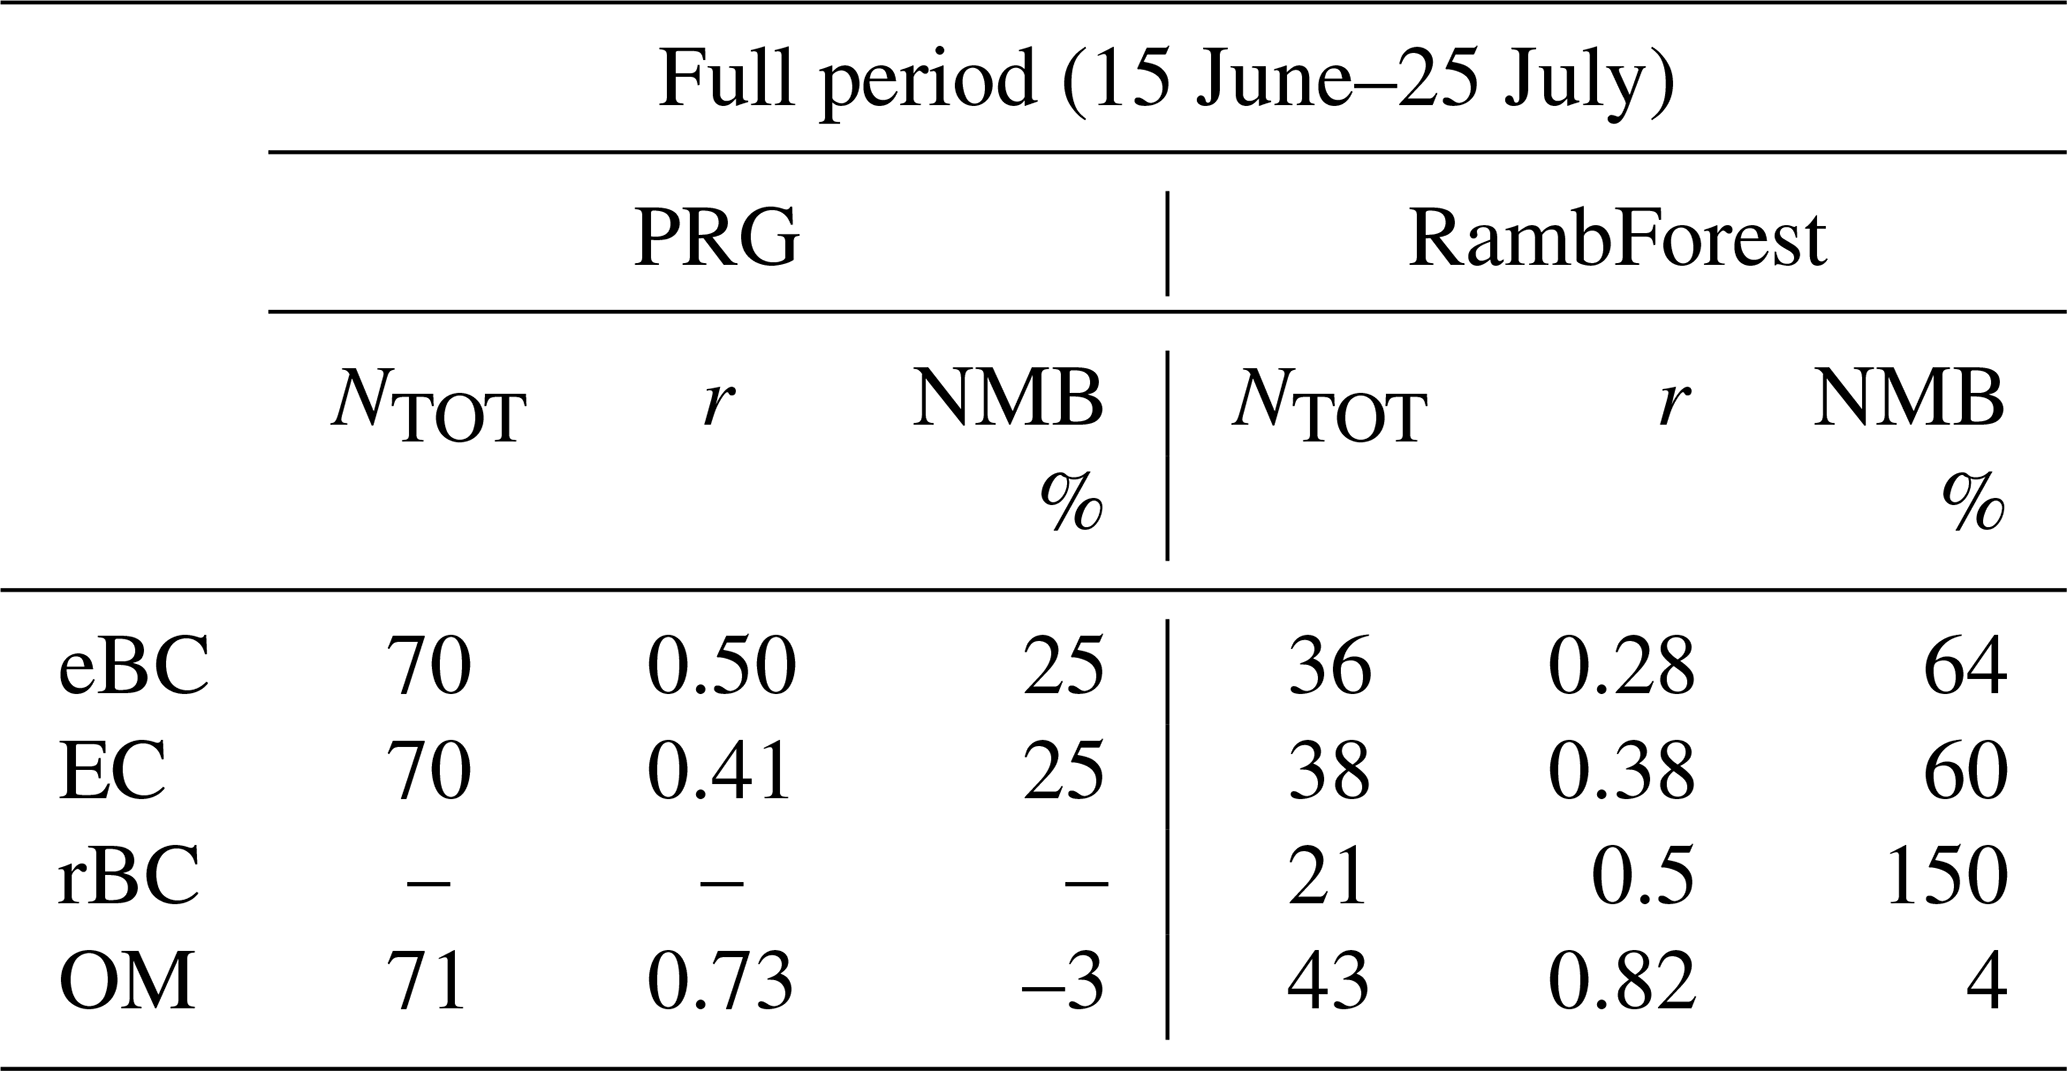
Finally, two OA peaks between 30 and 40 µg m−3 in the afternoon and night of 19 July are simulated at the three sites (Fig. 9a–c). Although the first peak was not observed by in situ data, the second was identified, and it could be attributed to the fire plume advected from the Aquitaine region in SW France (Menut et al., 2023). This event will be further described in Sect. 5.2. Despite these differences, the overall correlation between simulated and observed hourly OA concentrations at the three sites is satisfactory (r between 0.62 and 0.77, Table 2).
Table 2Summary of the comparison for the PRG (urban), SIRTA (suburban) and RambForest forest (rural) sites for the aerosol refractory chemical composition measurements. The statistical metrics are NTOT, number of observations; r, correlation coefficient; and NMB, normalized mean bias.
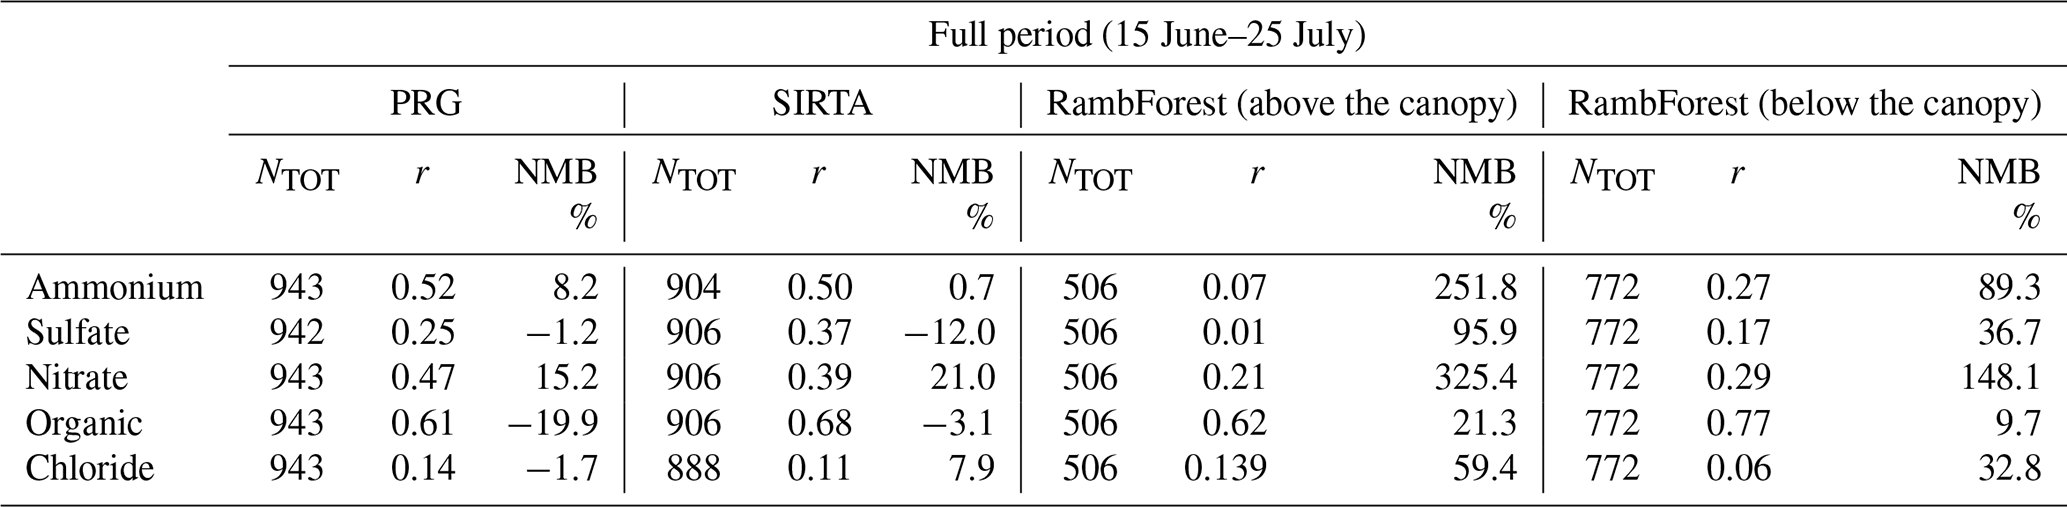
Figure 10 presents a comparison with OC measurements from filter samples at PRG and RambForest. NMB values with respect to simulations are between −3 % and +4 % for PRG and RambForest (under the hypothesis of an OM-to-OC ratio of 1.8; Sciare et al., 2011). Correlations (r) are large (0.73–0.82), indicating that averaging over 8–16 h smooths the short-term local variability at the sites and thereby facilitating the following of the organic aerosols' time evolution. In particular, a strong decrease in the organic aerosol is observed at the PRG site from a concentration higher than 15 µg m−3 to approximately 5 µg m−3 in the afternoon of 18 June at the end of the first heatwave, with peaks of 15–20 µg m−3 by the end of the second heatwave due to the several forest fire events such as that of 19 July, also observed at the Rambouillet forest.
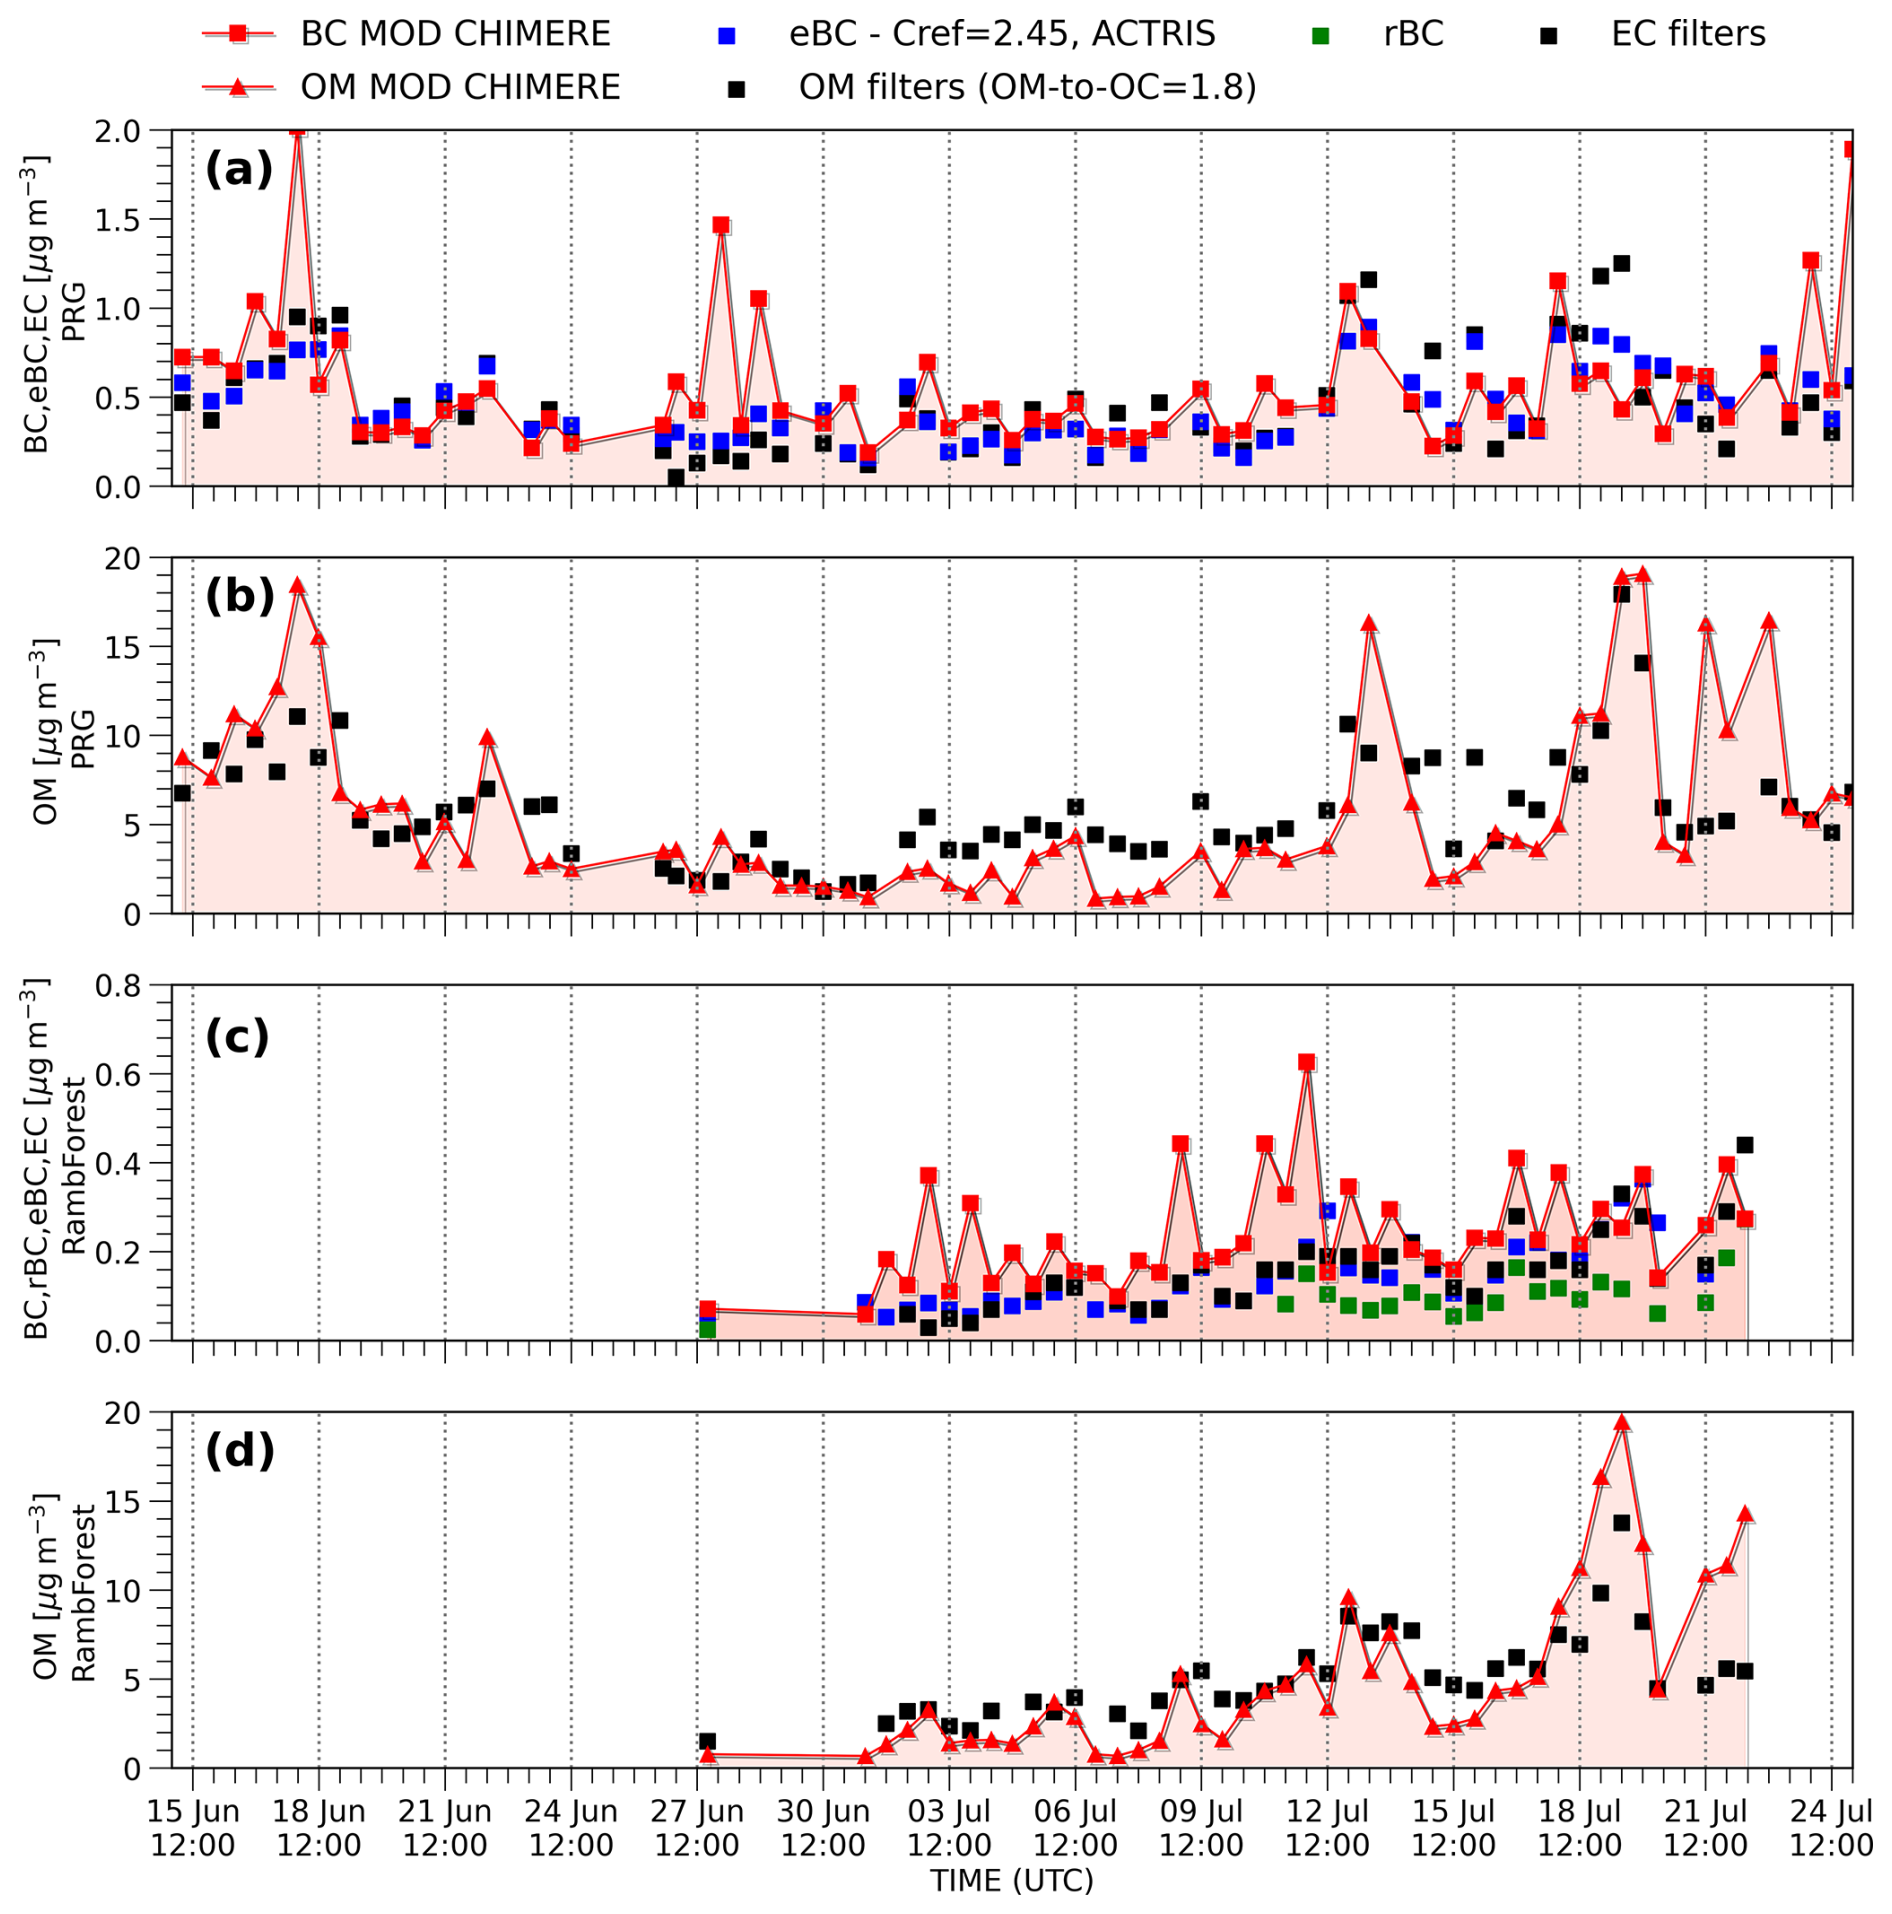
Figure 10Panels (a) and (c) represent a comparison of CHIMERE-simulated black carbon concentration with observations at the PRG site and RambForest sites, respectively: the black squares represent the elemental carbon measurements (EC), the blue the equivalent black carbon (eBC, corrected for the multiple-scattering coefficient from ACTRIS with Cref = 2.45) from AE33 measurements and the green the refractory black carbon from SP2 measurements. Panels (b) and (d) represent a comparison of CHIMERE-simulated organic matter concentration with the organic matter from the filter sampling (assuming an OM-to-OC ratio of 1.8 from Sciare et al. (2011). All the data are averaged based on the filters' starting and ending times.
Finally, the peak observed between 13 and 14 July at PRG and not observed at the RambForest site may be related to firework activity in connection with the national holiday (Bastille Day) in France.
For secondary inorganic aerosol species, biases are also much smaller for the three campaign sites than for the French GEOD'AIR sites. For sulfate, NMB values are −1 % for PRG, −12 % for SIRTA and +37 % for RambForest (Table 2). Especially during the first heatwave, simulated sulfate is more strongly underestimated than during the clean period (Fig. 9). For SIRTA, NMB is −63 % and −16 % for the first and second heatwaves, while it is only −11 % for the clean period (Table S3). Similar tendencies are observed for the other two sites (Tables S2 and S4). These differences between heatwave and clean periods are again in agreement with the comparison with the GEOD'AIR sites in Sect. 4.3. Again, as already made evident for the comparison with measurements from the GEOD'AIR sites, nitrate is significantly overestimated at the three sites PRG, SIRTA and RambForest, with NMB of +15 %, +21 % and +148 %, respectively. For nitrate, this large relative bias corresponds to a small absolute one of +0.24 µg m−3. A nitrate peak of about 15 µg m−3 is simulated in the morning of 16 June for the three sites and is observed to some extent (5 µg m−3) at PRG, the only site with available measurements at this time. Other non-observed nitrate peaks are encountered for morning hours between 5 and 17 July (Fig. 9). These peaks occur under northerly wind conditions, when NO- and NH3-rich air masses from northern France, Benelux and the English Channel region are advected to the campaign sites. For these days, aerosol is well neutralized to slightly acidic (see Fig. S12). Although the differences in the nitrate concentrations due to the spatial resolution of the model simulation are small (with a mean bias between the 6 and 2 km spatial resolution simulation ranging from 0.02 to 0.08 µg m−3 for nitrate at the three campaign sites), when discrepancies with observations occur, the nitrate peaks are typically more overestimated in the 2 km simulation compared to the 6 km simulation (see Fig. S1). As total nitrate measurements are not available for this study at the campaign sites at this stage, further analysis is postponed for future work. Figure 10 shows the BC simulation evaluation against the EC measurements from filter samples and equivalent black carbon (eBC) and refractory black carbon (rBC available only at RambForest) observations. Simulated BC and the measured eBC and rBC are averaged for the filter sampling time window. The simulated BC shows a general overestimation in terms of NMB, of ca. +25 % at PRG and ca. +60 % at RambForest (Table 3), where, for the latter, absolute concentrations are very small (average eBC of 0.15 µg m−3). Simulated concentrations at PRG larger than 1 µg m−3 are in general not observed. For PRG, this might be linked to the fact that this site is located on the seventh floor of a building (about 30 m a.g.l.) and then could be less sensitive to primary emissions compared to the first model layer extending approximately to 20 m a.g.l. Simulated and observed eBC concentrations are much lower at RambForest, mostly below 0.4 µg m−3. The largest simulated eBC peak of 0.6 µg m−3 during the night of 11 to 12 July is not observed. The BC tracer analysis product (specifically developed for the ACROSS field campaign, as detailed in Di Antonio et al., 2023a) revealed that this peak may be caused by the advection of Paris anthropogenic emissions to the RambForest site. Since this site is located within the forest, the discrepancy may be attributed to the altitude at which BC concentrations are transported from the Paris agglomeration and the absence of a forest canopy model in the simulation.
Table 3Summary of the comparison of the black carbon concentrations for the PRG and RambForest (rural) sites averaged on the filter sampling dates and times. eBC concentrations have been corrected for the ACTRIS harmonization factor ( 2.45). OC has been converted to OM assuming an OM OC ratio equal to 1.8. Statistical metrics are NTOT, number of observations; r, correlation coefficient; and NMB, normalized mean bias.
In summary, simulation-to-observation comparisons of PM speciation are mostly satisfying, with acceptable biases for all of the species below ±20 % (except for nitrate in terms of NMB).
Although the simulation of organic aerosols is sensitive to heatwave conditions, the model demonstrates a satisfactory capacity to simulate the overall broad variability between different meteorological periods. Nevertheless, it is observed that individual peaks lasting several hours are often not adequately simulated.
In this section, we present two examples to illustrate how the WRF–CHIMERE model is able to reproduce and disentangle complex advection and chemical formation patterns of OA. This contributes to an explanation of the spatio-temporal variability encountered at the campaign measurement sites.
5.1 Regional BSOA formation and advection during the first heatwave
The first case study corresponds to the night of 17 to 18 June (first heatwave period), when strong OA peaks are simulated and observed. Figure S11 shows that these peaks are, to a very large extent, due to BSOA (in the simulations; no source apportionment is available yet for the observations). Thus the following analysis concentrates on BSOA. Figure 11 shows the strong BSOA build-up over forested areas within and around the Île-de-France region during the first part of the night starting between 18:00 and 20:00 UTC and continuing until 18 June at 02:00 UTC. These forested areas are in the Sologne region (labelled S) 130 km south of Paris, the Fontainebleau forest (F) 60 km SSE of Paris, the Rambouillet forest (R) 40 km SWW of Paris and the Chantilly forest (C) 50 km NNE of Paris. For instance, at the Rambouillet forest, BSOA concentrations rise by about 20 µg m−3 between 18:00 and 22:00 UTC, corresponding to an increase rate of 5 µg m−3 h−1. Céspedes et al. (2024) found that the atmospheric stratification was very stable during this night, suggesting stagnant conditions in the rural settings. As no advection to this site is visible in Fig. 11 during these hours, we interpret this at first order as a BSOA formation rate, leading to enhanced surface BSOA concentrations due to suppressed vertical mixing. This leads to an OA peak at the RambForest site of about 40 µg m−3 at 22:00 UTC, which is also observed, although to a lesser extent (Fig. 9). The BSOA formation is probably initiated by O3 rather than NO3 because simulated NO3 levels are very low (about 0.5 ppt, not shown).
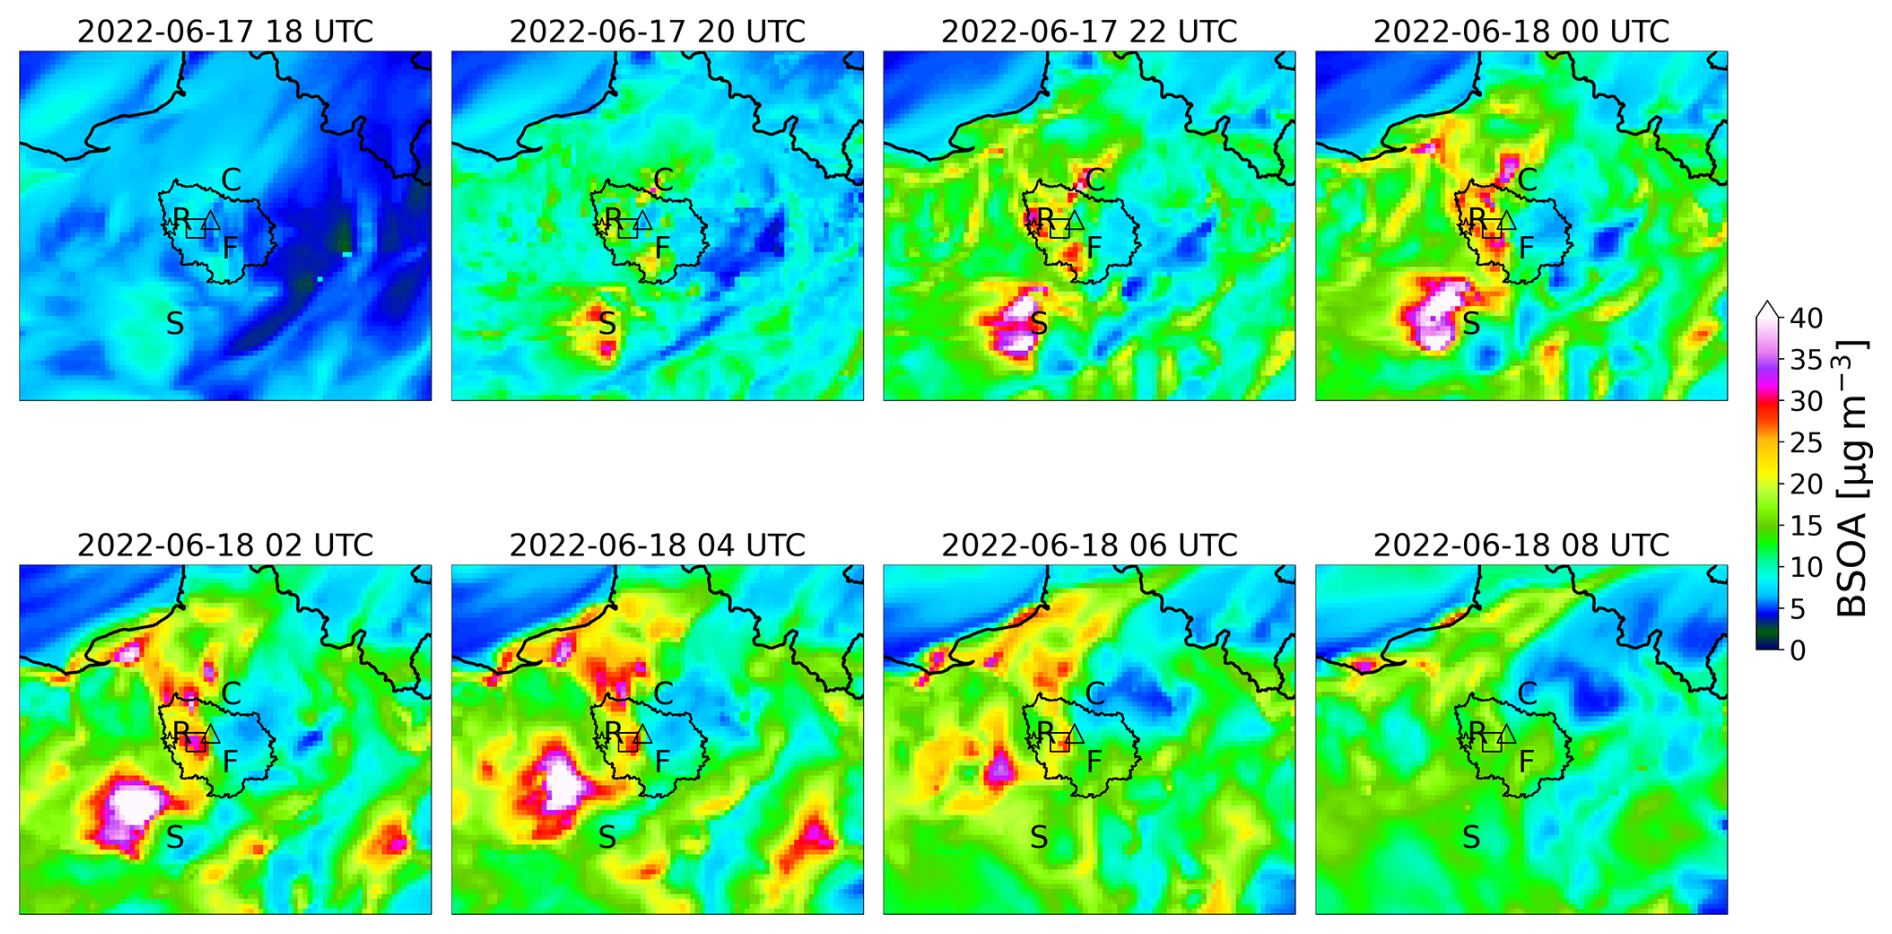
Figure 11Simulated biogenic secondary organic aerosol (BSOA) mass concentrations for 17 and 18 June 2022. The letter “F” indicates the Fontainebleau forest, “R” indicates the Rambouillet forest, “S” indicates the Sologne forest and “C” indicates the Chantilly forest. The star, the square and the triangle markers indicate the locations of the RambForest, SIRTA and PRG sites, respectively.
During the following hours, southeasterly winds advect BSOA-rich air masses from source regions northeastwards. The BSOA-rich area in Fig. 11, originating in Sologne, is advected to the west of the RambForest site, where BSOA concentrations diminish from 02:00 UTC onwards. The one originating in Fontainebleau forest is advected to the SIRTA and PRG sites. According to our simulations, it arrives at the SIRTA site at approximately midnight, and the maximum BSOA levels of about 30 µg m−3 occur at 02:00 UTC. Unfortunately, no ACSM measurements were available at SIRTA during this night. The SIRTA site being located at the edge of the Paris agglomeration, simulated NO3 concentrations are more important there and northwards of it (about 2.0 ppt, not shown), probably allowing for additional terpene oxidation and BSOA formation. Concerning the PRG site, Fig. 11 shows its location at the eastern edge of the simulated BSOA plume. A small spatial mismatch in the simulation could then explain why the plume is simulated but not observed at PRG (only enhanced OA concentrations of about 15 µg m−3 but with no peak).
As a major conclusion, the strong nighttime BSOA formation event has been successfully captured by the model. The OA peaks simulated and partly observed at the campaign sites during the night of 17 to 18 June can be traced back to nighttime BSOA build-up above forested areas within and south of the Île-de-France region and to further advection of these BSOA-rich air masses to the campaign sites.
5.2 Fire advection episode in the greater Paris area
The second case concerns the evening of 19 July, during the second heatwave, when large OA concentrations (around 15 µg m−3) were measured at the three sites (Figs. S8, S9, S10). The exceptionally hot and dry conditions during summer 2022 triggered high fire activity, especially in the Landes forest in SW France, leading to important forest destruction and very high local PM2.5 concentrations (Menut et al., 2023). The WRF–CHIMERE simulation shows that such enhanced fire activity, in addition to enhanced BVOC emissions, led to advection to northern France of both primary organic aerosols from the fires and BSOA from southwestern France (Aquitaine region) (Figs. 12 and 13). As stated before, in our simulation, aerosol fire emissions are taken as chemically inert, so they are by definition primary. Several VOC species are co-emitted with fires and, in our simulation, the reactive SOA precursor α-pinene. These fire-related BVOC emissions are locally much greater than those from the surrounding Landes forest, but the latter occur over a much larger area, so overall fire-emitted α-pinene is expected to contribute much less to BSOA formation than forest-emitted α-pinene (Fig. S13). During 19 June, this combined fire POA and BSOA plume moves eastwards (Fig. S14), passing over the campaign sites in the evening and impacting first the RambForest (19:00 UTC) and then the SIRTA and PRG (20:00 UTC) sites. The model predicts that, for the maximum plume OA encountered during these hours, about two-thirds (∼ 20 µg m−3) is BSOA and about one-third is due to primary fire POA (∼ 10 µg m−3). As a conclusion, regional advection from several hundred kilometres upwind of primary fire and secondary OA formed from fire and forest BVOCs can exceptionally affect the OA budget over the Île-de-France region and can be simulated with the WRF–CHIMERE model.
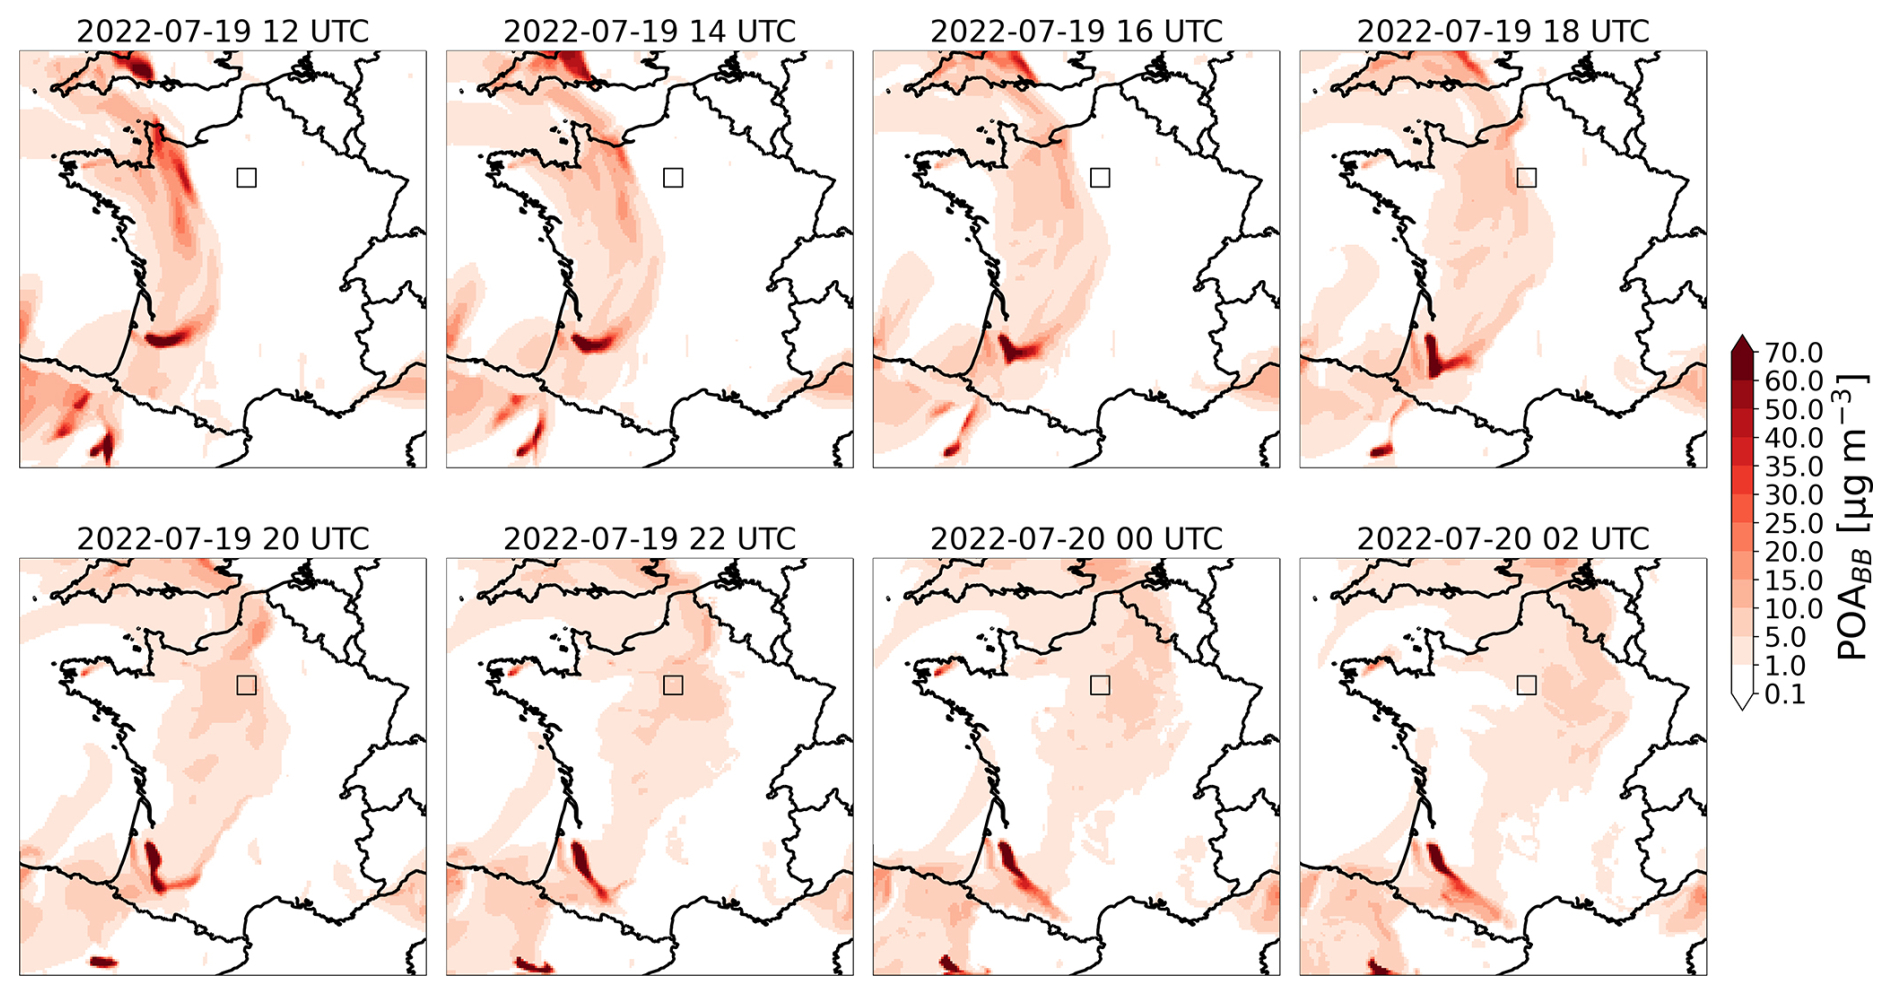
Figure 12Simulated primary biomass burning organic aerosol mass concentration for the fire episode of 19 and 20 July 2022. The square marker indicates the PRG site.
While these two case studies demonstrate the importance of BSOA and biomass burning OA (POA-BB), the average partitioning also shows a minor fraction of ASOA (Fig. S11) and makes the mixing of different OA sources over the Île-de-France region evident. For the entire campaign, BSOA contributes to 53.4 %, 58.2 % and 62.4 % of the OA for the PRG, SIRTA and RambForest campaign sites, respectively. The corresponding values for ASOA are 29.1 %, 28.5 % and 26.4 %; for POA-BB are 2.4 %, 2.4 % and 2.6 %; for POA are 9.3 %, 5.2 % and 3.2 %; and for OPOA (oxidized primary organic aerosol) are 5.6 %, 5.7 % and 5.4 %.
In this section, we examine some aspects of model uncertainty that we identified in the previous section. In particular, we discuss the uncertainties in the formation of biogenic secondary organic aerosol (BSOA) related to three aspects: (i) biogenic VOC (BVOC) emissions, (ii) yields of SOA formation from biogenic and anthropogenic VOC emissions, and (iii) the combined effects of (i) and (ii) in model-to-observation comparisons of OA and SOA.
We first discuss here the uncertainty in model-predicted biogenic secondary organic aerosol concentrations due to uncertainty in the biogenic VOC (BVOC) emissions used in the model. BVOC emissions are predicted by the global MEGAN v 2.1 module implemented in CHIMERE. While we did not find published BVOC emissions for summer 2022 from other models in the literature, several studies have compared biogenic emissions from different models and assessed the impact of the differences on secondary pollutants. For summer 2011 over Europe, Jiang et al. (2019) reported monoterpene emissions that were 3 times higher and 3 times lower isoprene emissions, with an emission model specifically developed for European tree species (named the PSI model) as compared to MEGAN v 2.1. This led to a factor-of-2 increase in SOA and 7 ppb increase in ozone average concentrations over Europe in their simulations. The main differences in emissions and secondary compounds are computed for the Mediterranean region, while the differences are much reduced over the northern half of France. For the Landes region, Cholakian et al. (2023), who refined land use and tree species distributions specifically for this forest, found that monoterpene concentrations increased and isoprene concentrations decreased by a factor of about 2. In contrast, based on inverse modelling of TROPOMI formaldehyde columns, Oomen et al. (2024) found that initial MEGAN isoprene emissions over France were typically underestimated by a factor of 2–3 and monoterpene emissions by about a factor of 2 for the summers of 2018 to 2021. Finally, Messina et al. (2016) compare global MEGAN v 2.1 isoprene emissions to those simulated by the ORCHIDEE atmosphere–vegetation interface model and found larger isoprene emissions in MEGAN over France by a factor of about 2. In conclusion, comparisons between different BVOC emission estimates or inverse modelling show large differences, typically by a factor of 2–3 with both signs. This suggests large uncertainties in emission models such as MEGAN v 2.1, without a clear indication of a positive or negative bias. This uncertainty in BVOC emissions is expected to have strong implications on BSOA formation (e.g. Jiang et al., 2019).
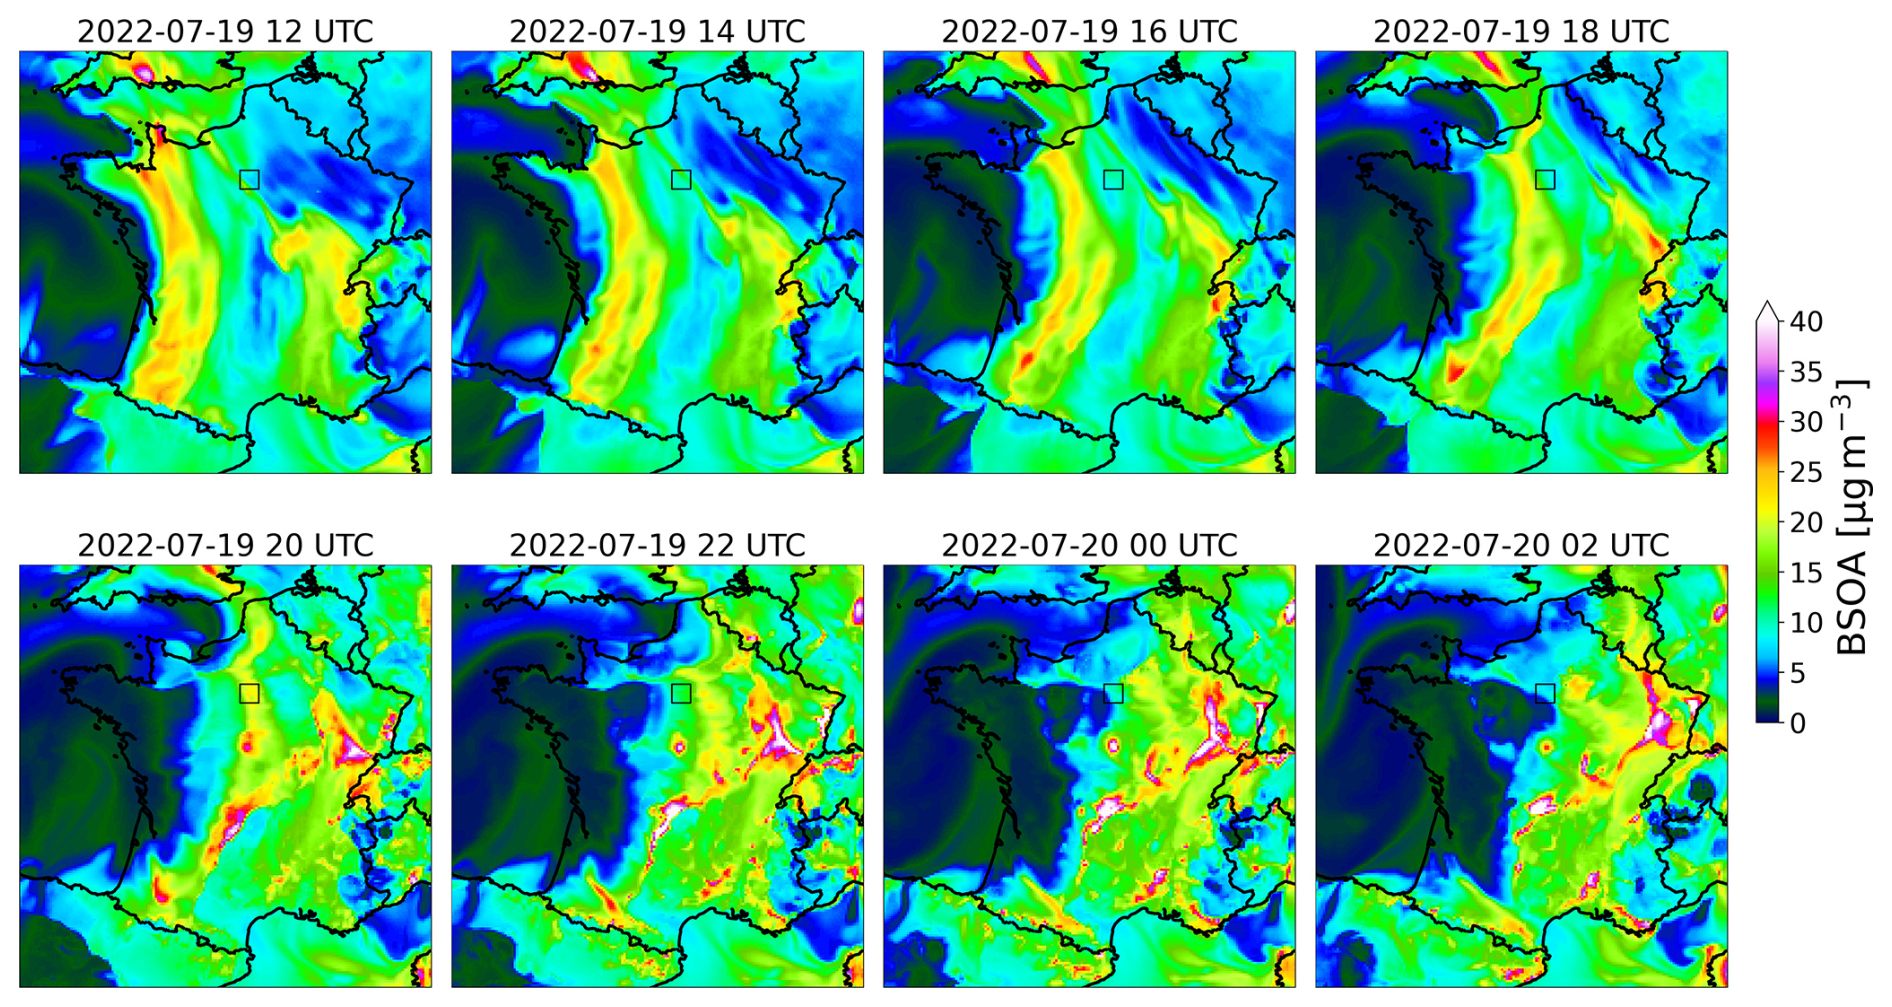
Figure 13Simulated biogenic secondary organic aerosol (BSOA) mass concentrations for 19 and 20 July 2022. The square marker indicates the PRG site. Among the BSOA precursors, α-pinene stems from both fire and forest emissions.
Additional uncertainty in SOA formation comes from the uncertainty in the aerosol scheme itself. A recent report from Ramboll (2022) compared SOA yields for given seed OA concentrations as predicted by two-product or VBS-based SOA schemes used in various state-of-the-art models (CAMx, CHIMERE, CMAQ, GEOS-Chem, WRF-Chem). For instance, for a seed OA concentration of 10 µg m−3 and under low-NOx conditions, for a generic monoterpene precursor and OH attack, the initial SOA yields, not considering further ageing, range from 0.047 to 0.247, with a median of 0.182 g g−1, the largest value being calculated with the SOA scheme used by CHIMERE in our calculation (Cholakian et al., 2018). This high yield could explain part of the BSOA overestimation in our simulations. For other precursors and under different NOx conditions, the minimum and maximum yields typically differ by a factor of 3 to 12, and our scheme is often in the middle of the ranking. In our scheme, as in others, these yields are uniform for different monoterpene and aromatic species and with respect to oxidants. This is certainly a simplification but one that is still used in recent state-of-the-art models, such as the AERO7 organic aerosol scheme used in CMAQ (Appel et al., 2021). Other models, such as the 1.5D VBS scheme implemented in CAMx (Ramboll, 2022), use an increased yield of BSOA species for the monoterpene + NO3 reaction, which is not included in our scheme. As a consequence, our simulations may underestimate the formation of NO3-initiated nocturnal BSOA. In addition, different SOA ageing formulations in different schemes add additional uncertainty to the SOA evolution.
Considering the uncertainties in both BVOC emissions and SOA yields, we discuss here the results of previous OA simulation–observation comparisons, focusing on France. Within the EURODELTA III model intercomparison exercise, Ciarelli et al. (2019) found SOA underestimations by a factor of 2 to 10 over two Paris suburban sites for seven state-of-the-art European models. A variety of different BVOC emission inventories and SOA modules were used for this exercise, including MEGAN v 2.1 and VBS schemes for SOA build-up (but not the VBS scheme used in the present work). On the contrary, Cholakian et al. (2023) found an average overestimation of OA (mainly BSOA) of about 60 % during the LANDEX campaign in summer 2017 in the maritime pine-dominated Landes forest in southwestern France. This overestimation of BSOA occurred, even though monoterpene and isoprene precursors showed good agreement after careful specification of local land use and tree distribution data. Using MEGAN v 2.1 BVOC emissions and a VBS scheme with ageing (functionalization) for ASOA within the PMCAMx model, Fountoukis et al. (2016) found only a small bias of less than 10 % in SOA (secondary oxygenated organic aerosol (OOA) fraction) measurements at three urban or suburban sites in Paris. However, with a similar BVOC–SOA setup within the WRF-Chem model, Barbet et al. (2016) found an underestimation by a factor of 6 of SOA at Puy de Dôme, a mountain (at 1465 m a.s.l.) background site in central France, during a summer 2010 pollution episode. During the summer 2013 ChArMEx Mediterranean campaign, a CHIMERE simulation with MEGAN v 2.1 BVOC emissions found the best agreement in OA at Cap Corse and Mallorca (Cholakian et al., 2018), precisely with the VBS SOA scheme used in the present work, including the SOA and secondary VOC (SVOC) ageing processes as functionalization, fragmentation and formation of non-volatile SOA. A further comparison of this model setup with OA measurements at 32 European sites from the EBAS network showed an average underestimation of about 25 % (Cholakian et al., 2019). To conclude this discussion, previous OA and SOA model-to-observation intercomparisons over France and Europe have shown a variety of results ranging from strong underestimation, even with VBS-based SOA schemes, to moderate overestimation. In the light of this discussion, the observed biases in simulated OA found in our study between about ±20 % during the ACROSS campaign period in June and July 2022 are moderate, even if the OA overestimations are larger (up to almost 50 %) during heatwave conditions.
In this paper, we used the available measurements from the ACROSS campaign in addition to observations from air quality and meteorological networks for a first evaluation of the coupled WRF–CHIMERE model simulation over the ACROSS campaign in June–July 2022 in the Île-de-France region and more widely over France. This is a required step for using the model system to drive further in-depth analysis of different physico-chemical processes, such as to disentangle chemical production, loss and transport processes of gas and aerosol species. The paper provides an overview of the meteorological conditions over the campaign period and related major pollution (PM, O3) variability over France and at the campaign sites.
From daily maximum temperature time series and pollutant fields at the Paris urban site, three periods could be identified during the campaign. A first heatwave period occurred from 15 to 18 June with daily temperature maxima (Tmax) exceeding 36 °C. These elevated temperatures were partially due to heat advection by an anticyclonic pressure system situated over western France which drew warm air from the Saharan heat reservoir, also resulting in dust transport over the Île-de-France region and enhanced PM10 surface levels over western France for 18 June.
The second heatwave period, spanning 12 to 25 July, was characterized by a combination of very high temperatures and cooler days. During this period, southerly advection to the Île-de-France region was again enhanced. Both heatwaves were accompanied by an increase in BVOC emissions, which led to enhanced formation of BSOA and ozone. For the intermediate period, between 19 June and 11 July, ozone and PM levels were considerably lower, with air mass origins being oceanic and sometimes partially continental.
Analysis from the present work shows that the WRF model is able to satisfactorily simulate key meteorological variables and to follow the meteorological variability during the campaign, in particular during the two heatwaves. Maximum daily temperature is in general simulated within ±1 °C. Maximum daily planetary boundary layer heights are often underestimated by about 200 m. The adequate simulation of temperature is important as this parameter is a general indicator for the model ability to catch the meteorological conditions and as, in particular, it governs among others the intensity of biogenic VOC emissions in the MEGAN module.
High-wind-speed and low-wind-speed periods and the evolution of wind direction are also reasonably well simulated (within ±1 m s−1), in particular for the Île-de-France region. This lends confidence to the simulation of different transport regimes during the campaign period, including simulation of the direction of the pollution plume originating in the Paris region.
The WRF–CHIMERE model system generally realistically produces daily ozone maxima, with negative biases between −5 and 0 µg m−3 for the air quality network sites and some larger unexplained underpredictions of up to −20 µg m−3 during the first heatwave, especially in the Île-de-France area.
While for PM10 the mean bias is slightly negative for the average of sites in the model domain, it is strongly positive for PM2.5. All major submicron aerosol species are part of this overestimation, although at a lower level than for the PM2.5. For organic aerosol, the biases are larger for the two heatwave periods, while they are slightly negative during the clean period. So there is a possible bias in OA sensitivity to temperature, which could be related to a corresponding bias in biogenic VOC emissions or within the VBS organic aerosol scheme. It is generally observed that there is an increase in BVOCs during heatwave events, with a subsequent decrease occurring as a result of the hydric stress. In the current version used, the MEGAN model does not explicitly take this process into account, which could result in an overestimation of BVOC emissions during such cases. Such a hypothesis should be tested in future work. In general, the preceding Discussion section showed large differences between BVOC emission inventories or models and in the SOA yields of different organic aerosol schemes. Thus the differences with observations made evident in our study are not unexpected in light of past intercomparison exercises.
On the contrary, the evaluation during the campaign period at the three ACROSS campaign sites within Île-de-France shows no systematic overestimation of OA (biases below about ±20 %), again with larger positive biases during the heatwave periods. Inorganic aerosol, especially nitrate, remains overestimated for reasons that remain to be elucidated. The largest positive biases appeared at the RambForest site, where concentrations were very small (e.g. 0.38 µg m−3 for ammonium, 0.16 µg m−3 for nitrate and 0.14 µg m−3 for BC).
This result allows the model simulation to be used to explain the aerosols' variability and support the scientific interpretation of the observations at the ground-based sites during the ACROSS campaign. We perform here a first model-based analysis for the 2 major heatwave days of 18 June and 19 July: major OA peaks simulated and partly observed at the campaign sites during the night of 17 to 18 June can be attributed to nighttime BSOA build-up above forested areas within and south of Île-de-France and to further advection of these BSOA-rich air masses to the campaign sites. Concerning 19 July, we make evident regional advection of biomass burning aerosol and BSOA from the Aquitaine region in the southwest of France. Over the whole campaign period, we simulated BSOA contributing to 53 %–62 % of OA for the PRG, SIRTA and RambForest campaign sites; ASOA to 26 %–29 %; POA-BB to 2 %–3 %; POA to 3 %–9 %; and OPOA (or SI-SOA) to 5 %–6 %. Even if such attributions are prone to the above-discussed uncertainties, they show the mixed anthropogenic–biogenic origin of OA during the ACROSS campaign and provide support for comparisons with observation-based tracer studies.
For short-term perspectives, further evaluation of the WRF–CHIMERE model system is necessary and will be performed continuously as new campaign data become available. Especially for biogenic VOCs, such data will be useful to evaluate biogenic VOCs under diversified meteorological conditions. Radical measurements (OH, NO3) will be used to evaluate the model's oxidant capacity. For instance, this will enable studies affecting organic aerosol formation via different pathways, including the differentiation of precursors and oxidants. This will enable the elucidation of the interplay between anthropogenic and biogenic sources. Future research will also concern the usage of the WRF–CHIMERE model to estimate the aerosol radiative effects, with a particular focus on the role of the anthropogenic–biogenic mixing. In order to address this goal, the next stage of this research will focus on the evaluation of the aerosol size distribution, spectral optical properties and radiation.
Level 2 datasets used in the present study from the ACROSS field campaign for the PRG and RambForest sites are available or will be made available at the AERIS Data Center (https://across.aeris-data.fr/catalogue/, AERIS, 2025) and via the DOI referenced. Some datasets that are already available are the black carbon Paris-to-region ratio (https://doi.org/10.25326/529, Di Antonio et al., 2023a); equivalent black carbon at the PRG site (https://doi.org/10.25326/575, Di Antonio et al., 2023b); PM1, PM2.5 and PM10 (https://doi.org/10.25326/572, Di Antonio et al., 2023c); the refractory black carbon concentration at the RambForest site (https://doi.org/10.25326/527, Yu and Formenti, 2023); the non-refractory aerosol composition below and above the canopy at the RambForest site (https://doi.org/10.25326/492, Ferreira de Brito et al., 2023b; https://doi.org/10.25326/491, Ferreira de Brito et al., 2023a); and the mixed-layer height at SIRTA (https://doi.org/10.25326/501, Kotthaus et al., 2023).
The SIRTA observatory data can be downloaded at https://sirta.ipsl.polytechnique.fr/sirta/data/data_search/ (last access: 7 April 2024) (IPSL, 2024).
The GEOD'AIR data are available at https://www.geodair.fr/donnees/api/ (GEOD'AIR, 2025). European Environment Agency data are available at https://eeadmz1-downloads-webapp.azurewebsites.net/ (EEA, 2025). The MIDAS (Met Office, 2012) data are available at https://catalogue.ceda.ac.uk/uuid/220a65615218d5c9cc9e4785a3234bd0 (last access: 7 April 2024).
The HYSPLIT simulations are available on the AERIS website (https://doi.org/10.25326/543, Siour and Di Antonio, 2023).
The supplement related to this article is available online at https://doi.org/10.5194/acp-25-4803-2025-supplement.
LDA and MB designed the study and discussed the results. LDA performed the full data analysis. MB and CDB supervised all the analysis work. VM and CC coordinated the ACROSS field campaign. LDA ran the model simulations with contributions from GS and MB. LDA, VM, CC, AB, ABe, MC, SC, MCi, JFB, PF, CG, OG, AG, VG, MH, LH, SK, GN, DP, JEP, EDP, VR, CY, JFD and CDB contributed to the campaign setup, deployment, calibration and operation of the instrumentation and the data collection from the PRG, SIRTA and RambForest sites. LDA, MB and CDB wrote the paper with contributions from all co-authors.
At least one of the (co-)authors is a member of the editorial board of Atmospheric Chemistry and Physics. Furthermore, at least one of the (co-)authors is a guest member of the editorial board of Atmospheric Chemistry and Physics for the special issue “Atmospheric Chemistry of the Suburban Forest – multiplatform observational campaign of the chemistry and physics of mixed urban and biogenic emissions (ACP/AMT inter-journal SI)”. The peer-review process was guided by an independent editor, and the authors also have no other competing interests to declare.
Publisher’s note: Copernicus Publications remains neutral with regard to jurisdictional claims made in the text, published maps, institutional affiliations, or any other geographical representation in this paper. While Copernicus Publications makes every effort to include appropriate place names, the final responsibility lies with the authors.
This article is part of the special issue “Atmospheric Chemistry of the Suburban Forest – multiplatform observational campaign of the chemistry and physics of mixed urban and biogenic emissions”. It is not associated with a conference.
The EEA is acknowledged for the air quality data used for the simulation validation. The NCEP is acknowledged for the meteorological input data used in the WRF meteorological model. The GEOD'AIR database is acknowledged for the aerosol composition data used to validate the model simulation. Useful discussions with Marc Mallet, Yevgeny Derimian and Jean-Christophe Raut are gratefully acknowledged. We thank Stéphanie Alage, Elie Almarj, Thomas Bertin, Patrice Coll, Anais Feron, Maxime Feingesicht, Oscar Guillemant, Sergio Harb, Johannes Heuser, Brigitte Language, Olivier Lauret, Camilo Macias, Franck Maisonneuve, Bénedicte Piquet-Varrault, Raquel Torres, Pascal Zapf, Alexandre Albinet, James Allan, Robin Aujay-Plouzeau, Manon Cayet, Martin Des Forges, David O. De Haan, Juliette R. Dignum, Olivier Favez, Eva Drew Pronovost, Sidney Riley, Alec Rose, Kanuri I. Roundtree and Marko Stepanovic for their contribution to the ACROSS field campaign deployment and filter sampling. Helpful comments by the two anonymous reviewers are gratefully acknowledged.
This work has been supported by the ACROSS and RI-URBANS projects. The ACROSS project has received funding from the French National Research Agency (ANR), with the reference ANR-20-CE01-0010, and under the investment programme integrated into France 2030, with the reference ANR-17-MPGA-0002, and it was supported by the French national programme LEFE (Les Enveloppes Fluides et l'Environnement) of the CNRS–INSU (Centre National de la Recherche Scientifique–Institut National des Sciences de l'Univers). The RI-URBANS project has received funding from the European Union's Horizon 2020 research and innovation programme under grant agreement no. 101036245. This work has also been supported by the Université Paris-Est Créteil. Chenjie Yu received funding from the Marie Skłodowska-Curie COFUND postdoctoral fellowship programme supported by the Paris Region. IMT Nord Europe received financial support from the Labex CaPPA project, which is funded by the ANR through PIA (Programme d'Investissement d'Avenir) under contract ANR-11-LABX-0005-01. This project was provided with computer and storage resources on the Joliot-Curie supercomputer SKL partition by GENCI at TGCC via grant 2022-A0130107232. Lelia N. Hawkins and Eva Drew Pronovost were funded by NSF IRES 1825094. The PEGASUS facility receives funding as a national facility (instrument national) of the CNRS INSU within the ACTRIS-FR research infrastructure. This work has been supported by the Centre National d’Études Spatiales (CNES) via a TOSCA/FIRESAT grant.
This paper was edited by Maria Kanakidou and reviewed by two anonymous referees.
ACTRIS: https://www.actris-ecac.eu/particle-light-absorption.html (last access: 18 February 2025), 2023.
AERIS: Catalogue, https://across.aeris-data.fr/catalogue/ (last access: 8 May 2025), 2025.
Ancellet, G., Viatte, C., Boynard, A., Ravetta, F., Pelon, J., Cailteau-Fischbach, C., Genau, P., Capo, J., Roy, A., and Nédélec, P.: Analysis of the day-to-day variability of ozone vertical profiles in the lower troposphere during the 2022 Paris ACROSS campaign, Atmos. Chem. Phys., 24, 12963–12983, https://doi.org/10.5194/acp-24-12963-2024, 2024.
Andrés Hernández, M. D., Hilboll, A., Ziereis, H., Förster, E., Krüger, O. O., Kaiser, K., Schneider, J., Barnaba, F., Vrekoussis, M., Schmidt, J., Huntrieser, H., Blechschmidt, A.-M., George, M., Nenakhov, V., Harlass, T., Holanda, B. A., Wolf, J., Eirenschmalz, L., Krebsbach, M., Pöhlker, M. L., Kalisz Hedegaard, A. B., Mei, L., Pfeilsticker, K., Liu, Y., Koppmann, R., Schlager, H., Bohn, B., Schumann, U., Richter, A., Schreiner, B., Sauer, D., Baumann, R., Mertens, M., Jöckel, P., Kilian, M., Stratmann, G., Pöhlker, C., Campanelli, M., Pandolfi, M., Sicard, M., Gómez-Amo, J. L., Pujadas, M., Bigge, K., Kluge, F., Schwarz, A., Daskalakis, N., Walter, D., Zahn, A., Pöschl, U., Bönisch, H., Borrmann, S., Platt, U., and Burrows, J. P.: Overview: On the transport and transformation of pollutants in the outflow of major population centres – observational data from the EMeRGe European intensive operational period in summer 2017, Atmos. Chem. Phys., 22, 5877–5924, https://doi.org/10.5194/acp-22-5877-2022, 2022.
Appel, K. W., Bash, J. O., Fahey, K. M., Foley, K. M., Gilliam, R. C., Hogrefe, C., Hutzell, W. T., Kang, D., Mathur, R., Murphy, B. N., Napelenok, S. L., Nolte, C. G., Pleim, J. E., Pouliot, G. A., Pye, H. O. T., Ran, L., Roselle, S. J., Sarwar, G., Schwede, D. B., Sidi, F. I., Spero, T. L., and Wong, D. C.: The Community Multiscale Air Quality (CMAQ) model versions 5.3 and 5.3.1: system updates and evaluation, Geosci. Model Dev., 14, 2867–2897, https://doi.org/10.5194/gmd-14-2867-2021, 2021.
Arino, O., Bicheron, P., Achard, F., Latham, J., Witt, R., and Weber, J.-L.: GLOBCOVER: The Most Detailed Portrait of Earth, ESA Bull., 136, 24–31, 2008.
Baklanov, A., Lawrence, M., Pandis, S., Mahura, A., Finardi, S., Moussiopoulos, N., Beekmann, M., Laj, P., Gomes, L., Jaffrezo, J.-L., Borbon, A., Coll, I., Gros, V., Sciare, J., Kukkonen, J., Galmarini, S., Giorgi, F., Grimmond, S., Esau, I., Stohl, A., Denby, B., Wagner, T., Butler, T., Baltensperger, U., Builtjes, P., van den Hout, D., van der Gon, H. D., Collins, B., Schluenzen, H., Kulmala, M., Zilitinkevich, S., Sokhi, R., Friedrich, R., Theloke, J., Kummer, U., Jalkinen, L., Halenka, T., Wiedensholer, A., Pyle, J., and Rossow, W. B.: MEGAPOLI: concept of multi-scale modelling of megacity impact on air quality and climate, Adv. Sci. Res., 4, 115–120, https://doi.org/10.5194/asr-4-115-2010, 2010.
Barbet, C., Deguillaume, L., Chaumerliac, N., Leriche, M., Freney, E., Colomb, A., Sellegri, K., Patryl, L., and Armand, P.: Evaluation of Aerosol Chemical Composition Simulations by the WRF-Chem Model at the Puy de Dôme Station (France), Aerosol Air Qual. Res., 16, 909–917, https://doi.org/10.4209/aaqr.2015.05.0342, 2016.
Bedoya-Velásquez, A. E., Titos, G., Bravo-Aranda, J. A., Haeffelin, M., Favez, O., Petit, J.-E., Casquero-Vera, J. A., Olmo-Reyes, F. J., Montilla-Rosero, E., Hoyos, C. D., Alados-Arboledas, L., and Guerrero-Rascado, J. L.: Long-term aerosol optical hygroscopicity study at the ACTRIS SIRTA observatory: synergy between ceilometer and in situ measurements, Atmos. Chem. Phys., 19, 7883–7896, https://doi.org/10.5194/acp-19-7883-2019, 2019.
Beekmann, M., Prévôt, A. S. H., Drewnick, F., Sciare, J., Pandis, S. N., Denier van der Gon, H. A. C., Crippa, M., Freutel, F., Poulain, L., Ghersi, V., Rodriguez, E., Beirle, S., Zotter, P., von der Weiden-Reinmüller, S.-L., Bressi, M., Fountoukis, C., Petetin, H., Szidat, S., Schneider, J., Rosso, A., El Haddad, I., Megaritis, A., Zhang, Q. J., Michoud, V., Slowik, J. G., Moukhtar, S., Kolmonen, P., Stohl, A., Eckhardt, S., Borbon, A., Gros, V., Marchand, N., Jaffrezo, J. L., Schwarzenboeck, A., Colomb, A., Wiedensohler, A., Borrmann, S., Lawrence, M., Baklanov, A., and Baltensperger, U.: In situ, satellite measurement and model evidence on the dominant regional contribution to fine particulate matter levels in the Paris megacity, Atmos. Chem. Phys., 15, 9577–9591, https://doi.org/10.5194/acp-15-9577-2015, 2015.
Budisulistiorini, S. H., Canagaratna, M. R., Croteau, P. L., Baumann, K., Edgerton, E. S., Kollman, M. S., Ng, N. L., Verma, V., Shaw, S. L., Knipping, E. M., Worsnop, D. R., Jayne, J. T., Weber, R. J., and Surratt, J. D.: Intercomparison of an Aerosol Chemical Speciation Monitor (ACSM) with ambient fine aerosol measurements in downtown Atlanta, Georgia, Atmos. Meas. Tech., 7, 1929–1941, https://doi.org/10.5194/amt-7-1929-2014, 2014.
Calderón-Garcidueñas, L., Kulesza, R. J., Doty, R. L., D'Angiulli, A., and Torres-Jardón, R.: Megacities air pollution problems: Mexico City Metropolitan Area critical issues on the central nervous system pediatric impact, Environ. Res., 137, 157–169, https://doi.org/10.1016/j.envres.2014.12.012, 2015.
Cantrell, C. and Michoud, V.: ACROSS: A Field Experiment to Study Atmospheric Oxidation Chemistry and Physics of Mixed Anthropogenic-Biogenic Air Masses in the Greater Paris Area, B. Am. Meteorol. Soc., 1, 599–603, https://doi.org/10.1175/BAMS-D-21-0115.1, 2022.
Carlton, A. G., Pye, H. O. T., Baker, K. R., and Hennigan, C. J.: Additional Benefits of Federal Air-Quality Rules: Model Estimates of Controllable Biogenic Secondary Organic Aerosol, Environ. Sci. Technol., 52, 9254–9265, https://doi.org/10.1021/acs.est.8b01869, 2018.
Carter, W. P. L.: Development of the SAPRC-07 chemical mechanism, Atmos. Environ., 44, 5324–5335, https://doi.org/10.1016/j.atmosenv.2010.01.026, 2010.
Cavalli, F., Viana, M., Yttri, K. E., Genberg, J., and Putaud, J.-P.: Toward a standardised thermal-optical protocol for measuring atmospheric organic and elemental carbon: the EUSAAR protocol, Atmos. Meas. Tech., 3, 79–89, https://doi.org/10.5194/amt-3-79-2010, 2010.
Céspedes, J., Kotthaus, S., Preissler, J., Toupoint, C., Thobois, L., Drouin, M.-A., Dupont, J.-C., Faucheux, A., and Haeffelin, M.: The Paris low-level jet during PANAME 2022 and its impact on the summertime urban heat island, Atmos. Chem. Phys., 24, 11477–11496, https://doi.org/10.5194/acp-24-11477-2024, 2024.
Chahine, A., Dupont, E., Musson-Genon, L., Legorgeu, C., and Carissimo, B.: Long term modelling of the dynamical atmospheric flows over SIRTA site, J. Wind Eng. Ind. Aerodyn., 172, 351–366, https://doi.org/10.1016/j.jweia.2017.09.004, 2018.
Cholakian, A., Beekmann, M., Colette, A., Coll, I., Siour, G., Sciare, J., Marchand, N., Couvidat, F., Pey, J., Gros, V., Sauvage, S., Michoud, V., Sellegri, K., Colomb, A., Sartelet, K., Langley DeWitt, H., Elser, M., Prévot, A. S. H., Szidat, S., and Dulac, F.: Simulation of fine organic aerosols in the western Mediterranean area during the ChArMEx 2013 summer campaign, Atmos. Chem. Phys., 18, 7287–7312, https://doi.org/10.5194/acp-18-7287-2018, 2018.
Cholakian, A., Beekmann, M., Coll, I., Ciarelli, G., and Colette, A.: Biogenic secondary organic aerosol sensitivity to organic aerosol simulation schemes in climate projections, Atmos. Chem. Phys., 19, 13209–13226, https://doi.org/10.5194/acp-19-13209-2019, 2019.
Cholakian, A., Beekmann, M., Siour, G., Coll, I., Cirtog, M., Ormeño, E., Flaud, P.-M., Perraudin, E., and Villenave, E.: Simulation of organic aerosol, its precursors, and related oxidants in the Landes pine forest in southwestern France: accounting for domain-specific land use and physical conditions, Atmos. Chem. Phys., 23, 3679–3706, https://doi.org/10.5194/acp-23-3679-2023, 2023.
Ciarelli, G., Theobald, M. R., Vivanco, M. G., Beekmann, M., Aas, W., Andersson, C., Bergström, R., Manders-Groot, A., Couvidat, F., Mircea, M., Tsyro, S., Fagerli, H., Mar, K., Raffort, V., Roustan, Y., Pay, M.-T., Schaap, M., Kranenburg, R., Adani, M., Briganti, G., Cappelletti, A., D'Isidoro, M., Cuvelier, C., Cholakian, A., Bessagnet, B., Wind, P., and Colette, A.: Trends of inorganic and organic aerosols and precursor gases in Europe: insights from the EURODELTA multi-model experiment over the 1990–2010 period, Geosci. Model Dev., 12, 4923–4954, https://doi.org/10.5194/gmd-12-4923-2019, 2019.
Crenn, V., Sciare, J., Croteau, P. L., Verlhac, S., Fröhlich, R., Belis, C. A., Aas, W., Äijälä, M., Alastuey, A., Artiñano, B., Baisnée, D., Bonnaire, N., Bressi, M., Canagaratna, M., Canonaco, F., Carbone, C., Cavalli, F., Coz, E., Cubison, M. J., Esser-Gietl, J. K., Green, D. C., Gros, V., Heikkinen, L., Herrmann, H., Lunder, C., Minguillón, M. C., Močnik, G., O'Dowd, C. D., Ovadnevaite, J., Petit, J.-E., Petralia, E., Poulain, L., Priestman, M., Riffault, V., Ripoll, A., Sarda-Estève, R., Slowik, J. G., Setyan, A., Wiedensohler, A., Baltensperger, U., Prévôt, A. S. H., Jayne, J. T., and Favez, O.: ACTRIS ACSM intercomparison – Part 1: Reproducibility of concentration and fragment results from 13 individual Quadrupole Aerosol Chemical Speciation Monitors (Q-ACSM) and consistency with co-located instruments, Atmos. Meas. Tech., 8, 5063–5087, https://doi.org/10.5194/amt-8-5063-2015, 2015.
Debry, E., Fahey, K., Sartelet, K., Sportisse, B., and Tombette, M.: Technical Note: A new SIze REsolved Aerosol Model (SIREAM), Atmos. Chem. Phys., 7, 1537–1547, https://doi.org/10.5194/acp-7-1537-2007, 2007.
DeCarlo, P. F., Kimmel, J. R., Trimborn, A., Northway, M. J., Jayne, J. T., Aiken, A. C., Gonin, M., Fuhrer, K., Horvath, T., Docherty, K. S., Worsnop, D. R., and Jimenez, J. L.: Field-Deployable, High-Resolution, Time-of-Flight Aerosol Mass Spectrometer, Anal. Chem., 78, 8281–8289, https://doi.org/10.1021/ac061249n, 2006.
Di Antonio, L., Siour, G., and Beekmann, M.: ACROSS_LISA_CHIMERE_BCRatio_1H, Aeris [data set], https://doi.org/10.25326/529, 2023a.
Di Antonio, L., Di Biagio, C., and Gratien, A.: ACROSS_LISA_ PRG_AETH-eBC_PM1_1-Min_L2, Aeris [data set], https://doi.org/10.25326/575, 2023b.
Di Antonio, L., Di Biagio, C., and Gratien, A.: ACROSS_LISA_ PRG_FIDAS_PM_1-Min_L2, Aeris [data set], https://doi.org/10.25326/572, 2023c.
Di Antonio, L., Di Biagio, C., Foret, G., Formenti, P., Siour, G., Doussin, J.-F., and Beekmann, M.: Aerosol optical depth climatology from the high-resolution MAIAC product over Europe: differences between major European cities and their surrounding environments, Atmos. Chem. Phys., 23, 12455–12475, https://doi.org/10.5194/acp-23-12455-2023, 2023d.
Di Biagio, C., Gratien, A., Bauville, A., Cazaunau, M., Hawkins, L., Pronovost, D., Bergé, A., and Di Antonio, L.: ACROSS_LISA_PRG_ACSM-nrPM1comp_6-min_v1_L2, Aeris [data set], https://doi.org/10.25326/775, 2025.
Donahue, N. M., Robinson, A. L., Stanier, C. O., and Pandis, S. N.: Coupled Partitioning, Dilution, and Chemical Aging of Semivolatile Organics, Environ. Sci. Technol., 40, 2635–2643, https://doi.org/10.1021/es052297c, 2006.
Du, Q., Zhao, C., Zhang, M., Dong, X., Chen, Y., Liu, Z., Hu, Z., Zhang, Q., Li, Y., Yuan, R., and Miao, S.: Modeling diurnal variation of surface PM2.5 concentrations over East China with WRF-Chem: impacts from boundary-layer mixing and anthropogenic emission, Atmos. Chem. Phys., 20, 2839–2863, https://doi.org/10.5194/acp-20-2839-2020, 2020.
EEA: European Environment Agency, EEA [data set], https://eeadmz1-downloads-webapp.azurewebsites.net/, last access: 5 May 2025.
Ferreira de Brito, J., Riffault, V., Dusanter, S., and Jamar, M.: ACROSS_IMTNE_RambForest_AMS_AboveCanopy_L2, Aeris [data set], https://doi.org/10.25326/491, 2023a.
Ferreira de Brito, J., Riffault, V., Dusanter, S., and Jamar, M.: ACROSS_IMTNE_RambForest_AMS_BelowCanopy_L2, Aeris [data set], https://doi.org/10.25326/492, 2023b.
Ferreyra, M. F. G., Curci, G., and Lanfri, M.: First Implementation of the WRF-CHIMERE-EDGAR Modeling System Over Argentina, IEEE J. Sel. Top. Appl., 9, 5304–5314, https://doi.org/10.1109/JSTARS.2016.2588502, 2016.
Fountoukis, C., Megaritis, A. G., Skyllakou, K., Charalampidis, P. E., Denier van der Gon, H. A. C., Crippa, M., Prévôt, A. S. H., Fachinger, F., Wiedensohler, A., Pilinis, C., and Pandis, S. N.: Simulating the formation of carbonaceous aerosol in a European Megacity (Paris) during the MEGAPOLI summer and winter campaigns, Atmos. Chem. Phys., 16, 3727–3741, https://doi.org/10.5194/acp-16-3727-2016, 2016.
Freney, E. J., Sellegri, K., Canonaco, F., Colomb, A., Borbon, A., Michoud, V., Doussin, J.-F., Crumeyrolle, S., Amarouche, N., Pichon, J.-M., Bourianne, T., Gomes, L., Prevot, A. S. H., Beekmann, M., and Schwarzenböeck, A.: Characterizing the impact of urban emissions on regional aerosol particles: airborne measurements during the MEGAPOLI experiment, Atmos. Chem. Phys., 14, 1397–1412, https://doi.org/10.5194/acp-14-1397-2014, 2014.
Fröhlich, R., Cubison, M. J., Slowik, J. G., Bukowiecki, N., Prévôt, A. S. H., Baltensperger, U., Schneider, J., Kimmel, J. R., Gonin, M., Rohner, U., Worsnop, D. R., and Jayne, J. T.: The ToF-ACSM: a portable aerosol chemical speciation monitor with TOFMS detection, Atmos. Meas. Tech., 6, 3225–3241, https://doi.org/10.5194/amt-6-3225-2013, 2013.
GEOD'AIR: GEstion des données d'Observation de la qualité de l'AIR, GEOD'AIR [data set], https://www.geodair.fr/donnees/api/, last access: 5 May 2025.
Guenther, A., Karl, T., Harley, P., Wiedinmyer, C., Palmer, P. I., and Geron, C.: Estimates of global terrestrial isoprene emissions using MEGAN (Model of Emissions of Gases and Aerosols from Nature), Atmos. Chem. Phys., 6, 3181–3210, https://doi.org/10.5194/acp-6-3181-2006, 2006.
Haeffelin, M., Barthès, L., Bock, O., Boitel, C., Bony, S., Bouniol, D., Chepfer, H., Chiriaco, M., Cuesta, J., Delanoë, J., Drobinski, P., Dufresne, J.-L., Flamant, C., Grall, M., Hodzic, A., Hourdin, F., Lapouge, F., Lemaître, Y., Mathieu, A., Morille, Y., Naud, C., Noël, V., O'Hirok, W., Pelon, J., Pietras, C., Protat, A., Romand, B., Scialom, G., and Vautard, R.: SIRTA, a ground-based atmospheric observatory for cloud and aerosol research, Ann. Geophys., 23, 253–275, https://doi.org/10.5194/angeo-23-253-2005, 2005.
Harrison, R. M., Dall'Osto, M., Beddows, D. C. S., Thorpe, A. J., Bloss, W. J., Allan, J. D., Coe, H., Dorsey, J. R., Gallagher, M., Martin, C., Whitehead, J., Williams, P. I., Jones, R. L., Langridge, J. M., Benton, A. K., Ball, S. M., Langford, B., Hewitt, C. N., Davison, B., Martin, D., Petersson, K. F., Henshaw, S. J., White, I. R., Shallcross, D. E., Barlow, J. F., Dunbar, T., Davies, F., Nemitz, E., Phillips, G. J., Helfter, C., Di Marco, C. F., and Smith, S.: Atmospheric chemistry and physics in the atmosphere of a developed megacity (London): an overview of the REPARTEE experiment and its conclusions, Atmos. Chem. Phys., 12, 3065–3114, https://doi.org/10.5194/acp-12-3065-2012, 2012.
Hersbach, H., Bell, B., Berrisford, P., Bilavati, G., Horányi, A., Muñoz Sabater, J., Nicolas, J., Peubey, C., Radu, R., Rozum, I., Schepers, D., Simmons, A., Soci, C., Dee, D., and Thépaut, J.-N.: ERA5 hourly data on pressure levels from 1940 to present, Copernicus Climate Change Service (C3S) Climate Data Store (CDS) [data set], https://doi.org/10.24381/cds.bd0915c6, 2023a.
Hersbach, H., Bell, B., Berrisford, P., Bilavati, G., Horányi, A., Muñoz Sabater, J., Nicolas, J., Peubey, C., Radu, R., Rozum, I., Schepers, D., Simmons, A., Soci, C., Dee, D., and Thépaut, J.-N.: ERA5 hourly data on single levels from 1940 to present. Copernicus Climate Change Service (C3S) Climate Data Store (CDS) [data set], https://doi.org/10.24381/cds.adbb2d47, 2023b.
Hong, S.-Y.: A new stable boundary-layer mixing scheme and its impact on the simulated East Asian summer monsoon, Q. J. Roy. Meteor. Soc., 136, 1481–1496, https://doi.org/10.1002/qj.665, 2010.
Honoré, C., Rouïl, L., Vautard, R., Beekmann, M., Bessagnet, B., Dufour, A., Elichegaray, C., Flaud, J.-M., Malherbe, L., Meleux, F., Menut, L., Martin, D., Peuch, A., Peuch, V.-H., and Poisson, N.: Predictability of European air quality: Assessment of 3 years of operational forecasts and analyses by the PREV'AIR system, J. Geophys. Res.-Atmos., 113, D04301, https://doi.org/10.1029/2007JD008761, 2008.
Iacono, M. J., Delamere, J. S., Mlawer, E. J., Shephard, M. W., Clough, S. A., and Collins, W. D.: Radiative forcing by long-lived greenhouse gases: Calculations with the AER radiative transfer models, J. Geophys. Res.-Atmos., 113, D13103, https://doi.org/10.1029/2008JD009944, 2008.
IPSL: SIRTA Atmospheric Observatory, IPSL [data set], https://sirta.ipsl.polytechnique.fr/sirta/data/data_search/, last access: 7 April 2024.
Jiang, J., Aksoyoglu, S., Ciarelli, G., Oikonomakis, E., El-Haddad, I., Canonaco, F., O'Dowd, C., Ovadnevaite, J., Minguillón, M. C., Baltensperger, U., and Prévôt, A. S. H.: Effects of two different biogenic emission models on modelled ozone and aerosol concentrations in Europe, Atmos. Chem. Phys., 19, 3747–3768, https://doi.org/10.5194/acp-19-3747-2019, 2019.
Kaiser, J. W., Heil, A., Andreae, M. O., Benedetti, A., Chubarova, N., Jones, L., Morcrette, J.-J., Razinger, M., Schultz, M. G., Suttie, M., and van der Werf, G. R.: Biomass burning emissions estimated with a global fire assimilation system based on observed fire radiative power, Biogeosciences, 9, 527–554, https://doi.org/10.5194/bg-9-527-2012, 2012.
Kotthaus, S., Haeffelin, M., Drouin, M.-A., Dupont, J.-C., Grimmond, S., Haefele, A., Hervo, M., Poltera, Y., and Wiegner, M.: Tailored Algorithms for the Detection of the Atmospheric Boundary Layer Height from Common Automatic Lidars and Ceilometers (ALC), Remote Sensing, 12, 3259, https://doi.org/10.3390/rs12193259, 2020.
Kotthaus, S., Haeffelin, M., Bouffies-Cloche, S., Dupont, J.-C., and Drouin, M.-A: PANAME Mixed Layer Height from high-SNR Automatic Aerosol Lidars, Aeris [data set], https://doi.org/10.25326/501, 2023.
Kulmala, M., Laaksonen, A., and Pirjola, L.: Parameterizations for sulfuric acid/water nucleation rates, J. Geophys. Res.-Atmos., 103, 8301–8307, https://doi.org/10.1029/97JD03718, 1998.
Lachatre, M., Mailler, S., Menut, L., Turquety, S., Sellitto, P., Guermazi, H., Salerno, G., Caltabiano, T., and Carboni, E.: New strategies for vertical transport in chemistry transport models: application to the case of the Mount Etna eruption on 18 March 2012 with CHIMERE v2017r4, Geosci. Model Dev., 13, 5707–5723, https://doi.org/10.5194/gmd-13-5707-2020, 2020.
Lane, T. E., Donahue, N. M., and Pandis, S. N.: Simulating secondary organic aerosol formation using the volatility basis-set approach in a chemical transport model, Atmos. Environ., 42, 7439–7451, https://doi.org/10.1016/j.atmosenv.2008.06.026, 2008.
Lenschow, P., Abraham, H.-J., Kutzner, K., Lutz, M., Preuß, J.-D., and Reichenbächer, W.: Some ideas about the sources of PM10, Atmos. Environ., 35, S23–S33, https://doi.org/10.1016/S1352-2310(01)00122-4, 2001.
Lin, C.-Y., Chen, W.-C., Chien, Y.-Y., Chou, C. C. K., Liu, C.-Y., Ziereis, H., Schlager, H., Förster, E., Obersteiner, F., Krüger, O. O., Holanda, B. A., Pöhlker, M. L., Kaiser, K., Schneider, J., Bohn, B., Pfeilsticker, K., Weyland, B., Andrés Hernández, M. D., and Burrows, J. P.: Effects of transport on a biomass burning plume from Indochina during EMeRGe-Asia identified by WRF-Chem, Atmos. Chem. Phys., 23, 2627–2647, https://doi.org/10.5194/acp-23-2627-2023, 2023.
Liu, Y., Liu, Y., Wang, M., Dong, X., Zheng, Y., Shrivastava, M., Qian, Y., Bai, H., Li, X., and Yang, X.-Q.: Anthropogenic–biogenic interaction amplifies warming from emission reduction over the southeastern US, Environ. Res. Lett., 16, 124046, https://doi.org/10.1088/1748-9326/ac3285, 2021.
Menut, L., Bessagnet, B., Briant, R., Cholakian, A., Couvidat, F., Mailler, S., Pennel, R., Siour, G., Tuccella, P., Turquety, S., and Valari, M.: The CHIMERE v2020r1 online chemistry-transport model, Geosci. Model Dev., 14, 6781–6811, https://doi.org/10.5194/gmd-14-6781-2021, 2021.
Menut, L., Cholakian, A., Siour, G., Lapere, R., Pennel, R., Mailler, S., and Bessagnet, B.: Impact of Landes forest fires on air quality in France during the 2022 summer, Atmos. Chem. Phys., 23, 7281–7296, https://doi.org/10.5194/acp-23-7281-2023, 2023.
Messina, P., Lathière, J., Sindelarova, K., Vuichard, N., Granier, C., Ghattas, J., Cozic, A., and Hauglustaine, D. A.: Global biogenic volatile organic compound emissions in the ORCHIDEE and MEGAN models and sensitivity to key parameters, Atmos. Chem. Phys., 16, 14169–14202, https://doi.org/10.5194/acp-16-14169-2016, 2016.
Met Office: Met Office Integrated Data Archive System (MIDAS) Land and Marine Surface Stations Data (1853–current), NCAS British Atmospheric Data Centre, 2024, https://catalogue.ceda.ac.uk/uuid/220a65615218d5c9cc9e4785a3234bd0 (last access: 5 May 2025), 2012.
Molina, M. J. and Molina, L. T.: Megacities and Atmospheric Pollution, JAPCA J. Air Waste Ma., 54, 644–680, https://doi.org/10.1080/10473289.2004.10470936, 2004.
Murphy, B. N. and Pandis, S. N.: Simulating the Formation of Semivolatile Primary and Secondary Organic Aerosol in a Regional Chemical Transport Model, Environ. Sci. Technol., 43, 4722–4728, https://doi.org/10.1021/es803168a, 2009.
Nenes, A., Pandis, S. N., and Pilinis, C.: ISORROPIA: A New Thermodynamic Equilibrium Model for Multiphase Multicomponent Inorganic Aerosols, Aquat. Geochem., 4, 123–152, https://doi.org/10.1023/A:1009604003981, 1998.
Oomen, G.-M., Müller, J.-F., Stavrakou, T., De Smedt, I., Blumenstock, T., Kivi, R., Makarova, M., Palm, M., Röhling, A., Té, Y., Vigouroux, C., Friedrich, M. M., Frieß, U., Hendrick, F., Merlaud, A., Piters, A., Richter, A., Van Roozendael, M., and Wagner, T.: Weekly derived top-down volatile-organic-compound fluxes over Europe from TROPOMI HCHO data from 2018 to 2021, Atmos. Chem. Phys., 24, 449–474, https://doi.org/10.5194/acp-24-449-2024, 2024.
Pandis, S. N., Wexler, A. S., and Seinfeld, J. H.: Secondary organic aerosol formation and transport – II. Predicting the ambient secondary organic aerosol size distribution, Atmos. Environ. A-Gen., 27, 2403–2416, https://doi.org/10.1016/0960-1686(93)90408-Q, 1993.
Pandolfi, M., Mooibroek, D., Hopke, P., van Pinxteren, D., Querol, X., Herrmann, H., Alastuey, A., Favez, O., Hüglin, C., Perdrix, E., Riffault, V., Sauvage, S., van der Swaluw, E., Tarasova, O., and Colette, A.: Long-range and local air pollution: what can we learn from chemical speciation of particulate matter at paired sites?, Atmos. Chem. Phys., 20, 409–429, https://doi.org/10.5194/acp-20-409-2020, 2020.
Pankow, J. F.: An absorption model of the gas/aerosol partitioning involved in the formation of secondary organic aerosol, Atmos. Environ., 28, 189–193, https://doi.org/10.1016/1352-2310(94)90094-9, 1994.
Passant, N.: Speciation of UK emissions of non-methane volatile organic compounds, AEAT/ENV/R/0545, https://uk-air.defra.gov.uk/reports/empire/AEAT_ENV_0545_final_v2.pdf (last access: 7 May 2024), 2002.
Pereira, D., Gratien, A., Formenti, P., Giorio, C., Chevaillier, S., and Noyalet, G.: ACROSS_LISA_PRG_OC-EC_L2, Aeris [data set], https://doi.org/10.25326/682, 2024.
Ramboll: User's Guide: Comprehensive Air quality Model with extensions, version 7.20, https://www.camx.com (last access: 5 May 2025), 2022.
Ribes, A., Boé, J., Qasmi, S., Dubuisson, B., Douville, H., and Terray, L.: An updated assessment of past and future warming over France based on a regional observational constraint, Earth Syst. Dynam., 13, 1397–1415, https://doi.org/10.5194/esd-13-1397-2022, 2022.
Robinson, A. L., Donahue, N. M., Shrivastava, M. K., Weitkamp, E. A., Sage, A. M., Grieshop, A. P., Lane, T. E., Pierce, J. R., and Pandis, S. N.: Rethinking Organic Aerosols: Semivolatile Emissions and Photochemical Aging, Science, 315, 1259–1262, https://doi.org/10.1126/science.1133061, 2007.
Sartelet, K. N., Couvidat, F., Seigneur, C., and Roustan, Y.: Impact of biogenic emissions on air quality over Europe and North America, Atmos. Environ., 53, 131–141, https://doi.org/10.1016/j.atmosenv.2011.10.046, 2012.
Savadkoohi, M., Pandolfi, M., Reche, C., Niemi, J. V., Mooibroek, D., Titos, G., Green, D. C., Tremper, A. H., Hueglin, C., Liakakou, E., Mihalopoulos, N., Stavroulas, I., Artiñano, B., Coz, E., Alados-Arboledas, L., Beddows, D., Riffault, V., De Brito, J. F., Bastian, S., Baudic, A., Colombi, C., Costabile, F., Chazeau, B., Marchand, N., Gómez-Amo, J. L., Estellés, V., Matos, V., van der Gaag, E., Gille, G., Luoma, K., Manninen, H. E., Norman, M., Silvergren, S., Petit, J.-E., Putaud, J.-P., Rattigan, O. V., Timonen, H., Tuch, T., Merkel, M., Weinhold, K., Vratolis, S., Vasilescu, J., Favez, O., Harrison, R. M., Laj, P., Wiedensohler, A., Hopke, P. K., Petäjä, T., Alastuey, A., and Querol, X.: The variability of mass concentrations and source apportionment analysis of equivalent black carbon across urban Europe, Environ. Int., 178, 108081, https://doi.org/10.1016/j.envint.2023.108081, 2023.
Sciare, J., d'Argouges, O., Sarda-Estève, R., Gaimoz, C., Dolgorouky, C., Bonnaire, N., Favez, O., Bonsang, B., and Gros, V.: Large contribution of water-insoluble secondary organic aerosols in the region of Paris (France) during wintertime, J. Geophys. Res.-Atmos., 116, D22203, https://doi.org/10.1029/2011JD015756, 2011.
Seinfeld, J. H. and Pandis, S. N.: Atmospheric Chemistry and Physics: From Air Pollution to Climate Change, 1st edn., Wiley, 1326 pp., ISBN 978-0-471-17816-3, 1998.
Shrivastava, M., Zelenyuk, A., Imre, D., Easter, R., Beranek, J., Zaveri, R. A., and Fast, J.: Implications of low volatility SOA and gas-phase fragmentation reactions on SOA loadings and their spatial and temporal evolution in the atmosphere, J. Geophys. Res.-Atmos., 118, 3328–3342, https://doi.org/10.1002/jgrd.50160, 2013.
Shrivastava, M., Easter, R. C., Liu, X., Zelenyuk, A., Singh, B., Zhang, K., Ma, P.-L., Chand, D., Ghan, S., Jimenez, J. L., Zhang, Q., Fast, J., Rasch, P. J., and Tiitta, P.: Global transformation and fate of SOA: Implications of low-volatility SOA and gas-phase fragmentation reactions, J. Geophys. Res.-Atmos., 120, 4169–4195, https://doi.org/10.1002/2014JD022563, 2015.
Shrivastava, M., Andreae, M. O., Artaxo, P., Barbosa, H. M. J., Berg, L. K., Brito, J., Ching, J., Easter, R. C., Fan, J., Fast, J. D., Feng, Z., Fuentes, J. D., Glasius, M., Goldstein, A. H., Alves, E. G., Gomes, H., Gu, D., Guenther, A., Jathar, S. H., Kim, S., Liu, Y., Lou, S., Martin, S. T., McNeill, V. F., Medeiros, A., de Sá, S. S., Shilling, J. E., Springston, S. R., Souza, R. a. F., Thornton, J. A., Isaacman-VanWertz, G., Yee, L. D., Ynoue, R., Zaveri, R. A., Zelenyuk, A., and Zhao, C.: Urban pollution greatly enhances formation of natural aerosols over the Amazon rainforest, Nat. Commun., 10, 1046, https://doi.org/10.1038/s41467-019-08909-4, 2019.
Sindelarova, K., Granier, C., Bouarar, I., Guenther, A., Tilmes, S., Stavrakou, T., Müller, J.-F., Kuhn, U., Stefani, P., and Knorr, W.: Global data set of biogenic VOC emissions calculated by the MEGAN model over the last 30 years, Atmos. Chem. Phys., 14, 9317–9341, https://doi.org/10.5194/acp-14-9317-2014, 2014.
Sinha, A., George, I., Holder, A., Preston, W., Hays, M., and Grieshop, A. P.: Development of volatility distributions for organic matter in biomass burning emissions, Environ. Sci. Atmos., 3, 11–23, https://doi.org/10.1039/D2EA00080F, 2023.
Siour, G. and Di Antonio, L.: ACROSS_LISA_WRF-CHIMERE_HYSPLIT_Backtraj_1H, Aeris [data set], https://doi.org/10.25326/543, 2023.
Skamarock, W., Klemp, J., Dudhia, J., Gill, D., Barker, D., Wang, W., Huang, X.-Y., and Duda, M.: A Description of the Advanced Research WRF Version 3, UCAR/NCAR, https://doi.org/10.5065/D68S4MVH, 2008.
Soulie, A., Granier, C., Darras, S., Zilbermann, N., Doumbia, T., Guevara, M., Jalkanen, J.-P., Keita, S., Liousse, C., Crippa, M., Guizzardi, D., Hoesly, R., and Smith, S. J.: Global anthropogenic emissions (CAMS-GLOB-ANT) for the Copernicus Atmosphere Monitoring Service simulations of air quality forecasts and reanalyses, Earth Syst. Sci. Data, 16, 2261–2279, https://doi.org/10.5194/essd-16-2261-2024, 2024.
Stein, A. F., Draxler, R. R., Rolph, G. D., Stunder, B. J. B., Cohen, M. D., and Ngan, F.: NOAA's HYSPLIT Atmospheric Transport and Dispersion Modeling System, B. Am. Meteorol. Soc., 96, 2059–2077, https://doi.org/10.1175/BAMS-D-14-00110.1, 2015.
Sun, Y.-L., Zhang, Q., Schwab, J. J., Demerjian, K. L., Chen, W.-N., Bae, M.-S., Hung, H.-M., Hogrefe, O., Frank, B., Rattigan, O. V., and Lin, Y.-C.: Characterization of the sources and processes of organic and inorganic aerosols in New York city with a high-resolution time-of-flight aerosol mass apectrometer, Atmos. Chem. Phys., 11, 1581–1602, https://doi.org/10.5194/acp-11-1581-2011, 2011.
Thompson, G., Field, P. R., Rasmussen, R. M., and Hall, W. D.: Explicit Forecasts of Winter Precipitation Using an Improved Bulk Microphysics Scheme. Part II: Implementation of a New Snow Parameterization, Mon. Weather Rev., 136, 5095–5115, https://doi.org/10.1175/2008MWR2387.1, 2008.
Tuccella, P., Menut, L., Briant, R., Deroubaix, A., Khvorostyanov, D., Mailler, S., Siour, G., and Turquety, S.: Implementation of Aerosol-Cloud Interaction within WRF-CHIMERE Online Coupled Model: Evaluation and Investigation of the Indirect Radiative Effect from Anthropogenic Emission Reduction on the Benelux Union, Atmosphere, 10, 20, https://doi.org/10.3390/atmos10010020, 2019.
Verwer, J. G.: Gauss–Seidel Iteration for Stiff ODES from Chemical Kinetics, SIAM J. Sci. Comput., 15, 1243–1250, https://doi.org/10.1137/0915076, 1994.
Yu, C. and Formenti, P.: ACROSS_LISA_RambForest_ SP2_ rBC_0220614_20220722, Aeris [data set], https://doi.org/10.25326/527, 2023.
Yuan, H., Dai, Y., Xiao, Z., Ji, D., and Shangguan, W.: Reprocessing the MODIS Leaf Area Index products for land surface and climate modelling, Remote Sens. Environ., 115, 1171–1187, https://doi.org/10.1016/j.rse.2011.01.001, 2011.
Zhang, Q. J., Beekmann, M., Drewnick, F., Freutel, F., Schneider, J., Crippa, M., Prevot, A. S. H., Baltensperger, U., Poulain, L., Wiedensohler, A., Sciare, J., Gros, V., Borbon, A., Colomb, A., Michoud, V., Doussin, J.-F., Denier van der Gon, H. A. C., Haeffelin, M., Dupont, J.-C., Siour, G., Petetin, H., Bessagnet, B., Pandis, S. N., Hodzic, A., Sanchez, O., Honoré, C., and Perrussel, O.: Formation of organic aerosol in the Paris region during the MEGAPOLI summer campaign: evaluation of the volatility-basis-set approach within the CHIMERE model, Atmos. Chem. Phys., 13, 5767–5790, https://doi.org/10.5194/acp-13-5767-2013, 2013.
Zhang, Y., Favez, O., Petit, J.-E., Canonaco, F., Truong, F., Bonnaire, N., Crenn, V., Amodeo, T., Prévôt, A. S. H., Sciare, J., Gros, V., and Albinet, A.: Six-year source apportionment of submicron organic aerosols from near-continuous highly time-resolved measurements at SIRTA (Paris area, France), Atmos. Chem. Phys., 19, 14755–14776, https://doi.org/10.5194/acp-19-14755-2019, 2019.
- Abstract
- Introduction
- Methods
- Description of the meteorological situation and evaluation
- Analysis and WRF–CHIMERE model evaluation for major pollutants during the ACROSS campaign
- Case study illustration
- Discussion
- Conclusions and perspectives
- Data availability
- Author contributions
- Competing interests
- Disclaimer
- Special issue statement
- Acknowledgements
- Financial support
- Review statement
- References
- Supplement