the Creative Commons Attribution 4.0 License.
the Creative Commons Attribution 4.0 License.
 | 15 Apr 2025
Highly resolved satellite-remote-sensing-based land-use-change inventory yields weaker surface-albedo-induced global cooling
Xiaohu Jian
Xiaodong Zhang
Xinrui Liu
Kaijie Chen
Tao Huang
Shu Tao
Junfeng Liu
Hong Gao
Yuan Zhao
Ruiyu Zhugu
Jianmin Ma
Land-use change (LUC) is ranked as the second anthropogenic source of climate change after fossil fuel burning and yields negative albedo-induced radiative forcing (ARF). This cooling effect has been assessed using low spatiotemporally resolved LUC datasets derived from historical statistical data with large uncertainties. Herein, we implement a satellite-remote-sensing-derived highly resolved LUC dataset into a compact earth system model and reassess the global and regional surface ARF by LUC from 1983–2010 relative to 1750. We find that the magnitude of the negative ARF obtained from the present study is lower than that estimated by the Intergovernmental Panel on Climate Change by 20 %, implying a weaker cooling effect. The result reveals that the global LUC-induced surface albedo change may not significantly slow down global warming as was previously anticipated. Sub-Saharan Africa made the largest net contribution to the magnitude of the global ARF (39.2 %), due to substantial land-use conversions, typically the conversion from forest to other vegetation lands, which are accompanied by higher surface albedos. The most remarkable land cover changes occurred in East and Southeast Asia, which dominated the changes in the global ARF in recent decades. Based on major land cover types in these two regions, we infer that vegetation lands exert the most vital effect on global ARF variation.
- Article
(3644 KB) - Full-text XML
-
Supplement
(3798 KB) - BibTeX
- EndNote


Anthropological activities that have effectuated global climate change can be primarily categorized under greenhouse gas emissions, the emissions of aerosols, and land-use change (LUC) (IPCC AR6, 2021). LUC in different temporal and spatial scales varies rapidly from local to global scales, with significant ramifications for the climate system, and is one of the key drivers of global climate change (Feddema et al., 2005; Cai and Kalnay, 2004; Foley et al., 2005; Houghton et al., 2012; Zhu et al., 2019). LUC accounted for 13 %–20 % of the total anthropogenic carbon emissions from the 1990s to the 2010s and 20 % in the 1980s and 1990s (Houghton et al., 2012), ranking as the second source of anthropogenic climate change after fossil fuel combustion (Andrews et al., 2017). The influence of LUC on climate change is primarily manifested in two critical processes: the radiation–energy interface between the surface and the atmosphere and the changes in the carbon source–sink. LUC affects climate by emitting or absorbing greenhouse gases in the atmosphere, modifying the carbon cycle within the climate system. In other words, the effect of LUC on climate balance involved in understanding how changes in land use (such as afforestation, urbanization, or land restoration) affect the climate system's energy balance through biogeochemical and biogeophysical processes. These processes drive carbon sequestration and emissions and surface albedo change (Gries et al., 2019). LUC also modifies the albedo and roughness of the underlying surface, altering the surface heat budget. By functioning as a carbon sink through carbon reduction-oriented land management, LUC plays a pivotal role in the sequestration of carbon (IPCC AR6, 2021). Such LUC-induced carbon sinks are crucial for compensating emissions from other carbon sources, such as fossil fuel energy, transportation, and housing, that continue to emit carbon dioxide.
The extent of the influence of LUC on the climate system and energy balance is often measured in terms of radiative forcing (RF) (Andrews et al., 2017; Andrews and Forster, 2020; Ramanathan, 1975; Bonan, 2008; Betts, 2000; Ward et al., 2014). The primary effect of RF on climate change is through a temperature feedback mechanism (Sherwood et al., 2015). While the effects of LUC on climate balance have been extensively studied from the biogeochemical perspective (Foley et al., 2005; Houghton et al., 2012; Vose et al., 2004; Gries et al., 2019), knowledge gaps still remain in the understanding of LUC-induced climate forcing from the biogeophysical perspective. This is partly due to the lack of extensive investigations in the long-term effects of LUC-induced climate forcing prediction and uncertainties in this field (IPCC AR6, 2021). Immediate impacts may be different from those observed over decades or centuries. Long-term temporal studies that track these changes are limited. The commonly held belief is that the change in surface albedo associated with LUC has a negative forcing globally, leading to a cooling effect and functioning as a carbon sink. However, the magnitudes of negative forcing vary between −0.15 and in different studies spanning the pre-industrial to industrial era (IPCC AR3, 2001; Myhre and Myhre, 2003; Hansen and Nazarenko, 2004; Betts et al., 2007; Forster et al., 2007; Pongratz et al., 2009; Ward et al., 2014; Li et al., 2016; Jiao et al., 2017). The Intergovernmental Panel on Climate Change (IPCC) AR3 report (2001) (IPCC AR3, 2001) adopted as the global average RF due to surface albedo change. This value has been revised in subsequent reports to (IPCC AR6, 2021). The magnitude of negative RF induced by surface albedo (hereafter referred to as ARF) obtained from other studies appears to be greater than the IPCC-adopted value (Fig. 1). In AR3 of the IPCC, the scientific understanding of the LUC-induced ARF was deemed “very low”. Due to the limited number of studies and the uncertainty of historical land cover (LC) changes, IPCC AR6 (2021) assigns these values a medium confidence level. A substantial proportion of the uncertainties in the LUC and ARF can be attributed to the lack of high spatiotemporal resolution in LUC data and sufficient support by measurements (Gong et al., 2013; Winkler et al., 2021; Jian et al., 2022). Recently, numerous high-resolution remote-sensing datasets have been used to develop highly resolved LUC datasets (Gong et al., 2013; Winkler et al., 2021). Modern satellites are equipped with sensors that offer high spatial resolution, allowing for the detailed mapping of land-use changes. This level of detail is essential for identifying specific types of land-use changes, such as deforestation, urban expansion, or agricultural intensification, each of which has different impacts on radiative forcing. These remote-sensing-based datasets reveal that LUC has affected as much as one-third of the world's land area in just 6 decades (1960–2019), roughly 4 times greater than the estimates from long-term land change assessments conducted previously (Winkler et al., 2021). It is interesting to know if and to what extent recently developed remote-sensing-based global land-use (LU) change data with very high spatial–temporal resolution from a climate perspective and potentially low uncertainty could improve the estimation of LUC-induced global and regional climate forcing.
In the present study, we reassessed the LUC-forced ARF by incorporating a high-resolution (5 km×5 km) satellite-remote-sensing-measured LUC dataset into a compact earth system model (see “Materials and methods”) and evaluate the contributions from various LUC and LU types in different regions/countries to the global ARF, aiming to provide a more precise and measurement-based estimate of the regional and global ARF.
2.1 OSCAR model
OSCAR v2.4 (Gasser et al., 2017), a compact model of global biogeochemical cycles, is used to investigate the effect of LUC-induced changes in surface albedo on global RF. OSCAR is not spatially resolved but country- and region-based. It is a nonlinear box model incorporating as many key climate components and modules as possible, such as LUC and aerosol physics–chemistry feedback. The model was designed to simulate long-term trends in earth system change rather than seasonal and interannual variations in the earth system. OSCAR is also a parametric model in which several parameters required to calculate RF are calibrated on (or input from) complex climate models. Model uncertainties are assessed by Monte Carlo ensembles, including input LUC, surface albedo, and other model parameters. In the present study, we have assigned a 5 % uncertainty in the OSCAR-modeled ARF based on LUC data uncertainty. The uncertainty of the LUC data is subject to their accuracy (82.81 %, Liu et al., 2020a). We examined the response of the modeled ARF to the 5 % uncertainty by increasing the uncertainty to 10 % and 15 %. The differences of the simulated mean ARF between 5 % and 10 % and 15 % were only 0.23 % and 0.47 %, respectively. Further details, advantages of OSCAR model, and the motivations to use OSCAR model in our ARF simulations are presented in Sect. S1 in the Supplement.
2.2 Updated global LUC data
The OSCAR's capability to simulate LU-change-induced RF is one of its strengths. To assess the combined effects of human activities on the carbon–climate system (Hurtt et al., 2011), the model employs the LU Harmonization (LUH1) LUC dataset (LUH1-LUC) developed under IPCC-AR5. The results show a smooth transition of annual changes in LUC, suggesting that approach and data sources adopted to derive LUH1 (Sect. S2 in the Supplement) likely missed some important characteristics of LU transitions, resulting in a substantial uncertainty in the modeled LUC-induced RF. Although LUH1 was recently updated to LUH2 with a spatial resolution of 0.25°×0.25° latitude–longitude (Hurtt et al., 2020), in the present study, we chose the Global Land Surface Satellite global LC dataset (GLASS-GLC) (Liu et al., 2020a) to replace the LUH1 inventory with coarse spatial resolution in the OSCAR model to capture the temporal–spatial variations of LUC adequately. GLASS-GLC was developed using 5 km×5 km resolution GLASS (Global Land Surface Satellite) climate data records from 1982–2015. Although both LUH and GLASS-GLC provide annual LUC, compared to previous LUC products, such as LUH1 and LUH2, GLASS-GLC based on satellite remote sensing has greater consistency, a higher spatial resolution, and many LU types. Compared to the LUH1 dataset derived based on historical statistics and census data combining with the History Database of the Global Environment (HYDE) model and the Global Land-use Model (GLM) (Hurtt et al., 2011), the GLASS-GLC dataset uses the Google Earth Engine (GEE) platform with the latest version of GLASS CDRs (Climate Data Records) from 1982–2015 (Liu et al., 2020a) to obtain a more reliable land-use inventory.
It should recognize the differences between the satellite-derived land cover classifications (GLASS-LUC) and the land-use classifications (LUH1) and reconcile the differences. Table S1 in the Supplement list mapping categories of the LUH1 and GLASS-GLC. GLASS-GLC considers seven LUC classes, including cropland, forest, grassland, shrubland, tundra, barren land, and snow/ice, with an overall accuracy of 82.81 %. Although the GLASS-GLC data source also includes urban areas, these small areas are not straightforward to be distinguished at the 5 km×5 km resolution as compared to other LUCs (Liu et al., 2020a). Besides, while urban expansion could contribute to climate warming (Ouyang et al., 2022), our previous work (Jian et al., 2022) has explored the impact of urbanization on China's ARF and found that the impact of urban sprawl on China's ARF is very small (0.59 %) and hence can be neglected, although China has experienced the world's most rapid urbanization since the 1980s (Yang, 2013), due to a considerably smaller area of urban land than the other selected six LU categories. Likewise, the urban land also exerts little effect on the ARF from a global perspective. Therefore, urban areas were not taken into consideration in this study. The LUC data are available for download at https://doi.org/10.1594/PANGAEA.913496. Note that, although the updated GLASS-GLC was extended to 2015, given that some of the parameters and variables in OSCAR v2.4 were only available up to 2010, we performed OSCAR simulations from 1982–2010.
We further compared the GLASS-LUC-derived ARF in the OSCAR model to the modeling result using another satellite-remote-sensing-derived LUC, namely, the MODIS-LUC data (Moderate Resolution Imaging Spectroradiometer, 2014, https://modis.gsfc.nasa.gov/, last access: 6 May 2020). Given that the MODIS-LUC data are only available from 2001–2023, we replaced the GLASS-GLC by MODIS-LUC data from 2002–2010 in the OSCAR model. During this period, the accumulated RF simulated by the OSCAR in the globe using the MODIS-LULC (land use and land cover) and the GLASS-GLC data is 0.0165 and 0.0157 W m−2, respectively, indicating only a 5 % difference between the RFs using the two LUC datasets derived from satellite remote sensing. Sun et al. (2022) compared the applications of six LULC products in the identification of LUCs in Northwestern China. Their results revealed that while GLASS-GLC and MODIS (MCD-12Q1) were not superior to other four products, these two datasets were of most temporal and spatial consistency.
The OSCAR model does not take the surface roughness length into account. The surface roughness primarily affects the turbulent exchange of heat and air mass between the underlying surface and air, which may indirectly alter surface radiation fluxes via changing sensible and latent fluxes under a heat balance status (Andrews, 2012). This characteristic can significantly influence RF largely via its association with surface albedo. Given that the OSCAR introduces the surface albedo directly, it is expected that excluding the roughness length would not perturb RF prediction significantly.
2.3 Sensitivity analysis
To illustrate the influence of LUC-induced albedo change on the global RF, we chose five LU types that have dominated the global LUCs over the past 4 decades: cropland, desert, forest, grassland, and shrub. Considering that, for many satellite-derived land-use classification products, overall classification accuracies range between 70 % and 90 %, implying that misclassifications can lead to an uncertainty of 10 % to 30 % in land-use area estimates (Gong et al., 2013), we carried out extensive sensitivity experiments by reducing each LU transition area by 20 % within five major LU types (cropland, desert, forest, grassland, and shrub). These sensitivity evaluations aimed to examine the relative significance and contribution the LU conversion and transition among different LU types to the ARF. Among them, each LU type is converted to the rest four LU types, thereby accounting for a total of 20 LU transitions and sensitivity experiments. However, in the original OSCAR inventory, there were only inter-conversions between cropland and other land types and no conversions between desert, forest, grassland, and shrub. Table S2 in the Supplement presents these 20 LU transitions from 1982–2010. To facilitate analysis and refine the effect of LUC on the ARF, the world has been divided into nine regions. These regions include East and Southeast Asia (including China), Europe, Latin America, the Near East and North Africa, North America, Oceania, Russia, Sub-Saharan Africa, and South Asia (Fig. 2). Table S3 in the Supplement presents the surface albedos for the five LU types in each nation and the nine regrouped global regions. Between the OSCAR LUH1-LUC inventory and the GLASS-GLC inventory, Fig. S1 and Table S4 in the Supplement compare annual changes in the area of each LU type from 1982–2010 in the globe and the nine regions. There are distinct differences between the two LUC inventories. The causes of these differences and two simulation results are discussed in Sect. S2. By performing OSCAR simulations with a low spatiotemporally resolved OSCAR LUH1-LUC inventory (Scenario 1) and a high spatiotemporally resolved GLASS-GLC inventory (scenario 2), respectively, we also set up two model scenarios for sensitivity experiments. Detailed results of sensitivity analysis are presented in Table S5 in the Supplement.
2.4 Methods of comparing ARF results for two datasets
The percentage changes in the annual ARF between the two scenarios are estimated using the following equation:
where ARFF, ARFS1, and ARFS2 represent the percentage changes in ARF values from model scenarios 1 (S1) and 2 (S2), respectively.
2.5 Disturbance capacity analysis and effective area
We conducted comprehensive sensitivity experiments on OSCAR simulations to analyze the impact of each of the 20 LU conversions on the ARF globally and across of the nine regions. We consider the conversion from each of the five LU types to the remaining four LU types, resulting in 20 LU conversion types (Table S2). In these sensitivity experiments, we introduce a disturbance capacity (DC; %) that determines the magnitude of the ARF change induced by the 20 LU conversions in the region of interest. The DC is defined as follows:
where represents the mean ARF in region i averaged from 1983–2010. We reduce the jth LU conversion in region i by 20 % and define the resultant ARF in region i as in each year. Its mean from 1983–2010 is defined as . Expression (2) can also be considered a statistical formula for determining the relative significance or the contribution of the ARF induced by a particular LU conversion to the total ARF change across all regions and LU conversion types. For example, the sensitivity experiment for grassland to cropland conversion in region i (13th sensitivity experiment or LU conversion) was conducted by multiplying the area converted from grassland to cropland by 0.8, indicating a 20 % reduction in the grassland to the cropland transition area. The changes (or response) of the ARF in region i perturbed by a 20 % reduction in the jth LU conversion area ΔRFij were then used to estimate DCij (Eq. 2).
We also examine net LU conversion among the five LU types, where net LU conversion is defined as the difference between a pair of LU conversions. For instance, the net conversion from grassland to cropland (13th LU conversion, Table S2) and from cropland to grassland (3rd LU conversion, Table S2) is calculated as the area converted from grassland to cropland minus the area converted from cropland to grassland, also referred to as the net two-way conversion. This adjustment reduces the total LU conversions in the sensitivity experiment from 20–10. The DC for the 10 net LU conversion areas is definable as follows:
where is the area of net LU transition; a and b indicate the conversion from LU type a to type b, respectively; and and are the transition areas from LU type a to LU type b and from LU type b to a. The superscript t denotes a specific year between 1982 and 2010. DCa↔b represents the disturbance capacity of net conversion between paired LUs, and DCa→b and DCb→a are the DC of LU conversion a→b and b→a, respectively. After the DC of LU conversion is determined, we estimate an effective area (EA), which is defined here as the cumulative area of six net LU conversions, given by
where DCik represents the DC in the kth net LU conversion type affecting the ARF in region i. The ratio of DCik to the absolute value of total DCik, defined by in Eq. (4), can also be viewed as the proportion of different net LU conversions to the global EA (Table S6 in the Supplement). denotes the EA in year t and region i. indicates the area of the kth net LU conversion type in year t and region i. Consequently, the EA measures the extent of a LU conversion area that significantly impacts the change in the ARF. In calculating the EA, we first exclude net LU conversions with , then sum up these values (), and finally divide the DC of each net LU conversion with by (Eq. 4). Table S6 presents the correlation coefficients and significance tests of the EAs. According to Eq. (4), once the DC is obtained, the EA area can be estimated, which defines the converting areas of the 10 net land conversion types between 1982 and 2010 divided by their respective absolute DCs. The results explain the change in the ARF from 1983–2010 (Sect. S3 in the Supplement).
2.6 Quantifying the contribution of regional LU transition to changes in the global ARF and effective area
The changes in the ARF due to LU conversion in a region from 1983–2010 can be simply defined as the differences in the ARF between 1983 and 2010. First, we considered the ARF change in any region across the globe as
where and denote the ARF in the ith region in the S2 scenario using the GLASS-GLC inventory in 2010 and 1983, respectively. To remove the effect of LU conversion on the ARF, we reduced the transition area of each LU type from 20 % to 100 % in the 20 sensitivity experiments, meaning no occurrence of LU transition. Second, we introduced and to represent the ARF in the ith region induced by the jth LU transition in the S2 scenario in 2010 and 1983, so their differences are as follows:
This can be regarded as the changes in the ARF induced by the other 19 conversion types for the jth LU conversion during this period. The changes in the ARF subject to any LU conversion in any of the nine regions can be written as
In other words, δF indicates the net effect of regional LU transition on the ARF. Finally, the contribution of the ARF from any region and any LU conversion to the changes in the global ARF is defined as
where and are the global ARF in 2010 and 1983 from model scenario 2, S2. Their difference is constant (0.0364 W m−2).
The contribution of regional EAs to the global EA is simply estimated by Eq. (9):
where denotes nine regions, is the number of years from 1983–2010, and αi,k is defined in Eq. (4).
The contribution of two-way LU conversions to the changes in the global ARF is defined by Eq. (10):
where denotes five LU types, denotes nine regions, and indicates paired two-way LU transitions. Taking cropland as an example, the one-way transitions between cropland and the remaining four LU types are the transitions from cropland to forestland, grassland, desert, and shrubland. The other way includes transitions from forestland, grassland, desert, and shrubland to cropland. So the two-way transition includes eight LU conversions.
3.1 Response of global RF to perturbed albedo
To examine the extent of the changes in global RF subject to the altered surface albedo derived from LU transition from 1983–2010, we compared the ARF using the coarse-resolution LU Harmonization v1–LU Change (LUH1-LUC inventory (OSCAR_L, model scenario 1, S1)) extending from 1750–2010 and the fine-resolution Global Land Surface Satellite–Global LC dataset (GLASS-GLC inventory (OSCAR_G, model scenario 2, S2)) in OSCAR simulations. It is noted that the annual ARF derived from model scenario 1 (S1) was relative to the baseline year of 1750. The annual ARF derived from model scenario 2 (S2) was also relative to 1750, but we replaced LUH1-LUC with GLASS-GLC after 1982. Figure 1a depicts the OSCAR-simulated annual global ARF subject to the two model scenarios. From 1983–2010, annual ARFs derived from the two LUC scenarios demonstrated an upward trend. In contrast, the ARF in the S1 simulation (solid blue line) displays a smoother variation and a weaker increase with a linear trend of 0.0003 (p value<0.01). The smooth transition from historical LUC estimates to future projections in the LUH1-LUC results in such gradual changes in the ARF. In contrast, the ARF in the S2 simulation (solid red line) displays strong interannual fluctuations and a more rapid increase with a linear trend of 0.0018 (p value<0.01). The dashed brown line indicates that the resulting ARFF ranges from −26.5 % (2009) to 17.6 % (1990). Globally, both scenarios produce negative forcing, consistent with previous estimates (IPCC AR6, 2021; Li et al., 2016). As mentioned already, even though we only replaced the coarse-resolution LUH1-LUC inventory with the fine-resolution GLASS-GLC inventory, the ARF in the OSCAR model has been predicted since the industrialization era in the 1750s, the same as the IPCC AR6. This suggests that both scenario simulations utilized the same LUH1-LUC data before 1982. Consequently, significant annual and decadal changes in the ARF have occurred over the past few decades, alongside rapid and remarkable global variations in LUC. The significant differences in the ARF between the two scenarios can be attributed to different data sources and approaches applied to derive LUH1-LUC and GLASS-GLC. The former was developed from a combination of historical statistics, population census data, HYDE, and GLM. Because the time covered by this inventory is outside the period of satellite observations, large uncertainties in LUH1-LUC have been recognized (Hurtt et al., 2020). A higher-resolution land-use dataset can ensure interannual consistency and comparability of the LUC and enables the accurate estimation of the rate and mode in LUC (Gong et al., 2013; Liu et al., 2020a), which can capture more detailed LUC and LU transitions. Recent reports indicate that the global LUC is 4 times larger than previously estimated (Winkler et al., 2021). The differences between the two LUC datasets are shown in Sects. S2 and S4, Table S4, and Fig. S1 in the Supplement.
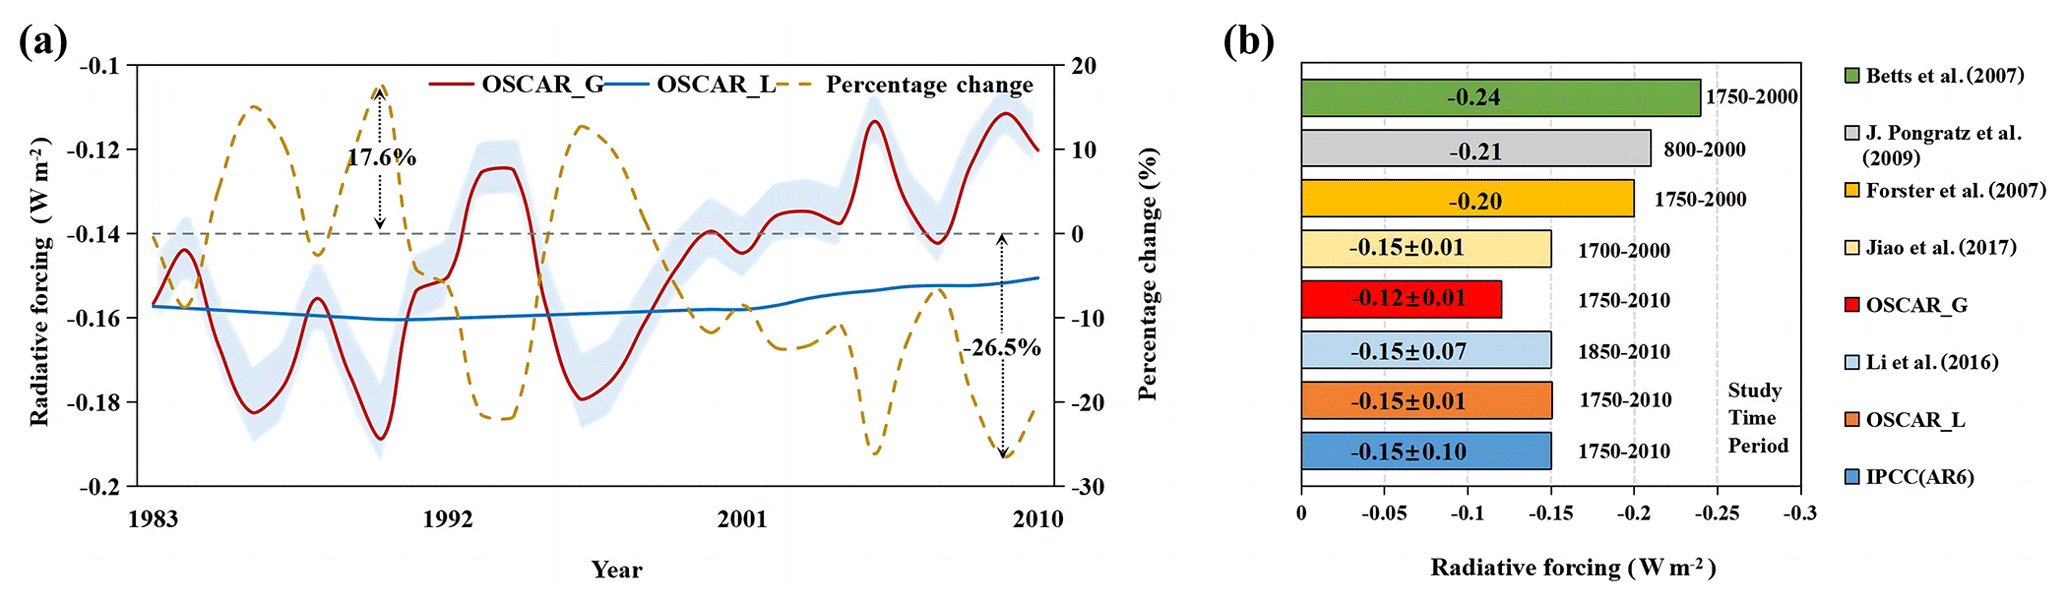
Figure 1Annual RF (W m−2) due to albedo change and ARF percentage change (%) and different ARF values derived from previous studies. (a) OSCAR-modeled annual RF due to the albedo change and ARF percentage change between the two model scenarios, S1 and S2, from 1983–2010 derived from the coarse-resolution LUH1-LUC inventory (solid blue line; see “Materials and methods”) and GLASS-GLC inventory (solid red line; see “Materials and methods”). The annual ARF of 1983 through 2010 from both model scenarios is relative to the baseline year of 1750. The two-tailed T test yields a p value of 0.025 (<0.05), indicating the statically significant difference between OSCAR-G and OSCAR-L data series. Pale-blue shading indicates the uncertainty interval estimated from Monte Carlo simulations. Dashed yellow line stands for a percentage change in the ARF from the two scenarios. (b) The ARF from present (red color bar) and previous (other color bars) studies from different time periods. However, the results of the studies covering the year 2010 all point to the result of 2010.
The previously estimated global ARF with coarse-resolution LUC data has been subject to several concerns. According to the IPCC Assessment Reports, the global RF induced by LUC from pre-industrial times to the present due to changes in land albedo is approximately , indicating that the ARF plays a cooling role (IPCC AR6, 2021). Considering that radiative forcing is often accumulated from the past, the differences of the ARF from the two inventories occurred mostly in final year, namely 2010. Our OSCAR simulation under the S1 scenario using a LUH1-LUC inventory yielded the same negative ARF value of as reported by the IPCC (Fig. 1b). Using coarse-resolution and historical-statistics-based LUC data, additional studies have also obtained ARF results with great uncertainties. As depicted in Fig. 1b, all previous studies yielded stronger negative ARFs than the IPCC's estimate, with the negative ARF reaching as low as (Betts et al., 2007). However, our estimation subject to the S2 scenario yields an ARF of , which is only half of that reported by Betts et al. (2007). The result suggests that the global LUC-induced surface albedo change may not be acting as anticipated to slow down the global warming.
3.2 Contribution of regional LUC to the global ARF
In recent decades, LUC has been subject to significant spatial heterogeneity across the globe. To investigate the magnitude of the response of the global ARF to continental/regional LUC that has occurred since the 1980s, we divided 113 countries and territories in OSCAR into nine regions. Each of the nine regions encompasses a specific number of countries and territories (Table S3). The mean ARF value for each of the nine regions was calculated by averaging the ARFs over the countries and territories in each of the nine regions. The colored sectional map in the center of Fig. 2 indicates the nine regions. In addition, the annual variation in the ARF subjected to GLASS-GLC (W m−2, solid red line, scaled on the left y axis) and its percentage change (%, dashed brown line, scaled on the right y axis) in each of these regions are illustrated in the nine-line charts of Fig. 2. Below the sectional map are two bar charts depicting the absolute and relative contributions of the nine regions to the global ARF. Correspondingly, the total contribution is defined as the proportion of the mean ARF of each nine regions to the global mean ARF from 1983–2010. The relative contribution is defined as the proportion of the change in the ARF in each of the nine regions to the change in the global ARF between 1983 and 2010. In addition, the OSCAR-simulated ARFs in each region derived from LUH1-LUC (solid blue line, scaled to the left on the y axis) are displayed in the line charts. Herein, OSCAR predicts ARFs by incorporating fine-scale variations, as opposed to the LUH1-LUC-derived ARFs with smoothing variations; GLASS-GLC, on the other hand, displays more pronounced annual fluctuations. In East and Southeast Asia and Near East and North Africa, the simulated ARFs derived from the two LUC datasets exhibit opposite trends from 1983–2010, indicating that LUC data substantially influence regional and continental ARFs.
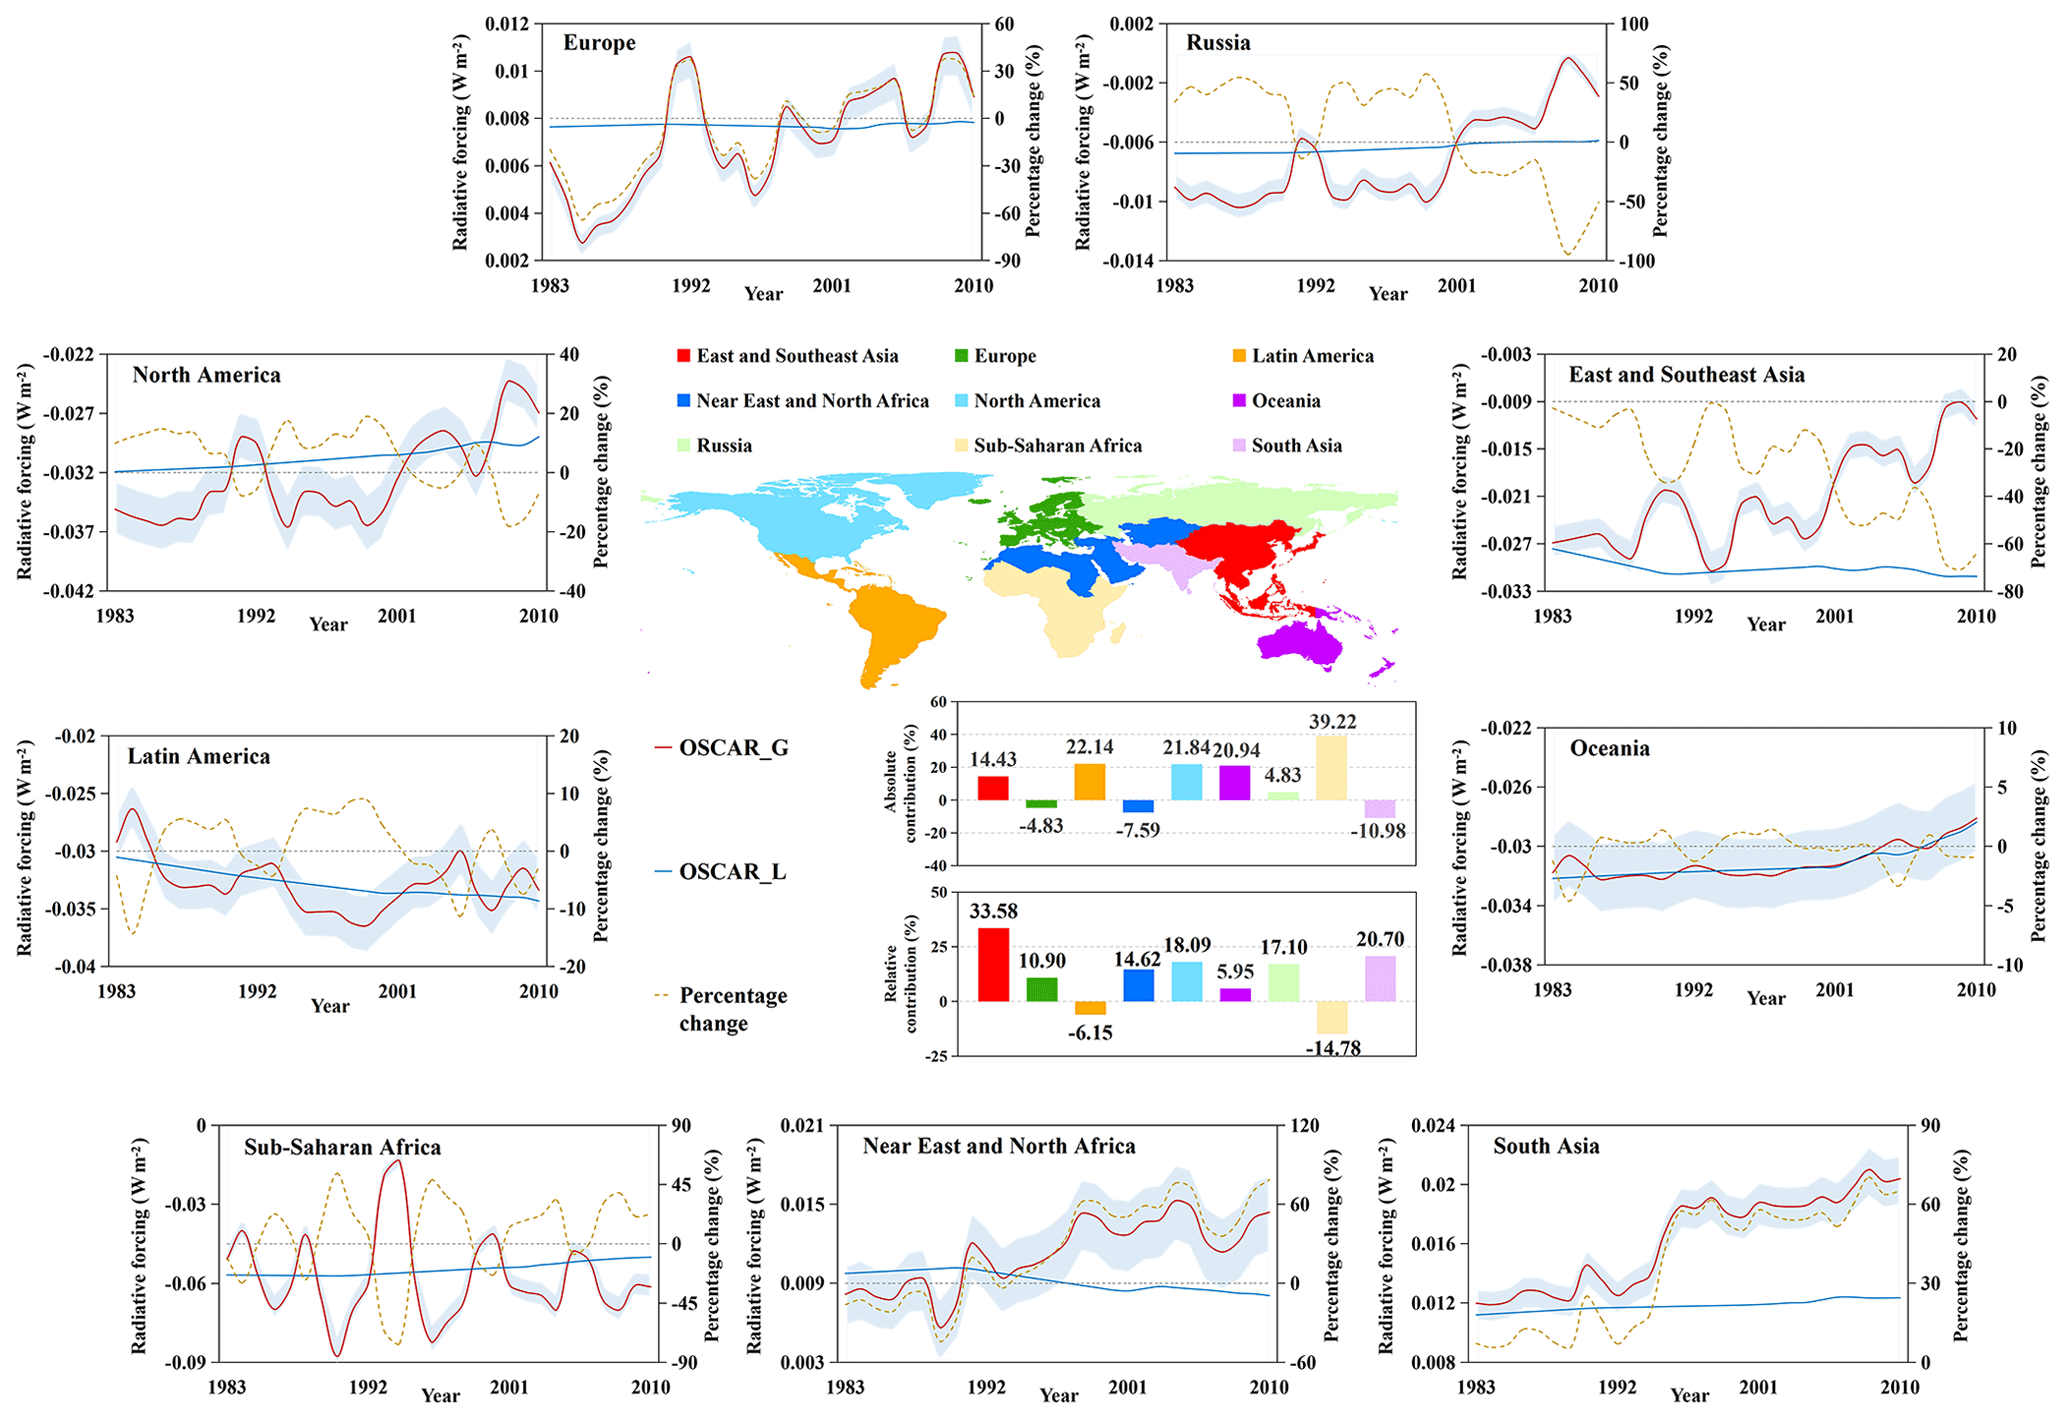
Figure 2Annual RF (W m−2) due to the albedo change and ARF percentage change between the two model scenarios, S1 and S2, from 1983–2010 derived from LUH1-LUC inventory (solid blue line) and GLASS-GLC inventory (solid red line) in nine regions across the globe. The pale-blue shading indicates the uncertainty interval estimated from Monte Carlo simulations. The dashed brown line stands for the percentage change in the annual ARFi-F between the LUH1-LUC inventory (ARFi-S1) and GLASS-GLC inventory (ARFi-S2), in which i represents regions, respectively, including East and Southeast Asia, Europe, Latin America, Near East and North Africa, North America, Oceania, Russia, Sub-Saharan Africa, and South Asia. The first bar chart illustrates the absolute contribution of different regions to the global albedo-induced RF, and the second bar chart displays the relative contribution of different regions to the global albedo-induced RF changes. The nine color bars represent different regions, as indicated by the color legend above the colored sectional map.
As evident from the bar charts below the sectional map, among the nine regions, Sub-Saharan Africa, with a mean ARF of on average from 1983–2010, made the largest net contribution (39.2 %) to the global mean ARF. The significant contribution from Sub-Saharan Africa is attributable to its large desert area of 697.37 Mha with a high albedo (Table S3) and pronounced LU conversions among vegetated LU types (Fig. S2 and Table S4 in the Supplement). South Asia had a mean ARF of 0.02 W m−2 from 1983 to 2010. This region had an absolute negative contribution of −10.98 % to the global mean ARF averaged over the nine regions, most likely because of rapidly expanding croplands (226.93 Mha) with low albedo associated with the Green Revolution (Pingali, 2012; Liu et al., 2021; Huang et al., 2022) (Fig. S2 and Table S4). East and Southeast Asia, Europe, Latin America, Near East and North Africa, North America, Oceania, and Russia contributed 14.43 %, −4.83 %, 22.14 %, −7.59 %, 21.84 %, 20.94 %, and 4.83 % to the global mean ARF, respectively.
Although East and Southeast Asia made a moderate absolute contribution to the global mean ARF compared to other regions, this region experienced the largest LUC between 1982 and 2010. This was characterized by the highest ARF change (0.017 W m−2), comprising the most significant relative contribution (33.58 %) to the global ARF change. Such a contribution can be attributed to the massive LC changes brought on by afforestation and the management of land desertification during this time period (Liu and Xin, 2021; Imai et al., 2018; Zhang et al., 2016), which led to a decrease in surface albedo. In contrast, deforestation in Sub-Saharan Africa in recent decades (Keenan et al., 2015) has promoted rapid shrub growth (Atsri et al., 2018; Mograbi et al., 2015), resulting in a rise in albedo. Consequently, this region has the largest negative contribution to the global ARF change, at −14.78 %, promoting a cooling effect on the global climate. Similarly, the deforestation in Latin America caused by the conversion of forest to cropland and pastureland in recent decades (Armenteras et al., 2021; Hansen et al., 2013; Nogueira et al., 2019; Davidson et al., 2012) has also led to an increase in surface albedo, thus contributing −6.15 % to the global ARF change between 1983 and 2010.
The differences (percentage change, %) in the regional ARF between the two scenarios for the nine regions are depicted by the dashed brown lines (scaled on the right y axis) in the line charts of Fig. 2. Except for Europe, the Near East and North Africa, and South Asia, where the annual ARFs are stronger than those derived from LUH1-LUC, the percentage changes in most regions exhibit the opposite phase of the ARFs predicted by OSCAR using GLASS-GLC. In East and Southeast Asia, for instance, the ARF derived from the S1 model scenario decreased from in 1983 to in 2010, indicating a reinforced cooling effect. In contrast, the ARF derived from the S2 scenario using the GLASS-GLC inventory exhibits the change from in 1983 to in 2010, indicating an attenuated cooling effect. The result suggests again that the LUH1-LUC inventory does not capture the change in LUC in East and Southeast Asia that has occurred since the 1980s. Other details are presented in Table S7 in the Supplement. Similar variations and trends of GLASS-GLC-driven ARFs can be observed in Russia, North America, and Oceania, where the negative ARFs exhibit rising trends from 1983–2010, indicating once again the declining negative ARF values and weakening cooling effect. In South Asia, the average percentage change in the ARF between the two scenarios is the highest, at 37.30 %. Moreover, Europe, the Near East and North Africa, and South Asia yielded positive ARFs. The increasing ARF trends indicate an intensification of the warming effect in these regions during this period. Sub-Saharan Africa experienced the greatest negative ARF values and fluctuations in both model scenarios. We found that the ARF from the S1 scenario extended from in 1983 to in 2010. The ARF from the S2 scenario dropped from in 1983 to in 2010. These results illustrate that the LUH1-LUC data attenuate the cooling effect in Sub-Saharan Africa, whereas the GLASS-GLC inventory enhances the cooling effect, demonstrating once again that the LUC data with significantly different resolutions and sources could alter the conclusions in the evaluation of LUC-induced climate forcing. Further details are provided in Sect. S4 and Table S7.
3.3 Effective area of LU conversion and interannual ARF variations
We designed 20 sensitivity experiments to examine the contribution of LU conversion among the five LU types to the variation in the ARF from 1982–2010 (“Materials and methods”; Table S2). We introduced a disturbance capacity (DC; %) and an effective area (EA; see Eq. 4 in “Materials and methods”) to explain the changes in the ARF caused by the size of LU conversion areas. Here, DC (%) quantifies the extent of LU conversion that may considerably impact the change in the ARF. The EA is the sum of six net LU conversions that quantifies the extent of LU conversion contributing to the change in the ARF. In the sensitivity experiments, we reduced the area of LU transition by 20 % for each LU conversion (Gong et al., 2013). The model combines the ARF results from 20 sensitivity experiments with the LUC for each target region. Further details are provided in “Materials and methods” and Sect. S3. We also analyzed the rate and magnitude of annual ARF fluctuations associated with EAs in the world and nine regions between 1983 and 2010. The details are presented in Sect. S5 and Figs. S3–S12 in the Supplement.
Figure 3 depicts the annual ARF (scaled on the left y axis) and EA (scaled on the right y axis) in the globe and nine selected regions. As seen, the global annual ARF, which is the sum of the ARFs in the nine regions based on OSCAR simulations, is stronger than the regional ARF due to the larger scale of global land cover change (Table S4 and Fig. S1) and stronger albedo changes. The correlation coefficient between the ARF and EA in the globe is 0.765 (p value<0.01), indicating that the net LU conversion area in the globe explains 59 % of the global ARF variation. In this instance, the global EA consists of a cumulative area of six net LU conversion types. The percentage of individual LU conversions to the global EA is presented in Table S6 and Fig. S13 in the Supplement. As shown in Fig. S13a, the interannual fluctuations of the EA (blue solid line) agree well with that of the transition area from grassland–forestland (dashed red line). Together with the grassland–cropland transition, these two LU transitions contribute the most to the global LU transition, accounting for 52.5 % of the total EA worldwide. Such significant LU conversions have been attributed to grassland degradation (Bardgett et al., 2021; Andrade et al., 2015; Aune et al., 2018; Leys et al., 2018), such as the expansion of croplands in the United States, which reduced prairie grasslands (Lark et al., 2020). Since the surface albedo of grassland is greater than that of forestland and cropland (Jackson et al., 2008), grassland degradation could be considered to have been a major contributor to the increase in the global ARF since the mid-1990s (Fig. 3a). This increasing ARF is crucial to the attenuation of the cooling effect of the global negative ARF from −0.15 to . In East and Southeast Asia, the correlation coefficient between the ARF and EA is 0.930 (p value<0.01), indicating that the EA explains 86 % of the ARF change in this region. In particular, the interannual fluctuation of the EA agrees well with the LU transition from cropland to forestland (dashed green line, Fig. S13b), followed by the transition from grassland to forestland (dashed red line). Afforestation plays a key role in the ARF changes in East and Southeast Asia, including grassland to forest, shrub to forest, and cropland to forest. These three LU transitions account for 68.6 % of total EA in this region. Previous reports have indicated that the forest area in Southeast Asia has been decreasing in recent decades (Hansen et al., 2013; Achard et al., 2002; Estoque et al., 2019) and has suffered from a net loss of 1.6 Mha yr−1 (0.6 % yr−1), thus reducing the region's forest cover from 268 Mha in 1990–236 Mha in 2010 (Stibig et al., 2014). However, China has expanded the world's largest afforested area since the late 1980s, and it had the world's largest artificial forest area in 2008, comprising approximately 62 Mha (National Forestry and Grassland Administration of China, 2009; FAO, 2010; Zhang et al., 2015). Consequently, the forest cover in East and Southeast Asia has expanded accordingly. Given the low albedo of forested land (Igusky, 2008) and the forestland expansion over the past 4 decades (Zhang et al., 2016; Peng et al., 2014), we observed a decreasing albedo and a more positive ARF in these regions. In Latin America, the correlation between the ARF and EA is 0.846 (p value<0.01). As shown in Fig. S13d, the annual variation in the EA nearly overlaps with the transition zone between grassland and forestland. This LU transition contributes 77.4 % to the EA in Latin America, thereby playing a significant role in the ARF in this continent. In recent decades, forest areas in Latin America have experienced a dramatic decline (FAO, 2020), partly due to forest wildfires (Aragãoand Shimabukuro, 2010; Escobar, 2019) and the transition from forestland to pastureland under the significantly rising global demand for agricultural products (such as meat and soybeans) in this region. Correspondingly, remarkable deforestation (Armenteras et al., 2019; Bullock et al., 2020) and conversion of forest to grassland have been observed (Andela et al., 2017). Spanning almost 15 years (1990–2005), Latin America has been reported to have lost 7 % of its forests (Da Ponte et al., 2015). This transition resulted in an increase in albedo and a decrease in the ARF in Latin America (Fig. 3d).
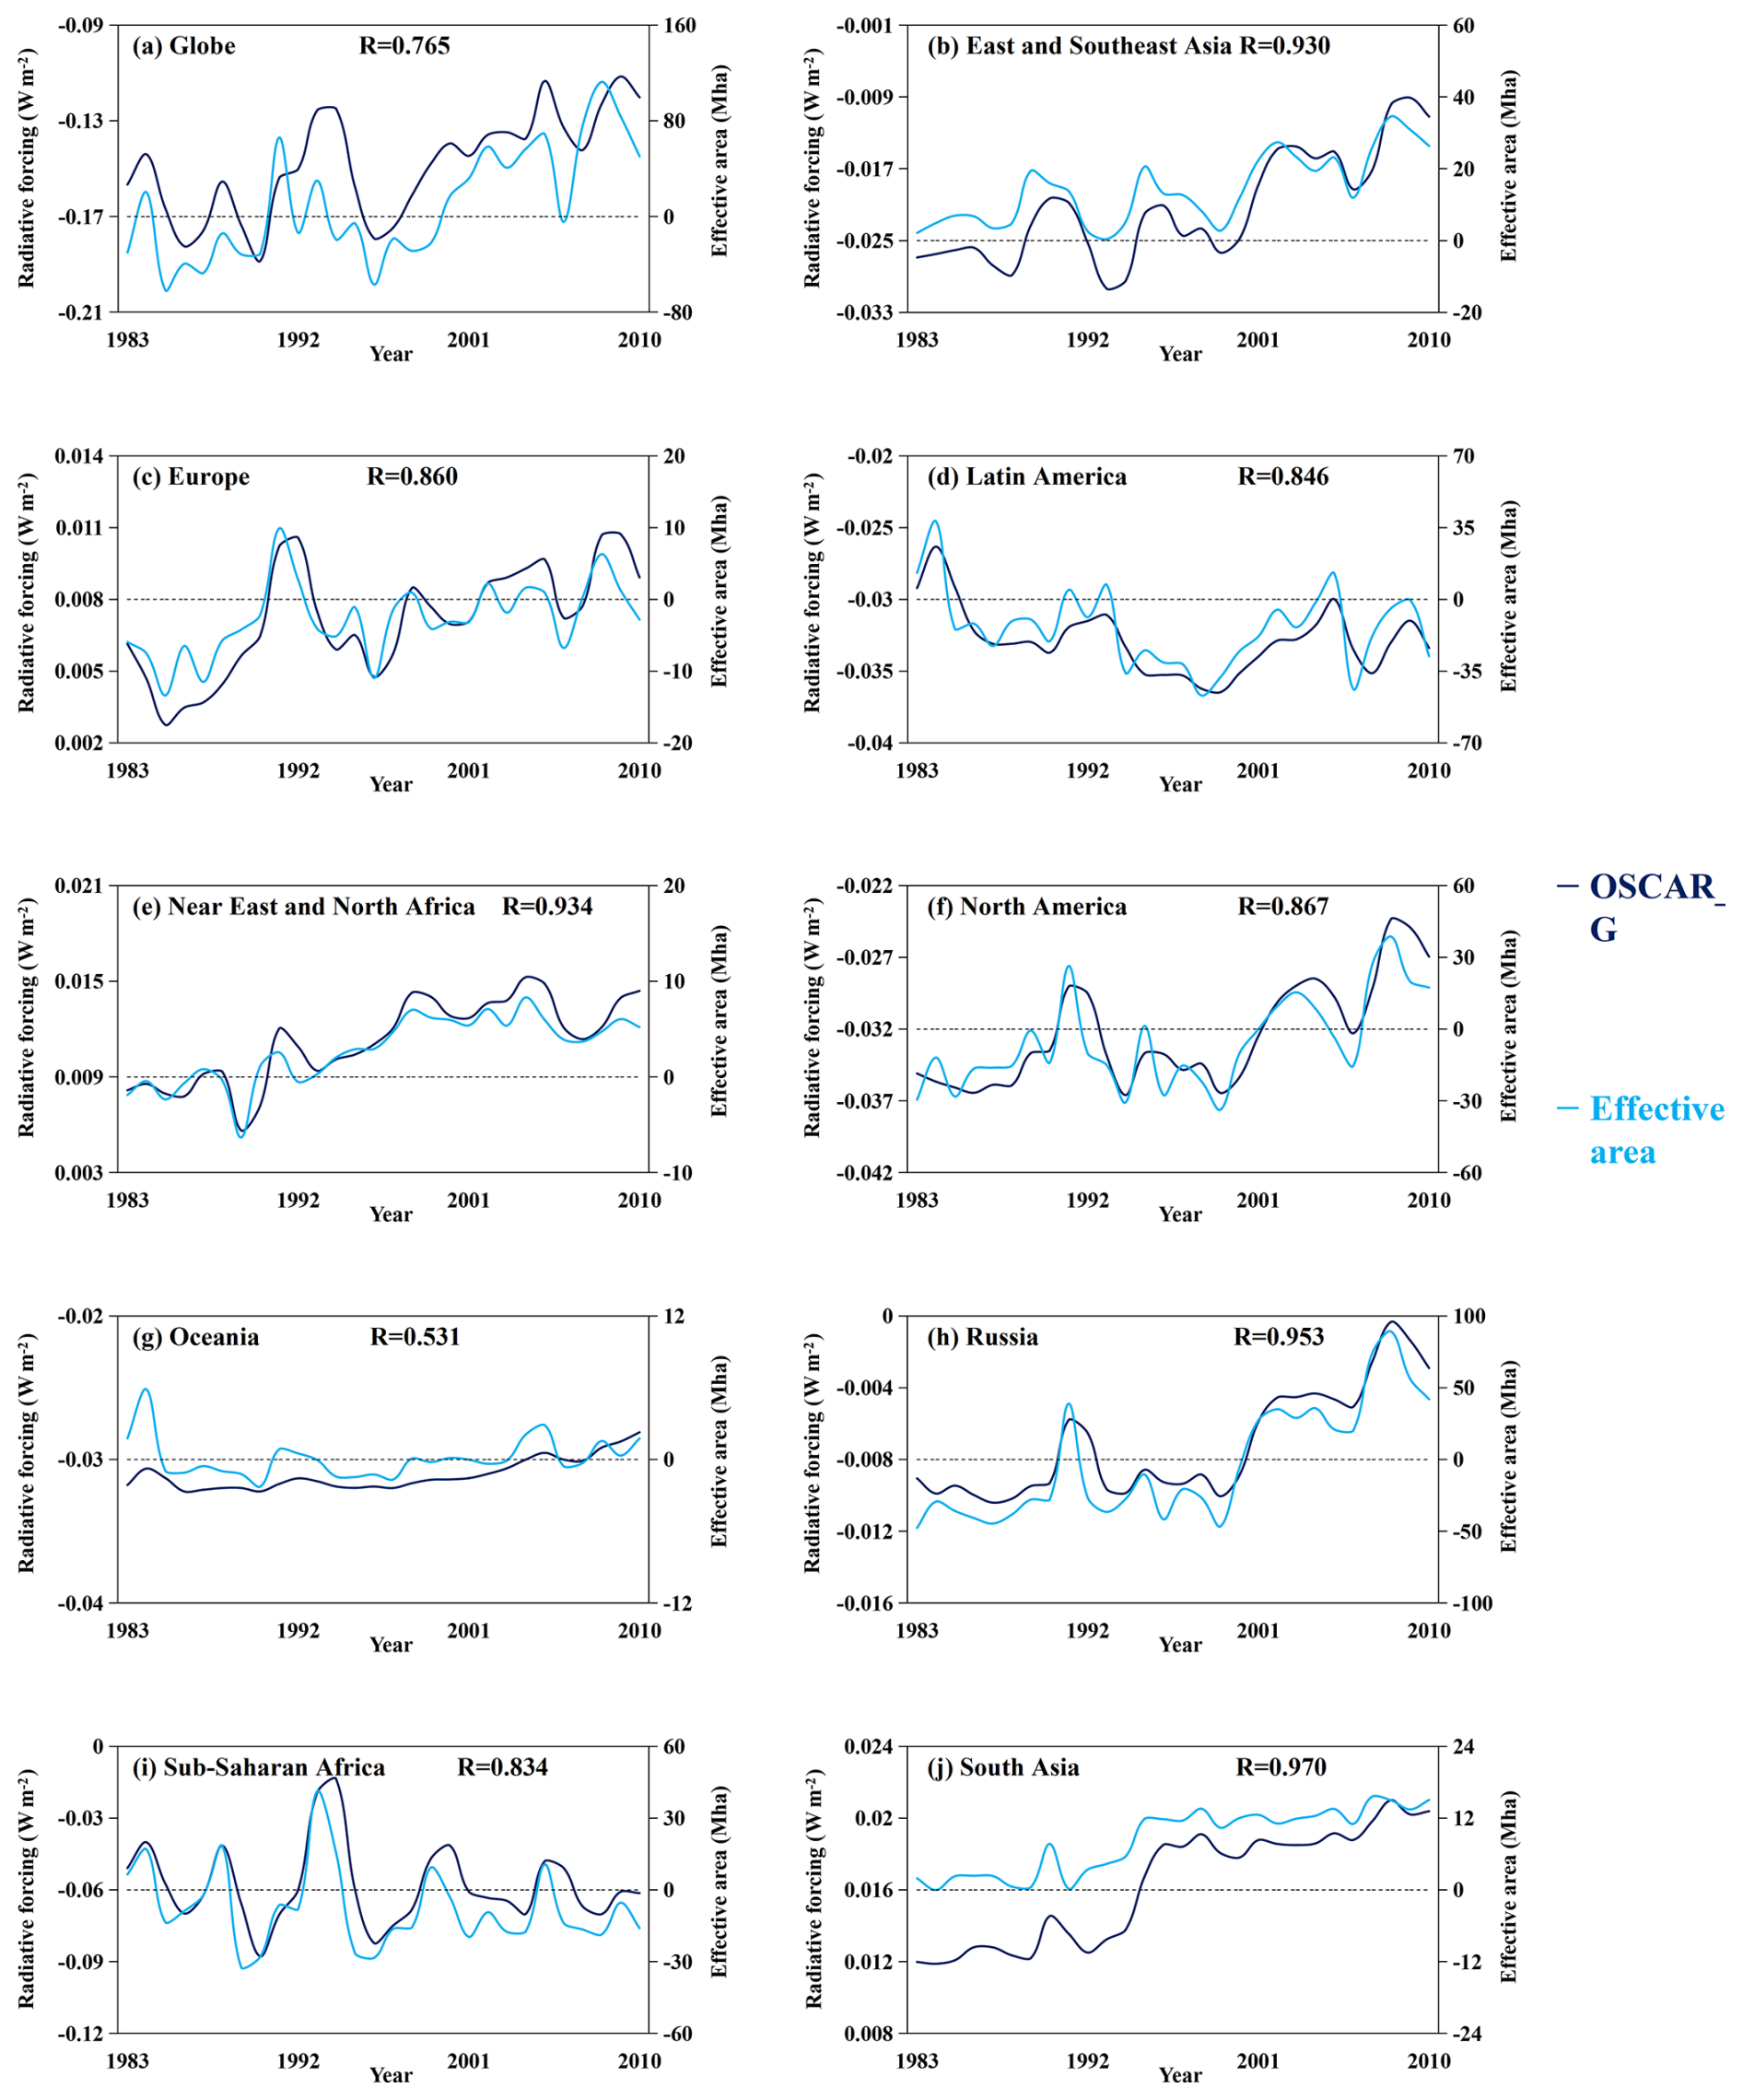
Figure 3Annual RF (W m−2) due to surface albedo change in model scenario 2 (S2) from 1983–2010 derived from GLASS-GLC inventory (solid black line) and effective area (solid blue line) in the globe and nine regions. (a) Globe, (b) East and Southeast Asia, (c) Europe, (d) Latin America, (e) Near East and North Africa, (f) North America, (g) Oceania, (h) Russia, (i) Sub-Saharan Africa, and (j) South Asia. Correlation coefficients between the ARF and effective area are marked in each panel. The effective area measures the extent of the area of all net LU conversion contributing to the change in the ARF (see “Materials and methods”).
The correlation coefficient between the ARF and the EA in Sub-Saharan Africa is 0.834 (p value<0.01). The EA in this region consists of the cumulative area of five net LU conversions (Table S6). The conversion between forestland and shrubs made the largest contribution (48.9 %) to the total EA. Sub-Saharan Africa is home to most of the world's tropical grassy ecosystems (grasslands and savannas), comprising ∼33.5 % of Africa's landmass (Parr et al., 2014). In recent years, the forest area in Sub-Saharan Africa has decreased (Bodart et al., 2013), accompanied by an increase in savanna (including shrubs) (Atsri et al., 2018; Gaillard et al., 2018). As depicted in Figs. 3i and S13i, declining forestland in Sub-Saharan Africa consistently produces a negative ARF, despite annual fluctuations.
In South Asia, the correlation coefficient between the ARF and EA is 0.97 (p value<0.01), with the EA including the cumulative area of six net LU conversions (Table S6). Of these LU conversions, cropland-related LU transitions contributed up to 81.4 % to the total EA. This region of Asia has experienced the most successful Green Revolution since the late 1960s (Liu et al., 2021), and India is one of the largest producers of agricultural commodities (FAOSTAT: Food and agricultural data, 2017; Teluguntla et al., 2015), with more than half of its territory used for cropland. Since the 1980s, the continuous expansion of cropland in South Asia (Hinz et al., 2020) has led to a decrease in albedo, increasing the ARF (Figs. 3j and S13j). Further discussions on EA in Europe, the Near East and North Africa, North America, Oceania, and Russia, as shown in Fig. S13, are presented in Sect. S6 in the Supplement.
3.4 Response of global ARF change to regional LUC area and LU conversion
To quantify the contribution of each LU transition in each region to the changes in the global ARF and EA, we estimated ARF and EA changes without LU conversion from 1983–2010 by reducing LU transition areas from 20 % to 100 % in 20 sensitivity experiments (see “Materials and methods”), indicating no LU transition. Subsequently, we calculated the differences between ARF and EA changes with and without LU conversion to determine the contributions of any LU conversion in any region to the changes in global ARF and EA, as defined by CARF and CEA, as described in Eqs. (5)–(9) of “Materials and methods”. The net conversion of grasslands to forests contributed 70.14 % to the change in the global ARF from 1983–2010. During this period, the global ARF increased by 0.036 W m−2, in line with the general upward trend. Since the albedo of grasslands is greater than that of forests, we would anticipate a decrease in albedo during the transition from grasslands to forests, which tends to increase the ARF. Efforts have been made to increase the global forest cover through afforestation programs. However, most afforestation programs have been implemented at the expense of natural vegetation, particularly grasslands, rather than agricultural land (Leys et al., 2018; Zablon et al., 2018). Globally expansive grasslands were found to be suitable for future forest restoration programs to offset anthropogenic CO2 emissions (Bond, 2016). With the updated LUC inventory with the satellite-measured information on a fine temporal–spatial scale, we could assess the effect of increasing forest coverage on the ARF with greater precision. The donut charts on the right side of Fig. 4a depict the change in the global ARF due to LU conversions in each of the nine regions. The results indicate that grassland–forest conversion in East and Southeast Asia contributes 19.50 % to the change in the global ARF, 8.16 % from Europe, −8.71 % from Latin America, 4.15 % from the Near East and North Africa, 14.22 % from North America, 0.44 % from Oceania, 15.74 % from Russia, 14.29 % from Sub-Saharan Africa, and 2.35 % from South Asia, respectively. The global net conversion of forests to shrubs contributes −50.15 % to the change in the global ARF, with individual contributions from East and Southeast Asia (0.16 %), Europe (−0.01 %), Latin America (3.54 %), Near East and North Africa (1.01 %), North America (0.57 %), Oceania (−0.31 %), Russia (0.03 %), Sub-Saharan Africa (−55.49 %), and South Asia (0.35 %). Thus, the contribution of the net conversion of forests to shrubs to the global ARF change enhanced the cooling effect. The contributions from the remaining four net conversion types are shown in Table S8 in the Supplement.
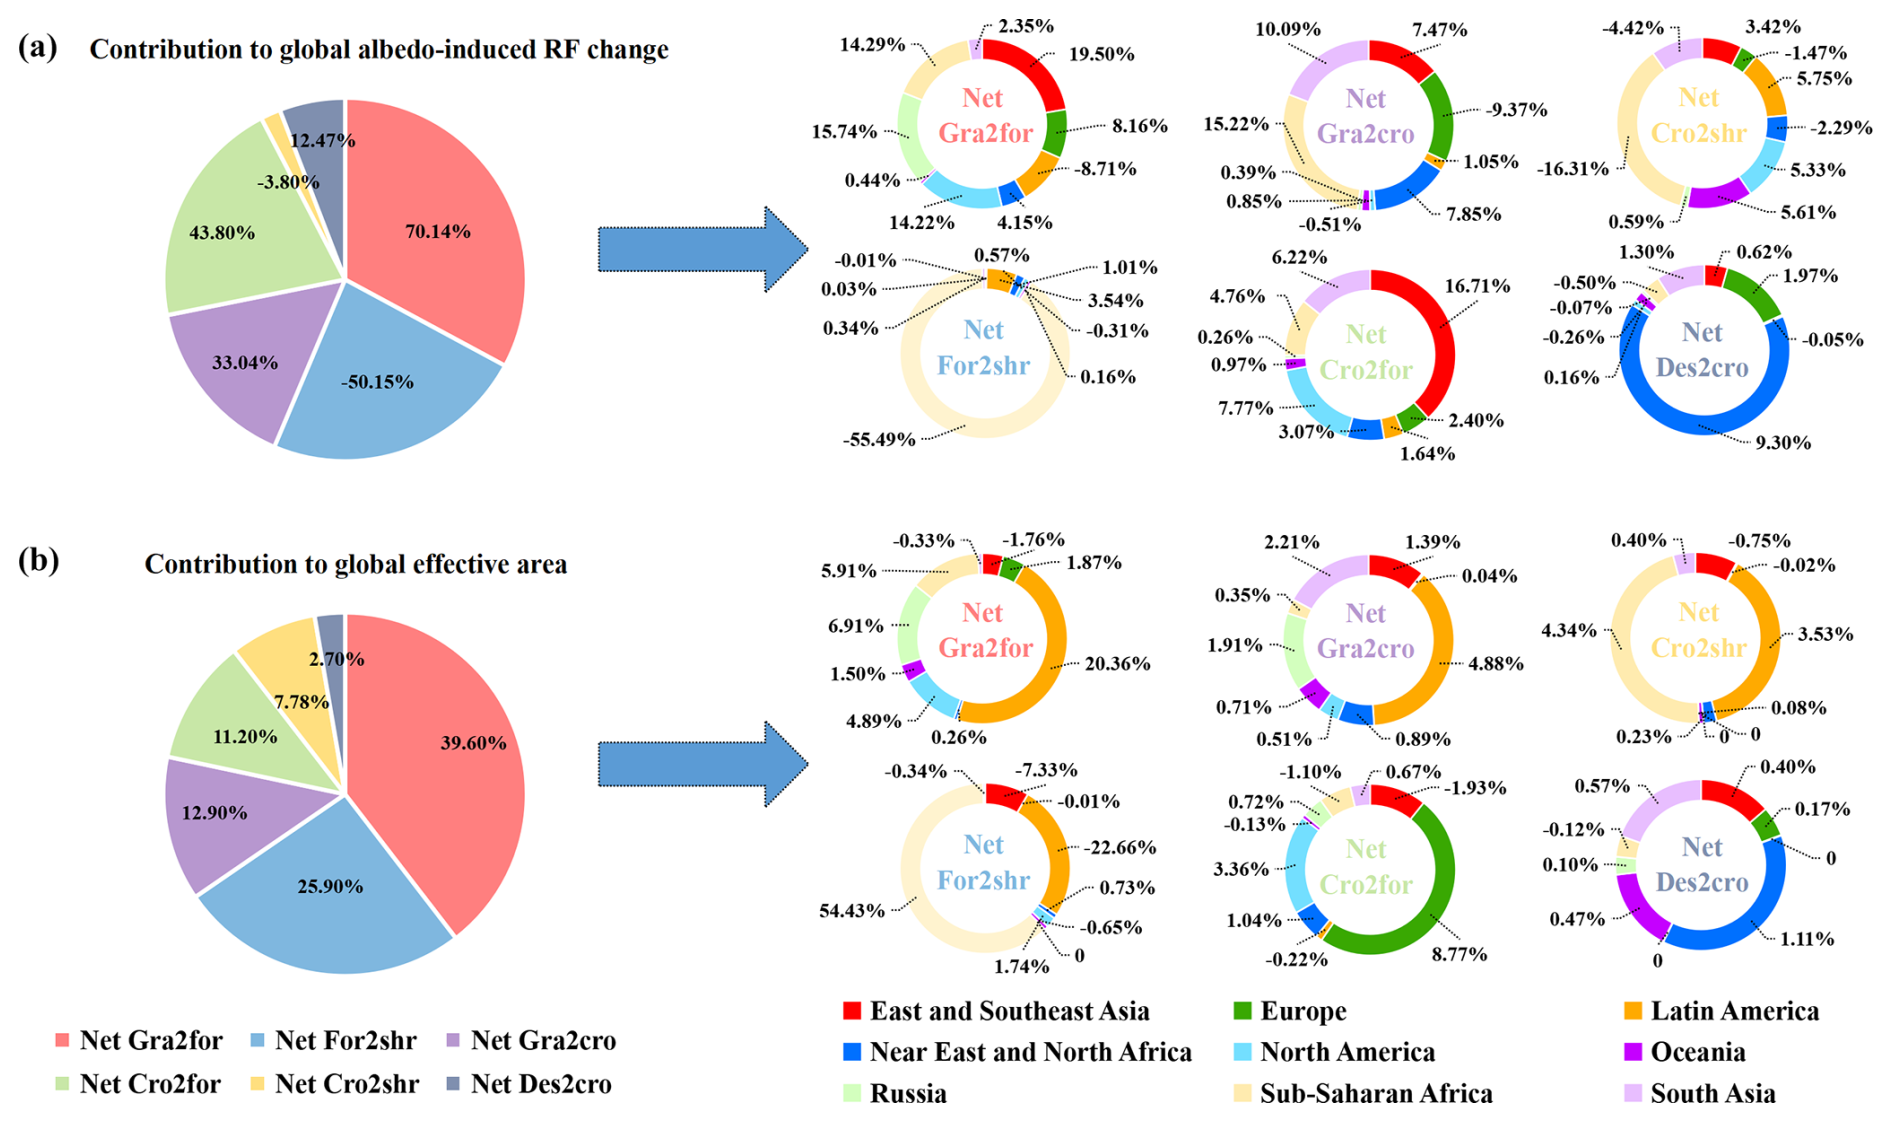
Figure 4Contribution of six net LU conversion types in nine regions () to the change in global ARF and EA globally and nine regions. (a) Pie charts on the left show the contribution of six LU conversion types in nine regions to the change in the global ARF, including grassland to forest (orange), forest to shrubs (light blue), grassland to cropland (light purple), cropland to forest (light green), cropland to shrubs (light yellow), and desert to cropland (light gray). Donut charts on the right show the contribution of each of the six net LU conversion types in each of the nine regions to the change in the global ARF. Among the nine regions, East and Southeast Asia are colored red, Europe deep green, Latin America deep yellow, Near East and North Africa deep blue, North America blue, Oceania purple, Russia green, Sub-Saharan Africa yellow, and South Asia purple gray. The coefficient of variation (CV) is ±5 %. (b) Contribution of six LU conversions () in the nine regions to global EA.
The contributions of net conversion from grassland to forest, forest to shrubs, grassland to cropland, cropland to forest, cropland to shrubs, and desert to cropland to the global EA (Eq. 4) are 39.60 %, 25.90 %, 12.90 %, 11.20 %, 7.78 %, and 2.70 %, respectively, as depicted in the pie charts on the left of Fig. 4b. The contributions of the six net conversion types in each of nine regions to the global EA are displayed in donut charts on the right of Fig. 4, providing additional information regarding the impact of regional LU conversion on the variation in the global ARF. For instance, the contributions of net conversion type of grassland to forest in each of the nine regions to the global EA are as follows: −1.76 % from East and Southeast Asia, 1.87 % from Europe, 20.36 % from Latin America, 0.26 % from Near East and North Africa, 4.89 % from North America, 1.49 % from Oceania, 6.91 % from Russia, 5.91 % from Sub-Saharan Africa, and −0.33 % from South Asia. Additional results for the remaining five types of net conversion in each of the nine regions are presented in Table S9 in the Supplement.
3.5 Contributions of two-way LU conversion to global ARF change
We also set up 20 sensitivity experiments to examine the response of the ARF to two-way LU transition in each region. The two-way LU transition entails LU conversion from a particular LU type to the remaining four LU types and vice versa, which accounts for eight LU conversions for the five LU types in the GLASS-GLC inventory. We compare the changes in the global ARF driven by the LU transition from 1983–2010 to the ARF estimated by reducing LU transition areas from 20 % to 100 %. The 100 % reduction of LU transition area means no LU transition. As an illustration, Fig. 5a-i compares the change in the global ARF caused by the transition between cropland and the other four LUs (cropland to desert, forest, grass, and shrub, solid red line) and without transition (fixed cropland, solid blue line). Marked differences can be observed for both with and without the transition between croplands and other LU types. The trend and annual fluctuation of the ARF are consistent with the results subject to LU transition (solid red line). However, under the fixed cropland (no LU transition) during this period (solid blue line), the negative values of ARF change have decreased since 1990 in comparison to the case with LU transition. As shown in the inset of Fig. 5a-i, the transition from grassland to cropland accounts for 41.0 % of the cropland transition area, while the net transition from desert to cropland accounts for 9.2 %. The remaining two net LU transitions occurred from croplands to forests (−48.9 %) and shrubs (−0.9 %), respectively, implying that LU transitions from croplands to other LUs account for −49.8 % of the cropland transition area. By combining these transition areas, the net cropland transition area was calculated to be 0.4 %, indicating the growth of cropland (Fig. S1). Since the transition from grasslands to croplands decreased surface albedo (Table S3), the LU conversion in this instance decreases the absolute value of the negative ARF, thereby weakening the cooling effect.
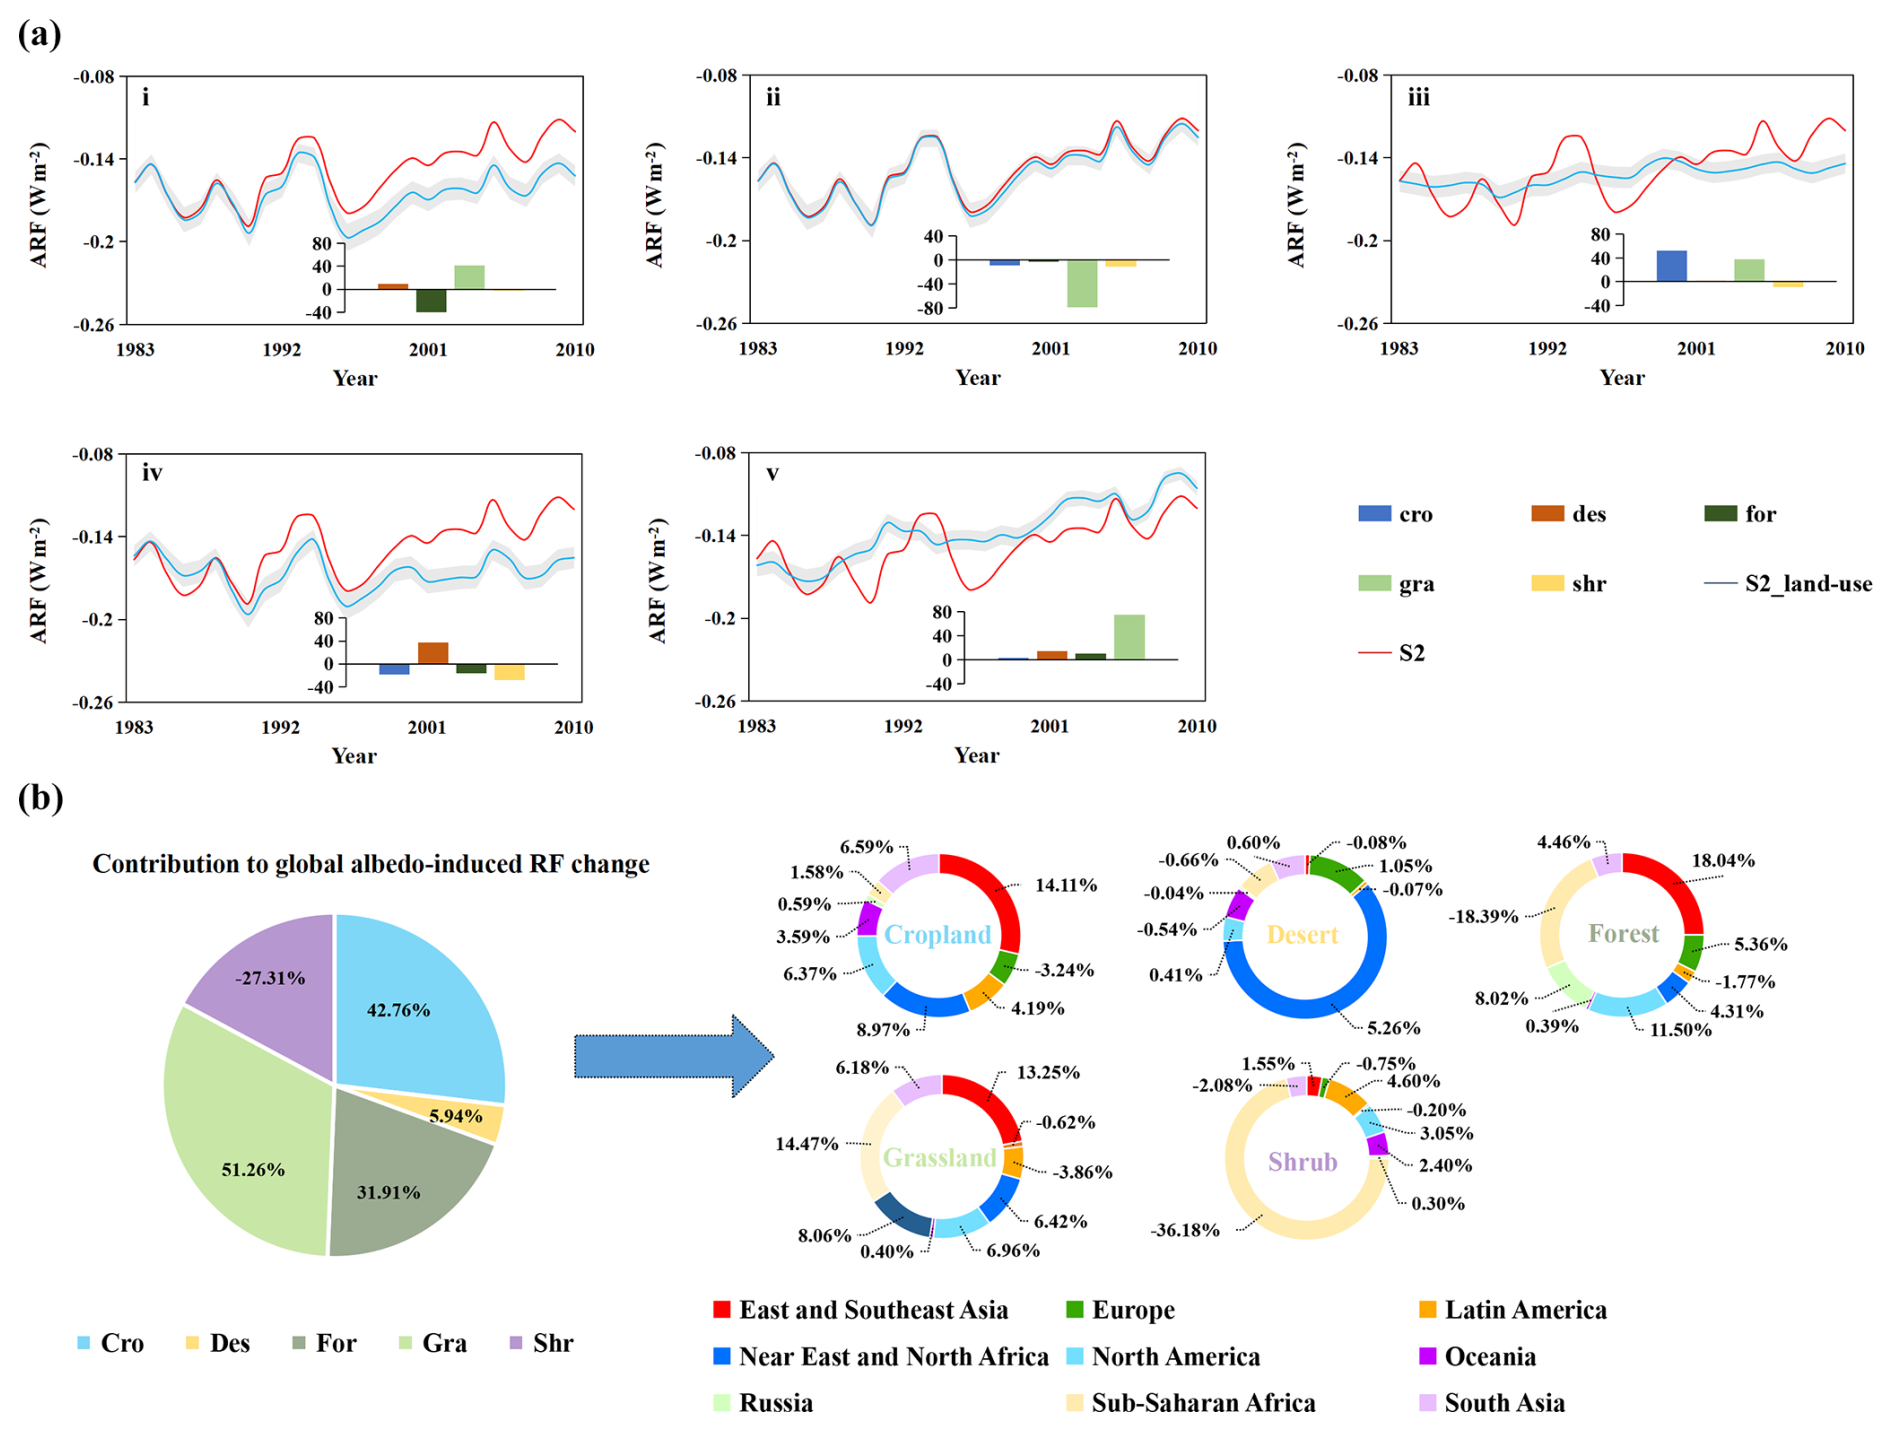
Figure 5Changes in the global ARF derived from model scenario 2 (S2) and contribution of five LU types in the globe and nine regions to the change in the global ARF. (a) Changes in the global ARF subject to LU transition from 1983–2010 (solid red line) and a fixed LU type without transition (solid blue line) for five LU types, including croplands (cro, a-i), deserts (des, a-ii), forests (for, a-iii), grasslands (gra, a-iv), and shrublands (shr, a-v). The inset bar chart represents the relative contribution of the two-way LU net transition between the LU of the interested and other LUs from 1983–2010. Taking the bar chart in (a-i) as an example, the bars with different colors show the result of the two-way transition between cropland and other LU types from 1983–2010. Positive bars represent the conversion from other LU types to cropland, and negative bars indicate the transition from cropland to other LU types. Shadings in (a-i–a-v) indicate the uncertainty interval estimated by Monte Carlo simulations. (b) Contribution of five LU types in each region to changes in the global ARF. The pie chart shows the contribution of five LU types to the change in the ARF in the globe, including cropland (light blue), desert (light yellow), forest (gray-green), grassland (light green), and shrubs (light purple). The five small donut charts show the contribution of each type in each of the nine regions to changes in the global ARF. The coefficient of variation (CV) is ±5 %.
Using the GLASS-GLC inventory (S2 scenario), we further estimated the percentage change (%) in the global ARF with the transition between cropland and the other four LUs (solid red line, Fig. S14a in the Supplement) from 1983–2010. During this period, the percentage changes ranged from −0.6 % to 28.4 %, illustrating a significant upward trend. From 1998–2010, the annual percentage change in the global ARF was almost 15 %, indicating that the cropland transition significantly contributed to the change in the global ARF. We also observed an overall increase in cropland area from 1983–2010, as indicated by the positive accumulated cropland area in Fig. S14a (solid black line, scaled to the right of the y axis), which is consistent with the growth rate of cropland area of 0.037 Mha yr−1 during this period.
Similarly, Fig. 5a-ii–a-v illustrate OSCAR-modeled global ARF variation utilizing the GLASS-GLC inventory with and without LU transition of individual LU types from 1983–2010. As shown in Fig. 5a-ii, the conversion of the desert to other LU types has little effect on the global ARF variation, and the modeled ARF from simulations with and without LU transition is nearly identical. Figure S14b demonstrates that the percentage change in the global ARF was less than 4.2 % between 1983 and 2010, with a mean value of 1.7 %. As illustrated in the inset of Fig. 5a-ii, the net transition from desert to grassland (light green bar) accounts for 79.1 % of the total transition area, the net transition from desert to shrubs (light yellow bar) accounts for 11.5 % of the total transition area, and the net transition from desert to cropland (deep blue bar) accounts for 8.9 % of the total transition area, respectively. The percentage change indicates a net decrease in a desert land, which is supported by the declining accumulated area of desert land (Fig. S14b). The lack of significant difference between the global ARF with and without LU transition is most likely due to the smaller change in the desert area over the past decades. Detailed discussions of the variations in the ARF induced by forest, grassland, and shrub transitions utilizing the GLASS-GLC inventory, as depicted in Fig. 5a from i–v, are presented in Sect. S7 in the Supplement. Overall, Fig. 5a reveals an increasing trend of ARF change, highlighted by the attenuated negative ARF from 1983–2010, which suggests a weakening cooling effect by the global ARF (Fig. 1).
Figure 5b depicts the contribution of regional LU transactions to the change in the global ARF (five pie charts on the right panel of Fig. 5b). Cropland, desert, forest, grassland, and shrubs contributed 42.76 %, 5.94 %, 31.91 %, 51.26 %, and −27.31 %, respectively, to the change in the global ARF, as depicted in the pie chart on the left panel of in Fig. 5b. The donut charts on the right side of Fig. 5b illustrate the contribution of each of the five LU types in the nine regions to the change in the global ARF. Taking cropland as an example, the contributions of cropland-related conversions in each of the nine regions to the change in the global ARF are as follows: 14.11 % (East and Southeast Asia), −3.24 % (Europe), 4.19 % (Latin America), 8.97 % (Near East and North Africa), 6.37 % (North America), 3.59 % (Oceania), 0.59 % (Russia), 1.58 % (Sub-Saharan Africa), and 6.59 % (South Asia). As stated previously and depicted in the left panel of Fig. 5b, the sum of the contributions from these nine regions to the global ARF change is 42.76 %. As a result, cropland-related LU conversion in East and Southeast Asia (primarily China) made the largest contribution to global ARF variation. The results for the remaining four LU types are presented in Table S5.
By incorporating a recently developed satellite-remote-sensing-based high-resolution LUC dataset into the OSCAR model, we demonstrate that previous estimates of the ARF derived from historical-statistics-based LUH1-LUC data with a coarse resolution tend to overestimate the LUC driving albedo-induced cooling effect. Our revised estimate reveals that the global ARF () is lower than the value adopted by the IPCC (). Our results indicate that, among the nine selected regions covering the global land area, Sub-Saharan Africa made the largest net contribution (39.2 %) to the global mean ARF (), owing to the transition of forestland to shrubland, which results in greater surface albedo and, hence, a declining ARF. The latter became very significant from 1982–2010. East and Southeast Asia also contributed significantly, following Sub-Saharan Africa, to the changes in the global ARF at 33.6 % (0.016 W m−2) due to the LU conversion from the grassland to forest conversion and land desertification management, which result in lower surface albedo (Table S3) and an increasing ARF. In line with previous research studies, we demonstrate that RF induced by changes in surface albedo is primarily driven by changes in vegetation (Betts et al., 2000). The transformation from forest to grass, shrub, and crop and from crop to grass resulted in decrease in the ARF of −0.68, −0.48, −0.19, and , respectively, due to the enhancement of surface albedo by the transformation from forest to these vegetation types. Opposite conversions of these vegetation types to forests outweigh positive contributions to the ARF, indicating a rise in surface albedos and cooling effects. In addition to the magnitudes, we find that the two LUC datasets developed based on different data sources, approaches, and resolutions produce different ARFs, indicating that LUC data influenced regional and continental ARFs considerably.
Notably, the present study only predicts the ARF and its change induced by surface albedo subject to LUC and LU conversions but does not address RF driven by CO2 emissions as a result of carbon source–sink conversions associated with LUC and the ARF associated with the changes in snow cover induced by land-use and land cover change (LULCC). However, the major findings of dominant LU transition patterns between forest and grassland, shrub, and cropland imply CO2 source–sink transitions, which are expected to influence LUC-driven RF more strongly. On the one hand, the unexpectedly weaker cooling effect of LUC observed in this study indicates that global LU and LU conversion as carbon sinks since the 1980s do not significantly mitigate climate warming. On the other hand, land management must be improved by increasing the capacity of LUC for carbon sequestration, preserving carbon sinks, and providing renewable resources. Our results show that Sub-Saharan Africa contributed the most to the global ARF induced by the forest–grass and forest–shrub transitions, with predicted ARF values of −0.20 and , respectively. In addition, East and Southeast Asia contribute the most to the ARF due to the conversion of LU from forest to crop and crop to grass. Furthermore, Sub-Saharan Africa has also been confirmed to have the highest proportion of forest–grass and forest–shrub transitions, contributing to a cooling effect.
These findings have substantial ramifications for pertinent policy issues. Accordingly, they suggest that local governments and international communities should take more action in Sub-Saharan Africa to slow down or, preferably, stop deforestation and forest–grassland–cropland conversion, which is a significant contributor to carbon emission enhancement (Spawn et al., 2019; Pendrill et al., 2019; Chang et al., 2021). In our case, even though this LU transition increases surface albedo, thereby increasing LUC- and albedo-induced negative RF and exerting a cooling effect, this effect is negligible compared to the increase in RF caused by CO2 emissions (IPCC AR6, 2021; Li et al., 2016; Jian et al., 2022). Therefore, the cooling effect of afforestation on reducing CO2 emissions outweighs the warming effect of the resultant decrease in surface albedo. The crop–forest transition occurring primarily in East and Southeast Asia, Europe, and the Near East and North Africa has been partially encouraged by national and international cropland and water resource conservation strategies and programs, resulting in ARF values of 0.09, 0.02, and 0.01 W m−2, respectively. The “Grain for Green” program in northwestern China (Wang et al., 2023), for example, impedes the transition from crop to forest in East and Southeast Asia. Although the program helps improve the ecological environment, from the perspective of the ARF, it tends to reduce the surface albedo and increase positive RF, thereby enhancing the warming effect. It is worth noting that the present study did not incorporate non-radiative process and the coupling between land and the atmosphere, which might drive many feedback mechanisms. The significance of land management in maintaining carbon sinks and providing renewable resources was also not dealt with. However, this study provides additional evidence of the importance of land management in influencing the carbon sinks. Optimal land management should implement integrated and enforceable sustainable agriculture, climate-smart forestry, and climate-friendly land resources with co-benefits and cost efficiency.
We have improved a global simulation and nine regional ARF simulations using the OSCAR model, an updated LUC dataset with a high temporal–spatial resolution. We explored the causes of ARF changes in the world and nine regions across the globe by disentangling land change data for 20 transformation types. We also developed the concepts of DC and EA to better explain the changes in ARFs. The major findings are summarized below:
-
The magnitude of the negative ARF obtained from this study is 20 % lower than previous estimations, implying a weaker cooling effect. The results suggest that global LUC-induced changes in surface albedo may not significantly slow global warming as previously expected.
-
Sub-Saharan Africa made the largest net contribution to the global ARF (39.2 %) due to significant land-use conversions, typically from forest to other vegetation land accompanying with higher surface albedo. The most significant land cover changes occurred in East and Southeast Asia, which dominated (33.6 %) the changes in the global ARF in recent decades.
-
The largest change in the global ARF occurs in the net transition from grassland to forest, contributing 70.14 % to the LUC-induced ARF, of which the East and Southeast Asia region accounts for 19.50 % of the change in the global ARF. The net transition from forest to shrub made the largest negative contribution of −50.15 % to the LUC-induced change in the global ARF, of which Sub-Saharan Africa accounted for −55.49 % to the change in the global ARF.
-
Vegetation lands exert the most vital effect on global ARF variation, of which grassland contributed 51.26 %. Among those vegetation lands, the changes in grasslands in Sub-Saharan Africa contributed 14.47 % to global ARF variation subject to the vegetation land transition, followed by East and Southeast Asia at 13.25 %.
OSCAR v2.4 source code is available for download at https://github.com/tgasser/OSCAR (Gasser and Fu, 2019).
GLASS-GLC data can be accessed at https://doi.org/10.1594/PANGAEA.913496 (Liu et al., 2020b). The dataset used to generate all the results of this study is available at https://doi.org/10.5281/zenodo.14586249 (Peking University, 2025).
The supplement related to this article is available online at https://doi.org/10.5194/acp-25-4251-2025-supplement.
All authors contributed to the manuscript and have given approval of the final paper. XZ coordinated and supervised the project. XZ, XJ, and JM designed the present experiment, carried out modeling, and drafted the manuscript. HG, YZ, and RZ collected the data. XL, KC, TH, ST, and JL analyzed simulation results.
The contact author has declared that none of the authors has any competing interests.
Publisher's note: Copernicus Publications remains neutral with regard to jurisdictional claims made in the text, published maps, institutional affiliations, or any other geographical representation in this paper. While Copernicus Publications makes every effort to include appropriate place names, the final responsibility lies with the authors.
We wish to thank the High-Performance Computing Platform of Peking University for supporting extensive model simulations of this study. We acknowledge the use of the OSCAR model and the GLASS-GLC dataset.
This research has been supported by the National Natural Science Foundation of China (grant nos. 41991312 and 41977357) and the National Key Research and Development Program of China (grant no. 2023YFE0112900).
This paper was edited by Yun Qian and reviewed by Aolin Jia and two anonymous referees.
Achard, F., Eva, H. D., Stibig, H. J., Mayaux, P., Gallego, J., Richards, T., and Malingreau, J. P.: Determination of Deforestation Rates of the World's Humid Tropical Forests, Science, 297, 999–1002, https://doi.org/10.1126/science.1070656, 2002.
Andela, N., Morton, D. C., Chen, L. G. Y., Werf, G. R. V. D., Kasibhatla, P. S., Defries, R. S., Collatz, G. J., Hantson, S., Kloster, S., Bachelet, D., Forrest, M., Lasslop, G., Li, F., Mangeon, S., Melton, J. R., Yue, C., and Randerson, J. T.: A human-driven decline in global burned area, Science, 356, 1356–1362, https://doi.org/10.1126/science.aal4108, 2017.
Andrade, B. O., Koch, C., Boldrini, I. I., Martin, E. V., Hasenack, H., Hermann, J. M., Kollmann, J., Pillar, V. D., and Overbeck, G. E.: Grassland degradation and restoration: a conceptual framework of stages and thresholds illustrated by southern Brazilian grasslands, Nat. Conservacao, 13, 95–104, https://doi.org/10.1016/J.NCON.2015.08.002, 2015.
Andrews, D.: An Introduction to Atmospheric Physics (2nd edn.), Cambridge University Press, ISBN 9780511800788, https://doi.org/10.1017/CBO9780511800788, 2012.
Andrews, T. and Forster, P. M.: Energy budget constraints on historical radiative forcing, Nat. Clim. Change, 10, 313–316, https://doi.org/10.1038/s41558-020-0696-1, 2020.
Andrews, T., Betts, R. A., Booth, B. B. B., Jones, C. D., and Jones, G. S.: Effective radiative forcing from historical land use change, Clim. Dynam., 48, 3489–3505, https://doi.org/10.1007/s00382-016-3280-7, 2017.
Aragão, L. E. O. C. and Shimabukuro, Y. E.: The Incidence of Fire in Amazonian Forests with Implications for REDD, Science, 328, 1275–1278, https://doi.org/10.1126/science.1186925, 2010.
Armenteras, D., Schneider, L., and Dávalos, L. M.: Fires in protected areas reveal unforeseen costs of Colombian peace, Nat. Ecol. Evol., 3, 20–23, https://doi.org/10.1038/s41559-018-0727-8, 2019.
Armenteras, D., Dávalos, L. M., Barreto, J. S., Miranda, A., Hernández-moreno, A., Zamorano-Elgueta, C., González-Delgado, T. M., Meza-Elizalde, M. C., and Retana, J.: Fire-induced loss of the world's most biodiverse forests in Latin America, Sci. Adv., 7, eabd3357, https://doi.org/10.1126/sciadv.abd3357, 2021.
Atsri, H. K., Konko, Y., Cuni-Sanchez, A., Abotsi, K. E., and Kokou, K.: Changes in the West African forest-savanna mosaic, insights from central Togo, PLoS One, 13, e0203999, https://doi.org/10.1371/journal.pone.0203999, 2018.
Aune, S., Bryn, A., and Hovstad, K. A.: Loss of semi-natural grassland in a boreal landscape: impacts of agricultural intensification and abandonment, J. Land Use Sci., 13, 375–390, https://doi.org/10.1080/1747423X.2018.1539779, 2018.
Bardgett, R. D., Bullock, J. M., Lavorel, S., Manning, P., Schaffner, U., Ostle, N., Chomel, M., Durigan, G., Fry, E. L., Johnson, D., Lavallee, J. M., Provost, G. L., Luo, S., Png, K., Sankaran, M., Hou, X. Y., Zhou, H. K., Ma, L., Ren, W. B., Li, X. L., Ding, Y., Li, Y. H., and Shi, H. X.: Combatting global grassland degradation, Nat. Rev. Earth Environ., 2, 720–735, https://doi.org/10.1038/s43017-021-00207-2, 2021.
Betts, R. A.: Offset of the potential carbon sink from boreal forestation by decreases in surface albedo, Nature, 408, 187–190, https://doi.org/10.1038/35041545, 2000.
Betts, R. A., Falloon, P. D., Goldewijk, K. K., and Ramankutty, N.: Biogeophysical effects of land use on climate: Model simulations of radiative forcing and large-scale temperature change, Agr. Forest Meteorol., 142, 216–233, https://doi.org/10.1016/j.agrformet.2006.08.021, 2007.
Bodart, C., Brink, A. B., Donnay, F., Lupi, A., Mayaux, P., and Achard, F.: Continental estimates of forest cover and forest cover changes in the dry ecosystems of Africa between 1990 and 2000, J. Biogeogr., 40, 1036–1047, https://doi.org/10.1111/jbi.12084, 2013.
Bonan, G. B.: Forests and Climate Change: Forcings, Feedbacks, and the Climate Benefits of Forests, Science, 320, 1444–1449, https://doi.org/10.1126/science.1155121, 2008.
Bond, W. J.: Ancient grasslands at risk, Science, 351, 120–122, https://doi.org/10.1126/science.aad5132, 2016.
Bullock, E. L., Woodcock, C. E., Souza Jr, C., and Olofsson, P.: Satellite-based estimates reveal widespread forest degradation in the Amazon, Glob. Change Biol., 26, 2956–2969, https://doi.org/10.1111/gcb.15029, 2020.
Cai, M. and Kalnay, E.: Impact of land-use change on climate, Nature, 427, 214, https://doi.org/10.1038/427214a, 2004.
Chang, J., Cias, P., Gasser, T., Smith, P., Herrero, M., Havlik, P., Obersteiner, M., Guenet, B., Goll, D. S., Li, W., Naipal, V., Peng, S. S., Qiu, C. J., Tian, H. Q., Viovy, N., Yue, C., and Zhu, D.: Climate warming from managed grasslands cancels the cooling effect of carbon sinks in sparsely grazed and natural grasslands, Nat. Commun., 12, 118, https://doi.org/10.1038/s41467-020-20406-7, 2021.
Da Ponte, E., Fleckenstein, M., Leinenkugel, P., Parker, A., Oppelt, N., and Kuenzer, C.: Tropical forest cover dynamics for Latin America using Earth observation data: a review covering the continental, regional, and local scale, Int. J. Remote Sens., 36, 3196–3342, https://doi.org/10.1080/01431161.2015.1058539, 2015.
Davidson, E. A., de Araujo, A. C., Artaxo, P., Balch, J. K., Brown, I. F., C.,Bustamante, M. M., Coe, M. T., DeFries, R. S., Keller, M., Longo, M., Munger, J. W., Schroeder, W., Soares-Filho, B. S., Souza, C. M., and Wofsy, S. C.: The Amazon basin in transition, Nature, 481, 321–328, https://doi.org/10.1038/nature10717, 2012.
Escobar, H.: Bolsonaro's first moves have Brazilian scientists worried, Science, 363, 330, https://doi.org/10.1126/science.363.6425.330, 2019.
Estoque, R. C., Ooba, M., Avitabile, V., Hijioka, Y., DasGupta, R., Togawa, T., and Murayama, Y.: The future of Southeast Asia's forests, Nat. Commun., 10, 1829, https://doi.org/10.1038/s41467-019-09646-4, 2019.
FAO: Global Forest Resources Assessment 2010, https://www.fao.org/forest-resources-assessment/past-assessments/fra-2010/en/ (last access: 11 April 2025), 2010.
FAO: Global Forest Resources Assessment 2020, https://www.fao.org/interactive/forest-resources-assessment/2020/en/ (last access: 11 April 2025), 2020.
FAO, Food and Agricultural data: FAOSTAT, https://www.fao.org/faostat/en/ (last access: 28 March 2025), 2017.
Feddema, J. J., Oleson, K. W., Bonan, G. B., Mearns, L. O., Buja, L. E., Meehl, G. A., and Washington, W. M.: The Importance of Land-Cover Change in Simulating Future Climates, Science, 310, 1674–1678, https://doi.org/10.1126/science.1118160, 2005.
Foley, J. A., Defries, R., Asner, G. P., Barford, C., Bonan, G., Carpenter, S. R., Chapin, F. S., Coe, M. T., Daily, G. C., Gibbs, H. K., Helkowski, J. H., Holloway, T., Howard, E. A., Kucharik, C. J., Monfreda, C., Patz, J. A., Prentice, I. C., Ramankutty, N., and Snyder, P. K.: Global Consequences of Land Use, Science, 309, 570–574, https://doi.org/10.1126/science.1111772, 2005.
Forster, P., Ramaswamy, V., Artaxo, P., Berntsen, T., Betts, R., Fahey, D. W., Haywood, J., Lean, J., Lowe, D. C., Myhre, G., Nganga, J., Prinn, R., Raga, G., Schulz, M., and Dorland, R. V.: Changes in Atmospheric Constituents and in Radiative Forcing, in: Climate Change 2007: The Physical Science Basis. Contribution of Working Group I to the Fourth Assessment Report of the Intergovernmental Panel on Climate Change, edited by: Solomon, S., Qin, D., Manning, M., Chen, Z., Marquis, M., Averyt, K. B., Tignor, M., and Miller, H. L., Cambridge University Press, Cambridge and New York, https://www.ipcc.ch/report/ar4/wg1/changesin-atmospheric-constituents-and-radiative-forcing/ (last access: 21 March 2025), 2007.
Gaillard, C., Langan, L., Pfeiffer, M., Kumar, D., Martens, C., Higgins, S. I., and Scheiter, S.: African shrub distribution emerges via a trade-off between height and sapwood conductivity, J. Biogeogr., 45, 2815–2826, https://doi.org/10.1111/jbi.13447, 2018.
Gasser, T. and Fu, B.: Compact earth system model, Github [code], https://github.com/tgasser/OSCAR (last access: 22 January 2024), 2019.
Gasser, T., Ciais, P., Boucher, O., Quilcaille, Y., Tortora, M., Bopp, L., and Hauglustaine, D.: The compact Earth system model OSCAR v2.2: description and first results, Geosci. Model Dev., 10, 271–319, https://doi.org/10.5194/gmd-10-271-2017, 2017.
Gong, P., Wang, J., Yu, L., Zhao, Y. C., Zhao, Y. Y., Liang, L., Niu, Z., Huang, X. M., Fu, H. H., Liu, S., Li, C. C., Li, X. Y., Fu, W., Liu, C. X., Xu, Y., Wang, X. Y., Cheng, Q., Hu, L. Y., Yao, W. B., Zhang, H., Zhu, P., Zhao, Z. Y., Zhang, H. Y., Zheng, Y. M., Ji, L. Y., Zhang, Y. W., Chen, H., Yan, A., Guo, J. H., Yu, L., Wang, L., Liu, X. J., Shi, T. T., Zhu, M. H., Chen, Y. L., Yang, G. W., Tang, P., Xu, B., Giri, C., Clinton, N., Zhu, Z. L., Chen, J., and Chen, J.: Finer resolution observation and monitoring of global land cover: first mapping results with Landsat TM and ETM+ data, Int. J. Remote Sens., 34, 2607–2654, https://doi.org/10.1080/01431161.2012.748992, 2013.
Gries, T., Redlin, M., and Ugarte, J. E.: Human-induced climate change: the impact of land-use change, Theor. Appl. Climatol., 135, 1031–1044, https://doi.org/10.1007/s00704-018-2422-8, 2019.
Hansen, J. and Nazarenko, L.: Soot climate forcing via snow and ice albedos, P. Natl. Acad. Sci. USA, 101, 423–428, https://doi.org/10.1073/pnas.2237157100, 2003.
Hansen, M. C., Potapov, P. V., Moore, R., Hancher, M., Turubanova, S. A., Tyukavina, A., Thau, D., Stehman, S. V., Goetz, S. J., Loveland, T. R., Kommareddy, A., Egorov, A., Chini, L., Justice, C. O., and Townshend, J. R. G.: High-Resolution Global Maps of 21st-Century Forest Cover Change, Science, 342, 850–853, https://doi.org/10.1126/science.1244693, 2013.
Hinz, R., Sulser, T. B., Huefner, R., Croz, D. M. D., Dunston, S., Nautiyal, S., Ringler, C., Schuengel, J., Tikhile, P., Wimmer, F., and Schaldach, R.: Agricultural Development and Land Use Change in India: A Scenario Analysis of Trade-Offs Between UN Sustainable Development Goals (SDGs), Earths Future, 8, e2019EF001287, https://doi.org/10.1029/2019EF001287, 2020.
Houghton, R. A., House, J. I., Pongratz, J., van der Werf, G. R., DeFries, R. S., Hansen, M. C., Le Quéré, C., and Ramankutty, N.: Carbon emissions from land use and land-cover change, Biogeosciences, 9, 5125–5142, https://doi.org/10.5194/bg-9-5125-2012, 2012.
Huang, T., Ma, J. M., Song, S. J., Ling, Z. L., Macdonald, R. W., Gao, H., Tao, S., Shen, H. Z., Zhao, Y., Liu, X. R., Tian, C. G., Li, Y. F., Jia, H. L., Lian, L. L., and Mao, X. X.: Health and environmental consequences of crop residue burning correlated with increasing crop yields midst India's Green Revolution, Npj. Clim. Atmos. Sci., 5, 81, https://doi.org/10.1038/s41612-022-00306-x, 2022.
Hurtt, G. C., Chini, L. P., Frolking, S., Betts, R. A., Feddema, J., Fischer, G., Fisk, J. P., Hibbard, K., Houghton, R. A., Janetos, A., Jones, C. D., Kindermann, G., Kinoshita, T., Goldwijk, K. K., Riahi, K., Shevliakova, E., Smith, S., Stehfest, E., Thomson, A., Thornton, P., Vuuren, D. P. V., and Wang, Y. P.: Harmonization of land-use scenarios for the period 1500–2100: 600 years of global gridded annual land-use transitions, wood harvest, and resulting secondary lands, Clim. Chang., 109, 117–161, https://doi.org/10.1007/s10584-011-0153-2, 2011.
Hurtt, G. C., Chini, L., Sahajpal, R., Frolking, S., Bodirsky, B. L., Calvin, K., Doelman, J. C., Fisk, J., Fujimori, S., Klein Goldewijk, K., Hasegawa, T., Havlik, P., Heinimann, A., Humpenöder, F., Jungclaus, J., Kaplan, J. O., Kennedy, J., Krisztin, T., Lawrence, D., Lawrence, P., Ma, L., Mertz, O., Pongratz, J., Popp, A., Poulter, B., Riahi, K., Shevliakova, E., Stehfest, E., Thornton, P., Tubiello, F. N., van Vuuren, D. P., and Zhang, X.: Harmonization of global land use change and management for the period 850–2100 (LUH2) for CMIP6, Geosci. Model Dev., 13, 5425–5464, https://doi.org/10.5194/gmd-13-5425-2020, 2020.
Igusky, K.: Quantifying Albedo and Surface Temperature over Different Land Covers: Implications for Carbon Offsets, Duke University Press, https://hdl.handle.net/10161/497 (last access: 11 April 2025), 2008.
Imai, N., Furukawa, T., Tsujino, R., Kitamura, S., and Yumoto, T.: Factors affecting forest area change in Southeast Asia during 1980–2010, PLoS One, 13, e0197391, https://doi.org/10.1371/journal.pone.0197391, 2018.
Intergovernmental Panel on Climate Change (IPCC), Climate Change 2001: The Scientific Basis is the most comprehensive and up-to-date scientific assessment of past, present and future climate change, Cambridge University Press, Cambridge and New York, https://www.ipcc.ch/report/ar3/wg1/ (last access: 21 March 2025), 2001.
Intergovernmental Panel on Climate Change (IPCC), Climate change 2021: The physical science basis, the working Group I contribution to the sixth assessment report of the intergovernmental panel on climate change, Cambridge University Press, Cambridge and New York, https://www.ipcc.ch/report/ar6/wg1/ (last access: 21 March 2025), 2021.
Jackson, R. B., Randerson, J. T., Canadell, J. G., Amderson, R. G., Avissar, R., Baldocchi, D. D., Bonan, G. B., Caldeira, K., Diffenbaugh, N. S., Field, C. B., Hungate, B. A., Jobbágy, E. G., Kueppers, L. M., Nosetto, M. D., and Pataki, D. E.: Protecting climate with forests, Environ. Res. Lett., 3, 044006, https://doi.org/10.1088/1748-9326/3/4/044006, 2008.
Jian, X. H., Zhang, X. D., Liu, Y. J., Liu, X. R., Chen, K. J., Wang, L. F., Li, J. X., Zhao, Y., Luo, J. M., Zhugu, R. Y., and Ma, J. M.: The Response of Radiative Forcing to High Spatiotemporally Resolved Land-Use Change and Transition From 1982 to 2010 in China, Geophys. Res. Lett., 49, e2022GL099003, https://doi.org/10.1029/2022GL099003, 2022.
Jiao, T., Williams, C. A., Ghimire, B., Masek, J., Gao, F., and Schaaf, C.: Global climate forcing from albedo change caused by large-scale deforestation and reforestation: quantification and attribution of geographic variation, Clim. Chang., 142, 463–476, https://doi.org/10.1007/s10584-017-1962-8, 2017.
Keenan, R. J., Reams, G. A., Achard, F., Freitas, J. V. D., Grainger, A., and Lindquist, E.: Dynamics of global forest area: Results from the FAO Global Forest Resources Assessment 2015, Forest Ecol. Manag., 353, 9–20, https://doi.org/10.1016/j.foreco.2015.06.014, 2015.
Lark, T. J., Spawn, S. A., Bougie, M., and Gibbs, H. K.: Cropland expansion in the United States produces marginal yields at high costs to wildlife, Nat. Commun., 11, 4295, https://doi.org/10.1038/s41467-020-18045-z, 2020.
Leys, B. A., Marlon, J. R., Umbanhowar, C., and Vannière, B.: Global fire history of grassland biomes, Ecol. Evol., 8, 8831–8852, https://doi.org/10.1002/ece3.4394, 2018.
Li, B. G., Gasser, T., Ciais, P., Piao, S. L., Tao, S., Balkanski, Y., Hauglustaine, D., Boisier, J. P., Chen, Z., Huang, M. T., Li, L. Z. X., Li, Y., Liu, H. Y., Liu, H. F., Peng, S. S., Shen, Z. H., Sun, Z. Z., Wang, R., Wang, T., Yin, G. D., Yin, Y., Zeng, H., Zeng, Z. Z., and Zhou, F.: The contribution of China's emissions to global climate forcing, Nature, 531, 357–361, https://doi.org/10.1038/nature17165, 2016.
Liu, H., Gong, P., Wang, J., Clinton, N., Bai, Y., and Liang, S.: Annual dynamics of global land cover and its long-term changes from 1982 to 2015, Earth Syst. Sci. Data, 12, 1217–1243, https://doi.org/10.5194/essd-12-1217-2020, 2020.
Liu, H., Gong, P., Wang, J., Clinton, N., Bai, Y., and Liang, S.: Annual dynamics of global land cover and its long-term changes from 1982 to 2015, link to GeoTIFF files, PANGAEA [data set], https://doi.org/10.1594/PANGAEA.913496, 2020b.
Liu, X. R., Zhang, X. D., Huang, Y. F., Chen, K, J., Wang, L. F., Ma, J. M., Huang, T., Zhao, Y., Gao, H., Tao, S., Liu, J. F., Jian, X. H., and Luo, J. M.: The Direct Radiative Forcing Impact of Agriculture-Emitted Black Carbon Associated With India's Green Revolution, Earths Future, 9, e2021EF001975, https://doi.org/10.1029/2021EF001975, 2021.
Liu, X. Y. and Xin, L. J.: China's deserts greening and response to climate variability and human activities, PLoS One, 16, e0256462, https://doi.org/10.1371/journal.pone.0256462, 2021.
Mograbi, P. J., Erasmus, B. F. N., Witkowski, E. T. F., Asner, G. P., Wessels, K. J., Mathieu, R., Knapp, D. E., Martin, R. E., and Main, R.: Biomass Increases Go under Cover: Woody Vegetation Dynamics in South African Rangelands, PLoS One, 10, e0127093, https://doi.org/10.1371/journal.pone.0127093, 2015.
Myhre, G. and Myhre, A.: Uncertainties in Radiative Forcing due to Surface Albedo Changes Caused by Land-Use Changes, J. Climate, 16, 1511–1524, https://doi.org/10.1175/1520-0442(2003)016<1511:UIRFDT>2.0.CO;2, 2003.
Nogueira, D. S., Marimon, B. S., Marimon-Junior, B. H., Oliveira, E. A., Morandi, P., Reis, S. M., Elias, F., Neves, E. C., Feldpausch, T. R., Lloyd, J., and Phillips, O. L.: Impacts of Fire on Forest Biomass Dynamics at the Southern Amazon Edge, Environ. Conserv., 46, 285–292, https://doi.org/10.1017/S0376892919000110, 2019.
Ouyang, Z. T., Sciusco, P., Jiao, T., Feron, S., Lei, C., Li, F., John, R., Fan, P., Li, X., Williams, C. A., Chen, G. Z., Wang, C. H., and Chen, J. Q.: Albedo changes caused by future urbanization contribute to global warming, Nat. Commun., 13, 3800, https://doi.org/10.1038/s41467-022-31558-z, 2022.
Parr, C. L., Lehmann, C. E. R., Bond, W. J., Hoffmann, W. A., and Andersen, A. N.: Tropical grassy biomes: misunderstood, neglected, and under threat, Trends Ecol. Evol., 29, 205–213, https://doi.org/10.1016/j.tree.2014.02.004, 2014.
Peking University: Dataset for ACP-egusphere-2024-1497, Zenodo [data set], https://doi.org/10.5281/zenodo.14586249, 2025.
Pendrill, F., Persson, U. M., Godar, J., Kastner, T., Moran, D., Schmidt, S., and Wood, R.: Agricultural and forestry trade drives large share of tropical deforestation emissions, Global Environ. Chang., 56, 1–10, https://doi.org/10.1016/j.gloenvcha.2019.03.002, 2019.
Peng, S. S., Piao, S. L., Zeng, Z. Z., Ciais, P., Zhou, L. M., Li, L. Z. X., Myneni, R. B., Yin, Y., and Zeng, H.: Afforestation in China cools local land surface temperature, P. Natl. Acad. Sci. USA, 111, 2915–2919, https://doi.org/10.1073/pnas.1315126111, 2014.
Pingali, P. L.: Green, Revolution: Impacts, limits, and the path ahead, P. Natl. Acad. Sci. USA, 109, 12302–12308, https://doi.org/10.1073/pnas.0912953109, 2012.
Pongratz, J., Raddatz, T., Reick, C. H., Esch, M., and Claussen, M.: Radiative forcing from anthropogenic land cover change since AD 800, Geophys. Res. Lett., 36, L02709, https://doi.org/10.1029/2008GL036394, 2009.
Ramanathan, V.: Greenhouse Effect Due to Chlorofluorocarbons: Climatic Implications, Science, 190, 50–52, https://doi.org/10.1126/science.190.4209.50, 1975.
National Forestry and Grassland Administration of China: Seventh National Forest Resource Inventory Report, https://www.forestry.gov.cn/c/www/lczy/8432.jhtml (last access: 11 April 2025), 2009.
Sherwood, S. C., Bony, S., Boucher, O., Bretherton, C., Forster, P. M., Gregory, J. M., and Stevens, B.: Adjustments in the Forcing-Feedback Framework for Understanding Climate Change, B. Am. Meteorol. Soc., 96, 217–228, https://doi.org/10.1175/BAMS-D-13-00167.1, 2015.
Spawn, S. A., Lark, T. J., and Gibbs, H. K.: Carbon emissions from cropland expansion in the United States, Environ. Res. Lett., 14, 045009, https://doi.org/10.1088/1748-9326/ab0399, 2019.
Stibig, H.-J., Achard, F., Carboni, S., Raši, R., and Miettinen, J.: Change in tropical forest cover of Southeast Asia from 1990 to 2010, Biogeosciences, 11, 247–258, https://doi.org/10.5194/bg-11-247-2014, 2014.
Sun, W., Ding, X., Su, J., Mu, X., Zhang, Y., Gao, P., and Zhao, G.: Land use and cover changes on the Loess Plateau: A comparison of six global or national land use and cover datasets, Land Use Policy, 119, 106165, https://doi.org/10.1016/j.landusepol.2022.106165, 2022.
Teluguntla, P. G., Thenkabail, P. S., Xiong, J., Gumma, M. K., Giri, C., Milesi, C., Ozdogan, M., Congalton, R., Tilton, J., Sankey, T. T., Massey, R., Phalke, A., and Yadav, K.: Global Cropland Area Database (GCAD) derived from remote sensing in support of food security in the twenty-fifirst century: Current achievements and future possibilities, in: Remote sensing handbook, Volume II, Land resources monitoring, modeling, and mapping with remote sensing, edited by: Thenkabail, P. S., Chap. 7, p. 849, Boca Raton: CRC Press, http://oar.icrisat.org/id/eprint/9224 (last access: 5 January 2016), 2015.
Vose, R. S., Kari, T. R., Easterling, D. R., Williams, C. N., and Menne, M. J.: Impact of land-use change on climate, Nature, 427, 213–214, https://doi.org/10.1038/427213b, 2004.
Wang, X. M., Ge, Q. S., Geng, X., Wang, Z. S., Gao, L., Bryan, B. A., Chen, S. Q., Su, Y. N., Cai, D. W., Ye, J. S., Sun, J. M., Lu, H. Y., Liu, B. L., Dong, Z. B., Cao, S. X., Hua, T., Chen, S. Y., Sun, F. B., Luo, G. P., Wang, Z. T., Hu, S., Xu, D. Y., Chen, M. X., Li, D. F., Liu, F., Xu, X. L., Han, D. M., Zheng, Y., Xiao, F. Y., Li, X. B., Wang, P., and Chen, F. H.: Unintended consequences of combating desertification in China, Nat. Commun., 14, 1139, https://doi.org/10.1038/s41467-023-36835-z, 2023.
Ward, D. S., Mahowald, N. M., and Kloster, S.: Potential climate forcing of land use and land cover change, Atmos. Chem. Phys., 14, 12701–12724, https://doi.org/10.5194/acp-14-12701-2014, 2014.
Winkler, K., Fuchs, R., Rounsevell, M., and Herold, M.: Global land use changes are four times greater than previously estimated, Nat. Commun., 12, 2501, https://doi.org/10.1038/s41467-021-22702-2, 2021.
Yang, J. X.: China's Rapid Urbanization, Science, 342, 310–310, https://doi.org/10.1126/science.342.6156.310-a, 2013.
Zablon, A. A., Nasta, P., Zlotnik, V., and Wedin, D.: Impact of grassland conversion to forest on groundwater recharge in the Nebraska Sand Hills, J. Hydrol. Reg. Stud., 15, 171–183, https://doi.org/10.1016/j.ejrh.2018.01.001, 2018.
Zhang, X., Huang, T., Zhang, L., Shen, Y., Zhao, Y., Gao, H., Mao, X., Jia, C., and Ma, J.: Three-North Shelter Forest Program contribution to long-term increasing trends of biogenic isoprene emissions in northern China, Atmos. Chem. Phys., 16, 6949–6960, https://doi.org/10.5194/acp-16-6949-2016, 2016.
Zhang, X. D., Huang, T., Zhang, L. M., Gao, H., Shen, Y. J., and Ma, J. M.: Trends of deposition fluxes and loadings of sulfur dioxide and nitrogen oxides in the artificial Three Northern Regions Shelter Forest across northern China, Environ. Pollut., 207, 238–247, https://doi.org/10.1016/j.envpol.2015.09.022, 2015.
Zhu, F., Emile-Geay, J., Mckay, N. P., Hakim, G. J., Khider, D., Ault, T. R., Steig, E. J., Dee, S., and Kirchner, J. W.: Cliamte models can correctly simulate the continuum of global-average temperature variability, P. Natl. Acad. Sci. USA, 116, 8728–8733, https://doi.org/10.1073/pnas.1809959116, 2019.