the Creative Commons Attribution 4.0 License.
the Creative Commons Attribution 4.0 License.
 | 14 Apr 2025
Impacts of irrigation on ozone and fine particulate matter (PM2.5) air quality: implications for emission control strategies for intensively irrigated regions in China
Tiangang Yuan
Tzung-May Fu
Aoxing Zhang
David H. Y. Yung
Jin Wu
Sien Li
Intensive irrigation is known to alleviate crop water stress and alter regional climate, which can in turn influence air quality, with ramifications for human health and food security. However, the interplay between irrigation, climate and air pollution especially in the simultaneously intensively irrigated and heavily polluted regions in China has rarely been studied. Here we incorporated a dynamic irrigation scheme into a regional climate–air quality coupled model to examine the potential impacts of irrigation on ozone (O3) and fine particulate matter (PM2.5) in China. Results show that irrigation increases PM2.5 by 12 µg m−3 (28 %) but reduces O3 concentration by 3–4 ppb (6 %–8 %). Among PM2.5, nitrate and ammonium aerosols rise by 70 % and 40 %, respectively, upon introducing irrigation, with secondary formation contributing to ∼ 60 % and 10 %–30 %, respectively. High humidity and low temperature promote the formation of ammonium nitrate aerosols. To mitigate these adverse effects on PM2.5 air quality, we found that a 20 % reduction in NH3 and NOx emissions is more effective compared with individual emission reductions, while the enhancement in O3 due to the NOx reduction can be completely offset by irrigation itself. Our study highlights the potential benefits of irrigation regarding O3 pollution but potential problems regarding PM2.5 pollution under currently prevalent irrigation modes and anthropogenic emission scenarios, emphasizing the need for an integrated approach to balance water conservation, air pollution, climate change mitigation and food security in the face of development needs.
- Article
(12874 KB) - Full-text XML
-
Supplement
(1398 KB) - BibTeX
- EndNote


Air pollution has become a global environmental concern because of its detrimental effects on human health (e.g., Lelieveld et al., 2015), agricultural production (e.g., Tai et al., 2014), ecosystem health (Zhou et al., 2018; Zhu et al., 2022) and climate (IPCC, 2021), especially in developing countries undergoing rapid urbanization and industrialization such as India and China. Among the various pollutants, fine particulate matter with diameters < 2.5 µm (PM2.5) and surface ozone (O3) are closely associated with increased mortality risks in China (Liang et al., 2019; Wang et al., 2016). The annual PM2.5 concentration in the North China Plain (NCP) exhibited a steady increase from 1970 to 2013 based on visibility data (An et al., 2019), with the Beijing–Tianjin–Hebei region recording a peak level of 106 µg m−3 in 2013 (Wang et al., 2020), which was three times the annual standard (35 µg m−3) of the Chinese Ambient Air Quality Standards Grade II. Although it has declined by roughly 40 % following the implementation of the Air Pollution Prevention and Control Action Plan since 2013 (An et al., 2019; Wang et al., 2020), more than 65 % of the Chinese people are still exposed to PM2.5 above the standard of the Chinese Ambient Air Quality Standards Grade II (Zhao et al., 2021). Meanwhile, the warm-season (May–September) O3 showed positive trends of 0.16 and 0.42 ppb yr−1 during 1981–2019 in the NCP and Sichuan Basin (SCB), respectively (Mao et al., 2024). In recent years, the summertime maximum daily 8 h average O3 concentration (MDA8) in China climbed continuously during 2013–2019 (Wang et al., 2022c; Lu et al., 2018). The rising trend is particularly evident in the NCP (3.3 ppb yr−1; Li et al., 2020), which was mainly caused by the weakened titration by nitrogen oxides (NOx ≡ NO + NO2) and aerosol uptake of hydroperoxyl radicals under the context of huge emission reductions (Li et al., 2019; Wang et al., 2022b).
PM2.5 consists of primary aerosols such as mineral dust and black carbon (BC), as well as secondary aerosols from gaseous precursors including secondary organic aerosol (SOA) and secondary inorganic aerosol (SIA, e.g., nitrate, sulfate and ammonium), while surface O3 is mainly produced by its precursors including NOx, volatile organic compounds (VOCs) and carbon monoxide (CO) through photochemical oxidation in the presence of sunlight. There is a complicated nonlinear response of O3 and PM2.5 to emission reductions and meteorological conditions. During the COVID-19 lockdowns when the large reduction in NOx emission enhanced atmospheric oxidative capacity, the level of secondary PM2.5 and surface O3 rose in megacity clusters of China, including the NCP and SCB, although the lockdown effectively reduced primary PM2.5 concentration (Huang et al., 2021; Shi et al., 2021).
Le et al. (2020) and Wang et al. (2022a) argued that the contribution of meteorological factors to the enhancement of O3 and PM2.5 may outweigh the impact of NOx reduction in eastern China during the lockdown. Furthermore, multiple studies indicate that meteorological conditions make up approximately 10 %–70 % of PM2.5 variability and 49 %–84 % of summertime O3 increases in China, outweighing the contribution of anthropogenic emissions (Dang et al., 2021; Yin et al., 2021; Leung et al., 2018). Meteorological factors influence O3 and PM2.5 through various pathways. For instance, low planetary boundary layer height (PBLH) and wind speed can trap all pollutants near the surface, and high relative humidity (RH) promotes SIA formation through heterogeneous reactions and aerosol hygroscopic growth, although heavy precipitation causes wet scavenging that removes aerosols and other gaseous pollutants (Chen et al., 2020; Zhang and Cao, 2015; Tie et al., 2017). Moreover, high temperature can enhance biogenic VOC emissions and accelerate SO2 oxidation and other photochemical reactions, thereby increasing sulfate, O3 and SOA. However, it usually has the opposite effect on nitrate, shifting it from the aerosol to gas phase (Tai et al., 2010; Shi et al., 2020). High temperatures are also usually associated with subtropical highs, which can generate stagnation events that tend to trap air pollutants and worsen air quality (Tai et al., 2010, 2012). Therefore, meteorological conditions are crucial for determining regional air quality through both physical and chemical processes.
Large-scale irrigation in agriculture has been shown to modify boundary meteorology substantially via enhancing evapotranspiration directly and provoking land–atmosphere feedback indirectly (McDermid et al., 2023). Specifically, evapotranspiration induced by irrigation can reduce surface air temperature, increase RH and cloud cover, and contribute to cloud formation. These effects, in turn, can stabilize and lower the atmospheric boundary layer (e.g., Cook et al., 2015; Qian et al., 2020). Yuan et al. (2023) demonstrated that through these processes flood and sprinkler irrigation in the NCP can enhance convective precipitation by raising convective available potential energy (CAPE) and precipitable water, whereas drip irrigation may cause a distinct hydrometeorological feedback and further suppress summertime precipitation slightly. These meteorological changes induced by irrigation may then affect O3 and PM2.5 pollution, but only very few studies thus far have examined the relationships between irrigation, climate and air pollution. Jacobson (1999) first found that initializing a coupled meteorology–chemistry model with high soil moisture lowers the PBLH and increases surface air pollutants including O3 in Los Angeles (CA, USA). By adding irrigation water into the soil directly to mimic irrigation, Jacobson (2008) showed that the PM2.5 and O3 could increase by approximately 2 % and 0.1 %, respectively, in California. Li et al. (2016) incorporated a dynamic irrigation method into the Weather Research and Forecasting with Chemistry (WRF-Chem) model and found that irrigation enhanced the concentrations of surface primary pollutants such as carbon monoxide (CO) and VOCs but reduced O3 slightly over irrigated areas in the Central Valley of California. The enhanced divergence over irrigated areas further transported pollutants from irrigated regions to nearby non-irrigated areas, leading to relatively higher O3 concentrations in the surrounding areas. In addition, irrigation may affect natural emissions including soil NOx and soil ammonia (NH3) by altering soil moisture and temperature, which are essential precursors of PM2.5 and O3 (Shen et al., 2023; Song et al., 2021). Thus, large-scale irrigation may exert important but under-researched roles in modulating regional air quality.
China currently possesses the largest irrigated cropland area in the world, whereby the irrigated area expanded dramatically from ∼ 16 to ∼ 68 Mha during 1949–2017, consuming over 70 % of the fresh water (Han et al., 2020b). The rapid irrigation expansion has caused water scarcity and depletion of groundwater storage, threatening food security and natural ecosystems (Currell et al., 2012). The NCP and SCB are the two regions with intensively irrigated areas, high food production and severe air pollution in China. Considerable research efforts have been devoted to the effects of irrigation on crop yields based on crop, hydrological or land surface models, and on hydrometeorology based on global or regional climate models (McDermid et al., 2023), while relatively little attention has been paid to the nonlinear interactions between irrigation, meteorology and air pollution. Moreover, a deeper understanding of such complicated interactions is essential to the co-formulation of effective air quality and agricultural management strategies; this is not only because irrigation can affect air quality, but also because high agricultural production contributes significant amounts of NH3 to the atmosphere, which is an important precursor of PM2.5 in these two regions. To address these questions, we incorporated a dynamic irrigation scheme into a coupled climate–air quality model, the Weather Research and Forecasting (WRF) meteorological model (v3.9.1.1) coupled with the GEOS-Chem chemical transport model (v12.7.2) (WRF-GC v2.0; Feng et al., 2021). This study represents the first comprehensive assessment of the possible impacts of irrigation on O3 and PM2.5 in China and proposes effective emission control strategies to counteract the corresponding adverse effects, which would be helpful for policymakers and farmers to evaluate the co-benefits and tradeoffs between agricultural and air quality management practices, especially with the rising application of water-saving irrigation systems in these intensively irrigated areas.
2.1 General model configuration
The WRF-GC model is a newly developed regional climate–atmosphere chemistry model (Lin et al., 2020; Feng et al., 2021), in which the GEOS-Chem chemical transport model is coupled to the WRF model, a mesoscale weather model for atmospheric research and weather forecasting (Skamarock et al., 2008). Currently, the WRF-GC v2.0 simulates online interactions and feedbacks between meteorology and chemistry, and it considers a vast array of physical and chemical processes including emission, transport, deposition and chemistry, with multiple parameterization options. It enables users to examine land–atmosphere physical and chemical interactions at high spatial resolutions. The standard chemical mechanism includes detailed Ox–NOx–VOC–ozone–halogen–aerosol chemistry in the troposphere as inherited from the GEOS-Chem model. Some aerosol species such as SIA, SOA, BC and primary organic carbon (POC) are treated as bulk masses by assuming a lognormal size distribution, while dust and sea salt aerosols are divided into four and two size bins, respectively. The thermodynamical equilibrium of SIA is simulated by the ISORROPIA II module (Pye et al., 2009). The “simple SOA” scheme without detailed chemical processes was used to simulate SOA yields (Hodzic and Jimenez, 2011; Kim et al., 2015), whereby SOA formation is directly related to emissions at fixed yields and shows no dependence on other factors such as temperature and NOx concentration. For a detailed description and evaluation of WRF-GC, one can be referred to Lin et al. (2020) and Feng et al. (2021), who proved that WRF-GC demonstrates satisfactory performance against observations regarding the magnitudes and spatial patterns of air pollutants, cloud properties and meteorological fields over China.
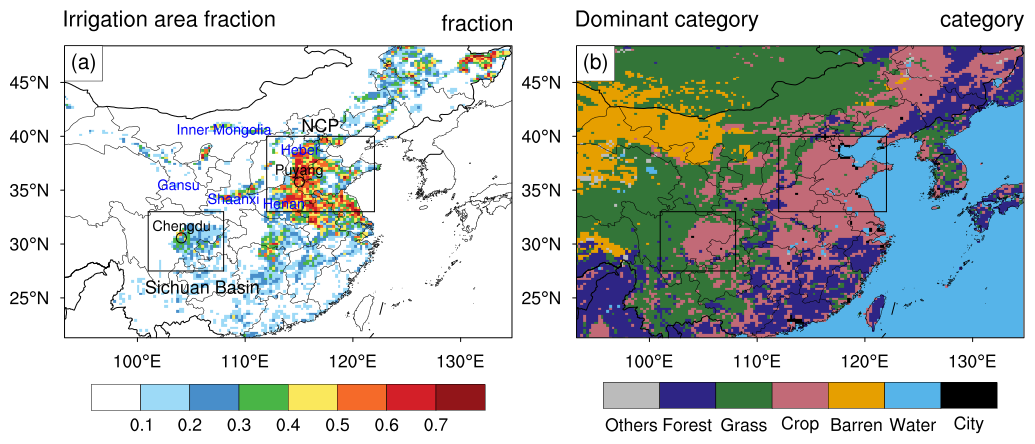
Figure 1Spatial distribution of (a) irrigated area fraction and (b) land use and land cover as WRF-GC model input. Intensively irrigated areas such as the North China Plain (NCP) and Sichuan Basin (SCB) are shown with rectangles. Two cities in the irrigated areas, Puyang and Chengdu, have been selected for further analysis. Some relevant provinces, including Hebei, Henan, Gansu, Shaanxi and Inner Mongolia, are marked in blue font.
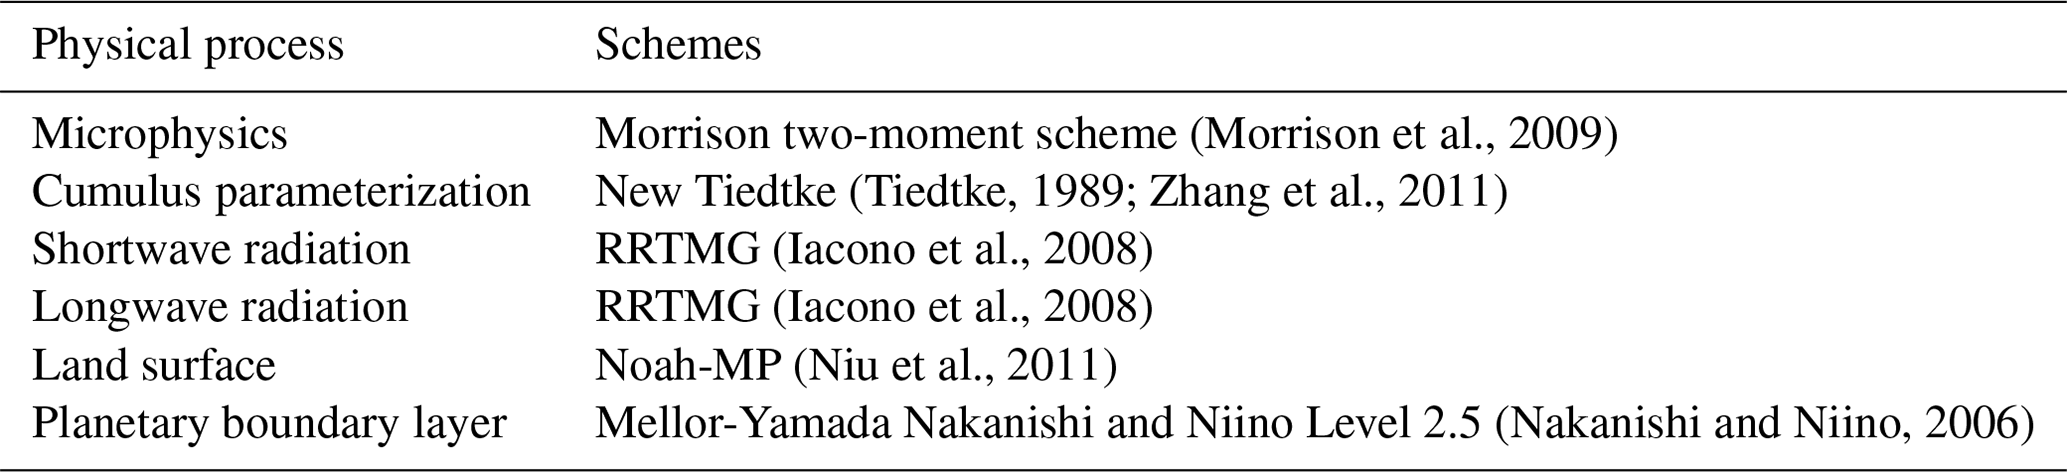
Figure 1a shows our model domain, which covers the intensively irrigated areas including the NCP and SCB at a horizontal resolution of 27 km. Model vertical levels are divided into 50 layers from the surface to 10 hPa. Anthropogenic emissions including BC, POC, CO, NH3 and VOCs are derived from the MIX emission inventory for Asia (Li et al., 2017a), overwritten by monthly Multi-resolution Emission Inventory for China (MEIC) version 1.3 of 2017 at a resolution of 0.25° over China (http://meicmodel.org.cn, last access: 1 May 2024; Li et al., 2017b; Zheng et al., 2018). MEIC accounts for emissions from five sectors: power plant, residential activities, transportation, industry and agriculture; data are available from 2008 to 2017. Monthly biomass burning emissions are taken from the Global Emissions Database version 4 (GFED4; Randerson et al., 2018). Biogenic emissions, soil NOx and dust emissions are calculated online by the Model of Emissions of Gases and Aerosols from Nature version 2.1 (MEGAN2.1; Guenther et al., 2012), Berkeley–Dalhousie Soil NOx Parameterization (BDSNP; Hudman et al., 2012), and Dust Entrainment And Deposition (DEAD; Zender et al., 2003), respectively, in the Harmonized Emissions Component (HEMCO) module. The initial and boundary meteorological conditions are provided by ERA5 reanalysis data with a spatial resolution of 0.25° and 6 h temporal interval (https://cds.climate.copernicus.eu/datasets, last access: 1 May 2024). Initial and boundary conditions of chemical species were obtained from the GEOS-Chem Classic global model outputs, which use the same chemical mechanisms and emissions as WRF-GC but at 2 × 2.5° resolution and with a 1-year spin-up time. The physical schemes used here are listed in Table 1, which have been tested and verified systematically by Feng et al. (2021).
2.2 Irrigation scheme
Previous work has documented the parameterization of irrigation in numerical models, which can be characterized by three major methods. The first approach involves maintaining the soil moisture at different percentages of soil field capacity or saturation point during the growing season (e.g., Lobell et al., 2008). This method keeps a high soil moisture, which can cause a cool bias and is deemed unrealistic (Kanamaru and Kanamitsu, 2008). The second one is to derive a time-invariant irrigation rate based on census irrigation water use (IWU) data (e.g., Sacks et al., 2009; Liu et al., 2021b), but it ignores the feedbacks from weather and climate on irrigation itself. The last one is a dynamic irrigation method that mimics real irrigation processes regarding irrigation water amount and ways of water application (e.g., Leng et al., 2017; Yuan et al., 2023). It has been suggested that the dynamic irrigation method can improve simulated surface energy fluxes, temperature and humidity greatly, particularly at fine resolutions (Sorooshian et al., 2014; Qian et al., 2020). Therefore, we followed He et al. (2023) and implemented the dynamic irrigation schemes into the Noah land surface model with multiparameterization (Noah-MP; Niu et al., 2011) embedded within WRF-GC.
Our previous work has investigated the climate effects of different irrigation methods, i.e., flood, sprinkler and drip irrigation, over the NCP based on the dynamic irrigation schemes using WRF alone, and we found that flood and sprinkler irrigation have comparable effects on air temperature and precipitation, except that flood irrigation is associated with a larger irrigation amount and surface runoff (Yuan et al., 2023). Hence, following previous studies, we used the sprinkler irrigation method to represent present-day irrigation in China to avoid the excess water use in the model (e.g., Liu et al., 2021a; Yang et al., 2015). The irrigation water amount at time t (It, mm) is the water availability between field capacity and current soil moisture, weighted by the irrigated area fraction (IF) and green vegetation fraction (GVF), when the relative soil moisture is below the management allowable deficit (MAD), following:
where SMfc and SMwt are soil moisture at soil field capacity and wilting point, respectively; SMt is soil moisture at current time (t); and DZS denotes root zone depth (m). MAD is set at 60 %, which is in line with the setting of Yuan et al. (2023). In sprinkler irrigation, water is applied over the canopy as precipitation. Under this circumstance, part of the water is intercepted by the canopy and evaporates to the atmosphere before reaching the ground. Irrigation rate (IR, mm) at each time step is limited to the minimum of infiltration (i, mm), irrigation amount and the rate of 5 mm h−1 (SIrate) used in Lawston et al. (2015):
where Δt is the time step. The evaporative loss (E, %) from spraying during application is parameterized as a function of wind speed (u, m s−1), saturation vapor pressure (es, hPa), actual vapor pressure (e, hPa) and surface air temperature (Ta, °C), following Bavi et al. (2009):
In the next time step (t+Δt), the remaining irrigation amount is
Irrigation would not be stopped until It is completely applied to the soil surface (i.e., It=0). Subsequently, the model would check if irrigation can be triggered again in the next time step when the previous irrigation event has finished. Five conditions need to be met before scheduling irrigation during growing season: (1) IF > 10 %, (2) precipitation < 1 mm h−1, (3) leaf area index (LAI) > 0.3, (4) , and (5) land type is cropland.
To represent irrigation more realistically, we used the actual 500 m irrigation map of 2017 and the National Land Cover Dataset of China (NLCD) in 2015 (Fig. 1), which were available from Zhang et al. (2022a) and the National Tibetan Plateau Data Center (http://data.tpdc.ac.cn, last access: 1 May 2024), respectively. The irrigated cropland map was generated by integrating statistics, satellite remote sensing and existing irrigation maps, and it has an overall accuracy of 73 %–82 % against 5648 samples collected from ground-truth images, surpassing the accuracy of other existing irrigation data. The biggest advantage is that it represents the area that is actually irrigated in a year. The NLCD land cover dataset with 1 km resolution was produced based on Landsat Thematic Mapper (TM) or Enhanced TM Plus (ETM+) digital images via a human–computer interaction approach and has more than 90 % overall accuracy based on field surveys (Liu et al., 2014). The land cover was then converted to 24-category US Geological Survey (USGS) land cover types as model input. Since the model default LAI and GVF are outdated, we updated them with 8 d composite LAI and GVF from the Global Land Surface Satellite (GLASS) product at 0.05° (http://www.glass.umd.edu/Download.html, last access: 1 May 2024; Liang et al., 2021), which were processed based on the Moderate-resolution Imaging Spectrometer (MODIS) satellite products. It has been shown that these products have the best accuracy and quality compared to other products such as GEOV1 (the first version of Geoland2 satellite products), by comparing with ground observations of LAI and GVF (Li et al., 2018; Jia et al., 2018). They were linearly interpolated from 8 d time intervals to daily products for model input.
2.3 Model experiments
Before examining the irrigation effects, we conducted a standard experiment with grid nudging (denoted CTL, control) to show the ability of the default WRF-GC model to simulate atmospheric physical and chemical variables. Subsequently, two sensitive experiments, one with the irrigation scheme described above (IRR) and one without irrigation (NOIRR), were designed and conducted. To clearly show the causality of irrigation and air quality, the climate effects of aerosols (i.e., aerosol-cloud interaction and aerosol-radiation interaction) and nudging were switched off in the sensitivity experiments (Table S1 in the Supplement). Therefore, the differences between IRR and NOIRR directly indicate how irrigation modifies meteorology and thus affects emission, transport, chemistry and deposition of air pollutants, and the experimental design decidedly did not address how changes in stimulated atmospheric species that are climate forcers (e.g., aerosols) would further modulate climate in the same model experiment.
Since we found that irrigation promotes nitrate formation and further worsens PM2.5 pollution through the above experiments, we then performed four additional sensitivity experiments to identify suitable mitigation strategies. The model settings of the four experiments including the irrigation scheme, physical and chemical schemes, and spatiotemporal resolutions, as well as natural and anthropogenic emissions, are the same as those of IRR except that the anthropogenic emissions of NOx and NH3 were scaled with different ratios to mimic different emission reduction strategies (Table S1): (1) 20 % combined reduction in NOx and NH3 emissions (Emiss_20c), (2) 50 % combined reduction in NH3 and NOx emissions (Emiss_50c), (3) 50 % reduction only in NOx emissions (Emiss_50NOx), and (4) 50 % reduction only in NH3 emissions (Emiss_50NH3). These strategies lie in the fact that previous studies have highlighted the effectiveness of the reductions in NH3 and NOx emissions in reducing PM2.5 pollution in China (Zhai et al., 2021; Liu et al., 2021c). In addition, considering the demanding computational resources required for WRF-GC, we had to choose a study year with relatively normal climate conditions to reduce the possible influences of interannual climate variability. Due to the limited availability of measurements of air pollutants in China, which are mostly accessible from 2014 onwards, and the occurrence of the COVID-19 pandemic during 2019–2022, we ultimately selected the summer of 2017, which has an absolute Standardized Precipitation Evapotranspiration Index (SPEI) below 0.5 in the NCP and SCB (see summertime SPEI from 2014 to 2018 in Fig. S1). Indeed, the simulated effects of irrigation on regional climate are similar to the longer-term simulations in our previous work (Yuan et al., 2023), reflecting small effects of interannual variability of climate on our model results. All seven simulations were conducted from 1 May to 1 September 2017, with the first month used as model spin-up time. Only the results for the summer of 2017 were analyzed.
2.4 Observations
The monthly land surface temperature (LST) data with a spatial resolution of 0.05° from MODIS aboard Aqua and Terra (https://ladsweb.modaps.eosdis.nasa.gov/, last access: 1 May 2024) were used for model validation. The soil moisture output from the Global Land Data Assimilation System (GLDAS) Noah land surface model (https://search.earthdata.nasa.gov/search?q=GLDAS, last access: 19 November 2024), which assimilates satellite- and ground-based observations using advanced data assimilation approaches, was also utilized to evaluate model performance. This dataset has a spatial resolution of 0.25° and a temporal resolution of 1 month. Daily air temperature (T2), dew point temperature and wind speed recorded by weather stations were derived from the National Oceanic and Atmospheric Administration (NOAA) National Climatic Data Center (NCDC) (ftp://ftp.ncdc.noaa.gov/pub/data/gsod/, last access: 1 May 2024). The hourly concentrations of surface air pollutants including O3 and PM2.5 monitored in sites during 2017 were collected from the Chinese Ministry of Ecology and Environment (MEE) (archived in https://quotsoft.net/air/, last access: 1 May 2024). Here we chose 1334 monitoring sites with valid values over 90 % falling within the model domain in the summer of 2017 to evaluate the model results. The monthly SPEI with 3-month timescale for the period 2014–2018 at a spatial resolution of 0.5° considered in this study was provided by the SPEIbase (https://digital.csic.es/handle/10261/332007, last access: 1 May 2024), which has been widely used to indicate drought characteristics. It was generated through monthly gridded potential evapotranspiration and precipitation from Climatic Research Unit of the University of East Anglia (Beguería et al., 2010), and a value ranging from −0.5 to 0.5 is characterized as normal climate conditions.
3.1 Model evaluation
Figure 2 compares the simulated seasonal mean T2, PM2.5 and afternoon O3 from the CTL experiment against surface observations during summer. The observed air temperature is around 28–30 °C in southern China and decreases to ∼ 20 °C in the north. The lowest air temperature is observed in western China because of the high altitude of the Tibetan Plateau. The WRF-GC model reproduces the spatial pattern and captures the warmer NCP and SCB, with the spatial correlation of 0.85 and root-mean-square error (RMSE) of 2.9 °C. However, the regional average temperature from the model is 27.7 and 26.3 °C in the NCP and SCB, respectively, about 2 °C larger than the corresponding observations (Table 2). This warm bias has been reported in many studies and can be reduced by including irrigation in the model processes (Yang et al., 2015; Qian et al., 2020).
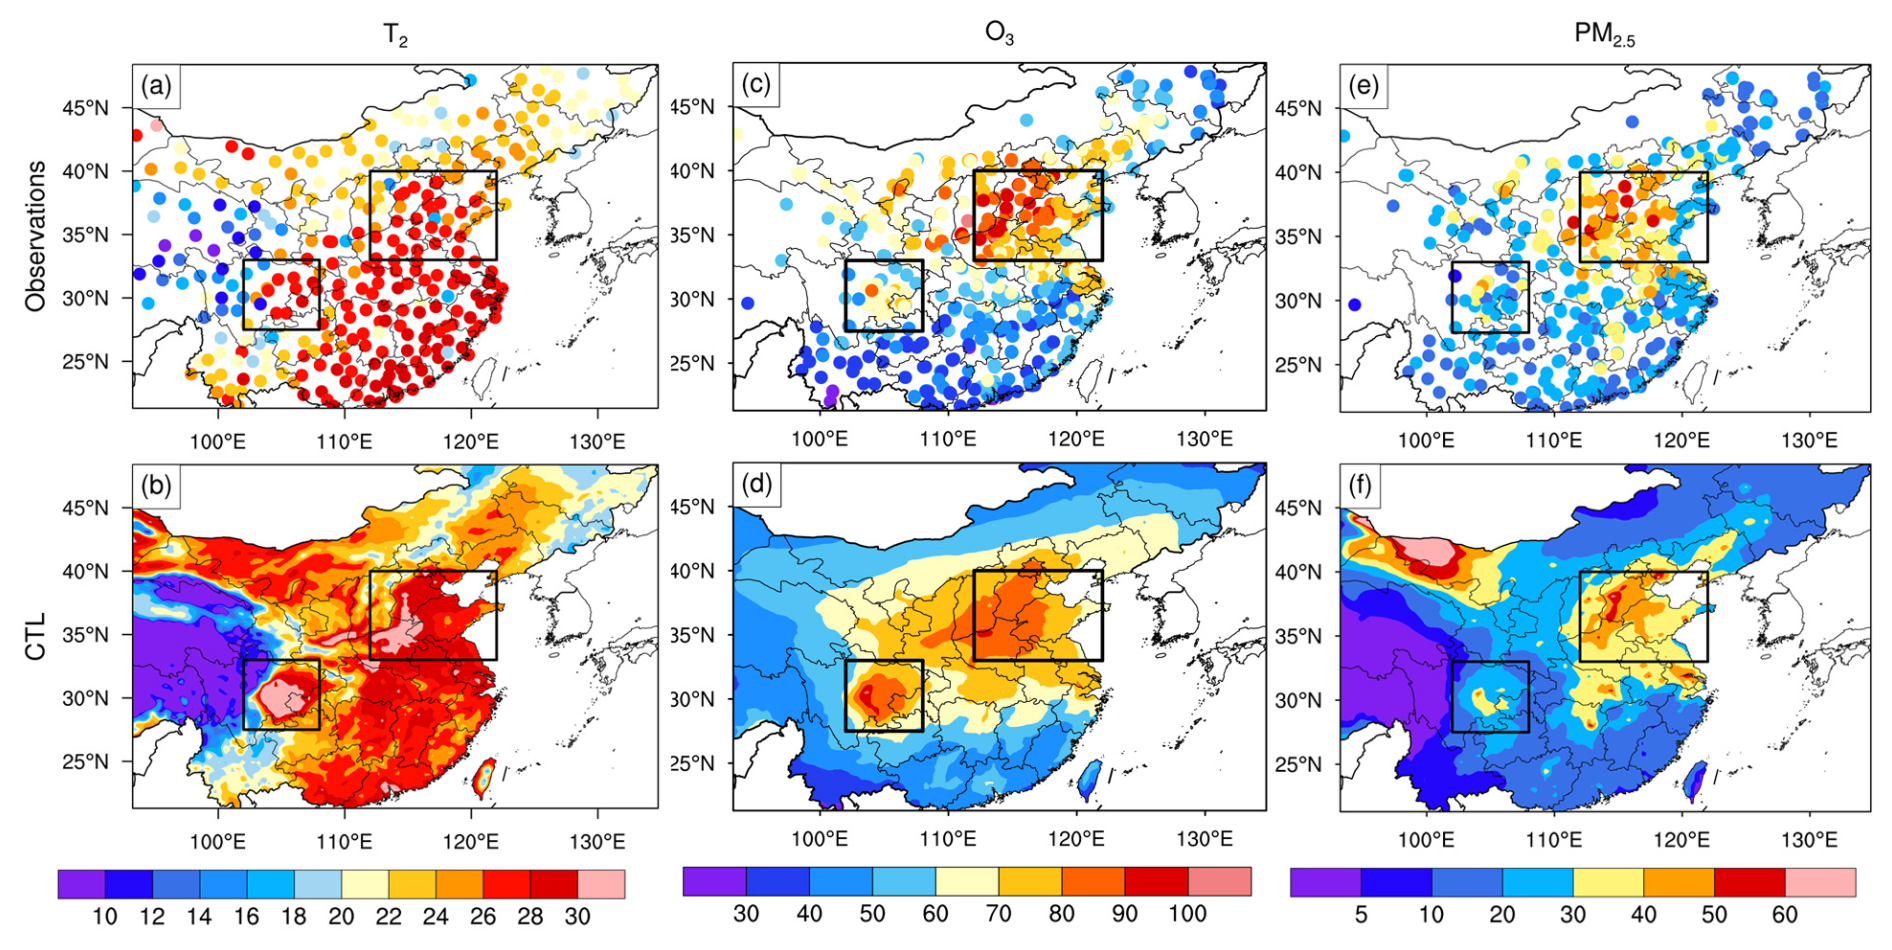
Figure 2Spatial distribution of seasonal average (a–b) air temperature at 2 m (T2, °C), (c–d) surface afternoon (13:00–17:00 BJT, Beijing time) ozone (O3, ppb) and (e–f) fine particulate matter (PM2.5, µg m−3) derived from surface observations and the control (CTL) experiment during the summer of 2017.
Table 2Daily mean surface temperature (T2), fine particulate matter (PM2.5) and afternoon ozone (O3, 13:00–17:00 BJT) from observations and the control (CTL) experiment over the North China Plain (NCP) and Sichuan Basin (SCB) averaged over the summer of 2017.
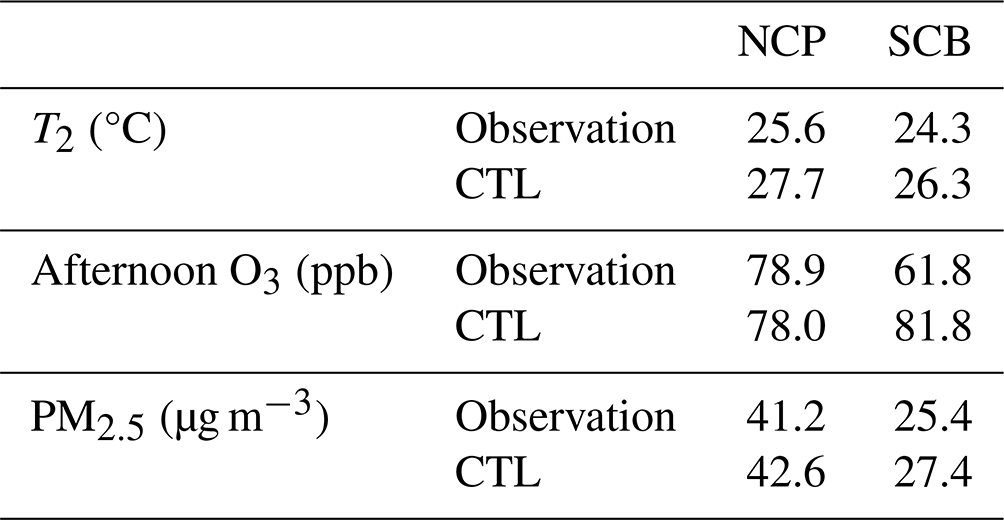
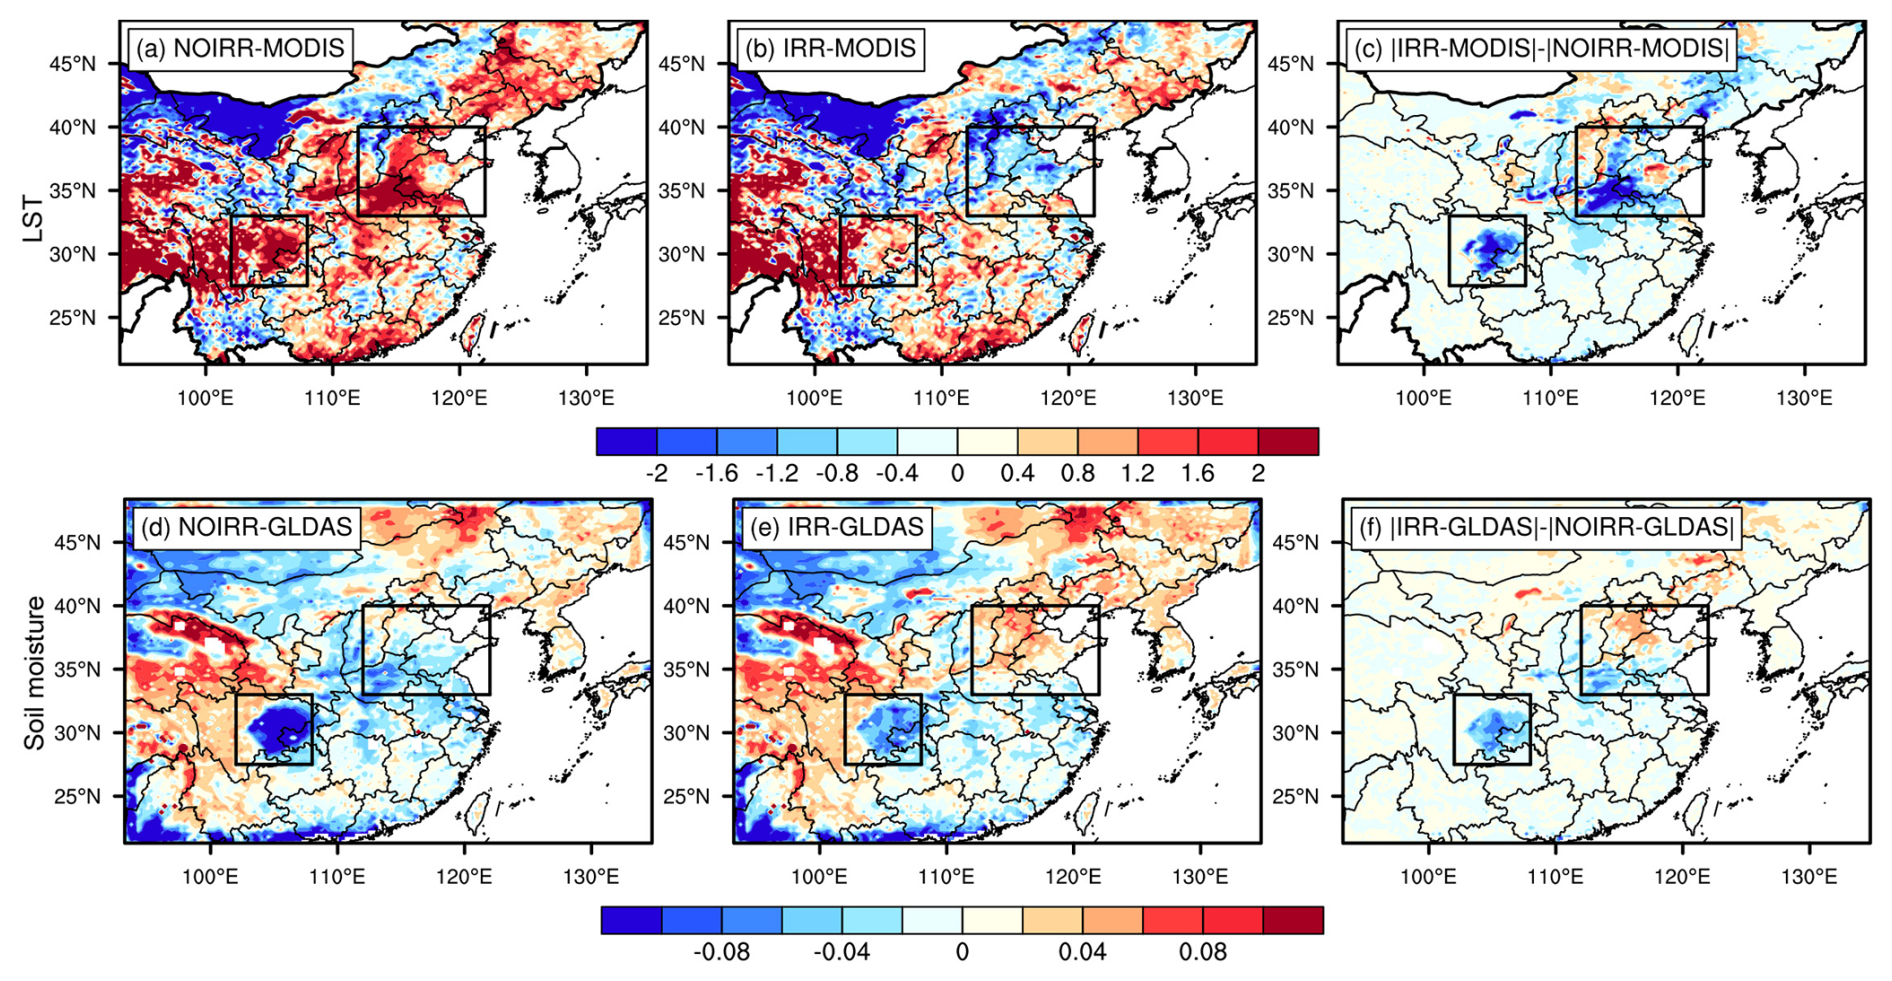
Figure 3Spatial distribution of the mean differences in (a–c) land surface temperature (LST, °C) and (d–f) surface soil moisture (0–10 cm, m3 m−3) between (a, d) sensitivity experiment without irrigation (NOIRR) and observations, (b, e) sensitivity experiment with irrigation (IRR) and observations, and (c, f) the differences between panels (b) and (a) or panels (d) and (e) during the summer of 2017, which quantitatively show how much the irrigation scheme can reduce the NOIRR biases. Negative values denote model improvements, while positive values indicate deterioration. MODIS indicates the LST obtained from the Moderate Resolution Imaging Spectroradiometer, and GLDAS indicates the soil moisture generated from the Global Land Data Assimilation System.
We thus compared the simulated LST and soil moisture from IRR and NOIRR with MODIS LST and surface soil moisture from GLDAS, respectively, to quantify the ability of irrigation processes to reduce model biases (Fig. 3). The large positive differences in LST between MODIS and NOIRR indicate that the standard WRF-GC model (i.e., without irrigation) overestimates the LST greatly with the biases more than 2 °C in northeast China, central China, southwest China and parts of southern China (Fig. 3a). When irrigation is introduced into the model, such warm biases almost disappear in the intensively irrigated areas including Northeast China, Inner Mongolia, Ningxia, Shaanxi, the NCP and the SCB (Fig. 3b). Regarding soil moisture, NOIRR underestimates it by more than 1 m3 m−3 in the SCB and 0.06 m3 m−3 in the southern NCP (Fig. 3d). With irrigation, IRR narrows the negative biases by more than half in the SCB and almost cancels out the negative biases in the southern NCP, despite the slight increase in positive biases in the northern NCP (Fig. 3e). The largest improvements for simulated LST and soil moisture primarily occur in the southern part of the NCP and the whole SCB where the warm and dry biases are reduced by more than 2 °C and 0.06 m3 m−3, respectively, suggesting that irrigation should be properly represented in numerical models to more accurately simulate meteorological variables in intensively irrigated regions (Yuan et al., 2023).
We also calculated the concentrations of afternoon surface O3 (13:00–17:00 BJT, Beijing time) and daily mean surface PM2.5 in the NCP and SCB. Observations show that peak O3 concentration primarily appears in the NCP, especially in the Hebei and northern Henan provinces, where O3 is 90–100 ppb (Fig. 2c). The O3 in the SCB is lower than that in the NCP, ranging from 60 to 70 ppb, with a few sites exhibiting much higher values. Likewise, PM2.5 pollution is severe in the NCP where the maximum concentration of 40–60 µg m−3, but it is relatively weaker in the SCB (20–40 µg m−3) (Fig. 2e). The WRF-GC model successfully captures the hotspots of O3 and PM2.5 with spatial correlation of 0.78 and 0.70 and RMSE of 11.9 ppb and 8.5 µg m−3 across the whole domain, respectively (Fig. 2d, f). The simulated O3 and PM2.5 are 77.8 ppb and 40 µg m−3 in the NCP, respectively, which closely aligns with observations (78.9 ppb and 41.2 µg m−3) (Table 2). Similarly, good performance for WRF-GC-simulated PM2.5 was also found by Feng et al. (2021), focusing on January 2015 in the NCP. In the SCB, the simulated mean PM2.5 is 27.4 µg m−3, slightly larger than the observation (25.4 µg m−3). However, the model overestimates the regional averaged O3 by approximately 20 ppb, although it is close to the biases (13 ppb) reported by Feng et al. (2021) using WRF-GC for the entire China. It is a common issue for GEOS-Chem to overestimate the summertime surface O3 in China (Dang et al., 2021; Ye et al., 2022), which can be attributable to the coarse resolution of the model and emission inventories, large stratosphere–troposphere exchange, low cloud cover and precipitation, and rapid chemical conversion, as summarized by Yang and Zhao (2023), who reviewed the performance of several popular air quality models. Ye et al. (2022) confirmed that the low cloud optical depth and small O3 dry deposition rate in GEOS-Chem are responsible for the overestimation of O3, particularly in the SCB. Therefore, the uncertainties inherited from GEOS-Chem may lead to the larger overestimation of O3 in the SCB. Overall, WRF-GC is able to reproduce the meteorological fields and chemical variables, despite overestimation of O3 in the SCB. These systematic biases are fully considered in our sensitivity simulations to investigate and interpret the effects of irrigation on atmospheric chemistry.
3.2 Impacts of irrigation on boundary meteorology
Figure 4 illustrates the differences in meteorological conditions between IRR and NOIRR. The corresponding percentage changes are also shown. Irrigation increases soil moisture by around 0.04–0.08 m3 m−3 (20 %–50 %) over irrigated areas in the NCP and SCB. High soil moisture enhances soil evaporation and crop transpiration, cooling the surface air temperature by 1–2 °C (9 %–12 %) and increasing RH by around 10 %–20 % in the NCP. Such changes are relatively weaker in the SCB because of the lower irrigation intensity. Consequently, including irrigation reduces the root mean square error of NOIRR for T2, dew point temperature, RH and wind speed by 30 %, 30 %, 30 % and 6 % against observations at each weather station, respectively, particularly in the SCB (Fig. S2), underscoring the importance of improved representation of agricultural management in regional climate models. The enhancement of evapotranspiration due to irrigation increases latent heat flux but reduces sensible heat flux (not shown), leading to a decline of over 250 and 150 m in PBLH over NCP and SCB, respectively (Fig. 4d). The low cloud cover increases significantly by 9 %–12 % over both the NCP and the SCB (Fig. 4e). The reduction in downward solar radiation in response to cloud formation is up to 10 W m−2 (Fig. S3), in good agreement with our previous long-term simulation results (Yuan et al., 2023), albeit being statistically insignificant. Additionally, the stable atmosphere associated with irrigation reduces the surface wind speed, with significant reduction of 0.2–0.4 m s−1 (6 %–10 %) in part of the irrigated areas (Fig. 4f), implying more unfavorable meteorological conditions for the dissipation of air pollutants.
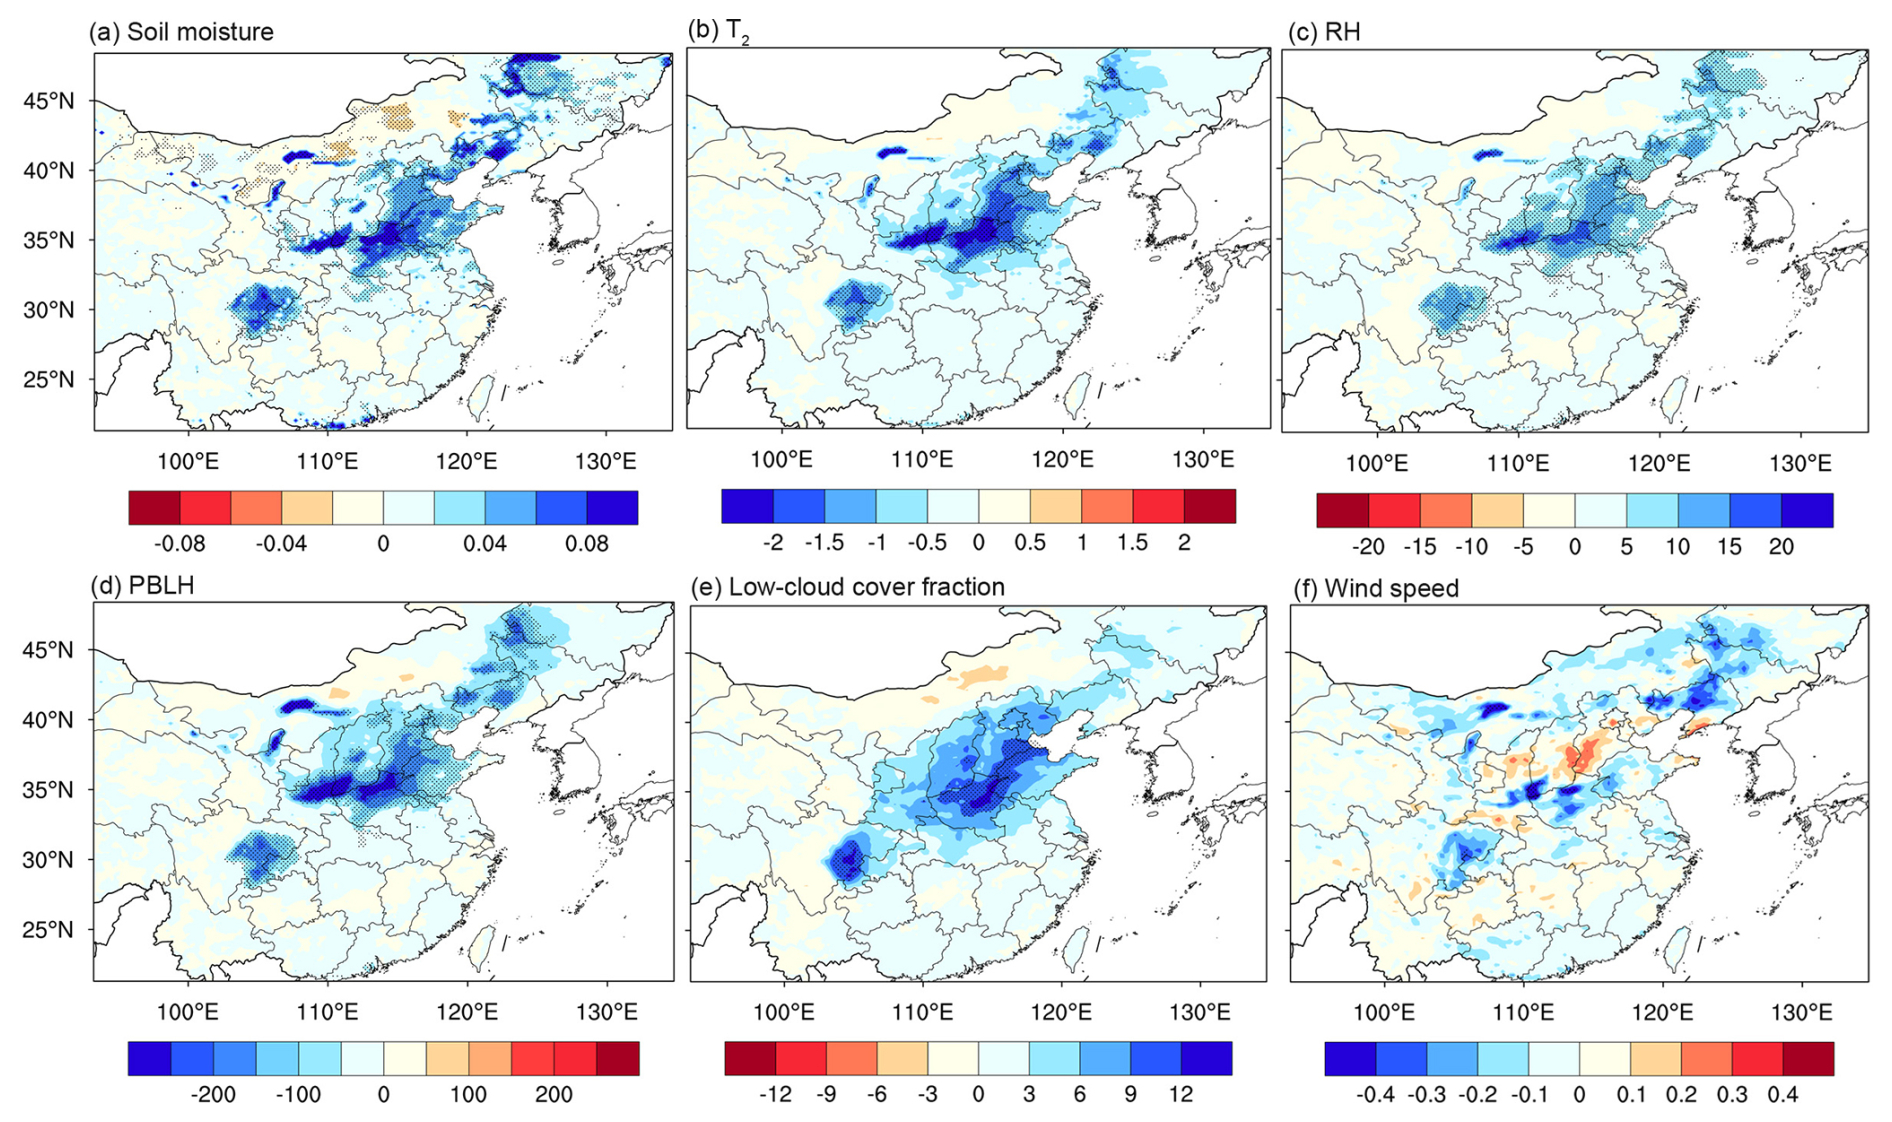
Figure 4Spatial distribution of changes in (a) topsoil moisture (m3 m−3), (b) 2 m air temperature (T2, °C), (c) 2 m relative humidity (RH, %), (d) planet boundary layer height (PBLH, m), (e) low-cloud fraction (%) and (f) 10 m wind speed (m s−1) in IRR relative to NOIRR averaged over the summer of 2017. The dotted area indicates changes that are statistically significant at the 95 % confidence level using a two-tailed Student's t test.
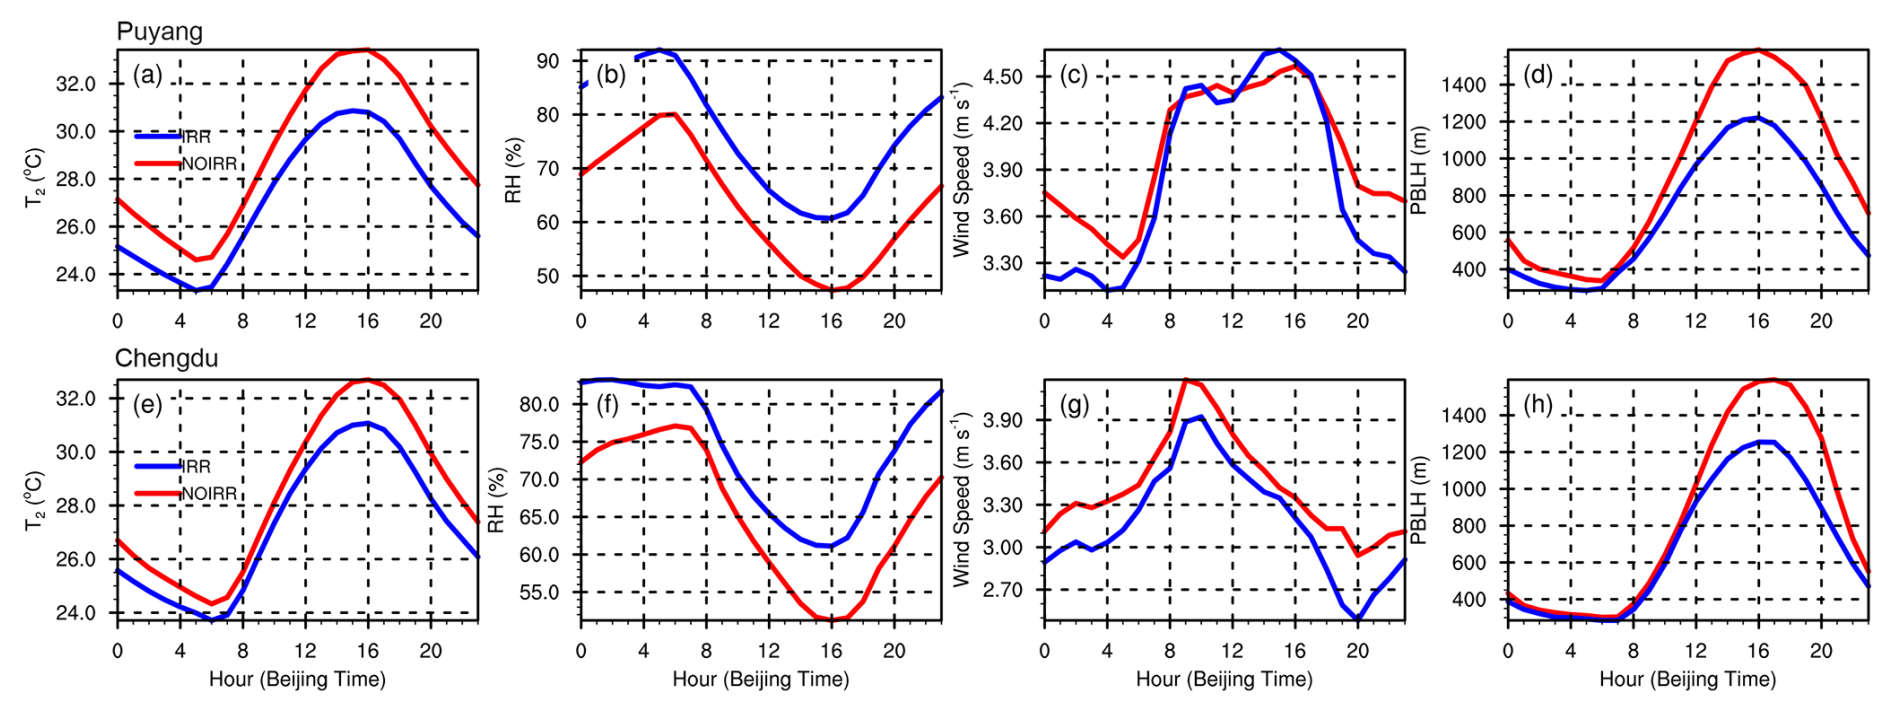
Figure 5Diurnal cycles of (a, e) T2, (b, f) RH, (c, g) 10 m wind speed, (d, h) PBLH from IRR and NOIRR in (a–d) Puyang and (e–h) Chengdu averaged over the summer of 2017.
To compare the diurnal variations and vertical profiles of the changes in meteorological conditions and air pollutants in intensively irrigated areas, we selected two typical cities, Puyang and Chengdu, which possess the largest irrigation fraction and witness the most evident changes in meteorological conditions in the NCP and SCB (Figs. 1a and 4), respectively. Figure 5 shows the diurnal cycle of meteorological conditions from IRR and NOIRR in the two cities. In NOIRR, T2 and PBLH reach a maximum at 15:00–16:00 BJT, but RH drops to a minimum in these two cities around the same time. In Puyang, strong wind speeds occur at 15:00–16:00 BJT, while in Chengdu they occur at 09:00–10:00 BJT. When irrigation is considered, the reduction in T2 and increase in RH are obvious throughout the whole day with the remarkable changes reaching up to −2.5 °C and 16 %, respectively, during their peak time in Puyang. Similar changes are also seen in Chengdu but with comparatively smaller values (−1.6 °C and 10 %, respectively). The reductions in wind speed and PBLH mainly occur at midnight and in the afternoon, respectively, with the changes reaching 0.2–0.5 m s−1 and 400 m in these two regions.
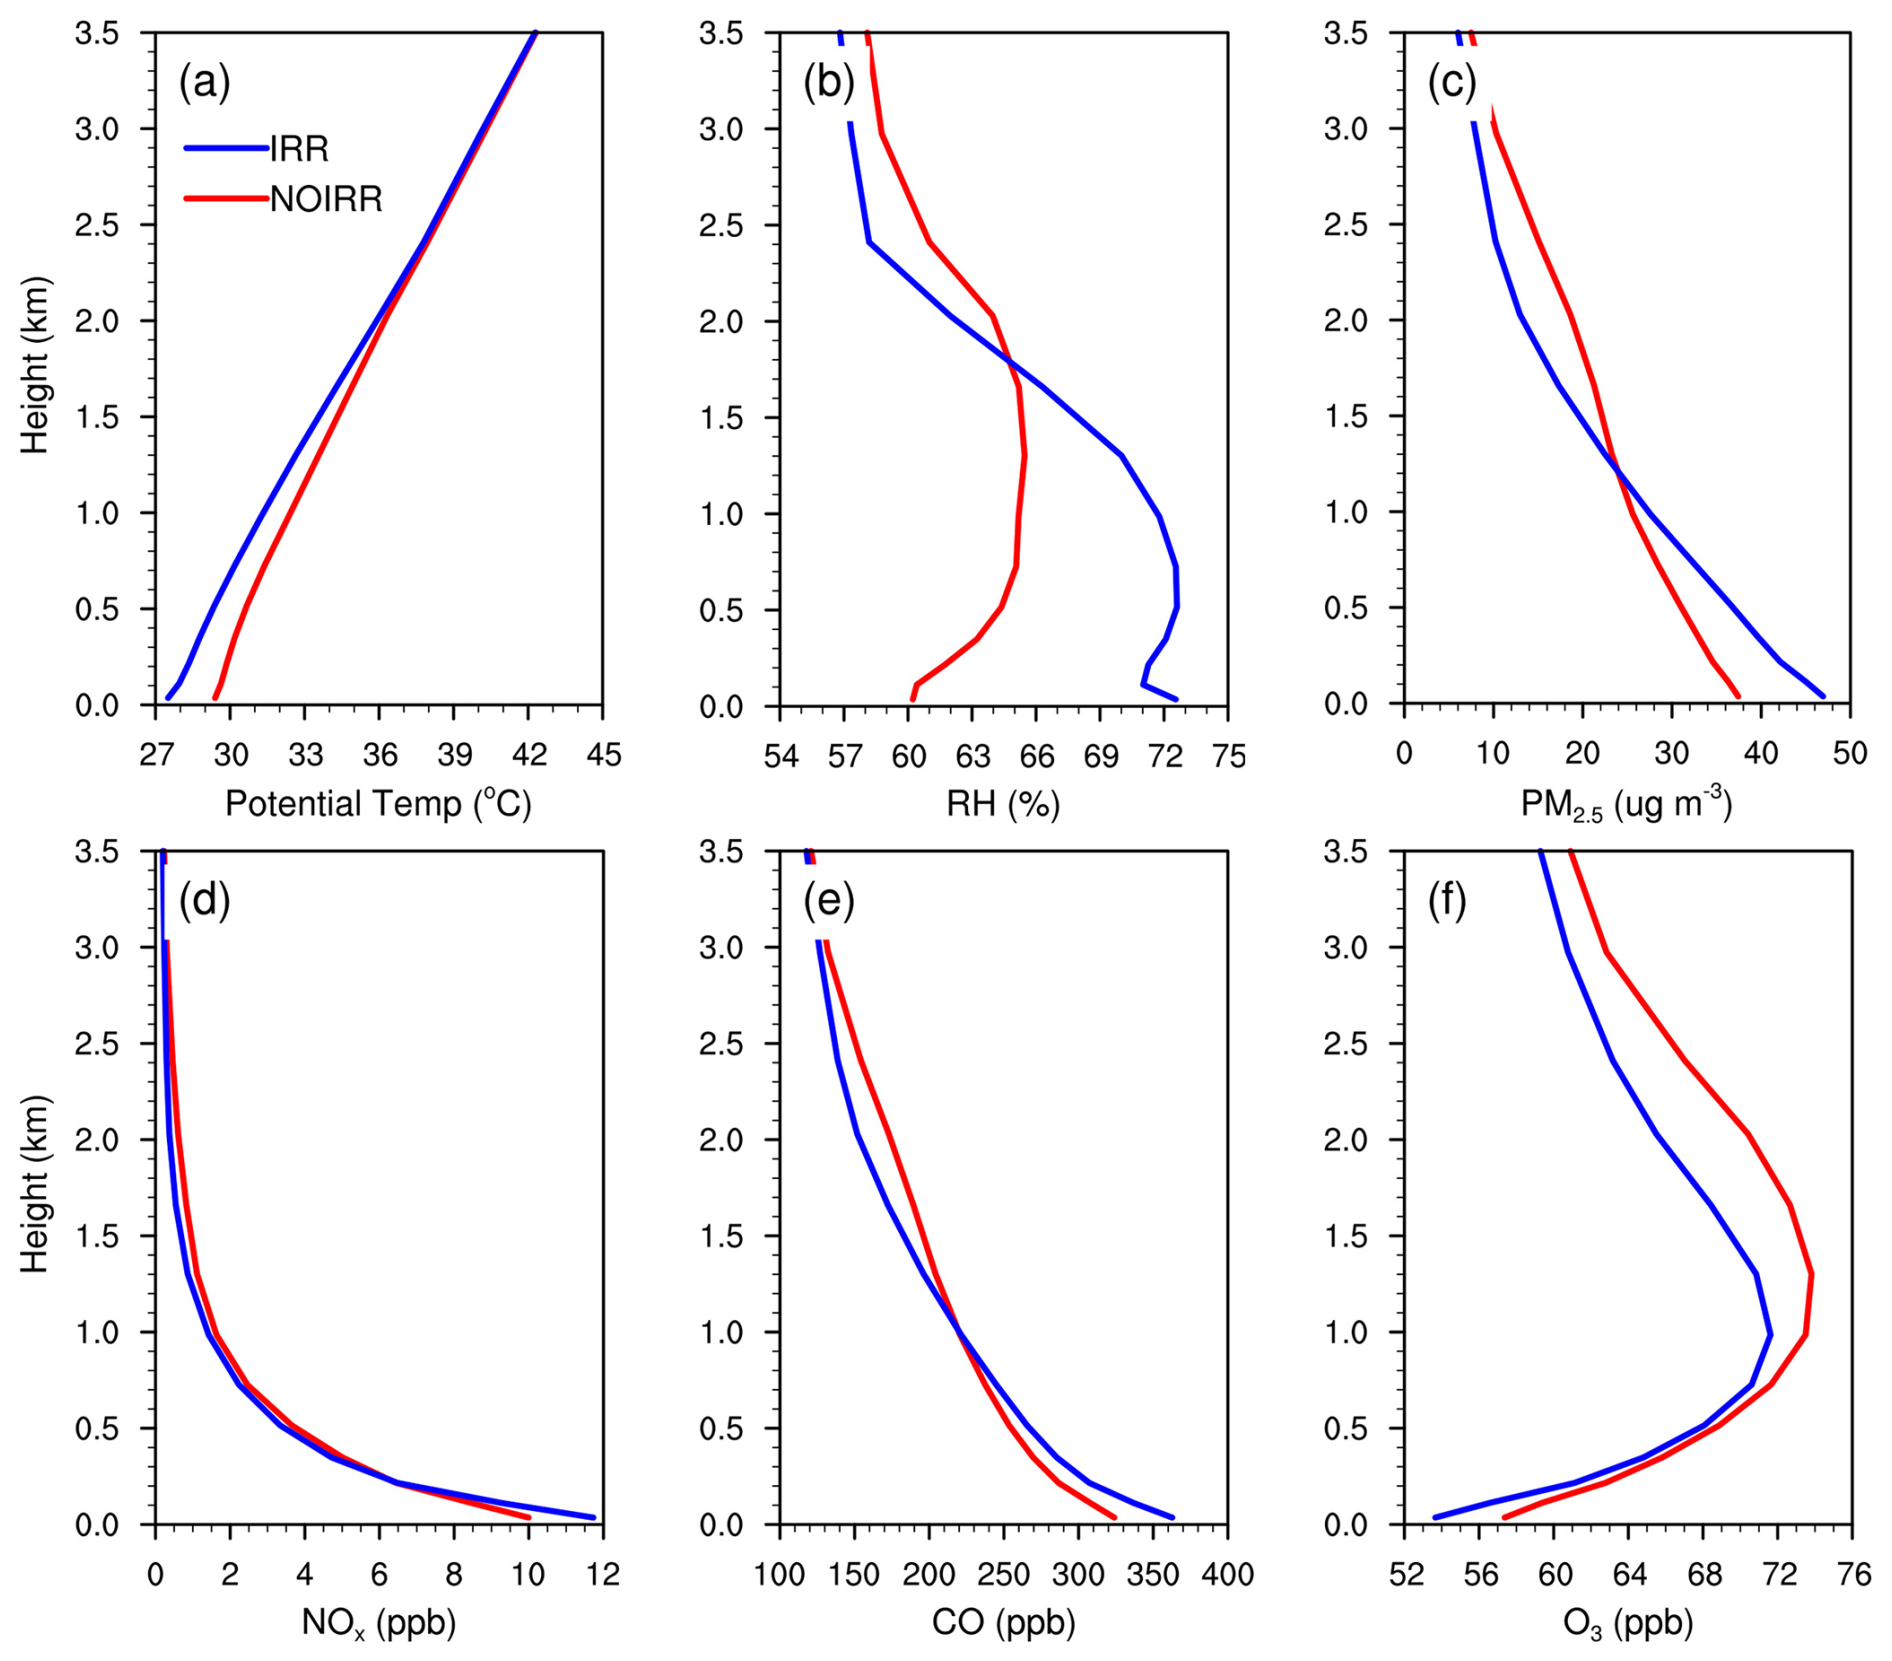
Figure 6Vertical profiles of daily mean (a) potential temperature (°C), (b) RH (%), (c) PM2.5 (µg m−3), (d) NOx (ppb), (e) CO (ppb) and (f) O3 (ppb) from IRR and NOIRR in Puyang averaged over the summer of 2017.
Figure 6 displays the vertical profiles of daily average meteorological fields and pollutants in Puyang. Irrigation strongly lowers the potential temperature but increases RH below 1.7 km by up to 2 °C and 12 %, respectively, making the slope of potential temperature with height steeper and thus stabilizing and moistening the boundary layer greatly (Fig. 6a, b). Additionally, the RH in IRR is reduced slightly over the altitude of 1.7 km in comparison to the NOIRR because of the more stable atmosphere. Chengdu is influenced by irrigation slightly with variations of up to −1 °C and 4 % in potential temperature and RH (Fig. S4a, b). Consequently, a more stable, moister, cooler and shallower boundary layer is formed over all irrigated areas and adjacent non-irrigated areas. Overall, irrigation has substantial effects on daytime temperature and PBLH, as well as nocturnal wind speed, whereas the effects on RH are comparable during daytime and nighttime.
3.3 Impacts of irrigation on gaseous pollutants
The variations in meteorology may further modify the formation and fate of air pollutants. Figure 7 demonstrates the irrigation-induced changes in surface gaseous pollutants. The shallower atmospheric boundary layer and lower wind speed induced by irrigation weaken the dispersion and trap primary pollutants in the PBL. Specifically, irrigation increases surface NOx by 2 ppb (20 %), CO by 40 ppb (16 %) and propane (C3H8) (a species of anthropogenic VOCs) by 1 ppb (20 %) over irrigated areas in the NCP and SCB. However, the mean surface O3 experiences an overall decline over the irrigated areas, with the largest decrease of 3–4 ppb (6 %–8 %) occurring in northern Henan province. Such changes become smaller as the irrigated areas stretch to Hebei and Shandong in the NCP. The SCB, on the other hand, only witnesses a slight increase (0–2 ppb) in surface O3, but the negative changes are found in its surrounding regions and central China where irrigated areas are scarcely scattered. Moreover, irrigation reduces atmospheric oxidation capacity, as evidenced by the decreases in oxidants (HOx) and O3. The dry deposition velocity of O3 is also reduced in irrigated areas. Regarding the vertical profiles, irrigation increases O3 precursors including NOx and CO near the surface but decreases them above 1 km, while O3 is reduced greatly from surface to 3.5 km in Puyang, with a reduction of 4 ppb near the surface (Fig. 6d–f). Irrigation lowers the altitude of maximum O3 by around 300 m. A similar pattern is also found in Chengdu, although the variation in O3 below 1 km is relatively small (Fig. S4d–f). Li et al. (2016) pointed out that surface O3 has small variations in irrigated areas but rises by 2–7 ppb in surrounding non-irrigated areas in Central Valley of California, which is different from our results. This discrepancy could be attributable to the more intensive irrigation in their study, leading to stronger divergence and transport of O3 precursors to the surrounding areas.
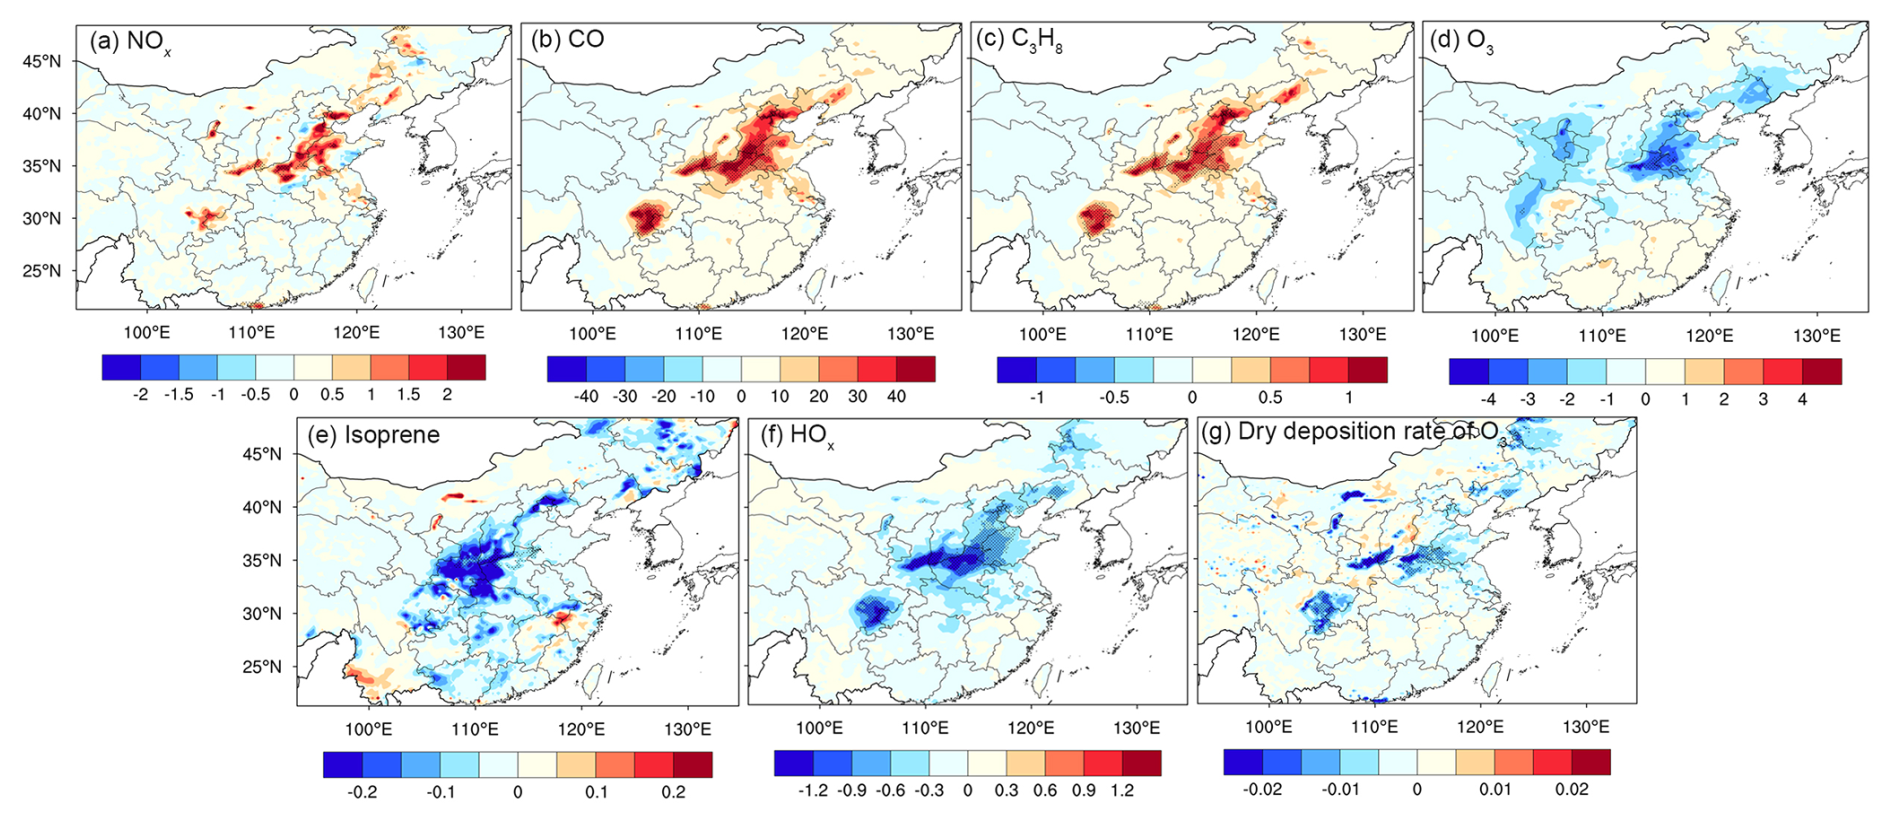
Figure 7Same as Fig. 4 but for (a) NOx, (b) CO, (c) propane (C3H8), (d) O3, (e) isoprene (ppb), (f) HOx (ppt) and (g) dry deposition velocity for O3 (cm s−1).
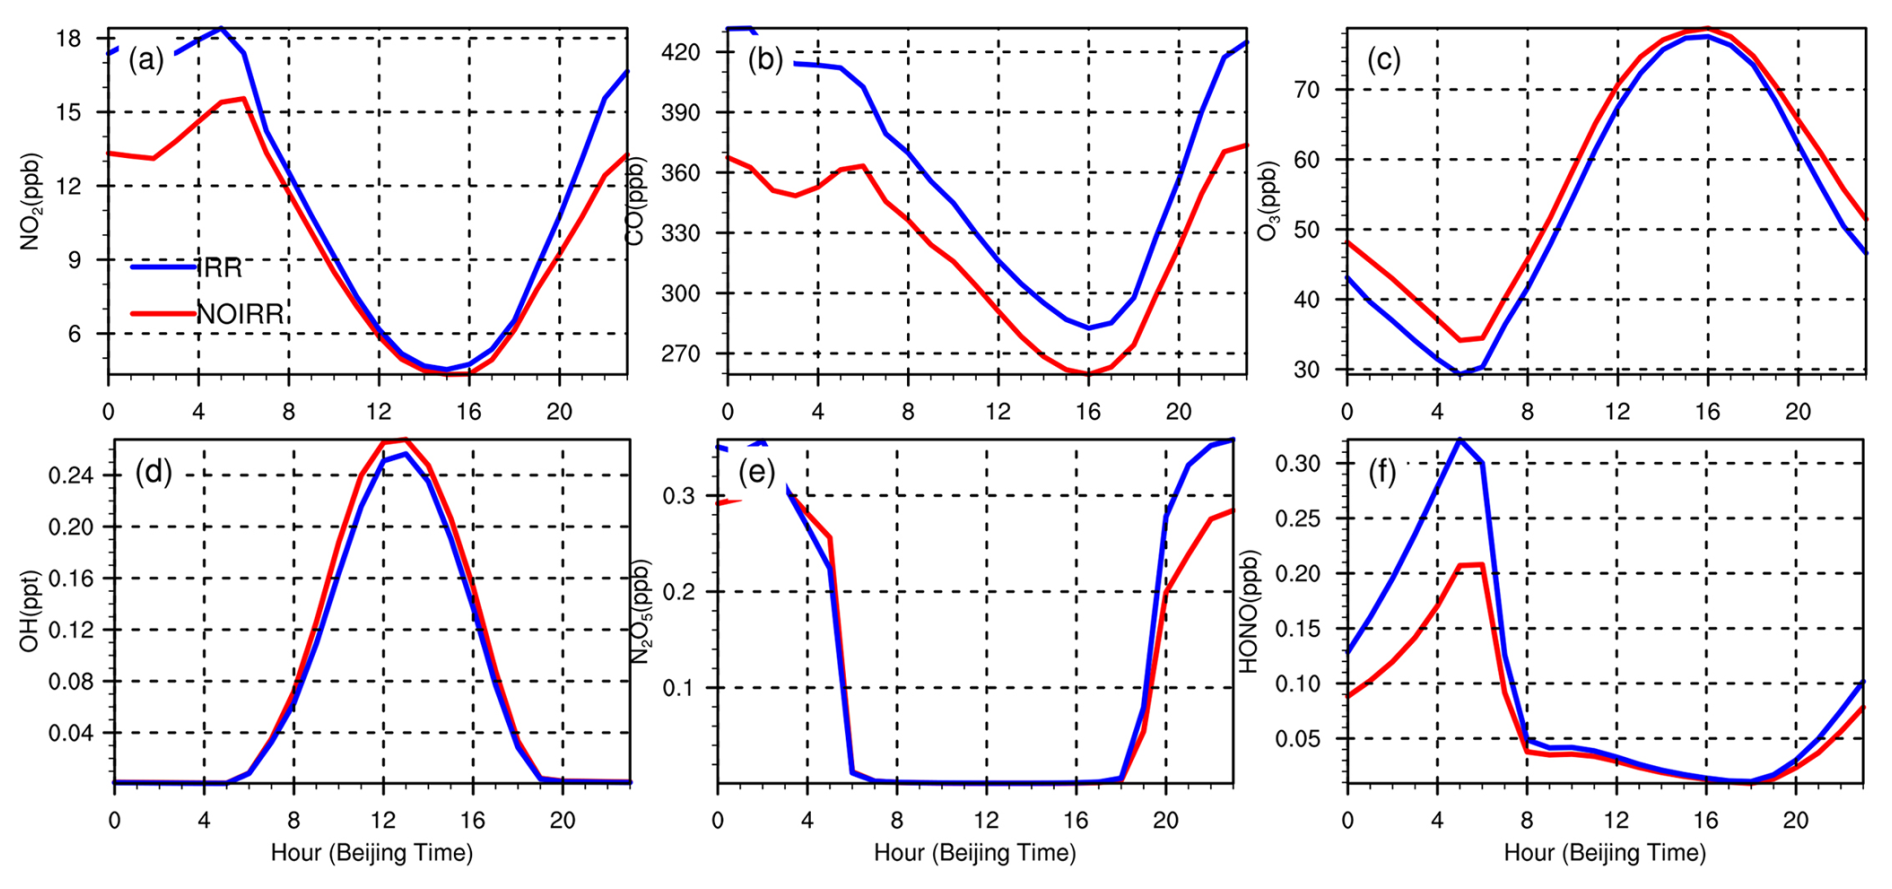
Figure 8Same as Fig. 5 but for NOx (ppb), CO (ppb), O3 (ppb), OH (ppt), N2O5 (ppb) and HONO (ppb) in Puyang.
Figure 8 exhibits the diurnal cycle of gaseous pollutants averaged over the summer. While irrigation has a stronger cooling effect in the afternoon, the most significant variations in these air pollutants occur at night with increases of 4 and 60 ppb in NO2 and CO, respectively. The reduction in surface O3 reaches a maximum of 5 ppb during 00:00–06:00 BJT and a minimum of 2 ppb in the afternoon. Some other secondary pollutants such as N2O5 and HONO show drastic increases at night, implying a distinct nocturnal chemistry. For the most crucial oxidant, OH, which mainly appears at daytime in the presence of sunlight, the decrease due to irrigation reaches the peak at noon and is relatively smaller during morning and afternoon.
Meteorological variations play a significant role in tropospheric O3 formation and removal through natural emission pathways and chemical processes (Lu et al., 2019). Using models and observations, considerable research has suggested that temperature and RH are two principal factors influencing tropospheric O3, but with opposite effects (e.g., Chen et al., 2019; Qian et al., 2022). Therefore, modified meteorology may influence the biogenic emissions, modulating photochemical production of O3 (Ren et al., 2022). However, we found that there is a small and insignificant reduction in isoprene in the NCP and SCB, indicating its weak effect (Fig. 7e). Conversely, high water vapor has been found to enhance O3 loss via more complex pathways such as by participating in the formation of HOx directly and slowing photochemical production via increasing cloud cover (Jacob and Winner, 2009; Han et al., 2020a). Moreover, since the reaction of NO2 + OH is an important pathway for O3 removal in high-NOx environments (Wang et al., 2017), the elevated total NOx concentration is likely responsible for daytime reduction in O3 and OH (Fig. 8). The NO titration might also be enhanced under high NOx concentration in IRR. At night, the elevated NO2 and RH promote the formation of N2O5 and HONO through O3 oxidation and NO2 hydrolysis, respectively, causing a drastic decline in O3 (Fig. 8c). Li et al. (2019) elucidated that a reduction in heterogeneous uptake of HO2 onto aerosol surface because of the decrease in PM2.5 exacerbates O3 pollution in the NCP. Thus, the increases in PM2.5 induced by irrigation may enhance the heterogeneous uptake process and hence slow down O3 production. Overall, we can exclude the influence of dry deposition rate of O3 given its reduction (Fig. 7g), which should have raised O3 instead of lowering it, and the high NOx due to weak mixing might be the major contributor to the reduction in O3 through oxidant titration (NO + O3 and NO2 + OH). On the other hand, the declines in O3 in both Puyang and Chengdu above the PBL can be attributable to the reductions in temperature (Figs. 6a and S4a) and concentrations of precursors induced by irrigation (Figs. 6d, e and S4d, e). Further research efforts are warranted to better understand and quantify the individual contributions of these processes to irrigation-induced O3 changes.
3.4 Impacts of irrigation on PM2.5 and its components
Meteorological conditions such as high RH, low PBLH and weak wind speed also play essential roles in facilitating the accumulation and formation of PM2.5 (Zhang and Cao, 2015; Chen et al., 2020). Particularly, humidity is positively correlated with PM2.5 in the NCP due to the favorable conditions for aqueous-phase aerosol chemistry, while the correlation is negative in the Pearl River Delta and Yangtze River Delta, given the dominant role of wet deposition in relation to precipitation in South China (Wang et al., 2023; Zhai et al., 2019). Figure 9 illustrates the differences in PM2.5 and its components between IRR and NOIRR. The corresponding relative percentage changes are shown in Fig. S5. Irrigation increases PM2.5, nitrate, sulfate, ammonium, SOA and BC by around 12 (28 %), 4 (70 %), 0.6–0.8 (10 %–20 %), 1.2–1.6 (40 %), 1.2 (12 %–16 %) and 4 µg m−3 (15 %–20 %) in both the NCP and the SCB, respectively. Regarding the vertical profiles, PM2.5 in Puyang and Chengdu mainly peaks at 47 and 58 µg m−3 near the surface in IRR, respectively, approximately 9 and 6 µg m−3 higher than that in NOIRR (Figs. 6c and S4c). Notably, the RH at 60 %–80 %, which is also seen in IRR (Fig. 5b, f), favors multiphase chemistry (i.e., heterogeneous and aqueous reactions) for secondary aerosol formation and hygroscopic growth, such as aqueous oxidation of SO2, aerosol uptake of NO2, heterogeneous uptake of HO2 and N2O5 hydrolysis (An et al., 2019; Tie et al., 2017; Sun et al., 2018). Therefore, the increase in PM2.5 components above is the total contribution from physical and chemical processes. It should be noted that the increase in SOA is primarily due to physical processes, because SOA formulation in our model is only related to CO, isoprene and other VOC emissions with no detailed SOA chemistry.
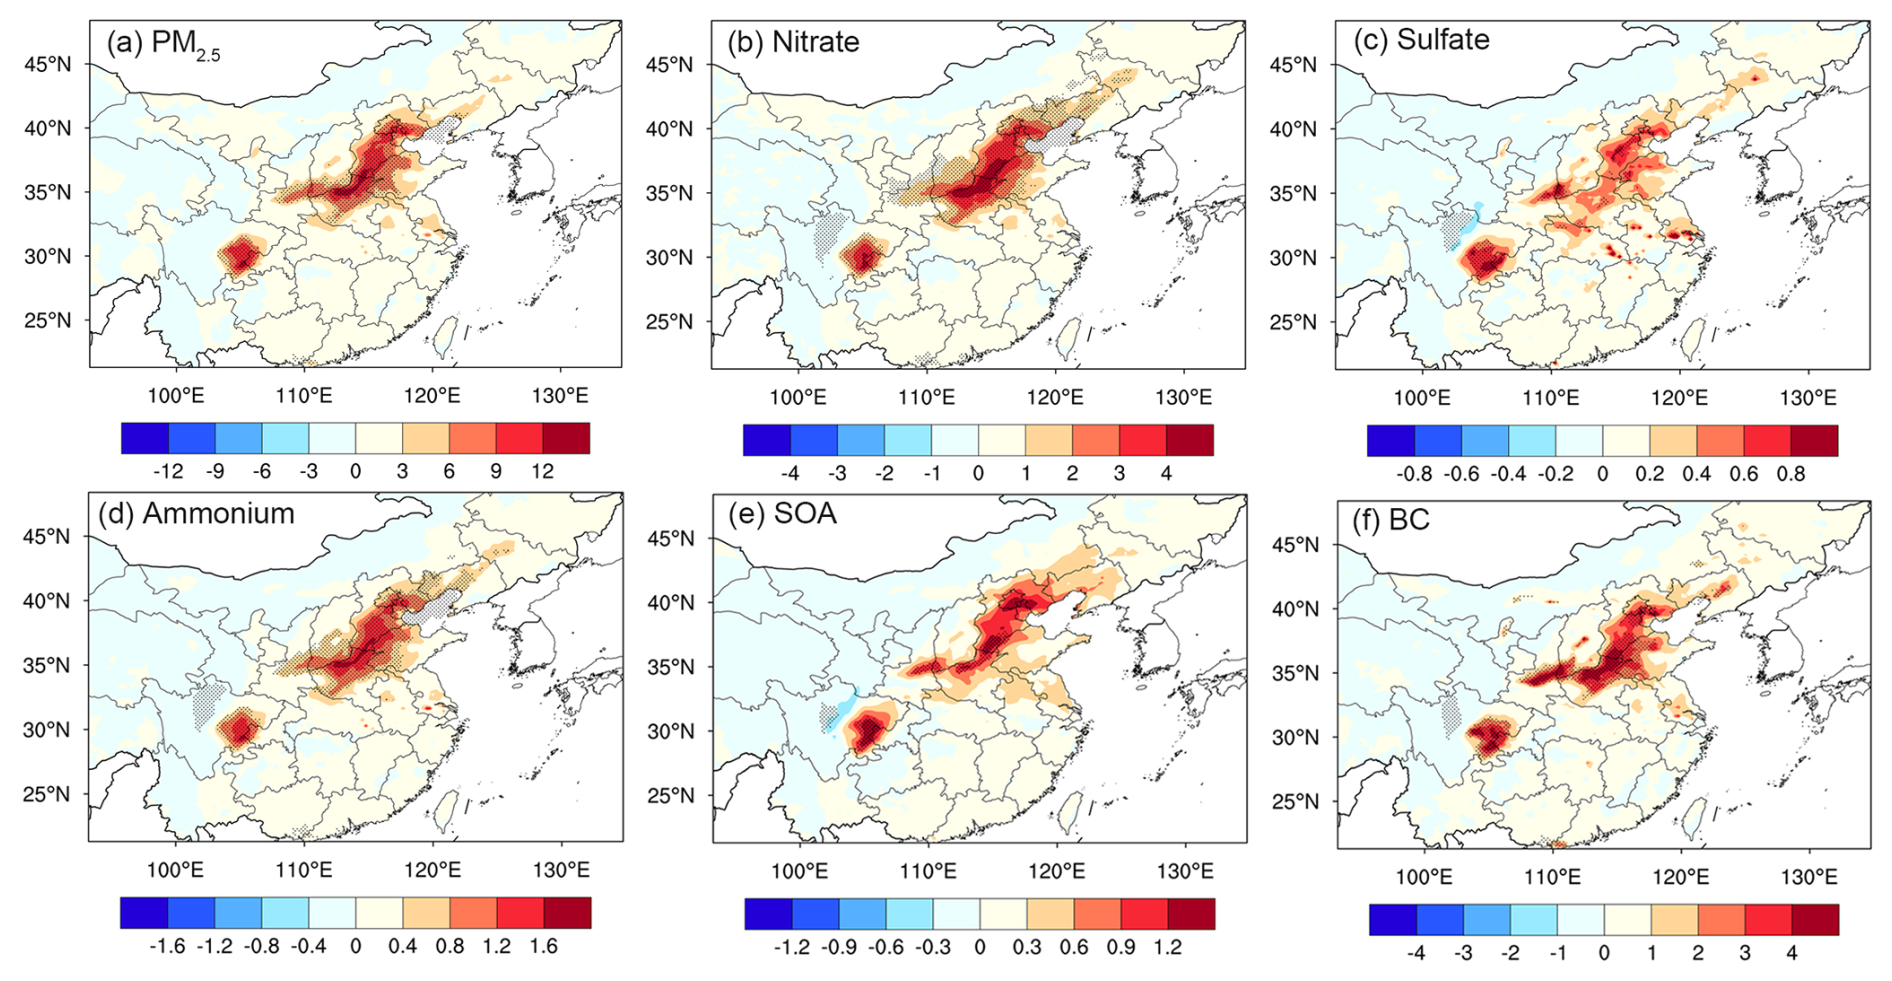
Figure 9Same as Fig. 4 but for (a) PM2.5, (b) nitrate, (c) sulfate, (d) ammonium, (e) SOA and (f) BC (µg m−3).
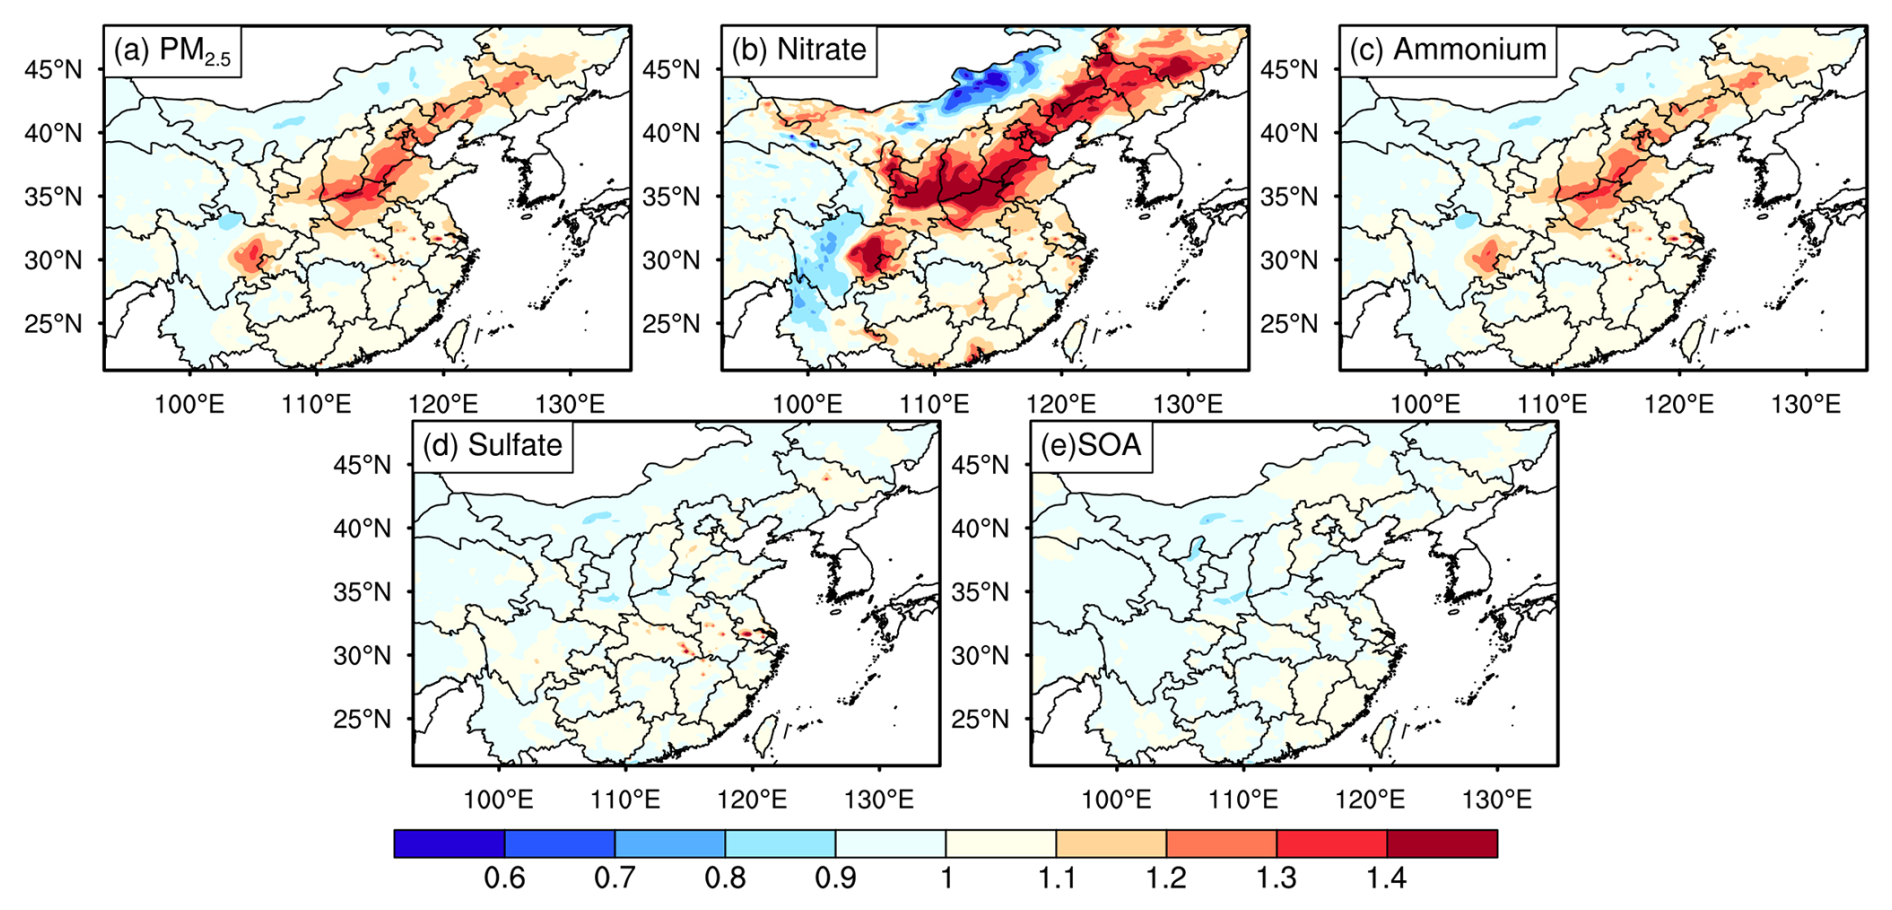
Figure 10Spatial distribution of the ratio of (a) PM2.5 and (b–e) secondary PM2.5 (sulfate, nitrate, ammonium and SOA) versus BC between the IRR and NOIRR, i.e. (PM2.5 BC)IRR (PM2.5 BC)NOIRR averaged over the summer of 2017.
To examine the contribution of chemical processes, we followed the approach of Huang et al. (2021) using the ratio of secondary PM2.5 (i.e., nitrate, sulfate, ammonium, SOA) versus BC between IRR and NOIRR, i.e., (PM2.5 BC)IRR (PM2.5 BC)NOIRR (Fig. 10). The basis is that BC is a primary aerosol, and the changes in BC induced by irrigation can be approximately regarded as the contribution of physical processes. Thus, aerosol formation is enhanced if the ratio is larger than unity, while it is weakened if the ratio is below one. As shown in Fig. S5, the relative increases in BC are around 15 %–20 % (i.e., contribution from physical process). Secondary formation of PM2.5 and ammonium are enhanced over NCP and SCB with the ratio ranging from 1.1 to 1.3 (Fig. 10a, c). Sulfate can be generated from the gas-phase oxidation of SO2 by OH and aqueous oxidation by hydrogen peroxide (H2O2) and O3. The ratio, which is close to one, suggested that the formation of sulfate is less evident and even suppressed (Fig. 10d), due to the decline in HOx and O3 (Fig. 7). As expected, there is no formation of SOA because of the lack of detailed SOA chemistry in response to irrigation (Fig. 10e). By comparing the differences in the relative changes in secondary aerosols and BC between IRR and NOIRR (i.e., subtracting the fractional changes in BC from the fractional changes in other aerosol species), we can approximately estimate the contributions of secondary formation to the increases in PM2.5 (Fig. S6), which are around 5 %–10 %, ∼ 60 %, 10 %–30 % compared to the total increases in PM2.5, nitrate, and ammonium, respectively, while it is negligible for sulfate and SOA.
Figure 11 demonstrates the diurnal cycle of relative changes in PM2.5 due to secondary formation induced by irrigation at Puyang. Nitrate formation remains at a high level during daytime, with two peaks occurring at 13:00 and 19:00 BJT, respectively, while it is relatively lower during nighttime. The enhanced production throughout the day suggests the dominance of the reaction of daytime NO2 + OH and nighttime N2O5 hydrolysis, which are two major formation pathways for nitrate (Alexander et al., 2020). This is supported by the drastic increase in N2O5 during nighttime and the decline in OH during daytime, driven by the elevated concentration of NO2 in IRR (Fig. 8). Apart from the chemical production, the cooling effect of irrigation during daytime can inhibit the transition of nitrate from the particle phase to the gas phase, which reduces the nitrate loss and is another possible driver for the drastic increase in nitrate during daytime. Moreover, the increase in HONO indicates its essential contribution through NO2 hydrolysis to form HNO3 and HONO at high NOx levels (Fig. 8f; Xue et al., 2014; Alexander et al., 2020). Ammonium formation follows a similar trend to nitrate, with the maximum ratio reaching 40 % at daytime, because of the neutralization of HNO3 by NH3 to form ammonium nitrate. In general, irrigation enhances the formation of nitrate and ammonium by lowering the temperature and raising humidity. The contribution of the chemical pathways is almost triple that of the physical process for nitrate, but comparable for ammonium and PM2.5. The production of SOA and sulfate is not sensitive to irrigation. The enhancement of nitrate formation through the NO2 + OH and N2O5 hydrolysis in IRR is coinciding with the reduction in O3 and OH during daytime and nighttime as discussed in Sect. 3.3, respectively.
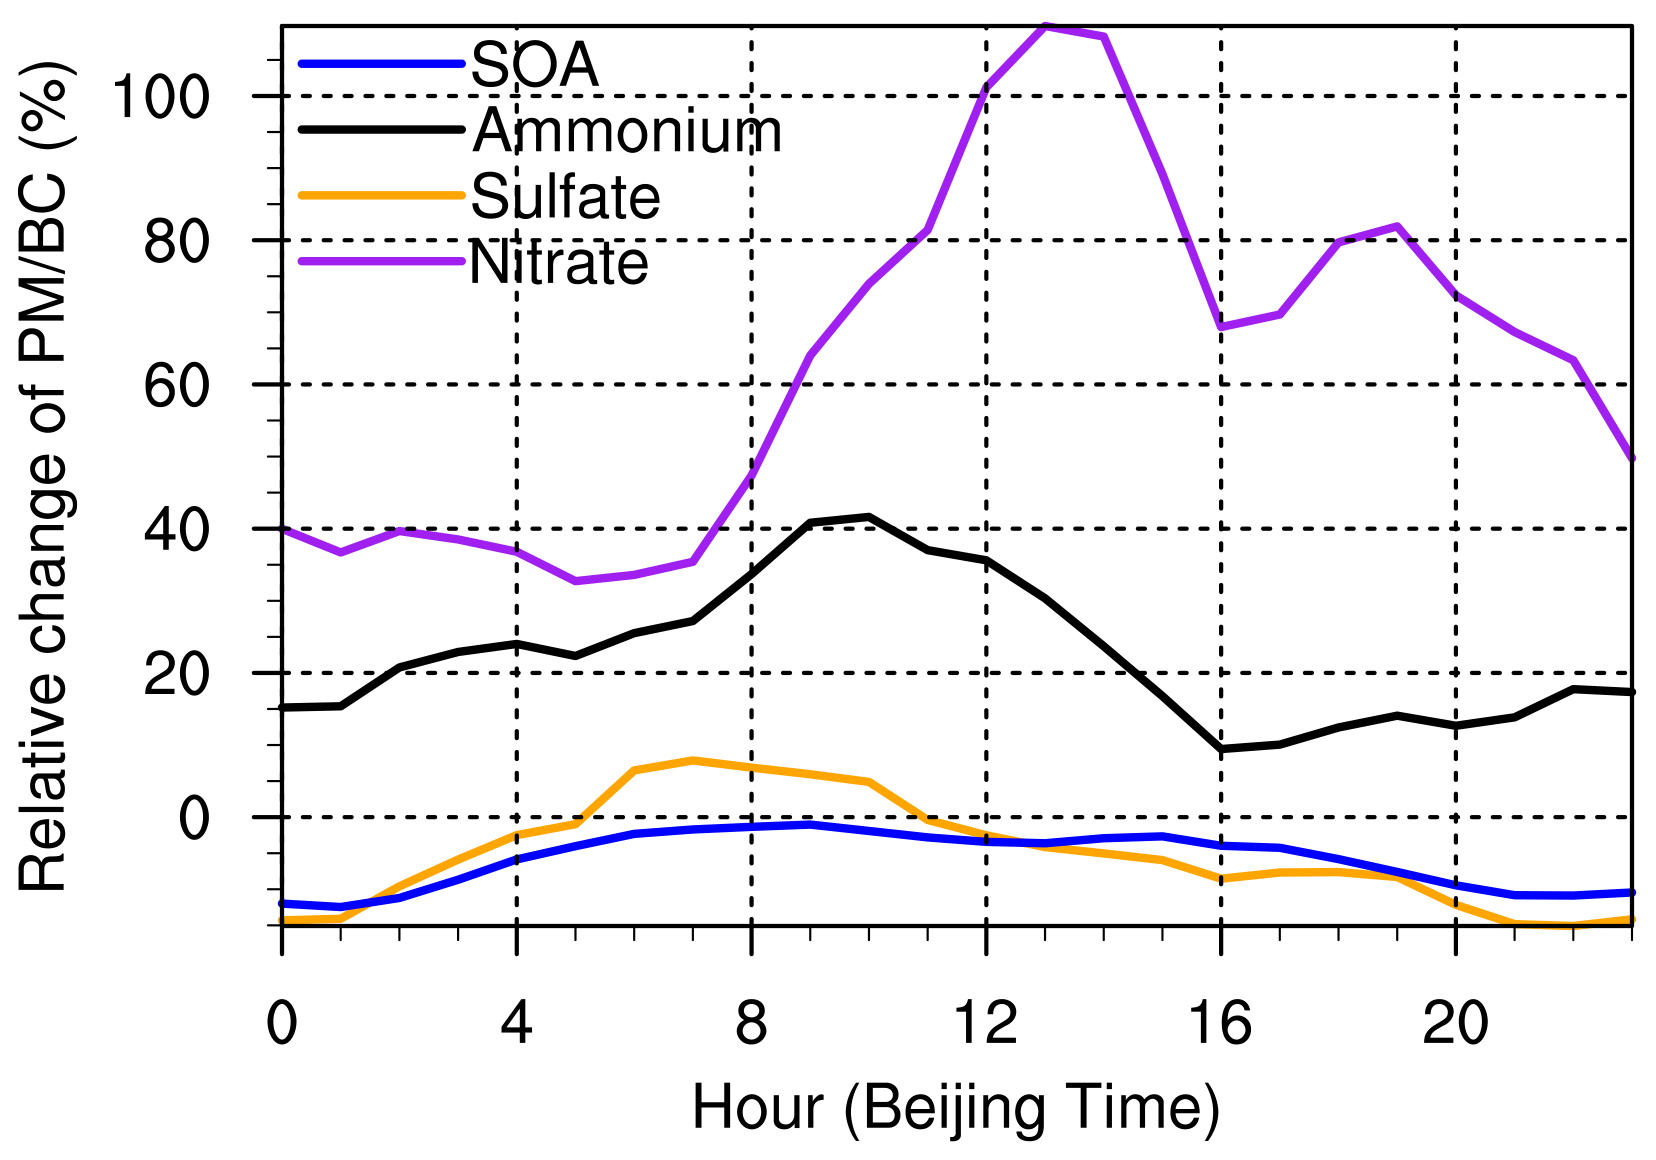
Figure 11Diurnal cycle of the relative changes (%) in the ratio of secondary PM2.5 components versus BC in IRR relative to NOIRR in Puyang averaged over the summer of 2017.
3.5 Emission control strategies to alleviate the deterioration of PM2.5 pollution by irrigation
Reducing nitrate is becoming a priority in China in recent years, as it dominates the chemical composition of PM2.5 in eastern China and shows relatively smaller decline compared with the total PM2.5 since the implementation of stringent emission control strategy in 2013 (Zhai et al., 2021; Sun et al., 2022). Through the above analysis, we found that irrigation increases nitrate and ammonium, which makes it even more challenging to reduce nitrate pollution. However, given that irrigation has been shown to mitigate both water stress and heat stress experienced by crops, and since it has been viewed as an effective way to buffer yield losses caused by future climate change (Abramoff et al., 2023; Liao et al., 2024), it is important to explore the suitable emission reduction strategies to alleviate nitrate pollution while keeping these irrigation benefits. Therefore, we designed four extra sensitivity experiments with 20 % and 50 % combined reductions in NOx and NH3 emissions and 50 % individual reductions in NOx and NH3 emissions, respectively. The effects of emission reductions on both aerosols and O3 can be estimated by comparing the extra sensitivity experiments with IRR, while the effects of irrigation on aerosols and O3 can be derived by comparing IRR with NOIRR. Figure 12 exhibits the irrigation benefits and percentage changes in nitrate and ammonium under different emission scenarios along with irrigation relative to IRR. Without irrigation, regional average nitrate is reduced by ∼ 28 % and 24 % in the NCP and SCB, respectively. Notably, the reduction in nitrate with 20 % combined emission in NH3 and NOx emissions is comparable to the abovementioned reduction in both regions in NOIRR, in comparison to IRR, which indicates that 20 % combined emission reductions can effectively offset the irrigation-induced increase in nitrate. The reduction in nitrate caused by 50 % combined emission reductions even doubles that in NOIRR in the two regions. However, individual reduction in NOx and NH3 emissions by up to 50 % only has half the benefit compared with 50 % combined reduction, implying the need for synergistic control of air pollution. Changes in ammonium are similar to those in nitrate except that it needs a 50 % individual reduction in NOx or NH3 emissions to totally offset the ammonium increase in IRR over both regions, and the 20 % combined emission reduction for ammonium mitigation is not as effective as that for nitrate mitigation (Fig. 13b).
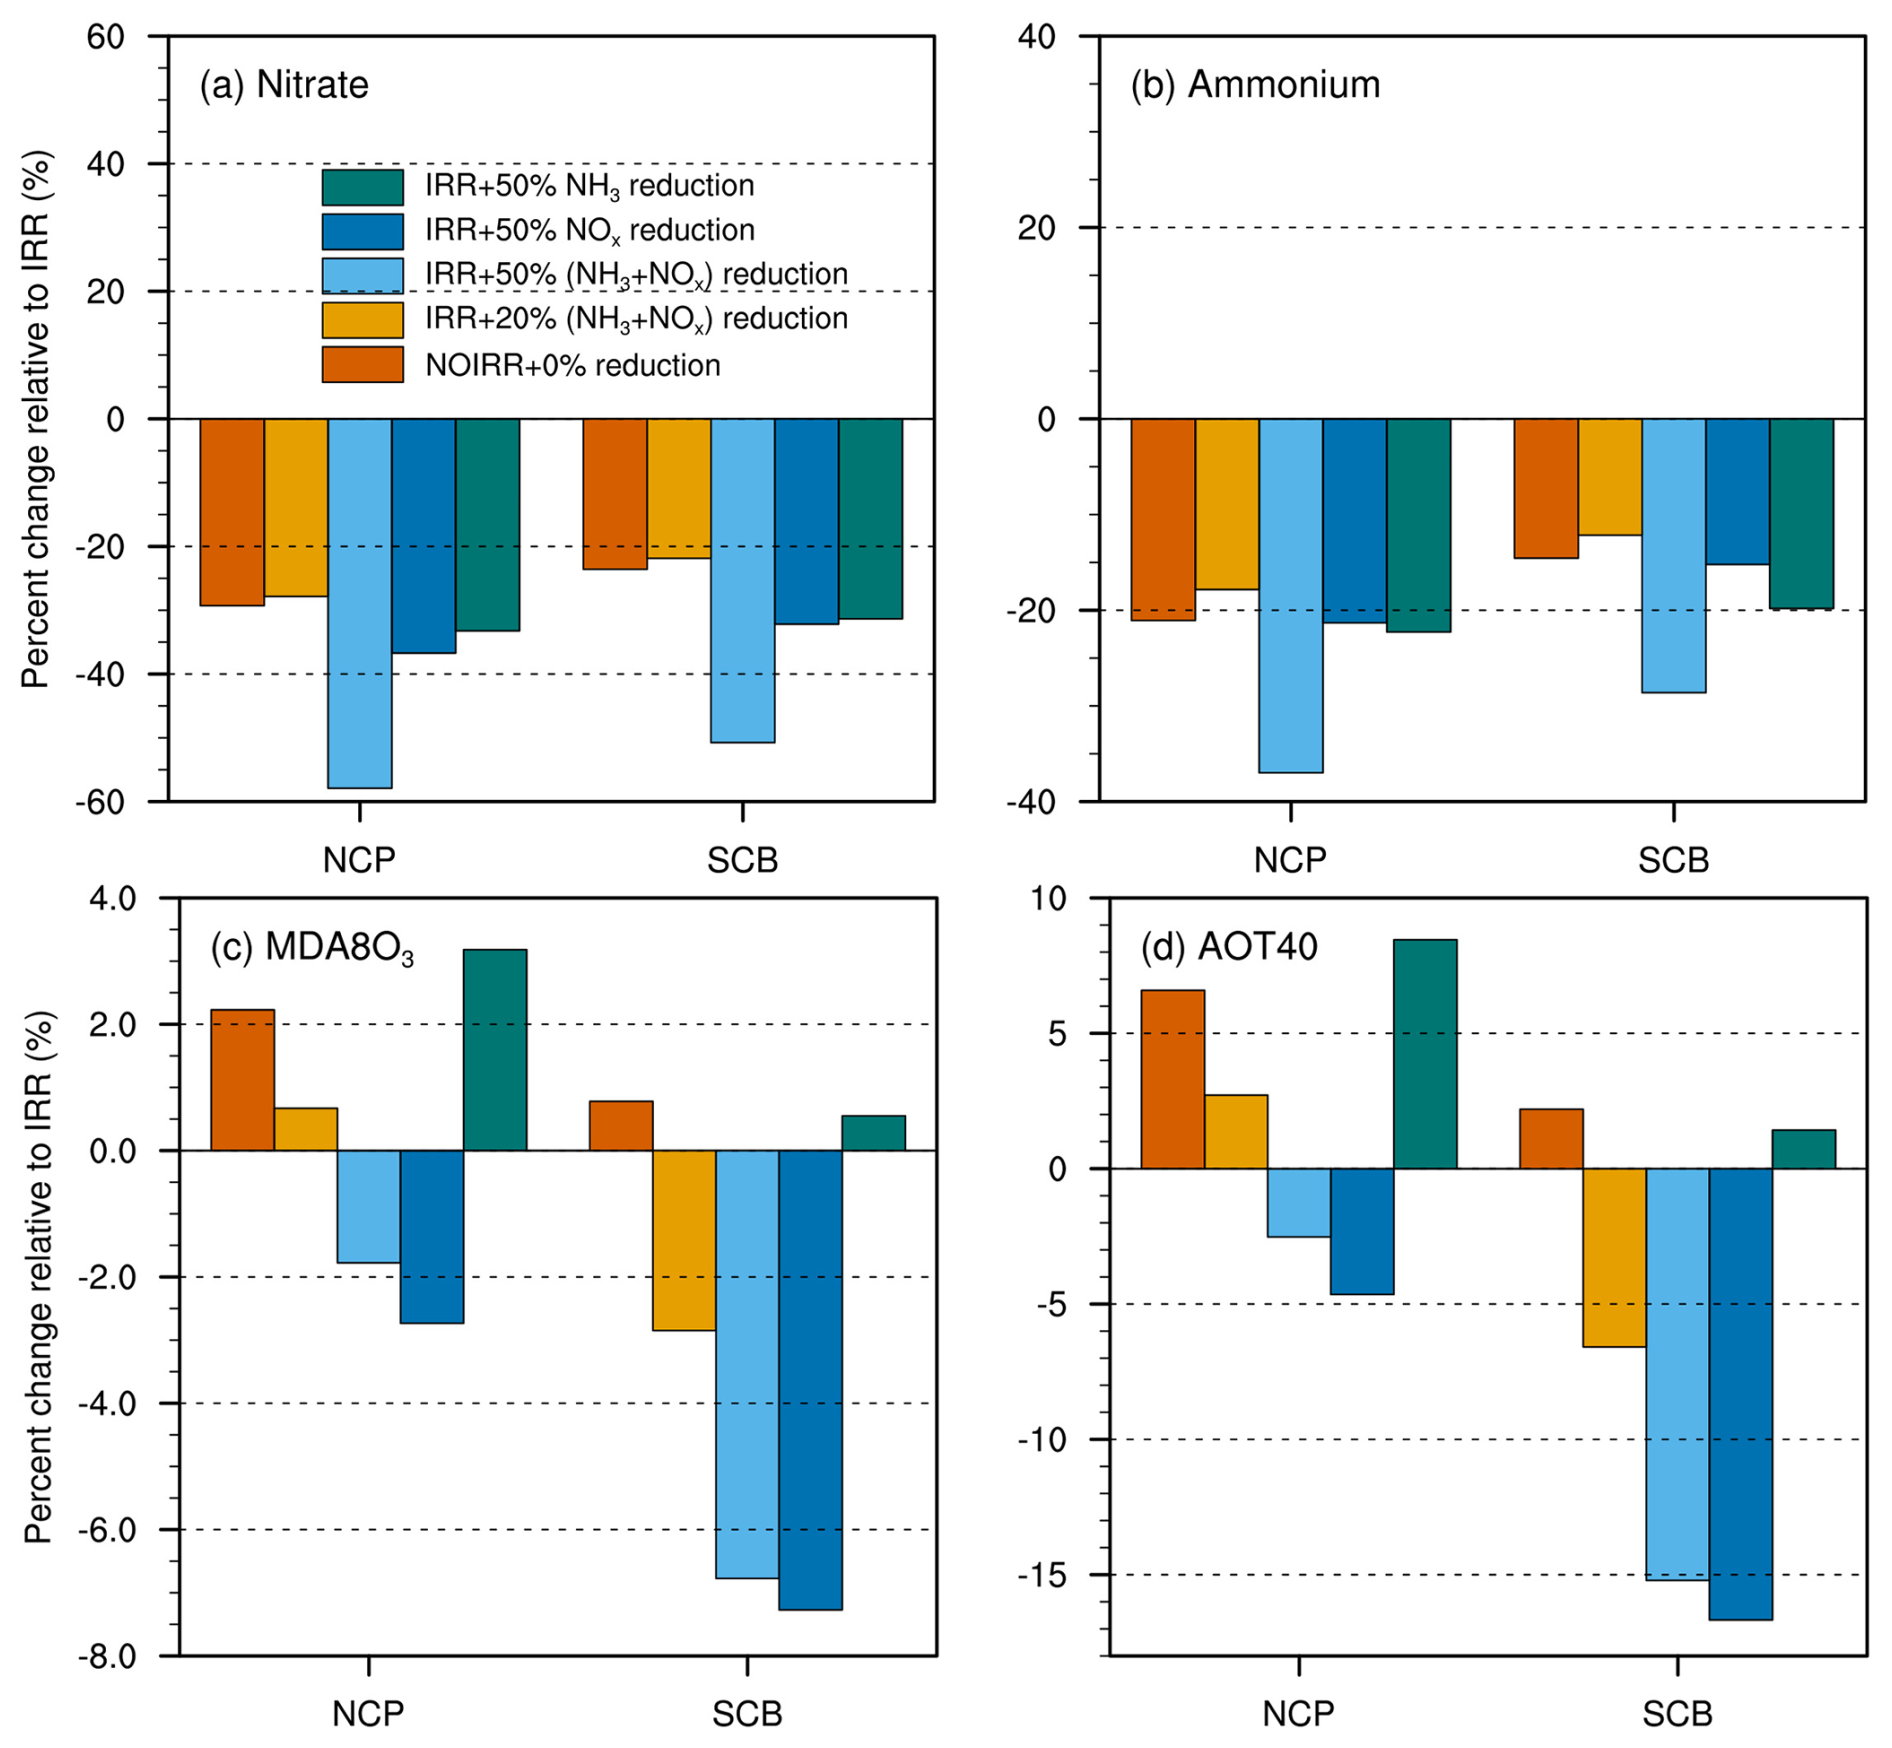
Figure 12Percentage changes in (a) nitrate, (b) ammonium, (c) maximum daily 8 h average O3 concentration (MDA8O3) and (d) accumulated surface O3 concentration over a threshold of 40 ppb (AOT40) in NOIRR and IRR with a 20 and 50 % combined reduction in NH3 and NOx emissions, respectively, as well as and 50 % individual emission reductions in NH3 and NOx, relative to IRR, averaged over the NCP and SCB during the summer of 2017.
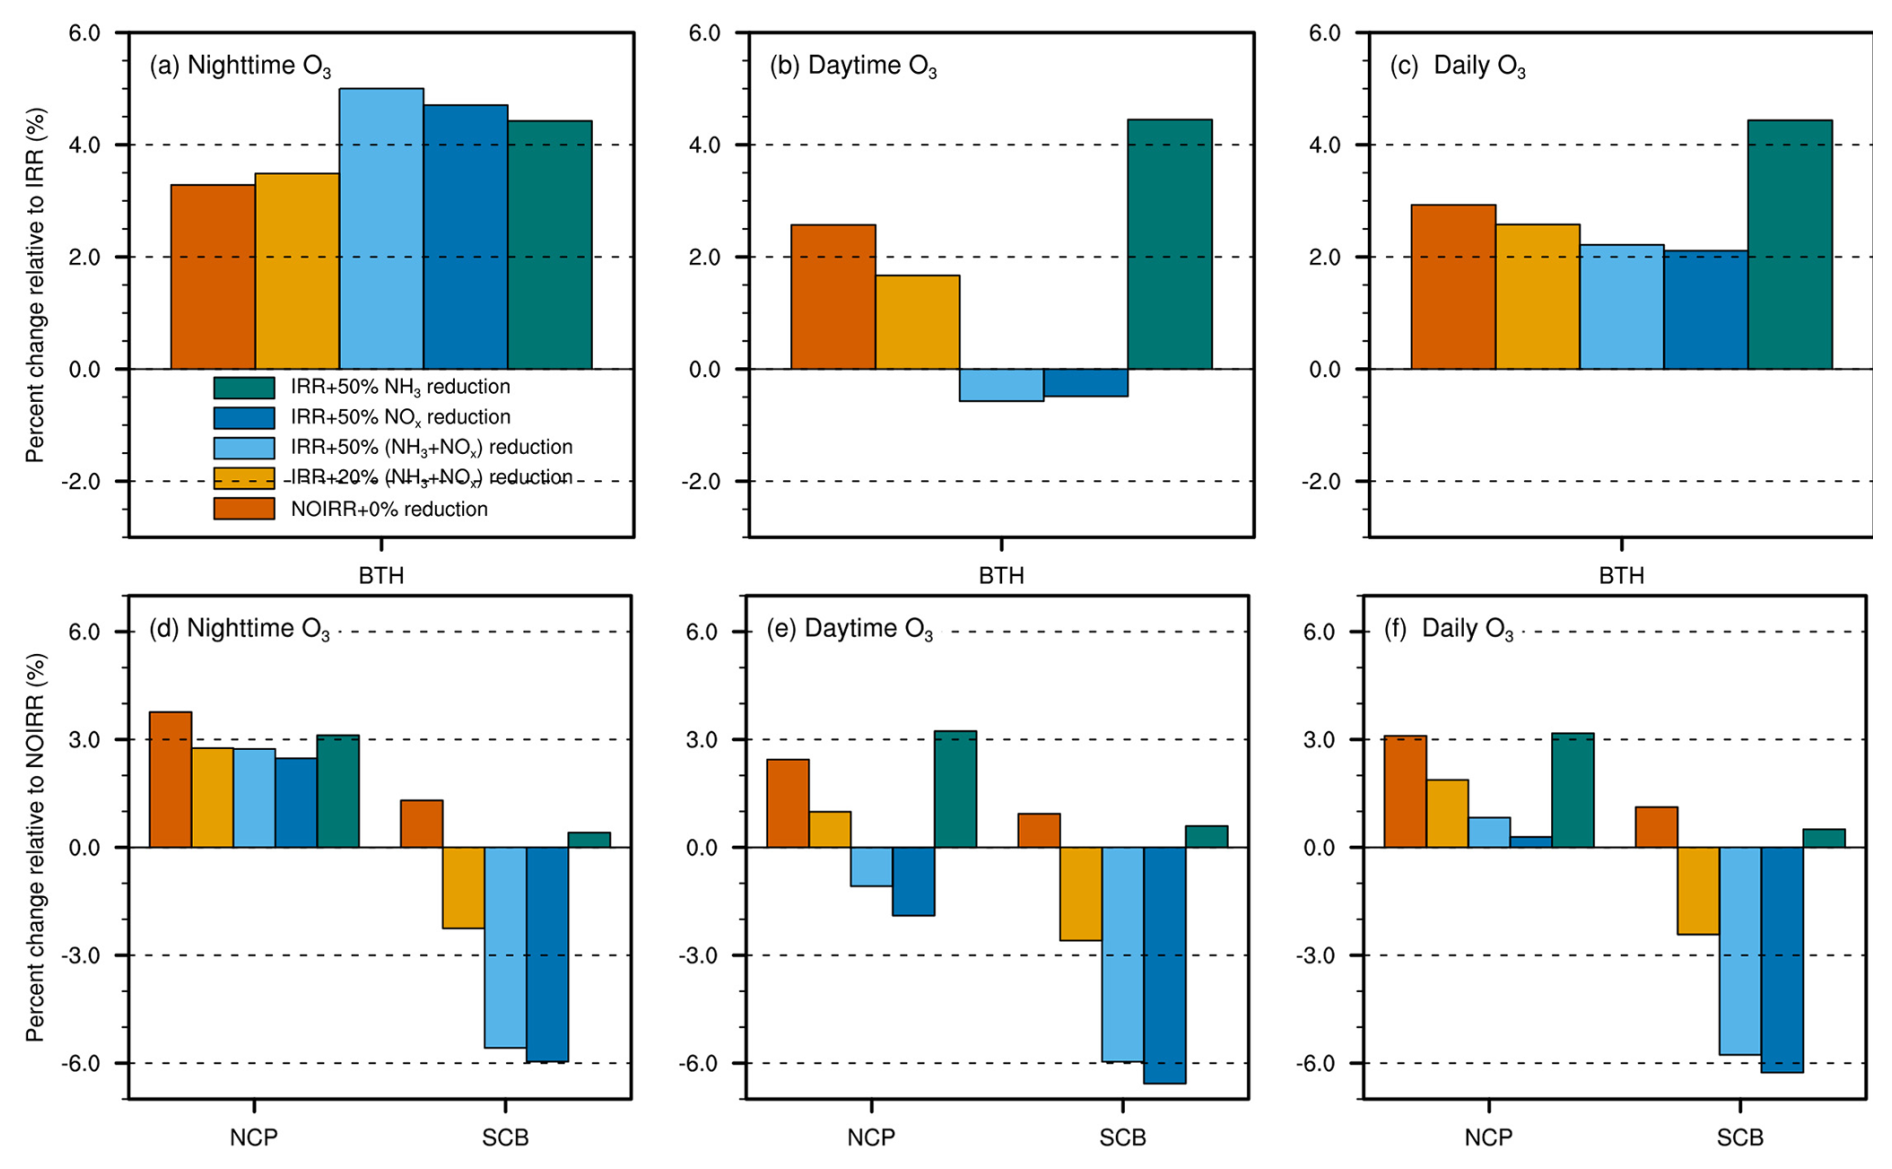
Figure 13Same as Fig. 12 but for nighttime, daytime and daily mean surface O3 in Beijing–Tianjin–Hebei (BTH), NCP and SCB.
Notably, although 50 % combined and individual reductions in NH3 and NOx emissions can strongly reduce nitrate and ammonium, the increase in nighttime O3 due to the weakened titration effect in large city clusters including the Beijing–Tianjin–Hebei (BTH) region, Yangtze River delta and Pearl River Delta should be recognized, while the decrease in O3 dominates the rest of other regions, reflecting nonlinear responses (Fig. S7). Such nonlinear responses of O3 have great ramifications for human health and crop yields. To evaluate these, the changes in MDA8 O3 and AOT40 (accumulated surface O3 concentration over a threshold of 40 ppb) in the summer of 2017 were utilized to evaluate the variations in human and crop exposure to O3 (Fig. 12c, d). Compared to IRR, NOIRR raises MDA8 O3 by 2.3 % and 0.8 % in the NCP and SCB, respectively. The reduction in MDA8 O3 under 20 % and 50 % combined emission reductions and 50 % NOx emission reductions along with irrigation relative to IRR substantially exceeds the abovementioned irrigation benefits, except for the slight degradation in MDA8 O3 in the NCP under 20 % combined emission reductions, suggesting the effectiveness of these strategies for O3 and PM2.5 controls. However, only reducing the NH3 emissions by 50 % may cause unintended consequences with the MDA8 O3 increasing by 2.3 % and 0.5 %, in the NCP and SCB, respectively. Similar changes are also seen in AOT40 under different sensitivity experiments, except that the responses of AOT40 to emission reductions are even larger than that of MDA8 O3. We thus show that irrigation can enhance crop growth not only by alleviating water and heat stresses, but also by reducing O3 exposure.
Figure 13 further shows the corresponding responses of O3 in daytime and nighttime. Taking the large megacity cluster of BTH as an example, excluding irrigation results in an increase of 3.3 % in nighttime O3, which is comparable to the increase in nighttime O3 under 20 % combined emission reductions along with irrigation relative to IRR. In other words, irrigation generally counteracts the rise in nighttime O3 due to NOx reduction with this emission reduction strategy. Regarding the 50 % combined and individual emission reductions, irrigation only cancels out 66 %–77 % of the nighttime O3 increase (Fig. 13a). By contrast, the 50 % combined and individual reductions in NOx emissions only reduce daytime O3 by 0.5 %, and irrigation solely reduces daytime O3 by 2.5 %, leading to a net benefit of 3 % (Fig. 13b). Even though the 20 % combined reductions raise daytime O3 by 1.7 %, irrigation fully reverses this situation, leading to a net decrease by 0.8 %. For daily average O3, irrigation still completely counteracts the O3 increase in all scenarios except the 50 % individual reduction in NH3, with the contribution of 111 %–138 % (Fig. 13c). The 50 % NH3 emission reduction leads to the largest increase in daytime O3 (4.4 %) among all experiments due to less neutralization with HNO3, exceeding the irrigation benefits (2.9 %) (Fig. 13b). Similar changes in daytime, nighttime and daily mean O3 are also seen in the whole NCP (Fig. 13d–e), except that irrigation benefits (3.8 %) exceed the nighttime O3 increases (∼ 3 %) due to emission reductions in the four scenarios (Fig. 13d). In the SCB, almost all emission reduction strategies reduce surface O3 substantially, regardless of daytime and nighttime, which is larger than the irrigation-induced reduction in O3. It is worth noting that 50 % combined reductions in both NOx and NH3 emissions and individual reductions in NOx emissions are the most effective in this region, followed by 20 % combined emission reductions, and only controlling NH3 emissions has the least efficiency.
Overall, we found that a 20 % combined reduction in NH3 and NOx emissions is an effective and feasible way to buffer the adverse effects of irrigation on nitrate and ammonium in the NCP and SCB, while leading to the smallest increase in nighttime O3 and O3 exposure to human health and crops. Although the 50 % combined emission reduction is more effective in reducing ammonium nitrate, it is more challenging to implement this stringent emission strategy and may lead to an increase in nighttime O3 in large city clusters. Our results are similar to previous modeling studies in which PM2.5 shows nonlinear responses to emission reductions, and the combined reduction in precursor emissions are more beneficial for nitrate reduction (Cheng et al., 2019; Zhai et al., 2021; Liu et al., 2021c).
China possesses the largest irrigated area of the world, and the expanding irrigated area has driven changes in many aspects of socioeconomic and environmental concerns, including in energy use and its related CO2 emissions, water resources, terrestrial emissions of pollutants and greenhouse gases (N2O and CH4), and regional climate (Yang et al., 2023). All of these would alter regional air quality through influencing emissions, transport and mixing, chemistry, and deposition. To reveal the possible underlying mechanisms, we implemented a new dynamic irrigation scheme into the WRF-GC model and found that it substantially reduces model biases for LST, topsoil moisture, air temperature, dew point temperature and wind speed in heavily irrigated areas in China. Irrigation substantially shapes boundary layer meteorology by raising RH and cloud cover as well as decreasing T2 and PBLH, which subsequently lead to an increase by 28 % (12 µg m−3) in PM2.5 and a decrease by 6 %–8 % (3–4 ppb) in surface O3. Reduced O3 also alleviates the O3 impacts on human health and crop yields, with MDA8 O3 and AOT40 decreasing by ∼ 2 % and 6.5 %, respectively, reflecting an additional pathway via which irrigation can promote crop growth.
The underlying mechanisms for the contrasting changes in PM2.5 and O3 were further examined. The reduction in O3 is more obvious during nighttime, which is associated with the enhancement of oxidant titration at elevated NOx concentration. During daytime, in addition to NOx titration, other mechanisms (such as enhanced O3 hydrolysis under higher atmospheric water vapor content, slower photochemical reactions due to lower temperature and more extensive cloud cover, and more heterogeneous uptake of HO2) might play additional roles as well. The components of PM2.5 show complex sensitivities to meteorological changes. Specifically, irrigation-induced high RH promotes nitrate formation through three major pathways, i.e., NO2 + OH, NO2 and N2O5 hydrolysis. Strong cooling at daytime suppresses the transition of nitrate from the particle to gas phase and thus reduces the nitrate loss. Ammonium is also enhanced through the neutralization of NH3 with HNO3, since high RH and low temperature facilitate the partitioning of gases to particles. By contrast, weak atmospheric oxidation capacity due to irrigation suppresses sulfate formation. Another important finding is that both weak dispersion and secondary formation increase nitrate, sulfate, ammonium, SOA and BC by 4 (70 %), 0.6–0.8 (10 %–20 %), 1.2–1.6 (40 %), 1.2 (12 %–16 %) and 4 µg m−3 (15 %–20 %), respectively, among which physical processes contribute approximately 15 %–20 %, whereas secondary chemical formation accounts for ∼ 60 % and 10 %–30 % of the overall increase in nitrate and ammonium, respectively.
In order to alleviate the increase in ammonium nitrate in intensively irrigated areas, we suggest that a 20 % combined reduction in NH3 and NOx emissions can effectively offset the negative effects of irrigation on PM2.5 nitrate without worsening nighttime O3 pollution in large city clusters. Meanwhile, the regional average O3 impacts on human health and crop yields would be greatly alleviated under different emission reduction strategies proposed in this study, except for the 50 % NH3 emission reductions. Therefore, agricultural development, air pollution control and climate change adaptation are closely coupled with each other. The expansion of irrigated areas in China has slowed down since the 1980s, and the IWU declines from the mid-1990s to the early 2000s, because of the advancement of irrigation systems (Zhou et al., 2020; Han et al., 2020b). However, the trend was reversed to a slight increase again since 2011 in water-scarce regions including the NCP, primarily driven by cropland expansion (Qi et al., 2022; Zhang et al., 2022b). It is projected that the IWU in China will increase by 8.5 %–17.1 % and 6.8 %–34.8 % by the 2050s and 2100s, respectively, under various warming scenarios (Liu et al., 2024a). This corresponds to the paradox of irrigation efficiency (Grafton et al., 2018), in which water conserved from highly efficient irrigation methods would be used for irrigation expansion to maximize crop yields and farmers' revenues, with government subsidies for modern irrigation systems (Zhang et al., 2022b). Therefore, the increasing adoption of water-saving irrigation systems in the future may potentially decrease surface water vapor and increase surface temperature and PBLH, as evidenced by our previous work (Yuan et al., 2023). These changes are favorable for aerosol dissipation, conversion of nitrate to the gas phase and suppression of nitrate formation, but they may contribute to O3 formation, in contrast with the present-day situation of widespread traditional irrigation. Consequently, the proposed emission control strategy for nitrate mitigation here is likely to exacerbate O3 pollution, which cannot be offset by irrigation. Thus, future emission control strategies may prioritize O3 mitigation (e.g., through reducing VOCs emissions) during the transition from conventional irrigation methods to water-saving irrigation techniques. In other words, a tradeoff between air pollution control and irrigation needs has to be carefully considered in the future.
We note that all these results discussed above are based on one summer simulation because of the demanding computer resources required by the WRF-GC model, and the effects of irrigation can have interannual variability (Sorooshian et al., 2012; Li et al., 2016). Conducting long-term simulations will provide a more comprehensive assessment of these effects. Indeed, we have conducted long-term simulations using WRF-only model in our previous work and found that long-term effects of irrigation on meteorology are similar to those reported in this study, likely reflecting the summer of 2017 being rather normal in terms of climate conditions. Thus, we expect that the interannual variability of climate may not significantly interfere with our results regarding atmospheric chemistry. However, we could not quantitatively show which pathway dominates the decrease in O3 and increase in PM2.5, given that the standard WRF-GC model cannot diagnose individual chemical pathways, so perturbation experiments or tagged simulations are promising for addressing this issue in future work. Moreover, the model uncertainty in simulating the composition of PM2.5 should be recognized, as Travis et al. (2022) found that GEOS-Chem overestimates nitrate by 36 % due to the missing sink of HNO3.
Overall, this study represents the first work to gain an insight into the possible range of air quality outcomes arising from irrigation over China. Our findings indicate the non-negligible and contrasting effects of irrigation on PM2.5 and O3 and emphasize the roles of changing irrigation practices in mitigating regional air pollution, suggesting that a coordinated approach is needed to simultaneously address air pollution control, water conservation, climate change adaption and food security. This study not only informs policymakers how to design emission control strategies and land management for air pollution control in intensively irrigated and heavily polluted regions, but also encourages farmers to adopt sustainable farming practices to maximize their socioeconomic gains. All of these contribute to the multiple Sustainable Development Goals (SDGs) including SDG 2 “zero hunger”, SDG 3 “good health and well-being”, SDG 6 “clean water and sanitation” and SDG 13 “climate action”. For example, using water-saving irrigation systems in place of traditional ones can raise crop yields, alleviate water scarcity and reduce PM2.5 pollution but with a possible worsening of O3 pollution, which may then have to be mitigated by tighter VOC emission control measures. On the other hand, as O3 control has been suggested to be more beneficial for safeguarding food security than PM2.5 control (Liu et al., 2024b), irrigation itself may serve as a potential approach to not only protect crops from water and heat stresses directly, but also alleviate O3 exposure and its damage via modulating atmospheric chemistry indirectly. Achieving these various SDGs requires multi-sectoral collaboration, and our study provides a valuable reference for decision-making in this regard.
The WRF-GC model coupled with irrigation schemes is now available from https://github.com/WRF-GC/wrf-gc-release (Feng et al., 2021). Model output data are available upon request.
The supplement related to this article is available online at https://doi.org/10.5194/acp-25-4211-2025-supplement.
APKT conceived the study and revised the manuscript. TY coupled the irrigation schemes into WRF-GC, performed the simulations and analysis and wrote the manuscript draft. AZ and TMF gave suggestions on how to use the WRF-GC model. DHYY helped design the model experiments. TMF, JW and SL reviewed and edited the manuscript.
At least one of the (co-)authors is a member of the editorial board of Atmospheric Chemistry and Physics. The peer-review process was guided by an independent editor, and the authors also have no other competing interests to declare.
Publisher's note: Copernicus Publications remains neutral with regard to jurisdictional claims made in the text, published maps, institutional affiliations, or any other geographical representation in this paper. While Copernicus Publications makes every effort to include appropriate place names, the final responsibility lies with the authors. Regarding the maps used in this paper, please note that Figs. 1–4, 7, 9 and 10 contain disputed territories.
This work was supported by the General Research Fund (project no.: 14307722) granted by the Research Grants Council (RGC) to Amos P. K. Tai, the Innovation and Technology Fund (Funding Support to State Key Laboratory of Agrobiotechnology, project nos. 8300031, 8300036, 8300070) granted to Amos P. K. Tai and Jin Wu, the National Natural Science Foundation of China (project no.: 31922090) granted to Jin Wu, and a Hong Kong PhD Fellowship granted by RGC to Tiangang Yuan.
This research has been supported by the Research Grants Council, University Grants Committee (grant no. 14307722), the Innovation and Technology Fund (Funding Support to State Key Laboratory of Agrobiotechnology, project nos. 8300031, 8300036, 8300070), a Hong Kong PhD Fellowship, and the National Natural Science Foundation of China (grant no. 31922090).
This paper was edited by Jeffrey Geddes and reviewed by two anonymous referees.
Abramoff, R. Z., Ciais, P., Zhu, P., Hasegawa, T., Wakatsuki, H., and Makowski, D.: Adaptation strategies strongly reduce the future impacts of climate change on simulated crop yields, Earths Future, 11, e2022EF003190, https://doi.org/10.1029/2022EF003190, 2023.
Alexander, B., Sherwen, T., Holmes, C. D., Fisher, J. A., Chen, Q., Evans, M. J., and Kasibhatla, P.: Global inorganic nitrate production mechanisms: comparison of a global model with nitrate isotope observations, Atmos. Chem. Phys., 20, 3859–3877, https://doi.org/10.5194/acp-20-3859-2020, 2020.
An, Z., Huang, R. J., Zhang, R., Tie, X., Li, G., Cao, J., Zhou, W., Shi, Z., Han, Y., Gu, Z., and Ji, Y.: Severe haze in northern China: A synergy of anthropogenic emissions and atmospheric processes, P. Natl. Acad. Sci. USA, 116, 8657–8666, https://doi.org/10.1073/pnas.1900125116, 2019.
Bavi, A., Kashkuli, H. A., Boroomand, S., Naseri, A., and Albaji, M.: Evaporation losses from sprinkler irrigation systems under various operating conditions, J. Appl. Sci., 9, 597–600, https://doi.org/10.3923/jas.2009.597.600, 2009.
Beguería, S., Vicente-Serrano, S. M., and Angulo-Martínez, M. A.: Multiscalar global drought dataset: the SPEIbase: a new gridded product for the analysis of drought variability and impacts, B. Am. Meteorol. Soc., 91, 1351–1356, https://doi.org/10.1175/2010BAMS2988.1, 2010.
Chen, Z., Chen, D., Zhao, C., Kwan, M.-p., Cai, J., Zhuang, Y., Zhao, B.o., Wang, X., Chen, B., Yang, J., Li, R., He, B., Gao, B., Wang, K., and Xu, B.: 2020. Influence of meteorological conditions on PM2.5 concentrations across China: a review of methodology and mechanism, Environ. Int. 139, 105558, https://doi.org/10.1016/j.envint.2020.105558, 2020.
Chen, Z. Y., Zhuang, Y., Xie, X., Chen, D., Cheng, N., Yang, L., and Li, R.: Understanding long-term variations of meteorological influences on ground ozone concentrations in Beijing during 2006–2016, Environ. Pollut., 245, 29–37, https://doi.org/10.1016/j.envpol.2018.10.117, 2019.
Cheng, J., Su, J., Cui, T., Li, X., Dong, X., Sun, F., Yang, Y., Tong, D., Zheng, Y., Li, Y., Li, J., Zhang, Q., and He, K.: Dominant role of emission reduction in PM2.5 air quality improvement in Beijing during 2013–2017: a model-based decomposition analysis, Atmos. Chem. Phys., 19, 6125–6146, https://doi.org/10.5194/acp-19-6125-2019, 2019.
Cook, B., Shukla, S. P., Puma, M. J., and Nazarenko, L. S.: Irrigation as an historical climate forcing, Clim. Dynam., 44, 1715–1730, https://doi.org/10.1007/s00382-014-2204-7, 2015.
Currell, M. J., Han, D., Chen, Z., and Cartwright, I.: Sustainability of groundwater usage in northern China: dependence on palaeowaters and effects on water quality, quantity and ecosystem health, Hydrol. Processes, 26, 4050–4066, https://doi.org/10.1002/hyp.9208, 2012.
Dang, R., Liao, H., and Fu, Y.: Quantifying the anthropogenic and meteorological influences on summertime surface ozone in China over 2012–2017, Sci. Total Environ., 754, 142394, https://doi.org/10.1016/j.scitotenv.2020.142394, 2021.
Feng, X., Lin, H., Fu, T.-M., Sulprizio, M. P., Zhuang, J., Jacob, D. J., Tian, H., Ma, Y., Zhang, L., Wang, X., Chen, Q., and Han, Z.: WRF-GC (v2.0): online two-way coupling of WRF (v3.9.1.1) and GEOS-Chem (v12.7.2) for modeling regional atmospheric chemistry–meteorology interactions, Geosci. Model Dev., 14, 3741–3768, https://doi.org/10.5194/gmd-14-3741-2021, 2021 (code available at: https://github.com/WRF-GC/wrf-gc-release, last access: 1 May 2024).
Grafton, R. Q., Williams, J., Perry., C. J., Molle, F., Rinhler, C., Steduto, P., Udall, B., Wheeler, S. A. Wang, Y., Garrick, D., and Allen, R. G.: The paradox of irrigation efficiency, Science, 361, 748–750, https://doi.org/10.1126/science.aat9314, 2018.
Guenther, A. B., Jiang, X., Heald, C. L., Sakulyanontvittaya, T., Duhl, T., Emmons, L. K., and Wang, X.: The Model of Emissions of Gases and Aerosols from Nature version 2.1 (MEGAN2.1): an extended and updated framework for modeling biogenic emissions, Geosci. Model Dev., 5, 1471–1492, https://doi.org/10.5194/gmd-5-1471-2012, 2012.
Han, H., Liu, J., Shu, L., Wang, T., and Yuan, H.: Local and synoptic meteorological influences on daily variability in summertime surface ozone in eastern China, Atmos. Chem. Phys., 20, 203–222, https://doi.org/10.5194/acp-20-203-2020, 2020a.
Han, S., Tian, F., and Gao, L.: Current status and recent trend of irrigation water use in China, Irrig. Drain., 69, 25–35, https://doi.org/10.1002/ird.2441, 2020b.
He, C., Valayamkunnath, P., Barlage, M., Chen, F., Gochis, D., Cabell, R., Schneider, T., Rasmussen, R., Niu, G.-Y., Yang, Z.-L., Niyogi, D., and Ek, M.: The Community Noah-MP Land Surface Modeling System Technical Description Version 5.0, NCAR Technical Note, NCAR/TN-575+STR, https://doi.org/10.5065/ew8g-yr95, 2023.
Hodzic, A. and Jimenez, J. L.: Modeling anthropogenically controlled secondary organic aerosols in a megacity: a simplified framework for global and climate models, Geosci. Model Dev., 4, 901–917, https://doi.org/10.5194/gmd-4-901-2011, 2011.
Huang, X., Ding, A., Gao, J., Zheng, B., Zhou, D., Qi, X., Tang, R., Wang, J., Ren, C., Nie, W., Chi, X., Xu, Z., Chen, L., Li, Y., Che, F., Pang, N., Wang, H., Tong, D., Qin, W., Cheng, W., Liu, W., Fu, Q., Liu, B., Chai, F., Davis, S., Zhang, Q., and He, K.: Enhanced secondary pollution offset reduction of primary emissions during COVID-19 lockdown in China, Natl. Sci. Rev., 8, nwaa137, https://doi.org/10.1093/nsr/nwaa137, 2021.
Hudman, R. C., Moore, N. E., Mebust, A. K., Martin, R. V., Russell, A. R., Valin, L. C., and Cohen, R. C.: Steps towards a mechanistic model of global soil nitric oxide emissions: implementation and space based-constraints, Atmos. Chem. Phys., 12, 7779–7795, https://doi.org/10.5194/acp-12-7779-2012, 2012.
Iacono, M. J., Delamere, J. S., Mlawer, E. J., Shephard, M. W., Clough, S. A., and Collins, W. D.: Radiative forcing by longlived greenhouse gases: Calculations with the AER radiative transfer models, J. Geophys. Res.-Atmos., 113, D13103, https://doi.org/10.1029/2008JD009944, 2008.
IPCC, 2021: Climate Change 2021: The Physical Science Basis. Contribution of Working Group I to the Sixth Assessment Report of the Intergovernmental Panel on Climate Change, edited by: Masson-Delmotte, V., Zhai, P., Pirani, A., Connors, S. L., Péan, C., Berger, S., Caud, N., Chen, Y., Goldfarb, L., Gomis, M. I., Huang, M., Leitzell, K., Lonnoy, E., Matthews, J. B. R., Maycock, T. K., Waterfield, T., Yelekçi, O., Yu, R., and Zhou, B., Cambridge University Press, Cambridge, United Kingdom and New York, NY, USA, 2391 pp. https://doi.org/10.1017/9781009157896, 2021.
Jacob, D. J. and Winner, D. A.: Effect of climate change on air quality, Atmos. Environ., 43, 51–63, https://doi.org/10.1016/j.atmosenv.2008.09.051, 2009.
Jacobson, M.: Studying the effects of soil moisture on ozone, temperatures, and winds in Los Angeles, J. Appl. Meteorol., 38, 607–616, https://doi.org/10.1016/S1352-2310(96)00201-4, 1999.
Jacobson, M.: Short-term effects of agriculture on air pollutant and climate in California, J. Geophys. Res., 113, D23101, https://doi.org/10.1029/2008JD010689, 2008.
Jia, K., Liang, S. L., Wei, X. Q., Yao, Y. J., Yang, L. Q., Zhang, X. T., and Liu, D. Y.: Validation of Global Land Surface Satellite (GLASS) fractional vegetation cover product from MODIS data in an agricultural region, Remote Sens. Lett., 9, 847–856, https://doi.org/10.1080/2150704X.2018.1484958, 2018.
Kanamaru, H. and Kanamitsu, M.: Model diagnosis of nighttime minimum temperature warming during summer due to irrigation in the California Central Valley, J. Hydrometeorol., 9, 1061–1072, https://doi.org/10.1175/2008JHM967.1, 2008.
Kim, P. S., Jacob, D. J., Fisher, J. A., Travis, K., Yu, K., Zhu, L., Yantosca, R. M., Sulprizio, M. P., Jimenez, J. L., Campuzano-Jost, P., Froyd, K. D., Liao, J., Hair, J. W., Fenn, M. A., Butler, C. F., Wagner, N. L., Gordon, T. D., Welti, A., Wennberg, P. O., Crounse, J. D., St. Clair, J. M., Teng, A. P., Millet, D. B., Schwarz, J. P., Markovic, M. Z., and Perring, A. E.: Sources, seasonality, and trends of southeast US aerosol: an integrated analysis of surface, aircraft, and satellite observations with the GEOS-Chem chemical transport model, Atmos. Chem. Phys., 15, 10411–10433, https://doi.org/10.5194/acp-15-10411-2015, 2015.
Lawston, P. M., Santanello Jr., J. A., Zaitchik, B. F., and Rodell, M.: Impact of irrigation methods on land surface model spinup and initialization of WRF forecasts, J. Hydrometeorol., 16, 1135–1154, https://doi.org/10.1175/JHM-D-14-0203.1, 2015.
Le, T., Wang, Y., Liu, L., Yang, J., Yung, Y. L., Li, G., and Seinfeld, J. H.: Unexpected air pollution with marked emission reductions during the COVID-19 outbreak in China, Science, 369, 702–706, https://doi.org/10.1126/science.abb7431, 2020.
Lelieveld, J., Evans, J. S., Fnais, M., Giannadaki, D., and Pozzer, A.: The contribution of outdoor air pollution sources to premature mortality on a global scale, Nature, 525, 367–371, https://doi.org/10.1038/nature15371, 2015.
Leung, D. M., Tai, A. P. K., Mickley, L. J., Moch, J. M., van Donkelaar, A., Shen, L., and Martin, R. V.: Synoptic meteorological modes of variability for fine particulate matter (PM2.5) air quality in major metropolitan regions of China, Atmos. Chem. Phys., 18, 6733–6748, https://doi.org/10.5194/acp-18-6733-2018, 2018.
Leng, G., Leung, L. R., and Huang, M.: Significant impacts of irrigation water sources and methods on modeling irrigation effects in the ACME Land Model, J. Adv. Model. Earth Syst., 9, 1665–1683, https://doi.org/10.1002/2016MS000885, 2017.
Li, J., Mahalov, A., and Hyde, P.: Impacts of agricultural irrigation on ozone concentrations in the Central Valley of California and in the contiguous United States based on WRF-Chem simulations, Agr. Forest Meteorol., 221, 34–49, https://doi.org/10.1016/j.agrformet.2016.02.004, 2016.
Li, K., Jacob, D. J., Liao, H., Shen, L., Zhang, Q., and Bates, K. H.: Anthropogenic drivers of 2013–2017 trends in summer surface ozone in China, P. Natl. Acad. Sci. USA, 116, 422–427, https://doi.org/10.1073/pnas.1812168116, 2019.
Li, K., Jacob, D. J., Shen, L., Lu, X., De Smedt, I., and Liao, H.: Increases in surface ozone pollution in China from 2013 to 2019: anthropogenic and meteorological influences, Atmos. Chem. Phys., 20, 11423–11433, https://doi.org/10.5194/acp-20-11423-2020, 2020.
Li, M., Zhang, Q., Kurokawa, J.-I., Woo, J.-H., He, K., Lu, Z., Ohara, T., Song, Y., Streets, D. G., Carmichael, G. R., Cheng, Y., Hong, C., Huo, H., Jiang, X., Kang, S., Liu, F., Su, H., and Zheng, B.: MIX: a mosaic Asian anthropogenic emission inventory under the international collaboration framework of the MICS-Asia and HTAP, Atmos. Chem. Phys., 17, 935–963, https://doi.org/10.5194/acp-17-935-2017, 2017a.
Li, M., Liu, H., Geng, G., Hong, C., Liu, F., Song, Y., Tong, D., Zheng, B., Cui, H., Man, H., Zhang, Q., and He, K.: Anthropogenic emission inventories in China: a review, Natl. Sci. Rev., 4, 834–866, https://doi.org/10.1093/nsr/nwx150, 2017b.
Li, X. L., Lu, H., Yu, L., and Yang, K.: Comparison of the spatial characteristics of four remotely sensed leaf area index products over China: Direct validation and relative uncertainties, Remote Sens., 10, 26, https://doi.org/10.3390/RS10010148, 2018.
Liang, S., Li, X., Teng, Y., Fu, H., Chen, L., Mao, J., Zhang, H., Gao, S., Sun, Y., Ma, Z., and Azzi, M: Estimation of health and economic benefits based on ozone exposure level with high spatial-temporal resolution by fusing satellite and station observations, Environ Pollut., 255, 113267, https://doi.org/10.1016/j.envpol.2019.113267, 2019.
Liang, S., Cheng, J., Jia, K., Jiang, B., Liu, Q., Xiao, Z., Yao, Y., Yuan, W., Zhang, X., Zhao, X., and Zhou, J.: The global land surface satellite (GLASS) product suite, B. Am. Meteorol. Soc., 102, E323–E337, https://doi.org/10.1175/BAMS-D-18-0341.1, 2021.
Liao, D., Niu, J., Ciais, P., Du, T., Zhang, B., and Kang, S.: Changing climate threatens irrigation benefits of maize gross primary productivity in China, Earths Future, 12, e2022EF003474, https://doi.org/10.1029/2022EF003474, 2024.
Lin, H., Feng, X., Fu, T.-M., Tian, H., Ma, Y., Zhang, L., Jacob, D. J., Yantosca, R. M., Sulprizio, M. P., Lundgren, E. W., Zhuang, J., Zhang, Q., Lu, X., Zhang, L., Shen, L., Guo, J., Eastham, S. D., and Keller, C. A.: WRF-GC (v1.0): online coupling of WRF (v3.9.1.1) and GEOS-Chem (v12.2.1) for regional atmospheric chemistry modeling – Part 1: Description of the one-way model, Geosci. Model Dev., 13, 3241–3265, https://doi.org/10.5194/gmd-13-3241-2020, 2020.
Liu, G., Wang, W., Shao, Q., Wei, J., Zheng, J., Liu, B., and Chen, Z.: Simulating the climatic effects of irrigation over China by using the WRF-Noah model system with mosaic approach, J. Geophys. Res.-Atmos., 126, e2020JD034428, https://doi.org/10.1029/2020JD034428, 2021a.
Liu, J., Kuang, W., Zhang, Z., Xu, X., Qin, X., Qin, Y., Ning, J., Zhou, W., Zhang, S., Li, R., Yan, C., Wu, S., Shi, X., Jiang, N., Yu, D., Pan, X., and Chi, W.: Spatiotemporal characteristics, patterns, and causes of land-use changes in China since the late 1980s, J. Geog. Sci., 24, 195–210, https://doi.org/10.1007/s11442-014-1082-6, 2014.
Liu, J., Jin, J., and Niu, G.-Y.: Effects of irrigation on seasonal and annual temperature and precipitation over China simulated by the WRF model, J. Geophys. Res.-Atmos., 126, e2020JD034222, https://doi.org/10.1029/2020JD034222, 2021b.
Liu, K., Bo, Y., Li, X., Wang, S., and Zhou, G.: Uncovering current and future variations of irrigation water use across China using machine learning, Earths Future, 12, e2023EF003562, https://doi.org/10.1029/2023EF003562, 2024a.
Liu, X., Chu, B., Tang, R., Liu, Y., Qiu, B., Gao, M., Li, X., Xiao, J., Sun Zhe, H., Huang, X., Desai, A. R., Ding, A., and Wang, H.: Air quality improvements can strengthen China's food security, Nat. Food, 5, 158–170, https://doi.org/10.1038/s43016-023-00882-y, 2024b.
Liu, Z., Zhou, M., Chen, Y., Chen, D., Pan, Y., Song, T., Ji, D., Chen, Q., and Zhang, L.: The nonlinear response of fine particulate matter pollution to ammonia emission reductions in North China, Environ. Res. Lett., 16, 034014, https://doi.org/10.1088/1748-9326/abdf86, 2021c.
Lobell, D. B., Bonfils, C. J., Kueppers, L. M., and Snyder, M. A.: Irrigation cooling effect on temperature and heat index extremes, Geophys. Res. Lett., 35, L09705, https://doi.org/10.1029/2008GL034145, 2008.
Lu, X., Hong, J., Zhang, L., Cooper, O. R., Schultz, M. G., Xu, X., Wang, T., Gao, M., Zhao, Y., and Zhang, Y.: Severe surface ozone pollution in China: a global perspective. Environ. Sci. Technol. Lett., 5, 487–494, https://doi.org/10.1021/acs.estlett.8b00366, 2018.
Lu, X., Zhang, L., and Shen, L.: Meteorology and climate influences on tropospheric ozone: a review of natural sources, chemistry, and transport patterns, Curr. Pollut. Rep., 5, 238–260, https://doi.org/10.1007/s40726-019-00118-3, 2019.
Mao, J., Tai, A. P. K., Yung, D. H. Y., Yuan, T., Chau, K. T., and Feng, Z.: Multidecadal ozone trends in China and implications for human health and crop yields: a hybrid approach combining a chemical transport model and machine learning, Atmos. Chem. Phys., 24, 345–366, https://doi.org/10.5194/acp-24-345-2024, 2024.
McDermid, S., Nocco, M., Lawston-Parker, P., Keune, J., Pokhrel, Y., Jain, M., Jägermeyr, J., Brocca, L., Massari, C., Jones, A. D., Vahmani, P., Thiery, W., Yao, Y., Bell, A., Chen, L., Dorigo, W., Hanasaki, N., Jasechko, S., Lo, M.-H., Mahmood, R., Mishra, V., Muller, N. D., Niyogi, D., Rabin, S. S., Sloat, L., Wada, Y., Zappa, L., Chen, F., Cook, B. I., Kim, H., Lombardozzi, D., Polcher, J., Ryu, D., Santanello, J., Satoh, Y., Seneviratne, S., Singh, D., and Yokohata, T.: Irrigation in the Earth system, Nat. Rev. Earth Environ., 4, 435–453, https://doi.org/10.1038/s43017-023-00438-5, 2023.
Morrison, H., Thompson, G., and Tatarskii, V.: Impact of Cloud Microphysics on the Development of Trailing Stratiform Precipitation in a Simulated Squall Line: Comparison of One- and Two-Moment Schemes, Mon. Weather Rev., 137, 991–1007, https://doi.org/10.1175/2008MWR2556.1, 2009.
Nakanishi, M. and Niino, H.: An improved mellor-yamada level-3 model: Its numerical stability and application to a regional prediction of advection fog, Bound.-Lay. Meteorol., 119, 397–407, https://doi.org/10.1007/s10546-005-9030-8, 2006.
Niu, G. Y., Yang, Z. L., Mitchell, K. E., Chen, F., Ek, M. B., Barlage, M., Kumar, A., Manning, K., Niyogi, D., Rosero, E., Tewari, M., and Xia, Y.: The community Noah land surface model with multiparameterization options (Noah-MP): 1. Model description and evaluation with local–scale measurements, J. Geophys. Res.-Atmos., 116, D12109, https://doi.org/10.1029/2010JD015139, 2011.
Pye, H. O. T., Liao, H., Wu, S., Mickley, L. J., Jacob, D. J., Henze, D. K., and Seinfeld, J. H.: Effect of changes in climate and emissions on future sulfate-nitrate-ammonium aerosol levels in the United States, J. Geophys. Res.-Atmos., 114, D01205, https://doi.org/10.1029/2008JD010701, 2009.
Qi, X., Feng, K., Sun, L., Zhao, D., Huang, X., Zhang, D., Liu, Z., and Baiocchi, G.: Rising agricultural water scarcity in China is driven by expansion of irrigated cropland in water scarce regions, One Earth, 5, 1139–1152, https://doi.org/10.1016/j.oneear.2022.09.008, 2022.
Qian, J., Liao, H., Yang, Y., Li, K., Chen, L., and Zhu, J.: Meteorological influences on daily variation and trend of summertime surface ozone over years of 2015–2020: Quantification for cities in the Yangtze River Delta, Sci. Total Environ., 834, 155107, https://doi.org/10.1016/j.scitotenv.2022.155107, 2022.
Qian, Y., Yang, Z., Feng, Z., Liu, Y., Gustafson, W. I., Berg, L. K., Huang, M., Yang, B., and Ma, H. Y.: Neglecting irrigation contributes to the simulated summertime warm-and-dry bias in the central United States, npj Clim. Atmos. Sci., 3, 31, https://doi.org/10.1038/s41612-020-00135-w, 2020.
Randerson, J. T., van der Werf, G. R., Giglio, L., Collatz, G. J., and Kasibhatla, P. S.: Global Fire Emissions Database, Version 4, (GFEDv4), ORNL DAAC, Oak Ridge, Tennessee, USA., https://doi.org/10.3334/ORNLDAAC/1293, 2018.
Ren, J., Guo, F., and Xie, S.: Diagnosing ozone–NOx–VOC sensitivity and revealing causes of ozone increases in China based on 2013–2021 satellite retrievals, Atmos. Chem. Phys., 22, 15035–15047, https://doi.org/10.5194/acp-22-15035-2022, 2022.
Sacks, W. J., Cook, B. I., Buenning, N., Levis, S., and Helkowski, J. H.: Effects of global irrigation on the near-surface climate, Clim. Dynam., 33, 159–175, https://doi.org/10.1007/s00382-008-0445-z, 2009.
Shen, Y., Xiao, Z., Wang, Y., Xiao, W., Yao, L., and Zhou, C.: Impacts of agricultural soil NOx emissions on O3 over mainland China. J. Geophys. Res.-Atmos., 128, e2022JD037986, https://doi.org/10.1029/2022JD037986, 2023.
Shi, Z., Huang, L., Li, J., Ying, Q., Zhang, H., and Hu, J.: Sensitivity analysis of the surface ozone and fine particulate matter to meteorological parameters in China, Atmos. Chem. Phys., 20, 13455–13466, https://doi.org/10.5194/acp-20-13455-2020, 2020.
Shi, Z., Song, C., Liu, B., Lu, G., Xu, J., Van Vu, T., Elliott, R. J. R., Li, W., Bloss, W. J., and Harrison, R. M.: Abrupt but smaller than expected changes in surface air quality attributable to COVID-19 lockdowns, Sci. Adv., 7, eabd6696, https://doi.org/10.1126/sciadv.abd6696, 2021.
Skamarock, W. C., Klemp, J. B., Dudhia, J., Gill, D. O., Barker, D., Duda, M. G., Hunag, X., Wang, W., and Powers, J. G.: A Description of the Advanced Research WRF Model Version 3, NCAR Tech. Note NCAR/TN-475+STR, https://doi.org/10.5065/D68S4MVH, 2008.
Song, C., Jiao, Y., Yang, W., Yu, Y., Zhang, J., and Liu, Y.: Research progress on the influence of irrigation methods on ammonia volatilization in farmland, IOP C. Ser. Earth Env., 647, 012170, https://doi.org/10.1088/1755-1315/647/1/012170, 2021.
Sorooshian, S., Li, J., Hsu, K., and Gao, X.: Influence of irrigation schemes used in RCMs on ET estimation: results and comparative studies from California's Central Valley agricultural regions, J. Geophys. Res., 117, D06107, https://doi.org/10.1029/2011JD016978, 2012.
Sorooshian, S., AghaKouchak, A., and Li, J.: Influence of irrigation on land hydrological processes over California, J. Geophys. Res.-Atmos., 119, 13137–13152, https://doi.org/10.1002/2014JD022232, 2014.
Sun, J., Liu, L., Xu, L., Wang, Y., Wu, Z., Hu, M., Shi, Z., Li, Y., Zhang, X., Chen, J., and Li, W.: Key role of nitrate in phase transitions of urban particles: Implications of important reactive surfaces for secondary aerosol formation. J. Geophys. Res.-Atmos., 123, 1234–1243, https://doi.org/10.1002/2017JD027264, 2018.
Sun, J., Qin, M., Xie, X., Fu, W., Qin, Y., Sheng, L., Li, L., Li, J., Sulaymon, I. D., Jiang, L., Huang, L., Yu, X., and Hu, J.: Seasonal modeling analysis of nitrate formation pathways in Yangtze River Delta region, China, Atmos. Chem. Phys., 22, 12629–12646, https://doi.org/10.5194/acp-22-12629-2022, 2022.
Tai, A. P., Mickley, L. J., and Jacob, D. J.: Correlations between fine particulate matter (PM2.5) and meteorological variables in the United States: Implications for the sensitivity of PM2.5 to climate change, Atmos. Environ., 44, 3976–3984, https://doi.org/10.1016/j.atmosenv.2010.06.060, 2010.
Tai, A. P., Martin, M. V., and Heald, C. L.: Threat to future global food security from climate change and ozone air pollution, Nat. Clim. Change, 4, 817–821, https://doi.org/10.1038/NCLIMATE2317, 2014.
Tai, A. P. K., Mickley, L. J., Jacob, D. J., Leibensperger, E. M., Zhang, L., Fisher, J. A., and Pye, H. O. T.: Meteorological modes of variability for fine particulate matter (PM2.5) air quality in the United States: implications for PM2.5 sensitivity to climate change, Atmos. Chem. Phys., 12, 3131–3145, https://doi.org/10.5194/acp-12-3131-2012, 2012.
Tie, X., Huang, R. J., Cao, J., Zhang, Q., Cheng, Y., Su, H., Chang, D., Pöschl, U., Hoffmann, T., Dusek, U., Li, G., Worsnop, D. R., and O'Dowd, C. D.: Severe Pollution in China Amplified by Atmospheric Moisture, Sci. Rep., 7, 15760, https://doi.org/10.1038/s41598-017-15909-1, 2017.
Tiedtke, M.: A comprehensive mass flux scheme for cumulus parameterization in large-scale models, Mon. Weather. Rev., 117, 1779–1800, https://doi.org/10.1175/1520-0493(1989)117<1779:ACMFSF>2.0.CO;2, 1989.
Travis, K. R., Crawford, J. H., Chen, G., Jordan, C. E., Nault, B. A., Kim, H., Jimenez, J. L., Campuzano-Jost, P., Dibb, J. E., Woo, J.-H., Kim, Y., Zhai, S., Wang, X., McDuffie, E. E., Luo, G., Yu, F., Kim, S., Simpson, I. J., Blake, D. R., Chang, L., and Kim, M. J.: Limitations in representation of physical processes prevent successful simulation of PM2.5 during KORUS-AQ, Atmos. Chem. Phys., 22, 7933–7958, https://doi.org/10.5194/acp-22-7933-2022, 2022.
Wang, H., Huang, C., Tao, W., Gao, Y., Wang, S., Jing, S., Wang, W., Yan, R., Wang, Q., An, J., Tian, J., Hu, Q., Lou, S., Pöschl, U., Cheng, Y., and Su, H.: Seasonality and reduced nitric oxide titration dominated ozone increase during COVID-19 lockdown in eastern China, npj Clim. Atmos. Sci., 5, 24, https://doi.org/10.1038/s41612-022-00249-3, 2022a.
Wang, J., Xing, J., Mathur, R., Pleim, J. E., Wang, S., Hogrefe, C., Gan, C. M., Wong, D. C., and Hao, J.: Historical trends in PM2.5-related premature mortality during 1990–2010 across the northern hemisphere, Environ. Health Perspect., 125, 400–408, https://doi.org/10.1289/EHP298, 2016.
Wang, L., Zhao, B., Zhang, Y., and Hu, H.: Correlation between surface PM2.5 and O3 in eastern China during 2015–2019: Spatiotemporal variations and meteorological impacts, Atmos. Environ., 294, 119520, https://doi.org/10.1016/j.atmosenv.2022.119520, 2023.
Wang, T., Xue, L., Brimblecombe, P., Lam, Y. F., Li, L., and Zhang, L.: Ozone pollution in China: A review of concentrations, meteorological influences, chemical precursors, and effects, Sci. Total Environ., 575, 1582–1596, https://doi.org/10.1016/j.scitotenv.2016.10.081, 2017.
Wang, T., Xue, L., Feng, Z., Dai, J., Zhang, Y., and Tan, Y.: Ground-level ozone pollution in China: a synthesis of recent findings on influencing factors and impacts, Environ. Res. Lett., 17, 063003, https://doi.org/10.1088/1748-9326/ac69fe, 2022b.
Wang, W., Parrish, D. D., Wang, S., Bao, F., Ni, R., Li, X., Yang, S., Wang, H., Cheng, Y., and Su, H.: Long-term trend of ozone pollution in China during 2014–2020: distinct seasonal and spatial characteristics and ozone sensitivity, Atmos. Chem. Phys., 22, 8935–8949, https://doi.org/10.5194/acp-22-8935-2022, 2022c.
Wang, Y., Gao, W., Wang, S., Song, T., Gong, Z., Ji, D., Wang, L., Liu, Z., Tang, G., Huo, Y., Tian, S., Li, J., Li, M., Yang, Y., Chu, B., Petäjä, T., Kerminen, V.-M., He, H., Hao, J., Kulmala, M., Wang, Y., and Zhang, Y.: Contrasting trends of PM2.5 and surface-ozone concentrations in China from 2013 to 2017, Natl. Sci. Rev., 7, 1331–1339, https://doi.org/10.1093/nsr/nwaa032, 2020.
Xue, L. K., Wang, T., Gao, J., Ding, A. J., Zhou, X. H., Blake, D. R., Wang, X. F., Saunders, S. M., Fan, S. J., Zuo, H. C., Zhang, Q. Z., and Wang, W. X.: Ground-level ozone in four Chinese cities: precursors, regional transport and heterogeneous processes, Atmos. Chem. Phys., 14, 13175–13188, https://doi.org/10.5194/acp-14-13175-2014, 2014.
Yang, B., Zhang, Y., Qian, Y., Tang, J., and Liu, D.: Climatic effects of irrigation over the Huang-Huai-Hai Plain in China simulated by the weather research and forecasting model, J. Geophys. Res.-Atmos., 5, 2246–2264, https://doi.org/10.1002/2015JD023736, 2015.
Yang, J. and Zhao, Y.: Performance and application of air quality models on ozone simulation in China – A review, Atmos. Environ., 293, 119446, https://doi.org/10.1016/j.atmosenv.2022.119446, 2023.
Yang, Y., Jin, Z., Mueller, N. D., Driscoll, A. W., Hernandez, R. R., Grodsky, S. M., Sloat, L. L., Chester, M. V., Zhu, Y.-G., and Lobell, D. B.: Sustainable irrigation and climate feedbacks, Nat. Food, 4, 654–663, https://doi.org/10.1038/s43016-023-00821-x, 2023.
Ye, X., Wang, X., and Zhang, L.: Diagnosing the model bias in simulating daily surface ozone variability using a machine learning method: The effects of dry deposition and cloud optical depth, Environ. Sci. Technol., 56, 16665–16675, https://doi.org/10.1021/acs.est.2c05712, 2022.
Yin, H., Liu, C., Hu, Q. H., Liu, T., Wang, S. T., Gao, M., Xu, S. Q., Zhang, C. X., and Su, W. J.: Opposite impact of emission reduction during the COVID-19 lockdown period on the surface concentrations of PM2.5 and O3 in Wuhan, China, Environ. Pollut., 289, 117899, https://doi.org/10.1016/j.envpol.2021.117899, 2021.
Yuan, T., Tai, A P. K., Mao, J., Tam, O., H. F., Li, R. K. K., Wu, J., and Li, S.: Effects of different irrigation methods on regional climate in North China Plain: A modeling study, Agr. Forest Meteorol., 342, 109728, https://doi.org/10.1016/j.agrformet.2023.109728, 2023.
Zender, C. S., Bian, H., and Newman, D.: Mineral Dust Entrainment and Deposition (DEAD) model: Description and 1990s dust climatology, J. Geophys. Res.-Atmos., 108, 4416, https://doi.org/10.1029/2002JD002775, 2003.
Zhai, S., Jacob, D. J., Wang, X., Shen, L., Li, K., Zhang, Y., Gui, K., Zhao, T., and Liao, H.: Fine particulate matter (PM2.5) trends in China, 2013–2018: separating contributions from anthropogenic emissions and meteorology, Atmos. Chem. Phys., 19, 11031–11041, https://doi.org/10.5194/acp-19-11031-2019, 2019.
Zhai, S., Jacob, D. J., Wang, X., Liu, Z., Wen, T., Shah, V., Li, K., Moch, J. M., Bates, K. H., Song, S., Shen, L., Zhang, Y., Luo, G., Yu, F., Sun, Y., Wang, L., Qi, M., Tao, J., Gui, K., Xu, H., Zhang, Q., Zhao, T., Wang, Y., Lee, H. C., Choi, H., and Liao, H.: Control of particulate nitrate air pollution in China, Nat. Geosci., 14, 389–395, https://doi.org/10.1038/s41561-021-00726-z, 2021.
Zhang, C., Wang, Y., and Hamilton, K.: Improved representation of boundary layer clouds over the southeast Pacific in ARW-WRF using a modified Tiedtke cumulus parameterization scheme, Mon. Weather Rev., 139, 3489–3513, https://doi.org/10.1175/MWR-D-10-05091.1, 2011.
Zhang, C., Dong, J., and Ge, Q.: Mapping 20 years of irrigated croplands in China using MODIS and statistics and existing irrigation products, Sci. Data, 9, 407, https://doi.org/10.1038/s41597-022-01522-z, 2022a.
Zhang, L., Zheng, D., Zhang, K., Chen, H., Ge, Y., and Li, X.: Divergent trends in irrigation-water withdrawal and consumption over mainland China, Environ. Res. Lett., 17, 094001, https://doi.org/10.1088/1748-9326/ac8606, 2022b.
Zhang, Y. L. and Cao, F.: Fine particulate matter (PM2.5) in China at a city level, Sci. Rep., 5, 1–12, https://doi.org/10.1038/srep14884, 2015.
Zhao, H., Chen, K., Liu, Z., Zhang, Y., Shao, T., and Zhang, H.: Coordinated control of PM2.5 and O3 is urgently needed in China after implementation of the “Air pollution prevention and control action plan”, Chemosphere, 270, 129441, https://doi.org/10.1016/j.chemosphere.2020.129441, 2021.
Zheng, B., Tong, D., Li, M., Liu, F., Hong, C., Geng, G., Li, H., Li, X., Peng, L., Qi, J., Yan, L., Zhang, Y., Zhao, H., Zheng, Y., He, K., and Zhang, Q.: Trends in China's anthropogenic emissions since 2010 as the consequence of clean air actions, Atmos. Chem. Phys., 18, 14095–14111, https://doi.org/10.5194/acp-18-14095-2018, 2018.
Zhou, F., Bo, Y., Ciais, P., Dumas, P., Tang, Q., Wang, X., Liu, J., Zheng, C., Polcher, J., Yin, Z., Guimberteau, M., Peng, S., Ottle, C., Zhao, X., Zhao, J., Tan, Q., Chen, L., Shen, H., Yang, H., Piao, S., Wang, H., and Wada, Y.: Deceleration of China's human water use and its key drivers, P. Natl. Acad. Sci. USA, 117, 7702–7711, https://doi.org/10.1073/pnas.1909902117, 2020.
Zhou, S. S., Tai, A. P. K., Sun, S., Sadiq, M., Heald, C. L., and Geddes, J. A.: Coupling between surface ozone and leaf area index in a chemical transport model: strength of feedback and implications for ozone air quality and vegetation health, Atmos. Chem. Phys., 18, 14133–14148, https://doi.org/10.5194/acp-18-14133-2018, 2018.
Zhu, J., Tai, A. P. K., and Hung Lam Yim, S.: Effects of ozone–vegetation interactions on meteorology and air quality in China using a two-way coupled land–atmosphere model, Atmos. Chem. Phys., 22, 765–782, https://doi.org/10.5194/acp-22-765-2022, 2022.