the Creative Commons Attribution 4.0 License.
the Creative Commons Attribution 4.0 License.
 | 09 Apr 2025
A data-efficient deep transfer learning framework for methane super-emitter detection in oil and gas fields using the Sentinel-2 satellite
Shutao Zhao
Yuzhong Zhang
Shuang Zhao
Xinlu Wang
Daniel J. Varon
Efficiently detecting large methane point sources (super-emitters) in oil and gas fields is crucial for informing stakeholder decisions about mitigation actions. Satellite measurements by multispectral instruments, such as Sentinel-2, offer global and frequent coverage. However, methane signals retrieved from satellite multispectral images are prone to surface and atmospheric artifacts that vary spatially and temporally, making it challenging to build a detection algorithm that applies everywhere. Hence, laborious manual inspection is often necessary, hindering widespread deployment of the technology. Here, we propose a novel deep-transfer-learning-based methane plume detection framework. It consists of two components: an adaptive artifact removal algorithm (low-reflectance artifact detection, LRAD) to reduce artifacts in methane retrievals and a deep subdomain adaptation network (DSAN) to detect methane plumes. To train the algorithm, we compile a dataset comprising 1627 Sentinel-2 images from six known methane super-emitters reported in the literature. We evaluate the ability of the algorithm to discover new methane sources with a suite of transfer tasks, in which training and evaluation data come from different regions. Results show that DSAN (average macro F1 score 0.86) outperforms four convolutional neural networks (CNNs), MethaNet (average macro F1 score 0.70), ResNet-50 (average macro F1 score 0.77), VGG16 (average macro F1 score 0.73), and EfficientNet-V2L (average macro F1 score 0.78), in transfer tasks. The transfer learning algorithm overcomes the issue of conventional CNNs, which is their performance degrades substantially in regions outside regions with training data. We apply the algorithm trained with known sources to an unannotated region in the Algerian Hassi Messaoud oil field and reveal 34 anomalous emission events during a 1-year period, which are attributed to three methane super-emitters associated with production and transmission infrastructure. These results demonstrate the potential of our deep-transfer-learning-based method in contributing towards efficient methane super-emitter discovery using Sentinel-2 across different oil and gas fields worldwide.
- Article
(11269 KB) - Full-text XML
-
Supplement
(2400 KB) - BibTeX
- EndNote


As one of the most important greenhouse gases, methane (CH4) is behind approximately a quarter of the overall global warming since the preindustrial age as reported by IPCC (2013). Among all the sources, reducing methane emissions from anthropogenic sources, including from oil and gas (O&G) production, is vital for mitigating near-term climate change (Lauvaux et al., 2022). Methane emission in the O&G production sector comes from point emitters such as malfunctioning flares, wells, storage tanks, and gas compressor stations. These point emissions exhibit a long-tailed distribution; that is, a substantial fraction of the total emissions are contributed by a limited number of anomalous point sources, which are often linked with production equipment malfunctions or abnormal operating conditions (Zavala-Araiza et al., 2017; Duren et al., 2019). Therefore, efficiently detecting these anomalous methane point sources is crucial for informing prompt mitigation actions.
Atmospheric methane concentrations can be quantified remotely by measuring backscattered radiation at wavelengths (e.g., around 1700 and 2150 nm) that correspond to the rotational–vibrational resonances of methane molecular transitions (Ehret et al., 2022). Recent studies have demonstrated that both multispectral and hyperspectral satellite instruments have the capability to identify anomalous methane point emissions (Guanter et al., 2021; Varon et al., 2021; Sánchez-García et al., 2022). Hyperspectral instruments (e.g., GHGSat, PRISMA, EMIT, and GF-5) offer higher sensitivity to CH4 and thus lower point source detection limits owing to their fine spectral resolution, but hyperspectral observations generally exhibit sparsity in both spatial and temporal coverage (Naus et al., 2023; Pandey et al., 2023). In comparison, multispectral satellites (including Landsat 8, WorldView-3, and Sentinel-2) provide global, frequent, and spatially continuous observations, though their sensitivity to methane is lower because of coarse spectral resolution (Varon et al., 2021; Ehret et al., 2022). As an illustration, Sentinel-2 provides global coverage data on a weekly basis, spanning a period of 8 years. The detection limit of the Sentinel-2 measurements for methane gas in the atmosphere is roughly 5000 kg h−1 or greater for heterogeneous surfaces (Gorroño et al., 2023).
However, the routine scanning for methane super-emitters across varied O&G areas remains challenging primarily due to the lack of an efficient automated source detection algorithm (Fig. 1). Currently, source detection predominantly relies on human visual inspection, a process that is time- and labor-consuming, thereby impeding large-scale deployment (Jongaramrungruang et al., 2022; Schuit et al., 2023). Deep learning techniques have been proposed to develop point source detectors for airborne instruments (Jongaramrungruang et al., 2022), satellite area mappers (e.g., TROPOMI) (Schuit et al., 2023), and satellite hyper-/multispectral instruments (e.g., PRISMA, Sentinel-2) (Bruno et al., 2024; Joyce et al., 2023; Vaughan et al., 2024).
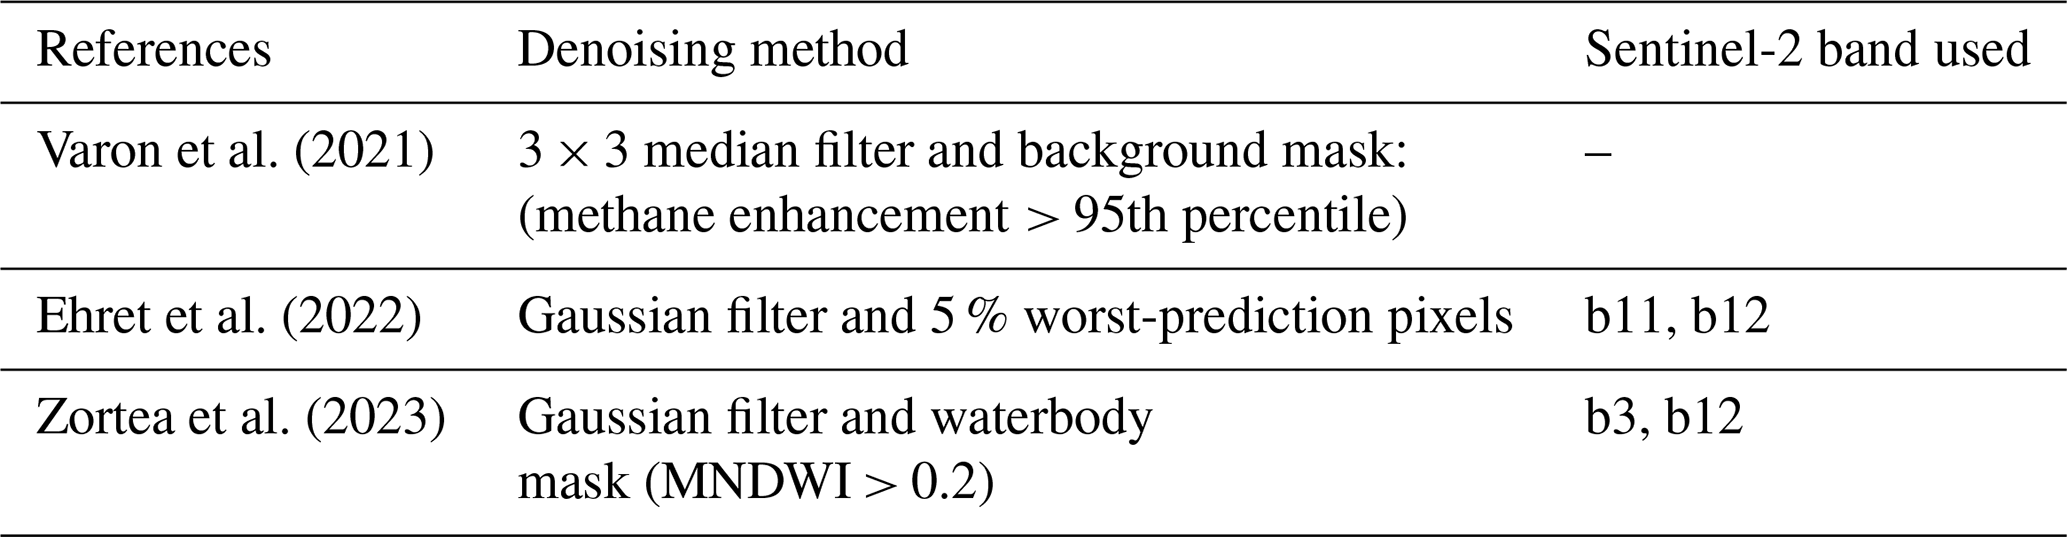
One of the key challenges in constructing such an automated detector for multispectral observations is the low signal-to-noise ratio (SNR) in the retrieved methane signals. Because of the coarse spectral resolution, methane signals obtained from multispectral observations are susceptible to diverse artifacts, including interferences from vegetation, waterbodies, and smoke, making source detection a difficult task, especially over heterogeneous land surface (Cusworth et al., 2019). Recent studies have proposed various strategies to reduce such noises (Table 1). Varon et al. (2021) introduced an approach that eliminates outliers using a 3×3 median filter and removes background noises below the 95 % confidence interval. Similarly, Ehret et al. (2022) discarded the 5 % pixels with the poorest predictions from methane-free background estimation and subsequently applied a Gaussian filter. Furthermore, Zortea et al. (2023) generated a binary mask to exclude the waterbody-related artifacts using the modified normalized difference water index (MNDWI). These denoising methods have demonstrated effectiveness on relatively homogeneous surfaces, where noise is uniformly distributed and artifacts are spatially small and temporally infrequent. However, in heterogeneous regions, artifacts tend to be more pronounced and often cover larger areas than methane plumes, posing significant challenges to existing denoising methods.
Table 1Summary of denoising methods introduced in the literature.
Another challenge arises from the necessity for an efficient detector to rapidly identify small-scale methane point emissions in satellite data with large-scale (global) coverage. Recently, various deep learning architectures have demonstrated feasibility for the automated detection of methane super-emissions in satellite imagery, including the vision-transformer-based network (Rouet-Leduc and Hulbert 2024), U-Net-based models (Bruno et al., 2024; Joyce et al., 2023; Růžička et al., 2023; Vaughan et al., 2024), ResNet-50 (Zortea et al., 2023), EfficientNet-V2L (Radman et al., 2023), and MethaNet (a network based on a convolutional neural network (CNN) specialized for methane plume detection) (Jongaramrungruang et al., 2022). Most of these detectors require huge-volume training datasets to achieve optimal performance.
However, multispectral satellites such as Sentinel-2 have high detection limits for methane emissions, even more than 5000 kg h−1 for heterogeneous surfaces (Gorroño et al., 2023). This means that the retrieved images containing methane plumes are extremely rare on both spatial and temporal scales within Sentinel-2 observations, as evidenced by Ehret et al. (2022). So far, a relatively small number of super-emitters have been detected by multispectral satellite, mainly in desertic regions with bright, uniform surfaces (Varon et al., 2021; Ehret et al., 2022; Irakulis-Loitxate et al., 2022; Sánchez-García et al., 2022; Naus et al., 2023; Pandey et al., 2023). In contrast, O&G production is spread across ∼ 100 countries worldwide, often with distinct environments (EIA; https://www.eia.gov, last access: 28 December 2023), resulting in different noise and artifact characteristics. Therefore, an image-level detector is required to efficiently filter out the myriads of methane-free patches.
Deep learning techniques, including zero-shot generalization and deep transfer learning, have recently been applied to address the training data issue for multispectral methane plume detection. Růžička et al. (2023) demonstrated zero-shot methane plume detection by directly transferring a model trained on one sensor (source domain) to other satellite observations (target domain). While this approach is promising, the model may struggle when the target domain significantly differs from the source. To overcome this limitation, deep transfer learning techniques, such as domain adaptation, have been employed. These methods leverage the similarities between the source and target domains to adjust the learned feature distributions during training (Iman et al., 2023). This approach is particularly valuable for developing data-efficient detection models with limited real training data (Jiang et al., 2022).
In this work, we aim to improve methane source detection using Sentinel-2 observations. We develop an adaptive artifact detection and masking algorithm that enhances the signal-to-noise ratio for retrieved methane signals and a deep transfer learning method that improves detection efficiency and performance of discovering unknown sources, leveraging knowledge acquired from known methane sources. To train our method, we also construct a dataset of Sentinel-2 methane retrievals comprising Sentinel-2 detectable super-emitters reported in the literature. Our method is a step forward towards large-scale operational monitoring of methane super-emitters by multispectral satellite instruments.
2.1 Satellite data
We employ the Sentinel-2 Level 1C (L1C) top-of-atmosphere reflectance product, which is freely available at https://dataspace.copernicus.eu (last access: 13 September 2023). The Copernicus Sentinel-2 mission is composed of two polar-orbiting satellites: Sentinel-2A, launched on 23 June 2015, and Sentinel-2B, launched on 7 March 2017. The mission can provide global coverage data with a revisit time of 2–5 d and a swath width of 290 km. The MultiSpectral Instrument (MSI) on board both Sentinel-2 satellites incorporates 13 channels spanning the visible and near-infrared spectra, featuring spatial resolutions that vary between 10 and 60 m. Sentinel-2 data have been used to support a variety of applications including land management, natural resource monitoring, and risk mapping (Ienco et al., 2019; Ramoelo et al., 2015; Varghese et al., 2021). Recent studies have demonstrated the potential of Sentinel-2 to monitor methane super-emitters (Ehret et al., 2022; Gorroño et al., 2023; Radman et al., 2023; Varon et al., 2021; Vaughan et al., 2024).
In this study, we use bands 11 (1610 nm) and 12 (2190 nm) for methane signal retrieval and bands 3 (560 nm), 8 (842 nm), and 11 (1610 nm) for artifact filtering. We resample the data to 20 m resolution using the ESA SNAP toolbox for Python and discard scenes with cloud coverage greater than 80 %. Sentinel-2 observations are collected in the vicinity of six O&G fields with reported ultra-emissions (Irakulis-Loitxate et al., 2022; Sánchez-García et al., 2022; Varon et al., 2021; Zhang et al., 2022). These satellite data are then processed with the methods described in Sect. 2.2 and 2.3, by which methane retrieval signal datasets used for constructing and evaluating the proposed method (see Sect. 3) are generated.
2.2 Framework for multispectral satellite point source detection and quantification
Figure 1 shows the workflow of methane super-emitter monitoring using Sentinel-2 satellite data, with algorithms developed in this study highlighted in red text. The workflow primarily includes three steps: methane signal retrieval, source detection, and flux quantification.
First, methane signals are retrieved from satellite measurements. We employ the structural similarity index measure (SSIM) algorithm (Zhou et al., 2004) to filter out cloudy observations (Fig. S1) and the low-reflectance adaptive detection (LRAD) algorithm developed in this study (Sect. 2.3) to filter out other interference. We then compute the fractional methane absorption signal (ΔR, unitless) using the band ratio method, similarly to Ehret et al. (2022) and Irakulis-Loitxate et al. (2022):
where and represent observations on the date of interest (t) and and represent reference conditions without any methane enhancement. We borrow the idea of sliding time window in Ehret et al. (2022) to predict and by the multivariate linear regression (MLR) model trained on band 11 and band 12 observations in the time window (within 60 d prior to date t). Data excluded by SSIM and LRAD are not used for the MLR model training. See Sect. S1 in the Supplement for detailed information on the methane signal retrieval step.
Second, we train an automated detector to detect potential methane super-emitters based on retrieved ΔR, in place of human inspection. We annotate ΔR images retrieved from Sentinel-2 observations of six methane super-emitters (Table 2). The dataset is then used to train and evaluate a deep subdomain adaptation network (DSAN) (Sect. 2.4) to detect whether an image contains methane plumes. Our work demonstrates that the DSAN detector, trained with a relatively small number of annotated ΔR images, shows promising performance in unknown source detection.
Finally, we quantify emission fluxes (kg h−1) of detected methane plumes by employing the integrated mass enhancement (IME) method (Frankenberg et al., 2016; Varon et al., 2018). See Sect. S2 for detailed descriptions of the flux quantification method.
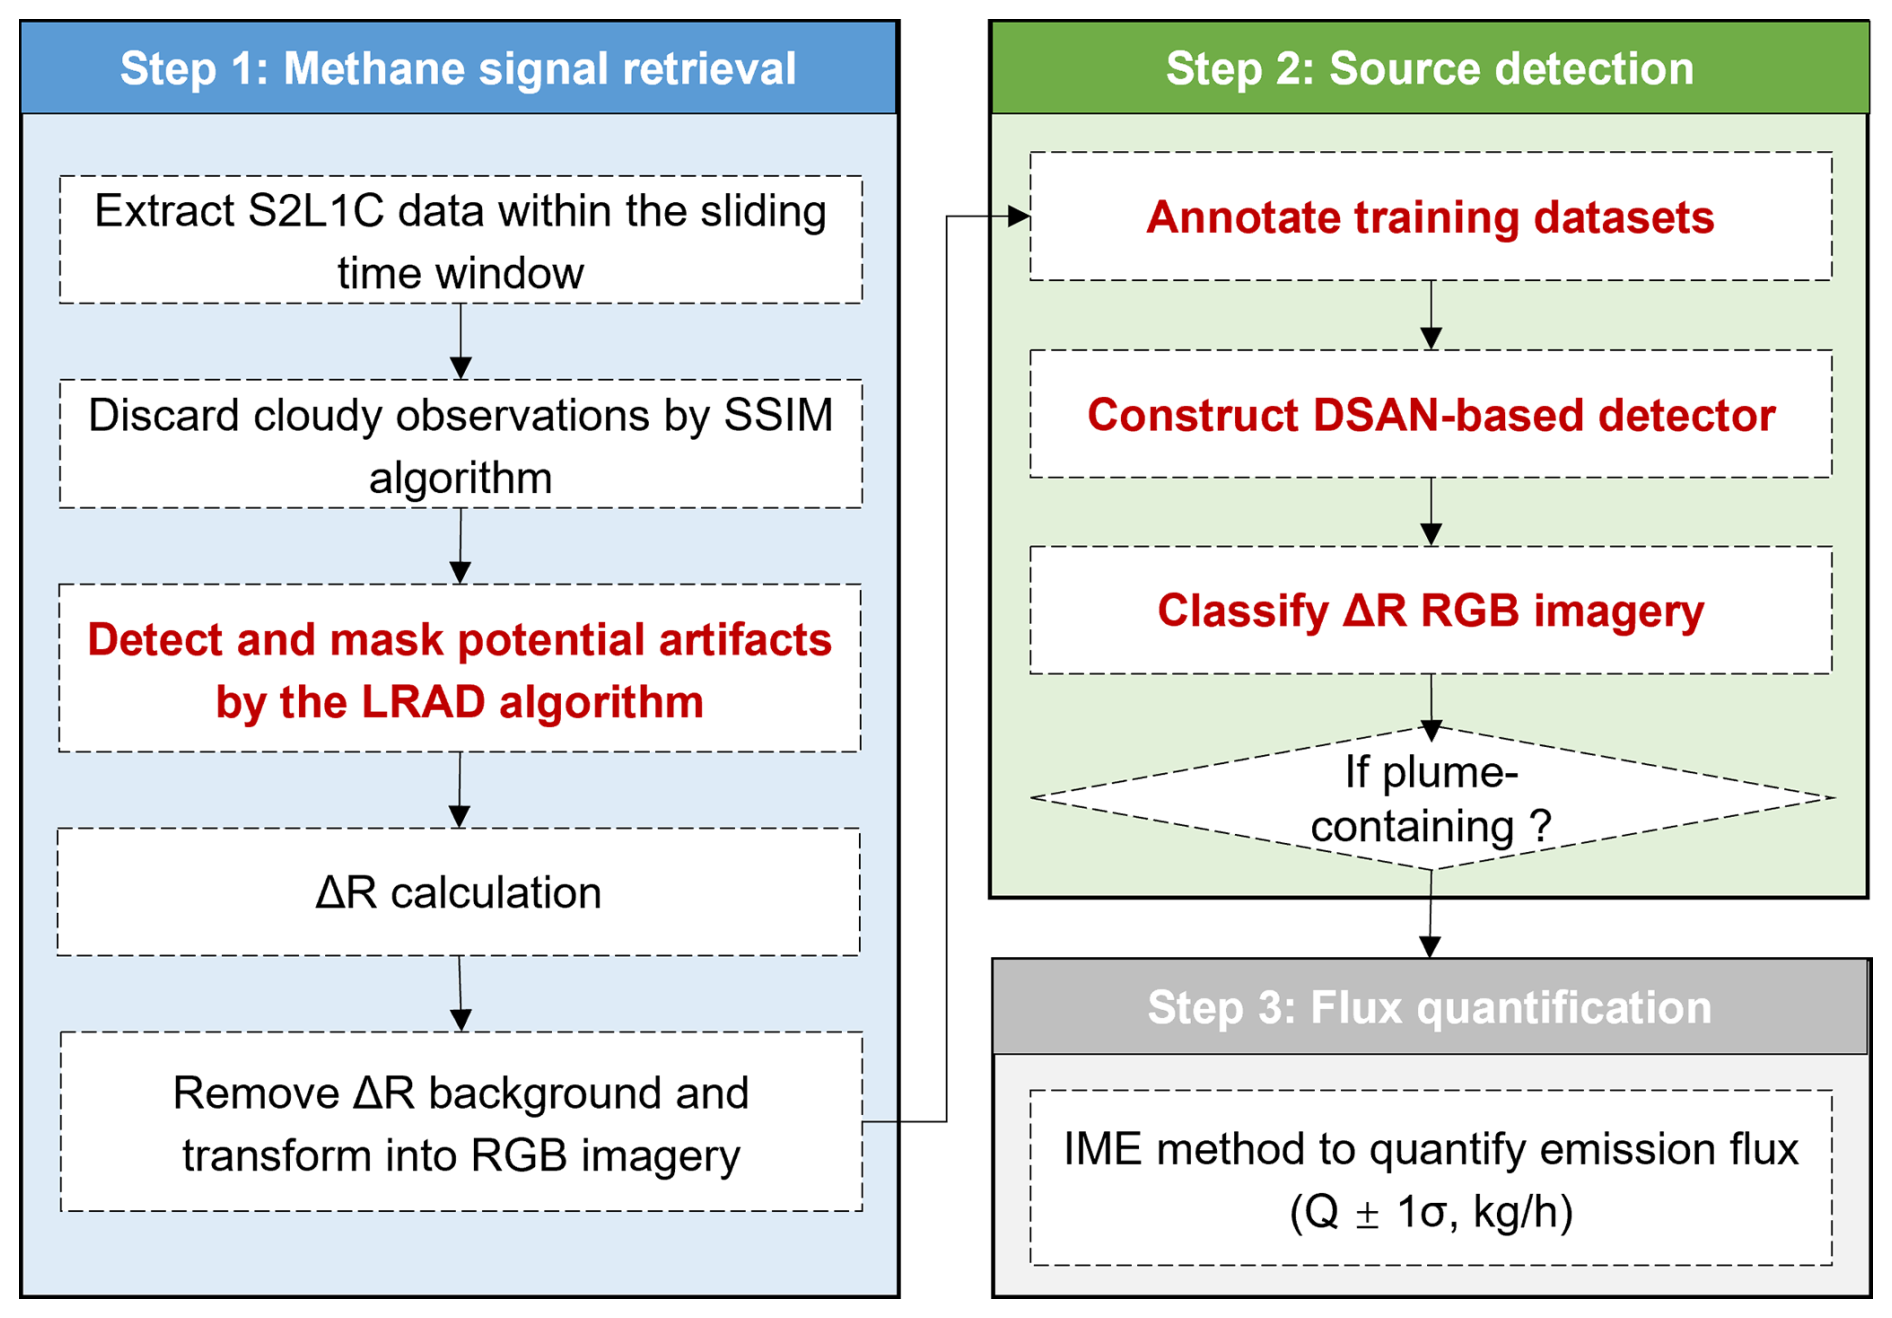
Figure 1The methane super-emitter monitoring workflow (from Sentinel-2 L1C (S2L1C) product to emission flux of the detected methane point emission signal). Text in red highlights the novel algorithms developed in this study.
2.3 Low-reflectance artifact detection (LRAD) algorithm for artifact removal
To increase the signal-to-noise ratio of Sentinel-2 methane retrieval, we develop a low-reflectance artifact detection (LRAD) algorithm to identify and remove various artifacts associated with low reflectance in the methane-sensitive band by surface features. Figure 2a and b show examples of these potential artifacts resulting from varied surface elements including smoke (from burning flare), rocky soil (with high mineral content), dark soil (with high organic matter or water content), waterbody, cloud shadow, and vegetation (Gorroño et al., 2023; Naus et al., 2023). These artifacts in the shortwave infrared (SWIR) bands may be filtered out by leveraging additional bands that are sensitive to the artifacts but insensitive to methane (Fig. 2c).
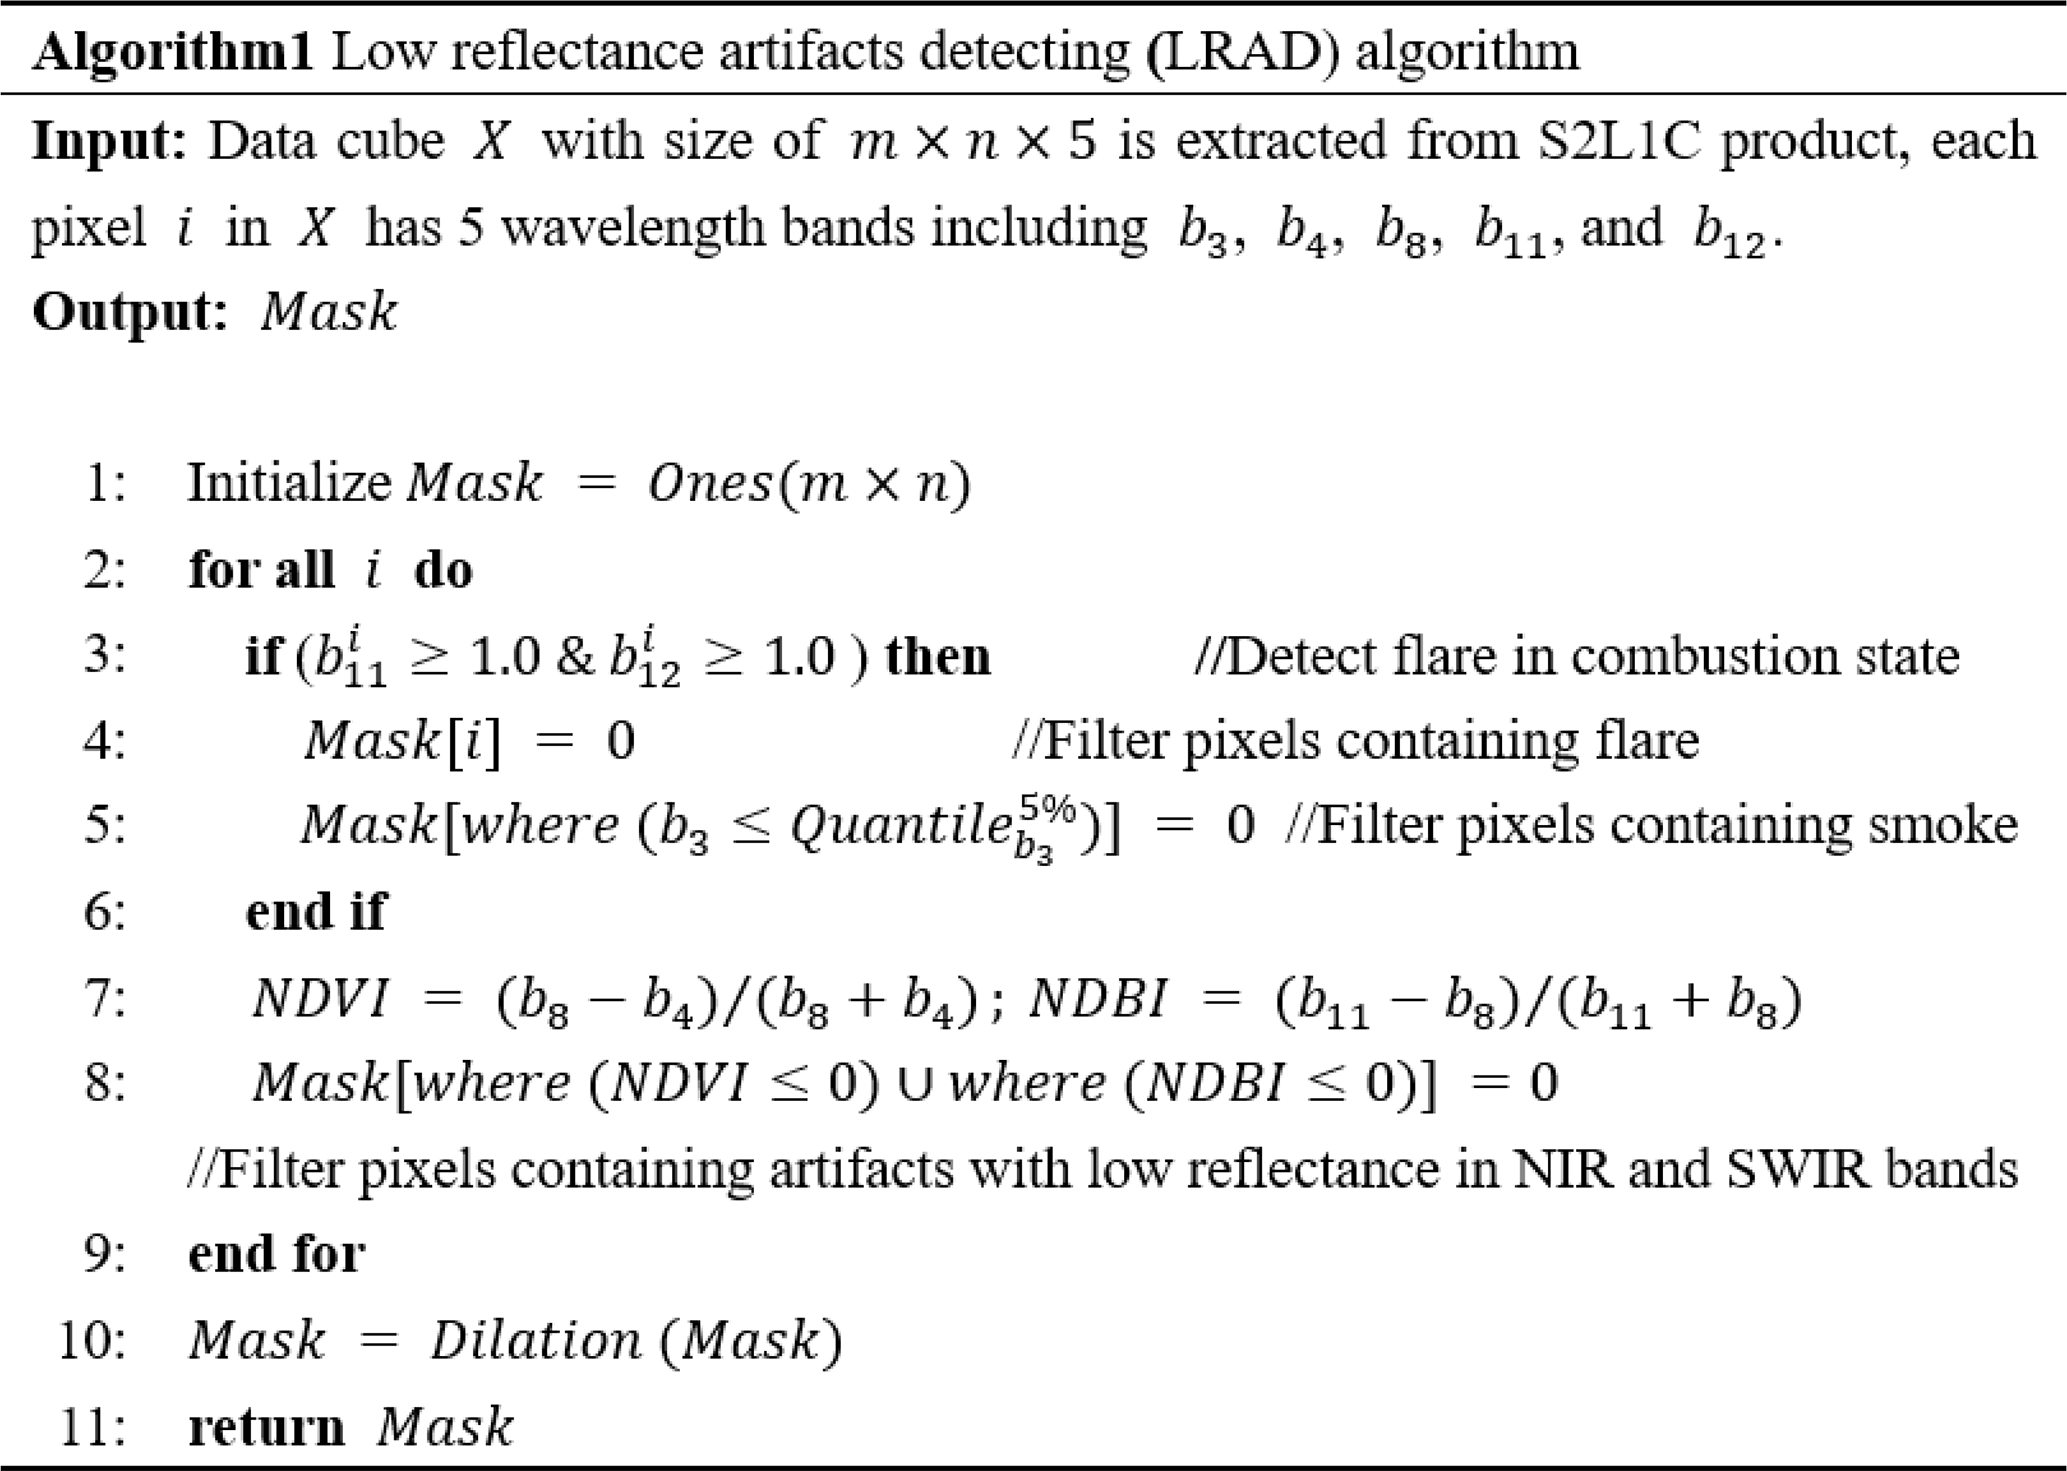
Algorithm 1 shows the pseudocode of the LRAD algorithm, which creates a surface artifact mask using bands 3 (560 nm), 4 (665 nm), and 8 (842 nm), in addition to bands 11 and 12. For combustion-related artifacts, the algorithm first filters out pixels with saturated reflectance in bands 11 and 12, which are related to thermal anomalies from high-temperature combustion (Liu et al., 2021). The algorithm then filters out pixels affected by heavy smoke, identifiable by extraordinarily low visible-band reflectance in band 3 (the 5 % lowest values of the scene). We calculate the standard deviation σ and then apply 2σ (around 95 % confidence interval) as the masking threshold. The above mask is then dilated to ensure that interference from combustion sources is removed.
Additionally, the LRAD algorithm filters out pixels with concurrent negative values of the normalized difference vegetation index (NDVI) (band 8 and band 4) and the normalized difference built-up index (NDBI) (band 8 and band 11), which are related to low-reflectance objects in SWIR such as waterbodies (Biermann et al., 2020; Fan et al., 2020; Purio et al., 2022). Positive values of these indices have been used in literature to detect healthy vegetation and urban areas (Kuc and Chormański, 2019).
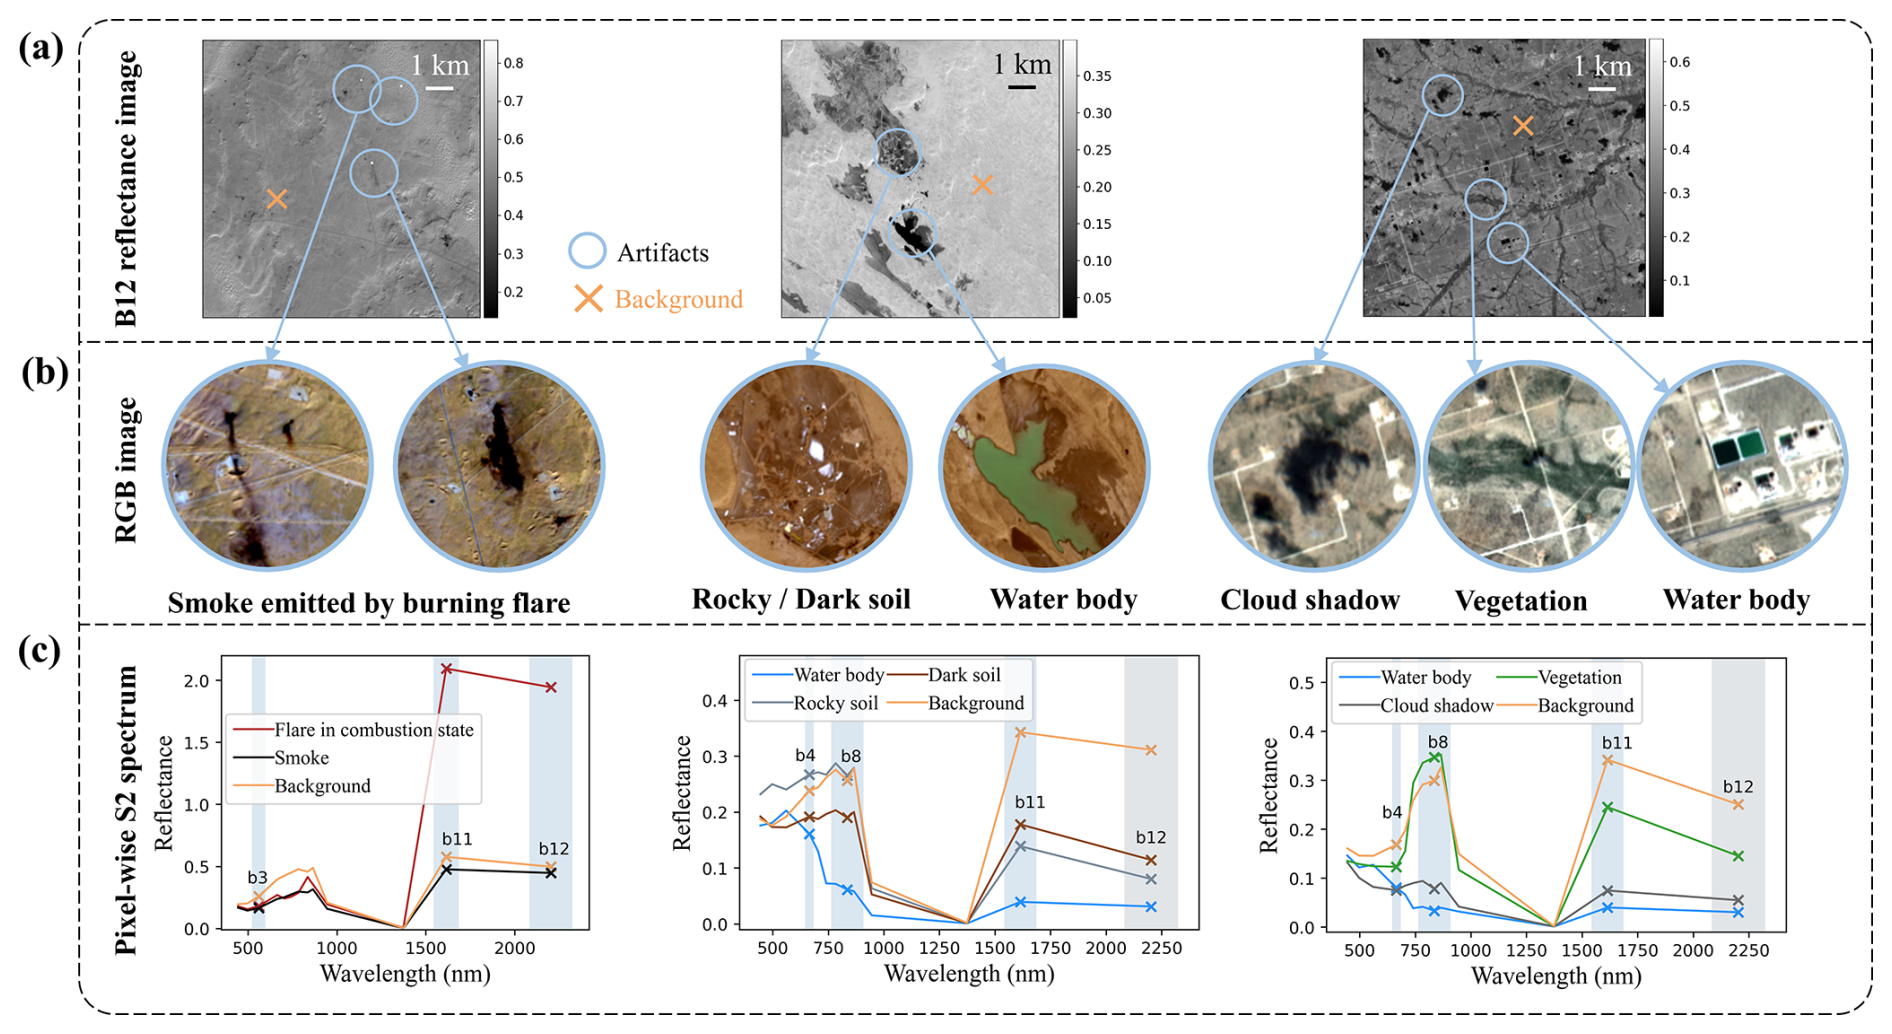
Figure 2Examples of varied artifacts in Sentinel-2 (S2) L1C reflectance images. (a) S2L1C band 12 (b12) reflectance images in Hassi Messaoud (20190117T32SKA (based on date in the format yyyy-mm-dd, tile 32SKA)), Gamyshlja Gunorta (20200404T40SBH), and the Permian basin (20190126T13SGR). (b) Representative RGB images of the artifacts presenting low reflectance in b12. (c) Pixel-wise S2L1C reflectance spectrum of the background and representative artifacts. Bands used for identifying artifacts are shown in blue shading.
2.4 Deep transfer learning for methane source detection
We employ the deep subdomain adaptation network (DSAN) (Zhu et al., 2021) to detect the presence of methane plumes in retrieved ΔR images (Fig. 3). DSAN is a transfer learning algorithm that leverages feature representations acquired from a labeled source domain to enhance performance in the unlabeled target domain (Pan and Yang, 2010). Using DSAN, we attempt to address the challenge that a methane-source classifier trained with labeled data in one location (source domain) tends to perform inadequately in another location where labeled data are unavailable (target domain) because of great differences in surface characteristics between regions (domain shift).
Figure 3 illustrates the structure of DSAN applied in this study. DSAN consists of deep feature extraction blocks and a domain adaptation module. Feature extraction is performed by adapting a pre-trained residual neural network (ResNet-50) as the backbone of DSAN. ResNet-50 has demonstrated exceptional performance in various image classification tasks, especially those based on spatial context, largely because of its strong feature mining capability enabled by shortcut connections (Burke et al., 2021) (see Fig. S2). ResNet-50 consists of 16 residual blocks that contain a series of convolutional layers and shortcut connections. Following each convolutional layer, there is a subsequent batch normalization (BN) layer and a rectified linear unit (ReLU) activation function.
The domain adaptation module transforms deep features extracted by ResNet-50 to align the feature distributions between source and target domains. The alignment is performed based on the local maximum mean discrepancy (LMMD), which measures the distance between feature distributions (Zhu et al., 2021). The general form of LMMD is presented as
where Ds and Dt are the samples in source and target domain, P and Q are the probability distribution of Ds and Dt, and i is the class of the sample (plume-containing or plume-free). ϕ(⋅) represents a feature mapping function, and ∥⋅∥H is the norm in the Hilbert space. LMMD is designed to capture both global (whole dataset) and local (each class) domain differences and therefore is sensitive to variability within each class. This property is important for our application because the differences between the two classes (plume-containing and plume-free ΔR images) are more subtle compared to a typical image classification task.
DSAN is first trained using labeled ΔR images in the source domain and unlabeled ΔR images in the target domain before it is used to predict labels for target domain images. The input ΔR imagery is transformed to match the ResNet-50 (which serves as the backbone of DSAN) input format. Before feeding into the network (Fig. 3), the input image was resized to , augmented by randomly flipping the images horizontally during the training process and then normalized to ensure that the three channels had a consistent scale. The model is trained with a learning rate of 0.001 using a stochastic gradient descent (SGD) optimizer over 100 epochs.
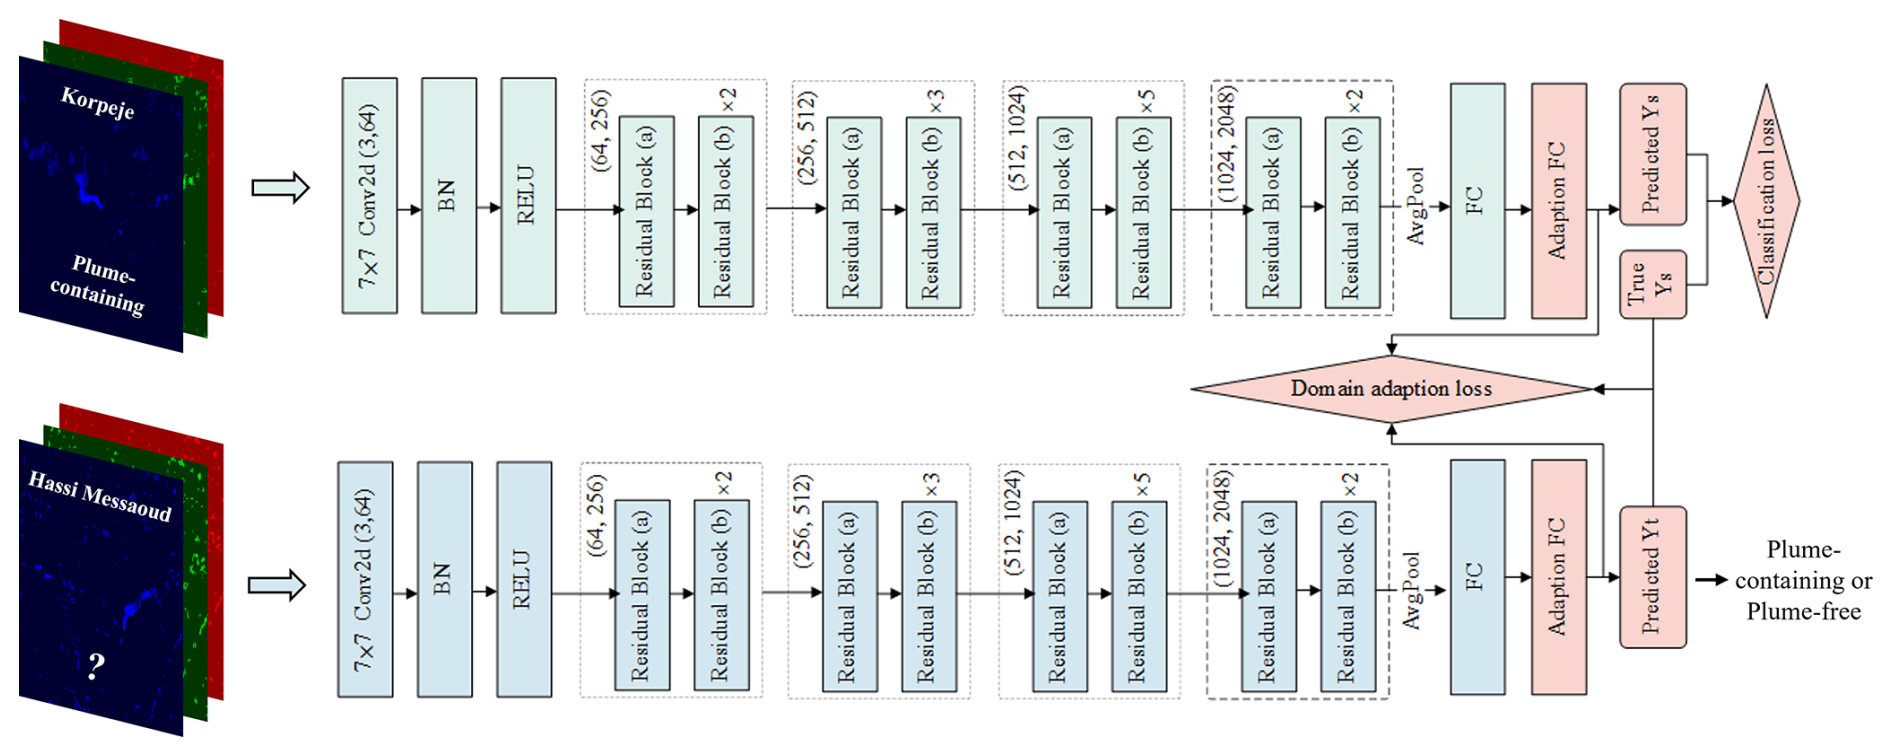
Figure 3The architecture of DSAN. DSAN employs ResNet-50 to learn features from labeled (green) and unlabeled (blue) data and then the domain adaptation module (red) to reduce the domain distribution discrepancy. FC refers to fully connected layer.
3.1 Methane retrieval (ΔR) imagery dataset construction
We compile ΔR datasets containing six reported super-emitters using Sentinel-2 L1C observations (Table 2). These super-emitters are located across five oil and gas fields with substantially diverse surrounding terrain and surface characteristics, and they also vary in the types of emitting facilities (e.g., compressor stations, flares, well pads, and pipelines) and in the magnitude of emission fluxes (ranging from 2 to 100 t h−1). Each sample in the dataset consists of a ΔR image retrieved from the satellite data and a corresponding label, manually determined, indicating the presence or absence of methane sources (plume-containing or plume-free).
3.1.1 Data preprocessing
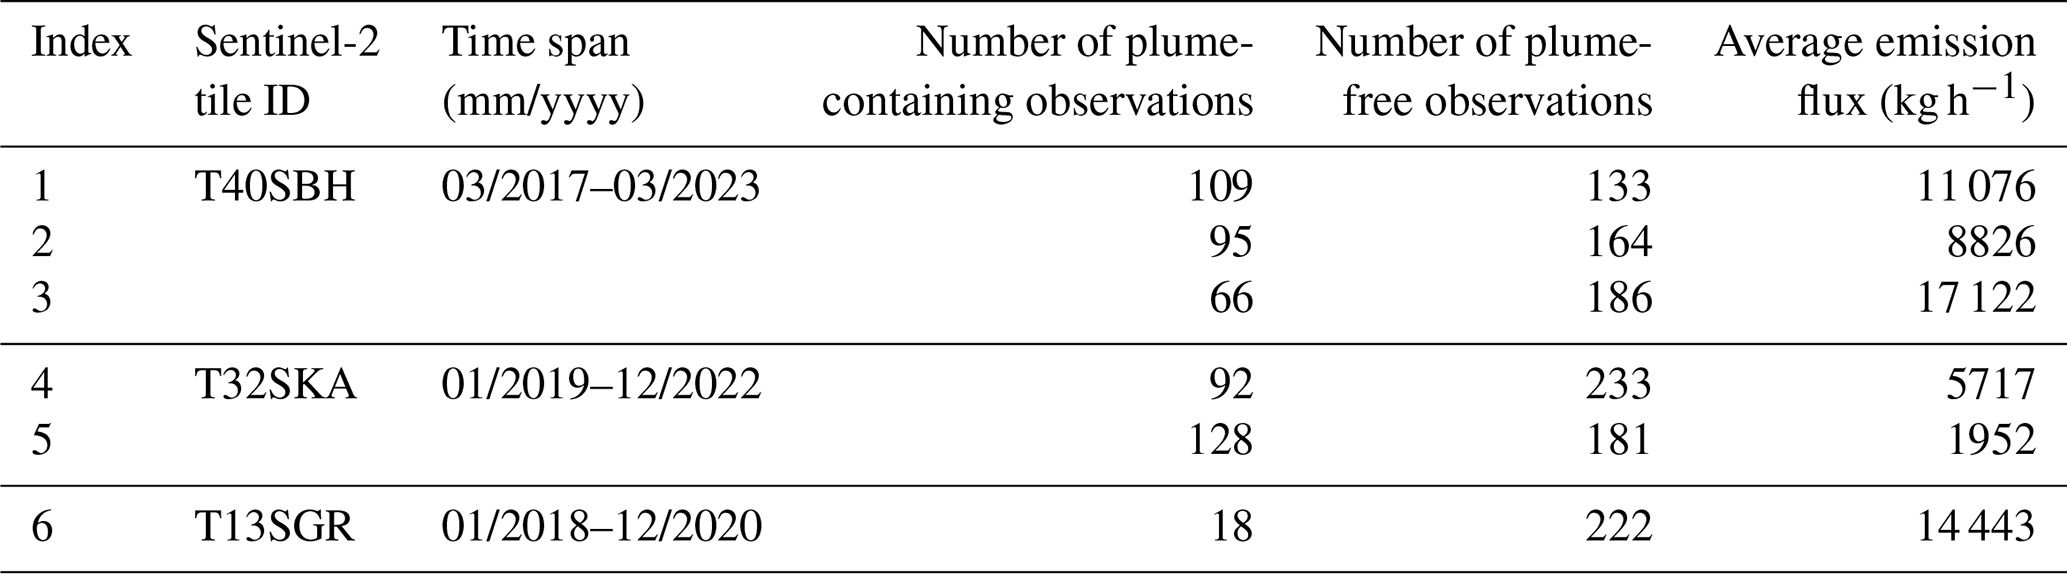
To construct the dataset, we use Sentinel-2 data tile 40SBH (March 2017 to March 2023) for emitters 1, 2, and 3; tile 32SKA (January 2019 to December 2022) for emitters 4 and 5; and tile 13SGR (January 2018 to December 2020) for emitter 6 (Table 2). To account for variations in Sentinel-2 observation density and the differing emission dates of super-emitters, we select distinct time periods for data collection. This ensures a comparable number of methane point source observations across the datasets. The selected satellite observations are cropped into patches of 16 km2, which are then prepared as input for the proposed algorithm to facilitate methane detection.
Table 2Reported methane super-emitters detected by multispectral satellite instruments.
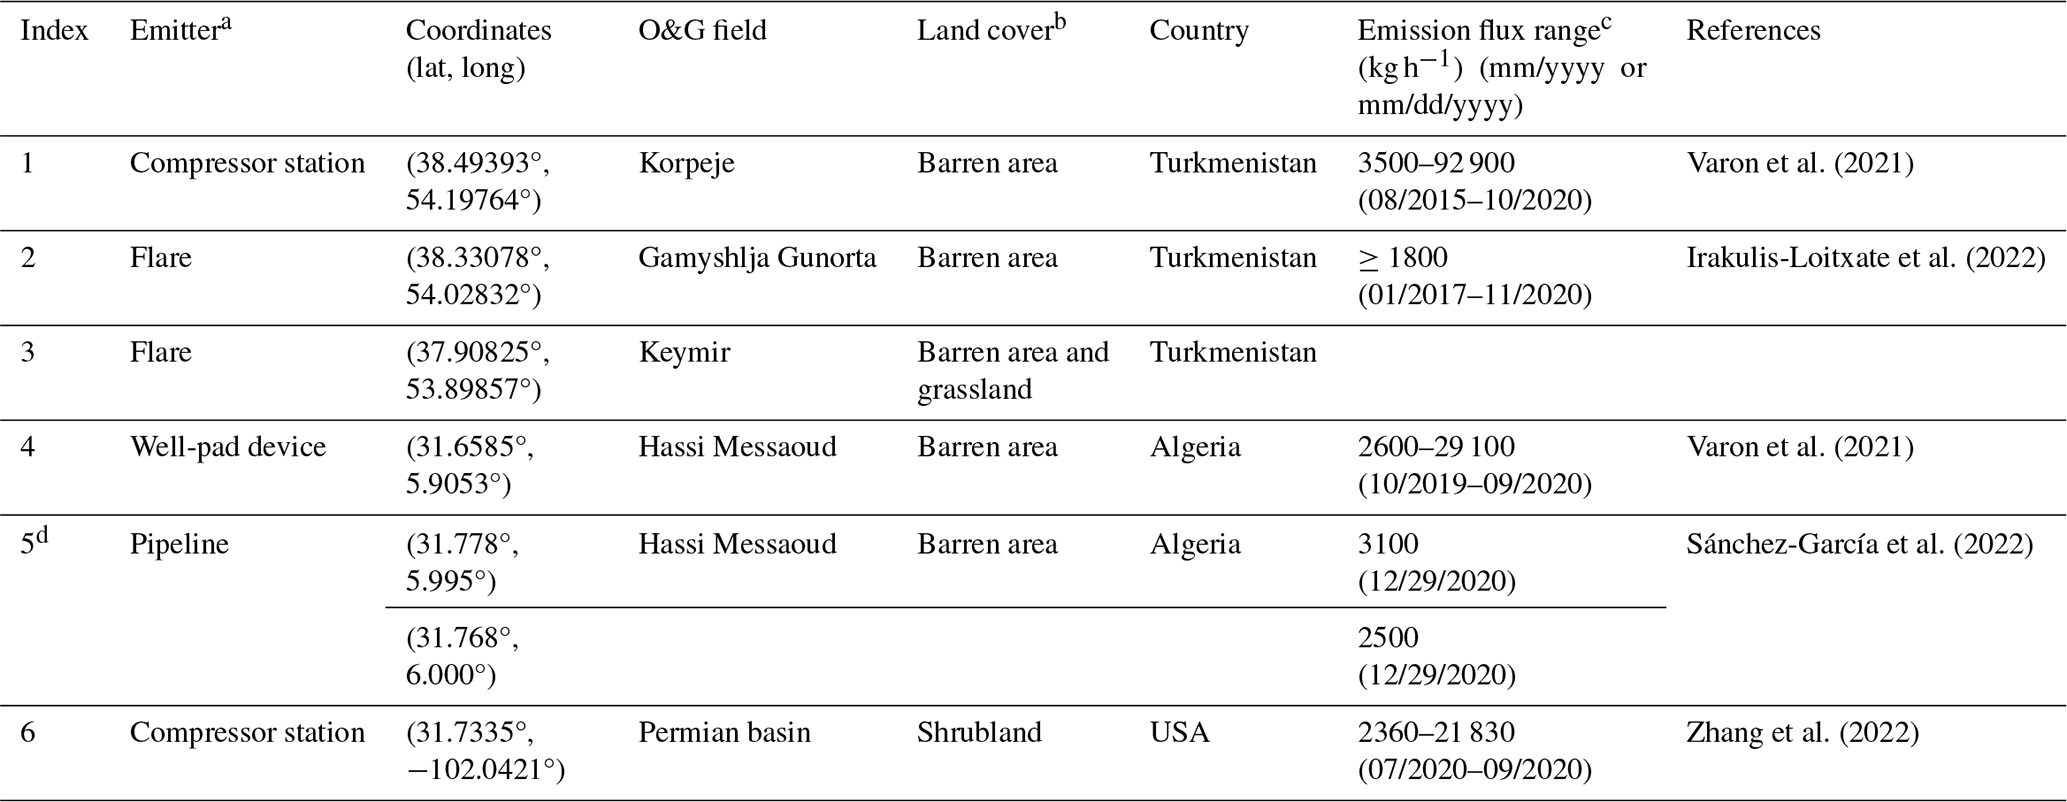
a Reports of these sources are all based on Sentinel-2 data except for no. 5 which is based on WorldView-3. b Land cover type near the emitter is obtained from the annual ESA CCI land cover map 2020 (https://maps.elie.ucl.ac.be/CCI/viewer/index.php, last access: 8 November 2023) as a reference. It is noted that the land cover map has a spatial resolution of 300 m, which cannot reflect surface features smaller than an area of 300 m2. c Values in this column represent emission flux during the time range or date studied in the literature. It is noted that the emission flux of emitters 2–3 has not been reported by Irakulis-Loitxate et al. (2022), and 1800 kg h−1 is the detection limit of Sentinel-2 provided in the literature. d Emitter 5 contains two pipeline leakage sources approximately 1.2 km apart. They are numbered together since they are only around 60 pixels apart in the 20 m resolution Sentinel-2 image.
Using the Sentinel-2 patches as input, we apply the methane signal retrieval workflow (Step 1 in Fig. 1) to generate methane retrieval (ΔR) imagery. Our workflow includes the LRAD algorithm (Sect. 2.3) proposed in this study to reduce noise and artifacts. Figure 4 shows examples of artifact masks generated by LRAD and compares the ΔR images with and without applying the masks. This result demonstrates that the algorithm can detect and remove various types of surface artifacts, including dark soil, rocky soil, waterbody, burning flare, smoke plume, vegetation, and cloud shadow. Figure S6 presents additional examples where LRAD generates masks that are adaptive to temporal changes in the land cover and are thus capable of detecting seasonally varying artifacts. As shown in Fig. 4, removing these artifacts by the LRAD algorithm enhances signal-to-noise ratios (SNRs) (defined as , where avg and standard deviation (SD) are calculated from the entire ΔR image) in ΔR images by 12.12 %–42.30 %, facilitating the following source detection step. Figure S7 compares the averaged SNRs of the six ΔR datasets before and after deploying the LRAD algorithm.
The procedure described above generates ΔR images in grayscale format, with a size of 200 pixels × 200 pixels. To ensure compatibility with the input structure of the pre-trained ResNet50 model, we transform the 200 × 200 grayscale ΔR matrix into a 224 × 224 × 3 RGB image by applying a color map to the grayscale data and resizing it to the required dimensions. The resulting RGB imagery is then fed into the plume detection model.
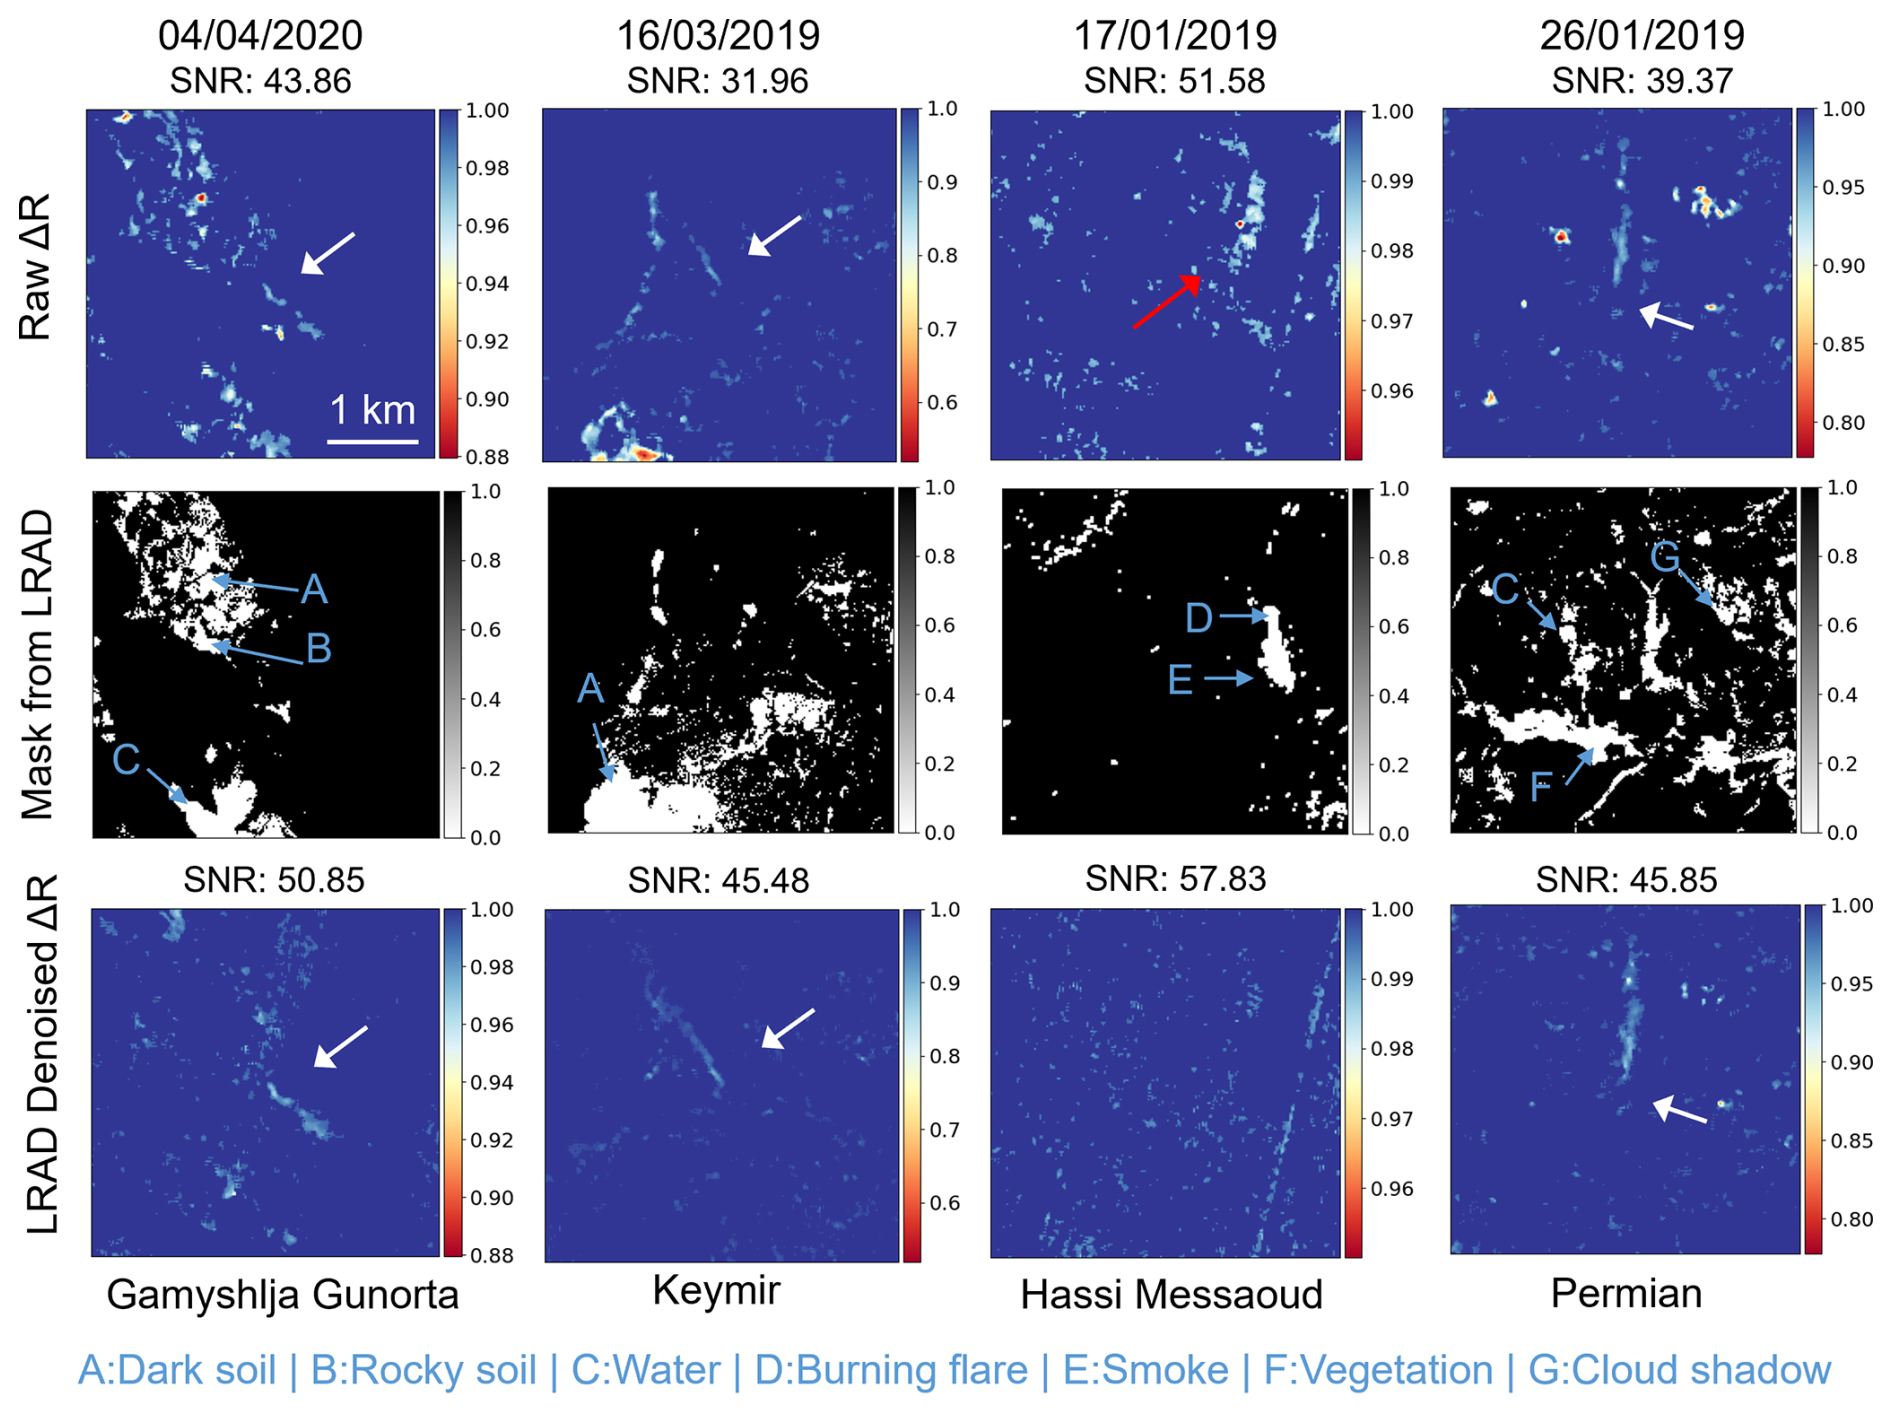
Figure 4Examples of the ΔR images and masks. The first row shows the raw ΔR images outputted by Step 1 procedures (Fig. 1) without LRAD deployed, the second row displays the latent artifacts masks generated by the LRAD algorithm, and the third row exhibits the denoised ΔR images outputted by Step 1 procedures (Fig. 1) with LRAD performed. White arrows indicate true methane plumes, and the red arrow indicates plume-like artifacts. Blue characters and arrows in the binary masks point to different types of latent artifacts.
3.1.2 Data annotation
Subsequently, we label the ΔR images following the decision rule as described in Fig. 5 and Sect. S3. Table 3 summarizes the information of the methane imagery dataset retrieved from Sentinel-2 L1C data. The dataset consists of subsets of six super-emitters reported in the literature (Table 2). Each subset contains 200–400 samples. These subsets differ greatly in the ratio between positive (plume-containing) and negative (plume-free) samples, ranging from 8.1 % in no. 6 to 81.95 % in no. 1, reflecting large variations in emission frequencies among varied sources. Most of the positive samples contain one methane plume, except for no. 5, in which occasionally two methane plumes are present simultaneously. Moreover, the background noises exhibit considerable variations among the six subsets (Fig. 6). Subsets 1, 4, and 5 present uniform noises originating from homogeneous surfaces, yet subsets 2, 3, and 6 have greater heterogeneity, resulting in a higher occurrence of artifacts. We quantify the emission rates of positive samples using the IME method (Sect. S2) (Fig. S5). The average emission flux varies from 1952 kg h−1 in no. 5 to 17 122 kg h−1 in no. 3.
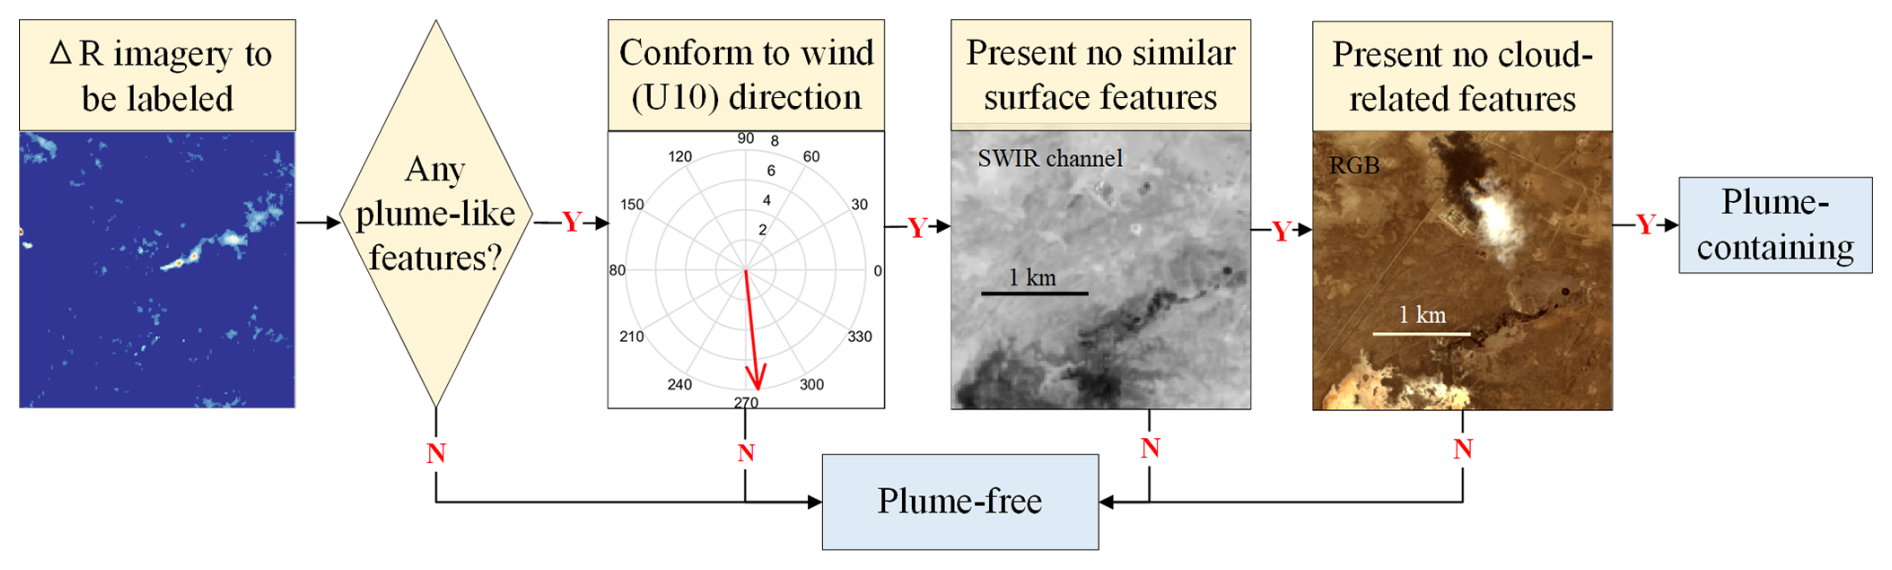
Figure 5A flowchart of the labeling decision rule of ΔR imagery (detailed description is provided in Sect. S3).
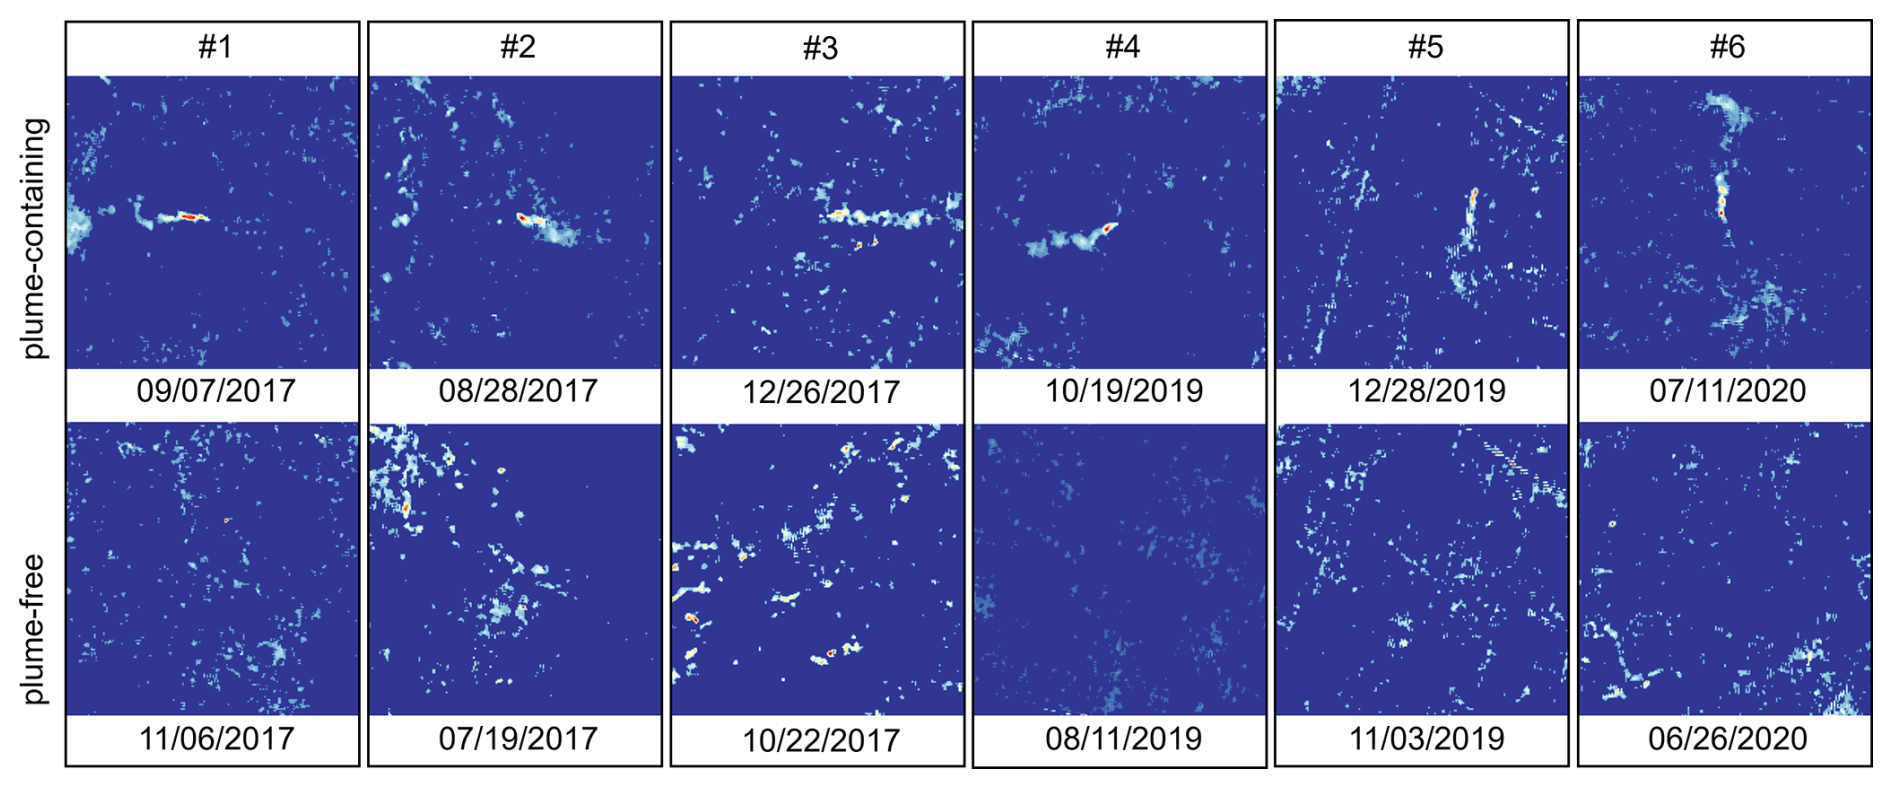
Figure 6Examples of the plume-containing and plume-free images in ΔR datasets 1–6. The date format is mm/dd/yyyy.
3.2 Experimental design
3.2.1 Performance evaluation on transfer tasks
We design two experiments (Fig. S4) to evaluate the performance of the DSAN framework in detecting unknown sources, using the six ΔR datasets for training and evaluation. The detailed training, validation, and test set configuration is presented in Table S1. In the first experiment (“1 → 1” task), we use one of the six datasets in Table 3 as the source domain (labels available to the algorithm) and another dataset in Table 3 as the target domain (labels unavailable to the algorithm and to be predicted). In total, there are tasks of the 1 → 1 type to be evaluated. For each 1 → 1 task, we roughly have 250 ΔR images in the source domain and other 250 in the target domain. In the second experiment (“5 → 1” task), five datasets in Table 3 are used as the source domain, and the remaining one is used as the target domain, yielding six 5 → 1 tasks. Each 5 → 1 task contains about 1250 ΔR images in the source domain and 250 images in the target domain. The 1 → 1 tasks assess how well a detector, trained on data from a known source, can detect unknown sources, while the 5 → 1 tasks evaluate whether performance can be enhanced by including training data from multiple sources.
To compare, we also build four conventional convolutional neural networks (CNNs) (Fig. S3) based on MethaNet (Jongaramrungruang et al., 2022), ResNet-50 (Zortea et al., 2023), VGG16 (Radman et al., 2023), and EfficientNet-V2L (Radman et al., 2023), which, unlike DSAN, do not contain a domain adaptation module. We train the MethaNet model from scratch and the other conventional CNNs model with a fine-tuning strategy demonstrated by Radman et al. (2023). The source domain images serve as the training and validation sets for conventional CNNs, while the target domain images are used for testing. The training and validation sets are created by randomly splitting the corresponding source domain data into an 80 : 20 ratio. Unlike DSAN, which does not require a validation set due to the adaptation layer, conventional CNN models rely on a validation set for hyperparameter tuning to optimize performance and mitigate overfitting.
The performance is assessed for each task with accuracy, precision, recall, and the macro F1 score using the scikit-learn package (Pedregosa et al., 2011). The main metric we use is the macro F1 score, computed as the average of F1 scores for each class (harmonic mean of precision and recall). The macro F1 score has a range of 0–1, suitable for datasets with imbalanced positive and negative samples. A higher macro F1 score indicates a better overall performance. Additional metrics encompass accuracy, representing the ratio of correctly predicted instances to the total instances; precision, calculated as the number of true positive predictions divided by the total number of positive predictions; and recall, determined by dividing the number of true positive predictions by the total number of actual positive instances.
3.2.2 Real-world application for new source discovery
In addition to the six ΔR datasets, we randomly selected an orbit (tile T32SKA) in the Hassi Messaoud oil and gas (O&G) field in Algeria to test the proposed workflow (Fig. 1) in a real-world scenario. The application spans an area of 4×10⁸ km2 and covers the period from July 2019 to June 2020. Satellite observations in the region are segmented into patches with an area of 16 km2, generating a total of 3537 ΔR images. These unannotated images are used as the target domain for DSAN, with the six labeled ΔR datasets (datasets 1–6, in total 1627 ΔR images) serving as the source domain. Finally, the results predicted by the detector are evaluated against manually determined labels.
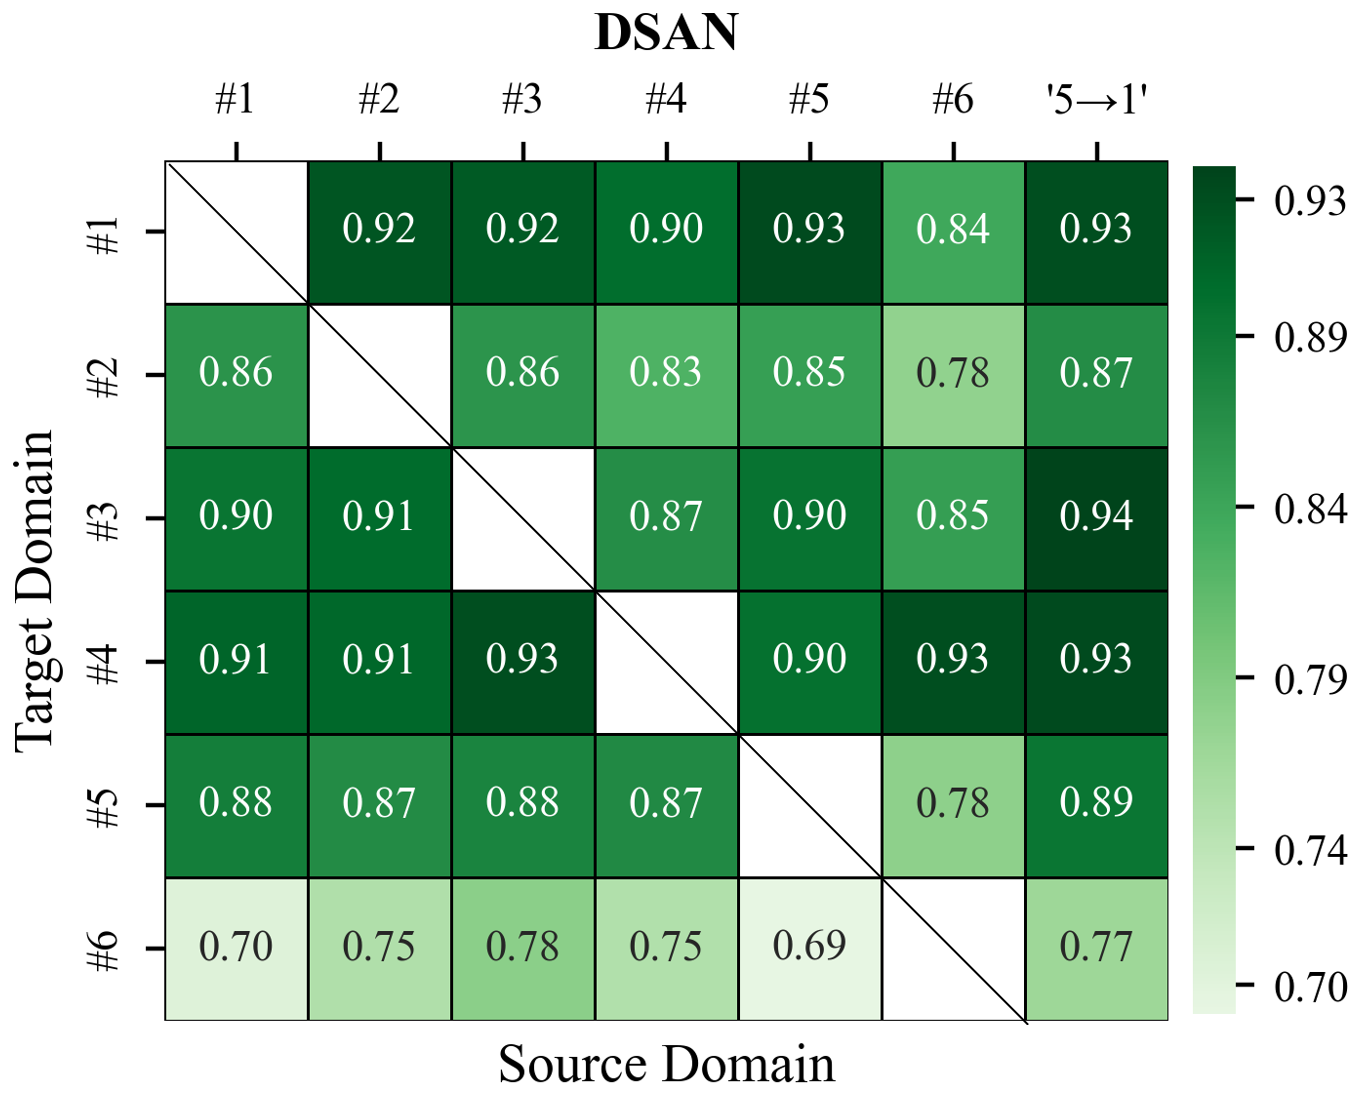
Figure 7Macro F1 scores on the transfer tasks given by DSAN. Each square represents a transfer task; 5 → 1 represents the source domain being fused by five datasets except for the target domain dataset.
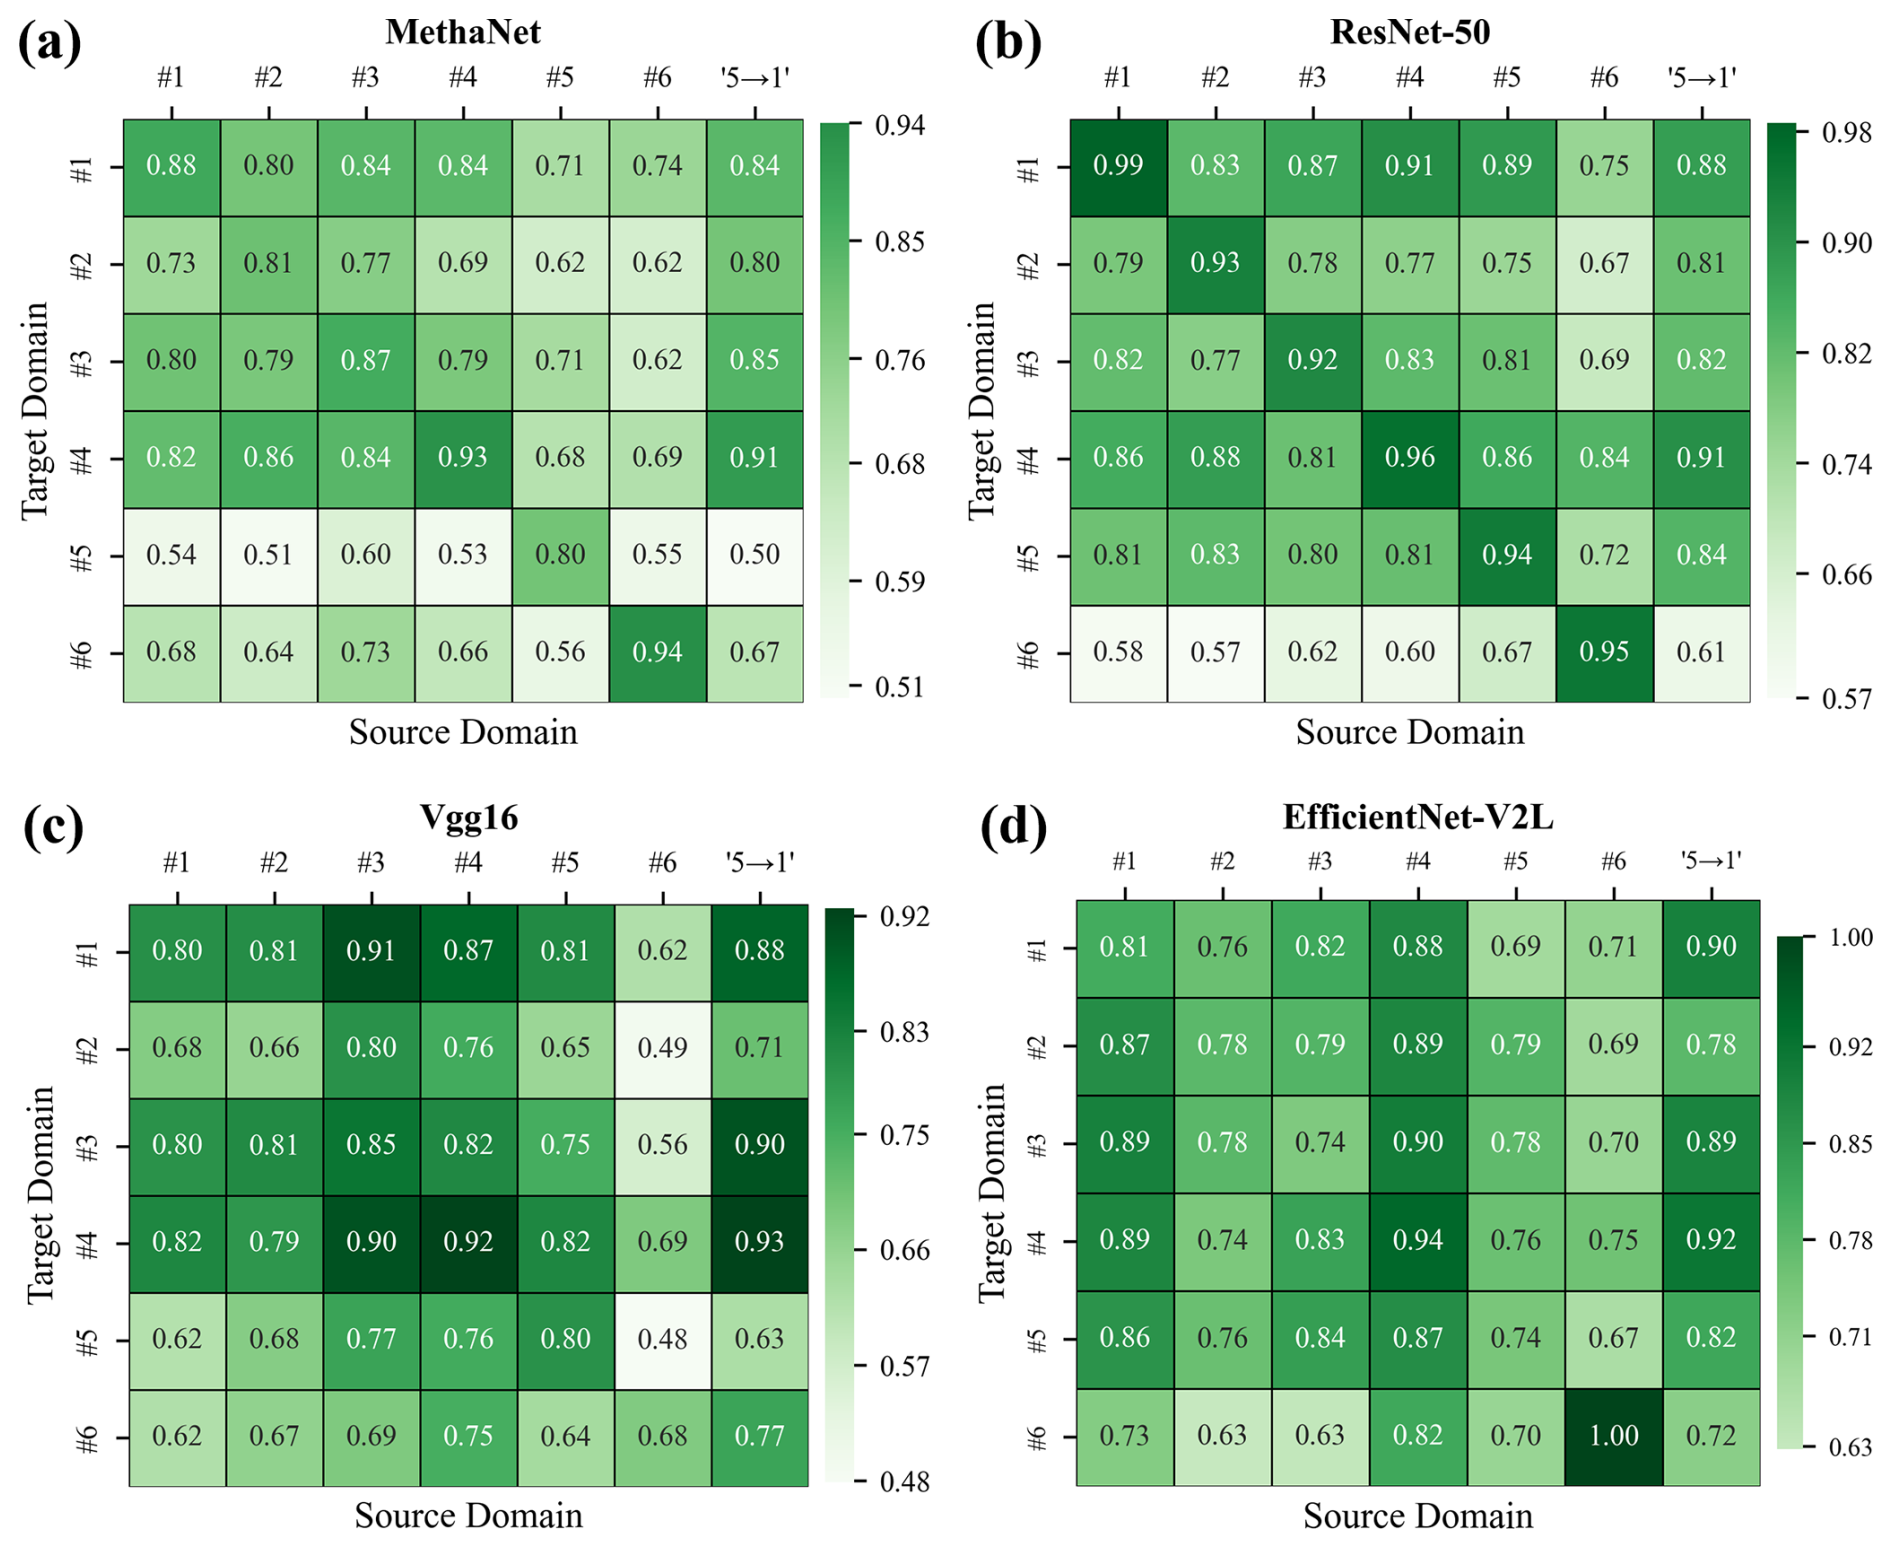
Figure 8Macro F1 scores given by (a) MethaNet, (b) ResNet-50, (c) VGG16, and (d) EfficientNet-V2L. Each square represents a task. Tasks on the diagonal pertain to non-transfer tasks, with each dataset partitioned into a training set (80 %) and a validation set (20 %). Tasks outside the diagonal are transfer tasks. Under the 1 → 1 task, the diagonal square shows the macro F1 score on the validation set and the square outside the diagonal shows the score on the test set; 5 → 1 denotes the source domain being fused by five datasets except for the target domain dataset.
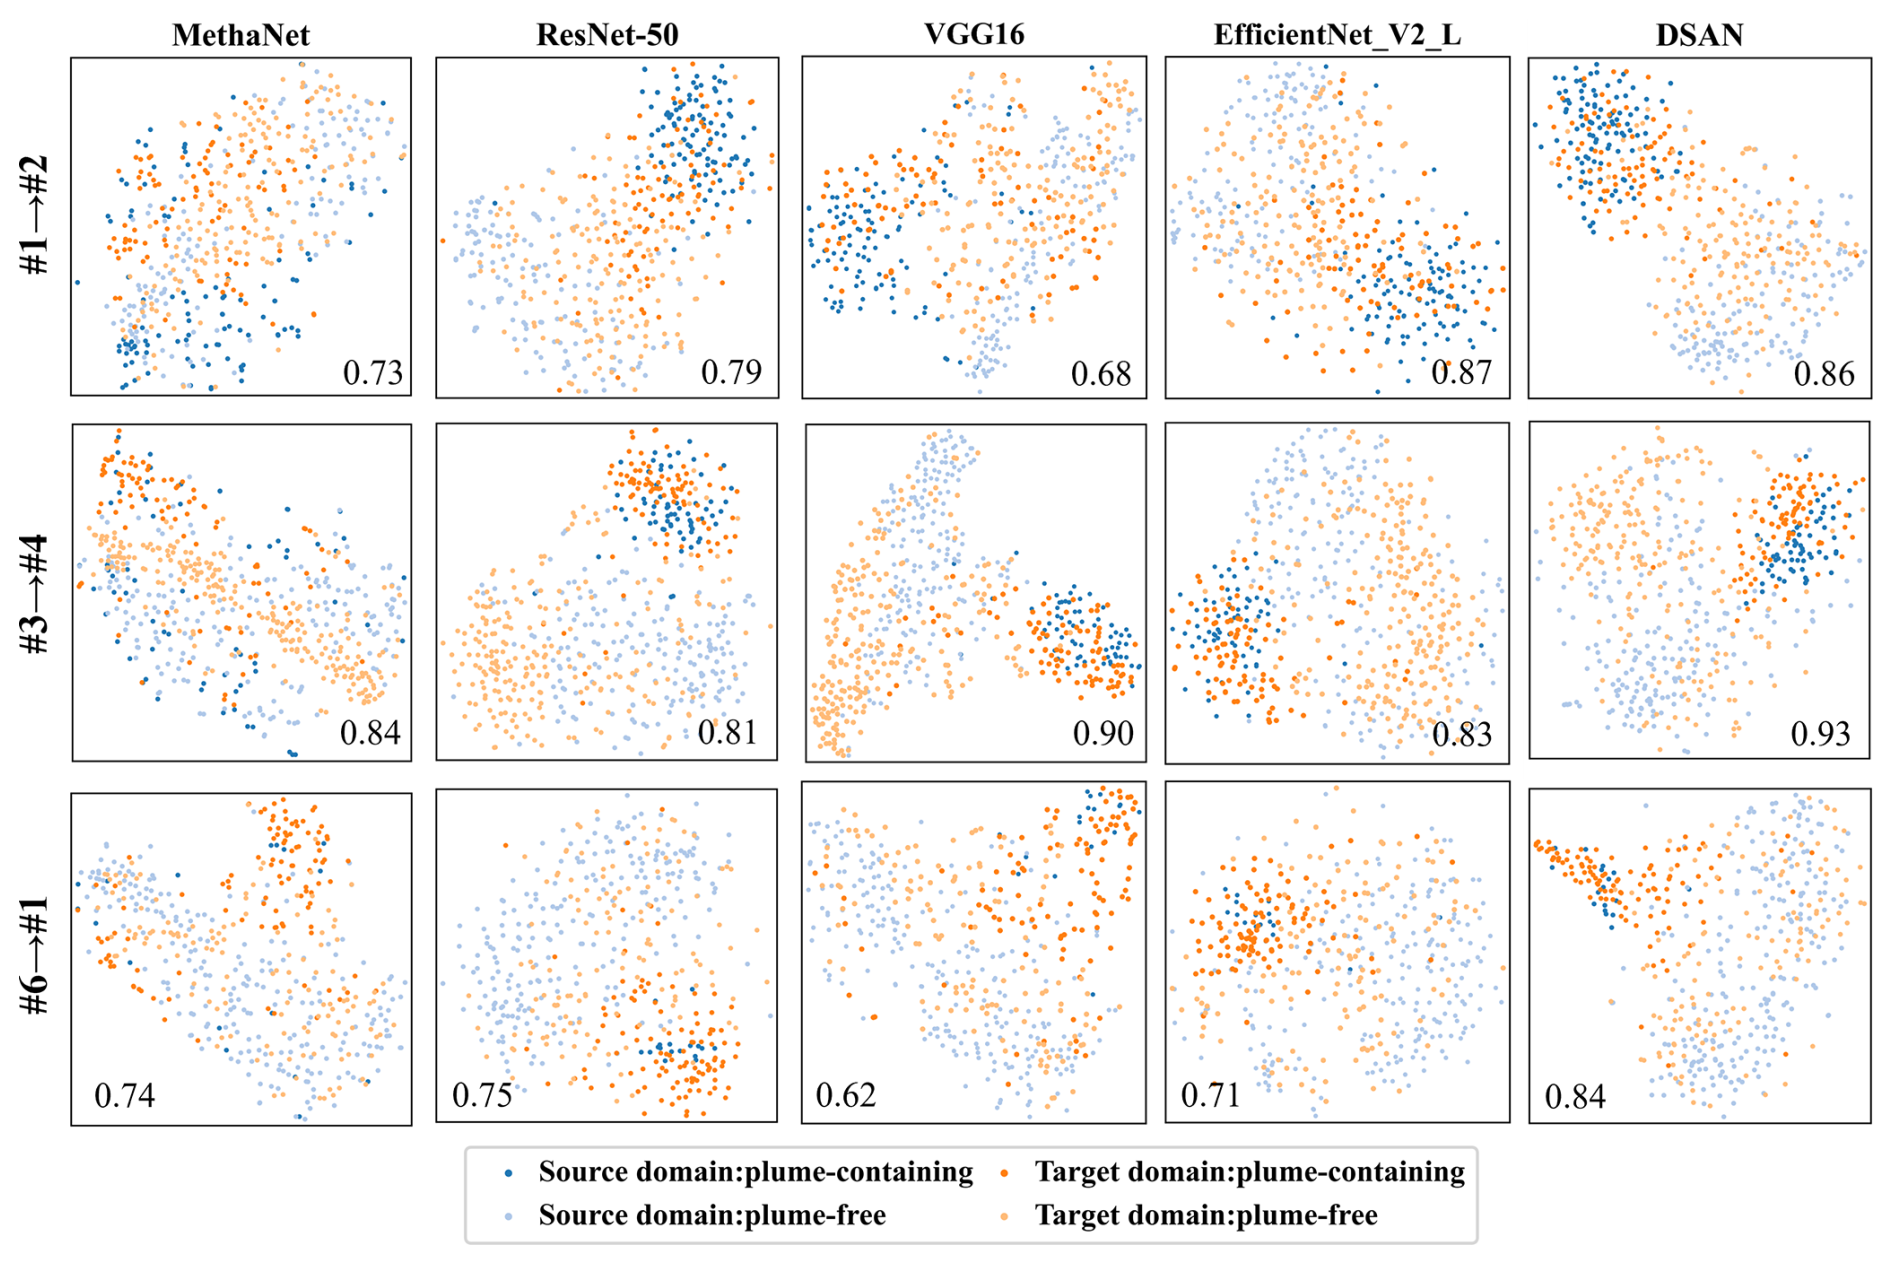
Figure 9t–stochastic neighbor embedding (SNE) visualizations of the learned feature representations of the ΔR datasets across different models and transfer tasks, providing insights into domain shift and how well the well-trained models identify different classes in the target domain. From the left to right column: MethaNet, ResNet-50, VGG16, EfficientNet-V2L, and DSAN on three 1 → 1 transfer tasks (1 → 2, 3 → 4, and 6 → 1). Each point represents a data sample. The number in each subfigure denotes the macro F1 score of the target domain label predicted by the model.
Figure 7 evaluates the ability of the DSAN model to detect a methane source in an unannotated region (transferability) with the macro F1 scores achieved for varied 1 → 1 or 5 → 1 transfer tasks (Sect. 3.2.1). For comparison with conventional CNNs, Fig. 8 shows results of MethaNet, ResNet-50, VGG16, and EfficientNet-V2L for the same tasks. In addition to macro F1 scores, Tables S2–S7 also tabulate other performance metrics from the experiments, including accuracy, precision, and recall.
The DSAN model achieves average macro F1 scores of 0.86 (0.69 to 0.93) for the 1 → 1 tasks and 0.89 (0.77 to 0.94) for the 5 → 1 tasks (Fig. 7), which consistently outperforms MethaNet (0.70 for 1 → 1 tasks and 0.76 for 5 → 1 tasks) (Fig. 8a), ResNet-50 (0.77 for 1 → 1 tasks and 0.81 for 5 → 1 tasks) (Fig. 8b), VGG16 (0.73 for the 1 → 1 tasks and 0.80 for the 5 → 1 tasks) (Fig. 8c), and EfficientNet-V2L (0.78 for the 1 → 1 tasks and 0.84 for the 5 → 1 tasks) (Fig. 8d). The performance of conventional CNN models degrades substantially in these transfer tasks (off-diagonal of each panel in Fig. 8) compared to non-transfer tasks (training and validation data from the same locations) (average macro F1 scores are 0.87 for MethaNet, 0.95 for ResNet-50, 0.79 for VGG16, and 0.84 for EfficientNet-V2L) (diagonal of each panel in Fig. 8), demonstrating the challenges of transfer tasks. Moreover, the performance of CNNs in 5 → 1 tasks (rightmost column of each panel in Fig. 8), which only marginally improved over their performance in 1 → 1 tasks (left six columns of each panel in Fig. 8), is still inferior to DSAN's performance in most 1 → 1 tasks (Fig. 7), which indicates that including a limited number of training samples from diverse regions is insufficient for conventional CNNs to enhance their transferability and underscores the value of transfer learning algorithms such as DSAN.
The disparity of the performance presented above can be interpreted by comparing the deep features extracted by MethaNet, ResNet-50, VGG16, and EfficientNet-V2L and DSAN. Figure 9 maps high-dimensional deep features to a two-dimensional plot generated by the t-distributed stochastic neighbor embedding (t–SNE) algorithm (van der Maaten and Hinton, 2008). Blue points are source domain samples, and orange points are target domain samples. DSAN exhibits better alignment between the source and the target domains compared to conventional CNN models under most transfer tasks. In the DSAN subfigures, it is evident that not only are the source and target points well-aligned, but also samples belonging to different classes exhibit noticeable distinctions. This result is consistent with our understanding that the domain transfer module in the DSAN model can effectively close background differences between different regions (domain shift), enhancing the ability of the algorithm to identify methane plumes at a new location.
Figures 7 and 8 also indicate that some of the datasets appear more difficult to predict than others. DSAN's performance for datasets 2 and 6 is not as good as for other datasets (Fig. 7), while MethaNet and VGG16 perform poorly for datasets 2, 5, and 6 and ResNet-50 and EfficientNet-V2L exhibit notably poor performance on dataset 6 (Fig. 8). Some dataset characteristics may have contributed to lower performance. Dataset 2 is marked by highly heterogeneous surface; dataset 5 by smaller methane fluxes and plume sizes; and dataset 6 by weak plume signals, higher surface complexity, and imbalanced positive–negative classes (Fig. 6 and Table 3).
Increasing the source domain from one dataset (1 → 1 tasks) to five (5 → 1 tasks) slightly improves the performance of the DSAN model (Fig. 7), demonstrating the benefit of including more and diverse training samples. However, dataset 6 remains the most problematic dataset, with no improvement.
We apply the proposed AI-assisted monitoring workflow (Fig. 1), including the LRAD and DSAN algorithms, to a 432 km2 area (Fig. 10) in the Hassi Messaoud O&G field in Algeria (Sect. 3.2.2). The algorithm processed in total 3527 images (200 pixels by 200 pixels) for 1 year, yielding 3168 negative (plume-free) and 369 positive (plume-containing) detections.
We manually verified that 33 out of the 369 positive detections contain true methane plumes from three methane super-emitters (denoted P(1), P(2), and P(3) in Fig. 10) and that one false negative detection was identified at P(2) (see Fig. S8). Using the Google Earth map, we attributed P(1) to a production well (31.8651° N, 6.1683° E) and P(2) to pipeline leakage (31.7566° N, 6.1864° E). We did not identify O&G infrastructure associated with P(3) (31.5846° N, 6.4878° E) from the Google Earth map. Figure 10 presents visual imagery of each source and the true positive plumes detected by our method. These super-emitters were not known at the time of our experiment. Two recent studies reported P(1) also based on Sentinel-2 data (Naus et al., 2023; Pandey et al., 2023).
Table 4Manual validation of detections by the AI-assisted framework.
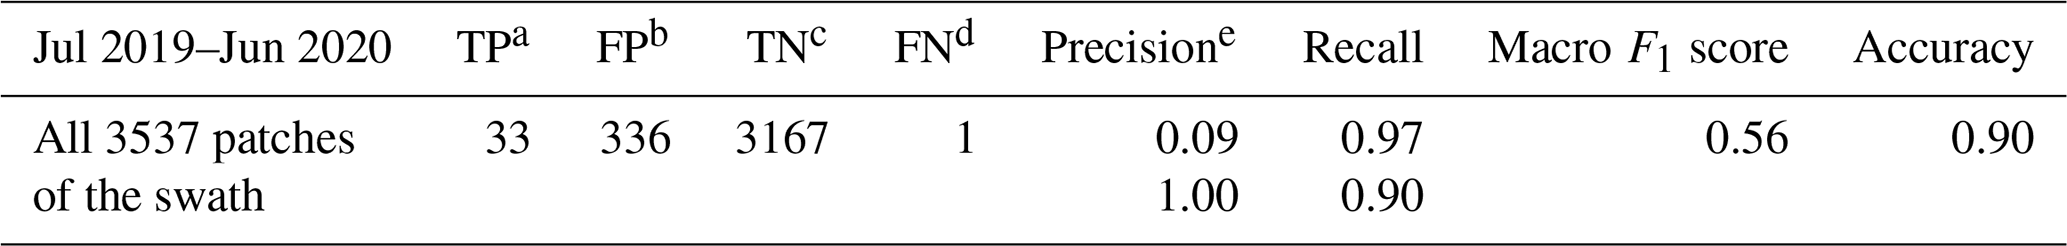
a True positive. b False positive. c True negative. d False negative. e The two “Precision” rows correspond to the plume-containing and plume-free classes, respectively, and the same goes for “Recall”.
Methane plumes are detected twice at P(1), 30 times at P(2), and twice at P(3) during July 2019 to June 2020 (Fig. 11), resulting in respective detection frequencies of 1.6 %, 24 %, and 1.6 % for the three sources after cloudy days are excluded. Meanwhile, the LRAD algorithm detects flaring as a byproduct (Fig. S9). We detected 67 flaring events at P(1) and 1 flaring event at P(2) (Fig. 11). Flaring detection at P(1) occurs primarily during July to August 2019 and January to May 2020.
We quantified the emission fluxes of the three sources using the IME method (Varon et al., 2021) (see Sect. S2 for details about the method). The average emission rate is 31 133 kg h−1 for P(1), 3990 kg h−1 for P(2), and 8210 kg h−1 for P(3) (Fig. 11). The largest emissions were found at P(1) due to a blowout event with 18 421±6575 kg h−1 on 4 January 2020 and 43 845±9169 kg h−1 on 7 January 2020. This result is generally comparable to estimates given by Pandey et al. (2023) (21 000±6000 kg h−1 on 4 January) and Naus et al. (2023) (29 800±14 900 kg h−1 on 4 January and 68 400±34 200 kg h−1 on 7 January).
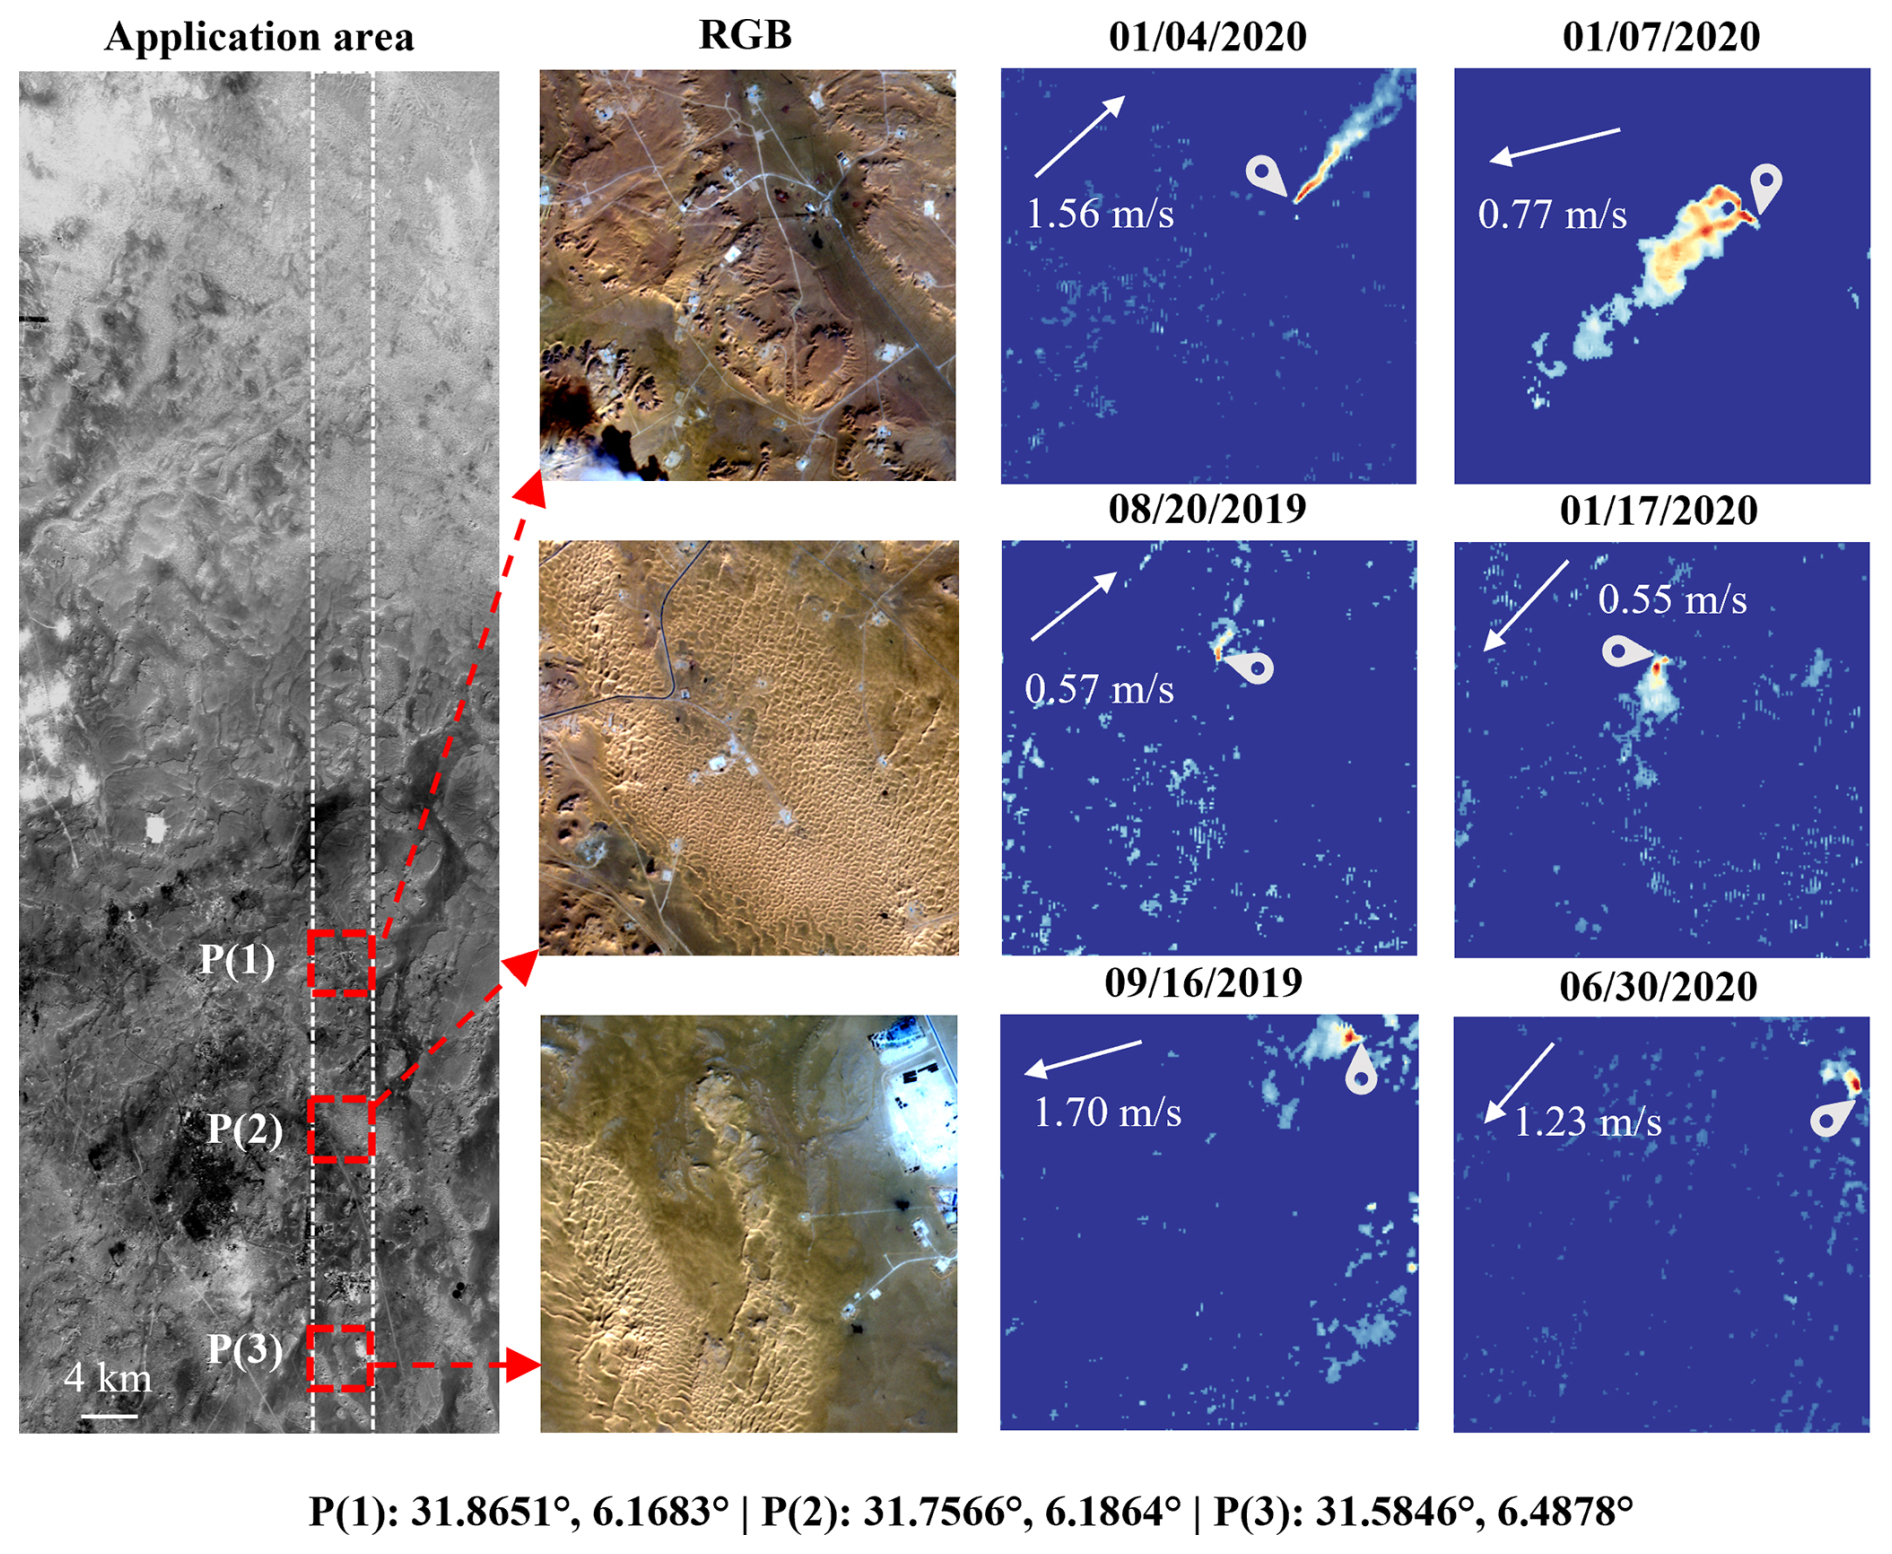
Figure 10From left to right: application area (the rectangular area within the dotted white line) extracted from Sentinel-2 data, RGB images of the positive patches containing methane point sources (P(1)–P(3)), and examples of the methane plume-containing ΔR images detected by our method. The white pin in the ΔR images points to the source location. The date format is mm/dd/yyyy.
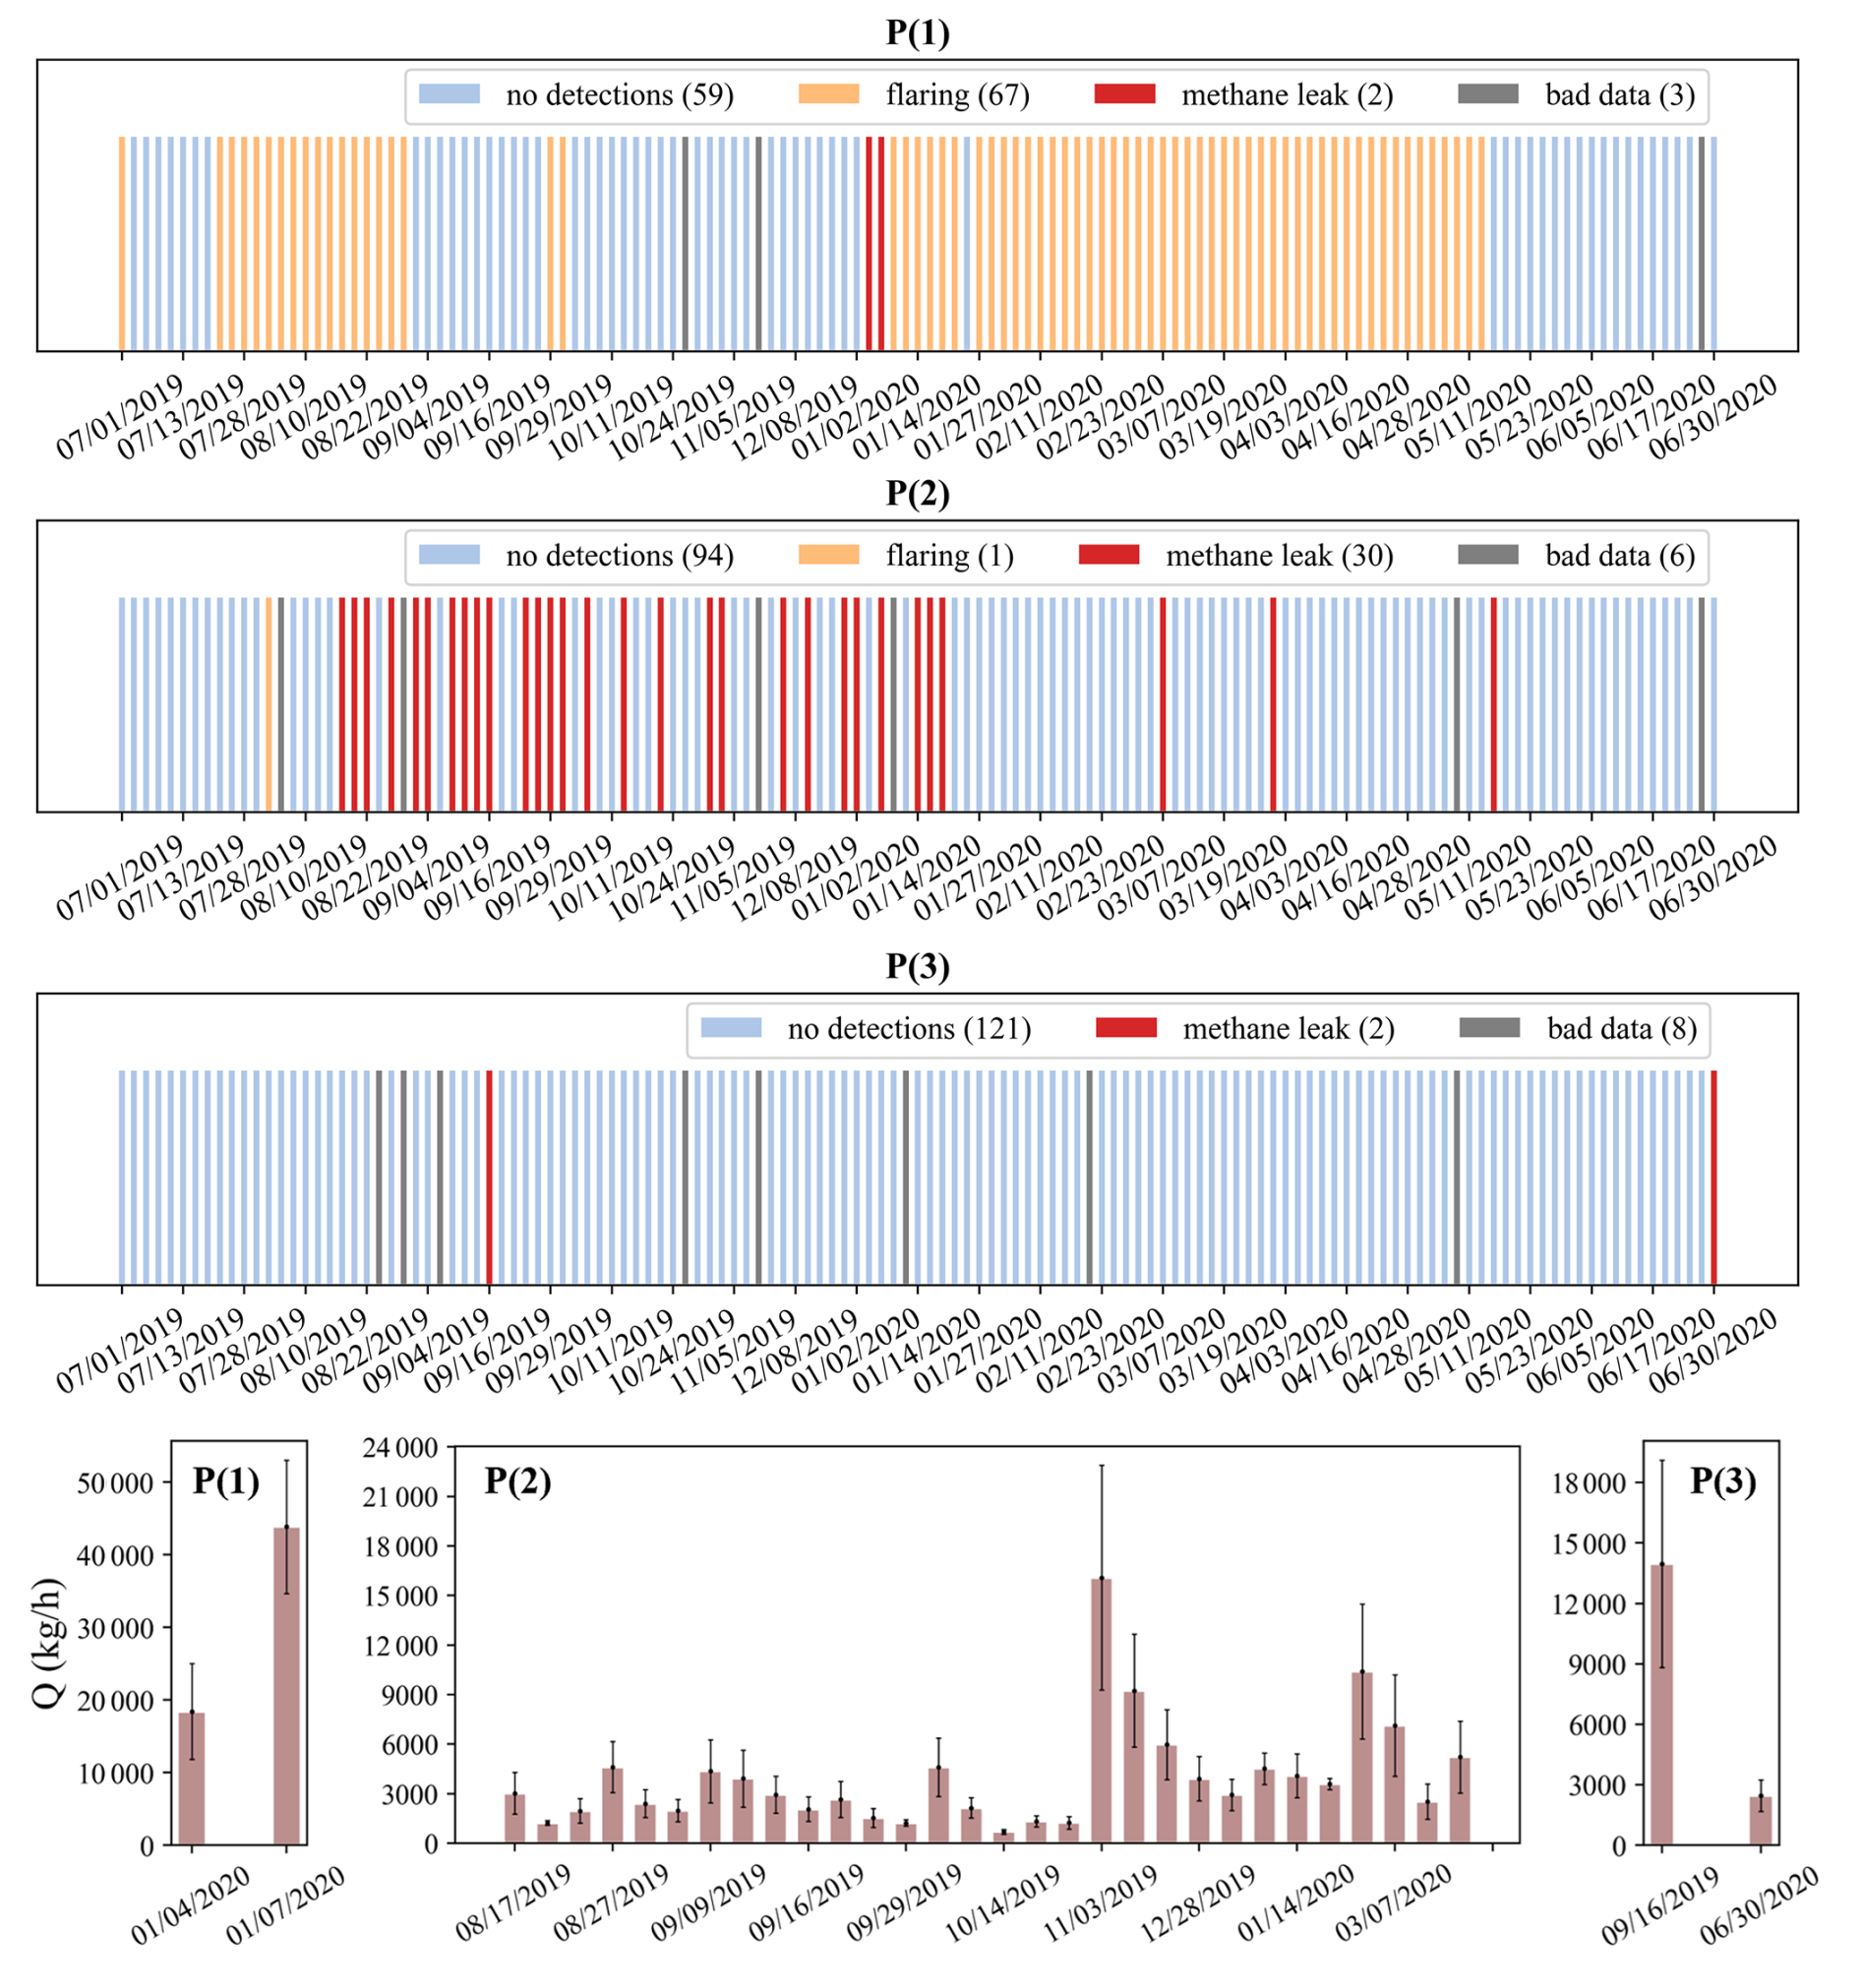
Figure 11Time series of detected methane leaking events, flaring, and the retrieved emission flux of the methane plumes for P(1), P(2), and P(3). It is noted that detected methane leaks and flaring come from different facilities, and the flare burn dates do not coincide with the leak dates. No detections indicate methane-free and flaring-free. Bad data mainly indicate cloudy data or data that are fully covered by artifacts. The date format is mm/dd/yyyy.
Table 4 summarizes the performance metrics for the real-world application. Our algorithm demonstrates a good detection capability with an accuracy of 0.90, consistent with the averaged value for the 36 transfer tasks (Sect. 4). This performance surpasses the detection accuracy of approximately 0.80 reported by CH4Net, which used Sentinel-2 for the west coast of Turkmenistan (Vaughan et al., 2024). For 3168 plume-free images, the DSAN detector achieves a false positive rate of 0.096 (FP TN + FP; FP denotes false positive and TN denotes true negative), higher than the results of existing detectors tested on synthetic datasets (Zortea et al., 2023; Rouet-Leduc and Hulbert, 2024). Nonetheless, this rate is lower than the 0.14 reported by the U-Plume detector based on GHGSat-C1 observations (Bruno et al., 2024) and the 0.18 reported by Vaughan et al. (2024).
Additionally, our detector shows the macro F1 score of 0.56, which is lower than that reported in Sect. 4 for the evaluation tasks primarily due to the 336 false positive detections. Further analyses suggest that these false positives are related to the categories of smoke, built-up, land surface, and cloud or cloud shadow (Fig. 12a). We categorize these false positives based on the type of main artifacts (Fig. 12b). Artifacts related to land-surface variability account for 77.61 % of the false positives, followed by those related to cloud or cloud shadow (19.10 %) and smoke (3.28 %). These results indicate that some artifacts remain after being processed by the artifact removal algorithm LRAD. Investigation into these artifacts, particularly those related to land surface, is key to further improving the performance.
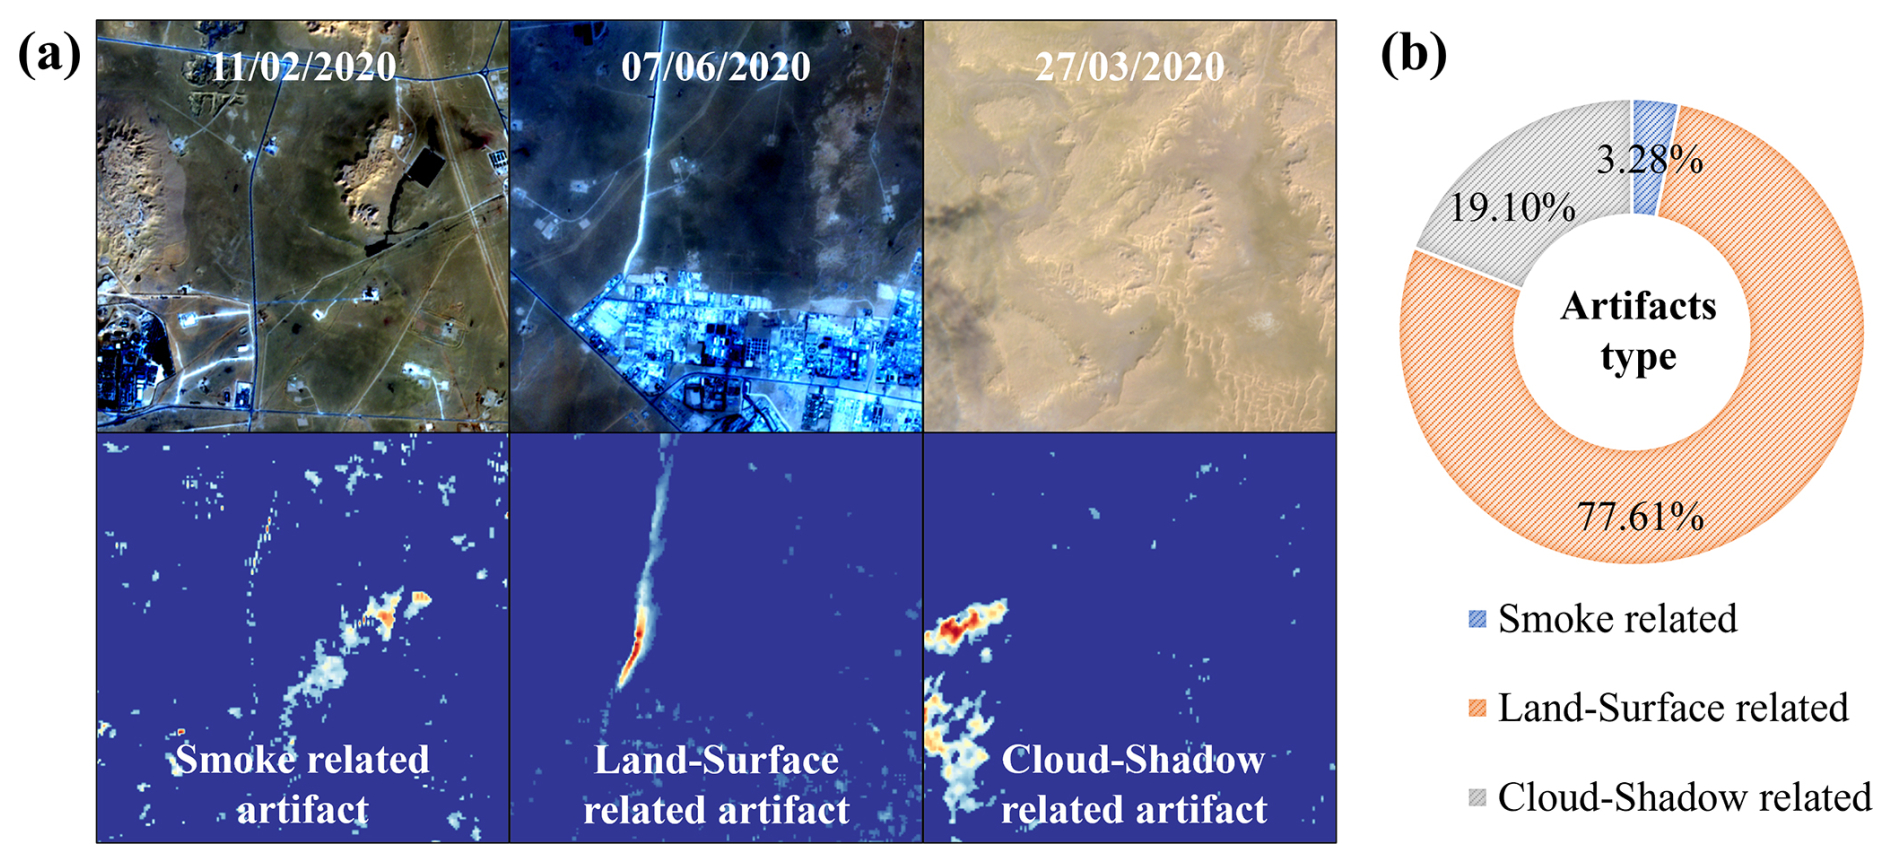
Figure 12False positive detection in a real-world application. (a) Representative examples of the false positive results and the corresponding RGB images extracted from Sentinel-2 L1C product. (b) Contributions of various artifact types to false positive detections. The date format is dd/mm/yyyy.
6.1 Impact of the denoising method on methane detection
Noise and artifacts in retrieved ΔR imagery pose significant challenges to real-world image classification tasks such as satellite-based methane plume detection, impacting the convergence and generalization of deep neural networks (Dodge and Karam, 2016). To address these issues, our LRAD algorithm leverages additional spectral bands to mitigate multiple types of artifacts and adapt to diverse land surfaces. As illustrated in Fig. S6, LRAD generates large-area denoising masks for heterogeneous surfaces and small-area or even no masks for homogeneous regions. The effectiveness of this approach is further demonstrated by the SNR improvements shown in Fig. S7, where notable enhancements are observed in heterogeneous regions (datasets 2, 3, and 6), with minimal improvements in homogeneous areas.
To further investigate the impact of LRAD, we conduct additional ablation experiments using the 30 tasks of 1 → 1 type and 6 tasks of 5 → 1 type (Sect. 3.2.1) to evaluate its influence on model performance. Figure 13 shows the macro F1 scores for the transfer tasks using the detection model without applying LRAD (WoLRAD-DSAN). The average macro F1 scores are 0.72 (ranging from 0.53 to 0.92) for the 1 → 1 tasks and 0.74 (ranging from 0.55 to 0.92) for the 5 → 1 tasks, significantly lower than those achieved by the LRAD–DSAN model on the same tasks (Fig. 7). The effect of LRAD is particularly pronounced on datasets 2, 3, and 6, where the absence of LRAD leads to macro F1 score reductions of approximately 33 %, 28 %, and 23 %, respectively. These results from the ablation experiments are consistent with the SNR improvements shown in Fig. S7, further underscoring the efficacy of LRAD, especially over heterogeneous surfaces.
The impact of LRAD can be further elucidated by analyzing the false negative rate (FNR) and false positive rate (FPR) for the transfer tasks (Fig. S10). LRAD substantially reduces the FNR (e.g., by 52 %, 46 %, and 33 % for datasets 2, 3, and 6, respectively) but only moderately reduces the FPR by 3 % to 24 %. These findings demonstrate that LRAD is primarily effective in reducing omissions of methane super-emitters.
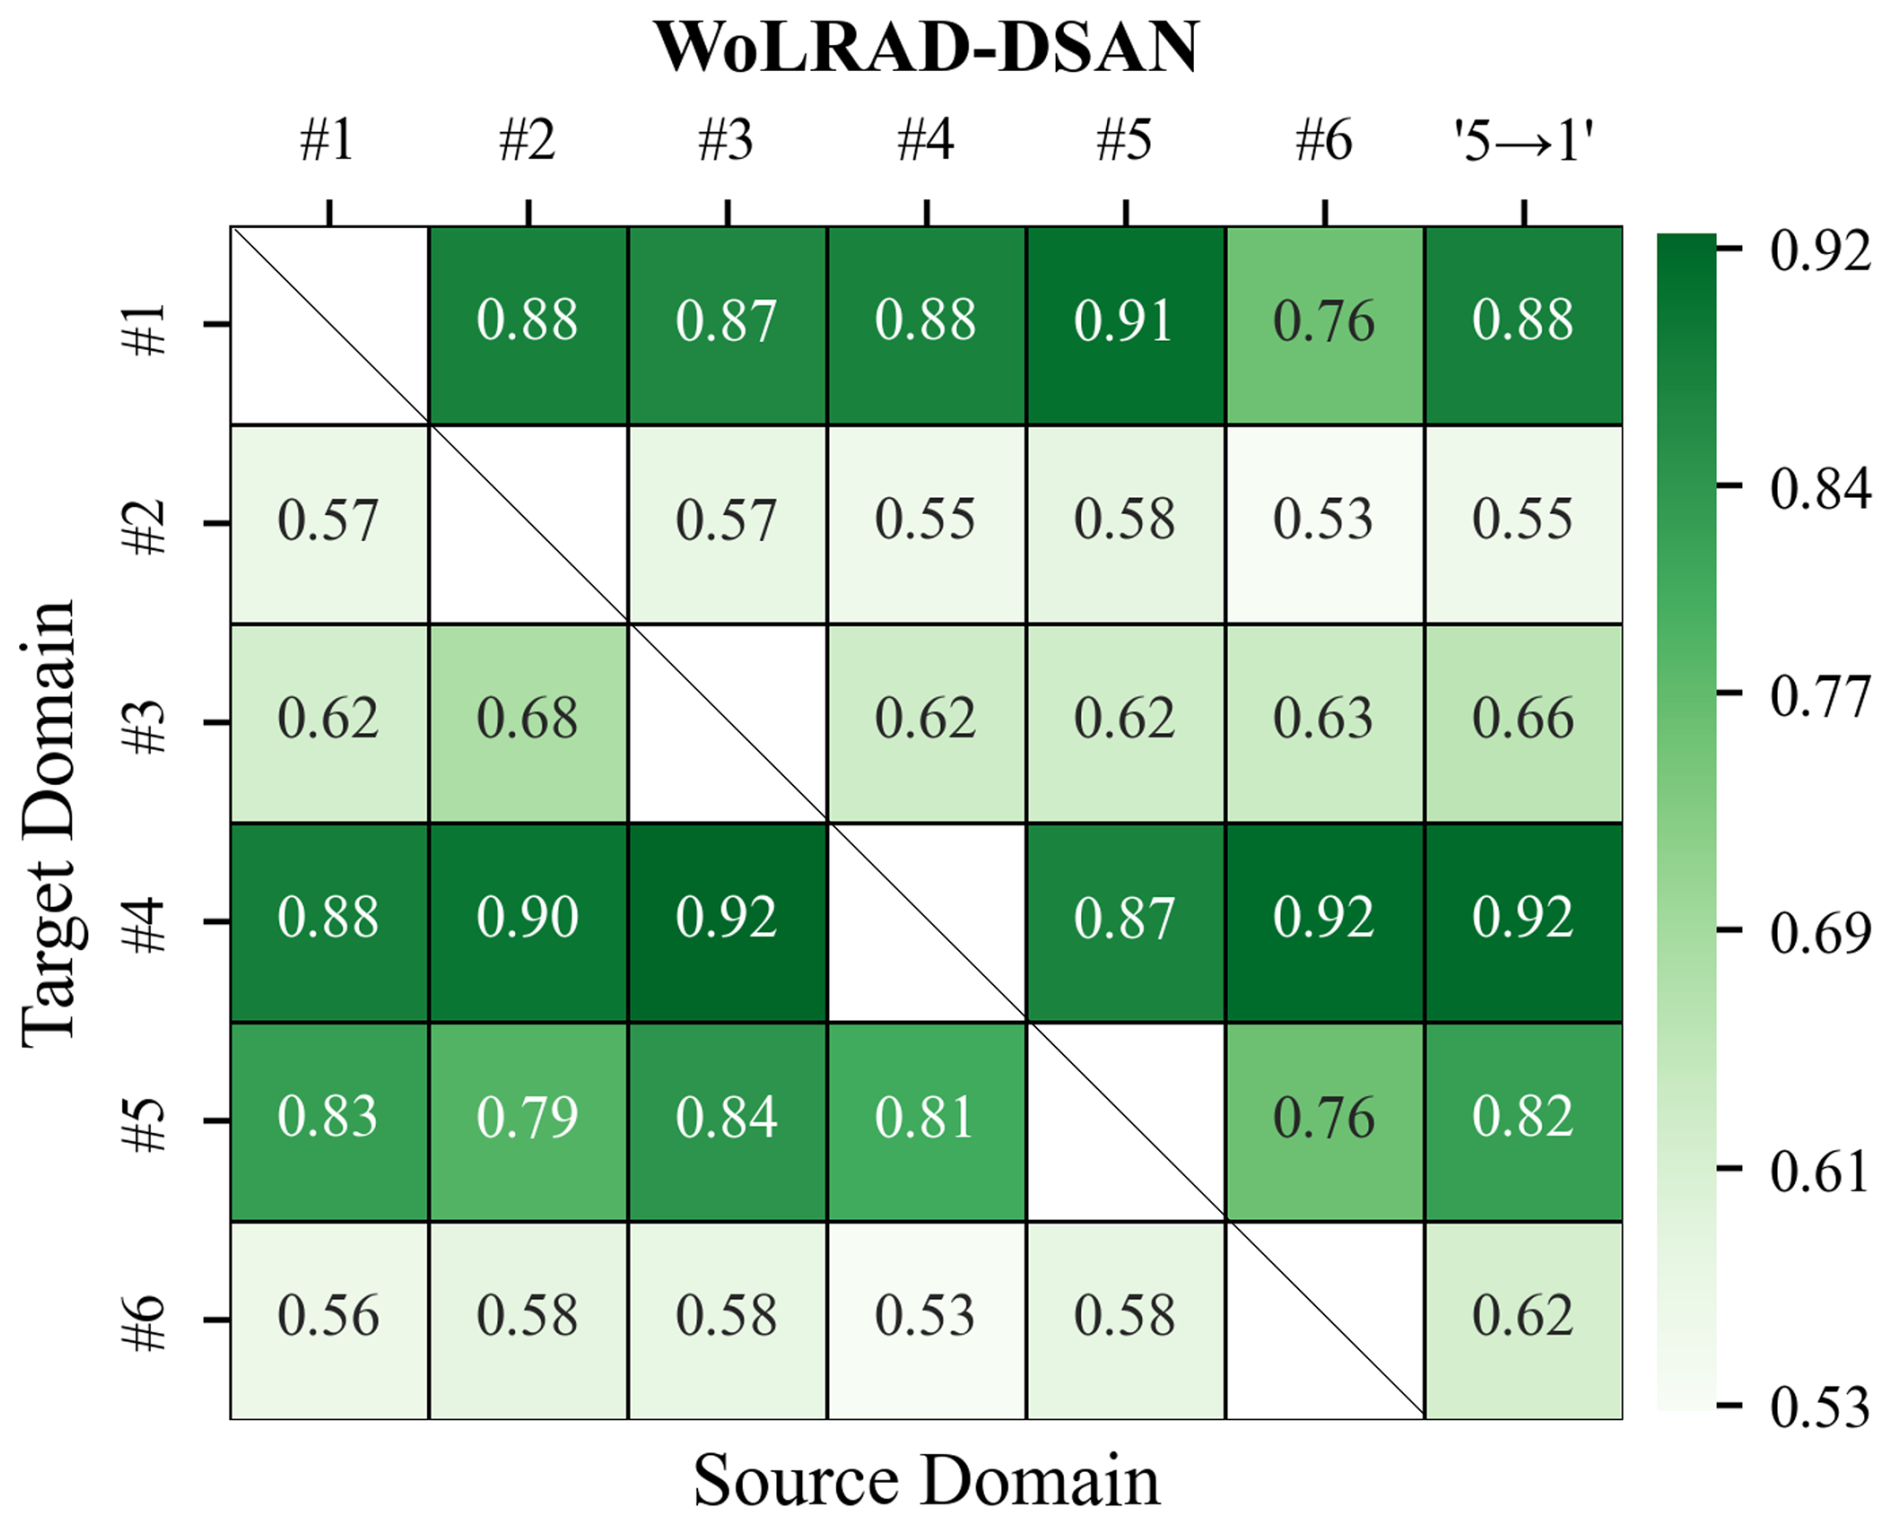
Figure 13Macro F1 scores on the transfer tasks given by the WoLRAD-DSAN model. Each square represents a transfer task; 5 → 1 indicates that the source domain is fused from five datasets excluding the target domain dataset. WoLRAD-DSAN refers to the DSAN framework without incorporating the LRAD denoising algorithm.
6.2 Additional assessment of transferability with synthetic data
The evaluation in Sects. 4 and 5 demonstrates the potential of the LRAD–DSAN framework to enable the development of methane plume detectors capable of operating across diverse regions in a data-efficient manner. Once trained on ΔR imagery with labeled methane point sources, the model can learn feature representations to discriminate plume and noise, enabling transferability to other regions, even those with distinct environmental conditions. However, concerns may remain regarding the limited diversity of environments represented in the dataset used for training and evaluation, which contains six super-emitters in only three countries (Table 2).
To address this limitation and further assess the transferability of the LRAD–DSAN method in the absence of additional real-world Sentinel-2 detections of methane super-emitters, we construct synthetic datasets by merging methane-free images with simulated methane plumes. These datasets encompass six regions across six countries (denoted Syn 1–Syn 6), each characterized by distinct land cover types (Table S8). Most of these regions exhibit more heterogeneous surface conditions compared to those in datasets 1–6, as shown in RGB images and NDVI–NDBI variation curves (Fig. S11), providing an additional test bed for evaluating the method's adaptability to varied and complex environments. See Sect. S4 for detailed information on the synthetic datasets.
We then train the LRAD–DSAN model with datasets 1–6 and evaluate its performance separately on each of the Syn 1–Syn 6 datasets. Table S9 summarizes the performance of the LRAD–DSAN model on these synthetic datasets. The macro F1 scores range from 0.88 to 0.92, consistent with the performance metrics reported in Sect. 4. As the six synthetic datasets have identical simulated plumes but varying background noise (Fig. S12), this evaluation further supports the capability of our proposed method to perform effectively across a wide range of diverse environmental conditions.
Here, we proposed a novel deep-transfer-learning-based approach that combined an adaptive artifact removal algorithm (LRAD) with a transferable plume detector (DSAN) to identify methane-plume-containing images retrieved from Sentinel-2 observations. Our evaluation demonstrated that the proposed method efficiently detects plumes in different O&G fields. Applying the method to the Hassi Messaoud O&G field over a 1-year period led to the discovery of 33 anomalous emission events from three methane super-emitters, which were attributed to well blowouts, pipeline leaks, and unknown facilities, with average emission rates of 31 133, 3990, and 8210 kg h−1, respectively.
The LRAD algorithm utilized Sentinel-2 bands 3, 8, 11, and 12 to remove multi-type artifacts associated with low reflectance in methane-sensitive bands, which greatly improved feature extraction by the deep model, especially in heterogeneous regions of O&G fields. We applied the LRAD algorithm to ΔR retrieval from Sentinel-2 observations and compiled ΔR datasets (1627 images in total) that include six different O&G super-emitters. The six labeled datasets have various ratios of positive (plume-containing) to negative (plume-free) sample size, plume sizes, and background noise levels.
The DSAN model was used to detect methane point sources based on ΔR images, aiming to resolving challenges arising from the domain shift between Sentinel-2 ΔR images for methane sources in different regions. For transfer detection tasks across six known methane sources, the DSAN model achieved an average macro F1 score of 0.86, outperforming MethaNet, ResNet-50, VGG16, and EfficientNet-V2L. Without a need for a huge volume of training data, our DSAN model operated in a data-efficient manner which leveraged knowledge acquired from a source domain during the training process to perform plume classification in a target domain.
Moving forward, the developed workflow can be modified to detect methane from other multispectral instruments, including Sentinel-2, Landsat 8, and WorldView-3. Also, it has the potential to detect plumes of other pollutants observable by satellites such as NO2 or CO2. Moreover, while this study made efforts to develop a labeling decision rule, the confidence of the labels determined by human analysts was difficult to quantify. To facilitate robust algorithm development, we recommend the development of standards for plume identification and construction of benchmark plume datasets for various satellite instruments.
The six compiled methane retrieval ΔR datasets and synthetic ΔR datasets are available through a public repository (https://doi.org/10.57760/sciencedb.15792, Zhao et al., 2024).
The supplement related to this article is available online at https://doi.org/10.5194/acp-25-4035-2025-supplement.
ShutZ: conceptualization, methodology, data curation, software, visualization, writing (original draft preparation). YZ: conceptualization, investigation, supervision, validation, writing (original draft preparation), funding. ShuaZ: funding. XW: reviewing and editing. DJV: software, reviewing and editing.
The contact author has declared that none of the authors has any competing interests.
Publisher’s note: Copernicus Publications remains neutral with regard to jurisdictional claims made in the text, published maps, institutional affiliations, or any other geographical representation in this paper. While Copernicus Publications makes every effort to include appropriate place names, the final responsibility lies with the authors.
The authors gratefully acknowledge the hardware facility support of the High-Performance Computing Center of Westlake University.
This research has been supported by the National Key Research and Development Program of China (grant no. 2022YFE0209100), the National Natural Science Foundation of China (grant no. 42307129), and the Zhejiang Provincial Natural Science Foundation (grant no. LZJMZ24D050005).
This paper was edited by Qiang Zhang and reviewed by two anonymous referees.
Biermann, L., Clewley, D., Martinez-Vicente, V., and Topouzelis, K.: Finding Plastic Patches in Coastal Waters using Optical Satellite Data, Sci. Rep., 10, 5364, https://doi.org/10.1038/s41598-020-62298-z, 2020.
Bruno, J. H., Jervis, D., Varon, D. J., and Jacob, D. J.: U-Plume: automated algorithm for plume detection and source quantification by satellite point-source imagers, Atmos. Meas. Tech., 17, 2625–2636, https://doi.org/10.5194/amt-17-2625-2024, 2024.
Burke, M., Driscoll, A., Lobell, D. B., and Ermon, S.: Using satellite imagery to understand and promote sustainable development, Science, 371, eabe8628, https://doi.org/10.1126/science.abe8628, 2021.
Cusworth, D. H., Jacob, D. J., Varon, D. J., Chan Miller, C., Liu, X., Chance, K., Thorpe, A. K., Duren, R. M., Miller, C. E., Thompson, D. R., Frankenberg, C., Guanter, L., and Randles, C. A.: Potential of next-generation imaging spectrometers to detect and quantify methane point sources from space, Atmos. Meas. Tech., 12, 5655–5668, https://doi.org/10.5194/amt-12-5655-2019, 2019.
Dodge, S. and Karam, L.: Understanding how image quality affects deep neural networks, 2016 Eighth International Conference on Quality of Multimedia Experience, 6–8 June 2016, Lisbon, Portugal, IEEE, 1–6, https://doi.org/10.1109/QoMEX.2016.7498955, 2016.
Duren, R. M., Thorpe, A. K., Foster, K. T., Rafiq, T., Hopkins, F. M., Yadav, V., Bue, B. D., Thompson, D. R., Conley, S., Colombi, N. K., Frankenberg, C., McCubbin, I. B., Eastwood, M. L., Falk, M., Herner, J. D., Croes, B. E., Green, R. O., and Miller, C. E.: California's methane super-emitters, Nature, 575, 180–184, https://doi.org/10.1038/s41586-019-1720-3, 2019.
Ehret, T., De Truchis, A., Mazzolini, M., Morel, J.-M., d'Aspremont, A., Lauvaux, T., Duren, R., Cusworth, D., and Facciolo, G.: Global Tracking and Quantification of Oil and Gas Methane Emissions from Recurrent Sentinel-2 Imagery, Environ. Sci. Technol., 56, 10517–10529, https://doi.org/10.1021/acs.est.1c08575, 2022.
Fan, X., Liu, Y., Wu, G., and Zhao, X.: Compositing the Minimum NDVI for Daily Water Surface Mapping, Remote Sens., 12, 1247, https://doi.org/10.3390/rs12040700, 2020.
Frankenberg, C., Thorpe, A. K., Thompson, D. R., Hulley, G., Kort, E. A., Vance, N., Borchardt, J., Krings, T., Gerilowski, K., Sweeney, C., Conley, S., Bue, B. D., Aubrey, A. D., Hook, S., and Green, R. O.: Airborne methane remote measurements reveal heavy-tail flux distribution in Four Corners region, P. Natl. Acad. Sci. USA, 113, 9734–9739, https://doi.org/10.1073/pnas.1605617113, 2016.
Gorroño, J., Varon, D. J., Irakulis-Loitxate, I., and Guanter, L.: Understanding the potential of Sentinel-2 for monitoring methane point emissions, Atmos. Meas. Tech., 16, 89–107, https://doi.org/10.5194/amt-16-89-2023, 2023.
Guanter, L., Irakulis-Loitxate, I., Gorroño, J., Sánchez-García, E., Cusworth, D. H., Varon, D. J., Cogliati, S., and Colombo, R.: Mapping methane point emissions with the PRISMA spaceborne imaging spectrometer, Remote Sens. Environ., 265, 112671, https://doi.org/10.1016/j.rse.2021.112671, 2021.
IPCC: Climate Change 2013: The Physical Science Basis. Contribution of Working Group I to the Fifth Assessment Report of the Intergovernmental Panel on Climate Change, Cambridge University Press, Cambridge, UK and New York, NY, USA, https://doi.org/10.1017/CBO9781107415324, 2013.
Ienco, D., Interdonato, R., Gaetano, R., and Ho Tong Minh, D.: Combining Sentinel-1 and Sentinel-2 satellite image time series for land cover mapping via a multi-source deep learning architecture, ISPRS J. Photogramm. Remote Sens., 158, 11–22, https://doi.org/10.1016/j.isprsjprs.2019.09.016, 2019.
Iman, M., Arabnia, H. R., and Rasheed, K.: A review of deep transfer learning and recent advancements, Technologies, 11, 40, https://doi.org/10.3390/technologies11020040, 2023.
Irakulis-Loitxate, I., Guanter, L., Maasakkers, J. D., Zavala-Araiza, D., and Aben, I.: Satellites detect abatable super-emissions in one of the world's largest methane hotspot regions, Environ. Sci. Technol., 56, 2143–2152, https://doi.org/10.1021/acs.est.1c04873, 2022.
Jiang, J., Shu, Y., Wang, J., and Long, M.: Transferability in deep learning: A survey, arXiv preprint, arXiv:2201.05867, https://doi.org/10.48550/arXiv.2201.05867, 2022.
Jongaramrungruang, S., Thorpe, A. K., Matheou, G., and Frankenberg, C.: MethaNet – An AI-driven approach to quantifying methane point-source emission from high-resolution 2-D plume imagery, Remote Sens. Environ., 269, 112809, https://doi.org/10.1016/j.rse.2021.112809, 2022.
Joyce, P., Ruiz Villena, C., Huang, Y., Webb, A., Gloor, M., Wagner, F.H., Chipperfield, M.P., Barrio Guilló, R., Wilson, C., and Boesch, H.: Using a deep neural network to detect methane point sources and quantify emissions from PRISMA hyperspectral satellite images. Atmos. Meas. Tech., 16, 2627–2640, https://doi.org/10.5194/amt-16-2627-2023, 2023.
Kuc, G. and Chormański, J.: Sentinel-2 imagery for mapping and monitoring imperviousness in urban areas, Int. Arch. Photogramm. Remote Sens. Spatial Inf. Sci., XLII-1/W2, 43–47, https://doi.org/10.5194/isprs-archives-XLII-1-W2-43-2019, 2019.
van der Maaten, L. and Hinton, G.: Visualizing data using t-SNE, J. Mach. Learn. Res., 9, 2579–2605, http://jmlr.org/papers/v9/vandermaaten08a.html (last access: 30 August 2024), 2008.
Lauvaux, T., Giron, C., Mazzolini, M., d'Aspremont, A., Duren, R., Cusworth, D., Shindell, D., and Ciais, P.: Global assessment of oil and gas methane super-emitters, Science, 375, 557–561, https://doi.org/10.1126/science.abj4351, 2022.
Liu, Y., Zhi, W., Xu, B., Xu, W., and Wu, W.: Detecting high-temperature anomalies from Sentinel-2 MSI images, ISPRS J. Photogramm. Remote Sens., 177, 174–193, https://doi.org/10.1016/j.isprsjprs.2021.05.008, 2021.
Naus, S., Maasakkers, J. D., Gautam, R., Omara, M., Stikker, R., Veenstra, A. K., Nathan, B., Irakulis-Loitxate, I., Guanter, L., Pandey, S., Girard, M., Lorente, A., Borsdorff, T., and Aben, I.: Assessing the relative importance of satellite-detected methane superemitters in quantifying total emissions for oil and gas production areas in algeria, Environ. Sci. Technol., 57, 19545–19556, https://doi.org/10.1021/acs.est.3c04746, 2023.
Pan, S. J. and Yang, Q.: A Survey on Transfer Learning, IEEE Trans. Knowl. Data Eng., 22, 1345–1359, https://doi.org/10.1109/TKDE.2009.191, 2010.
Pandey, S., van Nistelrooij, M., Maasakkers, J. D., Sutar, P., Houweling, S., Varon, D. J., Tol, P., Gains, D., Worden, J., and Aben, I.: Daily detection and quantification of methane leaks using Sentinel-3: a tiered satellite observation approach with Sentinel-2 and Sentinel-5p, Remote Sens. Environ., 296, 113716, https://doi.org/10.1016/j.rse.2023.113716, 2023.
Pedregosa, F., Varoquaux, G., Gramfort, A., Michel, V., Thirion, B., Grisel, O., Blondel, M., Prettenhofer, P., Weiss, R., and Dubourg, V.: Scikit-learn: Machine learning in Python, J. Mach. Learn. Res., 12, 2825–2830, http://jmlr.org/papers/v12/pedregosa11a.html (last access: 25 August 2023), 2011.
Purio, M. A., Yoshitake, T., and Cho, M.: Assessment of intra-urban heat island in a densely populated city using remote sensing: a case study for manila city, Remote Sens., 14, 1234, https://doi.org/10.3390/rs14215573, 2022.
Radman, A., Mahdianpari, M., Varon, D. J., and Mohammadimanesh, F.: S2MetNet: A novel dataset and deep learning benchmark for methane point source quantification using Sentinel-2 satellite imagery, Remote Sens. Environ., 295, 113708, https://doi.org/10.1016/j.rse.2023.113708, 2023.
Ramoelo, A., Cho, M., Mathieu, R., and Skidmore, A.: Potential of Sentinel-2 spectral configuration to assess rangeland quality, J. Appl. Remote Sens., 9, 094096, https://doi.org/10.1117/1.JRS.9.094096, 2015.
Rouet-Leduc, B. and Hulbert, C.: Automatic detection of methane emissions in multispectral satellite imagery using a vision transformer, Nat. Commun., 15, 3801, https://doi.org/10.1038/s41467-024-47754-y, 2024.
Růžička, V., Mateo-Garcia, G., Gómez-Chova, L., Vaughan, A., Guanter, L., and Markham, A.: Semantic segmentation of methane plumes with hyperspectral machine learning models, Sci. Rep., 13, 19999, https://doi.org/10.1038/s41598-023-44918-6, 2023.
Sánchez-García, E., Gorroño, J., Irakulis-Loitxate, I., Varon, D. J., and Guanter, L.: Mapping methane plumes at very high spatial resolution with the WorldView-3 satellite, Atmos. Meas. Tech., 15, 1657–1674, https://doi.org/10.5194/amt-15-1657-2022, 2022.
Schuit, B. J., Maasakkers, J. D., Bijl, P., Mahapatra, G., van den Berg, A.-W., Pandey, S., Lorente, A., Borsdorff, T., Houweling, S., Varon, D. J., McKeever, J., Jervis, D., Girard, M., Irakulis-Loitxate, I., Gorroño, J., Guanter, L., Cusworth, D. H., and Aben, I.: Automated detection and monitoring of methane super-emitters using satellite data, Atmos. Chem. Phys., 23, 9071–9086, https://doi.org/10.5194/acp-23-9071-2023, 2023.
Varghese, D., Radulović, M., Stojković, S., and Crnojević, V.: Reviewing the potential of Sentinel-2 in assessing the drought, Remote Sens., 13, 3355, https://doi.org/10.3390/rs13173355, 2021.
Varon, D. J., Jacob, D. J., McKeever, J., Jervis, D., Durak, B. O. A., Xia, Y., and Huang, Y.: Quantifying methane point sources from fine-scale satellite observations of atmospheric methane plumes, Atmos. Meas. Tech., 11, 5673–5686, https://doi.org/10.5194/amt-11-5673-2018, 2018.
Varon, D. J., Jervis, D., McKeever, J., Spence, I., Gains, D., and Jacob, D. J.: High-frequency monitoring of anomalous methane point sources with multispectral Sentinel-2 satellite observations, Atmos. Meas. Tech., 14, 2771–2785, https://doi.org/10.5194/amt-14-2771-2021, 2021.
Vaughan, A., Mateo-García, G., Gómez-Chova, L., Růžička, V., Guanter, L., and Irakulis-Loitxate, I.: CH4Net: a deep learning model for monitoring methane super-emitters with Sentinel-2 imagery, Atmos. Meas. Tech., 17, 2583–2593, https://doi.org/10.5194/amt-17-2583-2024, 2024.
Zavala-Araiza, D., Alvarez, R. A., Lyon, D. R., Allen, D. T., Marchese, A. J., Zimmerle, D. J., and Hamburg, S. P.: Super-emitters in natural gas infrastructure are caused by abnormal process conditions, Nat. Commun., 8, 14012, https://doi.org/10.1038/ncomms14012, 2017.
Zhang, Z., Sherwin, E. D., Varon, D. J., and Brandt, A. R.: Detecting and quantifying methane emissions from oil and gas production: algorithm development with ground-truth calibration based on Sentinel-2 satellite imagery, Atmos. Meas. Tech., 15, 7155–7169, https://doi.org/10.5194/amt-15-7155-2022, 2022.
Zhao, S., Zhang, Y., Zhao, S., Wang, X., and Varon, D. J.: Deep transfer learning assisted detection of methane super-emitters in oil and gas fields using Sentinel-2 observations[DS/OL], Science Data Bank [data set], https://cstr.cn/31253.11.sciencedb.15792 (last access: 7 March 2025), 2024.
Zhou, W., Bovik, A. C., Sheikh, H. R., and Simoncelli, E. P.: Image quality assessment: from error visibility to structural similarity, IEEE Trans. Image Process., 13, 600–612, https://doi.org/10.1109/TIP.2003.819861, 2004.
Zhu, Y., Zhuang, F., Wang, J., Ke, G., Chen, J., Bian, J., Xiong, H., and He, Q.: Deep subdomain adaptation network for image classification, IEEE Trans. Neural Netw. Learn. Syst., 32, 1713–1722, https://doi.org/10.1109/TNNLS.2020.2988928, 2021.
Zortea, M., Almeida, J. L. D. S., Klein, L., and Junior, A. C. N.: Detection of methane plumes using Sentinel-2 satellite images and deep neural networks trained on synthetically created label data, 2023 IEEE International Conference on Big Data, 15–18 December 2023, Sorrento, Italy, IEEE, 3830–3839, https://doi.org/10.1109/BigData59044.2023.10386482, 2023.
- Abstract
- Introduction
- Methodology
- Methane dataset and experimental design
- Performance evaluation of the DSAN model
- Real-world application for methane source discovery
- Discussion
- Conclusions
- Data availability
- Author contributions
- Competing interests
- Disclaimer
- Acknowledgements
- Financial support
- Review statement
- References
- Supplement