the Creative Commons Attribution 4.0 License.
the Creative Commons Attribution 4.0 License.
 | 25 Mar 2025
Boosting aerosol surface effects: strongly enhanced cooperative surface propensity of atmospherically relevant organic molecular ions in aqueous solution
Harmanjot Kaur
Stephan Thürmer
Shirin Gholami
Bruno Credidio
Florian Trinter
Debora Vasconcelos
Ricardo Marinho
Joel Pinheiro
Hendrik Bluhm
Arnaldo Naves de Brito
Gunnar Öhrwall
Bernd Winter
Olle Björneholm
The effects of atmospheric aerosols are key uncertainties in climate models. One reason is the complex aerosol composition which includes a relatively large fraction of organics. Another reason is the small size of aerosols, which makes surface effects and processes important. These two factors make surface-active organics relevant for atmospheric aerosols, as they can affect crucial processes, such as chemical aging and water accommodation, as well as properties such as the surface tension, which drives droplet formation. Two exemplary types of atmospherically relevant organics are carboxylic acids and alkyl amines, and often both are found together within aerosols. In the most atmospherically significant pH range, these exist as alkyl-carboxylate ions and alkyl-ammonium ions. Using liquid-jet photoelectron spectroscopy, tuned to high surface sensitivity, we measured the alkyl-carboxylate anions and the alkyl-ammonium cations of alkyl chain lengths of 1 to 6 carbon atoms, both as single-component and mixed-component aqueous solutions. This enabled us to systematically study how their surface propensity is affected by the length of the alkyl chains and how cooperative ion–ion interactions result in strongly increased surface propensity. An exponential increase in surface propensity is found for the single-species solutions, with cooperative solute–solute effects in mixed solutions of 1 : 1 molar ratio drastically increasing the number of molecules present at the solutions' surfaces up to a factor of several hundred. This cooperative surface propensity is shown to strongly affect the amounts of organics at the surface. These changes can significantly influence radiative forcing via aerosol growth, cloud condensation nuclei activity, and aerosol chemical aging. Our results demonstrate the principal feasibility of a more advanced input of molecular details for creating parameterized descriptions of aerosol surface composition needed to properly account for their impacts in climate models.
- Article
(3994 KB) - Full-text XML
-
Supplement
(1698 KB) - BibTeX
- EndNote


Water's liquid–vapor interface is of crucial environmental significance, considering the abundance of liquid water covering Earth's surface and of aqueous particles in Earth's atmosphere. Aqueous particles, varying from microscopic aerosols to raindrops, impact the global radiation balance by scattering sunlight (the direct effect) (McCormick and Ludwig, 1967) and by serving as important cloud condensation nuclei (CCN) and ice-nucleating particles (the indirect effects) (Twomey, 1974). The effects of aerosols have been identified by the United Nations Intergovernmental Panel on Climate Change (IPCC) as a key uncertainty in climate models (IPCC, 2022); thus, a better understanding of these effects is important for improving climate modeling. Atmospheric aerosols comprise many species, including atomic ions, organic compounds from various sources (like emissions and decomposition), soot from combustion, and mineral particles. The organic fraction, ranging from 20 %–90 % of submicron aerosol mass, mainly forms secondary organic aerosols (SOAs) with complex compositions (Jimenez et al., 2009). The complex mix of organic compounds within atmospheric aerosols makes it challenging to quantify the effect of aerosols on the climate and associated climate changes (Kanakidou et al., 2005; Tsigaridis et al., 2014).
The importance of aerosols stems from their large surface-to-volume ratio. One notable consequence is that the surface concentration of atmospherically relevant amino acids is up to 10 times higher than inside the aerosols (Mocellin et al., 2017). Furthermore, the surface concentration of amino acids tends to increase upon addition of salt to the aqueous solution (Gopakumar et al., 2022; Björneholm et al., 2022). Yet, existing climate models often pay less attention to aerosol surface effects because understanding of atmospheric surface phenomena on the molecular level is lacking (Noziere, 2016; Lowe et al., 2019). Specifically, the aforementioned organics affect surface tension, altering condensation and evaporation rates, which in turn alters water accommodation, i.e., the aggregation of water mass onto the aerosol (Sareen et al., 2013; Davies et al., 2013; Ergin and Takahama, 2016; Miles et al., 2016; Ruehl et al., 2016; Ovadnevaite et al., 2017). As surface species are more accessible for reactions with atmospheric radicals, the surface propensity of constituent species also affects the aerosol chemical aging, i.e., the time evolution of the chemical composition via chemical and photochemical processes (Shiraiwa et al., 2011). Microscopic surface effects are thus crucial for aerosol growth and cloud condensation nuclei activity, thereby affecting the macroscopic radiative forcing, i.e., Earth's energy balance in terms of reflection and absorption of solar radiation.
A promising experimental approach towards a deeper understanding of the molecular-scale interfacial structure and associated processes is the application of liquid-jet photoelectron spectroscopy (LJ-PES) to selected molecular model systems in aqueous solutions in combination with X-rays tuned to a surface-sensitive energy range. Many important organics are amphiphilic, i.e., containing both hydrophobic and hydrophilic parts; the former often consist of non-polar groups such as alkyl chains, while the latter consist of polar or charged groups. The surface propensity of such amphiphiles can be seen as a balance between the hydrophilic and hydrophobic interactions, where the hydrophilic part is solvated while the hydrophobic part tends to be only partially solvated. For example, LJ-PES studies in conjunction with molecular dynamics (MD) simulations have previously revealed how the surface propensity increases and how the molecular surface orientation evolves with the length of the hydrophobic alkyl chain for alcohols and carboxylic acids (Walz et al., 2015; Öhrwall et al., 2015; Lee et al., 2016; Walz et al., 2016; Werner et al., 2018; Ekholm et al., 2018). This picture has been quantitatively corroborated for perfluorinated pentanoic acid in aqueous solution, for which the distance of different parts of the molecule from the solution surface was determined with ångström resolution from the analysis of photoelectron angular distributions (Dupuy et al., 2023). The hydrophobic ends may undergo orientational changes, from mainly aligned parallel (to the molecular axis with respect to the surface plane) at low surface coverages towards perpendicular with increasing coverages to make room for more molecules. Such reorientation was, for example, observed for alcohols in aqueous solution (Walz et al., 2015, 2016).
Two common types of hydrophilic functional groups in atmospherically relevant organics are carboxyl/carboxylate and amine/ammonium (depending on pH, –COOH/–COO− and –NH2/NH, respectively), and carboxylic acids and alkyl amines are examples of amphiphiles commonly found in aerosols (Goldstein and Galbally, 2007). Both carboxylic acid and alkyl amines are considerably surface active (Ottosson et al., 2011; Werner et al., 2018). Most notably, in both cases larger alkyl chain lengths result in larger surface propensity. However, surface propensity is also pH dependent, with a smaller surface propensity of the charged species as compared to the neutral ones. However, as discussed above, atmospheric aerosols often contain multiple organic species. Interaction between different organic solutes can affect their respective surface propensity via cooperative or competing effects. Cooperative ion-pairing effects at the surface in mixed hexanoate hexyl ammonium solutions were shown to amplify the surface propensity of both species (Ekholm et al., 2018).
It can thus be expected that the surface propensity of atmospherically relevant alkyl-carboxylate ions and alkyl-ammonium ions scales with both the length of their hydrophobic chains and cooperative ion–ion interactions. In this work, we systematically explore how both effects jointly affect a molecule's surface propensity, exemplified for alkyl-carboxylate and alkyl-ammonium ions of variable alkyl chain lengths. Our results provide insight into the molecular driving forces affecting the surface composition of mixed-organic aqueous solutions, which will aid atmospheric scientists in creating a parameterized description of aerosol surface phenomena for improving climate models.
2.1 Experiments
Most measurements of this study were performed using the Electronic structure from Aqueous Solutions and Interfaces (EASI) liquid-jet photoelectron spectroscopy apparatus (Malerz et al., 2022) in tandem with the P04 soft X-ray beamline (Viefhaus et al., 2013) of the PETRA III synchrotron radiation facility (Deutsches Elektronen-Synchrotron DESY, Hamburg, Germany). Some measurements were repeated at the PLÉIADES beamline of the SOLEIL synchrotron facility (Paris, France) (see https://www.synchrotron-soleil.fr/en/beamlines/pleiades, last access: 26 February 2025), which is explained further below. The LJ-PES apparatus used at PETRA III is equipped with a state-of-the-art, near-ambient-pressure hemispherical electron analyzer (HEA, Scienta Omicron HiPP-3), complete mu-metal shielding, and large pumping capabilities for volatile liquids. Under operation conditions, the average pressure in the interaction chamber was typically maintained at ∼ 2 × 10⁻⁴ mbar, as accomplished with two turbomolecular pumps (with a total pumping speed of ∼ 2600 L s−1 for water) and three liquid-nitrogen cold traps (with a total pumping speed of ∼ 35 000 L s−1 for water). A custom-made differential pumping chamber, installed between the interaction chamber and the last beamline element, ensures a sufficient pressure drop across three differential stages for connection to the beamline (Malerz et al., 2022). The circularly polarized light from the APPLE II undulator (Sasaki, 1994) of the P04 beamline was monochromatized by a variable-line-spacing monochromator using a 1200 lines per millimeter planar grating (9 nm groove depth, non-blazed, Au coating) and a 150 µm vertical exit-slit opening (perpendicular to the LJ axis and the light propagation direction), adjusted by the exit-slit unit (EXSU). Photon energies of 400 eV (resolution of 70 meV) and 510 eV (resolution of 100 meV) were employed to measure C 1s and N 1s photoelectron spectra, respectively. O 1s signal intensities were not considered due to the strong overlap of this spectral region with the solvent. For a few solutes with very high surface propensity, the C 1s photoelectron (PE) signal could become so intense so as to potentially saturate the detector. This was prevented by reducing the photon flux by narrowing the vertically oriented beam-defining aperture (BDA), which is located 27.9 m downstream of the undulator and 43.1 m upstream of the EXSU (Bagschik et al., 2020). An overview of the used BDA settings, along with corresponding photon-flux values measured using a SXUV photodiode, can be found in the Supplement. The beamline's vertical spot size (relevant for the LJ target) at the 150 µm EXSU opening was ∼ 50 µm, independent of the BDA gap, which is somewhat larger than the LJ diameter (see below). The horizontal (along the liquid-jet axis) spot size was ∼ 180 µm. The photoelectron detection axis was at an angle of ∼ 130° with respect to the light propagation axis, in the vertical plane; that is, the spectrometer is above and tilted towards the beamline in the backwards direction (Malerz et al., 2022). The LJ axis is in the horizontal (floor) plane and thus orthogonal to both the light propagation and electron detection axes.
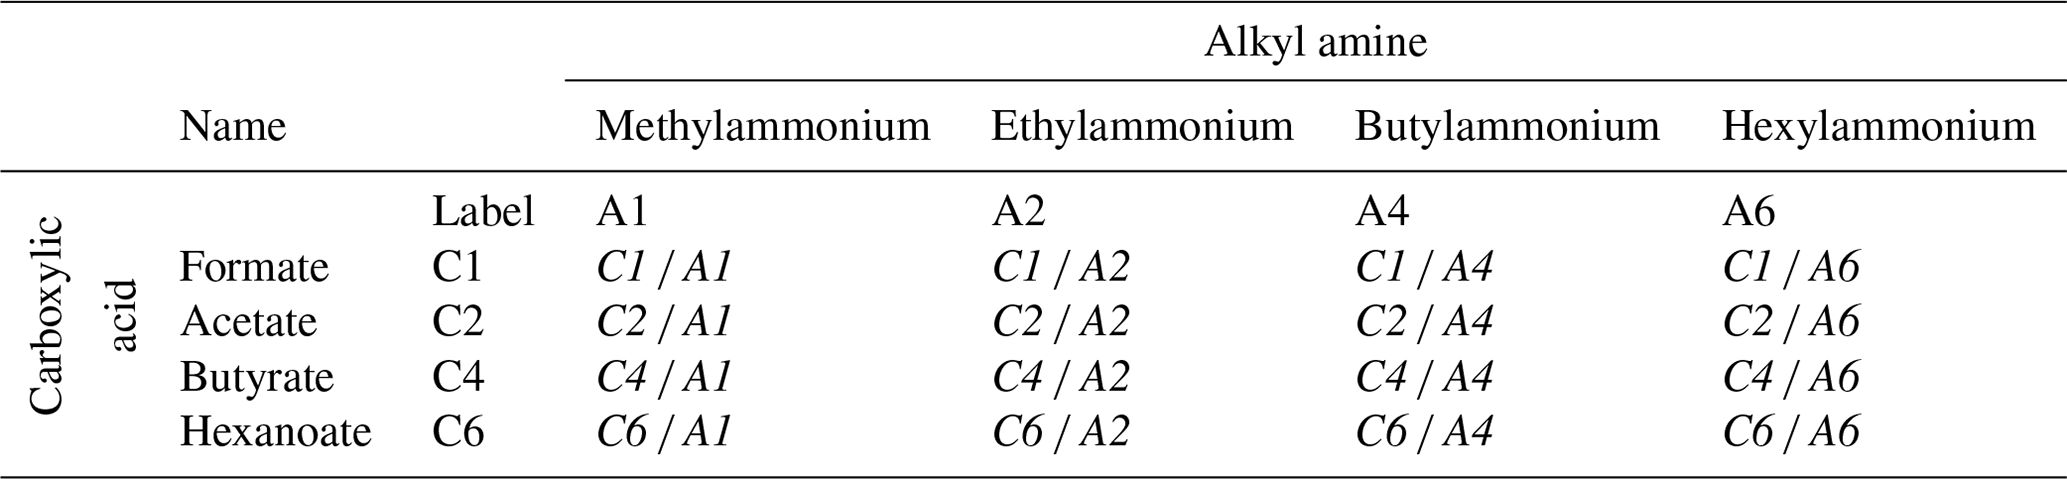
Surface-sensitive PES measurements were performed with a photon energy that results in a C 1s photoelectron kinetic energy (KE) of ∼ 100 eV, where the effective attenuation length (EAL), i.e., the probing depth into solution, is ∼ 15 Å (Thürmer et al., 2013). The samples were aqueous solutions of alkyl-carboxylate anions (sodium counter cation) and alkyl-ammonium cations (bromine counter anion) with variable chain lengths, with a total of eight individual molecular species and 16 paired mixtures (see Table 1). To keep descriptions concise, we adopt an abbreviated naming scheme, where letters A and C refer to alkyl amines and alkyl carboxylates, respectively. In addition, we use numbers which represent the number of carbon atoms, indicating the molecular chain length. For the former, the study covers the methylammonium (H3C–NH)aq cation, which is thus labeled “A1”, and so on: A2 represents ethylammonium (H3C–CH2–NH)aq, A4 represents butylammonium (H3C–CH2–CH2–CH2–NH)aq, and A6 represents hexylammonium (H3C–CH2–CH2–CH2–CH2–CH2–NH)aq, all with a Br− anion. The latter covers the following: C1 represents formate (HCOO−)aq, C2 represents acetate (H3C–COO−)aq, C4 represents butyrate (H3C–CH2–CH2–COO−)aq, and C6 represents hexanoate (H3C–CH2–CH2–CH2–CH2–COO−)aq, all with a Na+ cation. Mixed solutions of equimolar concentration are denoted Cx Ay, with x and y being the carbon counts. An overview of all studied single-component solutions as well as paired mixtures with their abbreviated labels is given in Table 1; sketches of all molecules are presented in Fig. 2c. The same table format is maintained throughout the paper when discussing quantitative peak intensities. Single-species solutions were prepared by dissolving methylammonium bromide (A1) of 98 % purity, ethylammonium bromide (A2) of ≥98 % purity, n-butylammonium bromide (A4) of ≥ 98 % purity, n-hexylammonium bromide (A6), sodium formate (C1) of ≥ 99 % purity, sodium acetate (C2) of ≥ 99 % purity, sodium butyrate (C4) of 98 % purity, or sodium hexanoate (C6) of 99 %–100 % purity, each from Sigma-Aldrich, in demineralized water (conductivity of ∼ 0.2 µS cm−1) to yield a 0.1 M concentration. At this concentration, the surface coverage of A6 is ∼ 0.37 and of C6 is ∼ 0.15 of the maximum coverage, i.e., well below surface saturation (Ekholm, 2018). Since A6 and C6 have the highest surface propensities among the single species, all other species will exhibit a lower surface coverage. Mixture solutions were prepared by mixing equal volumes of the pure solutions, yielding solutions with the same total solute concentration, 0.1 M, meaning 0.05 M concentrations for each species in the mixture.
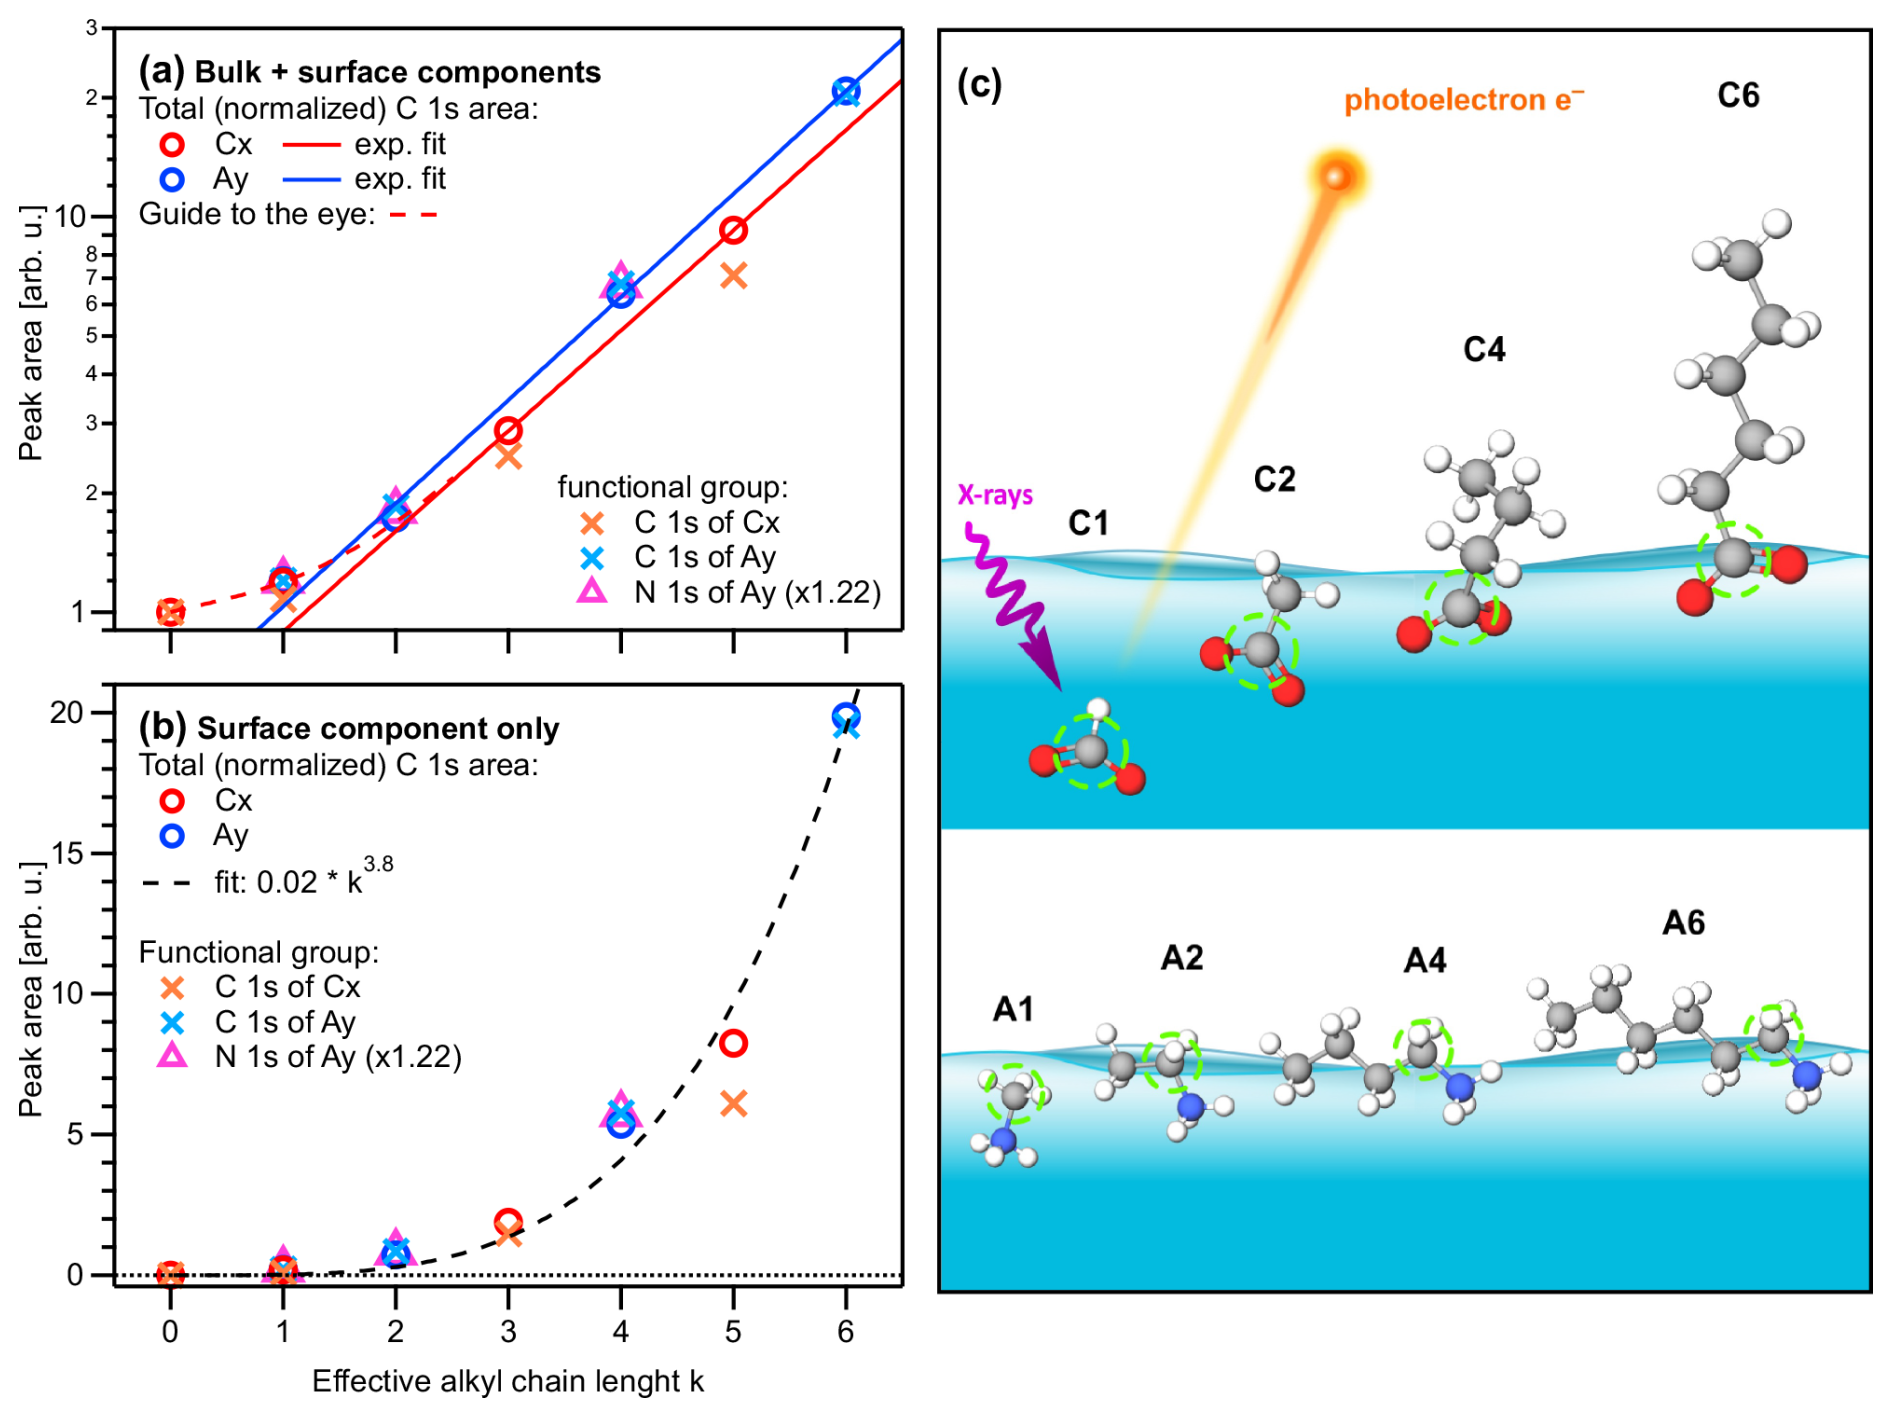
Figure 1(a) Peak areas extracted from the fits to the PE spectra for each single-component solution of carboxylic acid and alkyl amine (Cx and Ay, respectively; x,y = 1, 2, 4, 6), normalized by the value of formate, I(C1), and the number of carbons sites (x,y) within each molecule. Panel (b) shows the data of (a) after subtraction of I(C1), which represent the surface contributions (see the main text); note the different vertical axis scales. All values are plotted against the effective chain length k (bottom axis). Red and blue open circles represent the total-area values , i.e., a sum of all C 1s intensities, of the Cx and Ay species, respectively. Orange and light-blue crosses represent C 1s intensities of only peak p1 (related to the functional group) for Cx and Ay, respectively (compare Fig. 1). The N 1s peak intensities of Ay are plotted as purple triangles, which coincide with the crosses for Ay (i.e., the carbon near the functional group) when scaled with an arbitrary factor of 1.22. Both Cx and Ay show an approximately exponential increase as a function of k; note the logarithmic scale in (a) and the red and blue lines, which are exponential fits to the Cx and Ay data, respectively. Both species deviate somewhat from the exponential trend at low k, indicating a weaker promotion of surface propensity by short chains; see the dashed red curve as a guide to the eye. Small deviations of the crosses (functional group) above (Ay) or below (Cx) the circles' (total intensity) values are due to molecular orientation (see the main text). (c) Sketch of the likely average depth and orientation of each species as inferred from the absolute and relative intensities. The carbon site producing peak p1 is marked with a green circle.
Table 1Labeling scheme for the studied molecular species with varying chain lengths: carboxylic acids (C1–C6, vertical) and alkyl amines (A1–A6, horizontal). The eight single-component solutions (Cx and Ay, respectively) had a solute concentration of 0.1 M. The 16 mixed solutions (Cx Ay, italic text throughout all tables) were prepared at 0.05 M for each constituent, yielding the same total concentration of 0.1 M.
The aqueous solutions were injected into the vacuum chamber as a liquid jet via a silica-glass capillary nozzle with an inner diameter of 25 µm. The liquid was pumped via a Shimadzu LC-20AD high-performance liquid chromatography (HPLC) pump combined with an inline degasser unit (Shimadzu DGU-20A5R) and then pushed through the glass capillary to yield a typical flow rate of ∼ 0.8 mL min−1. The solution temperature was kept at ∼ 10 °C by water-cooling the LJ rod using a chiller unit; the temperature is expected to be a few degrees lower at the point of ionization (approximately 5 mm further downstream after the liquid is expelled into vacuum) of the liquid jet, due to evaporative cooling. At larger distances from the injection point, the liquid jet breaks up into droplets due to Rayleigh instabilities (Winter and Faubel, 2006). The resulting liquid spray is collected (frozen out) at the surface of a liquid-nitrogen cold trap, downstream of the flow direction. The distance between the locus of the jet–light-beam interaction and the entrance of the HEA was ∼ 0.8 mm, and the entrance aperture of the latter was also 0.8 mm in diameter. Accurate positioning of the jet was achieved by a high-precision x–y–z manipulator on which the LJ assembly was mounted. The optimal overlap of all axes was continuously monitored and adjusted during the measurement to account for signal fluctuations from small jet position drifts. This was done by injecting water with 50 mM NaCl in-between each sample and checking the PE signal level of the 1b1 band under identical conditions.
Because of stability issues noticed during analysis of the C1 A1 mixture in the first campaign, measurements of C1, A1, and their mixture (C1 A1) were repeated at PLÉIADES. Again, photon energies of 400 and 510 eV were employed to measure C 1s and N 1s photoelectron spectra, respectively. Here, the electron spectrometer was mounted such that the electron detection axis was perpendicular to the plane of the electron orbit in the storage ring. The LJ axis lies in the horizontal plane (plane of the electron orbit in the storage ring). The direction of propagation of the light, the electron detection axis, and the liquid jet were mutually orthogonal to each other. The angle between the light-polarization vector of the linearly polarized light and the spectrometer axis was set to 55°, which is close to the magic angle. A Shimadzu LC-40AD high-performance liquid chromatography (HPLC) pump was used to pump the liquid and push it through a glass capillary with 40 µm orifice diameter at a flow rate of 2.7 mL min−1. The LJ is then collected in liquid form by a heated copper–beryllium catcher. Differential pumping is achieved by housing the complete LJ assembly in an enclosure within the vacuum chamber while using small orifices for the insertion of the X-rays and the extraction of the photoelectrons. The distance between the LJ and the entrance of the 300 µm stainless-steel skimmer of the spectrometer was 1 mm. For more experimental details of the setup at PLÉIADES, see Powis et al. (2015) and Malerz et al. (2021).
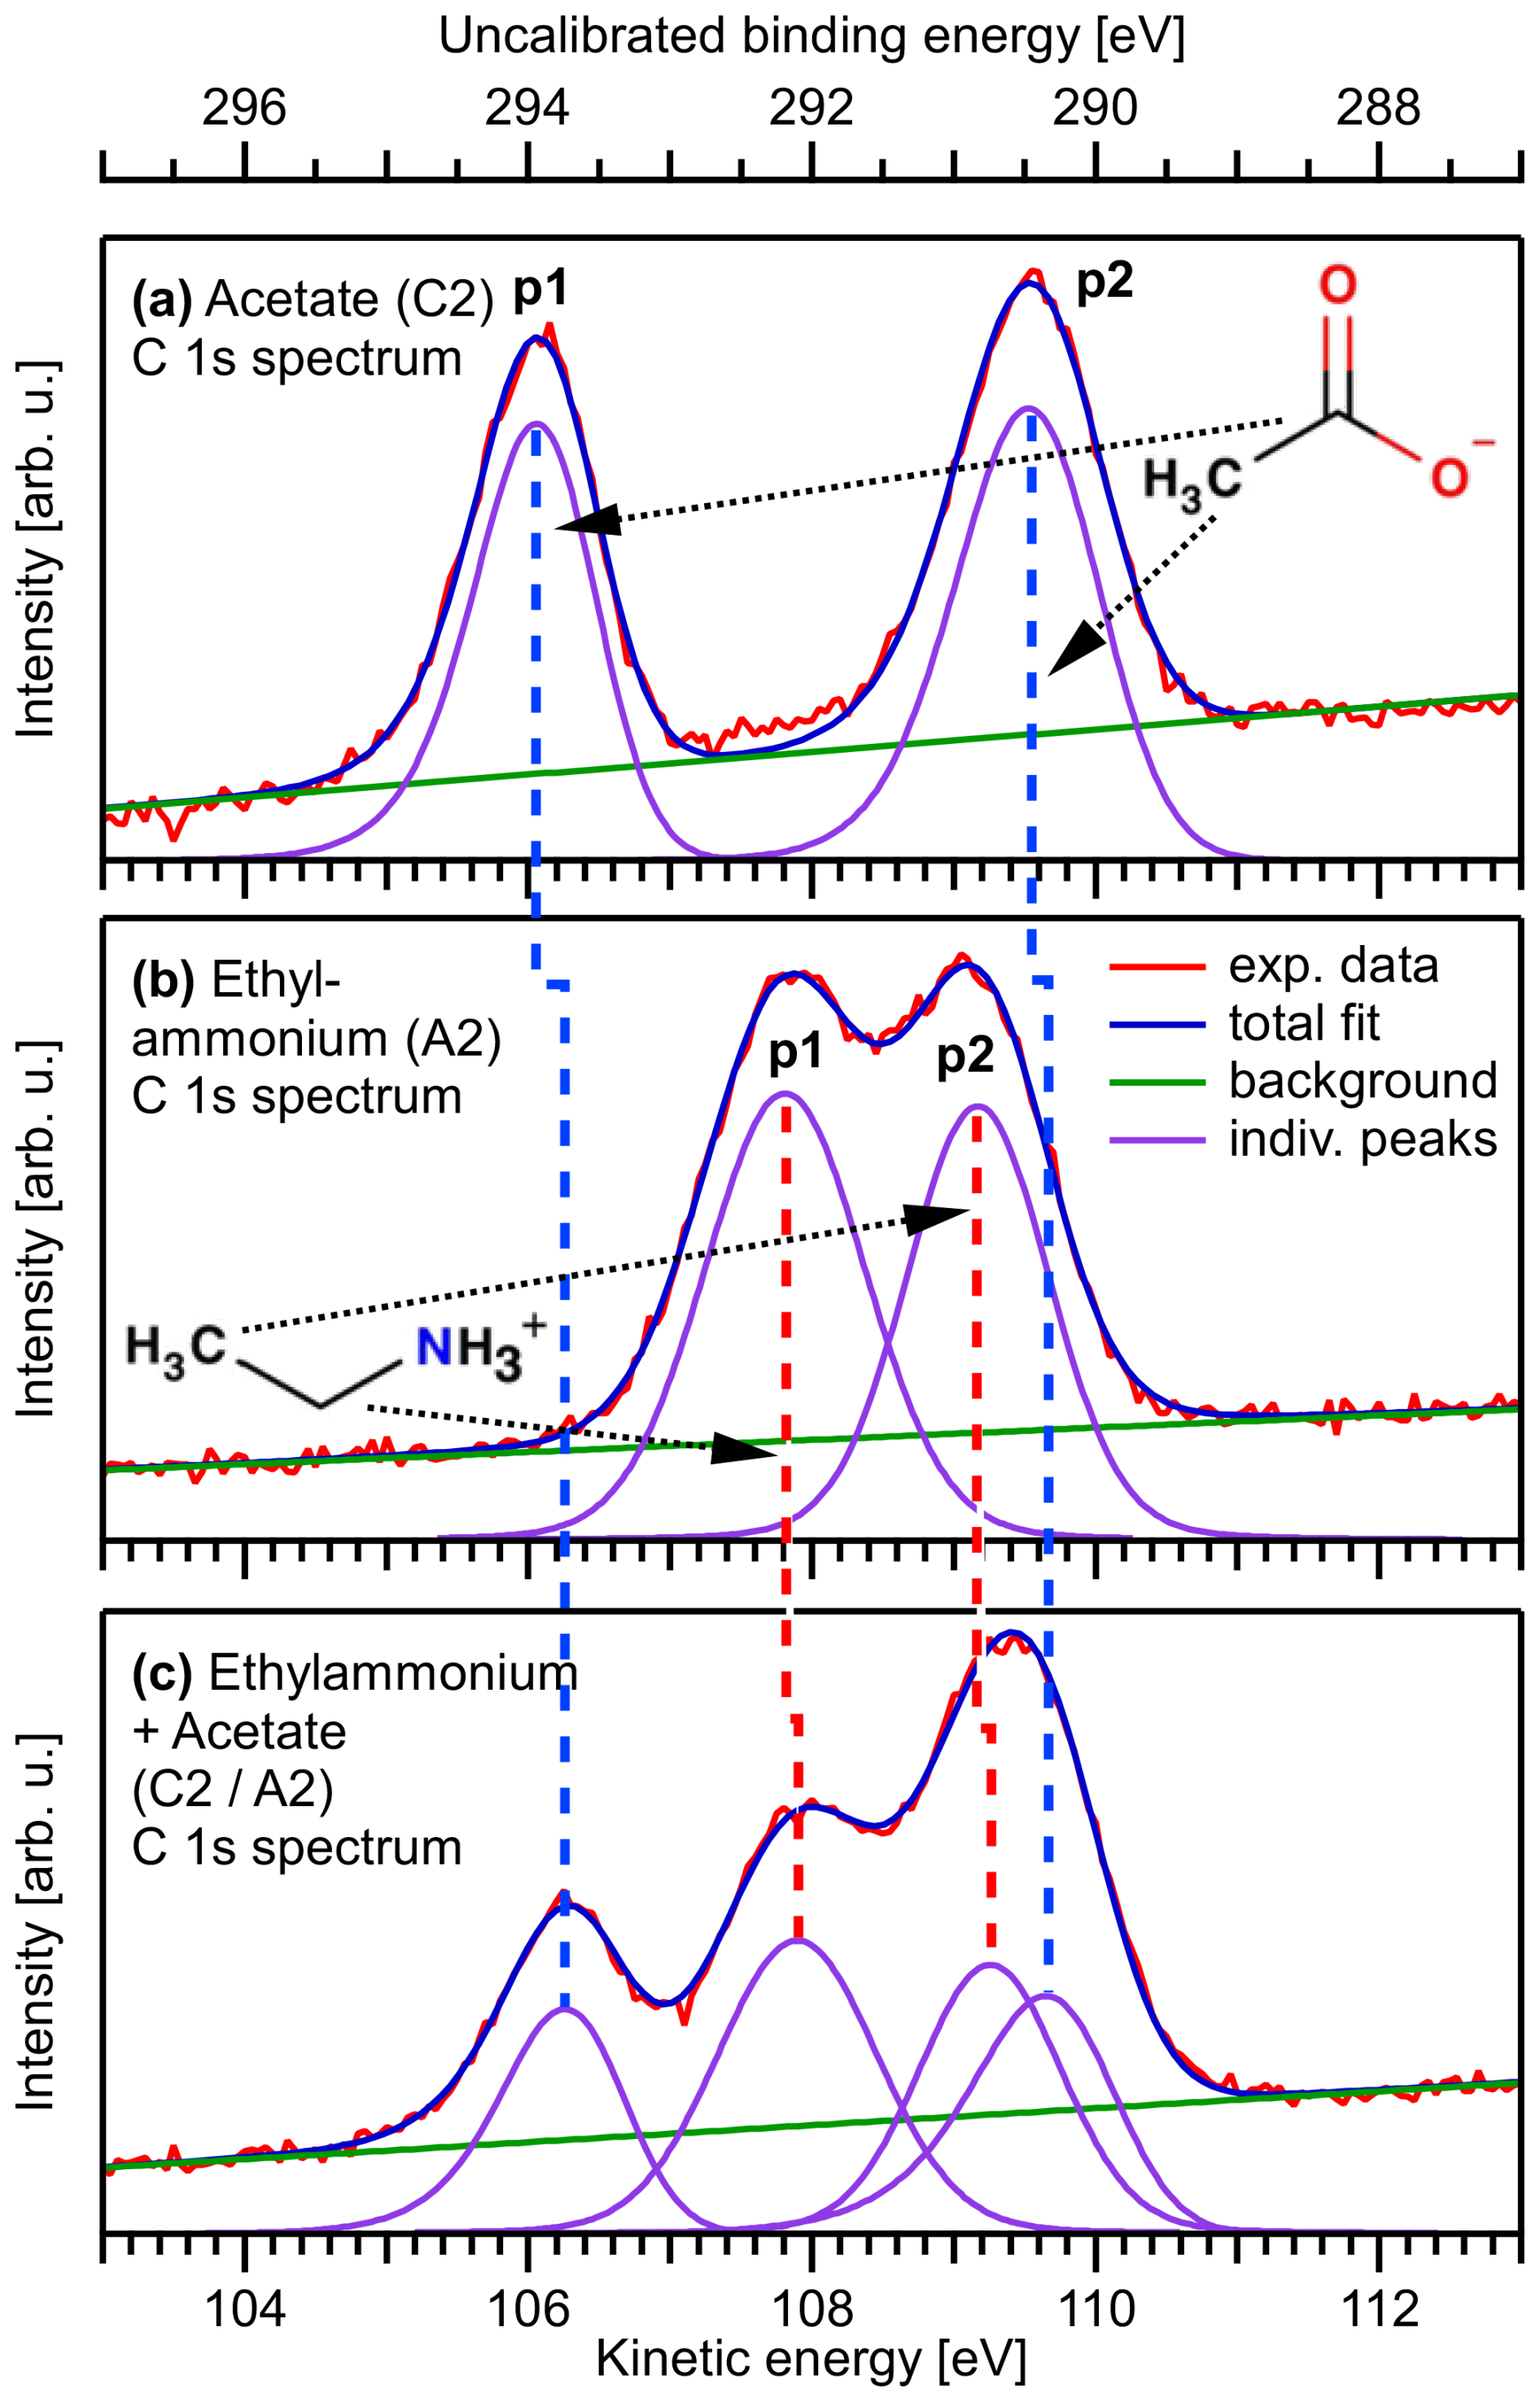
Figure 2Exemplary C 1s PE spectra from aqueous solutions of 0.1 M sodium acetate (C2, a), 0.1 M ethylammonium bromide (A2, b), and a mixture of sodium acetate and ethylammonium bromide (C2 A2, both 0.05 M, c), plotted on the as-measured electron KE scale. The BE scale at the top was calculated by subtracting the photon energy from the KE and was not further calibrated. The two peaks, p1 and p2, of the C2 spectrum, which are separated by a chemical shift, originate from the methyl carbon and the carboxylate carbon, respectively. The two slightly overlapping peaks, p1 and p2, in the A2 spectrum are from the methyl carbon and the carbon closest to the ammonium group, respectively. Relative to the alkyl-like carbons (CH2 and CH3, peaks labeled p2), the signals from the carbons in the two functional groups, –CH2–NH and –COO−, peaks labeled p1, are found at higher binding energies. On a qualitative level, this shift is caused by the proximity of electronegative atoms, which reduce the electron density around the carbon atoms in the initial-state and, thereby, also the final-state screening. This leads to a higher binding energy as compared to carbons bound to hydrogens or other carbons. In addition, the net charge associated with the two functional groups will lead to a shift. Moreover, small energy shifts associated with changes in the work function of the solution as the surface composition is changed may occur, which, however, does not affect the identification of the spectral peaks. For a further discussion, see Werner et al. (2018), with which the present results are consistent, as well as Thürmer et al. (2021). The spectrum of the mixed C2 A2 solution (c) can be understood as a sum of the C2 and A2 spectra. For details of the fitting procedure, see the Methods section.
2.2 Data analysis
The analysis of measured electron counts as a function of electron KE was carried out using Igor Pro (WaveMetrics, Sutter Instrument). First, the C 1s bands were fitted for all single-species solutions, i.e., the carboxylic acids (C1 to C6) and alkyl amines (A1 to A6) to extract peak shapes and widths. Exemplary fits for the C2 and A2 aqueous solutions are presented in Fig. 1a and b, respectively. The broad, featureless signal background, originating from inelastically scattered photoelectrons, was approximated with a linear function, which is a simplification but the most stable choice with only two fit parameters to vary. The signal contributions from the two carbon atoms, labeled p1 and p2 in the figure, respectively, can be separated for both solutions; all Cx and Ay species feature two distinct carbon signal contributions as we will detail later. A noticeable asymmetry of the C 1s bands of the carboxylic acids arises from unresolved vibrational excitations. To keep the number of fitting parameters preferably low, we chose asymmetric exponentially modified Gaussian (EMG) (Grushka, 1972) functions to account for the vibration contributions. The alkyl amine C 1s bands did not show any resolvable peak asymmetry and were best fitted with two (one in the case of A1) Voigt functions instead. A Voigt function yielded a better fit than a simple Gaussian function. The added complexity of both the EMG and Voigt functions has no impact on the results for the mixed solutions: the shapes of the EMG (asymmetry parameter τ) and the Voigt functions (Gaussian-to-Lorentzian width ratio) were held fixed in subsequent fits to the spectra of the mixed solutions, which removed any influence from these parameters. Indeed, for most of the solutions studied here, our procedure resulted in good overall fits of the measured photoelectron spectra. There are a few exceptions, where small additional signals occur, which we attribute to contaminations of unknown origin. These features were fitted with additional Gaussian functions (see the Supplement for details) but were not included in the determination of intensities (measured as peak areas) of the respective C 1s bands.
The mixed-solution spectra are fitted with a sum of the same number and type of functions as the individual species, where the shape (asymmetry τ for the EMG and width ratio for the Voigt functions, respectively) and peak width were kept fixed. Additional features from possible contaminants could not be discerned (see below); thus, additional (Gaussian) functions were not included in the mixed-solution fits. Since the contaminant features are small and not expected to be associated with a surface-active species, their contributions to the PE spectra, if present at all, become diminishingly small as peak intensities scale up rapidly for larger species. Figure 1c shows the C 1s fits for the C2 A2 mixed aqueous solution; the respective fits for the single-species solutions have been already introduced in Fig. 1a and b. The p2 bands are at similar positions for both the Cx and Ay species and are thus strongly overlapping. In the cases where both the Cx and Ay chains were present, i.e., x and y>1 for both species, the p1–p2 peak distance for Ay was set and held fixed to the result from the fit to the single-component Ay spectra. We note that the separation into distinct peak contributions becomes more difficult for species with increasing chain lengths. The spectral features of the chain carbons are almost completely overlapping for all species, which is an inevitable fact of the (lack of) chemical shift. In fact, for mixtures with the longest-chain alkyl amine A6, we had to additionally constrain the peak-height ratio for the Cx component to reach a stable fit, because the signal contributions from the chain for each constituent could not be discerned. This is a reasonable simplification since peak p1 of the Cx species is well separated in the spectrum and can serve as an anchor for the fit to determine the height of peak p2 for a fixed ratio.
We note that some of our PE spectra were unintentionally recorded under conditions of detector saturation (see the Experiments section), which disproportionally affects the signal intensity of the strongest bands for these spectra. Measurements of some samples (with the highest intensity) were repeated using a lower photon flux to circumvent saturation; the procedure is described in detail in the Supplement. Another complication was discovered when analyzing the peak intensities for the sodium formate methylammonium bromide (C1 A1) solution: we found fluctuating PE signal intensities of up to a factor of 2 during the initial measurement campaign. In that case, we have repeated the measurements from the (nominally) same C1 and A1 as well as C1 A1 concentrations in a different measurement campaign, using a different setup at the SOLEIL synchrotron radiation facility. Those measurements used a different sample batch and showed no sign of contamination, which reassured us that the sidebands in the initial data originated from contaminants. The signal intensities from the repeat measurement were scaled by the C1 signal to match the initial data and were used instead for the results presented here.
C 1s (relative) peak intensities, I(Cx) and I(Ay), the main observables in this study, which reveal a given species' variable and competing surface propensity, were quantified by normalization to the smallest peak-intensity value, I(C1), which is from aqueous-phase formate (C1). This normalization factor is used throughout the work for the analysis of all peak-intensity values; thus, the results represent a relative increase in surface propensity compared to formate. Peak intensities scale with the number of ionization targets, the photoionization cross section, and the probing depth of the C 1s photoelectrons (Hüfner et al., 2005). Molecular photoionization cross sections are unknown but are taken to be the same for all carbon atoms. In most cases, it is useful to present the data with the dependence on the carbon number removed, by normalizing to the number of relevant carbon sites. For example, when discussing the total peak intensity for C4, containing four carbons, the total intensity value is divided by four, and in the case of the C2 A4 mixture, with a total of six carbon atoms, the total intensity will be divided by six; such normalization will be stated in the caption.
In the case of the nitrogen-containing Ay species, we also recorded and analyzed the N 1s spectra. This procedure is much simpler, as only a single peak is present for all species, and the spectra were fitted with a single EMG function and a linear background. No contaminants were observed here, indicating that the contaminants are not degraded alkyl amine molecules. N 1s peak-intensity values were arbitrarily normalized to yield the same normalized intensity value as for the C 1s of methylammonium bromide (A1) for better comparability. Furthermore, the peak-intensity values of the mixed species must be adjusted for differences in molecular number density since each species in the mixed solutions had a concentration of 0.05 M instead of 0.1 M for the single-species solutions. Thus, intensity values were adjusted by a factor of 2 whenever relevant for a direct comparison.
We also analyzed the valence-band PE signal intensity based on a simple height comparison of the water 1b1 (HOMO) band for each solution's spectrum with that of a representative (average) neat water spectrum; see Fig. S2 in the Supplement for details.
Figure 1 shows C 1s PE spectra for three samples: C2 (Fig. 1a), A2 (Fig. 1b), and C2 A2 (Fig. 1c). The bottom axis presents the as-measured kinetic energy (KE) values of the photoelectrons, and the respective (uncalibrated) electron binding energy (BE) values, calculated as photon energy minus KE, are given on the top energy axis. These spectra are representative of the spectra recorded for all samples listed in Table 1; all PE spectra considered in the present study including the peak fits can be found in the Supplement as Figs. S4, S5, and S6. For both species, the spectra consist of two peaks: the peak p2 at the highest KE, i.e., lowest binding energy, corresponds to the methyl carbon. The peak p1 at lower KE, i.e., higher BE, is due to ionization of the carboxylate carbon for C2, and ionization of the carbon atom next to the ammonium group in the case of A2. The chemical shifts agree well with previous studies (Ottosson et al., 2011; Ekholm et al., 2018) and can be qualitatively understood as follows. The higher BE (lower KE) of the carbon next to N and O is due to the electronegative atoms N and O reducing the electron density around the C atoms relative to the methyl carbon. The slight shift of the methyl-carbon peak between C2 and A2 arises from the different charges of the C2 and A2 molecular ions. The spectrum of the mixed C2 A2 solution can be understood as a sum of the C2 and A2 spectra; see Fig. 1c.
We briefly comment on the definition of “chain” length for the Cx versus Ay species. The fact that carbon is not part of the functional group for the Ay offsets the chain length of this species by one with respect to Cx in practice, as we see below. Thus, we can say that A2 has a chain length of two, whereas C2 only has a chain length of one, as the carbon atom in the functional group is omitted. For this reason, we introduce the effective chain length for the Cx and Ay species, respectively. Yet, for Ay we can still distinguish between the carbon closest to nitrogen. The intensity of peak p1 will be treated separately as needed, since it allows us to discuss molecular orientation.
3.1 Single-component solutions
We start with the various single-component species in aqueous solution. Obtained peak intensities, based on the analysis of the C 1s and N 1s PE spectra (see the Methods section), are summarized in Table 2 and plotted in Fig. 2a. Normalized total C 1s peak intensities, Inorm, for the carboxylate and alkyl-ammonium species are plotted on a logarithmic scale against the effective chain length k, which is a measure of chain length ranging from 0 (no chain) to 6 (a six-carbon chain). Open circles represent Inorm(Cx) and Inorm(Ay), crosses are Inorm of peak p1 only (related to the functional group), and triangles represent Inorm for N 1s (Ay only). All values are normalized to the value of formate, I(C1), and as mentioned, the results can be understood as an increase in surface propensity relative to formate. The values shown in the figure are further normalized to x and y; thus, any increase is solely due to an increased surface propensity; see the bold numbers in Table 2, which are the ones plotted in Fig. 2.
Formate is known to be repelled from the liquid–vapor interface (Minofar et al., 2007) and thus can serve as a baseline for quantifying surface activity for the series of molecules studied here. We isolate the surface contribution from the total intensity Inorm for a quantitative characterization of the surface composition. Since all intensities have been normalized to the number of carbon atoms (x, y), the normalized bulk contribution should be the same for all species, i.e., equal to Inorm(C1). The surface contribution is then obtained by subtracting Inorm(C1) from each value of the different solutions, (C1), which is equivalent to since all values are already normalized by I(C1). This is done for both the Cx and the Ay species, and the resulting values are plotted in Fig. 2b. Clearly, the subtraction of the bulk component is just an approximation, since the probed solution–vapor interface is not a sharp transition. In fact, there is an approximately 1 nm thick gradient over which the average molecular density changes; see, for example, Werner et al. (2018) and Minofar et al. (2007) for the results of various organics. The Isurf,norm values discussed from here on thus reflect an average concentration within such a surface layer.
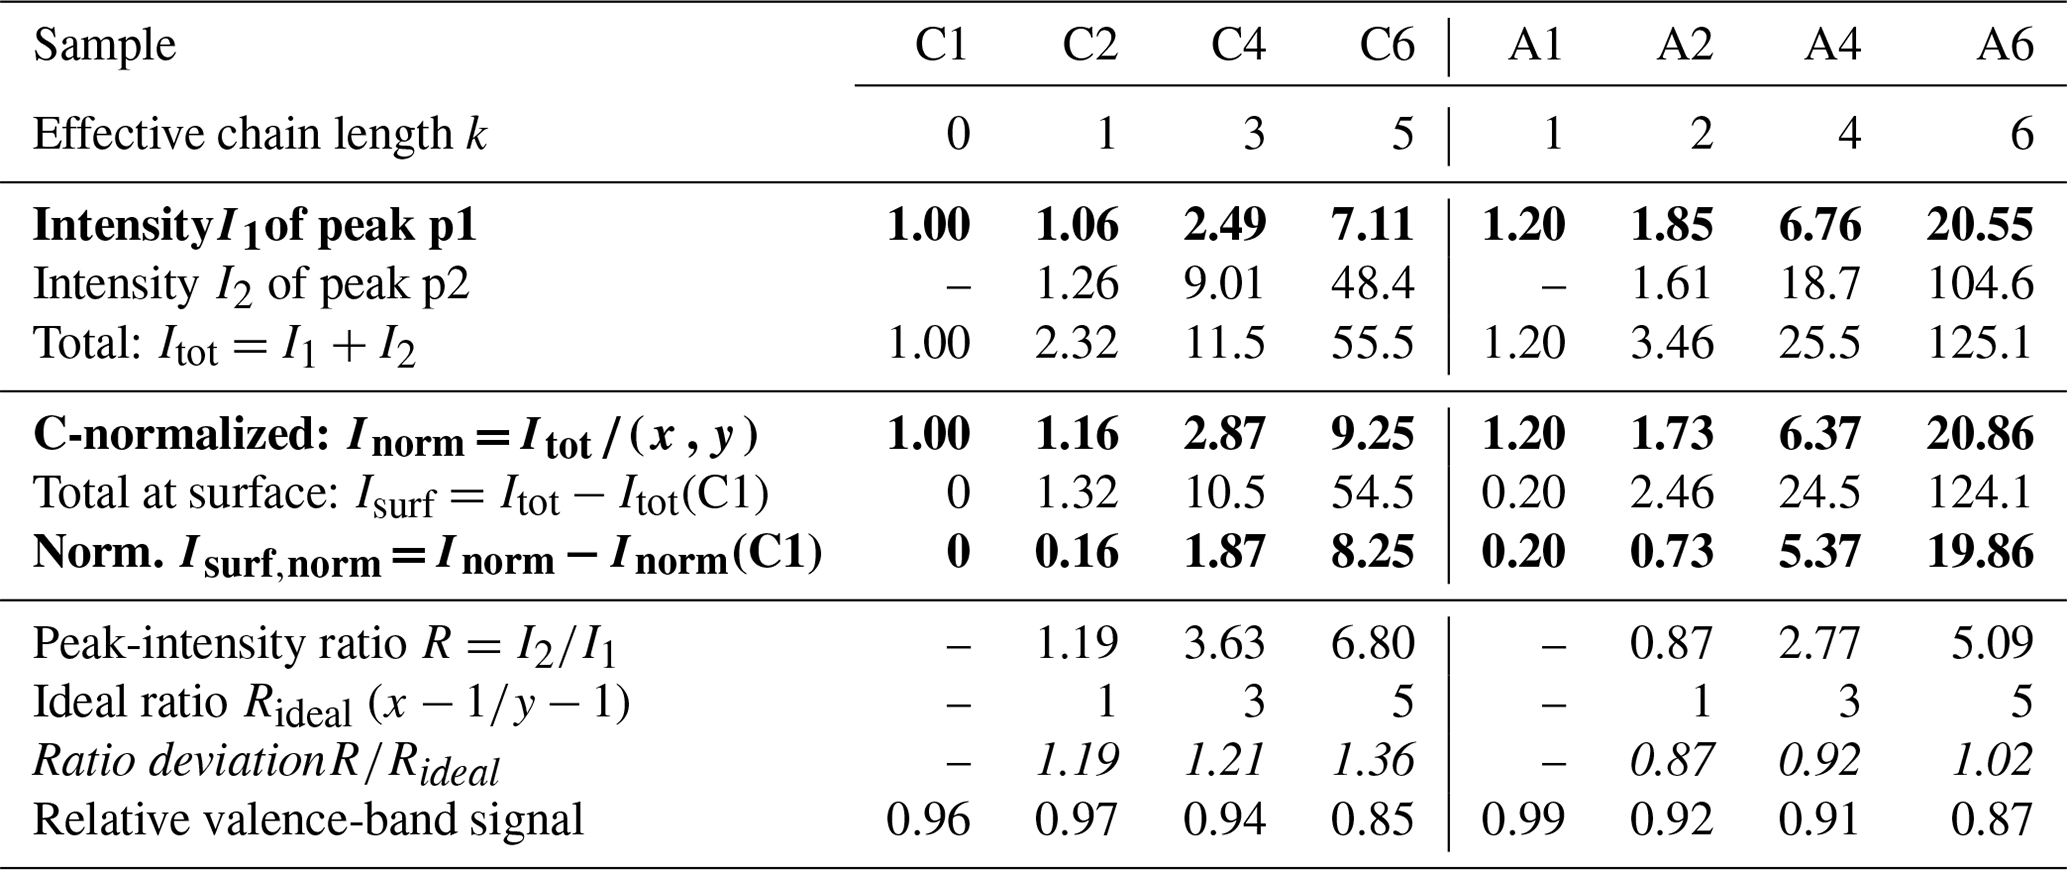
Table 2Analysis results for each single carboxylic acid (Cx) and alkyl amine (Ay) solution extracted from peak fitting to the C 1s PE spectra. All peak intensities are normalized to the value of formate (C1); see the Methods section. Peak intensities increase approximately exponentially with increasing chain length for both the Cx and Ay species; compare Fig. 2. The peak-intensity ratio R between peaks p1 and p2 (see Fig. 1) is compared to Rideal, calculated from the number of carbons contributing to peak p2; only one carbon atom contributes to peak p1 for all species. The results reveal a deviation from unity for all species. () indicates a preferable orientation with the chain (the functional group) towards the surface. The bottom-most row reports the relative change in the valence-band signal of each solution compared to neat water; see also Fig. S2. Bold values are plotted in Fig. 2a and b, respectively. Errors were estimated to be <2 % of the value from fitting errors and PE signal variations.
Except for the smallest molecules, C1 and A1, peak areas increase exponentially with increasing k (note the logarithmic ordinate scale of Fig. 2a), demonstrating a strong increase in surface propensity as the hydrophobic chain is extended. This is qualitatively expected given the well-known hydrophobicity of carbon chains. For x=y, the alkyl-ammonium ions (Ay) have a somewhat higher surface propensity than the alkyl-carboxylate ions (Cx), in agreement with the results for C4, C5, A4, and A6 in Werner et al. (2018). Note again that the chain length for Ay includes the carbon next to the functional group, while for Cx the carbon inside the functional group is excluded to calculate the k values. A good match between Cx and Ay demonstrates that indeed the effective chain length and not the absolute number of carbons determines the surface propensity of these species.
It should be noted that the measurement is performed at approximately ∼ 10−5 s after the liquid jet has exited the capillary (jet velocity ∼ 30 m s−1, distance ∼ 10−3 m). While this is a long time compared to the tens of nanoseconds used in MD simulations to obtain equilibrium conditions (see Ekholm et al., 2018, for the C6 A6 system), molecules with yet longer chain lengths may lead to further surface enrichment on a longer timescale. We cannot draw a sharp line and therefore conclude that the results presented here might be considered the lower limit for the observed surface behavior.
The surface contributions (Fig. 2b) for both species exhibit similar behavior and can be approximately described by k3.8. This is an arbitrary function obtained by fitting the data without any theoretical justification. Yet, we would like to showcase the possibility of a parameterized description of surface propensities, which would foster an inclusion of surface phenomena in improved atmospheric models. We have also analyzed corresponding intensity changes of the solvent, i.e., the reduction of (water) valence-band PE signal intensity as a function of x and y compared to an average neat-water valence spectrum. Results are shown in Fig. S2b.
From the relative intensities between peaks p1 and p2, i.e., the intensity originating from the carbon close to or within the functional group I1 relative to that from the chain carbons I2, we can also obtain information about the average molecular orientation at the surface. Returning to Fig. 2a, we take a closer look at the peak intensities, I1 (crosses), in close relation to the functional group; this carbon site can be easily identified in the C 1s PE spectra due to its associated large chemical shift. A similar but not exactly matching trend to the normalized total peak intensity, Inorm, is observed. For Ay, I1 values tend to be slightly higher than Inorm (compare circles vs. crosses); this is mirrored in the behavior of the N 1s data (triangles). For Cx, the I1 values tend to be somewhat lower than Inorm. Both effects can be interpreted to originate from molecular orientation: if one end of the molecule is closer to the solution–vapor interface, its signal will be larger compared to other molecular sites, which are pointing further into the bulk solution. We quantify this by calculating the intensity ratio R between the peaks, i.e., . This ratio can then be compared to Rideal, calculated from the number of carbons contributing only to peak p2, i.e., the chain. If R=Rideal, then all carbon sites are exposed equally (they are at equal probing depths) on average, implying that the molecules are either parallel to the surface along their long axis or randomly oriented. If instead , the molecule is preferably oriented normal to the interface (anchored) with one end. Table 2 (bottom part) summarizes the values of R, Rideal, and for each species. It is apparent that the ratio is consistently above unity for Cx, which implies that the Cx molecules are oriented with the hydrophilic functional group towards the bulk solution, and the hydrophobic chain is oriented towards the vacuum. For Ay, the opposite trend is observed: is slightly smaller than unity. This is surprising since it implies that the (carbon near the) functional group is closer to the interface than the chain. That is, the molecule lies rather parallel in the interfacial plane, despite the hydrophilic interaction of the amine end. The proposed orientations and relative depths of both species are sketched in Fig. 2c.
The molecular orientation at the surface is due to a balance between the hydrophobic and the hydrophilic interactions. The charged groups interact strongly with the water and tend to be submerged, i.e., fully surrounded by the solvent; here, carboxylate interacts stronger with water than ammonium. In contrast, the alkyl chains can only interact weakly with the water and tend to be expelled from the liquid interface. We speculate that for the alkyl carboxylates this could result in a somewhat more deeply solvated carboxylate group with the alkyl chain pointing outwards, while for the alkyl ammonium the less deeply solvated ammonium group would allow the alkyl chain to orient itself along the surface for increased bonding to the outermost water molecules. One may also expect that the counter ions, Na+ or Br−, may have a small contribution to the emerging surface structure, but that aspect has not been explored in the present study.
To summarize, the single-component aqueous solutions of carboxylate anions and alkyl-ammonium cations show an approximately exponentially increased surface propensity as a function of length of the hydrophobic alkyl chain. For the same number of carbon sites (i.e., x=y), the surface propensity is higher for alkyl-ammonium cations than for carboxylate anions, consistent with the larger effective alkyl chain length k of the former () and previous results for C4, C5, A4, and A6 in Werner et al. (2018). Moreover, the carboxylate anions seem to have an orientation perpendicular to the surface plane, whereas the alkyl-ammonium cations lie parallel to the surface plane.
3.2 Mixed solutions
We now turn to the mixed solutions, with results summarized in Table 3 and plotted in Fig. 3. Analogous to Fig. 2, Fig. 3 shows the total normalized intensity Inorm in panel (a) and the surface contribution Isurf,norm in panel (b), with the latter also summarized in the table. To emphasize the changes in surface composition, the normalized total surface intensity, Isurf,norm, a measure of the combined amount of organic molecular ions at the surface, is derived as before for the single-component solutions as (C1). In the figure, results for the Cx and Ay single-species solutions are highlighted by the red and blue circles, respectively. Values vastly increase for the mixed solutions, Cx Ay. Comparing Isurf,norm for the two mixtures of the smallest, C1 A1, and largest molecules in this study, C6 A6, we find an increase by a factor of ∼ 230. Neglecting depth-distribution differences, one can directly relate this to the different number of molecular ions at the surface.
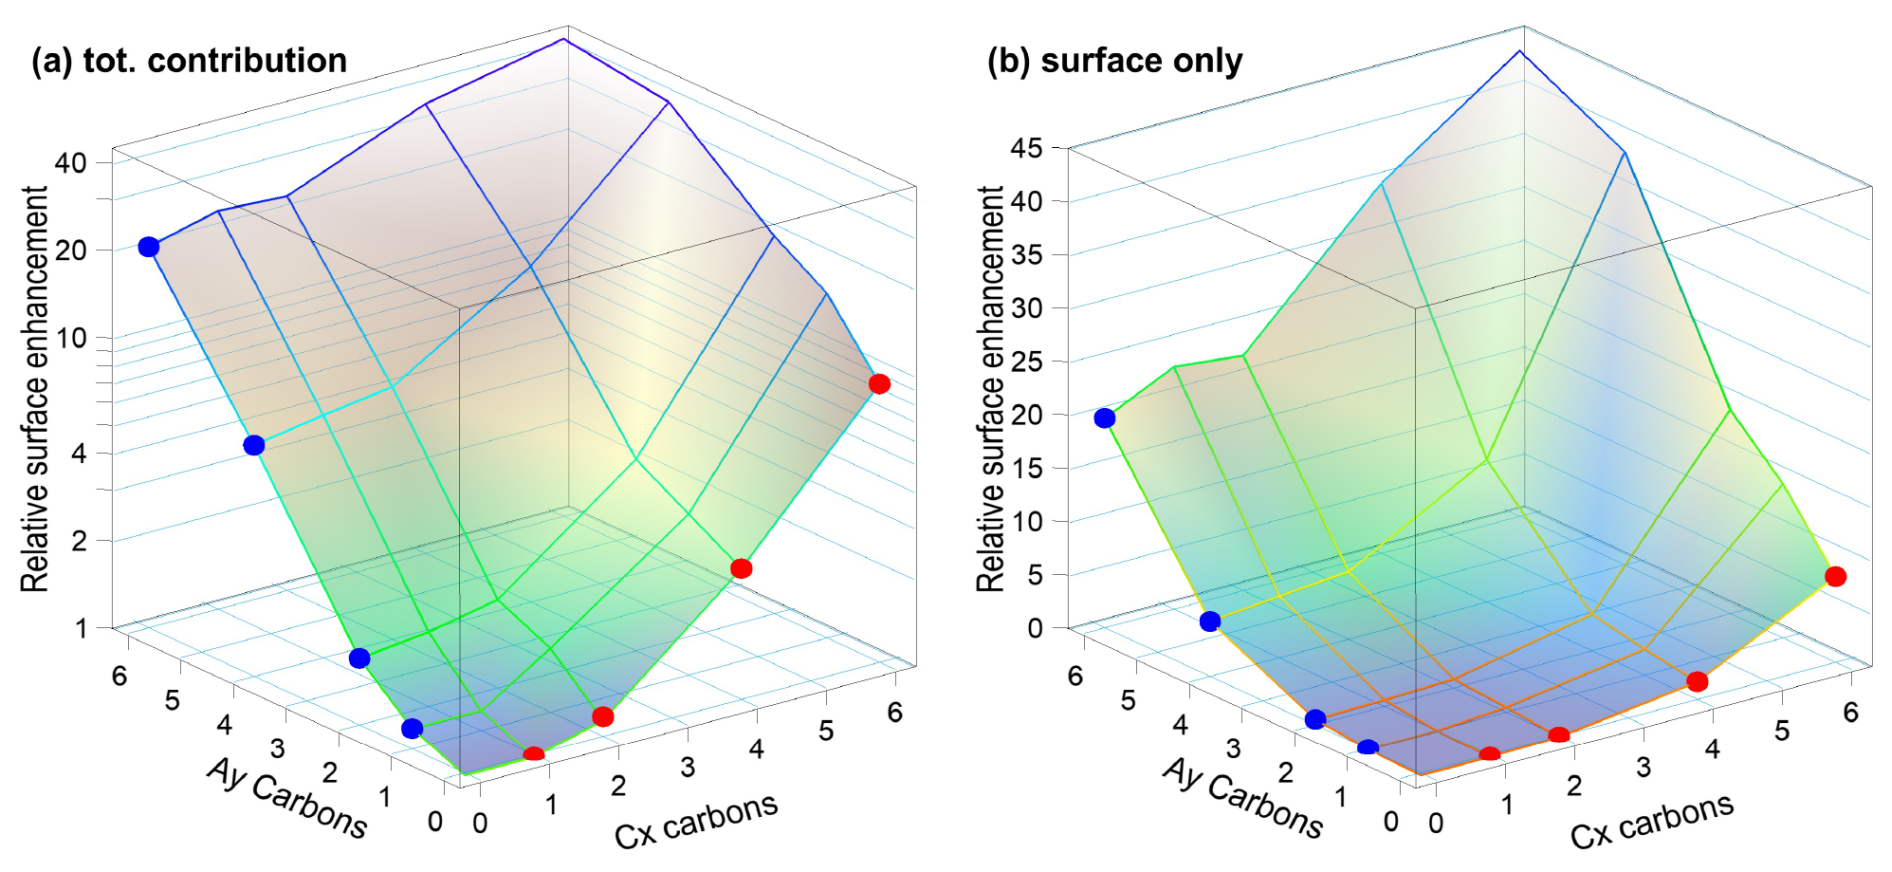
Figure 3(a) Normalized total C 1s peak intensity, Inorm, i.e., divided by the total number of carbon atoms and by the value of C1, for all studied species on a log scale. (b) Total surface component only, Isurf,norm, i.e., after subtraction of I(C1), on a linear scale. The two abscissae represent the total number of carbons (x,y) in the molecule for Cx and Ay, respectively. Red and blue circles mark the values for each single-species solution Cx and Ay, respectively, and correspond to the red and blue circles in Fig. 2. The plots can be seen as analogous to Fig. 2a and b but now including the mixed solutions as a pseudo-3D representation. The highest overall surface propensity is observed for C6 A6.
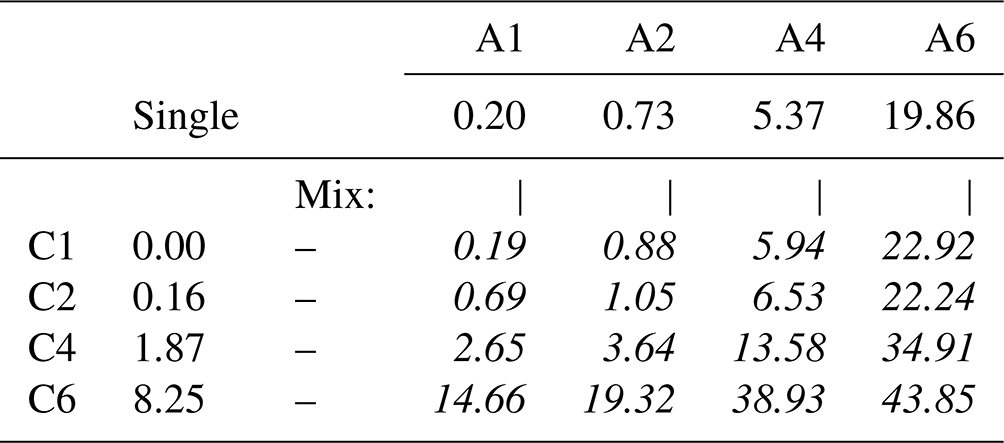
Table 3Total surface intensity, Isurf,norm, of all C 1s peaks and species combined, i.e., the sum of all C 1s peaks not separated into different molecular sites, which were extracted from fits to PE spectra of single- (frame) and mixed-species (italic text) solutions; the former values are included for comparison and are the same as in Table 2. All peak intensities were normalized to the value of formate (C1) and to the relevant number of carbons (see the Methods section). Furthermore, values have been adjusted for differences in molecular number density, i.e., 0.05 M (mixtures) versus 0.1 M (single species). The error for all values is estimated to be ±0.05 from intensity fluctuations and fit errors.
To quantify cooperative effects, we can make the ansatz that in absence of such effects the intensity should just be the sum of the individual species' intensities, . We then compare this with the measured intensities for each mixture by calculating the ratio ; the resulting values are summarized in Table 4. A ratio larger than unity corresponds to a larger than expected surface propensity. This becomes more pronounced towards longer chain lengths, i.e., higher x and y values. The increase in the mixed solutions clearly shows that ion–ion interactions lead to a cooperative surface enrichment of the organic molecular ions. We can discern roughly two regimes analogous to the single-species results: a slow increase and small cooperative effect when the chain is short (absent) and a large effect for long chains. For mixtures with C1 and C2 only, an insignificant cooperative effect is observed; C2 A1 is an exception, but we assume this is an outlier produced by a relative signal intensity that is too high for this mixture in the experiment. For larger x and y, the increase is more pronounced, reaching up to a factor of 3 for C6 A4. We would expect the ratio for the C6 A6 mixture to be higher, but it is possible that the surface already becomes saturated with molecules in this mixture, leading to a relatively small increase as compared to the (already very surface active) individual species C6 and A6. We would like to emphasize at this point that surface saturation is another crucial aspect determining the availability of molecular ions at the surface; here, saturation plays a limiting role for enrichment. We have seen above that cooperative effects can multiply the number of molecules at the surface by a factor of several hundred, quickly saturating the surface even at small bulk-solution concentrations. Thus, the relative increase in number density may be much larger at small initial concentrations very far from saturation, while only a small or even no enrichment is observed for an already relatively high initial concentration of each constituent species. Surface saturation should thus always be considered when modeling ion densities. We also note that an asymmetric mixture (deviations from the 1 : 1 concentration ratio) may further complicate the interaction, which is, however, beyond the scope of the current study.
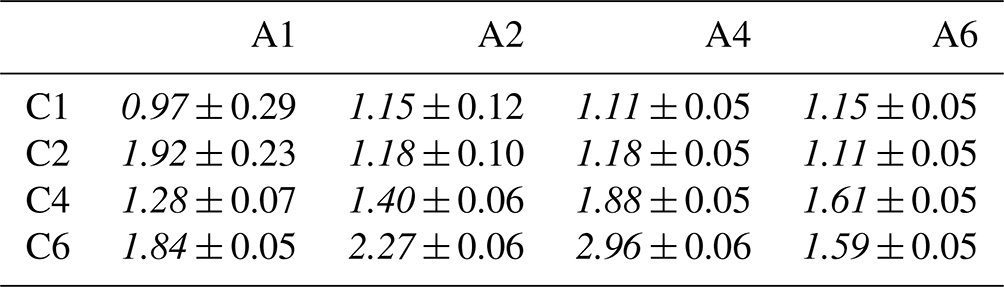
Table 4Surface enhancement ratio for the mixed solutions relative to the sum of the individual species' intensity , using Isurf,norm from Table 3. Errors are the result of error propagation of errors for determining the individual intensities.
3.3 Microscopic mechanism for cooperative surface enrichment
When only a single molecular ion species is present, the molecular ions on the surface repel each other via their charged head groups while their inorganic counter ions are located beneath the surface layer, as schematically illustrated in Fig. 4. Coulomb repulsion makes a high surface coverage of molecular ions energetically unfavorable. However, in the mixed-solute systems, Coulomb repulsion is reduced as the alkyl-ammonium cations and alkyl-carboxylate anions act as counter ions for each other, fostering a cooperative effect that allows for greater coverage of organic molecular ions at the surface. Cooperative surface enrichment similar to the observation in the present study has been reported for the C6 A6 system (Ekholm et al., 2018) and was qualitatively attributed to a combination of ion pairing between the charged functional groups of the respective organic ion, hydrophobic expulsion of the alkyl chains from the surface, and van der Waals interactions between the alkyl chains. Furthermore, the close packing of the alkyl chains contributes to the effect: molecules align perpendicular to the surface and are stabilized by van der Waals interactions between the chains, analogous to alcohols (Walz et al., 2015, 2016).
Figure 4Schematic illustration of attractive (green arrows) and repulsive (orange arrows) interactions between the organic and inorganic ions in the surface region for the C6 (a), A6 (b), and C6 A6 (c) cases.
3.4 Surface orientation
For the single-species solutions, we concluded from the C 1s peak-intensity ratios, , between intensities originating from the carbon atom close to or within the functional group I1 relative to that from the chain carbons I2, that the Cx anions seem to have an average orientation perpendicular to the surface plane, whereas the Ay cations are rather lying parallel to the surface plane. What then is the molecular orientation in the mixed cases, considering the much higher molecule number densities at the surface? In Table 5, we present the C 1s peak-intensity ratios R and as defined for the single-component cases. Again, a value of above (below) 1 indicates a preferable orientation with the chain (the functional group) closer to the surface. We observe that the Cx species retain their preferential perpendicular orientation, as expected. Similarly, the Ay species largely maintain their preferentially parallel orientation for the most part. Interestingly, the data imply Ay changing into a perpendicular orientation for C6 A4, C6 A6, and C4 A6, adapting a configuration that is normal to the surface and thus aligned with Cx at the surface. The molecular-scale mechanism of the cooperative surface propensity may thus include changes of the orientation from lying down to standing up, enabling higher molecular surface densities. Note, however, that the results for the latter two cases are less reliable since the peak ratio was constrained for the Cx component, thus possibly arbitrarily inflating the ratio for Ay. Still, such a result is not unexpected considering that a close packing of aligned molecules uses the available space more effectively (compare Fig. 4c). This result may also be related to surface saturation being likely reached with the particular concentration used, which has the tendency to force molecules into an aligned configuration (Walz et al., 2015, 2016).
Table 5Relative C 1s peak-intensity contribution from the chain I2 versus the functional group I1 for (a) the Cx and (b) the Ay species in aqueous solution. I1 and I2 of each species were extracted separately from the combined PE signal via fitting, and was calculated. The result is compared against , y−1, calculated from the number of carbons which contribute to I2. Below each entry we also present in bold. A value of indicates a preferable orientation with the chain (the functional group) closer to the surface. Values marked with a star (*) in (a) for mixtures of Cx with A6 are not fit results since these values were constrained during the fitting to reach a stable outcome for the strongly overlapping p2 peaks of Cx A6; values were chosen to represent averages of the results from the other Cx Ay mixtures with y<6. The error for all other values is estimated to be within ±0.1 via error propagation.
3.5 Surface composition
We discussed that the surface propensity of the single species increases with the number of carbons (x, y) and that cooperative ion–ion interactions lead to an additional increase in surface propensity for the mixed solutions. How do these two effects combined influence the relative amounts of Cx and Ay at the surface? In Table 6, we summarize the ratio , i.e., the ratio of the total intensities for each species, which is an indirect measure of the amount of Ay molecules relative to the amount of Cx molecules at the surface. We observed that the ratio is larger than unity when the Cx moiety has a short (C2) or no chain (C1); that is, the surfaces of these solutions are dominated by the Ay species. For Cx with longer chains, C4 and C6, combined with short-chained Ay, A1 and A2, the situation is reversed; that is, the ratio is smaller than unity. If the chains of both molecules are long, then the ratio converges to 1 (a 1 : 1 molecule ratio), which is expected when considering that a mutual charge neutralization would favor equal amounts of cationic Cx and anionic Ay species at the surface. Note that A6 is a longer molecule than C6 because of the nitrogen in the functional group, which explains the larger-than-unity intensity ratio for Cx A6 (with ); that is, the A6 molecule is likely protruding out further when both are aligned upright at the surface. We conclude that the species with the longer chain dominates the surface of the mixed solutions, and if both species contain long carbon chains, they are present in approximately equal amounts.
Table 6Relative surface contribution of Ay versus Cx to the C 1s PE spectra of the mixed solutions, i.e., an intensity ratio obtained as . Errors are calculated via error propagation and can get large if the denominator is very small (such as for C1 A2).
3.6 Amount of carbon at the surface
So far, we discussed the number density of organic molecular ions at the surface. However, some atmospherically relevant aspects, such as the availability of carbon for reactions with incoming radicals and the effects on water accommodation rather scale with the absolute amount of carbon (Shiraiwa et al., 2011; Davies et al., 2013; Ergin and Takahama, 2016; Miles et al., 2016; Ruehl et al., 2016). Here, the total C 1s surface intensity, , i.e., not normalized by the number of carbons (x, y), provides a measure of how the amount of surface carbon varies. These values are summarized in Table 7. Since molecular ions with higher surface propensity also tend to contain more carbon atoms, the amount of carbon at the surface scales even stronger with the alkyl chain length than the amount of organic molecular ions itself. For example, the relative amount of carbon at the surface is ∼ 1400 times higher for C6 A6 than for C1 A1.
Table 7Relative amounts of carbon at the surface, expressed as the total intensity minus the bulk contribution . The error for all values is estimated to be ±0.05.
3.7 Implications for inorganic ions
Another aspect of the surface enrichment of organic molecular ions concerns their ability to draw inorganic ions to the surface. Inorganic ions such as halides are important in atmospheric chemistry, as exemplified by the ozone depletion through a reaction with iodide and bromide (Moreno et al., 2018; Chen et al., 2021), the production of Cl2 from OH (gas) and Cl−(aq) (Laskin et al., 2006), and the reaction between N2O5 (gas) and Br−(aq) (Sobyra et al., 2019). These reactions involve a gas-phase species and a solvated halide ion, hinging on the presence of the latter at the surface. In single-solute solutions, the inorganic ions act as counter ions to the surface-enriched organic ions, which leads to the formation of an electric double-layer where organic ions occupy the surface and where inorganic ions reside in a sub-layer underneath. The considerable enrichment of either positively or negatively charged organic ions on the surface has been shown to lead to a notable increase in the concentration of inorganic counter ions within this sub-layer (Gopakumar et al., 2022). However, in mixed cationic–anionic molecular ion solutions, the inorganic ions are not the main counter ions of the organic ions, as discussed above. As a result, the inorganic counter ions can be expected to exhibit reduced enrichment in the sub-layer of such mixed cationic–anionic molecular ion solutions (compare Fig. 4 and Gopakumar et al., 2022); hence, fewer ions are available for reactions with gas-phase species.
3.8 Atmospheric implications
Before elaborating on the atmospheric implications, we briefly discuss the conditions of our measurements and their atmospheric relevance. Our PES studies from aqueous solutions were performed near ∼ 10 °C temperature and at rough vacuum conditions. Such temperatures are found in the atmosphere, both at ground level and higher up. Operation at low pressure implies that the measurements were made under evaporative conditions with the immediate surface being at or slightly below the vapor pressure of water, which are also found in the atmosphere. We note that this pertains to the water solvent, while the investigated molecular ions do not have an appreciable vapor pressure. Based on these considerations, we are confident that the phenomena we report are relevant for atmospheric aerosols, and we will now proceed to elaborate on the atmospheric implications.
Organic matter is ubiquitous in atmospheric aerosols, both on land and in the ocean, from the tropics to the Arctic. Many organic substances are surface active to a certain extent and also contain (de)protonatable groups such as amino and carboxyl groups, forming molecular ions in a broad pH range from slightly below 5 to somewhat above 10. On the microscopic level, the surface composition of aqueous aerosols has been discussed in terms of solvent–solute interaction, and we show here that solute–solute interactions can also substantially increase the amounts of organics at the surface. The presence of an outer organics-enriched layer has been shown to influence a number of relevant properties and processes, such as optical properties and shortwave radiative effects, water accommodation, and chemical aging; see, for example, McFiggans et al. (2006), Shiraiwa et al. (2011), Sareen et al. (2013), Davies et al. (2013), Ergin and Takahama (2016), Miles et al. (2016), Ruehl et al. (2016), Ovadnevaite et al. (2017), and Lowe et al. (2019).
Organics at the surface lower the surface tension, which is most relevant for the present study. This directly affects aerosol droplet formation, as described by classic Köhler theory (Köhler, 1936; McFiggans et al., 2006) and leads to significant enhancements of cloud condensation nuclei (Sareen et al., 2013; Ovadnevaite et al., 2017). Furthermore, the amphiphilic organics at the surface tend to be oriented with the carbon chains outwards. These organics can form a hydrophobic film, which, on the microscopic scale, will reduce the sticking coefficient of incoming water molecules and thereby affect water accommodation, as well as reduce the frequency of water molecules leaving the liquid phase, i.e., reduce evaporation (McFiggans et al., 2006; Davies et al., 2013; Ergin and Takahama, 2016; Miles et al., 2016; Ruehl et al., 2016). Yet another aspect is that surface species are more accessible than bulk-solvated species for reactions with atmospheric radicals. The cooperatively enhanced surface propensity sets the stage for further chemistry, as surface species are chemically more active than those in the aerosol bulk. This affects, for example, the aerosol chemical aging, i.e., the time evolution of the chemical composition via chemical and photochemical processes (McFiggans et al., 2006; George and Abbatt, 2010; Shiraiwa et al., 2011). These three examples illustrate how surface enrichment of organics influences atmospherically fundamental surface properties and processes.
On the microscopic scale, many common amphiphilic organics containing amino and carboxyl groups are strongly surface enriched by solute–solvent interactions, implying that modeling aqueous aerosols as homogenous droplets would be inadequate for surface-related phenomena. Our present results show that the surface propensity can be further strongly enhanced in a wide and environmentally relevant pH range by solute–solute interactions, mainly between the oppositely charged molecular ions. This implies that such cooperative effects boosting the single-solute surface propensity would have to be considered to properly model the surface composition of aqueous aerosols and, hence, all surface-related properties and processes.
On the macroscopic scale, these changes in surface composition can, therefore, significantly influence radiative forcing via aerosol growth, cloud condensation nuclei activity, and aerosol chemical aging. Our results demonstrate the principal feasibility of a more advanced input for creating parameterized descriptions of aerosol surface composition needed to properly account for their impacts in climate models. Specifically, the observed drastic increase in surfactant density due to the molecular interactions between different types of organic surfactants would be one effect to be included in future modeling, e.g., cloud droplet formation.
The ionic alkyl amines and carboxylic acids, crucial in the atmosphere as organic compounds, are prevalent over their non-ionic forms in solutions at pH near 7. We investigated the composition of surfaces in aqueous solutions containing single components as well as mixtures of the carboxylic acid cations formate, acetate, butyrate, and hexanoate and the alkyl amine anions methylammonium, ethylammonium, butylammonium, and hexylammonium, which are relevant in an atmospheric context. By using surface-sensitive X-ray-based PES measurements, we show that mixtures of these compounds exhibit a notable surface enrichment in organic ions compared to solutions with just one species. The availability of molecular ions at the surface scales exponentially as a function of carbon chain length, yielding an increase of up to a factor of ∼ 230 of the molecular number density and ∼ 1400 times the amount of carbon between mixtures of the smallest species and the largest species studied here. This enrichment arises mainly from ion-pairing interactions of the two ionic species, even at low bulk-solution concentrations. Yet, surface saturation imposes a limit on the maximum achievable enrichment. From this result, it is anticipated that even small variations in composition with admixture of different species can lead to significant changes in atmospherically relevant surface properties and processes such as surface tension, condensation rates, evaporation rates, water accommodation, and the chemical aging of aerosols. Furthermore, changes in the surface composition and condition may significantly impact radiative forcing at a larger scale via aerosol growth and cloud condensation nuclei activity. Our findings underscore the necessity for a comprehensive understanding of the surface composition of aqueous solutions of organic molecules, which is a critical aspect for enhancing the accuracy of aerosol modeling within climate models.
The data of relevance to this study have been deposited at the following repository: https://doi.org/10.5281/zenodo.12644491 (Kaur et al., 2024).
The supplement related to this article is available online at https://doi.org/10.5194/acp-25-3503-2025-supplement.
GÖ and OB conceived the experiments. HK, SG, BC, FT, DV, RM, JP, HB, ANB, GÖ, BW, and OB planned, prepared, and carried out the experiments and discussed the data. HK and ST analyzed the data. ST, BW, and OB wrote the manuscript with feedback from all authors.
The contact author has declared that none of the authors has any competing interests.
Publisher's note: Copernicus Publications remains neutral with regard to jurisdictional claims made in the text, published maps, institutional affiliations, or any other geographical representation in this paper. While Copernicus Publications makes every effort to include appropriate place names, the final responsibility lies with the authors.
We acknowledge DESY (Hamburg, Germany), a member of the Helmholtz Association HGF, for the provision of experimental facilities. Parts of this research were carried out at PETRA III, and we would like to thank Moritz Hoesch and his team for assistance in using beamline P04. Beamtime was allocated for proposal I-20220937 EC. Harmanjot Kaur and Bernd Winter acknowledge the European Research Council (ERC) under the European Union's Horizon 2020 research and innovation program (grant agreement no. 883759, AQUACHIRAL). Stephan Thürmer acknowledges support from JSPS KAKENHI (grant no. JP20K15229) and ISHIZUE 2024 of Kyoto University. Florian Trinter acknowledges funding by the Deutsche Forschungsgemeinschaft (DFG, German Research Foundation) – project 509471550, Emmy Noether Programme. Florian Trinter and Bernd Winter acknowledge support by the MaxWater initiative of the Max-Planck-Gesellschaft. Olle Björneholm acknowledges support from the Swedish Research Council (VR) through project 2023-04346 and the Swedish Foundation for International Cooperation in Research and Higher Education (STINT) through project 202100-2932. Ricardo Marinho, Joel Pinheiro, and Arnaldo Naves de Brito acknowledge support from the Swedish–Brazilian collaboration STINT-CAPES (process no. 88881.465527/2019-01). Arnaldo Naves de Brito acknowledges support from FAPESP (the São Paulo Research Foundation, process no. 2017/11986-5), Shell and ANP (Brazil's National Oil, Natural Gas and Biofuels Agency), and CNPq-Brazil (process no. 401581/2016-0). Harmanjot Kaur and Shirin Gholami acknowledge support by the IMPRS for Elementary Processes in Physical Chemistry.
This research has been supported by the European Research Council, Horizon Europe (grant no. 883759); the Japan Society for the Promotion of Science (grant no. JP20K15229); the Deutsche Forschungsgemeinschaft (grant no. 509471550); the Vetenskapsrådet (grant no. 2023-04346), the Swedish Foundation for International Cooperation in Research and Higher Education (grant no. 202100-2932); the Fundação de Amparo à Pesquisa do Estado de São Paulo (grant no. 2017/11986-5); and the Conselho Nacional de Desenvolvimento Científico e Tecnológico (grant no. 401581/2016-0).
The publication of this article was funded by the Swedish Research Council, Forte, Formas, and Vinnova.
This paper was edited by Zhibin Wang and reviewed by two anonymous referees.
Bagschik, K., Wagner, J., Buß, R., Riepp, M., Philippi-Kobs, A., Müller, L., Buck, J., Trinter, F., Scholz, F., Seltmann, J., Hoesch, M., Viefhaus, J., Grübel, G., Oepen, H. P., and Frömter, R.: Direct 2D spatial-coherence determination using the Fourier-analysis method: multi-parameter characterization of the P04 beamline at PETRA III, Opt. Express, 28, 7282–7300, https://doi.org/10.1364/oe.382608, 2020.
Björneholm, O., Öhrwall, G., de Brito, A. N., Ågren, H., and Carravetta, V.: Superficial Tale of Two Functional Groups: On the Surface Propensity of Aqueous Carboxylic Acids, Alkyl Amines, and Amino Acids, Acc. Chem. Res., 55, 3285–3293, https://doi.org/10.1021/acs.accounts.2c00494, 2022.
Chen, S., Artiglia, L., Orlando, F., Edebeli, J., Kong, X., Yang, H., Boucly, A., Corral Arroyo, P., Prisle, N., and Ammann, M.: Impact of Tetrabutylammonium on the Oxidation of Bromide by Ozone, ACS Earth Space Chem., 5, 3008–3021, https://doi.org/10.1021/acsearthspacechem.1c00233, 2021.
Davies, J. F., Miles, R. E. H., Haddrell, A. E., and Reid, J. P.: Influence of organic films on the evaporation and condensation of water in aerosol, P. Natl. Acad. Sci., 110, 8807–8812, https://doi.org/10.1073/pnas.1305277110, 2013.
Dupuy, R., Filser, J., Richter, C., Buttersack, T., Trinter, F., Gholami, S., Seidel, R., Nicolas, C., Bozek, J., Egger, D., Oberhofer, H., Thürmer, S., Hergenhahn, U., Reuter, K., Winter, B., and Bluhm, H.: Ångstrom-Depth Resolution with Chemical Specificity at the Liquid-Vapor Interface, Phys. Rev. Lett., 130, 156901, https://doi.org/10.1103/PhysRevLett.130.156901, 2023.
Ekholm, V.: Ion pairing and Langmuir-like adsorption at aqueous surfaces studied by core-level spectroscopy, Doctoral thesis, comprehensive summary, Digital Comprehensive Summaries of Uppsala Dissertations from the Faculty of Science and Technology, Acta Universitatis Upsaliensis, Uppsala, 62 pp., 2018.
Ekholm, V., Caleman, C., Bjärnhall Prytz, N., Walz, M.-M., Werner, J., Öhrwall, G., Rubensson, J.-E., and Björneholm, O.: Strong enrichment of atmospherically relevant organic ions at the aqueous interface: the role of ion pairing and cooperative effects, Phys. Chem. Chem. Phys., 20, 27185–27191, https://doi.org/10.1039/c8cp04525a, 2018.
Ergin, G. and Takahama, S.: Carbon Density Is an Indicator of Mass Accommodation Coefficient of Water on Organic-Coated Water Surface, J. Phys. Chem. A, 120, 2885–2893, https://doi.org/10.1021/acs.jpca.6b01748, 2016.
George, I. J. and Abbatt, J. P. D.: Heterogeneous oxidation of atmospheric aerosol particles by gas-phase radicals, Nat. Chem., 2, 713–722, https://doi.org/10.1038/nchem.806, 2010.
Goldstein, A. H. and Galbally, I. E.: Known and Unexplored Organic Constituents in the Earth's Atmosphere, Environ. Sci. Technol., 41, 1514–1521, https://doi.org/10.1021/es072476p, 2007.
Gopakumar, G., Unger, I., Saak, C.-M., Öhrwall, G., Naves de Brito, A., Rizuti da Rocha, T. C., Nicolas, C., Caleman, C., and Björneholm, O.: The surface composition of amino acid – halide salt solutions is pH-dependent, Environ. Sci.: Atmospheres, 2, 441–448, https://doi.org/10.1039/d1ea00104c, 2022.
Grushka, E.: Characterization of exponentially modified Gaussian peaks in chromatography, Anal. Chem., 44, 1733–1738, https://doi.org/10.1021/ac60319a011, 1972.
Hüfner, S., Schmidt, S., and Reinert, F.: Photoelectron spectroscopy – An overview, Nuclear Instruments and Methods in Physics Research Section A: Accelerators, Spectrometers, Detectors and Associated Equipment, 547, 8–23, https://doi.org/10.1016/j.nima.2005.05.008, 2005.
IPCC: Climate Change 2022: Impacts, Adaptation, and Vulnerability. Contribution of Working Group II to the Sixth Assessment Report of the Intergovernmental Panel on Climate Change, edited by: Pörtner, H.-O., Roberts, D. C., Tignor, M., Poloczanska, E. S., Mintenbeck, K., Alegría, A., Craig, M., Langsdorf, S., Löschke, S., Möller, V., Okem, A., and Rama, B., Cambridge University Press. Cambridge University Press, Cambridge, UK and New York, NY, USA, 3056 pp., https://doi.org/10.1017/9781009325844, 2022.
Jimenez, J. L., Canagaratna, M. R., Donahue, N. M., Prevot, A. S. H., Zhang, Q., Kroll, J. H., DeCarlo, P. F., Allan, J. D., Coe, H., Ng, N. L., Aiken, A. C., Docherty, K. S., Ulbrich, I. M., Grieshop, A. P., Robinson, A. L., Duplissy, J., Smith, J. D., Wilson, K. R., Lanz, V. A., Hueglin, C., Sun, Y. L., Tian, J., Laaksonen, A., Raatikainen, T., Rautiainen, J., Vaattovaara, P., Ehn, M., Kulmala, M., Tomlinson, J. M., Collins, D. R., Cubison, M. J., Dunlea, J., Huffman, J. A., Onasch, T. B., Alfarra, M. R., Williams, P. I., Bower, K., Kondo, Y., Schneider, J., Drewnick, F., Borrmann, S., Weimer, S., Demerjian, K., Salcedo, D., Cottrell, L., Griffin, R., Takami, A., Miyoshi, T., Hatakeyama, S., Shimono, A., Sun, J. Y., Zhang, Y. M., Dzepina, K., Kimmel, J. R., Sueper, D., Jayne, J. T., Herndon, S. C., Trimborn, A. M., Williams, L. R., Wood, E. C., Middlebrook, A. M., Kolb, C. E., Baltensperger, U., and Worsnop, D. R.: Evolution of Organic Aerosols in the Atmosphere, Science, 326, 1525–1529, https://doi.org/10.1126/science.1180353, 2009.
Kanakidou, M., Seinfeld, J. H., Pandis, S. N., Barnes, I., Dentener, F. J., Facchini, M. C., Van Dingenen, R., Ervens, B., Nenes, A., Nielsen, C. J., Swietlicki, E., Putaud, J. P., Balkanski, Y., Fuzzi, S., Horth, J., Moortgat, G. K., Winterhalter, R., Myhre, C. E. L., Tsigaridis, K., Vignati, E., Stephanou, E. G., and Wilson, J.: Organic aerosol and global climate modelling: a review, Atmos. Chem. Phys., 5, 1053–1123, https://doi.org/10.5194/acp-5-1053-2005, 2005.
Kaur, H., Thürmer, S., Gholami, S., Credidio, B., Trinter, F., Vasconcelos, D., Marinho, R., Pinheiro, J., Bluhm, H., Naves de Brito, A., Öhrwall, G., Winter, B., and Björneholm, O.: Strongly Enhanced Cooperative Surface Propensity of Atmospherically Relevant Organic Molecular Ions in Aqueous Solution – data (Version 1), Zenodo [data set], https://doi.org/10.5281/zenodo.12644492, 2024.
Köhler, H.: The nucleus in and the growth of hygroscopic droplets, Trans. Faraday Soc., 32, 1152–1161, https://doi.org/10.1039/tf9363201152, 1936.
Laskin, A., Wang, H., Robertson, W. H., Cowin, J. P., Ezell, M. J., and Finlayson-Pitts, B. J.: A New Approach to Determining Gas-Particle Reaction Probabilities and Application to the Heterogeneous Reaction of Deliquesced Sodium Chloride Particles with Gas-Phase Hydroxyl Radicals, J. Phys. Chem. A, 110, 10619–10627, https://doi.org/10.1021/jp063263+, 2006.
Lee, M.-T., Orlando, F., Artiglia, L., Chen, S., and Ammann, M.: Chemical Composition and Properties of the Liquid–Vapor Interface of Aqueous C1 to C4 Monofunctional Acid and Alcohol Solutions, J. Phys. Chem. A, 120, 9749–9758, https://doi.org/10.1021/acs.jpca.6b09261, 2016.
Lowe, S. J., Partridge, D. G., Davies, J. F., Wilson, K. R., Topping, D., and Riipinen, I.: Key drivers of cloud response to surface-active organics, Nat. Commun., 10, 5214, https://doi.org/10.1038/s41467-019-12982-0, 2019.
Malerz, S., Trinter, F., Hergenhahn, U., Ghrist, A., Ali, H., Nicolas, C., Saak, C.-M., Richter, C., Hartweg, S., Nahon, L., Lee, C., Goy, C., Neumark, D. M., Meijer, G., Wilkinson, I., Winter, B., and Thürmer, S.: Low-energy constraints on photoelectron spectra measured from liquid water and aqueous solutions, Phys. Chem. Chem. Phys., 23, 8246–8260, https://doi.org/10.1039/d1cp00430a, 2021.
Malerz, S., Haak, H., Trinter, F., Stephansen, A. B., Kolbeck, C., Pohl, M., Hergenhahn, U., Meijer, G., and Winter, B.: A setup for studies of photoelectron circular dichroism from chiral molecules in aqueous solution, Rev. Sci. Instrum., 93, 015101, https://doi.org/10.1063/5.0072346, 2022.
McCormick, R. A. and Ludwig, J. H.: Climate Modification by Atmospheric Aerosols, Science, 156, 1358–1359, https://doi.org/10.1126/science.156.3780.1358, 1967.
McFiggans, G., Artaxo, P., Baltensperger, U., Coe, H., Facchini, M. C., Feingold, G., Fuzzi, S., Gysel, M., Laaksonen, A., Lohmann, U., Mentel, T. F., Murphy, D. M., O'Dowd, C. D., Snider, J. R., and Weingartner, E.: The effect of physical and chemical aerosol properties on warm cloud droplet activation, Atmos. Chem. Phys., 6, 2593–2649, https://doi.org/10.5194/acp-6-2593-2006, 2006.
Miles, R. E. H., Davies, J. F., and Reid, J. P.: The influence of the surface composition of mixed monolayer films on the evaporation coefficient of water, Phys. Chem. Chem. Phys., 18, 19847–19858, https://doi.org/10.1039/c6cp03826c, 2016.
Minofar, B., Jungwirth, P., Das, M. R., Kunz, W., and Mahiuddin, S.: Propensity of Formate, Acetate, Benzoate, and Phenolate for the Aqueous Solution/Vapor Interface: Surface Tension Measurements and Molecular Dynamics Simulations, J. Phys. Chem. C, 111, 8242–8247, https://doi.org/10.1021/jp068804+, 2007.
Mocellin, A., Gomes, A. H. d. A., Araújo, O. C., de Brito, A. N., and Björneholm, O.: Surface Propensity of Atmospherically Relevant Amino Acids Studied by XPS, J. Phys. Chem. B, 121, 4220–4225, https://doi.org/10.1021/acs.jpcb.7b02174, 2017.
Moreno, C. G., Gálvez, O., López-Arza Moreno, V., Espildora-García, E. M., and Baeza-Romero, M. T.: A revisit of the interaction of gaseous ozone with aqueous iodide. Estimating the contributions of the surface and bulk reactions, Phys. Chem. Chem. Phys., 20, 27571–27584, https://doi.org/10.1039/c8cp04394a, 2018.
Noziere, B.: Don't forget the surface, Science, 351, 1396–1397, https://doi.org/10.1126/science.aaf3253, 2016.
Öhrwall, G., Prisle, N. L., Ottosson, N., Werner, J., Ekholm, V., Walz, M.-M., and Björneholm, O.: Acid–Base Speciation of Carboxylate Ions in the Surface Region of Aqueous Solutions in the Presence of Ammonium and Aminium Ions, J. Phys. Chem. B, 119, 4033–4040, https://doi.org/10.1021/jp509945g, 2015.
Ottosson, N., Wernersson, E., Söderstrom, J., Pokapanich, W., Kaufmann, S., Svensson, S., Persson, I., Öhrwall, G., and Björneholm, O.: The Protonation State of Small Carboxylic Acids at the Water Surface from Photoelectron Spectroscopy, Phys. Chem. Chem. Phys., 13, 12261–12267, https://doi.org/10.1039/c1cp20245f, 2011.
Ovadnevaite, J., Zuend, A., Laaksonen, A., Sanchez, K. J., Roberts, G., Ceburnis, D., Decesari, S., Rinaldi, M., Hodas, N., Facchini, M. C., Seinfeld, J. H., and O' Dowd, C.: Surface tension prevails over solute effect in organic-influenced cloud droplet activation, Nature, 546, 637–641, https://doi.org/10.1038/nature22806, 2017.
Powis, I., Holland, D. M. P., Antonsson, E., Patanen, M., Nicolas, C., Miron, C., Schneider, M., Soshnikov, D. Y., Dreuw, A., and Trofimov, A. B.: The influence of the bromine atom Cooper minimum on the photoelectron angular distributions and branching ratios of the four outermost bands of bromobenzene, J. Chem. Phys., 143, 144304, https://doi.org/10.1063/1.4931642, 2015.
Ruehl, C. R., Davies, J. F., and Wilson, K. R.: An interfacial mechanism for cloud droplet formation on organic aerosols, Science, 351, 1447–1450, https://doi.org/10.1126/science.aad4889, 2016.
Sareen, N., Schwier, A. N., Lathem, T. L., Nenes, A., and McNeill, V. F.: Surfactants from the gas phase may promote cloud droplet formation, P. Natl. Acad. Sci., 110, 2723–2728, https://doi.org/10.1073/pnas.1204838110, 2013.
Sasaki, S.: Analyses for a planar variably-polarizing undulator, Nuclear Instruments and Methods in Physics Research Section A: Accelerators, Spectrometers, Detectors and Associated Equipment, 347, 83–86, https://doi.org/10.1016/0168-9002(94)91859-7, 1994.
Shiraiwa, M., Ammann, M., Koop, T., and Pöschl, U.: Gas uptake and chemical aging of semisolid organic aerosol particles, P. Natl. Acad. Sci., 108, 11003–11008, https://doi.org/10.1073/pnas.1103045108, 2011.
Sobyra, T. B., Pliszka, H., Bertram, T. H., and Nathanson, G. M.: Production of Br2 from N2O5 and Br− in Salty and Surfactant-Coated Water Microjets, J. Phys. Chem. A, 123, 8942–8953, https://doi.org/10.1021/acs.jpca.9b04225, 2019.
Thürmer, S., Seidel, R., Faubel, M., Eberhardt, W., Hemminger, J. C., Bradforth, S. E., and Winter, B.: Photoelectron Angular Distributions from Liquid Water: Effects of Electron Scattering, Phys. Rev. Lett., 111, 173005, https://doi.org/10.1103/PhysRevLett.111.173005, 2013.
Thürmer, S., Malerz, S., Trinter, F., Hergenhahn, U., Lee, C., Neumark, D. M., Meijer, G., Winter, B., and Wilkinson, I.: Accurate Vertical Ionization Energy and Work Function Determinations of Liquid Water and Aqueous Solutions, Chem. Sci., 12, 10558–10582, https://doi.org/10.1039/d1sc01908b, 2021.
Tsigaridis, K., Daskalakis, N., Kanakidou, M., Adams, P. J., Artaxo, P., Bahadur, R., Balkanski, Y., Bauer, S. E., Bellouin, N., Benedetti, A., Bergman, T., Berntsen, T. K., Beukes, J. P., Bian, H., Carslaw, K. S., Chin, M., Curci, G., Diehl, T., Easter, R. C., Ghan, S. J., Gong, S. L., Hodzic, A., Hoyle, C. R., Iversen, T., Jathar, S., Jimenez, J. L., Kaiser, J. W., Kirkevåg, A., Koch, D., Kokkola, H., Lee, Y. H., Lin, G., Liu, X., Luo, G., Ma, X., Mann, G. W., Mihalopoulos, N., Morcrette, J.-J., Müller, J.-F., Myhre, G., Myriokefalitakis, S., Ng, N. L., O'Donnell, D., Penner, J. E., Pozzoli, L., Pringle, K. J., Russell, L. M., Schulz, M., Sciare, J., Seland, Ø., Shindell, D. T., Sillman, S., Skeie, R. B., Spracklen, D., Stavrakou, T., Steenrod, S. D., Takemura, T., Tiitta, P., Tilmes, S., Tost, H., van Noije, T., van Zyl, P. G., von Salzen, K., Yu, F., Wang, Z., Wang, Z., Zaveri, R. A., Zhang, H., Zhang, K., Zhang, Q., and Zhang, X.: The AeroCom evaluation and intercomparison of organic aerosol in global models, Atmos. Chem. Phys., 14, 10845–10895, https://doi.org/10.5194/acp-14-10845-2014, 2014.
Twomey, S.: Pollution and the planetary albedo, Atmos. Environ., 8, 1251—1256, https://doi.org/10.1016/0004-6981(74)90004-3, 1974.
Viefhaus, J., Scholz, F., Deinert, S., Glaser, L., Ilchen, M., Seltmann, J., Walter, P., and Siewert, F.: The Variable Polarization XUV Beamline P04 at PETRA III: Optics, mechanics and their performance, Nucl. Instrum. Meth. A, 710, 151–154, https://doi.org/10.1016/j.nima.2012.10.110, 2013.
Walz, M. M., Caleman, C., Werner, J., Ekholm, V., Lundberg, D., Prisle, N. L., Öhrwall, G., and Björneholm, O.: Surface behavior of amphiphiles in aqueous solution: a comparison between different pentanol isomers, Phys. Chem. Chem. Phys., 17, 14036–14044, https://doi.org/10.1039/c5cp01870f, 2015.
Walz, M. M., Werner, J., Ekholm, V., Prisle, N. L., Öhrwall, G., and Björneholm, O.: Alcohols at the aqueous surface: chain length and isomer effects, Phys. Chem. Chem. Phys., 18, 6648–6656, https://doi.org/10.1039/c5cp06463e, 2016.
Werner, J., Persson, I., Björneholm, O., Kawecki, D., Saak, C.-M., Walz, M.-M., Ekholm, V., Unger, I., Valtl, C., Caleman, C., Öhrwall, G., and Prisle, N. L.: Shifted equilibria of organic acids and bases in the aqueous surface region, Phys. Chem. Chem. Phys., 20, 23281–23293, https://doi.org/10.1039/c8cp01898g, 2018.
Winter, B. and Faubel, M.: Photoemission from Liquid Aqueous Solutions, Chem. Rev., 106, 1176–1211, https://doi.org/10.1021/Cr040381p, 2006.