the Creative Commons Attribution 4.0 License.
the Creative Commons Attribution 4.0 License.
 | 14 Mar 2025
Characterization of aerosol over the eastern Mediterranean by polarization-sensitive Raman lidar measurements during A-LIFE – aerosol type classification and type separation
Volker Freudenthaler
Moritz Haarig
Albert Ansmann
Carlos Toledano
David Mateos
Petra Seibert
Rodanthi-Elisavet Mamouri
Argyro Nisantzi
Josef Gasteiger
Maximilian Dollner
Anne Tipka
Manuel Schöberl
Marilena Teri
Bernadett Weinzierl
Aerosols are key players in Earth's climate system, with mineral dust being a major component of the atmospheric aerosol load. While former campaigns focused on investigating the properties and effects of layers of rather pure mineral dust, the A-LIFE (Absorbing aerosol layers in a changing climate: aging, lifetime and dynamics) campaign in April 2017 aimed to characterize dust in complex aerosol mixtures. In this study we present ground-based lidar measurements that were performed at Limassol, Cyprus, in April 2017. During our measurement period, the measurement site was affected by complex mixtures of dust from different sources and pollution aerosols from local as well as long-range transported sources. Considering the lidar measurements from two ground-based systems, POLIS (portable lidar system) and PollyXT (portable lidar system with extended capabilities). We found mean values and mean systematic errors (standard deviation, SD, given in brackets) of the particle linear depolarization ratio and extinction-to-backscatter ratio (lidar ratio) of 0.26 ± 0.03 (SD of 0.02) and 41 ± 5 sr (SD of 3 sr) at 355 nm and of 0.29 ± 0.02 (SD of 0.02) and 38 ± 5 sr (SD of 6 sr) at 532 nm for Arabian dust and of 0.26 ± 0.03 (SD of 0.03) and 55 ± 8 sr (SD of 6 sr) at 355 nm and of 0.28 ± 0.02 (SD of 0.01) and 54 ± 8 sr (SD of 8 sr) at 532 nm for Saharan dust. The values found for pollution aerosols of the particle linear depolarization ratio and the lidar ratio are 0.06 ± 0.02 (SD of 0.04) and 64 ± 13 sr (SD of 5 sr) at 355 nm and of 0.04 ± 0.02 (SD of 0.01) and 64 ± 12 sr (SD of 4 sr) at 532 nm, respectively. We use our measurements for aerosol typing and compare them to aerosol typing from sun photometer data, in situ measurements, and trajectory analysis. The different methods agree well for the derived aerosol type, but looking at the derived dust mass concentration from different methods, the trajectory analysis frequently underestimates high dust concentrations that were found in major mineral dust events.
- Article
(5707 KB) - Full-text XML
-
Supplement
(370 KB) - BibTeX
- EndNote


Aerosol particles are omnipresent and can affect Earth's atmosphere in different ways: they directly interact with incoming solar or outgoing terrestrial radiation by scattering and absorption, and they indirectly affect the formation and properties of clouds by acting as cloud condensation nuclei or ice nuclei. Additionally, they can also change the atmosphere's temperature and stability profile. Up to now, aerosols have contributed to the largest uncertainties in estimating changes in Earth's climate system (Forster et al., 2007; Boucher et al., 2013; Bender, 2020). One reason is the aerosol's strong temporal and spatial variability. Furthermore, the sign and the magnitude of their radiative impact strongly depends on the microphysical and chemical properties of the aerosol particles as well as on their vertical distribution. During their lifetime and transport the aerosol particles are exposed to transformation processes such as particle ageing or mixing process. These can change the optical and microphysical properties and the ability of the aerosol to act as cloud condensation nuclei. In addition, the aerosol properties can change due to mixing of different types.
In situ measurements directly measure the microphysical (e.g. Kaaden et al., 2009; Weinzierl et al., 2011) and chemical particle properties (Kandler et al., 2009) and can be used to derive the aerosol particle's ability to act as cloud condensation nuclei (e.g. Kumar et al., 2011; Haarig et al., 2019). These in situ measurements are strongly limited in space and time. Remote sensing data from airborne or spaceborne measurements provide information on a continental and global scale. But they cannot directly derive the particles' microphysical properties or chemical composition and thus their radiative effect and capability to act as cloud or ice nuclei. However, those properties strongly depend on the type of particle (e.g. Groß et al., 2013b; Wandinger et al., 2023). Thus, to estimate the radiative and cloud-influencing properties of aerosol layers from remote sensing measurements, further information and/or aerosol classification schemes are crucial, as different particle types interact differently with incoming and outgoing radiation and have a different impact on cloud formation and properties. Passive remote sensing measurements with sun photometers provide column-integrated values of aerosol properties and thus can only give a column-integrated typing (Toledano et al., 2011). Lidar measurements provide profile information of the aerosol and cloud structure. Polarization-sensitive Raman or high-spectral-resolution lidar (HSRL) systems provide height-resolved information about intensive optical properties (i.e. lidar ratio and particle linear depolarization ratio) that can be used for aerosol typing (Burton et al., 2012; Groß et al., 2011b, 2015b; Nicolae et al., 2018). In a next step, the aerosol layers can be linked to typical microphysical properties for the derived aerosol type (Groß et al., 2013b; Wandinger et al., 2023; Floutsi et al., 2023) to calculate the radiative effect of the aerosol layer (Gutleben et al., 2019, 2020) or their ability to act as cloud condensation nuclei (Ansmann et al., 2019) or ice nuclei (Mamouri and Ansmann, 2016; Marinou et al., 2019). However, aerosol classification schemes are limited by the considered aerosol types. Additionally, different classification schemes rely on different measurement properties and thus might differ in the derived results e.g. for aerosol mixtures. It is thus necessary to constantly further develop aerosol typing schemes and to re-evaluate them by comparison of classification schemes based on different measurement methods.
Mineral dust is a main contributor to the atmospheric aerosol load (Haywood and Boucher, 2000). Mineral dust scatters and absorbs the incoming and outgoing radiation, but the magnitude and sign of the dust radiative forcing are still not fully clear (e.g. Kok et al., 2018; Adebiyi et al., 2023). It strongly depends on the microphysical properties and chemical composition of the dust particles, which differ for dust particles from different sources (Kandler et al., 2009; Lieke et al., 2011). Dust microphysics and chemical composition have an impact on their optical properties (e.g. Groß et al., 2011b; Schuster et al., 2012; Nisantzi et al., 2015). In addition, the irregular shape of the dust particles causes difficulties in the modelling of the dust radiative effects (Gasteiger et al., 2011; Saito et al., 2021). To expand our knowledge, a large number of studies were performed. For example, lidar measurements in the framework of the European Aerosol Research Lidar Network (EARLINET; Pappalardo et al., 2014) at different measurement sites in Europe were analysed to study mineral dust transport towards southern Europe (e.g. Cachorro et al., 2008; Bravo-Aranda et al., 2015; Mona et al., 2014; Navas-Guzman et al., 2013), central Europe (e.g. Ansmann et al., 2003; Wiegner et al., 2011; Haarig et al., 2022), eastern Europe (Binietoglou et al., 2015; Talianu et al., 2007), and the Mediterranean (Amiridis et al., 2009; Papayannis et al., 2009; Mamouri et al., 2013; Soupiona et al., 2020). In addition, several field experiments have taken place to study mineral dust at different locations and lifetime stages (e.g. SHADE, Tanré et al., 2003; PRIDE, Reid et al., 2003; Fennec, Ryder et al., 2013). The most comprehensive field experiment to study mineral dust was the Saharan Mineral Dust Experiment (SAMUM; Ansmann et al., 2011), which was followed by the Saharan Aerosol Long-range Transport and Aerosol-Cloud-Interaction Experiment (SALTRACE; Weinzierl et al., 2017). SAMUM and SALTRACE were designed as closure studies, combining airborne and ground-based in situ, lidar, and radiation measurements together with modelling efforts. In these campaigns, the optical, microphysical, chemical, and radiative properties of Saharan mineral dust were studied close to the source region, at the beginning and after long-range transport towards the Caribbean.
With a similar concept, the A-LIFE (Absorbing aerosol layers in a changing climate: aging, lifetime and dynamics) field experiment was performed in Cyprus in April 2017 (https://a-life.at, last access: 4 December 2024). The eastern Mediterranean is a hotspot for different types of aerosols. Mineral dust from Africa, Asia, and the Arabian Peninsula are frequently transported towards Cyprus. In addition, the region is affected by biomass burning aerosol from forest fires and by local and transported pollution. This makes this region an ideal location to study mineral dust from different source regions and to investigate the impact of ageing and mixing. In this study, we aim to investigate the optical properties of mineral dust from source regions in the Sahara and from the Arabian Peninsula, to study differences of the different dust types and other absorbing aerosol, and to determine how these results impact aerosol classification schemes. For this it is important to compare the different methods for aerosol type classification and their ability to retrieve dust mass concentration. In Sect. 2, we present the used measurements and methods. Section 3 gives the results of this study, focusing on the characterization of the general measurement situation, the optical properties of the observed aerosol types, and an aerosol typing from different methods. In Sect. 4, we discuss the agreement of the different typing methods as well as the derived dust contribution. Section 5 concludes this work.
2.1 A-LIFE field experiment
For the analysis presented in this study we use ground-based lidar measurements that were performed during the A-LIFE field experiment as part of the ERC-funded (European Research Council-funded) project A-LIFE (https://a-life.at, last access: 4 December 2024; Weinzierl et al., 2025b). The experiment was designed as a closure experiment, combining airborne remote sensing and in situ measurements on board the Deutsches Zentrum für Luft- und Raumfahrt (DLR) Falcon together with ground-based observations, long-term observations, and modelling efforts. Measurements were performed in Cyprus in April 2017. The DLR Falcon was based at the airport at Paphos, where also ground-based in situ measurements were performed. The lidar measurements with POLIS (portable lidar system) and PollyXT (portable lidar system with extended capabilities) together with sun photometer measurements were performed at Limassol. A detailed description of the experiment is given in Weinzierl et al. (2025b).
2.2 POLIS lidar system
POLIS (portable lidar system) is a small, six-channel, dual-wavelength polarization-sensitive Raman lidar system which was developed and built at Ludwig-Maximilians-Universität München (LMU; Groß et al., 2015a). POLIS simultaneously measures the co- and cross-polarized light at 355 and 532 nm. During nighttime additional measurements of the N2 Raman-shifted wavelengths at 387 and 607 nm are performed. The distance of full overlap of the small lidar system is adjustable from about 70 m and was about 200 m during the campaign, allowing for highly accurate measurements within the boundary layer. The measured raw data have a resolution of 3.75 m in range and typically 10 s in time. Additionally, a 25-bin sliding average, i.e. ∼ 94 m, is used to reduce signal noise. For the nighttime Raman measurements, the data are typically averaged over 1.5–2 h in time, with a 151-bin sliding average, i.e. ∼ 566 m. The Raman approach described by Ansmann et al. (1990, 1992) is used to directly retrieve the extinction coefficient and backscatter coefficient and thus the extinction-to-backscatter ratio (lidar ratio). The lidar ratio is then used in the Fernald–Klett algorithm (Fernald, 1984; Klett, 1985) to retrieve the particle linear depolarization ratio (PLDR) with higher spatial resolution (sliding average of 25 or 51 bins) and for the daytime measurements. To verify that the lidar ratio from nighttime measurements is valid for the daytime analysis, we analyse the next Raman measurements at nighttime together with an evaluation of the stability of the aerosol situation. This allows for using the classification at nighttime as a first proxy for the daytime measurements. This first guess is then confirmed by the temporal continuity of the PLDR and verified by the evaluation of air mass source regions. For the daytime analysis, the measurements are averaged over 1 h around coordinated in situ measurements on board the DLR Falcon aircraft. For the analysis of the PLDR the highly accurate Δ90 calibration method (Freudenthaler, 2016; Freudenthaler et al., 2009, 2016) was used. The uncertainties in retrieved properties were calculated following the procedure described by Freudenthaler et al. (2009) and Groß et al. (2011c). The systematic error in the particle depolarization ratio includes uncertainties in the backscatter ratio and the volume depolarization ratio. The systematic error in the extinction coefficient from Raman measurements include uncertainties in the molecular extinction coefficient and the Ångström exponent. Together with the systematic errors in the backscatter coefficient, including uncertainties in the scattering ratio and the molecular backscatter coefficient, the errors are combined to determine the uncertainties in the lidar ratio.
POLIS measurements were analysed by the lidar experts from DLR and LMU.
2.3 PollyXT
The TROPOS (Leibniz-Institut für Troposphärenforschung) portable lidar system with extended capabilities (PollyXT) is described in Engelmann et al. (2016). The latest status of data analysis can be found in Baars et al. (2016), Hofer et al. (2017), and Ohneiser et al. (2020). The capabilities of the multiwavelength polarization-sensitive Raman lidar are similar to those of POLIS described above. The PollyXT instrument was continuously operated over the 1-month A-LIFE campaign. The same quality standards regarding data and uncertainty analysis as in the case of the POLIS data analysis are applied.
While POLIS measures the co- and cross-polarized backscatter signal component, PollyXT measures the total and cross-polarized backscatter signal component. While it is not in the focus of this paper to discuss minor differences resulting from the differences in the system setup, it is still worthwhile to intercompare the measurements and the resulting classification.
PollyXT measurements were analysed by the lidar group of TROPOS.
2.4 Aerosol typing and aerosol type separation based on lidar measurements
To determine the aerosol type in the case of rather pure aerosol situations, i.e. no mixture of different aerosol types, we used the retrieved the PLDR and lidar ratio based on the classification schemes described by Groß et al. (2013b, 2015b). To describe the contribution of different aerosol types in an aerosol mixture, we use the PLDR and the backscatter coefficient measured at 532 nm following the procedure described by Tesche et al. (2009a) and Groß et al. (2011a, 2016). Based on findings from former studies on Saharan dust (e.g. Petzold et al., 2011), we assume a two-type external mixture of mineral dust and pollution. This assumption is in good agreement with the coordinated in situ measurements (see Sect. 4). We follow the procedure described by Tesche et al. (2009a) and Groß et al. (2011a, 2016) to derive the dust and non-dust backscatter coefficient and extinction coefficient. As input for the type separation at 532 nm we use PLDR=0.3 for dust aerosols and PLDR=0.03 for non-dust aerosols according to findings of pure mineral dust (e.g. Freudenthaler et al., 2009; Tesche et al., 2009b; Groß et al., 2011b, 2015a, and findings of this study) and for anthropogenic pollution/smoke (e.g. Groß et al., 2013a; Hofer et al., 2017). It has to be considered that a deviation of the actual measured PLDR and the one used for the type separation can lead to an over- or underestimation of the contribution of the two contribution aerosol types. And thus, it is important to investigate the uncertainties in the type separation, also including the input values. The other inputs for the type separation at 532 nm are a lidar ratio of 55 sr for Saharan mineral dust (e.g. Tesche et al., 2009b; Groß et al., 2013b), of 45 sr for Arabian dust (Mamouri et al., 2013; Nisantzi et al., 2015; this study), and of 70 sr for anthropogenic pollution (Groß et al., 2013a; this study).
2.5 Conversion to volume and mass concentration
The extinction-to-volume conversion factor of mineral dust from different source regions (e.g. North Africa and the Middle East) was intensively studied by Mamouri and Ansmann (2017) and Ansmann et al. (2019) using AERONET (Aerosol Robotic Network; Holben et al., 1998) measurements and inversion products. They found a mean extinction-to-volume conversion factor for dust of m. The dust mass concentration is then calculated using the dust volume concentration and multiplying it with the particle density, which we assume to be 2.5 g cm−3 according to previous studies (e.g. Wagner et al., 2009; Groß et al., 2016). For the conversion from extinction to volume of pollution aerosols we use a conversion factor of m and a particle density of 1.5 g cm−3 as proposed by Mamouri and Ansmann (2017) from Limassol AERONET data. Considering the overall assumptions, the relative uncertainty in the estimated dust fraction is 10 %–20 %, while that in the calculated dust volume and mass concentration is about 10 %–15 %.
2.6 AERONET sun photometer
AERONET measurements were performed on the rooftop of the Cyprus University of Technology in Limassol about 200 m from the lidar site (site name: CUT-TEPAK). Direct sun observations provide the aerosol optical depth (AOD) at eight spectral channels at wavelengths between 340 and 1640 nm. Additionally, optical and microphysical aerosol properties are derived from the multi-angle and multi-spectral measurements of sky radiance (almucantar and hybrid scan geometries every hour). For details on the instrument calibration and data products see Holben et al. (1998), Dubovik and King (2000), and Dubovik et al. (2006). For this study we use the AOD measurements at 340, 500, and 1020 nm as well as the retrieved coarse- and fine-mode AOD at 500 nm and the Ångström exponent (440–870 and 380–500 nm) from the AERONET version 3 database (Giles et al., 2019). Further information on the sun photometer measurements during A-LIFE is provided by Mateos et al. (2025).
2.7 Aerosol typing based on AERONET measurements
For the AERONET-based aerosol typing we use the scatterplot of the Ångström exponent (440–870 nm) vs. AOD at 500 nm as proposed by Toledano et al. (2009, 2011). Values of the Ångström exponent (AE) > 1.2 serve as an indication of smoke/pollution, independent of the AOD. Ångström exponents of < 0.5 serve as an indication of dust (Toledano et al., 2009, 2011, 2019) or marine aerosols. Following Toledano et al. (2011), a threshold of AOD = 0.15 is used to separate dust and marine aerosols. Measurement points with AOD < 0.15 and AE < 0.5 are classified as marine, while measurement points with AOD > 0.15 and AE < 0.5 are classified as dust. Ångström exponents between 0.5 and 1.2 serve as an indication of mixtures. We further subdivide this value range in dust mixtures for AE > 0.5 and a value of the AERONET-derived fine-mode fraction larger than 0.5 (AE values of ∼ 0.8). A fine-mode fraction of < 0.5 (AE values of ≳ 0.8) and AE of < 1.2 are classified as a polluted mixture.
2.8 Aerosol in situ measurements and the A-LIFE in situ aerosol classification scheme
For A-LIFE, the DLR Falcon research aircraft was equipped with comprehensive aerosol in situ instrumentation, a wind lidar, and sensors for measuring meteorological parameters. The particle size distribution was measured with a combination of condensation nuclei counters, optical spectrometers, and an optical array probe covering the particle diameter range from 10 nm to 930 µm (Weinzierl et al., 2025b; Schöberl et al., 2024). The particle scattering coefficients were determined at three different wavelengths (λ=450, 525, 635 nm) with a polar nephelometer (Teri et al., 2022, 2024). The absorption coefficient was measured using a tricolour absorption photometer at multiple wavelengths (λ=465, 520, 640 nm), while the black carbon mass concentration was determined with a single-particle soot photometer (Teri et al., 2024).
An algorithm was developed to classify the airborne aerosol data into 12 aerosol types grouped in four main aerosol types (Saharan dust, Arabian dust, and mixtures with and without a coarse mode). Each of the four main aerosol types are further separated into three subclasses (pure, moderately polluted, and polluted) based on the relative contribution of pollution. The classification scheme is based on in situ measurements of the coarse-mode particle number concentration and refractory black carbon mass concentration. Furthermore, it uses information about the dust source region from the Lagrangian transport and dispersion model FLEXPART version 8.2 (Stohl et al., 1998; Seibert and Frank, 2004). FLEXPART was driven by meteorological data from the European Centre for Medium-Range Weather Forecasts (ECMWF). Coupled with emission data from the Copernicus Atmospheric Monitoring Service, it provides quantitative information about observed aerosol types and their origins. Here we use the results of the in situ classification for 23 periods of co-located measurements when the Falcon research aircraft was overflying the ground-based lidar site (see Table 2).
2.9 Atmospheric-transport simulations with FLEXPART
Backward atmospheric-transport simulations were carried out along the flight paths with the Lagrangian particle dispersion model FLEXPART (Stohl et al., 1998; Seibert and Frank, 2004; Stohl et al., 2005). Source–receptor relationships obtained were then combined with emission inventory data from the Copernicus Atmospheric Monitoring Service to get simulated mass concentrations of different species (dust, black carbon, organic matter, sulfate, sea salt). Furthermore, the contributions per species were split into source regions. Based on this output, each 1 min section of the flight track's aerosol components were assigned.
2.10 HYSPLIT
To identify the source regions and transport ways of the observed aerosol layers by ground-based lidar and sun photometer measurements, we use back-trajectory calculations. The trajectories were calculated with the Hybrid Single-Particle Lagrangian Integrated Trajectory (HYSPLIT) model (Draxler and Rolph, 2012) and reanalysis meteorological data. The start time and height of the trajectories were chosen according to the analysed lidar measurement time periods and the height ranges of the presumed aerosol layer. The duration of the backward trajectories is 48 h.
3.1 General measurement situation
During the A-LIFE field experiment we observed a high variability in aerosol types transported to our measurement site in Limassol, Cyprus. Satellite measurements (e.g. MSG, Meteosat Second Generation; MODIS) as well as trajectory calculations indicated that the main contributing aerosol types were Arabian dust, Saharan dust, and pollution/smoke aerosols. The different aerosol events showed a variety of aerosol layer heights and aerosol optical properties. Frequently, mixtures of different aerosol types or different aerosol types at different height levels were found (https://a-life.at, last access: 4 December 2024). Figure 1 gives an overview of the measurement situation that was continuously monitored by the PollyXT system. The lidar measurements confirmed the high variability in the aerosol and its distribution. On some days during the intense measurement period from 1 April to 1 May 2017 the main aerosol load was found in the boundary layer. Those days were connected with low values of the volume linear depolarization ratio. On other days high depolarizing aerosol was transported over our measurement site. The aerosol layers reached higher altitudes during those events. Signatures of aerosol structures were found up to 9 km altitude. Clouds were frequently embedded within or on top of those aerosol layers.
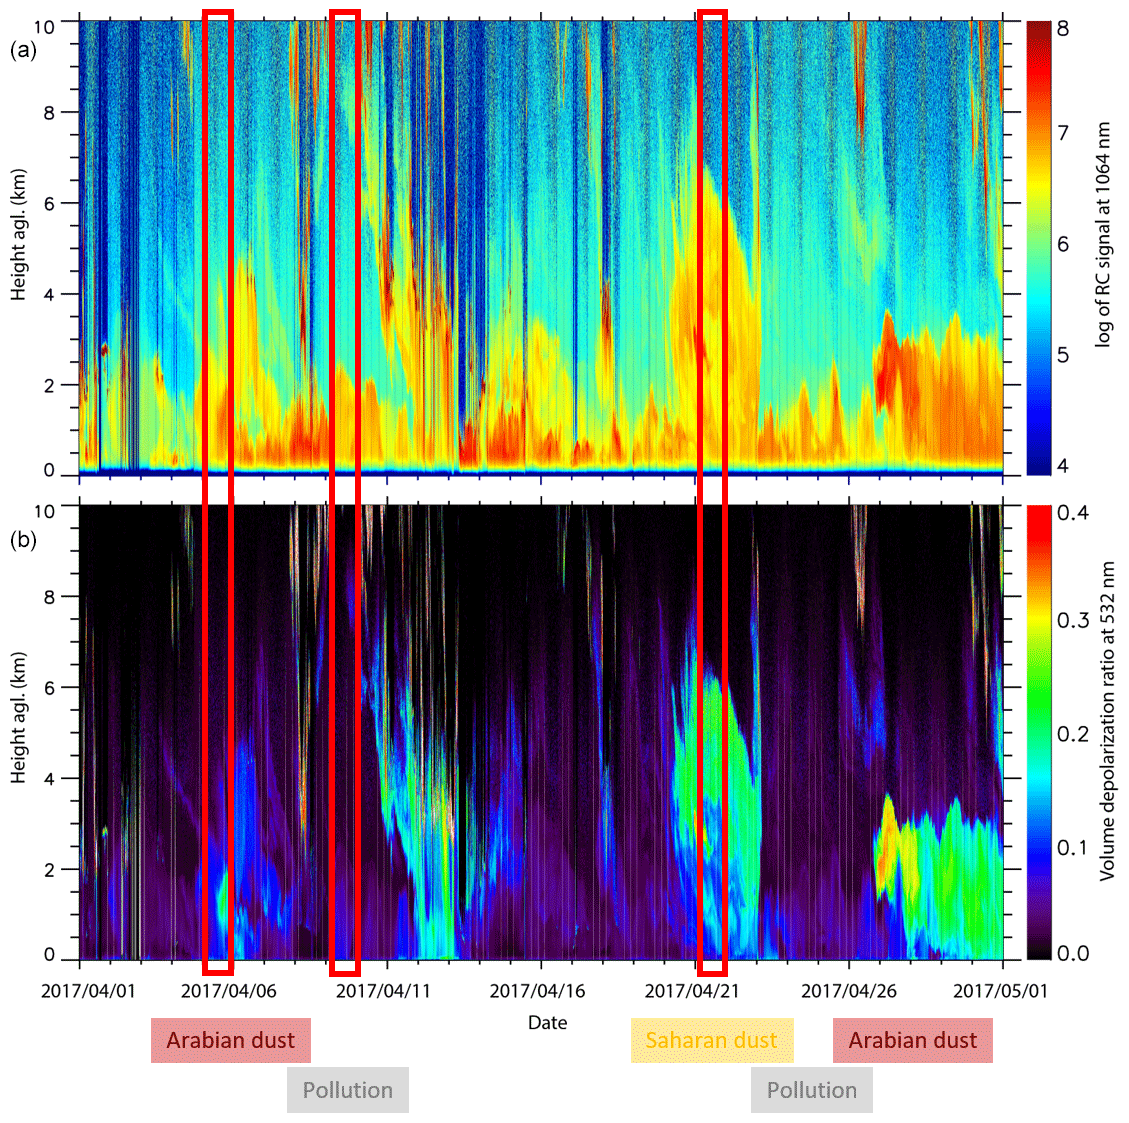
Figure 1PollyXT lidar range-corrected (RC) signal at 1064 nm (a) and the volume linear depolarization ratio at 532 nm (b) over Limassol, Cyprus, from 1 to 30 April 2017. Layers containing dust and dust mixtures can be identified by the greenish to reddish colours in (b). The red boxes indicate the days used for the case studies.
During our measurement period we were able to observe two events of Arabian dust (5 and 27–29 April 2017) and one event with major Saharan dust transport towards our measurement site starting on 20 April 2017 and lasting until 22 April 2017. Both events are characterized by a low Ångström exponent, indicating no or low wavelength dependence (see Fig. 2). But while the Ångström exponent (440–870 and 380–500 nm) during the Saharan dust event shows typical values of ∼ 0.2 (Toledano et al., 2009; Groß et al., 2011a), the Ångström exponent (440–870 and 380–500 nm) during the Arabian dust event shows slightly larger values of ∼ 0.6 for 440–870 nm and ∼ 0.8 for 380–500 nm. Both events show a large contribution of the coarse-mode particles to the overall AOD at 500 nm. The maximum AOD during the Saharan dust event was reached on 21 April 2017 with almost wavelength-independent values around 0.5 (Ångström exponents of <0.5), and during the Arabian dust event at the end of the measurement period an AOD as high as 0.7 was observed. Besides those mineral dust events we were able to characterize two cases with a dominance of anthropogenic pollution on 9 and 25 April 2017. While the AOD on 9 April was moderate with values between 0.1 and 0.25 at 1020 and 340 nm, respectively, the AOD during the second event was higher with values of up to ∼ 0.7 at 340 nm, up to ∼ 0.5 at 500 nm, and ∼ 0.15 at 1020 nm. In contrast to the dust cases, the fine-mode fraction contributed most to the AOD at 500 nm, while the contribution of the coarse-mode particles was almost negligible with AOD < 0.05. This dominance of the fine-mode particles is also reflected in the Ångström exponent, which was as high as 1.5. During the other days of the campaign we observed a mixture of different aerosol types, mainly of variable amounts of dust and pollution. Those days were characterized by quite strong wavelength dependence of the AOD measurements and large values of the Ångström exponent.
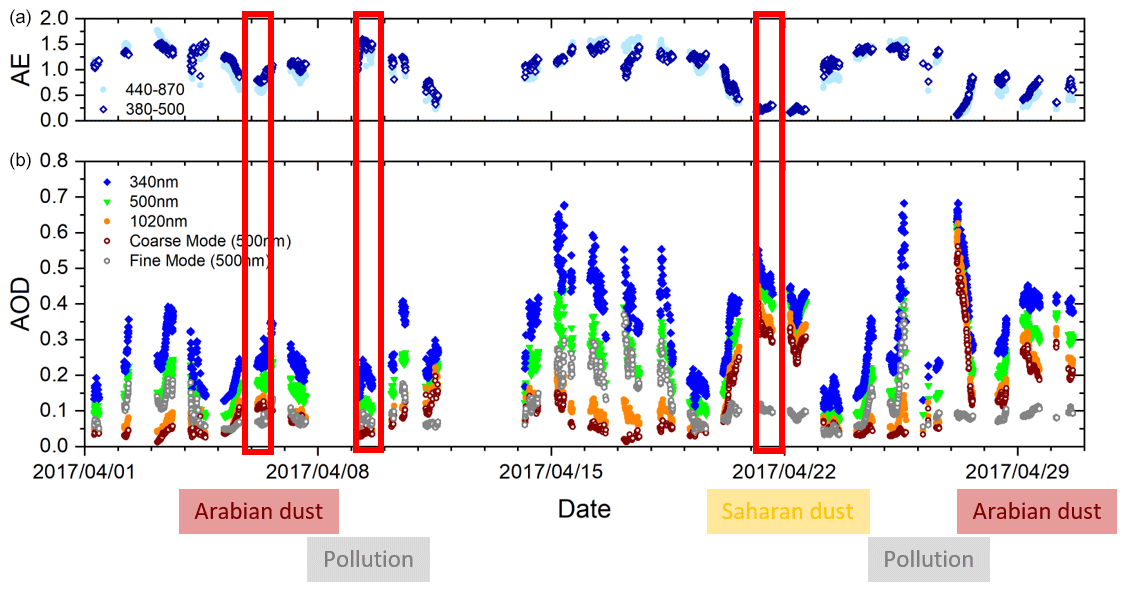
Figure 2AERONET sun photometer measurements and analysis during the A-LIFE field experiment at Limassol, Cyprus, showing the aerosol optical depth (AOD) at 340 nm (blue), 500 nm (green), and 1020 nm (orange) together with the retrieved coarse-mode AOD (brown) and fine-mode AOD (grey) at 500 nm (b) and the Ångström exponent between 440 and 870 nm (light-blue dots) and between 380 and 500 nm (blue diamonds) (a).
3.2 Case studies
In the following we concentrate on three case studies which represent pure Arabian dust (5 April 2017), pollution aerosol (9 April 2017), and Saharan dust (21 April 2017). The main focus of this investigation is the optical properties of pure aerosol types over Cyprus based on lidar measurements. Those analyses are valuable for advanced aerosol typing and determining the contribution of different aerosol types to aerosol mixtures. Figure 3 shows the calculated HYSPLIT backward trajectories for the selected case studies.
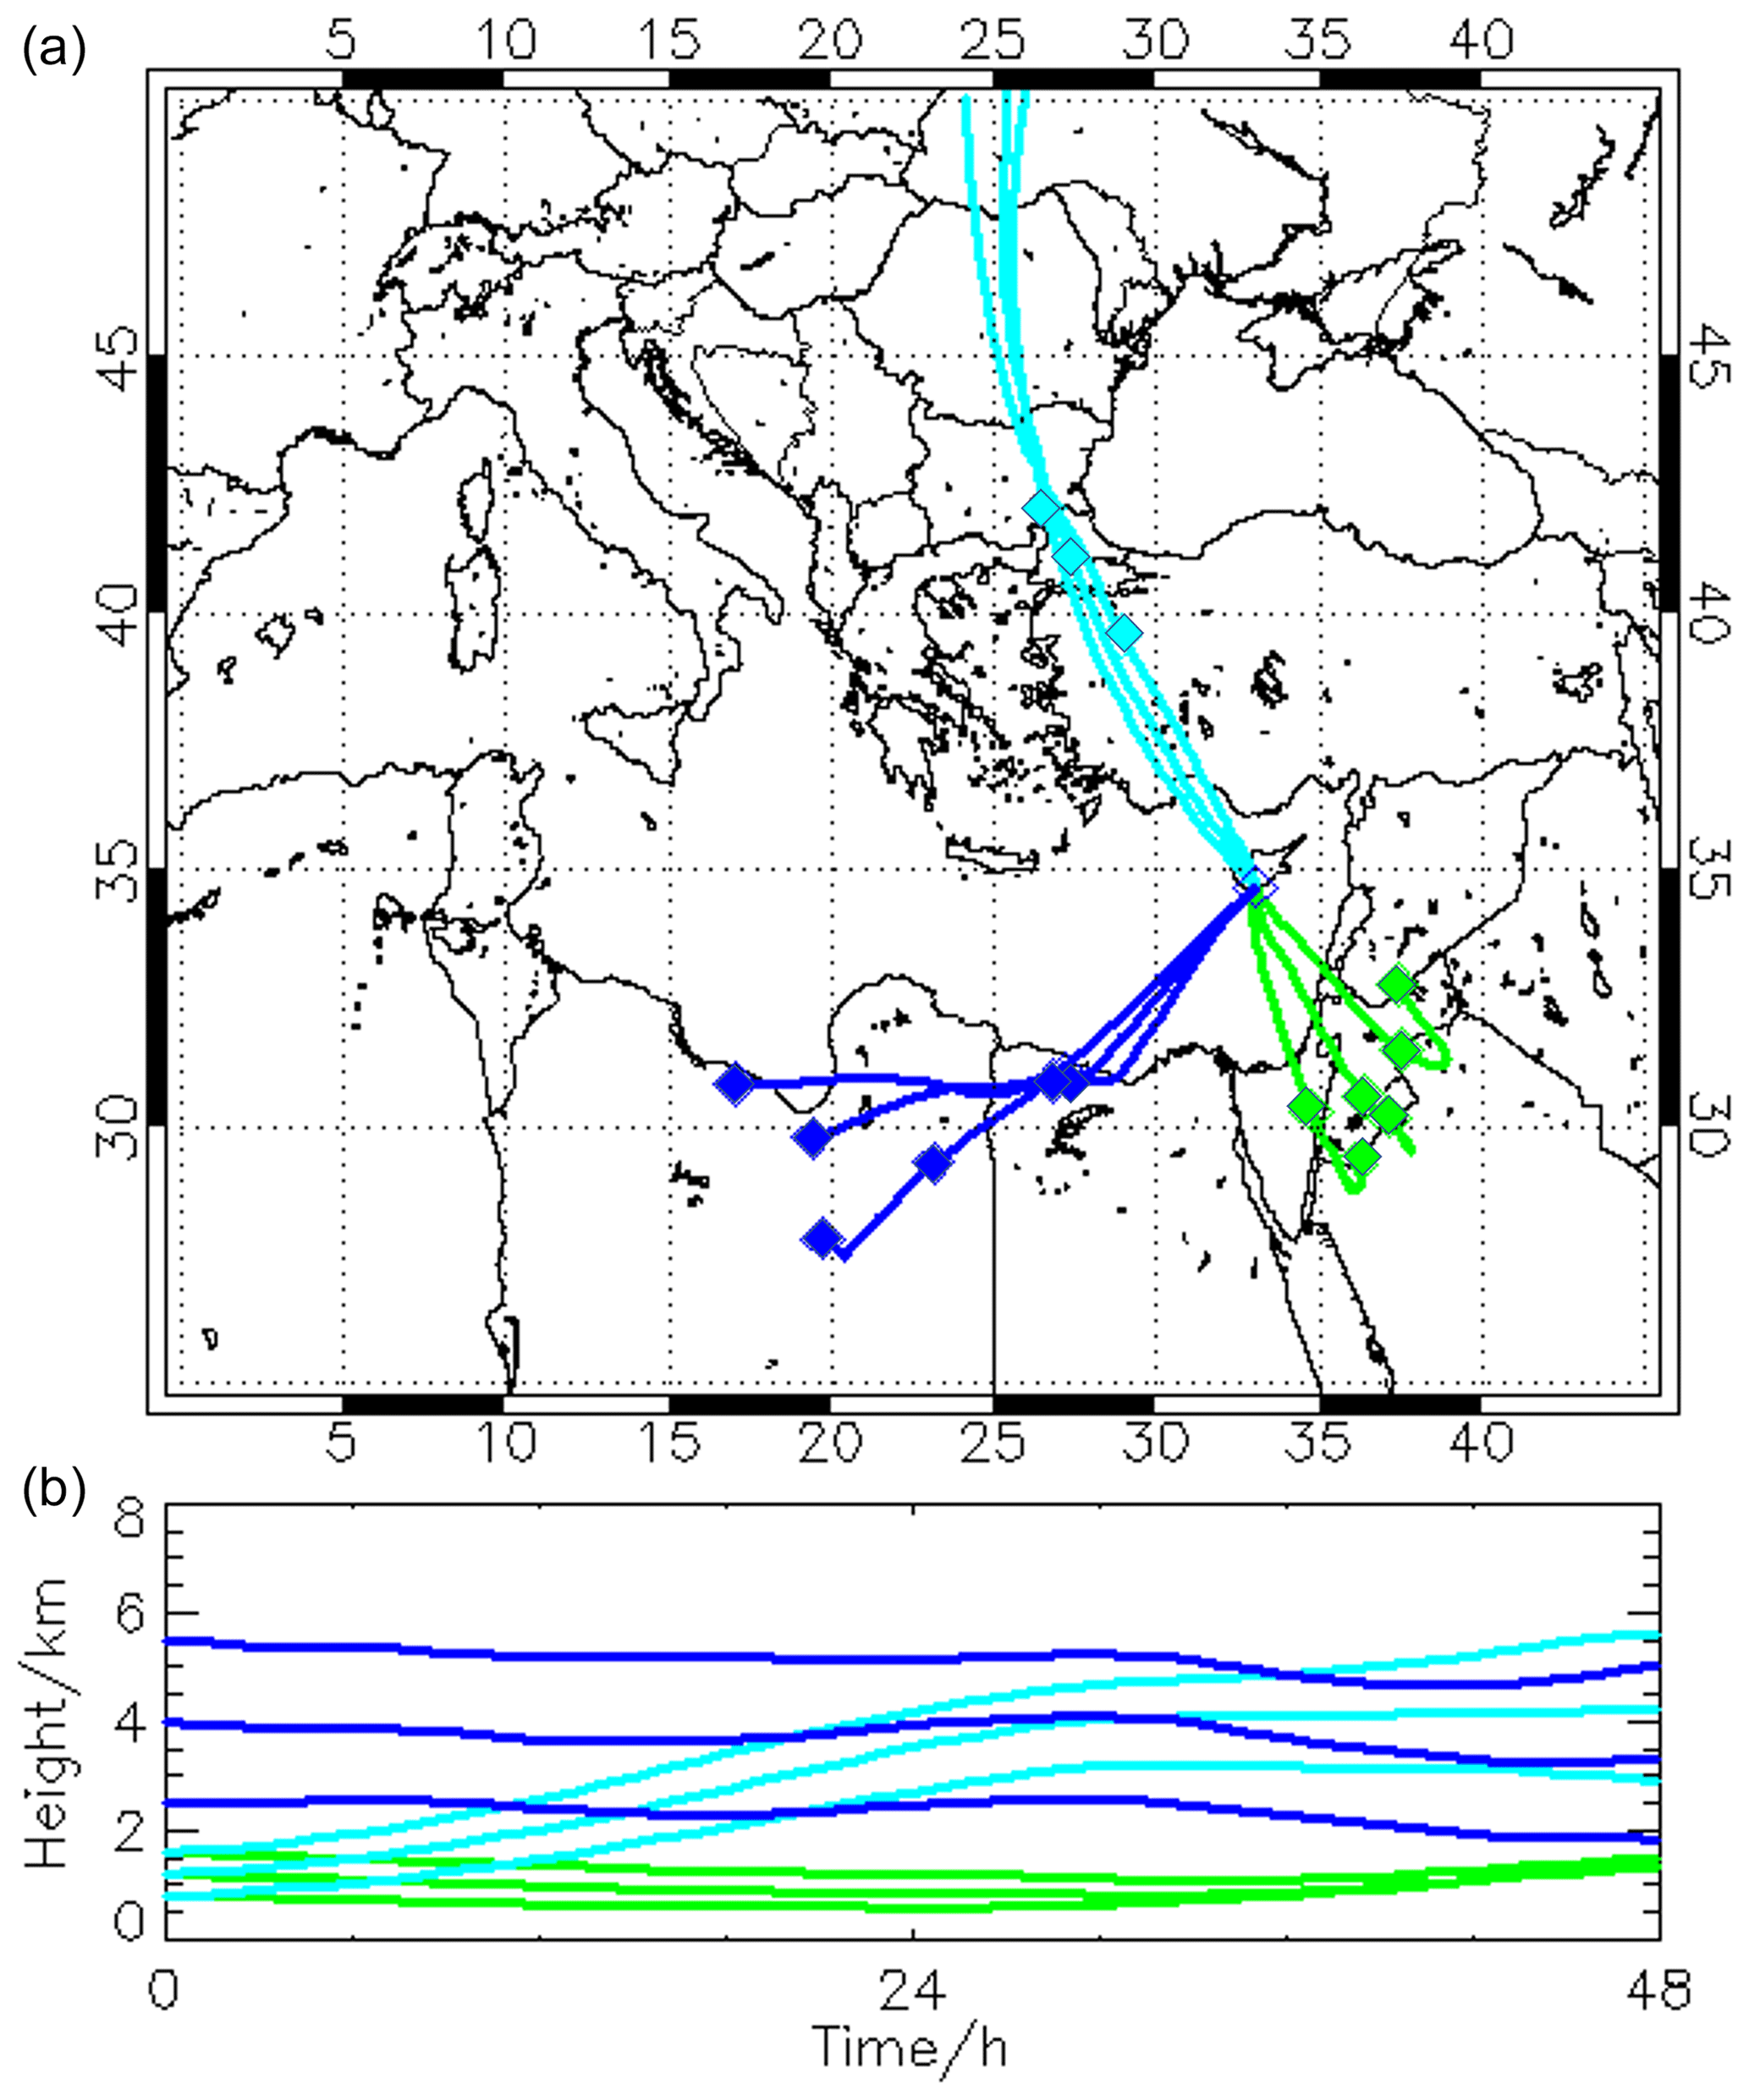
Figure 3The 48 h backward trajectories calculated with the Hybrid Single-Particle Lagrangian Integrated Trajectory (HYSPLIT) model (Draxler and Rolph, 2012) and reanalysis meteorological data for the observed aerosol layers on 5 April 2017 at 18:00 UTC (green, Arabian dust), 9 April 2017 at 21:00 UTC (light blue, pollution), and 21 April at 22:00 UTC (dark blue, Saharan dust). The stars along the trajectories indicate 24 h time steps.
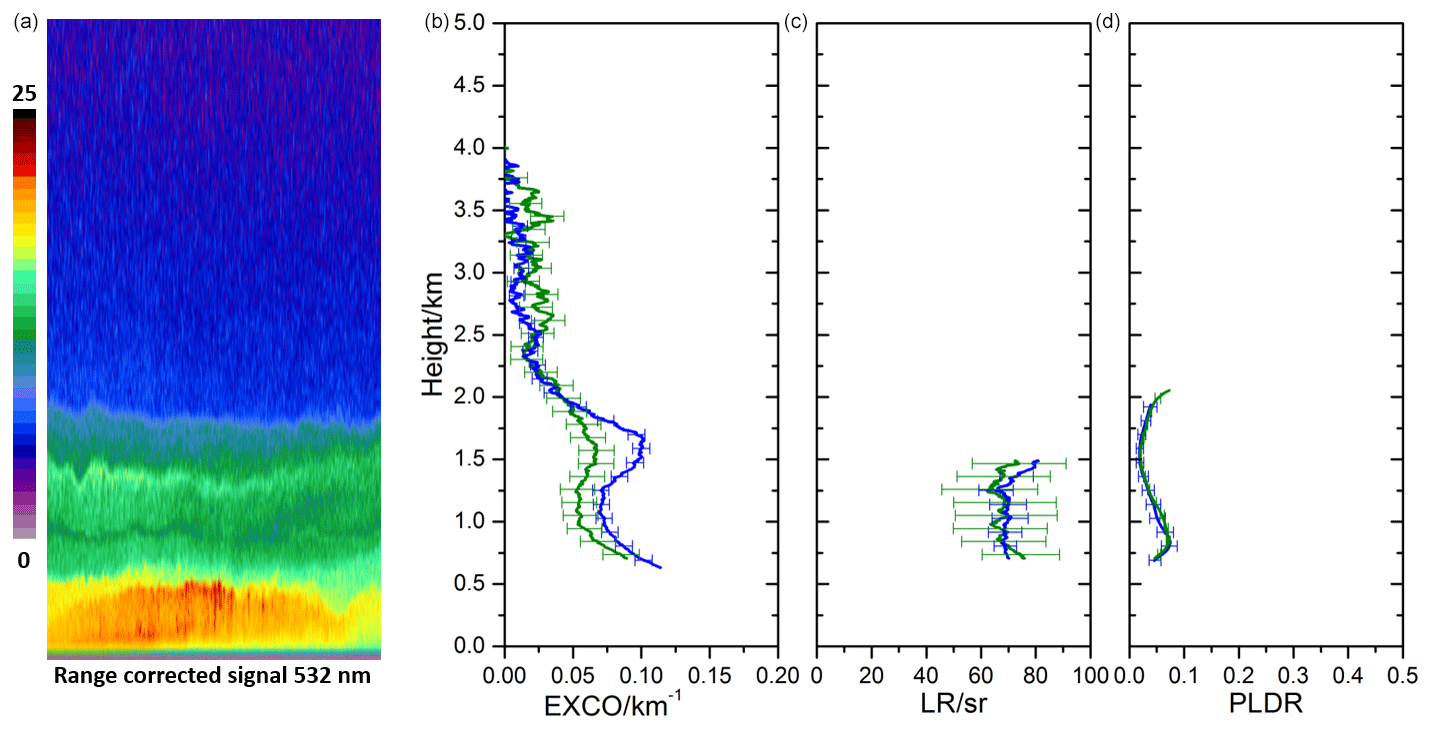
3.2.1 Arabian dust – 5 April 2017 (17:00–19:00 UTC)
A dust event with dust aerosols from the Middle East could be observed at the beginning of the campaign. Backward trajectories together (Fig. 3) with satellite images (not shown) helped to identify the source region of the air masses, which were advected from southerly directions. The AOD during this event reached values of 0.2 at 500 nm, and the situation was characterized by a low Ångström exponent (440–870 nm) of about 0.6. The lidar measurement (Fig. 4) shows that the main aerosol load was concentrated within the lowest 2 km. The particle linear depolarization ratio (PLDR) at 355 and 532 nm shows large mean values (and mean systematic errors) of 0.21 ± 0.02 and 0.27 ± 0.01, respectively, at a height range between about 0.8 and 21.8 km. Those values are clear indications of a large dust contribution within the observed aerosol layer (Tesche et al., 2009a; Freudenthaler et al., 2009; Groß et al., 2011b). The corresponding lidar ratio within this layer shows a wavelength-independent value of 40 ± 6 sr for 355 and 532 nm. Those values are significantly lower than the values found for Saharan dust but agree well with the measurements of a significantly lower lidar ratio of Arabian dust compared to Saharan dust (Mamouri et al., 2013; Nisantzi et al., 2015; Filioglou et al., 2020). The extinction coefficient within the Arabian dust layer shows moderate values of about 0.1 km−1 at 355 nm and of about 0.07 km−1 at 532 nm. Above the dust layer, the extinction coefficient strongly decreases. In the subjacent boundary layer, the PLDR values drop to about 0.1 to 0.15 at 355 and 532 nm, respectively, indicating that the dust was mixed with a different aerosol type. The corresponding lidar ratio increases to wavelength-independent values of about 50 to 60 sr, again indicating a change in the aerosol type and mixing state.
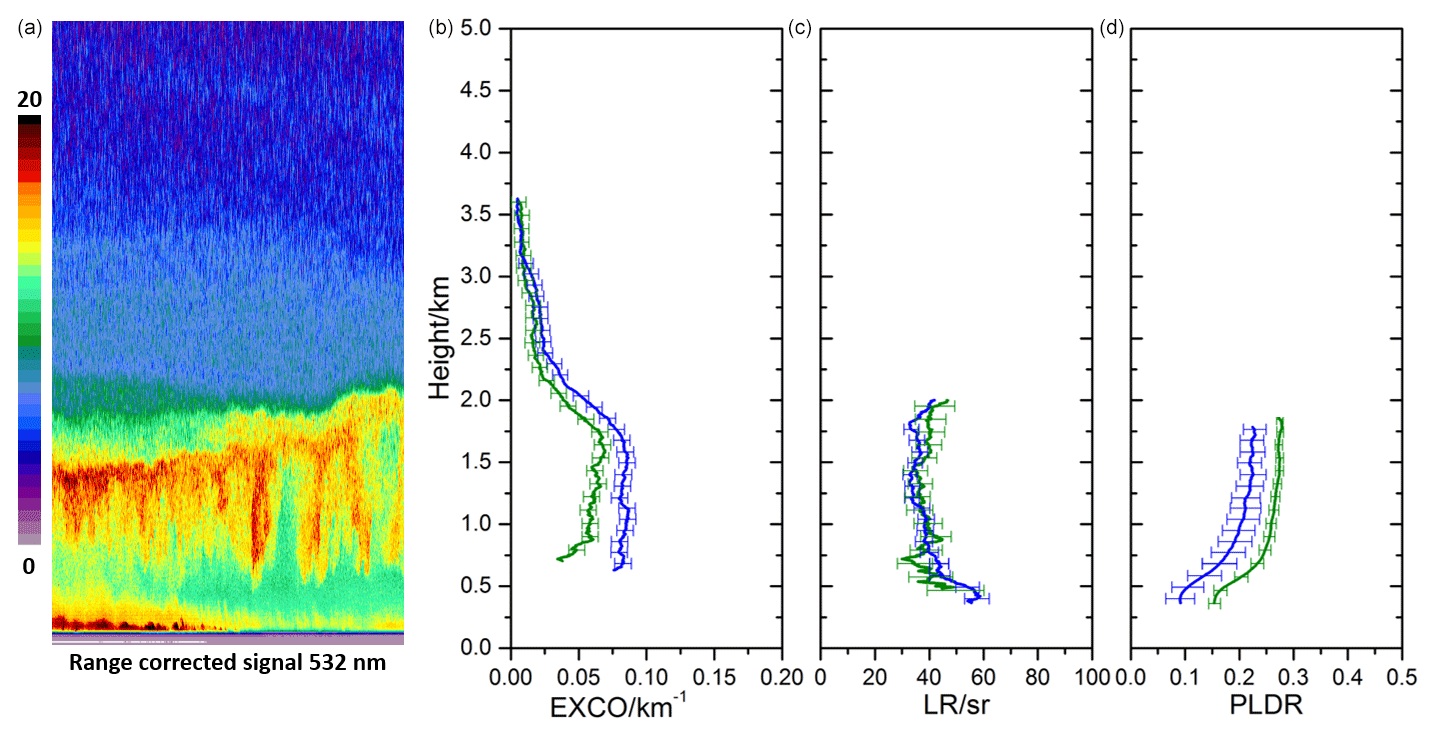
Figure 4POLIS lidar measurement showing the range-corrected signal (a) in arbitrary units from 17:00–19:00 UTC on 5 April 2017, with the intensity increasing from blue, green, and orange to red, and profiles (b–d) of the extinction coefficient (EXCO) (b), the lidar ratio (LR) (c), and the particle linear depolarization ratio (PLDR) (d). Blue lines indicate measurements at 355 nm, and green lines correspond to measurements at 532 nm. The signals were averaged between 17:00 and 19:00 UTC. The error bars show the systematic uncertainty.
3.2.2 Pollution – 9 April 2017 (20:16–22:16 UTC)
On 9 April 2017 air masses were advected from north-western directions (Fig. 3) towards our measurement site. The situation was characterized by an AOD of about 0.15 at 500 nm together with a large Ångström exponent of about 1.5. These values are clear indications of predominant fine-mode aerosols. Lidar measurements between 20:16 and 22:16 UTC are analysed to characterize the optical properties of this aerosol event. The main aerosol load was located within the lowermost 2.0 km (Fig. 5). Within a height range of about 0.75 to 2 km the retrieved extinction coefficient shows a significant wavelength dependence with values of > 0.1 km−1 at 355 nm and values around 0.07 km−1 at 532 nm. The mean values (and mean systematic errors) of the retrieved lidar ratio are about 69 ± 15 sr and wavelength independent between 355 and 532 nm. The corresponding PLDR is low, with mean values of about 0.03 ± 0.02 at 355 nm and of 0.04 ± 0.02 at 532 nm. Those values have been reported before for smoke/anthropogenic pollution aerosols (e.g. Groß et al., 2013a; Baars et al., 2021).
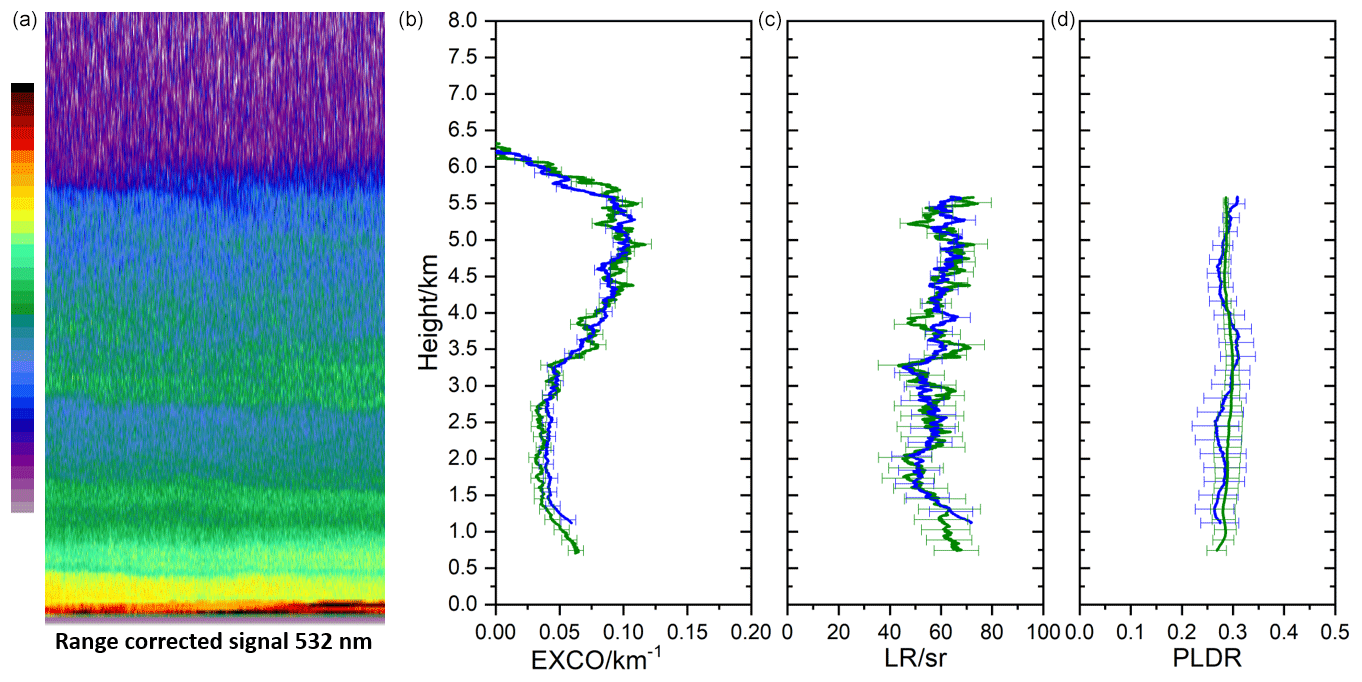
3.2.3 Saharan dust – 21 April 2017 (21:00–23:59 UTC)
Between 20 and 22 April 2017, the aerosol situation over the measurement site was dominated by Saharan dust. Backward trajectories (Fig. 3) indicated the western Saharan regions as main source regions for those aerosol masses. The situation was characterized by an AOD of about 0.5 at 500 nm and low Ångström exponent of about 0.2. The lidar measurements indicate that the top of the aerosol layer reached heights of about 6 km (Fig. 6). The extinction coefficient within the layer is wavelength independent between 355 and 532 nm, with maximum values around 0.1 km−1 between about 4 and 6 km height; from 1 to 3.5 km it is about 0.05 km−1. The retrieved mean lidar ratio and particle linear depolarization ratio (and mean systematic errors) are quite constant, with height showing wavelength-independent mean values of 59 ± 6 sr at 355 nm and of 58 ± 8 sr at 532 nm for the lidar ratio and of 0.28 ± 0.03 at 355 nm and 0.29 ± 0.02 at 532 nm for the PLDR. Similar values for Saharan dust after a transport of several days were also reported from recent studies (e.g. Groß et al., 2015a; Haarig et al., 2017).
3.3 General findings
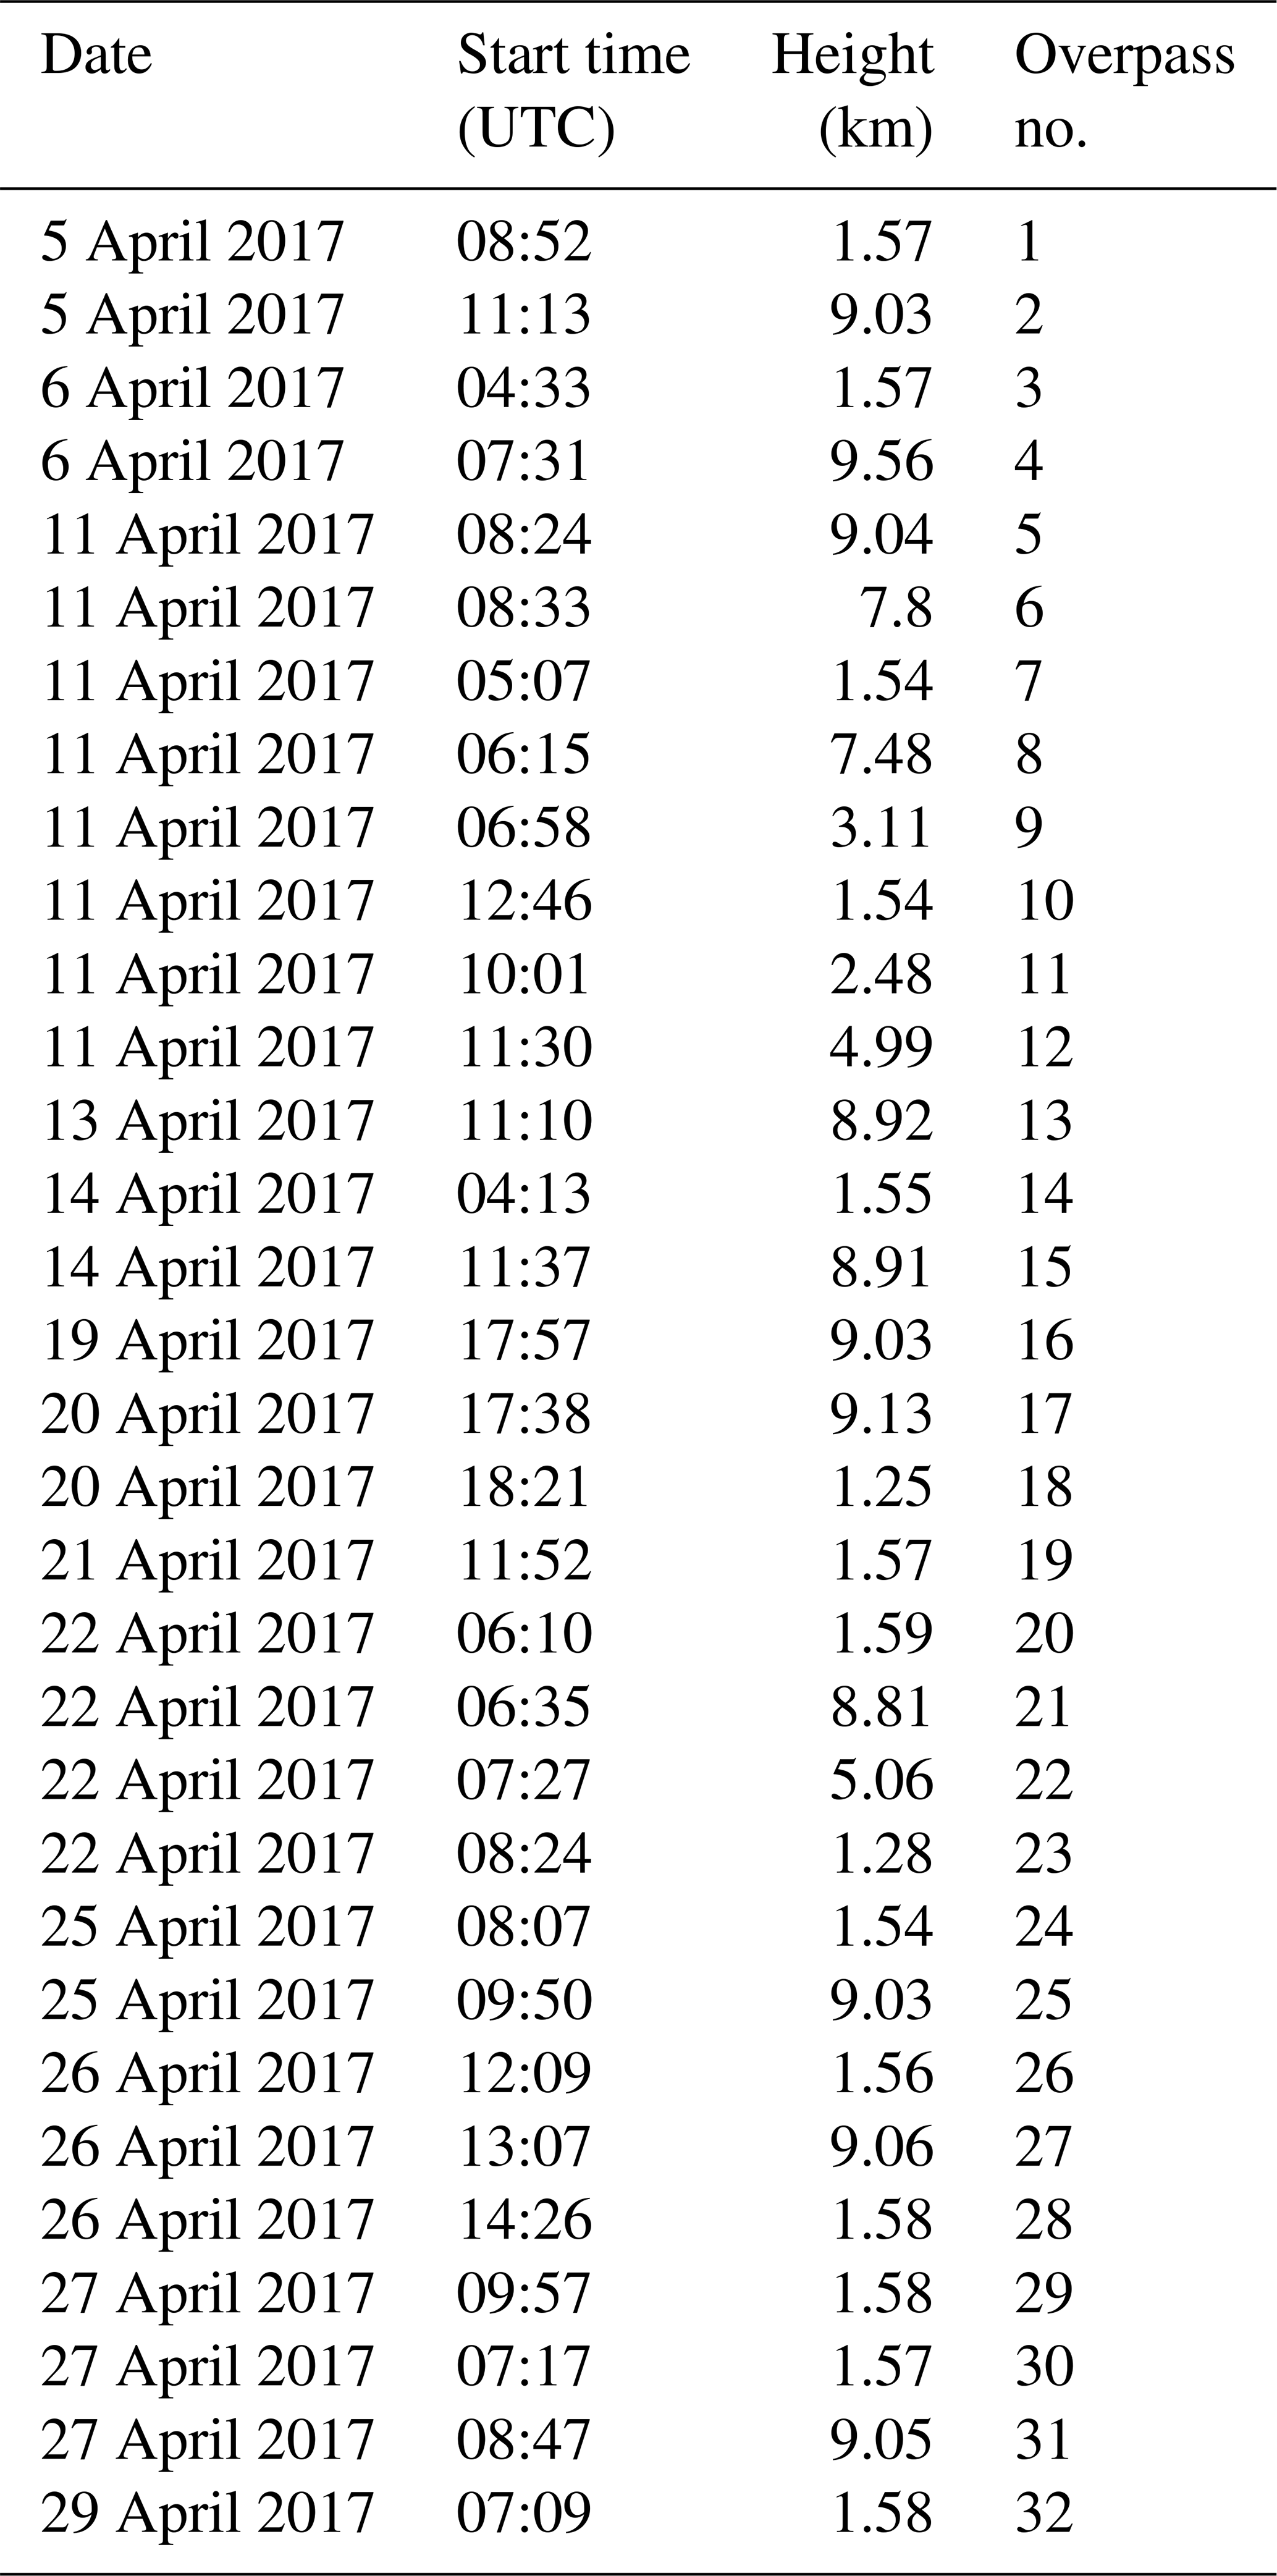
To better characterize the optical properties and the general aerosol situation with respect to dominating aerosol type during the measurements, we analyse the PLDR and the extinction coefficient of the POLIS measurements for the corresponding heights of the Falcon overpasses over our measurement site (see Table A1 in Appendix A). As most of the flights were performed during daytime, we were not able to retrieve the lidar ratio. Figure 7 shows the retrieved PLDR and the extinction coefficient for the Falcon overpasses along with the flight altitude. As the signal-to-noise ratio was too small to retrieve the PLDR with sufficient accuracy for overpasses at flight altitudes of > 7 km with low backscattering ratios, we restrict our evaluation to the extinction coefficient in those cases. The flight altitudes of most of the overpasses over our measurement site were 1.57 km and about 9.0 km. At the highest flight levels (around 9 km) the extinction coefficients are quite low, with values of 0.001 to 0.003 km−1, and wavelength independent for 355 and 532 nm. Lidar and in situ measurements of the extinction coefficient in this height range agree within the estimated measurement/retrieval uncertainty. In the lowermost layer the values range between 0.02 and 0.15 km−1. Although the lidar and in situ-derived extinction coefficients show the same behaviour, differences between both methods are obvious on dust-dominated days, with the in situ values exceeding the lidar-derived extinction coefficients. The largest difference we found was about 0.05 km−1 within the Saharan dust layer. The differences result partly from the different methods used to derive the extinction coefficient with lidar and the assumptions to calculate the extinction coefficient from in situ measurements and partly from the different volumes sampled by in situ and lidar measurements. We also included the measurements from PollyXT in our analysis and found an agreement within the uncertainty ranges with the POLIS measurements. For a better visualization, the PollyXT values are not included in Fig. 7.
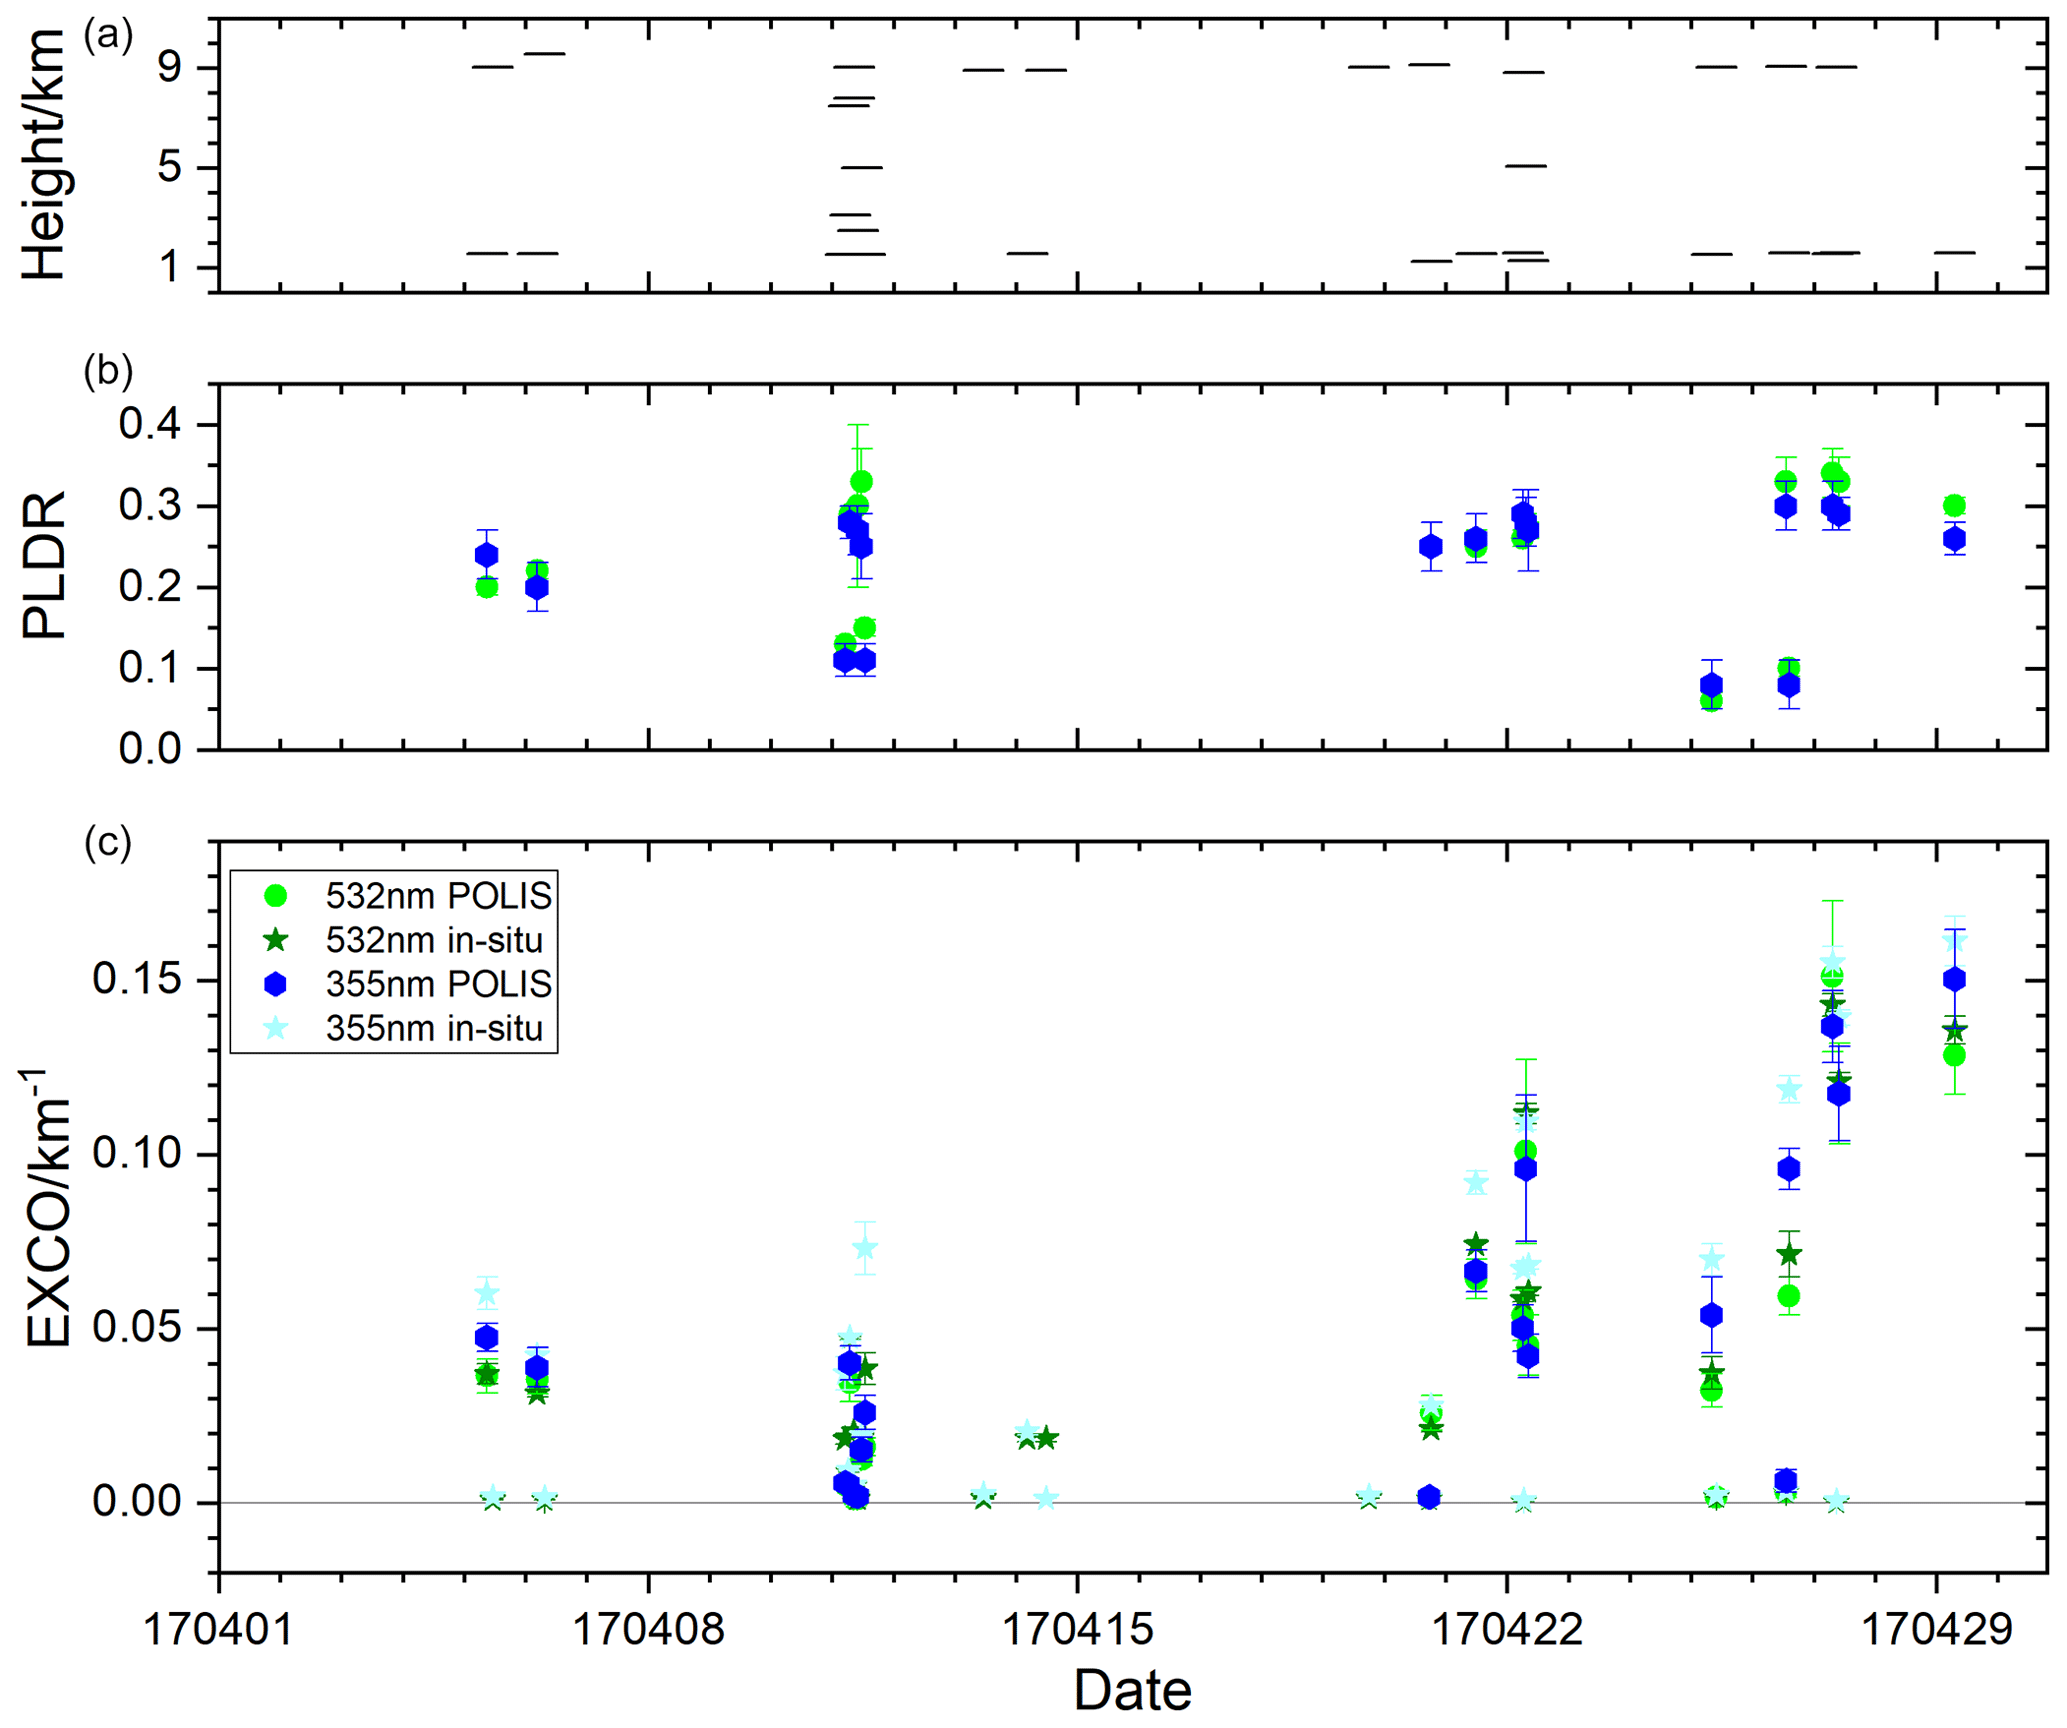
Figure 7Falcon flight altitude (a) used for the analyses (b, c) of the PLDR (b) at 355 nm (blue) and 532 nm (green) and the extinction coefficient (EXCO) from POLIS (c) at 355 nm (blue) and 532 nm (green), for in situ measurements at 355 nm (cyan) and 532 nm (olive), and for the dust (orange) and non-dust (grey) extinction coefficient at 532 nm as derived from the lidar analysis. The error bars give the systematic uncertainties.
The PLDR in the corresponding height levels helps to distinguish between different dominating aerosol types. For overpass 7, 10, 24, 26, and 28 (see Table A1) low PLDR values between 0.03 and 0.13 are found for 355 and 532 nm (wavelength independent); for the other days or higher levels, mean values of the PLDR between 0.2 and 0.32 are found at both wavelengths. These large values are a clear indication that the layer has a strong contribution of mineral dust particles or that mineral dust was even the only aerosol type in this layer. The PLDR at 532 nm within the layer is used to derive the contribution of dust and non-dust (assuming anthropogenic pollution) of the extinction coefficient at 532 nm. The analyses of the strong Saharan dust event from 20–22 April and during the strong Arabian dust event from 27–29 April show that dust by far dominates the extinction coefficient of the layer and that the contribution of anthropogenic pollution is only minor with values of max 0.01 km−1. On days with low mean PLDR values (∼ 0.05) at flight altitude, anthropogenic pollution dominates the extinction coefficient at 532 nm within this layer, while dust has only a minor contribution.
3.4 Aerosol typing
To investigate how well we can classify the different aerosol types and mixtures with lidar and the sun photometer, how this is understood in transport simulations, and how well it agrees with in situ measurements, we compare the different techniques with one another.
3.4.1 AERONET
Figure 8 shows the scatterplot of the sun photometer measurements during the A-LIFE field experiment. Marine aerosol scenes were not observed as low Ångström exponents with corresponding low AOD values are missing. Low Ångström exponents during A-LIFE came along with large AOD values. This is a typical signature of mineral dust events. Those events are classified as dust. Large values of the Ångström exponent with a corresponding AOD of about 0.2 to 0.4 are also frequently found during A-LIFE, clearly indicating the dominance of anthropogenic pollution or biomass burning aerosols during those days. All other days show intermediate values which correspond to aerosol mixtures with varying contributions of dust and pollution/smoke. This AOD–AE plot cannot be used to distinguish between Saharan dust and Arabian dust. Dedicated analysis of this difference is given by Mateos et al. (2025) using sun photometer inversion products. Along with the AOD–AE space, Fig. 8 also shows the measurement in the AOD–coarse-mode AOD space. This plot shows different arms of the distribution. Low coarse-mode AOD along with low to moderate AOD are found for pollution, which was also confirmed by looking at the AOD–AE measurements. Measurements of medium (0.2) to high coarse-mode AOD together with medium to large AOD values are indications of mineral dust, and the rest of the values are found for mixtures of dust and pollution. If the dominating aerosol type is dust in those mixtures, the coarse-mode AOD is slightly higher than for the mixtures with a dominance of pollution. The corresponding classification for the Falcon overpasses is listed in Table 2.
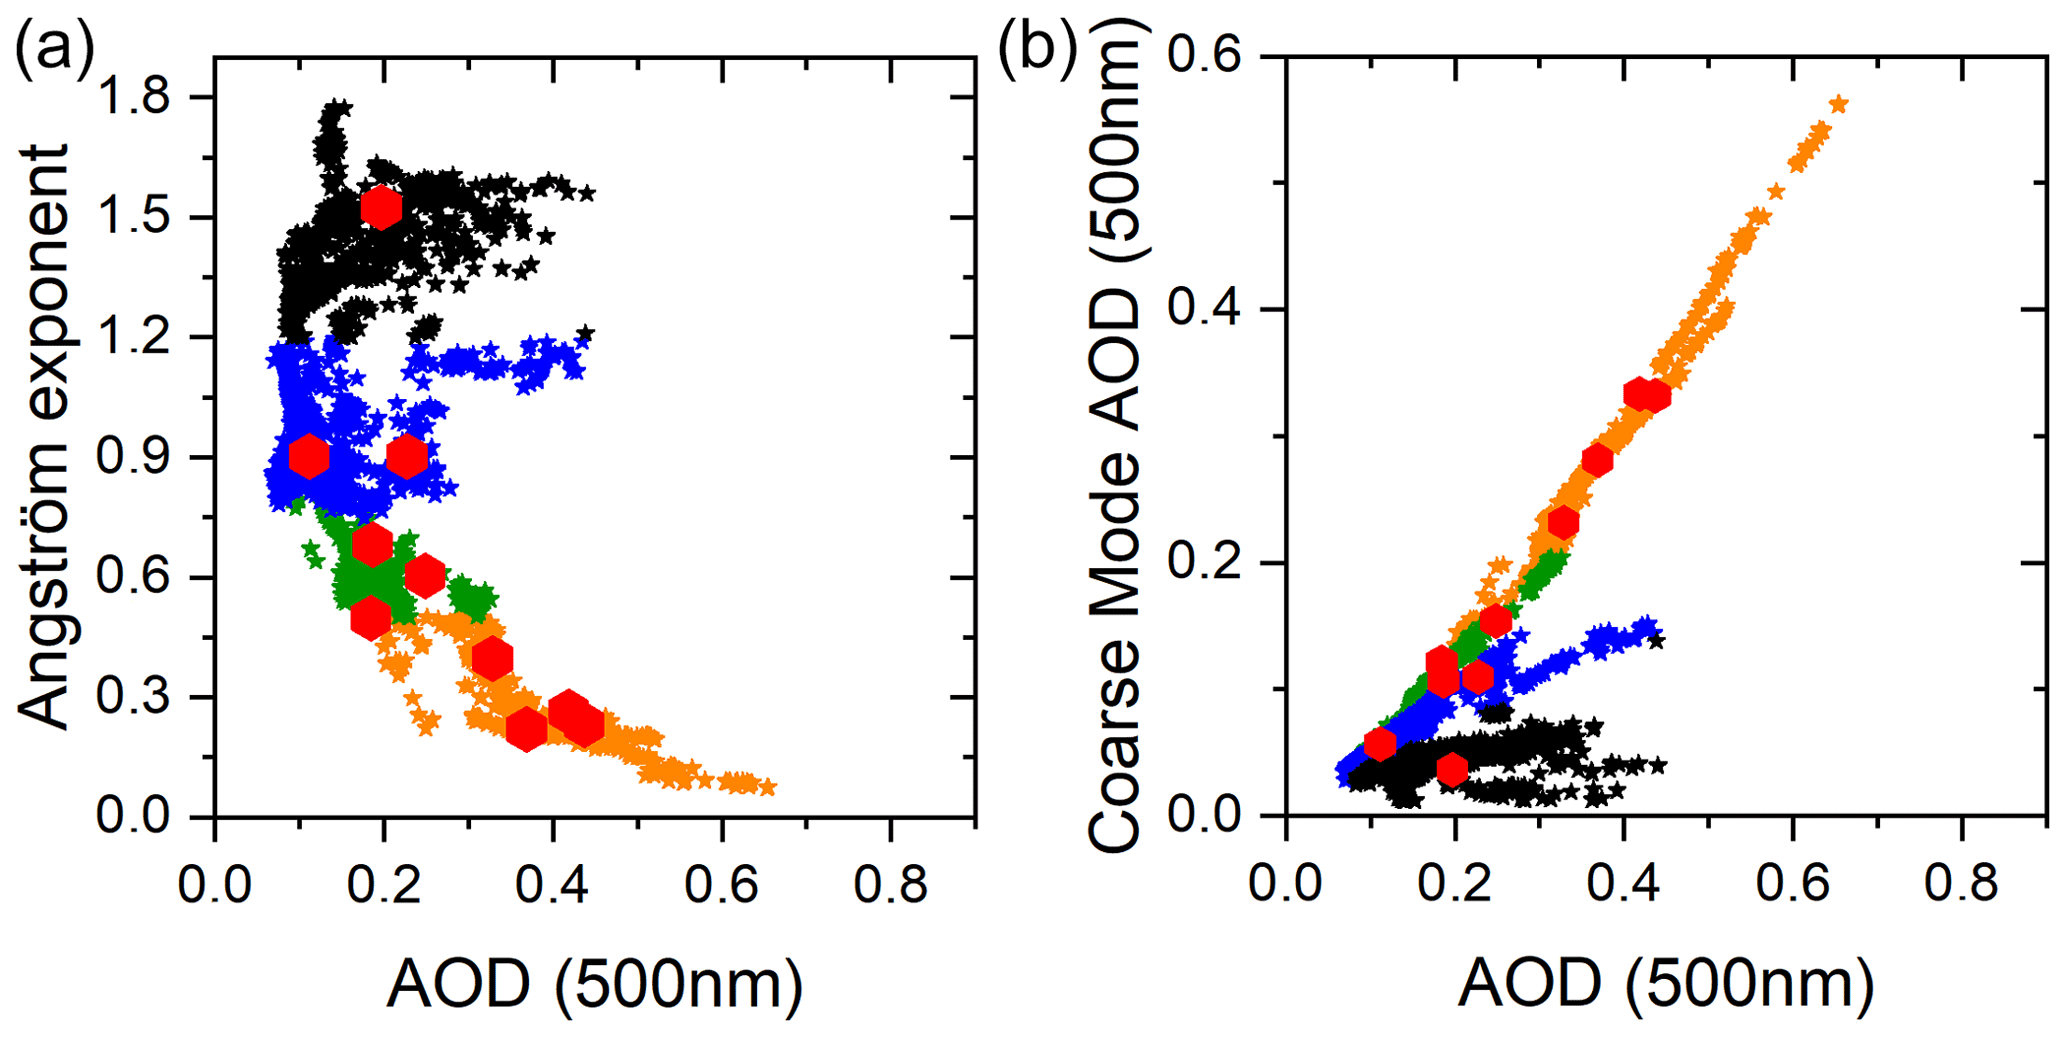
Figure 8AERONET sun photometer measurements and analysis during the A-LIFE field experiment at Limassol, Cyprus, showing the aerosol optical depth (AOD) at 500 nm vs. the Ångström exponent between 440 and 870 nm (a) and vs. the coarse-mode AOD at 500 nm (b). The measurements are colour-coded following the AERONET aerosol type classification scheme introduced in Sect. 2.7, where dust is indicated as orange, dust mixture is indicated as green, polluted mixture is indicated as blue, and pollution is indicated as black. The red symbols indicate the daily mean value used in Table 2.
3.4.2 Lidar
The mean values of the lidar ratio and the PLDR for the different aerosol layers and different aerosol types measured with the lidar systems POLIS and PollyXT during nighttime are shown in Table 1 and Fig. 9. The values show the large variability in the aerosol composition over the measurement site at Limassol, Cyprus. For the aerosol typing based on lidar measurements we use a method proposed by Burton et al. (2012) and Groß et al. (2013b, 2015b) extended for the LR threshold to distinguish Saharan and Arabian dust. This method depends on the fact that the lidar ratio and the PLDR are quite different for different aerosol types. Up to now, those schemes did not include the Arabian dust. Thus, our measurements will expand these classification schemes by another aerosol type of interest. Floutsi et al. (2023) already included the separation between Saharan and Arabian dust. But they performed data collection rather than classification. HETEAC (Hybrid End-To-End Aerosol Classification; Wandinger et al., 2023) was made more flexible regarding application to multiwavelength observations. The resulting HETEAC-Flex (Floutsi et al., 2024) includes optical properties for Saharan dust separate from Arabian dust. Figure 9 shows the PLDR vs. lidar ratio at 355 and 532 nm derived from POLIS and PollyXT lidar measurements. In the background of both plots the measurements from former campaigns that are already included in the typing schemes (Groß et al., 2015a, b) are shown. In the foreground (large symbols) the measurements during this campaign are shown. As both lidar systems, POLIS and PollyXT, were located side by side during the A-LIFE campaign, we can use the measurements to check if and how the analysis of different lidar systems with different algorithms done by different research groups affects the outcome. As mentioned in Sect. 3.4, we found significant differences in the retrieved extensive optical properties (i.e. the extinction coefficient). With the PLDR and lidar ratio presented in Table 2 and Fig. 9 we can also check if there are significant differences in the retrieved intensive optical properties. Although the mean values for the lidar ratio (both wavelengths) partly differ by 10 sr or more, considering the uncertainty range of the retrieved values we found no significant differences. For the PLDR at 532 nm we found an agreement of the mean values within 0.02 between the two instruments. For the PLDR at 355 nm the differences in the mean values are as large as 0.06 for the dust-dominated day around 20 April 2017. However, considering the uncertainty range, the differences are not significant. Differences can occur from different averaging (time and height) as well as from differences in the lidar performance (e.g. signal strength).
Table 1Mean values of the lidar ratio (LR) and particle linear depolarization ratio (PLDR) at 355 and 532 nm including the mean systematic errors (±) for different aerosol days and height ranges. The values given were derived from nighttime measurements. If no measurements were available, the corresponding values are missing in the table.
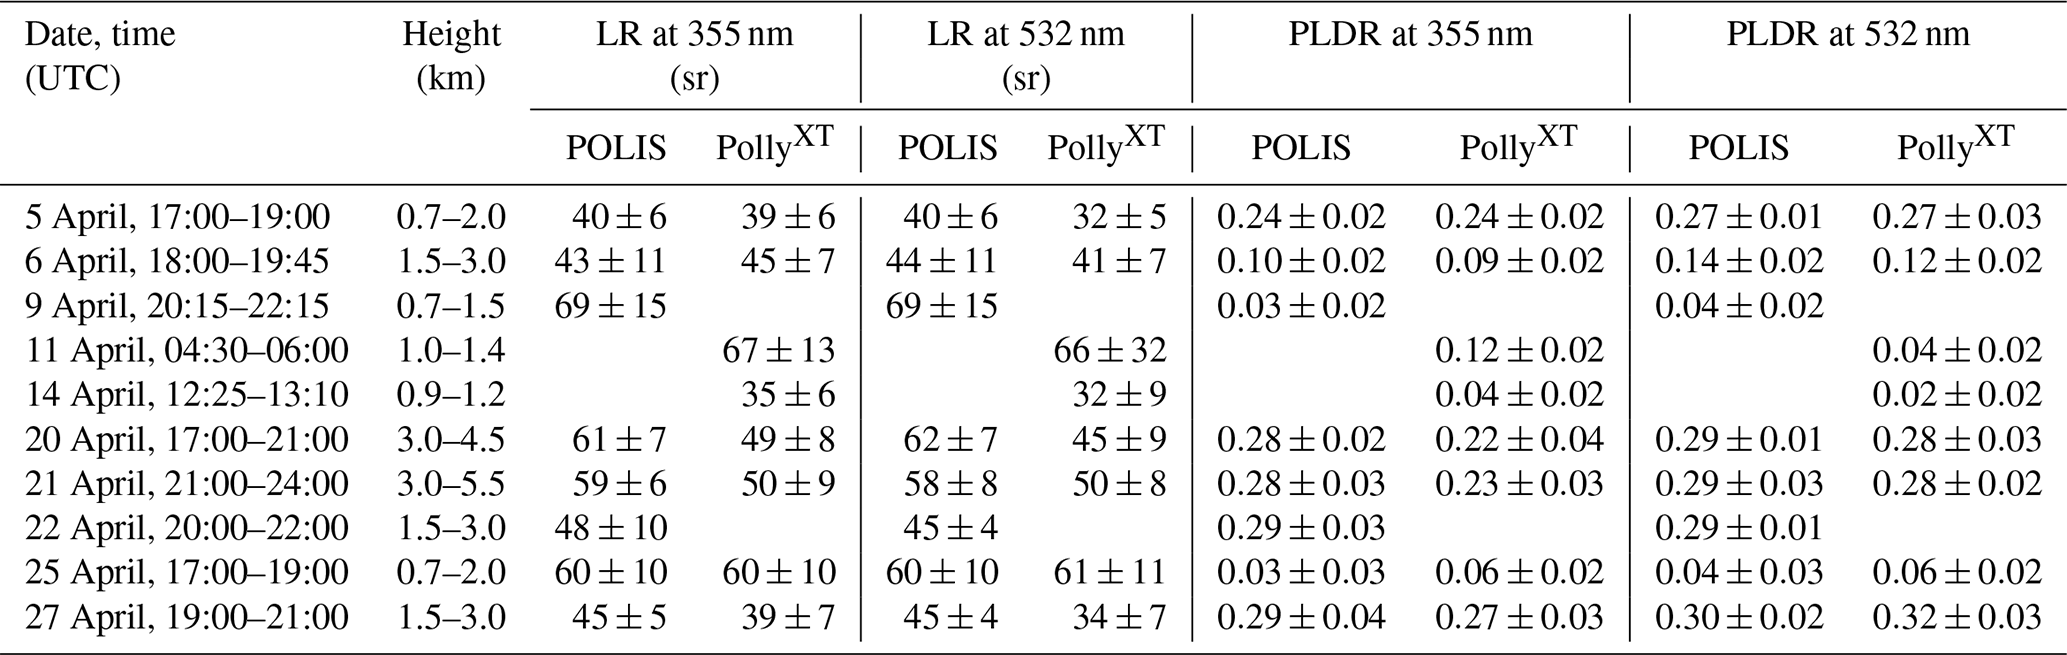
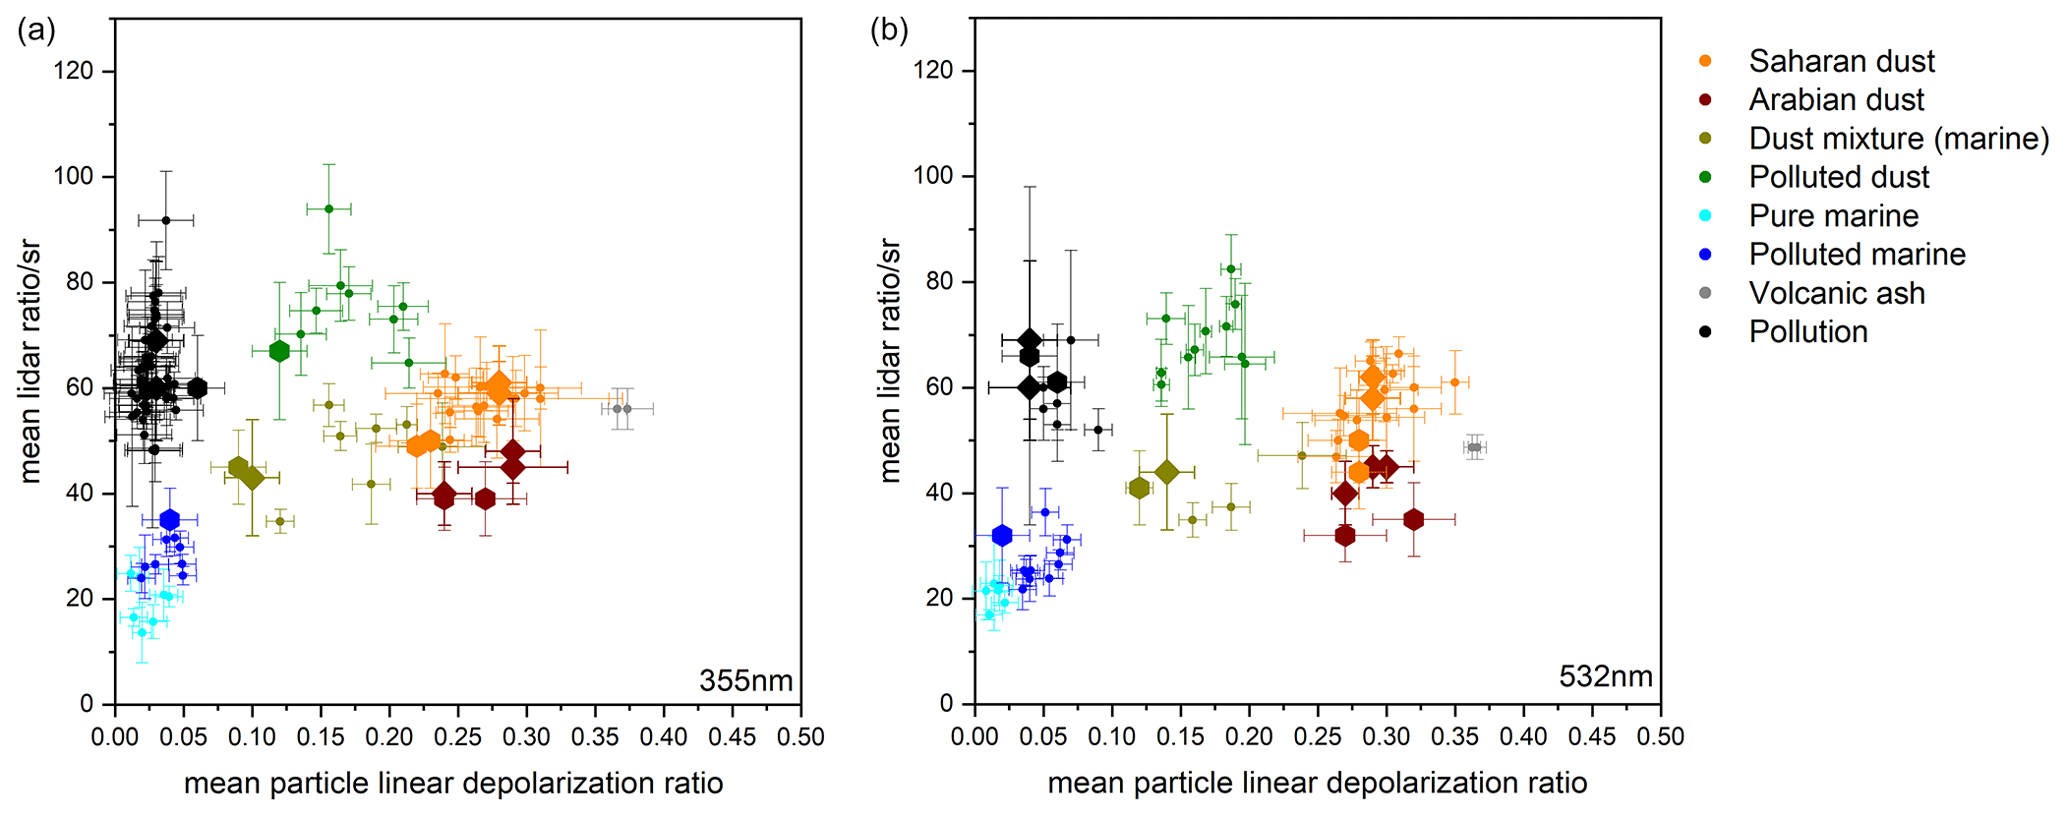
Figure 9Aerosol classification at 355 nm (a) and 532 nm (b) based on the particle linear depolarization ratio and the lidar ratio. Measurements given by small symbols show findings from former studies (Groß et al., 2015a, b) and measurements given by large symbols show measurements during A-LIFE, with diamonds showing POLIS measurements and hexagons showing PollyXT measurements. The error bars show the mean systematic errors. The figure is adopted from Groß et al. (2015a). Olive-green and cyan data points in the background indicate fresh biomass burning aerosol and marine aerosol, respectively, and blue data points indicate polluted marine.
Applying the classification scheme on the intensive optical properties we find good agreement of the results between the different systems and the different wavelengths. Only for the pollution case on 11 April 2017 does the classification at 355 and 523 nm show slight differences in the assigned aerosol type. The difference in the PLDR (0.12 ± 0.02 at 355 nm and 0.04 ± 0.02 at 532 nm) causes this difference. While the aerosol type was classified as polluted dust at 355 nm, it was classified as pollution/smoke at 532 nm. POLIS measurements are missing for that day to check the validity of the PollyXT classification. The measurements during the days dominated by anthropogenic pollution and Saharan dust clearly fit in the former classification scheme (Groß et al., 2015b). Thus, the aerosol type within these layers can be clearly classified. Arabian dust has lower values of the lidar ratio compared to Saharan dust, both at 355 and 532 nm. This was also confirmed by Filioglou et al. (2020). They found values of the lidar ratio of about 42–45 sr in lidar measurements at 355 and 532 nm and corresponding PLDR values of about 0.25 at 355 nm and of about 0.31 at 532 nm. Similarly, for Asian dust, low values of the lidar ratio were found by Hofer et al. (2017, 2020), who reported values of 39–45 sr for 355 and 532 nm with a PLDR of about 0.24 at 355 nm and of about 0.33 at 532 nm, while Hu et al. (2020) found larger values of the PLDR for measurements near the Taklimakan desert. They interpreted these large values as an indication of fresh dust close to the source regions with a large number of coarse and giant particles. A PLDR of less than ∼ 0.07 at 355 and 532 nm together with high lidar ratios of about 60–75 sr at both wavelengths indicated pollution aerosol layers. In addition, the lidar measurements indicated different layers with aerosol mixtures. Those layers are indicated by intermediate values of the PLDR and the lidar ratio. Pure marine aerosol layers could not be identified from the lidar measurements during A-LIFE; they rather indicate mixtures with dust and/or pollution.
4.1 Comparison of aerosol typing methods
Aerosol type classification is one important point in determining the radiative properties of the aerosol layers as well as estimating possible interactions, e.g. with clouds. Different aerosol type classification schemes are based on different measured properties, i.e. microphysical properties vs. optical properties (Sects. 2 and 3.5). Thus, the different methods might give slightly different results, depending also on the number of types and subtypes involved. To ensure that the different classification methods applied in A-LIFE (in situ, lidar, sun photometer, transport simulations) give the same results, we intercompare the output of those methods for selected overpasses. As we do not have the lidar ratio for the aerosol type classification during daytime, we classify the aerosol type at flight level by a combination of different pieces of information as described in Sect. 2.2. The lidar classification is not considered when we do not have collocated measurements in the flight altitude or cannot do an aerosol classification due to temporal variability or a low signal-to-noise ratio.
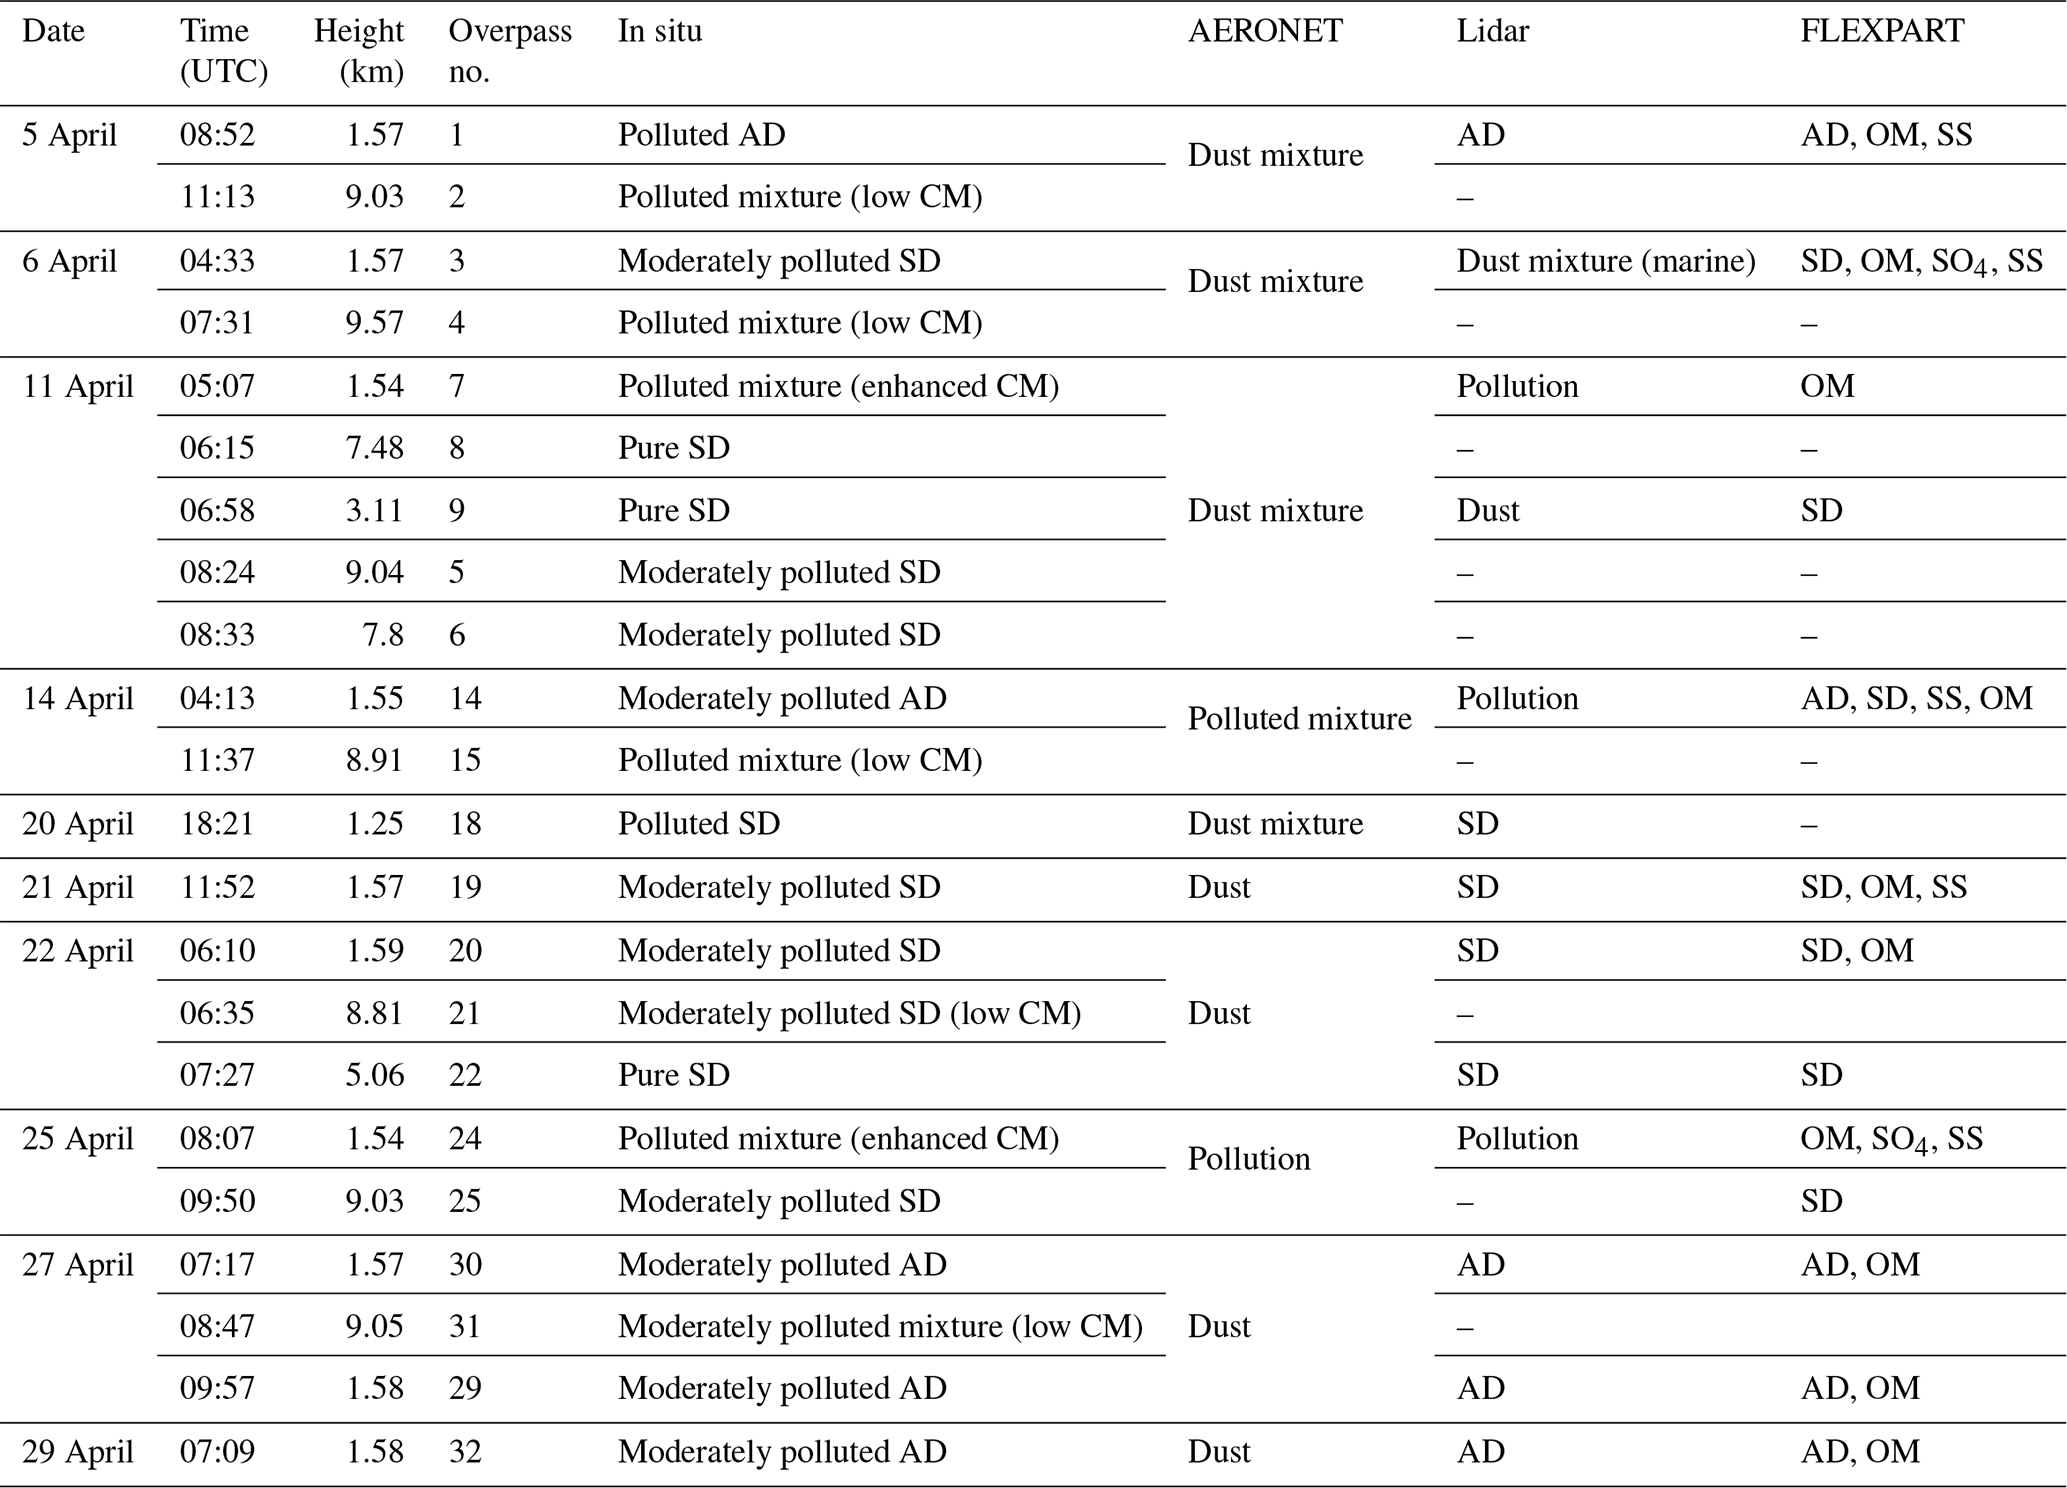
Table 2 gives an overview of the aerosol type classification of all used classification methods for the selected Falcon overpasses over the Limassol site. The different methods agree well in the classification of the dominating aerosol type, but it is also obvious that small differences occur. AERONET sun photometer measurements can only provide a classification for the whole atmospheric column due to the measurement setup. Thus, at days with different aerosol layers consisting of different aerosol types, the combination will be reflected in the classification. This is the case for the complex situation on 5, 6, and 11 April, for example. If only one main aerosol type is present, the classification is very comparable with the height-resolved classification from the lidar and the in situ measurements. Comparing the lidar and in situ classifications, we also see a good agreement in general. However, moderate contributions (e.g. from pollution) cannot be characterized with the lidar when the optical properties of the layer are strongly dominated by dust aerosols. This is shown e.g. for the Arabian dust outbreak on 5, 27, and 29 April and for the Saharan dust cases on 21 and 22 April. The investigation into how pollution within the mineral dust layers affects the optical and radiative properties goes beyond the objectives of this paper and is presented in a separated publication (Teri et al., 2024). A summary of the main optical properties measured in the cabin of the Falcon aircraft for these overflights is given in the Supplement of this publication. As another source of aerosol type characterization, we use atmospheric-transport calculations with the FLEXPART model in this study. This method considers a larger number of aerosol types than derived from AERONET, lidar, and in situ classification (including source allocation). We see that the FLEXPART-based classification in principle fits well in the in situ and lidar classifications. The comparison of the different aerosol typing schemes highlight that, although the dominating aerosol type is captured quite well, it is hard to directly compare the outcome in detail. As the different aerosol classification schemes rely on different measured quantities (e.g. optical properties vs. size distribution and microphysical properties), the results can provide a different degree of detail. It is important to carefully investigate if the chosen method provides sufficient information for the specific study for which is used.
Table 2Date, time, height, and number of Falcon overpasses over the Limassol measurement site together with the resulting aerosol classification from in situ, AERONET and lidar measurements, and atmospheric-transport simulations with FLEXPART. AD stands for Arabian dust, SD stands for Saharan dust, OM stands for organic matter, SS stands for sea salt, SO4 stands for sulfate aerosols, and CM stands for coarse mode. Missing values for the uppermost flight legs indicate that no lidar- and FLEXPART-based classification was possible in this layer.
4.2 Dust and non-dust fraction
From the aerosol typing comparison above we find that the different methods agree quite well. However, to better characterize the aerosol situation and thus investigate the impact of the different aerosols, not only the aerosol type but also the fractional contribution of a specific aerosol type to the optical properties or the volume concentration as well as its mass concentration is of importance. To intercompare the different methods with respect to the given dust mass concentration, we first calculate the dust fraction of the backscatter coefficient and of the volume concentration and the dust mass concentration for the different overpasses (Fig. 10) and compare the latter to the estimated dust mass concentration from the FLEXPART simulation as well as the total mass concentration.
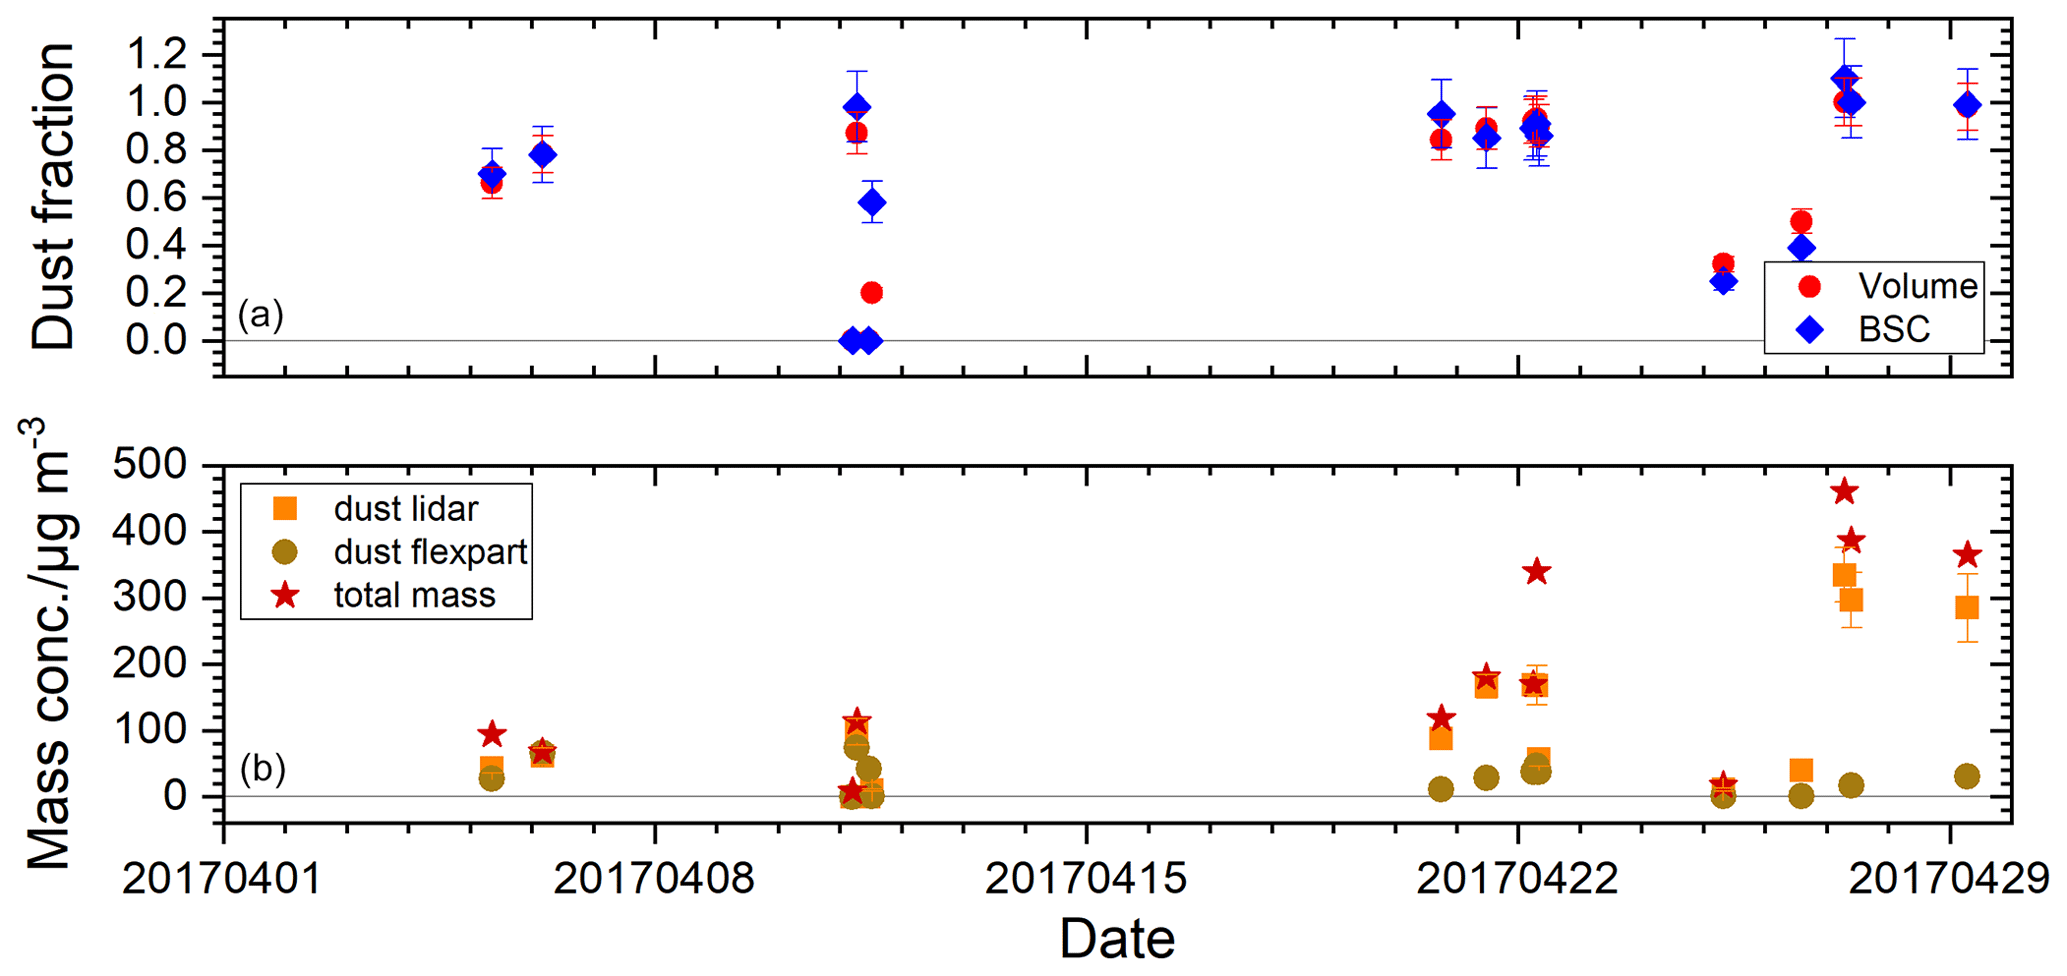
Figure 10Volume (red) and backscatter coefficient (blue) dust fraction derived from POLIS lidar measurements (a) and dust mass concentration (b) derived from POLIS lidar measurements (orange), FLEXPART (light brown), and in situ total mass concentration (red stars) for the Falcon overpasses.
The contribution of the dust fraction to the backscatter coefficient at 532 nm is similar to the dust contribution to the extinction coefficient (Fig. 7). During the major dust events the dust fraction of the layer mean backscatter coefficient varies between about 0.8 at the first events of Arabian dust at the beginning of the campaign to ∼ 1.0 at the strong Arabian dust event at the end of the campaign. As we find a deviation of the measured value of the PLDR of 0.32 on 27 April 2017 and the input value used for type separation of 0.3, the retrieved dust fraction to the backscatter coefficient (BSC) and the volume is overestimated, leading to mean values slightly larger than 1. For the Saharan dust event the dust fraction of the layer mean backscatter coefficient was about 0.9. And even during the days with a dominance of anthropogenic pollution, the dust fraction of the backscatter coefficient is still about 0.3, except during the pure pollution event where we find dust fractions of the layer mean backscatter coefficient of <0.1. The derived volume fraction of dust aerosols follows the dust fraction of the optical properties. Both dust fractions agree well within the uncertainty ranges, except for 11 April 2017, when the dust fraction to the BSC significantly exceeds the volume dust fraction. This difference might be caused by a wrong assumption of the contributing types and thus of the chosen conversion factor. In general, one can conclude that the dominance in the optical properties is a result of the dominance in volume.
Derived mean dust mass concentrations from the lidar measurements at 532 nm at flight altitude reflect the large variability during the measurement period. Large values of dust mass concentration at flight altitude of around 300 µg m−3 are found during the strong Arabian dust event at the end of the campaign. The backscatter and extinction coefficients at flight altitude at those days are also quite large, which perfectly fits to the large values of the dust mass concentrations. During all other dust events we find dust mass concentrations between about 50 µg m−3 during the first Arabian dust event and about 170 µg m−3 during the major Saharan dust event. For measurements with dust and non-dust mixtures we find a dust mass of <35 µg m−3 or even none at all during the pollution events. Comparing the lidar-derived dust mass concentrations with the calculated dust mass concentrations from FLEXPART, we find a good agreement for the low- and moderate-dust cases, e.g. the Arabian dust event at the beginning of the campaign, or for the moderate Saharan dust event around the 11 April 2017. In contrast, FLEXPART was not able to reproduce the dust mass concentrations for the strong dust events like the Saharan dust event around 21 April 2017, when FLEXPART estimated only about 50 µg m−3 compared to about 170 µg m−3 derived from the lidar measurements. The disagreement is even worse for the strong Arabian dust event at the end of the campaign. The dust mass concentration derived from the lidar measurements shows values as high as 285 µg m−3, while FLEXPART estimates only about 30 µg m−3. The lower values of the dust mass concentration from FLEXPART might result from an assumption of spherical or spheroidal dust particles. The sphericity is supposed to promote gravitational settling and thus leads to an earlier loss of coarse dust particles during transport (Huang et al., 2020).
In a next step, we include the in situ-derived total mass concentration in the comparison. The total mass concentration has in general a better agreement with the lidar-derived dust mass concentration. That confirms the large mass concentration during the strong Saharan dust event around 21 April and the strong Arabian dust event at the end of the campaign that are derived from the lidar measurements. The total mass concentration even exceeds the lidar-derived dust mass concentration for most of those days, especially when the dust mass concentration was large. Also considering the non-dust contribution in the comparison does not result in a significant improvement of the comparison. The lidar-derived optical properties during a dust-dominating day are mainly determined by dust aerosol, while the in situ measurements better characterize the minor contributing aerosol components which are included in the in situ-derived total mass concentration. Further differences occur due to the different averaging time of the lidar and the in situ measurements and thus the sampled volume.
In this study we investigated the optical properties of complex mineral dust and other absorbing aerosol mixtures in the eastern Mediterranean. We found significant lower values of the lidar ratio with means of 41 ± 5 sr at 355 nm and 39 ± 5 sr at 532 nm for Arabian dust transported to our measurement site compared to the lidar ratio found for Saharan dust of 55 ± 8 sr at 355 nm and 54 ± 8 sr at 532 nm. These findings are in good agreement with previous lidar studies (Mamouri et al., 2013; Nisantzi et al., 2015). The PLDR of Arabian dust of 0.26 ± 0.03 at 355 nm and of 0.29 ± 0.02 at 532 nm and of Saharan dust of 0.26 ± 0.03 355 nm and of 0.28 ± 0.02 at 532 nm is similar to what was found for Saharan mineral dust close to the source region (e.g. Tesche et al., 2009b; Freudenthaler et al., 2009; Groß et al., 2011b) and to the values found for transported Saharan dust (e.g. Groß et al., 2015a; Haarig et al., 2017). For pollution aerosol we found mean values of the PLDR and lidar ratio of 0.05 ± 0.02 and 65 ± 12 sr at 355 nm and 0.04 ± 0.02 and 60 ± 16 sr at 532 nm. Those values of the PLDR and the lidar ratio for pollution aerosol confirm the values reported by Groß et al. (2015a) and the papers cited therein.
We compared the findings of the lidar-based classification to aerosol typing based on in situ measurements, sun photometer values, and FLEXPART transport simulations. The different classification schemes showed a very good agreement, although the sun-photometer-based classification can only give a column-integrated value. We frequently found that pollution aerosol was mixed into the dust layers. Nevertheless, the lidar-derived extensive optical properties (i.e. extinction coefficient and backscatter coefficient) were dominated by mineral dust during significant dust events. The derived volume fraction of the dust aerosols partly showed a lower contribution to the total volume compared to its contribution to the optical properties.
The derived dust mass concentration varied strongly throughout the measurement period. The highest values of about 170 µg m−3 and of about 300 µg m−3, derived from lidar, were found during a major Saharan and Arabian dust event, respectively. While the FLEXPART-derived dust mass concentration agreed quite well with the lidar-derived dust mass concentration for low and moderate dust load, FLEXPART could not reflect the high dust concentrations during strong mineral dust events, although it could predict the dust transport in general. Models generally assume that dust aerosols are spherical or spheroidal; this leads to the assumption of more gravitational settling and thus helps to explain the underestimation of coarse dust transport (Huang et al., 2020). In order to improve the confidence in the high dust mass concentration derived from lidar measurements during these events, we compared them to the in situ-derived total mass concentration. During our measurement period we found a general good agreement of the total mass concentration and the lidar-derived dust mass concentration. However, during strong dust events the in situ-derived total mass concentration exceeded the lidar-derived dust mass concentration. The even higher values from the in situ values could result from e.g. both methods sampling a different volume due to time averaging and distance in the measurement location.
The PollyXT lidar data are available at https://polly-tmp.tropos.de/calendar/location/43 (Leibniz Institute for Tropospheric Research, 2025). POLIS lidar data are publicly available via Open Data LMU https://doi.org/10.5282/ubm/data.564, Groß and Freudenthaler, 2025). Airborne in situ data will be made publicly available in the University of Vienna data archive PHAIDRA (https://doi.org/10.25365/phaidra.649, Weinzierl et al., 2025a). Sun photometer measurements are provided by https://aeronet.gsfc.nasa.gov/cgi-bin/data_display_aod_v3?site=CUT-TEPAK&nachal=2&level=2&place_code=10 (AERONET, 2025).
The supplement related to this article is available online at https://doi.org/10.5194/acp-25-3191-2025-supplement.
BW coordinated the A-LIFE project. BW, MD, JG, and MT performed the in situ measurements. BW, MD, JG, MT, and MS analysed the in situ data. AT and PS performed the FLEXPART simulations. SG, VF, and AA performed the lidar measurements. SG and MH analysed the lidar data. CT and DM performed and analysed the sun photometer measurements. REM and AN supported the lidar and sun photometer measurements. SG wrote the manuscript. All authors discussed the data and findings.
The contact author has declared that none of the authors has any competing interests.
Publisher's note: Copernicus Publications remains neutral with regard to jurisdictional claims made in the text, published maps, institutional affiliations, or any other geographical representation in this paper. While Copernicus Publications makes every effort to include appropriate place names, the final responsibility lies with the authors.
The A-LIFE field experiment was mainly funded by an ERC Starting Grant (A-LIFE) with support from the Deutsches Zentrum für Luft- und Raumfahrt (DLR) and the University of Vienna. The lidar measurements were funded by TROPOS, DLR, and Ludwig-Maximilians-Universität München, and the sun photometer measurements were funded by the University of Valladolid. We thank the Flight Experiments Facility for conducting the research flights, and we are grateful to Daniel Sauer (DLR) for helpful comments on the paper. The research has been supported by DLR internal funding within the MABAK (Methoden zur Analyse und Bewertung von Veränderungen der Atmosphäre und des Klimasystems) project.
The A-LIFE project was funded by the European Research Council (ERC) under the European Union's Horizon 2020 research and innovation programme (grant agreement no. 640458, A-LIFE). The A-LIFE field experiment received further funding from the ESA project A-CARE (ESA contract no. 400012581018NLCTgp). Two EUFAR (EUropean Facility for Airborne Research) projects were also clustered with A-LIFE and provided funding for 16 flight hours.
The article processing charges for this open-access publication were covered by the German Aerospace Center (DLR).
This paper was edited by Stelios Kazadzis and reviewed by two anonymous referees.
AERONET: Limassol data, Goddard Space Flight Center, https://aeronet.gsfc.nasa.gov/cgi-bin/data_display_aod_v3?site=CUT-TEPAK&nachal=2&level=2&place_code=10, last access: 14 January 2025.
Adebiyi, A. A., Kok, J. F., Murray, B. J., Ryder, C. L., Stuut, J.-B. W., Kahn, R. A., Knippertz, P., Formenti, P., Mahowald, N. M., Pérez García-Pando, C., Klose, M., Ansmann, A., Samset, B. H., Ito, A., Balkanski, Y., Di Biagio, C., Romanias, M. N., Huang, Y., and Meng, J.: A review of coarse mineral dust in the Earth system, Aeolian Res., 60, 100849, https://doi.org/10.31223/X5QD36, 2023.
Amiridis, V., Balis, D. S., Giannakaki, E., Stohl, A., Kazadzis, S., Koukouli, M. E., and Zanis, P.: Optical characteristics of biomass burning aerosols over Southeastern Europe determined from UV-Raman lidar measurements, Atmos. Chem. Phys., 9, 2431–2440, https://doi.org/10.5194/acp-9-2431-2009, 2009.
Ansmann, A., Riebesell, M., and Weitkamp, C.: Measurement of atmospheric aerosol extinction profiles with a Raman lidar, Opt. Lett., 15, 746–748, 1990.
Ansmann, A., Wandinger, U., Riebesell, M., Weitkamp, C., and Michaelis, W.: Independent measurement of extinction and backscatter profiles in cirrus clouds by using a combined Raman elastic-backscatter lidar, Appl. Optics, 31, 7113–7131, 1992.
Ansmann, A., Bösenberg, J. Chaikovsky, A., Comeron, A., Eckhardt, S., Eixmann, R, Freudenthaler, V., Ginoux, P., Komguem, L., Linne, H., Lopez Marquez M. A., Matthias, V., Mattis, I., Mitev, V., Müller, D., Music, S., Nickovic, S., Pelon, J., Sauvage, L., Sobolewsky, P. Srivastava, M., Stohl, A., Torres, O., Vaughn, G., Wandinger, U., and Wiegner, M.: Long-range transport of Saharan dust to northern Europe: The 11–16 October 2001 outbreak observed with EARLINET, J. Geophys. Res., 108, 4783, https://doi.org/10.1029/2003JD003757, 2003.
Ansmann, A., Petzold, A., Kandler, K., Tegen, I., Manfred, W., Müller, D., Weinzierl, B., Müller, T., and Heintzenberg, J.: Saharan Mineral Dust Experiments SAMUM-1 and SAMUM-2: what have we learned?, Tellus B, 63, 403–429, https://doi.org/10.1111/j.1600-0889.2011.00555.x, 2011.
Ansmann, A., Mamouri, R.-E., Hofer, J., Baars, H., Althausen, D., and Abdullaev, S. F.: Dust mass, cloud condensation nuclei, and ice-nucleating particle profiling with polarization lidar: updated POLIPHON conversion factors from global AERONET analysis, Atmos. Meas. Tech., 12, 4849–4865, https://doi.org/10.5194/amt-12-4849-2019, 2019.
Baars, H., Kanitz, T., Engelmann, R., Althausen, D., Heese, B., Komppula, M., Preißler, J., Tesche, M., Ansmann, A., Wandinger, U., Lim, J.-H., Ahn, J. Y., Stachlewska, I. S., Amiridis, V., Marinou, E., Seifert, P., Hofer, J., Skupin, A., Schneider, F., Bohlmann, S., Foth, A., Bley, S., Pfüller, A., Giannakaki, E., Lihavainen, H., Viisanen, Y., Hooda, R. K., Pereira, S. N., Bortoli, D., Wagner, F., Mattis, I., Janicka, L., Markowicz, K. M., Achtert, P., Artaxo, P., Pauliquevis, T., Souza, R. A. F., Sharma, V. P., van Zyl, P. G., Beukes, J. P., Sun, J., Rohwer, E. G., Deng, R., Mamouri, R.-E., and Zamorano, F.: An overview of the first decade of PollyNET: an emerging network of automated Raman-polarization lidars for continuous aerosol profiling, Atmos. Chem. Phys., 16, 5111–5137, https://doi.org/10.5194/acp-16-5111-2016, 2016.
Baars, H., Radenz, M., Floutsi, A. A., Engelmann, R., Althausen, D., Heese, B., Ansmann, A., Fament, T., Dabas, A., Trapon, D., Reitebuch, O., Bley, S., and Wandinger, U.: Californian wildfire smoke over Europe: A first example of the aerosol observing capabilities of Aeolus compared to ground-based lidar, Geophys. Res. Lett., 48, e2020GL092194, https://doi.org/10.1029/2020GL092194, 2021.
Bender, F. A.-M.: Aerosol forcing: Still uncertain, still relevant, AGU Advances, 1, e2019AV000128, https://doi.org/10.1029/2019AV000128, 2020.
Binietoglou, I., Basart, S., Alados-Arboledas, L., Amiridis, V., Argyrouli, A., Baars, H., Baldasano, J. M., Balis, D., Belegante, L., Bravo-Aranda, J. A., Burlizzi, P., Carrasco, V., Chaikovsky, A., Comerón, A., D'Amico, G., Filioglou, M., Granados-Muñoz, M. J., Guerrero-Rascado, J. L., Ilic, L., Kokkalis, P., Maurizi, A., Mona, L., Monti, F., Muñoz-Porcar, C., Nicolae, D., Papayannis, A., Pappalardo, G., Pejanovic, G., Pereira, S. N., Perrone, M. R., Pietruczuk, A., Posyniak, M., Rocadenbosch, F., Rodríguez-Gómez, A., Sicard, M., Siomos, N., Szkop, A., Terradellas, E., Tsekeri, A., Vukovic, A., Wandinger, U., and Wagner, J.: A methodology for investigating dust model performance using synergistic EARLINET/AERONET dust concentration retrievals, Atmos. Meas. Tech., 8, 3577–3600, https://doi.org/10.5194/amt-8-3577-2015, 2015.
Boucher, O., Randall, D., Artaxo, P., Bretherton, C., Feingold, G., Forster, P., Keminen, V.-M., Kondo, Y., Liao, H., Lohmann, U., Rasch, P., Satheesh, S., Sherwood, S., Stevens, B., and Zhang, X. Y.: Clouds and Aerosols, in: Climate Change 2013: The Physical Science Basis. Contribution of Working Group I to the Fifth Assessment Report of the Intergovernmental Panel on Climate Change, Cambridge University Press, 571–657, https://doi.org/10.1017/CBO9781107415324, 2013.
Bravo-Aranda, J. A., Titos, G., Granados-Muñoz, M. J., GuerreroRascado, J. L., Navas-Guzmán, F., Valenzuela, A., Lyamani, H., Olmo, F. J., Andrey, J., and Alados-Arboledas, L.: Study of mineral dust entrainment in the planetary boundary layer by lidar depolarisation technique, Tellus B, 67, 26180, https://doi.org/10.3402/tellusb.v67.26180, 2015.
Burton, S. P., Ferrare, R. A., Hostetler, C. A., Hair, J. W., Rogers, R. R., Obland, M. D., Butler, C. F., Cook, A. L., Harper, D. B., and Froyd, K. D.: Aerosol classification using airborne High Spectral Resolution Lidar measurements – methodology and examples, Atmos. Meas. Tech., 5, 73–98, https://doi.org/10.5194/amt-5-73-2012, 2012.
Cachorro, V. E., Toledano, C., Prats, N., Sorribas, M., Mogo, S., Berjón, A., Torres, B., Rodrigo, R., De La Rosa, J., and De Frutos, A. M.: The strongest desert dust intrusion mixed with smoke over the Iberian Peninsula registered with Sun photometry, J. Geophys. Res.-Atmos., 113, 1–19, https://doi.org/10.1029/2007JD009582, 2008.
Draxler, R. R. and Rolph, G. D.: HYSPLIT (HYbrid Single Particle Lagrangian Integrated Trajectory) Model, NOAA Air Resources Laboratory, Silver Spring, MD, https://www.ready.noaa.gov/HYSPLIT.php (last access: 4 December 2024), 2012.
Dubovik, O. and King, M. D.: A flexible inversion algorithm for retrieval of aerosol optical properties from Sun and sky radiance measurements, J. Geophys. Res., 105, 20673–20696, https://doi.org/10.1029/2000JD900282, 2000.
Dubovik, O., Sinyuk, A., Lapyonok, T., Holben, B. N., Mishchenko, M., Yang, P., Eck, T. F., Volten, H., Munoz, O., Veihelmann, B., van der Zande, W., J., Leon, J.-F., Sorokin, M., and Slutsker, I.: Application of spheroid models to account for aerosol particle nonsphericity in remote sensing of desert dust, J. Geophys. Res., 111, D11208, https://doi.org/10.1029/2005JD006619, 2006.
Engelmann, R., Kanitz, T., Baars, H., Heese, B., Althausen, D., Skupin, A., Wandinger, U., Komppula, M., Stachlewska, I. S., Amiridis, V., Marinou, E., Mattis, I., Linné, H., and Ansmann, A.: The automated multiwavelength Raman polarization and water-vapor lidar PollyXT: the neXT generation, Atmos. Meas. Tech., 9, 1767–1784, https://doi.org/10.5194/amt-9-1767-2016, 2016.
Fernald, F. G.: Analysis of atmospheric lidar observations: some comments, Appl. Optics, 23, 652–653, 1984.
Filioglou, M., Giannakaki, E., Backman, J., Kesti, J., Hirsikko, A., Engelmann, R., O'Connor, E., Leskinen, J. T. T., Shang, X., Korhonen, H., Lihavainen, H., Romakkaniemi, S., and Komppula, M.: Optical and geometrical aerosol particle properties over the United Arab Emirates, Atmos. Chem. Phys., 20, 8909–8922, https://doi.org/10.5194/acp-20-8909-2020, 2020.
Floutsi, A. A., Baars, H., Engelmann, R., Althausen, D., Ansmann, A., Bohlmann, S., Heese, B., Hofer, J., Kanitz, T., Haarig, M., Ohneiser, K., Radenz, M., Seifert, P., Skupin, A., Yin, Z., Abdullaev, S. F., Komppula, M., Filioglou, M., Giannakaki, E., Stachlewska, I. S., Janicka, L., Bortoli, D., Marinou, E., Amiridis, V., Gialitaki, A., Mamouri, R.-E., Barja, B., and Wandinger, U.: DeLiAn – a growing collection of depolarization ratio, lidar ratio and Ångström exponent for different aerosol types and mixtures from ground-based lidar observations, Atmos. Meas. Tech., 16, 2353–2379, https://doi.org/10.5194/amt-16-2353-2023, 2023.
Floutsi, A. A., Baars, H., and Wandinger, U.: HETEAC-Flex: an optimal estimation method for aerosol typing based on lidar-derived intensive optical properties, Atmos. Meas. Tech., 17, 693–714, https://doi.org/10.5194/amt-17-693-2024, 2024.
Forster, P., Ramaswamy, V., Artaxo, P., Berntsen, T., Betts, R., Fahey, D. W., Haywood, J., Lean, J., Lowe, D. C., Myhre, G. Nganga, J., Prinn, R., Raga, G., Schulz, M., and Van Dorland, R.: Changes in atmospheric constituents and in radiative forcing, Climate Change 2007: The Physical Science Basis. Contribution of Working Group I to the Fourth Assessment Report of the Inter-governmental Panel on Climate Change, Cambridge University Press, 210–215, ISBN 978-0521-70596-7, 2007.
Freudenthaler, V.: About the effects of polarising optics on lidar signals and the Δ90 calibration, Atmos. Meas. Tech., 9, 4181–4255, https://doi.org/10.5194/amt-9-4181-2016, 2016.
Freudenthaler, V., Esselborn, M., Wiegner, M., Heese, B., Tesche, M., Ansmann, A., Müller, D., Althausen, D., Wirth, W., Fix, A., Ehret, G., Knippertz, P., Toledano, C., Gasteiger, J., Garhammer, M., and Seefeldner, M.: Depolarization ratio profiling at several wavelengths in pure Saharan dust during SAMUM 2006, Tellus B, 61, 165–179, https://doi.org/10.1111/j.1600-0889.2008.00396.x, 2009.
Freudenthaler, V., Seefeldner, M., Groß, S., and Wandinger, U.: Accuracy of linear depolarization ratios in clean air ranges measured with POLIS-6 at 355 and 532 nm, EPJ Web Conf., 119, 25013, https://doi.org/10.1051/epjconf/201611925013, 2016.
Gasteiger, J., Wiegner, M., Groß, S., Freudenthaler, V., Toledano, C., Tesche, M., and Kandler, K.: Modeling lidar-relevant optical properties of complex mineral dust aerosols, Tellus B, 63, 725–741, https://doi.org/10.1111/j.1600-0889.2011.00559.x, 2011.
Giles, D. M., Sinyuk, A., Sorokin, M. G., Schafer, J. S., Smirnov, A., Slutsker, I., Eck, T. F., Holben, B. N., Lewis, J. R., Campbell, J. R., Welton, E. J., Korkin, S. V., and Lyapustin, A. I.: Advancements in the Aerosol Robotic Network (AERONET) Version 3 database – automated near-real-time quality control algorithm with improved cloud screening for Sun photometer aerosol optical depth (AOD) measurements, Atmos. Meas. Tech., 12, 169–209, https://doi.org/10.5194/amt-12-169-2019, 2019.
Groß, S. and Freudenthaler, V.: POLIS lidar data for S. Groß et al.: Polarization lidar measurements during A-LIFE, ACP, 2025, Open Data LMU [data set], https://doi.org/10.5282/ubm/data.564, 2025.
Groß, S., Gasteiger, J., Freudenthaler, V., Wiegner, M., Geiß, A., Schladitz, A., Toledano, C., Kandler, K., Tesche, M., Ansmann, A., and Wiedensohler, A.: Characterization of the planetary boundary layer during SAMUM-2 by means of lidar measurements, Tellus B, 63, 695–705, https://doi.org/10.1111/j.1600-0889.2011.00557.x, 2011a.
Groß, S., Tesche, M., Freudenthaler, V., Toledano, C., Wiegner, M., Ansmann, A., Althausen D., and Seefeldner, M.: Characterization of Saharan dust, marine aerosols and mixtures of biomass-burning aerosols and dust by means of multi-wavelength depolarization and Raman lidar measurements during SAMUM 2, Tellus B, 63, 706–724, https://doi.org/10.1111/j.1600-0889.2011.00556.x, 2011b.
Groß, S., Wiegner, M., Freudenthaler, V., and Toledano, C.: Lidar ratio of Saharan dust over Cape Verde Islands: Assessment and error calculation, J. Geophys. Res.-Atmos., 116, D15203, https://doi.org/10.1029/2010JD015435, 2011c.
Groß, S., Esselborn, M., Abicht, F., Wirth, M., Fix, A., and Minikin, A.: Airborne high spectral resolution lidar observation of pollution aerosol during EUCAARI-LONGREX, Atmos. Chem. Phys., 13, 2435–2444, https://doi.org/10.5194/acp-13-2435-2013, 2013a.
Groß, S., Esselborn, M., Weinzierl, B., Wirth, M., Fix, A., and Petzold, A.: Aerosol classification by airborne high spectral resolution lidar observations, Atmos. Chem. Phys., 13, 2487–2505, https://doi.org/10.5194/acp-13-2487-2013, 2013b.
Groß, S., Freudenthaler, V., Schepanski, K., Toledano, C., Schäfler, A., Ansmann, A., and Weinzierl, B.: Optical properties of long-range transported Saharan dust over Barbados as measured by dual-wavelength depolarization Raman lidar measurements, Atmos. Chem. Phys., 15, 11067–11080, https://doi.org/10.5194/acp-15-11067-2015, 2015a.
Groß, S., Freudenthaler, V., Wirth, M., and Weinzierl, B.: Towards an aerosol classification scheme for future EarthCARE lidar observations and implications for research needs, Atmos. Sci. Lett., 16, 77–82, https://doi.org/10.1002/asl2.524, 2015b.
Groß, S., Gasteiger, J., Freudenthaler, V., Müller, T., Sauer, D., Toledano, C., and Ansmann, A.: Saharan dust contribution to the Caribbean summertime boundary layer – a lidar study during SALTRACE, Atmos. Chem. Phys., 16, 11535–11546, https://doi.org/10.5194/acp-16-11535-2016, 2016.
Gutleben, M., Groß, S., Wirth, M., Emde, C., and Mayer, B.: Impacts of water vapor on Saharan air layer radiative heating, Geophys. Res. Lett., 46, 14854–14862, 2019.
Gutleben, M., Groß, S., Wirth, M., and Mayer, B.: Radiative effects of long-range-transported Saharan air layers as determined from airborne lidar measurements, Atmos. Chem. Phys., 20, 12313–12327, https://doi.org/10.5194/acp-20-12313-2020, 2020.
Haarig, M., Ansmann, A., Althausen, D., Klepel, A., Groß, S., Freudenthaler, V., Toledano, C., Mamouri, R.-E., Farrell, D. A., Prescod, D. A., Marinou, E., Burton, S. P., Gasteiger, J., Engelmann, R., and Baars, H.: Triple-wavelength depolarization-ratio profiling of Saharan dust over Barbados during SALTRACE in 2013 and 2014, Atmos. Chem. Phys., 17, 10767–10794, https://doi.org/10.5194/acp-17-10767-2017, 2017.
Haarig, M., Walser, A., Ansmann, A., Dollner, M., Althausen, D., Sauer, D., Farrell, D., and Weinzierl, B.: Profiles of cloud condensation nuclei, dust mass concentration, and ice-nucleating-particle-relevant aerosol properties in the Saharan Air Layer over Barbados from polarization lidar and airborne in situ measurements, Atmos. Chem. Phys., 19, 13773–13788, https://doi.org/10.5194/acp-19-13773-2019, 2019.
Haarig, M., Ansmann, A., Engelmann, R., Baars, H., Toledano, C., Torres, B., Althausen, D., Radenz, M., and Wandinger, U.: First triple-wavelength lidar observations of depolarization and extinction-to-backscatter ratios of Saharan dust, Atmos. Chem. Phys., 22, 355–369, https://doi.org/10.5194/acp-22-355-2022, 2022.
Haywood, J. and Boucher, O.: Estimates of the direct and indirect radiative forcing due to tropospheric aerosols: a review, Rev. Geophys., 38, 513–543, 2000.
Hofer, J., Althausen, D., Abdullaev, S. F., Makhmudov, A. N., Nazarov, B. I., Schettler, G., Engelmann, R., Baars, H., Fomba, K. W., Müller, K., Heinold, B., Kandler, K., and Ansmann, A.: Long-term profiling of mineral dust and pollution aerosol with multiwavelength polarization Raman lidar at the Central Asian site of Dushanbe, Tajikistan: case studies, Atmos. Chem. Phys., 17, 14559–14577, https://doi.org/10.5194/acp-17-14559-2017, 2017.
Hofer, J., Ansmann, A., Althausen, D., Engelmann, R., Baars, H., Fomba, K. W., Wandinger, U., Abdullaev, S. F., and Makhmudov, A. N.: Optical properties of Central Asian aerosol relevant for spaceborne lidar applications and aerosol typing at 355 and 532 nm, Atmos. Chem. Phys., 20, 9265–9280, https://doi.org/10.5194/acp-20-9265-2020, 2020.
Holben, B. N., Eck, T. F., Slutsker, I., Tanré, D., Buis, J. P., Setzer, A., Vermote, E., Reagan, J. A., Kaufman, Y. J., Nakajima, T., Lavenu, F., Jankowiak, I., and Smirnov, A.: AERONET – A Federated Instrument Network and Data Archive for Aerosol Characterization, Remote Sens. Environ., 66, 1–16, https://doi.org/10.1016/S0034-4257(98)00031-5, 1998.
Hu, Q., Wang, H., Goloub, P., Li, Z., Veselovskii, I., Podvin, T., Li, K., and Korenskiy, M.: The characterization of Taklamakan dust properties using a multiwavelength Raman polarization lidar in Kashi, China, Atmos. Chem. Phys., 20, 13817–13834, https://doi.org/10.5194/acp-20-13817-2020, 2020.
Huang, Y., Kok, J. F., Kandler, K., Lindqvist, H., Nousiainen, T., Sakai, T., Adebiyi, A., and Jokinen, O.: Climate models and remote sensing retrievals neglect substantial desert dust asphericity, Geophys. Res. Lett., 47, e2019GL086592, https://doi.org/10.1029/2019GL086592, 2020.
Kaaden, N., Massling, A., Schladitz, A., Müller, T., Kandler, K., Schütz, L., Weinzierl, B., Petzold, A., Tesche, M., Leinert, S., Deutscher, C., Ebert, M., Weinbruch, S., and Wiedensohler, A.: State of mixing, shape factor, number size distribution, and hygroscopic growth of the Saharan anthropogenic and mineral dust aerosol at Tinfou, Morocco, Tellus B, 61, 51–63, https://doi.org/10.1111/j.1600-0889.2008.00388.x, 2009.
Kandler, K., Schütz, L., Deutscher, C., Ebert, M., Hofmann, H., Jäckel, S., Jaenicke, R., Knipperts, P., Lieke, K., Massling, A., Petzold, A., Schladitz, A., Weinzierl, B., Wiedensohler, A., Zorn, S., and Weinbruch, S.: Size distribution, mass concentration, chemical and mineralogical composition and derived optical parameters of the boundary layer aerosol at Tinfou, Morocco, during SAMUM 2006, Tellus B, 61, 32–50, https://doi.org/10.1111/j.1600-0889.2008.00385.x, 2009.
Klett, J. D.: Lidar inversion with variable backscatter/extinction ratios, Appl. Optics, 24, 1638–1643, 1985.
Kok, J. F., Ward, D. S., Mahowald, N. M., and Evan, A. T.: Global and regional importance of the direct dust-climate feedback, Nat. Commun., 9, 241, https://doi.org/10.1038/s41467-017-02620-y, 2018.
Kumar, P., Sokolik, I. N., and Nenes, A.: Measurements of cloud condensation nuclei activity and droplet activation kinetics of fresh unprocessed regional dust samples and minerals, Atmos. Chem. Phys., 11, 3527–3541, https://doi.org/10.5194/acp-11-3527-2011, 2011.
Leibniz Institute for Tropospheric Research (TROPOS): Observation calendar: Limsassol data, TROPOS, https://polly-tmp.tropos.de/calendar/location/43, last access: 14 January 2025.
Lieke, K., Kandler, K., Scheuvens, D., Emmel, C., von Glahn, C., Petzold, A., Weinzierl, B., Veira, A., Ebert, M., Weinbruch, S., and Schütz, L.: Particle chemical properties in the vertical column based on aircraft observations in the vicinity of Cape Verde islands, Tellus B, 63, 497–511, https://doi.org/10.1111/j.1600-0889.2011.00553.x, 2011.
Mamouri, R.-E. and Ansmann, A.: Potential of polarization lidar to provide profiles of CCN- and INP-relevant aerosol parameters, Atmos. Chem. Phys., 16, 5905–5931, https://doi.org/10.5194/acp-16-5905-2016, 2016.
Mamouri, R.-E. and Ansmann, A.: Potential of polarization/Raman lidar to separate fine dust, coarse dust, maritime, and anthropogenic aerosol profiles, Atmos. Meas. Tech., 10, 3403–3427, https://doi.org/10.5194/amt-10-3403-2017, 2017.
Mamouri, R. E., Ansmann, A., Nisantzi, A., Kokkalis, P., Schwarz, A., and Hadjimitsis, D.: Low Arabian dust extinction-to-backscatter ratio, Geophys. Res. Lett., 40, 4762–4766, https://doi.org/10.1002/grl.50898, 2013.
Marinou, E., Tesche, M., Nenes, A., Ansmann, A., Schrod, J., Mamali, D., Tsekeri, A., Pikridas, M., Baars, H., Engelmann, R., Voudouri, K.-A., Solomos, S., Sciare, J., Groß, S., Ewald, F., and Amiridis, V.: Retrieval of ice-nucleating particle concentrations from lidar observations and comparison with UAV in situ measurements, Atmos. Chem. Phys., 19, 11315–11342, https://doi.org/10.5194/acp-19-11315-2019, 2019.
Mateos, D., Toledano, C., Herreras, M., Calle, A., Gross, S., Mammouri, R., Weinzierl, B., González, R., Román, R., González-Fernández, D., Herrero, S., Antuña, J. C., Cachorro, V. E., and de Frutos, A. M.: Saharan and Arabian dust optical properties from Sun photometer measurements during A-LIFE experiment, Atmos. Chem. Phys., in preparation, 2025.
Meteorologisches Institut München (MIM): POLIS lidar data, MIM, https://www.meteo.physik.uni-muenchen.de/~stlidar/quicklooks/mim_quicklooks.html, last access: 14 January 2025.
Mona, L., Papagiannopoulos, N., Basart, S., Baldasano, J., Binietoglou, I., Cornacchia, C., and Pappalardo, G.: EARLINET dust observations vs. BSC-DREAM8b modeled profiles: 12 year-long systematic comparison at Potenza, Italy, Atmos. Chem. Phys., 14, 8781–8793, https://doi.org/10.5194/acp-14-8781-2014, 2014.
Navas-Guzmán, F., Bravo-Aranda, J. A., Guerrero-Rascado, J. L., Granados-Muñoz, M. J., and Alados-Arboledas, L.: Statistical analysis of aerosol optical properties retrieved by Raman lidar over Southeastern Spain, Tellus B, 65, 21234, https://doi.org/10.3402/tellusb.v65i0.21234, 2013.
Nicolae, D., Vasilescu, J., Talianu, C., Binietoglou, I., Nicolae, V., Andrei, S., and Antonescu, B.: A neural network aerosol-typing algorithm based on lidar data, Atmos. Chem. Phys., 18, 14511–14537, https://doi.org/10.5194/acp-18-14511-2018, 2018.
Nisantzi, A., Mamouri, R. E., Ansmann, A., Schuster, G. L., and Hadjimitsis, D. G.: Middle East versus Saharan dust extinction-to-backscatter ratios, Atmos. Chem. Phys., 15, 7071–7084, https://doi.org/10.5194/acp-15-7071-2015, 2015.
Ohneiser, K., Ansmann, A., Baars, H., Seifert, P., Barja, B., Jimenez, C., Radenz, M., Teisseire, A., Floutsi, A., Haarig, M., Foth, A., Chudnovsky, A., Engelmann, R., Zamorano, F., Bühl, J., and Wandinger, U.: Smoke of extreme Australian bushfires observed in the stratosphere over Punta Arenas, Chile, in January 2020: optical thickness, lidar ratios, and depolarization ratios at 355 and 532 nm, Atmos. Chem. Phys., 20, 8003–8015, https://doi.org/10.5194/acp-20-8003-2020, 2020.
Papayannis, A., Mamouri, R. E., Amiridis, V., Kazadzis, S., Pérez, C., Tsaknakis, G., Kokkalis, P., and Baldasano, J. M.: Systematic lidar observations of Saharan dust layers over Athens, Greece in the frame of EARLINET project (2004–2006), Ann. Geophys., 27, 3611–3620, https://doi.org/10.5194/angeo-27-3611-2009, 2009.
Pappalardo, G., Amodeo, A., Apituley, A., Comeron, A., Freudenthaler, V., Linné, H., Ansmann, A., Bösenberg, J., D'Amico, G., Mattis, I., Mona, L., Wandinger, U., Amiridis, V., Alados-Arboledas, L., Nicolae, D., and Wiegner, M.: EARLINET: towards an advanced sustainable European aerosol lidar network, Atmos. Meas. Tech., 7, 2389–2409, https://doi.org/10.5194/amt-7-2389-2014, 2014.
Petzold, A., Veira, A., Mund, S., Esselborn, M., Kiemle, C., Weinzierl, B., Hamburger, T., Ehret, G., Lieke, K., and Kandler, K.: Mixing of mineral dust with urban pollution aerosol over Dakar (Senegal): impact on dust physico-chemical and radiative properties, Tellus B, 63, 619–634, https://doi.org/10.1111/j.1600-0889.2011.00547.x, 2011.
Reid, J. S., Kinney, J. E., Westphal, D. L., Holben, B. N., Welton, E. J., Tsay, S.-C, Eleuterio, D. P., Campbell, J. R., Christopher, S. A., Colarco, P. R., Jonsson, H. H., Livingston J. M., Maring, H. B., Meier, M. L., Pilewskie, P., Prospero, J. M., Reid, E. A., Remer, L. A., Russell, P. B., Savoie, D. L., Smirnov, A., and Tanré, D.: Analysis of measurements of Saharan dust by airborne and ground-based remote sensing methods during the Puerto Rico Dust Experiment (PRIDE), J. Geophys. Res., 108, 8586, https://doi.org/10.1029/2002JD002493, 2003.
Ryder, C. L., Highwood, E. J., Rosenberg, P. D., Trembath, J., Brooke, J. K., Bart, M., Dean, A., Crosier, J., Dorsey, J., Brindley, H., Banks, J., Marsham, J. H., McQuaid, J. B., Sodemann, H., and Washington, R.: Optical properties of Saharan dust aerosol and contribution from the coarse mode as measured during the Fennec 2011 aircraft campaign, Atmos. Chem. Phys., 13, 303–325, https://doi.org/10.5194/acp-13-303-2013, 2013.
Saito, M., Yang, P., Ding, J., and Liu, X.: A Comprehensive Database of the Optical Properties of Irregular Aerosol Particles for Radiative Transfer Simulations, J. Atmos. Sci., 78, 2089–2111, 2021.
Schöberl, M., Dollner, M., Gasteiger, J., Seibert, P., Tipka, A., and Weinzierl, B.: Characterization of the airborne aerosol inlet and transport system used during the A-LIFE aircraft field experiment, Atmos. Meas. Tech., 17, 2761–2776, https://doi.org/10.5194/amt-17-2761-2024, 2024.
Schuster, G. L., Vaughan, M., MacDonnell, D., Su, W., Winker, D., Dubovik, O., Lapyonok, T., and Trepte, C.: Comparison of CALIPSO aerosol optical depth retrievals to AERONET measurements, and a climatology for the lidar ratio of dust, Atmos. Chem. Phys., 12, 7431–7452, https://doi.org/10.5194/acp-12-7431-2012, 2012.
Seibert, P. and Frank, A.: Source-receptor matrix calculation with a Lagrangian particle dispersion model in backward mode, Atmos. Chem. Phys., 4, 51–63, https://doi.org/10.5194/acp-4-51-2004, 2004.
Soupiona, O., Papayannis, A., Kokkalis, P., Foskinis, R., Sánchez Hernández, G., Ortiz-Amezcua, P., Mylonaki, M., Papanikolaou, C.-A., Papagiannopoulos, N., Samaras, S., Groß, S., Mamouri, R.-E., Alados-Arboledas, L., Amodeo, A., and Psiloglou, B.: EARLINET observations of Saharan dust intrusions over the northern Mediterranean region (2014–2017): properties and impact on radiative forcing, Atmos. Chem. Phys., 20, 15147–15166, https://doi.org/10.5194/acp-20-15147-2020, 2020.
Stohl, A., Hittenberger, M., and Wotawa, G.: Validation of the lagrangian particle dispersion model FLEXPART against large-scale tracer experiment data, Atmos. Environ., 32, 24, https://doi.org/10.1016/S1352-2310(98)00184-8, 1998.
Stohl, A., Forster, C., Frank, A., Seibert, P., and Wotawa, G.: Technical note: The Lagrangian particle dispersion model FLEXPART version 6.2, Atmos. Chem. Phys., 5, 2461–2474, https://doi.org/10.5194/acp-5-2461-2005, 2005.
Talianu, C., Nemuc, A., Nicolae, D., and Cristescu, C. P.: Dust Event Detection from Lidar Measurements, U. Politeh. Buch. Ser. A, 69, 53–66, 2007.
Tanré, D., Haywood, J., Pelon, J., Léon, J. F., Chatenet, B., Formenti, P., Francis, P., Goloub, P., and Myhre, G.: Measurement and modeling of the Saharan dust radiative impact: Overview of the Saharan Dust Experiment (SHADE), J. Geophys. Res.-Atmos., 108, 8574, https://doi.org/10.1029/2002JD003273, 2003.
Teri, M., Müller, T., Gasteiger, J., Valentini, S., Horvath, H., Vecchi, R., Bauer, P., Walser, A., and Weinzierl, B.: Impact of particle size, refractive index, and shape on the determination of the particle scattering coefficient – an optical closure study evaluating different nephelometer angular truncation and illumination corrections, Atmos. Meas. Tech., 15, 3161–3187, https://doi.org/10.5194/amt-15-3161-2022, 2022.
Teri, M., Gasteiger, J., Heimerl, K., Dollner, M., Schöberl, M., Seibert, P., Tipka, A., Müller, T., Aryasree, S., Kandler, K., and Weinzierl, B.: Pollution affects Arabian and Saharan dust optical properties in the Eastern Mediterranean, EGUsphere [preprint], https://doi.org/10.5194/egusphere-2024-701, 2024.
Tesche, M., Ansmann, A., Müller, D., Althausen, D., Engelmann, R., Freudenthaler, V., and Groß, S.: Vertically resolved separation of dust and smoke over Cape Verde using multiwavelength Raman and polarization lidars during Saharan Mineral Dust Experiment 2008, J. Geophys. Res.-Atmos., 114, D13202, https://doi.org/10.1029/2009JD011862, 2009a.
Tesche, M., Ansmann, A., Müller, D., Althausen, D., Mattis, I., Heese, B., Freudenthaler, F., Wiegern, M., Esselborn, M., Pisani, G., and Knipperts, P.: Vertical profiling of Saharan dust with Raman lidars and airborne HSRL in southern Morocco during SAMUM, Tellus B, 61, 144–164, https://doi.org/10.1111/j.1600-0889.2008.00390.x, 2009b.
Toledano, C., Wiegner, M., Garhammer, M., Seefeldner, M., Gasteiger, J., Müller, D., and Koepke, P.: Spectral aerosol optical depth characterization of desert dust during SAMUM 2006, Tellus B, 61, 216–228, https://doi.org/10.1111/j.1600-0889.2008.00382.x, 2009.
Toledano, C., Wiegner, M., Groß, S., Freudenthaler, V., Gasteiger, J., Müller, D., Schladitz, A., Weinzierl, B., Torres, B., and O'neill, N. T.: Optical properties of aerosol mixtures derived from sun-sky radiometry during SAMUM-2, Tellus B, 63, 635–648, https://doi.org/10.1111/j.1600-0889.2011.00573.x, 2011.
Toledano, C., Torres, B., Velasco-Merino, C., Althausen, D., Groß, S., Wiegner, M., Weinzierl, B., Gasteiger, J., Ansmann, A., González, R., Mateos, D., Farrel, D., Müller, T., Haarig, M., and Cachorro, V. E.: Sun photometer retrievals of Saharan dust properties over Barbados during SALTRACE, Atmos. Chem. Phys., 19, 14571–14583, https://doi.org/10.5194/acp-19-14571-2019, 2019.
Wagner, F., Bortoli, D., Pereira, S., João Costa, M., Silva, A. M., Weinzierl, B., Esselborn, M., Petzold, A., Rasp, K., Heinold, B., and Tegen, I.: Properties of dust aerosol particles transported to Portugal from the Sahara desert, Tellus B, 61, 297–306, https://doi.org/10.1111/j.1600-0889.2008.00393.x, 2009.
Wandinger, U., Floutsi, A. A., Baars, H., Haarig, M., Ansmann, A., Hünerbein, A., Docter, N., Donovan, D., van Zadelhoff, G.-J., Mason, S., and Cole, J.: HETEAC – the Hybrid End-To-End Aerosol Classification model for EarthCARE, Atmos. Meas. Tech., 16, 2485–2510, https://doi.org/10.5194/amt-16-2485-2023, 2023.
Weinzierl, B., Sauer, D., Esselborn, M., Petzold, A., Mund, S., Veira, A., Tesche, M., Ansmann, A., and Wirth, M.: Airborne observations of microphysical and optical properties of dust and biomass burning aerosol layers in the Cape Verde region during SAMUM 2008, Tellus B, 63, 589–618, https://doi.org/10.1111/j.1600-0889.2011.00566.x, 2011.
Weinzierl, B., Ansmann, A., Prospero, J. M., Althausen, D., Benker, N., Chouza, F., Dollner, M., Farrell, D., Fomba, W. K., Freudenthaler, V., Gasteiger, J., Groß, S., Haarig, M., Heinold, B., Kandler, K., Kristensen, T. B., Mayol-Bracero, O. L., Müller, T., Reitebuch, O., Sauer, D., Schäfler, A., Schepanski, K., Spanu, A., Tegen, I., Toledano, C., and Walser, A.: The Saharan Aerosol Long-Range Transport and Aerosol–Cloud-Interaction Experiment: Overview and Selected Highlights, B. Am. Meteorol. Soc., 98, 1427–1451, https://doi.org/10.1175/BAMS-D-15-00142.1, 2017.
Weinzierl, B., Dollner, M., Gasteiger, J., Schöberl, M., Seibert, P., Teri, M., and Tipka, A.: In situ data of the publication Characterization of aerosol over the Eastern Mediterranean by polarization sensitive Raman lidar measurements during A-LIFE aerosol type classification and type separation, Universität Wien [data set], https://doi.org/10.25365/phaidra.649, 2025a.
Weinzierl, B., Dollner, M., Gasteiger, J., Teri, M., Schöberl, M., Heimerl, K., Kupc, A., Tipka, A., Seibert, P., Huntrieser, H., Wagner, R., Kandler, K., Sudharaj, A., Müller, T., Brilke, S., Fölker, N., Sauer, D., Reitebuch, O., Groß, S., Freudenthaler, V., Toledano, C., Haarig, M., Mamouri, R., Amiridis, V., Ansmann, A., and the A-LIFE Science Team: Mineral dust mixtures in the Eastern Mediterranean: overview and selected highlights of the A-LIFE aircraft field experiment, in preparation, 2025b.
Wiegner, M., Groß, S., Freudenthaler, V., Schnell, F., and Gasteiger, J.: The May/June 2008 Saharan dust event over Munich: Intensive aerosol parameters from lidar measurements, J. Geophys. Res.-Atmos., 116, 1984–2012, 2011.