the Creative Commons Attribution 4.0 License.
the Creative Commons Attribution 4.0 License.
 | 11 Mar 2025
Lightning declines over shipping lanes following regulation of fuel sulfur emissions
Chris J. Wright
Joel A. Thornton
Lyatt Jaeglé
Yannian Zhu
Randall Jones II
Robert Holzworth
Daniel Rosenfeld
Robert Wood
Peter Blossey
Daehyun Kim
Aerosol interactions with clouds represent a significant uncertainty in our understanding of the Earth system. Deep convective clouds may respond to aerosol perturbations in several ways that have proven difficult to elucidate with observations. Here, we leverage the two busiest maritime shipping lanes in the world, which emit aerosol particles and their precursors into an otherwise relatively clean tropical marine boundary layer, to make headway on the influence of aerosol on deep convective clouds. The recent 7-fold change in allowable fuel sulfur by the International Maritime Organization allows us to test the sensitivity of the lightning to changes in ship plume aerosol number-size distributions. We find that, across a range of atmospheric thermodynamic conditions, the previously documented enhancement of lightning over the shipping lanes has fallen by over 40 %. The enhancement is therefore at least partially aerosol-mediated, a conclusion that is supported by observations of droplet number at cloud base, which show a similar decline over the shipping lane. These results have fundamental implications for our understanding of aerosol–cloud interactions, suggesting that deep convective clouds are impacted by the aerosol number distribution in the remote marine environment.
- Article
(2831 KB) - Full-text XML
-
Supplement
(3041 KB) - BibTeX
- EndNote


By acting as cloud condensation nuclei (CCN), aerosol particles influence clouds and, in turn, the Earth's energy balance. Aerosol–cloud interactions represent a significant uncertainty in our understanding of the Earth's climate (Boucher et al., 2013). Maritime ship traffic leads to the emission of aerosol particles and associated precursors into relatively clean marine air. These emissions enable the study of how increased CCN perturb low-level marine stratus cloud droplet number distributions and related cloud macrophysical properties, such as cloud albedo and lifetime.(Diamond et al., 2020; Yuan et al., 2022; Durkee et al., 2000; Radke et al., 1989).
Deep convective cloud (DCC) systems occur throughout the tropics and are essential to the Earth's water and energy cycles (Feng et al., 2021). However, there is little consensus on the mechanisms or magnitudes of aerosol particle impacts on DCCs (Tao et al., 2012; Seinfeld et al., 2016; Igel and van den Heever, 2021; Varble et al., 2023; Williams et al., 2002). Thornton et al. (2017) documented a potential case of persistent maritime aerosol–DCC interactions analogous to stratocumulus ship tracks, with the discovery of enhancements in lightning over major shipping lanes passing through the Indian Ocean and South China Sea (Fig. 1).
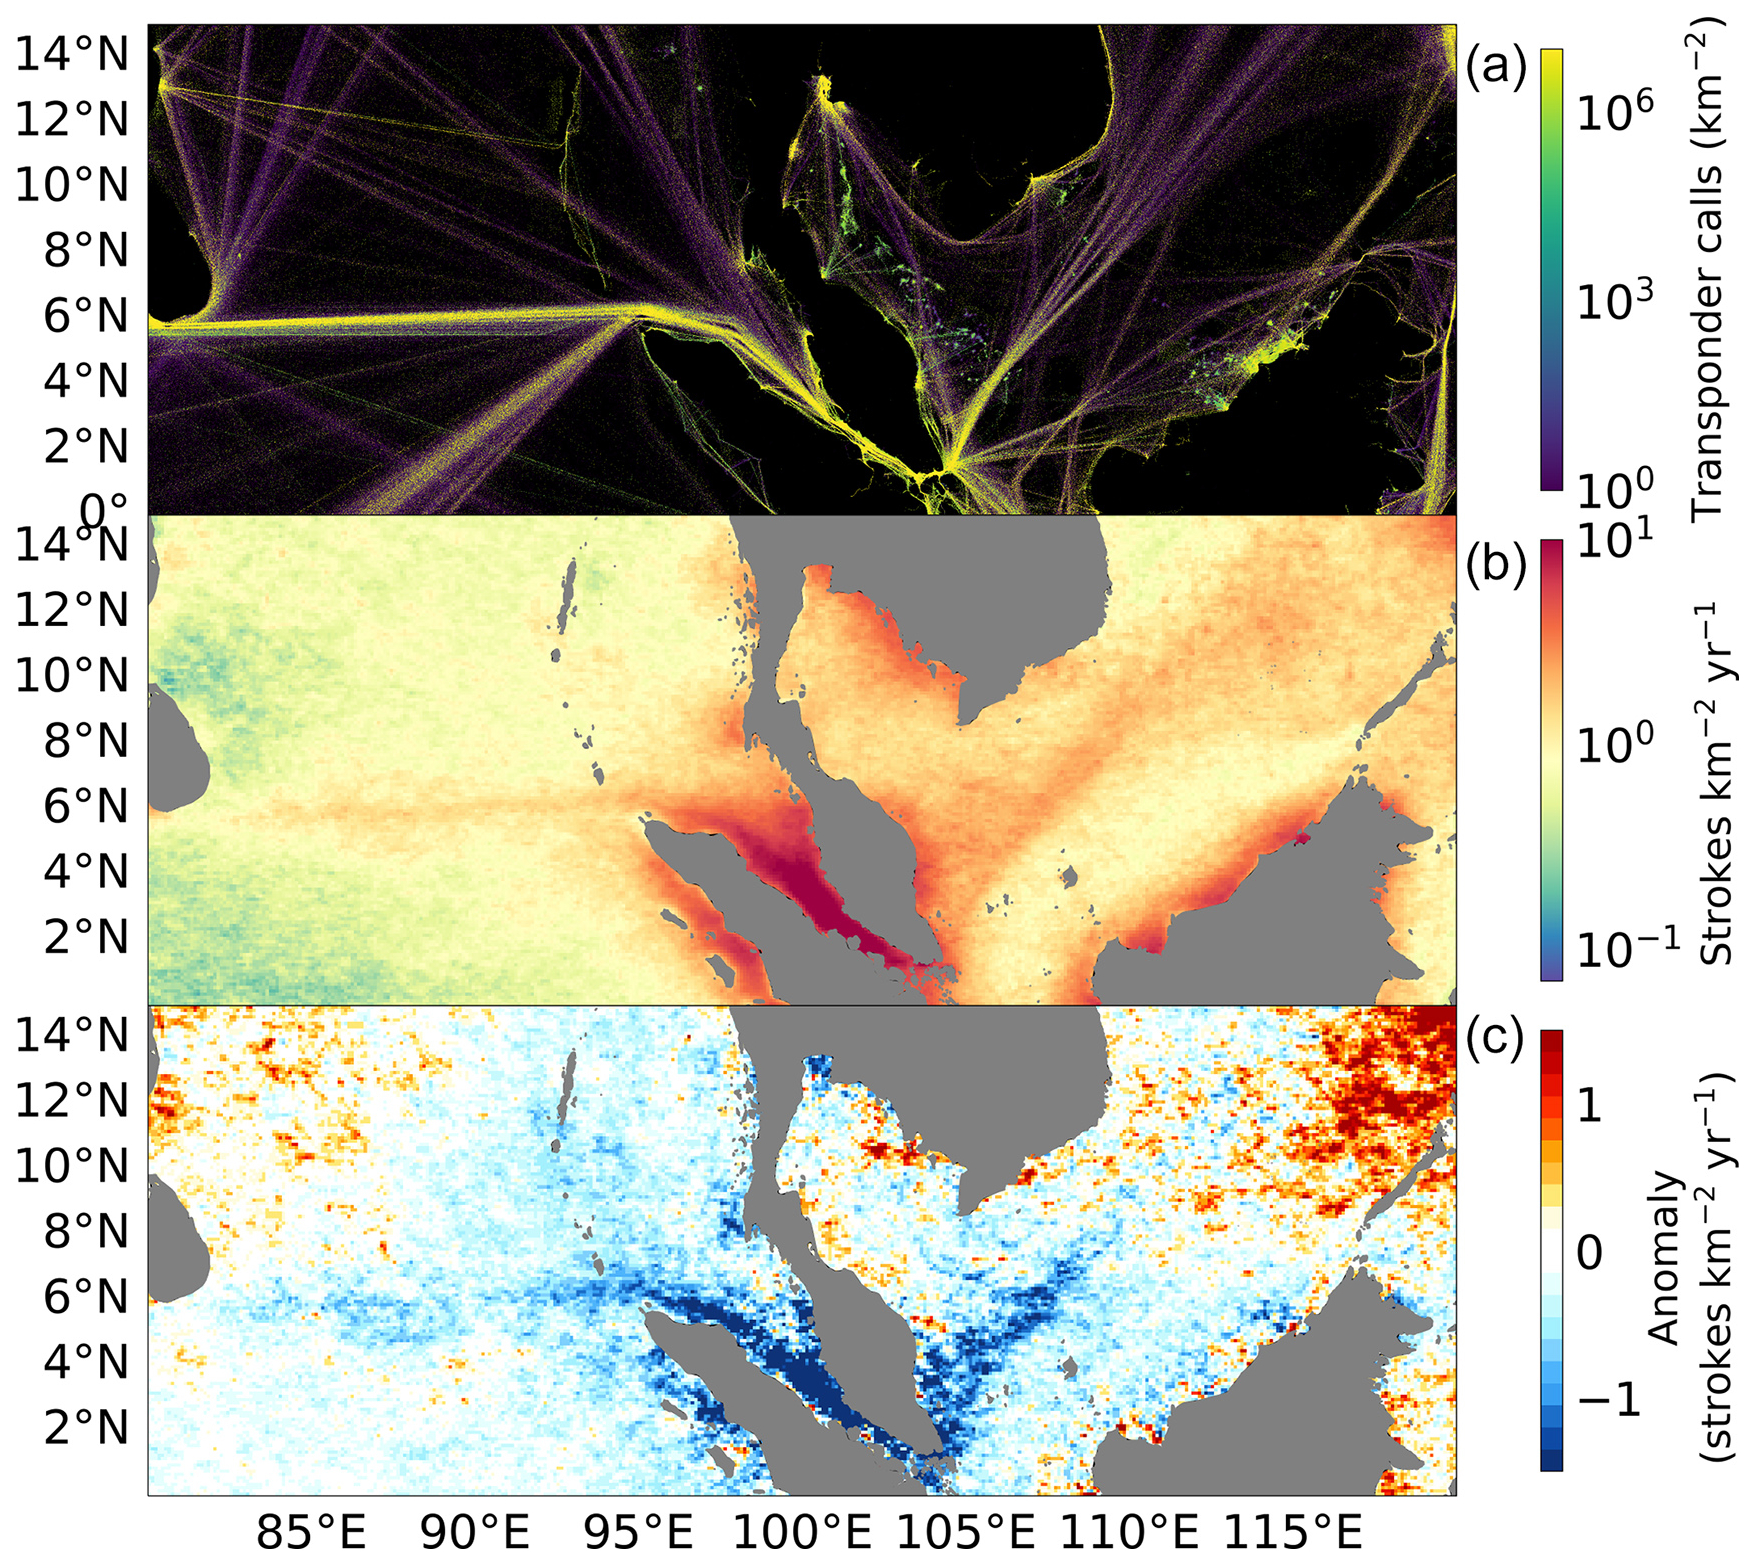
Figure 1(a) Map showing the total number of Automatic Identification System (AIS) transponder calls from 2015–2021, used by maritime vessels for collision avoidance. Data from the IMF World Seaborne Trade dataset (Cerdeiro et al., 2020). (b) Climatological mean lightning stroke density near the Port of Singapore (2010–2019). (c) Difference of the post-regulation period (2020–2023) lighting stroke density from the 2010–2019 climatology above. See Appendix A for further discussion of the retrievals.
Several mechanisms have been proposed to explain how aerosol particles from ship emissions could enhance lightning frequency, all of which involve enhanced cloud droplet nucleation (Twomey, 1977), leading to either (1) perturbations to super-cooled liquid water and ice hydrometeor distributions and enhanced charge separation in the mixed-phase region of DCC (Mansell and Ziegler, 2013; Blossey et al., 2018; Sun et al., 2024; Takahashi and Miyawaki, 2002; Deierling et al., 2008) or (2) an increase in the frequency or intensity of deep convection due to changes in the vertical distribution of humidity (Abbott and Cronin, 2021) or heating (Fan et al., 2018; Grabowski and Morrison, 2020). Some combination of (1) or (2) is also possible.
In January 2020, the International Maritime Organization (IMO) reduced the amount of allowable sulfur in fuel by a factor of 7, from 3.5 % to 0.5 % to curb effects of maritime shipping on air pollution (IMO, 2020). Recent analyses of shallow stratocumulus marine clouds over shipping lanes find changes to cloud brightness, droplet number, and droplet size associated with the IMO regulation, presumably due to the shift in aerosol number-size distribution (Watson-Parris et al., 2022; Yuan et al., 2022; Diamond, 2023).
We investigate whether the IMO fuel sulfur regulation has impacted lightning over the shipping lanes in the tropical Indian Ocean and South China Sea. We find the shipping lane lightning enhancement decreases significantly with the onset of the IMO regulation and that this decrease persists across a range of atmospheric conditions. We further show that the mean cloud droplet number concentration of shallow warm clouds over the Indian Ocean shipping lane was enhanced before the IMO regulation and also exhibits a decrease since the IMO regulation. We discuss the implications of these new results for mechanisms of shipping lane lightning enhancement and aerosol–DCC interactions.
The Port of Singapore accounts for 20 % of the world's bunkering fuel demand. The two primary shipping lanes it services – the Indian Ocean and South China Sea (hereafter “the shipping lanes”) – have traffic nearly an order of magnitude higher than other shipping lanes around the world (Fig. 1a) (Mao et al., 2022). As shown in Fig. 1b, prior to 2020, the mean absolute lightning stroke density measured by the World Wide Lightning Detection Network (WWLLN) remains enhanced over these shipping lanes, consistent with Thornton et al. (2017). Since 2020, however, when the IMO regulation of sulfur emissions began, lightning over the shipping lanes has decreased to an annual stroke density of about 1 stroke km−2 yr−1 lower than before the regulation (Fig. 1c). While some of the largest absolute declines in lightning since 2020 have occurred over the shipping lanes, lightning has increased or decreased in other parts of this region as well. As we illustrate below, variability in the dynamic and thermodynamic context for convection over these shipping lanes must be taken into account to better isolate the potential impacts of shipping emissions.
Regional ship traffic, as measured by vessel fuel sales at the Port of Singapore, has been relatively constant or even increased since 2020 (Fig. S1 in the Supplement) (Port of Singapore, 2024). The disruption by COVID-19 did not obviously decrease activity at the port, seeming only to have briefly slowed the growth of cargo throughput for 2–3 months in 2020 (Gu et al., 2023). Therefore, we focus on controlling for the variability in background meteorological conditions that impact the frequency and intensity of convection, and thus lightning, over the shipping lanes.
We first examine the shipping lane lightning enhancement using two controls on background meteorology: (1) we only sample precipitating clouds (Huffman et al., 2015; Pradhan and Markonis, 2023; Watters et al., 2023) and (2) we restrict analyses to the specific seasons in each region favorable for lighting (November to April in the Indian Ocean; June to November in the South China Sea). Using these criteria, we composite lightning observations as a function of distance to the shipping lanes, the center of which we define as the peak in shipping emissions from the Emissions Database for Global Atmospheric Research (EDGAR) emissions inventory (see Appendix A). As shown in Fig. 2a, mean absolute lightning exhibits a clear enhancement over the shipping lane before 2020 (pre-IMO), between approximately 150 km south to 150 km north of the shipping lanes, and this has decreased since the onset of regulations in 2020 (post-IMO) (Fig. 2a).
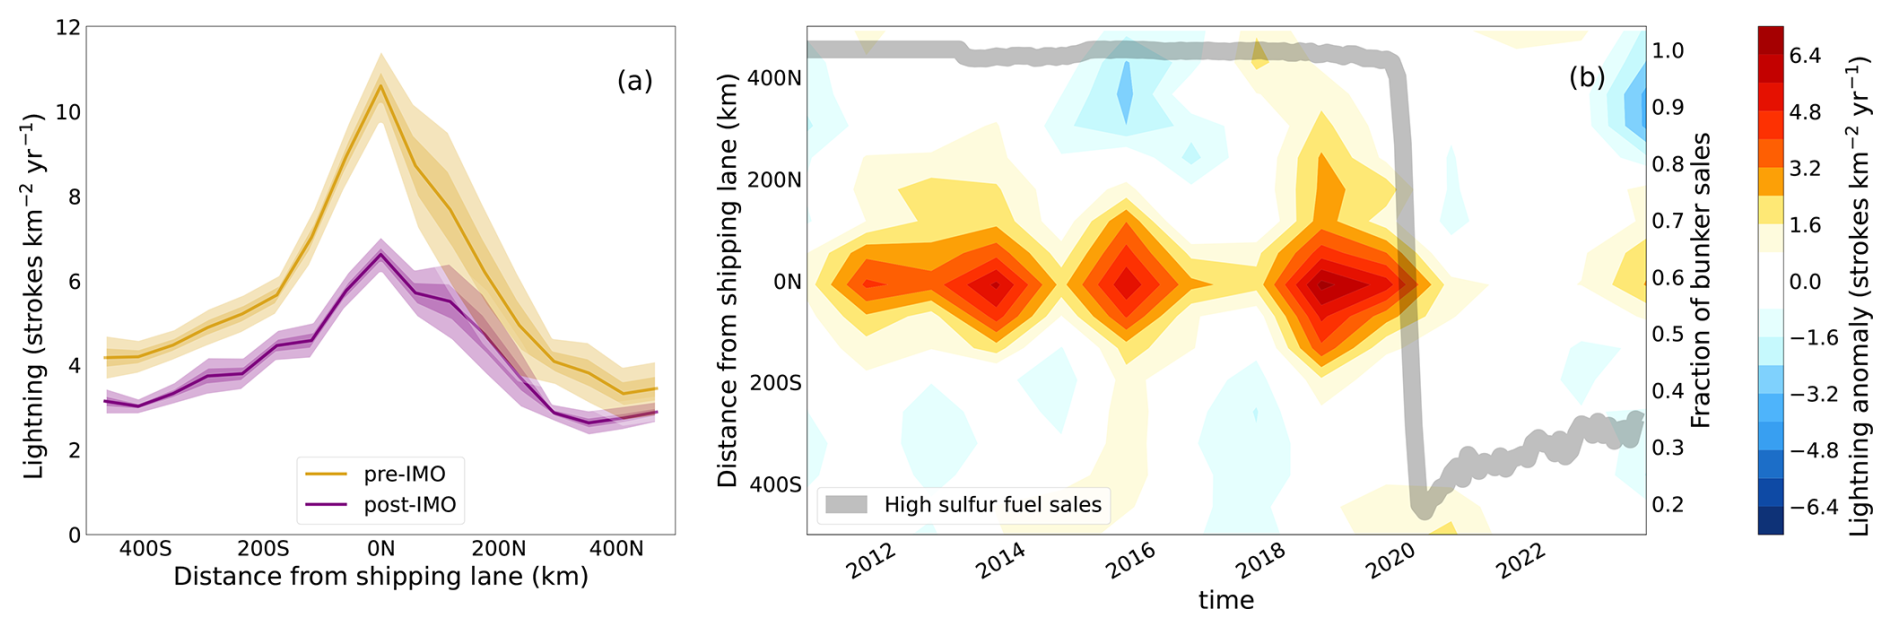
Figure 2(a) Lightning stroke density composited as a function of distance to the shipping lanes before and after the IMO regulation. Shading represents ±2 SE and ±3 SE (b) Hovmöller diagram of the annual mean lightning anomaly from the linear regression using convective available potential energy, precipitation, and Oceanic Niño Index from reanalysis data and observations, as well as spatial variables (latitude, longitude, lat ⋅ long, lat2, long2). The gray line shows the fraction of fuel sales that are high-sulfur fuel at the Port of Singapore.
To account for interannual variability in the frequency and intensity of convection in the region, we regress the observed annual lightning at a given distance from the shipping lane against three variables known to relate to lightning frequency (convective available potential energy (CAPE, discussed further below), precipitation rates (Romps et al., 2018), and the annual mean Oceanic Niño Index (ONI)), as well as several spatial variables such as latitude and longitude (Appendix A). Interannual variability in the Madden–Julian oscillation (MJO) was small and had a negligible impact when included in the regression (see Supplement). The regressed variables explain 65 % of the variance of the annual means. We subtract the regressed lightning from the observed annual mean, leaving the anomalous mean lightning stroke density that cannot be explained by interannual variability in storm occurrence and intensity, as shown in Fig. 2b.
The annual anomalous enhancement in lightning over the shipping lanes prior to 2020 is even clearer after regressing out meteorological variability, as is the near-step-change decrease in the anomaly after 2020 (Fig. 2b). Prior to the IMO regulation, essentially 100 % of fuel sold at the port was high-sulfur (Fig. 2b, right axis); correspondingly, the lightning anomaly over the shipping lane was 3.9 strokes km−2 yr−1 on average and was never below 2.5 strokes km−2 yr−1 for more than 1 year at a time. Adoption of the IMO regulation was prompt in 2020, as indicated by the change in high-sulfur fuel from 100 % to less than 35 % of fuel sold at the Port of Singapore. The Port of Singapore experienced little attenuation of fuel sales at the onset of COVID-19 (Gu et al., 2023), and total fuel sales have increased since 2020 consistent with higher traffic (Fig. S1). Since 2020, the shipping lane lightning enhancements compared to adjacent regions have declined by 67 % to 1.25 strokes km−2 yr−1 on average.
To further control for higher-frequency variations in convective activity and intensity, we examine the lightning enhancement in a 2-dimensional CAPE and precipitation space using 3-hourly coincident observations of CAPE, precipitation, and lightning. Cheng et al. (2021), building on Romps et al. (2018), showed that CAPE and precipitation is a reasonable proxy for tropical oceanic lightning frequency, given that a CAPE threshold is implemented. The 3-hourly CAPE and precipitation observations implicitly capture variability arising from more indirect sources, such as sea surface temperatures (SSTs), MJO events, and fronts (see Supplement for further discussion).
We compute lightning frequency in each CAPE–precipitation bin using data from a region centered over each shipping lane and from reference regions adjacent to the shipping lanes (see Fig. S2). We then compute a relative enhancement in lightning over the shipping lanes, before and after the onset of the IMO regulation, by taking the difference between corresponding CAPE–precipitation bin means in the shipping lane and associated reference box. The resulting shipping lane lightning enhancements as a function of both CAPE and precipitation are shown in Fig. 3. Before the IMO regulation (pre-IMO), a shipping lane lightning enhancement existed in nearly every thermodynamic setting (e.g., in each CAPE–precipitation bin; Fig. 3a, d) for both shipping lanes. As indicated by the larger pre-IMO perturbation, it seems that low-CAPE environments may have been more susceptible to the aerosol enhancement of lightning.
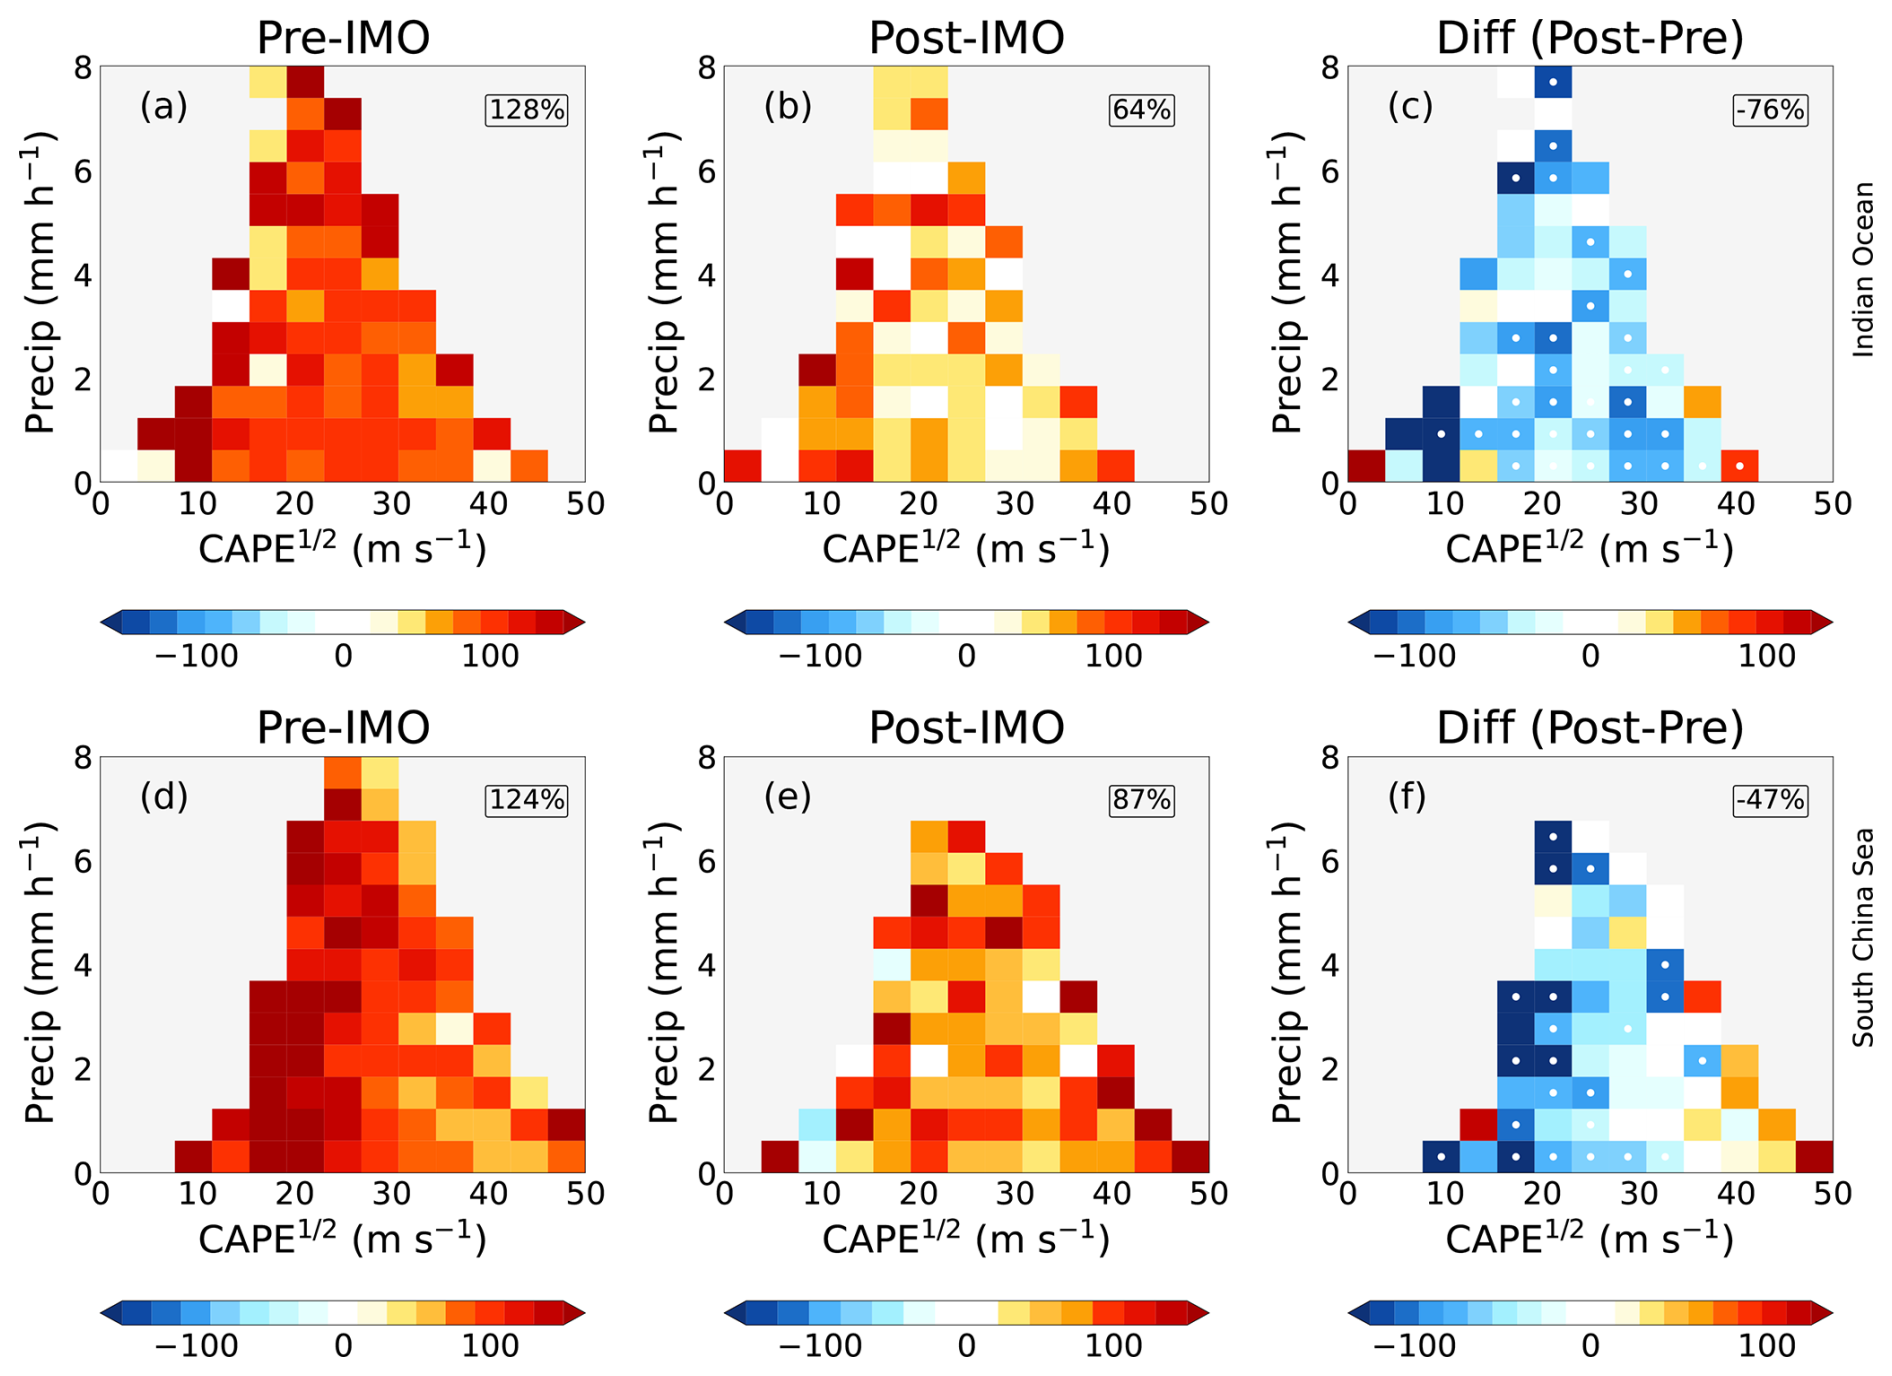
Figure 3Mean shipping lane percent enhancement in lightning stroke density (i.e., the relative difference in lighting over the shipping lane from that over immediately adjacent regions; see text), shown as colored pixels and binned by square root of CAPE reanalysis data (x axis) and precipitation observations (y axis) for the Indian Ocean (a–c) and South China Sea (d–f) shipping lanes. Enhancements since the regulation (b, e) are lower than before the regulation (a, d). The difference between post- and pre-IMO periods of the shipping lane lightning enhancements are represented in (c) and (f), where stippled bins indicate significance (p<0.05).
Since the IMO regulation (post-IMO), both shipping lanes exhibit significantly weaker lightning enhancements across most CAPE–precipitation regimes (Fig. 3b, e). The bin-by-bin differences between the pre- and post-IMO lightning enhancement histograms are shown in Fig. 3c and f. On average across all CAPE–precipitation conditions, the lightning enhancement has decreased by 76 % and by 47 % for the Indian Ocean and South China Sea shipping lanes, respectively (Fig. 3c, f); i.e., for the same convective setting characterized by CAPE and precipitation rates, the enhancement in lightning over the shipping lanes (as compared to adjacent regions) is significantly smaller after 2020 than it was before 2020.
Based upon the above, we hypothesize that the decline in the lightning enhancement since 2020 is most consistent with the IMO regulation changing CCN in the region. If decreasing sulfur emissions over the shipping lanes has reduced the total number of viable CCN and disrupted an associated mechanism for lightning enhancement, then there should be a corresponding change in warm cloud microphysics. To further test our hypothesis, we use Moderate Resolution Imaging Spectroradiometer (MODIS) satellite observations of cloud droplet number (Nd) in low clouds over the Indian Ocean shipping lane, where the influence of land is weaker and ship emissions are stronger, during the high-lightning season. The retrievals of Nd follow the method outlined in Zhu et al. (2018) (see Appendix A). Retrievals of Nd can only be done for shallow cumulus, not DCC. As a result, Nd retrievals sample a different set of conditions than the lightning observations. We assume that the behavior of Nd in shallow cumulus clouds from the same region is related to, though not necessarily a direct proxy for, Nd at cloud base in DCC.
In Fig. 4, we show that prior to the IMO regulation, there is a clear trend in Nd toward land (north), as well as a clear perturbation in Nd over the shipping lane. This Nd perturbation is roughly 10 %–15 % above the average droplet concentrations between 150 km north and 150 km south, which is larger than the shipping lane perturbations to Nd detected by Diamond et al. (2020) in southeast Atlantic stratocumulus clouds. The Nd perturbation over the Indian Ocean shipping lane is a significant finding on its own, as observations of persistent, mean-state Nd perturbations by ships are rare (Diamond and Wood, 2020), especially for convectively active regions we show here.
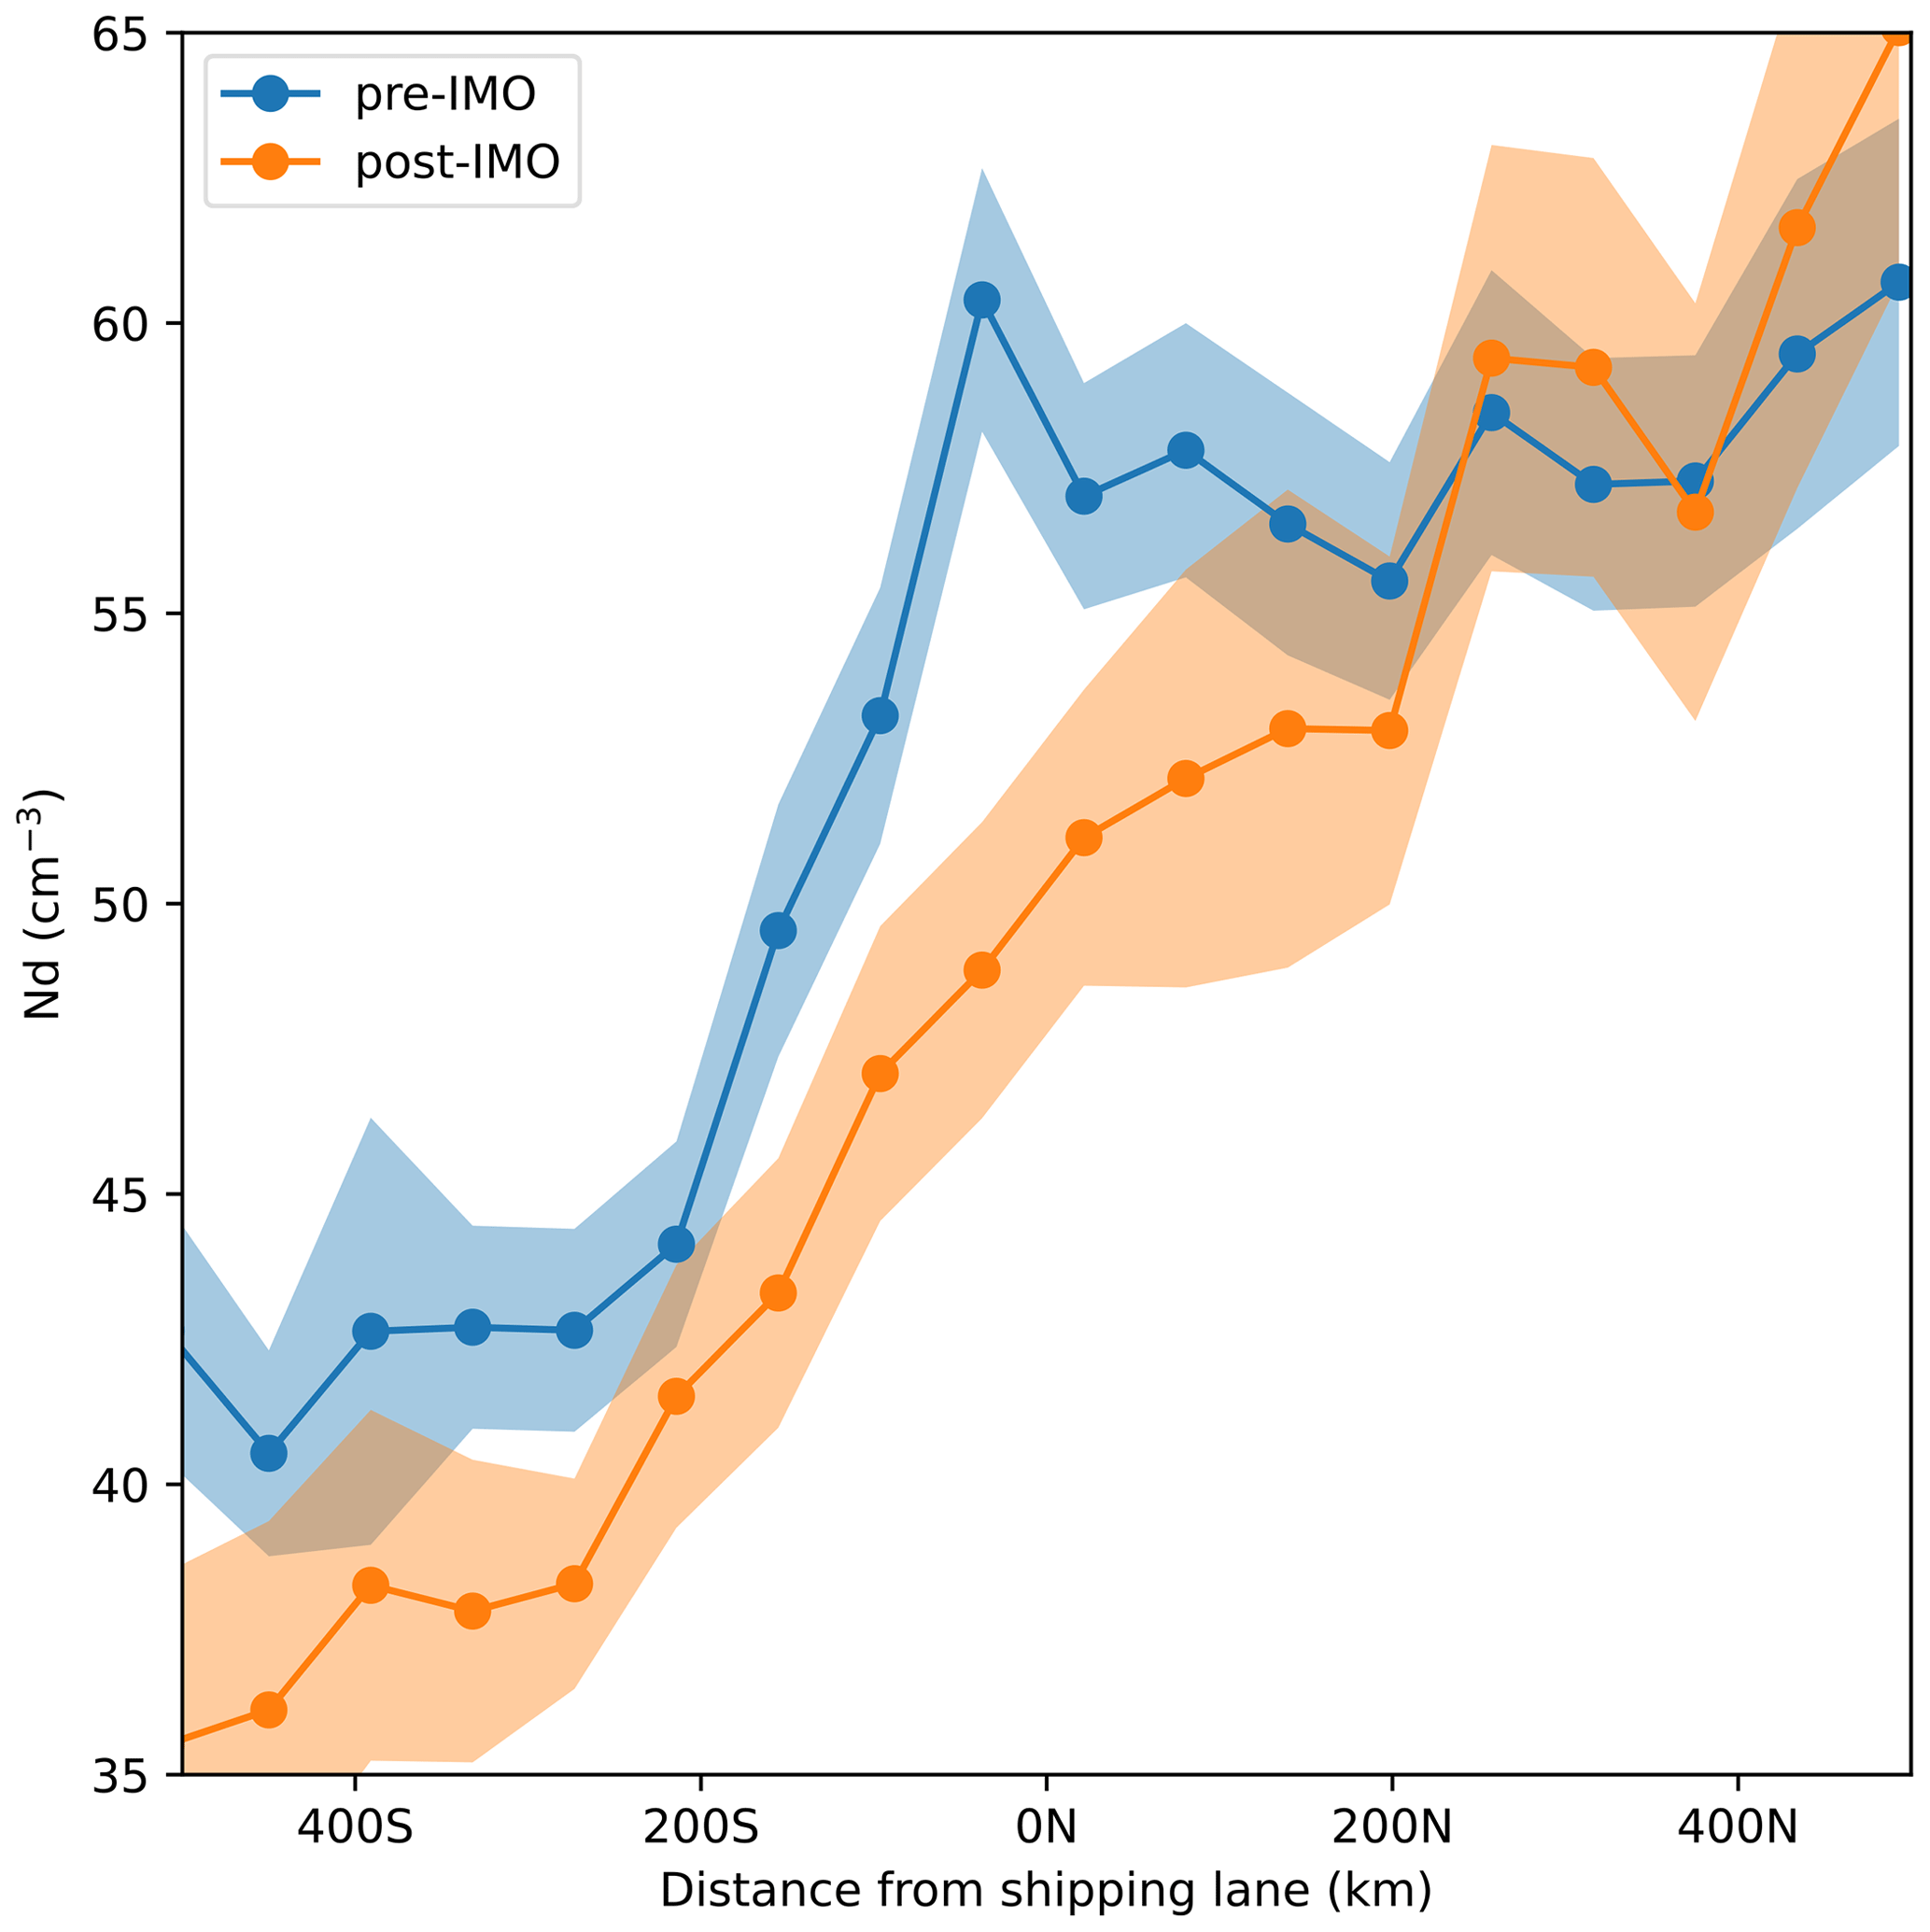
Figure 4Warm cloud-base droplet number (Nd) concentrations over the Indian Ocean, derived from MODIS observations of optical depth and effective radius following the procedure from Zhu et al. (2018). The pre-IMO regulation period is 2010–2019. Note the general increasing trend northward through the domain toward greater land influence, as well as the broad localized enhancement over the shipping lane prior to the regulation. To remove the effects and trends of large biomass burning and dust events, we remove any Nd retrievals where dust concentrations increase above 1 µg m−3 or black carbon concentrations above 0.1 µg m−3 (approximately the 50th percentile in each case). Shading represents ±2 SE.
Since the IMO regulation, the Nd retrievals away from the shipping lane mostly maintain their previous levels, as indicated by the overlap in the 95 % confidence intervals, particularly to the north (upwind). Meanwhile, the enhancement in Nd over the shipping lane has become essentially undetectable (Fig. 4). The decline in Nd over the shipping lane relative to the surrounding region establishes additional support for a relationship between the declining lightning enhancement and a shift in aerosol particle number-size distributions over the shipping lanes induced by the IMO regulation. Nd derived from shallow cumulus clouds will not be directly proportional to the CCN available for activation in high-supersaturation DCC (Hobbs et al., 2000) or to the lightning enhancements that might result from CCN enhancements. However, the change in Nd is an additional observable indication, independent of the lightning observations, that the IMO regulations have clearly shifted aerosol particle distributions over the shipping lanes of interest here.
We find that a previously identified enhancement in lightning stroke density over the two major shipping routes near the Port of Singapore has declined by over 40 % since 2020 when the IMO regulation of maritime shipping sulfur emissions came into effect. The decline is evident after controlling for natural variations in environmental conditions that characterize the convection intensity and frequency (see Fig. 3). While ships may act as lightning attractors (Peterson, 2023), there is not evidence of a change in the number of ships traversing these shipping lanes over this time period (Fig. S1). Further, an independently observed perturbation to Nd over the Indian Ocean shipping lane prior to the IMO regulation has since nearly vanished, indicating a coincident change in CCN over the region. The concomitant decline in Nd and lightning, timed with the onset of compliance with the IMO regulation, provides new evidence to support the set of CCN-mediated hypotheses previously proposed for the invigoration of lightning (Fan et al., 2018; Abbott and Cronin, 2021; Mansell and Ziegler, 2013; Grabowski and Morrison, 2020).
Precisely how increases in CCN and Nd caused by ship emissions might lead to enhanced lightning remains unresolved. Both the pre-IMO and post-IMO perturbations to Nd are smaller than the enhancements of lightning, which may be explained by high scavenging rates in DCC during the high lightning season, as well as the different supersaturation conditions sampled by the Nd (shallow cumulus) and lightning retrievals (deep convection), nonlinear relationships between Nd and secondary ice production, and ice nucleation.
Seppälä et al. (2021) find that a reduction by a factor of 10 in ship fuel sulfur content shifts emitted aerosol particles to smaller sizes and lower total number concentrations. Ultrafine particles <50 nm increase and those >50nm decrease substantially, which implies that ultrafine particle invigoration of updraft velocities proposed in Fan et al. (2018) was not contributing to the shipping lane lightning enhancement pre-IMO. We conclude the lightning enhancement prior to the IMO regulation was mostly the result of higher concentrations of larger aerosol particles (e.g., >50 nm) that perturbed: (1) cloud microphysics, such as elevated supercooled liquid water concentrations or rime splintering (see Supplement) (Mansell and Ziegler, 2013), and/or (2) updraft frequency, by means of heightened free-tropospheric humidity or a mesoscale circulation response (Blossey et al., 2018; Grabowski and Morrison, 2020). Enhancements in ultrafine particles may play a role in the smaller non-zero shipping lane lightning enhancement that has persisted post-IMO.
The IMO regulation of ship fuel sulfur illustrates connections between international trade, air pollution, DCC microphysics, and lightning. Further work combining in situ and remote sensing of aerosol and cloud microphysics together with lightning frequency is needed to clarify the mechanisms behind these connections and to quantify the relative roles of dynamic and microphysical responses. Our findings herein show that these regions remain a useful testbed for understanding aerosol pollution impacts on DCC and lightning.
Lightning stroke density observations come from the Worldwide Lightning Location Network (WWLLN), a ground-based lightning detection network with continuous global coverage of lightning at a resolution of 10 km (Dowden et al., 2002). WWLLN uses very low-frequency radio impulses (3–30 kHz) that, upon emission from a lightning stroke, propagate between the Earth–ionosphere waveguide and disperse into a wave train. The phase and frequency of that wave train determine the time of group arrival at three or more measurement stations, which can be used to retrieve the location of the stroke. While the detection efficiency for individual events is lower than satellite-based methods, continuous observations for more than a decade offer much more statistical power over our region of interest.
We use integrated multi-satellite retrievals for GPM (IMERG) precipitation rates (Huffman et al., 2015) and European Centre for Medium‐Range Weather Forecasts (ECMWF) Reanalysis 5th Generation (ERA5) atmospheric reanalyses (Hersbach et al., 2020) CAPE to compare the enhancement across various thermodynamic conditions. IMERG precipitation combines microwave and radar retrievals from the Tropical Rainfall Measuring Mission (TRMM) and the GPM constellation. In ERA5, a value for CAPE is calculated for every departing level between the surface and 350 hPa as follows:
where zdep is the departing level, ztop is the level of neutral buoyancy, θep is the virtual potential temperature of the parcel, and is the saturation virtual potential temperature of the environment. Once CAPE has been calculated for all levels, the most unstable layer is selected. We use CAPE, which is directly proportional to wmax, the theoretical maximum vertical velocity achievable at a location given the stability of the atmosphere. This follows from the proportionality between kinetic energy and the square of velocity. Further discussion of CAPE as it relates to lightning can be found in Cheng et al. (2021) and Romps et al. (2018).
Lightning in Fig. 1 is shown on a 0.1° × 0.1° grid, calculated from 3-hourly lightning stroke densities. For subsequent calculations of the enhancement (Figs. 2–3) all data (CAPE, precipitation, and lightning) are 3-hourly and mapped to a 0.5° N × 0.625° E grid to minimize collocation errors and noise and for comparison with MERRA-2 aerosol and meteorological reanalysis fields. Smoothly varying data (CAPE) are remapped bilinearly, while non-smoothly varying data (precipitation and lightning) are remapped conservatively (see Staff, 2014, and sources therein for further details on regridding practices). To provide some basic control for thermodynamic and meteorological variability, we only consider precipitating clouds (precipitation greater than 0.1 mm h−1) during the high-lightning season (see Supplement).
We use data from 2010 onward, as WWLLN detection efficiency was still increasing rapidly prior to 2010. The shipping lanes are defined as regions where the Emissions Database for Global Atmospheric Research (EDGAR) PM2.5 shipping emissions are greater than kg m−2 s−1 (Crippa et al., 2016). To remove influence from katabatic flows and sea-breeze-driven convergence, we only consider the larger blue regions outlined in Fig. S2. This notably removes the straight of Malacca, a region with both very high shipping emissions and active convection. There, surface convergence from land-based precipitation outflows on Sumatra and Malaysia and the adjacent landmasses make it challenging to establish a counterfactual, given the well-known land–ocean contrast in lightning stroke rates (Cheng et al., 2021; Romps et al., 2018).
For Fig. 2, the lightning stroke density (F) as a function of time (t) and distance from shipping lane (y) from the entire record is regressed as
where X is the vector of predictors (CAPE, precipitation, ONI, latitude (lat), longitude (long), lat ⋅ long, lat2, long2), β is the vector of coefficients, and ϵ is the residual or “anomaly” that is shown in the figure. This anomaly represents the difference between the lightning one would expect given the environmental conditions (β⋅X) (see Fig. S3) and the observed lightning (F). In accordance with Cheng et al. (2021) CAPE has been set to zero where CAPE < 15 m s−1.
We utilized the “brightest 10 %” method (Zhu et al., 2018; Cao et al., 2023) to obtain reliable Nd cloud droplet number concentration retrievals from MODIS Aqua across our target domain from 2010 to 2023. This method involves selecting the brightest 10 % of clouds within each scene to calculate Nd values for every 0.5° × 0.5° grid box. The validity of this retrieval method has been corroborated through comparisons with ship-based observations (Efraim et al., 2020; Wang et al., 2021). Nd is computed using the cloud effective radius (re) and cloud optical depth (τ), as described by the following equation:
where k represents the volume radius ratio of cloud droplets (rv) to re (k= ()3=0.8). The term fad denotes the adiabatic fraction, for which we assumed a constant value of 1 in our study due to the absence of more refined alternatives (Bennartz and Rausch, 2017; Grosvenor et al., 2018). Cw signifies the adiabatic cloud water condensation rate within an ascending cloud parcel, expressed in grams per cubic meter per meter (g m−3 m−1). The extinction efficiency factor, Qext, is assumed to be 2, and ρw is the density of water. To enhance the accuracy of our Nd estimations for each 0.5° × 0.5° grid box, we excluded pixels where the solar zenith angle exceeded 65° (Grosvenor and Wood, 2014). We also excluded of scenes containing mixed-phase, ice, or multilayer clouds. Consequently, after applying these filtering criteria, the remaining dataset comprised less than 1 % of multilayer cloud pixels in any given grid. We use only the Indian Ocean shipping lane to maximize signal to noise, as the South China Sea has a much weaker signal due to its proximity to land and lower ship emissions. Inclusion of the South China Sea in the analysis does not alter the results. Finally, in order to remove the impact of dust storms advected over the Bay of Bengal and to thereby reduce interannual variability in Nd outside the shipping lanes, we collocate 3-hourly MERRA-2 aerosol reanalysis output of dust and black carbon with the MODIS Nd retrievals. We then remove any Nd retrievals where dust concentrations increase above 1 ng m−3 or black carbon concentrations above 0.1 ng m−3 (approximately the 50th percentile in each case). Limited observations in the region likely hinder the ability of reanalysis products to capture the full variability in CCN sources (see Supplement for discussion of aerosol optical depth), possibly explaining some remaining differences in Nd over the southern region of the domain pre- and post-2020.
ERA5 CAPE may be downloaded using the Copernicus API at https://doi.org/10.24381/cds.adbb2d47 (Hersbach et al., 2023). IMERG precipitation and MERRA-2 aerosol are available for download at https://doi.org/10.5067/KLICLTZ8EM9D (GMAO, 2015) and https://doi.org/10.5067/GPM/IMERG/3B-HH/07 (Huffman et al., 2023). ONI is available at https://www.psl.noaa.gov/data/correlation/oni.data (NOAA Physical Sciences Laboratory, 2024). MODIS Aqua (MYD06) retrievals are available at https://doi.org/10.5067/MODIS/MYD06_L2.061 (Platnick et al., 2015). Precipitation feature reflectivity datasets are available for download at https://atmos.tamucc.edu/trmm/data/ (Liu et al., 2008). Global ship traffic density is available at Cerdeiro et al. (2020). Analysis and plotting are available at https://doi.org/10.5281/zenodo.11373991 (Wright, 2024). WWLLN lightning location data are collected by a global scientific collaboration and managed by the University of Washington. The WWLLN collaboration receives no federal, state, or private funds to pay for the network operations, which are fully paid for by data sales (available at https://www.wwlln.net, Rodger et al., 2009). Therefore, the stroke-level data are not free to the public. The composited annual stroke densities (as a function of distance from the shipping lane) and the mean pre- and post-regulation stroke densities region-wide are provided as part of the Zenodo code Supplement (Wright, 2024).
The supplement related to this article is available online at https://doi.org/10.5194/acp-25-2937-2025-supplement.
Analysis: CJW. Writing: CJW and JAT. Conceptualization and methodological development: CJW, JAT, LJ, and RW. Nd retrievals: YC, YZ, and JL. Additional expertise provided by RH, DR, RJ, PN, and DK.
The contact author has declared that none of the authors has any competing interests.
Publisher’s note: Copernicus Publications remains neutral with regard to jurisdictional claims made in the text, published maps, institutional affiliations, or any other geographical representation in this paper. While Copernicus Publications makes every effort to include appropriate place names, the final responsibility lies with the authors.
We would like to express our gratitude to Matthias Tesche and two anonymous referees, who provided valuable feedback during review. We also wish to thank the World Wide Lightning Location Network (http://www.wwlln.net (last access: 31 December 2024), a collaboration among over 50 universities and institutions, for providing the lightning location data used in this paper.
This research has been supported by the National Science Foundation (grant nos. AGS-2113494 and AGS-1912130), the National Natural Science Foundation of China (grant no. 42075093), the United States–Israel Binational Science Foundation (grant no. 2020809), the National Science Foundation (grant no. AGS-1912130), the Seoul National University (New Faculty Startup Fund), and NASA/UMBC (grant NASA0144-01).
This paper was edited by Matthias Tesche and Martina Krämer and reviewed by two anonymous referees.
Abbott, T. H. and Cronin, T. W.: Aerosol invigoration of atmospheric convection through increases in humidity, Science, 371, 83–85, https://doi.org/10.1126/science.abc5181, 2021. a, b
Bennartz, R. and Rausch, J.: Global and regional estimates of warm cloud droplet number concentration based on 13 years of AQUA-MODIS observations, Atmos. Chem. Phys., 17, 9815–9836, https://doi.org/10.5194/acp-17-9815-2017, 2017. a
Blossey, P. N., Bretherton, C. S., Thornton, J. A., and Virts, K. S.: Locally Enhanced Aerosols Over a Shipping Lane Produce Convective Invigoration but Weak Overall Indirect Effects in Cloud-Resolving Simulations, Geophys. Res. Lett., 45, 9305–9313, https://doi.org/10.1029/2018GL078682, 2018. a, b
Boucher, O., Randall, D., Artaxo, P., Bretherton, C., Feingold, G., Forster, P., Kerminen, V.-M., Kondo, Y., Liao, H., Lohmann, U., Rasch, P., Satheesh, S., Sherwood, S., Stevens, B., and Zhang, X.: Clouds and Aerosols, Climate Change 2013: The Physical Science Basis, 571–892, https://doi.org/10.1017/CBO9781107415324.016, 2013. a
Cao, Y., Zhu, Y., Wang, M., Rosenfeld, D., Liang, Y., Liu, J., Liu, Z., and Bai, H.: Emission Reductions Significantly Reduce the Hemispheric Contrast in Cloud Droplet Number Concentration in Recent Two Decades, J. Geophys. Res.-Atmos., 128, e2022JD037417, https://doi.org/10.1029/2022JD037417, 2023. a
Cerdeiro, D. A., Komaromi, A., Liu, Y., and Saeed, M.: World Seaborne Trade in Real Time: A Proof of Concept for Building AIS-based Nowcasts from Scratch, https://www.imf.org/en/Publications/WP/Issues/2020/05/14/World-Seaborne-Trade-in-Real-Time-A-Proof-of-Concept-for-Building-AIS-based-Nowcasts-from-49393 (last access: 31 December 2024), 2020. a, b
Cheng, W.-Y., Kim, D., and Holzworth, R. H.: CAPE Threshold for Lightning Over the Tropical Ocean, J. Geophys Res.-Atmos., 126, e2021JD035621, https://doi.org/10.1029/2021JD035621, 2021. a, b, c, d
Crippa, M., Janssens-Maenhout, G., Dentener, F., Guizzardi, D., Sindelarova, K., Muntean, M., Van Dingenen, R., and Granier, C.: Forty years of improvements in European air quality: regional policy-industry interactions with global impacts, Atmos. Chem. Phys., 16, 3825–3841, https://doi.org/10.5194/acp-16-3825-2016, 2016. a
Deierling, W., Petersen, W. A., Latham, J., Ellis, S., and Christian, H. J.: The relationship between lightning activity and ice fluxes in thunderstorms, J. Geophys. Res.-Atmos., 113, D15210, https://doi.org/10.1029/2007JD009700, 2008. a
Diamond, M. S.: Detection of large-scale cloud microphysical changes within a major shipping corridor after implementation of the International Maritime Organization 2020 fuel sulfur regulations, Atmos. Chem. Phys., 23, 8259–8269, https://doi.org/10.5194/acp-23-8259-2023, 2023. a
Diamond, M. S. and Wood, R.: Limited Regional Aerosol and Cloud Microphysical Changes Despite Unprecedented Decline in Nitrogen Oxide Pollution During the February 2020 COVID-19 Shutdown in China, Geophys. Res. Lett., 47, e2020GL088913, https://doi.org/10.1029/2020GL088913, 2020. a
Diamond, M. S., Director, H. M., Eastman, R., Possner, A., and Wood, R.: Substantial Cloud Brightening From Shipping in Subtropical Low Clouds, AGU Advances, 1, e2019AV000111, https://doi.org/10.1029/2019AV000111, 2020. a, b
Dowden, R. L., Brundell, J. B., and Rodger, C. J.: VLF lightning location by time of group arrival (TOGA) at multiple sites, J. Atmos. Sol.-Terr. Phy., 64, 817–830, https://doi.org/10.1016/S1364-6826(02)00085-8, 2002. a
Durkee, P. A., Noone, K. J., Ferek, R. J., Johnson, D. W., Taylor, J. P., Garrett, T. J., Hobbs, P. V., Hudson, J. G., Bretherton, C. S., Innis, G., Frick, G. M., Hoppel, W. A., O’Dowd, C. D., Russell, L. M., Gasparovic, R., Nielsen, K. E., Tessmer, S. A., Öström, E., Osborne, S. R., Flagan, R. C., Seinfeld, J. H., and Rand, H.: The Impact of Ship-Produced Aerosols on the Microstructure and Albedo of Warm Marine Stratocumulus Clouds: A Test of MAST Hypotheses 1i and 1ii, J. Atmos. Sci., 57, 2554–2569, https://doi.org/10.1175/1520-0469(2000)057<2554:TIOSPA>2.0.CO;2, 2000. a
Efraim, A., Rosenfeld, D., Schmale, J., and Zhu, Y.: Satellite Retrieval of Cloud Condensation Nuclei Concentrations in Marine Stratocumulus by Using Clouds as CCN Chambers, J. Geophys. Res.-Atmos., 125, e2020JD032409, https://doi.org/10.1029/2020JD032409, 2020. a
Fan, J., Rosenfeld, D., Zhang, Y., Giangrande, S. E., Li, Z., Machado, L. A. T., Martin, S. T., Yang, Y., Wang, J., Artaxo, P., Barbosa, H. M. J., Braga, R. C., Comstock, J. M., Feng, Z., Gao, W., Gomes, H. B., Mei, F., Pöhlker, C., Pöhlker, M. L., Pöschl, U., and de Souza, R. A. F.: Substantial convection and precipitation enhancements by ultrafine aerosol particles, Science, 359, 411–418, https://doi.org/10.1126/science.aan8461, 2018. a, b, c
Feng, Z., Leung, L. R., Liu, N., Wang, J., Houze Jr, R. A., Li, J., Hardin, J. C., Chen, D., and Guo, J.: A Global High-Resolution Mesoscale Convective System Database Using Satellite-Derived Cloud Tops, Surface Precipitation, and Tracking, J. Geophys. Res.-Atmos., 126, e2020JD034202, https://doi.org/10.1029/2020JD034202, 2021. a
Global Modeling and Assimilation Office (GMAO): MERRA-2 tavg1_2d_aer_Nx: 2d,1-Hourly,Time-averaged,Single-Level,Assimilation,Aerosol Diagnostics V5.12.4, Greenbelt, MD, USA, Goddard Earth Sciences Data and Information Services Center (GES DISC) [data set], https://doi.org/10.5067/KLICLTZ8EM9D, 2015. a
Grabowski, W. W. and Morrison, H.: Do Ultrafine Cloud Condensation Nuclei Invigorate Deep Convection?, J. Atmos. Sci., 77, 2567–2583, https://doi.org/10.1175/JAS-D-20-0012.1, 2020. a, b, c
Grosvenor, D. P. and Wood, R.: The effect of solar zenith angle on MODIS cloud optical and microphysical retrievals within marine liquid water clouds, Atmos. Chem. Phys., 14, 7291–7321, https://doi.org/10.5194/acp-14-7291-2014, 2014. a
Grosvenor, D. P., Sourdeval, O., Zuidema, P., Ackerman, A., Alexandrov, M. D., Bennartz, R., Boers, R., Cairns, B., Chiu, J. C., Christensen, M., Deneke, H., Diamond, M., Feingold, G., Fridlind, A., Hünerbein, A., Knist, C., Kollias, P., Marshak, A., McCoy, D., Merk, D., Painemal, D., Rausch, J., Rosenfeld, D., Russchenberg, H., Seifert, P., Sinclair, K., Stier, P., van Diedenhoven, B., Wendisch, M., Werner, F., Wood, R., Zhang, Z., and Quaas, J.: Remote Sensing of Droplet Number Concentration in Warm Clouds: A Review of the Current State of Knowledge and Perspectives, Rev. Geophys., 56, 409–453, https://doi.org/10.1029/2017RG000593, 2018. a
Gu, Y., Chen, Y., Wang, X., and Chen, Z.: Impact of COVID-19 epidemic on port operations: Evidence from Asian ports, Case Studies on Transport Policy, 12, 101014, https://doi.org/10.1016/j.cstp.2023.101014, 2023. a, b
Hersbach, H., Bell, B., Berrisford, P., Hirahara, S., Horányi, A., Muñoz-Sabater, J., Nicolas, J., Peubey, C., Radu, R., Schepers, D., Simmons, A., Soci, C., Abdalla, S., Abellan, X., Balsamo, G., Bechtold, P., Biavati, G., Bidlot, J., Bonavita, M., De Chiara, G., Dahlgren, P., Dee, D., Diamantakis, M., Dragani, R., Flemming, J., Forbes, R., Fuentes, M., Geer, A., Haimberger, L., Healy, S., Hogan, R. J., Hólm, E., Janisková, M., Keeley, S., Laloyaux, P., Lopez, P., Lupu, C., Radnoti, G., de Rosnay, P., Rozum, I., Vamborg, F., Villaume, S., and Thépaut, J.-N.: The ERA5 global reanalysis, Q. J. Roy. Meteor. Soc., 146, 1999–2049, https://doi.org/10.1002/qj.3803, 2020. a
Hersbach, H., Bell, B., Berrisford, P., Biavati, G., Horányi, A., Muñoz Sabater, J., Nicolas, J., Peubey, C., Radu, R., Rozum, I., Schepers, D., Simmons, A., Soci, C., Dee, D., and Thépaut, J.-N.: ERA5 hourly data on single levels from 1940 to present, Copernicus Climate Change Service (C3S) Climate Data Store (CDS) [data set], https://doi.org/10.24381/cds.adbb2d47, 2023. a
Hobbs, P. V., Garrett, T. J., Ferek, R. J., Strader, S. R., Hegg, D. A., Frick, G. M., Hoppel, W. A., Gasparovic, R. F., Russell, L. M., Johnson, D. W., O’Dowd, C., Durkee, P. A., Nielsen, K. E., and Innis, G.: Emissions from Ships with respect to Their Effects on Clouds, J. Atmos. Sci., 57, 2570–2580, https://doi.org/10.1175/1520-0469(2000)057<2570:EFSWRT>2.0.CO;2, 2000. a
Huffman, G. J., Bolvin, D. T., Braithwaite, D., Hsu, K., Joyce, R., Xie, P., and Yoo, S.-H.: NASA global precipitation measurement (GPM) integrated multi-satellite retrievals for GPM (IMERG), Algorithm theoretical basis document (ATBD) version, 4, 30, NASA Goddard Space Flight Center Greenbelt, MD, https://doi.org/10.5067/GPM/IMERG/3B-HH/07, 2015. a, b
Huffman, G. J., Stocker, E. F., Bolvin, D. T., Nelkin, E. J., and Tan, J.: GPM IMERG Final Precipitation L3 Half Hourly 0.1 degree x 0.1 degree V07, Greenbelt, MD, Goddard Earth Sciences Data and Information Services Center (GES DISC) [data set], https://doi.org/10.5067/GPM/IMERG/3B-HH/07, 2023. a
Igel, A. L. and van den Heever, S. C.: Invigoration or Enervation of Convective Clouds by Aerosols?, Geophys. Res. Lett., 48, e2021GL093804, https://doi.org/10.1029/2021GL093804, 2021. a
IMO: IMO 2020 Cutting Sulphur Oxide Emissions, https://www.imo.org/en/MediaCentre/HotTopics/Pages/Sulphur-2020.aspx (last access: 31 December 2024), 2020. a
Liu, C., Zipser, E. J., Cecil, D. J., Nesbitt, S. W., and Sherwood, S.: A Cloud and Precipitation Feature Database from Nine Years of TRMM Observations, J. Appl. Meteorol. Clim., 47, 2712–2728, https://doi.org/10.1175/2008JAMC1890.1, 2008 (data available at: https://atmos.tamucc.edu/trmm/data/, last access: 31 December 2024). a
Mansell, E. R. and Ziegler, C. L.: Aerosol Effects on Simulated Storm Electrification and Precipitation in a Two-Moment Bulk Microphysics Model, J. Atmos. Sci., 70, 2032–2050, https://doi.org/10.1175/JAS-D-12-0264.1, 2013. a, b, c
Mao, X., Rutherford, D., Osipova, L., and Georgeff, E.: Exporting emissions: Marine fuel sales at the Port of Singapore, Tech. rep., Internation Council on Clean Transportation, https://doi.org/10.13140/RG.2.2.19050.18886, 2022. a
NOAA Physical Sciences Laboratory: Download Climate Timeseries: ONI, NOAA Physical Sciences Laboratory [data set], https://www.psl.noaa.gov/data/correlation/oni.data, last access: 21 February 2024. a
Peterson, M.: Interactions Between Lightning and Ship Traffic, Earth and Space Science, 10, e2023EA002926, https://doi.org/10.1029/2023EA002926, 2023. a
Port of Singapore: Bunkering Statistics, https://www.mpa.gov.sg/port-marine-ops/marine-services/bunkering/bunkering-statistics (last access: 31 December 2024), 2024. a
Platnick, S., Meyer, K. G., King, M. D., Wind, G., Amarasinghe, N., Marchant, B., Arnold, G. T., Zhang, Z., Hubanks, P. A., Holz, R. E., Yang, P., Ridgway, W. L., and Riedi, J.: MODIS Atmosphere L2 Cloud Product (06_L2), NASA MODIS Adaptive Processing System, Goddard Space Flight Center, USA [data set], https://doi.org/10.5067/MODIS/MYD06_L2.061, 2015. a
Pradhan, R. K. and Markonis, Y.: Performance Evaluation of GPM IMERG Precipitation Products over the Tropical Oceans Using Buoys, J. Hydrometeorol., 24, 1755–1770, https://doi.org/10.1175/JHM-D-22-0216.1, 2023. a
Radke, L. F., Coakley, J. A., and King, M. D.: Direct and Remote Sensing Observations of the Effects of Ships on Clouds, Science, 246, 1146–1149, https://doi.org/10.1126/science.246.4934.1146, 1989. a
Rodger, C. J., Brundell, J. B., Holzworth, R. H., Lay, E. H., Crosby, N. B., Huang, T.-Y., and Rycroft, M. J.: Growing Detection Efficiency of the World Wide Lightning Location Network, AIP Conference Proceedings, 1118, 15–20, https://doi.org/10.1063/1.3137706, 2009 (data available at: https://www.wwlln.net, last access 31 December 2024). a
Romps, D. M., Charn, A. B., Holzworth, R. H., Lawrence, W. E., Molinari, J., and Vollaro, D.: CAPE Times P Explains Lightning Over Land But Not the Land-Ocean Contrast, Geophys. Res. Lett., 45, 12623–12630, https://doi.org/10.1029/2018GL080267, 2018. a, b, c, d
Seinfeld, J. H., Bretherton, C., Carslaw, K. S., Coe, H., DeMott, P. J., Dunlea, E. J., Feingold, G., Ghan, S., Guenther, A. B., Kahn, R., Kraucunas, I., Kreidenweis, S. M., Molina, M. J., Nenes, A., Penner, J. E., Prather, K. A., Ramanathan, V., Ramaswamy, V., Rasch, P. J., Ravishankara, A. R., Rosenfeld, D., Stephens, G., and Wood, R.: Improving our fundamental understanding of the role of aerosol−cloud interactions in the climate system, P. Natl. Acad. Sci. USA, 113, 5781–5790, https://doi.org/10.1073/pnas.1514043113, 2016. a
Seppälä, S. D., Kuula, J., Hyvärinen, A.-P., Saarikoski, S., Rönkkö, T., Keskinen, J., Jalkanen, J.-P., and Timonen, H.: Effects of marine fuel sulfur restrictions on particle number concentrations and size distributions in ship plumes in the Baltic Sea, Atmos. Chem. Phys., 21, 3215–3234, https://doi.org/10.5194/acp-21-3215-2021, 2021. a
Staff, N.: NCAR Climate Data Guide: Regridding Overview, https://climatedataguide.ucar.edu/climate-tools/regridding-overview (last access: 31 December 2024), 2014. a
Sun, R., Lu, X., Gao, M., Du, Y., Lin, H., Wright, C., He, C., and Yin, K.: The impacts of shipping emissions on lightning: roles of aerosol-radiation-interactions and aerosol-cloud-interactions, Environ. Res. Lett., 19, 034038, https://doi.org/10.1088/1748-9326/ad2aba, 2024. a
Takahashi, T. and Miyawaki, K.: Reexamination of Riming Electrification in a Wind Tunnel, J. Atmos. Sci., 59, 1018–1025, https://doi.org/10.1175/1520-0469(2002)059<1018:ROREIA>2.0.CO;2, , 2002. a
Tao, W.-K., Chen, J.-P., Li, Z., Wang, C., and Zhang, C.: Impact of aerosols on convective clouds and precipitation, Rev. Geophys., 50, RG2001, https://doi.org/10.1029/2011RG000369, 2012. a
Thornton, J. A., Virts, K. S., Holzworth, R. H., and Mitchell, T. P.: Lightning enhancement over major oceanic shipping lanes, Geophys. Res. Lett., 44, 9102–9111, https://doi.org/10.1002/2017GL074982, 2017. a, b
Twomey, S.: The Influence of Pollution on the Shortwave Albedo of Clouds, J. Atmos. Sci., 34, 1149–1152, https://doi.org/10.1175/1520-0469(1977)034<1149:TIOPOT>2.0.CO;2, 1977. a
Varble, A. C., Igel, A. L., Morrison, H., Grabowski, W. W., and Lebo, Z. J.: Opinion: A critical evaluation of the evidence for aerosol invigoration of deep convection, Atmos. Chem. Phys., 23, 13791–13808, https://doi.org/10.5194/acp-23-13791-2023, 2023. a
Wang, Y., Zhu, Y., Wang, M., Rosenfeld, D., Gao, Y., Yao, X., Sheng, L., Efraim, A., and Wang, J.: Validation of satellite-retrieved CCN based on a cruise campaign over the polluted Northwestern Pacific ocean, Atmos. Res., 260, 105722, https://doi.org/10.1016/j.atmosres.2021.105722, 2021. a
Watson-Parris, D., Christensen, M. W., Laurenson, A., Clewley, D., Gryspeerdt, E., and Stier, P.: Shipping regulations lead to large reduction in cloud perturbations, P. Natl. Acad. Sci. USA, 119, e2206885119, https://doi.org/10.1073/pnas.2206885119, 2022. a
Watters, D. C., Gatlin, P. N., Bolvin, D. T., Huffman, G. J., Joyce, R., Kirstetter, P., Nelkin, E. J., Ringerud, S., Tan, J., Wang, J., and Wolff, D.: Oceanic Validation of IMERG-GMI Version 6 Precipitation Using the GPM Validation Network, J. Hydrometeorol., 25, 125–142, https://doi.org/10.1175/JHM-D-23-0134.1, 2023. a
Williams, E., Rosenfeld, D., Madden, N., Gerlach, J., Gears, N., Atkinson, L., Dunnemann, N., Frostrom, G., Antonio, M., Biazon, B., Camargo, R., Franca, H., Gomes, A., Lima, M., Machado, R., Manhaes, S., Nachtigall, L., Piva, H., Quintiliano, W., Machado, L., Artaxo, P., Roberts, G., Renno, N., Blakeslee, R., Bailey, J., Boccippio, D., Betts, A., Wolff, D., Roy, B., Halverson, J., Rickenbach, T., Fuentes, J., and Avelino, E.: Contrasting convective regimes over the Amazon: Implications for cloud electrification, J. Geophys. Res.-Atmos., 107, LBA 50-1–LBA 50-19, https://doi.org/10.1029/2001JD000380, 2002. a
Wright, C.: Lightning Declines Over Shipping Lanes Follow Regulation of Fuel Sulfur: Data Analysis, Zenodo [code], https://doi.org/10.5281/zenodo.11373991, 2024. a, b
Yuan, T., Song, H., Wood, R., Wang, C., Oreopoulos, L., Platnick, S. E., von Hippel, S., Meyer, K., Light, S., and Wilcox, E.: Global reduction in ship-tracks from sulfur regulations for shipping fuel, Science Advances, 8, eabn7988, https://doi.org/10.1126/sciadv.abn7988, 2022. a, b
Zhu, Y., Rosenfeld, D., and Li, Z.: Under What Conditions Can We Trust Retrieved Cloud Drop Concentrations in Broken Marine Stratocumulus?, J. Geophys. Res.-Atmos., 123, 8754–8767, https://doi.org/10.1029/2017JD028083, 2018. a, b, c