the Creative Commons Attribution 4.0 License.
the Creative Commons Attribution 4.0 License.
 | 03 Mar 2025
Emissions of intermediate-volatility and semi-volatile organic compounds (I/SVOCs) from different cumulative-mileage diesel vehicles at various ambient temperatures
Shuwen Guo
Xuan Zheng
Lewei Zeng
Liqiang He
Xian Wu
Yifei Dai
Zihao Huang
Ting Chen
Shupei Xiao
Yan You
Sheng Xiang
Shaojun Zhang
Jingkun Jiang
Ye Wu
The role of intermediate-volatility and semi-volatile organic compounds (I/SVOCs) in heavy-duty diesel vehicle (HDDV) exhaust remains a significant research gap in previous studies, with limited focus on cumulative mileage and ambient temperature effects. This study analyzed gaseous and particulate I/SVOCs from four in-use HDDVs using thermal desorption two-dimensional gas chromatography–mass spectrometry (TD–GC × GC–MS). The total I/SVOC emission factors (EFs) ranged from 9 to 406 mg km−1, with 79 %–99 % in the gaseous phase. High-mileage vehicles (HMVs) emitted I/SVOCs at levels 8 times greater than low-mileage vehicles (LMVs), highlighting the influence of cumulative mileage. Emission deterioration occurred under both cold-start and hot-running conditions, though HMVs showed no extra sensitivity to cold starts. HMVs also exhibited increasing emissions with component volatility, alongside a higher proportion of oxygenated I/SVOCs (O-I/SVOCs) than LMVs (65 % vs. 42 %). Unique compounds such as phenol, alkenes, and cycloalkanes were detected exclusively in HMV emissions. Temperature effects were most pronounced at 0 °C, where only HMV emissions increased significantly, while LMV emissions remained relatively stable. A strong linear correlation (R2 = 0.93) between I/SVOC EFs and modified combustion efficiency (MCE) suggested that reduced combustion efficiency is a key driver of higher I/SVOC emissions. HMVs also showed 4 times greater secondary organic aerosol formation potential (SOAFP) compared to LMVs. This increase was smaller than the 8-fold rise in EFs, likely due to the higher O-I/SVOC content in HMV emissions.
- Article
(2796 KB) - Full-text XML
-
Supplement
(1102 KB) - BibTeX
- EndNote


As a major air pollutant, fine particulate matter (PM2.5) leads to over 3 million premature deaths globally each year (Apte et al., 2018), mainly due to lung cancer, ischemic heart disease, and stroke (Guan et al., 2018; Xue et al., 2021). Secondary organic aerosol (SOA) accounts for 12 % to 77 % of the total PM2.5 mass based on global source apportionment results (Huang et al., 2014; Sun et al., 2020; Zhang et al., 2021). Observational studies have demonstrated that SOA contributions increase with the severity of pollution during haze episodes in megacities in China (He et al., 2020; Ho, 2016; Li et al., 2015; Azmi and Sharma, 2023; Wang et al., 2023; Wang et al., 2024). Among potential SOA precursors, intermediate-volatility and semi-volatile organic compounds (I/SVOCs), with effective saturation concentrations (C*) between 103 and 106 µg m−3 and between 100 and 102 µg m−3, have been demonstrated to be more effective than volatile organic compounds (VOCs) (Tkacik et al., 2012; Jathar et al., 2013; Morino et al., 2022; Presto et al., 2009; Sommers et al., 2022; Huang et al., 2023).
Heavy-duty diesel vehicles (HDDVs) are recognized as significant sources of I/SVOCs (Alam et al., 2018; Drozd et al., 2021; Liu et al., 2021; Lu et al., 2018; Presto et al., 2009; Zhao et al., 2015). However, the contribution of HDDVs to I/SVOC emissions from on-road motor vehicles in China remains a contentious topic, as indicated by different studies. For example, Zhao et al. (2022) reported that diesel vehicles contributed 85 % of IVOC emissions from on-road mobile sources in China, while Chang et al. (2022) found that diesel vehicles emitted only about 20 % of the IVOCs produced by gasoline vehicles. These discrepancies highlight the urgent need for a more precise assessment of diesel vehicle I/SVOC emission factors (EFs). Previous studies have explored the impact of emission standards, after-treatment technologies, and driving cycles on EFs (Zhao et al., 2015; He et al., 2022b, a; Zhang et al., 2024a), while the influence of cumulative mileage and low ambient temperatures on HDDV emissions remains unexplored. Given that many regions in China experience temperatures below 0 °C during winter, evaluating how HDDVs operate under such conditions is critical for I/SVOC emissions and exhaust component distribution under different temperature conditions.
The complexity of I/SVOC components poses a challenge to accurately measuring HDDV EFs. The alkanes, alkenes, alkynes, cycloalkanes, monocyclic aromatic compounds, and oxygenated organic compounds present in IVOCs are all significant precursors of SOA. Previous analyses of I/SVOCs primarily relied on traditional one-dimensional gas chromatography–mass spectrometry (GC–MS). Due to limitations in separation techniques, many challenging-to-analyze I/SVOCs are grouped as an unresolved complex mixture (UCM), allowing for only rough quantification (Liu et al., 2021; Qi et al., 2019, 2021; Tang et al., 2021; Zhao et al., 2014, 2015, 2016). For example, Zhao et al. (2015) reported that 80 % of I/SVOCs emitted by diesel vehicles was classified as a UCM. This lack of detailed chemical information introduces uncertainties into I/SVOC quantification and prediction of SOA formation potential (SOAFP) (He et al., 2022b).
To address these challenges, our previous studies (He et al., 2022a, b) employed comprehensive two-dimensional gas chromatography (GC × GC), which enhances selectivity, peak capacity, and sensitivity by connecting two capillary columns with complementary stationary phases in series. We developed a method of constructing class-screening programs based on characteristic fragments and mass spectrum patterns in order to identify thousands of organic compounds using GC × GC; they successfully identified over 85 % of the I/SVOCs from HDDV exhaust (He et al., 2022b). Furthermore, we quantified oxygenated I/SVOCs (O-I/SVOCs) and found that the identified O-I/SVOCs resulted in a 45 % difference in the prediction results of SOAFP (He et al., 2022b). Therefore, the application of GC × GC and the qualitative method based on the unique mass spectrum patterns for I/SVOCs (He et al., 2022a, b, 2024) provide a more accurate determination of I/SVOC EFs and the component distribution. This methodology offers a robust foundation for analyzing the effects of cumulative mileage and ambient temperatures on HDDV I/SVOC emissions.
In this study, thermal desorption two-dimensional gas chromatography–mass spectrometry (TD–GC × GC–MS) was utilized in order to analyze gaseous and particulate I/SVOCs emitted from four HDDVs in chassis dynamometer tests. The I/SVOC EFs, gas-to-particle partitioning, and detailed chemical species across vehicles with different cumulative mileage at different ambient temperatures were reported. The role of combustion efficiency in influencing I/SVOC emissions was explored. Additionally, the SOAFP of I/SVOCs in the exhaust of different vehicles was evaluated. The impact of cumulative mileage and ambient temperature on the total I/SVOC emissions in the emission inventory was assessed after incorporating these factors into the EFs.
2.1 Fleet and dynamometer tests
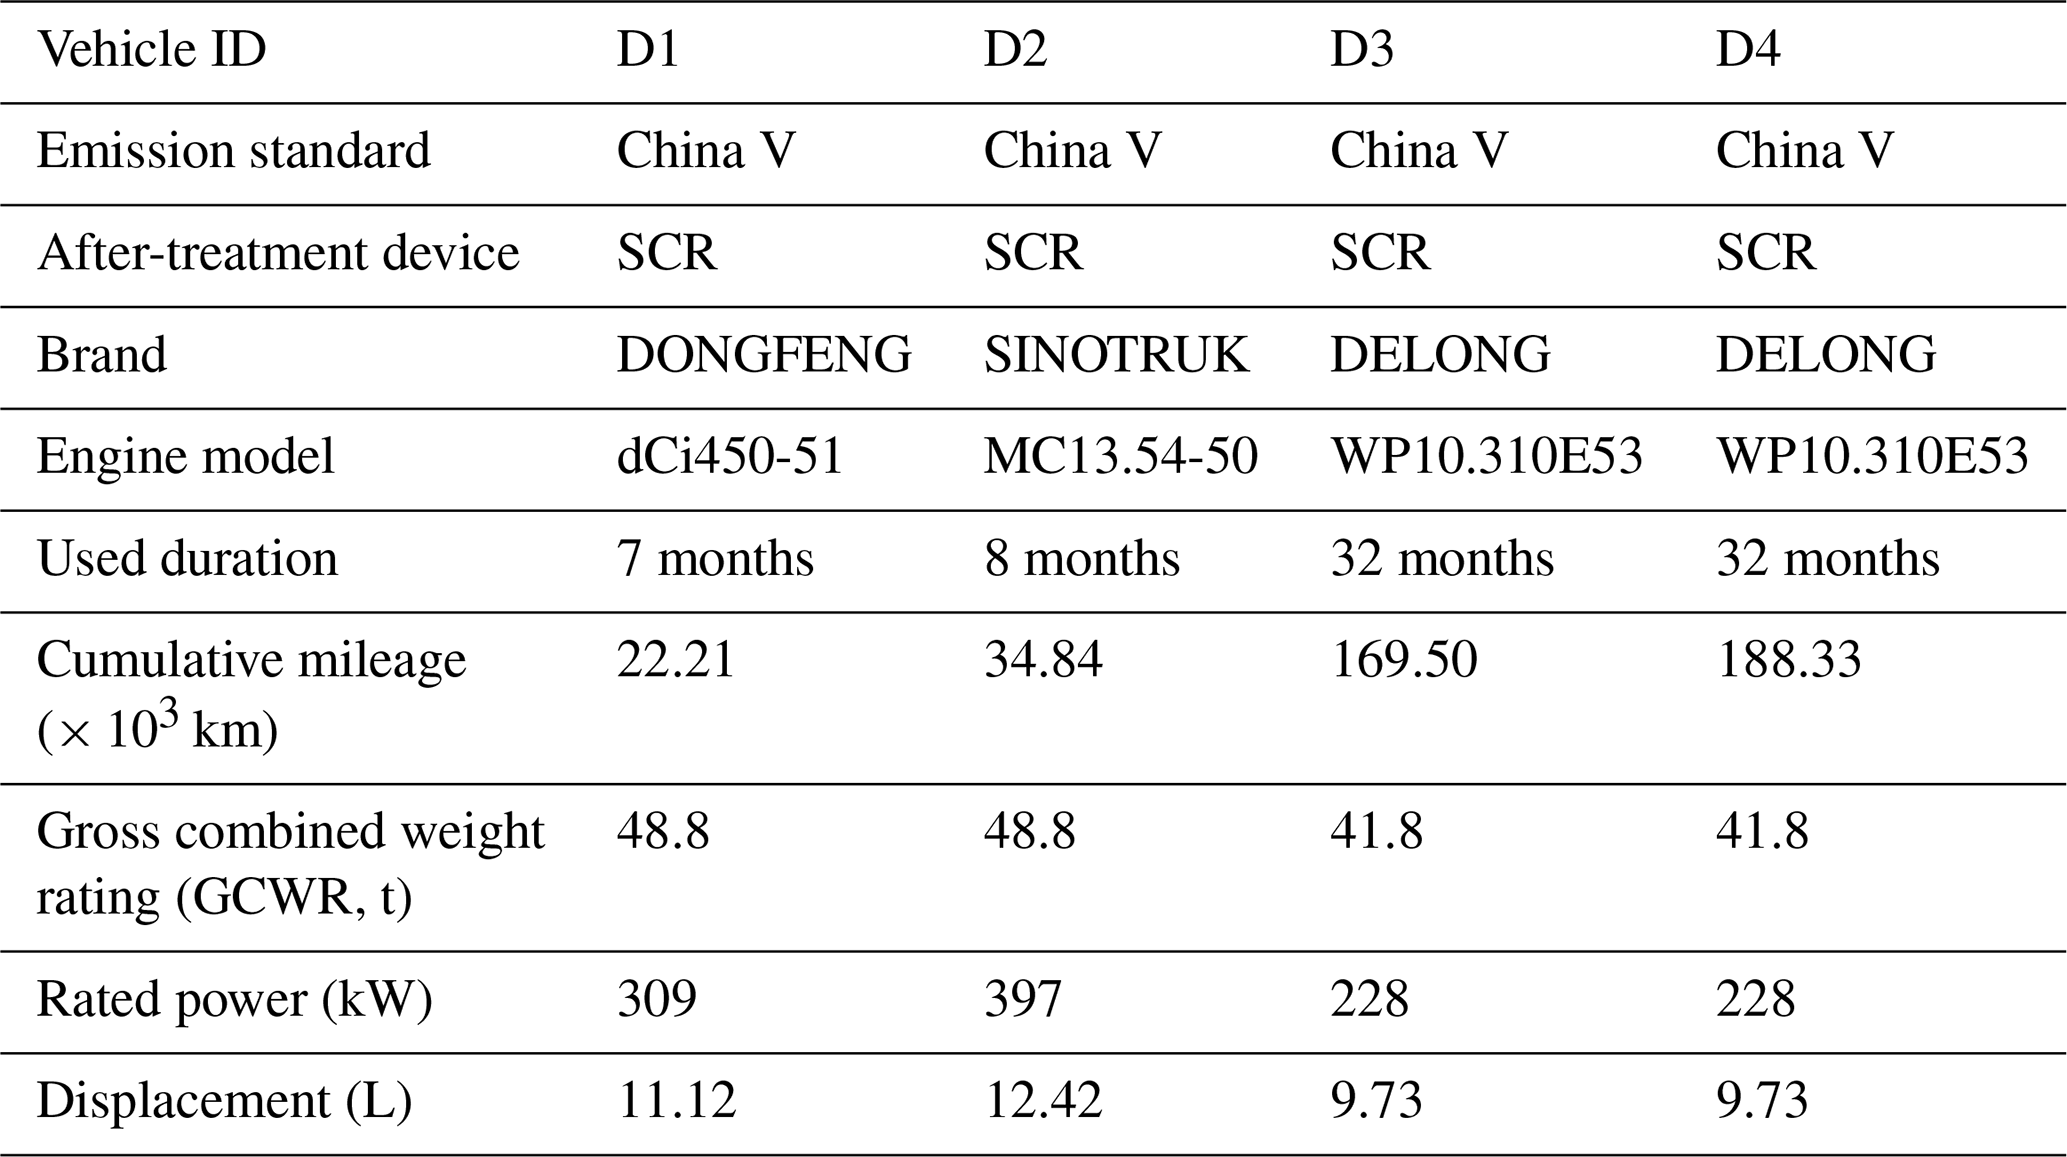
Four in-use HDDVs using China VI 0# diesel fuel were tested on a chassis dynamometer following the China heavy-duty commercial vehicle test cycle for tractor trailers (CHTC-TT) at the China Automotive Technology & Research Center (CATARC) in Guangzhou, China. All tested HDDVs were equipped with selective catalytic reduction (SCR) systems and complied with the China V national emission standard. Two vehicles with lower cumulative mileage were numbered D1 and D2 (low-cumulative-mileage vehicles or LMVs), while the other two with higher cumulative mileage were numbered D3 and D4 (high-cumulative-mileage vehicles or HMVs). To assess the impact of ambient temperature on I/SVOC emissions, emission tests for D2 and D4 were conducted at both 0 and 23 °C. General information about the vehicles is presented in Table 1. The sets of test cycles are listed in Table S1 in the Supplement.
Each CHTC-TT lasts 1800 s, with an average speed of 46.6 km h−1 and a maximum speed of 88 km h−1 (Fig. S2). When the vehicles were driven at the speed on the dynamometer specified by the CHTC-TT, the exhaust emitted from the tailpipes was diluted in the constant-volume sampler (CVS). The exhaust dilution ratio was about 40. The CVS system maintains the airflow of the diluted exhausts at 25 °C in order to avoid thermophoretic and condensational losses. CO2, CO, total hydrocarbons (THC), and NOx from the diluted exhaust were detected by the real-time gas analyzer module (MEXA-7400HLE, HORIBA, Japan) provided by CATARC, and a series of offline test samples was also collected from the CVS.
2.2 Sampling and analysis
The diluted exhaust from the CVS was filtered with a 47 mm PTFE filter (R2PJ047, PALL Corporation, USA) and then collected by Tenax TA tubes (C1-AAXX-5003, MARKES International, UK) and 47 mm quartz filters (grade QM-A, Whatman, UK), respectively, in order to analyze I/SVOCs and gas-phase organic compounds adsorbed on quartz filters (Qgas, Fig. S6). Note that two TA tubes were connected in series for each sampling in order to prevent penetration, and the quantitative results from the two connected tubes were ultimately added together. Particulate matter in the exhaust of the CVS was also captured by another parallel pipe with a 47 mm quartz filter (Qtotal) for analysis of the particulate organic compounds, mainly I/SVOCs. The accurate mass of particulate organics was obtained by subtracting Qgas from Qtotal in order to avoid adsorption of gaseous organic compounds. Qgas accounted for 32 % of the Qtotal, as detailed in Sect. 3.2. Thus, the total I/SVOC results in this paper were gaseous I/SVOCs collected by TA tubes plus particulate I/SVOCs collected by quartz filters after deducting artifacts (total I/SVOCs = TA + (1 %–32 %) × Qtotal). Notably, the gas phase of I/SVOCs was collected after passing through a PTFE filter, but the separation of gas and particle I/SVOCs beyond the PTFE filter may disrupt the equilibrium between them. This disruption could cause the evaporation of particle I/SVOCs, potentially leading to an overestimation of Qgas (Cheng et al., 2010). Cheng et al. (2010) evaluated the collection artifacts of organic carbon using various quartz filter sampling methods and found that about 10 % of the Qgas was derived from volatilized particulate organic carbon using the sampling method of this study. Therefore, the Qgas in this study may be slightly overestimated. The TA tubes were prebaked at 320° for 2 h and at 335° for 30 min. The quartz filters were also prebaked for 8 h at 550° in a muffle furnace to remove carbonaceous contamination. All quartz filter samples were stored at −20°.
Each TA tube was injected with 2 µL of deuterated internal standard mixing solution (IS) through a mild nitrogen blow (CSLR, MARKES International, UK) before TD–GC × GC–MS analysis. The TD–GC × GC–MS system was composed of an autosampler with a thermal desorber (ULTRA-xr™ and UNITY-xr™, MARKES International, UK) and a solid-state modulator (SSM1810, J&X Technologies, China) installed on a gas chromatograph (8890, Agilent Technologies, USA) coupled with a mass spectrometer (5977 B, Agilent Technologies, USA). The quartz filter samples were also injected with the same IS and then inserted into clean quartz tubes (C0-FXXX-0000, MARKES International, UK) for TD–GC × GC–MS analysis.
In the thermal desorption unit, TA tube (quartz filter) samples were heated at 320° (330°) for 20 min with a trap flow of 50 mL min−1, and then all desorbed organics were captured by the cold trap (U-T1HBL-2S, MARKES International, UK). Subsequently, the cold trap was heated at 330° (340°) for 5 min so that the organics could enter GC × GC to be separated and detected by MS. In GC × GC, four different columns (Agilent Technologies, USA) were connected in series from front to back: 30 m DB-5MS, 0.6 m VF-1ms, 0.7 m CP802510 (open tubular column), and 1.2 m DB-17MS. Of these, VF-1ms switched between the cold and hot zones of the modulator. Hence, the organics that underwent the first separation entered the subsequent columns in the form of a pulse for the second separation. The 8890 oven and the hot zone of the modulator matched the same heating program: maintained at 50 °C for 3 min, increased to 310 °C at a rate of 5 °C min−1, and then maintained for 5 min. The cold zone of the modulator dropped from 9 to −51 °C at the fastest speed and was maintained for 21.8 min; it then rose to 9 °C at a rate of 20 °C min−1 and was maintained for 34 min.
2.3 Qualitative analysis and quantification of I/SVOCs
The I/SVOCs were identified and quantified with their respective authentic standards or surrogates using the three-step approach proposed by He et al. (2022b). Given that more than 1500 peaks were typically observed, it was not feasible to accurately identify and quantify every individual peak. To address this, the organic compounds in the samples were categorized into 11 groups, each associated with a specific mass spectrometry rule under electron energy 70 eV. The peaks without external standard (ES) curves were quantified by the closest and same ES groups. A total of 120 ES curves was used in this study to cover as many organic compounds as possible, as shown in Fig. S4. All information on the ES curves is listed in Tables S2 and S1 with descriptions of all the organic category names. The elution peak area that cannot be recognized by any identification code accounts for about 20 % of the total peak area, which was not quantified in this study.
2.4 Emission factor calculation
All pollutant data were reported as distance-based and fuel-based EFs:
where Δmi is the measured background-corrected mass of species i (mg). s is the distance traveled by the vehicle in a test cycle (km). wC is the measured carbon mass fraction of fuel (0.82). ΔCO2 and ΔCO are the background-corrected masses of CO2 and CO.
2.5 Modified combustion efficiency (MCE) calculation
MCE was applied here to represent the combustion efficiency in each measurement, as displayed in
where [CO2]i and [CO]i are the instantaneous mixing ratios of CO2 and CO at second i during the entire cycle where n is equal to 1800 s.
2.6 Emission inventory calculation
According to the official guide (Ministry of Ecology and Environment of the People's Republic of China, 2024) and the national HDDV population in 2022, the emission inventory was established based on
where En is the total mass of I/SVOC emissions of the different cases in this study. P is the vehicle population. VKT represents the calibrated number of annual kilometers traveled per vehicle, which is considered to be 87 786.15 km (240.51 km d−1 × 365 d) for each freight vehicle (https://mp.weixin.qq.com/s/oeiU9Vu3kLlld6wjbnH56w, last access: 27 February 2025). EFn is the emission factor of the I/SVOCs of the different cases (mg km−1). Three cases are assumed in this study.
2.7 SOAFP estimation
The SOAFP derived from I/SVOCs was estimated following the approach of Zhao et al. (2015). The SOAFP (mg km−1) produced over a period (Δt) was calculated as follows:
where EFi is the emission factor of pollution i (mg km−1). is the hydroxyl (OH) radical reaction rate constant of compound i at 25°. [OH] is the OH concentration, assumed to be 1.5 × 10⁶ molec. cm−3. Δt is the photooxidation time (s). Yi is the SOA yield of precursor i.
3.1 Overall results
The HDDV I/SVOC EFs ranged from 9 to 406 mg km−1 (41 to 1848 mg kg-fuel−1) in this study, consistent with previous findings and indicating a broad range of I/SVOC EFs from HDDVs. For example, Zhao et al. (2015) reported that the IVOC EFs of assorted heavy-duty vehicles were 17 to 5354 mg kg-fuel−1, with various driving cycles and after-treatments. Similarly, He et al. (2022b) showed that the I/SVOC EFs of the China V and China V HDDVs ranged from 38 to 18 900 mg kg-fuel−1, attributing this extensive range to the significant differences in after-treatments and emission standards of vehicles. Zhang et al. (2024a) tested two China V HDDVs and reported that the gaseous I/SVOC EFs were 2034 and 2054 mg kg-fuel−1, respectively.
To analyze the I/SVOC component and volatility distribution further, the average EFs of all the test cycles were divided into seven intervals based on log10C*, as shown in Fig. S5. Overall, IVOCs dominated the I/SVOC emissions with an average contribution of 81 %, with the remaining 19 % attributed to SVOCs. The primary contributors to the total number of identified EFs, ranked from high to low, were alkanes (including n- and i-alkanes, 20 %), oxy-PAH (polycyclic aromatic hydrocarbon) and oxy-benzene (20 %), phenol (14 %), acids (11 %), PAH_3rings (11 %), alcohol (10 %), and carbonyls (7 %). The proportion of O-I/SVOCs (including alcohols, phenols, carbonyls, acids, oxy-PAHs, and oxy-benzenes) accounted for 61 % of the total. The proportions of the other categories were lower than 5 %.
The proportion of O-I/SVOCs was notably higher in this study compared to previous research, where alkanes typically accounted for 37 % to 66 % and O-I/SVOCs for 20 % to 27 % (He et al., 2022b; Zhang et al., 2024a). The discrepancy may relate to differences in the types of vehicles tested and variations in the composition of diesel and lubricating oils. Most of the detected alkanes in this study were present in relatively higher-volatility bins like bin 6 (log10C* = 6), while PAHs were distributed across bins 1 to 4. For O-I/SVOCs, alcohols and phenols mainly fell into bin 5, while oxy-PAHs and oxy-benzenes exhibited decreasing concentrations with decreasing volatility. Although a higher acid proportion was detected in this study compared to previous work (He et al., 2022b; Zhang et al., 2024a), its contribution to SOA production was considered minimal due to its low SOA yields (Huang et al., 2024).
3.2 Gas-particle partitioning and I/SVOC artifacts on quartz filters
Generally, the gaseous I/SVOCs consistently accounted for 79 %–99 % of the I/SVOC total, while the particulate I/SVOCs contributed 1 %–21 %. However, Liu et al. (2021) reported that China V HDDVs could emit more particulate I/SVOCs than gaseous I/SVOCs. This discrepancy may be due to the use of series sampling with a quartz filter and a TA tube, which can lead to the adsorption of a substantial fraction of gaseous I/SVOCs onto the quartz filters (artifacts), causing these compounds to be mistakenly categorized as particulate-phase ones. At the same time, the adsorption onto the front quartz filters reduces the amount of gaseous I/SVOCs that reach the rear TA tubes, resulting in the final calculated proportion of particulate I/SVOCs exceeding 50 %.
To assess the impact of adsorption artifacts on quartz filters, Qgas samples from the hot-start cycles of the tested vehicles were analyzed. Results indicated that artifacts accounted for 32 % ± 14 % of the mass fractions in quartz filters, consistent with previous findings (May et al., 2013). Including these artifacts directly in the particulate-phase measurement introduces significant uncertainty into the calculated emission inventory, especially for IVOCs, and amplifies the uncertainties in environmental impact predictions related to emission sources. As illustrated in Fig. S6a, IVOCs dominated the artifacts on quartz filters, representing 98 % of the mass, while SVOCs made up only 2 %. From a chemical composition perspective, carbonyls were most affected by adsorption artifacts (Fig. S6b). However, accurately determining the adsorption capacity of quartz filters for gaseous I/SVOCs or predicting the point of saturation remains a challenge due to variability in filter properties for different manufacturers and production batches (Kirchstetter et al., 2001). Therefore, it is essential to minimize or eliminate particle quantification errors caused by adsorption artifacts in order to reduce uncertainties in subsequent modeling efforts. This is particularly crucial when assessing the environmental impact of IVOCs, given their substantial role in SOA formation and pollution forecasting.
3.3 I/SVOC EFs and composition from HDDVs with varying cumulative mileage
Figure 1a presents the distance-based EFs of I/SVOCs for HMVs and LMVs. The data reveal that the average I/SVOC EFs of HMVs (D3 and D4, 190 ± 94 mg km−1) were approximately 8 times higher than those of LMVs (D1 and D2, 23 ± 11 mg km−1), even though HMVs consumed less fuel on average (26 L 100 km−1) than LMVs (33 L 100 km−1) for their lower gross combined weight rating (GCWR). The significant disparity in I/SVOC EFs between HMVs and LMVs indicates that cumulative mileage is a critical factor influencing I/SVOC EFs (p= 0.005 for hot-start cycles), which has often been overlooked in previous studies. For instance, both the official guideline (https://www.mee.gov.cn/xxgk2018/xxgk/xxgk06/202401/W020240130539574113045.pdf, last access: 27 February 2025) and the COPERT 4 model, the latest vehicular emission factor model (Cai and Xie, 2013), do not account for the deterioration of organic emissions (e.g., THC) from diesel vehicles.
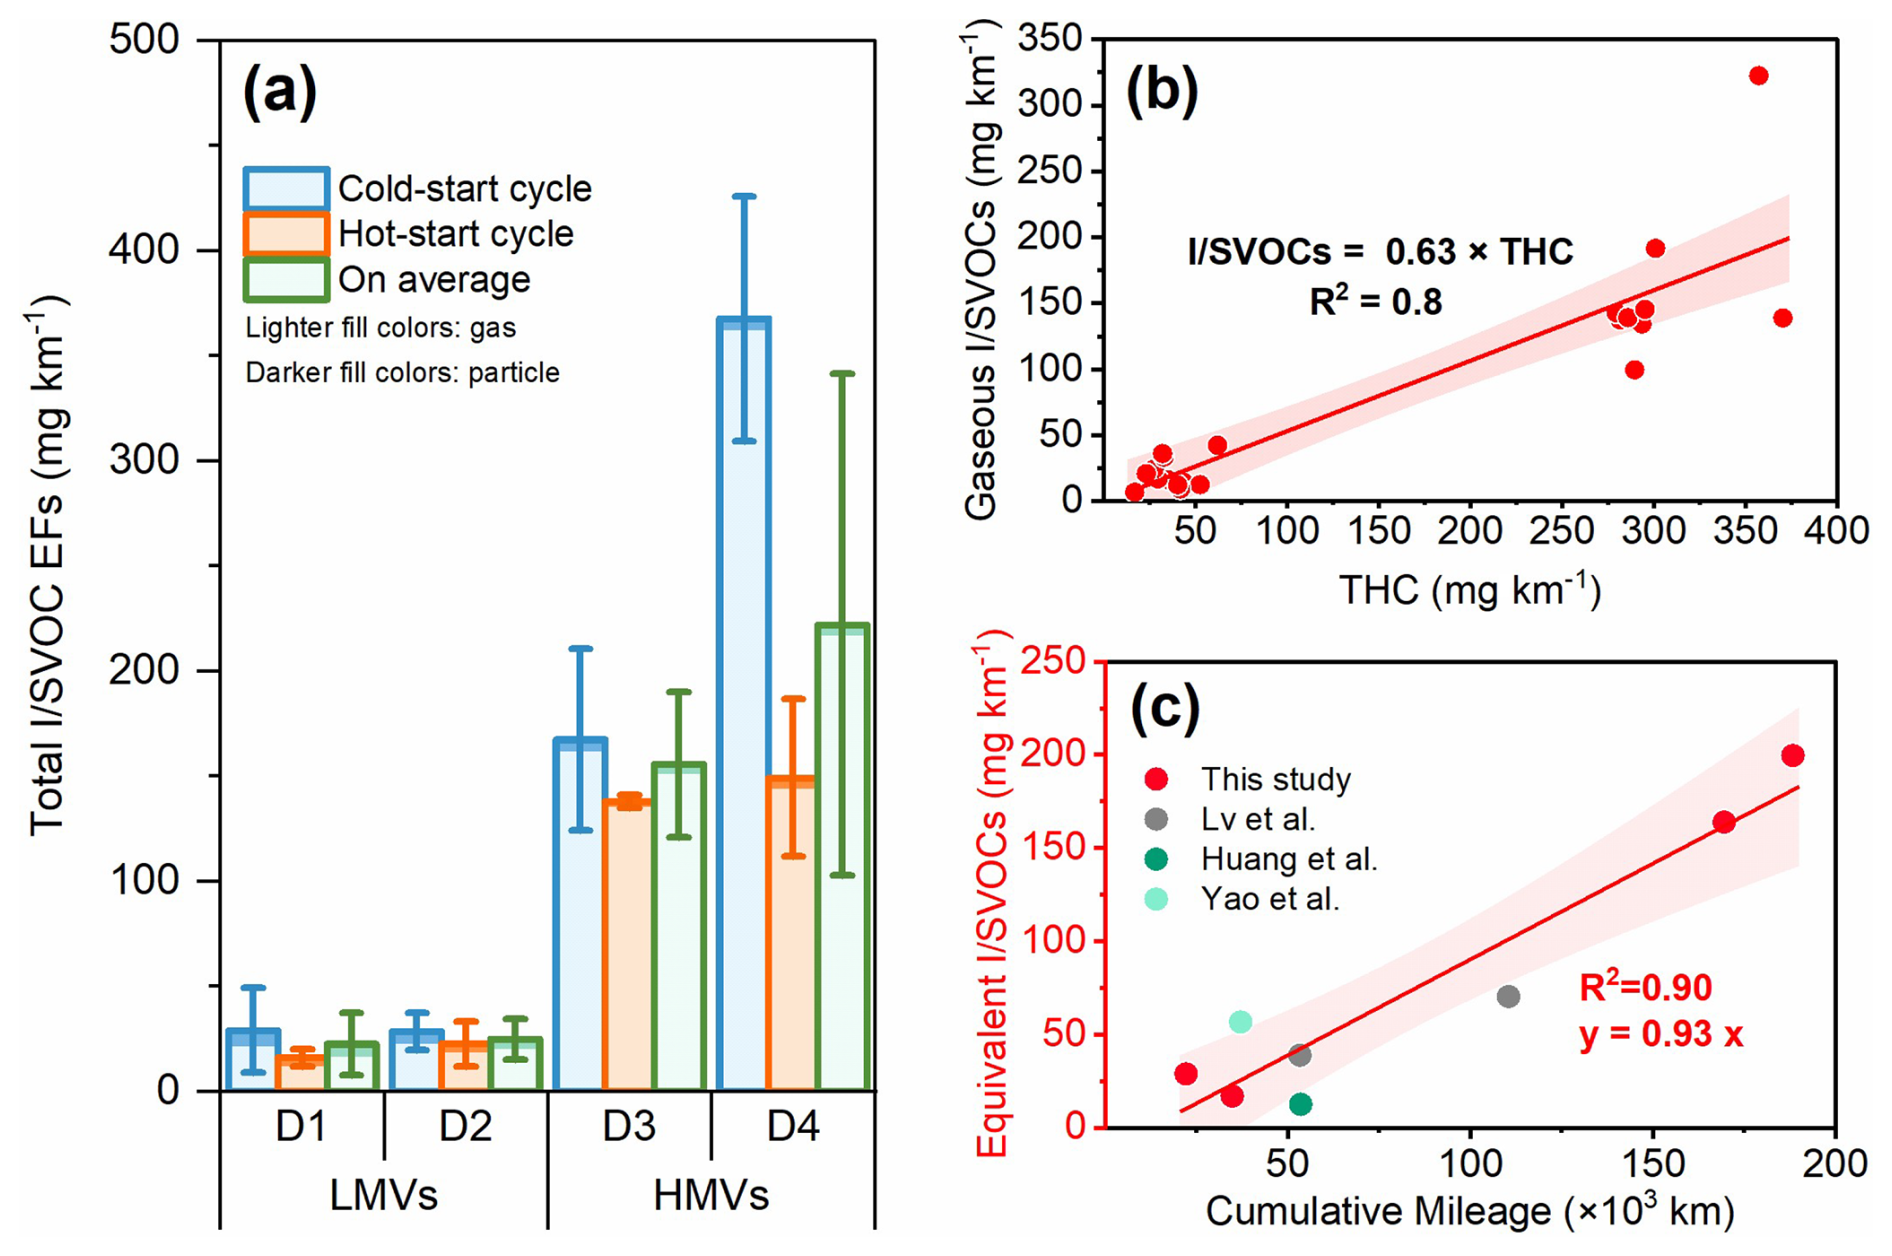
Figure 1(a) The bar chart represents the I/SVOC EF total from each HDDV in cold- and hot-start driving cycles. The error bars are the standard deviations. Gaseous and particulate I/SVOCs are represented by the lighter and darker fill colors, respectively. The horizontal axis shows the vehicle IDs. (b) The linear correlation between the gaseous I/SVOC and THC EFs. (c) The linear correlation between the THC EFs and HDDV cumulative mileage. The data are from this study and previous studies (Huang et al., 2013; Lv et al., 2020; Yao et al., 2015), of which the tested vehicles shared the same THC emission limit (Chinese IV/V and European IV/V emission standards limit diesel engine THC EFs to 460 mg kWh−1) and had similar weights.
To investigate the underlying causes of high I/SVOC emissions from HMVs, we compared the MCE of each test cycle. As shown in Fig. S7, a strong correlation (R2 = 0.73) was observed between MCE and I/SVOC EFs. As combustion efficiency decreases, I/SVOC EFs rise and HMVs exhibit greater variability in MCE than LMVs. This suggests that cumulative mileage contributes to increased emissions, emphasizing the need to incorporate this factor into emission inventories and SOA estimation. Given the scarcity of I/SVOC EF data in previous studies (Huang et al., 2013; Yao et al., 2015; Lv et al., 2020), we estimated the emission deterioration factors of I/SVOCs by leveraging the strong correlation between THC and I/SVOC emissions and the available THC EFs. Figure 1c demonstrates a linear relationship (R2= 0.9) between equivalent I/SVOCs and cumulative mileage. It should be noted that existing research primarily focuses on diesel vehicles with a cumulative mileage below 200 000 km. Further experiments are necessary to determine whether I/SVOC emissions from designated HDDVs with over 200 000 km in mileage will continue to increase linearly or stabilize. Also, the brands, engine models, GCWRs, and displacements of the four HDDVs were slightly different (Table 1), which might introduce some uncertainty into the emission analysis results (Zeng et al., 2024; Tolouei and Titheridge, 2009; Aosaf et al., 2022). Future studies should further consider the uncertainties brought on by these factors.
Additionally, we examined cold-start extra emissions (CSEEs), which form the difference between emissions from the cold-start and hot-start cycle results. For HMVs, CSEEs ranged from 657 to 5592 mg, whereas for LMVs they ranged from 79 to 281 mg. CSEEs contributed 18 % to 59 % of the total cold-start cycle emissions for HMVs and 21 % to 45 % for LMVs, respectively. This showed that I/SVOC emission deterioration could occur under both cold-start and hot-running conditions.
To compare the volatility and category distribution further, the average EFs of HMVs and LMVs are shown separately in Fig. 2. The EF ratios across the different volatility bins exhibited a decreasing trend with decreasing volatility, indicating that the elevated I/SVOC EFs of HMVs were primarily due to a marked increase in organics within the volatility range of bins 2 to 6. Figure 2 further depicts the relative proportion of distinct organic groups present in I/SVOC emissions, and their EFs are shown in Fig. S9. The EFs of all organic compounds emitted by HMVs were higher than those of LMVs, but the magnitude of the increase varied. Except for phenol, alkene, and cycloalkane, the organic group with the highest HMV : LMV ratio was carbonyls, i.e., 34 as shown in Fig. S9. The next highest is oxy-PAH and oxy-benzene, whose HMV : LMV ratio reached 11. The ratios of PAH_2rings, alcohol, and alkane were 7 each. Overall, the HMV : LMV ratios of O-I/SVOCs were relatively higher and contributed 65 % of the I/SVOC emissions from HMVs compared to 42 % for LMVs. Since the SOA yields of O-I/SVOCs are lower than those of hydrocarbon-like I/SVOCs in the same bin (Chacon-Madrid and Donahue, 2011), variations in O-I/SVOC proportions directly impacted the SOAFP gap between HMVs and LMVs, which will be discussed further in Sect. 3.5. Alkane as well as oxy-PAH and oxy-benzene were the dominant contributors to I/SVOCs for both HMVs and LMVs. PAH_3rings contributed 8 % of the I/SVOC emissions for HMVs and 23 % for LMVs. Interestingly, phenol, alkene, and cycloalkane were not detected in any of the LMV samples.
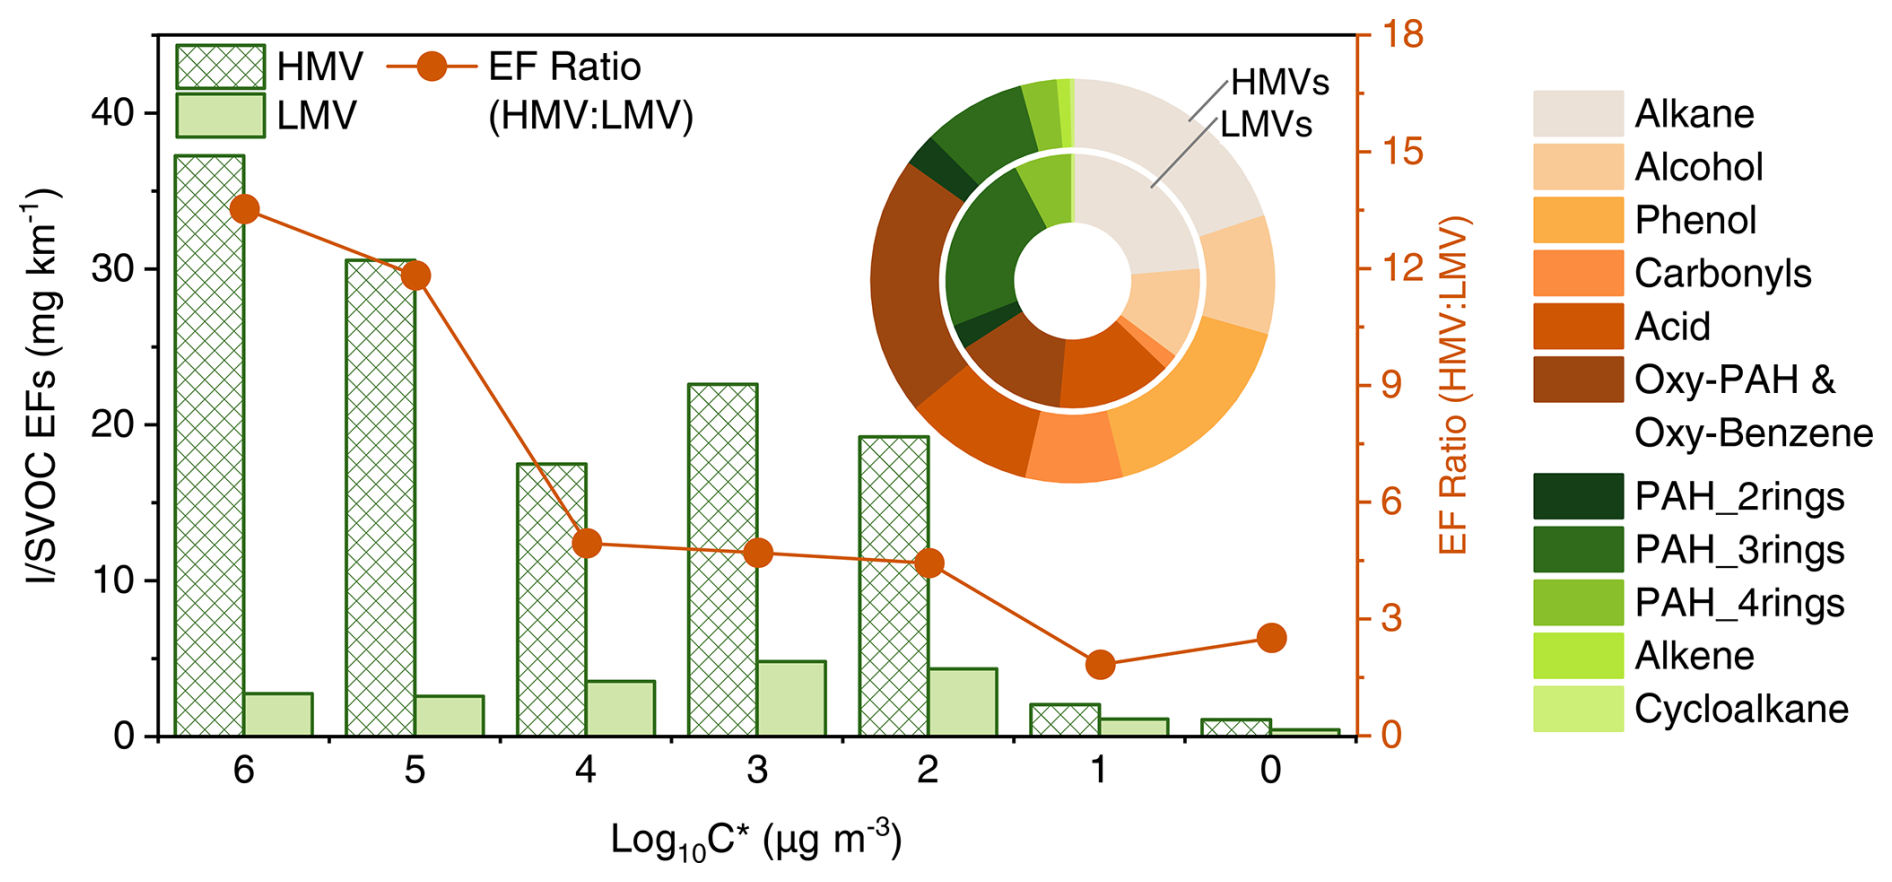
Figure 2The average volatility distribution of I/SVOCs of LMVs and HMVs. The red dots represent the EF ratio of HMV and LMV I/SVOCs (HMVs:LMVs). For the circular graph, the differently colored blocks represent the proportion of different organic groups in I/SVOCs, where the inner ring represents the average data from LMVs and the outer ring those from HMVs.
3.4 Low ambient temperature effect on the I/SVOC EF total and composition
The I/SVOC emissions during the hot-start cycle from LMVs (D2) and HMVs (D4) were tested at ambient temperatures of 0 and 23°. As shown in Fig. 3a, a colder ambient temperature increased the I/SVOC EF total of HMVs from 127 to 171 mg km−1 (p= 0.01). In contrast, no statistically significant increase was observed for LMVs (p= 0.23). Figure S7 shows the strong linear correlation (R2= 0.93) between I/SVOC EFs and MCE for LMVs and HMVs for different ambient temperatures. This finding suggests that the decline in MCE is a primary driver of the increase in I/SVOC EFs. Additionally, the MCE of LMVs exhibited greater stability, which explains the absence of elevated I/SVOC emissions at low ambient temperatures compared with HMVs. These results indicate that cumulative mileage enhances the sensitivity of I/SVOC emissions to ambient temperature. Even in the absence of instantaneous emission data of I/SVOCs at different ambient temperatures, the strong linear correlation between THC and I/SVOCs allows us to infer the instantaneous THC emission profile. Figure 3b illustrates that HMVs were more likely to emit higher I/SVOC levels than LMVs during rapid acceleration phases at 0°, such as those occurring from 210 to 220 s or from 1011 to 1032 s. Furthermore, a prior study demonstrated that low temperatures significantly affect VOC emissions from diesel vehicles under cold-start conditions (Dardiotis et al., 2013). Therefore, we recommend that future studies focus on the I/SVOC emissions of vehicles under low-temperature, cold-start conditions.
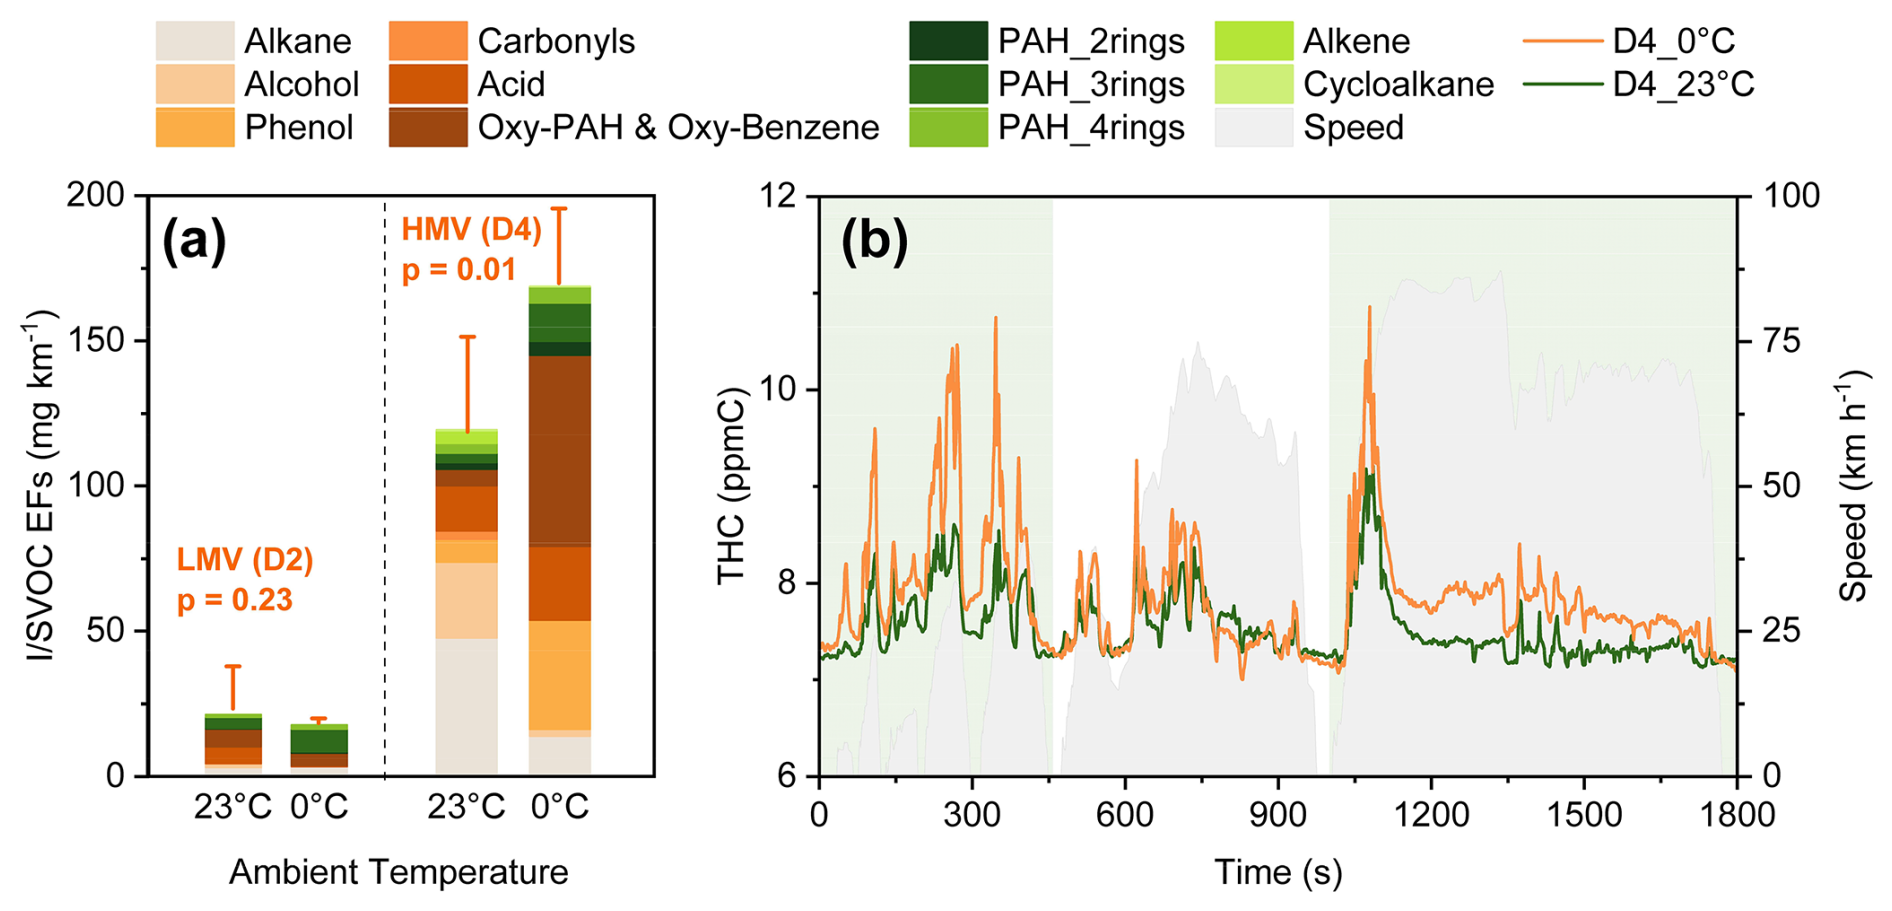
Figure 3(a) Total I/SVOC EFs of D2 and D4 at 0 and 23°. Differently colored bars represent different organic groups. (b) The average instantaneous THC emission concentrations of D4 at 0 °C (orange line) and 23 °C (green line).
Regarding the distribution of I/SVOC categories, the mass fractions of PAHs increased at lower temperatures for both vehicle types (LMVs: from 17 % to 52 %; HMVs: from 10 % to 14 %). Given the toxicity of PAHs, further research on the changes in exhaust gas toxicity in low-temperature environments is warranted, as the elevated PAH emissions may result from incomplete combustion under cold conditions. Additionally, the proportion of O-I/SVOCs in HMVs increased from 52 % to 78 %, while no such trend was observed in LMVs. Within the O-I/SVOCs of HMVs, there was a notable decrease in alcohol, accompanied by a significant increase in carbonyls, oxy-PAH, and oxy-benzene from 23 to 0 °C. This substantial increment of O-I/SVOCs is expected to influence the SOA yield, as O-I/SVOCs typically exhibit a lower SOAFP compared to hydrocarbon-like organics such as alkanes (Chacon-Madrid and Donahue, 2011).
3.5 SOAFP of the I/SVOCs
To evaluate the environmental impact of HDDV exhaust, Fig. 4 depicts the average potential SOA production after 48 h of photooxidation. The estimated SOAFP of HMVs reached 30 mg km−1, approximately 4 times higher than that of LMVs (8 mg km−1). However, the 4-fold increase in SOAFP with cumulative mileage was less pronounced compared to the 8-fold increase observed for I/SVOC EFs. This discrepancy is primarily attributed to the greater increase in O-I/SVOC EFs relative to hydrocarbon-like organics (Chacon-Madrid and Donahue, 2011) (Sect. 3.3, Fig. 2). The largest contributors to SOAFP for HMVs were alkane (19 %), oxy-PAH and oxy-benzene (18 %), and phenol (18 %), whereas, for LMVs, they were alkane (26 %), acid (17 %), and PAH_3rings (17 %). Therefore, alkane, oxy-PAH and oxy-benzene, and phenol were identified as the key contributors driving the increase in SOAFP for HMVs.
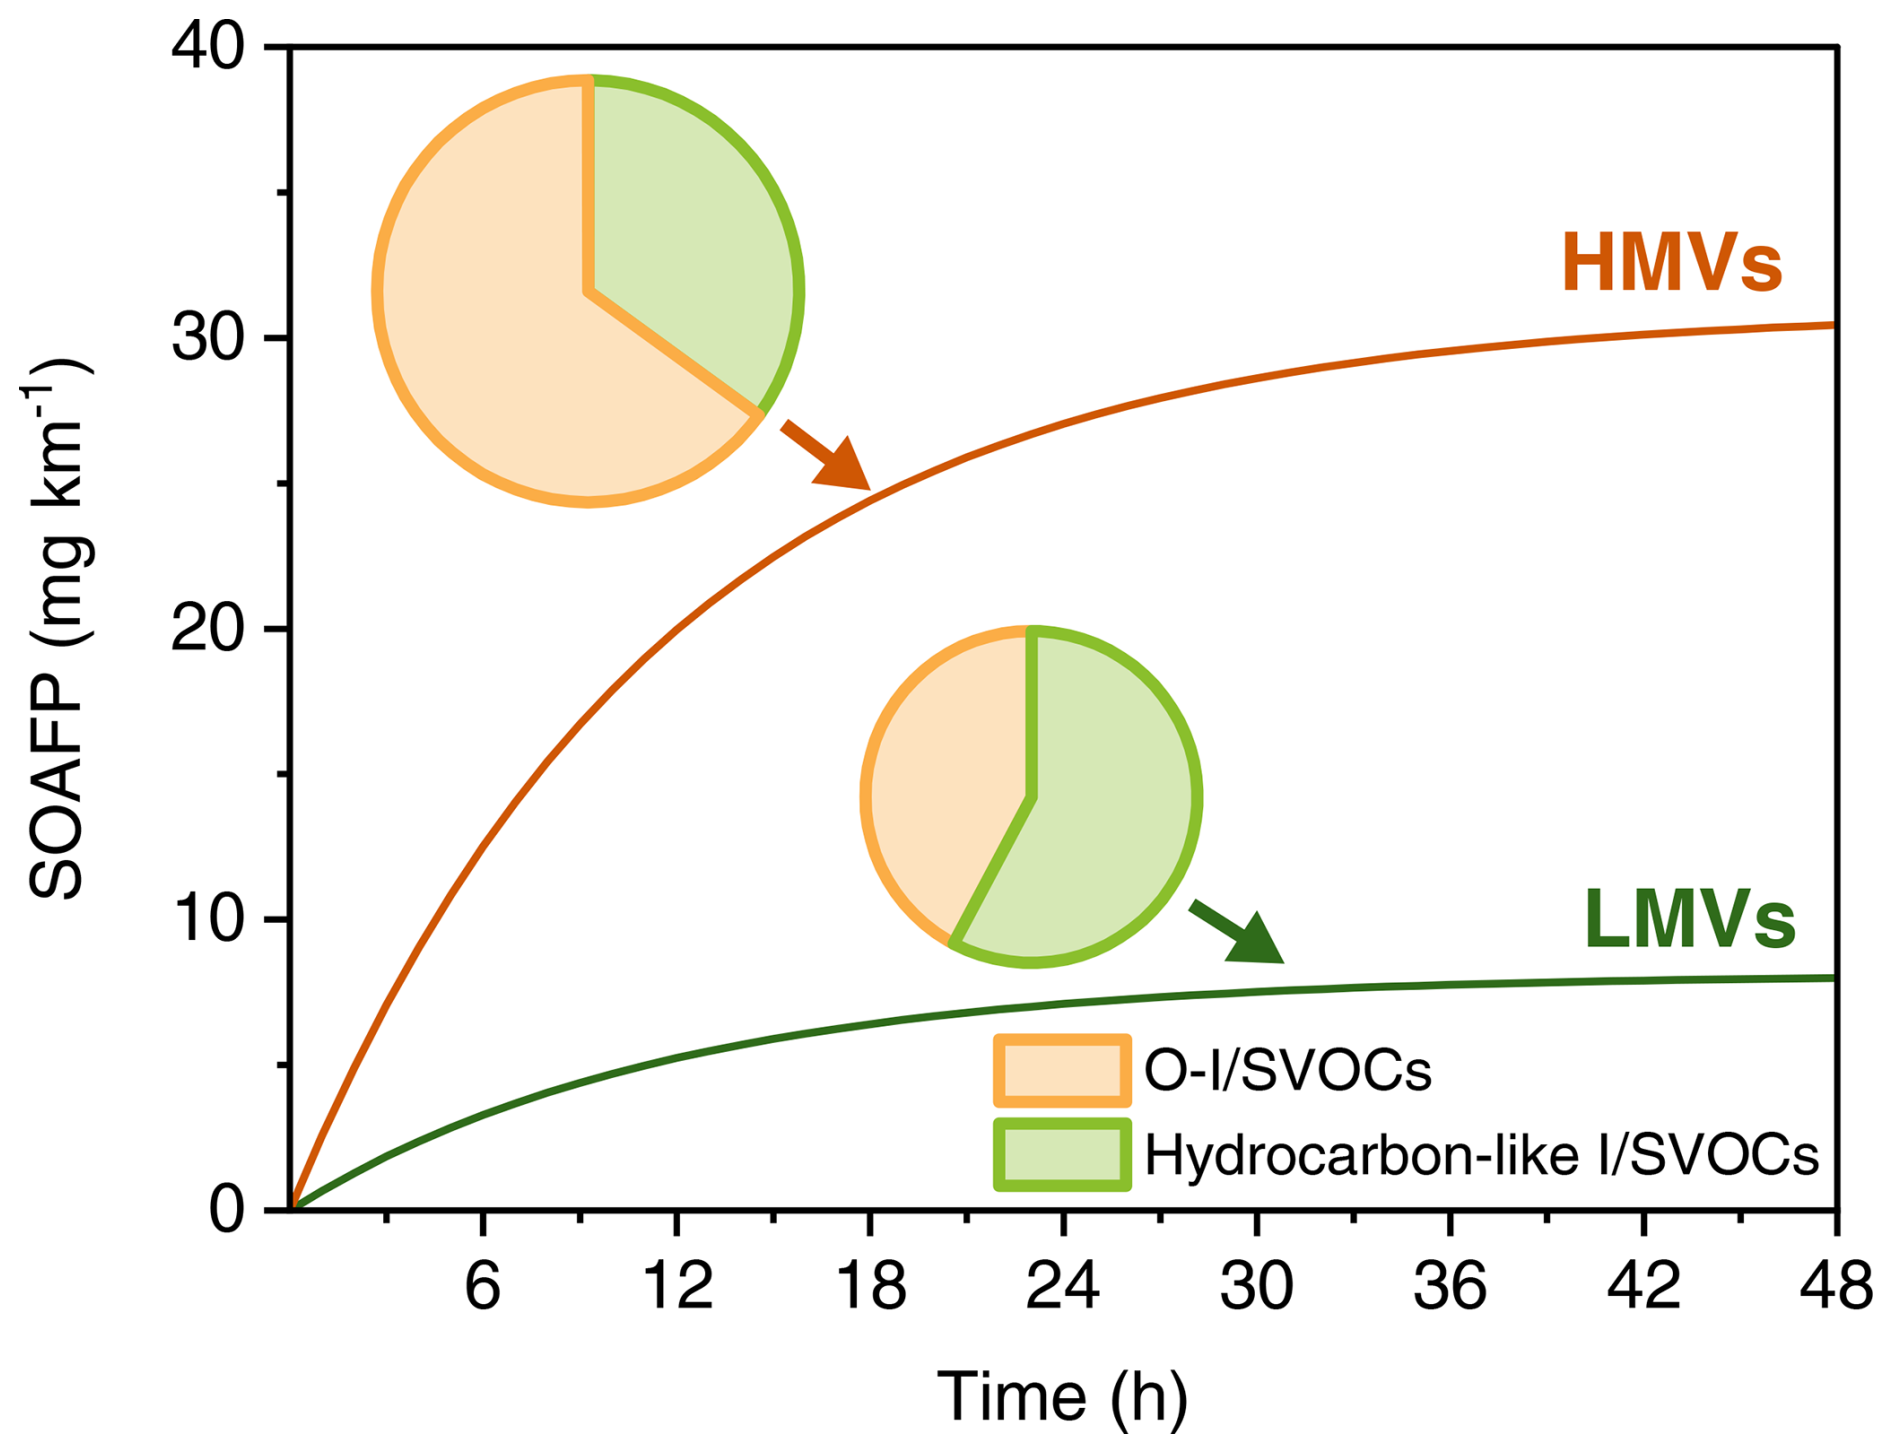
Figure 4The average SOAFP for HMVs and LMVs during 48 h of photooxidation. The pie charts represent the contributions of hydrocarbon-like I/SVOCs and O-I/SVOCs to the total I/SVOC emissions of HMVs and LMVs.
To estimate the effects of cumulative mileage and ambient temperature on the I/SVOC emission inventory, we constructed an emission inventory of China V HDDVs. In scenario 1, we utilized the average I/SVOC EFs of all tested vehicles, consistent with the approach taken in previous studies (Liu et al., 2021; Zhao et al., 2022; Wu et al., 2019; Zhang et al., 2024b). In scenario 2, the calculation was based on the assumption that the EFs increase linearly with cumulative mileage, as discussed in Sect. 3.3; scenario 3 expanded on scenario 2 by incorporating an average ambient temperature of 0 °C for 3 months of the year.
In 2022, the estimated I/SVOC emissions from China V HDDVs were 20, 60, and 66 kt for scenarios 1, 2, and 3, respectively. The emissions in scenario 2 were up to 3 times higher than those in scenario 1. When considering the impact of low temperatures as in scenario 3, the total emissions increased by an additional 10 %. Given the critical role of accurate HDDV I/SVOC emission inventories in predicting urban SOA formation, it is recommended that future studies measure and track I/SVOC emissions from HDDVs over extended periods (exceeding 3 years or corresponding to higher cumulative mileage). This will allow for a more comprehensive understanding of the degradation patterns of I/SVOCs from diesel vehicles.
In this study, gaseous and particulate I/SVOCs emitted from four HDDVs were analyzed using TD–GC × GC–MS. The I/SVOC EFs from HDDVs ranged from 10 to 409 mg km−1, with gaseous I/SVOCs contributing between 79 % and 99 % and particulate I/SVOCs accounting for 1 % to 21 %. The significant impact of vehicle cumulative mileage on I/SVOC emissions was evidenced by the 8 times higher emissions from HMVs compared with LMVs. The linear relationship between I/SVOC emissions and vehicle cumulative mileage was established, emphasizing the need for long-term emission monitoring of HDDVs. Deterioration of I/SVOC emissions could occur under both cold-start and hot-running conditions, with comparable proportions of I/SVOC emissions during the cold-start cycles of HMVs and LMVs. Our findings suggest that emission deterioration factors should be incorporated into emission inventories for more accurate predictions of SOA formation. Furthermore, volatility and category distribution analyses revealed that the increase in I/SVOC emissions from HMVs was primarily driven by higher-volatility compounds (bins 2 to 6).
Low ambient temperatures also increased I/SVOC emissions from HMVs but not from LMVs. A strong linear correlation (R2= 0.93) between I/SVOC EFs and MCE from LMVs and HMVs at various temperatures suggests that the decline in combustion efficiency may be a direct cause of the increase. Changes in the composition of I/SVOCs at low temperatures were observed, with a notable increase in PAHs and oxygenated compounds, both of which are likely to influence SOA formation.
Finally, the SOAFP estimations revealed that the SOAFP of HMVs was approximately 4 times higher than that of LMVs after 48 h of photooxidation. Furthermore, a China V I/SVOC emission inventory was established based on various assumptions. Results indicated that neglecting emission discrepancies between LMVs and HMVs could result in a 3-fold underestimation of the inventory, while accounting for low temperatures would increase the total emissions by 10 %. This study recommends incorporating the effects of cumulative mileage and temperature into future emission inventories for more accurate predictions of SOA formation.
The measurement data and codes used in this study are available on request.
The supplement related to this article is available online at https://doi.org/10.5194/acp-25-2695-2025-supplement.
SG: experiment, formal analysis, data validation, and writing – original draft. XZ: writing – review and editing, project administration, supervision, and funding acquisition. XH: model development and funding acquisition. LZ: experiment and funding acquisition. LH and XW: experiment. YD: data validation. ZH, TC, and SX: experiment. YY: funding acquisition. SX: editing. SZ, JJ, and YW: data validation and writing – review and editing.
The contact author has declared that none of the authors has any competing interests.
Publisher’s note: Copernicus Publications remains neutral with regard to jurisdictional claims made in the text, published maps, institutional affiliations, or any other geographical representation in this paper. While Copernicus Publications makes every effort to include appropriate place names, the final responsibility lies with the authors.
The authors received financial support from the National Natural Science Foundation of China (grant nos. 51978404, 42261160645, 42105100, and 42307136); the Open Research Fund of the Key Laboratory of Vehicle Emission Control and Simulation of the Ministry of Ecology and Environment, Chinese Research Academy of Environmental Sciences (grant no. VECS2024K04); the Fundamental Research Funds for the Central Public-interest Scientific Institution (grant no. 2024YSKY-03); the Macau Science and Technology Development Fund (grant nos. 0023/2022/AFJ and 001/2022/NIF); and the Scientific Research Fund of Shenzhen University (grant nos. 868-000001032089 and 827-000907).
This paper was edited by Qi Chen and reviewed by two anonymous referees.
Alam, M. S., Zeraati-Rezaei, S., Liang, Z., Stark, C., Xu, H., MacKenzie, A. R., and Harrison, R. M.: Mapping and quantifying isomer sets of hydrocarbons (≥ C12) in diesel exhaust, lubricating oil and diesel fuel samples using GC × GC-ToF-MS, Atmos. Meas. Tech., 11, 3047–3058, https://doi.org/10.5194/amt-11-3047-2018, 2018.
Aosaf, M. R., Wang, Y., and Du, K.: Comparison of the emission factors of air pollutants from gasoline, CNG, LPG and diesel fueled vehicles at idle speed, Environ. Pollut., 305, 119296, https://doi.org/10.1016/j.envpol.2022.119296, 2022.
Apte, J. S., Brauer, M., Cohen, A. J., Ezzati, M., and Pope, C. A. I.: Ambient PM2.5 reduces global and regional life expectancy, Environ. Sci. Tech. Let., 5, 546–551, https://doi.org/10.1021/acs.estlett.8b00360, 2018.
Azmi, S. and Sharma, M.: Global PM2.5 and secondary organic aerosols (SOA) levels with sectorial contribution to anthropogenic and biogenic SOA formation, Chemosphere, 336, 139195, https://doi.org/10.1016/j.chemosphere.2023.139195, 2023.
Cai, H. and Xie, S.: Temporal and spatial variation in recent vehicular emission inventories in China based on dynamic emission factors, J. Air Waste. Manage., 63, 310–326, https://doi.org/10.1080/10962247.2012.755138, 2013.
Chacon-Madrid, H. J. and Donahue, N. M.: Fragmentation vs. functionalization: chemical aging and organic aerosol formation, Atmos. Chem. Phys., 11, 10553–10563, https://doi.org/10.5194/acp-11-10553-2011, 2011.
Chang, X., Zhao, B., Zheng, H., Wang, S., Cai, S., Guo, F., Gui, P., Huang, G., Wu, D., Han, L., Xing, J., Man, H., Hu, R., Liang, C., Xu, Q., Qiu, X., Ding, D., Liu, K., Han, R., Robinson, A. L., and Donahue, N. M.: Full-volatility emission framework corrects missing and underestimated secondary organic aerosol sources, One Earth, 5, 403–412, https://doi.org/10.1016/j.oneear.2022.03.015, 2022.
Cheng, Y., He, K. B., Duan, F. K., Zheng, M., Ma, Y. L., Tan, J. H., and Du, Z. Y.: Improved measurement of carbonaceous aerosol: evaluation of the sampling artifacts and inter-comparison of the thermal-optical analysis methods, Atmos. Chem. Phys., 10, 8533–8548, https://doi.org/10.5194/acp-10-8533-2010, 2010.
Dardiotis, C., Martini, G., Marotta, A., and Manfredi, U.: Low-temperature cold-start gaseous emissions of late technology passenger cars, Appl. Energ., 111, 468–478, https://doi.org/10.1016/j.apenergy.2013.04.093, 2013.
Drozd, G. T., Weber, R. J., and Goldstein, A. H.: Highly resolved composition during diesel evaporation with modeled ozone and secondary aerosol formation: insights into pollutant formation from evaporative intermediate volatility organic compound sources, Environ. Sci. Technol., 55, 5742–5751, https://doi.org/10.1021/acs.est.0c08832, 2021.
Guan, T., Xue, T., Liu, Y., Zheng, Y., Fan, S., He, K., and Zhang, Q.: Differential susceptibility in ambient particle–related risk of first-ever stroke: findings from a national case-crossover study, Am. J. Epidemiol., 187, 1001–1009, https://doi.org/10.1093/aje/kwy007, 2018.
He, X., Wang, Q., Huang, X. H. H., Huang, D. D., Zhou, M., Qiao, L., Zhu, S., Ma, Y., Wang, H., Li, L., Huang, C., Xu, W., Worsnop, D. R., Goldstein, A. H., and Yu, J. Z.: Hourly measurements of organic molecular markers in urban Shanghai, China: Observation of enhanced formation of secondary organic aerosol during particulate matter episodic periods, Atmos. Environ., 240, 117807, https://doi.org/10.1016/j.atmosenv.2020.117807, 2020.
He, X., Zheng, X., Zhang, S., Wang, X., Chen, T., Zhang, X., Huang, G., Cao, Y., He, L., Cao, X., Cheng, Y., Wang, S., and Wu, Y.: Comprehensive characterization of particulate intermediate-volatility and semi-volatile organic compounds (I/SVOCs) from heavy-duty diesel vehicles using two-dimensional gas chromatography time-of-flight mass spectrometry, Atmos. Chem. Phys., 22, 13935–13947, https://doi.org/10.5194/acp-22-13935-2022, 2022a.
He, X., Zheng, X., You, Y., Zhang, S., Zhao, B., Wang, X., Huang, G., Chen, T., Cao, Y., He, L., Chang, X., Wang, S., and Wu, Y.: Comprehensive chemical characterization of gaseous I/SVOC emissions from heavy-duty diesel vehicles using two-dimensional gas chromatography time-of-flight mass spectrometry, Environ. Pollut., 305, 119284, https://doi.org/10.1016/j.envpol.2022.119284, 2022b.
He, X., Zheng, X., Guo, S., Zeng, L., Chen, T., Yang, B., Xiao, S., Wang, Q., Li, Z., You, Y., Zhang, S., and Wu, Y.: Automated compound speciation, cluster analysis, and quantification of organic vapors and aerosols using comprehensive two-dimensional gas chromatography and mass spectrometry, Atmos. Chem. Phys., 24, 10655–10666, https://doi.org/10.5194/acp-24-10655-2024, 2024.
Ho, K.: Thermodynamic formulation of a viscoplastic constitutive model capturing unusual loading rate sensitivity, Int. J. Eng. Sci., 100, 162–170, https://doi.org/10.1016/j.ijengsci.2015.12.003, 2016.
Huang, C., Lou, D., Hu, Z., Feng, Q., Chen, Y., Chen, C., Tan, P., and Yao, D.: A PEMS study of the emissions of gaseous pollutants and ultrafine particles from gasoline- and diesel-fueled vehicles, Atmos. Environ., 77, 703–710, https://doi.org/10.1016/j.atmosenv.2013.05.059, 2013.
Huang, D. D., Hu, Q., He, X., Huang, R.-J., Ding, X., Ma, Y., Feng, X., Jing, S., Li, Y., Lu, J., Gao, Y., Chang, Y., Shi, X., Qian, C., Yan, C., Lou, S., Wang, H., and Huang, C.: Obscured contribution of oxygenated intermediate-volatility organic compounds to secondary organic aerosol formation from gasoline vehicle emissions, Environ. Sci. Technol., 58, 10652–10663, https://doi.org/10.1021/acs.est.3c08536, 2024.
Huang, L., Liu, H., Yarwood, G., Wilson, G., Tao, J., Han, Z., Ji, D., Wang, Y., and Li, L.: Modeling of secondary organic aerosols (SOA) based on two commonly used air quality models in China: Consistent S/IVOCs contribution but large differences in SOA aging, Sci. Total Environ., 903, 166162, https://doi.org/10.1016/j.scitotenv.2023.166162, 2023.
Huang, R.-J., Zhang, Y., Bozzetti, C., Ho, K.-F., Cao, J.-J., Han, Y., Daellenbach, K. R., Slowik, J. G., Platt, S. M., Canonaco, F., Zotter, P., Wolf, R., Pieber, S. M., Bruns, E. A., Crippa, M., Ciarelli, G., Piazzalunga, A., Schwikowski, M., Abbaszade, G., Schnelle-Kreis, J., Zimmermann, R., An, Z., Szidat, S., Baltensperger, U., Haddad, I. E., and Prévôt, A. S. H.: High secondary aerosol contribution to particulate pollution during haze events in China, Nature, 514, 218–222, https://doi.org/10.1038/nature13774, 2014.
Jathar, S. H., Miracolo, M. A., Tkacik, D. S., Donahue, N. M., Adams, P. J., and Robinson, A. L.: Secondary organic aerosol formation from photo-oxidation of unburned fuel: experimental results and implications for aerosol formation from combustion emissions, Environ. Sci. Technol., 47, 12886–12893, https://doi.org/10.1021/es403445q, 2013.
Kirchstetter, T. W., Corrigan, C. E., and Novakov, T.: Laboratory and field investigation of the adsorption of gaseous organic compounds onto quartz filters, Atmos. Environ., 35, 1663–1671, https://doi.org/10.1016/S1352-2310(00)00448-9, 2001.
Li, X., Yang, Z., Fu, P., Yu, J., Lang, Y., Liu, D., Ono, K., and Kawamura, K.: High abundances of dicarboxylic acids, oxocarboxylic acids, and α-dicarbonyls in fine aerosols (PM2.5) in Chengdu, China during wintertime haze pollution, Environ. Sci. Pollut. R., 22, 12902–12918, https://doi.org/10.1007/s11356-015-4548-x, 2015.
Liu, Y., Li, Y., Yuan, Z., Wang, H., Sha, Q., Lou, S., Liu, Y., Hao, Y., Duan, L., Ye, P., Zheng, J., Yuan, B., and Shao, M.: Identification of two main origins of intermediate-volatility organic compound emissions from vehicles in China through two-phase simultaneous characterization, Environ. Pollut., 281, 117020, https://doi.org/10.1016/j.envpol.2021.117020, 2021.
Lu, Q., Zhao, Y., and Robinson, A. L.: Comprehensive organic emission profiles for gasoline, diesel, and gas-turbine engines including intermediate and semi-volatile organic compound emissions, Atmos. Chem. Phys., 18, 17637–17654, https://doi.org/10.5194/acp-18-17637-2018, 2018.
Lv, L., Ge, Y., Ji, Z., Tan, J., Wang, X., Hao, L., Wang, Z., Zhang, M., Wang, C., and Liu, H.: Regulated emission characteristics of in-use LNG and diesel semi-trailer towing vehicles under real driving conditions using PEMS, J. Environ. Sci., 88, 155–164, https://doi.org/10.1016/j.jes.2019.07.020, 2020.
May, A. F., May, A. A., Presto, A. A., Hennigan, C. J., Nguyen, N. T., Gordon, T. D., and Robinson, A. L.: Gas-particle partitioning of primary organic aerosol emissions: (2) diesel vehicles, Environ. Sci. Technol., 47, 8288–8296, https://doi.org/10.1021/es400782j, 2013.
Morino, Y., Li, Y., Fujitani, Y., Sato, K., Inomata, S., Tanabe, K., Jathar, S. H., Kondo, Y., Nakayama, T., Fushimi, A., Takami, A., and Kobayashi, S.: Secondary organic aerosol formation from gasoline and diesel vehicle exhaust under light and dark conditions, Environ. Sci. Atmos., 2, 46–64, https://doi.org/10.1039/D1EA00045D, 2022.
Presto, A. A., Miracolo, M. A., Kroll, J. H., Worsnop, D. R., Robinson, A. L., and Donahue, N. M.: Intermediate-volatility organic compounds: a potential source of ambient oxidized organic aerosol, Environ. Sci. Technol., 43, 4744–4749, https://doi.org/10.1021/es803219q, 2009.
Qi, L., Liu, H., Shen, X., Fu, M., Huang, F., Man, H., Deng, F., Shaikh, A. A., Wang, X., Dong, R., Song, C., and He, K.: Intermediate-volatility organic compound emissions from nonroad construction machinery under different operation modes, Environ. Sci. Technol., 53, 13832–13840, https://doi.org/10.1021/acs.est.9b01316, 2019.
Qi, L., Zhao, J., Li, Q., Su, S., Lai, Y., Deng, F., Man, H., Wang, X., Shen, X., Lin, Y., Ding, Y., and Liu, H.: Primary organic gas emissions from gasoline vehicles in China: Factors, composition and trends, Environ. Pollut., 290, 117984, https://doi.org/10.1016/j.envpol.2021.117984, 2021.
Sommers, J. M., Stroud, C. A., Adam, M. G., O'Brien, J., Brook, J. R., Hayden, K., Lee, A. K. Y., Li, K., Liggio, J., Mihele, C., Mittermeier, R. L., Stevens, R. G., Wolde, M., Zuend, A., and Hayes, P. L.: Evaluating SOA formation from different sources of semi- and intermediate-volatility organic compounds from the Athabasca oil sands, Environ. Sci. Atmos., 2, 469–490, https://doi.org/10.1039/D1EA00053E, 2022.
Sun, P., Nie, W., Wang, T., Chi, X., Huang, X., Xu, Z., Zhu, C., Wang, L., Qi, X., Zhang, Q., and Ding, A.: Impact of air transport and secondary formation on haze pollution in the Yangtze River Delta: In situ online observations in Shanghai and Nanjing, Atmos. Environ., 225, 117350, https://doi.org/10.1016/j.atmosenv.2020.117350, 2020.
Tang, R., Lu, Q., Guo, S., Wang, H., Song, K., Yu, Y., Tan, R., Liu, K., Shen, R., Chen, S., Zeng, L., Jorga, S. D., Zhang, Z., Zhang, W., Shuai, S., and Robinson, A. L.: Measurement report: Distinct emissions and volatility distribution of intermediate-volatility organic compounds from on-road Chinese gasoline vehicles: implication of high secondary organic aerosol formation potential, Atmos. Chem. Phys., 21, 2569–2583, https://doi.org/10.5194/acp-21-2569-2021, 2021.
Tkacik, D. S., Presto, A. A., Donahue, N. M., and Robinson, A. L.: Secondary organic aerosol formation from intermediate-volatility organic compounds: cyclic, linear, and branched alkanes, Environ. Sci. Technol., 46, 8773–8781, https://doi.org/10.1021/es301112c, 2012.
Tolouei, R. and Titheridge, H.: Vehicle mass as a determinant of fuel consumption and secondary safety performance, Transport. Res. D-Tr. E, 14, 385–399, https://doi.org/10.1016/j.trd.2009.01.005, 2009.
Wang, Q., Huo, J., Chen, H., Duan, Y., Fu, Q., Sun, Y., Zhang, K., Huang, L., Wang, Y., Tan, J., Li, L., Wang, L., Li, D., George, C., Mellouki, A., and Chen, J.: Traffic, marine ships and nucleation as the main sources of ultrafine particles in suburban Shanghai, China, Environ. Sci. Atmos., 3, 1805–1819, https://doi.org/10.1039/D3EA00096F, 2023.
Wang, Y., Ning, M., Su, Q., Wang, L., Jiang, S., Feng, Y., Wu, W., Tang, Q., Hou, S., Bian, J., Huang, L., Lu, G., Manomaiphiboon, K., Kaynak, B., Zhang, K., Chen, H., and Li, L.: Designing regional joint prevention and control schemes of PM2.5 based on source apportionment of chemical transport model: A case study of a heavy pollution episode, J. Clean. Prod., 455, 142313, https://doi.org/10.1016/j.jclepro.2024.142313, 2024.
Wu, L., Wang, X., Lu, S., Shao, M., and Ling, Z.: Emission inventory of semi-volatile and intermediate-volatility organic compounds and their effects on secondary organic aerosol over the Pearl River Delta region, Atmos. Chem. Phys., 19, 8141–8161, https://doi.org/10.5194/acp-19-8141-2019, 2019.
Xue, T., Han, Y., Fan, Y., Zheng, Y., Geng, G., Zhang, Q., and Zhu, T.: Association between a rapid reduction in air particle pollution and improved lung function in adults, Annals ATS, 18, 247–256, https://doi.org/10.1513/AnnalsATS.202003-246OC, 2021.
Yao, Z., Wu, B., Wu, Y., Cao, X., and Jiang, X.: Comparison of NOx emissions from China III and China IV in-use diesel trucks based on on-road measurements, Atmos. Environ., 123, 1–8, https://doi.org/10.1016/j.atmosenv.2015.10.056, 2015.
Zeng, L., Xiao, S., Dai, Y., Chen, T., Wang, H., Yang, P., Huang, G., Yan, M., You, Y., Zheng, X., Zhang, S., and Wu, Y.: Characterization of on-road nitrogen oxides and black carbon emissions from high emitters of heavy-duty diesel vehicles in China, J. Hazard. Mater., 477, 135225, https://doi.org/10.1016/j.jhazmat.2024.135225, 2024.
Zhang, J., Wang, H., Yan, L., Ding, W., Liu, R., Wang, H., and Wang, S.: Analysis of chemical composition characteristics and source of PM2.5 under different pollution degrees in autumn and winter of Liaocheng, China, Atmosphere, 12, 1180, https://doi.org/10.3390/atmos12091180, 2021.
Zhang, X., He, X., Cao, Y., Chen, T., Zheng, X., Zhang, S., and Wu, Y.: Comprehensive characterization of speciated volatile organic compounds (VOCs), gas-phase and particle-phase intermediate- and semi-volatile volatility organic compounds (I/S-VOCs) from Chinese diesel trucks, Sci. Total Environ., 912, 168950, https://doi.org/10.1016/j.scitotenv.2023.168950, 2024a.
Zhang, Z., Man, H., Zhao, J., Huang, W., Huang, C., Jing, S., Luo, Z., Zhao, X., Chen, D., He, K., and Liu, H.: VOC and IVOC emission features and inventory of motorcycles in China, J. Hazard. Mater., 469, 133928, https://doi.org/10.1016/j.jhazmat.2024.133928, 2024b.
Zhao, J., Qi, L., Lv, Z., Wang, X., Deng, F., Zhang, Z., Luo, Z., Bie, P., He, K., and Liu, H.: An updated comprehensive IVOC emission inventory for mobile sources in China, Sci. Total Environ., 851, 158312, https://doi.org/10.1016/j.scitotenv.2022.158312, 2022.
Zhao, Y., Hennigan, C. J., May, A. A., Tkacik, D. S., de Gouw, J. A., Gilman, J. B., Kuster, W. C., Borbon, A., and Robinson, A. L.: Intermediate-volatility organic compounds: a large source of secondary organic aerosol, Environ. Sci. Technol., 48, 13743–13750, https://doi.org/10.1021/es5035188, 2014.
Zhao, Y., Nguyen, N. T., Presto, A. A., Hennigan, C. J., May, A. A., and Robinson, A. L.: Intermediate volatility organic compound emissions from on-road diesel vehicles: chemical composition, emission factors, and estimated secondary organic aerosol production, Environ. Sci. Technol., 49, 11516–11526, https://doi.org/10.1021/acs.est.5b02841, 2015.
Zhao, Y., Nguyen, N. T., Presto, A. A., Hennigan, C. J., May, A. A., and Robinson, A. L.: Intermediate volatility organic compound emissions from on-road gasoline vehicles and small off-road gasoline engines, Environ. Sci. Technol., 50, 4554–4563, https://doi.org/10.1021/acs.est.5b06247, 2016.