the Creative Commons Attribution 4.0 License.
the Creative Commons Attribution 4.0 License.
 | 28 Feb 2025
Investigating the response of China's surface ozone concentration to the future changes of multiple factors
Jinya Yang
Yutong Wang
Lei Zhang
Yu Zhao
Climate change and associated human response are supposed to greatly alter surface ozone (O3), an air pollutant generated through photochemical reactions involving both anthropogenic and biogenic precursors. However, a comprehensive evaluation of China's O3 response to these multiple changes has been lacking. We present a modeling framework under Shared Socioeconomic Pathways (SSP2-4.5), incorporating future changes in local and foreign anthropogenic emissions, meteorological conditions, and biogenic volatile organic compound (BVOC) emissions. From the 2020s to 2060s, daily maximum 8 h average (MDA8) O3 concentration is simulated to decline by 7.7 ppb in the warm season (April–September) and 1.1 ppb in the non-warm season (October–March) over the country, with a substantial reduction in exceedances of national O3 standards. Notably, O3 decreases are more pronounced in developed regions such as Beijing–Tianjin–Hebei (BTH), the Yangtze River Delta (YRD), and the Pearl River Delta (PRD) during the warm season, with reductions of 9.7, 14.8, and 12.5 ppb, respectively. Conversely, in the non-warm season, the MDA8 O3 in BTH and YRD will increase by 5.5 and 3.3 ppb, partly attributed to reduced NOx emissions and thereby a weakened titration effect. O3 pollution will thus expand into the non-warm season in the future. Sensitivity analyses reveal that local emission change will predominantly influence future O3 distribution and magnitude, with contributions from other factors within ±25 %. Furthermore, the joint impact of multiple factors on O3 reduction will be larger than the sum of individual factors, due to changes in the O3 formation regime. This study highlights the necessity of region-specific emission control strategies to mitigate potential O3 increases during the non-warm season and under the climate penalty.
- Article
(7263 KB) - Full-text XML
-
Supplement
(28567 KB) - BibTeX
- EndNote


Surface ozone (O3) is a secondary air pollutant generated by photochemical reactions in the presence of two main kinds of precursors, NOx (NOx= NO + NO2) and volatile organic compounds (VOCs). It has been reported to be a non-negligible threat to both human health and crop yield and also a short-lived climate forcer with warming effect (Finlayson-Pitts and Pitts, 1997; Jerrett et al., 2009; Avnery et al., 2011; Lelieveld et al., 2015; von Schneidemesser et al., 2015; Tai and Val Martin, 2017; Yin et al., 2020; Feng et al., 2022; Niu et al., 2022). Given the abundant emissions of anthropogenic NOx and VOCs, China suffered from extremely high and continuously increasing O3 pollution from 2013 to 2019, with the peak season daily maximum 8 h average (MDA8) O3 concentration over 95 µg m−3. The rising trend has been reversed since 2020, along with the national annual NOx and non-methane VOC (NMVOC) emissions reduced by 28.3 % and 3.8 %, respectively, during 2013–2020 (Zheng et al., 2018; Xiao et al., 2022; Liu et al., 2023a; Wang et al., 2023). However, current O3 concentration over China is still much higher than the global air quality guidelines (60 µg m−3 for the averaged peak season MDA8 O3, WHO, 2021). This presents a great challenge for the country to meet the criteria for public heath welfare in the future (Feng et al., 2023; Jiang et al., 2023).
In addition to anthropogenic drivers, studies also addressed the roles of meteorological factors, biogenic VOC (BVOC) emissions, and transboundary transport of pollutants in O3 enhancement in China (Monks et al., 2015; Lu et al., 2019; Cao et al., 2022; Wang et al., 2022; Weng et al., 2022; Jiang et al., 2023). Meteorological factors, including temperature, humidity, and wind, influence the chemical reactions associated with O3 production and elimination and the transportation of O3 precursors (Gong and Liao, 2019). The changed meteorology was estimated to enhance the summer MDA8 O3 concentration by 1.4 ppb yr−1 during 2013–2019 in the North China Plain (NCP), nearly half of the overall O3 growth of 3.3 ppb yr−1 (Li et al., 2020a). BVOCs refer to VOCs emitted from terrestrial ecosystems and possess high reactivity in atmospheric chemical processes, mainly including isoprene, monoterpenes, and sesquiterpene (Wu et al., 2020b). Cao et al. (2022) reported that BVOC emissions in summer 2018 were enhanced by 8.6 ppb MDA8 O3 averaged over China, with the highest contribution over 30 ppb in Southern China. Moreover, O3 and its precursors can be transported over long distances, and transboundary foreign anthropogenic emissions have been estimated to contribute 2–11 ppb to near-surface O3 in China (Ni et al., 2018; Han et al., 2019).
In the context of future global change, substantial but uncertain changes will occur in economy, climate, and land cover. According to the Sixth Assessment Report of Intergovernmental Panel on Climate Change (IPCC AR6 report), the global surface temperature will increase 0.2–3.7 °C till 2100 under different scenarios compared to 2015 (IPCC, 2021, 2022). As a result, unfavorable meteorological extremes, such as high temperature extremes and ecological drought events, will be more frequent and intense (Hong et al., 2019; Porter and Heald, 2019; IPCC, 2021), leading to the deterioration of air quality, called the climate penalty. To conquer the climate change and resulting air quality deterioration, a series of measures will be implemented, such as accelerating the transition to clean energy, upgrading industrial production technologies, and strengthening pollution control measures. Attributable to these changes, annual mean surface O3 in east Asia was projected to change by −13.9–6.1 ppb till 2100 compared to 2015 (IPCC, 2021). However, limited by the coarse resolution of earth system models and the lack of consideration of the regional measures for reducing air pollution and carbon emissions, global estimation is insufficient for understanding how O3 pollution in China will respond to the complex future change.
There have been some studies on how the above-mentioned changes will affect future O3 levels in China. Hong et al. (2019) reported that the 1 h maximum O3 in April to September will be enhanced by 2–8 ppb within large areas of China under the RCP4.5 (Representative Concentration Pathway 4.5, van Vuuren et al., 2011) scenario from the 2010s to 2050s. Under high-forcing scenarios, Li et al. (2023) projected the climate-driven O3 concentration in the 2100s and found that O3 concentration in southeastern China would increase 5 %–20 % compared to the 2020s using a machine learning method. A warming climate should enhance the O3 level, given the increasing frequency of atmospheric stagnation and heat waves (Hong et al., 2019; Wang et al., 2022; Gao et al., 2023; Li et al., 2023). The effect of anthropogenic emission change on China's O3 level has been estimated by studies under different scenarios. Zhu and Liao (2016) applied global emission estimates under RCPs and found that the maximum growth of annual mean O3 would be 6–12 ppb during 2000–2050 under different scenarios. Using the Dynamic Projection model for Emissions in China (DPEC) that more effectively includes local information on energy transition and emission controls (Cheng et al., 2021b), Xu et al. (2022) reported that the joint impact of climate change and emission reduction would reduce the annual MDA8 O3 concentration to 63.0 µg m−3 under ambitious scenario of carbon neutrality. Biogenic emission change is another factor influencing future O3 (Chen et al., 2009; Andersson and Engardt, 2010; Harper and Unger, 2018; Wang et al., 2020). Liu et al. (2019) predicted a 24 % growth of BVOC emissions driven by climate change under RCP8.5 from 2015 to the 2050s, resulting in a variation of daily 1 h maximum O3 concentration ranging from −10.0 to 19.7 ppb across different regions in China.
Limitations exist in current studies, which prevent comprehensive assessment and understanding of the joint impacts of future changes of multiple factors on China's O3 pollution. Firstly, the above estimations mainly focused on the influence of future changes on summertime or annual average O3 concentration. As China's O3 pollution has been reported to spread into spring and fall, it is of great importance to separate the impacts on warm-season (April to September, the 6 months with heaviest O3 pollution for most of China, Liu et al., 2023a) and non-warm-season O3 (October to March), considering the diverse air pollution sources and O3 formation sensitivity to precursors for different seasons (Li et al., 2021; Wang et al., 2023). Recent studies have suggested diverse effects of future emission change on O3 evolution for difference seasons in China (Hou et al., 2023; Liu et al., 2023b). In addition, the rising frequency of extreme weathers and declining anthropogenic emissions will further influence the possibility of extreme O3 events, which has been scarcely discussed. Secondly, to restrain global warming, China has made a national commitment to achieve “carbon neutrality” by 2060 (Shi et al., 2021) and accordingly launched a series of energy and climate action plans to reduce greenhouse gas emissions. These actions will also cause substantial reductions in air pollutant emissions but have not been fully included in existing predictions of global emissions (Tong et al., 2020; Cheng et al., 2021b). Large bias will then be caused in the simulation of anthropogenic-induced future changes of air quality, with a less realistic estimate of the local emission path (Cheng et al., 2021a). Due to a decline in emissions that is probably faster in China but slower in surrounding countries in the future, the contributions of transboundary emissions to China's O3 could be greatly changed and have not yet been fully considered (Hou et al., 2023). Thirdly, BVOC emissions will be affected not only by meteorological factors but also by land use and land cover change (Penuelas and Staudt, 2010; Szogs et al., 2017; Wang et al., 2021a). Future land management will change due to socio-economic development and necessary actions as part of the climate change response, and the changed shares of forest, cropland, and grassland will alter the magnitude and distribution of BVOC emissions and thereby affect O3 concentration (Hurtt et al., 2020; Liao et al., 2020; Liu et al., 2022). Finally, the existing evaluations were conducted separately for individual influencing factors, with diverse methods and data. The interactions between different factors were seldom included in existing analyses, and the relative contributions of multiple factors were difficult to be evaluated or compared. Relevant studies have been conducted in developed countries (Gonzalez-Abraham et al., 2015) and are still lacking in China.
In this study, we evaluate the complex influence of future changes of multiple factors on surface O3 concentration in China within a uniform framework. The evaluation is conducted from the perspectives of seasonal, regional, and extreme events of O3 pollution. Four factors are included in the analyses, i.e., meteorological conditions, local anthropogenic emissions, BVOC emissions, and anthropogenic emissions from surrounding foreign countries. The analyses are conducted based on a series of sensitivity experiments in numerical modeling of future air quality, and up-to-date input data from multiple sources are utilized in the model (see details in next section). We provide a comprehensive perspective on the spatiotemporal change in China's O3 pollution till the 2060s, under a moderate SSP (Shared Socioeconomic Pathway) scenario, SSP2 (Riahi et al., 2017), and a mid-range mitigation scenario, RCP4.5, a scenario with medium socio-economic development, with radiative forcing of 4.5 W m−2 nominally by 2100 (Meinshausen et al., 2020). The outcomes highlight the regional and seasonal heterogeneity of O3 pollution risks driven by complex future changes of multiple factors and support strategy design of O3 pollution alleviation with specific principles, targets, and action pathways.
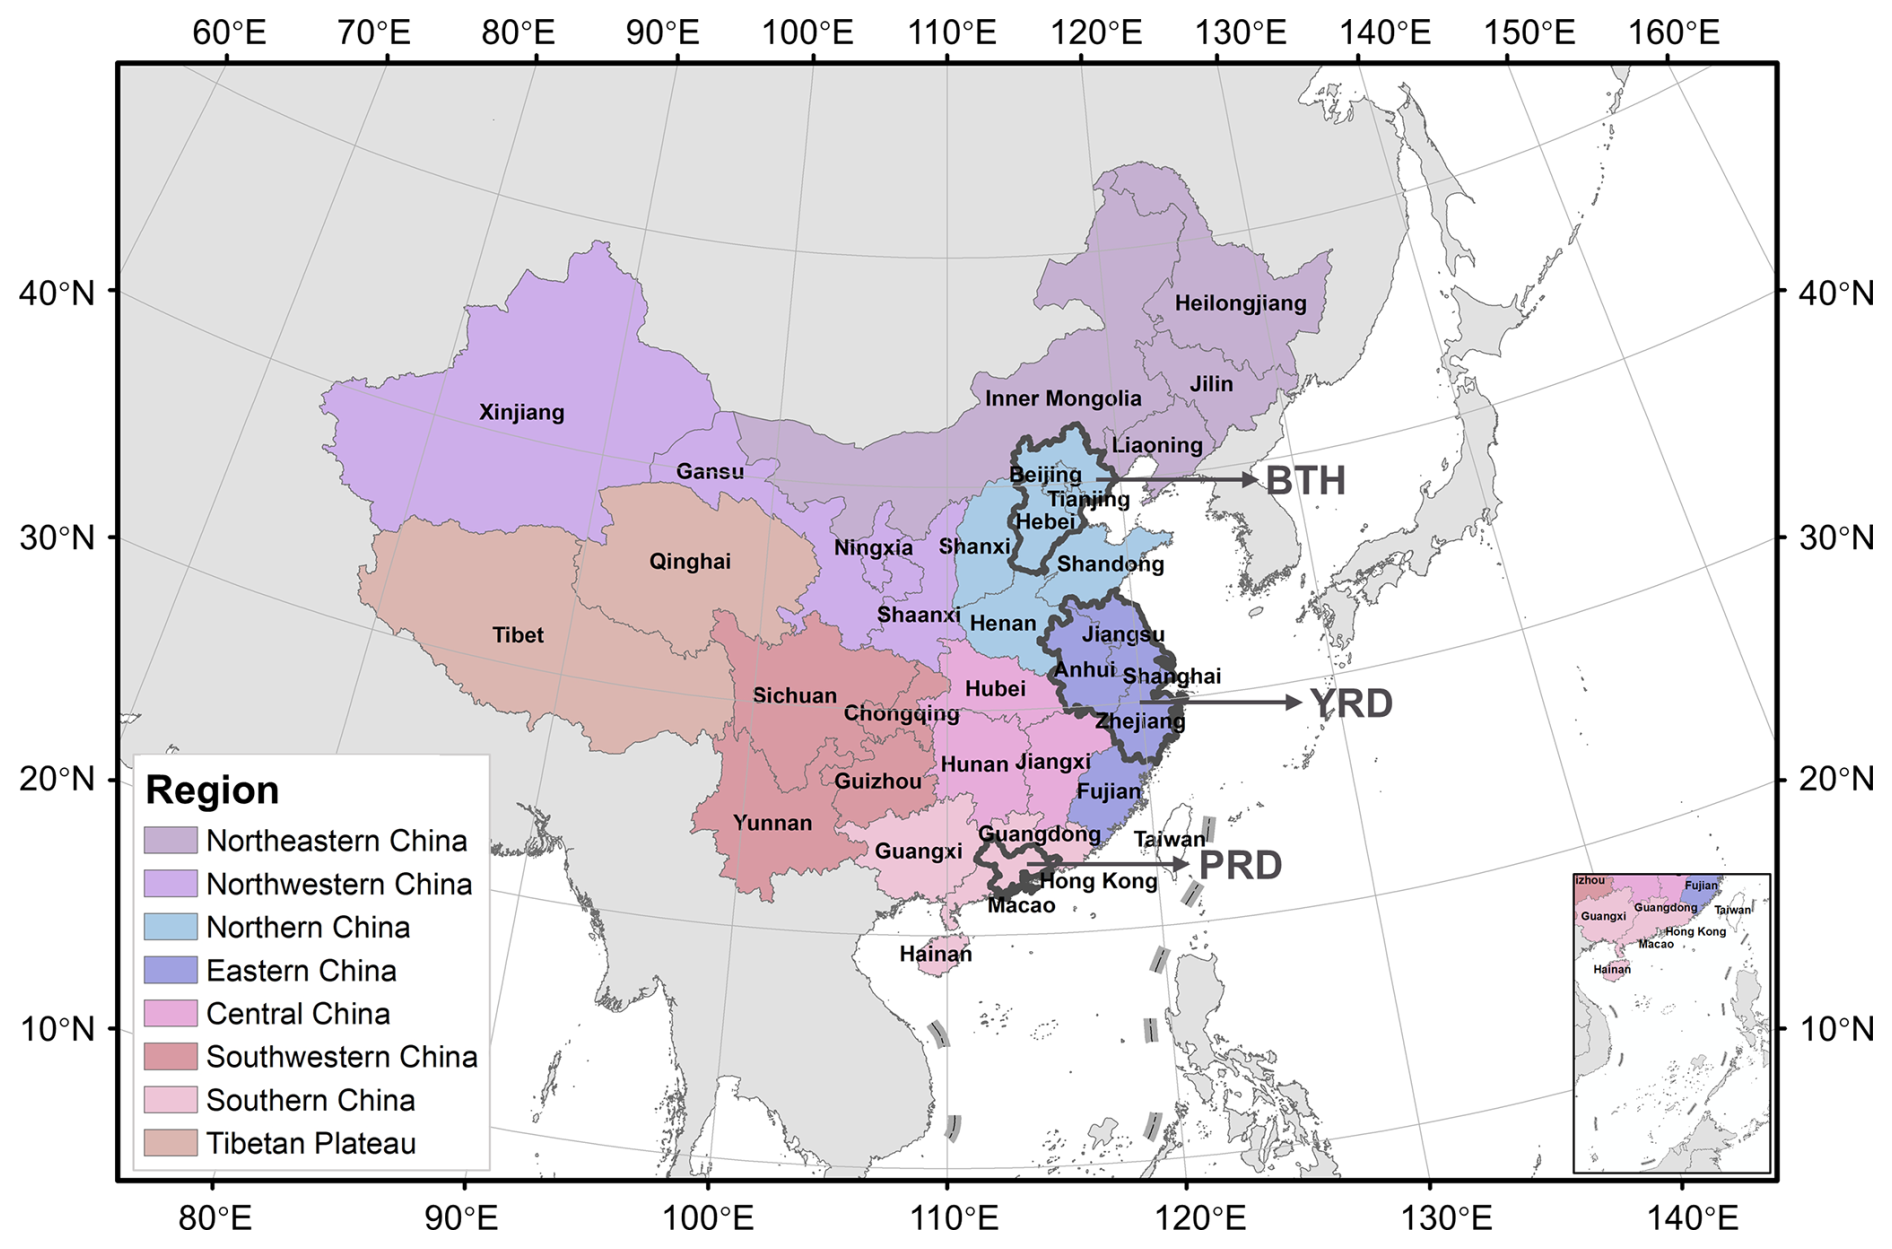
Figure 1The modeling domain and geographical definitions (denoted by colors) of this study. Boundaries of the three regions, including BTH (Beijing–Tianjin–Hebei), the YRD (Yangtze River Delta), and the PRD (Pearl River Delta), are marked by dark-grey lines.
2.1 Main framework and research domain
The simulation framework incorporates the Weather Research and Forecasting model (WRF, version 3.7.1) to generate hourly meteorological fields, the Model of Emissions of Gases and Aerosols from Nature (MEGAN, version 2.1) to calculate gridded BVOC emissions, and the Community Multiscale Air Quality model (CMAQ, version 5.2) to simulate O3 concentration. BVOC emission calculations and air quality simulations are driven by meteorological fields of 2018–2022 (the 2020s, representing the current situation) and 2058–2062 (the 2060s, representing the future situation). All simulation results are averaged over a period of 5 years to mitigate the influence of interannual variability of meteorology. The modeling domain, as for WRF, MEGAN, and CMAQ, covers east Asia and portions of other Asian regions, including north Asia, central Asia, south Asia, and southeast Asia (Fig. 1). It applies the Lambert conformal conic projection, centered at 34° N, 110° E, and the horizontal resolution is 27 km × 27 km, with 303×203 grids. The target area, the Chinese mainland, includes 31 provincial-level administrative regions (excluding Hong Kong SAR, Macao SAR, and Taiwan). Eight geographical regions are defined, and locations of the three regions with dense population and relatively heavy air pollution are also shown in Fig. 1, namely BTH (Beijing–Tianjin–Hebei), the YRD (Yangtze River Delta), and the PRD (Pearl River Delta).
2.2 Data sources and processing methods
We use the bias-corrected RCP4.5 output of the National Center for Atmospheric Research's Community Earth System Model (NCAR CESM) as initial and boundary conditions for WRF (Monaghan et al., 2014). A 10-year dynamic downscaling simulation for 2018–2022 and 2058–2062 is conducted. Note we do not utilize the real-time reanalysis data to drive the simulation of the 2020s, in order to minimize the systematic error between the simulation driven by real meteorological conditions (for current simulations) and climate projection (for future simulations).
The BVOC emissions are basically determined by meteorology and vegetation. The meteorological conditions are supplied by WRF. The vegetation data, including leaf area index (LAI), plant functional types (PFTs), and emission factors (EFs) of each PFT, are determined for 2020 and 2060. Gridded LAI data for 2020 are obtained from Global Land Surface Satellite product (Liang et al., 2021), and those for 2060 under the SSP2-4.5 scenario are downscaled from the daily CESM2 output of Coupled Model Intercomparison Project Phase 6 (CMIP6). PFT data for 2020 are derived from the MCD12C1 product of the Moderate-Resolution Imaging Spectroradiometer (MODIS) dataset and mapped to the 16 types required for MEGAN following Liao et al. (2020). The PFT data for 2060 in China are obtained from Liao et al. (2020) under the SSP2-4.5 scenario, with other regions maintaining 2020 levels. EFs for each PFT are taken from Guenther et al. (2012).
Anthropogenic emissions for the Chinese mainland are obtained from the Multi-resolution Emission Inventory for China (MEIC; http://meicmodel.org.cn/?page_id=560, last access: 24 March 2024) for 2020 and DPEC version 1.1 under SSP2-4.5, incorporating the best available end-of-pipe pollution control technologies, for 2060. The annual total emissions by country/region outside the Chinese mainland are obtained from the CMIP6 dataset under the SSP2-4.5 scenario (O'Neill et al., 2016; Gidden et al., 2019), and these emissions are downscaled into gridded monthly data for CMAQ simulation, based on the spatial and temporal distributions of emissions in MIX Asian emission inventory (Li et al., 2017). The speciation profiles of NMVOCs are taken from MIX as well. Figure S1 in the Supplement shows the emissions of two main precursors of O3 by year and region. The NOx and NMVOC emissions for the Chinese mainland were estimated to decline 58 % and 51 % from 2020 to 2060, respectively, much faster than those of surrounding areas within the modeling domain (8 % and 14 %, respectively). In particular, the NOx emissions would decline 57 %–62 % for the three developed regions, BTH, the YRD, and the PRD, while the reductions of anthropogenic NMVOCs would vary a lot among regions (36 %, 49 %, and 60 % for BTH, the YRD, and the PRD, respectively).
Carbon Bond 2005 (CB05; Yarwood et al., 2005) is adopted as the gas-phase chemical mechanism and the sixth-generation CMAQ aerosol module AERO6 (Appel et al., 2013) as the aerosol chemistry mechanism. The initial and boundary conditions are set by default clean air conditions in CMAQ, and the first 10 d for each year is determined as the spin-up period to minimize the effects of initial and boundary conditions.
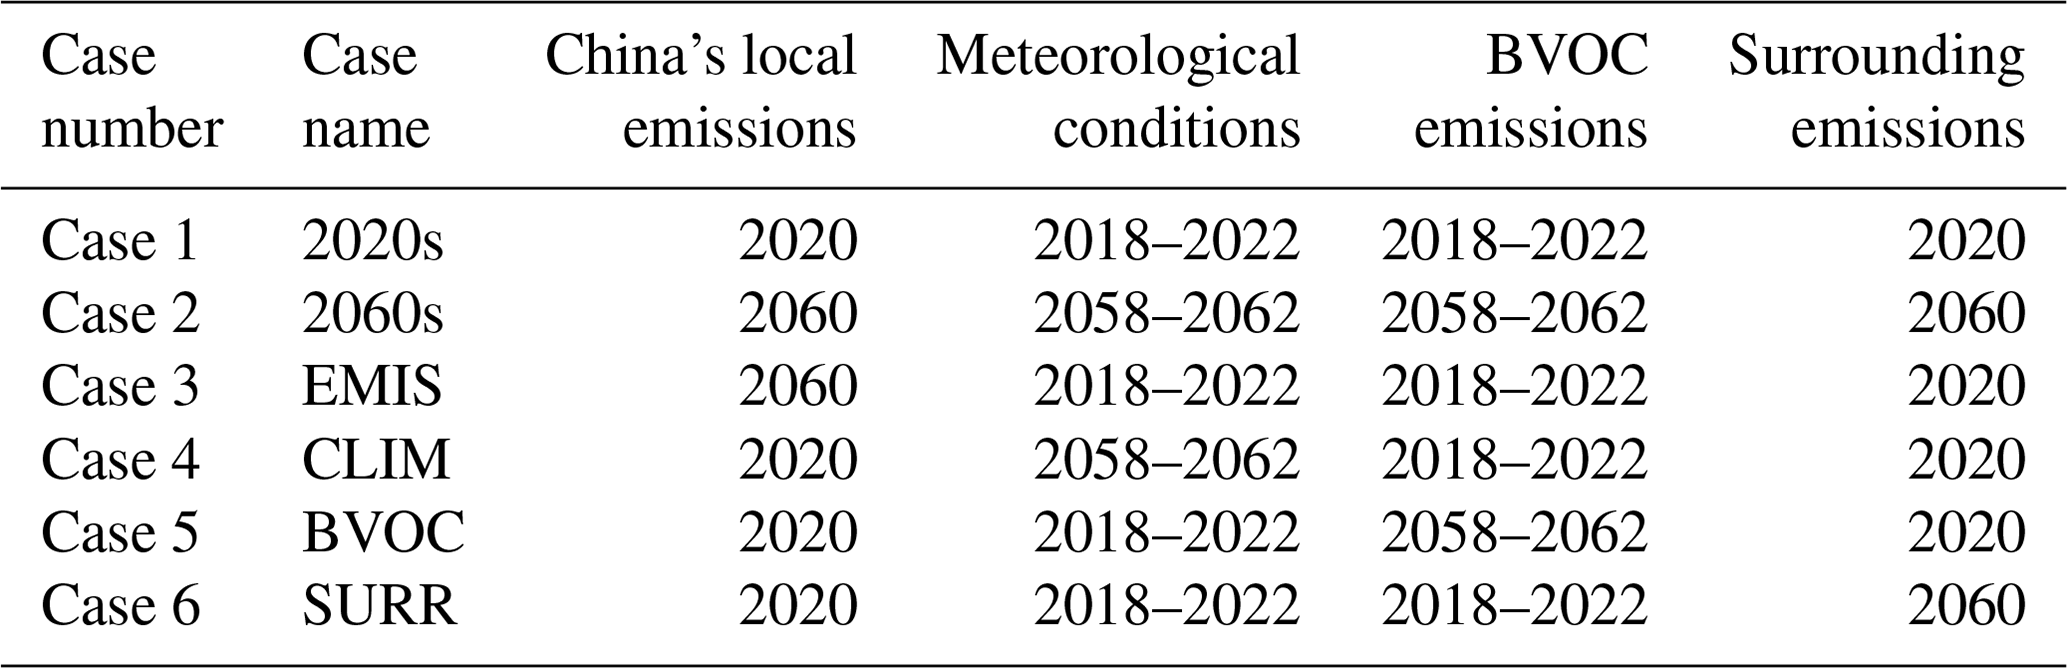
Table 1List of simulation cases to investigate the impact of future change upon surface O3 in China, with sensitivity experiments from the perspectives of four main influencing factors.
2.3 Simulation cases
Six cases of CMAQ simulations are conducted to investigate the impacts of future change of the four factors on O3 concentration in China (Table 1). Cases 1 and 2 represent the current (2020s) and future (2060s) baseline, respectively, and the difference between them indicates the joint effect of the future changes of multiple factors. Cases 3–6 each apply the prediction for 2060s for one specific factor but keeps the remaining factors at current condition (2020s). Thus, the difference between each of those four cases and Case 1 indicates the impact of individual factor, including meteorological conditions (Case 3), domestic anthropogenic emissions (Case 4), BVOC emissions (Case 5), and anthropogenic emissions of surrounding countries (countries other than the Chinese mainland within the modeling domain, Case 6). Each case contains a 5-year (2018–2022 or 2058–2062) WRF–MEGAN–CMAQ simulation driven by the varying meteorological conditions for individual years, and the 5-year average of simulated O3 concentrations is adopted for further analyses.
2.4 Model performance
To evaluate the model performance, we conduct a comparative analysis between simulations and observations for meteorological factors and O3 concentrations, as well as an intercomparison for BVOC estimates between different studies.
We first examine the capability of downscaled CESM climate projections in capturing the meteorological conditions of the 2020s. We applied the meteorological data from the National Climate Data Center (NCDC, archived at https://quotsoft.net/air, last access: 13 December 2021) in 2020, and the statistical metrics are presented in Table S1 in the Supplement. The modeled temperature at 2 m (T2) is in good spatiotemporal agreement with the observations, with the correlation coefficient (R) of 0.96 and index of agreement (IOA) of 0.98. The relative humidity (RH) is also well predicted with R and IOA at 0.78 and 0.88, respectively. The model shows an overestimation on the wind speed by 1.41 m s−1, which is also reported by Hu et al. (2022). The correlation coefficients of wind speed and direction are higher than 0.5. Overall, the modeled meteorological fields have basically captured the conditions in China and are appropriate for subsequent MEGAN and CMAQ simulations.
For BVOC emissions, we compare our estimates for the 2020s with previous studies, as summarized in Table S2. The total BVOC, isoprene, and terpene emissions in this study are estimated at 33.55, 21.08, and 3.30 Tg yr−1, respectively, and are comparable to other studies. In particular, our estimate is larger than others, except for Li et al. (2020b) for isoprene, while it is smaller than others, except for Wu et al. (2020b) for terpenes. The differences between studies might result from the diverse strategies of mapping PFTs from the original satellite products and the difference between downscaled climate conditions and the real meteorological fields.
We apply the observed MDA8 O3 concentration data from the national network of the China Ministry of Ecology and Environment (archived at https://quotsoft.net/air, last access: 2 April 2021) to evaluate CMAQ performance. As shown in Fig. S2, the simulation could capture the spatiotemporal distribution of surface MDA8 O3 concentration for the whole country and specific O3 pollution hot spots, e.g., BTH and eastern Sichuan Province with their surrounding areas. The statistical metrics of the comparisons between the simulated and observed monthly average MDA8 O3 concentration of 2020s are summarized in Table S1. The normalized mean biases (NMBs) are calculated at 14.12 % and 10.90 % for the warm and non-warm season, and R values at 0.71 and 0.32, respectively. Even with a slight overestimation, the reliability of our simulation is comparable to most previous studies in China, with a better performance in the warm season (Hu et al., 2016; Lu et al., 2019; Gao et al., 2020; Yang and Zhao, 2023).
We evaluate the interannual variability within each of the 5-year simulations, based on the coefficient of variation (CV), the ratio of standard deviation to the mean of the simulated O3 concentration. As shown in Table S3, the CVs are generally below 5 % in most cases, indicating relatively small interannual variability in O3 concentration simulation. The results thus justify the representativeness of the 5-year averages for present and future scenarios.
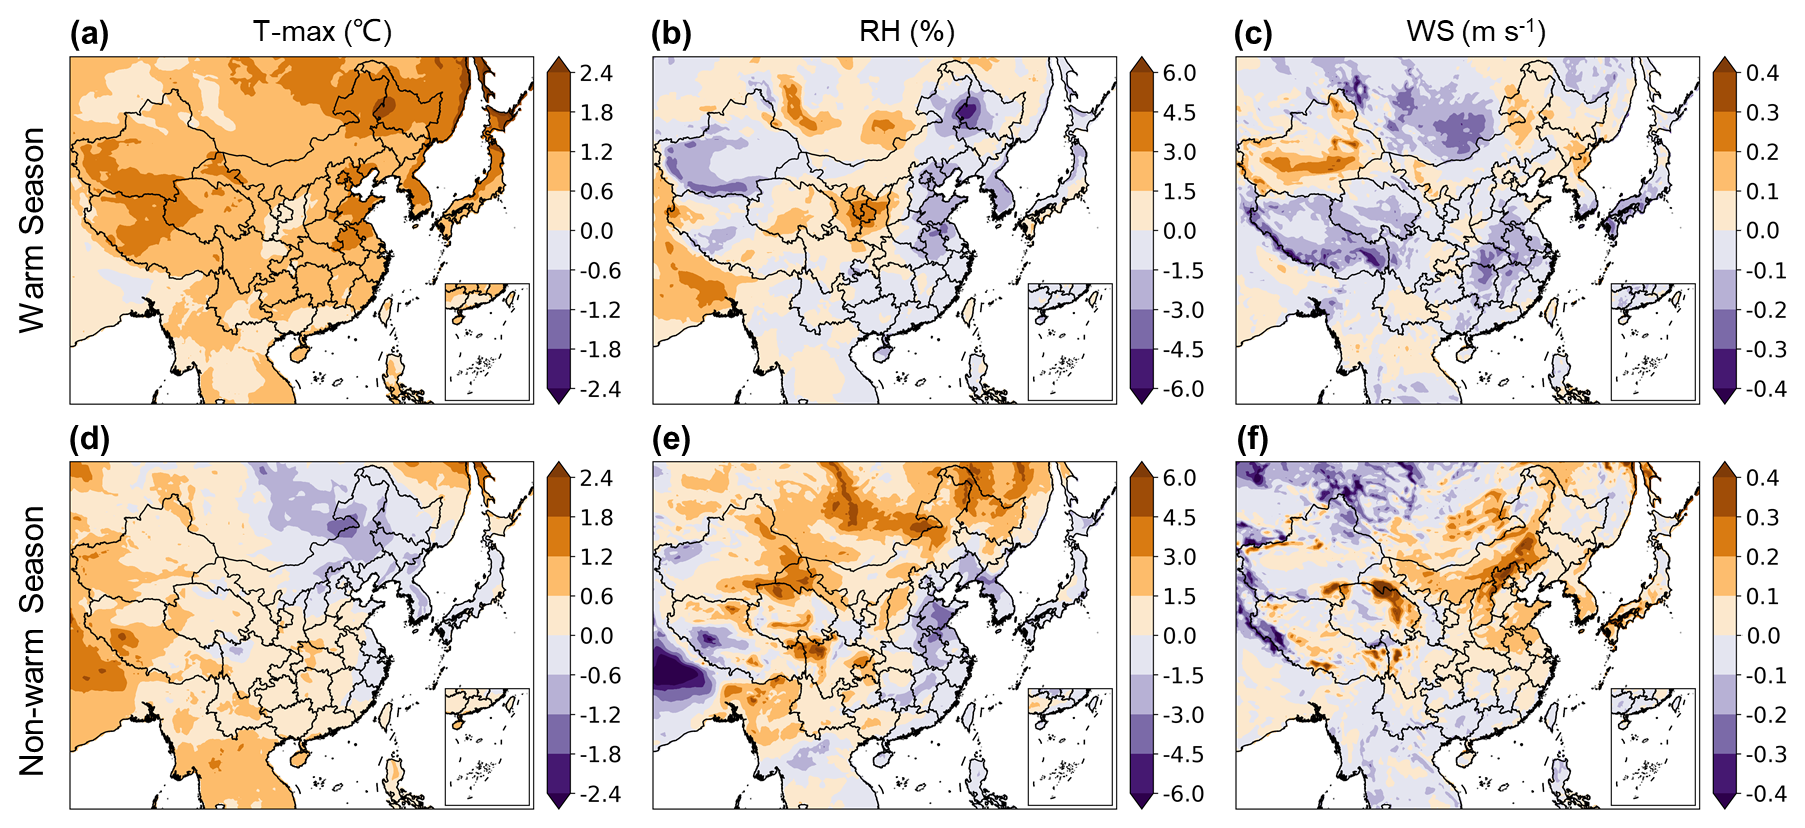
Figure 2Projected changes of the ozone-related meteorological factors, including daily maximum temperature at 2 m (Tmax; a, d), relative humidity (RH; b, e), and wind speed (WS; c, f), from the 2020s to 2060s. Panels (a)–(c) represent the warm season, and panels (d)–(f) represent the non-warm season.
3.1 Future change of meteorology and BVOC emissions
The downscaled changes in the meteorological factors from the 2020s to 2060s (SSP2-4.5 scenario) are shown in Fig. 2, including temperature, RH, and wind speed (WS). The changes are analyzed separately for April–September (warm season) and October–March (non-warm season). For the warm season, daily maximum temperature at 2 m (Tmax) will increase across China with an average change of 1.0 °C, and the minimum and maximum changes are found in Tibetan Plateau at 0.1 °C and in Heilongjiang Province at 2.1 °C, respectively. The RH will decrease slightly by −0.6 % for the whole country, with the changes for most areas within the range between −3 % and 0 % except for some areas of Northwestern China, Southwestern China, and the Tibetan Plateau (see the region definitions in Fig. 1). The growing Tmax and declining RH will enhance the photochemical production of O3 and BVOC emissions. For the non-warm season, the national average growth of Tmax will be smaller at 0.2 °C, and some areas in Northeastern, Northern, and Eastern China will even experience a decline ranging from −1.8 to 0 °C. The RH will change diversely across the country, ranging from −6.0 % to 6.3 %. Very limited change in WS will occur, ranging from −0.1 to 0.2 m s−1 in most areas of the country. Generally, the decreasing wind speed in future east Asia could be attributed to weakened atmospheric circulation (Coumou et al., 2018; Deng et al., 2021). The increasing wind speed in the non-warm season might result from the temperature and pressure gradients between the land and adjacent oceans (Yao et al., 2019; Wu et al., 2020a). The spatial distribution of downscaled future meteorological field changes is generally in agreement with those predicted by Hong et al. (2019) and Hu et al. (2022). Some discrepancies in temperature and wind speed change of the non-warm season between studies result from the different choices of base year and parameterization schemes of WRF.
Table 2The BVOC estimation over China and emission intensity in BTH, the YRD, and the PRD of the 2020s and 2060s, as well as the corresponding growth rates over this period.
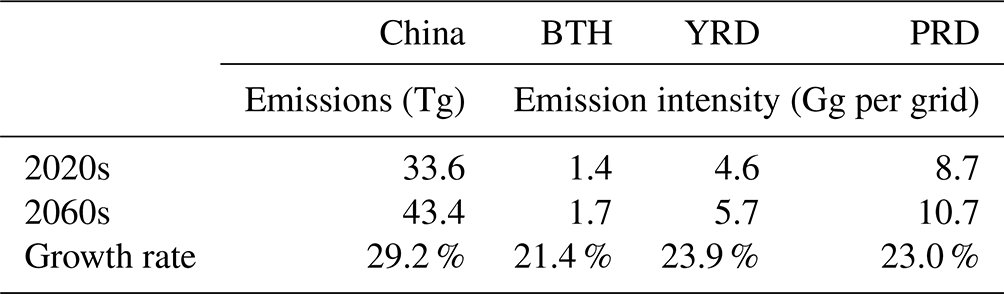
Table 2 shows China's BVOC emissions of the 2020s and 2060s (SSP2-4.5 scenario) estimated with MEGAN, as well as the BVOC emission intensity (emissions per unit area) for the three developed regions. The emissions will increase from 33.6 Tg yr−1 for the 2020s to 43.4 Tg yr−1 for the 2060s. The growth rates in BTH, YRD, and PRD are predicted to be 21.4 %, 23.9 %, and 23.0 %, respectively, smaller than for the whole country (29.2 %). The spatial distributions of BVOC emissions for the 2020s and the changes from the 2020s to 2060s are shown in Fig. S3. Areas all over China will experience growth in BVOC emissions, and this will be more prominent in areas with high vegetation coverage (e.g., Southern and Southwestern China) rather than urban areas. The growth of BVOC emissions will enhance the contribution of natural sources to O3 formation, especially along with declining anthropogenic emissions in the future (Penuelas and Llusia, 2003; Riahi et al., 2017; Gao et al., 2022).
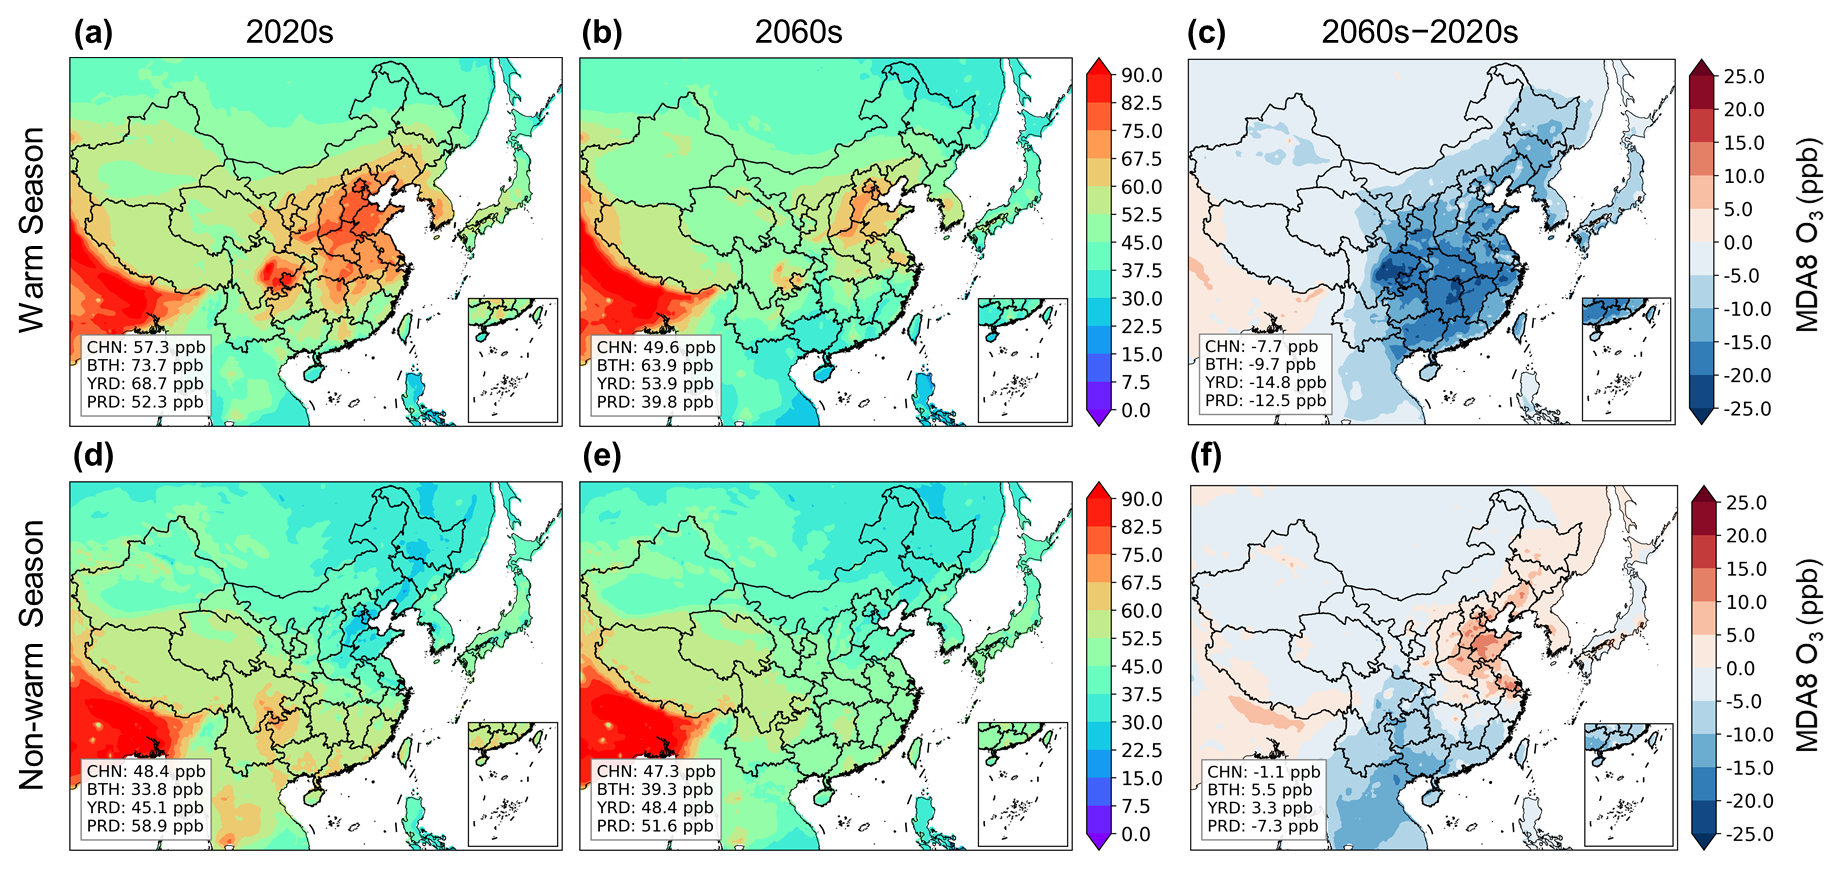
Figure 3Simulation and projection of seasonal average MDA8 O3 in the 2020s (Case 1, a, b) and 2060s (Case 2, d, e) and the changes over this period (Case 2 − Case 1, c, f). Panels (a)–(c) represent the warm season, and panels (d)–(f) represent the non-warm season. Regional mean concentrations across China (CHN), BTH, the YRD, and the PRD are shown in the inset on the left.
3.2 Response of surface O3 concentration to combined future changes
Figure 3 illustrates the spatial distributions of MDA8 O3 concentrations for the warm and non-warm seasons of the 2020s and 2060s (SSP2-4.5 scenario), as well as the differences between the two periods. Briefly, future changes of the four factors under SSP2-4.5 are estimated to jointly reduce MDA8 O3 by 7.7 and 1.1 ppb in the warm and non-warm season, respectively, while the O3 responses to future changes will differ by region.
In the warm season of the 2020s (Fig. 3a), the nationwide average MDA8 O3 concentration is simulated at 57.3 ppb, and the concentrations in BTH, the YRD, and the PRD are 73.7, 68.7, and 52.3 ppb, respectively. Hot spots of O3 pollution, with average MDA8 O3 over 75 ppb, are mainly located in Northern China and Sichuan Province. The pattern is predicted to persist into the 2060s (Fig. 3b), with a decline in both the severity and size of highly polluted regions. The nationwide MDA8 O3 concentration will decline 13.4 % to 49.6 ppb, and in most areas of China it will be within the range of 37.5–67.5 ppb. The highest concentration will be lower than 75 ppb for the two hot spots of Northern China and Sichuan. BTH will remain the most O3-polluted area in the warm season, with the O3 concentration at 63.9 ppb (13.3 % smaller than the 2020s), while that of YRD and PRD will decrease to 53.9 (21.5 %) and 39.8 ppb (23.9 %), respectively. O3 concentration in the developed regions will decline faster than or roughly the same as that for the whole country. The reductions in MDA8 O3 from 2020s to 2060s will be 10–20 ppb for Northern, Eastern, Central, and Southern China and 0–10 ppb for Northeastern and Northwestern China as well as the Tibetan Plateau (Fig. 3c). Notably, some areas in Sichuan are expected to experience a substantial decline in MDA8 O3 over 20 ppb.
O3 concentration of the non-warm season is simulated to be much lower than that of the warm season. The 2020s average MDA8 O3 is 48.4 ppb, ranging from 30.0 to 67.5 ppb in most areas of China (Fig. 3d). Different from the warm season in which the highest concentration is found for Northern China and Sichuan, Southern China, and Southwestern China suffer the highest O3 level for the non-warm season. A general west–east and south–north gradient is found for MDA8 O3, with the lowest concentration found in Northern and Northeastern China. The concentrations in BTH and YRD are simulated at 33.8 and 45.1 ppb, respectively, much lower than the concentration in the PRD (58.9 ppb). Relatively high temperature during even the non-warm season is expected to expand the O3 pollution period in Southern China. Resulting from complex change of multiple factors, the national average MDA8 O3 concentration in the non-warm season of 2060s will decrease slightly to 47.3 ppb under SSP2-4.5, and in most regions it will be within the range of 37.5–52.5 ppb, except for some areas in Northeastern China and the Tibetan Plateau (Fig. 3e). The MDA8 O3 concentrations of the three developed regions will become closer at 39.3, 48.4, and 51.6 ppb for BTH, the YRD, and the PRD, respectively. As illustrated in Fig. 3f, MDA8 O3 is predicted to increase in BTH and YRD and the surrounding areas, with the growth mostly ranging 0–15 ppb. In other areas (especially in Southern China), the concentration will decrease in the non-warm season by −15 to −5 ppb. As a result of the increased O3 in the less polluted regions of Eastern and Northern China and decreased O3 in the more polluted regions of Southwestern and Southern China, the 2060s regional disparity in the non-warm season O3 pollution will get smaller compared to the 2020s (Fig. 3d and e).
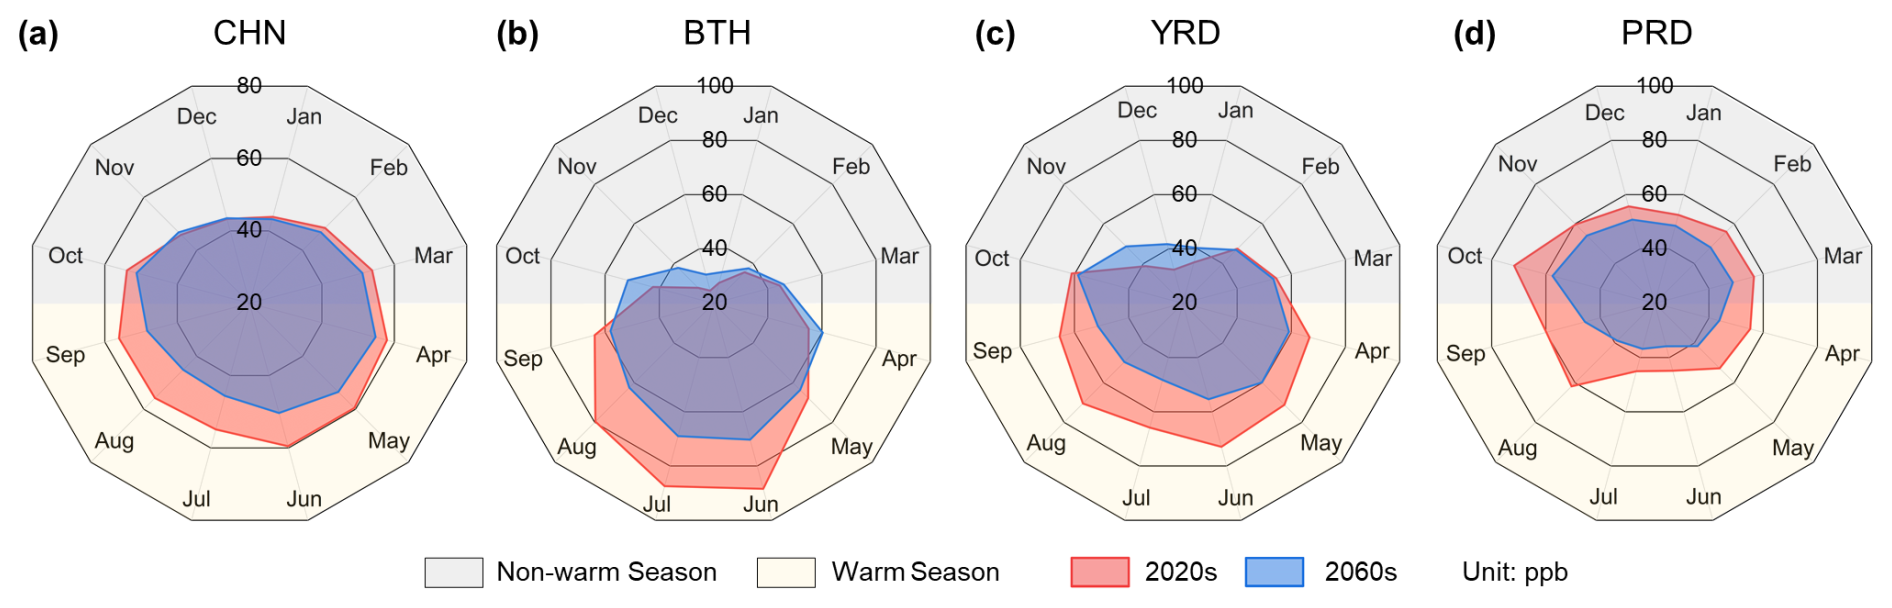
Figure 4Simulation and projection of monthly average MDA8 O3 in the 2020s and 2060s across CHN (a), BTH (b), YRD (c), and PRD (d).
To further explore the temporal pattern of O3 level in the future, we compare the monthly average MDA8 O3 in the 2020s and 2060s under SSP2-4.5 for the whole country and three developed regions (Figs. 4 and S4). For the whole country (Fig. 4a), the changes of monthly average MDA8 O3 from 2020s to 2060s are estimated to range from −3.2 to −10.7 ppb in the warm season but to be less prominent in the non-warm season (from −2.7 to 0.9 ppb). Along with the greater reduction in summertime (June, July, and August), in particular, the periods with the highest O3 concentration will expand into spring (March) and fall (October), as presented in Fig. S4. For the three regions, a greater decline in O3 concentration is found in the warm season, while a smaller or even a growth is found in the non-warm season. For BTH (Fig. 4b), the monthly MDA8 O3 concentrations range between 24.7 and 88.4 ppb in the 2020s, with a clear difference between the warm and non-warm season. This pattern will remain in the 2060s, with a smaller difference between months (30.6–70.2 ppb). The temporal change pattern of the YRD is similar to that in BTH, with a decline in the warm season and growth in the non-warm season (Fig. 4c). The shift in O3 pollution from the warm towards the non-warm season is more prominent in the PRD, the only region where O3 concentration of all the months in the 2060s is predicted to decline (Fig. 4d). Different from BTH and the YRD, as mentioned above, higher O3 concentrations during spring and fall and lower in summer (due to the abundant summertime precipitation and high humidity) are found for PRD in the 2020s (Gao et al., 2020; Han et al., 2020). With great O3 decline in the warm season, the periods experiencing peak O3 pollution are predicted in the non-warm season of the 2060s, predominantly between October and March (Fig. S4).
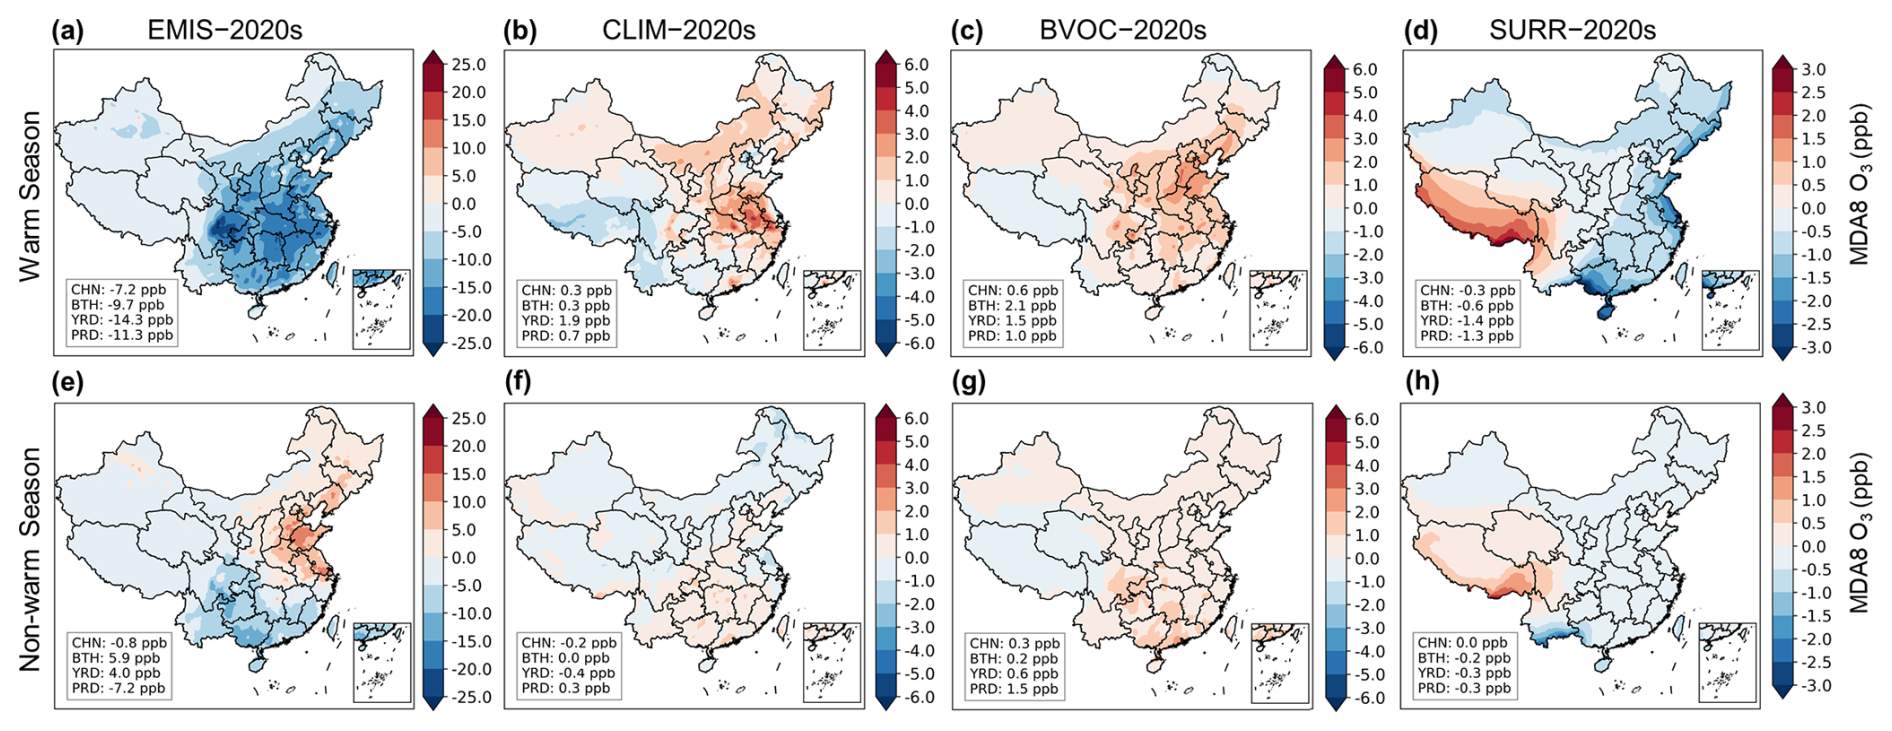
Figure 5Projected changes of MDA8 O3 from the 2020s to 2060s attributed to anthropogenic emissions from local sources (Case 3 − Case 1, a, e), meteorological conditions (Case 4 − Case 1, b, f), BVOC emissions (Case 5 − Case 1, c, g), and anthropogenic emissions from surrounding countries (Case 6 − Case 1, d, h). Panels (a)–(d) represent the warm season, and panels (e)–(h) represent the non-warm season. Regional mean changes across CHN, BTH, the YRD, and the PRD are shown in the inset on the left.
3.3 Identifying surface O3 response to individual factors
3.3.1 Local anthropogenic emission change
Figure 5 shows the influences of changes of individual factors (local anthropogenic emissions, meteorological conditions, BVOC emissions, and anthropogenic emissions from surrounding countries) on the warm and non-warm season O3 concentrations. Out of the four, the change of local anthropogenic emissions is predicted to be the most influential factor, resulting in a national average decline of 7.2 and 0.8 ppb for the warm and non-warm season, respectively (Fig. 5a and e). In the warm season, the emission reduction will play a positive role in reducing O3 pollution in most areas of China, and the decrease will exceed 10 ppb across Northern, Eastern, Central, Southern, and part of Southwestern China. In the non-warm season, emission reduction will have contrasting effects on MDA8 O3 levels in the north and south of China, enhancing MDA8 O3 by 0–15 ppb for the former while restraining it by 0–10 ppb for the latter. In particular, the emission reduction is predicted to elevate the O3 concentration by 5.9 and 4.0 ppb for BTH and the YRD, respectively.
Figure S5 shows the relative emission reductions from the 2020s to 2060s by region. Under the SSP2-4.5 scenario, the reductions in NOx and VOC emissions will range from 35.6 % to 63.6 % for different regions, and VOC emission reduction will be less than that of NOx except for the PRD. As the NOx-limited regime for O3 formation (i.e., O3 is more sensitive to NOx emission change) occurs more frequently in the warm season, while the VOC-limited regime occurs more in the non-warm season, the larger decline in NOx emissions than VOCs should be more effective in restraining the warm season O3 pollution, but it has less benefit or even a negative effect in the non-warm season (Sillman and He, 2002). Wintertime in the NCP and YRD has been reported under the VOC-limited regime, and the excessive NOx emissions play an important role in removing O3 via the titration effect (Jin and Holloway, 2015; Li et al., 2021; Wang et al., 2021b). This may explain the MDA8 O3 increase during the non-warm season with an insufficient reduction in VOCs (35.6 % and 49.5 %) but a sharp reduction in NOx of 53.4 % and 60.3 % for the NCP and YRD, respectively. Similarly, Hou et al. (2023) and Liu et al. (2023b) also predicted a growth of O3 concentration in the non-warm season over BTH and the YRD under a net-zero carbon emission scenario, resulting from a weakened titration effect. Figure S6 shows the monthly variation of O3 and odd oxygen (Ox, Ox= O3+ NO2, representing the real photochemical production potential of O3 considering the titration effect) in the 2020s and 2060s. It should be noted that the growth of O3 in the non-warm season in the 2060s for BTH and the YRD will be accompanied by minimal change of Ox, while the declines of O3 and Ox will appear simultaneously in the warm season for the three regions and in the non-warm season for the PRD. This indicates that the growth of non-warm season O3 in BTH and the YRD should result partly from NOx reduction and thereby weakened NO titration, as titration is a key pathway of O3 loss when the chemical reactivity is relatively low in winter (Gao et al., 2013; Akimoto and Tanimoto, 2022). The differentiated O3 responses to precursor reduction between YRD and PRD were also detected during the COVID-19 breakout period. With the O3 isopleth plots, Wang et al. (2021b) illustrated that 40 %–60 % reduction in NOx and VOCs enhanced the O3 formation in YRD under the VOC-limited regime but suppressed O3 in PRD under the transitional regime (a regime that is between NOx- and VOC-limited). Therefore, VOC emission controls should be better addressed for O3 pollution alleviation when it expands to the non-warm season in the future.
3.3.2 Meteorological condition change
As shown in Fig. 5b and f, the influence of meteorological change exhibits different patterns for the warm and non-warm season. In the warm season, meteorological change due to global warming will play a positive role on O3 formation in most of China, with the enhancement within 0–4 ppb, but it will reduce the O3 level in remote areas like the Tibetan Plateau. The national average growth will be 0.3 ppb and that for the YRD, the PRD, and BTH will be 1.9, 0.7, and 0.3 ppb, respectively. The response of O3 to meteorological change is associated with some specific variables (Hong et al., 2019). For example, the great enhancement of O3 in YRD might be attributable to a hotter, drier, and more stable atmosphere, with a growth in Tmax (over 0.6 °) and decline in RH and WS (Fig. 2). The result is similar to Hong et al. (2019), which reported a change of 2–8 ppb of daily 1 h maximum O3 concentration for the peak season from the 2010s to 2050s under RCP4.5. In addition, the declining O3 in Tibetan Plateau and the surrounding areas might result partly from the weakened long-range transport of peroxyacetyl nitrate (PAN; the principal NOx reservoir) from the polluted areas (Fischer et al., 2014). Driven by the elevated temperature, PAN from relatively polluted regions will undergo stronger thermal decomposition locally and thus fail to be transported far away to the remote regions to promote O3 formation (Liu et al., 2013; Lu et al., 2019).
The influence of meteorological change on O3 production is predicted to be much smaller for the non-warm season, with the magnitude within ±1 ppb in most areas and nationwide average at −0.2 ppb. In the three developed regions, the changes are predicted to range from −0.4 to 0.3 ppb, with little regional difference. The limited influence might be attributable to the modest change in temperature and RH in the non-warm season.
3.3.3 BVOCs and surrounding anthropogenic emission change
Compared to domestic emissions, a change in BVOC emissions and anthropogenic emissions from surrounding countries will have less of an influence (within ±3 ppb) on surface O3 concentration in China. BVOC change tends to enhance O3, while foreign emission change tends to restrain it in most areas (Fig. 5).
The growing BVOC emissions due to vegetation and climate change are estimated to enhance O3 concentration by 0–3 ppb in the most areas of China, with a larger influence of 0.6 ppb in the warm season than that of 0.3 ppb in the non-warm season across the country (Fig. 5c and g). In the warm season, relatively large growth of O3 concentration will occur in BTH at 2.1 ppb, and in the YRD and PRD, it will be 1.5 and 1.0 ppb, respectively. The abundant NOx emissions in BTH are expected to result in a larger O3 concentration response to BVOC emission change than in the YRD and PRD; even the BVOC emission change in BTH will be smaller than the other two regions (Table 2). The result is in agreement with other numerical simulation experiments. Liu et al. (2019) reported a prominent O3 enhancement even with a low BVOC emission rate under RCP8.5, in a NOx-abundant environment. In remote areas like the Tibetan Plateau and Northeastern China, the increased BVOCs will remove O3 due to the isoprene ozonolysis in a low-NOx environment (Hollaway et al., 2017; Zhu et al., 2022). In general, regions with higher O3 pollution levels and NOx emissions will suffer more risk of O3 growing from rising BVOC emissions in the future.
Most areas of China will benefit from the foreign emission change in terms of O3 pollution alleviation (Fig. 5d and h). An exception is the Tibetan Plateau and its surrounding areas, which will be affected by the elevated emissions of NOx and VOCs from south Asia under SSP2-4.5. Limited by the range of pollutant transport, greater impacts will be found for coastal and border areas and less for inland areas (Ni et al., 2018). Larger O3 changes in the three developed regions are predicted than in the whole country, benefitting from the precursor emission reduction in east Asia and southeast Asia.
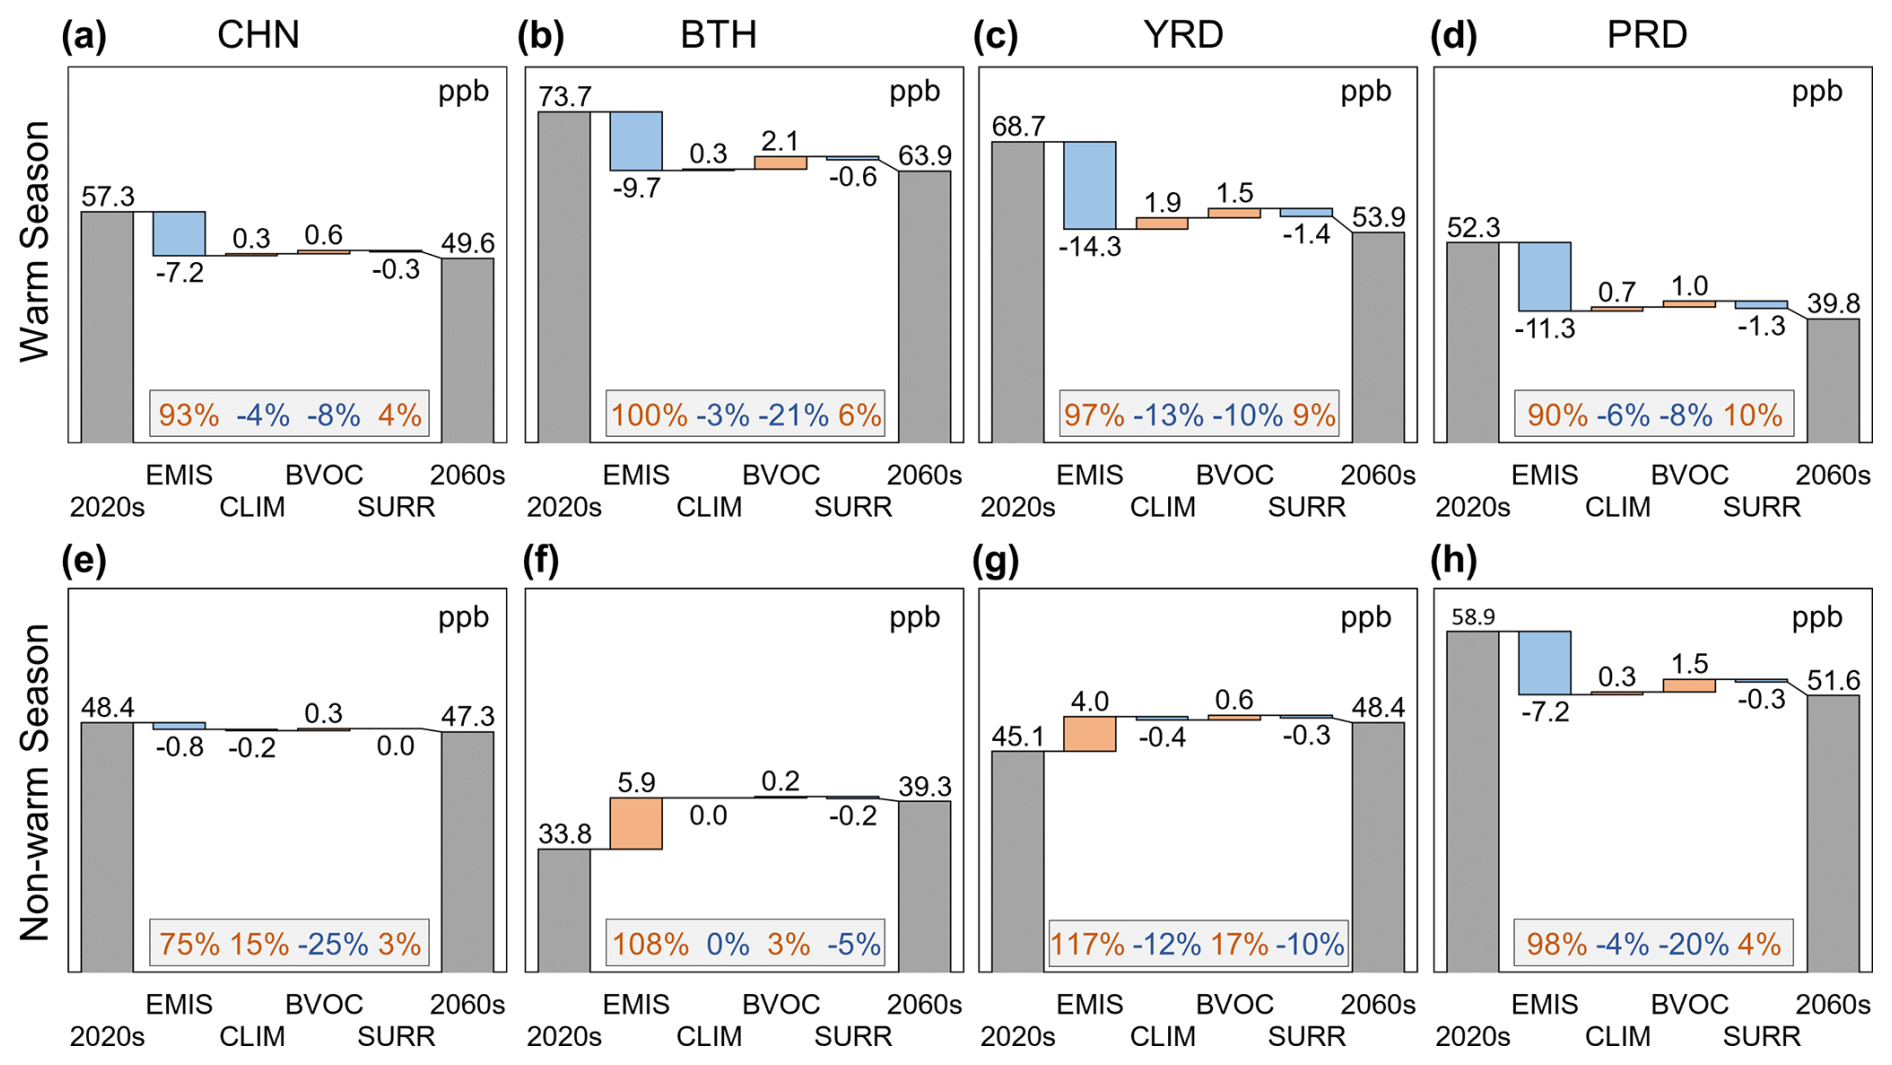
Figure 6The relationships between the separate MDA8 O3 changes attributed to the four factors (denoted by the name of Case 3–6) and the total changes from the 2020s to 2060s over China and the three regions. Panels (a)–(d) represent the warm season, and panels (e)–(h) represent the non-warm season. The relative contributions of the four factors to the total influence of future change are shown in the light-grey box.
3.4 The relationship between the joint and separate effects of multiple factors
Figure 6 summarizes the contributions of individual factors to the total O3 change by region and season. Due to the nonlinear response of O3 to multi-factor changes, the aggregated contribution of the four factors does not equal the joint contribution (i.e., there are gaps between the difference of the 2020s and 2060s and the aggregated contribution of four factors).
The varying domestic anthropogenic emissions are predicted to dominate the change of the future O3, with a relative contribution ranging from 75 % to 117 % for different regions and seasons. The relative contributions of the other three factors are estimated to be limited within ±25 % at national and regional level. Among different regions, YRD will be more affected by climate change with the contribution of −13 % and −12 % for the warm and non-warm season, respectively, far greater than that of BTH and PRD (−6 % to 0 %). BTH will be more affected by BVOC emission change than other regions in the warm season (−21 %), while the YRD and PRD will be more affected in the non-warm season with the relative contributions of 17 % and −20 %, respectively. Little regional difference is found for the relative contributions of foreign emission change.
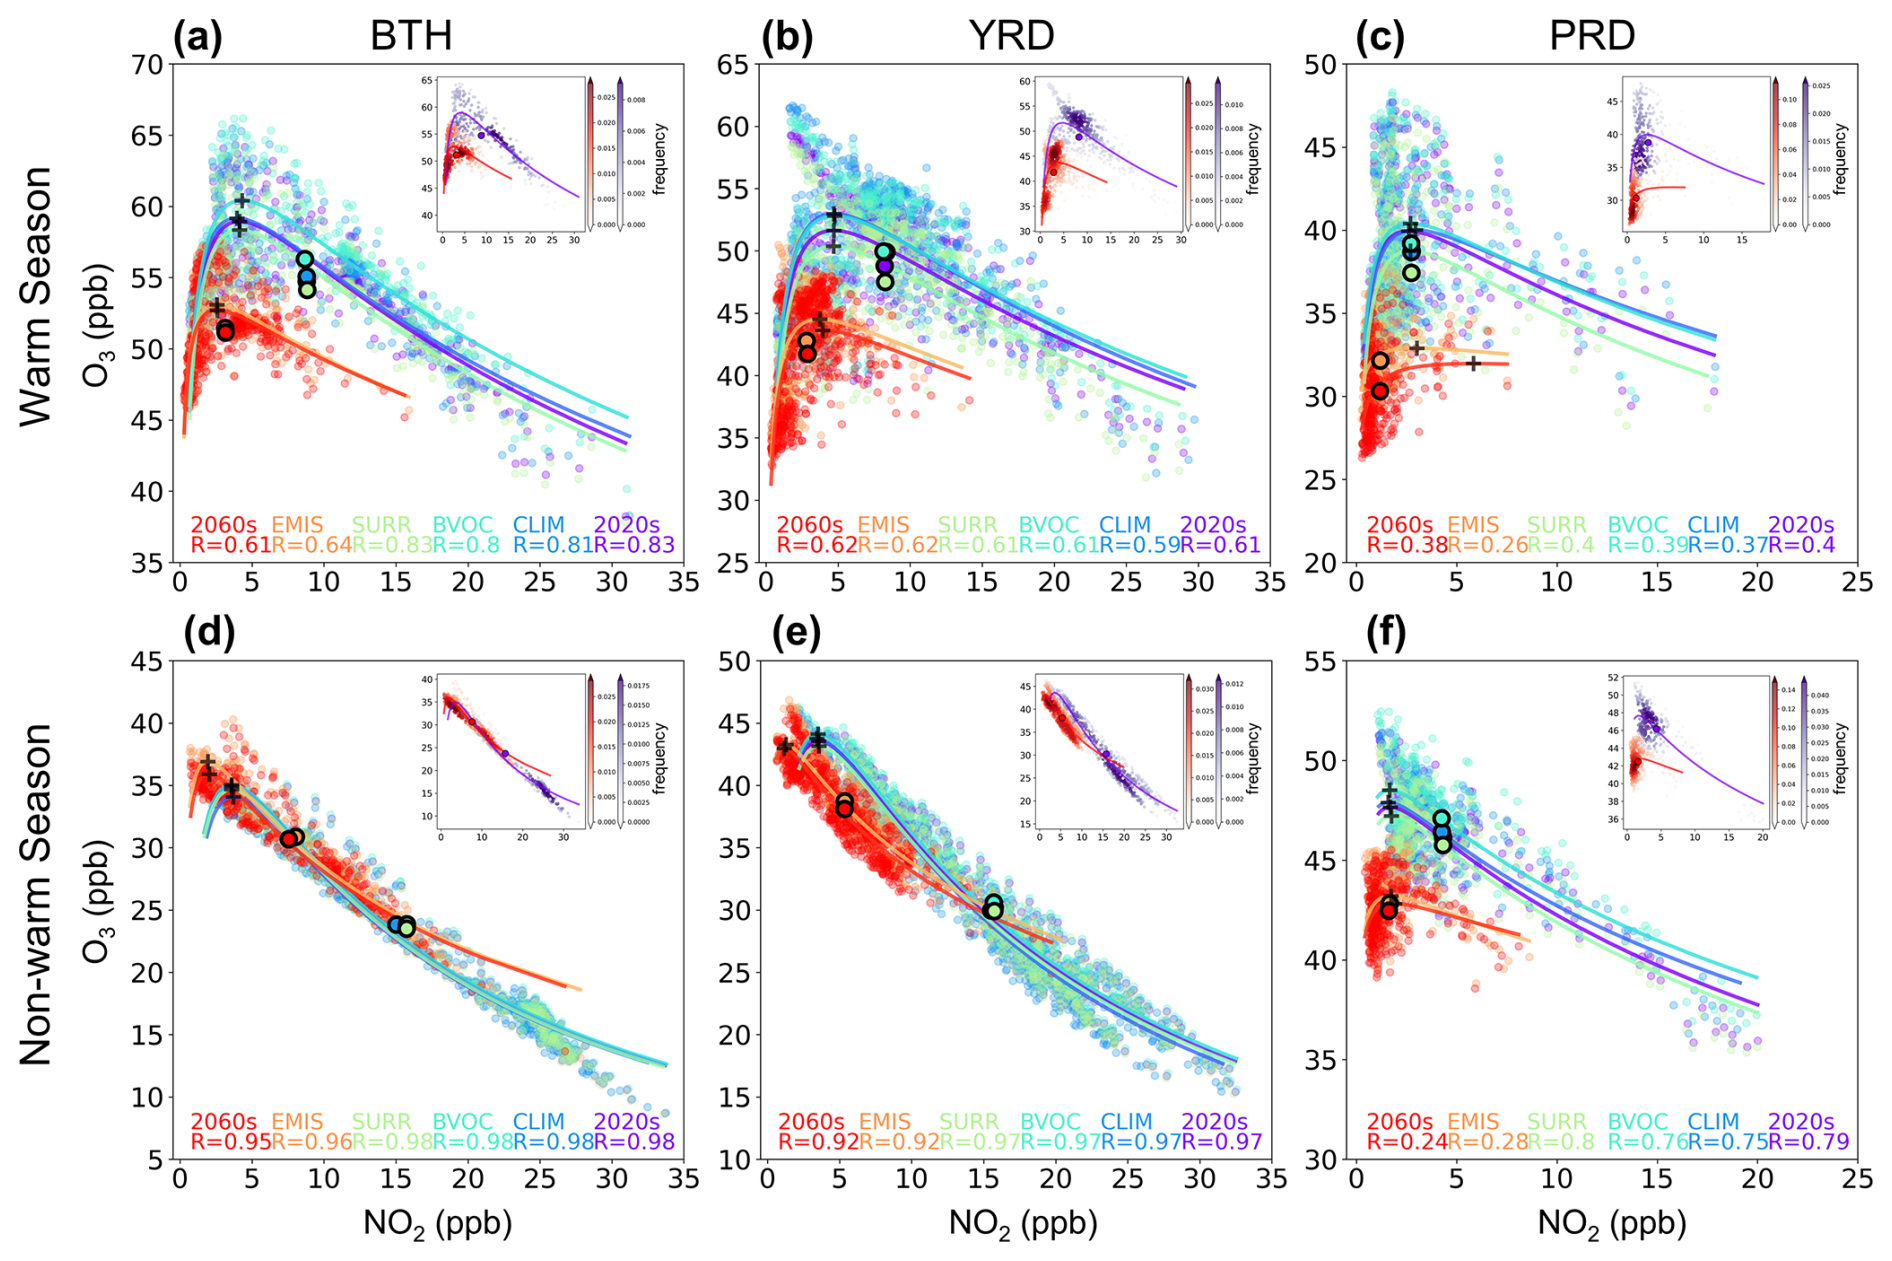
Figure 7The relationships between simulated hourly NO2 and O3 concentrations with the lognormal fits for different regions and seasons. The colored circles, representing different cases, come from the seasonal average concentrations for each grid in the target region. The specific circles with black border represent the regional average situation, and the turning points of every fitted curve are marked by the “+” sign. The density plots of the 2020s and 2060s are shown in the inset on the left.
To better understand the regional and seasonal differences of the relative contributions of future changes to O3 concentration, we examine the nonlinear response of O3 to precursor change in the three developed regions. We follow Chen et al. (2021) and Schroeder et al. (2017) and conduct a fit of lognormal distribution for the relationship of modeled hourly O3 and NO2 concentrations, as shown in Fig. 7. The data points on the left of the turning point of the fitted curve suggest a NOx-limited regime and on the right a VOC-limited regime, and data points around the turning point are under a transitional regime.
The O3–NO2 relationship from the 2020s to 2060s will be mostly influenced by the changing domestic anthropogenic emissions, indicated by the close distributions of data points and fitted curves between “EMIS” and “2060s” in Fig. 7. In the warm season, the future O3–NO2 relations in BTH and YRD are predicted to change greatly from a highly O3 polluted situation with moderate NO2 concentration to a situation with a relatively low level of NO2 (mostly under 10 ppb) and a moderate level of O3 (under 60 ppb). A weak VOC-limited regime appeared for the whole BTH in the 2020s, consistent with recent observation-based analysis (Chen et al., 2023; Kong et al., 2024). There is big diversity within the region, including a dense area with a strong VOC-limited regime and other areas with a transitional or NOx-limited regime (Fig. 7a). Represented by the moving of most points from the right of the turning point to near or left of the turning point, the NOx-limited and transitional regimes will dominate BTH in the 2060s. Compared to 2020s, the data points of 2060s are more closely distributed, indicating a reduced diversity of O3 formation regime in the region. For YRD, most areas were under a transitional or weak VOC-limited regime in the 2020s with limited diversity within the region, and the situation in the 2060s will be similar to that of BTH (Fig. 7a and b). The shift from a weak VOC-limited regime in the 2020s to a transitional or NOx-limited regime in the 2060s for BTH and the YRD implies the influence of emission reduction on altering the sensitivity of O3 formation to precursors. Most areas of PRD in the 2020s are under transitional or NOx-limited regimes, and the regime will transfer to a strong NOx-limited one in the 2060s, with an almost positive correlation between NO2 and O3 in a low-NO2 environment (Fig. 7c). In the non-warm season, O3 and NO2 will remain negatively correlated for BTH and YRD till the 2060s, which suggests a persistent VOC-limited regime and explains the O3 concentration growth along with substantial precursor emission reductions. The turning points are simulated at extremely low NO2 concentrations of 2.0 and 1.2 ppb for BTH and YRD, respectively (Fig. 7d and e). A big challenge still exists on effective emission controls to reduce the O3 concentration in the non-warm season for the two regions. Differently, the O3 formation sensitivity in most of the PRD will shift from a transitional regime towards a more NOx-limited situation (Fig. 7f). A simple comparison with the O3 evolution and its precursor emission changes in developed country provided more implications for policy. According to Chen et al. (2021) and the US Environmental Protection Agency, the northeastern United States experienced a rapid surpassing of the turning point of O3 formation sensitivity during the 1990s–2010s, with approximately 60 % reductions in both anthropogenic NOx and VOC emissions. In BTH, the emissions are predicted to decline 57 % and 36 % for NOx and NMVOCs during 2020s–2060s under SSP2-4.5. Therefore, more ambitious reductions in NMVOCs will be necessary (ideally double the current projected abatement under SSP2-4.5) to accelerate the shift in the O3 chemical regime for BTH.
The fitted curves of other three factors are similar to those of the 2020s, and the change of these factors will make little difference on NO2 concentration but will result in moderate changes on O3 concentration within ±2 ppb. The limited changes of climate, BVOC emissions, and foreign anthropogenic emissions will not essentially alter the O3 formation regime but may change the O3 production under nearly the same NO2 concentration. Changes in individual meteorological factors are expected to easily influence the O3 and NO2 concentrations (Pope et al., 2015; Liu and Wang, 2020; Dewan and Lakhani, 2022). The little modeled response of NO2 to meteorological change, except that in the non-warm season for BTH, might be attributed to the compensating effect of different variables. The limited influence of BVOCs on the O3 formation sensitivity to precursors is consistent with Gao et al. (2022), which reported comparable empirical kinetic modeling approach (EKMA) curves with and without BVOC emissions. The transboundary O3 pollution results from the transport of both O3 and its precursors (mainly associated with PAN), while NO2 is less influenced by long-range transport due to its shorter lifetime (Ni et al., 2018; Yin et al., 2022).
The change in O3 formation regime might partly explain the finding that the joint effect of multiple factors on restraining O3 pollution will be larger than the aggregated effects of individual factors. Under a NOx-limited regime, O3 is less sensitive to changing VOC emissions (e.g., BVOC emissions) than under a VOC-limited one. Therefore, the enhancement of O3 due to BVOC emission growth in the future will be restrained with a much lower NO2 concentration. This indicates a co-benefit of reducing the anthropogenic emissions to restrain the potential O3 pollution elevation due to growing BVOC emissions (as a part of the climate penalty) in the future.
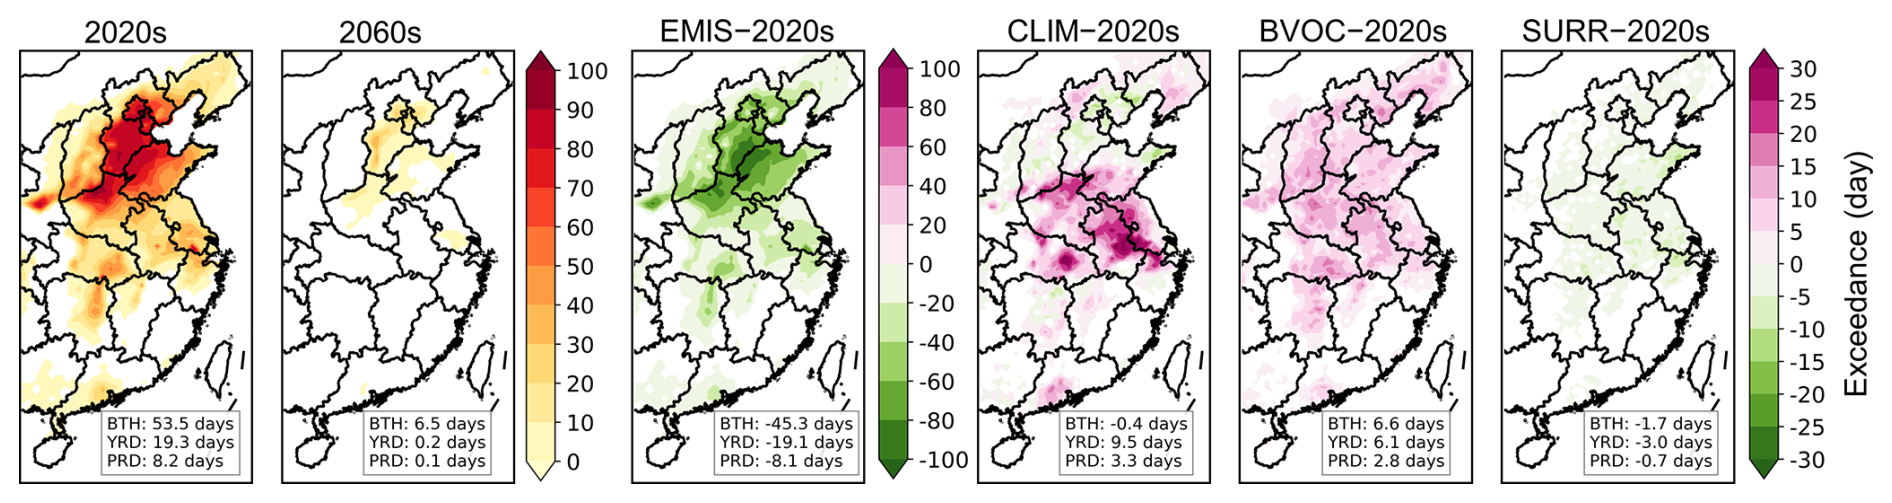
Figure 8Projected annual O3 exceedance over the east of China in the 2020s and 2060s and the exceedance changes when the four factors at 2060s level. Regional mean changes across CHN, BTH, the YRD, and the PRD are shown in the inset on the left.
3.5 Change of O3 exceedance events over the east of China
Figure 8 shows the “O3 exceedance events” over the east of China (mainly including Northern, Eastern, Central, and Southern China) in the 2020s and 2060s, and the changes influenced by different factors. The exceedance is defined as number of days with the MDA8 O3 exceeding the Chinese National Air Quality Standard Grade II (160 µg m−3 or 81.6 ppb). The exceedance events mainly appear in the warm season (Fig. S7). Areas with frequent exceedance (over 50 d) in the 2020s were mainly located in Northern China. Much fewer exceedances are found for YRD and PRD (19.3 and 8.2 d in the 2020s, respectively). In the 2060s, the O3 exceedance events will drop significantly. The exceedance days will be fewer than 10 d for most of the country, except for some areas in BTH which will still have more than 20 exceedance days over the year.
Domestic emission abatement will be the most important factor reducing the O3 exceedance, particularly in Northern China. The exceedance days will be cut by 45.3, 19.1, and 8.1 d for BTH, the YRD, and the PRD, respectively, with the maximum reduction reaching 80 d within BTH and the YRD. Notably, the spatial pattern of changing O3 exceedance due to emission reduction is different from that of changing MDA8 O3 due to emission reduction as shown in Fig. 5a. Even the warm-season MDA8 O3 concentration of BTH will decline only 9.7 ppb, the O3 exceedance events will be greatly reduced, indicating that national emission controls will be especially effective in reducing serious O3 pollution. Climate change will mainly affect Jiangsu, Anhui, Henan, and Hebei provinces, elevating the exceedance by more than 15 d in most of these areas. For the YRD and PRD, climate change will elevate the exceedance by 9.5 and 3.3 d, respectively. Some areas of BTH will benefit from climate change, with the exceedance declining 0–10 d. The influences of BVOCs and foreign emission change on exceedance days are of limited regional differences, with a growth of 5 to 15 d for the former and a decline of −5 to 0 d for the latter. The exceedances elevated by BVOC emission growth will be 6.6, 6.1, and 2.8 d for BTH, the YRD, and the PRD with the maximum reaching 19, 18, and 12 d within the region, respectively, reflecting a role of biogenic source change in future O3 episodes that cannot be neglected.
We explore the response of China's surface O3 concentration to the future changes of multiple factors under SSP2-4.5, based on a series of sensitivity experiments with WRF–MEGAN–CMAQ simulations. From the 2020s to 2060s, the MDA8 O3 concentration is predicted to decline by 7.7 and 1.1 ppb in the warm and non-warm season, respectively, and the O3 exceedances of the Chinese National Air Quality Standard (Grade II) will be largely eliminated. In the warm season, MDA8 O3 in BTH, the YRD, and the PRD will decline by 9.7, 14.8 and 12.5 ppb, respectively, larger than the national average level. However, MDA8 O3 will increase in BTH and the YRD in the non-warm season, attributed to the reduced NOx emissions and thereby a weakened titration effect. The O3 pollution will expand towards the non-warm season in the future, bringing a new challenge for policy makers to optimize the strategy of precursor emission controls based on local conditions.
Reduction of local anthropogenic emissions is estimated to dominate the spatial distribution and magnitude of future O3 change. Meteorological variation will lead to a change of MDA8 O3 ranging between −1 and 4 ppb for most areas in the warm season. The influences of changing BVOCs and foreign anthropogenic emissions will be within ±3 ppb, with the former elevating O3 and the latter reducing O3. Especially in areas with high O3 pollution and intense NOx emissions, the growing BVOC emissions will enhance the risk of O3 pollution even more. The joint effect of multiple factors on restraining O3 pollution will be larger than the aggregated effects of individual factors, which can be partly explained by the changing O3 formation regime. A large amount of emission reduction under SSP2-4.5 will reshape the O3 formation sensitivity to precursors. In BTH and the YRD, O3 formation in the warm season is projected to shift from a weak VOC-limited to transitional or NOx-limited regime, while a VOC-limited regime will still dominate in the non-warm season. In the future, O3 will be less sensitive to BVOC change in a low-NOx environment, along with persistent emission controls, highlighting the benefit of anthropogenic emissions abatement for mitigating the climate penalty and limiting O3 pollution.
Limitations exist in current study. Firstly, the future climate data are taken from one single model CESM, subject to bias in the assessment of meteorological influence on O3. Secondly, some factors that will influence future O3 level are not included in our analyses, such as the changing CH4 concentration, increasing soil NOx emissions, and the stratosphere–troposphere exchange of O3. For example, the hot spot of soil NOx emissions in Northern China is also the region with large reduction of anthropogenic NOx emission but relatively small decline in O3 concentrations. Under a warmer climate, a growing trend of soil NOx emissions is expected for the future and may thus present an additional challenge for O3 pollution alleviation. Thirdly, there are gaps between the downscaled and realistic conditions of meteorology for the 2020s, leading to uncertainty in the O3 simulation. Finally, the changing O3 formation regime is presented through the relation between O3 and NO2 concentrations, and the mechanism how the climate penalty will influence O3 formation under substantial reduction of anthropogenic emissions needs to be better analyzed in future studies.
All data in this study are available from the authors upon request.
The supplement related to this article is available online at https://doi.org/10.5194/acp-25-2649-2025-supplement.
JY developed the methodology, conducted the work and wrote the draft. YZ improved the methodology, supervised the work, and revised the manuscript. YW and LZ contributed to the methodology and provided support for the scientific interpretation and discussions.
The contact author has declared that none of the authors has any competing interests.
Publisher's note: Copernicus Publications remains neutral with regard to jurisdictional claims made in the text, published maps, institutional affiliations, or any other geographical representation in this paper. While Copernicus Publications makes every effort to include appropriate place names, the final responsibility lies with the authors. Regarding the maps used in this paper, please note that Figs. 1–3, 5, and 8 contain disputed territories.
This work was sponsored by the National Key Research and Development Program of China (grant no. 2023YFC3709802), the National Natural Science Foundation of China (grant no. 42177080), and the Jiangsu Provincial Key Research and Development Program (grant no. BE2022838). We thank Qiang Zhang and Dan Tong from Tsinghua University for the emission data (MEIC and DPEC).
This research has been supported by the National Key Research and Development Program of China (grant no. 2023YFC3709802), the National Natural Science Foundation of China (grant no. 42177080), and the Jiangsu Provincial Key Research and Development Program (grant no. BE2022838).
This paper was edited by Guangjie Zheng and reviewed by three anonymous referees.
Akimoto, H. and Tanimoto, H.: Rethinking of the adverse effects of NOx-control on the reduction of methane and tropospheric ozone – Challenges toward a denitrified society, Atmos. Environ., 277, 119033, https://doi.org/10.1016/j.atmosenv.2022.119033, 2022.
Andersson, C. and Engardt, M.: European ozone in a future climate: Importance of changes in dry deposition and isoprene emissions, J. Geophys. Res.-Atmos., 115, D02303, https://doi.org/10.1029/2008jd011690, 2010.
Appel, K. W., Pouliot, G. A., Simon, H., Sarwar, G., Pye, H. O. T., Napelenok, S. L., Akhtar, F., and Roselle, S. J.: Evaluation of dust and trace metal estimates from the Community Multiscale Air Quality (CMAQ) model version 5.0, Geosci. Model Dev., 6, 883–899, https://doi.org/10.5194/gmd-6-883-2013, 2013.
Avnery, S., Mauzerall, D. L., Liu, J., and Horowitz, L. W.: Global crop yield reductions due to surface ozone exposure: 1. Year 2000 crop production losses and economic damage, Atmos. Environ., 45, 2284–2296, https://doi.org/10.1016/j.atmosenv.2010.11.045, 2011.
Cao, J., Situ, S., Hao, Y., Xie, S., and Li, L.: Enhanced summertime ozone and SOA from biogenic volatile organic compound (BVOC) emissions due to vegetation biomass variability during 1981–2018 in China, Atmos. Chem. Phys., 22, 2351–2364, https://doi.org/10.5194/acp-22-2351-2022, 2022.
Chen, J., Avise, J., Guenther, A., Wiedinmyer, C., Salathe, E., Jackson, R. B., and Lamb, B.: Future land use and land cover influences on regional biogenic emissions and air quality in the United States, Atmos. Environ., 43, 5771–5780, https://doi.org/10.1016/j.atmosenv.2009.08.015, 2009.
Chen, X., Jiang, Z., Shen, Y., Li, R., Fu, Y., Liu, J., Han, H., Liao, H., Cheng, X., Jones, D. B. A., Worden, H., and Abad, G. G.: Chinese Regulations Are Working – Why Is Surface Ozone Over Industrialized Areas Still High? Applying Lessons From Northeast US Air Quality Evolution, Geophys. Res. Lett., 48, e2021GL092816, https://doi.org/10.1029/2021gl092816, 2021.
Chen, X., Wang, M., He, T. L., Jiang, Z., Zhang, Y., Zhou, L., Liu, J., Liao, H., Worden, H., Jones, D., Chen, D., Tan, Q., and Shen, Y.: Data- and Model-Based Urban O3 Responses to NOx Changes in China and the United States, J. Geophys. Res.-Atmos., 128, e2022JD038228, https://doi.org/10.1029/2022jd038228, 2023.
Cheng, J., Tong, D., Liu, Y., Yu, S., Yan, L., Zheng, B., Geng, G., He, K., and Zhang, Q.: Comparison of Current and Future PM2.5 Air Quality in China Under CMIP6 and DPEC Emission Scenarios, Geophys. Res. Lett., 48, e2021GL093197, https://doi.org/10.1029/2021gl093197, 2021a.
Cheng, J., Tong, D., Zhang, Q., Liu, Y., Lei, Y., Yan, G., Yan, L., Yu, S., Cui, R. Y., Clarke, L., Geng, G., Zheng, B., Zhang, X., Davis, S. J., and He, K.: Pathways of China's PM2.5 air quality 2015–2060 in the context of carbon neutrality, Natl. Sci. Rev., 8, nwab078, https://doi.org/10.1093/nsr/nwab078, 2021b.
Coumou, D., Di Capua, G., Vavrus, S., Wang, L., and Wang, S.: The influence of Arctic amplification on mid-latitude summer circulation, Nat. Commun., 9, 2959, https://doi.org/10.1038/s41467-018-05256-8, 2018.
Deng, H., Hua, W., and Fan, G.: Evaluation and Projection of Near-Surface Wind Speed over China Based on CMIP6 Models, Atmosphere, 12, 1062, https://doi.org/10.3390/atmos12081062, 2021.
Dewan, S. and Lakhani, A.: Tropospheric ozone and its natural precursors impacted by climatic changes in emission and dynamics, Front. Environ. Sci., 10, 1007942, https://doi.org/10.3389/fenvs.2022.1007942, 2022.
Feng, Y., Ning, M., Xue, W., Cheng, M., and Lei, Y.: Developing China's roadmap for air quality improvement: A review on technology development and future prospects, J. Environ. Sci., 123, 510–521, https://doi.org/10.1016/j.jes.2022.10.028, 2023.
Feng, Z. Z., Xu, Y. S., Kobayashi, K., Dai, L. L., Zhang, T. Y., Agathokleous, E., Calatayud, V., Paoletti, E., Mukherjee, A., Agrawal, M., Park, R. J., Oak, Y. J., and Yue, X.: Ozone pollution threatens the production of major staple crops in East Asia, Nat. Food, 3, 47–56, https://doi.org/10.1038/s43016-021-00422-6, 2022.
Finlayson-Pitts, B. J. and Pitts, J. N.: Tropospheric air pollution: Ozone, airborne toxics, polycyclic aromatic hydrocarbons, and particles, Science, 276, 1045–1052, https://doi.org/10.1126/science.276.5315.1045, 1997.
Fischer, E. V., Jacob, D. J., Yantosca, R. M., Sulprizio, M. P., Millet, D. B., Mao, J., Paulot, F., Singh, H. B., Roiger, A., Ries, L., Talbot, R. W., Dzepina, K., and Pandey Deolal, S.: Atmospheric peroxyacetyl nitrate (PAN): a global budget and source attribution, Atmos. Chem. Phys., 14, 2679–2698, https://doi.org/10.5194/acp-14-2679-2014, 2014.
Gao, M., Gao, J., Zhu, B., Kumar, R., Lu, X., Song, S., Zhang, Y., Jia, B., Wang, P., Beig, G., Hu, J., Ying, Q., Zhang, H., Sherman, P., and McElroy, M. B.: Ozone pollution over China and India: seasonality and sources, Atmos. Chem. Phys., 20, 4399–4414, https://doi.org/10.5194/acp-20-4399-2020, 2020.
Gao, M., Wang, F., Ding, Y., Wu, Z., Xu, Y., Lu, X., Wang, Z., Carmichael, G. R., and McElroy, M. B.: Large-scale climate patterns offer preseasonal hints on the co-occurrence of heat wave and O3 pollution in China, P. Natl. Acad. Sci. USA, 120, e2218274120, https://doi.org/10.1073/pnas.2218274120, 2023.
Gao, Y., Fu, J. S., Drake, J. B., Lamarque, J.-F., and Liu, Y.: The impact of emission and climate change on ozone in the United States under representative concentration pathways (RCPs), Atmos. Chem. Phys., 13, 9607–9621, https://doi.org/10.5194/acp-13-9607-2013, 2013.
Gao, Y., Yan, F., Ma, M., Ding, A., Liao, H., Wang, S., Wang, X., Zhao, B., Cai, W., Su, H., Yao, X., and Gao, H.: Unveiling the dipole synergic effect of biogenic and anthropogenic emissions on ozone concentrations, Sci. Total Environ., 818, 151722, https://doi.org/10.1016/j.scitotenv.2021.151722, 2022.
Gidden, M. J., Riahi, K., Smith, S. J., Fujimori, S., Luderer, G., Kriegler, E., van Vuuren, D. P., van den Berg, M., Feng, L., Klein, D., Calvin, K., Doelman, J. C., Frank, S., Fricko, O., Harmsen, M., Hasegawa, T., Havlik, P., Hilaire, J., Hoesly, R., Horing, J., Popp, A., Stehfest, E., and Takahashi, K.: Global emissions pathways under different socioeconomic scenarios for use in CMIP6: a dataset of harmonized emissions trajectories through the end of the century, Geosci. Model Dev., 12, 1443–1475, https://doi.org/10.5194/gmd-12-1443-2019, 2019.
Gong, C. and Liao, H.: A typical weather pattern for ozone pollution events in North China, Atmos. Chem. Phys., 19, 13725–13740, https://doi.org/10.5194/acp-19-13725-2019, 2019.
Gonzalez-Abraham, R., Chung, S. H., Avise, J., Lamb, B., Salathé Jr., E. P., Nolte, C. G., Loughlin, D., Guenther, A., Wiedinmyer, C., Duhl, T., Zhang, Y., and Streets, D. G.: The effects of global change upon United States air quality, Atmos. Chem. Phys., 15, 12645–12665, https://doi.org/10.5194/acp-15-12645-2015, 2015.
Guenther, A. B., Jiang, X., Heald, C. L., Sakulyanontvittaya, T., Duhl, T., Emmons, L. K., and Wang, X.: The Model of Emissions of Gases and Aerosols from Nature version 2.1 (MEGAN2.1): an extended and updated framework for modeling biogenic emissions, Geosci. Model Dev., 5, 1471–1492, https://doi.org/10.5194/gmd-5-1471-2012, 2012.
Han, H., Liu, J., Yuan, H., Wang, T., Zhuang, B., and Zhang, X.: Foreign influences on tropospheric ozone over East Asia through global atmospheric transport, Atmos. Chem. Phys., 19, 12495–12514, https://doi.org/10.5194/acp-19-12495-2019, 2019.
Han, H., Liu, J., Shu, L., Wang, T., and Yuan, H.: Local and synoptic meteorological influences on daily variability in summertime surface ozone in eastern China, Atmos. Chem. Phys., 20, 203–222, https://doi.org/10.5194/acp-20-203-2020, 2020.
Harper, K. L. and Unger, N.: Global climate forcing driven by altered BVOC fluxes from 1990 to 2010 land cover change in maritime Southeast Asia, Atmos. Chem. Phys., 18, 16931–16952, https://doi.org/10.5194/acp-18-16931-2018, 2018.
Hollaway, M. J., Arnold, S. R., Collins, W. J., Folberth, G., and Rap, A.: Sensitivity of midnineteenth century tropospheric ozone to atmospheric chemistry–vegetation interactions, J. Geophys. Res.-Atmos., 122, 2452–2473, https://doi.org/10.1002/2016jd025462, 2017.
Hong, C., Zhang, Q., Zhang, Y., Davis, S. J., Tong, D., Zheng, Y., Liu, Z., Guan, D., He, K., and Schellnhuber, H. J.: Impacts of climate change on future air quality and human health in China, P. Natl. Acad. Sci. USA, 116, 17193–17200, https://doi.org/10.1073/pnas.1812881116, 2019.
Hou, X., Wild, O., Zhu, B., and Lee, J.: Future tropospheric ozone budget and distribution over east Asia under a net-zero scenario, Atmos. Chem. Phys., 23, 15395–15411, https://doi.org/10.5194/acp-23-15395-2023, 2023.
Hu, A., Xie, X., Gong, K., Hou, Y., Zhao, Z., and Hu, J.: Assessing the Impacts of Climate Change on Meteorology and Air Stagnation in China Using a Dynamical Downscaling Method, Front. Environ. Sci., 10, 894887, https://doi.org/10.3389/fenvs.2022.894887, 2022.
Hu, J., Chen, J., Ying, Q., and Zhang, H.: One-year simulation of ozone and particulate matter in China using WRF/CMAQ modeling system, Atmos. Chem. Phys., 16, 10333–10350, https://doi.org/10.5194/acp-16-10333-2016, 2016.
Hurtt, G. C., Chini, L., Sahajpal, R., Frolking, S., Bodirsky, B. L., Calvin, K., Doelman, J. C., Fisk, J., Fujimori, S., Klein Goldewijk, K., Hasegawa, T., Havlik, P., Heinimann, A., Humpenöder, F., Jungclaus, J., Kaplan, J. O., Kennedy, J., Krisztin, T., Lawrence, D., Lawrence, P., Ma, L., Mertz, O., Pongratz, J., Popp, A., Poulter, B., Riahi, K., Shevliakova, E., Stehfest, E., Thornton, P., Tubiello, F. N., van Vuuren, D. P., and Zhang, X.: Harmonization of global land use change and management for the period 850–2100 (LUH2) for CMIP6, Geosci. Model Dev., 13, 5425–5464, https://doi.org/10.5194/gmd-13-5425-2020, 2020.
IPCC: Climate Change 2021 – The Physical Science Basis: Working Group I Contribution to the Sixth Assessment Report of the Intergovernmental Panel on Climate Change, Cambridge University Press, Cambridge, https://doi.org/10.1017/9781009157896, 2021.
IPCC: Climate Change 2022: Mitigation of Climate Change: Working Group III Contribution to the Sixth Assessment Report of the Intergovernmental Panel on Climate Change, Cambridge University Press, Cambridge, https://doi.org/10.1017/9781009157926, 2022.
Jerrett, M., Burnett, R. T., Pope 3rd, C. A., Ito, K., Thurston, G., Krewski, D., Shi, Y., Calle, E., and Thun, M.: Long-term ozone exposure and mortality, N. Engl. J. Med., 360, 1085–1095, https://doi.org/10.1056/NEJMoa0803894, 2009.
Jiang, Y., Ding, D., Dong, Z., Liu, S., Chang, X., Zheng, H., Xing, J., and Wang, S.: Extreme Emission Reduction Requirements for China to Achieve World Health Organization Global Air Quality Guidelines, Environ. Sci. Technol., 57, 4424–4433, https://doi.org/10.1021/acs.est.2c09164, 2023.
Jin, X. and Holloway, T.: Spatial and temporal variability of ozone sensitivity over China observed from the Ozone Monitoring Instrument, J. Geophys. Res.-Atmos., 120, 7229–7246, https://doi.org/10.1002/2015jd023250, 2015.
Kong, L., Song, M., Li, X., Liu, Y., Lu, S., Zeng, L., and Zhang, Y.: Analysis of China's PM(2.5) and ozone coordinated control strategy based on the observation data from 2015 to 2020, J. Environ. Sci. (China), 138, 385–394, https://doi.org/10.1016/j.jes.2023.03.030, 2024.
Lelieveld, J., Evans, J. S., Fnais, M., Giannadaki, D., and Pozzer, A.: The contribution of outdoor air pollution sources to premature mortality on a global scale, Nature, 525, 367–371, https://doi.org/10.1038/nature15371, 2015.
Li, H., Yang, Y., Jin, J., Wang, H., Li, K., Wang, P., and Liao, H.: Climate-driven deterioration of future ozone pollution in Asia predicted by machine learning with multi-source data, Atmos. Chem. Phys., 23, 1131–1145, https://doi.org/10.5194/acp-23-1131-2023, 2023.
Li, K., Jacob, D. J., Shen, L., Lu, X., De Smedt, I., and Liao, H.: Increases in surface ozone pollution in China from 2013 to 2019: anthropogenic and meteorological influences, Atmos. Chem. Phys., 20, 11423–11433, https://doi.org/10.5194/acp-20-11423-2020, 2020a.
Li, K., Jacob, D. J., Liao, H., Qiu, Y., Shen, L., Zhai, S., Bates, K. H., Sulprizio, M. P., Song, S., Lu, X., Zhang, Q., Zheng, B., Zhang, Y., Zhang, J., Lee, H. C., and Kuk, S. K.: Ozone pollution in the North China Plain spreading into the late-winter haze season, P. Natl. Acad. Sci. USA, 118, e2015797118, https://doi.org/10.1073/pnas.2015797118, 2021.
Li, L., Yang, W., Xie, S., and Wu, Y.: Estimations and uncertainty of biogenic volatile organic compound emission inventory in China for 2008–2018, Sci. Total Environ., 733, 139301, https://doi.org/10.1016/j.scitotenv.2020.139301, 2020b.
Li, M., Zhang, Q., Kurokawa, J.-I., Woo, J.-H., He, K., Lu, Z., Ohara, T., Song, Y., Streets, D. G., Carmichael, G. R., Cheng, Y., Hong, C., Huo, H., Jiang, X., Kang, S., Liu, F., Su, H., and Zheng, B.: MIX: a mosaic Asian anthropogenic emission inventory under the international collaboration framework of the MICS-Asia and HTAP, Atmos. Chem. Phys., 17, 935–963, https://doi.org/10.5194/acp-17-935-2017, 2017.
Liang, S., Cheng, J., Jia, K., Jiang, B., Liu, Q., Xiao, Z., Yao, Y., Yuan, W., Zhang, X., Zhao, X., and Zhou, J.: The Global Land Surface Satellite (GLASS) Product Suite, B. Am. Meteorol. Soc., 102, E323–E337, https://doi.org/10.1175/bams-d-18-0341.1, 2021.
Liao, W., Liu, X., Xu, X., Chen, G., Liang, X., Zhang, H., and Li, X.: Projections of land use changes under the plant functional type classification in different SSP-RCP scenarios in China, Sci. Bull., 65, 1935–1947, https://doi.org/10.1016/j.scib.2020.07.014, 2020.
Liu, Q., Lam, K. S., Jiang, F., Wang, T. J., Xie, M., Zhuang, B. L., and Jiang, X. Y.: A numerical study of the impact of climate and emission changes on surface ozone over South China in autumn time in 2000–2050, Atmos. Environ., 76, 227–237, https://doi.org/10.1016/j.atmosenv.2013.01.030, 2013.
Liu, S., Xing, J., Zhang, H., Ding, D., Zhang, F., Zhao, B., Sahu, S. K., and Wang, S.: Climate-driven trends of biogenic volatile organic compound emissions and their impacts on summertime ozone and secondary organic aerosol in China in the 2050s, Atmos. Environ., 218, 117020, https://doi.org/10.1016/j.atmosenv.2019.117020, 2019.
Liu, S., Sahu, S. K., Zhang, S., Liu, S., Sun, Y., Liu, X., Xing, J., Zhao, B., Zhang, H., and Wang, S.: Impact of Climate-Driven Land-Use Change on O3 and PM Pollution by Driving BVOC Emissions in China in 2050, Atmosphere, 13, 1086, https://doi.org/10.3390/atmos13071086, 2022.
Liu, Y. and Wang, T.: Worsening urban ozone pollution in China from 2013 to 2017 – Part 1: The complex and varying roles of meteorology, Atmos. Chem. Phys., 20, 6305–6321, https://doi.org/10.5194/acp-20-6305-2020, 2020.
Liu, Y., Geng, G., Cheng, J., Liu, Y., Xiao, Q., Liu, L., Shi, Q., Tong, D., He, K., and Zhang, Q.: Drivers of Increasing Ozone during the Two Phases of Clean Air Actions in China 2013–2020, Environ. Sci. Technol., 57, 8954–8964, https://doi.org/10.1021/acs.est.3c00054, 2023a.
Liu, Z., Wild, O., Doherty, R. M., O'Connor, F. M., and Turnock, S. T.: Benefits of net-zero policies for future ozone pollution in China, Atmos. Chem. Phys., 23, 13755–13768, https://doi.org/10.5194/acp-23-13755-2023, 2023b.
Lu, X., Zhang, L., and Shen, L.: Meteorology and Climate Influences on Tropospheric Ozone: a Review of Natural Sources, Chemistry, and Transport Patterns, Curr. Pollut. Rep., 5, 238–260, https://doi.org/10.1007/s40726-019-00118-3, 2019.
Meinshausen, M., Nicholls, Z. R. J., Lewis, J., Gidden, M. J., Vogel, E., Freund, M., Beyerle, U., Gessner, C., Nauels, A., Bauer, N., Canadell, J. G., Daniel, J. S., John, A., Krummel, P. B., Luderer, G., Meinshausen, N., Montzka, S. A., Rayner, P. J., Reimann, S., Smith, S. J., van den Berg, M., Velders, G. J. M., Vollmer, M. K., and Wang, R. H. J.: The shared socio-economic pathway (SSP) greenhouse gas concentrations and their extensions to 2500, Geosci. Model Dev., 13, 3571–3605, https://doi.org/10.5194/gmd-13-3571-2020, 2020.
Monaghan, A. J., Steinhoff, D. F., Bruyere, C. L., and Yates, D.: NCAR CESM Global Bias-Corrected CMIP5 Output to Support WRF/MPAS Research, Research Data Archive at the National Center for Atmospheric Research, Computational and Information Systems Laboratory [data set], https://doi.org/10.5065/D6DJ5CN4, 2014.
Monks, P. S., Archibald, A. T., Colette, A., Cooper, O., Coyle, M., Derwent, R., Fowler, D., Granier, C., Law, K. S., Mills, G. E., Stevenson, D. S., Tarasova, O., Thouret, V., von Schneidemesser, E., Sommariva, R., Wild, O., and Williams, M. L.: Tropospheric ozone and its precursors from the urban to the global scale from air quality to short-lived climate forcer, Atmos. Chem. Phys., 15, 8889–8973, https://doi.org/10.5194/acp-15-8889-2015, 2015.
Ni, R., Lin, J., Yan, Y., and Lin, W.: Foreign and domestic contributions to springtime ozone over China, Atmos. Chem. Phys., 18, 11447–11469, https://doi.org/10.5194/acp-18-11447-2018, 2018.
Niu, Y., Zhou, Y., Chen, R., Yin, P., Meng, X., Wang, W., Liu, C., Ji, J. S., Qiu, Y., Kan, H., and Zhou, M.: Long-term exposure to ozone and cardiovascular mortality in China: a nationwide cohort study, Lancet Planet. Health, 6, e496–e503, https://doi.org/10.1016/s2542-5196(22)00093-6, 2022.
O'Neill, B. C., Tebaldi, C., van Vuuren, D. P., Eyring, V., Friedlingstein, P., Hurtt, G., Knutti, R., Kriegler, E., Lamarque, J.-F., Lowe, J., Meehl, G. A., Moss, R., Riahi, K., and Sanderson, B. M.: The Scenario Model Intercomparison Project (ScenarioMIP) for CMIP6, Geosci. Model Dev., 9, 3461–3482, https://doi.org/10.5194/gmd-9-3461-2016, 2016.
Penuelas, J. and Llusia, J.: BVOCs: plant defense against climate warming?, Trends Plant Sci., 8, 105–109, https://doi.org/10.1016/s1360-1385(03)00008-6, 2003.
Penuelas, J. and Staudt, M.: BVOCs and global change, Trends Plant Sci., 15, 133–144, https://doi.org/10.1016/j.tplants.2009.12.005, 2010.
Pope, R. J., Savage, N. H., Chipperfield, M. P., Ordóñez, C., and Neal, L. S.: The influence of synoptic weather regimes on UK air quality: regional model studies of tropospheric column NO2, Atmos. Chem. Phys., 15, 11201–11215, https://doi.org/10.5194/acp-15-11201-2015, 2015.
Porter, W. C. and Heald, C. L.: The mechanisms and meteorological drivers of the summertime ozone–temperature relationship, Atmos. Chem. Phys., 19, 13367–13381, https://doi.org/10.5194/acp-19-13367-2019, 2019.
Riahi, K., van Vuuren, D. P., Kriegler, E., Edmonds, J., O'Neill, B. C., Fujimori, S., Bauer, N., Calvin, K., Dellink, R., Fricko, O., Lutz, W., Popp, A., Cuaresma, J. C., Kc, S., Leimbach, M., Jiang, L., Kram, T., Rao, S., Emmerling, J., Ebi, K., Hasegawa, T., Havlik, P., Humpenöder, F., Da Silva, L. A., Smith, S., Stehfest, E., Bosetti, V., Eom, J., Gernaat, D., Masui, T., Rogelj, J., Strefler, J., Drouet, L., Krey, V., Luderer, G., Harmsen, M., Takahashi, K., Baumstark, L., Doelman, J. C., Kainuma, M., Klimont, Z., Marangoni, G., Lotze-Campen, H., Obersteiner, M., Tabeau, A., and Tavoni, M.: The Shared Socioeconomic Pathways and their energy, land use, and greenhouse gas emissions implications: An overview, Glob. Environ. Change, 42, 153–168, https://doi.org/10.1016/j.gloenvcha.2016.05.009, 2017.
Schroeder, J. R., Crawford, J. H., Fried, A., Walega, J., Weinheimer, A., Wisthaler, A., Müller, M., Mikoviny, T., Chen, G., Shook, M., Blake, D. R., and Tonnesen, G. S.: New insights into the column CH2O/NO2 ratio as an indicator of near-surface ozone sensitivity, J. Geophys. Res.-Atmos., 122, 8885–8907, https://doi.org/10.1002/2017jd026781, 2017.
Shi, X., Zheng, Y., Lei, Y., Xue, W., Yan, G., Liu, X., Cai, B., Tong, D., and Wang, J.: Air quality benefits of achieving carbon neutrality in China, Sci. Total Environ., 795, 148784, https://doi.org/10.1016/j.scitotenv.2021.148784, 2021.
Sillman, S. and He, D.: Some theoretical results concerning O3–NOx-VOC chemistry and NOx-VOC indicators, J. Geophys. Res.-Atmos., 107, 4659, https://doi.org/10.1029/2001jd001123, 2002.
Szogs, S., Arneth, A., Anthoni, P., Doelman, J. C., Humpenöder, F., Popp, A., Pugh, T. A. M., and Stehfest, E.: Impact of LULCC on the emission of BVOCs during the 21st century, Atmos. Environ., 165, 73–87, https://doi.org/10.1016/j.atmosenv.2017.06.025, 2017.
Tai, A. P. K. and Val Martin, M.: Impacts of ozone air pollution and temperature extremes on crop yields: Spatial variability, adaptation and implications for future food security, Atmos. Environ., 169, 11–21, https://doi.org/10.1016/j.atmosenv.2017.09.002, 2017.
Tong, D., Cheng, J., Liu, Y., Yu, S., Yan, L., Hong, C., Qin, Y., Zhao, H., Zheng, Y., Geng, G., Li, M., Liu, F., Zhang, Y., Zheng, B., Clarke, L., and Zhang, Q.: Dynamic projection of anthropogenic emissions in China: methodology and 2015–2050 emission pathways under a range of socio-economic, climate policy, and pollution control scenarios, Atmos. Chem. Phys., 20, 5729–5757, https://doi.org/10.5194/acp-20-5729-2020, 2020.
van Vuuren, D. P., Edmonds, J., Kainuma, M., Riahi, K., Thomson, A., Hibbard, K., Hurtt, G. C., Kram, T., Krey, V., Lamarque, J. F., Masui, T., Meinshausen, M., Nakicenovic, N., Smith, S. J., and Rose, S. K.: The representative concentration pathways: an overview, Clim. Change, 109, 5–31, https://doi.org/10.1007/s10584-011-0148-z, 2011.
von Schneidemesser, E., Monks, P. S., Allan, J. D., Bruhwiler, L., Forster, P., Fowler, D., Lauer, A., Morgan, W. T., Paasonen, P., Righi, M., Sindelarova, K., and Sutton, M. A.: Chemistry and the Linkages between Air Quality and Climate Change, Chem. Rev., 115, 3856–3897, https://doi.org/10.1021/acs.chemrev.5b00089, 2015.
Wang, H., Wu, Q., Guenther, A. B., Yang, X., Wang, L., Xiao, T., Li, J., Feng, J., Xu, Q., and Cheng, H.: A long-term estimation of biogenic volatile organic compound (BVOC) emission in China from 2001–2016: the roles of land cover change and climate variability, Atmos. Chem. Phys., 21, 4825–4848, https://doi.org/10.5194/acp-21-4825-2021, 2021a.
Wang, L., Tai, A. P. K., Tam, C.-Y., Sadiq, M., Wang, P., and Cheung, K. K. W.: Impacts of future land use and land cover change on mid-21st-century surface ozone air quality: distinguishing between the biogeophysical and biogeochemical effects, Atmos. Chem. Phys., 20, 11349–11369, https://doi.org/10.5194/acp-20-11349-2020, 2020.
Wang, N., Xu, J., Pei, C., Tang, R., Zhou, D., Chen, Y., Li, M., Deng, X., Deng, T., Huang, X., and Ding, A.: Air Quality During COVID-19 Lockdown in the Yangtze River Delta and the Pearl River Delta: Two Different Responsive Mechanisms to Emission Reductions in China, Environ. Sci. Technol., 55, 5721–5730, https://doi.org/10.1021/acs.est.0c08383, 2021b.
Wang, P., Yang, Y., Li, H., Chen, L., Dang, R., Xue, D., Li, B., Tang, J., Leung, L. R., and Liao, H.: North China Plain as a hot spot of ozone pollution exacerbated by extreme high temperatures, Atmos. Chem. Phys., 22, 4705–4719, https://doi.org/10.5194/acp-22-4705-2022, 2022.
Wang, Y., Zhao, Y., Liu, Y., Jiang, Y., Zheng, B., Xing, J., Liu, Y., Wang, S., and Nielsen, C. P.: Sustained emission reductions have restrained the ozone pollution over China, Nat. Geosci., 16, 967–974, https://doi.org/10.1038/s41561-023-01284-2, 2023.
Weng, X., Forster, G. L., and Nowack, P.: A machine learning approach to quantify meteorological drivers of ozone pollution in China from 2015 to 2019, Atmos. Chem. Phys., 22, 8385–8402, https://doi.org/10.5194/acp-22-8385-2022, 2022.
WHO: Global air quality guidelines: particulate matter (PM2.5 and PM10), ozone, nitrogen dioxide, sulfur dioxide and carbon monoxide: executive summary, World Health Organization (WHO), ISBN 9789240034228, 2021.
Wu, J., Shi, Y., and Xu, Y.: Evaluation and Projection of Surface Wind Speed Over China Based on CMIP6 GCMs, J. Geophys. Res.-Atmos., 125, e2020JD033611, https://doi.org/10.1029/2020jd033611, 2020a.
Wu, K., Yang, X., Chen, D., Gu, S., Lu, Y., Jiang, Q., Wang, K., Ou, Y., Qian, Y., Shao, P., and Lu, S.: Estimation of biogenic VOC emissions and their corresponding impact on ozone and secondary organic aerosol formation in China, Atmos. Res., 231, 104656, https://doi.org/10.1016/j.atmosres.2019.104656, 2020b.
Xiao, Q., Geng, G., Xue, T., Liu, S., Cai, C., He, K., and Zhang, Q.: Tracking PM2.5 and O3 Pollution and the Related Health Burden in China 2013–2020, Environ. Sci. Technol., 56, 6922–6932, https://doi.org/10.1021/acs.est.1c04548, 2022.
Xu, B., Wang, T., Ma, D., Song, R., Zhang, M., Gao, L., Li, S., Zhuang, B., Li, M., and Xie, M.: Impacts of regional emission reduction and global climate change on air quality and temperature to attain carbon neutrality in China, Atmos. Res., 279, 106384, https://doi.org/10.1016/j.atmosres.2022.106384, 2022.
Yang, J. and Zhao, Y.: Performance and application of air quality models on ozone simulation in China – A review, Atmos. Environ., 293, 119446, https://doi.org/10.1016/j.atmosenv.2022.119446, 2023.
Yao, Y., Zou, X., Zhao, Y., and Wang, T.: Rapid Changes in Land-Sea Thermal Contrast Across China's Coastal Zone in a Warming Climate, J. Geophys. Res.-Atmos., 124, 2049–2067, https://doi.org/10.1029/2018jd029347, 2019.
Yarwood, G., Rao, S., Yocke, M., and Whitten, G.: Updates to the carbon bond chemical mechanism: CB05, Final report to the US EPA, https://www.camx.com/Files/CB05_Final_Report_120805.pdf (last access: 26 February 2025), 2005.
Yin, H., Sun, Y., Notholt, J., Palm, M., and Liu, C.: Spaceborne tropospheric nitrogen dioxide (NO2) observations from 2005–2020 over the Yangtze River Delta (YRD), China: variabilities, implications, and drivers, Atmos. Chem. Phys., 22, 4167–4185, https://doi.org/10.5194/acp-22-4167-2022, 2022.
Yin, P., Brauer, M., Cohen, A. J., Wang, H., Li, J., Burnett, R. T., Stanaway, J. D., Causey, K., Larson, S., Godwin, W., Frostad, J., Marks, A., Wang, L., Zhou, M., and Murray, C. J. L.: The effect of air pollution on deaths, disease burden, and life expectancy across China and its provinces, 1990–2017: an analysis for the Global Burden of Disease Study 2017, Lancet Planet. Health, 4, e386–e398, https://doi.org/10.1016/s2542-5196(20)30161-3, 2020.
Zheng, B., Tong, D., Li, M., Liu, F., Hong, C., Geng, G., Li, H., Li, X., Peng, L., Qi, J., Yan, L., Zhang, Y., Zhao, H., Zheng, Y., He, K., and Zhang, Q.: Trends in China's anthropogenic emissions since 2010 as the consequence of clean air actions, Atmos. Chem. Phys., 18, 14095–14111, https://doi.org/10.5194/acp-18-14095-2018, 2018.
Zhu, J. and Liao, H.: Future ozone air quality and radiative forcing over China owing to future changes in emissions under the Representative Concentration Pathways (RCPs), J. Geophys. Res.-Atmos., 121, 1978–2001, https://doi.org/10.1002/2015jd023926, 2016.
Zhu, J., Tai, A. P. K., and Hung Lam Yim, S.: Effects of ozone–vegetation interactions on meteorology and air quality in China using a two-way coupled land–atmosphere model, Atmos. Chem. Phys., 22, 765–782, https://doi.org/10.5194/acp-22-765-2022, 2022.