the Creative Commons Attribution 4.0 License.
the Creative Commons Attribution 4.0 License.
 | 21 Feb 2025
Burning conditions and transportation pathways determine biomass-burning aerosol properties in the Ascension Island marine boundary layer
Ernie R. Lewis
Arthur J. Sedlacek III
Tyler Tatro
Maria A. Zawadowicz
African biomass-burning aerosol (BBA) in the southeast Atlantic Ocean (SEA) marine boundary layer (MBL) is an important contributor to Earth's radiation budget, yet its representation remains poorly constrained in regional and global climate models. Data from the Layered Atlantic Smoke Interactions with Clouds (LASIC) field campaign on Ascension Island (7.95° S, 14.36° W) provide insight into how burning conditions, fuel type, transport pathways, and atmospheric processing affect the chemical, microphysical, and optical properties of BBA between June and September 2017. A total of 10 individual plume events characterize the seasonal evolution of the BBA properties. Early-season inefficient fires, determined by low refractory black carbon to above-background carbon monoxide mixing ratios (rBC : ΔCO), led to enhanced concentrations of organic- and sulfate-rich aerosols. Mid-season efficient fires, determined by higher rBC : ΔCO values, led to rBC-enriched BBA. A mix of efficient and inefficient fires later in the season resulted in conflicting BBA properties. Prolonged transport (∼ 10 d) through the MBL and lower free troposphere (FT) facilitated chemical and aqueous-phase processing, which led to a reduction in organic aerosol mass concentrations. This resulted in lower organic aerosol (OA) to rBC (OA : rBC) mass ratios (2–5) in the MBL compared to higher values (5–15) in the nearby FT. These atmospheric and cloud oxidation processes yield more light-absorbing BBA and explain the notably low single-scattering albedo at 530 nm (SSA530) values (< 0.80) observed in the MBL. This study establishes a robust correlation between SSA530 and OA : rBC across the MBL and FT, underscoring the dependency of optical properties on chemical composition.
- Article
(15718 KB) - Full-text XML
-
Supplement
(6087 KB) - BibTeX
- EndNote


Biomass burning injects 16–34 Tg of particulate matter into Earth's atmosphere each year, with Africa contributing over 50 % of that amount (Akagi et al., 2011; Bond et al., 2013). Biomass-burning aerosol (BBA) and the copious amounts of co-emitted gases such as carbon dioxide, carbon monoxide, and ozone have major effects on air quality, climate change, human health, and Earth's geochemical cycles (Bowman et al., 2009; Bond et al., 2013). Biomass burning is a major global source of black carbon (BC), the second-largest contributor to climate warming after carbon dioxide (CO2). However, BC is a minor component of the total BBA, which also includes organic aerosol (OA), sulfate (SO4), nitrate (NO3), and ammonium (NH4). The large impacts of BBA on direct aerosol radiative forcing and aerosol–cloud interactions, both of which contribute substantial uncertainty to Earth's radiative budget (IPCC, 2022), underlie the importance of detailed characterization of BBA chemical, microphysical, and optical properties.
A deck of persistent marine stratocumulus clouds offshore of southwestern Africa coexists with biomass burning in southern Africa from June to October of each year, creating a natural laboratory to investigate how long-range-transported BBA interacts with low clouds far to the west of the continent (Zuidema et al., 2016; Adebiyi and Zuidema, 2018). Recent field campaigns have determined that the BBA is commonly transported across the southeast Atlantic Ocean (SEA) in the free troposphere (FT) and the marine boundary layer (MBL) during these 5 months (Zuidema et al., 2018; Haywood et al., 2021; Redemann et al., 2021). The BBA in the FT is highly absorbing of shortwave radiation (Pistone et al., 2019; Denjean et al., 2020a; Taylor et al., 2020; Wu et al., 2020; Dobracki et al., 2023), with single-scattering albedo (the ratio of the aerosol scattering coefficient to the sum of the aerosol scattering and absorption coefficients) at wavelength 530 nm (single-scattering albedo at 530 nm; SSA530) values increasing from 0.80 to 0.95 between June and October in the continental boundary layer across southern Africa (Eck et al., 2013). Measurements in the FT over the SEA show August–September mean SSA530 values near 0.84 (Pistone et al., 2019; Wu et al., 2020; Dobracki et al., 2023) and measurements in the MBL at Ascension Island (7.95° S, 14.36° W), a remote location in the tropical Atlantic, yield even lower SSA530 values, with June–August monthly mean values near 0.80 (Zuidema et al., 2018; Che et al., 2022a). The lower SSA530 values at Ascension Island in the MBL compared to those in the FT above the island have not been previously explained (Barrett et al., 2022; Sedlacek et al., 2022).
Multiple field campaigns have collected spatially comprehensive data sets on aerosol properties across the SEA, yet substantial observation–model discrepancies for this region persist (Chýlek et al., 2019; Hodzic et al., 2020; Mallet et al., 2020; Shinozuka et al., 2020; Brown et al., 2021; Doherty et al., 2022; Howes et al., 2023). Measured SSA530 values in the FT and MBL across the SEA are much lower than those used in many global and regional climate models (Shinozuka et al., 2020; Mallet et al., 2020; Doherty et al., 2022). The aerosol over the SEA is highly oxidized (Hodzic et al., 2020; Dobracki et al., 2023), with measured molecular ratios of organic matter to organic carbon (OM : OC) near 2.25 in the FT in September, exceeding the value of 1.4 that is used in many climate models (Hodzic et al., 2020). Aerosol removal through chemical and photolytic processing is typically not represented in models (Hodzic et al., 2020), which contributes to the underestimation of OM : OC. Solar absorption in the FT over the SEA is also not well captured in climate models because of the unrealistic aerosol chemical composition (Mallet et al., 2021), inaccurate representation of mixing states (Brown et al., 2021), and overestimation of the rate at which absorbing aerosol descends in the atmosphere, which also leads to an underestimation of the aerosol loading in the FT (Das et al., 2017). These studies demonstrate that more realistic representations of aerosol properties and processes in the SEA are required to yield accurate results.
Much of the research over the SEA has focused on BBA properties in the FT, with fewer studies characterizing and constraining BBA properties in the MBL (Dang et al., 2022; Che et al., 2022a). Here, data from the Layered Atlantic Smoke Interactions with Clouds (LASIC) field campaign on Ascension Island are used to examine how source regions and conditions (i.e., burning conditions and fuel type), chemical processes, and transport pathways affect the chemical, microphysical, and optical properties of the BBA in the MBL between June and September 2017. Results from LASIC are compared to those of Wu et al. (2020) and Taylor et al. (2020), both of whom analyzed BBA properties during the Cloud–Aerosol–Radiation Interaction and Forcing Year 2017 (CLARIFY) aircraft campaign in August–September 2017 (Haywood et al., 2021). The CLARIFY analysis, while based on only 3 weeks of data, covered times when BBA was present in only the FT, only the MBL, and both the FT and the MBL. We also compare our results to those of Dobracki et al. (2023), who analyzed BBA properties in the FT near the African coast for September 2016 during the ObseRvations of Aerosols above CLouds and their IntEractionS (ORACLES 2016–2018) campaign (Redemann et al., 2021). Moreover, we investigate whether the strong relationship between SSA530 and the mass ratio of OA to BC (OA : BC) observed during ORACLES, documented in Dobracki et al. (2023), also applies to the BBA within the remote MBL.
We distinguish BBA characteristics that are primarily determined at the source, such as BC core diameter and above-background CO (ΔCO) mixing ratio, from those that can change during long-range transport, such as chemical composition and size distribution, by examining back-trajectories for selected time periods when BC mass concentrations in the MBL were sufficiently high. We then combine the back-trajectory estimates of BBA source locations with maps of fire density, surface relative humidity (RH), and land use to help infer the burning conditions and fuel types at the fire sources. We address the following questions.
-
How do the chemical, microphysical, and optical properties of African BBA in the MBL at Ascension Island change between June and September?
-
How do transport pathways from Africa to Ascension Island impact the chemical, microphysical, and optical properties of African BBA in the MBL there?
-
How do differences in burning conditions and fuel type affect the chemical, microphysical, and optical properties of African BBA in the MBL at Ascension Island?
-
How do the chemical, microphysical, and optical properties of African BBA in the MBL at Ascension Island differ from those in the FT?
-
Is there a clear relationship between SSA530 and OA : BC for the MBL at Ascension Island similar to that reported by Dobracki et al. (2023) for the FT closer to the coast?
In Sect. 2, we introduce the LASIC field campaign, the sampling and instrumentation methods, the data products, and the data analysis techniques used in this study. In Sect. 3.1, we identify 10 events with high BC mass concentrations aggregated into three temporal regimes distinguished by burning conditions, fuel type, and the conserved tracers BC and ΔCO. In Sect. 3.2, we present the chemical, microphysical, and optical properties of the BBA in the Ascension Island MBL for the 10 events. Next, in Sect. 3.3, we discuss the aerosol transport pathways of the BBA to Ascension Island. In Sect. 4, we discuss the evolution of BC properties (Sect. 4.1–4.2), oxidation processes, and transport pathways (Sect. 4.3–4.4) and the dependence of SSA530 on BBA chemical properties (Sect. 4.5). Section 5 highlights a change in aerosol transport in early September (Sect. 5.1) and discusses remaining questions on enhanced aerosol absorption (Sect. 5.2). Last, in Sect. 6, we conclude with a summary of our major findings.
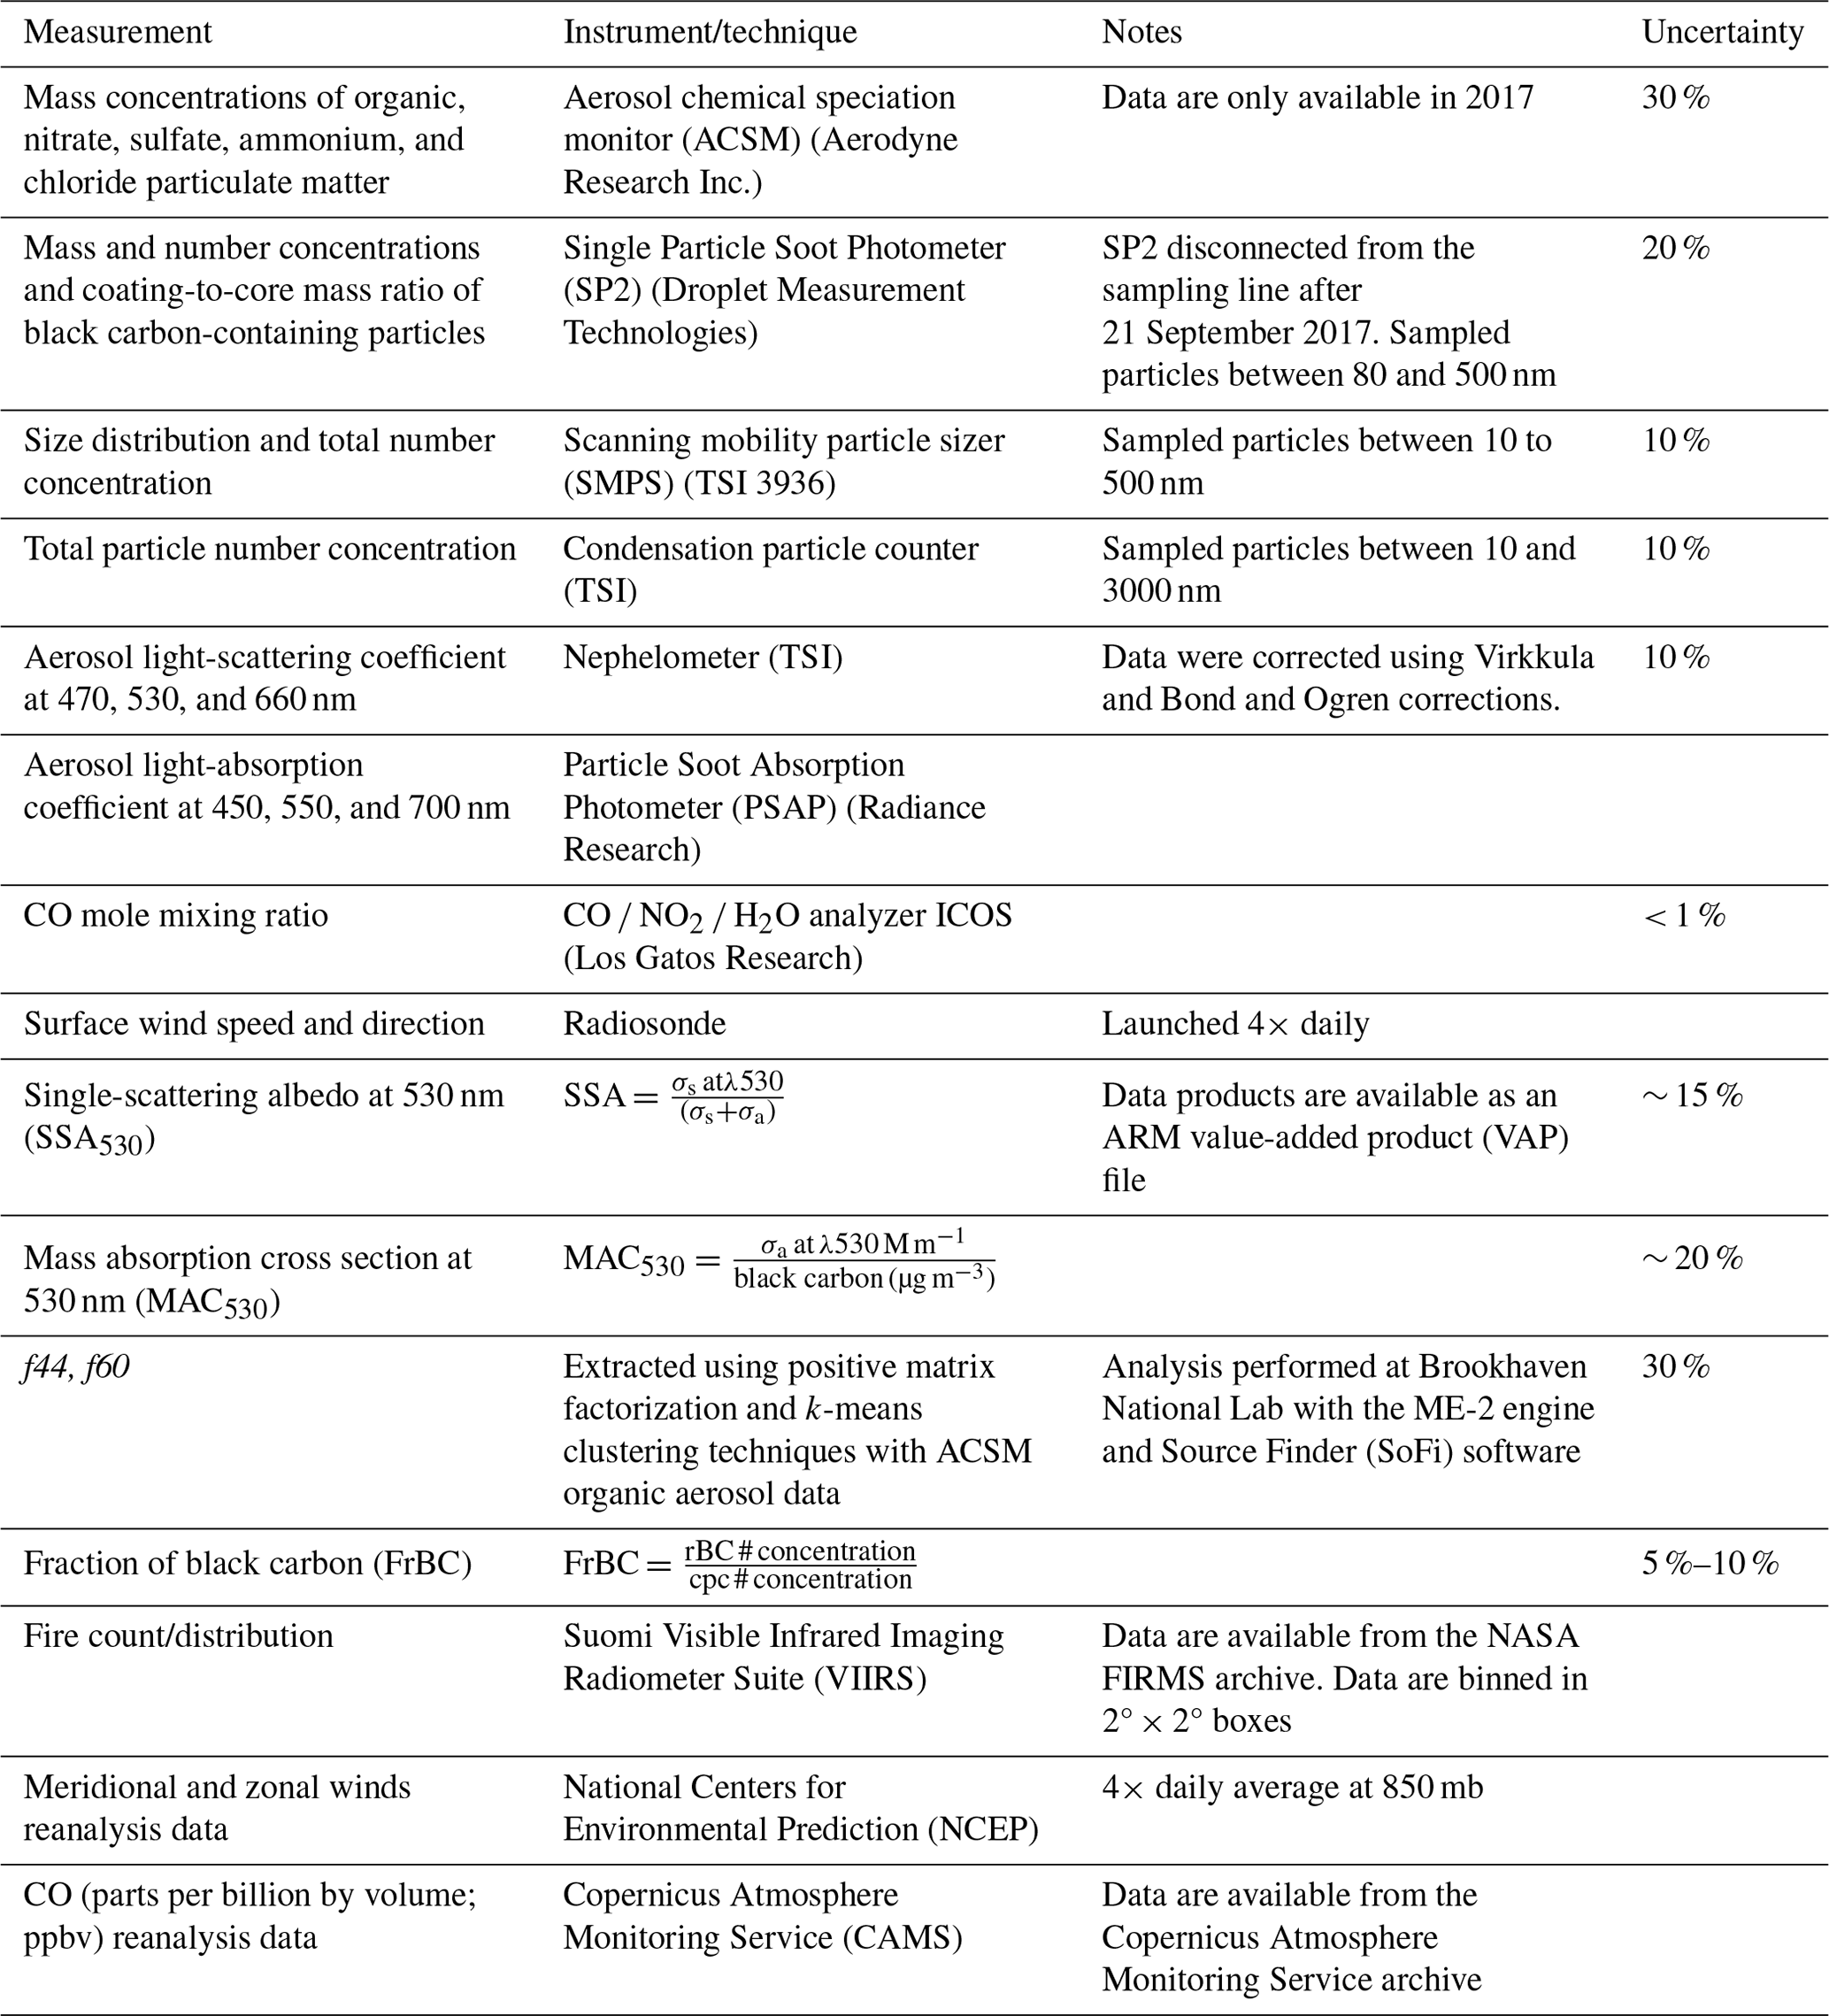
2.1 Instrumentation and data products
The LASIC field campaign deployed the Department of Energy (DOE) Atmospheric Radiation Measurement (ARM) First Mobile Facility (AMF1) (Zuidema et al., 2018) on Ascension Island between June 2016 and October 2017 to measure aerosol and cloud properties with the goal of constraining uncertainties in BBA aging processes and aerosol–cloud interactions. Here we focus on surface measurements collected from June to September 2017, as aerosol composition was available only for those times. The utilized data products, and the quantities measured and instrumentation suite are listed in Table 1. While the LASIC data are constrained to surface-based measurements, they are predominantly representative of the boundary layer surrounding Ascension Island. It is crucial to consider that the clouds were intermittently coupled with the surface during the early morning and evening. The observed intermittent coupling of clouds with the surface during early morning and evening hours highlights a more complex interaction than the constant decoupling observed by aircraft measurements (Zhang and Zuidema, 2019). Despite these complexities, our findings provide a reliable representation of the prevailing boundary layer conditions (Zhang and Zuidema, 2019; Abel et al., 2020; Wu et al., 2020).
Mass concentrations of OA, SO4, NO3, and NH4 were measured with the quadrupole aerosol chemical speciation monitor (ACSM; Ng et al., 2011a), which separates the ions of different elemental compositions at each mass-to-charge ratio () to provide the unit–mass resolution. The sampling efficiency of the LASIC ACSM was previously discussed in Barrett et al. (2022); however, a comparison (Appendix A) of the aerosol volume concentration calculated using the ACSM with that calculated from the size distribution measurements from the scanning mobility particle sizer (SMPS) indicates that the ACSM sampled effectively. Masses of the refractory black carbon (rBC) in individual particles within the rBC-diameter range of 80 to 500 nm were measured with the Single Particle Soot Photometer (SP2; Droplet Measurement Technologies), allowing the determination of the size distributions of number concentration of rBC-containing particles and mass concentrations of rBC (Sedlacek et al., 2022). CO mixing ratios were measured with the CO NO2 H2O integrated cavity output spectroscopy (ICOS) analyzer (Table 1).
During the ORACLES 2016 campaign, non-refractory aerosols were sampled with a high-resolution time-of-flight aerosol mass spectrometer (HR-ToF-AMS; Aerodyne Research Inc.; Dobracki et al., 2023). During the CLARIFY campaign, the same type of aerosol was sampled with a compact time-of-flight aerosol mass spectrometer (C-ToF-AMS; Taylor et al., 2020; Barrett et al., 2022). During the ORACLES 2016 and CLARIFY campaigns, rBC was measured with a four-channel SP2 (Droplet Measurement Technologies; Barrett et al., 2022; Sedlacek et al., 2022). Despite these slight differences in instrumentation and sampling strategies, we utilize the data from both campaigns in this study to ensure a comprehensive analysis.
Size distributions of the aerosol number concentration for mobility diameters between 10 and 500 nm were measured with the SMPS, and the total number concentrations of particles with diameters between 10 and 3000 nm were measured with a condensation particle counter (CPC). Light-scattering coefficients (σs) at wavelengths 450, 550, and 700 nm were measured with the nephelometer (TSI 3563), and light-absorption coefficients (σa) at 465, 530, and 650 nm were measured with the Particle Soot Absorption Photometer (PSAP; Radiance Research). These quantities were taken from the ARM aerosol optical properties value-added product (AOP VAP; Flynn et al., 2018), as were values of SSA530 that were calculated from them. The mass absorption cross section at 530 nm (MAC530), calculated as the ratio of the absorption coefficient at 530 nm determined by the PSAP to the rBC mass concentration determined by the SP2, is used below to quantify aerosol absorption enhancement. A mass absorption cross section of 7.5 m2 g−1 at 550 nm, which corresponds to ∼ 7.8 m2 g−1 at 530 nm under the assumption of an inverse relationship between absorption coefficient and wavelength (i.e., absorption Ångström exponent (AAE) equal to unity), is universally used for fresh, uncoated rBC (Bond and Bergstrom, 2006). Therefore, a value of MAC530 substantially greater than this indicates enhanced light absorption (Bond et al., 2013; Zanatta et al., 2016). The absorption Ångström exponent between wavelengths 470 and 660 nm (AAE470−660) is the negative of the ratio of the logarithm of the absorption coefficient at 470 nm divided by that at 660 nm to the logarithm of 470 divided by 660. These values were also taken from the ARM AOP VAP.
The aerosol optical properties measured in this study were also compared to those from the ORACLES and CLARIFY campaigns. During ORACLES, the aerosol optical properties were measured with similar instruments to those in the LASIC campaign. Specifically, scattering coefficients at wavelengths of 450, 550, and 700 nm were measured using the TSI 3563 nephelometer, while absorption coefficients at 465, 530, and 650 nm were measured with the PSAP (Radiance Research) (Dobracki et al., 2023). Corrections for the scattering coefficients were applied using Virkkula and Bond and Ogren methods (Pistone et al., 2019; Dobracki et al., 2023). During the CLARIFY campaign, absorption coefficients at 405, 515, and 660 nm, along with aerosol dry extinction at 405 and 658 nm, were measured using the EXtinction, SCattering and Absorption of Light for Airborne Aerosol Research (EXSCALABAR) (Wu et al., 2020; Barrett et al., 2022). EXSCALABAR sampled downstream of a 1.3 µm aerodynamic diameter impactor (Taylor et al., 2020), whereas a 1.0 µm aerodynamic impactor was positioned upstream of the instruments deployed in LASIC. Variations in impactor cutoff sizes could introduce biases in the measured aerosol optical properties, particularly the scattering coefficients. Nevertheless, data from both campaigns are utilized in this study to facilitate a comparative analysis.
2.2 Data analysis techniques
ΔCO mixing ratios at Ascension Island were calculated by subtracting the 5th percentile value of the measured CO mixing ratio from the average value for each month, following Che et al. (2022a), and then converted to mass concentrations. These mass concentrations, together with rBC mass concentrations measured by the SP2, were used to determine mass ratios of rBC : ΔCO. These mass ratios can be used as an indicator of burning conditions at the source because rBC is chemically inert (Wang, 2004; Cape et al., 2012; Lund et al., 2018), and the average lifetime of CO is approximately 2 months (Khalil and Rasmussen, 1990), which are much longer than typical transport times. rBC : ΔCO was used to classify fires as either inefficient or efficient, with inefficient fires having values of rBC : ΔCO less than 0.01, and efficient fires having values of rBC : ΔCO greater than 0.01, consistent with previous classifications (Vakkari et al., 2018; Che et al., 2022a). Surface RH fields provided by the NOAA National Centers for Environmental Prediction (NCEP) reanalysis are robustly used to assess the burning condition classification. RH values > 50 % are generally associated with efficient fires, and < 50 % are generally associated with inefficient fires. The surface RH analysis serves as supplementary information for interpreting the rBC : ΔCO ratios, rather than as a primary classification criterion, which is similar to the approach used in Che et al. (2022a). Inefficient fires typically produce relatively more OA and SO4 and relatively less rBC than efficient fires (Collier et al., 2016; Rickly et al., 2022). The rBC : ΔCO classification is used as a general framework in this study, with the supplementary context provided by additional factors such as surface RH, land use maps, fire locations, and the OA : rBC and SO4 : rBC ratios. This approach is consistent with methodologies commonly used in other studies investigating biomass-burning emissions and plume characteristics in this region (Vakkari et al., 2018; Che et al., 2022a). Although a modified combustion efficiency (MCE) may be a better determinant of burning conditions (Collier et al., 2016; Dobracki et al., 2023), this quantity could not be calculated because CO2 was not sampled at Ascension Island during the LASIC campaign.
The locations of the fires between 12.0° W–52.0° E and 0° N–34.5° S encompass the sources of most of the BBA measured at Ascension Island. Fire locations were determined from fire distributions and counts obtained from NASA's Fire Information for Resource Management System (FIRMS) archive, which uses the Visible Infrared Imaging Radiometer Suite (VIIRS) aboard the S-NPP (Suomi National Polar-orbiting Partnership) and NOAA 20 satellites. The vegetation types contributing to the fuel for the fires were identified using annual land use maps from the Moderate Resolution Imaging Spectroradiometer (MODIS), combined with the NOAA Hybrid Single-Particle Lagrangian Integrated Trajectory (HYSPLIT) back-trajectories initialized with Global Data Assimilation System (GDAS) meteorology inputs. Transport pathways were determined using a combination of back-trajectories from HYSPLIT and CO mixing ratios from the Copernicus Atmosphere Monitoring Service (CAMS), combined with European Centre for Medium-Range Weather Forecasts (ECMWF) reanalysis (ERA5) 950, 800, and 700 hPa winds (Fig. S1a–d).
Positive matrix factorization (PMF) was applied to the ACSM-derived compositions during BBA-laden time periods to apportion the organic mass spectra into various factors, following Aiken et al. (2008), Lanz et al. (2010), and Zhang et al. (2011). This PMF analysis yielded only two factors, namely oxygenated organic aerosol (OOA) and low-volatility oxygenated organic aerosol (LV-OOA). This result is not surprising as BBA dominated the composition during the time periods during which PMF was applied. This analysis also provided robust calculations of the ion fractions f44 and f60, with f44 indicating the presence of the CO ion, a product of oxidation (Canagaratna et al., 2015), and f60 indicating the presence of C2H4O2, a fragment of levoglucosan, which is a known tracer for BBA (Cubison et al., 2011). Further details on the PMF analysis can be found in Appendix A.
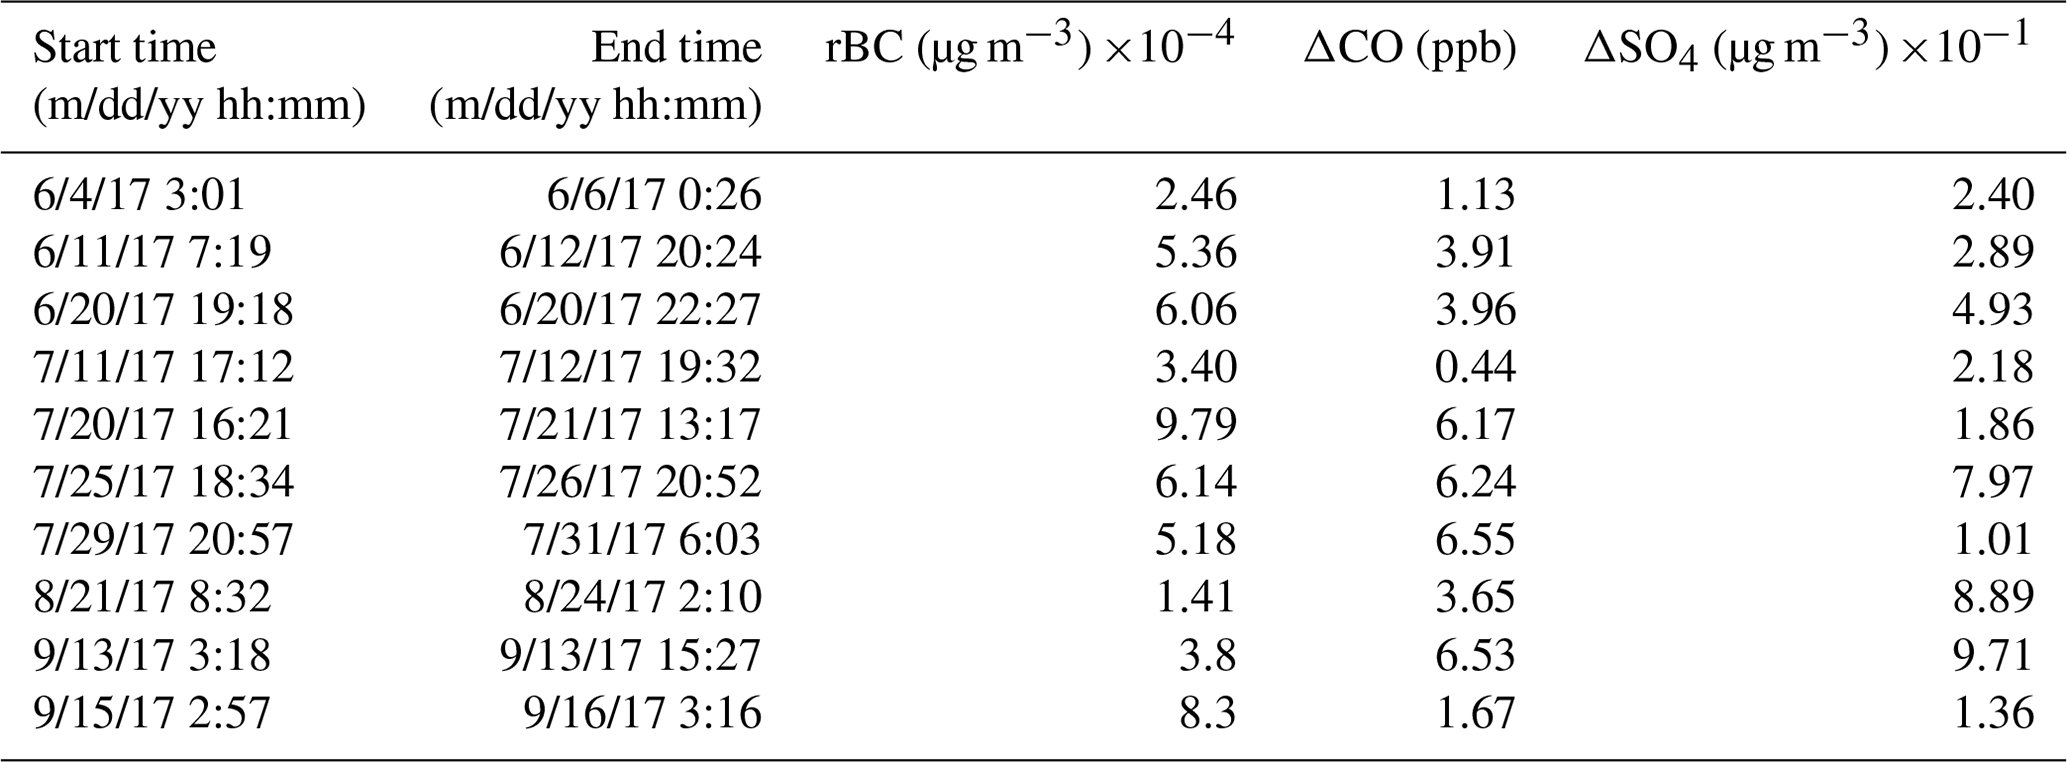
Monthly mean above-background ΔSO4 mass concentrations were calculated by subtracting SO4 mass concentrations averaged over the times during each month for which the rBC mass concentrations were smaller than 20 ng m−3 (Table 2) from the total SO4 mass concentration during BBA-laden times (Table 2). This quantity excludes background SO4 produced from marine or local sources in the MBL. Background SO4 concentrations were typically higher later in the biomass-burning season and did not correlate with wind speed, suggesting some remaining BBA residual SO4. Changes in the mass ratios of ΔSO4 to rBC (ΔSO4 : rBC), OA : rBC, and f44 can indicate changes in BBA properties from aqueous-phase chemistry and chemical processing during transport, respectively. Oxalate is an organic acid that is a well-known tracer of aqueous-phase oxidation of OA that contributes to f44 and can indicate that the aerosol has interacted with cloud (Sorooshian et al., 2010; Ervens et al., 2011). However, the ACSM cannot specifically distinguish the oxalate from other species that contribute to f44.
Table 2ΔSO4, rBC, and ΔCO from clean periods. Note that all times are in UTC.
The number fraction of black carbon (FrBC) in the BBA was calculated by dividing the number concentrations of rBC-containing particles measured by the SP2 by the total particle number concentration measured by the CPC. This value is a lower limit because the SP2 detects only particles with rBC-core diameters between 80 and 500 nm, whereas the CPC detects particles with total diameters between 10 and 3000 nm. However, there were likely very few rBC particles with diameters smaller than 80 nm or greater than 500 nm (Taylor et al., 2020; Dobracki et al., 2023). The FrBC values are not likely influenced by the background aerosol emissions because aerosol number concentrations in the accumulation mode during these clean periods are only a fraction of the BBA aerosol number concentrations during plume events. We further highlight the differences in aerosol number concentration between the clean and polluted periods in Sect. 3.2.3). The rBC geometric peak diameter (rBCgpd) is defined as the diameter at the maximum value of the size distribution of number concentration of rBC-containing particles in the representation dN dlogD, and the rBC core mass-equivalent peak diameter (rBCmpd) is defined as the diameter at the maximum value of the size distribution of mass concentration in the representation dM dlogD. The coating-to-core mass ratio of rBC-containing particles is defined as the daily average of the ratio of the coating mass to the rBC core mass and has an uncertainty of ∼ 20 % (Sedlacek et al., 2022).
A time series of rBC and ΔCO spanning from June through September 2017 indicates a significant synoptic variability, with times when the rBC mass concentrations were near 1 µg m−3 interspersed with times with rBC smaller than 0.02 µg m−3 (Fig. 1; see also Pennypacker et al., 2020). Previous studies from LASIC have often classified BBA using monthly means (Zuidema et al., 2018; Carter et al., 2021; Che et al., 2022a). However, due to the variability in aerosol loading across 4 months, monthly means may not adequately capture the BBA properties in the Ascension Island MBL. Here we explore 10 plume events, denoted P1 to P10, corresponding to rBC mass concentrations exceeding 0.15 µg m−3, which is the 70th percentile of all rBC mass concentrations. These synoptically defined events last from 2 d to 2 weeks and may contain BBA from multiple sources, each with its own combustion history. Temporal trends in the plume rBC : ΔCO mass ratios (Fig. 2), together with maps of fire density, surface RH, land use, and fuel type (Table 3) support a classification of the 10 events into three temporal regimes, reflecting different conditions at the beginning, middle, and end of the biomass-burning period as perceived within the remote MBL.
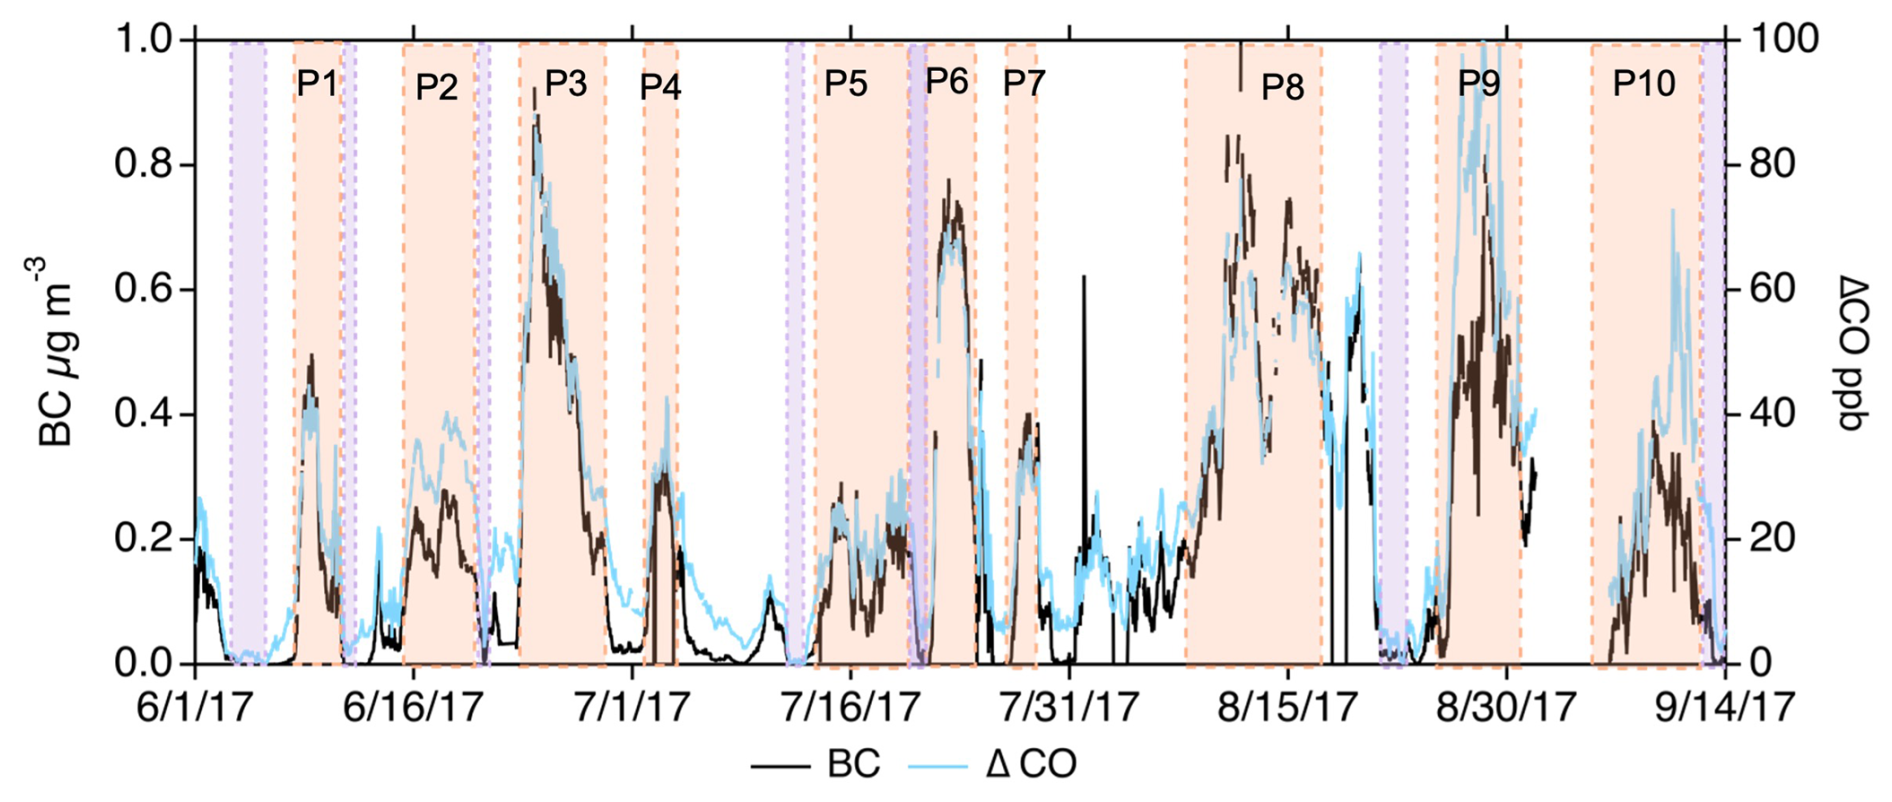
Figure 1Time series of black carbon mass concentration (µg m−3) (black) and ΔCO mixing ratio (ppb) (blue) calculated by removing the bottom 5th percentile of the monthly ΔCO distribution from the total from 1 June 2017 through 15 September 2017. Pink boxes indicate selected plume events, and purple boxes indicate clean events.
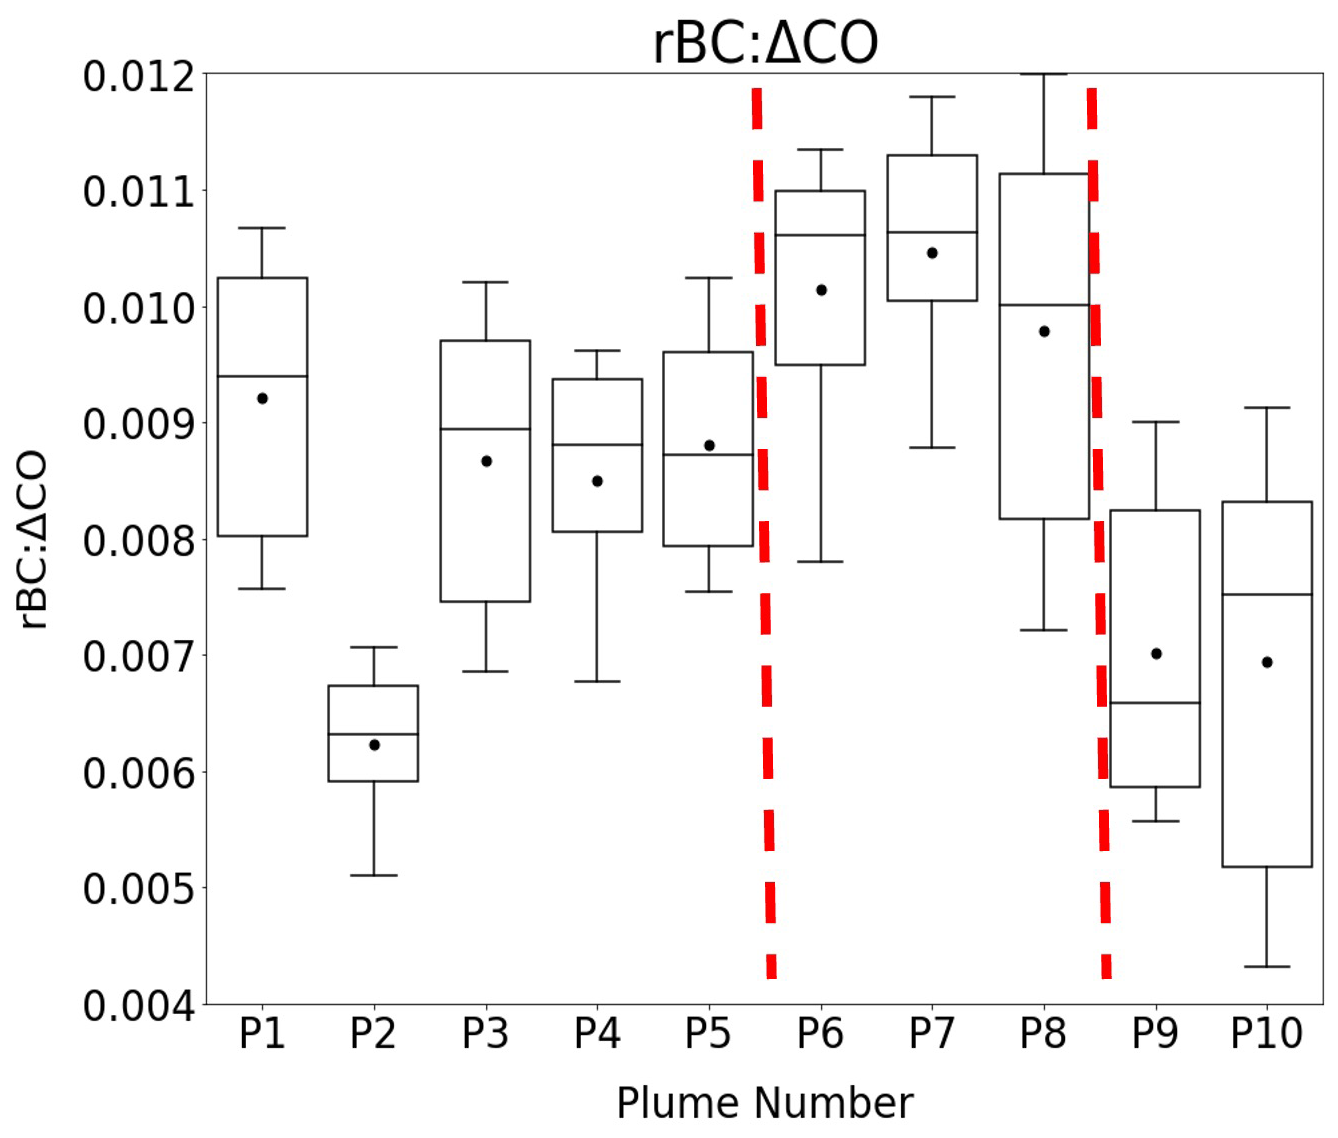
Figure 2rBC : ΔCO box–whisker distributions for major plume events, with the lowest whisker at the 10th percentile, the lowest bar at the 25th percentile, the middle bar at the 50th percentile, the upper bar at the 75th percentile, and the highest whisker at the 90th percentile. Filled circles represent the mean. Dashed red lines distinguish the three regimes discussed in the text.
Table 3Mean ± standard deviation in rBC, ΔCO, rBC : ΔCO, fire location, fuel type, and burning conditions for each regime.
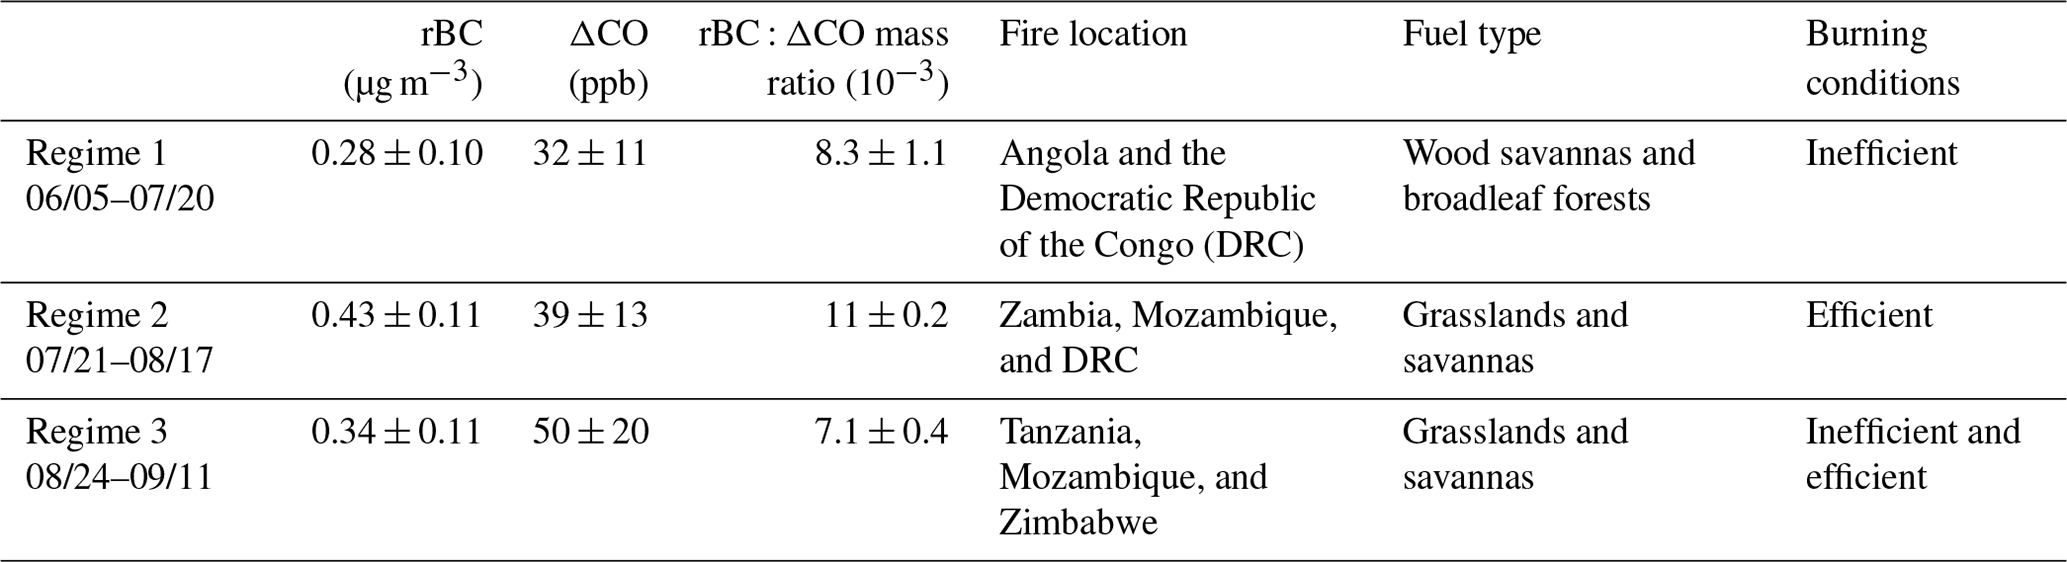
The data presented here encompass only the plume events in each regime.
3.1 Regime-based analysis determined from rBC : ΔCO
The first five plume events, spanning 8 June to 20 July, have relatively low rBC : ΔCO mass ratios of 0.0083 ± 0.0011 (mean ± standard deviation; Fig. 2), indicating inefficient combustion. Four of the events have mean rBC : ΔCO values near 0.009, with P2 being significantly lower. Despite the anomalously low rBC : ΔCO value of 0.006 ± 0.001 in P2, the rBC : ΔCO ratios of the other four plumes suggest that burning conditions remained mostly homogeneous over 6 weeks. Most fires were located near 10° S and west of 30° E (Fig. 3a; near the coast in northern Angola and in western Congo), coinciding with surface RH values greater than 50 % (Fig. 3b). Woodier landscapes (e.g., woody savannahs and broadleaf forests) dominated in the burning region (Fig. 3c). These five events, based primarily on their similar rBC : ΔCO values, are grouped into Regime 1.
Plume events 5–8, extending from 21 July to 17 August, extend into the heart of the burning season. The mean rBC : ΔCO is higher, at 0.0112 ± 0.0002 (Fig. 2), indicating efficient combustion. Most fires occurred south of 10° S (Fig. 4a; in Zambia, the Democratic Republic of the Congo (DRC), and western Mozambique), coinciding with surface RH values at less than 50 % (Fig. 4b). The burned regions are more grassy and less woody (Fig. 4c) than those burned in Regime 1. These plume events are grouped into Regime 2.
The final two plume events, spanning 24 August to 11 September, have the lowest overall rBC : ΔCO, with a mean of 0.0071 ± 0.0004. These low rBC : ΔCO values indicate that the fires were inefficient. Most of the fires occurred east of 30° E and south of 10° S (Fig. 5a; in northeast Zambia, southwest Tanzania, Mozambique, and Zimbabwe), with surface RH ranging between 30 and 60 % (Fig. 5b), over vegetation types varying from grasslands to woody savannas (Fig. 5c). Some of the fires occurred over dry central Africa and on the eastern African coast, where precipitation was greater in September (Ryoo et al., 2021). The variation in surface RH and vegetation insinuates that the two plumes in this regime may have originated from fires that are both efficient and inefficient. We further describe these conflicting conditions in Sect. 4. A notable feature of this regime is that the strong free-tropospheric winds known as the African Easterly Jet-South became active around 20 August at approximately 700 hPa (Ryoo et al., 2022).
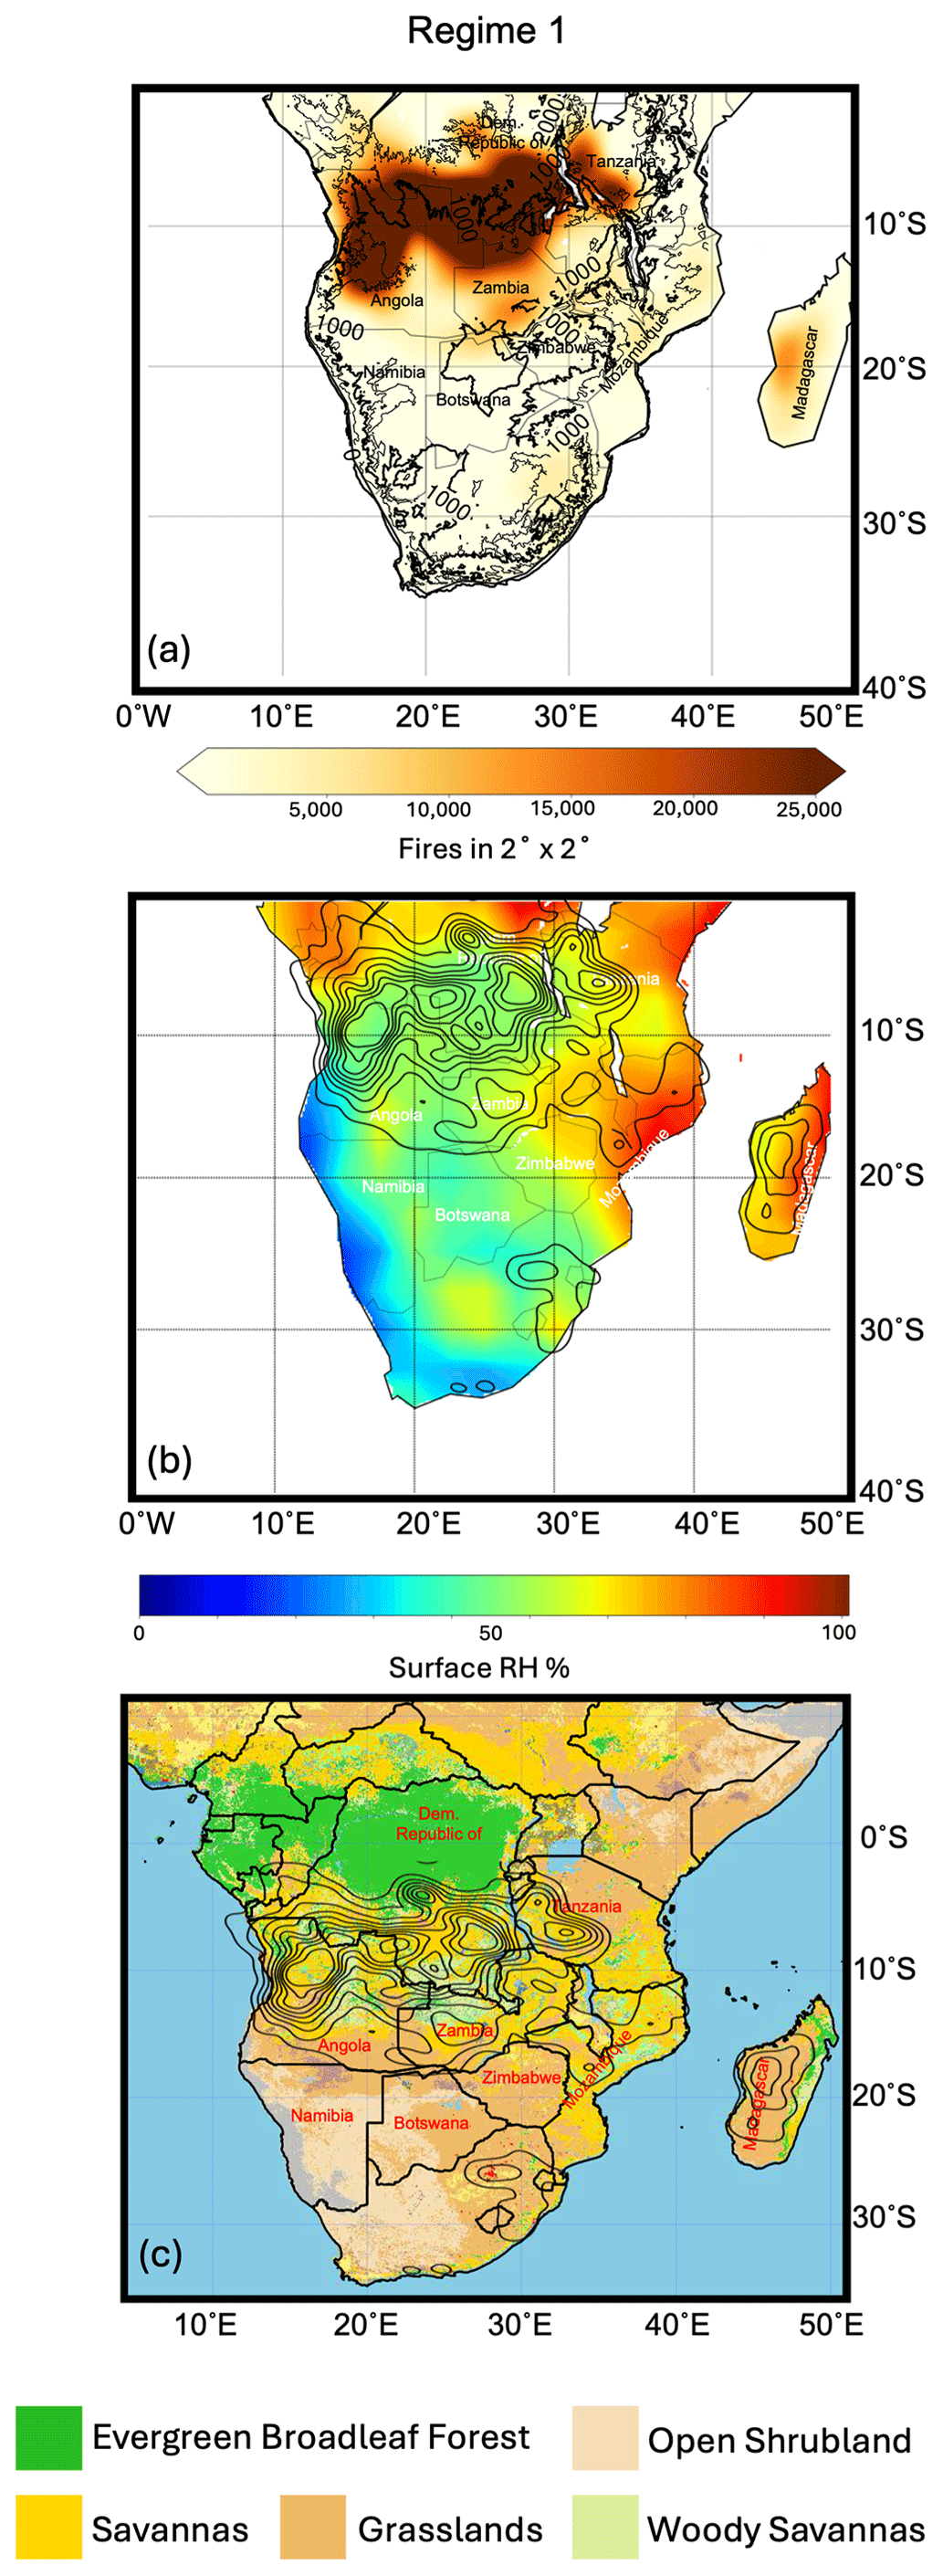
Figure 3(a) Regime 1 fire density maps showing 2° × 2° bins of the number of fires detected by the NASA S-NPP satellite between 31 May and 13 July 2017. (b) NCEP reanalysis Regime 1 mean surface relative humidity, with contours indicating the fire number density. (c) MODIS annual (2017) mean land use map with Regime 1 fire number density contours. Fire number density is shown for total fires beginning 10 d prior to the regime initiation date.
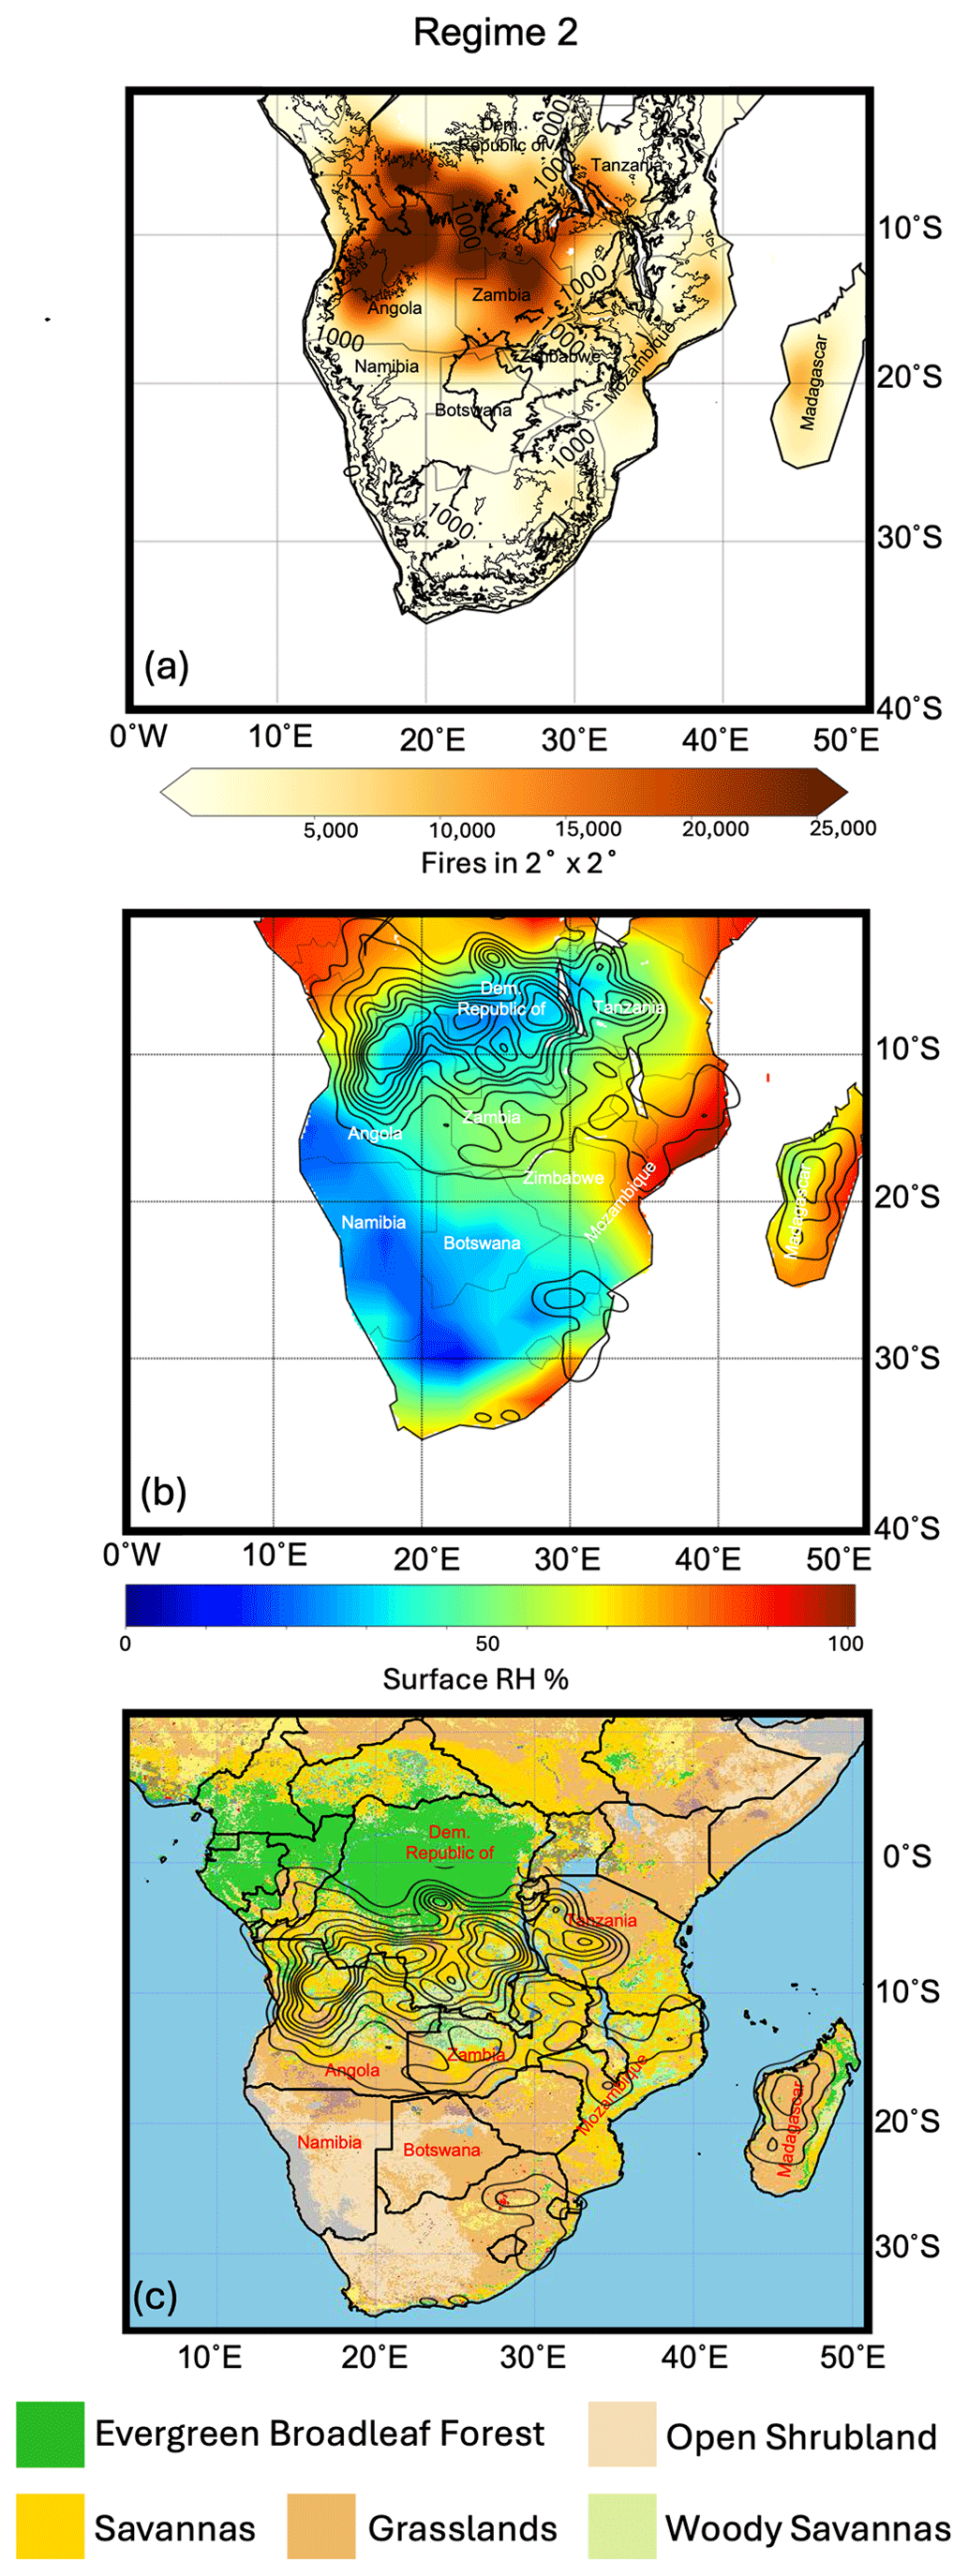
Figure 4(a) Regime 2 fire density maps showing 2° × 2° bins of the number of fires detected by the NASA S-NPP satellite between 14 July and 10 August 2017. (b) NCEP reanalysis Regime 2 mean surface relative humidity, with contours indicating the fire number density. (c) MODIS annual (2017) mean land use map with Regime 2 fire number density contours. Fire number density is shown for total fires beginning 10 d prior to the regime initiation date.
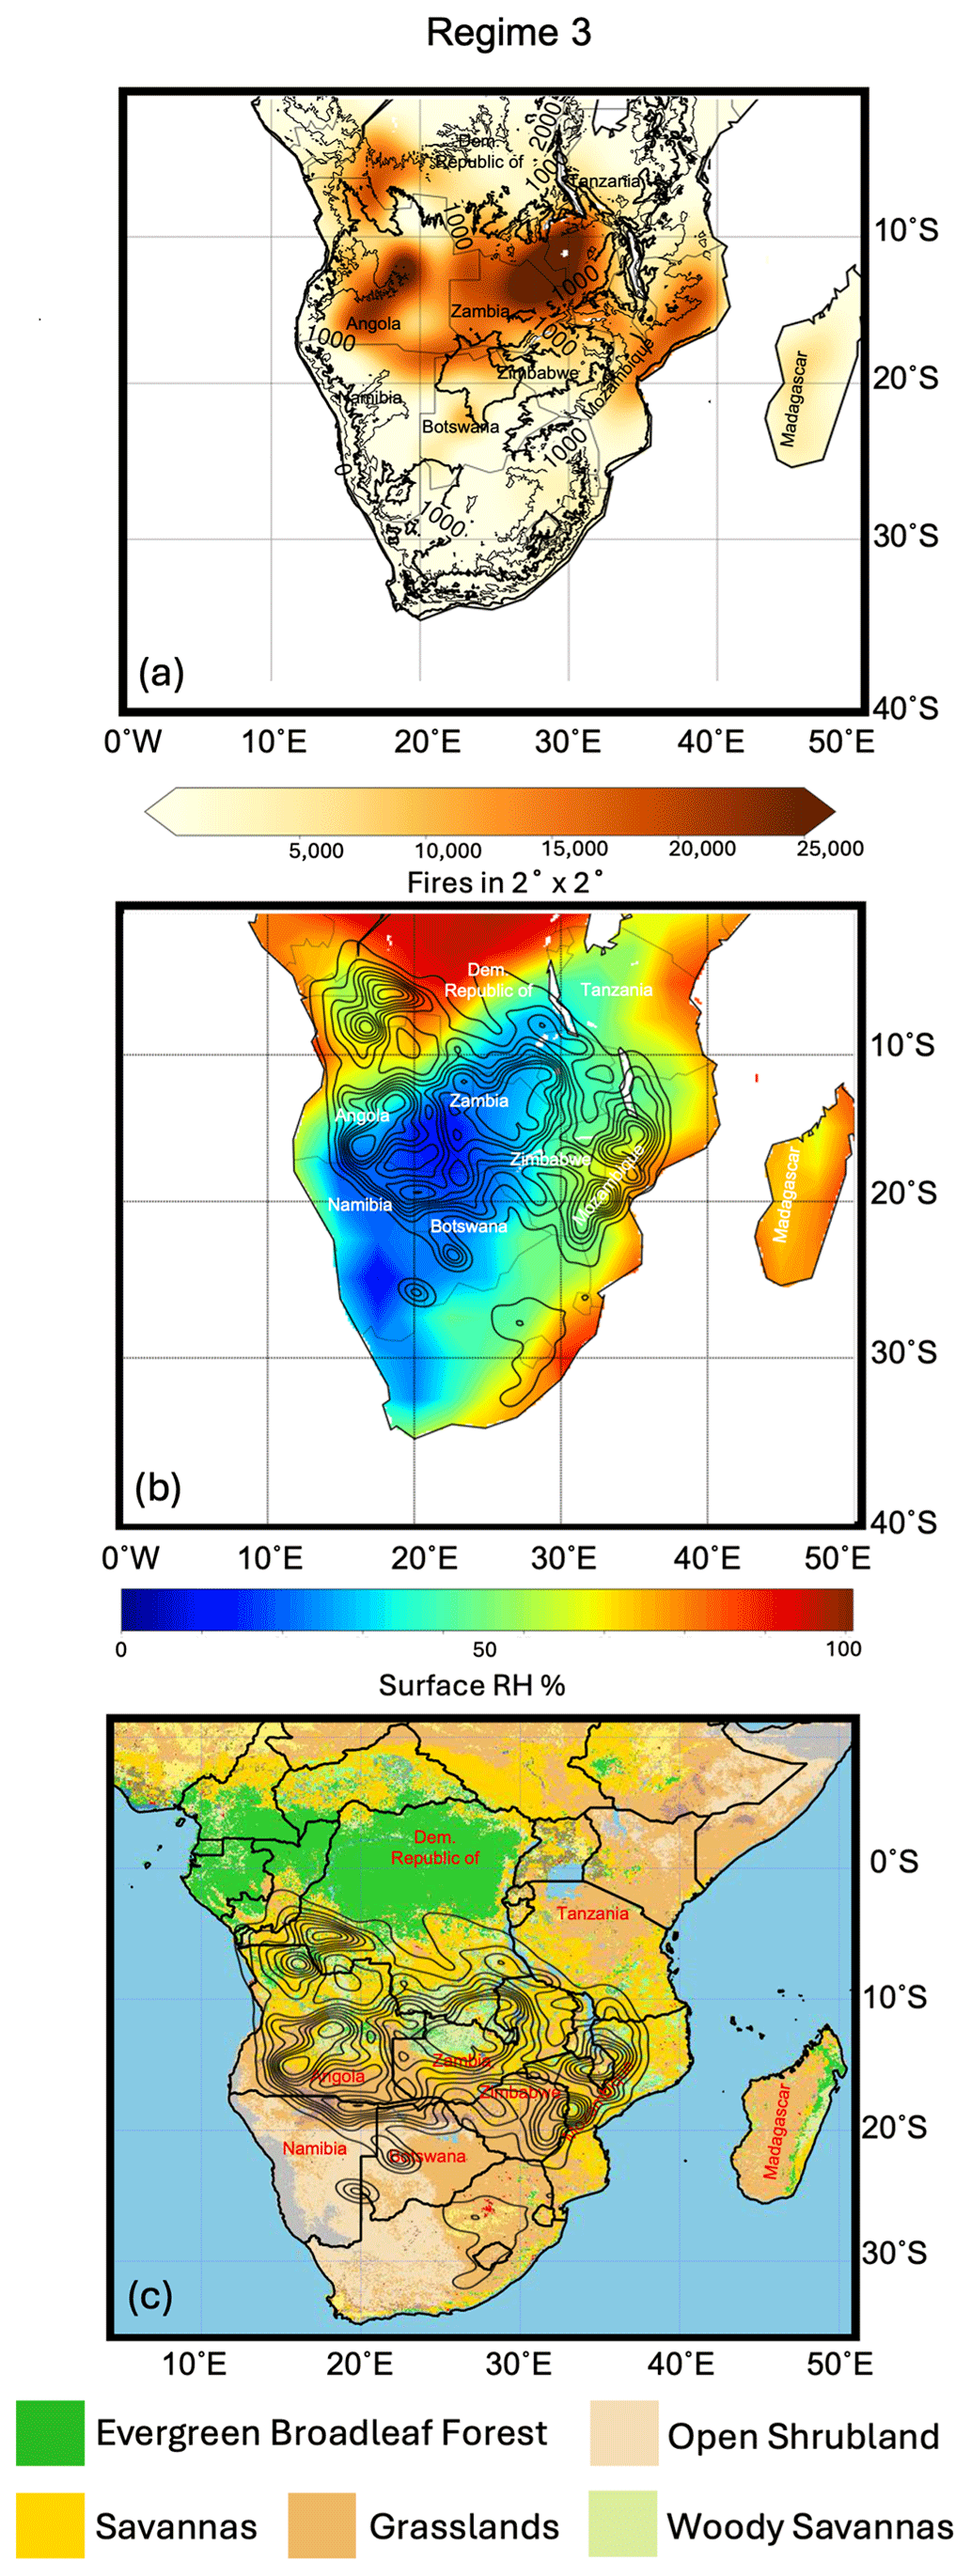
Figure 5(a) Regime 3 fire density maps showing 2° × 2° bins of the number of fires detected by the NASA S-NPP satellite between 19 August and 4 September 2017. (b) NCEP reanalysis Regime 3 mean surface relative humidity, with contours indicating fire number density. (c) MODIS annual (2017) mean land use map with Regime 3 fire number density contours. Fire number density is shown for total fires beginning 10 d prior to the regime initiation date.
3.2 BBA properties measured at Ascension Island
Here, we present the chemical, microphysical, and optical properties of the African BBA sampled in the Ascension Island MBL. By examining the rBC size distributions, rBC coating-to-core mass ratios, and number fraction of rBC-containing particles, we can infer how burning conditions and fuel type varied across the three regimes (Table 4). Additionally, we examine changes in non-refractory mass concentrations and values of f44 across 4 months to understand how long-range transport affected the chemical composition of African BBA. BBA size distributions indicate whether the BBA had undergone cloud processing or mixed with clean marine air in the MBL. Light-absorption coefficients and light-scattering coefficients are used to assess how the optical properties changed as a result of changing chemical and microphysical properties during long-range transport. Last, HYSPLIT back-trajectories facilitate an understanding of the BBA transport pathways to Ascension Island in June, July, August, and September.
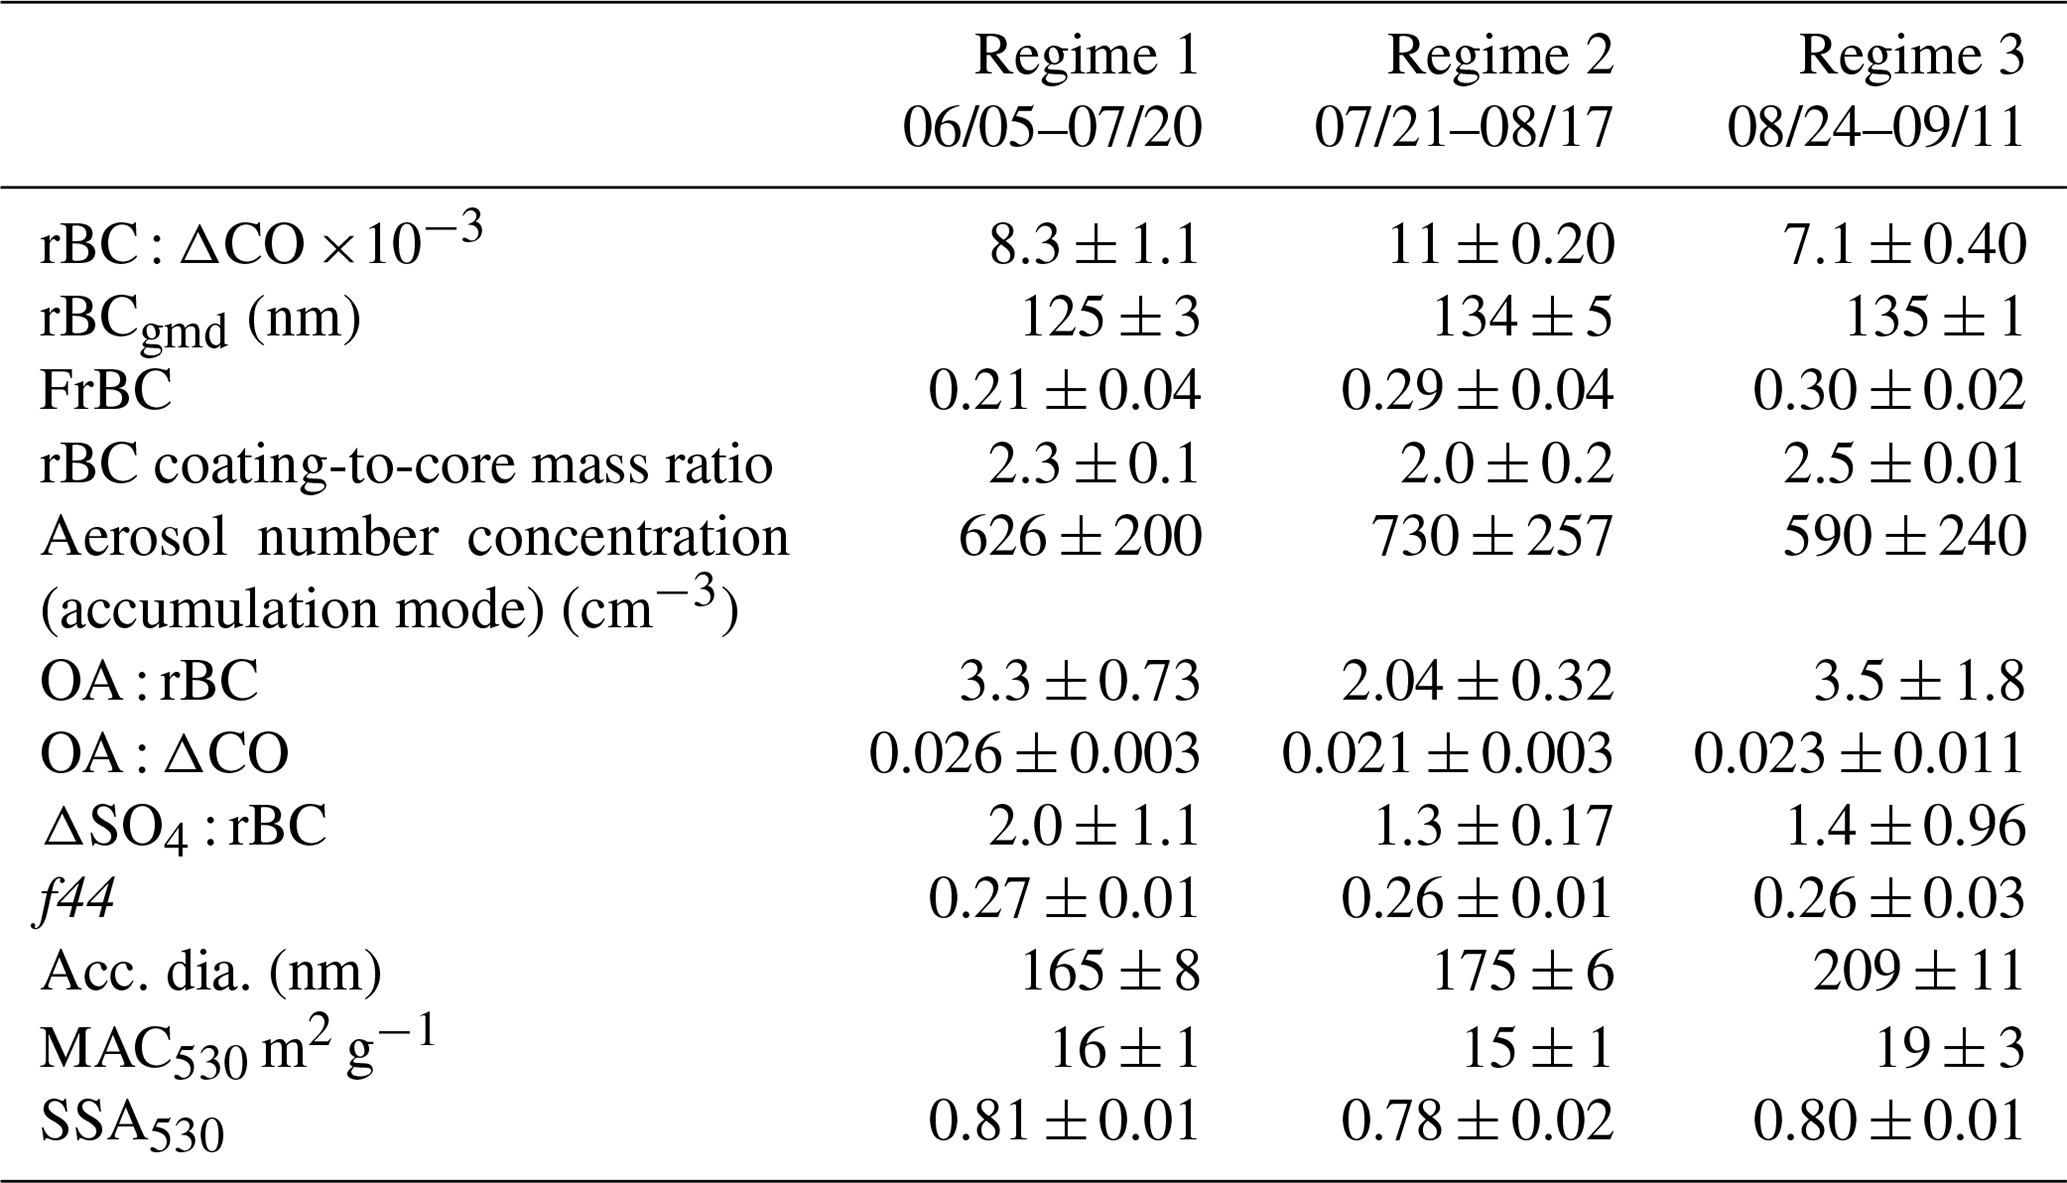
Table 4Mean ± standard deviation in aerosol properties across the three regimes (for plume events only). Note that “Acc. dia.” stands for accumulation mode diameter.
3.2.1 Black carbon aerosol properties
The rBC size distributions, the rBC coating-to-core mass ratios, and the number fraction of rBC-containing particles provide additional information on fuel-type variations across the three regimes. The rBC geometric and mass-equivalent peak diameters, rBCgpd and rBCmpd, increase monotonically, if non-dramatically, from P1 to P10, with rBCgpd increasing from 122 to 136 nm and rBCmpd increasing from 193 to 203 nm (Fig. 6; Table 4). The mean FrBC also increases from 0.21 ± 0.04 during Regime 1 to 0.29 ± 0.03 for the latter two regimes (Fig. 7a), although internal variability is high. Interestingly, the coating-to-core mass ratio trends opposite to rBC : ΔCO decreases from 2.3 ± 0.1 in Regime 1 to 2.0 ± 0.2 in Regime 2 before increasing to 2.50 ± 0.01 in Regime 3 (Fig. 7b). These variations suggest particles with larger rBC cores also contain a higher fraction of rBC-containing particles, with coating thicknesses that vary less with the rBC core size.
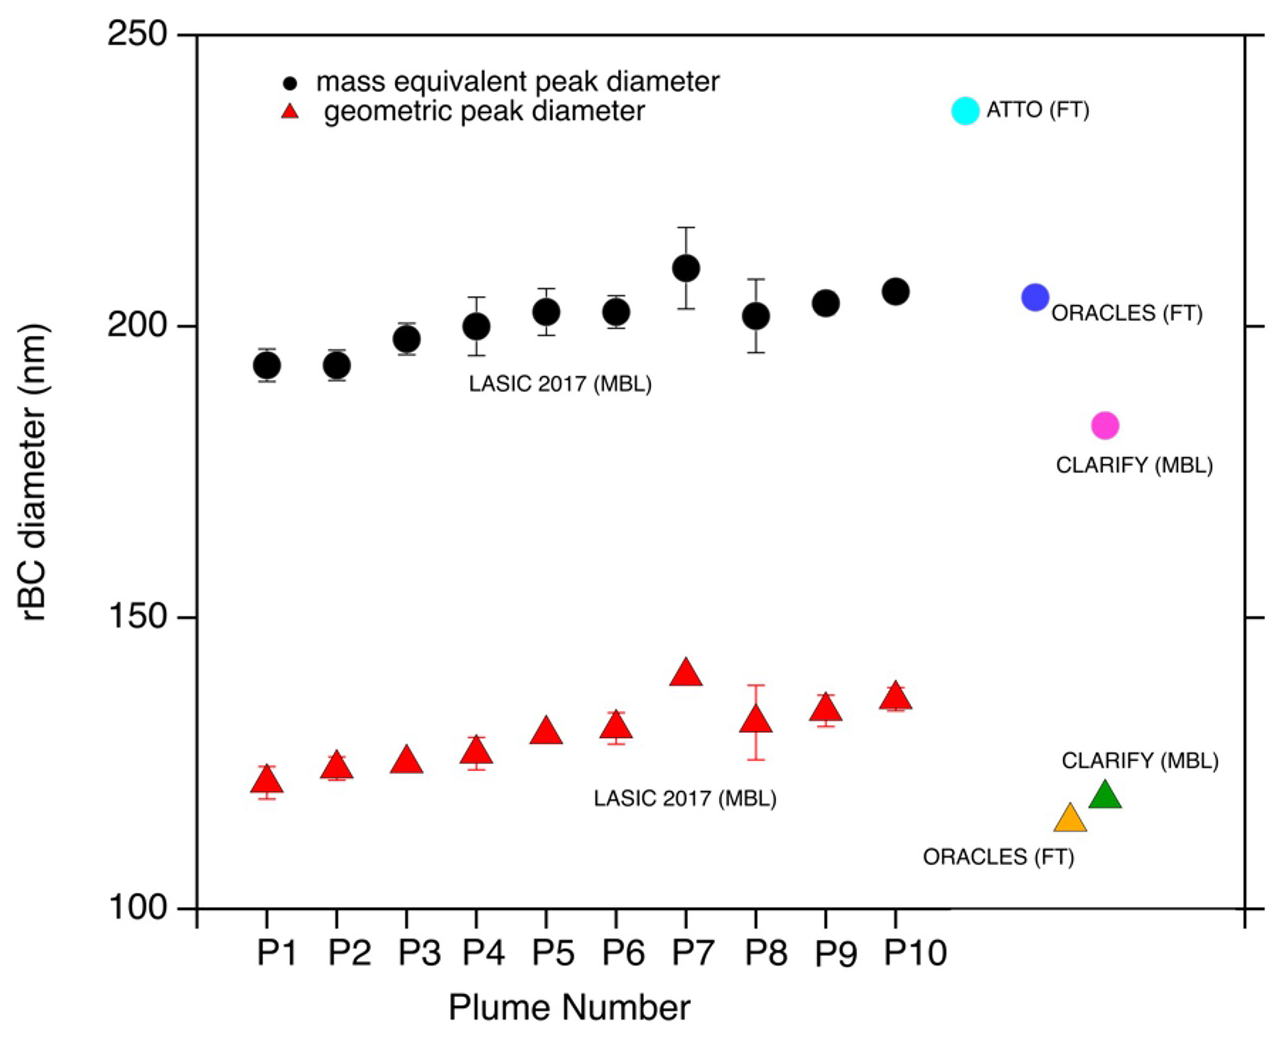
Figure 6Mean rBCmpd (circles) and rBCgpd (triangles) for multiple field campaigns in the SEA. Filled colored circles and triangles represent the daily mean geometric peak diameters from the LASIC MBL (black; red), ORACLES FT (blue; yellow) (Dobracki et al., 2023), CLARIFY MBL (pink; green) (Wu et al., 2020), and the Amazon Tall Tower Observatory lower FT (cyan) (Holanda et al., 2023). Error bars are the standard deviation in each plume event.
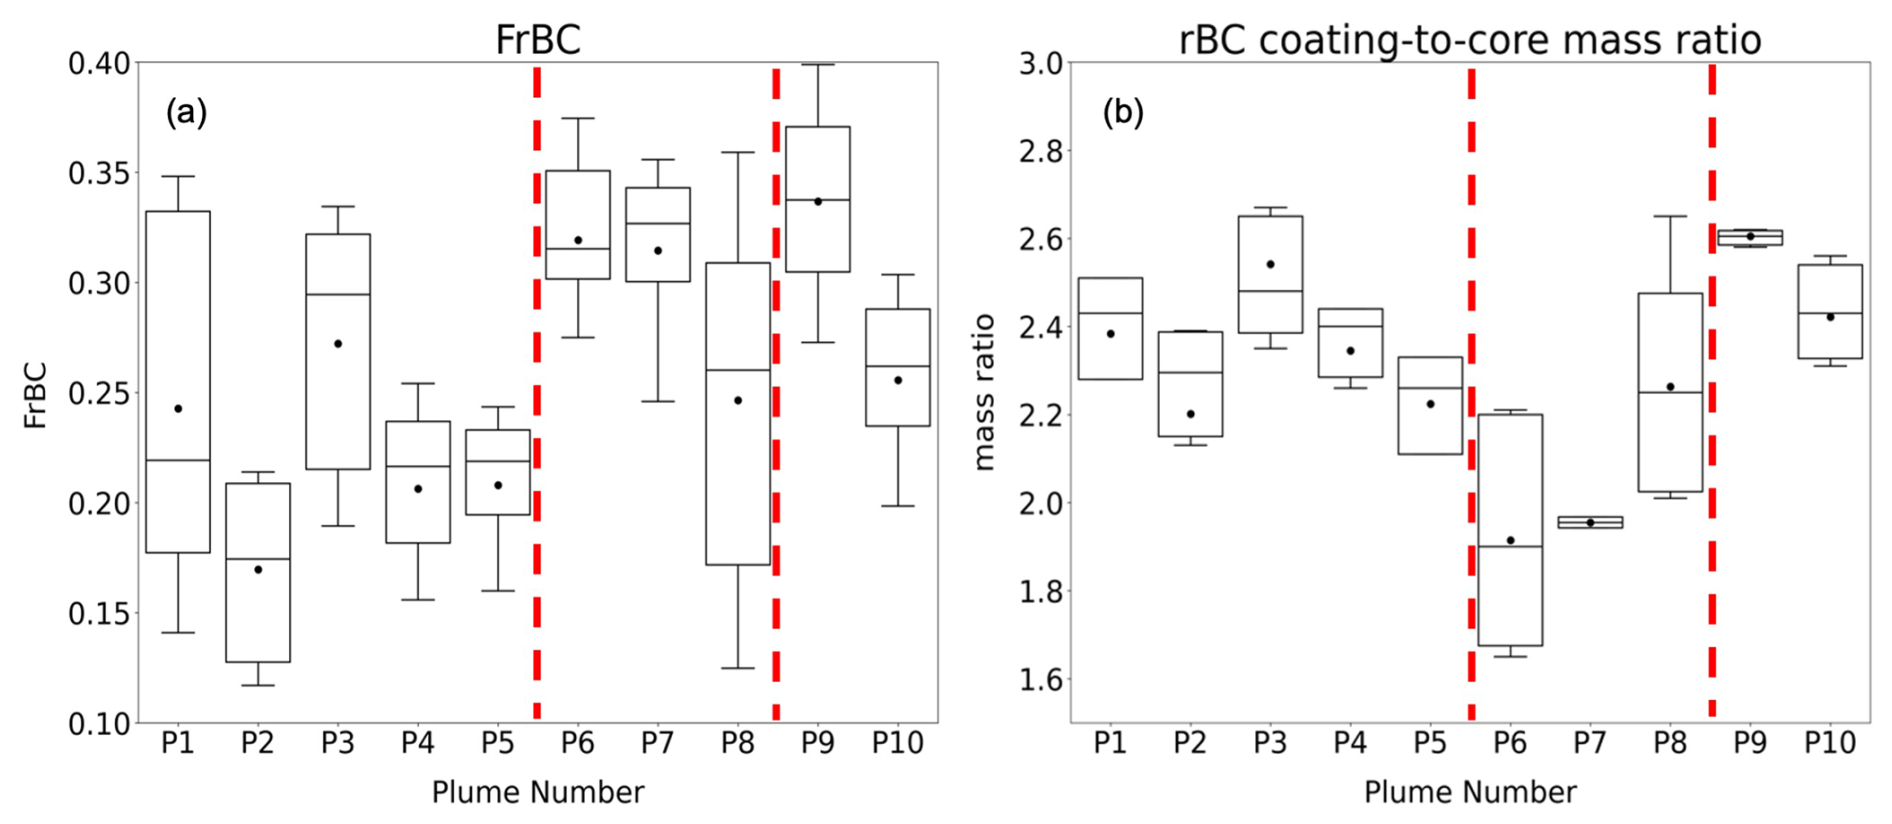
Figure 7Box–whisker distributions of the (a) FrBC and (b) rBC coating-to-core mass ratio, with the lowest whisker at the 10th percentile, the lowest bar at the 25th percentile, the middle bar at the 50th percentile, the upper bar at the 75th percentile, and the highest whisker at the 90th percentile. Filled circles represent the mean. Dashed red lines distinguish the three regimes discussed in the text.
3.2.2 Organic and sulfate aerosol properties
OA, SO4, NO3, and NH4 were also commonly present in the MBL at Ascension Island between June and September 2017 (Fig. 8). Organics provided 45 % of the total aerosol mass over the 10 plume events, with above-background sulfate contributing 33 %, rBC 13 %, and nitrate and ammonium the remaining 9 % (not shown). OA : rBC mass ratios generally decreased from P1 to P9, from 3.3 ± 1.3 (P1) to 2.2 ± 0.8 (P9), before increasing to a maximum of 4.8 ± 1.9 during P10 (Fig. 9a; Table 4). The trend in ΔSO4 : rBC approximately follows that in OA : rBC across the 10 plumes (Fig. 9b; Table 4) but is more pronounced, decreasing from 3.2 ± 1.0 in P2 to 0.82 ± 0.30 in P9 and then increasing to 2.2 ± 0.9 in P10.
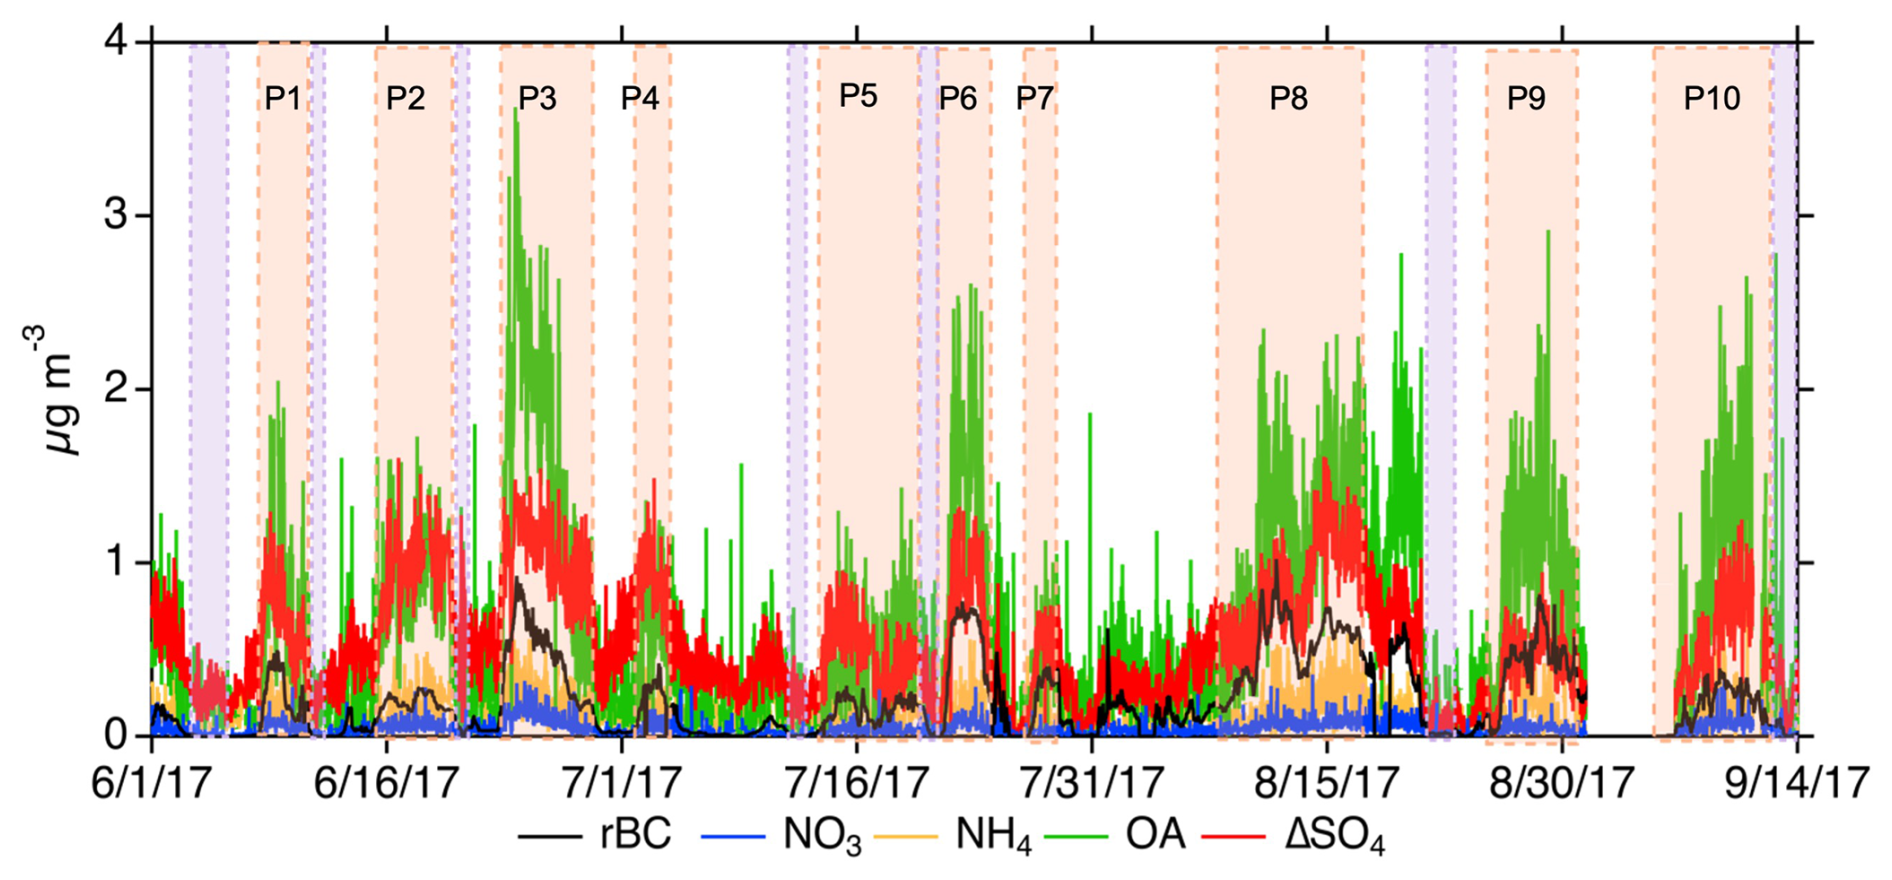
Figure 8Time series of the mass concentrations of the bulk chemical species of OA, NO3, ΔSO4, and NH4 from the ACSM and rBC from the SP2. Pink boxes indicate selected plume events, and purple boxes indicate clean events. A color vision-deficiency-friendly version of this figure can be found in the Supplement.
The two factors (OOA and LV-OOA) generally had similar peak intensities at values of 18, 28, 43, and 44 and only slight differences in minor peaks (Figs. S2 and S3). Most of the plumes had similar f44 values (Fig. S3), with the exception of P5 and P10 (Fig. 10), for which Factor 1 f44 values were 0.23 ± 0.01 and 0.26 ± 0.01, respectively, and Factor 2 f44 values were 0.29 ± 0.01 and 0.313 ± 0.002, respectively. These differences possibly result from regime transitions and/or more complex fuel source mixtures. f44 values from both Factor 1 and Factor 2 for the other eight plumes were not substantially different; therefore, averages of the two factors are used to describe each of the 10 events. These values ranged between 0.24 and 0.28 (Fig. 10), indicating highly oxidized BBA. Mean f44 values decrease only slightly from 0.284 ± 0.001 in Regime 1 to 0.26 ± 0.03 in Regime 3 (Table 4) but may still provide information about transport and oxidation processes in the MBL.
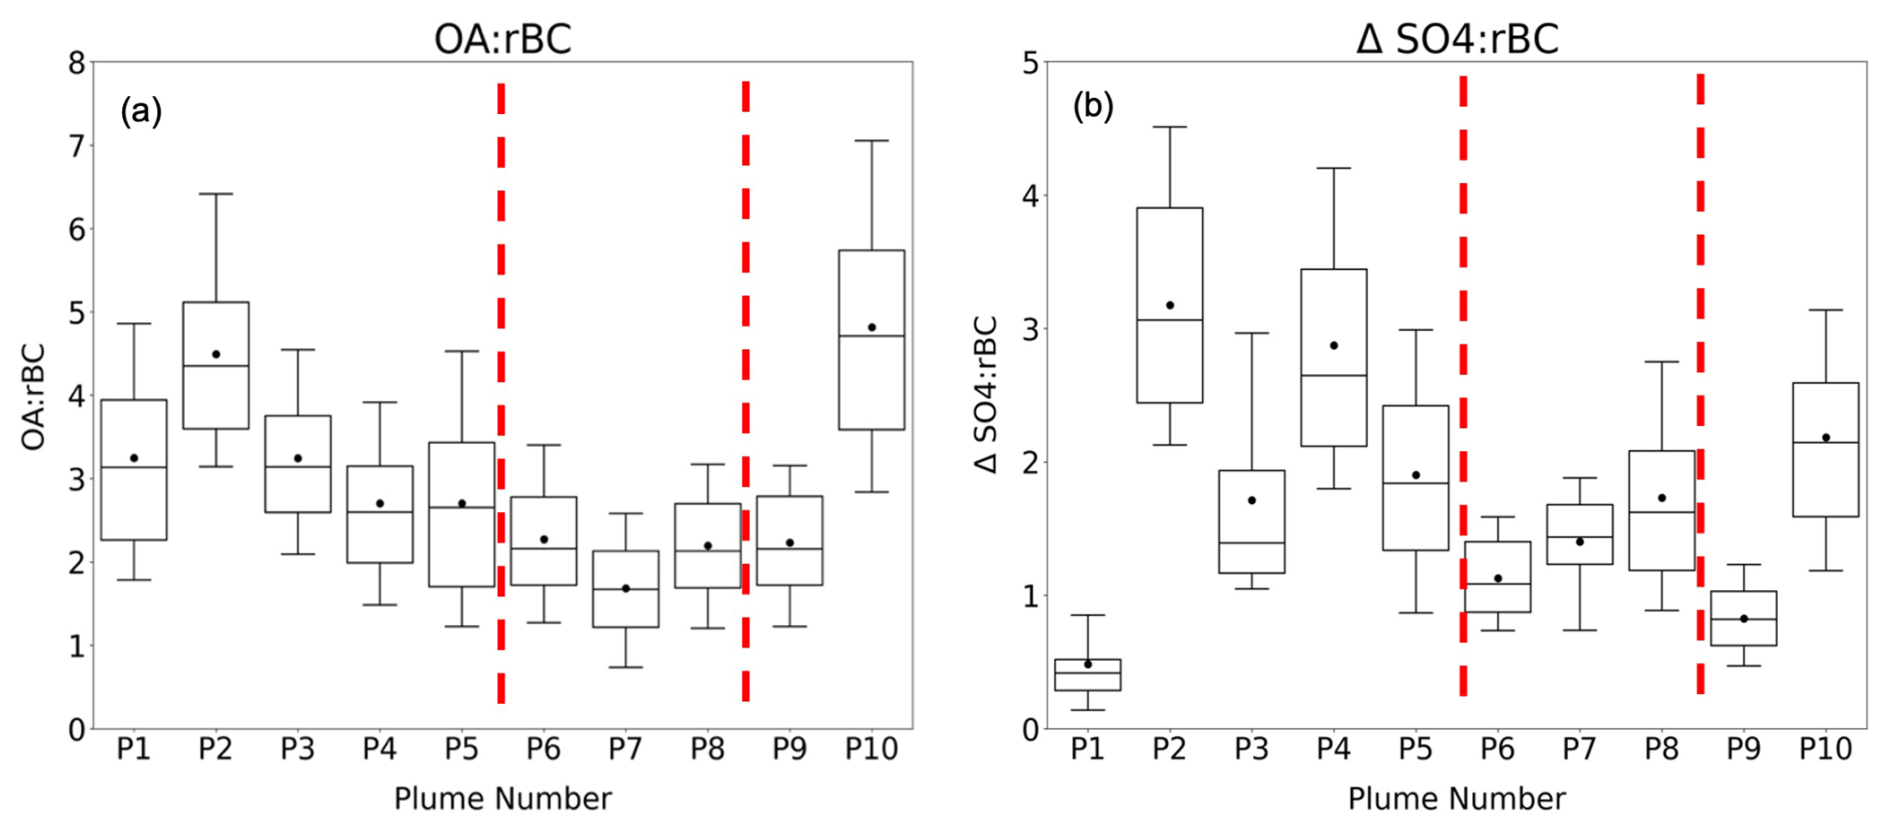
Figure 9Box–whisker distributions of (a) OA : rBC, (b) ΔSO4 : rBC, with the lowest whisker at the 10th percentile, the lowest bar at the 25th percentile, the middle bar at the 50th percentile, the upper bar at the 75th percentile, and the highest whisker at the 90th percentile. Filled circles represent the mean. Dashed red lines distinguish the three regimes discussed in the text.
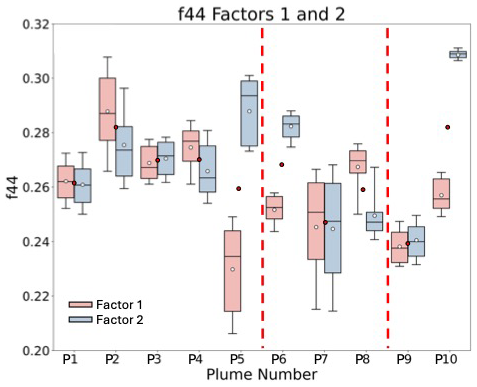
Figure 10Box–whisker distributions of f44 Factor 1 (red) and f44 Factor 2 (blue). Filled white circles represent the mean of each factor, with the lowest whisker at the 10th percentile, the lowest bar at the 25th percentile, the middle bar at the 50th percentile, the upper bar at the 75th percentile, and the highest whisker at the 90th percentile. Dashed red lines distinguish the three regimes discussed in the text. Red-filled circles represent the mean of Factors 1 and 2.
3.2.3 Size distributions
The shape of the aerosol size distribution provides information on whether the aerosol has undergone cloud processing. A bimodal size distribution has an Aitken mode at small diameters and an accumulation mode at larger diameters, with the minimum between these modes referred to as the Hoppel minimum (Hoppel et al., 1986). The bimodality results from the activation of larger particles into cloud drops, which then either precipitate or evaporate to form even larger aerosol particles due to the uptake of other substances and coagulation after collisions with other cloud drops. The smaller particles are typically formed from gas-to-particle conversion of organic and sulfate vapors from the ocean or the biomass-burning plume and have not activated. Therefore, bimodal aerosol size distributions in the MBL suggest aerosol that has undergone cloud processing, whether it is clean marine aerosol or BBA (Figs. 11 and S4).
Daily mean number size distributions during clean time periods in Regime 1 were always bimodal, with noticeable Aitken and accumulation modes (Fig. 11a). The average of all clean size distributions (in the representation dN dlogD) had an Aitken mode with a peak near 200 cm−3 at a diameter near 35 nm and an accumulation mode with a peak also near 200 cm−3 at a diameter near 135 nm. The Hoppel minimum diameter was near 60 nm. Daily mean size distributions during BBA-laden times in Regime 1 were bimodal on 25 of the 28 d (Fig. S4a). The average of the bimodal size distributions during BBA-laden times had an Aitken mode with a peak (200 cm−3) at a larger diameter than that during the pristine period (near 45 nm) and an accumulation mode with a much larger peak than that during the pristine period, ranging from 400–700 cm−3 at a diameter near 165 nm (Fig. 11a), with a Hoppel minimum diameter near 70 nm.
The pristine size distributions in Regime 2 were also bimodal (Fig. 11b) but with a more pronounced Aitken mode than during Regime 1, with the number concentrations greater than 500 cm−3, at a diameter near 35 nm. The accumulation mode peaks at slightly less than 250 cm−3 at a slightly larger diameter (near 145 nm), but the Hoppel minimum diameter remained near 60 nm. In contrast to Regime 1, only slightly more than half (12 out of 20) of the BBA-laden days in Regime 2 had bimodal size distributions (Fig. S4b). When BBA was present, the Hoppel minimum was less pronounced than that in Regime 1, spanning a broader range of diameters between 45 and 85 nm. The Aitken mode for the average of these bimodal size distributions was also less pronounced, with peak number concentrations less than 150 cm−3 occurring at diameters between 30 and 50 nm. The accumulation mode peak number concentration ranged from 400 to 900 cm−3 and occurred at slightly larger diameters than for Regime 1 near 175 nm (Fig. 11b).
Last, in Regime 3, the number size distributions from the clean time periods were more weakly bimodal than in Regimes 1 and 2 (Fig. 11c), primarily because the accumulation mode was less well defined. The Hoppel minimum diameter remained between 60 and 80 nm, similar to Regimes 1 and 2. The Aitken mode for the average of these size distributions had a maximum number concentration near 250 cm−3 at a smaller diameter, near 20 nm, than in the two other regimes, and the accumulation mode was less pronounced, with a maximum number concentration near 100 cm−3 at diameters around 150 nm. Only 4 out of the 12 polluted days in Regime 3 exhibited a bimodal number size distribution (Fig. S4c), which is fewer than in both Regimes 1 and 2. The monomodal number size distributions only contained the accumulation mode which had number concentrations between 400 and 800 cm−3 and had a modal diameter near 200 nm, which is the largest of the three regimes.
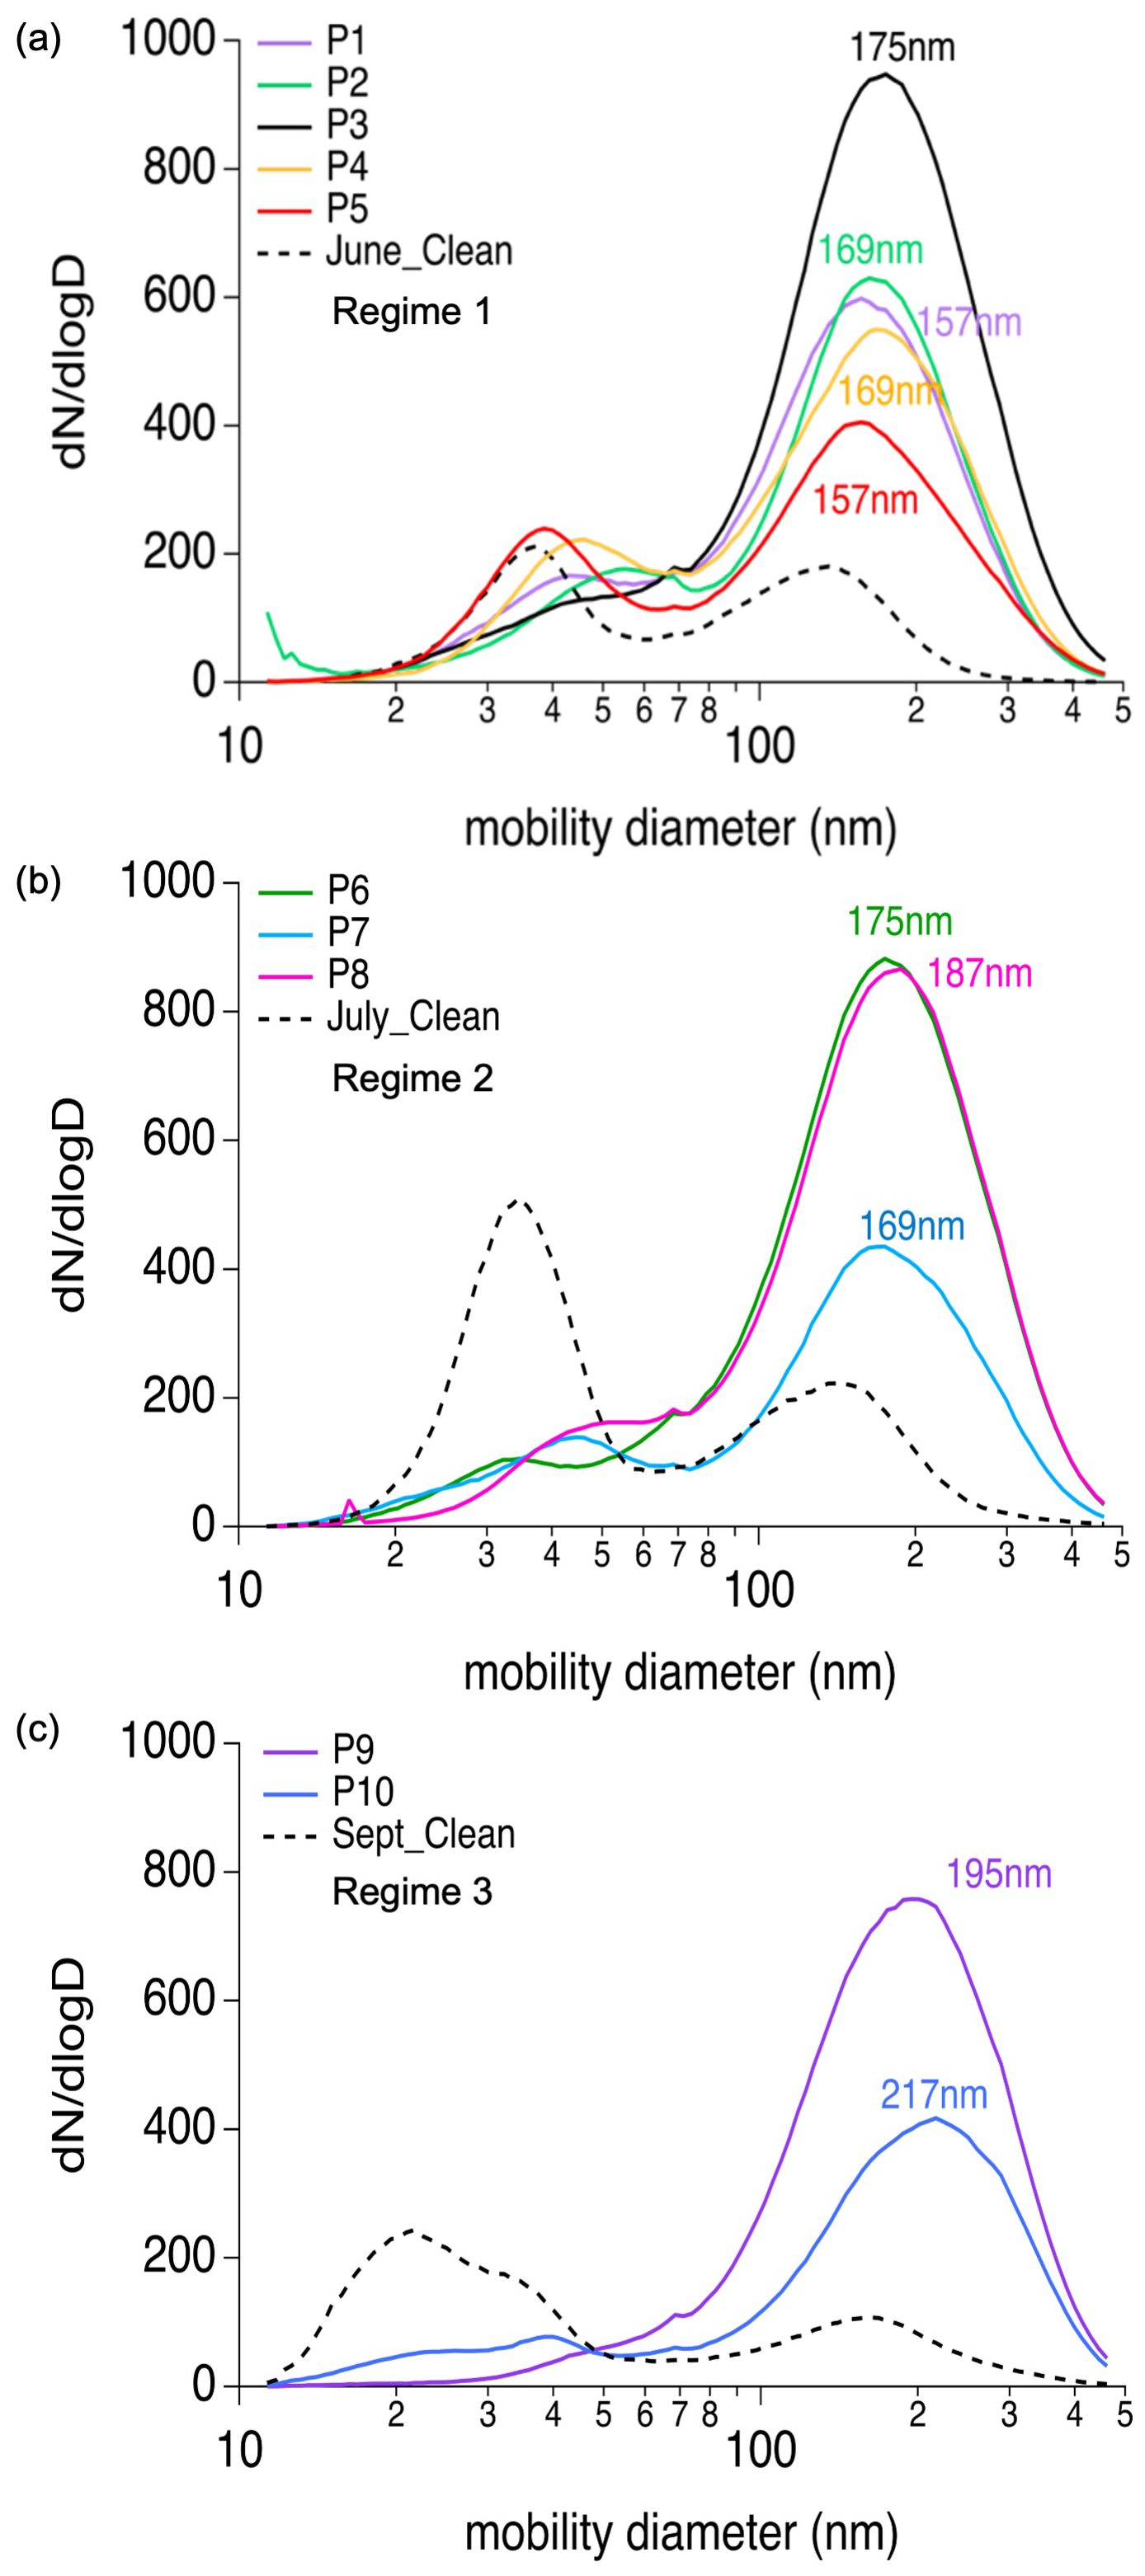
Figure 11Plume mean SMPS aerosol size distributions (dN dlogD cm−3) for each selected plume event in (a) Regime 1, (b) Regime 2, and (c) Regime 3. Monthly mean distributions from clean periods are denoted as dashed black lines.
3.2.4 Optical properties
There was no obvious trend in MAC530 (Fig. 12a), SSA530 (Fig. 12b), or AAE470−660 (not shown) over the 10 plume events, but MAC530 and SSA530 do correlate positively over the first 9 plume events (Fig. S5). Plume mean MAC530 values remained between 15 and 18 m2 g−1 during P1 to P9 and increased only to 20 ± 4 m2 g−1 in P10 (Fig. 12a). The lowest MAC530 value, 15 ± 2 m2 g−1, was observed during P1 (Fig. 12a), but this is statistically indistinguishable from the campaign mean of 16 ± 2 m2 g−1. SSA530 varied between 0.75 ± 0.01 and 0.83 ± 0.02 for individual plume events, with a campaign mean of 0.80 ± 0.01 (Fig. 12b). Lower SSA530 values were typically associated with higher FrBC and lower OA : rBC and ΔSO4 : rBC. For example, the lowest SSA530, 0.75 ± 0.01, in P6, also had the second-highest FrBC (0.32 ± 0.04) and low OA : rBC and ΔSO4 : rBC (2.3 ± 0.8 and 1.1 ± 0.4, respectively), whereas the highest SSA530, 0.83 ± 0.02, in P2, corresponded to the lowest FrBC (0.17 ± 0.04) and high OA : rBC and ΔSO4 : rBC (4.5 ± 1.3 and 3.2 ± 1.0, respectively). AAE470−660 had a campaign mean of 1.03 ± 0.04 and varied little between plume events.
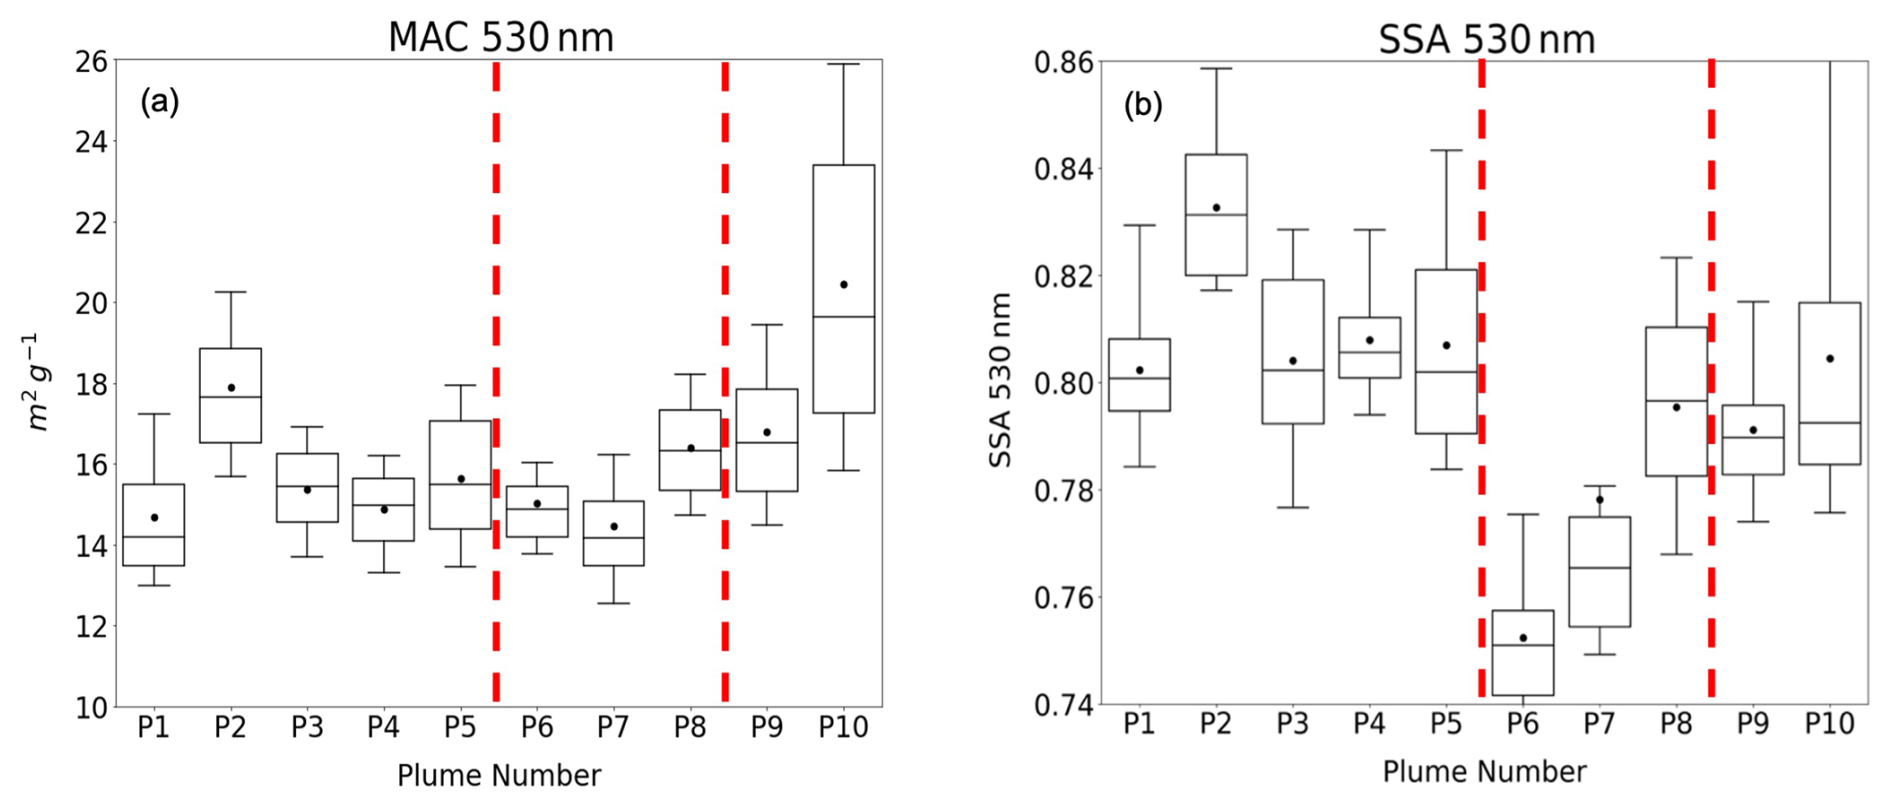
Figure 12Box–whisker distributions of (a) MAC530 and (b) SSA530, with the lowest whisker at the 10th percentile, the lowest bar at the 25th percentile, the middle bar at the 50th percentile, the upper bar at the 75th percentile, and the highest whisker at the 90th percentile. Filled circles represent the mean. Dashed red lines distinguish the three regimes discussed in the text.
3.3 BBA transport to Ascension Island
Differences in the transport patterns between clean and BBA-laden days highlight the conditions that allow BBA to reach the remote island. HYSPLIT back-trajectories, initialized at 800, 1100, and 1400 m, are shown with NCEP reanalysis 850 hPa wind speeds for representative days with and without BBA at Ascension Island (Figs. 13a–d, 14a–d). The 8 selected days are representative of the overall transport processes occurring during June through September.
A common feature on clean days (Figs. 14a–d) was the presence of a sea level pressure high between 0 and 20° W, which promoted the advection of pristine air from the southern oceans (also noted by Pennypacker et al., 2020) and forced the BBA to north of Ascension Island. On polluted days, the lack of a sea level pressure high allowed easterly winds to transport BBA to Ascension Island in the upper levels of the MBL or lower levels of the FT.
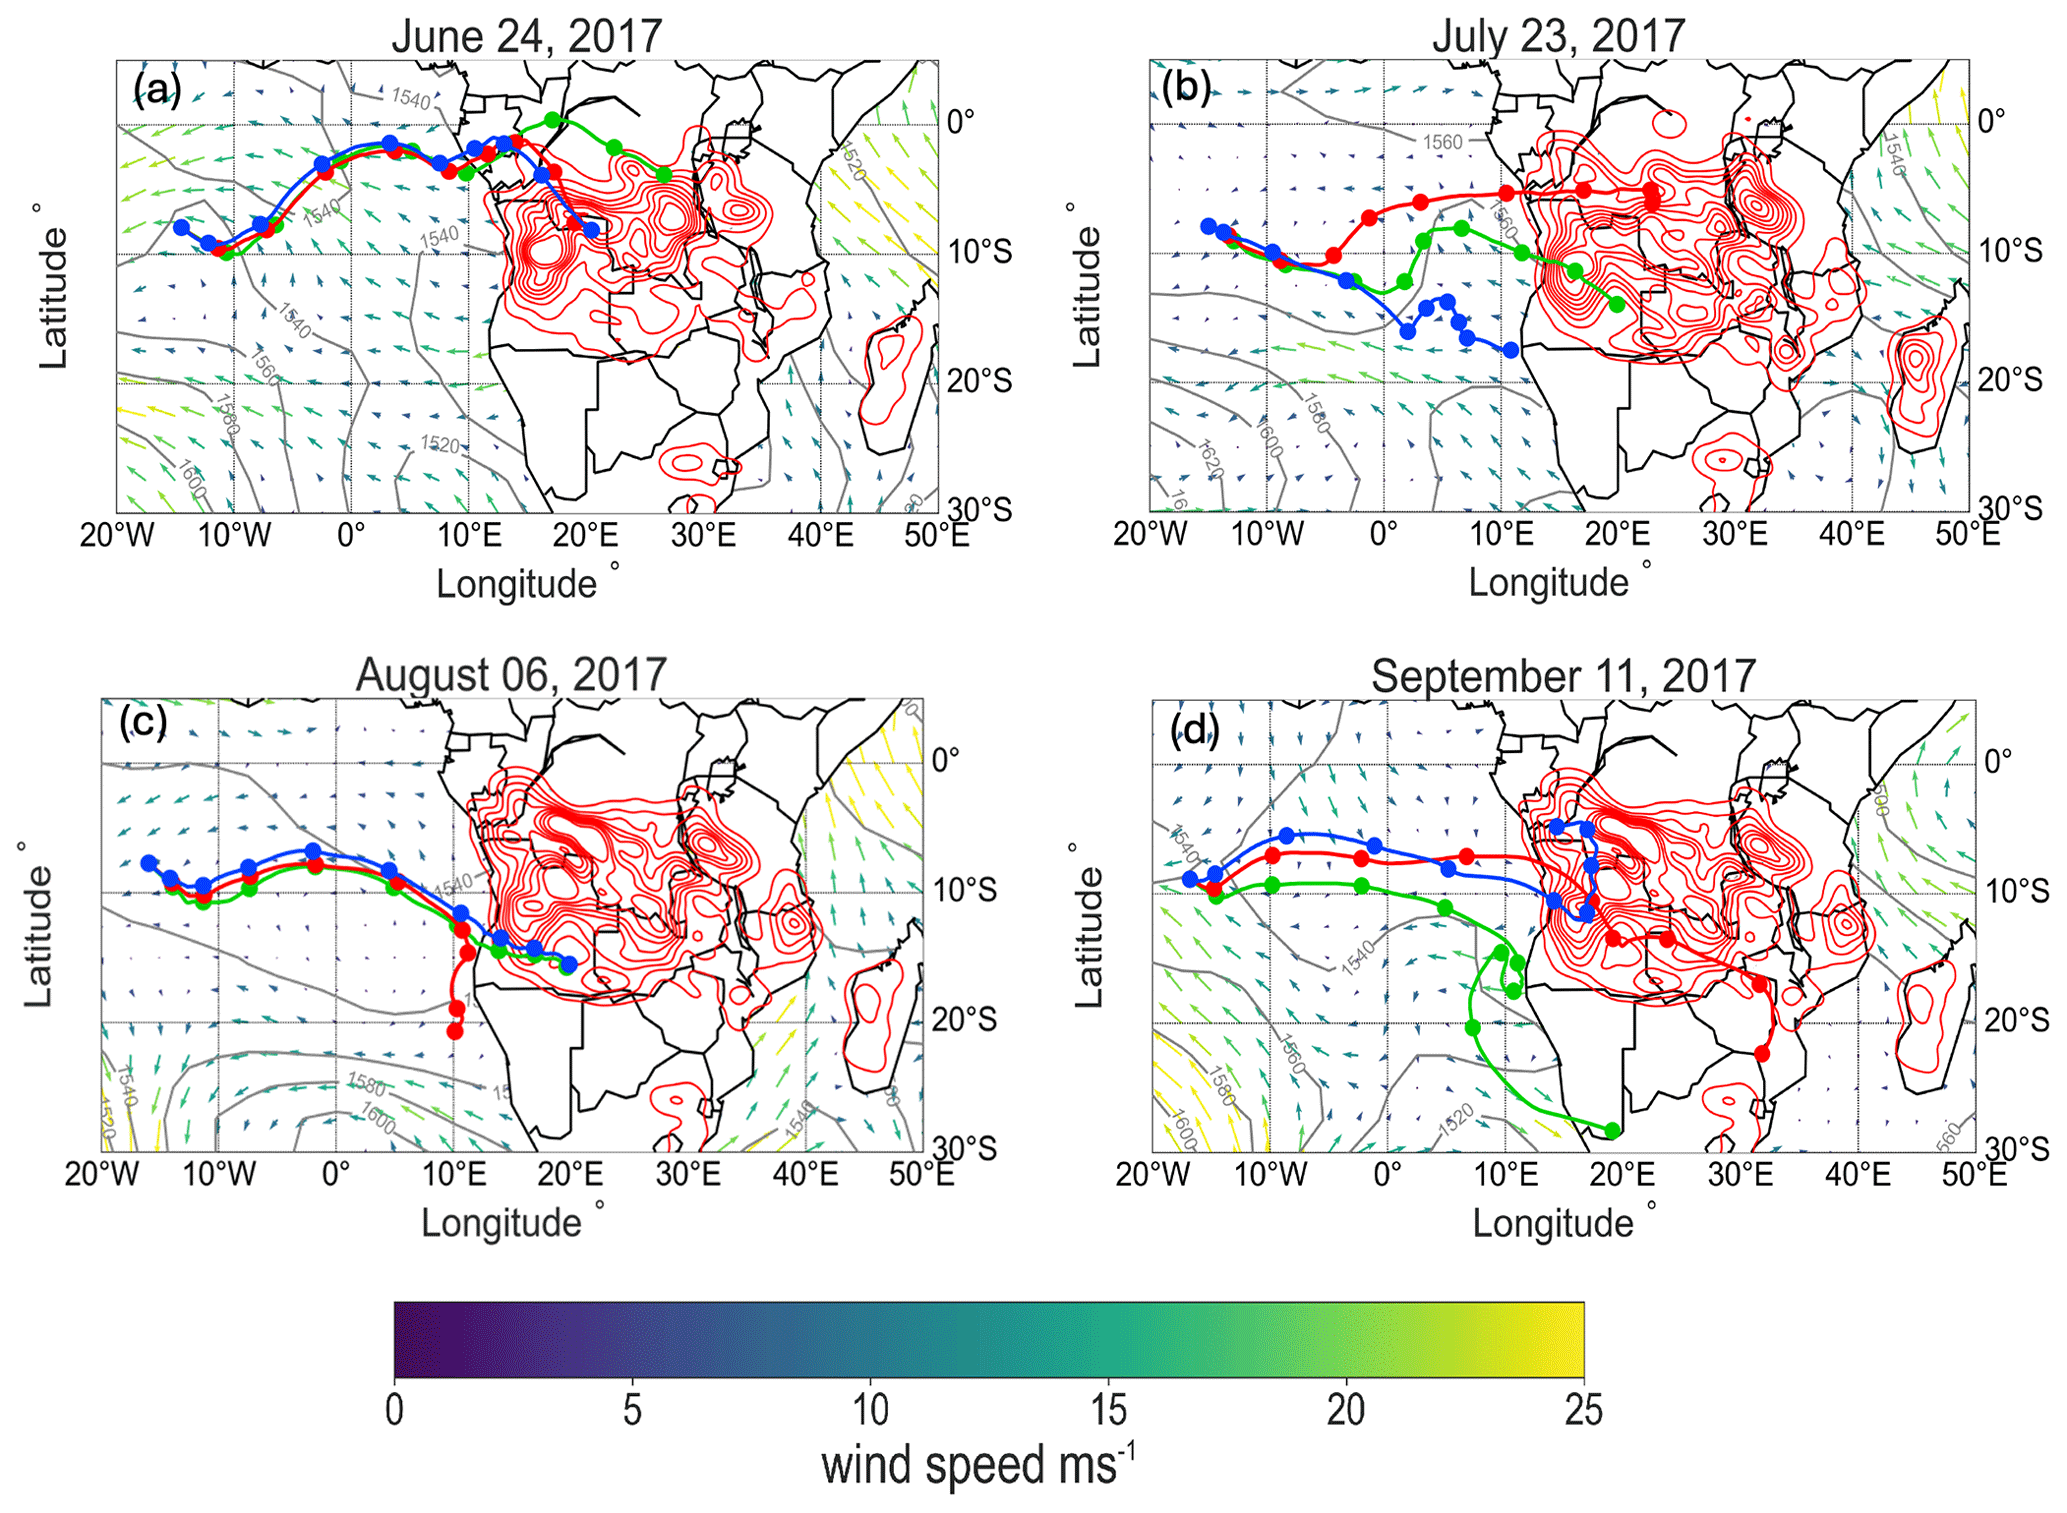
Figure 13HYSPLIT back-trajectories at 800 m (red), 1100 m (blue), and 1400 m (green) above sea level for polluted days initiated at 12:00 UTC for (a) 24 June 2017, (b) 23 July 2017, (c) 6 August 2017, and (d) 11 September 2017. Each filled colored circle represents the trajectory location at 00:00 UTC after initiation. Solid grey lines represented the NCEP reanalysis geopotential height at 850 hPa. Wind direction and magnitude are represented by arrows colored by wind speed (0–25 m s−1). Fire density is shown as red contours for total fires 2 weeks prior to the initiation date.
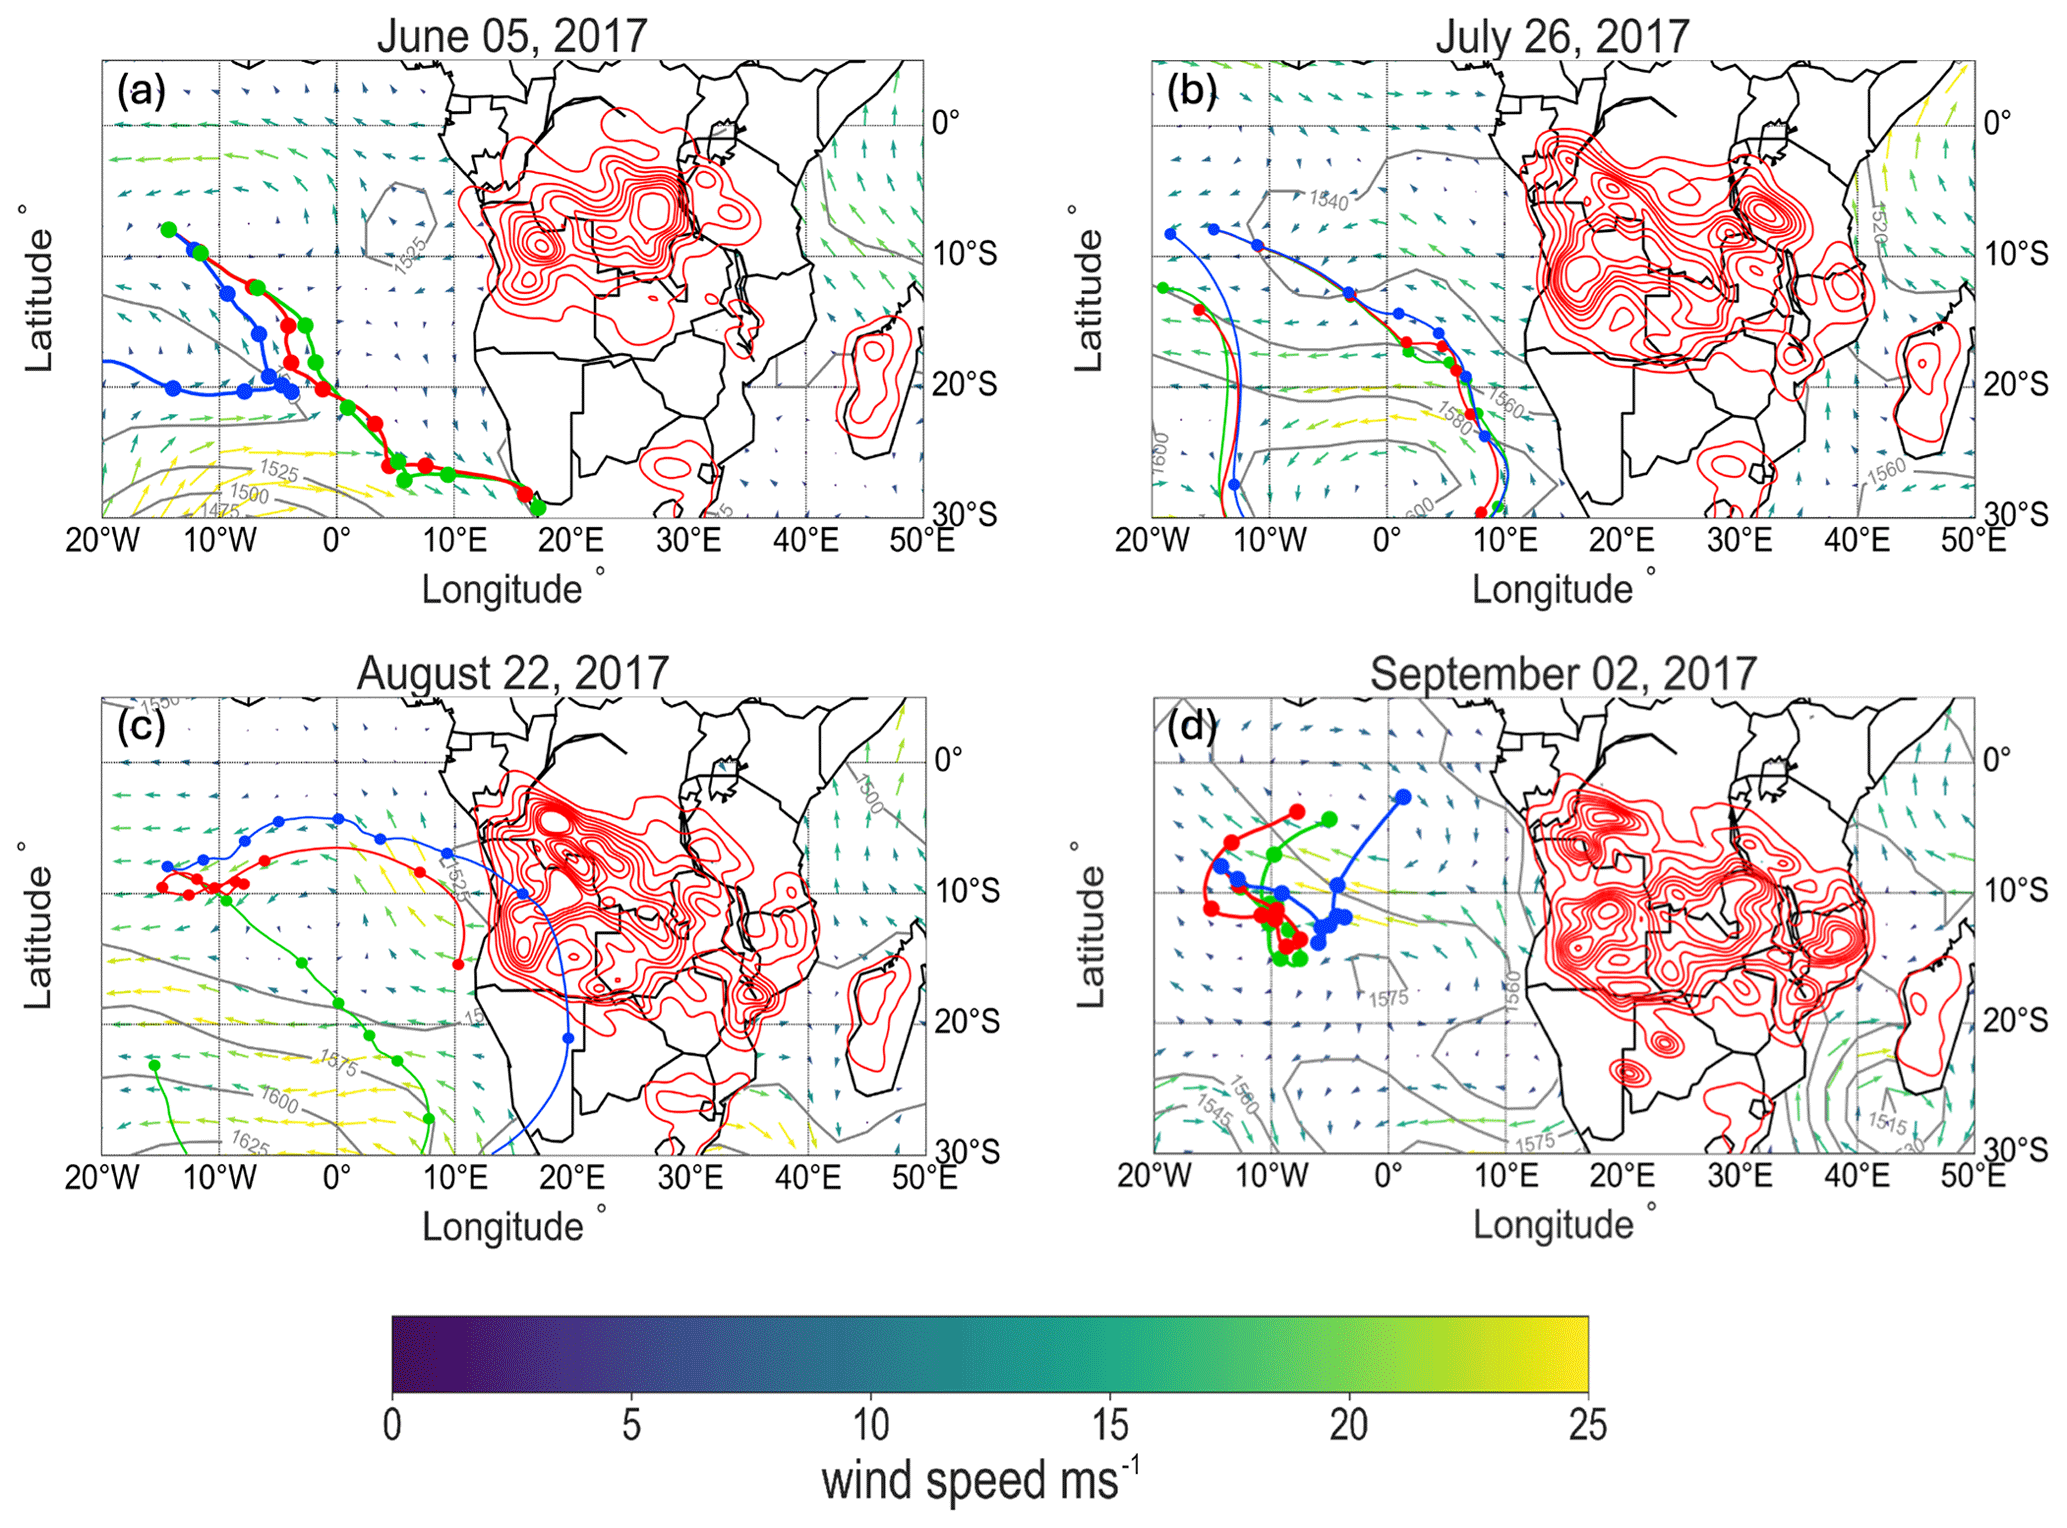
Figure 14HYSPLIT back-trajectories at 800 m (red), 1100 m (blue), and 1400 m (green) above sea level for clean days initiated at 12:00 UTC for clean days in (e) 5 June 2017, (f) 26 July 2017, (g) 22 August 2017, and (h) 14 September 2017. Each filled colored circle represents the trajectory location at 00:00 UTC after initiation. Solid grey lines represented NCEP reanalysis geopotential height at 850 hPa. Wind direction and magnitude are represented by arrows colored by wind speed (0–25 m s−1). Fire density is shown as red contours for total fires 2 weeks prior to the initiation date.
In June, the BBA transport to Ascension Island occurred mostly near 850 hPa, in the upper levels of the MBL, with a transit time of approximately 10 d. The lack of a southeast Atlantic sea level pressure high near the African continent allows a direct if slow westward movement of BBA. Back-trajectories from 24 June (Fig. 13a) demonstrate the BBA originated from northern Angola and the southern region of the DRC, in agreement with the conclusion above based on fire density maps (Fig. 3a). Additional HYSPLIT back-trajectories (not shown) highlight that P2 with the anomalously low rBC : ΔCO ratio also originated from northern Angola, which suggests that the source of this plume was likely similar to those from the other four plume events in this regime.
The BBA transport in late July also occurred near 850 hPa, but because the MBL was shallower than in June (Zhang and Zuidema, 2021), more of the transport may have occurred in the lower FT, with the BBA later becoming entrained into the MBL further away from the continent. The transport took less time (∼ 8 d) because of stronger winds further south near 20° S (Fig. 13b), despite most of the fires being located more inland in central Africa near southern Angola and from the central region of the DRC, similar to the monthly mean fire density maps (Fig. 4a). The BBA transport in early August was similar, also occurring near 850 hPa and requiring ∼ 8 d. However, the fire locations shifted further south and east to southern Angola and western Zambia (Fig. 13c), as also seen on the fire density maps (Fig. 5a).
The African Easterly Jet-South became active after 20 August, causing a dramatic switch in the BBA transport to much higher values in the FT near 700 hPa (Ryoo et al., 2022). This would imply that little BBA was transported to the MBL at Ascension Island, despite more African fires occurring in September than in any other month (Fig. 5a). Nevertheless, one last BBA-laden episode was observed in early September (Fig. 12d). The back-trajectories on 11 September suggest that the BBA may have arrived after ∼ 8 d from fires originating in Mozambique and the DRC. This last plume event is further investigated in Sect. 5.1.
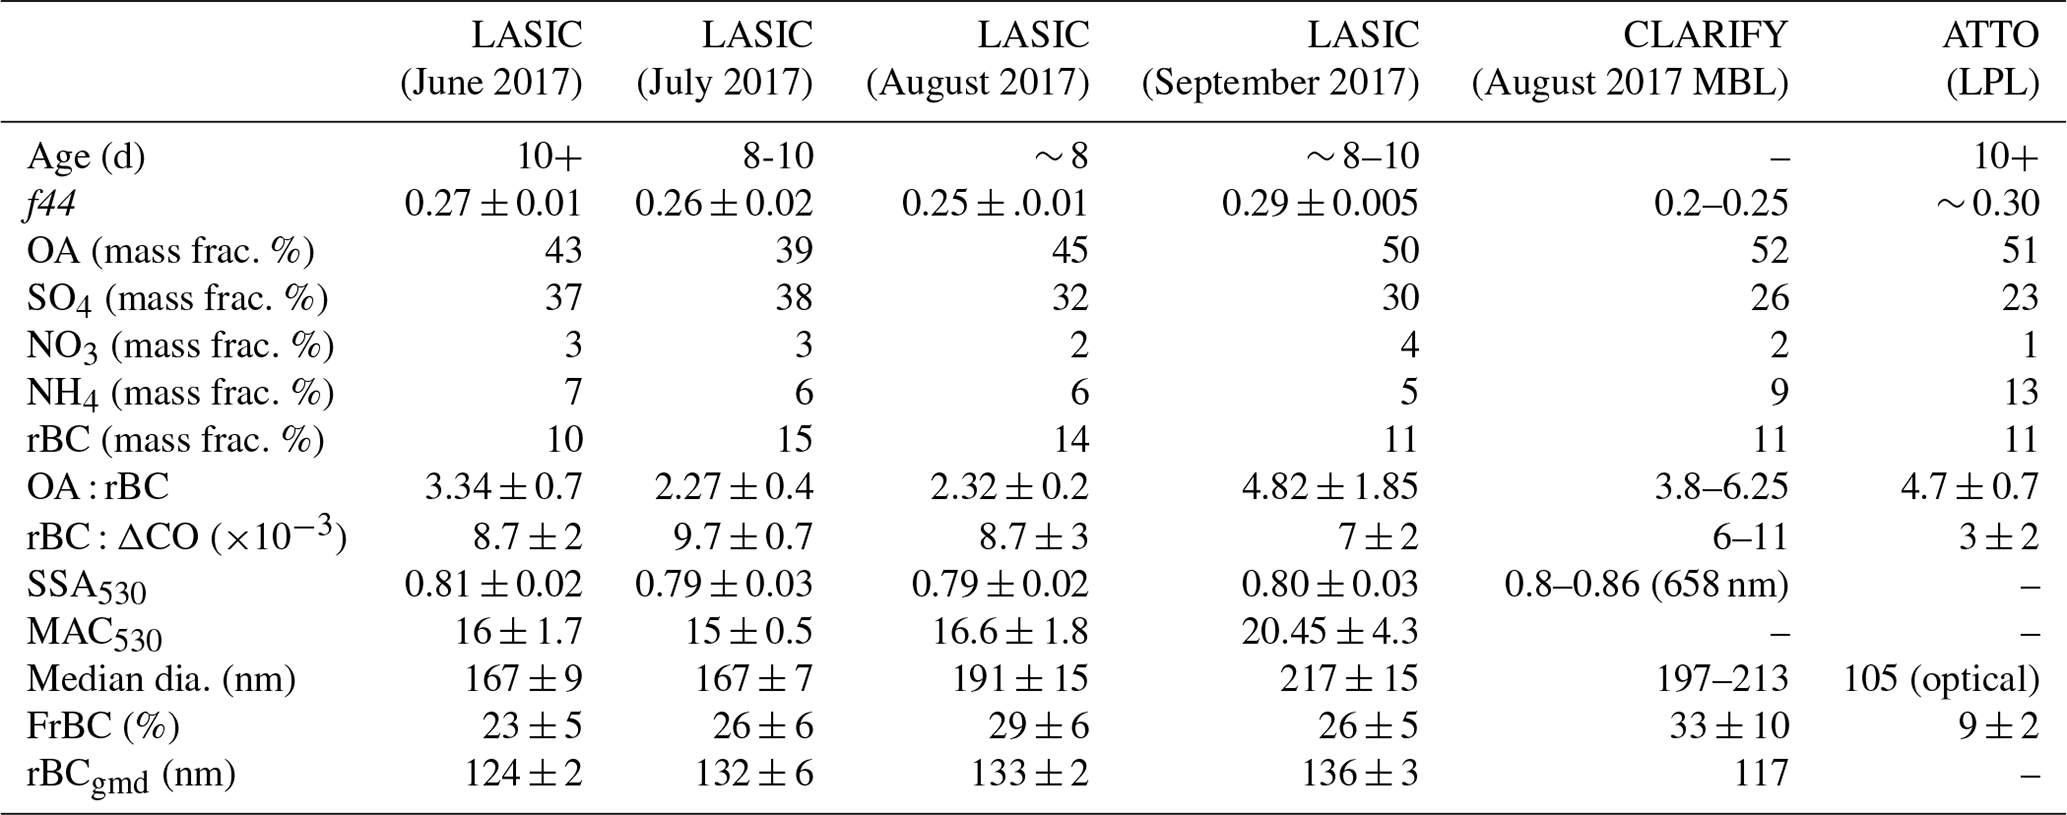
The continuous sampling of BBA in the MBL during the LASIC campaign provides a unique opportunity to characterize the evolution of the African BBA properties across the biomass-burning season. We first describe how burning conditions and fuel type, as inferred from rBC : ΔCO (Sect. 3.1), affect the microphysical and chemical properties of BBA. We then discuss how heterogeneous oxidation and evaporation, along with transport pathways and aqueous-phase processes, alter the composition and masses of the BBA particles by the time they reach the Ascension Island MBL. Last, we examine the dependence of SSA530 on the chemical properties of the BBA and explain why the BBA in the MBL has a lower SSA530 than that in the FT. Throughout this discussion, we also compare our results to those from the ORACLES and CLARIFY campaigns, which sampled African BBA in the FT and MBL between the African coast and Ascension Island, and those from the Amazon Tall Tower Observatory (ATTO) site (Holanda et al., 2020, 2023), which sampled African BBA in Brazil, beyond Ascension Island, in September 2014. These comparisons are summarized in Table 5 and are discussed further below.
Table 5Field campaign comparison table (mean ± standard deviation).
4.1 Dependence of BBA properties on burning conditions and fuel type
In this section, we discuss how burning conditions and fuel types change across the three temporal regimes and how these changes may affect BBA properties such as FrBC, rBC coating-to-core mass ratios, and OA : rBC and ΔSO4 : rBC mass ratios. These analyses offer further BBA characterization than what has typically been presented for biomass-burning events. However, given the limited data set, we cannot definitively describe conditions over land and instead rely on supporting data from previous studies in this region to interpret the observed patterns.
The mean rBC : ΔCO values in Regime 1 were smaller than 0.01, indicating that the fires across the woodlands and savannas of Angola and the southern DRC were inefficient, as concluded above (Figs. 3a and 13a). The high OA : rBC and ΔSO4 : rBC ratios sampled in this regime had elevated f44 values and extended transport times, which support the interpretation that inefficient fires at the source may have emitted greater amounts of OA relative to rBC. The BBA in this regime also had large rBC coating-to-core mass ratios and low FrBC (Sect. 3.2–3.3; Figs. 6–7). These results are consistent with those from the Southern African Regional Science Initiative 2000 campaign (SAFARI 2000; Sinha et al., 2004), which demonstrated that woodland fires across central Africa are inefficient, emitting approximately 3 times as much OA mass as rBC mass.
The mean rBC : ΔCO values in Regime 2 were greater than 0.01, indicating that fires across the grasslands of Angola, the DRC, and Zambia were efficient, as concluded above (Figs. 4a, 13b). The low OA : rBC and ΔSO4 : rBC values sampled in this regime had lower f44 values and faster transport times, which support the interpretation that efficient fires at the source may have emitted less OA relative to rBC. In contrast to BBA properties from Regime 1, the BBA from efficient fires in this regime had small coating-to-core mass ratios, high FrBC, and low ΔSO4 : rBC values (Sect. 3.2–3.3; Figs. 6–7). These results are also consistent with those from the SAFARI 2000 campaign, which showed that burning conditions became more efficient as the soil moisture content across Zambia decreased by 80 % between June and August and rBC emissions increased relative to those of OA (Hoffa et al., 1999; Korontzi et al., 2003).
The mean rBC : ΔCO values in Regime 3 were smaller than 0.01, indicating that the fires across the DRC and Mozambique were inefficient, as concluded above (Figs. 5a and 13c–d). However, the low OA : rBC values, low ΔSO4 : rBC values, and high FrBC observed during P9 (late August) suggest that BBA during this plume event originated from efficient fires. A similar discrepancy is seen in P10 (early September), where high OA : rBC, large rBC coating-to-core mass ratios, and high ΔSO4 : rBC would suggest that the fires were inefficient, while the high FrBC would indicate that the fires were efficient. These conflicting results imply that despite the overall low rBC : ΔCO values in Regime 3, the BBA from earlier in this regime likely resulted from efficient fires across central African grasslands, whereas the BBA from later in this regime likely resulted from both efficient fires across the grasslands and inefficient fires near the eastern coast (Jiang et al., 2020). These intriguing BBA properties observed in early September are further investigated in Sect. 5.1. Overall, the efficient fires in late August and the combination of efficient and inefficient fires in September are consistent with observations reported by Che et al. (2022a), who concluded that burning conditions in this region become less efficient as cloud cover increases, precipitation increases, surface wind speed decreases, and soil moisture increases from August to October.
4.2 Black carbon core size properties
Average rBCmpd values from the current study generally compare well with those from other studies in this region (Fig. 6). The average rBCmpd value of 180 nm observed in the MBL in August during the CLARIFY campaign is slightly smaller (although still within instrument uncertainty) than the corresponding LASIC value of 200 nm, while the average rBCmpd value of 200 nm observed in the FT closer to the African coast in September during the ORACLES campaign (Dobracki et al., 2023) is the same as that sampled during LASIC at this time. The average rBCmpd value of 238 nm sampled at the ATTO site, further west, in September 2014, was considerably larger than that sampled between the African coast and Ascension Island during LASIC, CLARIFY, and ORACLES (Fig. 6). Explanations include differences in burning conditions and fuel types, which seems less likely than a combination of burning and meteorological conditions that select for larger rBC (Adebiyi and Zuidema, 2016), possibly enhanced by opportunities for the coagulation of rBC cores over the ∼ 10 d transport time. The rBCgpd and rBCmpd increased between June and September, with the largest values of 140 and 210 nm, respectively, occurring when the rBC : ΔCO mass ratio was the highest (0.011) in P7 (late July). This suggests that efficient fires produce either larger rBC core diameters or more and smaller rBC particles that coagulate to form larger rBC particles as the BBA undergoes long-range transport (Pan et al., 2017). However, large rBCgpd and rBCmpd values of 135 and 205 nm, respectively, were also observed during Regime 3, in late August and early September when burning conditions were less efficient (rBC : ΔCO = 0.007). These results are consistent with Holder et al. (2016), who conclude that woodier inefficient fires across the southeast United States emit larger rBC particles than those from efficient grassland fires. Yet, smaller rBCgpd and rBCmpd values in Regime 1 (125 and 195 nm) occurred when fires were also less efficient (rBC : ΔCO = 0.008), which is contradictory to the higher values of rBCgpd and rBCmpd in Regime 3 that support Holder et al. (2016). These contrasting results suggest that further research is needed on the dependence of rBC core diameters on burning conditions and fuel types.
4.3 Heterogeneous oxidation as an aerosol mass removal mechanism in the MBL
The evolutions of f44 and f60 help to quantify changes in aerosol chemical composition from heterogeneous and aqueous-phase oxidation and thus to determine if heterogeneous oxidation is a dominant chemical process that can explain the low mass ratios of OA : rBC (Fig. 9a). In fresh BBA, f44 values are typically near 0.05, and those of f60 are typically near 0.04 (Cubison et al., 2011; Garofalo et al., 2019). Heterogeneous oxidation can increase f44 through the formation of carboxylic acid groups and decrease f60 through the fragmentation of levoglucosan (C6H10O5) (Ng et al., 2011b; Canonaco et al., 2015). Heterogeneous oxidation can also fragment carbon–carbon bonds in the OA, allowing the smaller fragments to subsequently evaporate because of the higher vapor pressure of compounds with lower molecular weight (Kroll et al., 2009, 2015).
ORACLES data show f44 increasing from 0.18 to 0.22 and f60 decreasing from 0.006 to 0.004 after 4 to 6 d of transport in the free troposphere (Fig. 15; Dobracki et al., 2023). This study also shows f44 increasing and f60 decreasing with increasing transport time. Plumes that were 8 d old at Ascension Island had f44 values near 0.24 and f60 values near 0.005, whereas f44 values for 10 d old plumes, occurring in June, were near 0.29, and f60 values were lower and near 0.003 (Fig. 15). The coupled temporal increase in f44 and decrease in f60 with the increasing transport time observed in both the ORACLES and the LASIC campaigns demonstrate that heterogeneous oxidation may still be continuing for up to 10 d, with contributions from aqueous-phase oxidation as discussed in Sect. 4.4. This result is particularly noteworthy because, to date, few studies have observed evolution in f44 for times greater than a few hours (see also Che et al., 2022b; Dang et al., 2022).
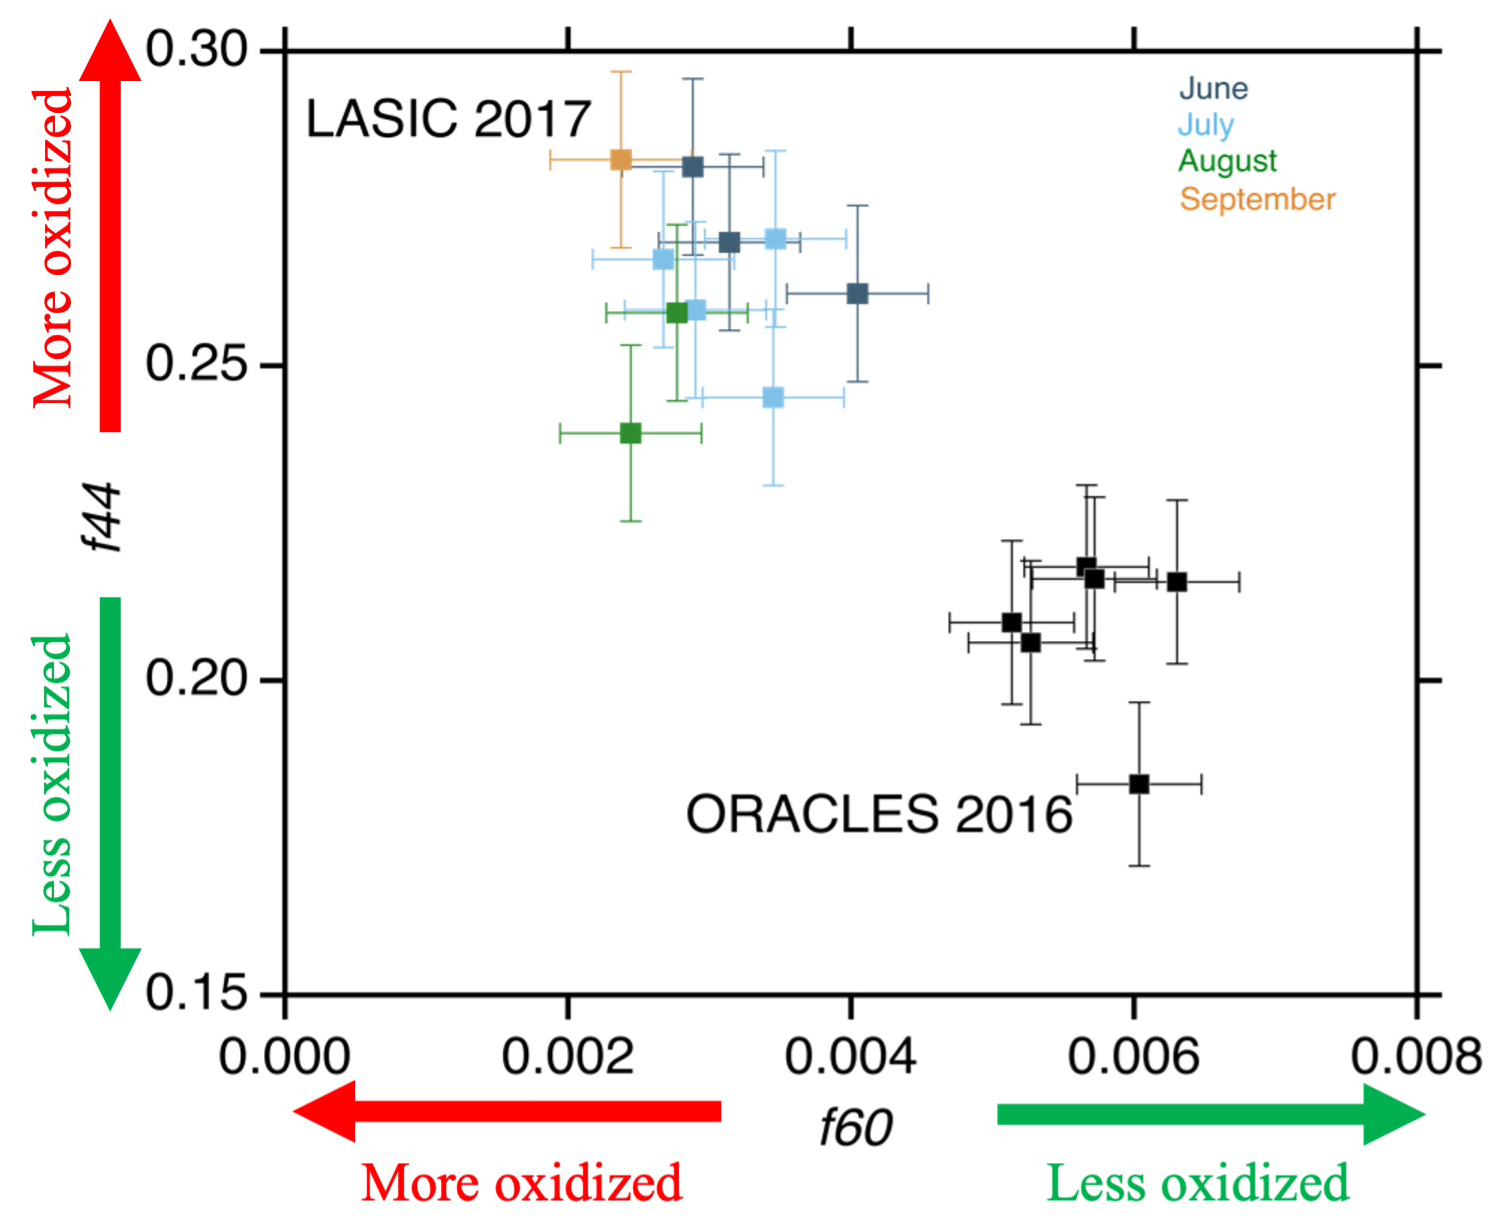
Figure 15f44 versus f60 with LASIC plume event data (filled squares), colored by month, and ORACLES 2016 level flight average data, where OA > 20µg m−3 (black squares) (Dobracki et al., 2023). Error bars represent the standard deviation in the data set.
Changes in f44 and f60 indicate that oxidation has occurred but do not capture simultaneous loss of OA with transport time and oxidation. Fragmentation has previously been invoked to explain why OA : rBC mass ratios decrease by 30% in the FT between the African coast and the ORACLES sampling locations (Dobracki et al., 2023). Here, the relationship between changes in f44 and in the OA : rBC mass ratio during the ORACLES, CLARIFY, and LASIC campaigns and at the ATTO site is used to determine the extent of OA mass loss caused by heterogeneous oxidation across the SEA (Fig. 16). f44 values were typically near 0.18, and OA : rBC values were near 8 for BBA sampled near the African coast during the ORACLES campaign (Dobracki et al., 2023). f44 values were greater than 0.22 and OA : rBC values were smaller than 5 for BBA sampled in the FT and MBL near Ascension Island (Wu et al., 2020; Dang et al., 2022). f44 values increase further to near 0.30, while OA : rBC values decrease to values smaller than 2.5 for BBA sampled at the ATTO site in Brazil (Holanda et al., 2020). The BBA sampled at ATTO was transported primarily within the FT, facilitated by the southern African Easterly Jet, resulting in rapid transport at higher altitudes. As a result, the BBA reached Brazil in a similar time frame to Ascension Island, which likely explains the similarities in f44 and OA : rBC values between the two studies. Notably, the lower pollution layer (LPL) in their study corresponds to the lower FT and not the MBL. As removal through precipitation does not occur in the southeast Atlantic free troposphere during the June–September time period (Adebiyi et al., 2015), these results suggest that heterogeneous oxidation is likely the primary process causing a loss of OA across the SEA and that it continues to occur at timescales longer than 4 d. Loss of OA mass, also attributed to heterogeneous oxidation, is also evident in decreasing rBC coating-to-core mass ratios with increasing transport time (Sedlacek et al., 2022).
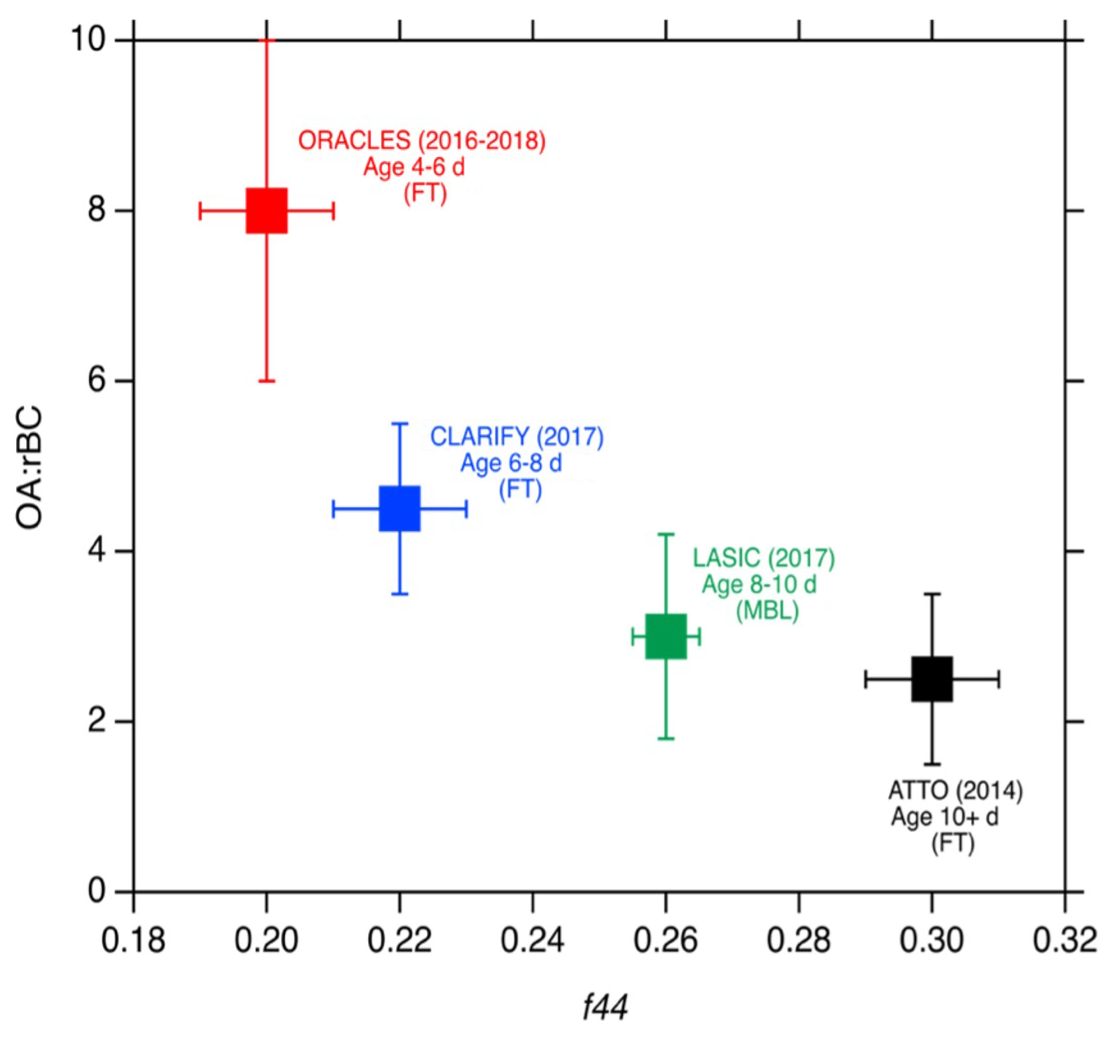
Figure 16OA : rBC versus f44 for the FT during ORACLES (2016–2018) (red), CLARIFY FT (2017) (blue) (Wu et al., 2020), ATTO (2014) (black) (Holanda et al., 2020), and for the LASIC MBL (2017) (green). Error bars represent the standard deviation in the data set.
The rBC coating-to-core mass ratios between 2 and 4 observed during LASIC were also much lower than the values between 5 and 10 observed in the FT for African BBA aged between 7 and 10 d (Sedlacek et al., 2022). This indicates that most of the coating had been removed by the time the BBA reaches Ascension Island.
One other aerosol removal mechanism we consider in the MBL is through thermodynamic evaporation. Results from the ORACLES campaign found OA : rBC decreases from only 14.5 ± 2.6 to 11.7 ± 1.9 as the air temperature increased from 5 to 35 °C (Fig. S6), suggesting that some thermodynamic evaporation may contribute to OA mass loss. Given that MBL air temperatures remain between 20 and 25 °C, evaporation is likely not an important loss mechanism. Another reason why the OA : rBC ratio is substantially lower in the MBL than in the FT may be higher relative humidities in the MBL encourage faster heterogeneous oxidation (fragmentation) (Wong et al., 2015; Li et al., 2018). Ascension Island RH regularly exceeds 65 % (Zhang and Zuidema., 2021). During ORACLES, however, OA : rBC mass ratios are 10 % greater when RH is greater than 60 % (Dobracki et al., 2023), again suggesting that humidity-induced oxidation may not be dominating. We next consider aqueous-phase processing.
4.4 Aqueous-phase processes and aerosol transport pathways are powerful determinants of aerosol size distributions, f44, and ΔSO4 variability
BBA in the MBL has the opportunity to directly interact with the semi-permanent deck of marine stratocumulus clouds between the African coast and Ascension Island during its transit. These aerosol–cloud interactions could encourage a net loss of BBA through wet removal (the formation of cloud droplets subsequently removed by precipitation). A previous comparison of the BBA size distributions in the FT and in the MBL near Ascension Island does not indicate a preferential removal of larger particles, as expected during precipitation events (Wu et al., 2020). Instead, non-precipitating aerosol–cloud interactions can alter the chemical and the physical properties of the BBA. For example, oxidants such as OH, commonly found in high concentrations in cloud drops, can increase f44 (McNeill et al., 2015) and alter aerosol composition. Additionally, OA and ΔSO4 and their gaseous precursors can interact with H2O2 within cloud drops to form an additional aerosol mass (Yang et al., 2011; Bianco et al., 2020). Here, we use the aerosol size distributions, transport pathways, and values of f44 to explore the extent to which aqueous-phase processes may have occurred and contributed to additional OA loss, thus also helping to explain the low OA : rBC values.
The BBA size distributions observed in the MBL were monomodal, weakly bimodal, or distinctly bimodal, whereas the BBA size distributions observed in the FT were uniformly monomodal and broad, with most of the particles having diameters greater than 100 nm but with a small fraction of particles having diameters less than 60 nm (Kacarab et al., 2020; Howell et al., 2021; Dobracki et al., 2023). The monomodal BBA size distributions in the MBL indicate that this BBA likely had not interacted with marine clouds. The weakly bimodal BBA size distributions with indistinct Hoppel minima in the MBL (Fig. 11) indicate that this BBA had undergone insufficient processing to fully alter the shape of the distinctly bimodal background aerosol size distributions (Atwood et al., 2020). Last, the distinctly bimodal BBA size distributions with pronounced Hoppel minima (Figs. 11 and S4) suggest that this BBA had undergone interactions with clouds.
Regime 1 was dominated by bimodal aerosol size distributions, which, along with inferred transport pathways, high f44 values, and high ΔSO4 : rBC mass ratios, suggest BBA that had undergone appreciable cloud processing. The BBA transport was the slowest of the three regimes and, because upper-level FT winds were still weak, likely confined the BBA to the deeper MBL (Zhang and Zuidema, 2021). These conditions allow more time for interaction with clouds. The highest fraction of activated aerosol particles occurred during this time (Zuidema et al., 2018), consistent with larger accumulation mode aerosol (Dedrick et al., 2024). Relatively high f44 values (Fig. 10) suggest some oxidation also occurred through aqueous-phase processing (Giorio et al., 2017; Che et al., 2022b). The ΔSO4 : rBC mass ratios were also the highest during Regime 1, consistent with more conversion of SO2 gas (co-emitted with the BBA) into SO4 aerosol within cloud drops (Yang et al., 2011; Bianco et al., 2020). These observations support the conclusion that the BBA in this regime likely experienced cloud oxidation and additional aqueous-phase aerosol production.
Thereafter, fewer and less distinct bimodal aerosol size distributions, faster transport pathways, lower f44 values, and lower ΔSO4 : rBC mass ratios in Regime 2 indicate that the BBA has undergone less cloud processing than in Regime 1. The MBL is also slightly shallower (Zhang and Zuidema, 2021), allowing the BBA to remain in the FT for longer. These conditions discourage opportunities for aerosol–cloud microphysical interactions, despite a cloud fraction near Ascension Island (Zhang and Zuidema, 2021). Values of f44 and ΔSO4 : rBC in Regime 2 were lower than those in Regime 1, also indicating less additional oxidation through aqueous-phase processing.
During Regime 3, mostly monomodal aerosol size distributions, faster transport pathways in the FT, lower f44 values, and lower ΔSO4 : rBC mass ratios suggest that the BBA has not undergone extensive cloud processing. BBA is more likely to be transported above the MBL, in part by stronger FT easterly winds after 20 August, and thereby less likely entrained into the MBL until near Ascension Island (Ryoo et al., 2022). Delayed entrainment into the MBL would result in the BBA replacing the marine aerosol initially, with little mixing.
Cloud processing, which is most active in Regime 1, can also produce small amounts of additional aerosol mass, increasing the mass fractions of OA and ΔSO4 (Ervens et al., 2011; Gilardoni et al., 2016). This may have occurred during Regime 1 for which rBC particles also possess slightly greater coating-to-core mass ratios than in the latter regimes and for which OA : rBC and f44 correlate positively (r2 = 0.61), as do ΔSO4 : rBC and f44 (r2 = 0.58; Fig. S7). However, the correlations between OA : rBC and f44 and between ΔSO4 : rBC and f44 could also have been influenced by differences in aerosol composition at the fire sources and differences in transport pathways. Nevertheless, our conclusions that aqueous-phase processing in non-precipitating clouds oxidizes the OA but does not substantially remove it are consistent with the results of Che et al. (2022b) and numerous laboratory studies (Ervens et al., 2011; Gilardoni et al., 2016). The smaller values of OA : rBC in the MBL compared to the FT, in August, are most likely explained by a combination of longer transport paths allowing for more heterogeneous oxidation, including within clouds.
4.5 SSA530 values in the MBL are best explained by OA : rBC
The SSA530 values in the Ascension Island MBL, between 0.75 and 0.83 (Sect. 3.2.4), are among the lowest in the world from BBA (Eck et al., 2013; Zuidema et al., 2018) and will strengthen the boundary layer semi-direct effect (Zhang and Zuidema, 2019) as a result. These values are even lower (by about 0.07) than those sampled in the FT between the African plateau and Ascension Island during the September 2016 ORACLES campaign. This result is surprising, as the mean background SSA530 value was 0.98 ± 0.01, and mixing with clean marine air should increase SSA530 in the MBL, especially near the surface (Wu et al., 2020). However, the low SSA530 values of ∼ 0.79 across P8–P9 compare relatively well with the polluted MBL SSA550 value of ∼ 0.81 measured during CLARIFY in the polluted MBL for the same time period. This minor difference in SSA can likely be explained by the variations in impactor cutoff sizes between LASIC and CLARIFY (Sect. 2.2; Barrett et al., 2022), where larger particles near the surface may contribute to higher SSA values. The slight reduction in SSA530 from P8 to P9 (Fig. 12) is consistent with the observed increase in rBC fraction from Period 1 to Period 3 during CLARIFY (Wu et al., 2020). Our results further solidify that SSA530 is negatively correlated with FrBC (Fig. 17a) and positively correlated with OA : rBC (Fig. 17b) in the MBL and in the FT between the African plateau and Ascension Island. Moreover, SSA530 is not correlated with the geometric peak diameter of the accumulation mode (Fig. S8) in either the MBL or FT, consistent with Denjean et al. (2020b), using in situ data over the Gulf of Guinea, and Dobracki et al. (2023). FrBC values for the MBL and the FT are almost identical between ORACLES and LASIC, ranging between 0.15 and 0.40, so variations in the FrBC cannot account for the reduced MBL SSA530 values either (Fig. 18a). Instead, one difference is that the OA : rBC mass ratios in the MBL (ranging from 2 to 5) are markedly lower than those in the FT (between 5–15). Of further note is that a robust correlation exists between SSA530 and OA : rBC that applies to both the MBL and FT, namely SSA530 = 0.78 + 0.0077 × OA : rBC (Fig. 18b). This relation is similar to that proposed by Dobracki et al. (2023) for the ORACLES 2016 campaign. The SSA530 dependence on OA : rBC shows that accurate estimates of SSA530 can be obtained from the BBA chemical properties alone.
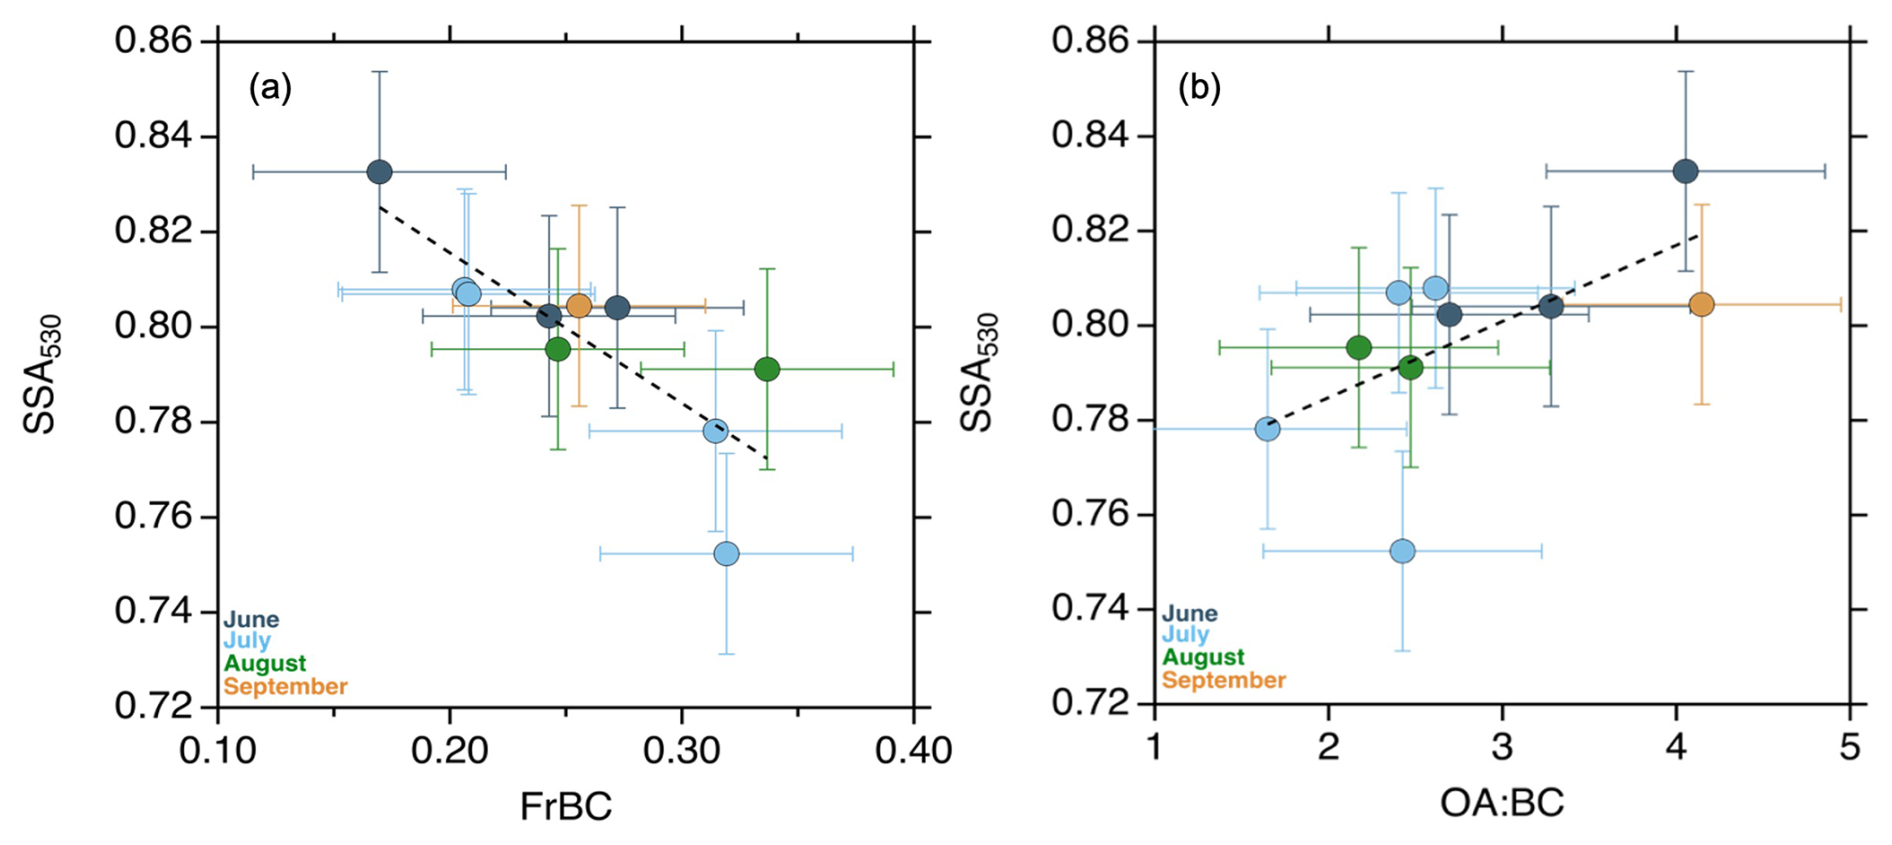
Figure 17(a) SSA530 versus FrBC (b) SSA530 versus OA : rBC. Markers are colored by month, and error bars represent the standard deviation in the data set. The dashed black line is the best-fit line calculated by linear regression analysis. The best-fit line is weighted by µg m−3 min−1.
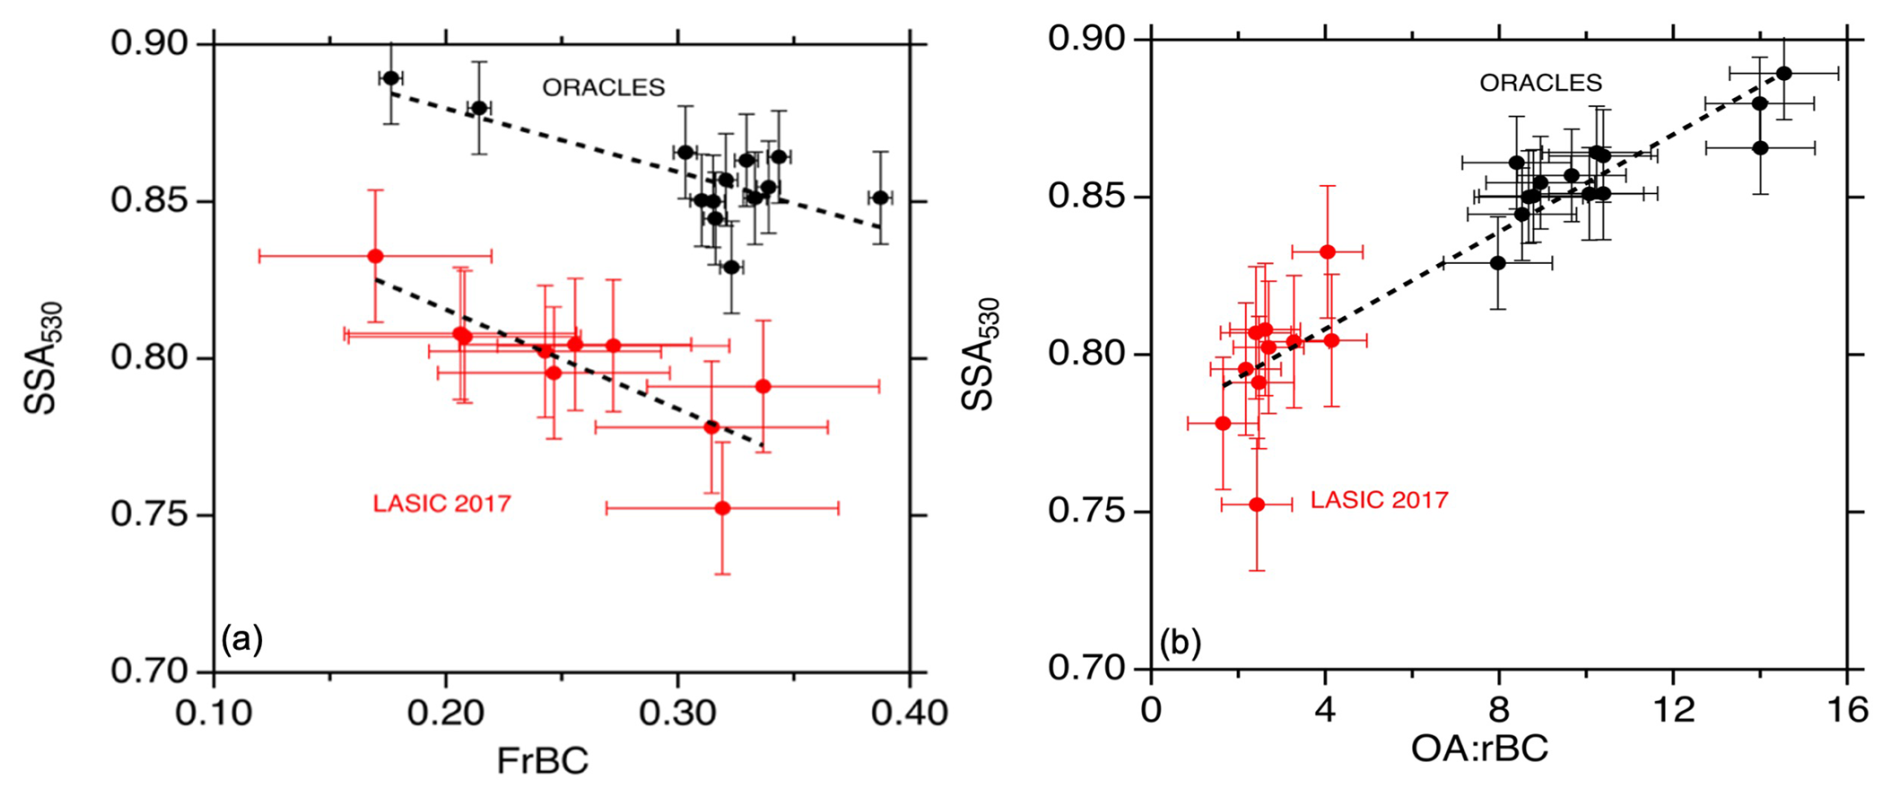
Figure 18(a) SSA530 versus FrBC for ORACLES level leg data (black) (Dobracki et al., 2023) and LASIC 2017 major plume event data (red). (b) SSA530 versus OA : rBC for ORACLES level leg data (black) and LASIC 2017 major plume event data (red). Error bars represent the standard deviation in the data set, and the dashed black line is the best-fit line calculated by linear regression analysis.
5.1 Case study: 6–11 September 2017
The last plume event to reach the MBL at Ascension Island between 6–11 September (P10) is unique in that the BBA originated from efficient fires across central Africa and inefficient fires along the eastern coast of Africa (Sect. 4.1). This plume is notable for possessing large rBC core diameters (Fig. 6), and the largest OA : rBC mass ratio (Fig. 9), f44 values (Fig. 10; factor 2 only), and MAC530 of the 10 plumes.
Additional HYSPLIT back-trajectories (Fig. 19) indicate that the BBA sampled before 10 September may have experienced more time in the FT than that from 1–2 d later by first circulating anticyclonically ∼ 10° to the southeast of Ascension Island in the lower FT (1–2.5 km) before entering the MBL (Fig. 19a), similar to the case discussed in Diamond et al. (2022). The African Easterly Jet-South would have advected the BBA aloft prior to entrainment into the MBL (Ryoo et al., 2022). In contrast, the BBA sampled on 10 September was transported directly westward from the continent (Fig. 19b), potentially from as far away as eastern Africa. This direct westward transport, meteorologically unusual for September (Ryoo et al., 2022), is more likely to occur at lower altitudes (Fig. 13d), and the different source region may explain why the aerosol properties of this plume differed from those from previous times.
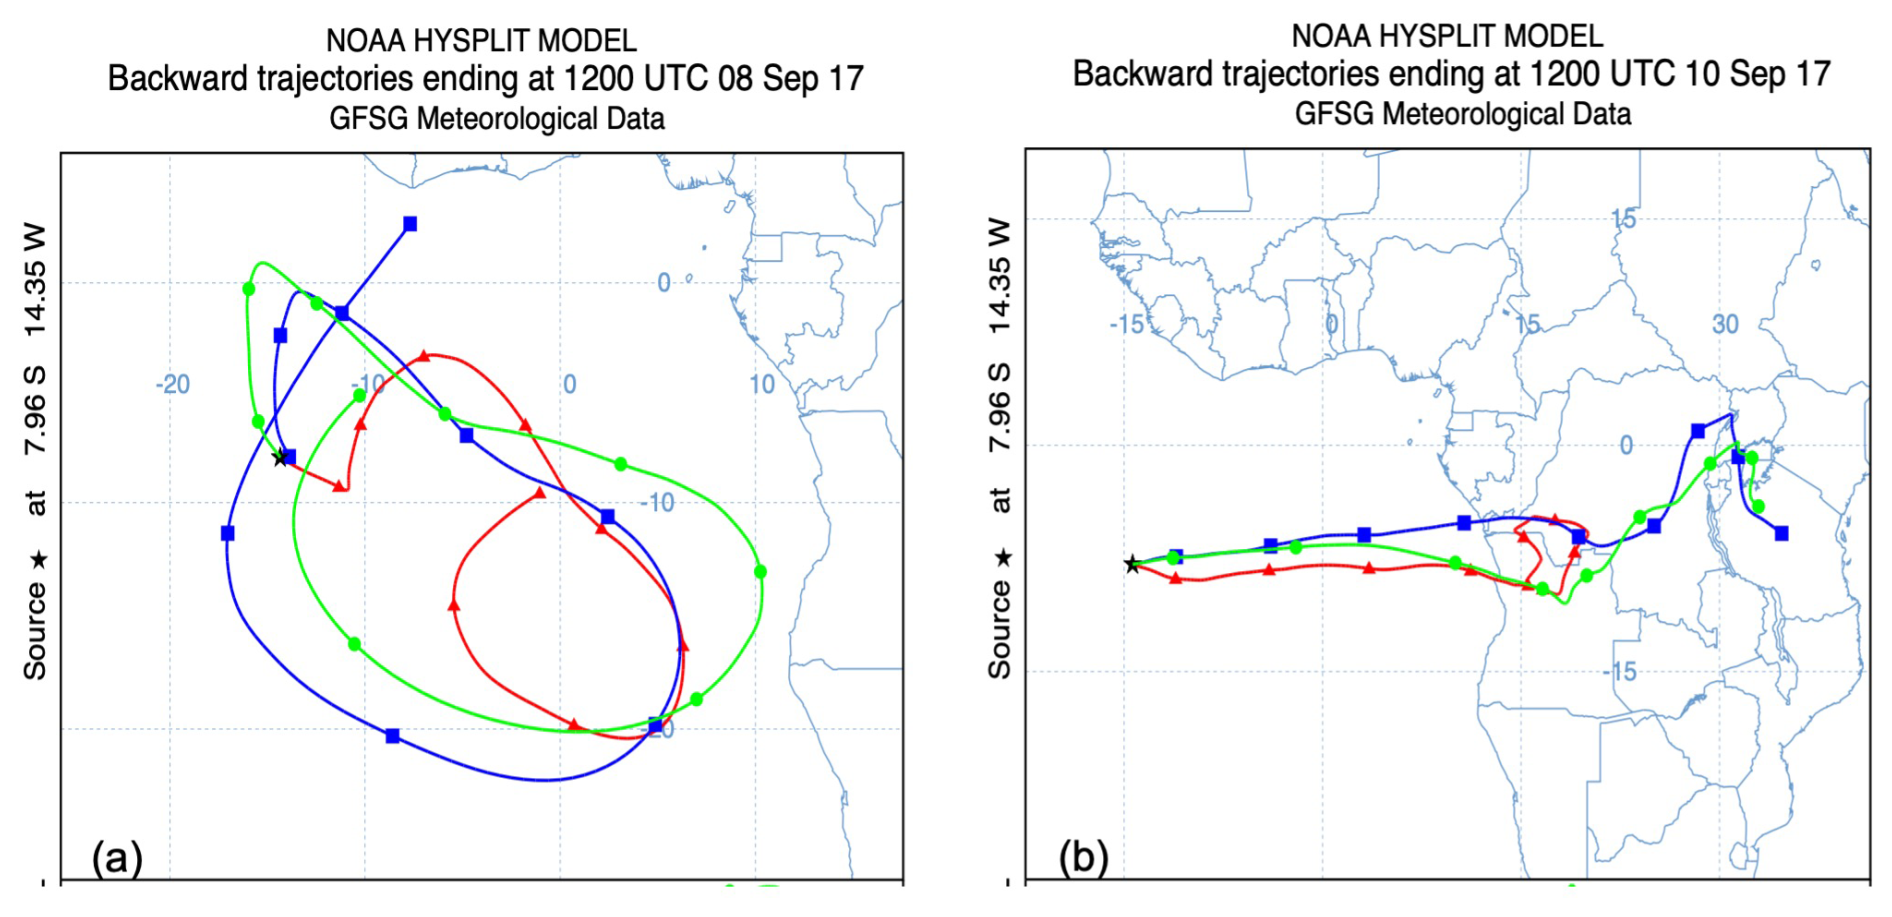
Figure 19The 10 d HYSPLIT back-trajectories at 1000 m (red), 1500 m (blue), and 2500 m (green) on (a) 8 September 2017 at 12:00 UTC and (b) 10 September 2017 at 12:00 UTC.
The high values of rBC : ΔCO (Fig. S9a) and FrBC and the low values of OA : rBC (Fig. S9b) and ΔSO4 : rBC (Fig. S9c) indicate that the BBA sampled before 10 September originated from efficient fires. Lower values of rBC : ΔCO and FrBC paired with the higher values of OA : rBC and ΔSO4 : rBC on 10 September indicate BBA during the last 2 d from inefficient combustion. Although these chemical properties are consistent with inefficient combustion, the optical properties are not. Intuitively, MAC530 would increase with OA : rBC because of greater absorption by particles with larger OA coatings (so-called lensing), while SSA530 would increase with OA : rBC because of relatively more scattering than absorption for either internally or externally mixed aerosol. Instead, we find the opposite relationship. Although the MAC530 did increase from 17.5 to 29.5 m2 g−1 between 7 and 10 September, it decreased to 25 m2 g−1 on 11 September (Fig. S9d). Meanwhile, the SSA530 decreased from 0.835 to 0.785 across the 5 d (Fig. S9e). The highest MAC530 and lowest SSA530 occurred on the day when ΔCO was the highest (Fig. S9f). Overall, MAC530 correlates positively, and SSA530 correlates negatively with ΔCO (Fig. S10), indicating greater absorption and absorptivity by particles more deeply within the smoke plume. We cannot fully explain the underlying processes.
5.2 Aerosol absorption enhancement
The larger analysis of LASIC also brings the typical explanation for the high MAC530 values (> 15 m2 g−1) observed in the Ascension Island MBL, of lensing-enhanced absorption from thick coatings, into question. MAC530 does not correlate with the geometric mean diameter of the accumulation mode determined from the BBA size distributions (Fig. S11) in the presence of more constant rBC core sizes, as also concluded by Denjean et al. (2020b) and Dobracki et al. (2023) for FT aerosol. The high MAC530 values in the FT have been attributed to thick coatings (Taylor et al., 2020; Sedlacek et al., 2022), but rBC-containing particles in the MBL are more thinly coated (Sedlacek et al., 2022).
MAC530 and SSA530 are positively correlated (Fig. S5), indicating that scattering and absorption are enhanced when soot particles are coated with transparent OA and ΔSO4 (Khalizov et al., 2009). In addition, MAC530 and AAE470−660 in the MBL increase with increasing f44 (Figs. 20a–b), suggesting that chemical processing, either through heterogeneous oxidation or aqueous-phase processing, can act to enhance aerosol light absorption, as also shown in Zhang et al. (2018). The increased light absorption resulting from chemical changes must have been small, however, as average AAE470−660 values are near 1 in both the MBL and the FT near Ascension Island, consistent with brown carbon (BrC) contributing less than 10 % to the aerosol absorption (Taylor et al., 2020; Zhang et al., 2022). We conclude that the processes contributing to aerosol absorption enhancement in the MBL are different to those in the FT and require additional study.
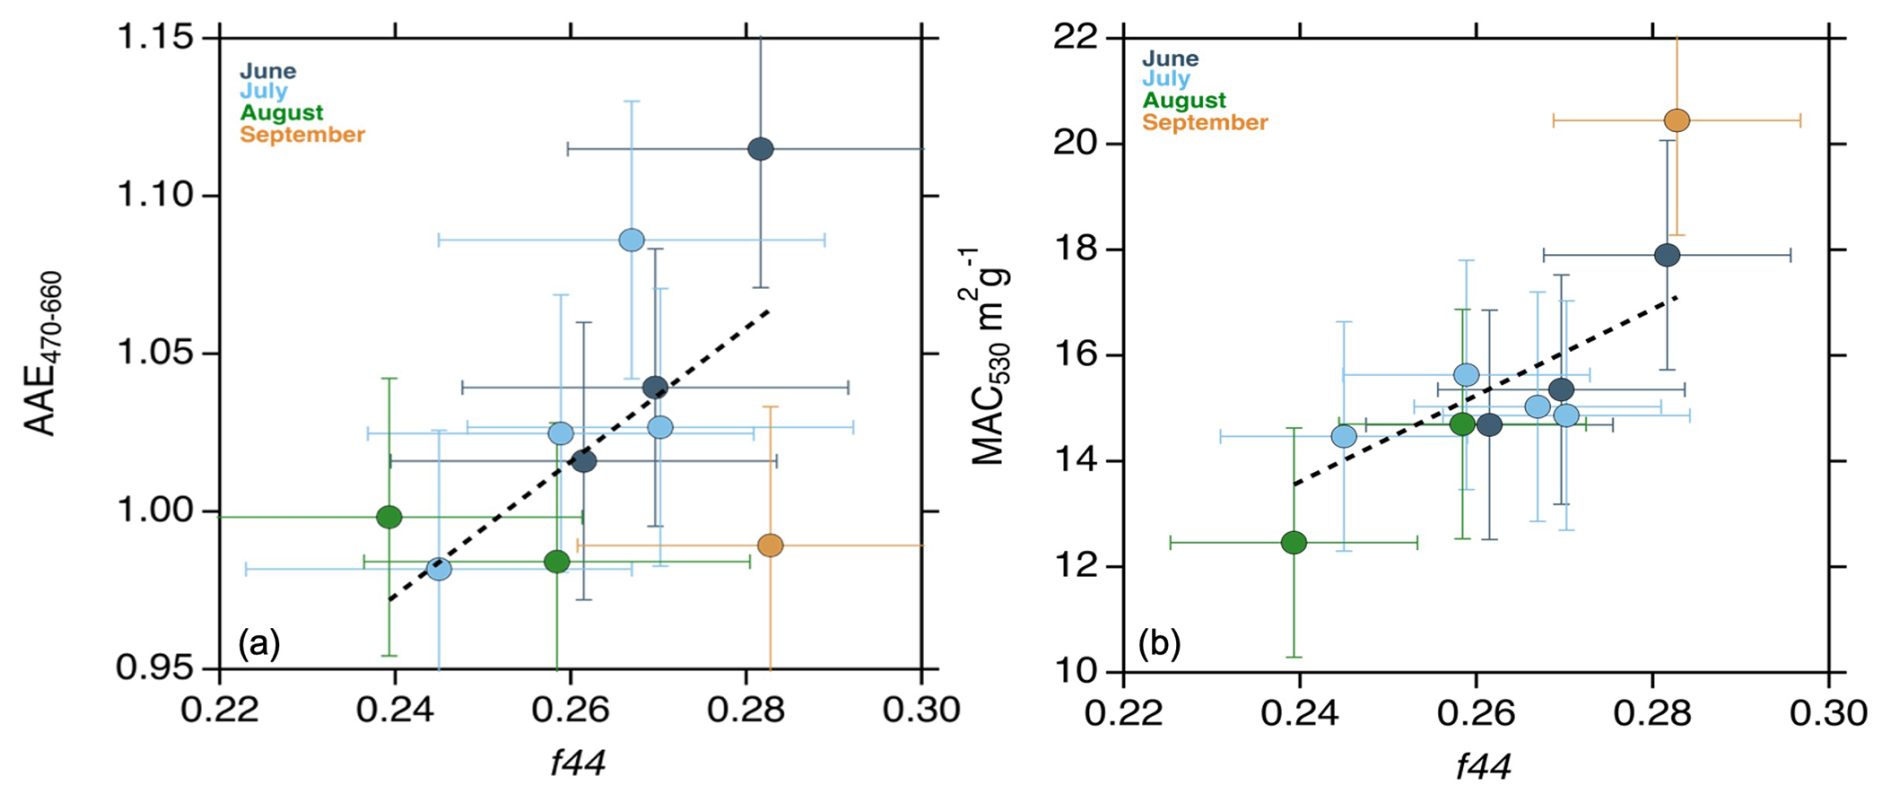
Figure 20(a) AAE470−660 nm versus average f44 for the 10 selected plume events. (b) Average f44 versus MAC530 (m2 g−1) for the 10 selected plume events. Markers are colored by month, and error bars represent the standard deviation in the data set. The dashed black line is the best-fit line calculated by linear regression analysis. The best-fit line is weighted by µg m−3 min−1.
The current analysis focuses solely on 10 specific BBA plumes within the remote MBL of the southeast Atlantic, in contrast to BBA plumes in the FT. The synoptically modulated BBA plumes in the MBL occur from June until early September, before further aerosol transport moves to the free troposphere. BBA in June and early July (Regime 1) contained more OA and ΔSO4 relative to rBC, within primarily bimodal BBA size distributions. These BBA properties resulted from inefficient burning conditions (characterized by rBC : ΔCO mass ratios less than 0.01) combined with a slow westward transport of BBA in the MBL that allowed more time for cloud processing, arguably most notable in the enhanced ΔSO4 mass. The BBA in late July and early August (Regime 2) had lower contributions of OA and ΔSO4 relative to rBC and fewer, broader, bimodal size distributions than those earlier in the season. These BBA properties resulted from efficient burning conditions (characterized by rBC : ΔCO mass ratios greater than 0.01) and from slightly faster transport pathways that were less confined to the MBL, reducing time for aqueous-phase processing. The BBA in late August and early September (Regime 3) had the highest contribution from OA relative to rBC. Mostly monomodal BBA size distributions indicate little mixing with marine air. BBA properties reflect efficient and inefficient burning conditions. These BBA properties resulted from efficient and inefficient burning conditions and aerosol transport pathways being mostly in the FT due to the strong easterly winds during this time that did not allow for many aerosol–cloud interactions.
The BBA transport pathways to Ascension Island in the MBL and lower FT between June and September are slow, overall, and allow not only for heterogeneous oxidation processes but also for aqueous-phase processes. Continuous heterogeneous oxidation processes for up to 10 d contribute to a net loss of OA mass, with the contribution from aqueous-phase processes (in June and July) difficult to distinguish from fuel-type variations. Although f44 values and BBA size distributions suggest that aqueous-phase processing occurred, further effort is required to better quantify the relative contributions of heterogeneous oxidation and aqueous-phase processing on the evolution of BBA.
SSA values measured in the Ascension Island MBL, lower than 0.80, are among the lowest in the world from BBA. The low OA : rBC ratios in the MBL, a consequence of oxidation processes, likely explains these low SSA530 values and is arguably the most striking result of this study. Current global and regional aerosol models typically do not include heterogeneous and aqueous-phase oxidation processes as major aerosol loss mechanisms, but the resulting changes in chemical composition can have substantial effects on aerosol optical properties, demonstrating the need for further effort placed on constraining the loss of OA in the MBL. A remaining puzzle is a strong positive correlation between MAC530 and SSA530, which is not easily explained by lensing effects.
A1 Aerosol sampling inlet
The inlet used in each Aerosol Observing System (AOS) was based on the design from the Environmental Measurements Laboratory (Leifer et al., 1994; Uin et al., 2019). The inlet was positioned 10 m above the ground and drew a flow rate of 1000 L min−1, with 150 L min−1 distributed evenly among five sample lines (Uin et al., 2019). The flow through the sample lines was maintained by bypass flow, with support from a vacuum source and from individual instrument flows on that line (Uin et al., 2019). The bypass flows were measured and monitored by rotameters. Trace gas measurements were sampled through a separate in. (1.27 cm) tube that ran parallel to the main inlet (Uin et al., 2019; Fig. 4). A comprehensive description of the AOS set up and operation within the ARM program is given by Uin et al. (2019).
A2 Aerosol chemical speciation monitor (ACSM)
The aerosol chemical speciation monitor (ACSM; Aerodyne Research Inc.) measures non-refractory particle mass concentrations of organic, nitrate, sulfate, ammonium, and chloride species in real time for particles with aerodynamic diameters between 75 and 650 nm at a 30 min time resolution (ACSM handbook, Watson, 2017). The ACSM has a detection limit of 0.3 µg m−3 (30 min signal average) for organic aerosol, 0.2 µg m−3 for nitrate, 0.4 µg m−3 for sulfate, 0.5 µg m−3 for ammonium, and 0.2 µg m−3 for chloride. The aerosol was drawn in through a sampling pump at 3 L min−1, focused through an aerodynamic lens, impacted on a collector plate kept at 600 °C to vaporize the particles, and then ionized by electron ionization at 70 eV. The ions were analyzed by a quadrupole mass spectrometer which provides unit mass resolution. The ACSM has an uncertainty of 30 %–40 % in mass concentration.
The ACSM was calibrated twice in the field using ammonium nitrate. A misaligned laser filament was replaced in January 2017, and the instrument was re-calibrated. A time- and composition-dependent collection efficiency (CDCE) corrects for the incomplete vaporization of mixed-phase particles (Middlebrook et al., 2012). The CDCE was calculated at each sampling interval using methods from Shilling and Levin (2021). The average CDCE between June and September was 0.54.
A3 Single Particle Soot Photometer (SP2)
The SP2 (Droplet Measurement Technologies) measured time-dependent scattering and incandescence signals from refractory black-carbon-containing particles with aerodynamic diameter between 80 and 500 nm. The SP2 used an eight-channel neodymium-doped yttrium–aluminum–garnet (Nd:YAG) laser (1064 nm) that induced incandescence of the particles to determine rBC mass and number concentrations, Sedlacek, 2017; ARM Handbook). The SP2 was calibrated twice in the field using fullerene soot with an effective density from Gysel et al. (2011). The SP2 has a detection limit of 0.1 µg m−3 with 75 % certainty (May et al., 2014) and a mass uncertainty of ∼ 20 %.
A4 Scanning mobility particle sizer (SMPS)
The scanning mobility particle sizer (SMPS; TSI 3936) determines the size distributions of the number concentration of particles with mobility diameters between 10 and 1000 nm. The SMPS uses a bipolar aerosol charger to establish an equilibrium charge distribution on the aerosol. A long-column differential mobility analyzer (DMA) classifies charged particles according to their electrical mobility. The particle concentration was measured with a condensation particle counter (CPC). The SMPS and CPC were calibrated with certified polystyrene latex (PSL), silver chloride, and sodium chloride particles (Hermann et al., 2007). The SMPS has an uncertainty of 10 %.
A5 Particle Soot Absorption Photometer
The PSAP (Radiance Research) measured optical transmittance through a cellulose filter on which particles were deposited to determine the light absorption at 470, 530, and 660 nm. PSAP data were corrected for loading and scattering effects following the ARM protocol ARM handbook (Virkkula, 2010; Ogren, 2010; Bond et al., 1999).
A6 Nephelometer
The nephelometer (TSI) measured the total light-scattering coefficient and backscatter fraction by aerosol particles at 450, 550, and 700 nm (Anderson and Ogren, 1998). The aerosol optical properties and their derived products incorporate correction algorithms from Bond/Ogren (Bond et al., 1999; extended by Ogren, 2010) and Virkkula (2010), as done previously in Zuidema et al. (2018) and Pistone et al. (2019). Further information can be found in Flynn et al. (2020). The nephelometer deployed at Ascension Island was installed in a series with a drying/humidification system to measure the change in scattering due to water uptake or loss by the particles and has a systematic uncertainty of 10 % (Uin, 2024).
A7 CAPS-SSA
The cavity-attenuated phase shift single-scattering albedo monitor (CAPS-SSA; Aerodyne Research Inc.) was deployed to Ascension Island between 4 August and 22 September 2017. The CAPS-SSA collected 1 s time response measurements of aerosol extinction and scattering. The CAPS-SSA measurement of ambient SSA at 530 nm wavelength (0.78) compared well with SSA530 (0.79) calculated from the PSAP (absorption) and nephelometers (scattering; Fig. A1; Onasch et al., 2015).
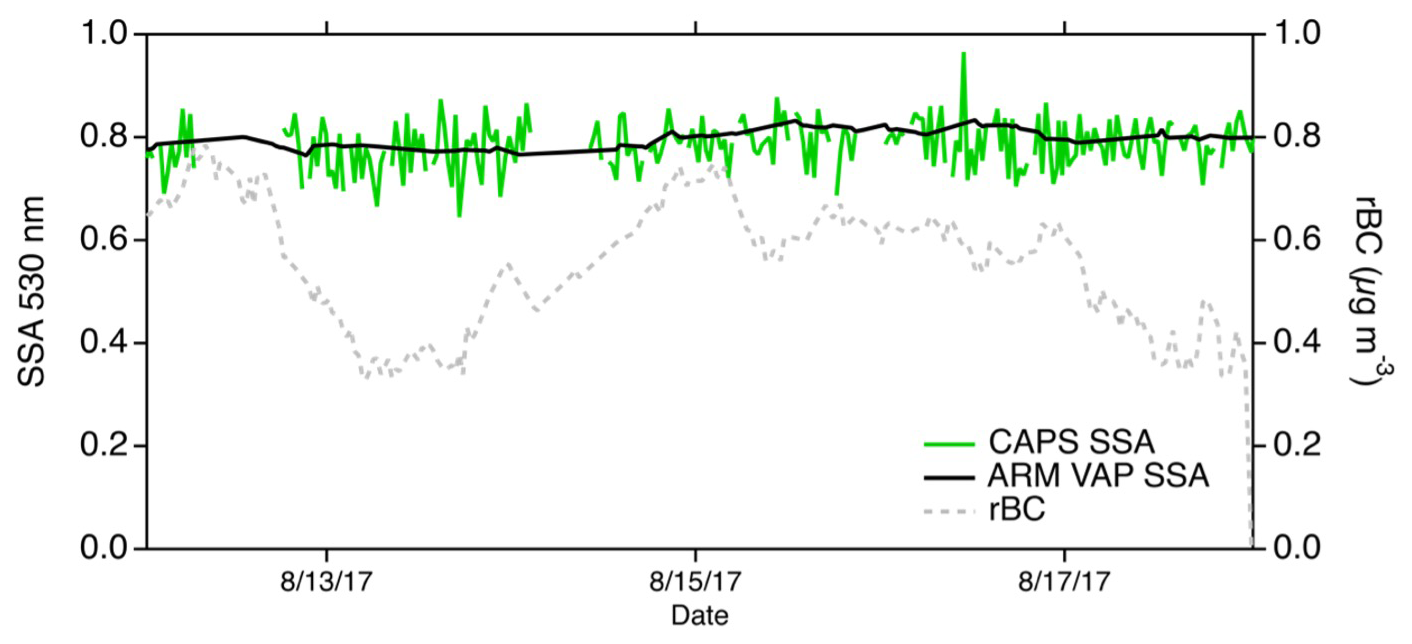
Figure A1SSA530 calculated from the PSAP and nephelometer absorption and scattering coefficients (black) and CAPS-SSA (green). rBC mass concentration (dashed grey line) indicates that this comparison was done in the plume.
A8 CO N2O H2O analyzer
Carbon monoxide, nitrous oxide, and water vapor mixing ratios were measured with a CO N2O H2O analyzer (Los Gatos Research) at 1 s resolution. The measurement precision is 0.05 ppb (parts per billion) under quiet ambient conditions (Springston, 2015). ΔCO was calculated for each month by removing (subtracting) the 5th percentile of the measured CO from the total measured CO. Background values of CO were 50.2 ppb for June, 54.4 ppb for July, 58.8 ppb for August, and 60.2 ppb for September. Methods for calculating ΔCO were adopted from Che et al. (2022a).
B1 Positive matrix factorization (PMF)
A PMF apportions the unit mass resolution data using a bilinear model through a multilinear engine (ME-2). A graphical user interface, Source Finder (SoFi), developed at the Paul Scherrer Institute, was run using Igor Pro (WaveMetrics v8) to facilitate the testing of different rotational techniques within the ME-2 (Canonaco et al., 2013; Crippa et al., 2014; Zhu et al., 2018; Canonaco et al., 2021). The PMF results in this paper were obtained by running 400–1000 clusters of the unit–mass resolution data from the 10 major plume events with SoFi through Igor Pro (v8). The clusters were then analyzed using a k-means statistical function to find clusters of a comparable spatial extent. The average mass spectra result of the clusters presented two factors of source- and process-related apportionments.
B2 SSA530 and MAC530 calculations
The single-scattering albedo (SSA) is defined as the ratio of the (light-) scattering coefficient to the sum of the absorption and scattering coefficients. The absorption Ångström exponent (AAE) describes the spectral dependence of light absorption on aerosols (Helin et al., 2021) and is calculated from the linear fit of log(σa) to log(λ). The MAC530 was calculated by dividing the absorption coefficient at 530 nm by the rBC mass concentration determined by the SP2.
The cavity-attenuated phase shift (CAPS) extinction monitor (Aerodyne Research Inc.) was deployed in August 2017 to measure aerosol extinction (Sedlacek, 2017). The calculated SSA530 from the ARM VAP file agrees well with the SSA530 from CAPS during smoky periods (Fig. A1), indicating that the assumed corrections to the PSAP and nephelometers are appropriate in the MBL, where there could be a large presence of sea salt particles.
B3 ACSM volume comparison
The total volume concentration calculated using the size distribution from the SMPS was compared to the sum of the volume concentrations from the ACSM and SP2, calculated for each substance as the mass concentration divided by the density the bulk species based on the mass fraction of each species (OA, SO4, NO3, NH4, and rBC). The values of the densities of most of the primary substances measured by the ACSM are well established (nitrate is ρ = 1.72 g cm−3, sulfate and ammonium are ρ = 1.77 g cm−3, and chloride is ρ = 1.35 g cm−3; Nakao et al., 2013); however, values for OA between 0.8 and 1.8 g cm−3 have been reported. Some of this range is due to differences in the chemical composition of the individual organic species and some from the age of the OA, with values of aged OA being typically less than those of freshly emitted OA (Rudich et al., 2007; Denjean et al., 2020b). Here a density of 0.9 g cm−3 for OA was assumed, as aging metrics suggest that the aerosol at Ascension Island is highly aged (greater than 7 d old; Sect. 3.2.3). The volume concentration calculated as the sum of those determined by the SMPS agrees with that determined from the ACSM and SP2 to within 30 % (Fig. A2), which is roughly the sampling error expected for the latter two instruments.
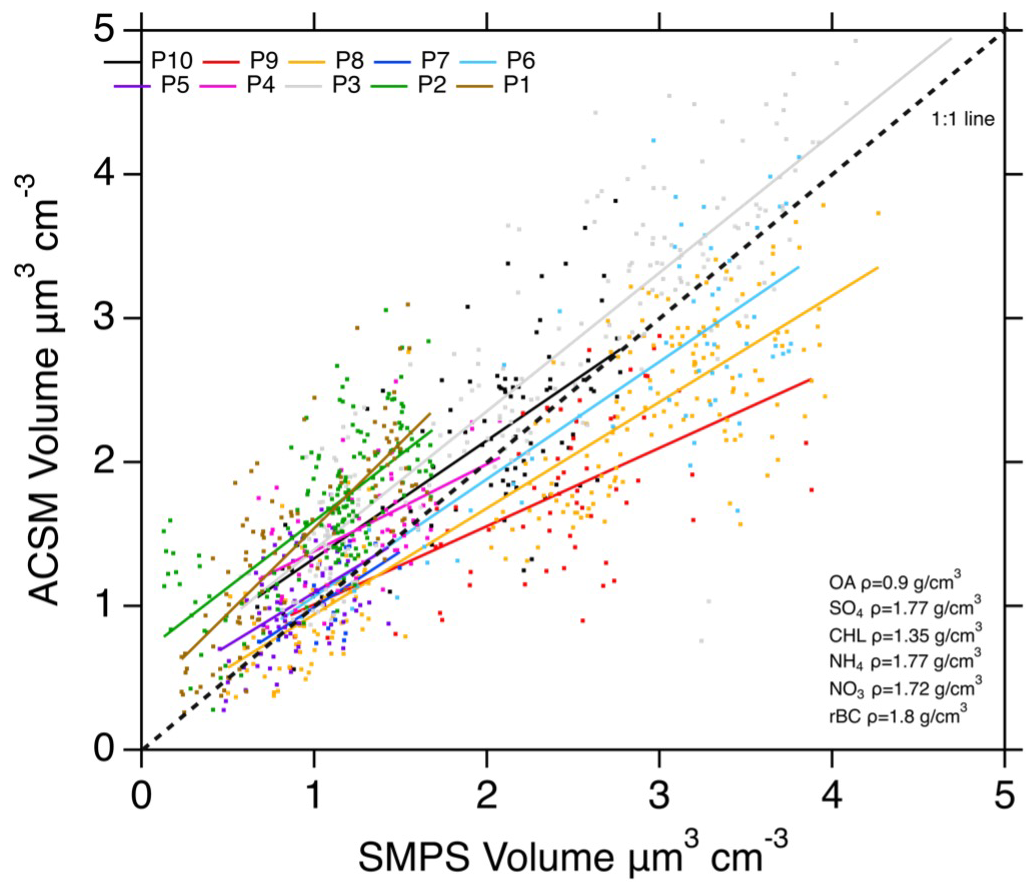
Figure B1ACSM and SMPS volume comparison for the 10 selected plume events. Solid lines represent the best-fit linear regression analysis for each plume event. Lines and markers are colored by plume number. Dashed black line represents the 1:1 relationship.
The following data are publicly available through the Atmospheric Radiation Measurement (ARM) Data Archive (for definitions, see Table 1).
-
ACSM at https://doi.org/10.5439/1762267 (Zawadowicz et al., 2021; Watson, 2017; Shilling and Levin, 2021).
-
SP2 at http://www.arm.gov/campaigns/amf2016lasic/ (Sedlacek, 2017, 2021).
-
SMPS at https://doi.org/10.5439/1476898 (Kuang et al., 2023; Kuang, 2016).
-
CPC at https://doi.org/10.5439/1352536 (Koontz et al., 2021; Kuang, 2016).
-
Nephelometer data at https://doi.org/10.5439/1369240 (Uin et al., 2022; Uin, 2016).
-
PSAP at https://doi.org/10.5439/1369240 (Koontz et al., 2022a; Springston, 2018).
-
Surface winds at https://doi.org/10.5439/1595321 (Keeler et al., 2022; Holdridge, 2020).
-
CO analyzer at http://www.arm.gov/campaigns/amf2016lasic/, last access: 22 November 2022 (Koontz et al., 2022b; Springston, 2015).
-
Optical properties VAP at https://doi.org/10.5439/1369240 (Flynn, 2020).
-
Fire data at https://firms.modaps.eosdis.nasa.gov/download/ (NASA, 2025).
-
NCEP winds at https://psl.noaa.gov/data/gridded/data.ncep.reanalysis.html (Kalnay et al., 1996).
-
CAMS CO at https://ads.atmosphere.copernicus.eu/cdsapp#!/dataset/cams-global-reanalysis-eac4?tab=overview (Inness et al., 2019).
The supplement related to this article is available online at https://doi.org/10.5194/acp-25-2333-2025-supplement.
PZ designed the research. AD and PZ conceived this study. AJS and MZ prepared data sets of ACSM and SP2. AD, MAZ, and AJS analyzed the data sets. AD, PZ, and ERL wrote the paper, with edits from TT, MAZ, and AJS.
The contact author has declared that none of the authors has any competing interests.
Publisher's note: Copernicus Publications remains neutral with regard to jurisdictional claims made in the text, published maps, institutional affiliations, or any other geographical representation in this paper. While Copernicus Publications makes every effort to include appropriate place names, the final responsibility lies with the authors.
This article is part of the special issue “New observations and related modelling studies of the aerosol–cloud–climate system in the Southeast Atlantic and southern Africa regions (ACP/AMT inter-journal SI)”. It is not associated with a conference.
We are grateful to the LASIC instrument mentors, AOS technicians, and logistics staff, who made this analysis possible through their efforts in deploying and maintaining the instruments at this remote location and to those who processed and calibrated the campaign data. We thank the editor, Rebecca Garland, and the reviewers for their insightful feedback and suggestions, which have enhanced the clarity and impact of our work.
Amie Dobracki, Tyler Tatro, and Paquita Zuidema received support from the U.S. Department of Energy Atmospheric System Research (award no. DE-SC0021250) and from NASA (NASA-80NSSC21K1344 award). Ernie R. Lewis, Arthur J. Sedlacek III, and Maria A. Zawadowicz received support from the U.S. Department of Energy's Office of Biological and Environmental Sciences program (contract no. DE-SC0012704).
This paper was edited by Rebecca Garland and reviewed by Huihui Wu and one anonymous referee.
Abel, S. J., Barrett, P. A., Zuidema, P., Zhang, J., Christensen, M., Peers, F., Taylor, J. W., Crawford, I., Bower, K. N., and Flynn, M.: Open cells exhibit weaker entrainment of free-tropospheric biomass burning aerosol into the south-east Atlantic boundary layer, Atmos. Chem. Phys., 20, 4059–4084, https://doi.org/10.5194/acp-20-4059-2020, 2020.
Adebiyi, A. A., Zuidema, P., and Abel, S. J.: The Convolution of Dynamics and Moisture with the Presence of Shortwave Absorbing Aerosols over the Southeast Atlantic, J. Clim., 28, 1997–2024, https://doi.org/10.1175/JCLI-D-14-00352.1, 2015.
Adebiyi, A. A. and Zuidema, P.: Low Cloud Cover Sensitivity to Biomass-Burning Aerosols and Meteorology over the Southeast Atlantic, J. Clim., 31, 4329–4346, https://doi.org/10.1175/JCLI-D-17-0406.1, 2018.
Aiken, A. C., DeCarlo, P. F., Kroll, J. H., Worsnop, D. R., Huffman, J. A., Docherty, K. S., Ulbrich, I. M., Mohr, C., Kimmel, J. R., and Sueper, D.: and ratios of primary, secondary, and ambient organic aerosols with high-resolution time-of-flight aerosol mass spectrometry, Environ. Sci. Technol., 42, 4478–4485, 2008.
Akagi, S. K., Yokelson, R. J., Wiedinmyer, C., Alvarado, M. J., Reid, J. S., Karl, T., Crounse, J. D., and Wennberg, P. O.: Emission factors for open and domestic biomass burning for use in atmospheric models, Atmos. Chem. Phys., 11, 4039–4072, https://doi.org/10.5194/acp-11-4039-2011, 2011.
Anderson, T. L. and Ogren, J. A.: Determining Aerosol Radiative Properties Using the TSI 3563 Integrating Nephelometer, Aersol Sci. Technol., 29, 57–69, https://doi.org/10.1080/02786829808965551, 1998.
Barrett, P. A., Abel, S. J., Coe, H., Crawford, I., Dobracki, A., Haywood, J. M., Howell, S., Jones, A., Langridge, J., McFarquhar, G., Nott, G., Price, H., Redemann, J., Shinozuka, Y., Szpek, K., Taylor, J., Wood, R., Wu, H., Zuidema, P., Bauguitte, S., Bennett, R., Bower, K., Chen, H., Cochrane, S. P., Cotterell, M., Davies, N., Delene, D., Flynn, C., Freedman, A., Freitag, S., Gupta, S., Noone, D., Onasch, T. B., Podolske, J., Poellot, M. R., Schmidt, S. K., Springston, S., III, A. J. S., Trembath, J., Vance, A., Zawadowicz, M., and Zhang, J.: Intercomparison of airborne and surface-based measurements during the CLARIFY, ORACLES and LASIC field experiments, Atmos. Meas. Tech., 15, 6329–6371, https://doi.org/10.5194/amt-15-6329-2022, 2022.
Bianco, A., Passananti, M., Brigante, M., and Mailhot, G.: Photochemistry of the Cloud Aqueous Phase: A Review, Molecules, 25, 423, https://doi.org/10.3390/molecules25020423, 2020.
Bond, T. C., Anderson, T. L., and Campbell, D.: Calibration and Intercomparison of Filter-Based Measurements of Visible Light Absorption by Aerosols, Aerosol Sci. Technol., 30, 582–600, https://doi.org/10.1080/027868299304435, 1999.
Bond, T. C. and Bergstrom, R. W.: Light absorption by carbonaceous particles: an investigative review, Aer. Sci. Tech., 40, 27–67, https://doi.org/10.1080/02786820500421521, 2006.
Bond, T. C., Doherty, S. J., Fahey, D. W., Forster, P. M., Berntsen, T., DeAngelo, B. J., Flanner, M. G., Ghan, S., Kärcher, B., and Koch, D.: Bounding the role of black carbon in the climate system: A scientific assessment, J. Geophys. Res., 118, 5380–5552, https://doi.org/10.1002/jgrd.50171, 2013.
Bowman, D. M., Balch, J. K., Artaxo, P., Bond, W. J., Carlson, J. M., Cochrane, M. A., d’Antonio, C. M., DeFries, R. S., Doyle, J. C., and Harrison, S. P.: Fire in the Earth System, Science, 324, 481–484, https://doi.org/10.1126/science.1163886, 2009.
Brown, H., Liu, X., Pokhrel, R., Murphy, S., Lu, Z., Saleh, R., Mielonen, T., Kokkola, H., Bergman, T., Myhre, G., Skeie, R. B., Watson-Paris, D., Stier, P., Johnson, B., Bellouin, N., Schulz, M., Vakkari, V., Beukes, J. P., vanZyl, P. G., Liu, S., and Chand, D.: Biomass burning aerosols in most climate models are too absorbing, Nat. Comm., 12, 277, https://doi.org/10.1038/s41467-020-20482-9, 2021.
Canagaratna, M., Jimenez, J., Kroll, J., Chen, Q., Kessler, S., Massoli, P., Hildebrandt Ruiz, L., Fortner, E., Williams, L., and Wilson, K.: Elemental ratio measurements of organic compounds using aerosol mass spectrometry: characterization, improved calibration, and implications, Atmos. Chem. Phys., 15, 253–272, https://doi.org/10.5194/acp-15-253-2015, 2015.
Canonaco, F., Crippa, M., Slowik, J. G., Baltensperger, U., and Prévôt, A. S. H.: SoFi, an IGOR-based interface for the efficient use of the generalized multilinear engine (ME-2) for the source apportionment: ME-2 application to aerosol mass spectrometer data, Atmos. Meas. Tech., 6, 3649–3661, https://doi.org/10.5194/amt-6-3649-2013, 2013.
Canonaco, F., Slowik, J. G., Baltensperger, U., and Prévôt, A. S. H.: Seasonal differences in oxygenated organic aerosol composition: implications for emissions sources and factor analysis, Atmos. Chem. Phys., 15, 6993–7002, https://doi.org/10.5194/acp-15-6993-2015, 2015.
Canonaco, F., Tobler, A., Chen, G., Sosedova, Y., Slowik, J. G., Bozzetti, C., Daellenbach, K. R., El Haddad, I., Crippa, M., Huang, R.-J., Furger, M., Baltensperger, U., and Prévôt, A. S. H.: A new method for long-term source apportionment with time-dependent factor profiles and uncertainty assessment using SoFi Pro: application to 1 year of organic aerosol data, Atmos. Meas. Tech., 14, 923–943, https://doi.org/10.5194/amt-14-923-2021, 2021.
Cape, J. N., Coyle, M., and Dumitrean, P.: The atmospheric lifetime of black carbon, Atmos. Env., 59, 256–263, https://doi.org/10.1016/j.atmosenv.2012.05.030, 2012.
Carter, T. S., Heald, C. L., Cappa, C. D., Kroll, J. H., Campos, T. L., Coe, H., Cotterell, M. I., Davies, N. W., Farmer, D. K., and Fox, C.: Investigating carbonaceous aerosol and its absorption properties from fires in the western United States (WE‐CAN) and southern Africa (ORACLES and CLARIFY), J. Geophys. Res. Atmos., 126, e2021JD034984, https://doi.org/10.1029/2021JD034984, 2021.
Che, H., Segal-Rozenhaimer, M., Zhang, L., Dang, C., Zuidema, P., Sedlacek III, A. J., Zhang, X., and Flynn, C.: Seasonal variations in fire conditions are important drivers in the trend of aerosol optical properties over the south-eastern Atlantic, Atmos. Chem. Phys., 22, 8767–8785, https://doi.org/10.5194/acp-22-8767-2022, 2022a.
Che, H., Segal-Rozenhaimer, M., Zhang, L., Dang, C., Zuidema, P., Dobracki, A., Sedlacek, A. J., Coe, H., Wu, H., Taylor, J., Zhang, X., Redemann, J., and Haywood, J.: Cloud processing and weeklong ageing affect biomass burning aerosol properties over the south-eastern Atlantic, Commun. Earth Environ., 3, 182, https://doi.org/10.1038/s43247-022-00517-3, 2022b.
Chýlek, P., Lee, J. E., Romonosky, D. E., Gallo, F., Lou, S., Shrivastava, M., Carrico, C. M., Aiken, A. C., and Dubey, M. K.: Mie Scattering Captures Observed Optical Properties of Ambient Biomass Burning Plumes Assuming Uniform Black, Brown, and Organic Carbon Mixtures, J. Geophys. Res., 124, 11406–11427, https://doi.org/10.1029/2019jd031224, 2019.
Collier, S., Zhou, S., Onasch, T. B., Jaffe, D. A., Kleinman, L., Sedlacek, A. J., Briggs, N. L., Hee, J., Fortner, E., Shilling, J. E., Worsnop, D., Yokelson, R. J., Parworth, C., Ge, X., Xu, J., Butterfield, Z., Chand, D., Dubey, M. K., Pekour, M. S., Springston, S., and Zhang, Q.: Regional Influence of Aerosol Emissions from Wildfires Driven by Combustion Efficiency: Insights from the BBOP Campaign, Environ. Sci. Technol., 50, 8613–8622, https://doi.org/10.1021/acs.est.6b01617, 2016.
Crippa, M., Canonaco, F., Lanz, V. A., Äijälä, M., Allan, J. D., Carbone, S., Capes, G., Ceburnis, D., Dall'Osto, M., Day, D. A., DeCarlo, P. F., Ehn, M., Eriksson, A., Freney, E., Hildebrandt Ruiz, L., Hillamo, R., Jimenez, J. L., Junninen, H., Kiendler-Scharr, A., Kortelainen, A.-M., Kulmala, M., Laaksonen, A., Mensah, A. A., Mohr, C., Nemitz, E., O'Dowd, C., Ovadnevaite, J., Pandis, S. N., Petäjä, T., Poulain, L., Saarikoski, S., Sellegri, K., Swietlicki, E., Tiitta, P., Worsnop, D. R., Baltensperger, U., and Prévôt, A. S. H.: Organic aerosol components derived from 25 AMS data sets across Europe using a consistent ME-2 based source apportionment approach, Atmos. Chem. Phys., 14, 6159–6176, https://doi.org/10.5194/acp-14-6159-2014, 2014.
Cubison, M. J., Ortega, A. M., Hayes, P. L., Farmer, D. K., Day, D., Lechner, M. J., Brune, W. H., and Apel, E.: Effects of aging on organic aerosol from open biomass burning smoke in aircraft and laboratory studies, Atmos. Chem. Phys., 11, 12049–12064, https://doi.org/10.5194/acp-11-12049-2011, 2011.
Dang, C., Segal-Rozenhaimer, M., Che, H., Zhang, L., Formenti, P., Taylor, J., Dobracki, A., Purdue, S., Wong, P.-S., Nenes, A., Sedlacek III, A., Coe, H., Redemann, J., Zuidema, P., Howell, S., and Haywood, J.: Biomass burning and marine aerosol processing over the southeast Atlantic Ocean: a TEM single-particle analysis, Atmos. Chem. Phys., 22, 9389–9412, https://doi.org/10.5194/acp-22-9389-2022, 2022.
Das, S., Harshvardhan, H., Bian, H., Chin, M., Curci, G., Protonotariou, A. P., Mielonen, T., Zhang, K., Wang, H., and Liu, X.: Biomass burning aerosol transport and vertical distribution over the South African-Atlantic region, J. Geophys. Res., 122, 6391–6415, https://doi.org/10.1002/2016JD026421, 2017.
Dedrick, J. L., Russell, L. M., Sedlacek, A. J., III, Kuang, C., Zawadowicz, M. A., and Lubin, D.: Aerosol-correlated cloud activation for clean conditions in the tropical Atlantic boundary layer during LASIC, Geophys. Res., 51, e2023GL105798, https://doi.org/10.1029/2023GL105798, 2024.
Denjean, C., Bourrianne, T., Burnet, F., Mallet, M., Maury, N., Colomb, A., Dominutti, P., Brito, J., Dupuy, R., Sellegri, K., Schwarzenboeck, A., Flamant, C., and Knippertz, P.: Overview of aerosol optical properties over southern West Africa from DACCIWA aircraft measurements, Atmos. Chem. Phys., 20, 4735–4756, https://doi.org/10.5194/acp-20-4735-2020, 2020a.
Denjean, C., Brito, J., Libois, Q., Mallet, M., Bourrianne, T., Burnet, F., Dupuy, R., Flamant, C., and Knippertz, P.: Unexpected Biomass Burning Aerosol Absorption Enhancement Explained by Black Carbon Mixing State, Geophys. Res. Lett., 47, e2020GL089055, https://doi.org/10.1029/2020gl089055, 2020b.
Diamond, M. S., Saide, P. E., Zuidema, P., Ackerman, A. S., Doherty, S. J., Fridlind, A. M., Gordon, H., Howes, C., Kazil, J., Yamaguchi, T., Zhang, J., Feingold, G., and Wood, R.: Cloud adjustments from large-scale smoke–circulation interactions strongly modulate the southeastern Atlantic stratocumulus-to-cumulus transition, Atmos. Chem. Phys., 22, 12113–12151, https://doi.org/10.5194/acp-22-12113-2022, 2022.
Dobracki, A., Zuidema, P., Howell, S. G., Saide, P., Freitag, S., Aiken, A. C., Burton, S. P., Sedlacek III, A. J., Redemann, J., and Wood, R.: An attribution of the low single-scattering albedo of biomass burning aerosol over the southeastern Atlantic, Atmos. Chem. Phys., 23, 4775–4799, https://doi.org/10.5194/acp-23-4775-2023, 2023.
Doherty, S. J., Saide, P. E., Zuidema, P., Shinozuka, Y., Ferrada, G. A., Gordon, H., Mallet, M., Meyer, K., Painemal, D., Howell, S. G., Freitag, S., Dobracki, A., Podolske, J. R., Burton, S. P., Ferrare, R. A., Howes, C., Nabat, P., Carmichael, G. R., da Silva, A., Pistone, K., Chang, I., Gao, L., Wood, R., and Redemann, J.: Modeled and observed properties related to the direct aerosol radiative effect of biomass burning aerosol over the southeastern Atlantic, Atmos. Chem. Phys., 22, 1–46, https://doi.org/10.5194/acp-22-1-2022, 2022.
Eck, T., Holben, B., Reid, J., Mukelabai, M., Piketh, S., Torres, O., Jethva, H., Hyer, E., Ward, D., and Dubovik, O.: A seasonal trend of single scattering albedo in southern African biomass‐burning particles: Implications for satellite products and estimates of emissions for the world's largest biomass‐burning source, J. Geophys. Res.-Atmos., 118, 6414–6432, 2013.
Ervens, B., Turpin, B. J., and Weber, R. J.: Secondary organic aerosol formation in cloud droplets and aqueous particles (aqSOA): a review of laboratory, field and model studies, Atmos. Chem. Phys., 11, 11069–11102, https://doi.org/10.5194/acp-11-11069-2011, 2011.
Flynn, C., Koontz, A., Ermold, B., and Chand, D.: ARM Aerosol Optical Properties (AOP) and its Value-Added Product, https://doi.org/10.2172/1433185, 2018.
Garofalo, L. A., Pothier, M. A., Levin, E. J. T., Campos, T., Kreidenweis, S. M., and Farmer, D. K.: Emission and Evolution of Submicron Organic Aerosol in Smoke from Wildfires in the Western United States, ACS Earth Space Chem., 3, 1237–1247, https://doi.org/10.1021/acsearthspacechem.9b00125, 2019.
Gilardoni, S., Massoli, P., Paglione, M., Giulianelli, L., Carbone, C., Rinaldi, M., Decesari, S., Sandrini, S., Costabile, F., Gobbi, G. P., Pietrogrande, M. C., Visentin, M., Scotto, F., Fuzzi, S., and Facchini, M. C.: Direct observation of aqueous secondary organic aerosol from biomass-burning emissions, P. Natl. Acad. Sci. USA, 113, 10013–10018, https://doi.org/10.1073/pnas.1602212113, 2016.
Giorio, C., Monod, A., Brégonzio-Rozier, L., DeWitt, H. L., Cazaunau, M., Temime-Roussel, B., Gratien, A., Michoud, V., Pangui, E., Ravier, S., Zielinski, A. T., Tapparo, A., Vermeylen, R., Claeys, M., Voisin, D., Kalberer, M., and Doussin, J.-F.: Cloud Processing of Secondary Organic Aerosol from Isoprene and Methacrolein Photooxidation, J. Phys. Chem. A, 121, 7641–7654, https://doi.org/10.1021/acs.jpca.7b05933, 2017.
Gysel, M., Laborde, M., Olfert, J. S., Subramanian, R., and Gröhn, A. J.: Effective density of Aquadag and fullerene soot black carbon reference materials used for SP2 calibration, Atmos. Meas. Tech., 4, 2851–2858, https://doi.org/10.5194/amt-4-2851-2011, 2011.
Haywood, J. M., Abel, S. J., Barrett, P. A., Bellouin, N., Blyth, A., Bower, K. N., Brooks, M., Carslaw, K., Che, H., Coe, H., Cotterell, M. I., Crawford, I., Cui, Z., Davies, N., Dingley, B., Field, P., Formenti, P., Gordon, H., de Graaf, M., Herbert, R., Johnson, B., Jones, A. C., Langridge, J. M., Malavelle, F., Partridge, D. G., Peers, F., Redemann, J., Stier, P., Szpek, K., Taylor, J. W., Watson-Parris, D., Wood, R., Wu, H., and Zuidema, P.: Overview: The CLoud-Aerosol-Radiation Interaction and Forcing: Year-2017 (CLARIFY-2017) measurement campaign, Atmos. Chem. Phys., 21, 1049–1084, https://doi.org/10.5194/acp-21-1049-2021, 2021.
Helin, A., Virkkula, A., Backman, J., Pirjola, L., Sippula, O., Aakko-Saksa, P., Väätäinen, S., Mylläri, F., Järvinen, A., Bloss, M., Aurela, M., Jakobi, G., Karjalainen, P., Zimmermann, R., Jokiniemi, J., Saarikoski, S., Tissari, J., Rönkkö, T., Niemi, J. V., and Timonen, H.: Variation of Absorption Ångström Exponent in Aerosols From Different Emission Sources, J. Geophys. Res.-Atmos., 126, e2020JD034094, https://doi.org/10.1029/2020JD034094, 2021.
Hermann, M., Wehner, B., Bischof, O., Han, H.-S., Krinke, T., Liu, W., Zerrath, A., and Wiedensohler, A.: Particle counting efficiencies of new TSI condensation particle counters, J. Aerosol Sci., 38, 674–682, https://doi.org/10.1016/j.jaerosci.2007.05.001, 2007.
Holanda, B. A., Franco, M. A., Walter, D., Artaxo, P., Carbone, S., Cheng, Y., Chowdhury, S., Ditas, F., Gysel-Beer, M., Klimach, T., Kremper, L. A., Krüger, O. O., Lavric, J. V., Lelieveld, J., Ma, C., Machado, L. A. T., Modini, R. L., Morais, F. G., Pozzer, A., Saturno, J., Su, H., Wendisch, M., Wolff, S., Pöhlker, M. L., Andreae, M. O., Pöschl, U., and Pöhlker, C.: African biomass burning affects aerosol cycling over the Amazon, Commun. Earth Environ., 4, 154–154, https://doi.org/10.1038/s43247-023-00795-5, 2023.
Hodzic, A., Campuzano-Jost, P., Bian, H., Chin, M., Colarco, P. R., Day, D. A., Froyd, K. D., Heinold, B., Jo, D. S., Katich, J. M., Kodros, J. K., Nault, B. A., Pierce, J. R., Ray, E., Schacht, J., Schill, G. P., Schroder, J. C., Schwarz, J. P., Sueper, D. T., Tegen, I., Tilmes, S., Tsigaridis, K., Yu, P., and Jimenez, J. L.: Characterization of organic aerosol across the global remote troposphere: a comparison of ATom measurements and global chemistry models, Atmos. Chem. Phys., 20, 4607–4635, https://doi.org/10.5194/acp-20-4607-2020, 2020.
Hoffa, E. A., Ward, D. E., Hao, W. M., Susott, R. A., and Wakimoto, R. H.: Seasonality of carbon emissions from biomass burning in a Zambian savanna, J. Geophys. Res.-Atmos., 104, 13841–13853, https://doi.org/10.1029/1999JD900091, 1999.
Holanda, B. A., Pöhlker, M. L., Walter, D., Saturno, J., Sörgel, M., Ditas, J., Ditas, F., Schulz, C., Franco, M. A., Wang, Q., Donth, T., Artaxo, P., Barbosa, H. M. J., Borrmann, S., Braga, R., Brito, J., Cheng, Y., Dollner, M., Kaiser, J. W., Klimach, T., Knote, C., Krüger, O. O., Fütterer, D., Lavrič, J. V, Ma, N., Machado, L. A. T., Ming, J., Morais, F. G., Paulsen, H., Sauer, D., Schlager, H., Schneider, J., Su, H., Weinzierl, B., Walser, A., Wendisch, M., Ziereis, H., Zöger, M., Pöschl, U., Andreae, M. O., and Pöhlker, C.: Influx of African biomass burning aerosol during the Amazonian dry season through layered transatlantic transport of black carbon-rich smoke, Atmos. Chem. Phys., 20, 4757–4785, https://doi.org/10.5194/acp-20-4757-2020, 2020.
Holanda, B. A., Franco, M. A., Walter, D., Artaxo, P., Carbone, S., Cheng, Y., Chowdhury, S., Ditas, F., Gysel-Beer, M., Klimach, T., Kremper, L. A., Krüger, O. O., Lavric, J. V, Lelieveld, J., Ma, C., Machado, L. A. T., Modini, R. L., Morais, F. G., Pozzer, A., Saturno, J., Su, H., Wendisch, M., Wolff, S., Pöhlker, M. L., Andreae, M. O., Pöschl, U., and Pöhlker, C.: African biomass burning affects aerosol cycling over the Amazon, Commun. Earth Environ., 4, 154, https://doi.org/10.1038/s43247-023-00795-5, 2023.
Holder, A. L., Hagler, G. S., Aurell, J., Hays, M. D., and Gullett, B. K.: Particulate matter and black carbon optical properties and emission factors from prescribed fires in the southeastern United States, J. Geophys. Res., 121, 3465–3483, https://doi.org/10.1002/2015JD024321, 2016.
Hoppel, W., Frick, G., and Larson, R.: Effect of non-precipitating clouds on the aerosol size distribution, Geophys. Res. Lett., 13, 125–128, https://doi.org/10.1029/GL013i002p00125, 1986.
Howell, S. G., Freitag, S., Dobracki, A., Smirnow, N., and III, A. J. S.: Undersizing of aged African biomass burning aerosol by an ultra-high-sensitivity aerosol spectrometer, Atmos. Meas. Tech., 14, 7381–7404, https://doi.org/10.5194/amt-14-7381-2021, 2021.
Howes, C., Saide, P. E., Coe, H., Dobracki, A. N., Freitag, S., Haywood, J. M., Howell, S. G., Gupta, S., Uin, J., Kacarab, M., Kuang, C., Leung, L. R., Nenes, A., McFarquhar, G., Redemann, J., Sedlacek, A. J., Thornhill, K. L., Wong, J. P. S., Wood, R., Wu, H., Zhang, Y., Zhang, J., and Zuidema, P.: Biomass-burning smoke properties and its interactions with marine stratocumulus clouds in WRF-CAM5 and southeastern Atlantic field campaigns, EGUsphere, 2023, 1–47, https://doi.org/10.5194/egusphere-2023-886, 2023.
Inness, A., Ades, M., Agustí-Panareda, A., Barré, J., Benedictow, A., Blechschmidt, A. M., Dominguez, J. J., Engelen, R., Eskes, H., Flemming, J., Huijnen, V., Jones, L., Kipling, Z., Massart, S., Parrington, M., Peuch, V. H., Razinger, M., Remy, S., Schulz, M., and Suttie, M.: The CAMS reanalysis of atmospheric composition, Atmos. Chem. Phys., 19, 3515–3556, https://doi.org/10.5194/acp-19-3515-2019, 2019 (data available at https://ads.atmosphere.copernicus.eu/cdsapp#!/dataset/cams-global-reanalysis-eac4?tab=overview, last access: 17 February 2025).
Jiang, Y., Zhou, L., and Raghavendra, A.: Observed changes in fire patterns and possible drivers over Central Africa, Environ. Res. Lett., 15, 0940b8, https://doi.org/10.1088/1748-9326/ab9db2, 2020.
Kalnay, E., Kanamitsu, M., Kistler, R., Collins, W., Deaven, D., Gandin, L., Iredell, M., Saha, S., White, G., Woollen, J., Zhu, Y., Chelliah, M., Ebisuzaki, W., Higgins, W., Janowiak, J., Mo, K. C., Ropelewski, C., Wang, J., Leetmaa, A., Reynolds, R., Jenne, R., and Joseph, D.: The NCEP/NCAR 40-Year Reanalysis Project, Bull. Am. Meteorol. Soc., 77, 437–472, https://doi.org/10.1175/1520-0477(1996)077, 1996 (data available at https://psl.noaa.gov/data/gridded/data.ncep.reanalysis.html, last access: 17 February 2025).
Keeler, E., Burk, K., and Kyrouac, J.: Balloon-Borne Sounding System (SONDEWNPN), 2016-04-29 to 2017-11-01, ARM Mobile Facility (ASI), Airport Site, Ascension Island, South Atlantic Ocean, Supplemental Site (S1), Atmospheric Radiation Measurement (ARM) User Facility [data set], https://doi.org/10.5439/1595321, 2022.
Khalil, M. A. K. and Rasmussen, R. A.: The global cycle of carbon monoxide: Trends and mass balance, Chemosphere, 20, 227–242, https://doi.org/10.1016/0045-6535(90)90098-E, 1990.
Khalizov, A. F., Xue, H., Wang, L., Zheng, J., and Zhang, R.: Enhanced Light Absorption and Scattering by Carbon Soot Aerosol Internally Mixed with Sulfuric Acid, J. Phys. Chem. A, 113, 1066–1074, https://doi.org/10.1021/jp807531n, 2009.
Koontz, A., Flynn, C., Kuang, C., Andrews, E., Kuang, C., Hayes, C., Singh, A., and Salwen, C.: Condensation Particle Counter (AOSCPCU), 2016-05-20 to 2017-11-03, ARM Mobile Facility (ASI), Ascension Island, South Atlantic Ocean, AMF1 (M1), Atmospheric Radiation Measurement (ARM) User Facility [data set], https://doi.org/10.5439/1228061, 2021.
Koontz, A., Springston, S., and Trojanowski, R.: Carbon Monoxide Analyzer (AOSCO), 2016-04-23 to 2017-11-01, ARM Mobile Facility (ASI), Ascension Island, South Atlantic Ocean, AMF1 (M1), Atmospheric Radiation Measurement (ARM) User Facility [data set], https://doi.org/10.5439/1250819, 2022a.
Koontz, A., Flynn, C., Shilling, J., and Flynn, C.: Aerosol Optical Properties (AOPPSAP1FLYNN1M), 2016-04-23 to 2017-11-01, ARM Mobile Facility (ASI), Ascension Island, South Atlantic Ocean, AMF1 (M1), Atmospheric Radiation Measurement (ARM) User Facility [data set], https://doi.org/10.5439/1369240, 2022.
Korontzi, S., Justice, C. O., and Scholes, R. J.: Influence of timing and spatial extent of savanna fires in southern Africa on atmospheric emissions, J. Arid. Environ., 54, 395–404, https://doi.org/10.1006/jare.2002.1098, 2003.
Kroll, J. H., Smith, J. D., Che, D. L., Kessler, S. H., Worsnop, D. R., and Wilson, K. R.: Measurement of fragmentation and functionalization pathways in the heterogeneous oxidation of oxidized organic aerosol, Phys. Chem. Chem. Phys., 11, 8005–8014, https://doi.org/10.1039/B905289E, 2009.
Kroll, J. H., Lim, C. Y., Kessler, S. H., and Wilson, K. R.: Heterogeneous Oxidation of Atmospheric Organic Aerosol: Kinetics of Changes to the Amount and Oxidation State of Particle-Phase Organic Carbon, J. Phys. Chem. A, 119, 10767–10783, https://doi.org/10.1021/acs.jpca.5b06946, 2015.
Kuang, C., Singh, A., Howie, J., Salwen, C., and Hayes, C.: Scanning mobility particle sizer (AOSSMPS), 2016-05-20 to 2017-10-20, ARM Mobile Facility (ASI), Ascension Island, South Atlantic Ocean, AMF1 (M1), Atmospheric Radiation Measurement (ARM) User Facility [data set], https://doi.org/10.5439/1476898, 2023.
Lanz, V. A., Prévôt, A. S. H., Alfarra, M. R., Weimer, S., Mohr, C., DeCarlo, P. F., Gianini, M. F. D., Hueglin, C., Schneider, J., Favez, O., D'Anna, B., George, C., and Baltensperger, U.: Characterization of aerosol chemical composition with aerosol mass spectrometry in Central Europe: an overview, Atmos. Chem. Phys., 10, 10453–10471, https://doi.org/10.5194/acp-10-10453-2010, 2010.
Leifer, R., Knuth, R. H., and Lee, H. N.: Surface aerosol measurements at Lamont, Oklahoma, Proc. Third Atmospheric Radiation Measurement Science Team Meeting, Washington, DC, U.S. Department of Energy, 349–351, 1994.
Li, Z., Smith, K. A., and Cappa, C. D.: Influence of relative humidity on the heterogeneous oxidation of secondary organic aerosol, Atmos. Chem. Phys., 18, 14585–14608, https://doi.org/10.5194/acp-18-14585-2018, 2018.
Lund, M. T., Samset, B. H., Skeie, R. B., Watson-Parris, D., Katich, J. M., Schwarz, J. P., and Weinzierl, B.: Short Black Carbon lifetime inferred from a global set of aircraft observations, npj Clim. Atmos. Sci., 1, 31, https://doi.org/10.1038/s41612-018-0040-x, 2018.
Mallet, M., Solmon, F., Nabat, P., Elguindi, N., Waquet, F., Bouniol, D., Sayer, A. M., Meyer, K., Roehrig, R., and Michou, M.: Direct and semi-direct radiative forcing of biomass-burning aerosols over the southeast Atlantic (SEA) and its sensitivity to absorbing properties: a regional climate modeling study, Atmos. Chem. Phys., 20, 13191–13216, https://doi.org/10.5194/acp-20-13191-2020, 2020.
Mallet, M., Nabat, P., Johnson, B., Michou, M., Haywood, J. M., Chen, C., and Dubovik, O.: Climate models generally underrepresent the warming by Central Africa biomass-burning aerosols over the Southeast Atlantic, Sci. Adv., 7, eabg9998, https://doi.org/10.1126/sciadv.abg9998, 2021.
McNeill, V. F.: Aqueous Organic Chemistry in the Atmosphere: Sources and Chemical Processing of Organic Aerosols, Env. Sci. Tech., 49, 1237–1244, https://doi.org/10.1021/es5043707, 2015.
Middlebrook, A. M., Bahreini, R., Jimenez, J. L., and Canagaratna, M. R.: Evaluation of Composition-Dependent Collection Efficiencies for the Aerodyne Aerosol Mass Spectrometer using Field Data, Aerosol Sci. Technol., 46, 258–271, https://doi.org/10.1080/02786826.2011.620041, 2012.
Nakao, S., Tang, P., Tang, X., Clark, C. H., Qi, L., Seo, E., Asa-Awuku, A., and Cocker III, D.: Density and elemental ratios of secondary organic aerosol: Application of a density prediction method, Atmos. Environ., 68, 273–277, 2013.
NASA: VIIIRS data, Fire data [data set], https://firms.modaps.eosdis.nasa.gov/,10.5067/FIRMS/VIIRS/VNP14IMGT_NRT.002, last access: 10 January 2025.
Ng, N. L., Canagaratna, M. R., Jimenez, J. L., Chhabra, P. S., Seinfeld, J. H., and Worsnop, D. R.: Changes in organic aerosol composition with aging inferred from aerosol mass spectra, Atmos. Chem. Phys., 11, 6465–6474, https://doi.org/10.5194/acp-11-6465-2011, 2011a.
Ng, N. L., Herndon, S. C., Trimborn, A., Canagaratna, M. R., Croteau, P., Onasch, T. B., Sueper, D., Worsnop, D. R., Zhang, Q., and Sun, Y.: An Aerosol Chemical Speciation Monitor (ACSM) for routine monitoring of the composition and mass concentrations of ambient aerosol, Aerosol Sci. Tech., 45, 780–794, 2011b.
Ogren, J. A.: Comment on “Calibration and Intercomparison of Filter-Based Measurements of Visible Light Absorption by Aerosols”, Aerosol Sci. Technol., 44, 589–591, https://doi.org/10.1080/02786826.2010.482111, 2010.
Onasch, T. B., Massoli, P., Kebabian, P. L., Hills, F. B., Bacon, F. W., and Freedman, A.: Single Scattering Albedo Monitor for Airborne Particulates, Aerosol Sci. Technol., 49, 267–279, https://doi.org/10.1080/02786826.2015.1022248, 2015.
Pan, X., Kanaya, Y., Taketani, F., Miyakawa, T., Inomata, S., Komazaki, Y., Tanimoto, H., Wang, Z., Uno, I., and Wang, Z.: Emission characteristics of refractory black carbon aerosols from fresh biomass burning: a perspective from laboratory experiments, Atmos. Chem. Phys., 17, 13001–13016, https://doi.org/10.5194/acp-17-13001-2017, 2017.
Pennypacker, S., Diamond, M., and Wood, R.: Ultra-clean and smoky marine boundary layers frequently occur in the same season over the southeast Atlantic, Atmos. Chem. Phys., 20, 2341–2351, https://doi.org/10.5194/acp-20-2341-2020, 2020.
Pistone, K., Redemann, J., Doherty, S., Zuidema, P., Burton, S., Cairns, B., Cochrane, S., Ferrare, R., Flynn, C., Freitag, S., Howell, S., Kacenelenbogen, M., LeBlanc, S., Liu, X., Schmidt, K. S., Sedlacek III, A. J., Segal-Rosenhaimer, M., Shinozuka, Y., Stamnes, S., van Diedenhoven, B., Van Harten, G., and Xu, F.: Intercomparison of biomass burning aerosol optical properties from in-situ and remote-sensing instruments in ORACLES-2016, Atmos. Chem. Phys., 19, 9181–9208, https://doi.org/10.5194/acp-19-9181-2019, 2019.
Redemann, J., Wood, R., Zuidema, P., Doherty, S. J., Luna, B., LeBlanc, S. E., Diamond, M. S., Shinozuka, Y., Chang, I. Y., Ueyama, R., Pfister, L., Ryoo, J.-M., Dobracki, A. N., da Silva, A. M., Longo, K. M., Kacenelenbogen, M. S., Flynn, C. J., Pistone, K., Knox, N. M., Piketh, S. J., Haywood, J. M., Formenti, P., Mallet, M., Stier, P., Ackerman, A. S., Bauer, S. E., Fridlind, A. M., Carmichael, G. R., Saide, P. E., Ferrada, G. A., Howell, S. G., Freitag, S., Cairns, B., Holben, B. N., Knobelspiesse, K. D., Tanelli, S., L'Ecuyer, T. S., Dzambo, A. M., Sy, O. O., McFarquhar, G. M., Poellot, M. R., Gupta, S., O'Brien, J. R., Nenes, A., Kacarab, M., Wong, J. P. S., Small-Griswold, J. D., Thornhill, K. L., Noone, D., Podolske, J. R., Schmidt, K. S., Pilewskie, P., Chen, H., Cochrane, S. P., Sedlacek, A. J., Lang, T. J., Stith, E., Segal-Rozenhaimer, M., Ferrare, R. A., Burton, S. P., Hostetler, C. A., Diner, D. J., Seidel, F. C., Platnick, S. E., Myers, J. S., Meyer, K. G., Spangenberg, D. A., Maring, H., and Gao, L.: An overview of the ORACLES (ObseRvations of Aerosols above CLouds and their intEractionS) project: aerosol–cloud–radiation interactions in the southeast Atlantic basin, Atmos. Chem. Phys., 21, 1507–1563, https://doi.org/10.5194/acp-21-1507-2021, 2021.
Rickly, P. S., Guo, H., Campuzano-Jost, P., Jimenez, J. L., Wolfe, G. M., Bennett, R., Bourgeois, I., Crounse, J. D., Dibb, J. E., DiGangi, J. P., Diskin, G. S., Dollner, M., Gargulinski, E. M., Hall, S. R., Halliday, H. S., Hanisco, T. F., Hannun, R. A., Liao, J., Moore, R., Nault, B. A., Nowak, J. B., Peischl, J., Robinson, C. E., Ryerson, T., Sanchez, K. J., Schöberl, M., Soja, A. J., St. Clair, J. M., Thornhill, K. L., Ullmann, K., Wennberg, P. O., Weinzierl, B., Wiggins, E. B., Winstead, E. L., and Rollins, A. W.: Emission factors and evolution of SO2 measured from biomass burning in wildfires and agricultural fires, Atmos. Chem. Phys., 22, 15603–15620, https://doi.org/10.5194/acp-22-15603-2022, 2022.
Rudich, Y., Donahue, N. M., and Mentel, T. F.: Aging of Organic Aerosol: Bridging the Gap Between Laboratory and Field Studies, Ann. Rev. Phys. Chem., 58, 321–352, https://doi.org/10.1146/annurev.physchem.58.032806.104432, 2007.
Ryoo, J.-M., Pfister, L., Ueyama, R., Zuidema, P., Wood, R., Chang, I., and Redemann, J.: A meteorological overview of the ORACLES (ObseRvations of Aerosols above CLouds and their intEractionS) campaign over the southeast Atlantic during 2016–2018: Part 1 – Climatology, Atmos. Chem. Phys., 21, 16689–16707, https://doi.org/10.5194/acp-21-16689-2021, 2021.
Ryoo, J.-M., Pfister, L., Ueyama, R., Zuidema, P., Wood, R., Chang, I., and Redemann, J.: A meteorological overview of the ORACLES (ObseRvations of Aerosols above CLouds and their intEractionS) campaign over the southeastern Atlantic during 2016–2018: Part 2 – Daily and synoptic characteristics, Atmos. Chem. Phys., 22, 14209–14241, https://doi.org/10.5194/acp-22-14209-2022, 2022.
Sedlacek, A.: SP2 B-level data, 2016-06-02 to 2017-11-01, ARM Mobile Facility (ASI), Ascension Island, South Atlantic Ocean, AMF1 (M1), Atmospheric Radiation Measurement (ARM) User Facility [data set], http://www.arm.gov/campaigns/amf2016lasic/, last access: 16 March 2021.
Sedlacek, A., Lewis, E., Onasch, T., Zuidema, P., Redemann, J., Jaffee, D., and Kleinman, L.: Using the black carbon particle mixing state to characterize the lifecyle of biomass burn aerosols, Environ. Sci. Technol., 56, 14315–14325, https://doi.org/10.1021/acs.est.2c30851, 2022.
Shilling, J. E. and Levin, M. S.: Aerosol Chemical Speciation Monitor (ACSM) Composition-Dependent Collection Efficiency (CDCE) Value-Added Product Report, https://doi.org/10.2172/1813010, 2021.
Shinozuka, Y., Saide, P. E., Ferrada, G. A., Burton, S. P., Ferrare, R., Doherty, S. J., Gordon, H., Longo, K., Mallet, M., Feng, Y., Wang, Q., Cheng, Y., Dobracki, A., Freitag, S., Howell, S. G., LeBlanc, S., Flynn, C., Segal-Rosenhaimer, M., Pistone, K., Podolske, J. R., Stith, E. J., Bennett, J. R., Carmichael, G. R., da Silva, A., Govindaraju, R., Leung, R., Zhang, Y., Pfister, L., Ryoo, J.-M., Redemann, J., Wood, R., and Zuidema, P.: Modeling the smoky troposphere of the southeast Atlantic: a comparison to ORACLES airborne observations from September of 2016, Atmos. Chem. Phys., 20, 411–491, 526, https://doi.org/10.5194/acp-20-11491-2020, 2020.
Sinha, P., Hobbs, P. V, Yokelson, R. J., Blake, D. R., Gao, S., and Kirchstetter, T. W.: Emissions from miombo woodland and dambo grassland savanna fires, J. Geophys. Res.-Atmos., 109, D11305, https://doi.org/10.1029/2004JD004521, 2004.
Sorooshian, A., Murphy, S. M., Hersey, S., Bahreini, R., Jonsson, H., Flagan, R. C., and Seinfeld, J. H.: Constraining the contribution of organic acids and AMS 44 to the organic aerosol budget: On the importance of meteorology, aerosol hygroscopicity, and region, Geophys. Res. Lett., 37, L21807, https://doi.org/10.1029/2010GL044951, 2010.
Springston, S. R.: Carbon monoxide analyzer (CO-ANALYZER) instrument handbook, ARM Tech. Rep. DOE/SC-ARM-TR-159 [data set], 30 pp., https://doi.org/10.2172/1495422, 2015.
Taylor, J. W., Wu, H., Szpek, K., Bower, K., Crawford, I., Flynn, M. J., Williams, P. I., Dorsey, J., Langridge, J. M., Cotterell, M. I., Fox, C., Davies, N. W., Haywood, J. M., and Coe, H.: Absorption closure in highly aged biomass burning smoke, Atmos. Chem. Phys., 20, 11201–11221, https://doi.org/10.5194/acp-20-11201-2020, 2020.
Uin, J.: Integrating nephelometer instrument handbook, ARM Tech. Rep. DOE/SC-ARM-TR-165 [data set], 16 pp., https://doi.org/10.2172/1246075, 2016.
Uin, J., Aiken, A. C., Dubey, M. K., Kuang, C., Pekour, M., Salwen, C., Sedlacek, A. J., Senum, G., Smith, S., Wang, J., Watson, T. B., and Springston, S. R.: Atmospheric Radiation Measurement (ARM) Aerosol Observing Systems (AOS) for Surface-Based In Situ Atmospheric Aerosol and Trace Gas Measurements, J. Atmos. Ocean. Technol., 36, 2429–2447, https://doi.org/10.1175/JTECH-D-19-0077.1, 2019.
Uin, J., Salwen, C., Hayes, C., and Mayol Bracero, O.: Nephelometer (AOSNEPHDRY1M), 2016-04-23 to 2017-11-01, ARM Mobile Facility (ASI), Ascension Island, South Atlantic Ocean, AMF1 (M1), Atmospheric Radiation Measurement (ARM) User Facility [data set], https://doi.org/10.5439/1984586, 2022.
Virkkula, A.: Correction of the Calibration of the 3-wavelength Particle Soot Absorption Photometer (3 PSAP), Aerosol Sci. Tech., 44, 706–712, 2010.
Vakkari, V., Beukes, J. P., Maso, M. D., Aurela, M., Josipovic, M., and van Zyl, P. G.: Major secondary aerosol formation in southern African open biomass burning plumes, Nat. Geosci., 11, 580–583, https://doi.org/10.1038/s41561-018-0170-0, 2018.
Wang, C.: A modeling study on the climate impacts of black carbon aerosols, J. Geophys. Res.-Atmos., 109, D03106, https://doi.org/10.1029/2003JD004084, 2004.
Watson, T. B.: Aerosol Chemical Speciation Monitor (ACSM) Instrument Handbook, https://doi.org/10.2172/1375336, 2017.
Wong, J. P. S., Zhou, S., and Abbatt, J. P. D.: Changes in Secondary Organic Aerosol Composition and Mass due to Photolysis: Relative Humidity Dependence, J. Phys. Chem. A, 119, 4309–4316, https://doi.org/10.1021/jp506898c, 2015.
Wu, H., Taylor, J. W., Szpek, K., Langridge, J. M., Williams, P. I., Flynn, M., Allan, J. D., Abel, S. J., Pitt, J., Cotterell, M. I., Fox, C., Davies, N. W., Haywood, J., and Coe, H.: Vertical variability of the properties of highly aged biomass burning aerosol transported over the southeast Atlantic during CLARIFY-2017, Atmos. Chem. Phys., 20, 12697–12719, https://doi.org/10.5194/acp-20-12697-2020, 2020.
Yang, M., Huebert, B. J., Blomquist, B. W., Howell, S. G., Shank, L. M., McNaughton, C. S., Clarke, A. D., Hawkins, L. N., Russell, L. M., Covert, D. S., Coffman, D. J., Bates, T. S., Quinn, P. K., Zagorac, N., Bandy, A. R., de Szoeke, S. P., Zuidema, P. D., Tucker, S. C., Brewer, W. A., Benedict, K. B., and Collett, J. L.: Atmospheric sulfur cycling in the southeastern Pacific – longitudinal distribution, vertical profile, and diel variability observed during VOCALS-REx, Atmos. Chem. Phys., 11, 5079–5097, https://doi.org/10.5194/acp-11-5079-2011, 2011.
Zanatta, M., Gysel, M., Bukowiecki, N., Müller, T., Weingartner, E., Areskoug, H., Fiebig, M., Yttri, K. E., Mihalopoulos, N., Kouvarakis, G., Beddows, D., Harrison, R. M., Cavalli, F., Putaud, J. P., Spindler, G., Wiedensohler, A., Alastuey, A., Pandolfi, M., Sellegri, K., Swietlicki, E., Jaffrezo, J. L., Baltensperger, U., and Laj, P.: A European aerosol phenomenology-5: Climatology of black carbon optical properties at 9 regional background sites across Europe, Atmos. Environ., 145, 346–364, https://doi.org/10.1016/j.atmosenv.2016.09.035, 2016.
Zawadowicz, M., Howie, J., Shilling, J., and Levin, M.: ACSM, Corrected for Composition-Dependent Collection Efficiency (ACSMCDCE), 2016-06-02 to 2017-11-01, ARM Mobile Facility (ASI), Ascension Island, South Atlantic Ocean, AMF1 (M1), Atmospheric Radiation Measurement (ARM) User Facility [data set], https://doi.org/10.5439/1763029, 2021.
Zhang, J. and Zuidema, P.: The diurnal cycle of the smoky marine boundary layer observed during August in the remote southeast Atlantic, Atmos. Chem. Phys., 19, 14493–14516, https://doi.org/10.5194/acp-19-14493-2019, 2019.
Zhang, J. and Zuidema, P.: Sunlight-absorbing aerosol amplifies the seasonal cycle in low-cloud fraction over the southeast Atlantic, Atmos. Chem. Phys., 21, 11179–11199, https://doi.org/10.5194/acp-21-11179-2021, 2021.
Zhang, L., Segal-Rozenhaimer, M., Che, H., Dang, C., Sedlacek III, A. J., Lewis, E. R., Dobracki, A., Wong, J. P. S., Formenti, P., Howell, S. G., and Nenes, A.: Light absorption by brown carbon over the South-East Atlantic Ocean, Atmos. Chem. Phys., 22, 9199–9213, https://doi.org/10.5194/acp-22-9199-2022, 2022.
Zhang, Q., Jimenez, J. L., and Canagaratna, M. R.: Understanding atmospheric organic aerosols via factor analysis of aerosol mass spectrometry: a review, Anal. Bioanal. Chem., 401, 3045–3067, https://doi.org/10.1007/s00216-011-5355-y, 2011.
Zhang, Y., Favez, O., Canonaco, F., Liu, D., Močnik, G., Amodeo, T., Sciare, J., Prévôt, A. S. H., Gros, V., and Albinet, A.: Evidence of major secondary organic aerosol contribution to lensing effect black carbon absorption enhancement, npj Clim. Atmos. Sci., 1, 47, https://doi.org/10.1038/s41612-018-0056-2, 2018.
Zhu, Q., Huang, X.-F., Cao, L.-M., Wei, L.-T., Zhang, B., He, L.-Y., Elser, M., Canonaco, F., Slowik, J. G., Bozzetti, C., El-Haddad, I., and Prévôt, A. S. H.: Improved source apportionment of organic aerosols in complex urban air pollution using the multilinear engine (ME-2), Atmos. Meas. Tech., 11, 1049–1060, https://doi.org/10.5194/amt-11-1049-2018, 2018.
Zuidema, P., Redemann, J., Haywood, J., Wood, R., Piketh, S., Hipondoka, M., and Formenti, P.: Smoke and Clouds above the Southeast Atlantic: Upcoming Field Campaigns Probe Absorbing Aerosol's Impact on Climate, Bull. Am. Meteor. Soc., 97, 1131–1135, https://doi.org/10.1175/bams-d-15-00082.1, 2016.
Zuidema, P., Sedlacek III, A. J., Flynn, C., Springston, S., Delgadillo, R., Zhang, J., Aiken, A. C., Koontz, A., and Muradyan, P.: The Ascension Island Boundary Layer in the Remote Southeast Atlantic is Often Smoky, Geophys. Res. Lett., 45, 4456–4465, https://doi.org/10.1002/2017gl076926, 2018.
- Abstract
- Introduction
- Methods
- Results
- Discussion
- Remaining questions
- Conclusions and summary
- Appendix A: Experimental design and instrumentation
- Appendix B: Data analysis
- Data availability
- Author contributions
- Competing interests
- Disclaimer
- Special issue statement
- Acknowledgements
- Financial support
- Review statement
- References
- Supplement