the Creative Commons Attribution 4.0 License.
the Creative Commons Attribution 4.0 License.
 | 09 Dec 2025
Spatial and temporal distribution of fine aerosol acidity in the Eastern Mediterranean
Anna Maria Neroladaki
Maria Tsagkaraki
Kyriaki Papoutsidaki
Kalliopi Tavernaraki
Filothei Boufidou
Pavlos Zarmpas
Irini Tsiodra
Eleni Liakakou
Aikaterini Bougiatioti
Giorgos Kouvarakis
Nikos Kalivitis
Christos Kaltsonoudis
Athanasios Karagioras
Dimitrios Balis
Konstantinos Michailidis
Konstantinos Kourtidis
Stelios Myriokefalitakis
Nikos Hatzianastassiou
Spyros N. Pandis
Athanasios Nenes
Nikolaos Mihalopoulos
Aerosol acidity (pH) affects aerosol composition and properties, and therefore climate, human health and ecosystems. Fine aerosol acidity and its seasonal variation at 6 sites (Finokalia, Patras, Thissio, Ioannina, Thessaloniki, and Xanthi) in Greece were investigated during 2019–2020. The thermodynamic model ISORROPIA-lite was used to calculate aerosol water and acidity based on measurements of the chemical composition of PM2.5 and available gas-phase concentrations of HNO3, NH3, and HCl. During winter the fine aerosols were acidic to moderately acidic throughout Greece with an overall mean aerosol pH of 3.57±0.44 in urban areas and 3.05±0.50 in remote locations. The highest aerosol pH (4.08±0.42) in January 2020 was found in Ioannina due to, among others, high K+ levels from biomass burning emissions. Aerosols in Xanthi were the most acidic due to high sulfate levels. Similar seasonal profiles of aerosol pH were observed at all sites studied with different factors contributing to this seasonality. During the summer PM2.5 at Thissio, Ioannina and Finokalia was acidic with a mean aerosol pH across all three sites of 1.76±0.40. During this season, sulfates were the driver of the higher acidity conditions at Thissio and Finokalia, with other factors such as the semivolatiles and temperature contributing to a lesser extent. At Ioannina, temperature along with the total ammonia and nitrate were the main contributors to the seasonal difference of the aerosol pH, while some of the nonvolatile species also contributed. In most cases, the importance of organics for aerosol pH was small.
- Article
(5073 KB) - Full-text XML
-
Supplement
(1510 KB) - BibTeX
- EndNote


The aerosol pH is one of the most important chemical properties of aerosols. It controls the rates of several reactions in the particulate phase (e.g., sulfate and oligomer formation reactions in the particulate phase) and governs the gas-particle partitioning of semivolatile gases such as ammonia (NH3), nitric acid (HNO3) and hydrochloric acid (HCl), and some organic acids with low molecular weight (formic, oxalic, acetic etc.) and bases (e.g. amines). Several studies have thoroughly discussed the importance of the gas phase NH3 and HNO3 and their effect on the particulate matter as well as their relationship with aerosol pH and water (Pye et al., 2020; Nenes et al., 2020; Guo et al., 2016, 2017b, 2018). NH3 from anthropogenic and biogenic emissions is the most important gaseous base in the atmosphere, while HNO3 is an acid produced by the oxidation of NOx mainly emitted by combustion sources (Seinfeld and Pandis, 2006). HNO3, because of its strong acidity and solubility, partitions more in the gas phase than in the particle phase (as nitrate) at lower aerosol pH (usually below 1.5 to 2) (Weber et al., 2016), while NH3 remains in the gas phase at higher pH. These processes have serious implications for the wet and dry deposition of these semivolatile pollutants on ecosystems, their lifetime, climate and human health (Pye et al., 2020).
Metal cations, including those that originate from dust and sea salt, are nonvolatile at atmospheric temperatures. These constituents seriously affect the aerosol pH together with parameters such as the meteorological conditions (i.e. temperature and relative humidity). These parameters and the availability of sulfuric acid (that partitions almost exclusively to the particulate phase) are mostly responsible for the wide range of the pH of atmospheric particles (Pye et al., 2020).
Aerosol pH affects the uptake of sulfur dioxide (SO2) into the aerosol aqueous phase and its oxidation to sulfate (Seinfeld and Pandis, 2006). This is important for climate, as sulfate is one of the main scattering components of atmospheric aerosols with a cooling effect on climate. Acid catalyzed reactions lead to the formation of brown carbon that is an important contributor to absorbing aerosol (Zhang et al., 2020). Atmospheric acidity affects aerosol toxicity, controlling the solubilization of toxic forms of transition and heavy metals, such as copper and iron (Fang et al., 2017) with adverse impacts on human health (Vierke et al., 2013). Furthermore, acidity increases the solubility and thus the bioavailability of iron, phosphorus and trace metals that are deposited on ecosystems (Pye et al., 2020). This is of a great importance in oligotrophic areas, such as the East Mediterranean Sea, a marine desert, characterized by extremely low biological productivity, due to the limited availability of nutrients like phosphate (Powley et al., 2017). The area is frequently influenced by dust outbreaks from the Saharan desert, which contain several minerals and metals primarily in insoluble forms. The conversion of insoluble to soluble bioavailable form of a given nutrient is favored under acidic conditions (Kanakidou et al., 2018; Nenes et al., 2011). The solubility of iron and thus its bioavailability to ecosystems, is also controlled by acidity, as it is enhanced in the presence of acidic species. Theodosi et al. (2008) found that in the Eastern Mediterranean the iron solubility ranged from 28 % for polluted rainwater (pH 4–5) to 0.5 % for Sahara dust episodes (pH = 8).
Although the acidity of atmospheric particles plays such a critical role in all of the atmospheric processes mentioned above, there is no direct method for its accurate measurement due to the miniscule sample mass and liquid volume (Pye et al., 2020). Thus, several indirect methods have been developed, which estimate aerosol acidity (Pye et al., 2020). One of the best available methods is the aerosol pH prediction using atmospheric aerosol thermodynamic models in combination with measurements of aerosol composition and gas-phase HNO3, NH3 and HCl concentrations. Models such as ISORROPIA II (Fountoukis and Nenes, 2007), MOSAIC (Zaveri et al., 2008), E-AIM; (Clegg et al., 2001; Wexler and Clegg, 2002), etc. can be used to this purpose.
Aerosols' acidity covers a wide range and aerosol pH can be as high as about 7 pH units (sea salt), and as low as −1 and sometimes even −2 pH units, depending on the composition of the aerosol and the meteorological conditions in a given area (Pye et al., 2020). Negative values appear when sulfates are the dominant constituent of particulate matter, while the aerosol pH rarely rises above neutral levels (pH = 7). Globally fine atmospheric particles (PM2.5) have been found to have a bimodal acidity pattern with one population of smaller particles having an average pH between 1 and 3 pH units, and another of larger particles with a mean pH close to 4 and 5 units, which is due to the influence of dust, sea spray and biomass burning (Pye et al., 2020).
Several studies have investigated the levels of the acidity of fine particles and their major drivers at specific sites. For instance, studies in Beijing and close-by locations indicate a mean wintertime PM2.5 pH of 4.2 to 4.9 units (Liu et al., 2017; Guo et al., 2017a; Shi et al., 2017; Ding et al., 2019). Pye et al. (2020) summarized and investigated the fine aerosol pH in several regions globally and reported that overall aerosol pH is consistently acidic and looking into the seasonality, during wintertime where low temperature and high relative humidity occur, aerosol pH was higher compared to summertime following the temperature and the availability of liquid water content. Tao and Murphy (2019) reported that in winter the pH of fine aerosols was around 3 units at 6 sites in Canada and was strongly influenced by temperature, relative humidity and aerosol chemical composition. Kakavas et al. (2021) simulated the aerosol acidity and its variation with size and altitude over Europe during summer and found the ground level mean aerosol pH across the domain to be 2.05 for PM1, 2.65 for PM1–2.5, 3.2 for PM2.5–5 and 3.35 for PM5–10. The lowest aerosol pH was reported in the Mediterranean and especially in the eastern Mediterranean where high sulfate and nitrate levels were predicted. This study suggests that Eastern Mediterranean can be an especially interesting region for aerosol pH studies.
There have been only limited estimations of aerosol acidity in the eastern Mediterranean. The PM2.5 pH in 6 cities in the eastern Po Valley in Italy (Masiol et al., 2020) was found to range from 1.5 to 4.5 with summer minima and winter maxima and mean pH values across all sites of 2.2±0.3 and 3.9±0.3, respectively. These levels of fine aerosol acidity were mainly driven by secondary sulfate, fossil fuel combustion, secondary nitrate and biomass burning. An earlier study in the same area (Squizzato et al., 2013) investigated seasonally the aerosol pH and found that in spring the aerosol pH was higher compared to summer (average aerosol pH across the sites; spring 3.6 pH units, summer 2.3, autumn 3, winter 3.6) as a result of desert dust aerosol originating from the Sahara desert. Again in Po Valley, a multiyear (25 years) trend of fog water pH and aerosol pH was estimated (Paglione et al., 2021) and an opposite trend between them was found; there was an increase in the fog water pH and a decrease in fine aerosol acidity. In fact, there was a decrease of 0.5–1.5 pH units in the aerosol pH that was driven by the contemporary decrease of the corresponding air pollutants due to environmental policies in combination with the changing meteorology (temperature and relative humidity levels). Lastly, the submicron aerosol pH was estimated in a study conducted at the Finokalia atmospheric observation station in Greece (Bougiatioti et al., 2016) and was found to be highly acidic ranging from 0.5 to 2.8 pH units with daytime minimum and nighttime maximum values due to low aerosol water content and high temperatures during the day. They also pointed out the influence of biomass burning which increased the aerosol pH values highlighting the impact of nonvolatile cations, mainly potassium from biomass burning together with ammonia and nitrate emitted from wood burning. Despite these studies, the spatial distribution of aerosol acidity based on atmospheric composition observations is not well understood.
The present study aims to provide a spatial and seasonal picture of the acidity of fine (PM2.5) atmospheric aerosol over Greece in the eastern Mediterranean based on observations of atmospheric composition. For this, the ISORROPIA-lite thermodynamic equilibrium model (Kakavas et al., 2022) is used together with observations of the chemical composition of the fine aerosol from 6 sites over Greece and with gas phase NH3 and HNO3 data, where available. The water and pH of the fine aerosol are estimated during summer 2019 and winter 2019–2020. The factors controlling the seasonality of aerosol pH are examined and the effect of particulate organic matter on aerosol pH predictions is also investigated.
2.1 Measurement sites
Measurements of the chemical composition of PM2.5 were performed at 6 sites across Greece (Fig. 1) (Finokalia, Thissio, Patra, Ioannina, Xanthi and Thessaloniki, Table S1 in the Supplement). The corresponding summer and winter field campaigns were conducted within the PANACEA (PANhellenic infrastructure for Atmospheric Composition and climatE chAnge) project during the summer of 2019 (at 3 of the sites, Finokalia, Thissio and Ioannina) and the winter of 2019–2020 (at all sites).
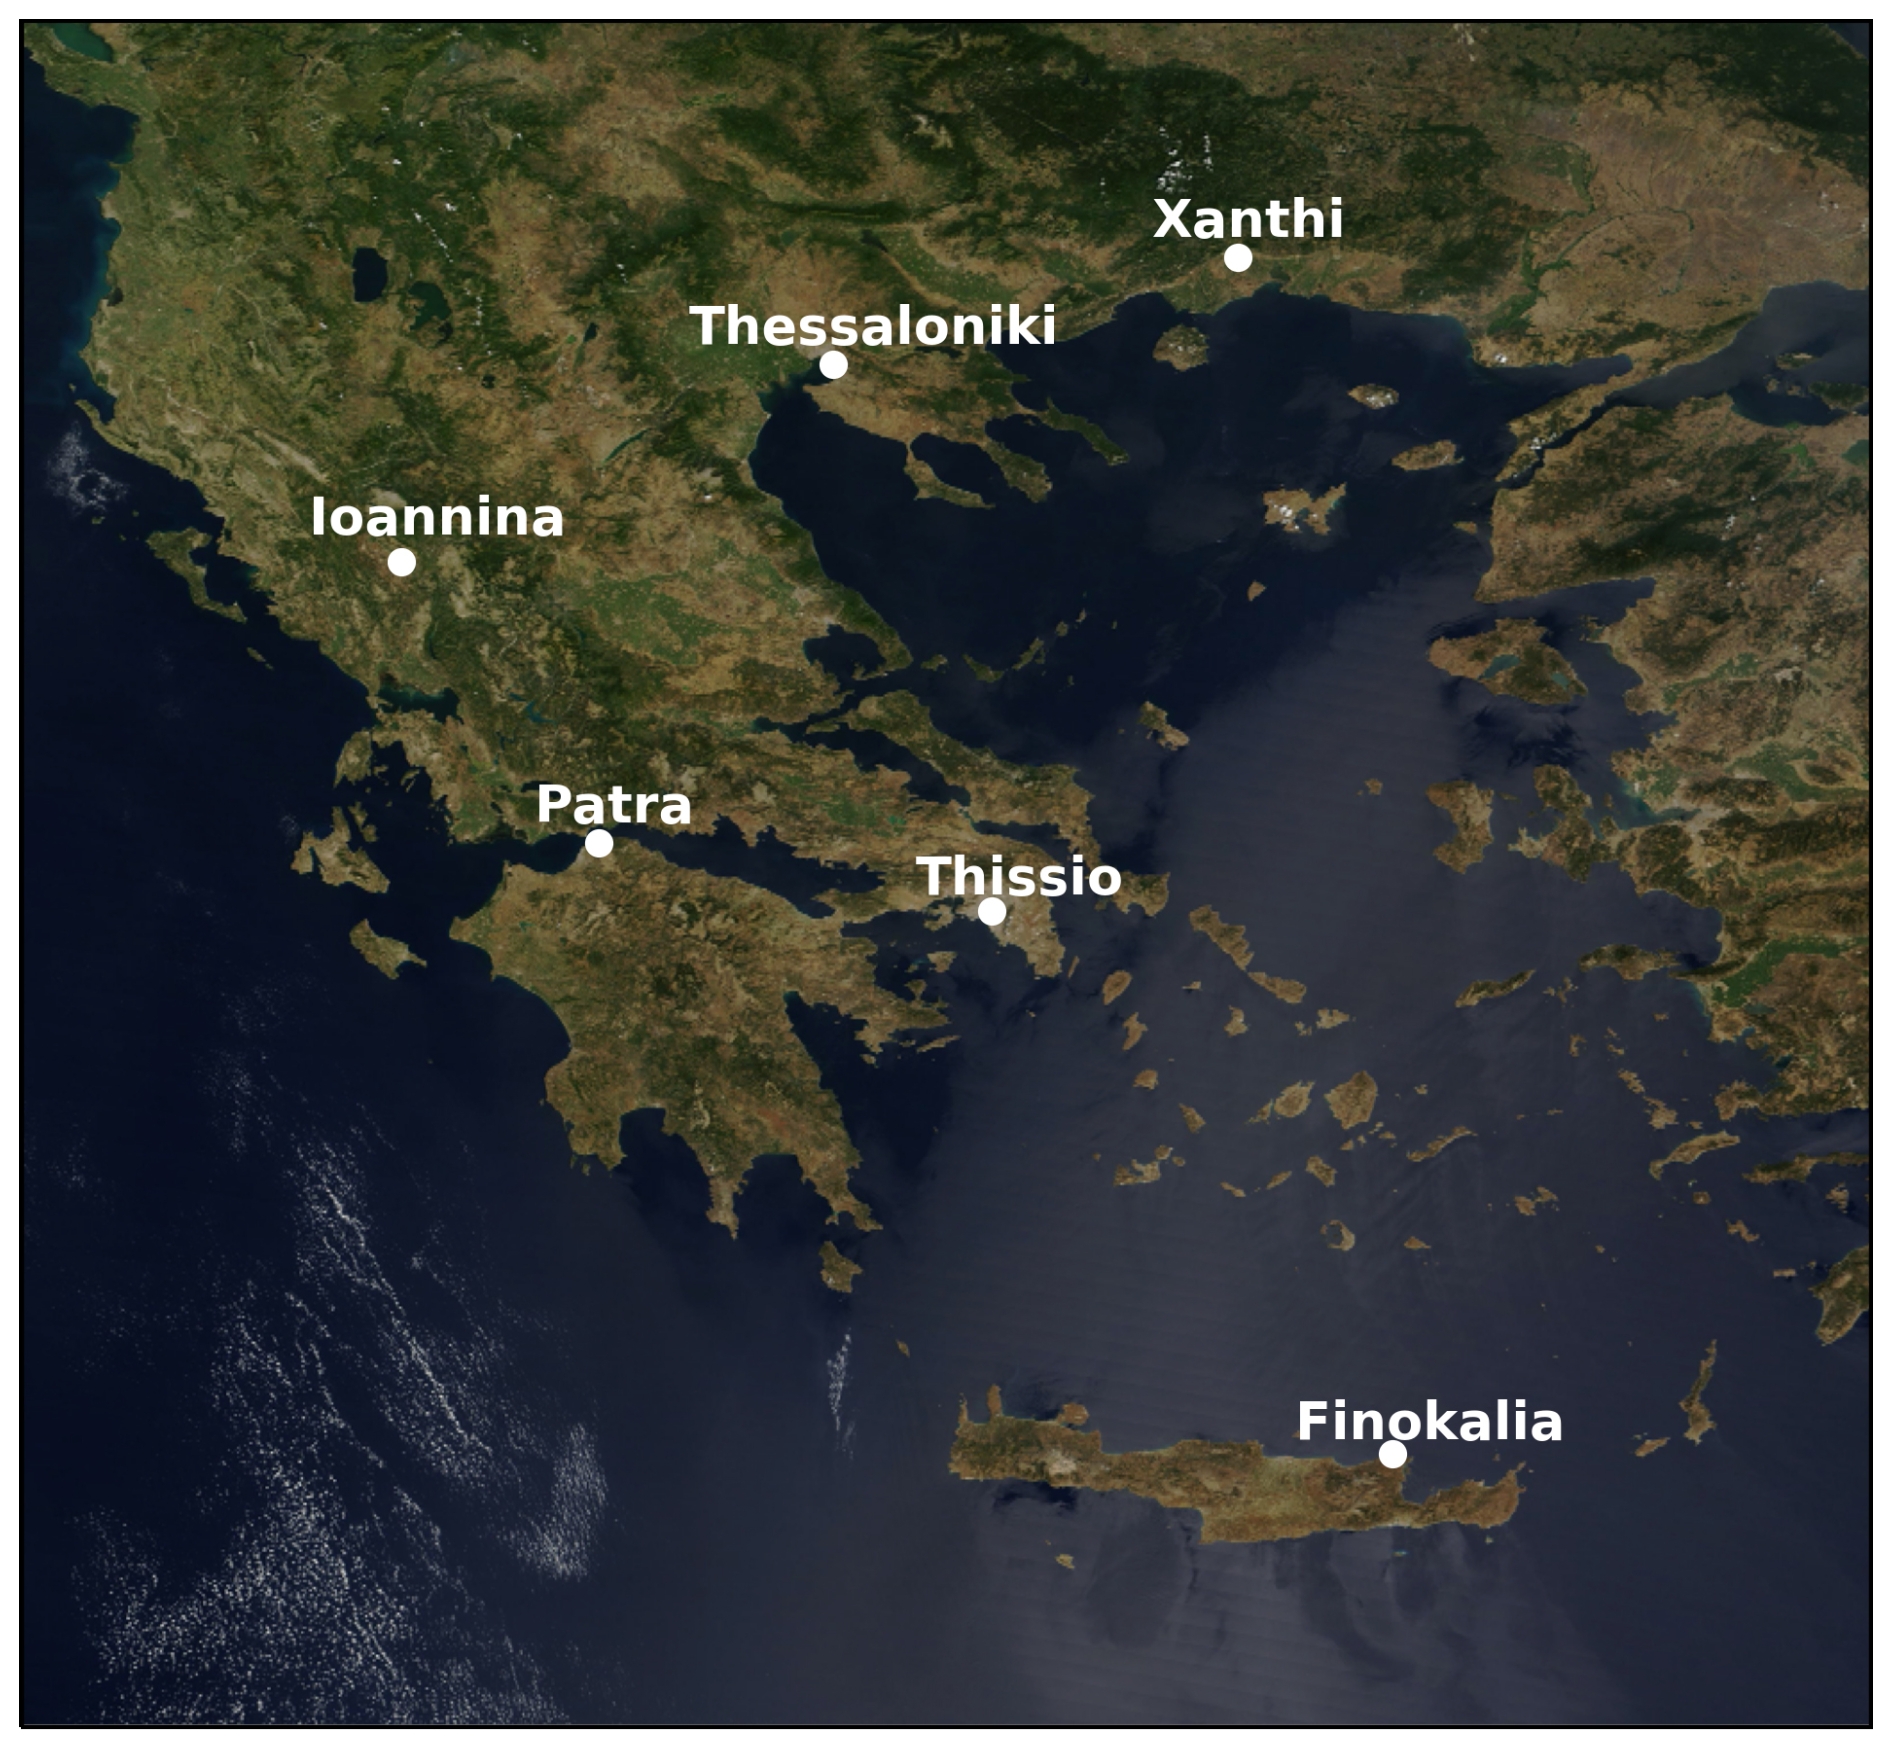
Figure 1Map of the region of Greece and the sampling sites. From south to north, Finokalia (FKL), Thissio (THI), Patras (PTR), Ioannina (IOA), Thessaloniki (LAP) and Xanthi (XAN). Modified from the original MODIS TERRA satellite image of Greece obtained from https://earthobservatory.nasa.gov/images/4778/greece, last access: 18 November 2025). NASA image courtesy Jeff Schmaltz, MODIS Land Rapid Response Team at NASA GSFC.
The Finokalia atmospheric observatory of the University of Crete in Crete, Greece (FKL, 35.33° N, 25.67° E; 250 m a.s.l.) is a remote regional background site in the northeast coast of the island of Crete (south Greece). The site is not subject to any major anthropogenic influence and it is considered as a representative background site for the entire eastern Mediterranean. During the warm months of the year (April to September, dry season) the station mainly receives air masses from the N/NW (originating from the Central and Eastern Europe and the Balkans), while between October and April (wet season) air masses coming from the South lead to Saharan dust events (Mihalopoulos et al., 1997).
The Thissio Air Monitoring station (THI, 37.97° N, 23.72° E, 105 m a.s.l.) of the National Observatory of Athens, Greece is located approximately 50 m above the mean city level near the historical city center. The station is an urban background site due to its distance from traffic and industrial emission sources and receives air pollutants from various urban and regional sources.
The Patras site is located at the Institute of Chemical Engineering Sciences (ICE-HT) of FORTH (Foundation for Research and Technology, Hellas), which is in Platani (PTR, 38.30° N, 21.81° E, 100 m a.s.l.) 8 km from the city center. It is an urban background site. Local sources include transportation, biomass burning (both residential and agricultural) and shipping emissions, while long-range transport is the dominant PM2.5 source during most periods (Pikridas et al., 2013).
The Xanthi station is operated by the Laboratory of Atmospheric Pollution and Pollution Control Engineering of Atmospheric Pollutants of the Department of Environmental Engineering. The station is located in the Kimmeria DUTH campus (XAN, 41.15° N, 24.92° E; 75 m a.s.l.) almost 2 km from the city of Xanthi in northeastern Greece. The station is a rural site and the edge of a slope facing to the south, 20 km away from the seashore. The Rodopi Mountain Range is located to the north of the station. The prevailing winds that reach the site in winter are fairly stable SW/S/SE during the day, but they change to N/NW at night; the location of the site between mountains and a valley creates a closed circulation cell of valley/land breezes (Kastelis and Kourtidis, 2016).
The Thessaloniki station at the north of Greece is at the Laboratory of Atmospheric Physics (LAP), which is located at the School of Sciences of the Aristotle University of Thessaloniki (LAP, 40.63° N, 22.95° E; 50 m a.s.l.). Thessaloniki is a coastal city at Thermaikos Gulf and is the second largest city in Greece. The site experiences air pollution episodes due to the meteorological conditions over northern Greece; with high pressure, anticyclonic systems and sunny weather in summer, while colder temperatures near the surface and snow occur in winter (Flocas et al., 2009). It is considered as a representative urban station.
Ioannina (IOA, 39.653195° N, 20.854208° E) is located in Epirus Region in northwestern Greece, which is separated from the eastern part of the country mainland by the Pindus mountain range (orientated from NW to SE and exceeding 2000 m in height). The sampling station was located at a kindergarten yard, 1.5 km from Ioannina's city center. Ioannina is located on a plateau of about 500 m altitude and is surrounded by mountains. The city is next to the Pamvotis lake and is characterized by frequent fog events in winter, due to increased relative humidity, weak winds and basin-like attributes and winter biomass burning events (Kaskaoutis et al., 2020).
2.2 Measurements
The PANACEA campaigns took place at the 6 sites discussed above during the summer of 2019 (at FKL, THI, IOA) and the winter of 2019–2020 (at all 6 sites). Atmospheric particles were collected daily on quartz-fiber filters using high-volume or low-volume aerosol samplers depending on the site. A Sunset Organic Carbon (OC)/Elemental Carbon (EC) analyzer was used to determine the concentrations of OC and EC, while the inorganic cations: ammonium (NH), potassium (K+), calcium (Ca2+), magnesium (Mg2+), sodium (Na+) and anions: sulfate (SO), chloride (Cl−), nitrate (NO) were determined using ion chromatography. Details on the methods of the PM2.5 filter analysis during the PANACEA winter and summer campaign can be found in Kaskaoutis et al. (2022). In situ-measurements of temperature and relative humidity were also available for the period of the campaigns (Figs. S1 and S2 in the Supplement).
For the campaign period there were not available gas phase concentrations (NH3, HNO3) measurements at any of the 6 sampling sites except PTR (NH3). Thus, for NH3, satellite data were used for the remaining sites (except IOA during the winter campaign period). For HNO3, past in situ measurements were used at FKL and for the other sites (THI, PTR, IOA, LAP, XAN) past in situ measurements conducted at THI were used. A summary of the type of NH3 and HNO3 measurement data used (satellite or in-situ, simultaneous or past, same or neighbor site), is presented in Table S2.
In more detail, the Patras site as mentioned above, was the only site with available gas-phase NH3 measurements for the studied periods during the 2019–2020 winter campaign, with mean NH3 concentration of 2.54±0.90 µg m−3. At IOA during the wintertime period of the study, neither in situ observations nor satellite data were available and thus NH3 observations at PTR were used for IOA. Therefore, the mean NH3 concentration value from PTR dataset was also used for the IOA wintertime simulations.
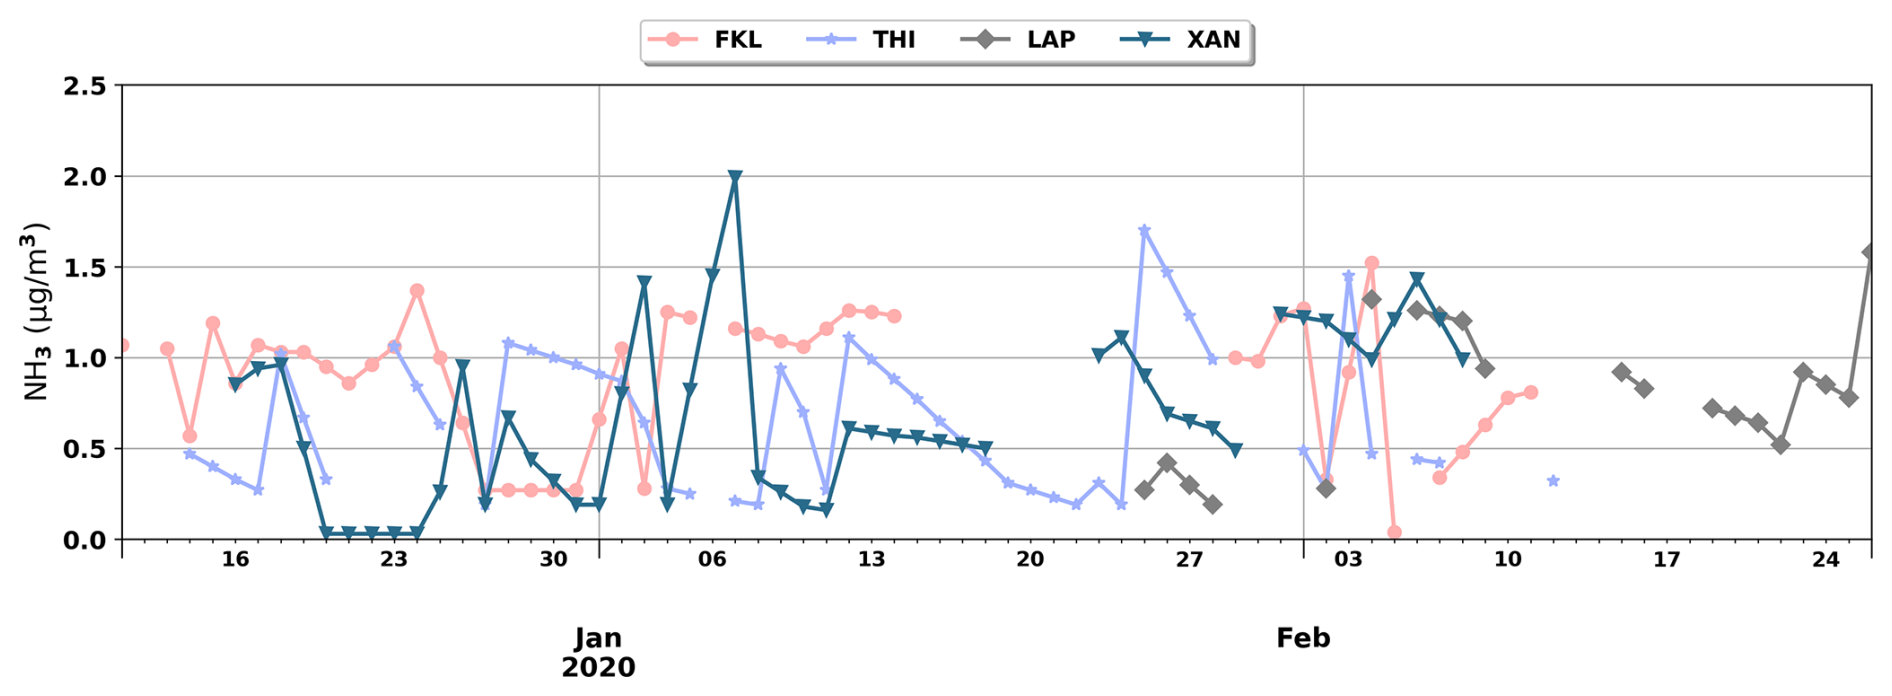
Figure 2Daily surface NH3 concentrations during the winter of 2019–2020 as derived from the Cross-track Infrared Sounder (CrIS) instrument for FKL, THI, LAP and XAN.
For the other sites (FKL and THI during winter and summer, and LAP and XAN during winter) NH3 data (level 2 data, version 1.6.3) were used from the Cross-track Infrared Sounder (CrIS) instrument which is deployed on board the Suomi National Polar-orbiting Partnership (SNPP) platform (into an orbit with an altitude of 824 km above the Earth surface) (Shephard and Cady-Pereira, 2015). NH3 values over these sites were obtained from the CrIS Fast Physical Retrieval (CFPR) product, which provides NH3 concentration data for a total of 15 vertical levels, with the value closest to the ground being taken as the near-surface concentration. From the available CrIS near-surface NH3 concentrations within a 50 km diameter area around each site, the value within the pixel at the closest distance to the site is retained (Shephard et al., 2020; Shephard and Cady-Pereira, 2015). The wintertime near-surface NH3 concentrations as derived from CrIS for FKL, THI, XAN and LAP are shown in Fig. 2. For summer at FKL and THI, mean values of summertime near-surface NH3 (from 13 to 19 August 2019 for FKL and from 13 to 31 August 2019 for THI) are 1.24±0.61 µg m−3 and 1.32±1.53 µg m−3 respectively, were used due to the scarcity of summertime data from CrIS in 2019.
For IOA during summer, a mean NH3 concentration of 1.04 µg m−3 was used as derived from the Atmospheric Infrared Sounder (AIRS) aboard NASA's Aqua satellite (Level 3 data) operating from September 2002 to August 2016 (Warner et al., 2016) (the mean summertime 2002–2016 concentration was used).
For HNO3 and HCl gas-phase concentration measurements, samples were collected only at Finokalia (2015–2016) using glass fiber filters coated with Na2CO3 and were analyzed by ion chromatography. The median of these gas-phase measurements of HNO3 and HCl were used here (0.63 and 0.98 µg m−3 for winter and 0.95 and 1.34 µg m−3 for summer, respectively). For all other sites, gas-phase measurements of HNO3 conducted at Thissio from December 2014 to March 2016 (Liakakou et al., 2022) were used here as mean values (0.53±0.12 µg m−3 for winter and 0.91±0.29 µg m−3 for summer).
Since the NH3 in situ observations at PTR did not coincide with any CrIS or AIRS data, a comparison between in situ and satellite data was not possible. The sensitivity of our pH estimates to these assumed NH3 and HNO3 concentrations will be examined in a subsequent section (see Sect. 3.4).
2.3 pH estimation
The pH of the fine aerosol at the 6 studied sites, was calculated using ISORROPIA-lite thermodynamic model (Kakavas et al., 2022), which is an extension of the ISORROPIA-II model (Fountoukis and Nenes, 2007). ISORROPIA-lite treats the same system of aerosols as ISORROPIA-II (Ca2+, K+, Mg2+, SO, Na+, NH, NO, Cl−, H2O and their equilibrium with the gas phase HNO3, NH3, HCl and H2O) with the addition of the organic aerosol and considering only the deliquescent aerosol at all RH values. The addition of organic matter in the thermodynamic equilibrium aerosol system, results in more aerosol water which favors the partitioning of semivolatile inorganic species into the aerosol phase in order to satisfy the equilibrium (Kakavas et al., 2022). The particle water (Worg) associated with the organic aerosol is implemented in the model using the hygroscopicity parameter (κorg). The total aerosol water content, i.e. the water associated with the inorganic and organic parts of the aerosol, is the sum of the inorganic and organic water and it is used in the thermodynamic calculations. The aerosol pH is then calculated by:
where is the activity coefficient of the hydronium ion (H+) here assumed unity, is the equilibrium particle hydronium ion concentration per volume air (µg m−3), Winorg and Worg is the water associated with the inorganic and organic part of the aerosol, respectively (both in µg m−3). Thus, the aerosol pH was calculated including the contribution of the organic aerosol hence the aerosol water associated with both inorganic and organic species. Daily values were used as input to the model. These were gas phase (NH3, HNO3) and particulate phase (ions and OA) concentrations, OA hygroscopicity and density, and meteorological data (temperature and relative humidity).
To calculate the aerosol water content associated with the organic species, the total organic aerosol concentration (OA) derived from the OC measurements at each site is used together with an OA OC ratio of 1.8 for all sites. This average ratio is consistent with the results of measurements conducted at the same sites (Florou et al., 2017; Hildebrandt et al., 2011; Kaskaoutis et al., 2020, 2022; Kostenidou et al., 2015; Pikridas et al., 2013; Stavroulas et al., 2019; Tsiflikiotou et al., 2019). The hygroscopicity parameter was set to κorg=0.16 for Finokalia as suggested in studies for this site (Bougiatioti et al., 2009; Kalkavouras et al., 2019), and κorg=0.12 for the other sites (Psichoudaki et al., 2018).
3.1 Aerosol composition
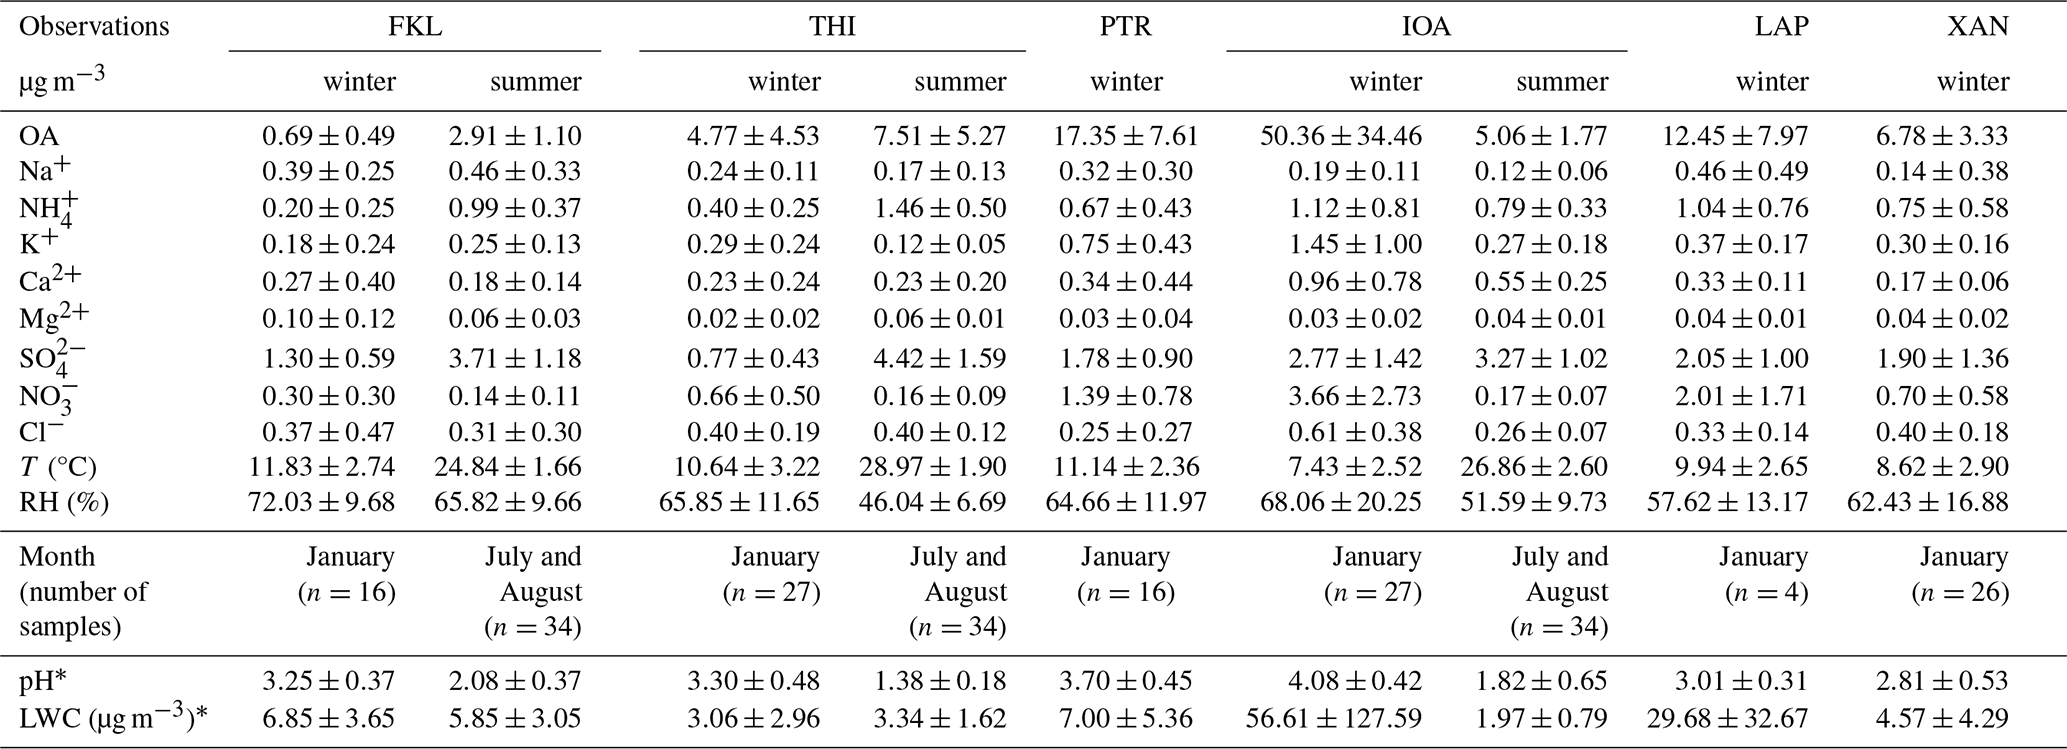
The chemical composition and mass concentration of the major species in PM2.5 measured during the PANACEA campaigns are summarized in Table 1. The dominant PM2.5 component was OA at all sites except FKL, where sulfate dominated both in winter and summer. This is typical for remote background sites (Lemou et al., 2020; Sciare et al., 2008). Higher sulfate levels were present in FKL during summer due to high temperatures and photochemistry, followed by organics (typically consisting 20 %–30 % of the PM2.5 mass (Pikridas et al., 2010; Putaud et al., 2004). The highest levels of OA were observed at Ioannina (IOA) during winter. OA represented more than 60 % of the PM2.5 and was mainly due to residential wood burning emissions while the meteorology and topography of the area facilitated the accumulation of all pollutants (Kaskaoutis et al., 2022). Much lower levels of OA and PM2.5 mainly of regional origin, were measured at IOA in the summer (Kaskaoutis et al., 2022). At the three sites where measurements were available in the summer (IOA, FKL, THI), sulfate was a major component of the PM2.5 despite their different characteristics. Inorganic PM2.5 across all sites in winter was dominated by sulfate except IOA where, interestingly, NO was the dominant inorganic PM2.5 component due to possible high NOx emissions, or NOx accumulation in the boundary layer due to low inversion heights and decreased horizontal circulation, the latter due to surrounding mountains. The K+ levels in IOA were also elevated indicating the influence of biomass burning in the area (Kaskaoutis et al., 2022).
Table 1Descriptive statistics (mean ± stdev) for the chemical composition of PM2.5 during the winter and summer PANACEA campaigns. OA is the organic aerosol derived from OC measurements and a ratio of OA OC of 1.8. Meteorological conditions are also provided. * The aerosol pH and LWC calculated with ISORROPIA-lite are also provided (n = number of days).
3.2 Aerosol pH across Greece
3.2.1 Winter
The distributions of estimated pH of PM2.5 as derived from the ISORROPIA-lite model for the 6 studied sites during winter (January 2020) is shown in Fig. 3a. Due to the lack of data in some of the sites during the winter 2019–2020, the results of only January 2020 were used in order to be able to compare the aerosol pH results among the sites. The entirety of the aerosol pH results for all sites during winter 2019–2020 can be found in Fig. S4.
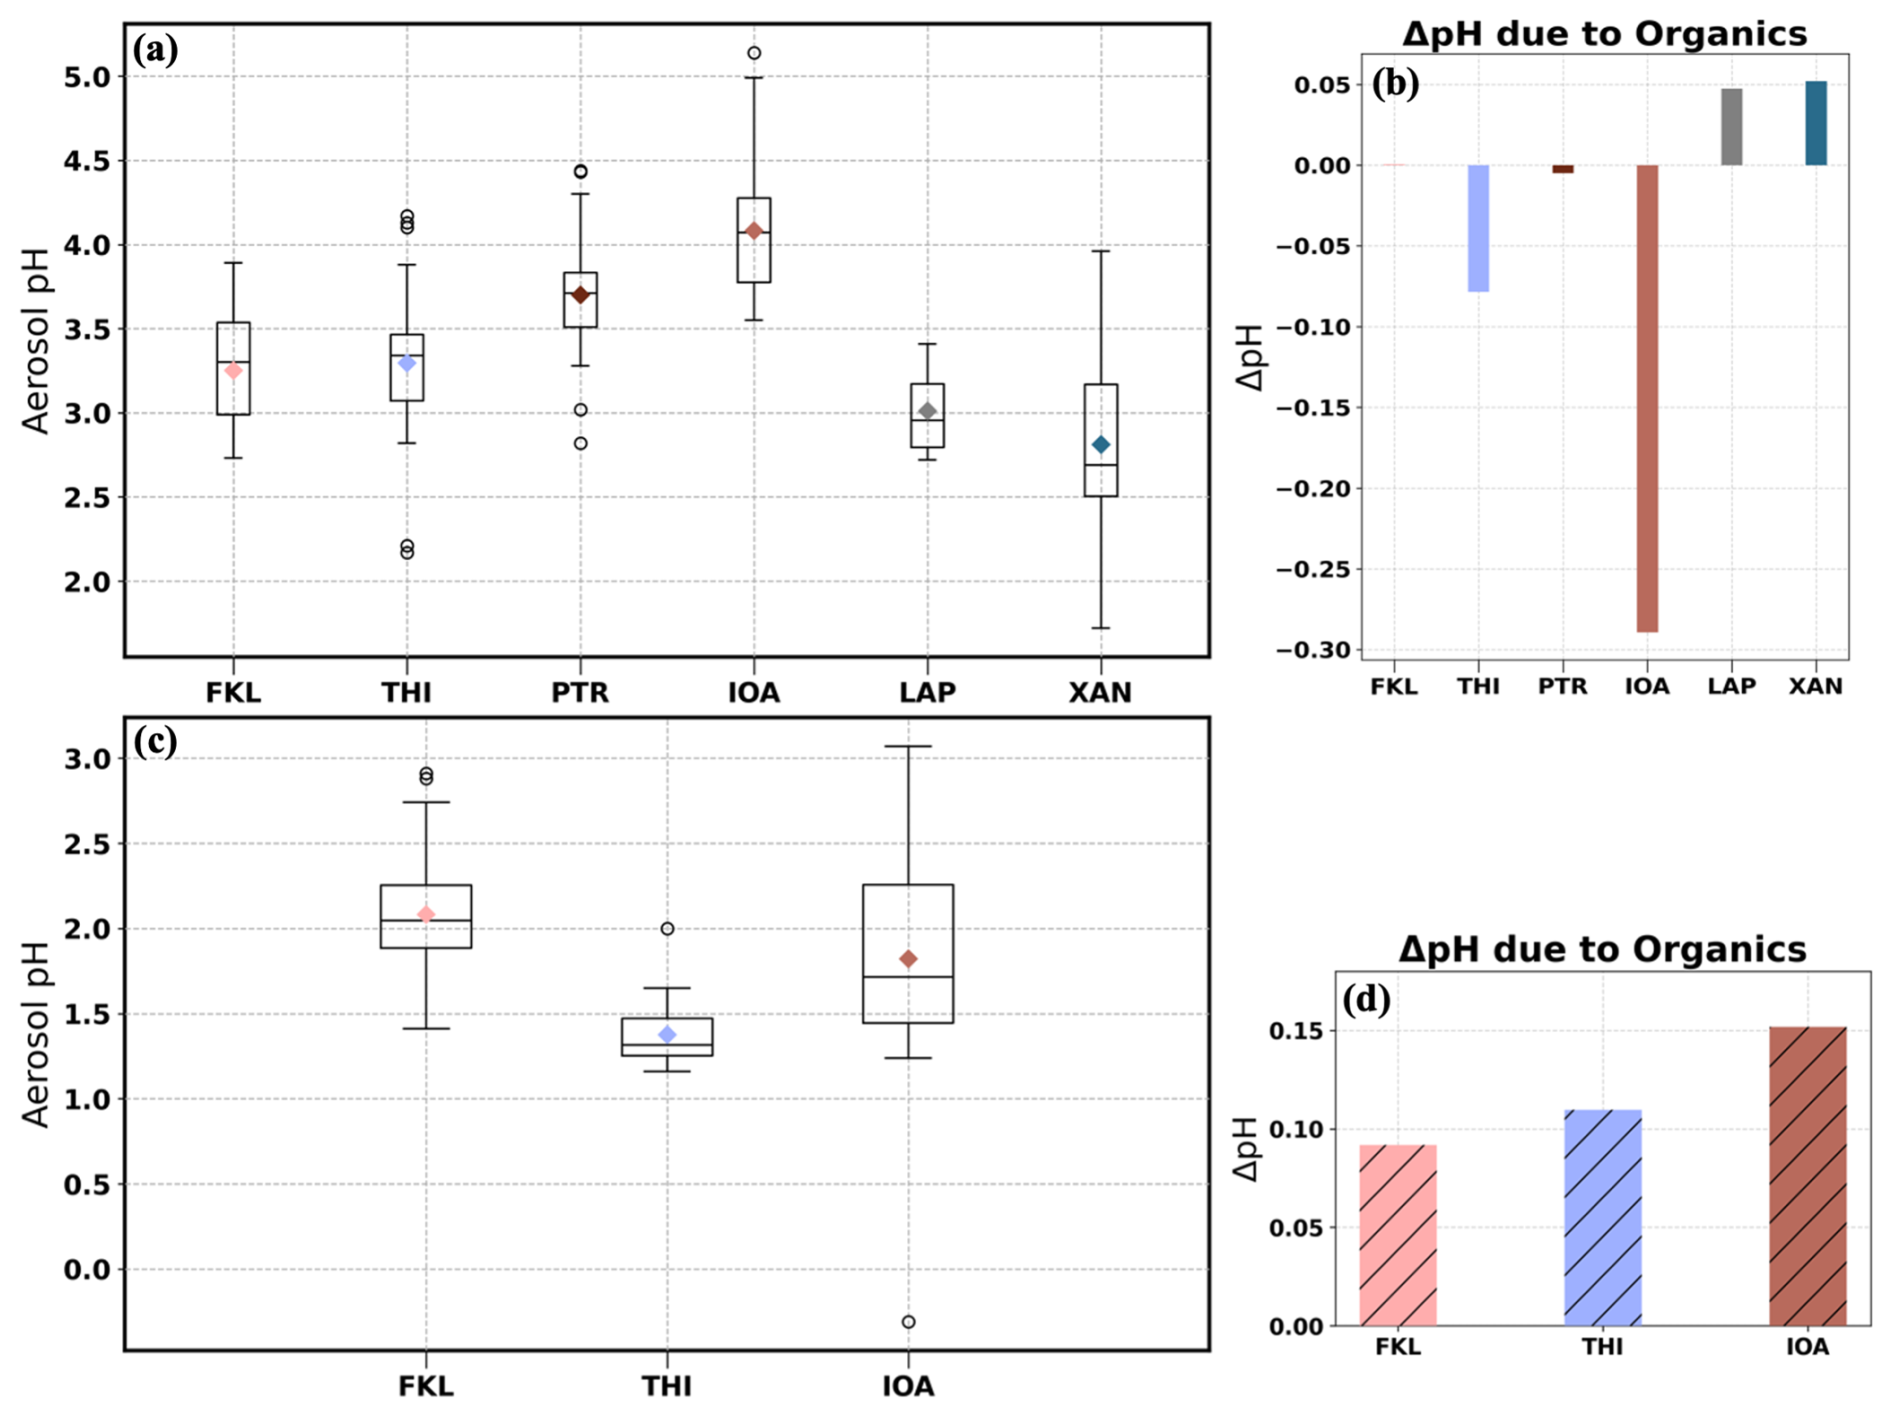
Figure 3(a, c) Total aerosol pH (meaning the aerosol pH associated with inorganics and organics) derived using ISORROPIA-lite in January 2020 and summer 2019 (July and August) respectively, (b, d) ΔpH = total aerosol pH − inorganic aerosol pH both derived from ISORROPIA-lite in January 2020 and summer 2019 respectively. The inorganic aerosol pH was derived by setting the organic concentration and hygroscopicity as zero.
In January the aerosols at THI were slightly acidic with a wide range of pH values (2.17 to 4.17), reflecting the variation of the PM2.5 composition and meteorology. The mean pH was 3.30±0.48 (median 3.34). Days with highly acidic aerosol, i.e. pH below 2.5, were associated with elevated sulfate levels and northerly winds. At FKL the mean aerosol pH was 3.25±0.37 and ranged from 2.73 to 3.89 (median 3.30). The elevated pH coincided with high concentrations of nonvolatile cations (NVC) and NH3 and the lower pH values (less than 2.8) occurred during periods with high levels of sulfates. In the northern part of Greece, at XAN the pH range covered 2.24 units with a mean value of 2.81±0.53 (median 2.69). The shift between acidic and moderately acidic conditions was associated with changes mainly in NH3 and sulfate levels. Days when pH reached almost 4, were characterized by high K+ in combination with high OA and EC levels and low sulfates suggesting significant influence of biomass burning. At LAP the pH of PM2.5 ranged from 2.72 to 3.41, with a mean value of 3.01±0.31. Please note that only 4 days of PM2.5 measurements were available in LAP during January 2020. The fine aerosol in IOA had the lowest overall acidity with a mean value of 4.08±0.42 units and a range between 3.55 and 5.14 units. These levels of acidity are a consequence of the intense biomass burning during this winter campaign at IOA (Kaskaoutis et al., 2022). Elevated K+ levels were observed, due almost entirely to wood burning for heating. Comparing IOA with the other sites in January, there is a statistically significant difference in aerosol acidity levels due to higher Ca2+, K+ and NH3 combined with lower temperature, despite the high sulfates levels in the area (Table 1). At PTR aerosol pH ranged from 2.82 to 4.44 units with a mean value of 3.70±0.45. NVCs (Ca2+, K+, Mg2+ and Na+), NH3 and sulfates drove the variability of the aerosol pH most of the days. Aerosols at LAP and XAN exhibited the highest acidity (lowest pH levels) among all studied sites, while IOA and PTR exhibited the highest aerosol pH levels (Fig. 3a). Remarkably, aerosol acidity at the urban background site (THI) was similar to that at the coastal background site (FKL). On the other hand, the suburban site (PTR) had higher aerosol pH mainly due to the likely higher NH3 levels at PTR than THI and FKL (Table 1), considering though the different ways NH3 was measured for these sites. Considering the two remote rural and coastal areas (XAN and FKL), their fine aerosol pH differed by about half a pH unit due to increased Na+, Mg2+ and relative humidity levels at FKL together with slightly higher sulfate concentrations at XAN.
The accuracy of the aerosol pH predictions using ISORROPIA-lite was evaluated by comparing the observed with the predicted partitioning coefficient of NH (ε(NH)) and this comparison was possible only at PTR during winter when both NH3 and NH were measured. A useful way to assess the reliability and potential uncertainties of such models' predictions of aerosol pH is the comparison between measured and simulated gas-particle partitioning fractions of semivolatile species (Guo et al., 2016). Figure 4 shows the comparison of the observed and predicted ε(NH) calculated for the case of PTR in winter. We focus on PTR since it was the only site where NH3 in-situ measurements were available making it a more suitable case for such comparison. The measurements and predictions of total NH3 are well correlated (R2=0.78) although the model underestimates by 30 % the ε(NH). A sensitivity test and a re-evaluation of the model discussed in Sect. S4 (Fig. S3) indicates that this small underestimation can be attributed to the uncertainty in the HNO3 levels. Sensitivity tests regarding the gas phase NH3 and HNO3 used to estimate aerosol pH are also provided (Sect. 3.4). Overall, PM2.5 during winter varied from acidic to moderately acidic, with an average pH across all studied urban and urban background sites of 3.57±0.44. The overall PM2.5 pH range across all 6 sites was from 1.72 to 5.14.
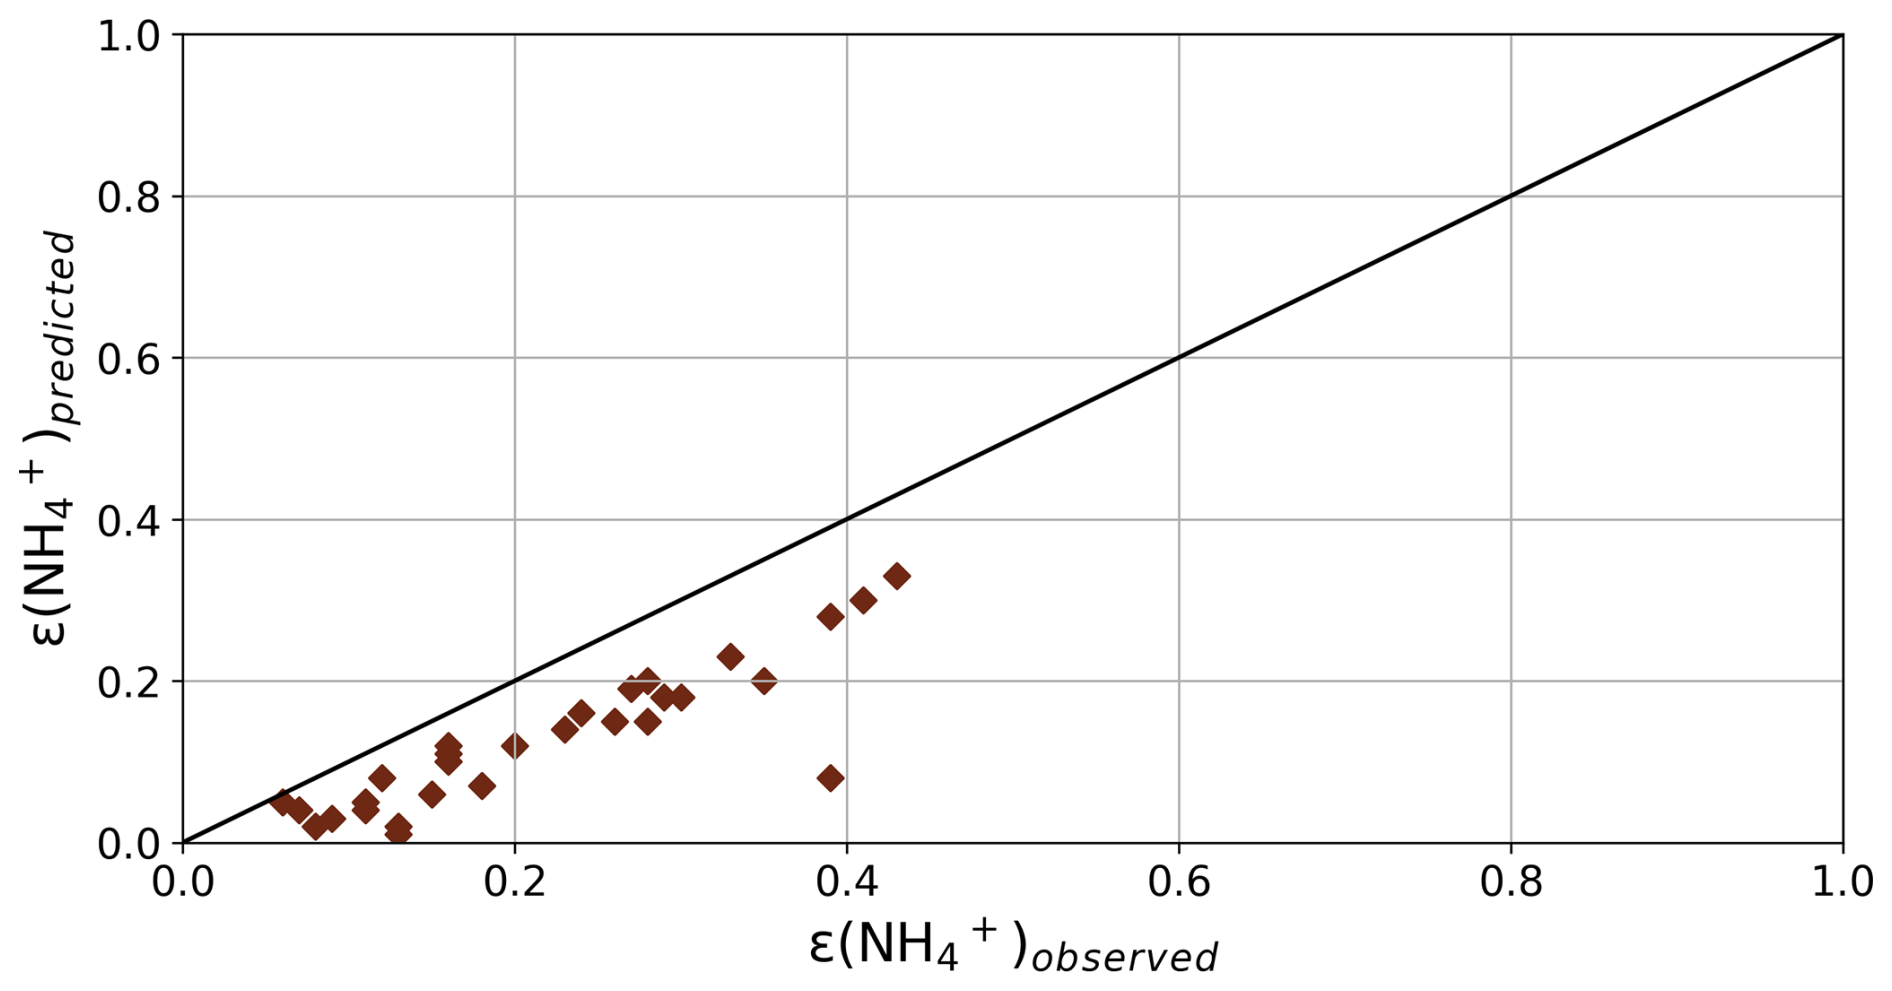
Figure 4Evaluation of the ISORROPIA-lite results for the case of PTR in winter. Comparison of the partitioning coefficient of NH calculated from measurements with that from the predicted concentrations derived from the model (R2=0.78 and ). The partitioning coefficient is defined as ε (NH = NHNH + NH3). The black line shows the 1:1 ratio.
3.2.2 Summer
The seasonal variation of the acidity of PM2.5 was investigated at three of the sites, THI, FKL and IOA in which measurements were available for the summer 2019 PANACEA campaign. The mean PM2.5 composition is summarized in Table 1. During the whole period, PM2.5 at the three sites was acidic with a mean pH of 1.35±0.18 at THI, 1.75±0.62 at IOA and 2.08±0.45 pH at FKL (Fig. 3c). At THI the PM2.5 pH was consistently low throughout the summer period with a minimum value of 1.13, and a maximum of 2. At IOA and FKL the PM2.5 pH was slightly higher than at THI. At FKL relative humidity levels increased the aerosol water content and together with the relatively high K+ and Na+ levels led to higher aerosol pH. Higher Ca2+ and K+ levels at IOA and slightly higher sulfate levels at THI seemed to be the factors controlling the difference in the aerosol pH between these two sites. Overall, comparing the summertime (July and August) aerosol pH levels at the three sites (Figs. 3c and S5), a uniformity can be observed with high aerosol acidity being the case on most of the days, dropping even below 0 at IOA as a result of increased temperature and sulfate levels and reduced aerosol water. FKL and IOA had similar aerosol pH levels since most of the major aerosol components had similar concentrations at the two sites. The higher Ca2+at IOA was balanced by the higher Na+ in FKL.
3.2.3 Impact of organics
In order to investigate the potential effect of OA on the aerosol pH levels, ISORROPIA-lite was also run considering only the inorganic components of the aerosol (i.e. setting the OA concentration to zero). The mean difference between the aerosol pH calculated considering all aerosol components, including organics and the one accounting only for the inorganic content of PM2.5 is shown in Fig. 3b and d for January 2020 and summer 2019, respectively. The water associated with the OA in most cases reduces the H+ concentration and therefore increases the aerosol pH (Kakavas et al., 2022). However, this expected increase in aerosol pH due to OA was not always found at all sites, because of the resulting changes in the partitioning of the semivolatile compounds from the gas phase to the aerosol phase. This partitioning affects the OA induced change in the H+ concentration ( concentration in Eq. 1), which together with aerosol water determine the aerosol pH.
In January at IOA, THI and PTR, the addition of aerosol water associated with the OA did not always increase the overall aerosol pH. In fact, a mean decrease of about 0.3 pH units was found at IOA, which had the highest OA concentrations among the 3 sites. Figure 5a depicts the aerosol water associated only with the inorganics along with the total one (i.e. including the OA water) and relative humidity and in Fig. 5b the timeseries of the aerosol pH at IOA is shown in which again the one associated only with the inorganics and the one including the OA water (total aerosol pH) is depicted. An increase in the aerosol pH as a result of the addition of the organics is clear only at the end of January (from 26 to 29 January); the total aerosol pH was higher than the one when OA was absent (by 0.19 pH units on average). This was due to the high aerosol water content, which resulted from high relative humidity (above 80 %). The addition of the OA increased aerosol water even more (Fig. 5a). On all the other days in January with lower relative humidity, the addition of OA resulted in relative small increases in aerosol water. The partitioning of the semivolatile species to the aerosol phase increased, by decreasing the gas phase concentration (change up to 0.10 µg m−3 for NH3, 0.18 for HNO3 and 0.12 for HCL), and similarly increasing the corresponding aerosol phase (NH, NO and Cl−). Furthermore, addition of considerable amounts of aerosol water affects the activity coefficients of all ionic species (especially sulfate/bisulfate ions and NH, which shifts the ionic balance slightly. In addition, the free H+ approximation of pH that we are using (Eq. 1) does not consider shifts in the activity coefficient in H+ (Pye et al., 2020). Overall, the increase in the concentrations of the acids exceeded that of ammonium, therefore the concentration of H+ increased. The increase in aerosol water did not counterbalance the increase in H+ concentration resulting in a more acidic aerosol (lower aerosol pH). The highest decreases in pH were observed in days where high aerosol pH occurred (inorganic aerosol pH above 4.5 units, mean pH decrease 0.58 units). At the other two sites the aerosol pH decreased by about 0.08 pH units at THI and 0.01 at PTR. These relatively rare, but still important, set of conditions require further tests of thermodynamic model pH predictions.
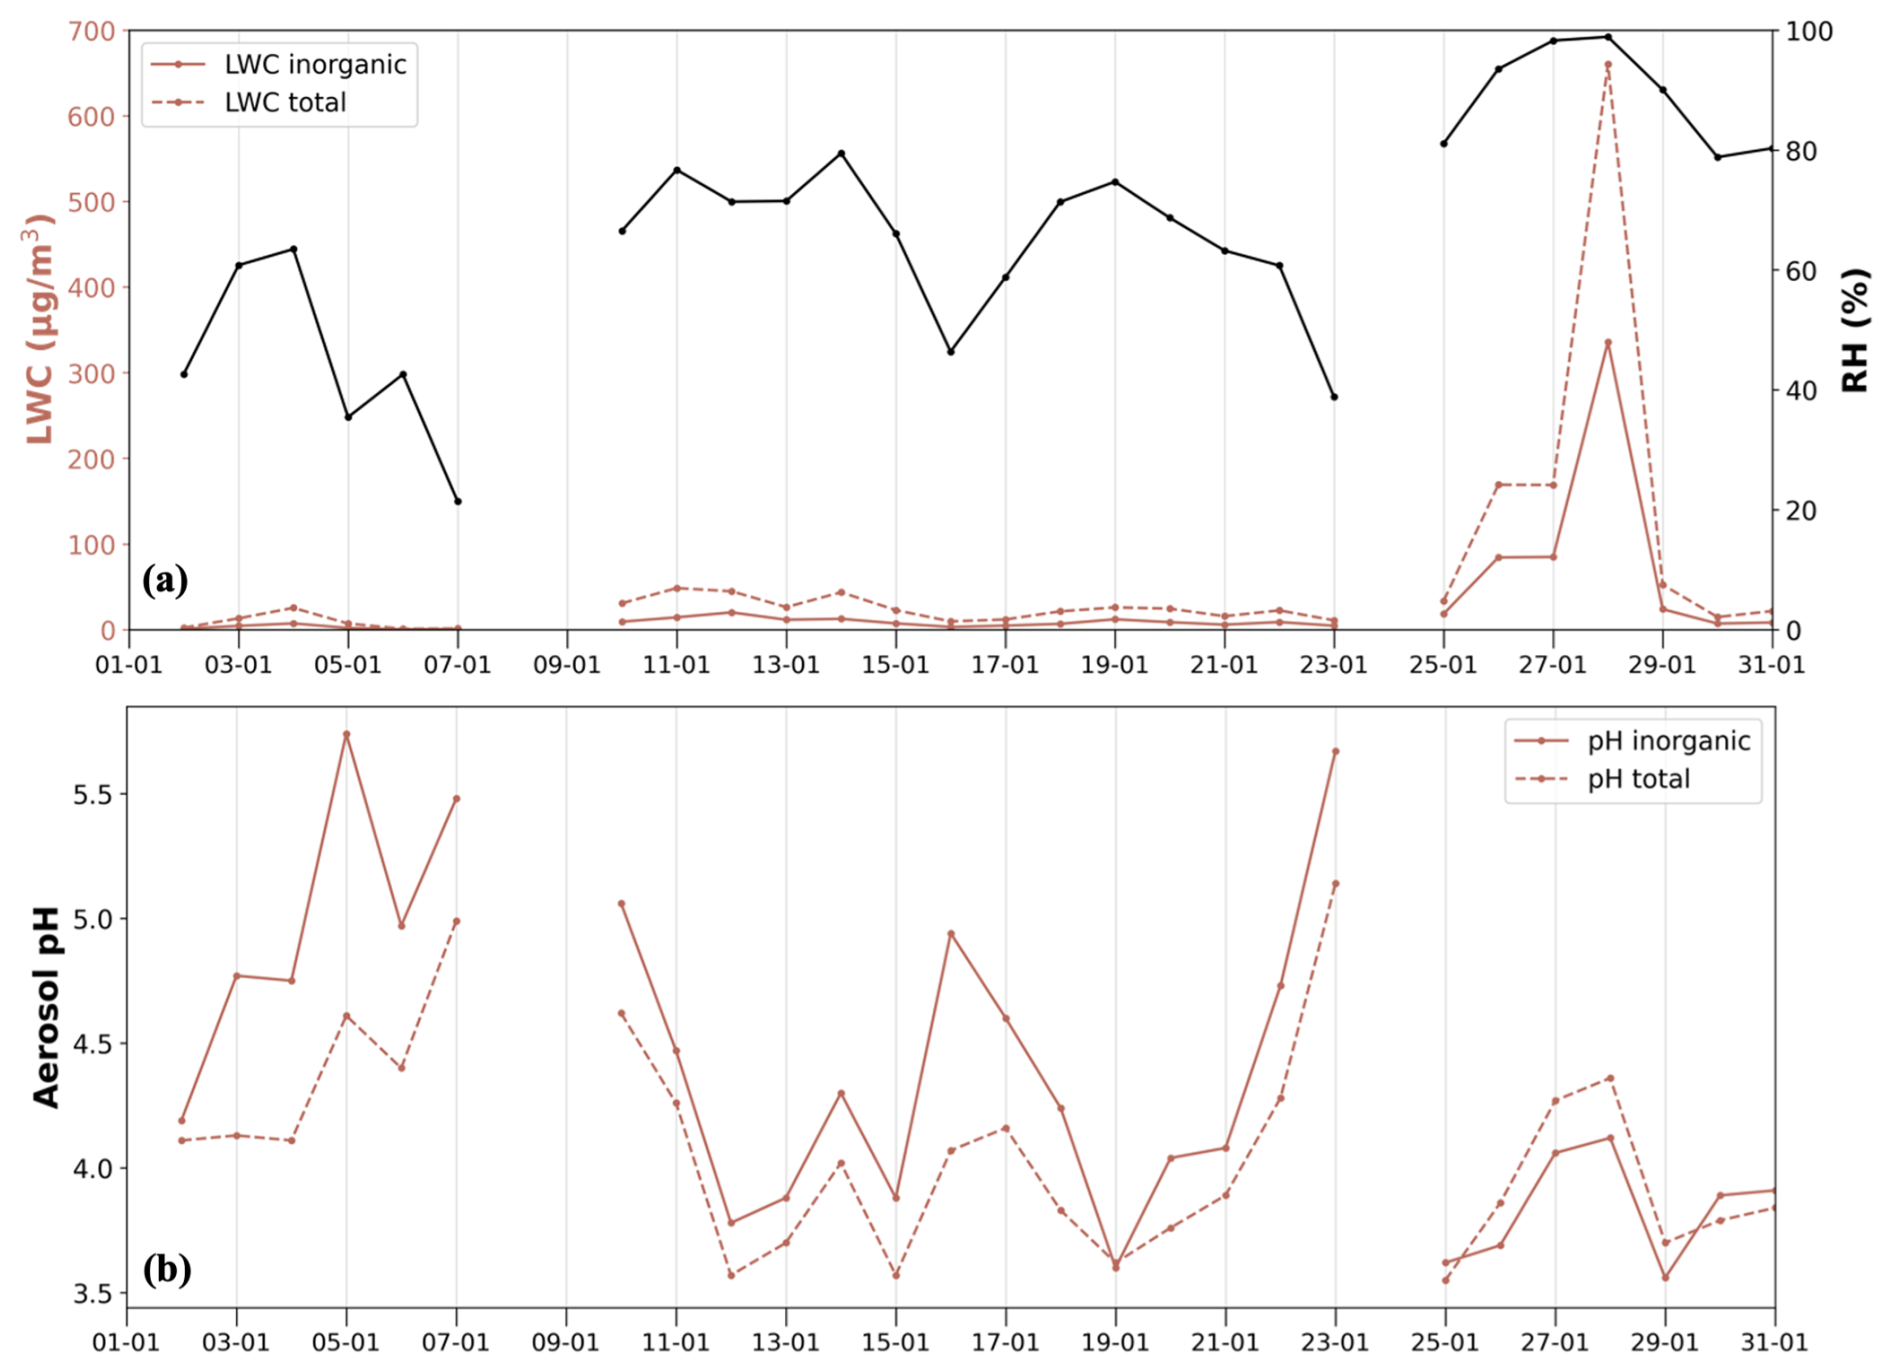
Figure 5(a) Aerosol liquid water content at IOA in January 2020 as derived from ISORROPIA-lite associated with inorganics (inorganic, red line), associated with both inorganics and organics (total, red- dashed line) and relative humidity levels (secondary y axis, black line). (b) Inorganic (red line) and total (red dashed line, associated with inorganics and organics) aerosol pH at IOA in January 2020.
At FKL, XAN and LAP a small increase in aerosol pH was found; 0.001, 0.05, 0.05 pH units increase respectively. In the summer (July and August), the pH increased at all sites when considering OA water, with the highest predicted increase of about 0.15 at IOA. At the other sites the aerosol pH increased by about 0.09 units at FKL and 0.11 at THI. Therefore, the effect of the organics on the pH at all sites was on average less than 0.3 units.
3.2.4 Main factors controlling seasonality of pH
A clear seasonal difference in acidity was observed at all sites. In summer PM2.5 at FKL was 1 pH unit more acidic than in winter. To determine the main drivers of aerosol pH seasonal variability, a series of sensitivity simulations were performed using the concentrations of aerosol components and meteorological conditions observed in winter and replacing each time one of them by its corresponding mean value in summer. Then, the difference in the estimated aerosol pH was calculated. The factors that were tested were: temperature, relative humidity, TNO3 (sum of gas-phase HNO3 and particulate NO), TNH3 (sum of gas-phase NH3 and particulate NH), sulfates, Na+, K+, Ca2+ and OA. The results for FKL are shown in Fig. 6f and Table S5 as ΔpH, that is the pH of the base case simulation minus that of the perturbation scenario. Sulfate was the main contributor to the change in aerosol acidity between summer and winter at FKL, where the 2 µg m−3 concentration difference between the two seasons resulted in 1.66 units of pH difference. Total NH3 availability was the second most important factor with a mean ΔpH of 0.39 followed by temperature (mean ΔpH = 0.30) and Na+ (mean ΔpH = 0.25). The effect of the remaining factors was on average less than 0.20 pH units; TNO3 (mean ΔpH = 0.17), relative humidity (mean ΔpH = 0.16), K+ (mean ΔpH = 0.15), Ca2+ (mean ΔpH = 0.14) and OA (mean ΔpH = 0.08).
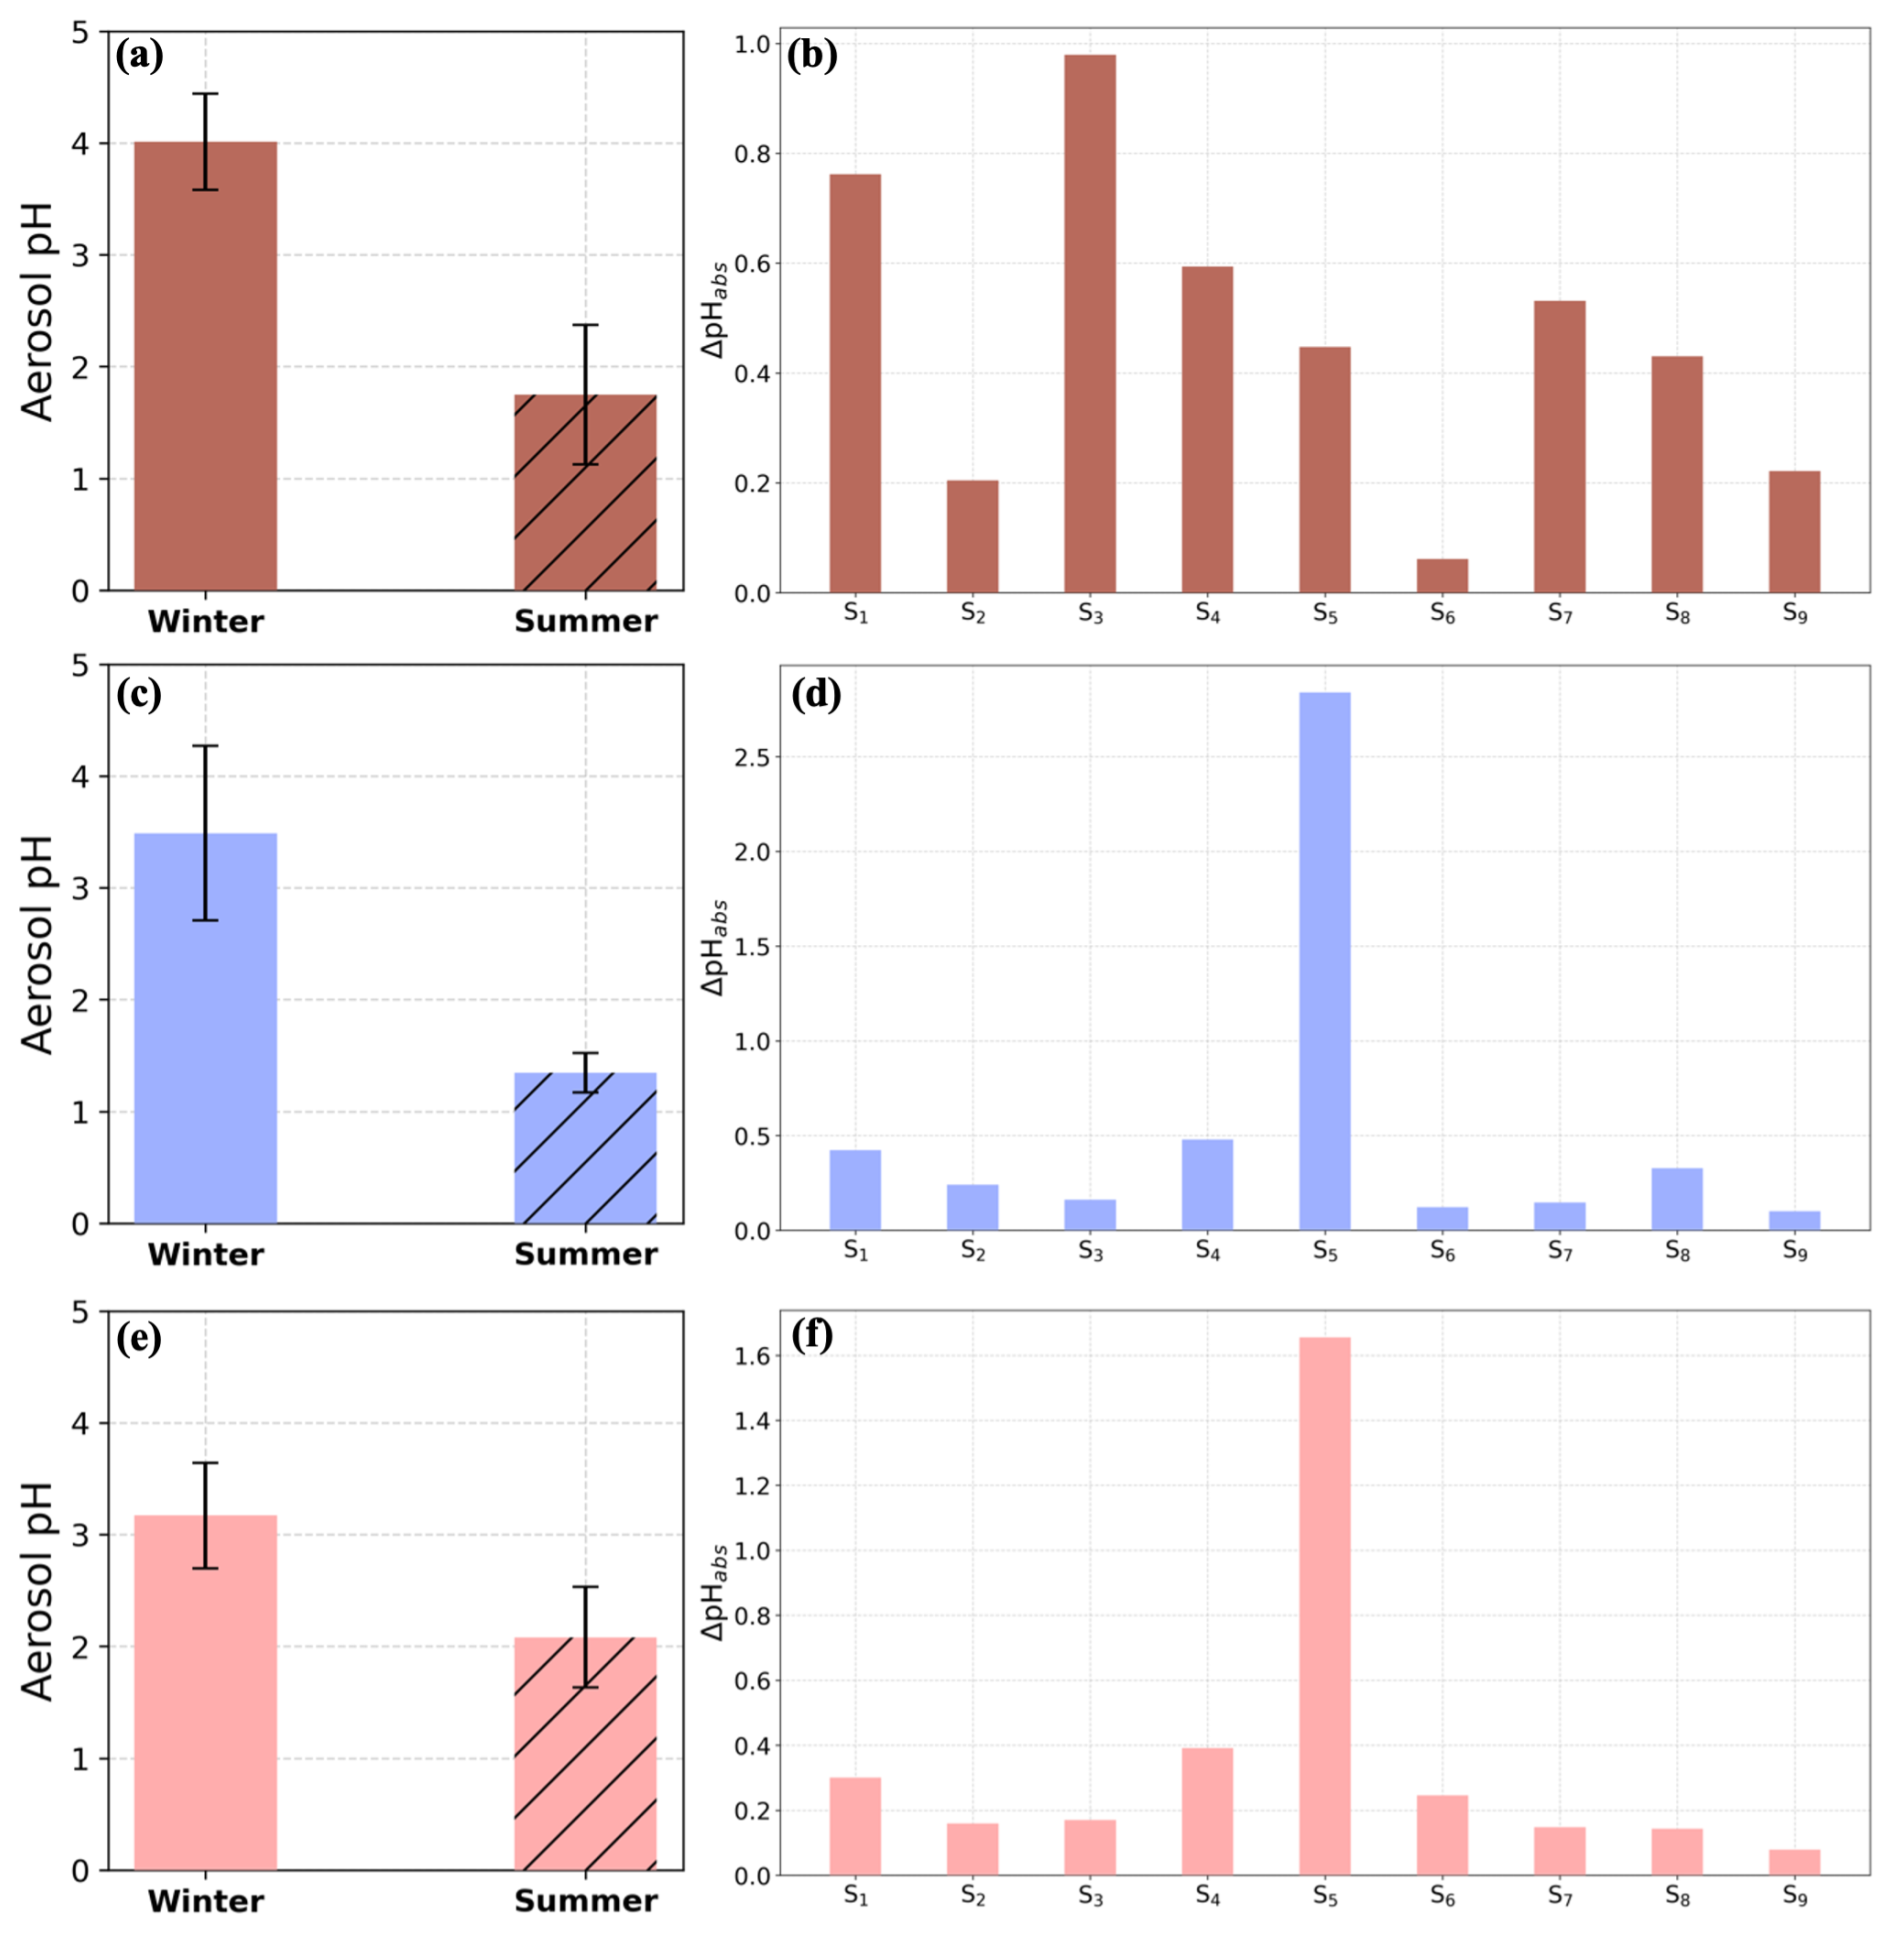
Figure 6Mean fine aerosol pH in winter and in summer at (a) IOA, (c) THI, (e) FKL and the respective sensitivity results for winter conducted for each site (Tables S5–S7). , where summerX is the mean summer temperature (first simulation, S1), relative humidity (S2), TNO3 (S3), TNH3 (S4), SO (S5), Na+ (S6), K+ (S7), Ca2+ (S8) and OA concentration (S9) in IOA (b), THI (d) and FKL (f).
At IOA, aerosol average pH levels differed by 2.26 pH units between summer and winter with higher aerosol pH in winter (Fig. 6a). Simulations were performed using ISORROPIA-lite for nine factors: temperature, relative humidity, TNO3 (sum of gas-phase HNO3 and particulate NO), TNH3, SO, Na+, K+, Ca2+ and OA. The results are shown in Fig. 6b and Table S6. The availability of total HNO3 (ΔpH = 0.98), temperature (ΔpH = 0.76) and the total NH3 (ΔpH = 0.59) had the greatest influence on the seasonal aerosol pH difference. The effect of K+ (ΔpH = 0.53), sulfates (ΔpH = 0.45) and Ca2+ (ΔpH = 0.43), followed by organics (0.22), RH (0.21) and Na+ (0.06) were also notable. High concentrations of K+ affecting the aerosol pH are associated with biomass burning as discussed in Kaskaoutis et al. (2022).
THI also exhibited a significant seasonal difference in the aerosol acidity with PM2.5 being approximately 2.6 times more acidic in summer than in winter (Fig. 6c). Nine sensitivity tests were conducted for the effect of the nine factors tested for the other two sites on pH (Table S7, Fig. 6d). Sulfate was found to be the main contributor to the more acidic conditions in summer at THI with a mean absolute difference in pH (winter–summer), ΔpH, of 2.8 units, followed by TNH3 and temperature with absolute ΔpH of 0.48 and 0.42 units, respectively. The other factors contributed less to the seasonal difference in aerosol pH, with an absolute ΔpH varying between 0.10 and 0.33 units.
3.3 Aerosol water
ISORROPIA-lite can also be used to calculate the contribution of each inorganic salt and organic fraction to the total aerosol water content. Figure 7 depicts the average contributions of the various inorganic salts and of OA to the total aerosol water for all sites in winter (January) (Fig. 7a) and summer (July and August) (Fig. 7b).
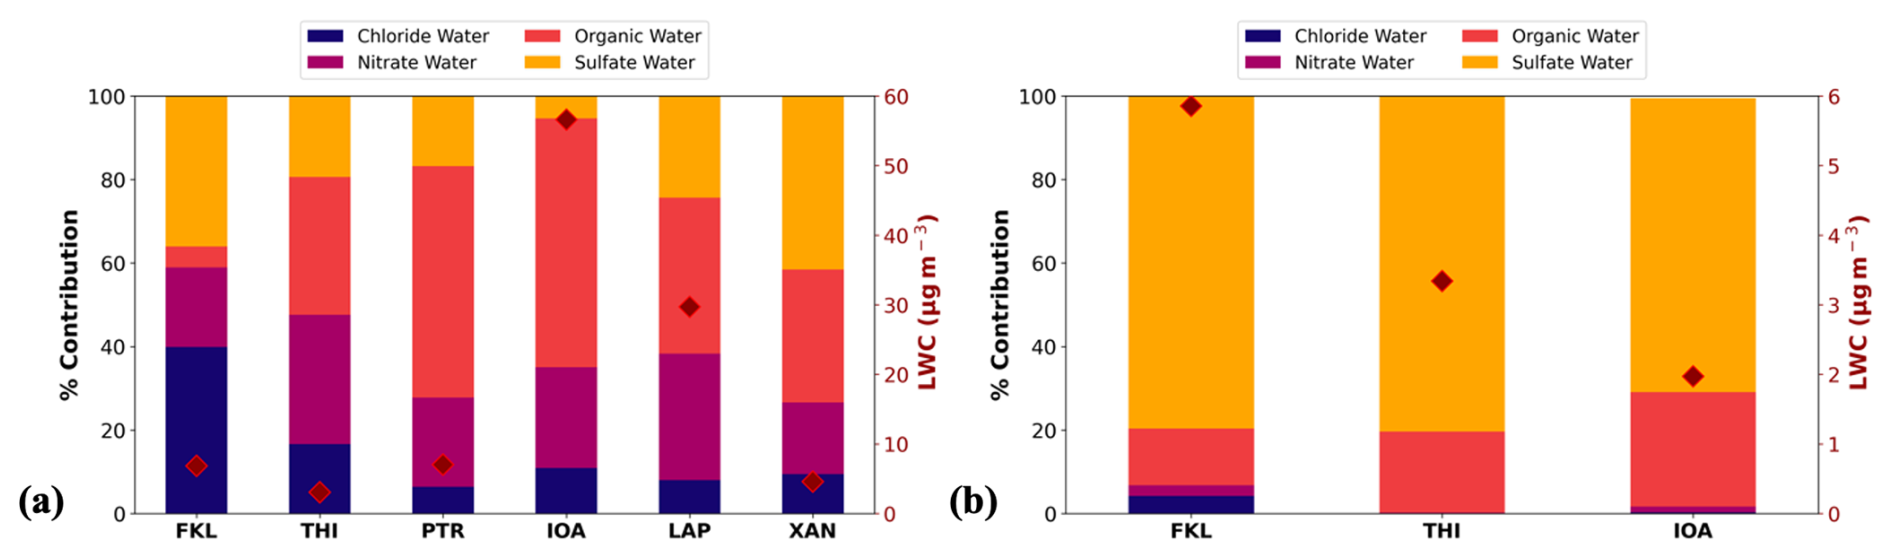
Figure 7Averaged aerosol liquid water content (LWC) for all sites in winter, January 2020 (a) and summer, July and August 2019 (b) expressed as the contribution of each chemical aerosol salt group considering both the inorganics and organics at the observational sites shown in Fig. 1 (left axis). Aerosol water mean concentrations are shown with rhombus in each plot (right axis).
In January (Fig. 7a), OA contributed 60 % to the total aerosol water at IOA and 55 % at PTR. These were the two sites with the highest levels of OA mainly due to residential wood burning. At LAP and THI, OA was also the dominant aerosol component contributing to total aerosol water 37 % and 33 % respectively, while at XAN sulfate salts were associated with 42 % and OA with 32 % of the water. Focusing on the inorganic components alone, aerosol water was found to be controlled by nitrate and sulfate. Nitrate had the highest contributions to inorganic aerosol water at IOA (24 %), THI (31 %), LAP (30 %) and PTR (21 %). NH4NO3 was the dominant salt at IOA, LAP and PTR; while at THI NaNO3 contributed 25 % to the total water associated with inorganics along with NH4NO3 (22 %). The situation at FKL was different with chloride and sulfate being the major contributors to aerosol water (40 % and 36 % respectively), while OA had only a minor contribution (5 %) due to its very low concentration at this site. The dominant chloride salt at FKL was NH4Cl contributing 31 % to the total inorganic water while Na2SO4 was the major sulfate salt, contributing 17 %.
In July and August in the three sites with available observations, sulfate dominated aerosol water (Fig. 7b) with contributions ranging from 70 % at IOA to 80 % at FKL and THI. (NH4)2SO4 was the dominant salt at all three sites, contributing more than half of the total water content at THI (58 %) and 38 % and 40 % at IOA and FKL, respectively. The second most dominant aerosol component was OA with 19 % contribution to the total aerosol water at THI, 27 % at IOA and 14 % at FKL.
3.4 Sensitivity of pH to NH3 and HNO3
Studies with ISORROPIA-II (Guo et al., 2015; Weber et al., 2016) have shown that neglecting gas-phase NH3 in the thermodynamic equilibrium calculation of pH results in an underestimation of at most one pH unit (Bougiatioti et al., 2016). Due to the lack of in situ measurements of the gas phase NH3 (except PTR) and HNO3 during the campaign periods, a sensitivity test was conducted varying the assumed concentrations of the gases that we used for the aerosol pH estimation. In detail, simulations with half and double the concentrations of NH3 and HNO3 were conducted for all sites during both periods; winter (January) and summer (July and August). The resulted difference in aerosol pH (ΔpH) due to these altered gas phase concentrations are depicted in Fig. 8 and the mean values of ΔpH for each simulation are summarized in Table S8 along with the concentrations of the gases for the base case scenarios (i.e. the concentrations used for the main simulations). For the case of NH3, an average (across all sites and both periods) of 0.25 increase in aerosol pH was observed when double the amount of NH3 introduced to each system and the increase in pH ranged between 0.13 and 0.34 pH units. On the other hand, when half the amount of NH3 was used a smaller change was observed across the sites; the mean decrease in aerosol pH was −0.19 pH units while it ranged from −0.07 to −0.31 units. For the sensitivity simulations varying the amount of HNO3 the overall change in aerosol pH was much less distinct. The mean decrease in the pH of the aerosol was between 0.01 and 0.15 pH units when the concentration of HNO3 was doubled (the overall mean decrease was 0.06). Using half the concentration of HNO3 resulted in a mean increase ranging from 0.01 to 0.15 pH units. According to this sensitivity analysis, the uncertainty in the gas phase NH3 could explain about half of the seasonal difference in aerosol pH that was presented and discussed in Sect. 3.2.4 about the factors affecting the seasonality of pH. The uncertainty in gas phase NH3 could explain a larger fraction of the seasonal difference in aerosol pH in IOA than in FKL and THI, which is expected since at these two sites aerosol pH seasonality was predominately driven by sulfates. Our results show a factor of 2 uncertainty in NH3 lead to an average pH difference of 0.25 units that has minor impact on our findings discussed below.
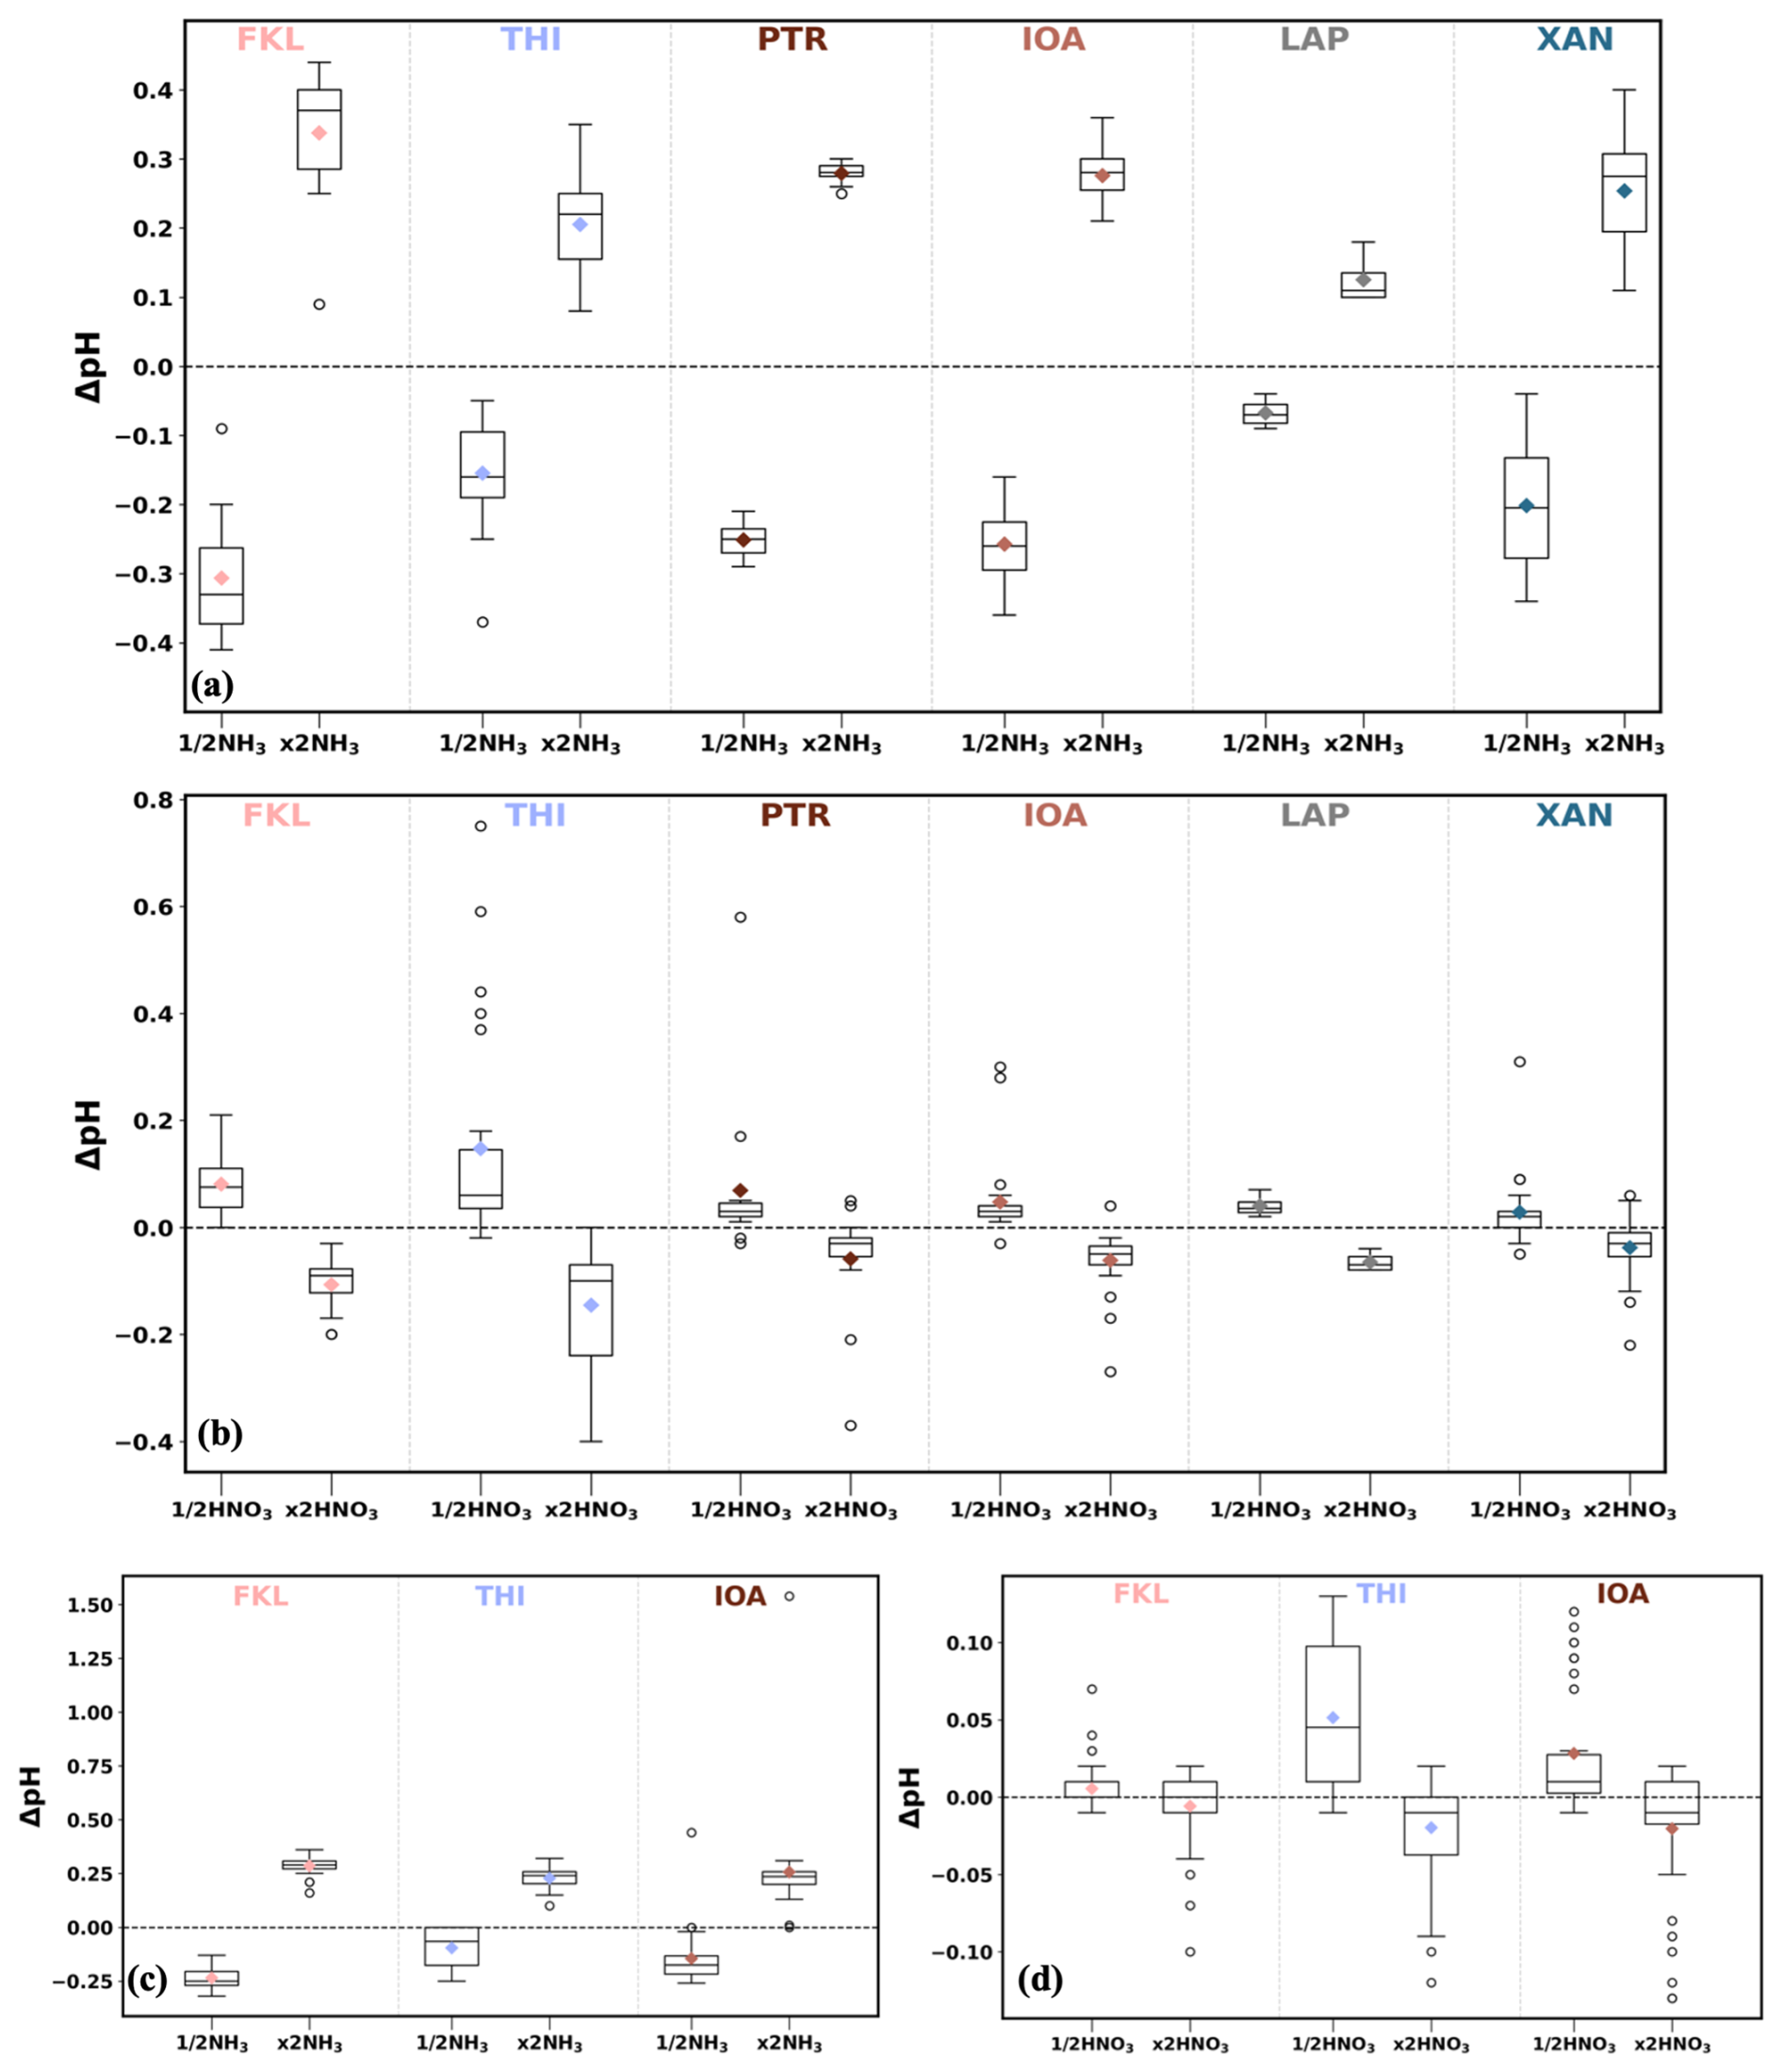
Figure 8Sensitivity of pH estimation to gas phase NH3 and HNO3 concentrations. (a) and (b) are the wintertime (January) simulations for NH3 and HNO3 tests respectively and (c) and (d) for the summertime ones (July and August). Each graph shows the difference in pH when using half or double the concentration of the respective gas compared to the original pH at each site. ( and respectively).
3.4.1 Sensitivity of PM levels to NH3 and HNO3 availability
We used the framework developed by Nenes et al. (2020) that relates the levels of aerosol pH with the formation of aerosol nitrate (and ammonium), to investigate the sensitivity of the different aerosol systems studied here to the gas-phase concentrations of NH3 and HNO3. The main parameters used in this framework that control the secondary inorganic particulate matter sensitivity are the aerosol pH, liquid water content and temperature. The conceptual idea is that there is a “sensitivity window” of pH levels in which the partitioning of nitrate shifts from nitrate being predominately gaseous to mostly in the aerosol phase. When acidity is below this pH sensitivity window, particulate nitrate is almost non-existent and consequently aerosol levels are insensitive to HNO3 availability. In this case, aerosol reduction policies that only target HNO3 reduction cannot be effective (Nenes et al., 2020), as there is no nitrate in the aerosol phase. Based on these criteria, this framework defines characteristic levels of aerosol acidity at which the aerosol becomes insensitive to NH3 (or HNO3) levels and vice versa. Therefore, four possible regimes of PM sensitivity can be derived; (i) neither NH3 nor HNO3 are important for PM formation, or PM formation is dominated by (ii) HNO3, (iii) both NH3 and HNO3, and (iv) NH3 alone.
Figure 9 shows the PM2.5 sensitivity maps derived using this framework and the daily data at all stations in January 2020 (Fig. 9a) and at FKL, THI and IOA in summer (July and August) (Fig. 9b) (34 days in total; in July and August 2019). Considering the average temperature across the 3 sites (Table S9) the pH sensitivity window for each of the two gases (NH3 and HNO3) was calculated as a function of aerosol water (LWC). The data that were used as well as the aerosol pH and water from the combination of the datasets from the sites are given in Table S9.
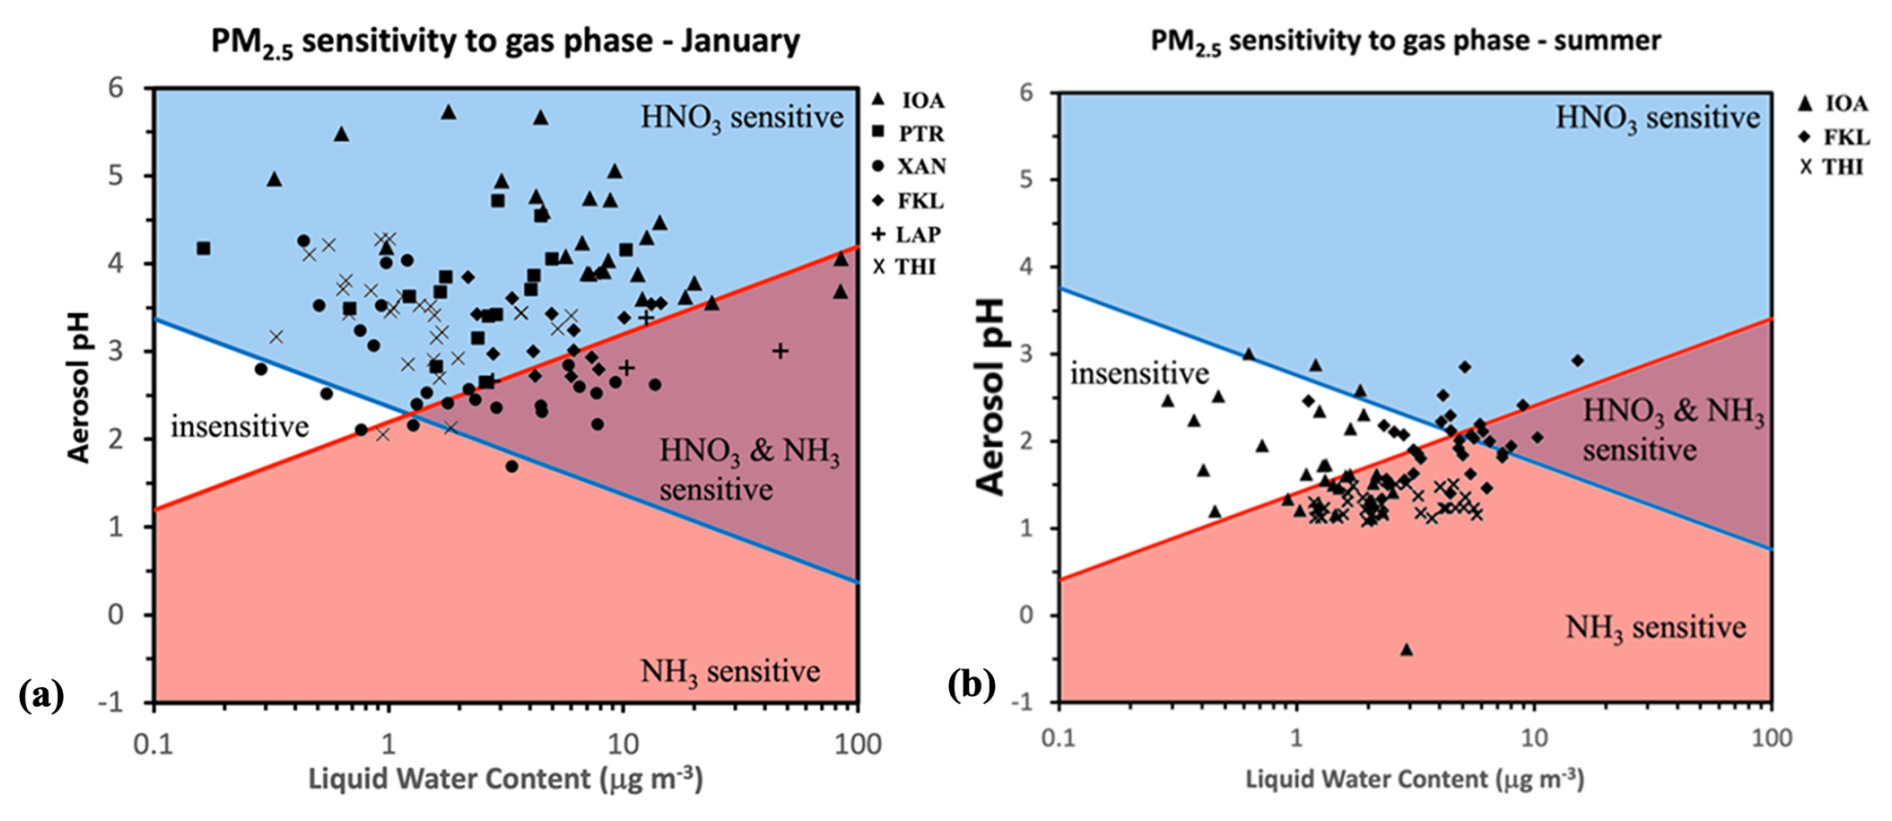
Figure 9Chemical domains of sensitivity of PM2.5 mass to NH3 and NOx emissions for the studied period (a) in winter (January) and (b) in summer (July and August). The average temperature used here is the mean measured one for the studied period at all sites in each season. Daily averaged values in each season of aerosol pH and liquid water content were used. The red line shows the characteristic aerosol pH as a function of liquid water content below which the PM2.5 mass is sensitive to NH3 levels and the blue line the characteristic aerosol pH as a function of liquid water content above which the PM2.5 mass is sensitive to HNO3 levels.
During January, an overall sensitivity of PM2.5 to HNO3 is found as most of the points of the sites reside above the blue line thus an increase in HNO3 concentration will lead to its partitioning to the aerosol phase as nitrate. On the other hand, most points are also above the red line indicating that PM2.5 is relatively insensitive to gas phase NH3. Depending on the conditions and aerosol acidity levels, each site may have some days that deviate from the HNO3-only sensitivity region. At FKL out of the 17 days where HNO3 sensitivity dominated, on 4 days PM2.5 was sensitive to both HNO3 and NH3 levels due to the slightly more acidic particles present. At THI PM2.5 was sensitive to HNO3 on all 27 days that were examined, except for two days in which NH3 sensitivity regime also occurred and characterized by lower aerosol pH values (2.05 and 2.13 pH units). At IOA as a consequence of the lower aerosol acidity, PM2.5 was (as expected) almost exclusively in the HNO3 sensitive regime where NH3 mass variations would not affect PM concentration. At IOA, NH3 availability was found to play a role in aerosol formation in two days when the aerosol water was very high in combination with the aerosol pH being slightly lower. Regions with more acidic particles i.e. XAN and LAP were also in some cases in the HNO3 and NH3 sensitive region.
During summer (July and August) PM2.5 shifted out of the HNO3 only sensitive region at all three sites and NH3 started to play a more important role for the aerosol levels due to the more acidic conditions compared to January. In many days at IOA and some at FKL the sensitivity to HNO3 and the insensitive regime also seemed to exist when extremely low aerosol water content was present. At THI PM2.5 sensitivity showed the least “dispersed” picture compared to the other sites, and PM2.5 was exclusively sensitive to NH3 availability due to the consistently high aerosol acidity conditions. Consequently, for the studied period the inorganic PM2.5 levels at THI in winter would be reduced by limitation of HNO3 formation, which depends on VOC and NOx conditions, and NH3 controls in summer. However, sulfate is the major inorganic PM2.5 component during the summer so the NH3 reductions would have a relatively small effect on the total fine PM. The inclusion of the OA in the aerosol pH and water calculations resulted in a small difference in terms of these sensitivity maps. As the aerosol water increased slightly, in a few cases in XAN the PM sensitivity was shifted from insensitive to HNO3 sensitive, while in a few cases in IOA and FKL, PM also became sensitive to NH3 (Fig. S6).
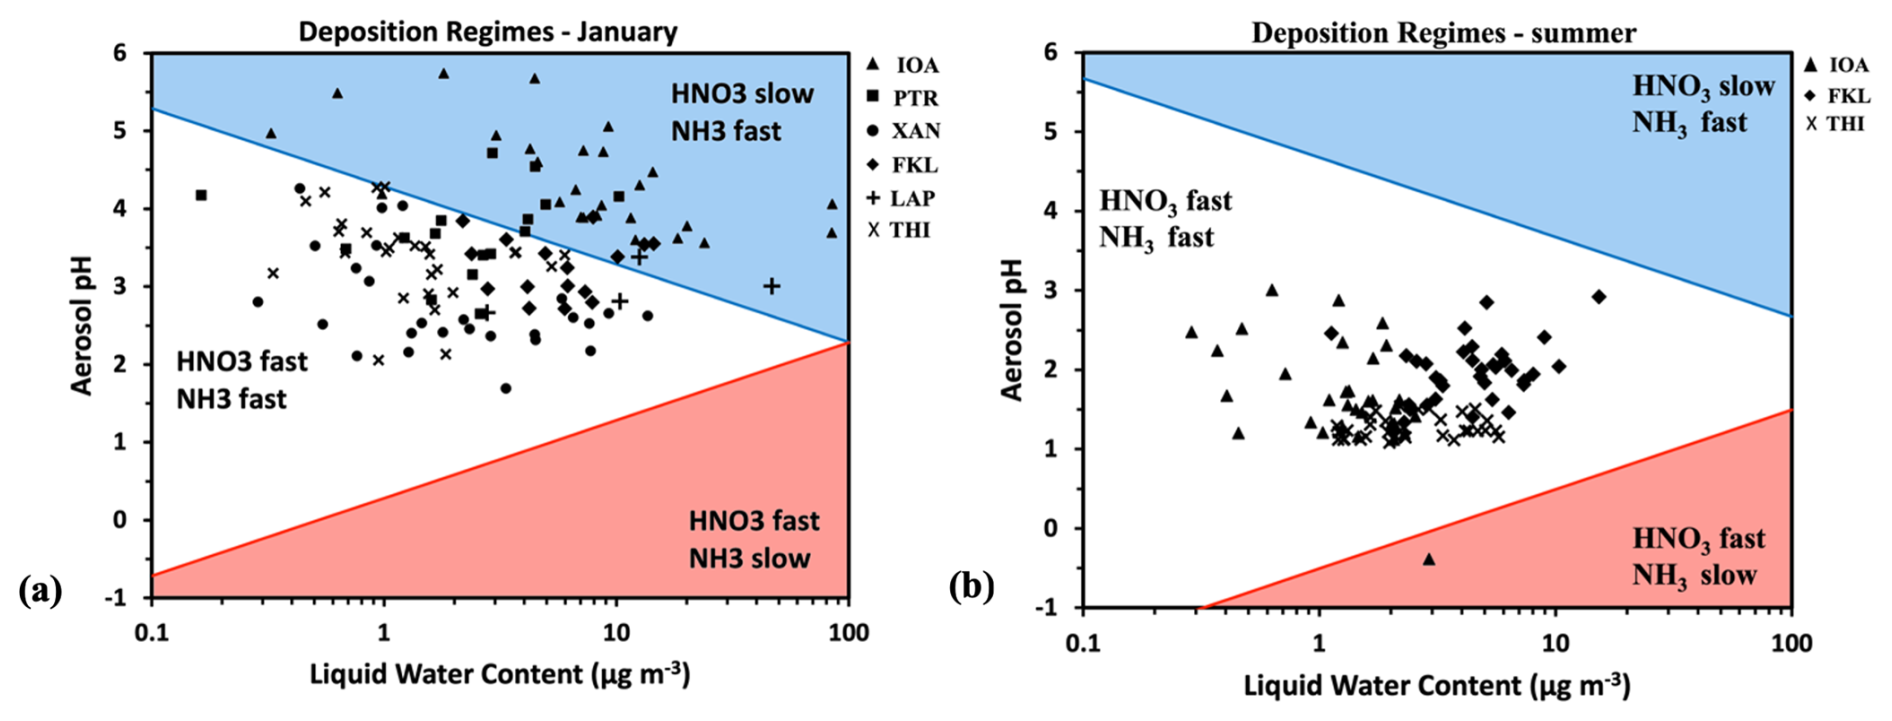
Figure 10Domains of reactive nitrogen deposition for the studied period (a) in winter (January) and (b) in summer (July and August). The average temperature used here is the mean measured one at all sites, for each season. Daily averaged values in each season for aerosol pH and liquid water content were used. The red line shows the characteristic aerosol pH, as a function of liquid water content, below which NH3 deposition is slow and the blue line the characteristic aerosol pH, as a function of liquid water content, above which HNO3 deposition is slow.
3.4.2 Importance of semivolatiles for deposition
Aerosol acidity and water effects on the partitioning of HNO3 and NH3 are linked with the total deposition of these species, in both their gas and particulate forms. As HNO3 and NH3 are deposited about 10 times faster than their particulate forms (NO, NH), the partitioning between gas and particulate phase affects how fast HNONO or NHNH are deposited (Nenes et al., 2021) and therefore the distance to which they are transported within the atmosphere before deposition (Baker et al., 2021). This gas-to-particle partitioning depends on the pH of the aerosol water and on the LWC of the aerosol (Guo et al., 2015). Therefore, “fast” and “slow” deposition regimes for HNO3 and NH3 can be defined as a function of aerosol pH and LWC. Figure 10 shows the reactive nitrogen (sum of TNO3 and TNH3) deposition regimes at the sites, where data were available both in January (Fig. 10a) and summer (July and August) (Fig. 10b), calculated using the average temperatures of the datasets for each season. Looking at the characterization of the deposition domains for all the studied sites during January, a main difference can be observed in terms of the nitrogen deposition velocity (Fig. 10a). At all sites, NH3 seems to always experience fast deposition. On the other hand, nitrate's deposition rate varies between fast (as gaseous HNO3) and slow (as particulate NO), leading to local removal or long-range transport, respectively. IOA and PTR cases are almost exclusively in the HNO3 slow – NH3 fast regime due to the higher aerosol pH levels that enhance HNO3 partitioning to the particulate phase. The other sites are characterized by high deposition rates for both NH3 and HNO3. In summer, the deposition is similarly characterized as fast for both NH3 and HNO3 at FKL, THI and IOA due to the higher acidity levels. The higher temperature in summer than in winter also favors the fast removal of both HNO3 and NH3, with the exception of one day at IOA characterized by extremely low aerosol pH (below zero), where NH3 was present in the form of particulate NH and thus had a slow deposition velocity. Including the OA in the calculations did not change as much the deposition rates (Fig. S7). In a few cases during January in THI and PTR the deposition rate of HNO3 shifted from fast to slow due to the addition of OA water.
This study was based on PM2.5 chemical composition observations in 6 regions of Greece (Finokalia, FKL; Thissio, THI; Patras, PTR; Ioannina, IOA; Xanthi, XAN; and Thessaloniki, LAP) during summer 2019 (in FKL, THI and IOA) and winter 2019–2020 (in all regions) as part of the national research infrastructure PANACEA. The aerosol composition measurements together with the gas phase NH3, HNO3 data were used in the thermodynamic model ISORROPIA-lite to calculate the fine aerosol pH at all the sites and to determine its seasonal variation.
The pH levels of PM2.5 across Greece during winter ranged from 1.72 to 5.14. The highest pH values were estimated at IOA (4.08±0.42) and PTR (3.70±0.45) followed by THI (3.30±0.48) and FKL (3.25±0.37), while aerosols at XAN and LAP were the most acidic (2.81±0.53 and 3.01±0.31, respectively). The lowest acidity at IOA was associated with high K+ levels from biomass burning emissions in combination with high Ca2+ and NH3 and low temperatures. Similar factors (NH3 and cation levels) affected PTR aerosol pH. The aerosol acidity levels at the urban background site (THI) were similar to those at the coastal background site (FKL). High nonvolatile cation concentrations at FKL, together with elevated humidity levels resulted in a higher mean aerosol pH compared to the rural background site (XAN), which had slightly higher levels of sulfates than FKL.
In summer, PM2.5 was generally more acidic than in winter at the three sites studied (THI, IOA and FKL), with mean pH values of 1.35±0.18 (THI), 1.75±0.62 (IOA) and 2.08±0.45 units (FKL). pH in summer was lower than winter by 1 (FKL) to about 2 (THI and IOA) pH units. Sulfates drive the seasonal variation in aerosol pH at THI and FKL. At IOA, on the other hand, temperature together with NH3 and HNO3 availability were the main drivers of the seasonal difference in aerosol acidity, with K+, Ca2+, and sulfates also contributing.
Organics contributed significantly to the total fine aerosol mass at all sites but FKL in January. OA was found to be the main contributor to the total aerosol water at IOA and PTR (60 % and 55 % contribution, respectively) due to the OA levels in these sites, and the dominant contributor at THI and LAP (33 % and 37 % contribution respectively). During January nitrate salts contributed more to the total aerosol water at IOA (24 %), THI (31 %), LAP (30 %) and PTR (21 %), with NH4NO3 being the dominant salt present at IOA, LAP and PTR and NaNO3 at THI. The aerosol water content at XAN was dominated by sulfate (42 %), with OA also contributing to the total aerosol water (32 %). Chloride and sulfate contributed more to the aerosol water at FKL (40 % and 36 % respectively). During summer (July and August), sulfate salts contributed more to LWC at all sites (80 % contribution at FKL and THI and 70 % at IOA), with (NH4)2SO4 being the dominant species of the inorganic LWC at all three sites. At sites with higher aerosol pH (IOA, THI and PTR in January), the water associated with the organics did not increase aerosol pH in most cases. This behavior associated with aerosol pH above 4 units is the result of increased partitioning of semivolatiles to the aerosol phase and of changes in the activity coefficients. Such conditions are good benchmark for testing the thermodynamic model predictions of pH.
PM2.5 mass was sensitive to the availability of total HNO3 at all sites during January 2020. At LAP and XAN, PM mass was also found to be sensitive to NH3. In summer (July and August), PM at all three sites examined showed a strong sensitivity to NH3 due to the low summertime aerosol pH. In some cases, the PM2.5 concentrations at FKL and IOA appeared insensitive to both precursor species due to the low water content of the aerosols. PM sensitivity at THI in summer showed a clear dependence on NH3, reflecting the higher summertime aerosol acidity. Our results show that HNO3 levels (could contribute to) regulate PM2.5 mass concentration which however was mainly composed by OA and sulfate, hence policies targeted to reduce PM2.5 levels in Greece would be more effective by reducing HNO3 levels (i.e. transportation sector) in addition to OA and sulfate.
Finally, our analysis has shown that in Greece NH3 deposition is fast, whereas deposition of HNONO may occur locally near the sources or remotely by long-range transport, depending on the environmental conditions. How future changes in the meteorological conditions and in air pollutant emissions will affect the aerosol pH and the factors controlling it, as well as atmospheric residence time and deposition of reactive nitrogen in the region, requires further investigation.
ISORROPIA-lite is openly available at https://www.epfl.ch/labs/lapi/models-and-software/isorropia/ (last access: 26 November 2025).
Observational data are available upon request by the corresponding site principal investigator.
The supplement related to this article is available online at https://doi.org/10.5194/acp-25-17953-2025-supplement.
AMN collected the data, performed the simulations and wrote the manuscript, MK conceived the study and supervised the work. MK and SP edited the manuscript, AN provided the thermodynamic codes and sensitivity/deposition routines for analysis of the data, and advised on their application/interpretation. MT, EL, KP, KT, IT, CK, FB, AK, KM, GK, NK, NH provided data; all authors provided comments on the manuscript.
At least one of the (co-)authors is a member of the editorial board of Atmospheric Chemistry and Physics. The peer-review process was guided by an independent editor, and the authors also have no other competing interests to declare.
Publisher's note: Copernicus Publications remains neutral with regard to jurisdictional claims made in the text, published maps, institutional affiliations, or any other geographical representation in this paper. While Copernicus Publications makes every effort to include appropriate place names, the final responsibility lies with the authors. Views expressed in the text are those of the authors and do not necessarily reflect the views of the publisher.
We acknowledge additonal support of this work by the Project Pyrogenic TRansformations Affecting Climate and Health (PyroTRACH-726165) by the Horizon-2020 Project FORCeS of the European Union under grant agreement no. 821205.
Colorblind friendly palettes were used to create the figures according to and described in Crameri et al. (2020). More information about the abovementioned palettes can be found in https://doi.org/10.5281/zenodo.8409685 (Crameri, 2018).
This research has been supported by the Operational Programme “Competitiveness, Entrepreneurship and Innovation” (NSRF 2014-2020) co-financed by Greece and the European Regional Development Fund (PANACEA, grant no. MIS 5021516) and the European Horizon 2020 Framework Programme, H2020 Excellent Science (Ri-Urbans, grant no. 101036245).
This paper was edited by Lynn M. Russell and reviewed by two anonymous referees.
Baker, A. R., Kanakidou, M., Nenes, A., Myriokefalitakis, S., Croot, P. L., Duce, R. A., Gao, Y., Guieu, C., Ito, A., Jickells, T. D., Mahowald, N. M., Middag, R., Perron, M. M. G., Sarin, M. M., Shelley, R., and Turner, D. R.: Changing atmospheric acidity as a modulator of nutrient deposition and ocean biogeochemistry, Sci. Adv., 7, eabd8800, https://doi.org/10.1126/sciadv.abd8800, 2021.
Bougiatioti, A., Fountoukis, C., Kalivitis, N., Pandis, S. N., Nenes, A., and Mihalopoulos, N.: Cloud condensation nuclei measurements in the marine boundary layer of the Eastern Mediterranean: CCN closure and droplet growth kinetics, Atmos. Chem. Phys., 9, 7053–7066, https://doi.org/10.5194/acp-9-7053-2009, 2009.
Bougiatioti, A., Nikolaou, P., Stavroulas, I., Kouvarakis, G., Weber, R., Nenes, A., Kanakidou, M., and Mihalopoulos, N.: Particle water and pH in the eastern Mediterranean: source variability and implications for nutrient availability, Atmos. Chem. Phys., 16, 4579–4591, https://doi.org/10.5194/acp-16-4579-2016, 2016.
Clegg, S. L., Seinfeld, J. H., and Brimblecombe, P.: Thermodynamic modelling of aqueous aerosols containing electrolytes and dissolved organic compounds, J. Aerosol Sci., 32, 713–738, https://doi.org/10.1016/S0021-8502(00)00105-1, 2001.
Crameri, F.: Geodynamic diagnostics, scientific visualisation and StagLab 3.0, Geosci. Model Dev., 11, 2541–2562, https://doi.org/10.5194/gmd-11-2541-2018, 2018.
Crameri, F., Shephard, G. E., and Heron, P. J.: The misuse of colour in science communication, Nat. Commun., 11, https://doi.org/10.1038/s41467-020-19160-7, 2020.
Ding, J., Zhao, P., Su, J., Dong, Q., Du, X., and Zhang, Y.: Aerosol pH and its driving factors in Beijing, Atmos. Chem. Phys., 19, 7939–7954, https://doi.org/10.5194/acp-19-7939-2019, 2019.
Fang, T., Guo, H., Zeng, L., Verma, V., Nenes, A., and Weber, R. J.: Highly Acidic Ambient Particles, Soluble Metals, and Oxidative Potential: A Link between Sulfate and Aerosol Toxicity, Environ. Sci. Technol., 51, 2611–2620, https://doi.org/10.1021/acs.est.6b06151, 2017.
Flocas, H., Kelessis, A., Helmis, C., Petrakakis, M., Zoumakis, M., and Pappas, K.: Synoptic and local scale atmospheric circulation associated with air pollution episodes in an urban Mediterranean area, Theor. Appl. Climatol., 95, 265–277, https://doi.org/10.1007/s00704-008-0005-9, 2009.
Florou, K., Papanastasiou, D. K., Pikridas, M., Kaltsonoudis, C., Louvaris, E., Gkatzelis, G. I., Patoulias, D., Mihalopoulos, N., and Pandis, S. N.: The contribution of wood burning and other pollution sources to wintertime organic aerosol levels in two Greek cities, Atmos. Chem. Phys., 17, 3145–3163, https://doi.org/10.5194/acp-17-3145-2017, 2017.
Fountoukis, C. and Nenes, A.: ISORROPIA II: a computationally efficient thermodynamic equilibrium model for K+–Ca2+–Mg2+–NH–Na+–SO–NO–Cl−–H2O aerosols, Atmos. Chem. Phys., 7, 4639–4659, https://doi.org/10.5194/acp-7-4639-2007, 2007.
Guo, H., Xu, L., Bougiatioti, A., Cerully, K. M., Capps, S. L., Hite, J. R., Carlton, A. G., Lee, S.-H., Bergin, M. H., Ng, N. L., Nenes, A., and Weber, R. J.: Fine-particle water and pH in the southeastern United States, Atmos. Chem. Phys., 15, 5211–5228, https://doi.org/10.5194/acp-15-5211-2015, 2015.
Guo, H., Sullivan, A. P., Campuzano-Jost, P., Schroder, J. C., Lopez-Hilfiker, F. D., Dibb, J. E., Jimenez, J. L., Thornton, J. A., Brown, S. S., Nenes, A., and Weber, R. J.: Fine particle pH and the partitioning of nitric acid during winter in the northeastern United States, J. Geophys. Res.-Atmos., 121, https://doi.org/10.1002/2016JD025311, 2016.
Guo, H., Liu, J., Froyd, K. D., Roberts, J. M., Veres, P. R., Hayes, P. L., Jimenez, J. L., Nenes, A., and Weber, R. J.: Fine particle pH and gas–particle phase partitioning of inorganic species in Pasadena, California, during the 2010 CalNex campaign, Atmos. Chem. Phys., 17, 5703–5719, https://doi.org/10.5194/acp-17-5703-2017, 2017a.
Guo, H., Weber, R. J., and Nenes, A.: High levels of ammonia do not raise fine particle pH sufficiently to yield nitrogen oxide-dominated sulfate production, Sci. Rep., 7, 12109, https://doi.org/10.1038/s41598-017-11704-0, 2017b.
Guo, H., Otjes, R., Schlag, P., Kiendler-Scharr, A., Nenes, A., and Weber, R. J.: Effectiveness of ammonia reduction on control of fine particle nitrate, Atmos. Chem. Phys., 18, 12241–12256, https://doi.org/10.5194/acp-18-12241-2018, 2018.
Hildebrandt, L., Kostenidou, E., Lanz, V. A., Prevot, A. S. H., Baltensperger, U., Mihalopoulos, N., Laaksonen, A., Donahue, N. M., and Pandis, S. N.: Sources and atmospheric processing of organic aerosol in the Mediterranean: insights from aerosol mass spectrometer factor analysis, Atmos. Chem. Phys., 11, 12499–12515, https://doi.org/10.5194/acp-11-12499-2011, 2011.
Kakavas, S., Patoulias, D., Zakoura, M., Nenes, A., and Pandis, S. N.: Size-resolved aerosol pH over Europe during summer, Atmos. Chem. Phys., 21, 799–811, https://doi.org/10.5194/acp-21-799-2021, 2021.
Kakavas, S., Pandis, S. N., and Nenes, A.: ISORROPIA-Lite: A Comprehensive Atmospheric Aerosol Thermodynamics Module for Earth System Models, Tellus B, 74, 1–23, https://doi.org/10.16993/tellusb.33, 2022.
Kalkavouras, P., Bougiatioti, A., Kalivitis, N., Stavroulas, I., Tombrou, M., Nenes, A., and Mihalopoulos, N.: Regional new particle formation as modulators of cloud condensation nuclei and cloud droplet number in the eastern Mediterranean, Atmos. Chem. Phys., 19, 6185–6203, https://doi.org/10.5194/acp-19-6185-2019, 2019.
Kanakidou, M., Myriokefalitakis, S., and Tsigaridis, K.: Aerosols in atmospheric chemistry and biogeochemical cycles of nutrients, Environ. Res. Lett., 13, 063004, https://doi.org/10.1088/1748-9326/aabcdb, 2018.
Kaskaoutis, D. G., Grivas, G., Theodosi, C., Tsagkaraki, M., Paraskevopoulou, D., Stavroulas, I., Liakakou, E., Gkikas, A., Hatzianastassiou, N., Wu, C., Gerasopoulos, E., and Mihalopoulos, N.: Carbonaceous Aerosols in Contrasting Atmospheric Environments in Greek Cities: Evaluation of the EC-tracer Methods for Secondary Organic Carbon Estimation, Atmosphere, 11, 161, https://doi.org/10.3390/atmos11020161, 2020.
Kaskaoutis, D. G., Grivas, G., Oikonomou, K., Tavernaraki, P., Papoutsidaki, K., Tsagkaraki, M., Stavroulas, I., Zarmpas, P., Paraskevopoulou, D., Bougiatioti, A., Liakakou, E., Gavrouzou, M., Dumka, U. C., Hatzianastassiou, N., Sciare, J., Gerasopoulos, E., and Mihalopoulos, N.: Impacts of severe residential wood burning on atmospheric processing, water-soluble organic aerosol and light absorption, in an inland city of Southeastern Europe, Atmos. Environ., 280, 119139, https://doi.org/10.1016/j.atmosenv.2022.119139, 2022.
Kastelis, N. and Kourtidis, K.: Characteristics of the atmospheric electric field and correlation with CO2 at a rural site in southern Balkans, Earth Planet Space, 68, 3, https://doi.org/10.1186/s40623-016-0379-3, 2016.
Kostenidou, E., Florou, K., Kaltsonoudis, C., Tsiflikiotou, M., Vratolis, S., Eleftheriadis, K., and Pandis, S. N.: Sources and chemical characterization of organic aerosol during the summer in the eastern Mediterranean, Atmos. Chem. Phys., 15, 11355–11371, https://doi.org/10.5194/acp-15-11355-2015, 2015.
Lemou, A., Rabhi, L., Merabet, H., Ladji, R., Nicolas, J. B., Bonnaire, N., Mustapha, M. A., Dilmi, R., Sciare, J., Mihalopoulos, N., and Yassaa, N.: Chemical characterization of fine particles (PM2.5) at a coastal site in the South Western Mediterranean during the ChArMex experiment, Environ. Sci. Pollut. Res., 27, 20427–20445, https://doi.org/10.1007/s11356-020-08168-7, 2020.
Liakakou, E., Fourtziou, L., Paraskevopoulou, D., Speyer, O., Lianou, M., Grivas, G., Myriokefalitakis, S., and Mihalopoulos, N.: High-Resolution Measurements of SO2, HNO3 and HCl at the Urban Environment of Athens, Greece: Levels, Variability and Gas to Particle Partitioning, Atmosphere, 13, 218, https://doi.org/10.3390/atmos13020218, 2022.
Liu, M., Song, Y., Zhou, T., Xu, Z., Yan, C., Zheng, M., Wu, Z., Hu, M., Wu, Y., and Zhu, T.: Fine particle pH during severe haze episodes in northern China: Fine Particle pH During Haze Episodes, Geophys. Res. Lett., 44, 5213–5221, https://doi.org/10.1002/2017GL073210, 2017.
Masiol, M., Squizzato, S., Formenton, G., Khan, M. B., Hopke, P. K., Nenes, A., Pandis, S. N., Tositti, L., Benetello, F., Visin, F., and Pavoni, B.: Hybrid multiple-site mass closure and source apportionment of PM2.5 and aerosol acidity at major cities in the Po Valley, Sci. Total Environ., 704, 135287, https://doi.org/10.1016/j.scitotenv.2019.135287, 2020.
Mihalopoulos, N., Stephanou, E., Kanakidou, M., Pilitsidis, S., and Bousquet, P.: Tropospheric aerosol ionic composition in the Eastern Mediterranean region, Tellus B, 49, 314–326, https://doi.org/10.1034/j.1600-0889.49.issue3.7.x, 1997.
Nenes, A., Krom, M. D., Mihalopoulos, N., Van Cappellen, P., Shi, Z., Bougiatioti, A., Zarmpas, P. and Herut, B.: Atmospheric acidification of mineral aerosols: a source of bioavailable phosphorus for the oceans, Atmos. Chem. Phys., 11, 6265–6272, https://doi.org/10.5194/acp-11-6265-2011, 2011.
Nenes, A., Pandis, S. N., Weber, R. J., and Russell, A.: Aerosol pH and liquid water content determine when particulate matter is sensitive to ammonia and nitrate availability, Atmos. Chem. Phys., 20, 3249–3258, https://doi.org/10.5194/acp-20-3249-2020, 2020.
Nenes, A., Pandis, S. N., Kanakidou, M., Russell, A. G., Song, S., Vasilakos, P., and Weber, R. J.: Aerosol acidity and liquid water content regulate the dry deposition of inorganic reactive nitrogen, Atmos. Chem. Phys., 21, 6023–6033, https://doi.org/10.5194/acp-21-6023-2021, 2021.
Paglione, M., Decesari, S., Rinaldi, M., Tarozzi, L., Manarini, F., Gilardoni, S., Facchini, M. C., Fuzzi, S., Bacco, D., Trentini, A., Pandis, S. N., and Nenes, A.: Historical Changes in Seasonal Aerosol Acidity in the Po Valley (Italy) as Inferred from Fog Water and Aerosol Measurements, Environ. Sci. Technol., 55, 7307–7315, https://doi.org/10.1021/acs.est.1c00651, 2021.
Pikridas, M., Bougiatioti, A., Hildebrandt, L., Engelhart, G. J., Kostenidou, E., Mohr, C., Prévôt, A. S. H., Kouvarakis, G., Zarmpas, P., Burkhart, J. F., Lee, B.-H., Psichoudaki, M., Mihalopoulos, N., Pilinis, C., Stohl, A., Baltensperger, U., Kulmala, M., and Pandis, S. N.: The Finokalia Aerosol Measurement Experiment – 2008 (FAME-08): an overview, Atmos. Chem. Phys., 10, 6793–6806, https://doi.org/10.5194/acp-10-6793-2010, 2010.
Pikridas, M., Tasoglou, A., Florou, K., and Pandis, S. N.: Characterization of the origin of fine particulate matter in a medium size urban area in the Mediterranean, Atmos. Environ., 80, 264–274, https://doi.org/10.1016/j.atmosenv.2013.07.070, 2013.
Powley, H. R., Cappellen, P. V., and Krom, M. D.: Nutrient Cycling in the Mediterranean Sea: The Key to Understanding How the Unique Marine Ecosystem Functions and Responds to Anthropogenic Pressures, in: Mediterranean Identities – Environment, Society, Culture, edited by: Fuerst-Bjelis, B., InTech, https://doi.org/10.5772/intechopen.70878, 2017.
Psichoudaki, M., Nenes, A., Florou, K., Kaltsonoudis, C., and Pandis, S. N.: Hygroscopic properties of atmospheric particles emitted during wintertime biomass burning episodes in Athens, Atmos. Environ., 178, 66–72, https://doi.org/10.1016/j.atmosenv.2018.01.004, 2018.
Putaud, J.-P., Raes, F., Van Dingenen, R., Brüggemann, E., Facchini, M.-C., Decesari, S., Fuzzi, S., Gehrig, R., Hüglin, C., Laj, P., Lorbeer, G., Maenhaut, W., Mihalopoulos, N., Müller, K., Querol, X., Rodriguez, S., Schneider, J., Spindler, G., Brink, H. T., Tørseth, K., and Wiedensohler, A.: A European aerosol phenomenology – 2: chemical characteristics of particulate matter at kerbside, urban, rural and background sites in Europe, Atmos. Environ., 38, 2579–2595, https://doi.org/10.1016/j.atmosenv.2004.01.041, 2004.
Pye, H. O. T., Nenes, A., Alexander, B., Ault, A. P., Barth, M. C., Clegg, S. L., Collett, J. L., Fahey, K. M., Hennigan, C. J., Herrmann, H., Kanakidou, M., Kelly, J. T., Ku, I. T., Faye McNeill, V., Riemer, N., Schaefer, T., Shi, G., Tilgner, A., Walker, J. T., Wang, T., Weber, R., Xing, J., Zaveri, R. A., and Zuend, A.: The acidity of atmospheric particles and clouds, Atmos. Chem. Phys., 20, 4809–4888, https://doi.org/10.5194/acp-20-4809-2020, 2020.
Sciare, J., Oikonomou, K., Favez, O., Liakakou, E., Markaki, Z., Cachier, H., and Mihalopoulos, N.: Long-term measurements of carbonaceous aerosols in the Eastern Mediterranean: evidence of long-range transport of biomass burning, Atmos. Chem. Phys., 8, 5551–5563, https://doi.org/10.5194/acp-8-5551-2008, 2008.
Seinfeld, J. H. and Pandis, S. N.: Atmospheric chemistry and physics: from air pollution to climate change, in: 2nd Edn., J. Wiley, Hoboken, NJ, 1203 pp., ISBN 978-0-471-72018-8, 2006.
Shephard, M. W. and Cady-Pereira, K. E.: Cross-track Infrared Sounder (CrIS) satellite observations of tropospheric ammonia, Atmos. Meas. Tech., 8, 1323–1336, https://doi.org/10.5194/amt-8-1323-2015, 2015.
Shephard, M. W., Dammers, E., Cady-Pereira, K. E., Kharol, S. K., Thompson, J., Gainariu-Matz, Y., Zhang, J., McLinden, C. A., Kovachik, A., Moran, M., Bittman, S., Sioris, C. E., Griffin, D., Alvarado, M. J., Lonsdale, C., Savic-Jovcic, V., and Zheng, Q.: Ammonia measurements from space with the Cross-track Infrared Sounder: characteristics and applications, Atmos. Chem. Phys., 20, 2277–2302, https://doi.org/10.5194/acp-20-2277-2020, 2020.
Shi, G., Xu, J., Peng, X., Xiao, Z., Chen, K., Tian, Y., Guan, X., Feng, Y., Yu, H., Nenes, A., and Russell, A. G.: pH of Aerosols in a Polluted Atmosphere: Source Contributions to Highly Acidic Aerosol, Environ. Sci. Technol., 51, 4289–4296, https://doi.org/10.1021/acs.est.6b05736, 2017.
Squizzato, S., Masiol, M., Brunelli, A., Pistollato, S., Tarabotti, E., Rampazzo, G., and Pavoni, B.: Factors determining the formation of secondary inorganic aerosol: a case study in the Po Valley (Italy), Atmos. Chem. Phys., 13, 1927–1939, https://doi.org/10.5194/acp-13-1927-2013, 2013.
Stavroulas, I., Bougiatioti, A., Grivas, G., Paraskevopoulou, D., Tsagkaraki, M., Zarmpas, P., Liakakou, E., Gerasopoulos, E., and Mihalopoulos, N.: Sources and processes that control the submicron organic aerosol composition in an urban Mediterranean environment (Athens): a high temporal-resolution chemical composition measurement study, Atmos. Chem. Phys., 19, 901–919, https://doi.org/10.5194/acp-19-901-2019, 2019.
Tao, Y. and Murphy, J. G.: The sensitivity of PM2.5 acidity to meteorological parameters and chemical composition changes: 10-year records from six Canadian monitoring sites, Atmos. Chem. Phys., 19, 9309–9320, https://doi.org/10.5194/acp-19-9309-2019, 2019.
Theodosi, C., Markaki, Z., and Mihalopoulos, N.: Iron speciation, solubility and temporal variability in wet and dry deposition in the Eastern Mediterranean, Mar. Chem., 120, 100–107, https://doi.org/10.1016/j.marchem.2008.05.004, 2008.
Tsiflikiotou, M. A., Kostenidou, E., Papanastasiou, D. K., Patoulias, D., Zarmpas, P., Paraskevopoulou, D., Diapouli, E., Kaltsonoudis, C., Florou, K., Bougiatioti, A., Stavroulas, I., Theodosi, C., Kouvarakis, G., Vasilatou, V., Siakavaras, D., Biskos, G., Pilinis, C., Eleftheriadis, K., Gerasopoulos, E., Mihalopoulos, N., and Pandis, S. N.: Summertime particulate matter and its composition in Greece, Atmos. Environ., 213, 597–607, https://doi.org/10.1016/j.atmosenv.2019.06.013, 2019.
Vierke, L., Ahrens, L., Shoeib, M., Palm, W.-U., Webster, E. M., Ellis, D. A., Ebinghaus, R., and Harner, T.: In situ air–water and particle–water partitioning of perfluorocarboxylic acids, perfluorosulfonic acids and perfluorooctyl sulfonamide at a wastewater treatment plant, Chemosphere, 92, 941–948, https://doi.org/10.1016/j.chemosphere.2013.02.067, 2013.
Warner, J. X., Wei, Z., Strow, L. L., Dickerson, R. R., and Nowak, J. B.: The global tropospheric ammonia distribution as seen in the 13-year AIRS measurement record, Atmos. Chem. Phys., 16, 5467–5479, https://doi.org/10.5194/acp-16-5467-2016, 2016.
Weber, R. J., Guo, H., Russell, A. G., and Nenes, A.: High aerosol acidity despite declining atmospheric sulfate concentrations over the past 15 years, Nat. Geosci., 9, 282–285, https://doi.org/10.1038/ngeo2665, 2016.
Wexler, A. S. and Clegg, S. L.: Atmospheric aerosol models for systems including the ions H+, NH, Na+, SO, NO, Cl−, Br−, and H2O, J. Geophys. Res., 107, 4207, https://doi.org/10.1029/2001JD000451, 2002.
Zaveri, R. A., Easter, R. C., Fast, J. D., and Peters, L. K.: Model for Simulating Aerosol Interactions and Chemistry (MOSAIC), J. Geophys. Res., 113, D13204, https://doi.org/10.1029/2007JD008782, 2008.
Zhang, A., Wang, Y., Zhang, Y., Weber, R. J., Song, Y., Ke, Z., and Zou, Y.: Modeling the global radiative effect of brown carbon: a potentially larger heating source in the tropical free troposphere than black carbon, Atmos. Chem. Phys., 20, 1901–1920, https://doi.org/10.5194/acp-20-1901-2020, 2020.