the Creative Commons Attribution 4.0 License.
the Creative Commons Attribution 4.0 License.
 | 04 Dec 2025
Aircraft-based observation of volatile organic compounds (VOCs) over the North China Plain
Yibo Huangfu
Ziyang Liu
Sihang Wang
Xianjun He
Wei Zhou
Fei Wang
Ping Tian
Wei Xiao
Yuanmou Du
Jiujiang Sheng
Min Shao
The vertical distribution of reactive trace gases can greatly help understand the complex atmospheric evolution under the joint impacts of surface emission, chemical removal, and regional transport. Focusing on the core area of the North China Plain, aircraft-based observations were conducted in September 2017 and July 2019 to reveal the vertical distributions of volatile organic compounds (VOCs) measured by high-time resolution mass spectrometry. Generally decreasing trends of VOC concentrations with altitudes were captured, indicating strong surface source emissions and chemical removal within the planetary boundary layer (PBL). Ethanol exhibited the highest concentration within the PBL with an average of 46.7 ppbv and the largest ratio (16.5) between the average below and above the PBL heights. The vertical-averaged VOCs above Baoding were greater than those in Beijing by factors ranging from 1.2 to 3.5, suggesting richer precursors for secondary pollutant formation in Baoding. Increases of several VOC species, including styrene and acetonitrile, at high altitudes (>2500 m) were captured in Beijing. Correlation analysis further revealed the significant influences of industrial and biomass burning emissions. Our results highlight the critical role of both local emissions and regional transport in shaping the VOC vertical distributions, which may affect atmospheric organic chemistry across various atmospheric layers in the region.
- Article
(3260 KB) - Full-text XML
-
Supplement
(1617 KB) - BibTeX
- EndNote


The North China Plain (NCP) stands as one of the most developed city clusters in China, yet it is also a region of concern that suffers from severe air pollution (Zhao et al., 2021; Yao et al., 2022b; Le et al., 2020; Wang et al., 2023). Following the implementation of the Action Plan on the Prevention and Control of Air Pollution, the particulate matter concentrations in NCP have significantly declined primarily due to a sharp reduction in anthropogenic emissions. In contrast, ozone levels have not shown a similar downward trend (Chen et al., 2020; Li et al., 2019a; Lu et al., 2019, 2020). From 2013 to 2019, the annual maximum daily average of 8 h ozone (MDA8O3) concentrations increased significantly with a rate of 2.3 ppbv yr−1 in Beijing (Chen et al., 2020), while during warm seasons (April–September), the average increasing rate reached 3.3 ppbv yr−1 for NCP (Lu et al., 2020). Under the background of coordinated efforts to reduce pollution and carbon emissions, the continuous improvement of ambient air quality in the NCP region is under great pressure.
Volatile organic compounds (VOCs), as the key precursors of ozone and secondary organic aerosols due to photochemical degradation, have been listed as one of the key indicators for atmospheric environmental quality during the “14th Five-Year Plan” period (Li et al., 2022b; Mao et al., 2021). The temporal variation, emission characteristics, and environmental effect of VOCs have been extensively studied in the NCP region through ground-based measurements, greatly enhancing the understanding of the role in the formation of photochemical pollution (Yuan et al., 2012; Wang et al., 2014; Li et al., 2019b; Zhao et al., 2021; Sun et al., 2018; Förster et al., 2023). However, recent studies have also revealed the complex evolution of VOCs in the atmosphere under the impact of meteorological conditions (Zhang et al., 2018; Shi et al., 2018) and inter-city and regional transport (Liu et al., 2019; Zhao et al., 2021; Chang et al., 2019) that cannot be thoroughly investigated based on ground measurements.
In the past few years, vertical observations have been carried out utilizing observation towers (Zhang et al., 2020; Li et al., 2022a; Yang et al., 2024a; Li et al., 2025), tethered balloons (Zhang et al., 2019; Sangiorgi et al., 2011; Zhang et al., 2018), unmanned aerial vehicles (UAVs) (Peng et al., 2015; Han et al., 2016; Vo et al., 2018), and aircraft (Benish et al., 2020; Förster et al., 2023; Zhao et al., 2021; Wilde et al., 2021), bringing the opportunity to study VOCs from a three-dimensional perspective. Compared to other vertical observation techniques, aircraft platforms offer distinct advantages, including the capability of covering larger spatial areas, carrying heavy instrument payloads, and performing both vertical and horizontal observations at higher altitudes (Kwak et al., 2020; Zhao et al., 2021; Dieu Hien et al., 2019). The advantages of aircraft measurement make it an irreplaceable role in scientific research and practical applications. While aircraft-based research has been conducted intensively in the United States and Europe with high temporal resolution instruments (Fisher et al., 2016; Karion et al., 2015; Ren et al., 2018), only a handful of similar aircraft flights have been conducted equipped with online instruments that measure inorganic pollutants and aerosols in China (Zhao et al., 2021; Liu et al., 2018). Limited aircraft-based VOC measurements in China typically applied the collection of canister samples followed by detection by gas chromatography techniques in the laboratory (Xue et al., 2011; Benish et al., 2020; Liu et al., 2013). A typical decrease of non-methane hydrocarbons with increasing height was reported over Northeast China (Xue et al., 2011), while for the NCP region, aircraft-based measurements have been conducted but only reported the vertical distributions of BTEX species (benzene, toluene, ethylbenzene, xylenes), showing a similar negative trend with height (Liu et al., 2013). Nevertheless, the vertical distribution of VOCs in the NCP region is still unclear due to the scarcity of offline samples, hindering the ability to accurately assess the impacts of local emissions and air mass transport on VOC levels.
This study analyses aircraft-based observation results over the Beijing and Baoding area, the two core cities of the NCP region. A proton transfer reaction time-of-flight mass spectrometer (PTR-ToF-MS) was equipped on the platform to monitor VOC concentrations with high time resolution across altitudes. Combined with correlation analysis of VOC pairs, possible sources and origins of VOCs within the planetary boundary layer (PBL) and the atmosphere above it were discussed, pointing out the important roles of local urban emissions and regional transport.
2.1 Aircraft flight routes
A King Air 350ER aircraft (Hawker Beechcraft) was deployed and five flights were conducted between 9 and 15 September 2017, and an additional flight on 14 July 2019. The flight trajectories are summarized in Table 1 and illustrated in Fig. 1. The aircraft was based at Shahe Airport (40°8′24′′ N, 116°19′48′′ E) in Changping District, Beijing, surrounded by villages, factories, and educational institutions. Four of the flights in 2017 (9, 12, 13, and 15 September) focused on the Beijing area, while the remaining two flights (14 September 2017, and 14 July 2019) followed southwest trajectories over the forest area before turning southeast to the Baoding area and returning to Shahe Airport. During each flight, the aircraft maintained level flight at a given altitude before ascending or descending to the next predetermined flight level. The step intervals between altitudes were consistently maintained within approximately 150 to 200 m.
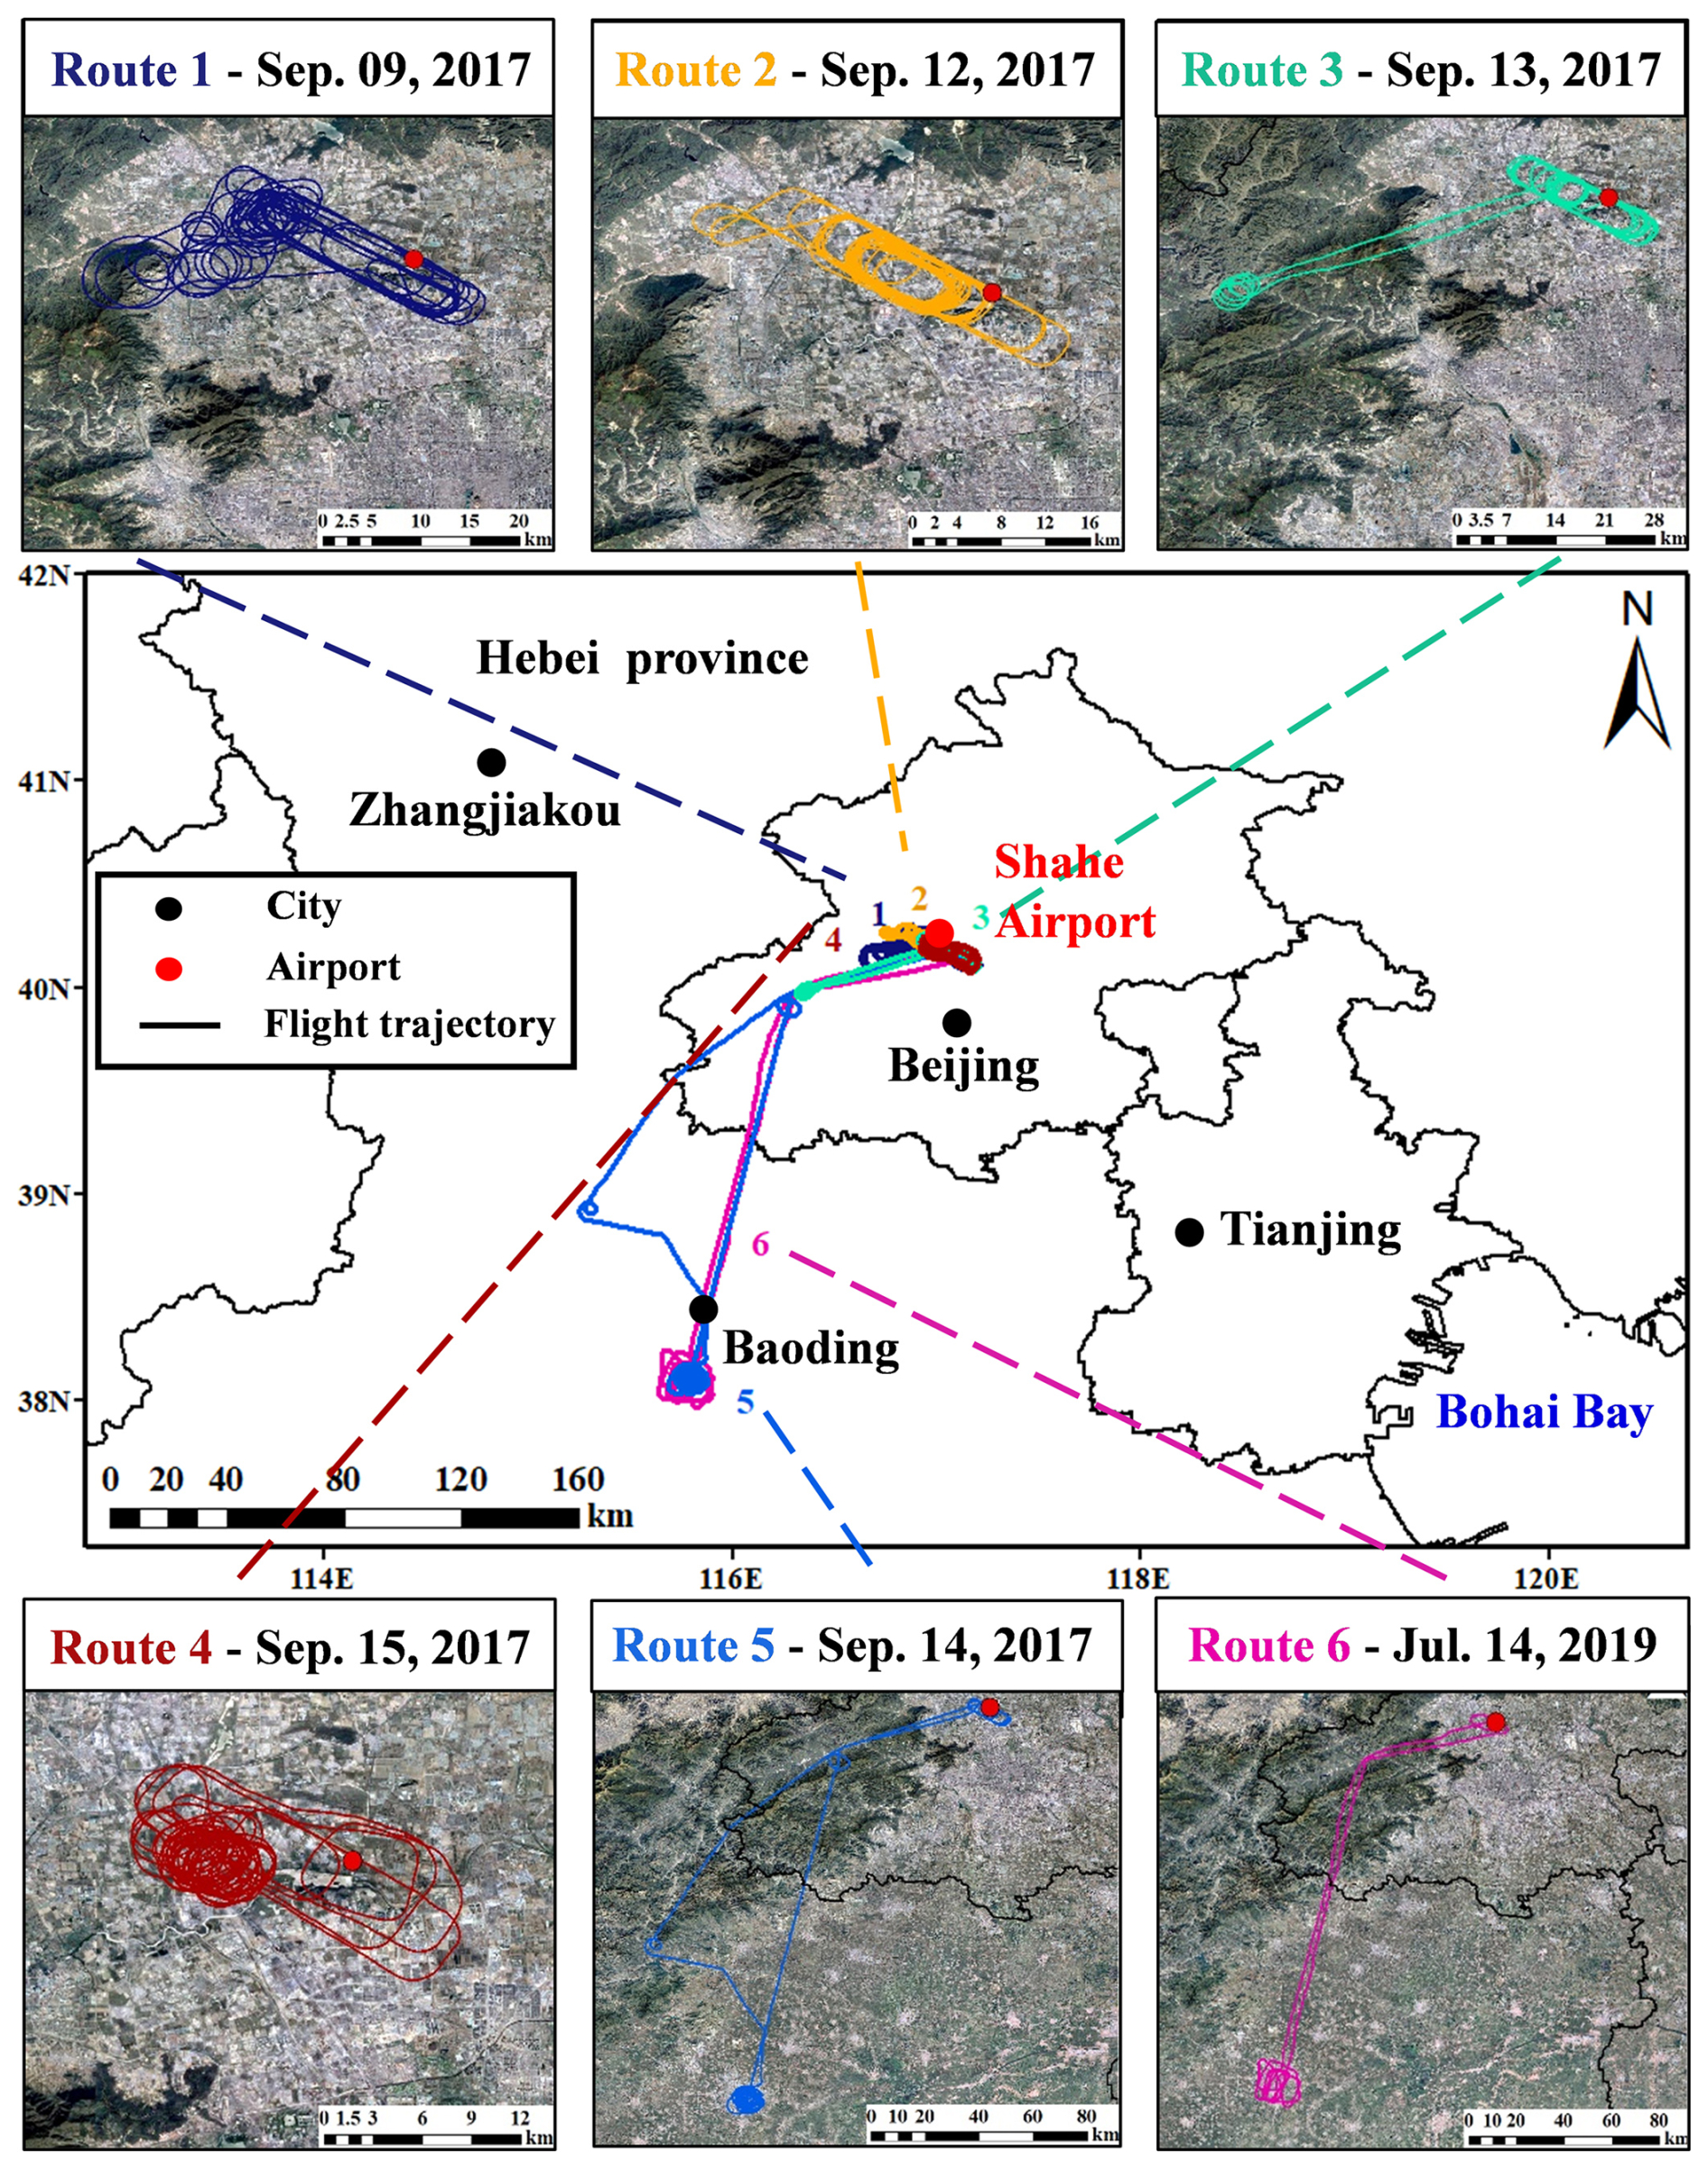
Figure 1Flight trajectories during different aerial surveys in September 2017 and July 2019. Figures were made by Meteolnfo software. The satellite images were downloaded from © Google Earth and edited in ArcGIS 10.8.
Table 1Detailed information for different flight routes during different aerial surveys in September 2017 and July 2019.
Note: * Profile time is the local time.
2.2 VOC sample and meteorological data collection
A PTR-ToF-MS (PTR-ToF-MS-8000, Ionicon Analytik GmbH, Austria) was applied onboard to measure VOC concentrations during each flight. The time-of-flight mass spectrometry has been proven to have the capability of measuring VOCs at high time resolution over broad mass spectra (Wu et al., 2020a; Yuan et al., 2017). Ambient air was drawn through a 1.5 m-long PTFE tube at a flow rate of 15 L min−1 using a pump. A sub-stream of this air was then subsampled by the PTR-ToF-MS at a flow rate of 100 mL min−1 through a PTFE membrane particle filter. With a voyage speed of ∼ 250 km h−1 of the aircraft, VOC concentrations were measured every 5 s, resulting in a spatial resolution of ∼ 70 m. The PTR-ToF-MS was operated with a drift pressure of 2.2 mbar, E/N 135 Td, and reactor temperature of 60 °C. The raw spectral data of PTR-ToF-MS were processed using the Ionicon Data Analyzer (IDA, V2.0.1.0), including mass calibration, peak detection, peak fitting, and etc. The sensitivities of PTR-ToF-MS for various VOC species were calibrated with commercial standard gas (Apel-Riemer, Environmental Inc., USA) before each field campaign. The sensitivity of monoterpenes was calibrated based on the a-pinene in the standard gas. Both methyl vinyl ketone (MVK) and methacrolein (MACR) were included in the standard gas, so the sensitivity of MVK&MACR was calculated based on their summed concentrations. A total of 15 VOC species are reported in this study and listed in Table S1 as well as the limits of detection (LODs) and propagated uncertainties. Based on the multi-level tests in the laboratory, the impacts of humidity on VOC sensitivities were evaluated to be less than 10 % for the reported VOC species, so no correction was conducted, and the induced uncertainty was propagated to the overall uncertainties. The interferences of fragmentations, such as the impact of higher-carbon aldehydes and cycloalkanes on isoprene signal ( 69, C5H8H+) and the impact of ethylbenzene on benzene signal ( 79, C6H6H+), were not corrected, so the concentrations of isoprene and benzene might be overestimated due to these interferences.
In addition, the aircraft platform also carried instruments that recorded the meteorological parameters (AIMMS-20, Aventech Research Inc.), including temperature, relative humidity, and pressure. The vertical profiles of meteorological factors are shown in Fig. S1 in the Supplement. A global positioning system (GPS) was equipped to record the aircraft's position. All instruments were thoroughly inspected and air-tightly checked before each flight to ensure the quality and reliability of data. To minimize the impact of aircraft exhaust emissions on VOC measurement, the data measured during the first 2 min after the engine started were excluded from the profile data.
2.3 Height of planetary boundary layer
In this study, the height of planetary boundary layer (HPBL) was determined by the air parcel method (Zhao et al., 2020, 2019), which was considered to be more accurate and less deviated by human subjective judgment compared with the visual observation method and data simulation method (Zhang et al., 2019). The air parcel method determines the HPBL based on the vertical profile change of the potential temperature (Tθ) during the adiabatic process (Zhang et al., 2018). The vertical profiles of potential temperature for each flight can be found in Fig. S1. Tθ first decreases with height to a minimum and then increases. The HPBL is determined as the height where Tθ returns to its surface value. The HPBL during each ascending and descending stage is listed in Table S2 in the Supplement. A 10 % uncertainty is determined based on previous studies (Zhao et al., 2019; Zhang et al., 2014; Vogelezang and Holtslag, 1996).
3.1 The characteristics of VOC vertical distributions in Beijing
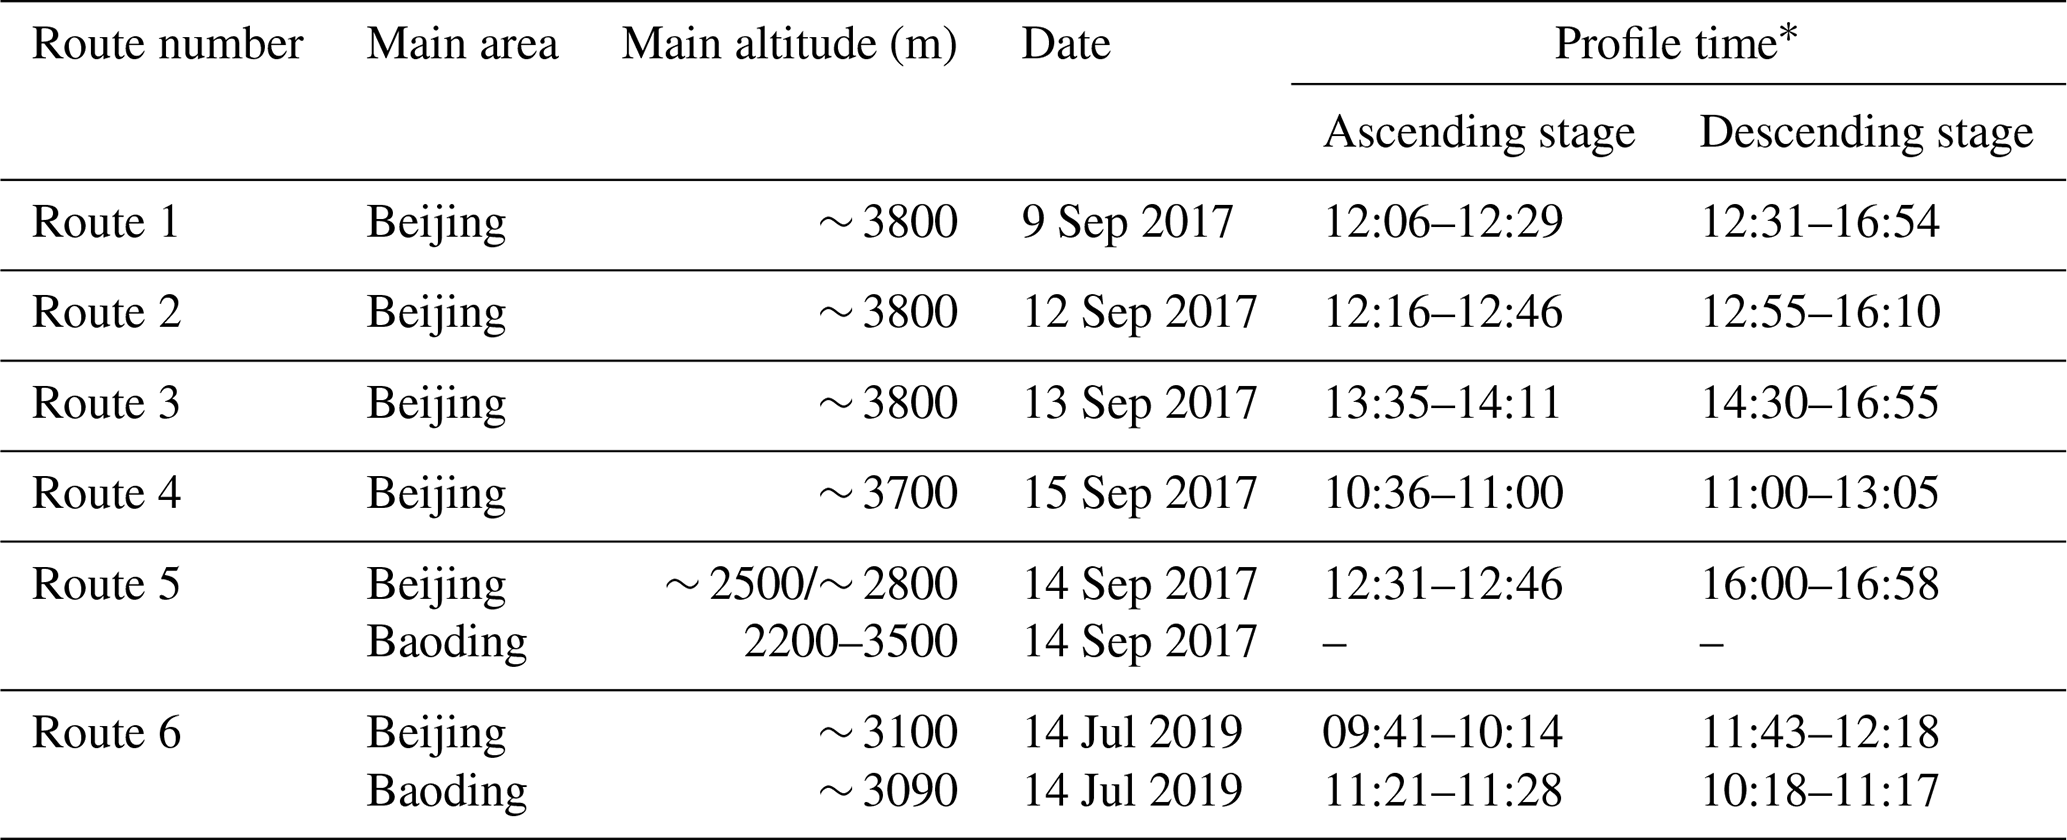
The ambient air quality data of criteria pollutants (ozone, NO2, SO2, CO, PM2.5, and PM10) of Changping Town station, the nearest national air quality monitoring station to the Shahe Airport (11 km away), were collected from the China National Environmental Monitoring Center (CNEMC) and presented in Fig. 2. According to the Level-II thresholds in China's current National Ambient Air Quality Standards (NAAQS), pollution events in Beijing with PM2.5 exceedances on 9, 10, and 14 September and ozone exceedances on 13 September were noticed. The vertical profiles of relative humidity (RH), temperature (T), and Tθ in Fig. S1 provide meteorological information for each flight. Monotonic trends for T and Tθ were recorded. T decreased with altitude, while Tθ had opposite trends. In contrast, RH showed a more complex, non-monotonic trend with altitude, with great variations found across different aerial surveys, reflecting the complexity of the boundary layer structure.
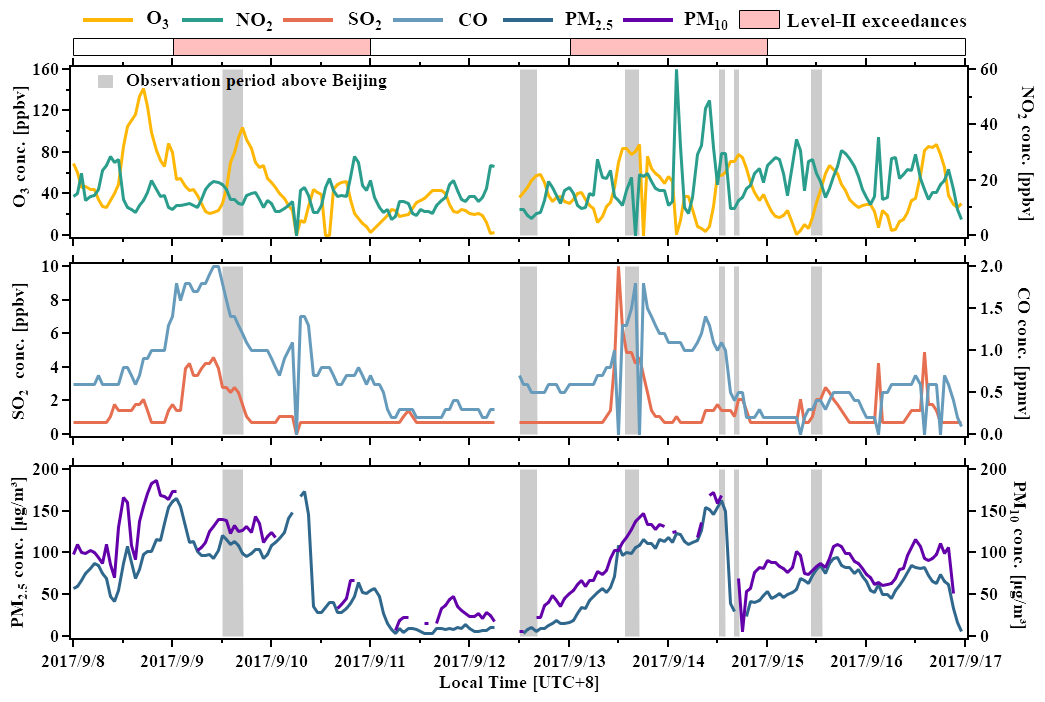
Figure 2Time series of criteria pollutants including ozone, NO2, SO2, CO, PM2.5, and PM10 from 8 and 16 September 2017. Data is obtained from Changping Town stations, the closest national air quality monitoring stations to the airport. Grey shaded areas indicate the observation periods. The bars filled with light red at the bottom show the periods when Level-II National Ambient Air Quality Standards (NAAQS) were exceeded.
Five flights were conducted over Beijing in September 2017. The averaged concentrations of all 15 VOC species ranged from 25.9 ± 13.4 ppb measured on 12 September 2017 to 52.1 ± 57.7 ppb measured on 14 September 2017 (Table S3). The VOC concentrations measured within and above the PBL are listed in Tables S4 and S5. As illustrated in Fig. 3, the VOC concentrations within the PBL (Table S4) were compared with previous measurements in urban Beijing (Squires et al., 2020; Yuan et al., 2012). Yuan et al. (2012) conducted VOC measurements on the top of a six-story building on Peking University campus using the PTR-MS technique in the summer of 2010. The concentrations of aromatic species below the PBL in this study were comparable to those measured in 2010 (Fig. 3b), with data points clustering along the 1 : 1 line. For the OVOC species, the differences remained within or close to twofold variations. The two datasets in Fig. 3b were measured seven years apart, during which VOC emissions in urban Beijing declined significantly (Wang et al., 2015; Yao et al., 2022a). While the VOC levels at the campus site in 2010 should have been higher due to greater VOC emissions, this effect was likely compensated for by the extra industrial emissions in suburban areas, which might be the reason for the comparable results observed.
Figure 3Comparison of averaged VOC concentrations below the PBL in this study and those measured in Beijing in 2010 (Yuan et al., 2012) and 2017 (Squires et al., 2020). Methanol concentrations were scaled down by a factor of 5 to improve visualization in (a). Scatter plots were also shown in (b) and (c). Error bars indicate the standard deviations. Reference lines are shown with shading to illustrate the differences.
VOC measurements by PTR-ToF-MS in the summer of 2017 were conducted at the 102 m platform of the Institute of Atmospheric Physics (IAP) meteorology tower and represented the VOC concentrations driven by traffic-related emissions in the center of urban Beijing (Squires et al., 2020). Compared with the 2017 IAP measurement, the aromatic species measured in this study were higher by factors ranging from 3.2 to 6.2 (Fig. 3c). The enhancements of C8 and C9 aromatics are much greater than those of benzene and toluene. Given that industrial emissions contain higher proportions of C8 and C9 aromatics (Wang et al., 2024; Jiang et al., 2023), these results suggest that the VOC measured in aerial surveys in this study might be under the impacts of industrial emissions from the suburban region, especially at lower altitudes. Most OVOC species measured across both campaigns showed good agreement within twofold variability, except methyl ethyl ketone (MEK), which exhibited a factor of 5.7 higher in this study. As one of the common ingredients in industrial solvents, MEK can be emitted through multiple industrial processes (Wu et al., 2020b; Wang et al., 2024). Similarly, tetrahydrofuran (THF), an isomer of MEK and a significant industrial pollutant itself (Hu et al., 2018), may also contribute to the measured MEK signals. Hence, the higher concentrations of both compounds in this study are likely attributable to the nearby industrial emissions. Regarding the biogenic species, isoprene, MVK&MACR, and monoterpenes measured in this study were consistently higher than those reported in the other two campaigns, probably due to the enhanced biogenic emissions from the suburban region surrounded by mountain vegetation (Fig. 1).
The characteristics of VOC vertical distributions were investigated through ten profiles obtained across the five flights over Beijing in 2017. Composite profiles of individual VOC species, as shown in Fig. 4, revealed fundamental vertical distribution patterns, with detailed profiles for each flight provided in Figs. S2–S6. Generally, decreasing trends with altitudes were observed for most VOC species, and the largest concentration variations were noticed towards the surface due to the dynamic change of surface emissions. These general decreasing trends of pollutants have been reported by previous studies (Benish et al., 2020; Liu et al., 2013; Xue et al., 2011). However, due to a lack of high-resolution VOC measurements, concentration variations with height and anomalous enhancement have not been documented.
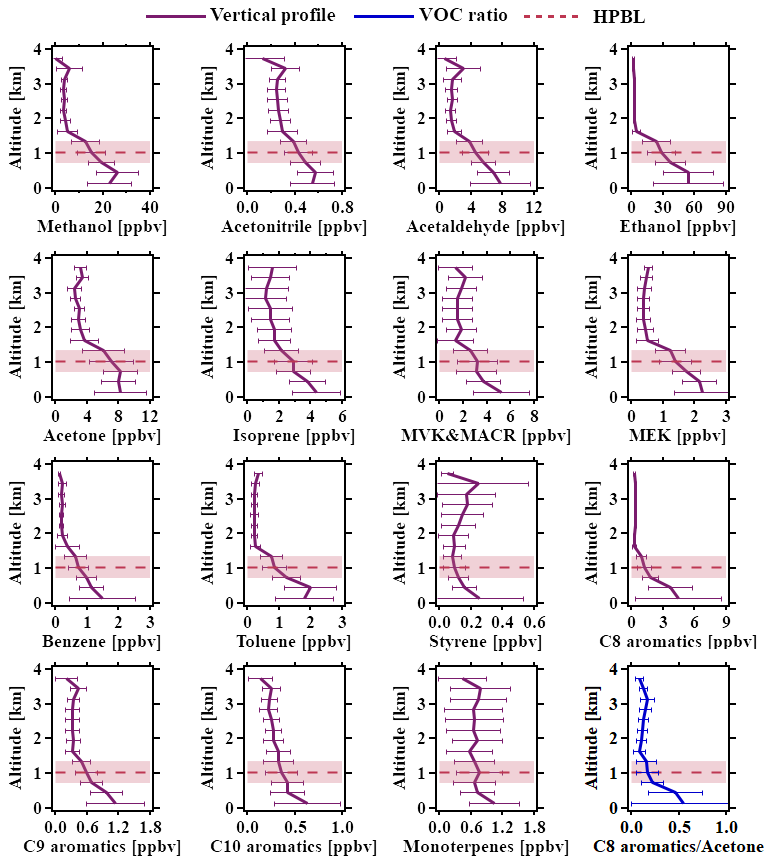
Figure 4Averaged vertical profile (purple line) of VOCs in five aerial surveys above the Beijing area in September 2017 with error bar. The blue line shows the average vertical profile of C8 aromatics-to-acetone concentration ratio with error bar. The red dashed line is the average of the HPBL, with the light red area showing the variation range of one standard deviation.
All aromatic hydrocarbons exhibited characteristic negative vertical gradients with maximum concentrations at ground level (0.3–4.5 ppbv by average) and progressive decreases through the PBL, except the anomalous profile of styrene (Fig. 4). Aromatic hydrocarbons primarily originate from vehicular and industrial emissions. and their lifetime within the PBL can span several days. The dominance of surface emissions explains their significantly higher concentrations near the ground than those measured above the the PBL. As turbulent mixing transports air upward, these compounds get oxidized with OH radicals, diminishing to near-zero levels at higher altitudes with minimal variation. The ground levels of C8 aromatics were the highest, reaching 4.5 ppbv on average. In contrast to other aromatic hydrocarbons, styrene displayed a distinct increase with altitude above the PBL, peaking notably at ∼ 3500 m. Similar concentration enhancements at the same altitude were also observed for methanol, acetonitrile, and acetaldehyde. By checking the profiles of each flight (Figs. S2–S6), such enhancements in the composite profiles were mainly driven by the measurement on 9 September 2017. This anomalous profile, potentially associated with long-range transported industrial emissions, will be further explored in Sect. 3.3. Similar VOC concentration enhancements were also found on the flight for 14 July 2019, which will be analyzed as well in Sect. 3.3.
OVOCs originate from both biogenic and anthropogenic sources and can also be formed as secondary products during the oxidation of non-methane hydrocarbons, complicating the interpretation of their vertical distributions (Yuan et al., 2012). Near the surface, OVOC concentrations were substantially higher than those of aromatic hydrocarbons. Across all flights, the vertical profiles of both alcohols and MEK followed trends similar to aromatic hydrocarbons. Their vertical variations demonstrate the impact of PBL dynamics, as evidenced by their pronounced vertical gradients (Fig. 4). During the flight on 12 September, the HPBL over Beijing exhibited the largest disparity between ascending and descending stages, with a difference of 700 m (Table S2). As illustrated in Fig. S3, when the HPBL increased from ∼ 900 to ∼ 1600 m, turbulent mixing transported ground methanol and ethanol upward, leading to a significant increase in alcohol concentrations above 1000 m. In contrast to other OVOCs, acetone and acetaldehyde displayed markedly greater variability above the PBL on 12 September. Both compounds are known to form secondarily through atmospheric oxidation (Holzinger et al., 2005; de Gouw et al., 2004; Wu et al., 2020a), which likely contributes to their less uniform vertical distribution and larger variability at higher altitudes.
For biogenic VOCs, isoprene and monoterpenes are both primarily emitted from biogenic sources, while MVK and MACR are secondary oxidation products of isoprene (Canaval et al., 2020; Cappellin et al., 2019). Across all flight measurements, the vertical distribution patterns of MVK and MACR were quite similar to those observed for alcohols and most aromatic hydrocarbons. In contrast, the vertical profiles of isoprene and monoterpenes varied significantly between flights. Decreasing trends with altitude were found on 9 September (Fig. S2), 13 September (Fig. S4), and 14 September (Fig. S5). On 12 September (Fig. S3), there were no significant vertical variations of isoprene and monoterpenes across the altitudes. Notably, during the flight on 15 September (Fig. S6), concentration enhancements can be seen at altitudes above 2000 m, suggesting a potential contribution from atmospheric transport.
The ratio between VOC species is commonly applied to address the impact of chemical removal and secondary formation during transport (Yang et al., 2024b; Zhu et al., 2025). The vertical profile of the C8 aromatics-to-acetone concentration ratio was plotted in Fig. 4 to demonstrate these effects. Both species can be emitted by vehicular and industrial emissions (Jiang et al., 2023; Wang et al., 2024), but C8 aromatics are more reactive, and acetone can be formed from secondary processes. The two effects both lead to a rapid decrease in the concentration ratio of C8 aromatics to acetone within the PBL before stabilizing as expected.
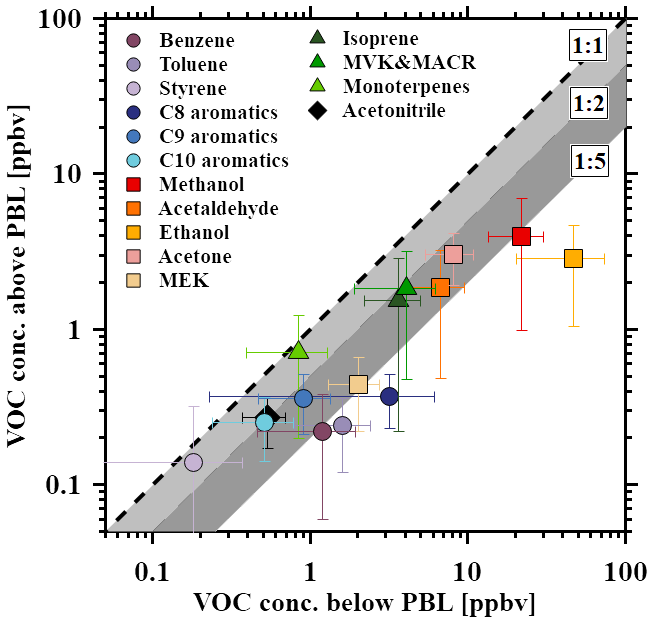
Figure 5Scatter plot of the averaged VOC concentrations in Beijing below and above the PBL in September 2017. Error bars indicate the standard deviations. Reference lines are shown with shading to illustrate the differences.
The averaged VOC concentrations measured below and above the PBL are compared in the scatter plot shown in Fig. 5. To account for the variation of HPBL, data points above and below the light red area in Fig. 4 were used to calculate the averages and corresponding standard deviations. The averaged VOC concentrations below the PBL were consistently higher than those above the PBL, reflecting the combined effects of strong surface source emissions and the chemical oxidation process during vertical transport. Ethanol exhibited the highest concentration within the PBL with an average of 46.7 ppbv and the largest ratio of 16.5 between below- and above-PBL measurements. For the species with secondary formation, the data points of acetaldehyde, acetone, and MEK lay within the 2–5 ratio range. Above the PBL, the averaged concentrations of aromatic hydrocarbons were all smaller than 0.5 ppbv. Within the PBL, C8 aromatics showed the highest concentration, greater than the average above the PBL by a factor of 8.6, followed by toluene and benzene with factors of 6.6 and 5.4, respectively. C8 aromatics are quite chemically reactive, so a higher ratio suggests strong chemical removal, while for less reactive species, such as acetone, its ratio is closer to 1, indicating a weak impact of chemical reactions and potential contribution of secondary formation. Notably, the data points of styrene are clustered near the 1 : 1 ratio line, and occasionally, the concentrations above the PBL could be higher than those within the PBL. Since styrene is a primary species emitted at the surface, this pattern suggests a great contribution from transport, which will be discussed in Sect. 3.3. For isoprene, MVK and MACR, C9 aromatics, C10 aromatics, and acetonitrile, the average concentrations below the PBL were approximately twice as high as those measured above the PBL.
3.2 Differences in VOC vertical distribution in Beijing and Baoding
Two out of the six aerial surveys covered both the Beijing and Baoding areas. The aerial survey on 14 September 2017 maintained a constant altitude of ∼ 3000 m over Baoding, which prevented the collection of a vertical profile for Baoding. The flight conducted on 14 July 2019 provided comprehensive vertical distribution data for both cities through systematic altitude variations and therefore, was selected for the comparative analysis of urban VOC profiles. As shown in Fig. S7, the ascending stage over Beijing was quite short (<10 min), so the vertical profiles measured during the descending stage at noon were selected to better represent the profiles in Beijing. The spiral descending stage in Baoding was used in the comparative analysis as it had well-designed altitude gradients.
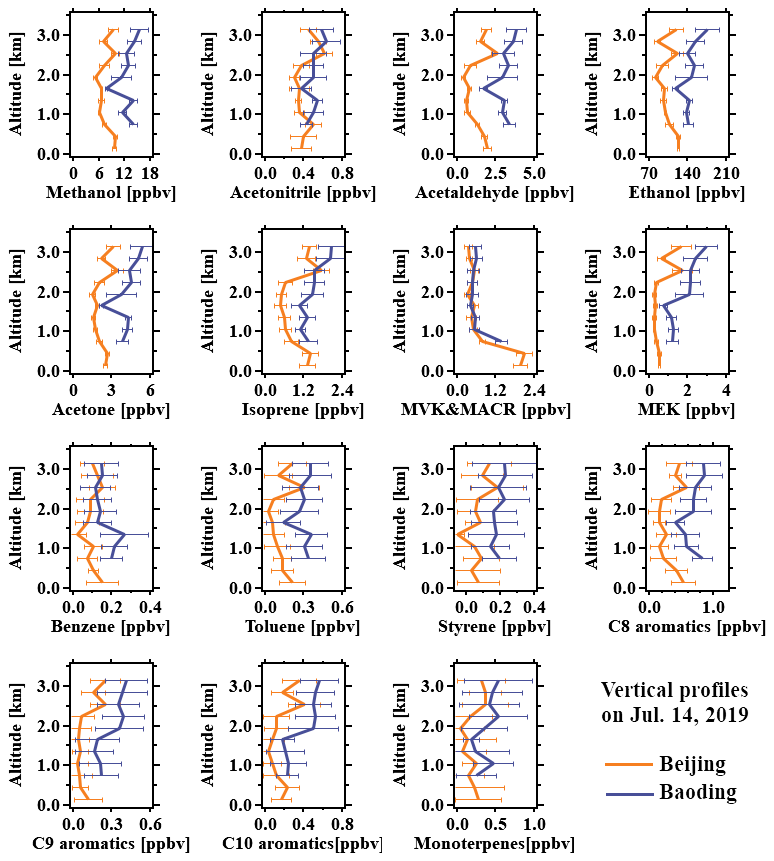
Figure 6Comparison of vertical profiles of VOCs in Beijing (in orange) and Baoding (in blue) during the aerial survey on 14 July 2019, with error bars. The data measured during the descending stages above both cities were plotted.
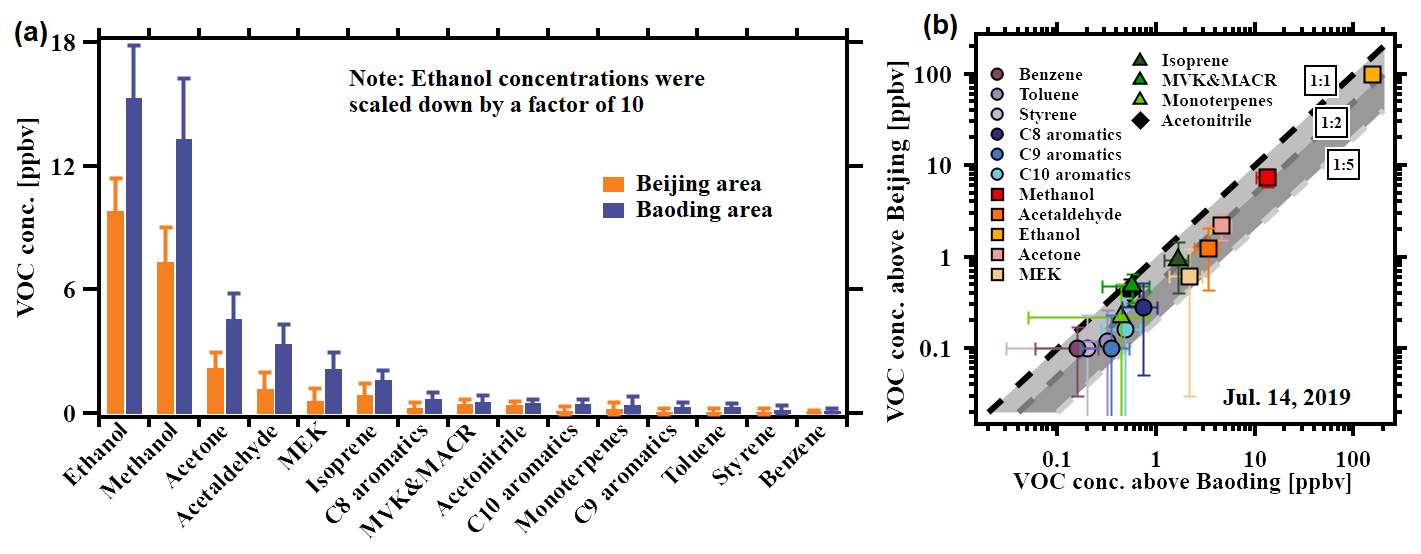
Figure 7Comparison of averaged VOC vertical concentrations in Beijing and Baoding during the aerial survey on 14 July 2019. The data measured within the same altitude range (500–3000 m) were averaged. Ethanol concentrations were scaled down by a factor of 10 to improve visualization in (a). The scatter plot was made in (b). Error bars indicate the standard deviations. Reference lines are shown with shading to illustrate the differences.
The results of the comparison between the vertical VOC distributions of VOCs in Beijing and Baoding are illustrated in Fig. 6. The VOC profile over Beijing exhibited notable concentration peaks around ∼ 2500 m altitude, a feature previously observed during the flight on 9 September 2017 (Fig. S2). This anomaly will be discussed in Sect. 3.3 through the ratio analysis. For Baoding, almost all the VOCs showed increasing trends with altitude, except for MVK and MACR, benzene, and toluene, with stable low levels above 1000 m altitude throughout the observation periods. Unfortunately, the aerial survey didn't capture the VOC surface measurements below 500 m in Baoding, which prevented the comparison between the near-ground VOC levels in both cities. Based on the ground monitoring data from local air quality monitoring stations (Fig. S8), pollution episodes with ozone exceeding the Level-II NAAQS in both Beijing and Baoding were captured on 14 July 2019. Baoding exhibited much higher ozone concentrations compared to Beijing, indicating more severe photochemical pollution, and the northeast wind prevailing over Baoding suggests potential influence from regional transport from Beijing, as reported in previous studies (Huang et al., 2018). Figure 7 presents the comparison between the averaged vertical concentrations of VOCs in Beijing and Baoding during the same altitude range (500–3000 m). Ethanol was found with the highest levels of VOCs measured in the air above both cities (Fig. 7a), 98 ppbv for Beijing and 153 ppbv for Baoding, respectively. According to the scatter plot in Fig. 7b, all the data points cluster around the 1 : 2 line. The VOC concentrations in Baoding were higher than those in Beijing by factors ranging from 1.2 to 3.5 with MEK showing the largest difference. Much greater concentrations of C8 and C9 aromatics in Baoding were found than those of benzene, which, together with the MEK showing the largest difference, suggests more significant impacts from the industrial emissions on the air above Baoding. This VOC enhancement implies a greater precursor reservoir over Baoding, which may accelerate secondary pollutant formation through chemical oxidation production and lead to more severe air pollution.
3.3 The contribution of regional emissions to VOC vertical profiles
Among six aerial surveys in 2017 and 2019, two distinct vertical distributions were noticed, characterized by abrupt VOC concentration enhancements above the PBL. For the aerial survey on 9 September 2017, the vertical profile of styrene exhibited an inverse gradient, with concentrations increasing from 0.2–0.3 ppbv at ground to peak levels of 0.6–1.0 ppbv at ∼ 3500 m altitude, as shown in Fig. 8a. Above the ∼ 3500 m altitude, styrene concentration rapidly fell back to levels close to the detection limit by 4000 m. Similar increases at 3500 m were also noticed for methanol, acetonitrile, acetaldehyde, acetone, benzene, and C9 aromatics. By plotting the ratios of averaged VOC levels at altitudes of 2500–3500 m to the ones near the ground (0–500 m) in Fig. 8b, only styrene showed a ratio significantly larger than 1. This anomaly indicates that at altitudes of 2500–3500 m, the VOC levels were influenced by air mass rich in styrene transported from further regions.
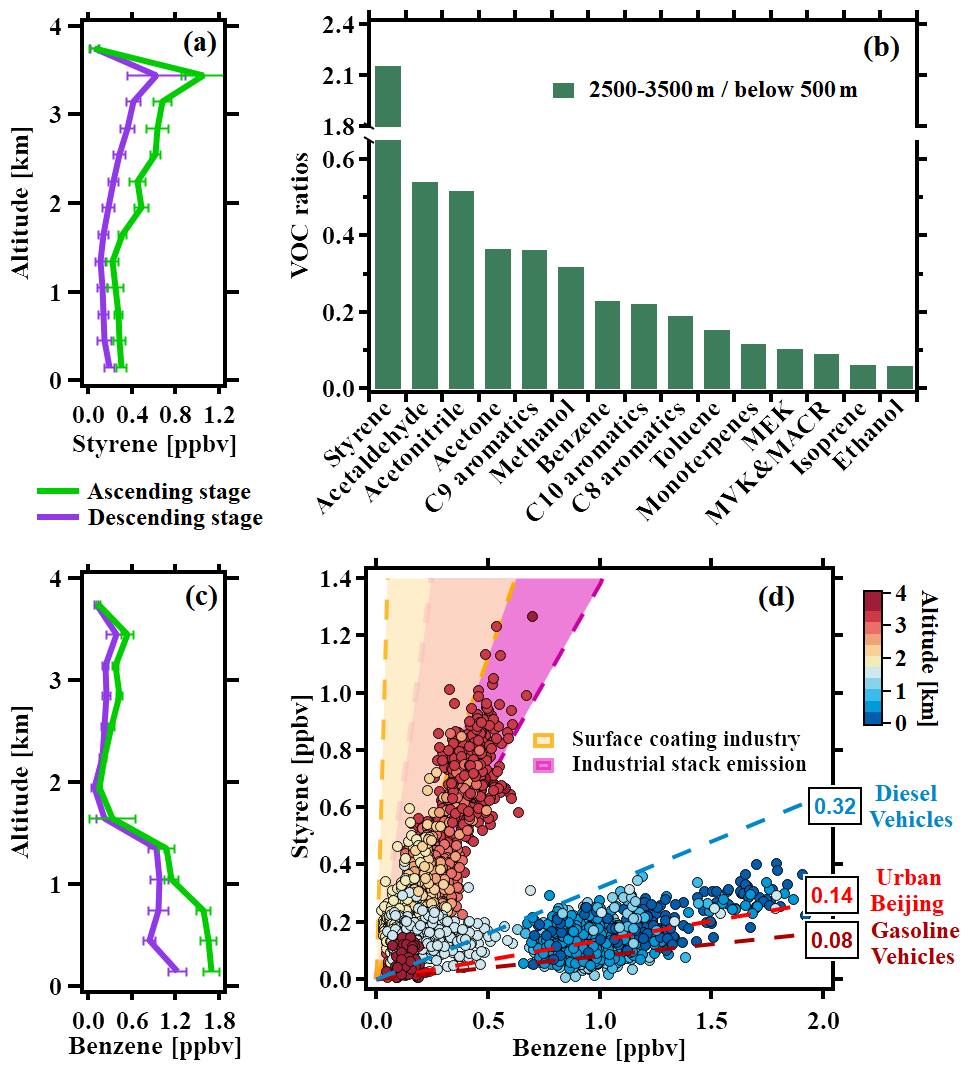
Figure 8Analysis of the vertical profiles of styrene (a) and benzene (c) during ascending (in green) and descending (in purple) stages with error bars on 9 September 2017. (b) The ratios of each VOC species measured between 2500–3500 m and below 500 m. (d) The correlation analysis between styrene and benzene using the profiles. All the data points were color-coded with altitudes. Areas shaded with orange and purple represent the typical ratio ranges of styrene and benzene for the surface coating industry (Zhong et al., 2017) and industrial stack emissions (Jiang et al., 2023), respectively, showing an overlap between the two. The blue and dark red dashed lines represent ratios of styrene and benzene for diesel and gasoline vehicular emissions, respectively (Wang et al., 2024). The red dashed line represents the ratio measured in urban Beijing at the IAP tower in 2021.
We further conducted a correlation analysis with styrene and benzene, as they can be co-emitted from common anthropogenic sources. The paired data points of styrene and benzene are shown in Fig. 8d, together with ratio ranges representing industrial emissions (Jiang et al., 2023; Zhong et al., 2017), vehicular emissions (Wang et al., 2022), and ratios measured in urban Beijing at the IAP tower. The data points were color-coded with altitude. An obvious transition between two subsets of data can be seen as the altitude increases. The data points near the ground are all lying between the lines representing the characteristic ratios of diesel vehicles (slope = 0.32) and gasoline vehicles (slope = 0.08) and are consistent with the ratio observed at the Beijing IAP tower. This indicates the dominant contribution from vehicular emissions for the VOCs near the ground. In contrast, the data points observed with altitudes between 2500–3500 m are located in the characteristic ratio ranges related to industrial emissions, which suggests that the VOCs within this altitude range were greatly impacted by industrial emissions. The synoptic chart in Fig. S9a shows strong northerly winds at the 850 hPa level over the aircraft survey area, suggesting that the industrial emissions were likely transported from the north. Since styrene is more chemically reactive than benzene and thus the lifetime of styrene is much shorter than that of benzene. The ratio of styrene to benzene would decrease during transport. As shown in Fig. 8d, the enhancement ratios at higher altitudes still fall within the characteristic ranges of industrial sources and are significantly larger than those of vehicular emissions. Thus, the chemical influences do not change our conclusion here.
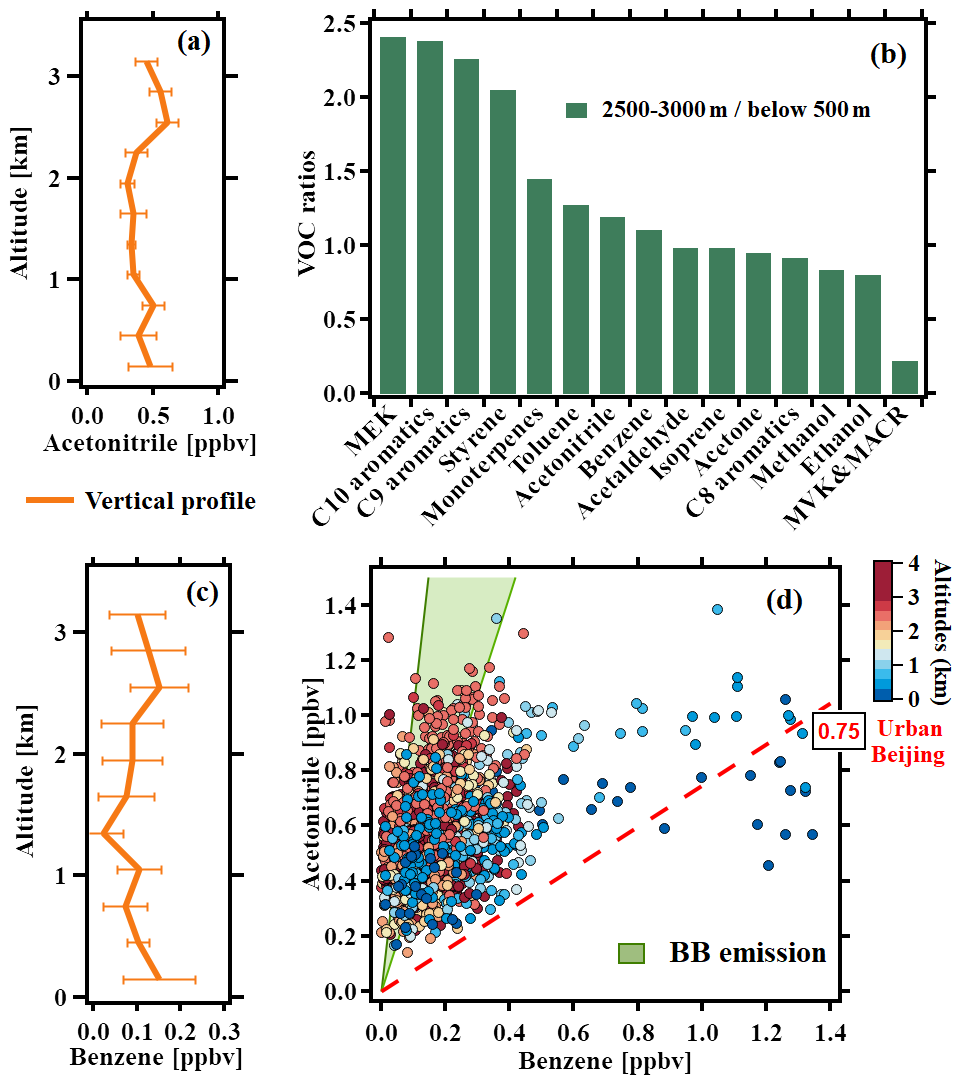
Figure 9Analysis of the vertical profiles of acetonitrile (a) and benzene (c) with error bars on 14 July 2019. (b) The ratios of each VOC species measured between 2500–3000 m and below 500 m. (d) The correlation analysis between acetonitrile and benzene using the whole flight data. All the data points were color-coded with altitudes. The red dashed lines represent ratios in urban Beijing at the IAP tower in 2021. The area with green shadow represents the ratio ranges of acetonitrile and benzene measured in the biomass burning (BB) emissions, including wood, corncob, corn straw, and bean straw (Gao et al., 2023).
During the aerial survey on 14 July 2019, the VOC vertical profiles in the Beijing area (Fig. 6) showed similar trends with elevated VOC concentrations above 2500 m for almost all the VOCs. Analyses were conducted for this aerial survey as shown in Fig. 9. The vertical levels of acetonitrile (Fig. 9a), a widely applied tracer for biomass burning, were well above the typical backgrounds of 0.1–0.3 ppbv reported in previous studies (Wu et al., 2016; Wang et al., 2007). The ratios of averaged VOC levels at higher altitudes (2500–3000 m) and lower altitudes (<500 m) were plotted in Fig. 9b. Unlike the ratios illustrated in Fig. 8, most VOC species in the aerial survey on 14 July had ratios around 1 or even greater than 2 for MEK, C10 aromatics, C9 aromatics, and styrene, showing the impact of significant regional transport. Elevated acetonitrile concentrations above the background might suggest biomass burning contribution. However, using acetonitrile as the biomass burning tracer in urban regions can be problematic (Huangfu et al., 2021; Coggon et al., 2016). Other sources (e.g., vehicular emissions) also emit acetonitrile, potentially interfering with the identification of dominant emission sources (Inomata et al., 2013; Valach et al., 2014). Further correlation analysis was conducted between acetonitrile and benzene in Fig. 9d. Both are typical pollutants emitted from biomass burning and vehicular emissions, therefore, the specific emission ratio of acetonitrile and benzene for both sources can be used as references in the source analysis. We applied the ratio measured in central Beijing to represent the typical ratio of vehicular emissions. While only a few data points are near the typical ratio of urban vehicular emissions (slope = 0.75), most of the data points lie within the typical biomass burning ratio range, suggesting the influence of biomass burning emissions. No clear height-dependent classification can be found, which is distinguished from the analysis in Fig. 8d. As shown in Fig. S9b, winds were quite weak at 850 hPa in the aircraft survey area, suggesting that the elevated VOC concentrations were likely attributed to localized biomass burning emissions.
The analysis of two distinct vertical distributions reveals that regional transport of emissions, such as industrial and biomass burning, can significantly influence the VOC vertical profiles, and the associated chemical processes and environmental impact deserve further investigation.
Aircraft-based observations were conducted to investigate the vertical distribution of VOCs over Beijing and Baoding, two core cities in the NCP region. According to the vertical profiles of VOC concentrations, near-surface VOC levels were generally greater than those at higher altitudes, reflecting strong surface source emissions and chemical removal. In Beijing, ethanol exhibited the highest concentration within the PBL with an average of 46.7 ppbv and the largest vertical gradient with a ratio of 16.5 between the below- and above-PBL averages.
The vertical profiles over Beijing and Baoding were compared. Vertical-averaged VOCs above Baoding were generally greater than those in Beijing by factors ranging from 1.2 to 3.5. Increasing trends of concentrations with altitude in Baoding were observed for most VOC species, excluding MVK and MACR, benzene, and toluene. This implies richer precursors available for the secondary pollutant formation above Baoding.
Unlike the general vertical distributions, increases of VOC concentrations above 2500 m altitude were captured in Beijing. According to the ratio analysis, VOC levels near the surface were mainly emitted from vehicular emissions or under the joint impact of vehicular and biomass burning emissions. In contrast, the regional transport of industrial and biomass burning emissions drove the distinct enhancement of VOC concentration above the PBL.
This study presents vertical profiles of key VOC species up to ∼ 4000 m in the core area of the NCP region, yielding valuable insights into VOC distribution patterns within the PBL and in the atmosphere above it. The observed concentration enhancements underscore the substantial impact of regional transport in shaping vertical distributions of VOCs. As these VOCs actively engage in the complex chemical processes above the PBL, the secondary pollutant formation at the higher altitudes necessitates further investigation.
The data in this article are available from the corresponding author upon reasonable request.
The supplement related to this article is available online at https://doi.org/10.5194/acp-25-17613-2025-supplement.
BY and JS designed the research. JS organized the aerial surveys. WZ, FW, PT, WX, YD, and JS contributed to data collection. YH and ZL performed the data analysis, with contributions from BY, SW, and XH. YH, ZL, and BY prepared the article with contributions from SW, XH, and JS. All the authors reviewed the article.
The contact author has declared that none of the authors has any competing interests.
Publisher's note: Copernicus Publications remains neutral with regard to jurisdictional claims made in the text, published maps, institutional affiliations, or any other geographical representation in this paper. While Copernicus Publications makes every effort to include appropriate place names, the final responsibility lies with the authors. Views expressed in the text are those of the authors and do not necessarily reflect the views of the publisher.
This work was supported by the National Key R&D Program of China (grant nos. 2022YFC3700604, 2023YFC3710900, 2023YFC3706103, 2024YFC3013001), the National Natural Science Foundation of China (grant nos. 42575211, 42230701, 42121004, 42275188), Guangdong Basic and Applied Basic Research Foundation (grant no. 2025A1515011156), and the Innovation Foundation of CPML/CMA (2024CPML-C05). This work was also supported by Guangdong Provincial General Colleges and Universities Innovation Team Project (Natural Science) (grant no. 2024KCXTD004) and Guangdong Province Special Support Plan for High-Level Talents (grant no. 2023JC07L057).
This paper was edited by Kelvin Bates and reviewed by two anonymous referees.
Benish, S. E., He, H., Ren, X., Roberts, S. J., Salawitch, R. J., Li, Z., Wang, F., Wang, Y., Zhang, F., Shao, M., Lu, S., and Dickerson, R. R.: Measurement report: Aircraft observations of ozone, nitrogen oxides, and volatile organic compounds over Hebei Province, China, Atmos. Chem. Phys., 20, 14523–14545, https://doi.org/10.5194/acp-20-14523-2020, 2020.
Canaval, E., Millet, D. B., Zimmer, I., Nosenko, T., Georgii, E., Partoll, E. M., Fischer, L., Alwe, H. D., Kulmala, M., Karl, T., Schnitzler, J. P., and Hansel, A.: Rapid conversion of isoprene photooxidation products in terrestrial plants, Commun. Earth Environ., 1, 44, https://doi.org/10.1038/s43247-020-00041-2, 2020.
Cappellin, L., Loreto, F., Biasioli, F., Pastore, P., and McKinney, K.: A mechanism for biogenic production and emission of MEK from MVK decoupled from isoprene biosynthesis, Atmos. Chem. Phys., 19, 3125–3135, https://doi.org/10.5194/acp-19-3125-2019, 2019.
Chang, X., Wang, S., Zhao, B., Xing, J., Liu, X., Wei, L., Song, Y., Wu, W., Cai, S., Zheng, H., Ding, D., and Zheng, M.: Contributions of inter-city and regional transport to PM2.5 concentrations in the Beijing-Tianjin-Hebei region and its implications on regional joint air pollution control, Science of The Total Environment, 660, 1191–1200, https://doi.org/10.1016/j.scitotenv.2018.12.474, 2019.
Chen, S., Wang, H., Lu, K., Zeng, L., Hu, M., and Zhang, Y.: The trend of surface ozone in Beijing from 2013 to 2019: Indications of the persisting strong atmospheric oxidation capacity, Atmospheric Environment, 242, https://doi.org/10.1016/j.atmosenv.2020.117801, 2020.
Coggon, M. M., Veres, P. R., Yuan, B., Koss, A., Warneke, C., Gilman, J. B., Lerner, B. M., Peischl, J., Aikin, K. C., Stockwell, C. E., Hatch, L. E., Ryerson, T. B., Roberts, J. M., Yokelson, R. J., and de Gouw, J. A.: Emissions of nitrogen-containing organic compounds from the burning of herbaceous and arboraceous biomass: Fuel composition dependence and the variability of commonly used nitrile tracers, Geophysical Research Letters, 43, 9903–9912, https://doi.org/10.1002/2016gl070562, 2016.
de Gouw, J., Warneke, C., Holzinger, R., Klüpfel, T., and Williams, J.: Inter-comparison between airborne measurements of methanol, acetonitrile and acetone using two differently configured PTR-MS instruments, International Journal of Mass Spectrometry, 239, 129–137, https://doi.org/10.1016/j.ijms.2004.07.025, 2004.
Dieu Hien, V. T., Lin, C., Thanh, V. C., Kim Oanh, N. T., Thanh, B. X., Weng, C. E., Yuan, C. S., and Rene, E. R.: An overview of the development of vertical sampling technologies for ambient volatile organic compounds (VOCs), Journal of Environmental Management, 247, 401–412, https://doi.org/10.1016/j.jenvman.2019.06.090, 2019.
Fisher, J. A., Jacob, D. J., Travis, K. R., Kim, P. S., Marais, E. A., Chan Miller, C., Yu, K., Zhu, L., Yantosca, R. M., Sulprizio, M. P., Mao, J., Wennberg, P. O., Crounse, J. D., Teng, A. P., Nguyen, T. B., St. Clair, J. M., Cohen, R. C., Romer, P., Nault, B. A., Wooldridge, P. J., Jimenez, J. L., Campuzano-Jost, P., Day, D. A., Hu, W., Shepson, P. B., Xiong, F., Blake, D. R., Goldstein, A. H., Misztal, P. K., Hanisco, T. F., Wolfe, G. M., Ryerson, T. B., Wisthaler, A., and Mikoviny, T.: Organic nitrate chemistry and its implications for nitrogen budgets in an isoprene- and monoterpene-rich atmosphere: constraints from aircraft (SEAC4RS) and ground-based (SOAS) observations in the Southeast US, Atmos. Chem. Phys., 16, 5969–5991, https://doi.org/10.5194/acp-16-5969-2016, 2016.
Förster, E., Bönisch, H., Neumaier, M., Obersteiner, F., Zahn, A., Hilboll, A., Kalisz Hedegaard, A. B., Daskalakis, N., Poulidis, A. P., Vrekoussis, M., Lichtenstern, M., and Braesicke, P.: Chemical and dynamical identification of emission outflows during the HALO campaign EMeRGe in Europe and Asia, Atmos. Chem. Phys., 23, 1893–1918, https://doi.org/10.5194/acp-23-1893-2023, 2023.
Gao, Y., Wang, H., Yuan, L., Jing, S., Yuan, B., Shen, G., Zhu, L., Koss, A., Li, Y., Wang, Q., Huang, D. D., Zhu, S., Tao, S., Lou, S., and Huang, C.: Measurement report: Underestimated reactive organic gases from residential combustion – insights from a near-complete speciation, Atmos. Chem. Phys., 23, 6633–6646, https://doi.org/10.5194/acp-23-6633-2023, 2023.
Han, F., Xu, J., He, Y., Dang, H., Yang, X., and Meng, F.: Vertical structure of foggy haze over the Beijing–Tianjin–Hebei area in January 2013, Atmospheric Environment, 139, 192-204, https://doi.org/10.1016/j.atmosenv.2016.05.030, 2016.
Holzinger, R., Williams, J., Salisbury, G., Klüpfel, T., de Reus, M., Traub, M., Crutzen, P. J., and Lelieveld, J.: Oxygenated compounds in aged biomass burning plumes over the Eastern Mediterranean: evidence for strong secondary production of methanol and acetone, Atmos. Chem. Phys., 5, 39–46, https://doi.org/10.5194/acp-5-39-2005, 2005.
Hu, D., Li, X., Chen, Z., Cui, Y., Gu, F., Jia, F., Xiao, T., Su, H., Xu, J., Wang, H., Wu, P., and Zhang, Y.: Performance and extracellular polymers substance analysis of a pilot scale anaerobic membrane bioreactor for treating tetrahydrofuran pharmaceutical wastewater at different HRTs, Journal of Hazardous Materials, 342, 383–391, https://doi.org/10.1016/j.jhazmat.2017.08.028, 2018.
Huang, Z., Hong, L., Yin, P., Wang, X., and Zhang, Y.: Source Apportionment and Transport Characteristics of Ozone in Baoding during Summer Time, Acta Scientiarum Naturalium Universitatis Pekinensis, 53, 665–672, https://doi.org/10.13209/j.0479-8023.2017.189, 2018.
Huangfu, Y., Yuan, B., Wang, S., Wu, C., He, X., Qi, J., de Gouw, J., Warneke, C., Gilman, J. B., Wisthaler, A., Karl, T., Graus, M., Jobson, B. T., and Shao, M.: Revisiting Acetonitrile as Tracer of Biomass Burning in Anthropogenic-Influenced Environments, Geophysical Research Letters, 48, https://doi.org/10.1029/2020gl092322, 2021.
Inomata, S., Tanimoto, H., Fujitani, Y., Sekimoto, K., Sato, K., Fushimi, A., Yamada, H., Hori, S., Kumazawa, Y., Shimono, A., and Hikida, T.: On-line measurements of gaseous nitro-organic compounds in diesel vehicle exhaust by proton-transfer-reaction mass spectrometry, Atmospheric Environment, 73, 195–203, https://doi.org/10.1016/j.atmosenv.2013.03.035, 2013.
Jiang, C., Pei, C., Cheng, C., Shen, H., Zhang, Q., Lian, X., Xiong, X., Gao, W., Liu, M., Wang, Z., Huang, B., Tang, M., Yang, F., Zhou, Z., and Li, M.: Emission factors and source profiles of volatile organic compounds from typical industrial sources in Guangzhou, China, Science of the Total Environment, 869, 161758, https://doi.org/10.1016/j.scitotenv.2023.161758, 2023.
Karion, A., Sweeney, C., Kort, E. A., Shepson, P. B., Brewer, A., Cambaliza, M., Conley, S. A., Davis, K., Deng, A., Hardesty, M., Herndon, S. C., Lauvaux, T., Lavoie, T., Lyon, D., Newberger, T., Petron, G., Rella, C., Smith, M., Wolter, S., Yacovitch, T. I., and Tans, P.: Aircraft-Based Estimate of Total Methane Emissions from the Barnett Shale Region, Environmental Science & Technology, 49, 8124–8131, https://doi.org/10.1021/acs.est.5b00217, 2015.
Kwak, K.-H., Lee, S.-H., Kim, A. Y., Park, K.-C., Lee, S.-E., Han, B.-S., Lee, J., and Park, Y.-S.: Daytime Evolution of Lower Atmospheric Boundary Layer Structure: Comparative Observations between a 307-m Meteorological Tower and a Rotary-Wing UAV, Atmosphere, 11, https://doi.org/10.3390/atmos11111142, 2020.
Le, T., Wang, Y., Liu, L., Yang, J., Yung, Y. L., Li, G., and Seinfeld, J. H.: Unexpected air pollution with marked emission reductions during the COVID-19 outbreak in China, Science, 369, 702–706, https://doi.org/10.1126/science.abb7431, 2020.
Li, K., Jacob, D. J., Liao, H., Shen, L., Zhang, Q., and Bates, K. H.: Anthropogenic drivers of 2013–2017 trends in summer surface ozone in China, Proceedings of the National Academy of Sciences of the United States of America, 116, 422–427, https://doi.org/10.1073/pnas.1812168116, 2019a.
Li, M., Zhang, Q., Zheng, B., Tong, D., Lei, Y., Liu, F., Hong, C., Kang, S., Yan, L., Zhang, Y., Bo, Y., Su, H., Cheng, Y., and He, K.: Persistent growth of anthropogenic non-methane volatile organic compound (NMVOC) emissions in China during 1990–2017: drivers, speciation and ozone formation potential, Atmos. Chem. Phys., 19, 8897–8913, https://doi.org/10.5194/acp-19-8897-2019, 2019b.
Li, X.-B., Yuan, B., Wang, S., Wang, C., Lan, J., Liu, Z., Song, Y., He, X., Huangfu, Y., Pei, C., Cheng, P., Yang, S., Qi, J., Wu, C., Huang, S., You, Y., Chang, M., Zheng, H., Yang, W., Wang, X., and Shao, M.: Variations and sources of volatile organic compounds (VOCs) in urban region: insights from measurements on a tall tower, Atmos. Chem. Phys., 22, 10567–10587, https://doi.org/10.5194/acp-22-10567-2022, 2022a.
Li, Z., Yu, S., Li, M., Chen, X., Zhang, Y., Song, Z., Li, J., Jiang, Y., Liu, W., Li, P., and Zhang, X.: The Modeling Study about Impacts of Emission Control Policies for Chinese 14th Five-Year Plan on PM2.5 and O3 in Yangtze River Delta, China, Atmosphere, 13, 26, https://doi.org/10.3390/atmos13010026, 2022b.
Li, X.-B., Yuan, B., Huangfu, Y., Yang, S., Song, X., Qi, J., He, X., Wang, S., Chen, Y., Yang, Q., Song, Y., Peng, Y., Tang, G., Gao, J., Gu, D., and Shao, M.: Vertical changes in volatile organic compounds (VOCs) and impacts on photochemical ozone formation, Atmos. Chem. Phys., 25, 2459–2472, https://doi.org/10.5194/acp-25-2459-2025, 2025.
Liu, K., Quan, J., Mu, Y., Zhang, Q., Liu, J., Gao, Y., Chen, P., Zhao, D., and Tian, H.: Aircraft measurements of BTEX compounds around Beijing city, Atmospheric Environment, 73, 11–15, https://doi.org/10.1016/j.atmosenv.2013.02.050, 2013.
Liu, Q., Ding, D., Huang, M., Tian, P., Zhao, D., Wang, F., Li, X., Bi, K., Sheng, J., Zhou, W., Liu, D., Huang, R., and Zhao, C.: A study of elevated pollution layer over the North China Plain using aircraft measurements, Atmospheric Environment, 190, 188–194, https://doi.org/10.1016/j.atmosenv.2018.07.024, 2018.
Liu, Y., Wang, H., Jing, S., Gao, Y., Peng, Y., Lou, S., Cheng, T., Tao, S., Li, L., Li, Y., Huang, D., Wang, Q., and An, J.: Characteristics and sources of volatile organic compounds (VOCs) in Shanghai during summer: Implications of regional transport, Atmospheric Environment, 215, https://doi.org/10.1016/j.atmosenv.2019.116902, 2019.
Lu, X., Zhang, L., Chen, Y., Zhou, M., Zheng, B., Li, K., Liu, Y., Lin, J., Fu, T.-M., and Zhang, Q.: Exploring 2016–2017 surface ozone pollution over China: source contributions and meteorological influences, Atmos. Chem. Phys., 19, 8339–8361, https://doi.org/10.5194/acp-19-8339-2019, 2019.
Lu, X., Zhang, L., Wang, X., Gao, M., Li, K., Zhang, Y., Yue, X., and Zhang, Y.: Rapid Increases in Warm-Season Surface Ozone and Resulting Health Impact in China Since 2013, Environmental Science & Technology Letters, 7, 240–247, https://doi.org/10.1021/acs.estlett.0c00171, 2020.
Mao, Z., Bai, Y., and Meng, F.: How can China achieve the energy and environmental targets in the 14th and 15th five-year periods? A perspective of economic restructuring, Sustainable Production and Consumption, 27, 2022–2036, https://doi.org/10.1016/j.spc.2021.05.005, 2021.
Peng, Z.-R., Wang, D., Wang, Z., Gao, Y., and Lu, S.: A study of vertical distribution patterns of PM2.5 concentrations based on ambient monitoring with unmanned aerial vehicles: A case in Hangzhou, China, Atmospheric Environment, 123, 357–369, https://doi.org/10.1016/j.atmosenv.2015.10.074, 2015.
Ren, X., Salmon, O. E., Hansford, J. R., Ahn, D., Hall, D., Benish, S. E., Stratton, P. R., He, H., Sahu, S., Grimes, C., Heimburger, A. M. F., Martin, C. R., Cohen, M. D., Stunder, B., Salawitch, R. J., Ehrman, S. H., Shepson, P. B., and Dickerson, R. R.: Methane Emissions From the Baltimore-Washington Area Based on Airborne Observations: Comparison to Emissions Inventories, Journal of Geophysical Research: Atmospheres, 123, 8869–8882, https://doi.org/10.1029/2018jd028851, 2018.
Sangiorgi, G., Ferrero, L., Perrone, M. G., Bolzacchini, E., Duane, M., and Larsen, B. R.: Vertical distribution of hydrocarbons in the low troposphere below and above the mixing height: Tethered balloon measurements in Milan, Italy, Environmental Pollution, 159, 3545–3552, https://doi.org/10.1016/j.envpol.2011.08.012, 2011.
Shi, H., Critto, A., Torresan, S., and Gao, Q.: The Temporal and Spatial Distribution Characteristics of Air Pollution Index and Meteorological Elements in Beijing, Tianjin, and Shijiazhuang, China, Integrated Environmental Assessment and Management, 14, 710–721, https://doi.org/10.1002/ieam.4067, 2018.
Squires, F. A., Nemitz, E., Langford, B., Wild, O., Drysdale, W. S., Acton, W. J. F., Fu, P., Grimmond, C. S. B., Hamilton, J. F., Hewitt, C. N., Hollaway, M., Kotthaus, S., Lee, J., Metzger, S., Pingintha-Durden, N., Shaw, M., Vaughan, A. R., Wang, X., Wu, R., Zhang, Q., and Zhang, Y.: Measurements of traffic-dominated pollutant emissions in a Chinese megacity, Atmos. Chem. Phys., 20, 8737–8761, https://doi.org/10.5194/acp-20-8737-2020, 2020.
Sun, J., Wang, Y., Wu, F., Tang, G., Wang, L., Wang, Y., and Yang, Y.: Vertical characteristics of VOCs in the lower troposphere over the North China Plain during pollution periods, Environmental Pollution, 236, 907–915, https://doi.org/10.1016/j.envpol.2017.10.051, 2018.
Valach, A. C., Langford, B., Nemitz, E., MacKenzie, A. R., and Hewitt, C. N.: Concentrations of selected volatile organic compounds at kerbside and background sites in central London, Atmospheric Environment, 95, 456–467, https://doi.org/10.1016/j.atmosenv.2014.06.052, 2014.
Vo, T. D., Lin, C., Weng, C. E., Yuan, C. S., Lee, C. W., Hung, C. H., Bui, X. T., Lo, K. C., and Lin, J. X.: Vertical stratification of volatile organic compounds and their photochemical product formation potential in an industrial urban area, Journal of Environmental Management, 217, 327–336, https://doi.org/10.1016/j.jenvman.2018.03.101, 2018.
Vogelezang, D. H. P. and Holtslag, A. A. M.: Evaluation and model impacts of alternative boundary-layer height formulations, Boundary-Layer Meteorology, 81, 245–269, https://doi.org/10.1007/BF02430331, 1996.
Wang, M., Shao, M., Chen, W., Yuan, B., Lu, S., Zhang, Q., Zeng, L., and Wang, Q.: A temporally and spatially resolved validation of emission inventories by measurements of ambient volatile organic compounds in Beijing, China, Atmos. Chem. Phys., 14, 5871–5891, https://doi.org/10.5194/acp-14-5871-2014, 2014.
Wang, M., Shao, M., Chen, W., Lu, S., Liu, Y., Yuan, B., Zhang, Q., Zhang, Q., Chang, C.-C., Wang, B., Zeng, L., Hu, M., Yang, Y., and Li, Y.: Trends of non-methane hydrocarbons (NMHC) emissions in Beijing during 2002–2013, Atmos. Chem. Phys., 15, 1489–1502, https://doi.org/10.5194/acp-15-1489-2015, 2015.
Wang, Q., Shao, M., Liu, Y., William, K., Paul, G., Li, X., Liu, Y., and Lu, S.: Impact of biomass burning on urban air quality estimated by organic tracers: Guangzhou and Beijing as cases, Atmospheric Environment, 41, 8380–8390, https://doi.org/10.1016/j.atmosenv.2007.06.048, 2007.
Wang, S., Yuan, B., Wu, C., Wang, C., Li, T., He, X., Huangfu, Y., Qi, J., Li, X.-B., Sha, Q., Zhu, M., Lou, S., Wang, H., Karl, T., Graus, M., Yuan, Z., and Shao, M.: Oxygenated volatile organic compounds (VOCs) as significant but varied contributors to VOC emissions from vehicles, Atmos. Chem. Phys., 22, 9703–9720, https://doi.org/10.5194/acp-22-9703-2022, 2022.
Wang, S., Yuan, B., He, X., Cui, R., Song, X., Chen, Y., Wu, C., Wang, C., Huangfu, Y., Li, X.-B., Wang, B., and Shao, M.: Emission characteristics of reactive organic gases (ROGs) from industrial volatile chemical products (VCPs) in the Pearl River Delta (PRD), China, Atmos. Chem. Phys., 24, 7101–7121, https://doi.org/10.5194/acp-24-7101-2024, 2024.
Wang, Z., Zhang, P., Pan, L., Qian, Y., Li, Z., Li, X., Guo, C., Zhu, X., Xie, Y., and Wei, Y.: Ambient Volatile Organic Compound Characterization, Source Apportionment, and Risk Assessment in Three Megacities of China in 2019, Toxics, 11, https://doi.org/10.3390/toxics11080651, 2023.
Wilde, S. E., Dominutti, P. A., Allen, G., Andrews, S. J., Bateson, P., Bauguitte, S. J.-B., Burton, R. R., Colfescu, I., France, J., Hopkins, J. R., Huang, L., Jones, A. E., Lachlan-Cope, T., Lee, J. D., Lewis, A. C., Mobbs, S. D., Weiss, A., Young, S., and Purvis, R. M.: Speciation of VOC emissions related to offshore North Sea oil and gas production, Atmos. Chem. Phys., 21, 3741–3762, https://doi.org/10.5194/acp-21-3741-2021, 2021.
Wu, C., Wang, C., Wang, S., Wang, W., Yuan, B., Qi, J., Wang, B., Wang, H., Wang, C., Song, W., Wang, X., Hu, W., Lou, S., Ye, C., Peng, Y., Wang, Z., Huangfu, Y., Xie, Y., Zhu, M., Zheng, J., Wang, X., Jiang, B., Zhang, Z., and Shao, M.: Measurement report: Important contributions of oxygenated compounds to emissions and chemistry of volatile organic compounds in urban air, Atmos. Chem. Phys., 20, 14769–14785, https://doi.org/10.5194/acp-20-14769-2020, 2020a.
Wu, J., Gao, S., Chen, X., Yang, Y., Fu, Q.-Y., Che, X., and Jiao, Z.: Source Profiles and Impact of Volatile Organic Compounds in the Coating Manufacturing Industry, Environmental Science, 41, 1582–1588, https://doi.org/10.13227/j.hjkx.201908203, 2020b.
Wu, R., Li, J., Hao, Y., Li, Y., Zeng, L., and Xie, S.: Evolution process and sources of ambient volatile organic compounds during a severe haze event in Beijing, China, Science of The Total Environment, 560–561, 62–72, https://doi.org/10.1016/j.scitotenv.2016.04.030, 2016.
Xue, L. K., Wang, T., Simpson, I. J., Ding, A. J., Gao, J., Blake, D. R., Wang, X. Z., Wang, W. X., Lei, H. C., and Jing, D. Z.: Vertical distributions of non-methane hydrocarbons and halocarbons in the lower troposphere over northeast China, Atmospheric Environment, 45, 6501–6509, https://doi.org/10.1016/j.atmosenv.2011.08.072, 2011.
Yang, Q., Li, X.-B., Yuan, B., Zhang, X., Huangfu, Y., Yang, L., He, X., Qi, J., and Shao, M.: Measurement report: Enhanced photochemical formation of formic and isocyanic acids in urban regions aloft – insights from tower-based online gradient measurements, Atmos. Chem. Phys., 24, 6865–6882, https://doi.org/10.5194/acp-24-6865-2024, 2024a.
Yang, S., Zhu, B., Shi, S., Jiang, Z., Hou, X., An, J., and Xia, L.: Vertical Features of Volatile Organic Compounds and Their Potential Photochemical Reactivities in Boundary Layer Revealed by In-Situ Observations and Satellite Retrieval, Remote Sensing, 16, https://doi.org/10.3390/rs16081403, 2024b.
Yao, D., Tang, G., Sun, J., Wang, Y., Yang, Y., Wang, Y., Liu, B., He, H., and Wang, Y.: Annual nonmethane hydrocarbon trends in Beijing from 2000 to 2019, Journal of Environmental Sciences, 112, 210–217, https://doi.org/10.1016/j.jes.2021.04.017, 2022a.
Yao, D., Tang, G., Wang, Y., Yang, Y., Wang, Y., Liu, Y., Yu, M., Liu, Y., Yu, H., Liu, J., Hu, B., Wang, P., and Wang, Y.: Oscillation cumulative volatile organic compounds on the northern edge of the North China Plain: Impact of mountain-plain breeze, Science of The Total Environment, 821, 153541, https://doi.org/10.1016/j.scitotenv.2022.153541, 2022b.
Yuan, B., Shao, M., de Gouw, J., Parrish, D. D., Lu, S., Wang, M., Zeng, L., Zhang, Q., Song, Y., Zhang, J., and Hu, M.: Volatile organic compounds (VOCs) in urban air: How chemistry affects the interpretation of positive matrix factorization (PMF) analysis, Journal of Geophysical Research: Atmospheres, 117, https://doi.org/10.1029/2012jd018236, 2012.
Yuan, B., Koss, A. R., Warneke, C., Coggon, M., Sekimoto, K., and de Gouw, J. A.: Proton-Transfer-Reaction Mass Spectrometry: Applications in Atmospheric Sciences, Chemical Reviews, 117, 13187–13229, https://doi.org/10.1021/acs.chemrev.7b00325, 2017.
Zhang, H., Zhang, Y., Huang, Z., Acton, W. J. F., Wang, Z., Nemitz, E., Langford, B., Mullinger, N., Davison, B., Shi, Z., Liu, D., Song, W., Yang, W., Zeng, J., Wu, Z., Fu, P., Zhang, Q., and Wang, X.: Vertical profiles of biogenic volatile organic compounds as observed online at a tower in Beijing, Journal of Environmental Sciences, 95, 33–42, https://doi.org/10.1016/j.jes.2020.03.032, 2020.
Zhang, K., Xiu, G., Zhou, L., Bian, Q., Duan, Y., Fei, D., Wang, D., and Fu, Q.: Vertical distribution of volatile organic compounds within the lower troposphere in late spring of Shanghai, Atmospheric Environment, 186, 150–157, https://doi.org/10.1016/j.atmosenv.2018.03.044, 2018.
Zhang, K., Zhou, L., Fu, Q., Yan, L., Bian, Q., Wang, D., and Xiu, G.: Vertical distribution of ozone over Shanghai during late spring: A balloon-borne observation, Atmospheric Environment, 208, 48–60, https://doi.org/10.1016/j.atmosenv.2019.03.011, 2019.
Zhang, Y., Gao, Z., Li, D., Li, Y., Zhang, N., Zhao, X., and Chen, J.: On the computation of planetary boundary-layer height using the bulk Richardson number method, Geosci. Model Dev., 7, 2599–2611, https://doi.org/10.5194/gmd-7-2599-2014, 2014.
Zhao, D., Huang, M., Tian, P., He, H., Lowe, D., Zhou, W., Sheng, J., Wang, F., Bi, K., Kong, S., Yang, Y., Liu, Q., Liu, D., and Ding, D.: Vertical characteristics of black carbon physical properties over Beijing region in warm and cold seasons, Atmospheric Environment, 213, 296–310, https://doi.org/10.1016/j.atmosenv.2019.06.007, 2019.
Zhao, D., Liu, D., Yu, C., Tian, P., Hu, D., Zhou, W., Ding, S., Hu, K., Sun, Z., Huang, M., Huang, Y., Yang, Y., Wang, F., Sheng, J., Liu, Q., Kong, S., Li, X., He, H., and Ding, D.: Vertical evolution of black carbon characteristics and heating rate during a haze event in Beijing winter, Science of The Total Environment, 709, https://doi.org/10.1016/j.scitotenv.2019.136251, 2020.
Zhao, R., Yin, B., Zhang, N., Wang, J., Geng, C., Wang, X., Han, B., Li, K., Li, P., Yu, H., Yang, W., and Bai, Z.: Aircraft-based observation of gaseous pollutants in the lower troposphere over the Beijing-Tianjin-Hebei region, Science of The Total Environment, 773, https://doi.org/10.1016/j.scitotenv.2020.144818, 2021.
Zhong, Z., Sha, Q., Zheng, J., Yuan, Z., Gao, Z., Ou, J., Zheng, Z., Li, C., and Huang, Z.: Sector-based VOCs emission factors and source profiles for the surface coating industry in the Pearl River Delta region of China, Science of the Total Environment, 583, 19–28, https://doi.org/10.1016/j.scitotenv.2016.12.172, 2017.
Zhu, B., Yang, S., Shi, S., Jiang, Z., Tang, G., Lu, C., Hou, X., An, J., Xia, L., and Liao, H.: Revealing Distinct Photochemical Ages within the Vertical Boundary Layer and Seasons by Observed VOC Species Ratios, ACS ES&T Air, 2, 1172–1179, https://doi.org/10.1021/acsestair.4c00319, 2025.