the Creative Commons Attribution 4.0 License.
the Creative Commons Attribution 4.0 License.
 | 26 Nov 2025
Impacts of reductions in anthropogenic aerosols and greenhouse gases toward carbon neutrality on dust pollution over the Northern Hemisphere dust belt
Shicheng Yan
Lili Ren
Hailong Wang
Pinya Wang
Lei Chen
Jianbin Jin
Hong Liao
To mitigate future global warming, many countries have implemented rigorous climate policies for carbon neutrality. Given some shared emission sources with greenhouse gases (GHGs), aerosol particles and their precursor emissions are expected to be reduced as the consequences of global efforts in climate mitigation and environmental improvement, potentially inducing complex climate feedbacks. However, a clear understanding of the individual effects of anthropogenic aerosols and GHGs on natural dust concentrations has not yet emerged, especially in the carbon neutral scenario. Here, we assess the large-scale impacts of reductions in anthropogenic GHGs and aerosol under a carbon neutral scenario in 2060 on natural dust emissions and concentrations over the low- to mid-latitudes in the Northern Hemisphere using the fully coupled Community Earth System Model. Our findings demonstrate a decline in atmospheric dust loading toward carbon neutrality (SSP1-1.9) relative to the high fossil fuel scenario (SSP5-8.5). Mechanistic analysis reveals counteracting modulation mechanisms: (i) reductions in aerosols amplify surface downwelling shortwave radiation, convection and wind speed, thereby promoting dust emissions by 6 %–12 % and concentrations by 4 %–20 % over North Africa, the Central Asia Desert and East Asia; (ii) GHGs reductions diminish the land-ocean thermal contrast and wind speed, suppressing dust emissions by 6 %–15 % and concentrations by 8 %–20 % mainly over the Central Asia Desert and North Africa. The latter drives the future dust responses. These results highlight that carbon neutral strategies not only achieve climate mitigation goals and air quality improvements, but also generate synergistic benefits through dust pollution suppression.
- Article
(24460 KB) - Full-text XML
-
Supplement
(1164 KB) - BibTeX
- EndNote


Dust aerosols are a crucial component of the Earth-atmosphere system, exerting multifaceted influences on environment and climate (Chen et al., 2024; Hu et al., 2023). They play a significant role in modulating the Earth's radiation budget via aerosol-cloud and aerosol-radiation interactions. Dust aerosols absorb longwave radiation and scatter shortwave radiation, thereby influencing atmospheric radiative balance and surface energy fluxes (Kok et al., 2017, 2023; Liu et al., 2021). Additionally, dust aerosols act as cloud condensation nuclei, modifying cloud microphysical properties and subsequently affecting cloud development and precipitation patterns (Min et al., 2009; Yuan et al., 2021; Zhang et al., 2021). In addition, mineral dust transports iron to marine ecosystems, stimulating phytoplankton growth and enhancing carbon fixation (Jickells et al., 2005; Pabortsava et al., 2017). Furthermore, dust can reduce visibility, degrade air quality and have important impacts on public health, particularly in arid and semiarid regions (Fussell and Kelly, 2021; Goudie, 2014; Li et al., 2024; Roy et al., 2023). These health risks are extended beyond proximal desert margins to distal urban centers by intercontinental transport mechanisms (Griffin, 2007; Meng et al., 2023).
The global primary sources of dust emissions are located in the arid zones of the low- to mid-latitudes in the Northern Hemisphere, with core areas concentrated in the Sahara Desert of North Africa, the Central Asia Desert, Arabian Desert, Taklamakan Desert, and Gobi Desert of East Asia, which is often called the dust belt (Prospero et al., 2002; Shao et al., 2011). Specifically, the North African desert, as the world's largest dust source, injects approximately 1.0–1.5 billion t of dust aerosols annually into the atmosphere, accounting for 50 %–65 % of the global total dust emissions (Tanaka and Chiba, 2006; Ginoux et al., 2004). Meanwhile, Asian dust sources contribute 30 %–40 % of the global dust flux and are identified as the second-largest emission center (Kok et al., 2021).
Dust emission is influenced by climate change, determined by a combination of natural and anthropogenic factors, including greenhouse gases (GHGs) concentrations, aerosol loading, and land use, with anthropogenic contributions exhibiting increasing influence in the post-industrial era (Gui et al., 2022; Tegen et al., 2004). Variations in GHGs concentrations further regulate dust transport through large-scale atmospheric teleconnections. Elevated GHGs levels amplified the North Atlantic Oscillation (NAO) (Kuzmina et al., 2005), which changed atmospheric circulation patterns and enhanced dust advection to South Asia (Banerjee et al., 2021). The strengthened West African monsoon under warming conditions was found to amplify dust emissions (Wubben et al., 2024). In the arid and semi-arid regions of North and Central Asia, surface warming enhanced atmospheric instability, thereby intensifying vertical convective motions and significantly increasing dust emission fluxes (Zhou et al., 2023). Anthropogenic aerosols are recognized as an important forcing factor in global and regional climate systems (Ramanathan et al., 2001; Myhre et al., 2017). Analyses of observations from 1979 to 2013 showed that anthropogenic sulfate aerosols over the Asian monsoon region suppressed dust emissions in East Asia by altering atmospheric dynamics (Xie et al., 2025). Specifically, sulfate-induced shifts in the Asian westerly jet enhanced precipitation and reduced surface wind speeds across arid and semi-arid source regions, thereby limiting dust mobilization. Model simulations illustrated that the combined reduction of carbonaceous aerosols (black carbon and organic carbon) and increased sulfate emissions in South Asia synergistically caused atmospheric cooling over continental regions, which attenuated the zonal thermal gradient, resulting in a weakening of the Indian summer monsoon circulation (Das et al., 2020). Concurrently, this altered atmospheric circulation suppressed dust emissions from the Arabian Peninsula and inhibited dust transport across the Arabian Sea. Observational and reanalysis data from the COVID-19 pandemic period revealed that anthropogenic aerosol emission reductions over the Indian subcontinent amplified the Indian summer monsoon intensity and triggered anomalous convective activity over the tropical Indian Ocean, which increased surface wind speeds and enhanced dust lifting over the Arabian Peninsula (Francis et al., 2022). Modeling studies have found that reductions in anthropogenic aerosol emissions along the West African coast led to a decrease in aerosol loading, triggering a northward shift of the monsoonal precipitation belt. This meridional displacement subsequently enhanced surface wind speeds over the Saharan arid zone, thereby increasing mineral dust emission fluxes through intensified wind erosion processes (Menut et al., 2019).
Under future climate change, dust distribution will vary depending on the projected scenarios. Using the Coupled Model Intercomparison Project Phase 5 (CMIP5) multi-model simulations, Singh et al. (2017) showed a 30 % increase in regional dust loading over the South Asian monsoon region by the end of the 21st century (2076–2100) relative to 1976–2000 under the RCP8.5 scenario. Zhao et al. (2023) analyzed the multi-model results under four Shared Socioeconomic Pathways (SSPs) from the Coupled Model Intercomparison Project Phase 6 (CMIP6) and found that global dust loading was expected to increase by 2.0 %–12.5 % by the end of the 21st century in most future scenarios, except for SSP3-7.0, which shows a slight decline. Liu et al. (2024) estimated a substantial increase in dust mass loading over North Africa during 2081–2100 under SSP1-2.6, SSP2-4.5, SSP3-7.0, and SSP5-8.5 scenarios from bias-corrected CMIP6 models. Woodward et al. (2005) showed through HadCM3-coupled model experiments that the annual mean global dust burden would rise by 225 %, from the 2000 baseline (4 × 10⁴ mg m−2) to 1.3 × 10⁵ mg m−2 by 2100, under a medium-emission scenario, attributed to desertification and climate change. Gomez et al. (2023) projected that rising CO2 concentrations would elevate global mean PM2.5 levels, partly driven by intensified dust aerosol emissions attributable to a strengthened West African monsoon. Akinsanola et al. (2025) found that African easterly wave activity was projected to undergo a robust intensification across the Sahel region under both SSP2-4.5 and SSP5-8.5 scenarios by the end of the 21st century, with profound implications for Saharan dust emission and transport. These studies mainly focus on investigating dust variations under different Shared Socioeconomic Pathways, thereby examining only the combined effects of anthropogenic aerosols and GHGs. However, relatively little attention has been paid to quantifying the individual contributions of anthropogenic aerosols and GHGs changes to the changing dust concentrations in the future, especially in the carbon-neutral scenario.
The future climate changes toward carbon neutrality would also affect dust aerosols, which remains largely unknown. Many countries have committed to achieve carbon neutrality by the middle of the 21st century to limit global temperature rise to below 2 °C or even 1.5 °C by the end of the 21st century. The pursuit of carbon neutrality will reshape anthropogenic emissions associated with climate and environmental policies, driving changes in atmospheric composition and radiative forcing (Wang et al., 2023; Yang et al., 2023). As nations reduce GHGs and aerosol emissions to mitigate global warming, these shifts are expected to induce complex climate influences. Studies have suggested that anthropogenic aerosol reductions could enhance surface downwelling shortwave radiation, elevate near-surface temperatures, and increase wind speed (Lei et al., 2023; Ren et al., 2024). Projections indicated that by the end of the 21st century, interannual precipitation variability will intensify by 3.9 % and 5.3 % under 1.5 and 2.0 °C warming scenarios, respectively (Chen et al., 2020). Consequently, the implementation of carbon neutrality policies is likely to modify the current climate state and affect various meteorological variables (Seager et al., 2019; Lee and Feldstein, 2013), which are expected to influence dust mobilization.
In the carbon-neutral future, reductions in GHGs and aerosols can change climate and meteorological factors, which further affect dust emissions and concentrations. However, existing studies typically focus on dust flux responses to climate change under future scenarios, thereby examining only the combined effects of anthropogenic aerosols and GHGs, which also have yet to quantify dust response to future climate change due to individual changes in anthropogenic aerosols and GHGs for pursuing carbon neutrality goals (Zhao et al., 2023; Liu et al., 2024). In this study, we conduct Earth system model experiments to assess the impact of aerosols and GHGs reductions toward carbon neutrality on meteorological variables such as precipitation, relative humidity, and wind speed, as well as their implications for dust emissions and concentrations. Although dust is from both natural and anthropogenic sources. This study only focuses on dust from natural sources without considering anthropogenic dust. Given that the combined contribution of dust sources from the North Africa and Asia exceeds 80 % of global dust emissions, this study strategically focuses on the dust belt regions, including the Sahara Desert, Central Asia Desert, Arabian Desert, Taklamakan Desert, and Gobi Desert. The findings of this study aim to provide valuable insights to guide the establishment of dust prevention measures and strategies in global pursuit of carbon neutrality. The paper is structured as follows. The method and data are presented in Sect. 2. The results of dust changes related to the reductions in GHGs and aerosols are shown in Sect. 3. The discussion and the conclusions are given in Sect. 4.
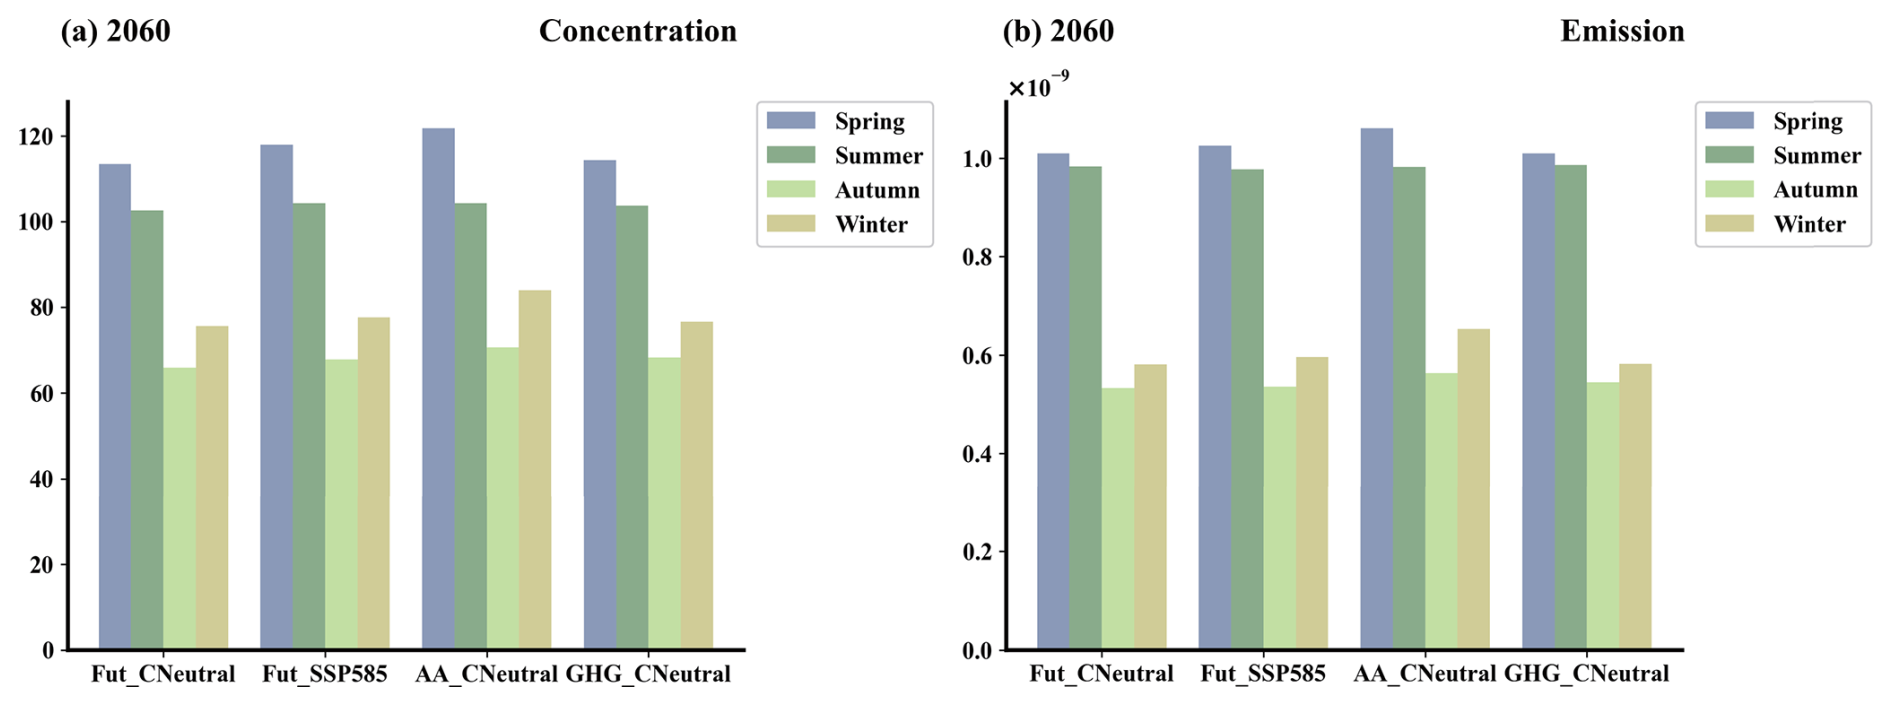
Figure 1Seasonal mean (a) dust near-surface concentration (µg m−3) and (b) dust emission (kg m−2 s−1) during boreal spring (March–April–May), summer (June–July–August), Autumn (September–October–November) and winter (December–January–February) of 2060 over the dust belt (0–60° N, 25° W–130° E) simulated from the Fut_CNeutral, Fut_SSP585, AA_CNeutral and GHG_CNeutral simulations.
2.1 Model Description
The fully coupled Community Earth System Model version 1.2.2 (CESM1) (Hurrell et al., 2013) is used to investigate the effects of meteorological changes induced by anthropogenic aerosols and GHGs under carbon neutrality on dust emissions and concentrations. The atmospheric component utilizes the Community Atmosphere Model version 5 (CAM5), which simulates the major aerosol species, including sulfate, black carbon, primary organic aerosol, secondary organic aerosol, mineral dust and sea salt. These aerosols are distributed in the four lognormal size distribution modes (i.e., Aitken, accumulation, coarse, and primary carbon modes) (Liu et al., 2016). Simulations are conducted at 1.9° × 2.5° horizontal resolution with 30 vertical layers. Aerosol particles within the same mode are mixed internally, whereas external mixing assumption is treated for particles between different modes. The dust emission flux is calculated using the Dust Entrainment and Deposition model developed by Zender et al. (2003), which is implemented in the Community Land Model version 4 (CLM4; Oleson et al., 2010). Dust particles are divided into four bins (0.1–1.0, 1.0–2.5, 2.5–5.0, and 5.0–10.0 µm) in CLM4, and subsequently redistributed to four modes of the Modal Aerosol Module scheme. The emission or mobilization process is governed by the synergistic effects of multiple controlling parameters, including wind friction speed, vegetation cover, and surface soil moisture content. Aerosol direct and indirect radiative effects are incorporated in CAM5 (Ma et al., 2022). Furthermore, optimized parameterization schemes for key aerosol processes in CAM5, such as convective transport and wet deposition, have been implemented to enhance model performance (Wang et al., 2013). The dynamic oceanic component in CESM1 uses the Parallel Ocean Program version 2 (POP2). In this study, emissions of aerosols and precursors and GHGs concentrations are obtained from the CMIP6 input data, specifically adopting the SSP1-1.9 and SSP5-8.5 (shared socioeconomic pathways). Future emission inventories build on the Shared Socioeconomic Pathways, providing standardized multidimensional parameters (e.g., population, economy, technology, environment, institutions) and qualitative narratives at national/regional scales (van Vuuren et al., 2017; Kriegler et al., 2017; Fujimori et al., 2017; Calvin et al., 2017; Fricko et al., 2017).
2.2 Experimental Design
To quantify the impacts of anthropogenic aerosols and GHGs on future dust toward carbon neutrality, four sets of CESM1 equilibrium simulations are designed, comprising one baseline (Fut_SSP585) and three sensitivity experiments (Fut_CNeutral, AA_CNeutral and GHG_ CNeutral). The SSP1-1.9 represents a sustainable development scenario focused on ecological restoration, conservation, and a significant reduction in fossil fuel dependence. This pathway is considered the most likely to achieve the 1.5 °C target under the Paris Agreement and carbon neutrality in the mid-21st century (Su et al., 2021; Wang et al., 2023; Zhu et al., 2024). In contrast, the SSP5-8.5 follows a high fossil fuel consumption with substantial associated emissions (Meinshausen et al., 2020). Many countries had committed to achieving carbon neutrality by 2050 or 2060, with most targets set for the post-2050 period (Chen et al., 2022). Focusing on the year 2060 therefore ensures direct alignment with policy timelines and enhances the practical relevance of our results.
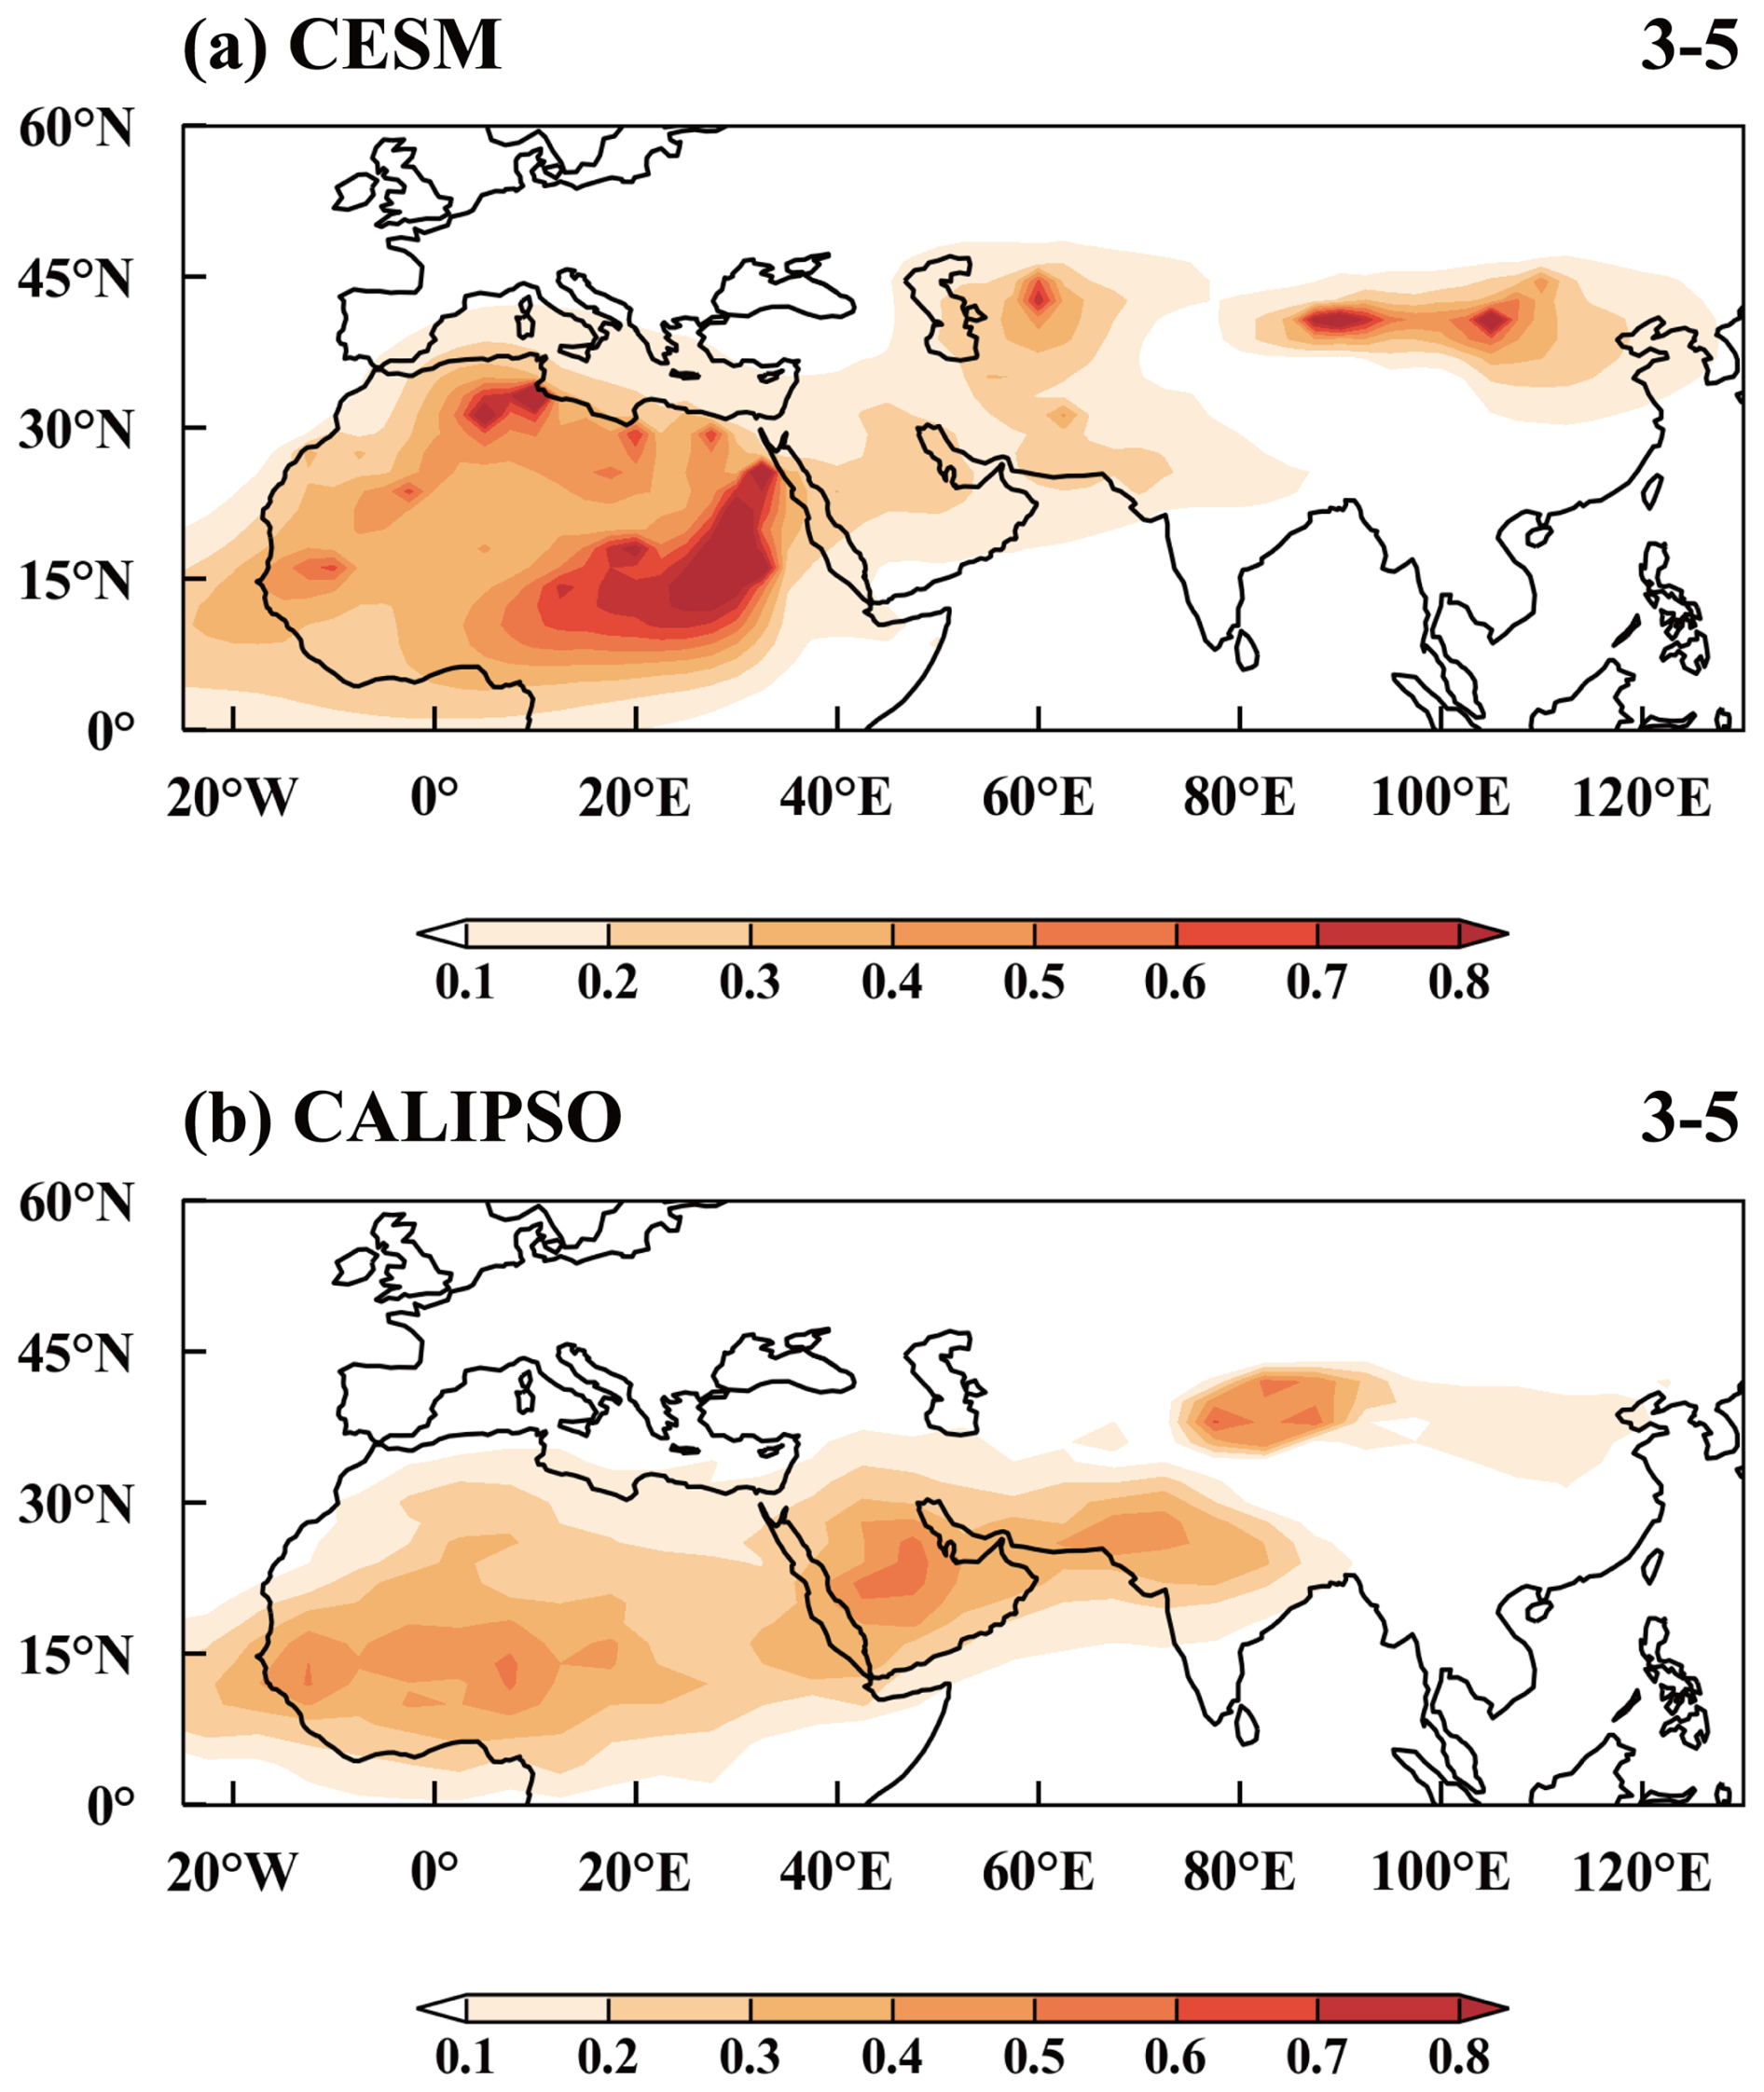
Figure 2Spatial distribution of the average dust optical depth (DOD) from March to May 2020 from (a) the CESM model simulation (Fut_2020) and (b) the CALIPSO satellite observations averaged over 2017–2021.
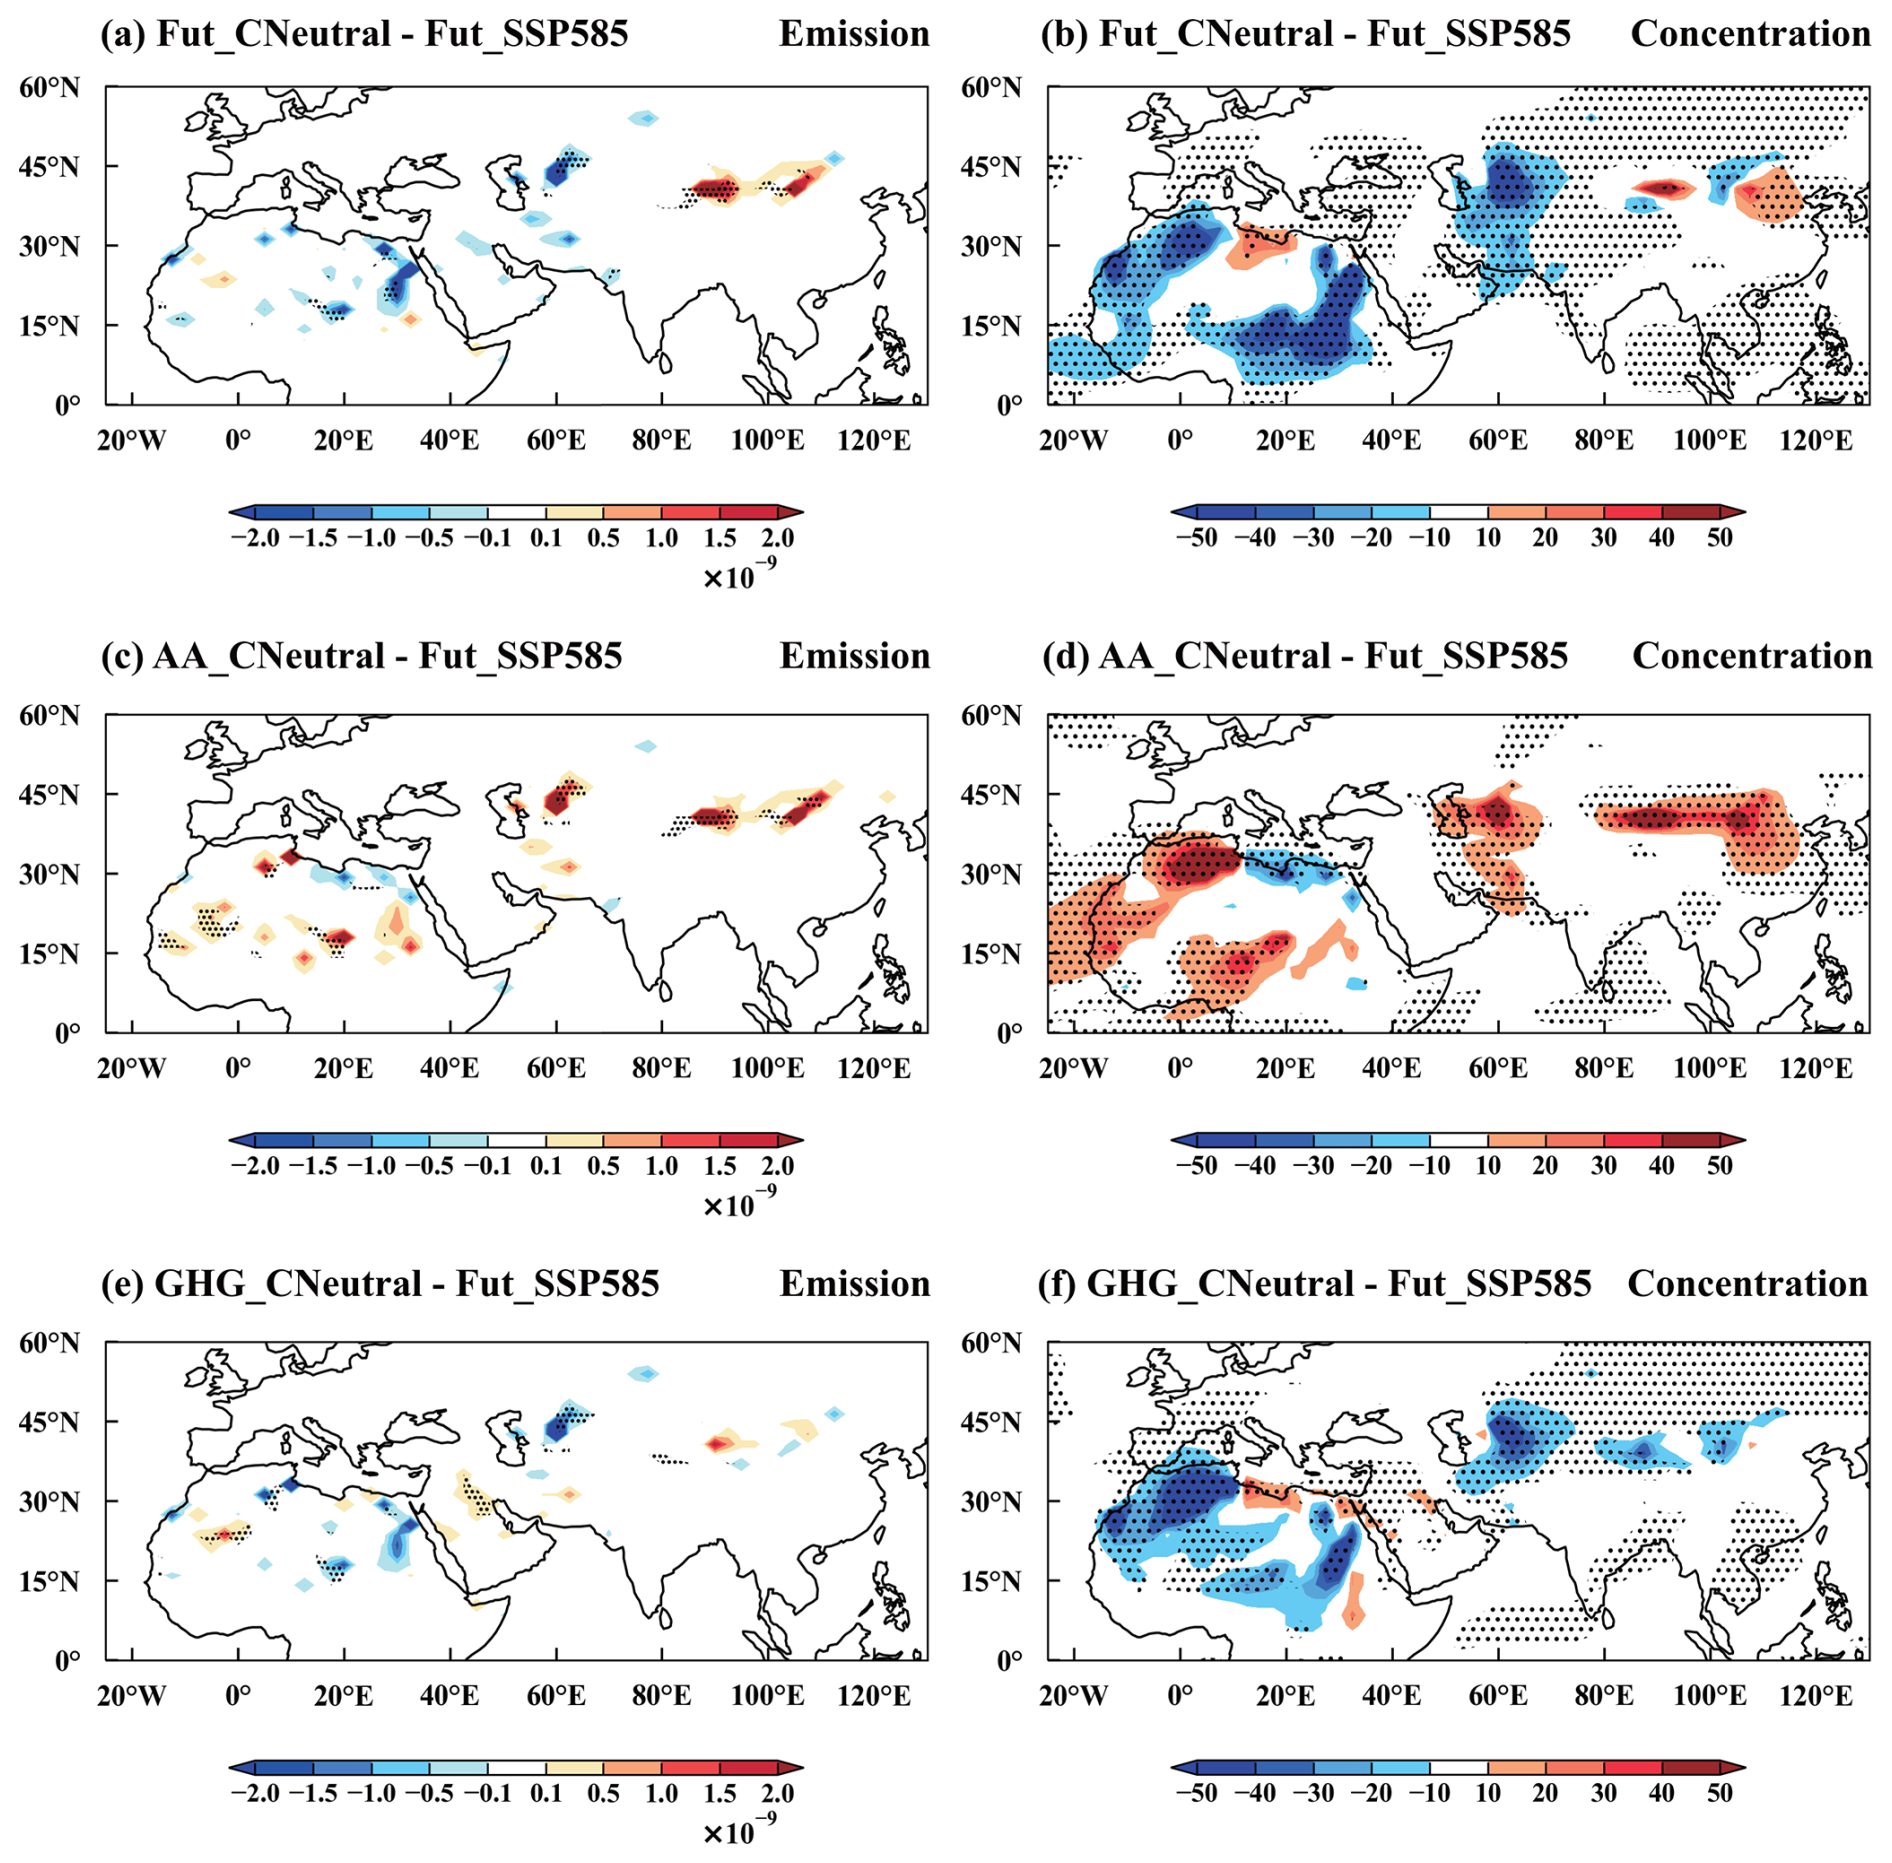
Figure 3Spatial distribution of changes in March–May mean (a, c, e) dust emissions (kg m−2 s−1) and (b, d, f) near-surface dust concentrations (µg m−3) in 2060 for Fut_CNeutral (a, b), AA_CNeutral (c, d), and GHG_CNeutral (e, f) compared to the Fut_SSP585 simulation. The stippled areas indicate statistically significant differences at the 90 % confidence level based on a two-tailed Student's t test.
The Fut_SSP585 simulation prescribes global GHGs concentrations and anthropogenic emissions of aerosols and precursors from the CMIP6 input data, with all forcings held at 2060 levels under the SSP5-8.5 scenario. In Fut_CNeutral experiment, GHGs concentrations, aerosols, and their precursor emissions are adopted following SSP1-1.9 emission pathway in 2060, enabling isolation of combined effects of aerosols and GHGs through comparison with the baseline. The AA_CNeutral experiment applies anthropogenic emissions of aerosols and precursors from SSP1-1.9 while retaining GHGs concentrations under SSP5-8.5, allowing aerosol effect quantification by comparing with the baseline. Conversely, we also perform the GHG_CNeutral simulations in which GHGs concentrations are set to the 2060 levels under SSP1-1.9, along with aerosol emissions using SSP5-8.5 input data, which allows comparison with the baseline to estimate the climate impacts of GHGs. One additional experiment, Fut_2020, is also performed for the model evaluation, with GHGs concentrations and aerosol emissions set to the 2020 levels under SSP1-1.9. All simulations are initialized with the same conditions and only the GHGs concentrations and/or aerosol emissions change in time and space every month. All experiments are conducted with three ensemble members of different initial conditions, achieved by applying a small initial perturbation to atmospheric temperature. Each ensemble member is run for 100 years, with the initial 40 years considered as model spin-up period, retaining the latter 60 years for analysis.
2.3 Model Evaluation
Numerous studies documented the hemispheric asymmetry of global dust sources, with most emissions originated from northern hemisphere arid zones, notably North Africa, Central Asia, East Asia, and the Middle East (Shao et al., 2011; Ginoux et al., 2012; Yang et al., 2022). Consistent with prior studies that highlight peak dust activities during boreal spring and summer in these regions (Ginoux et al., 2012; Nabavi et al., 2016; Jethva et al., 2005, Choobari et al., 2014), our seasonal analysis for simulations in 2060 also reveals substantially elevated dust emissions and concentrations in warm seasons, especially spring, compared to autumn and winter (Fig. 1). In this study, we mainly focus on spring dust activities. To evaluate model's dust simulation performance, dust optical depth from model results in boreal spring of 2020 is compared with CALIPSO satellite retrievals averaged over 2017–2021. The model reasonably reproduces the overall spatial distribution of dust optical depth (Fig. 2), but overestimates dust loading over parts of Central Asia, Eastern Africa and the Gobi Desert. Similar discrepancies have been noted in existing studies, indicating that the deviations between the model and observations are primarily attributable to the topographic source function and the dust emission scheme used in the model (Wu et al., 2020), which could potentially lead to bias in the quantitative analysis of the results.
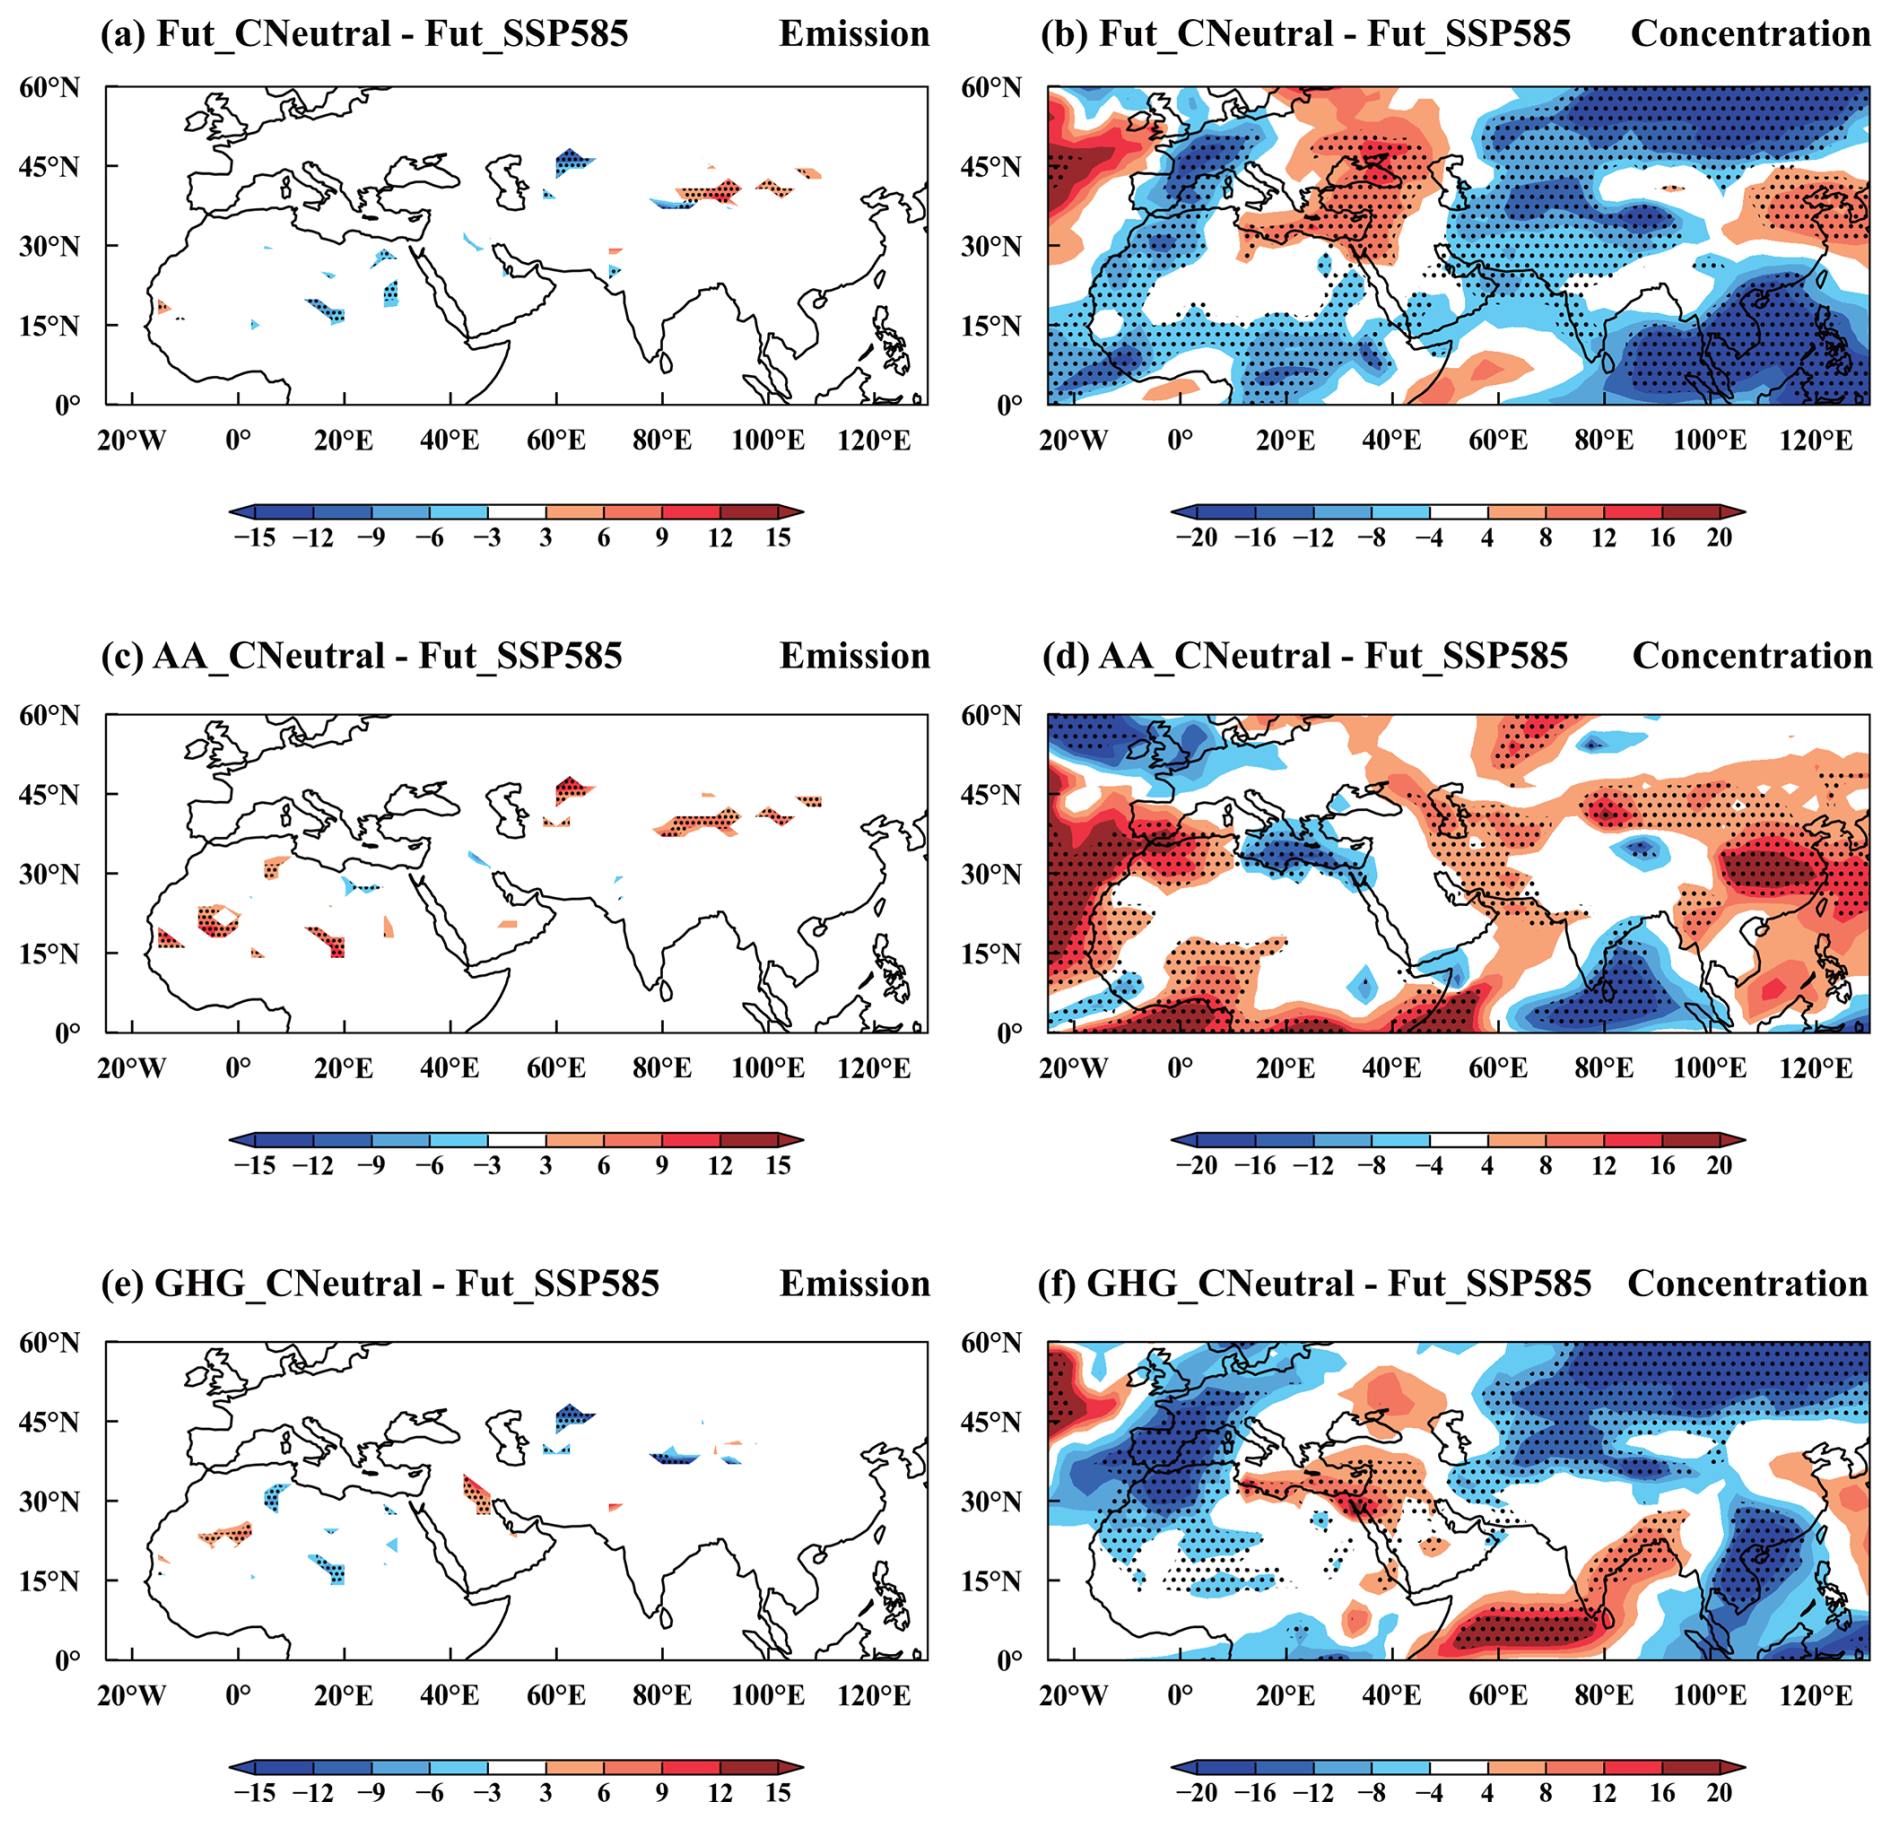
Figure 4Spatial distribution of percentage changes in March–May mean (a, c, e) dust emissions (%) and (b, d, f) near-surface dust concentrations (%) in 2060 for Fut_CNeutral (a, b), AA_CNeutral (c, d), and GHG_CNeutral (e, f) compared to the Fut_SSP585 simulation. The stippled areas indicate statistically significant differences at the 90 % confidence level based on a two-tailed Student's t-test.
3.1 Changing dust aerosol toward carbon neutrality
Figure 3a and b present the spatial patterns of changes in emission fluxes and near-surface concentrations of dust aerosols between carbon neutrality (SSP1-1.9) and high fossil fuel (SSP5-8.5) scenarios driven by both fixed anthropogenic aerosols and GHGs in 2060. Under the strong decline in anthropogenic emissions toward carbon neutrality, marked reductions in dust emissions (3 %–12 %) and concentrations (4 %–16 %) are observed across primary source regions (Fig. 4a–b), particularly the North African dust belt and Central Asian arid corridor, whereas increases in dust emission (3 %–12 %) and concentrations (4 %–8 %) are found over East Asian dust source regions. Dust concentrations in most regions exhibit reductions, exceeding 40 µg m−3 over North Africa and Central Asia, while northwestern China and the North China Plain show a weak increase in dust concentrations.
The simulated future changes in dust concentrations are the combined effects of the reduction of anthropogenic aerosols and GHGs. Here we also investigate their respective impacts on future dust changes through sensitivity experiments. Figure 3c–d illustrate the responses of emission fluxes and near-surface concentrations of dust to anthropogenic aerosol reductions in SSP1-1.9 relative to SSP5-8.5, while 3e-f demonstrate the responses to GHGs reduction alone. The future reductions in anthropogenic aerosols would lead to significant increases in dust emissions (6 %–12 %) and concentrations (4 %–20 %) across the dust belt (Fig. 4c–d). However, GHGs reduction induces decreases in dust loads mainly over North Africa and Central Asia. These contrasting patterns indicate opposite dust responses to future reductions in anthropogenic aerosols and GHGs. The following sections illustrate possible mechanisms derived from the analysis of key meteorological drivers and their association with emission reduction strategies.
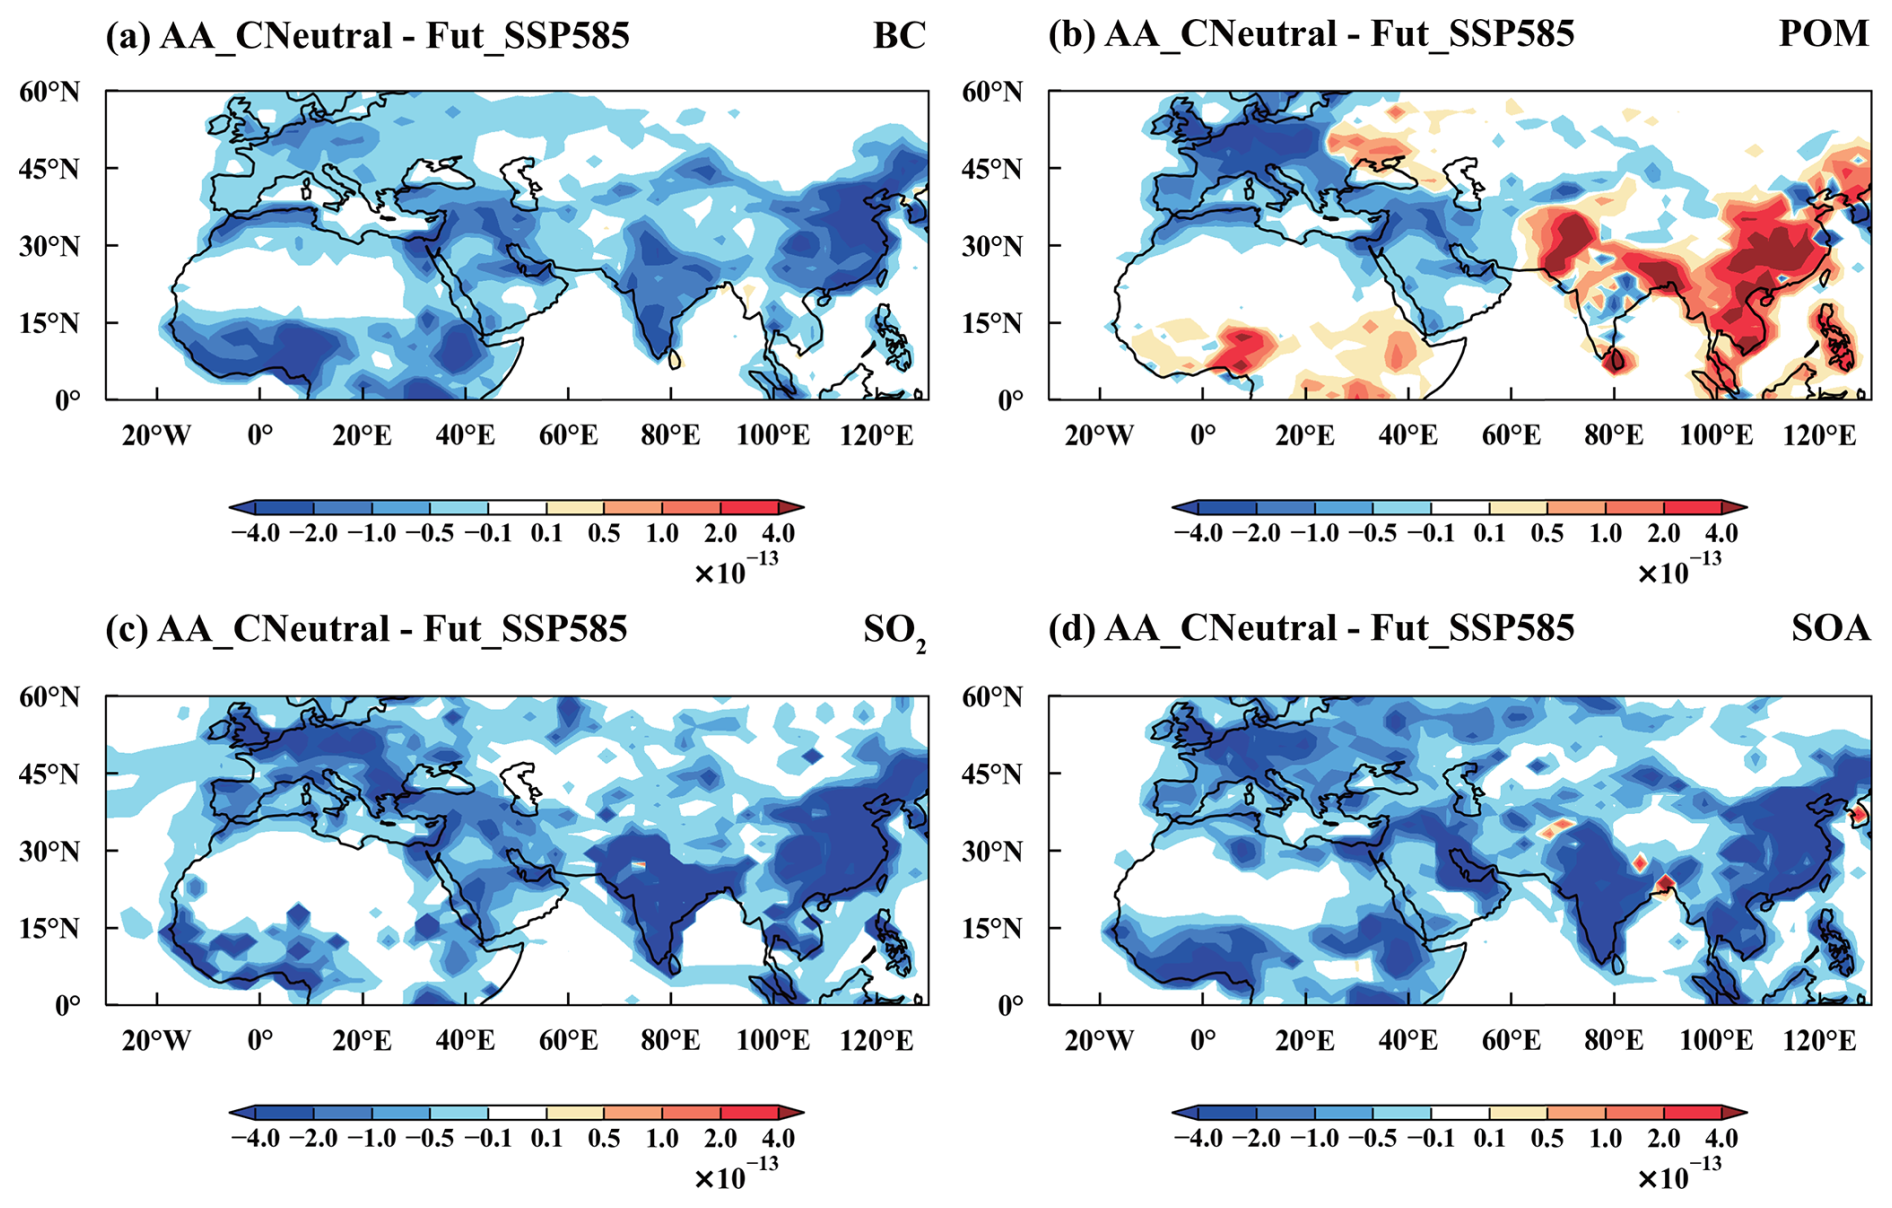
Figure 5Spatial distribution of changes in March–May mean (a) black carbon (BC, kg m−2 s−1), (b) particulate organic matter (POM, kg m−2 s−1), (c) sulfur dioxide (SO2, kg m−2 s−1), and (d) precursor gas of secondary organic aerosol (SOAG, Tg m−2 yr−1) in 2060 for AA_CNeural, compared to the Fut_SSP585 simulation.
3.2 Dust increases due to anthropogenic aerosols reductions
Pursuing the carbon neutrality leads to substantial reductions in anthropogenic emissions of aerosols and precursors. As shown in Fig. 5, CMIP6 experiments show decreases exceeding 8 × 10⁻¹³ kg m−2 s−1 in anthropogenic emissions of aerosols and precursors, including black carbon, sulfur dioxide and precursor gases of secondary organic aerosols, over polluted eastern China, South Asia, and parts of Europe and North Africa in 2060 under SSP1-1.9 scenario compared to SSP5-8.5, while primary organic matter emissions slightly increase by 4–8 × 10⁻¹³ kg m−2 s−1. Although anthropogenic aerosol emission changes are primarily concentrated in Asia, reductions in aerosol optical depth (AOD) of approximately 0.01–0.05 are also evident over remote regions including Northern Africa (Fig. 6a), mainly due to the decreases in sulfate aerosol (Fig. 6b and c). Along with the aerosol reduction, the surface downwelling shortwave radiation increases by 4–12 W m−2 (Fig. 7a), which further increases the land surface temperatures by more than 0.6 °C over eastern China, Southeast Asia and North Africa and 0.9 °C over South Asia (Fig. 7b). Enhanced convective instability due to the warmer surface condition elevates planetary boundary layer (PBL) heights over most land regions (Fig. 7c). Furthermore, diminished atmospheric heating from light-absorbing aerosols (e.g., black carbon) in the air reduces lower tropospheric stability, intensifying convective conditions and resulting in an increase in the PBL height. The associated strengthening of vertical exchange processes enhances near-surface wind speeds by 0.05–0.1 m s−1 through downward momentum transfer (Fig. 8a) (Qin et al., 2024). Note that, the spatial patterns of changes in PBL height show a mismatch with dust emission changes in some regions, which arises from the imperfect correspondence between boundary layer height and surface wind speed and has been reported in many studies (e.g., Jacobson and Kaufman, 2006; Qin et al., 2024). The wind speed responses to aerosol changes reported in these studies agrees with our findings, and the mechanistic interpretation that aerosol reduction increases wind speed is also consistent with their established physical understanding. Related to the surface warming driven by anthropogenic aerosol reductions, relative humidity and soil water content decrease (Fig. 8b–c). These changes in meteorological and land surface conditions explain the simulated increases (exceeding 2 × 10⁻⁹ kg m−2 s−1) in dust emissions across the dust belt due to the anthropogenic aerosol reductions toward carbon neutrality (Fig. 3c). This result is consistent with previous studies (Menut et al., 2019; Xie et al., 2025).
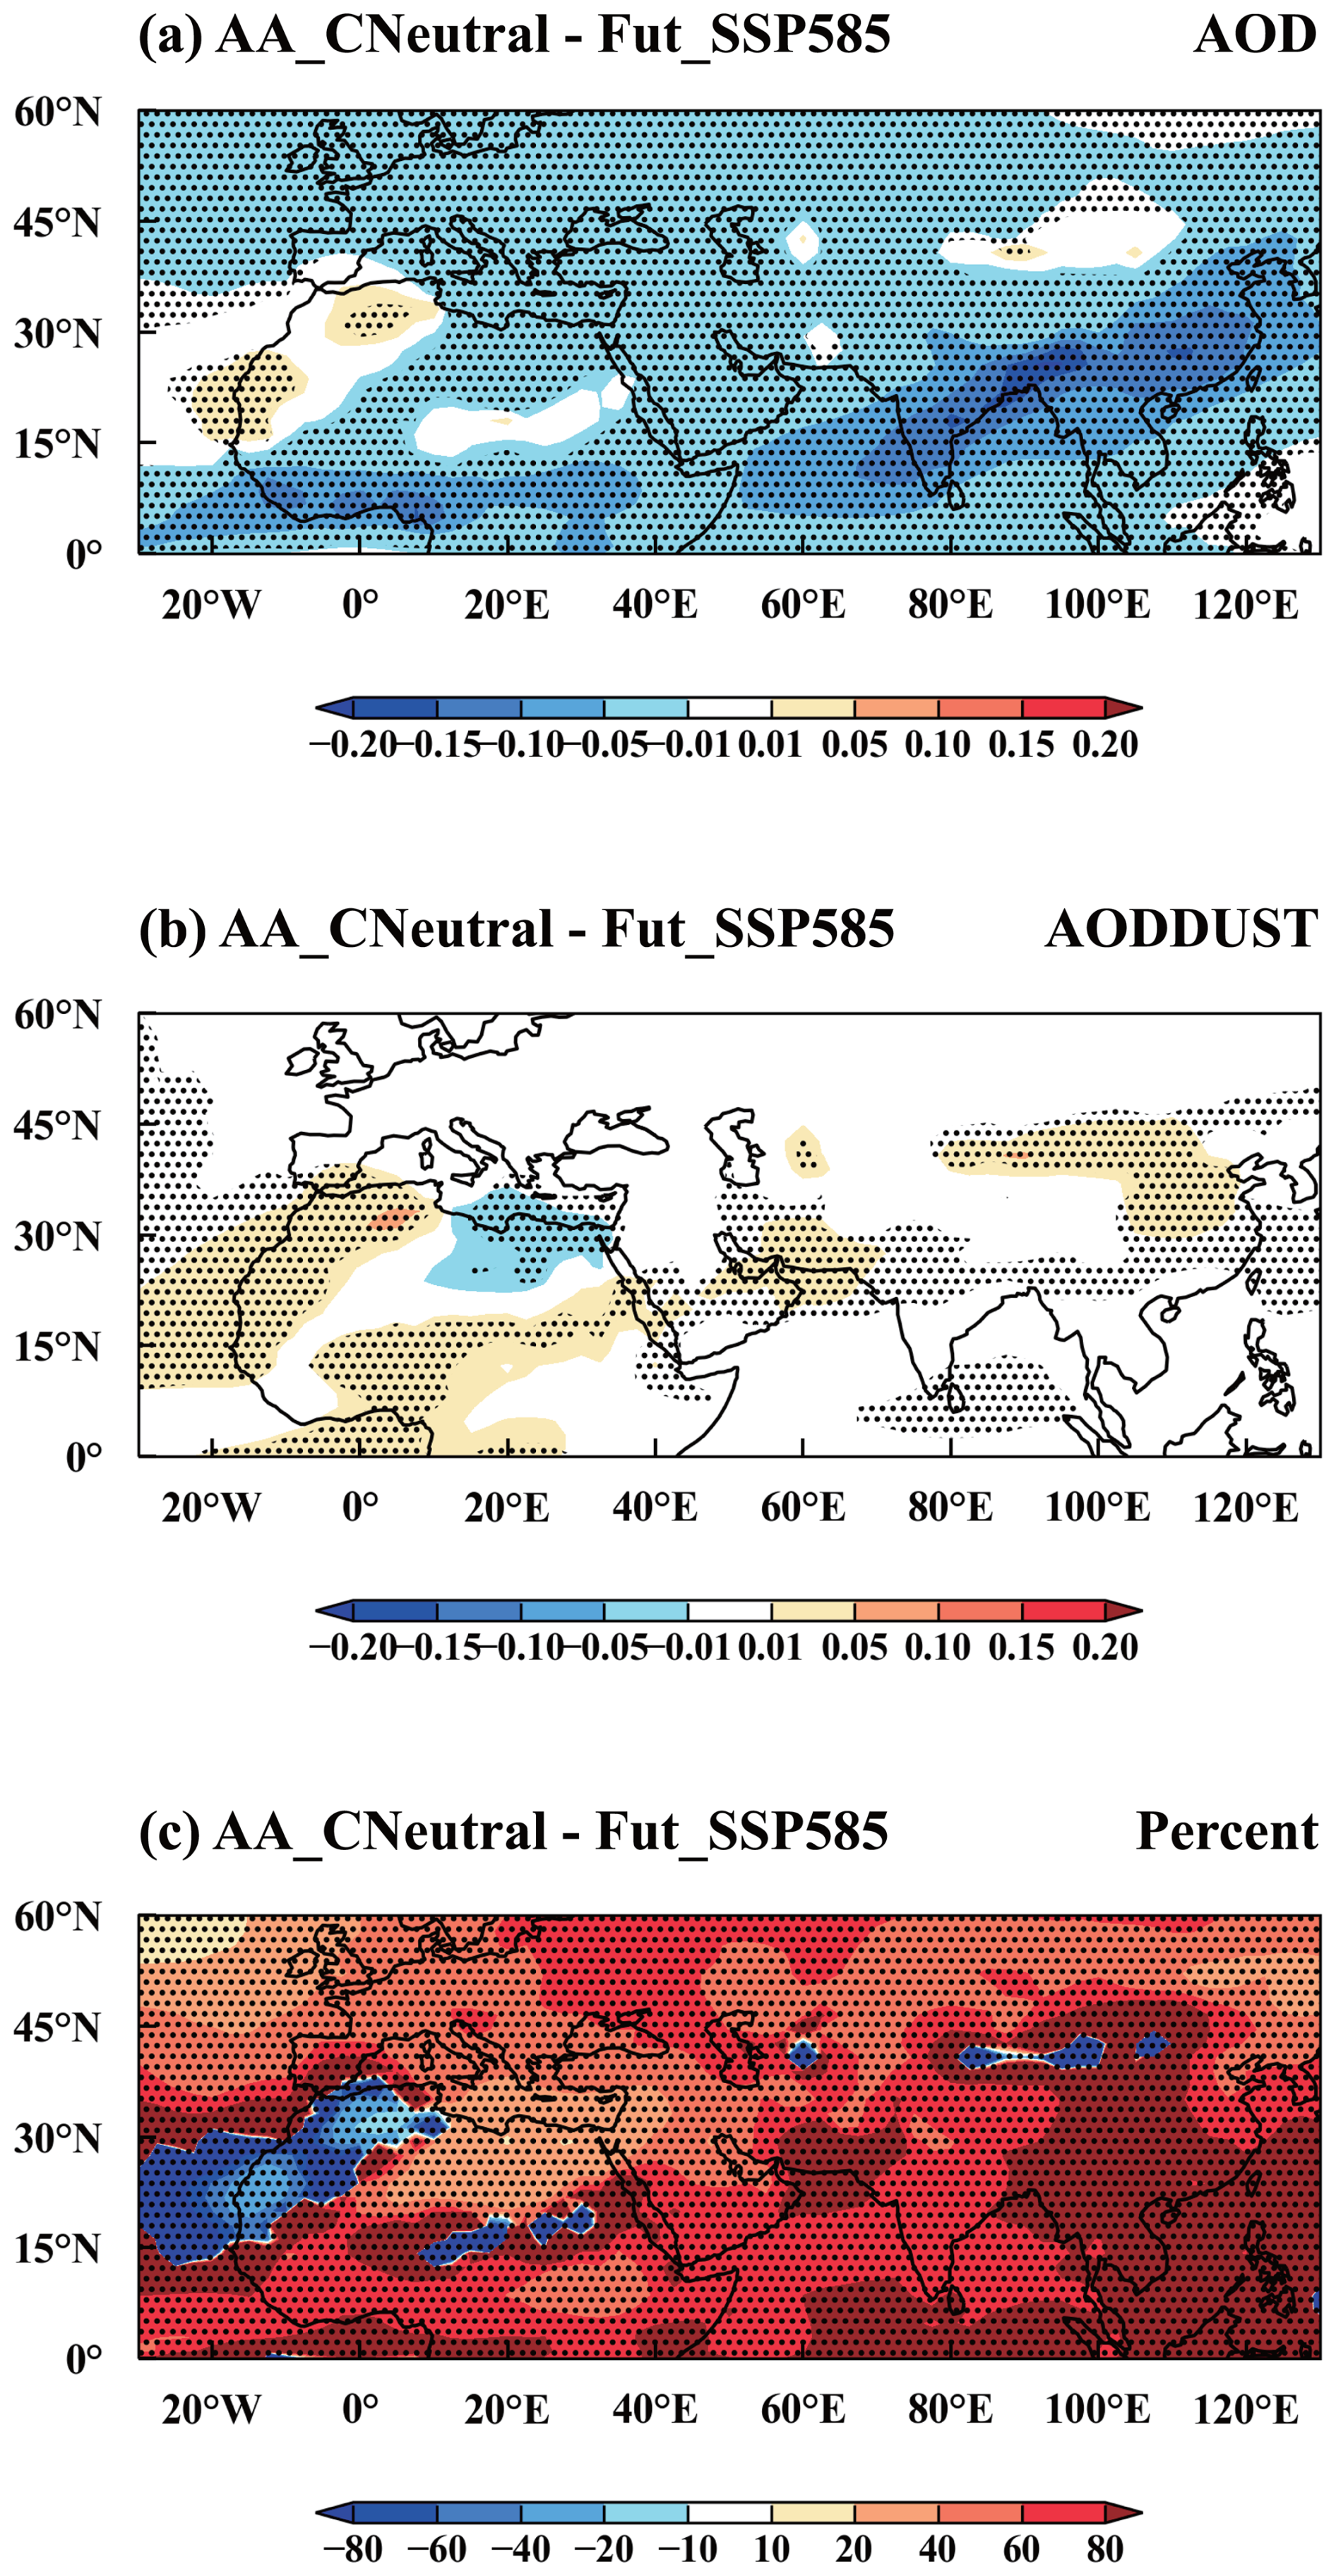
Figure 6Spatial distribution of changes in March–May mean (a) aerosol optical depth (AOD), (b) aerosol optical depth from dust (AODDUST), and (c) the fraction of sulfate AOD change in total AOD change (%) in 2060 for AA_CNeural, compared to the Fut_SSP585 simulation.
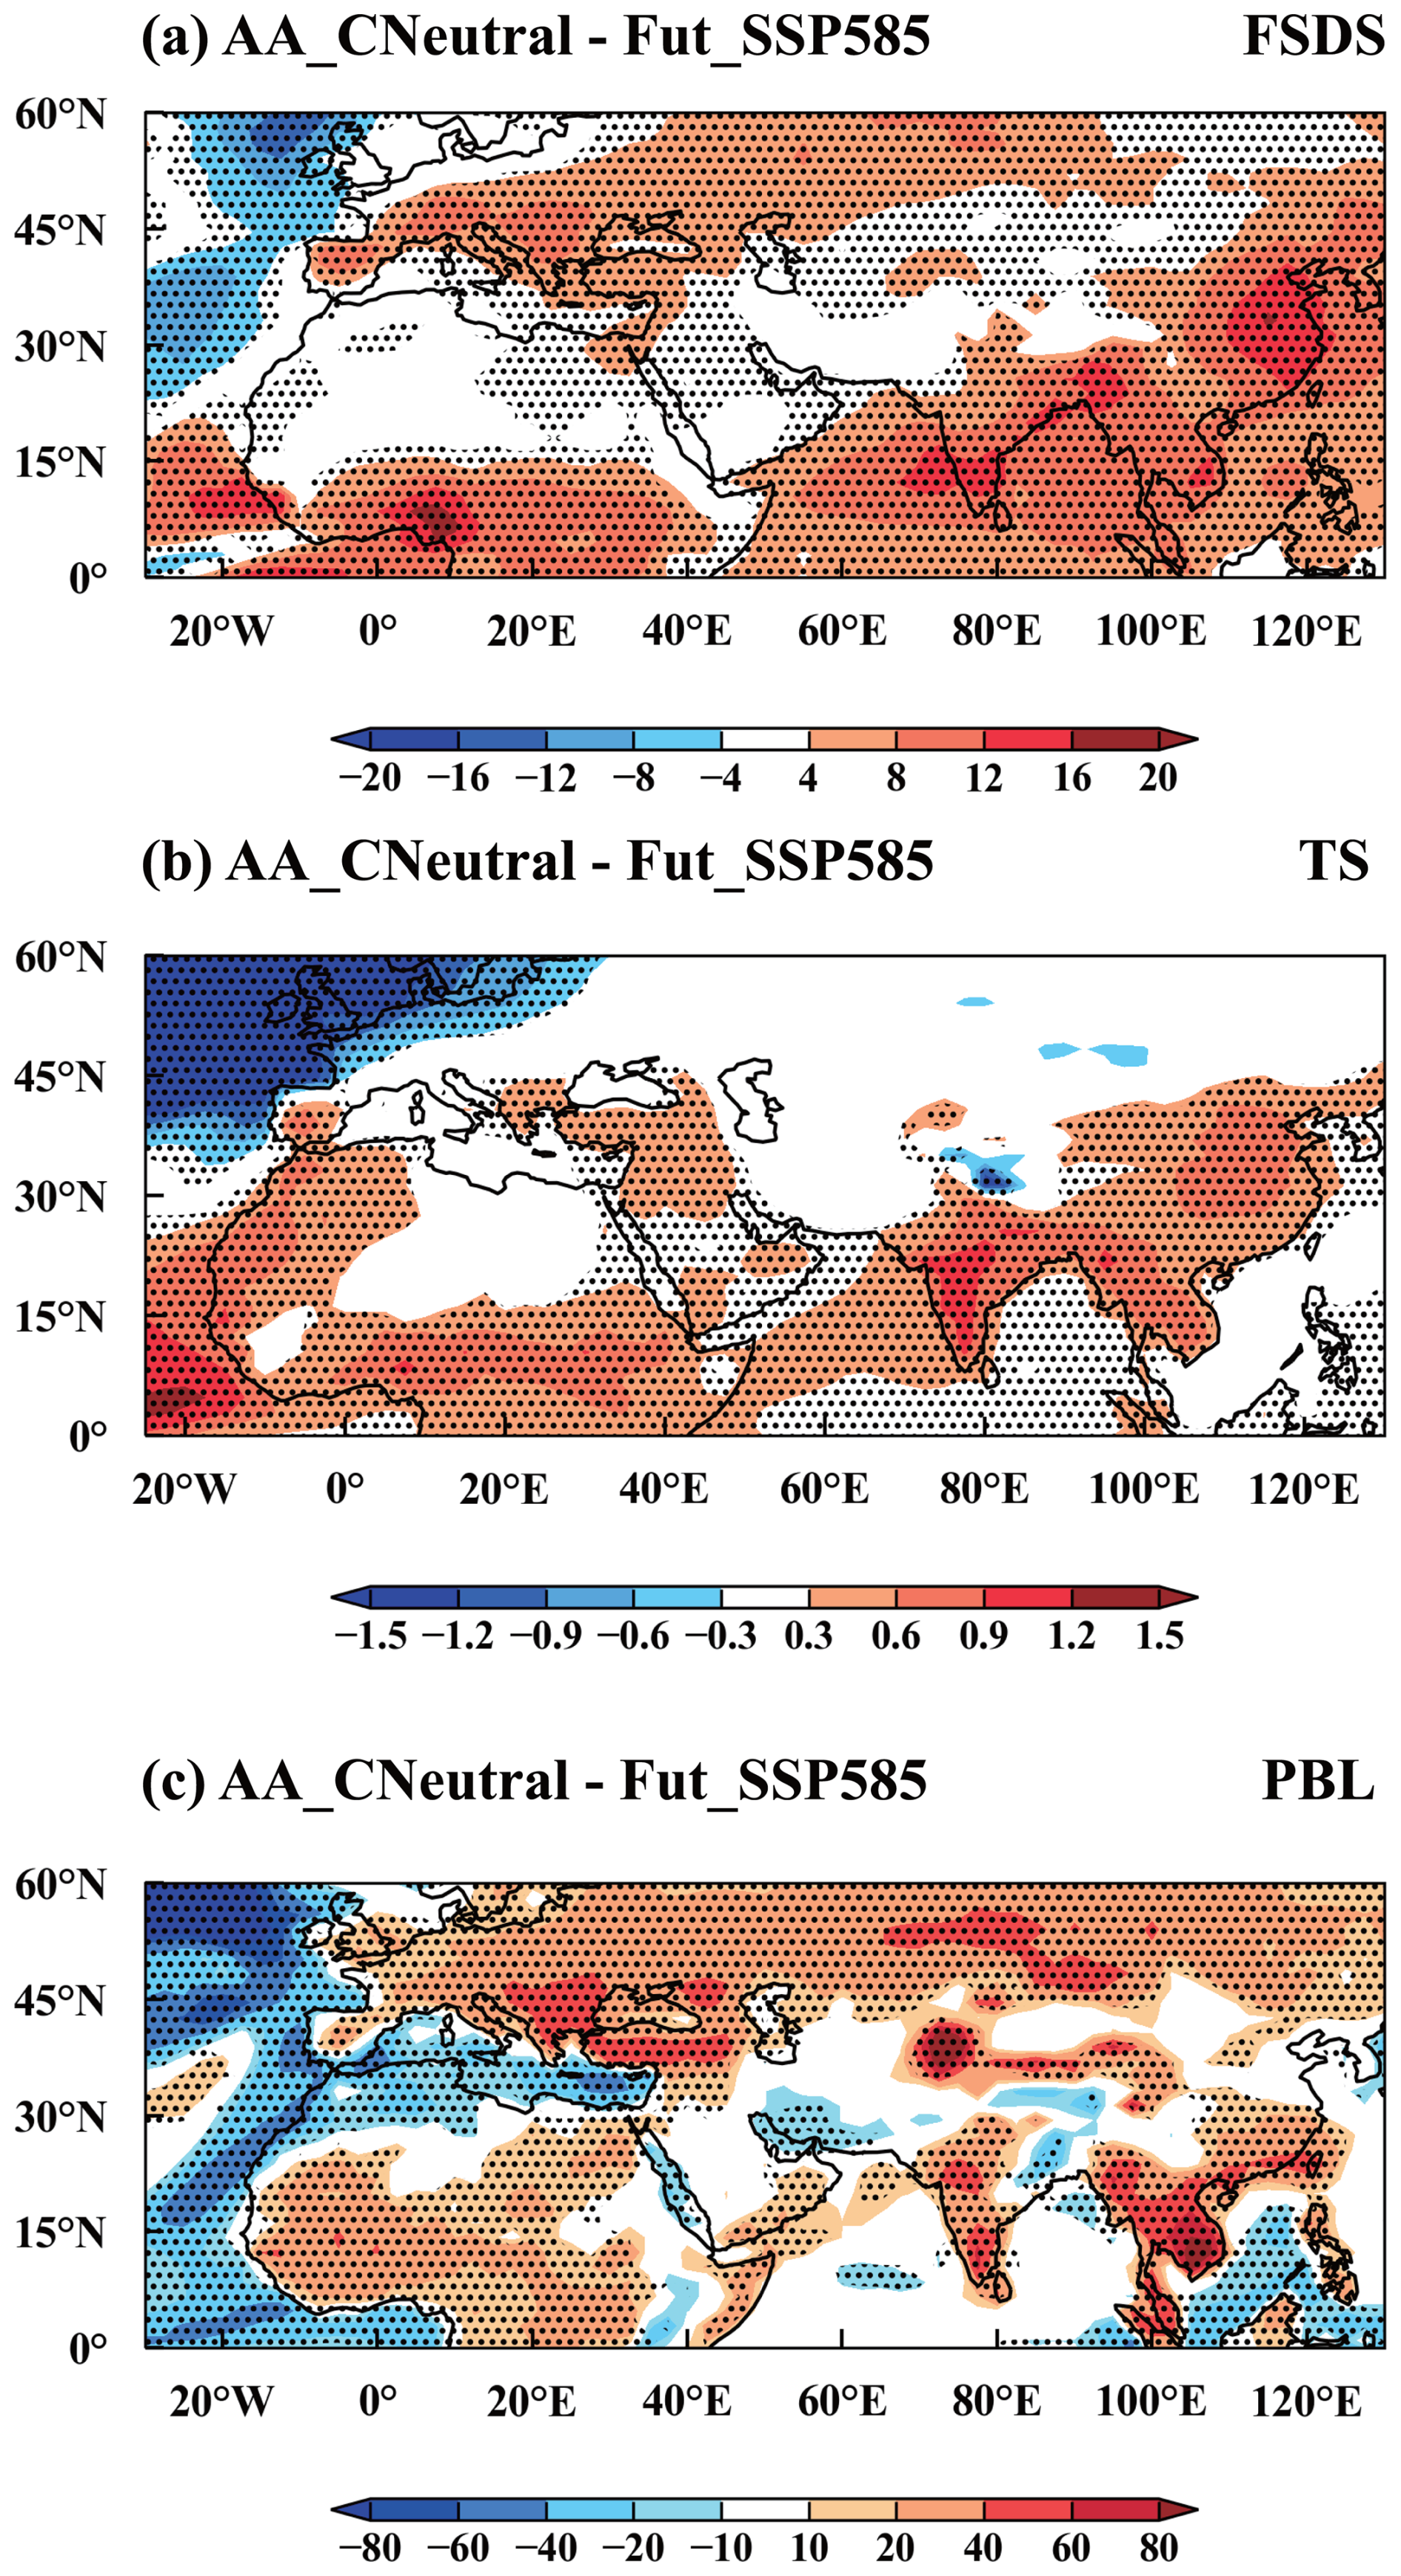
Figure 7Spatial distribution of changes in March–May mean (a) downwelling solar flux at the surface (FSDS, W m−2), (b) surface temperature (TS, K), and (c) planetary boundary layer height (PBL, m), in 2060 for AA_CNeural, compared to the Fut_SSP585 simulation. The stippled areas indicate statistically significant differences at the 90 % confidence level based on a two-tailed Student's t test.
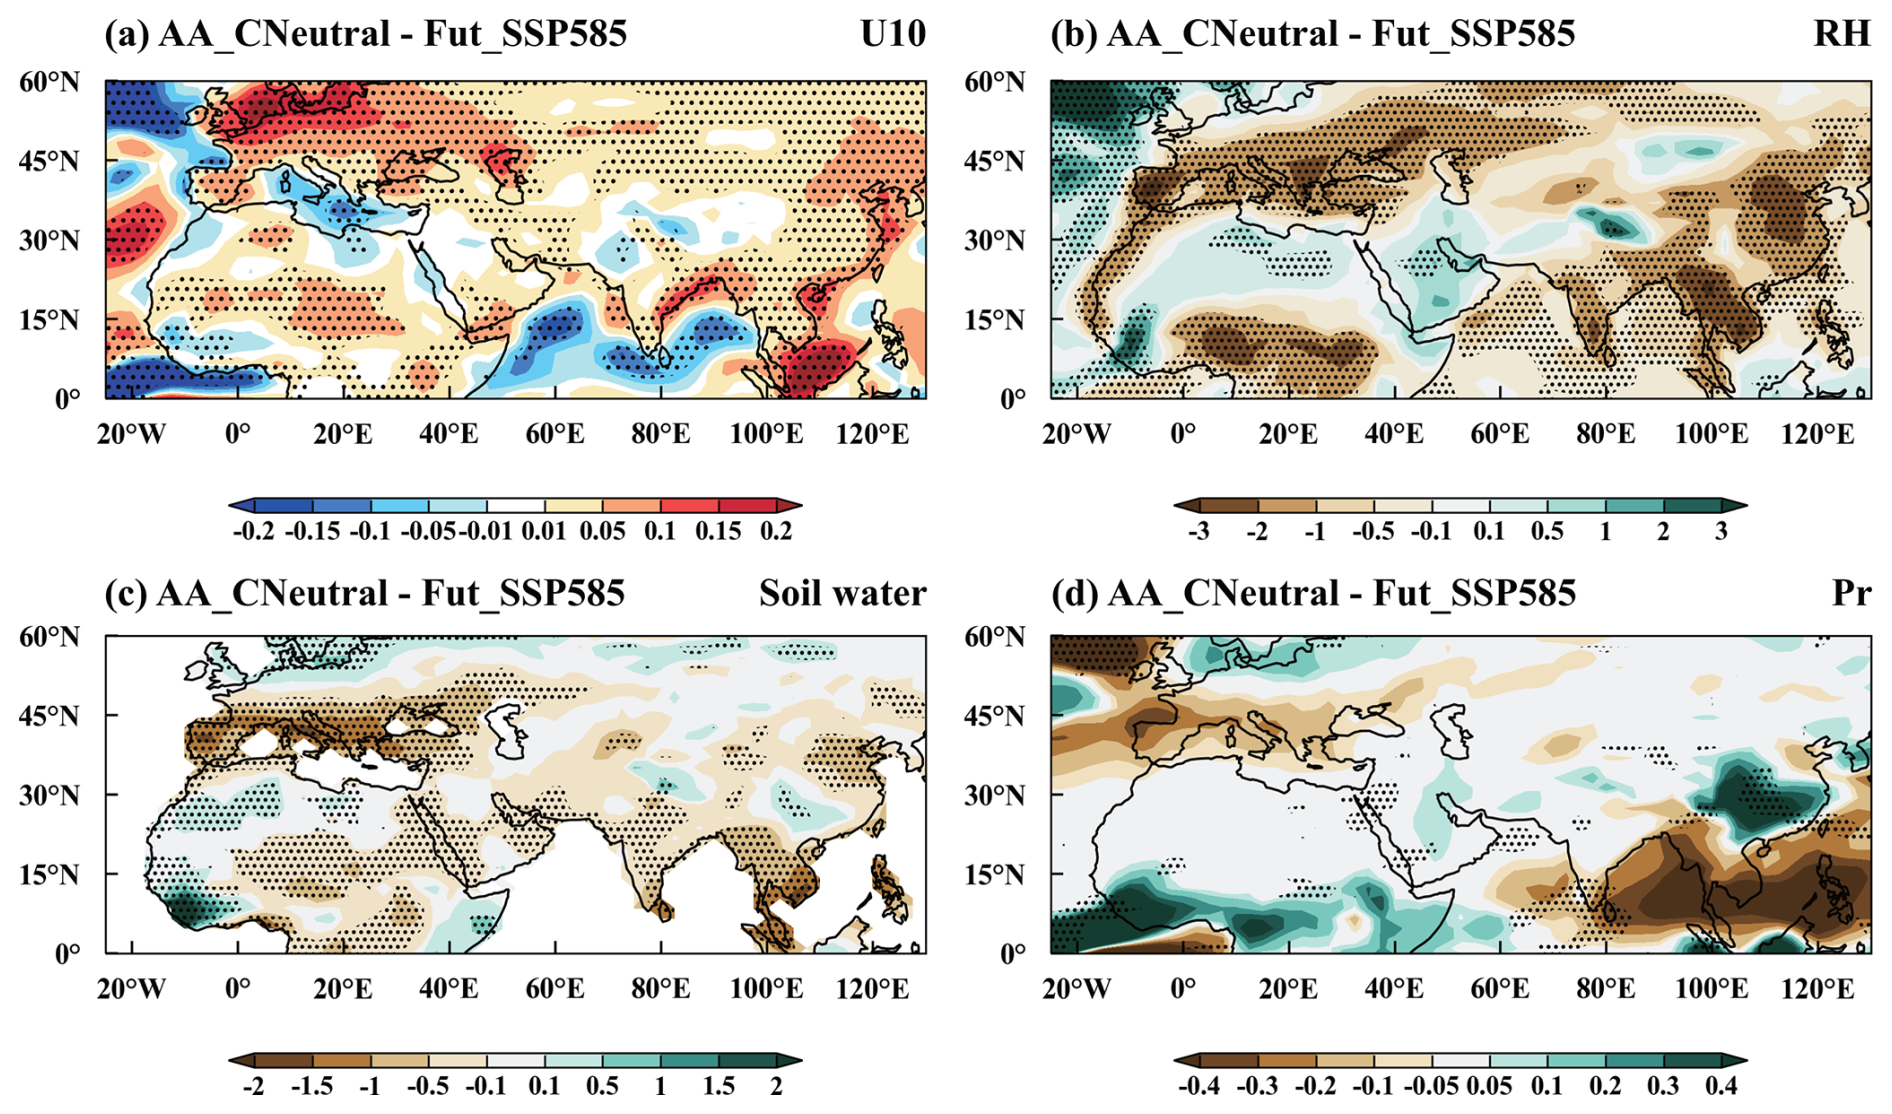
Figure 8Spatial distribution of changes in March–May mean (a) 10 m wind speed (U10, m s−1), (b) relative humidity (RH, %), (c) soil water content (soil water, kg m−2), and (d) precipitation rate (pr, mm d−1) in 2060 for AA_CNeural, compared to the Fut_SSP585 simulation. The stippled areas indicate statistically significant differences at the 90 % confidence level based on a two-tailed Student's t test.
Previous studies have established a robust positive correlation between near-surface wind speed and dust emission fluxes, particularly in arid dust source regions characterized by chronically low soil moisture and minimal precipitation inputs (Zender et al., 2003; Dong et al., 2006). Our analysis reveals that anthropogenic aerosol reductions in SSP1-1.9 relative to SSP5-8.5 amplify 10 m wind speed by 0.05–0.10 m s−1 across core dust sources (Fig. 8a), driving intensified dust emission fluxes (6–12 %) and near-surface concentrations (8 %–16 %) in North and Central Africa (Figs. 3c–d and 4c–d). The dust-wind speed relationship is modulated by emission thresholds. In arid areas, the threshold of wind speed for dust mobilization increases with rising relative humidity (Ravi and D'Odorico, 2005). This is primarily due to the enhanced adsorption layer interactions created by overlapping water films on adjacent soil particles (Ravi and D'Odorico, 2005). Consequently, after the reduction of anthropogenic aerosols, reduced relative humidity by −1 % to −3 % (Fig. 8b) lowers the critical threshold of wind speed, particularly in Central Africa and East Asia. Additionally, in the major dust source regions, precipitation changes are minimal and statistically insignificant (Fig. 8d), which do not have a large influence on dust concentrations after emitting into the atmosphere.
3.3 Dust decreases due to greenhouse gas reductions
Figure 9a illustrates the surface temperature distribution in 2060 under SSP5-8.5, highlighting persistent land-ocean thermal contrast with continental temperatures around dust source regions much higher than oceanic values. Due to GHGs reductions in SSP1-1.9 relative to SSP5-8.5, surface temperatures decrease by 1.8–3.0 °C over land and 1.2–1.8 °C over adjacent oceans (Fig. 9b), where the overall land-sea contrast is largely due to the higher heat capacity of water than land surface. Figure 9c and d respectively depict the zonal and meridional distributions of surface temperatures over the Sahara Desert of North Africa. Notably, the surface cooling due to GHGs reductions is stronger over the Sahara Desert (10–30° N, 10° W–30° E) than that over the Mediterranean Sea (north of 30° N) and North Atlantic Ocean (west of 10° W). It diminishes the land-sea temperature gradient, thereby contributing to the decline in wind speed over North Africa (Fig. 10a). Central Asia Desert also demonstrates a stronger temperature reduction than the surrounding Caspian Sea (Fig. 9e) and high latitude regions, weakening the land-sea thermal gradient and thereby driving the decrease in surface wind speed throughout Central Asia (Fig. 10a). By reducing the land-ocean thermal contrast, GHG mitigation lowers surface wind speeds over major dust source regions, leading to a consequent decline in dust emissions (exceeding 2 × 10⁻⁹ kg m−2 s−1) (Fig. 3e), which is consistent with previous study. Qu et al. (2025) studied prolonged wind droughts in a warming climate. Under the SSP5-8.5 scenario, they found that wind droughts decreased in the tropics, primarily due to increased wind speeds. Reversely, in the tropics, global warming amplifies the land-ocean thermal contrast, thereby strengthening winds. Thus, the mechanism of wind speed reduction is consistent with established understanding. As a result of the GHGs reduction implementation, the marked temperature reduction suppresses surface evaporation and alters atmospheric saturation vapor pressure, thereby increasing relative humidity by 1 %–3 % across Northern Hemisphere dust source areas (Fig. 10b).
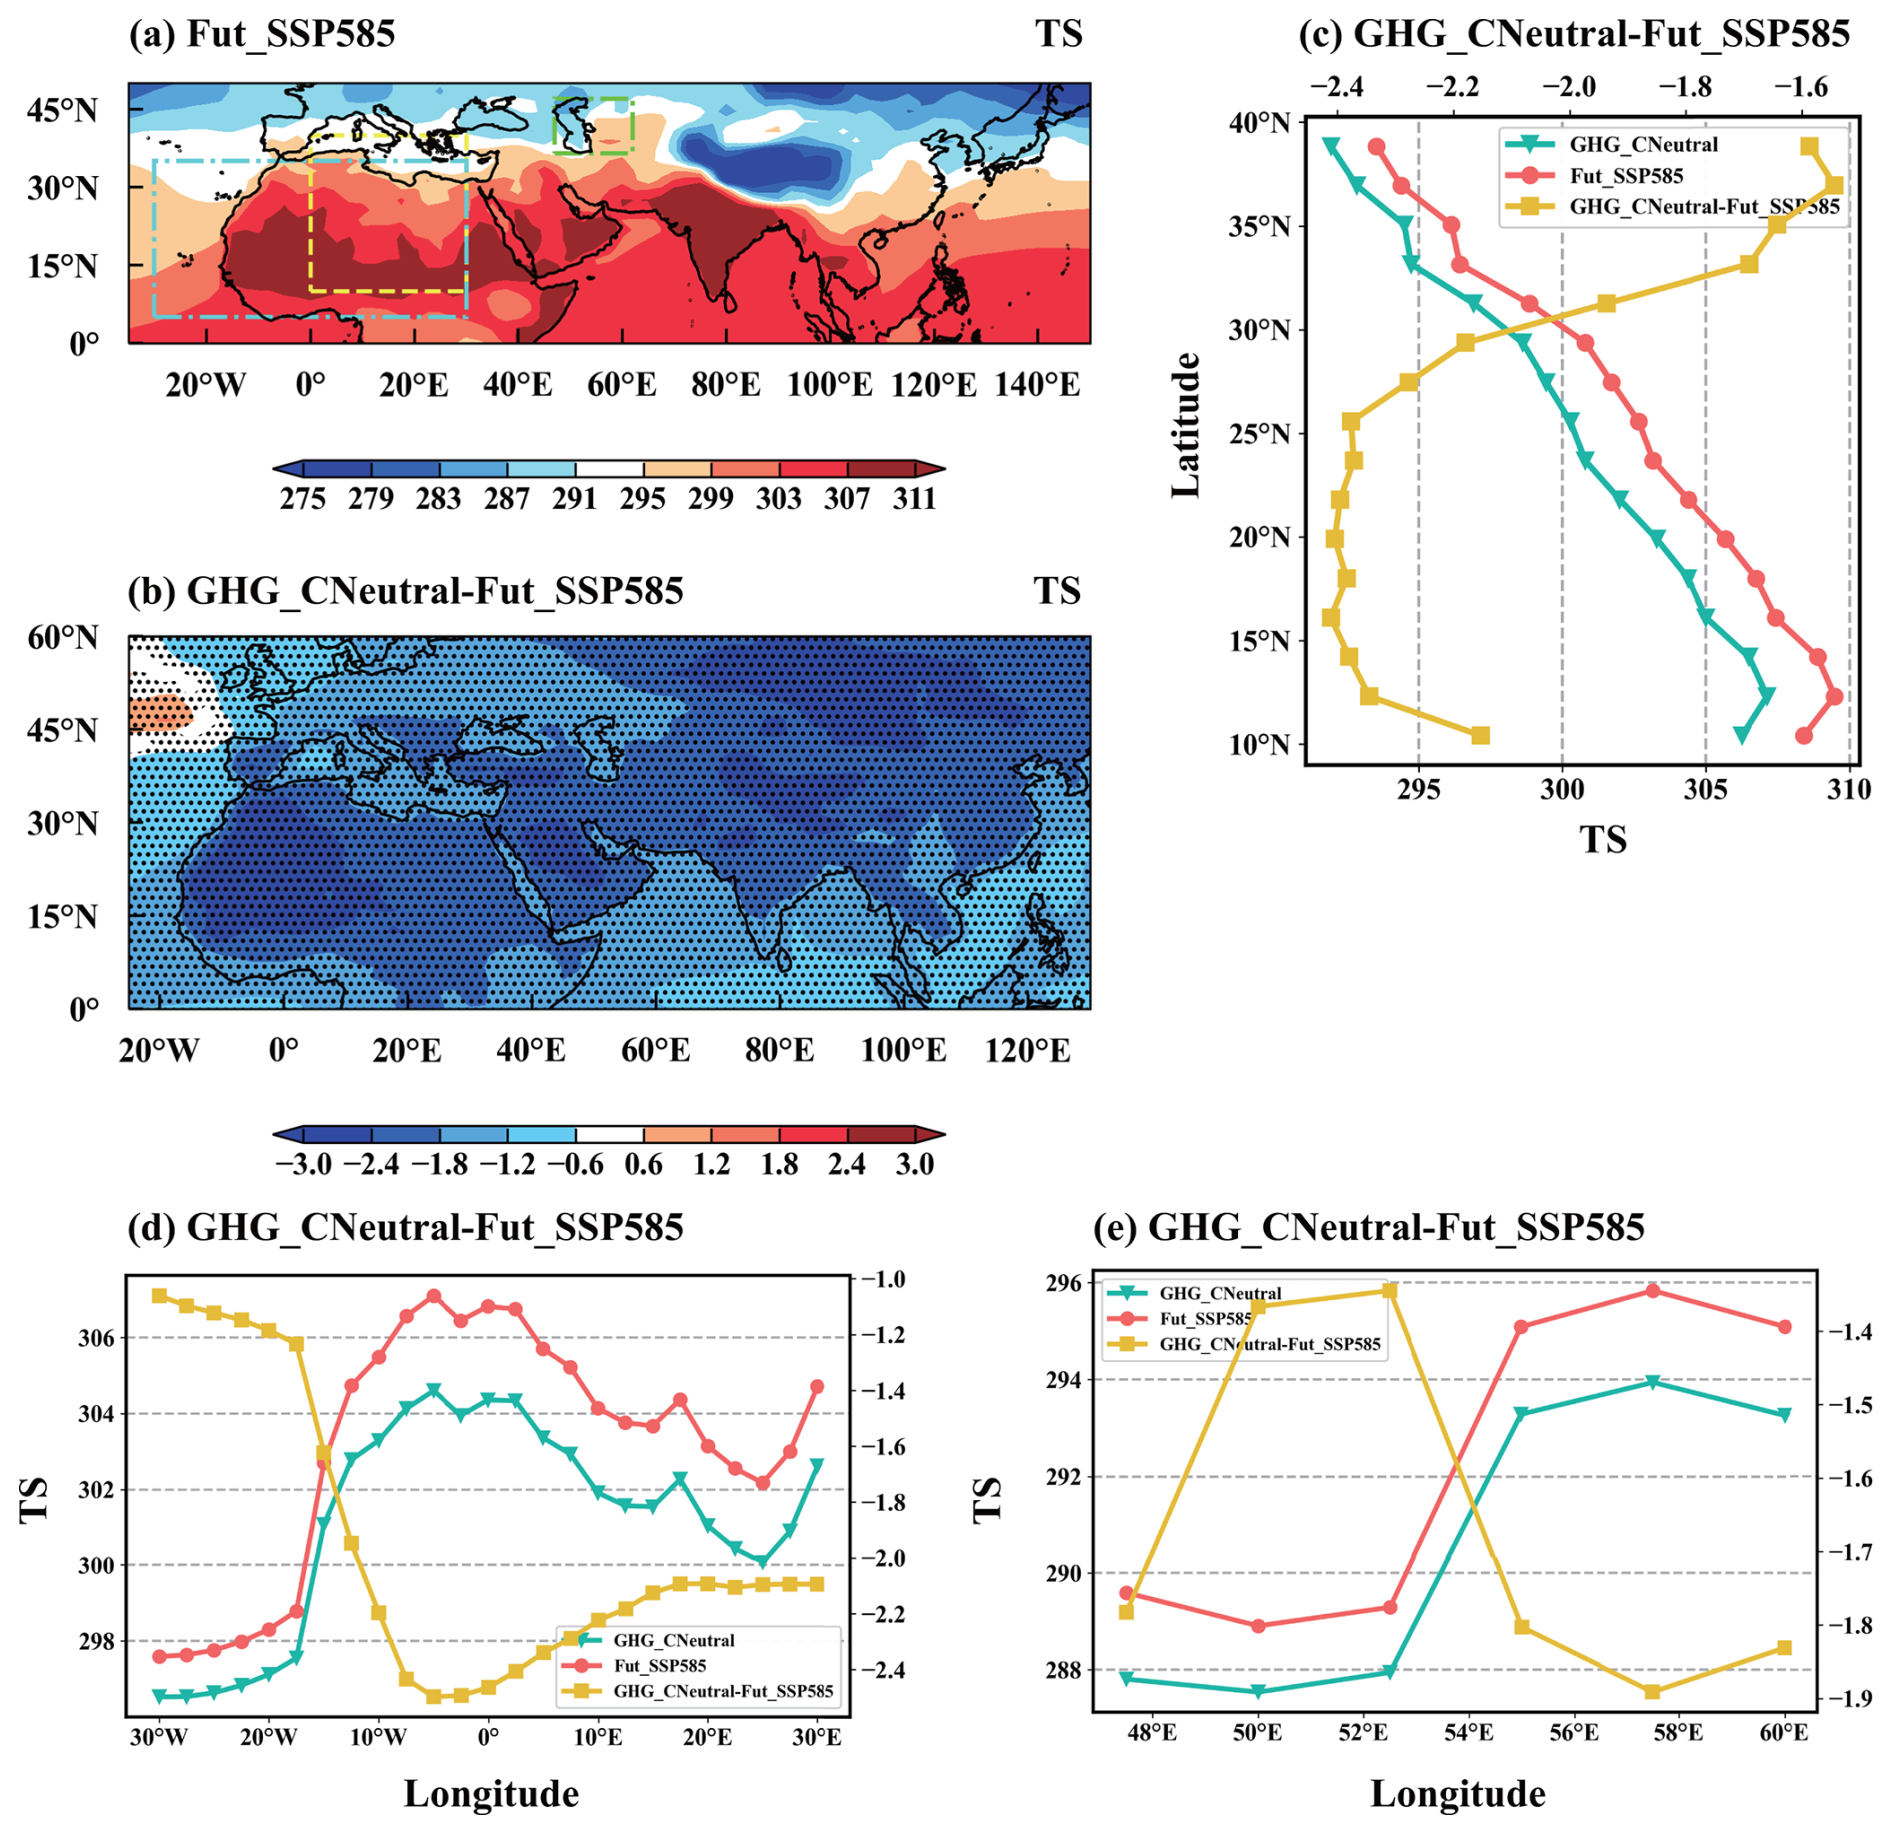
Figure 9Spatial distribution of March–May mean (a) surface temperature (TS, K) in 2060 from Fut_SSP585 and (b) changes in March–May mean surface temperature (TS, K) in 2060 for GHG_CNeural, compared to the Fut_SSP585 simulation. The stippled areas in panels (a) and (b) indicate statistically significant differences at the 90 % confidence level based on a two-tailed Student's t test. (c) Zonal averaged TS (K) over the region (10–40° N, 0–30° E, yellow) and (d–e) meridional averaged TS (K) over the regions (5–35° N, 30° W–30° E, blue; 36.5–47° N, 47–62° E, green) marked in panel (a) from March to May in 2060 for GHG_CNeutral, Fut_SSP5-8.5, and the changes between GHG_CNeutral and Fut_SSP5-8.5.
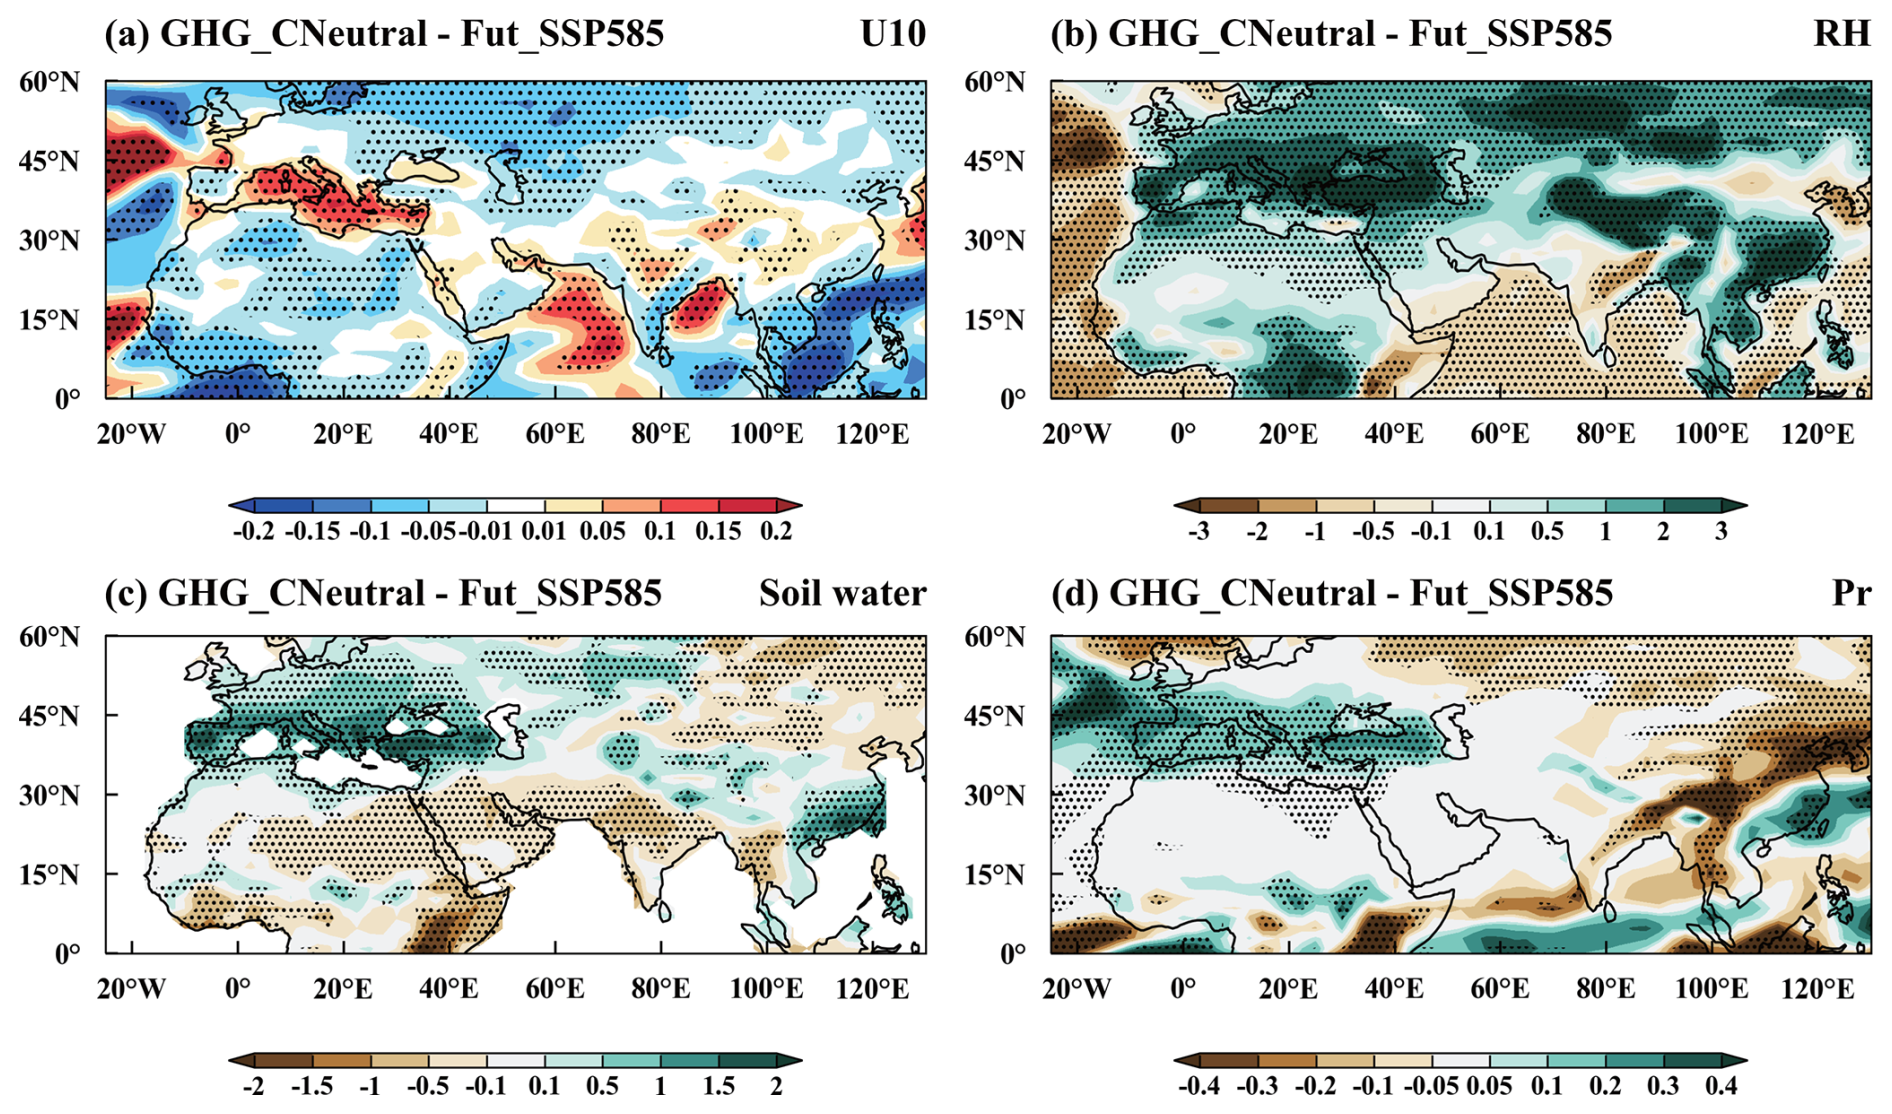
Figure 10Spatial distribution of changes in March–May mean (a) 10 m wind speed (U10, m s−1), (b) relative humidity (RH, %), (c) soil water content (soil water, kg m−2), and (d) precipitation rate (pr, mm d−1) in 2060 for GHG_CNeural, compared to the Fut_SSP585 simulation. The stippled areas indicate statistically significant differences at the 90 % confidence level based on a two-tailed Student's t test.
Dust emission suppression in North African and Central Asian regions (Fig. 3e) is primarily attributed to the weakened surface wind speeds induced by GHGs reduction (Fig. 10a). The GHGs reduction elevates relative humidity (Fig. 10b), which raises the critical threshold wind velocity required for dust mobilization. It further reduces dust emission fluxes by 6 %–15 % and atmospheric dust concentrations by 8 %–20 % (Fig. 4e–f), particularly in the North African and Central Asian source regions, even though the soil moisture slightly increases in some regions (Fig. 10c). This finding is consistent with previous research indicating that dust emissions across most source regions are significantly lower under the low-emission scenarios than under high-emission scenarios (Zhao et al., 2023; Liu et al., 2024; Gomez et al., 2023). The precipitation does not show significant changes over the North Africa and Central Asia (Fig. 10d). Over East Asia, the decreases in precipitation and soil water, likely related to the changing atmospheric circulation and moisture transport due to GHGs reductions, slightly promote the dust emissions over some parts of Taklamakan Desert and Gobi Desert (Fig. 3e). However, decreases in wind speed do not favor the dust transport (Fig. 10a) and are conducive to the local dust deposition. It can be confirmed by the changes in dust deposition that more dust is removed from the atmosphere over the Taklamakan Desert and the downwind North China Plain (Fig. 11) and the increase in dust removal surpasses the increase in dust emission (0.5 × 10⁻⁹ to 2 × 10⁻⁹ kg m−2 s−1) (Fig. 3e).
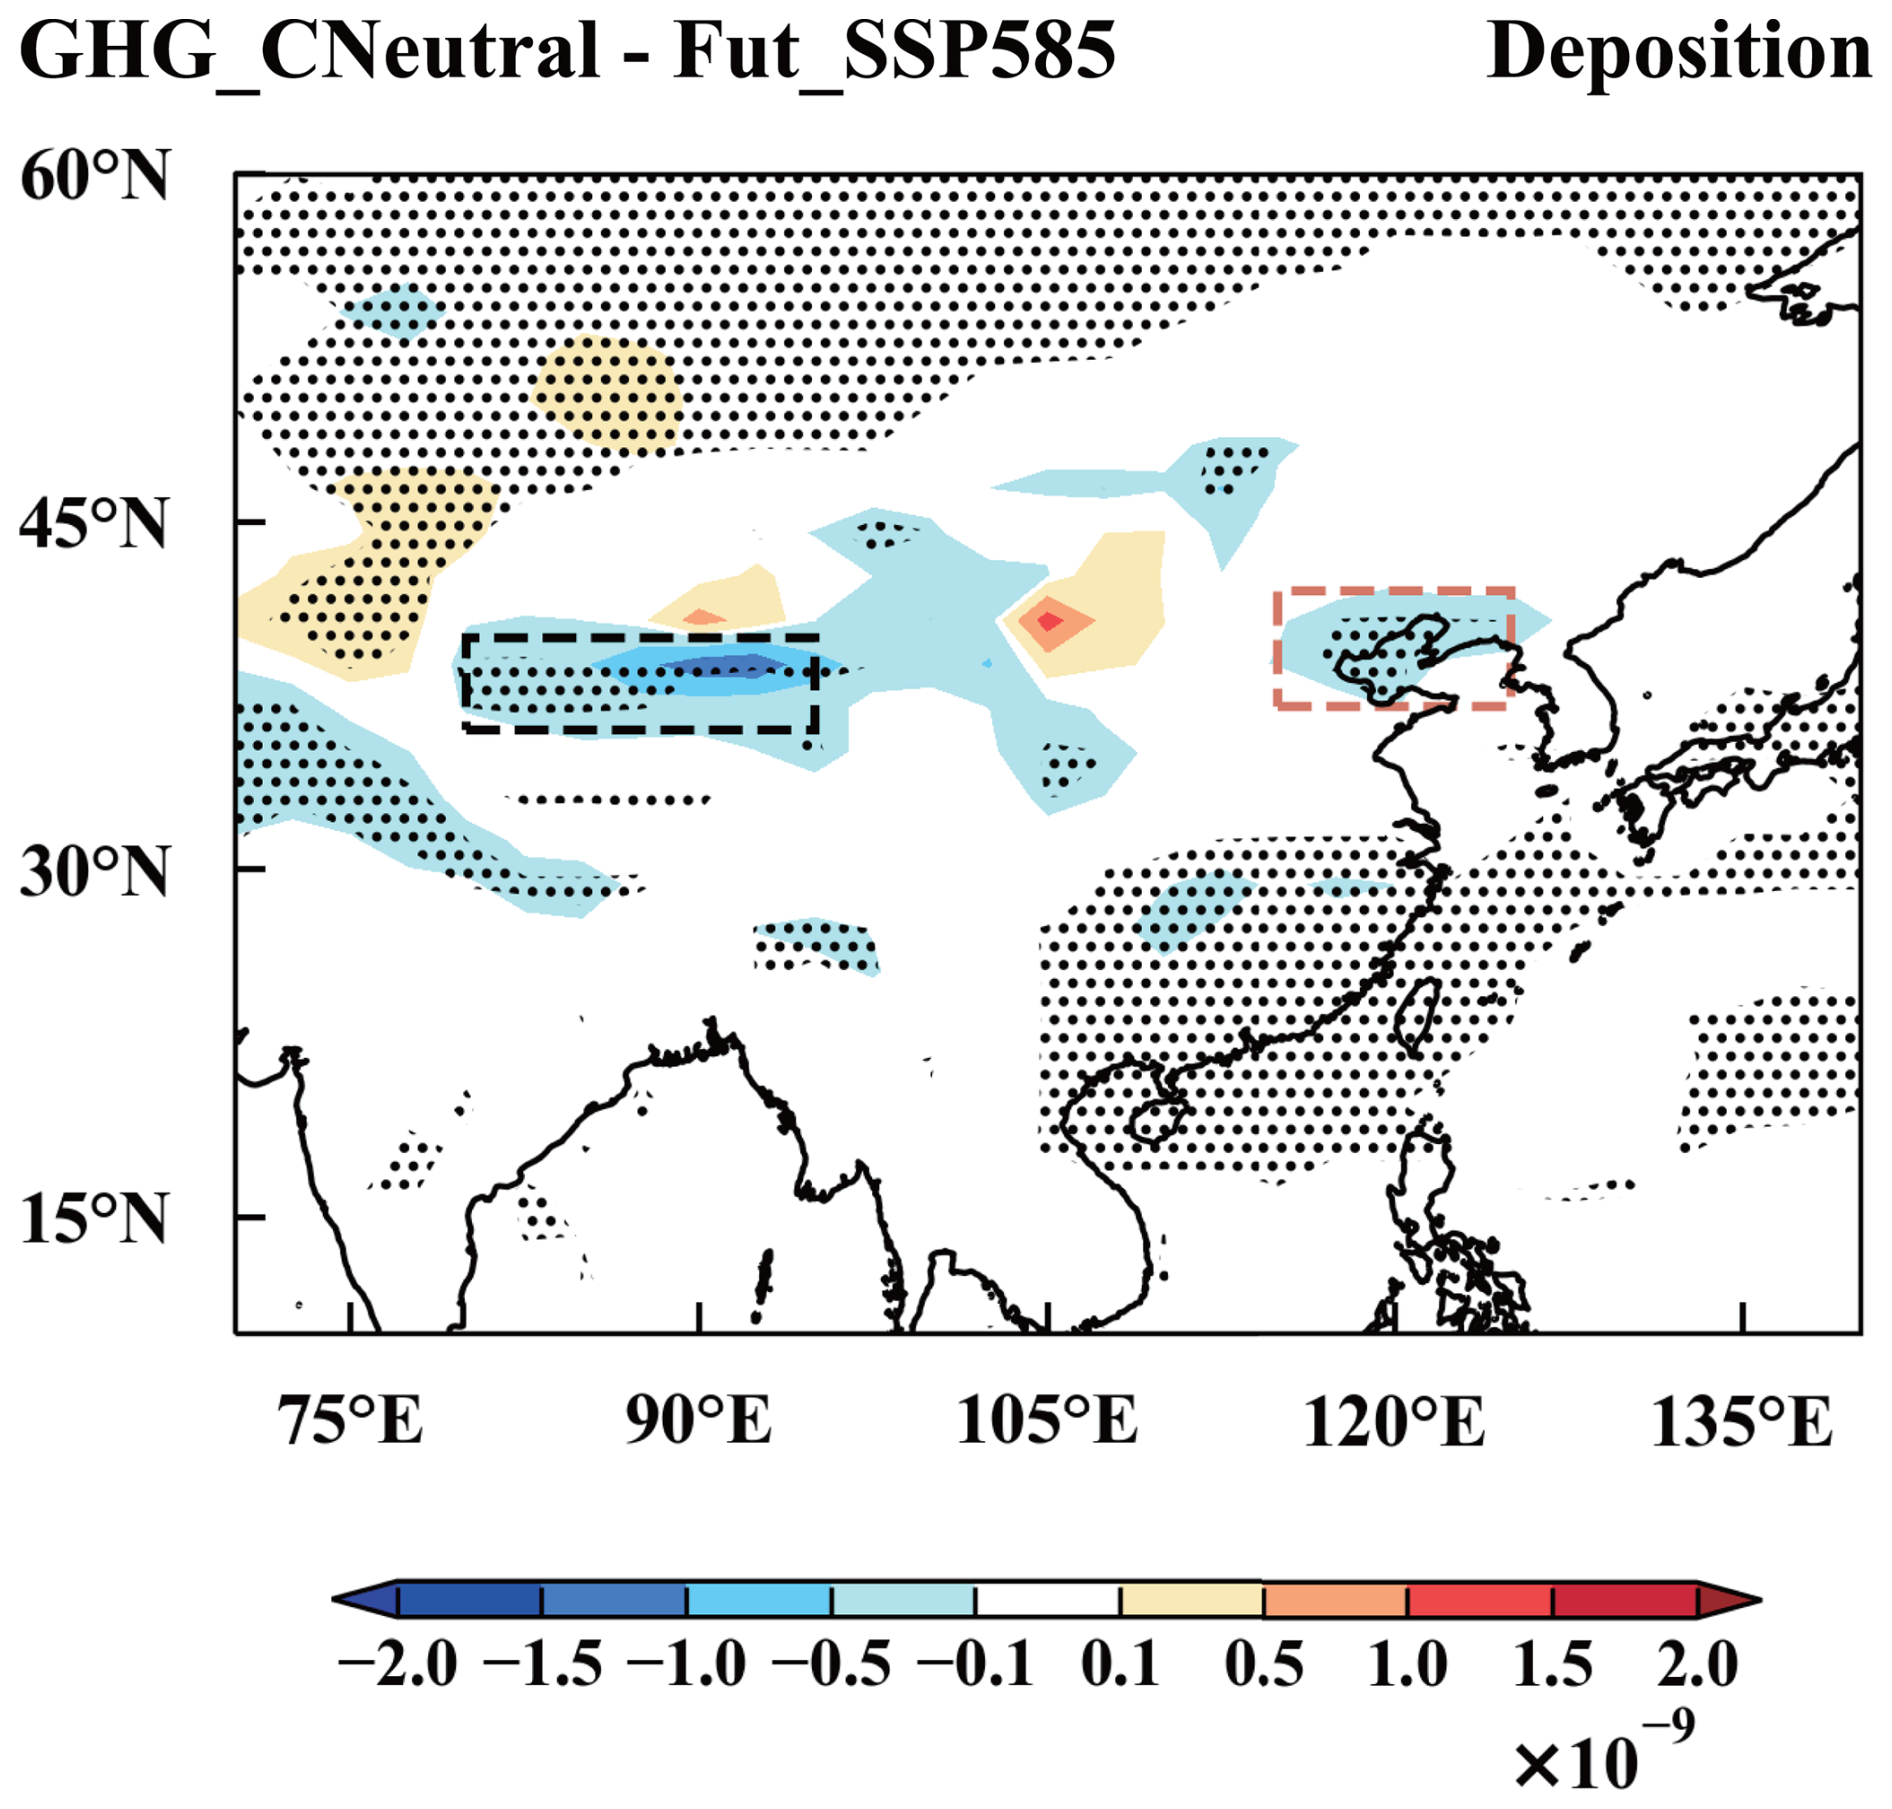
Figure 11Spatial distribution of dust deposition (kg m−2 s−1) changes for the period of March to May in 2060 between GHG_CNeural and Fut_SSP585 scenarios. The stippled areas indicate statistically significant differences at the 90 % confidence level based on a two-tailed Student's t test. Negative values denote more dust deposition to the surface. The Taklimakan (black box) and North China Plain (brown box) are highlighted.
In the carbon-neutral future scenario, reductions in GHGs and aerosols for climate mitigation and environmental improvement could change meteorological conditions and further influence dust emissions and concentrations. However, critical knowledge gaps remain in dust response to future climate change for pursuing carbon neutrality goals. While existing work has captured the combined impacts of anthropogenic aerosols and GHGs on dust flux under different future scenarios (Singh et al., 2017; Woodward et al., 2005; Zhao et al., 2023; Liu et al., 2024), the distinct roles of anthropogenic aerosols versus GHGs in modulating dust flux remain unresolved. Our work systematically resolves these knowledge gaps. In this study, the individual impacts of anthropogenic aerosols and GHGs reductions under the global carbon neutral scenario on dust emissions and concentrations over the dust belt of low- to mid-latitudes in the Northern Hemisphere are investigated using the fully coupled CESM1 model. The distinct effects of future GHGs and aerosol emission changes on dust emissions are individually assessed. Under carbon neutral scenario (SSP1-1.9), significant reductions in dust emissions (3 %–12 %) and concentrations (4 %–16 %) are seen over major Asian and African dust source regions relative to the high fossil fuel scenario (SSP5-8.5) in 2060 (Fig. 4a–b).
Anthropogenic aerosols and GHGs reduction exert opposite impacts on dust emissions. Due to aerosol reductions toward carbon neutrality, atmospheric convective is amplified, elevating surface wind speeds by 0.05–0.10 m s−1 and intensifying dust emissions (exceeding 2 × 10⁻⁹ kg m−2 s−1) and concentrations (exceeding 30 µg m−3), particularly in the North African, Central Asian, South Asian, and East Asian source sectors, by year 2060. Additionally, the reduction in aerosols is expected to increase near-surface temperature by 0.3–1.2 °C, decreasing relative humidity and soil water content, further intensifying dust emissions. In contrast, GHGs reduction diminishes the land-ocean thermal contrast, suppressing surface winds by 0.01–0.1 m s−1 and associated dust emissions by 2 × 10⁻⁹ kg m−2 s−1 and concentrations by 50 µg m−3 in North Africa and Central Asia (Fig. 3e–f ). The marked temperature reduction also elevates relative humidity by 1 %–3 %, suppressing dust generation, due to the GHGs reductions. Dust emissions over parts of the Taklamakan Desert and Gobi Desert are promoted, because of a decrease in precipitation and soil water. However, decreases in wind speed enhance dust deposition, leading to a decline in near-surface dust concentrations.
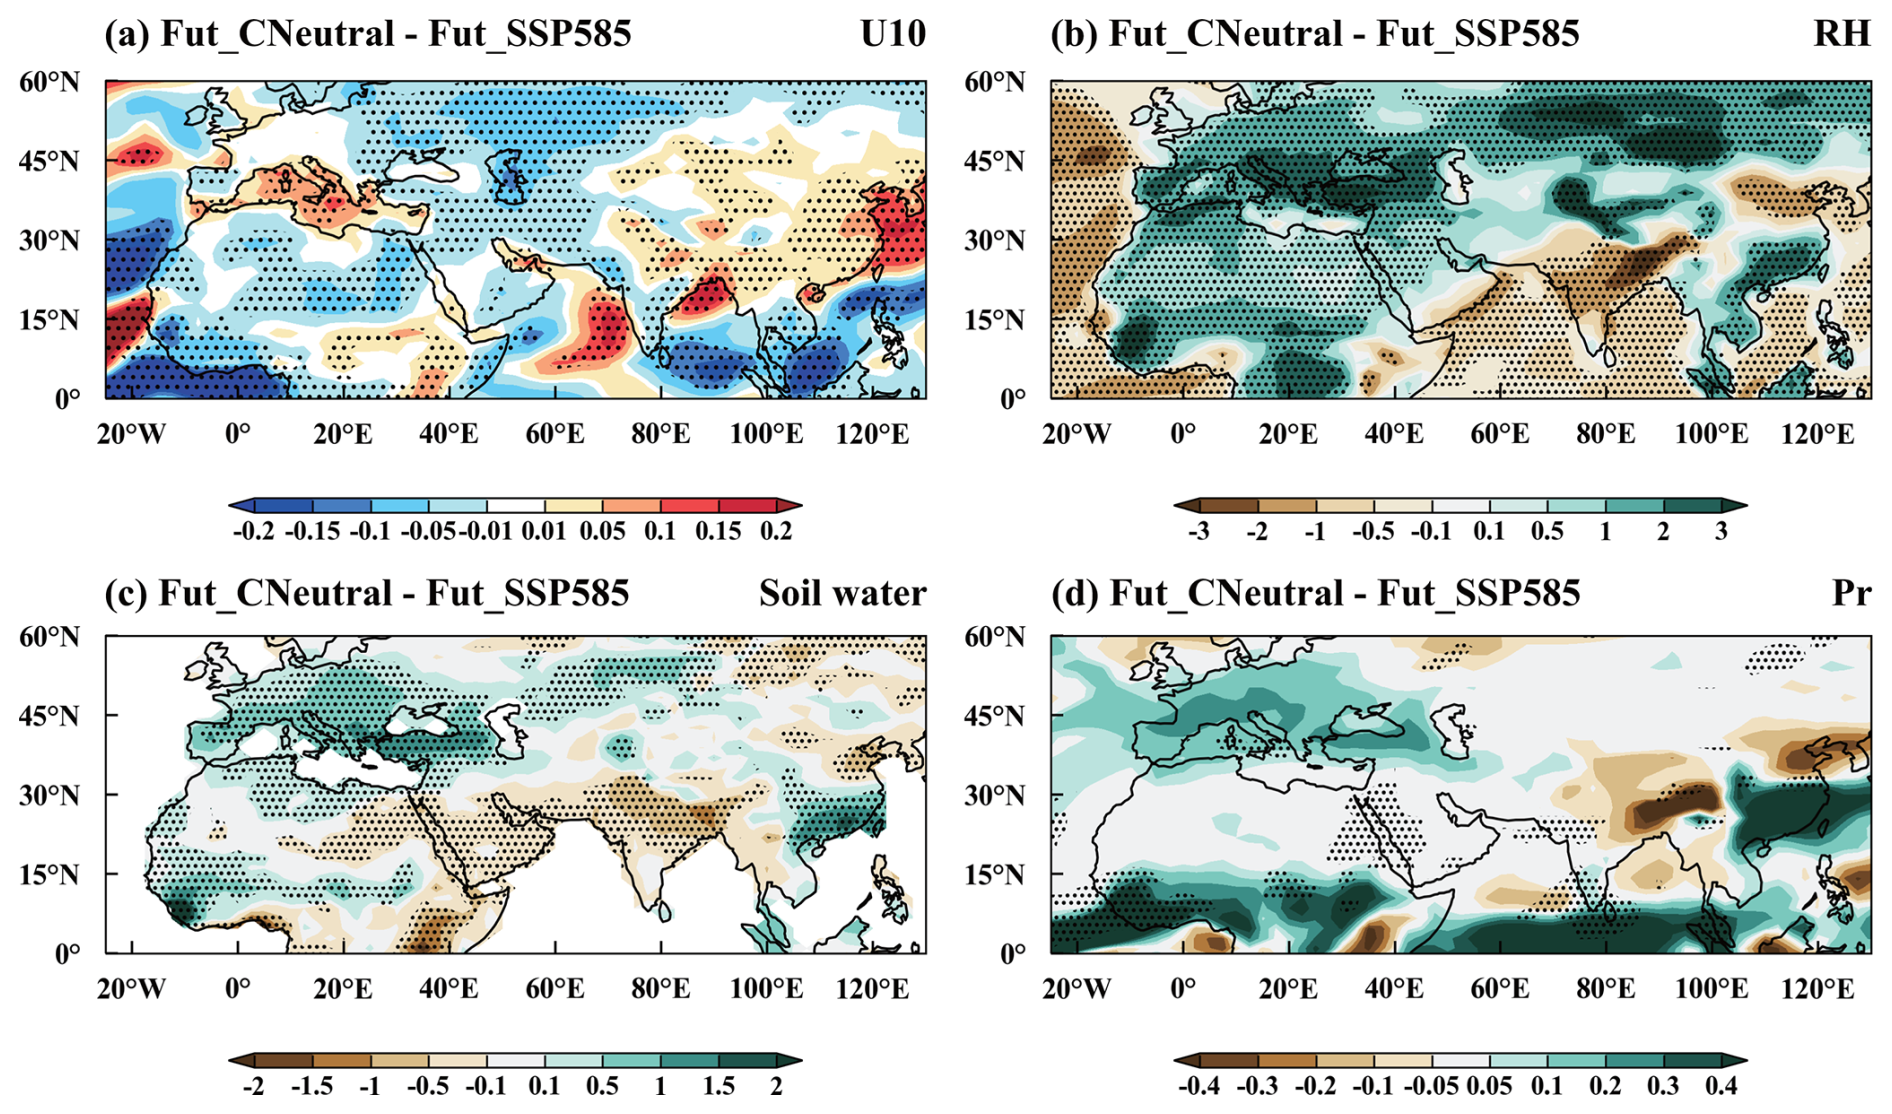
Figure 12Spatial distribution of changes in March–May mean (a) 10 m wind speed (U10, m s−1), (b) relative humidity (RH, %), (c) soil water content (soil water, kg m−2), and (d) precipitation rate (pr, mm d−1) in 2060 for Fut_CNeutral, compared to the Fut_SSP585 simulation. The stippled areas indicate statistically significant differences at the 90 % confidence level based on a two-tailed Student's t test.
Under combined GHG and aerosol reductions, dust emissions decline by 3 %–12 % across Northern Africa and Central Asia, contrasting with an increase of 3 %–9 % in East Asia (Fig. 4a–b). A consistent pattern has been observed in previous research (Liu et al., 2024). Correspondingly, surface wind speeds decrease by 0.01–0.1 m s−1 across Northern Africa and Central Asia but increase by 0.01–0.05 m s−1 over East Asia (Fig. 12a). Concurrently, relative humidity rises more significantly by 0.1 %–3 % over major dust source regions (Fig. 12b). This increase raises the wind speed threshold for dust emission, thereby suppressing dust uplift. However, in East Asia, higher wind speeds offset the suppression from increased humidity. Changes in soil moisture and precipitation are insignificant in these dust source regions and thus play minor roles in dust emission (Fig. 12c–d). Consequently, the suppressive effect of GHG mitigation dominates over the promotive effect of aerosol mitigation in Northern Africa and Central Asia. This outcome primarily results from the stronger cooling effect induced by GHG reductions compared to the warming caused by anthropogenic aerosol reductions (Fig. 13a). The cooling diminishes the land–ocean thermal contrast across Africa and Central Asia, further suppressing wind speeds and inhibiting dust emissions (Fig. 13b–d). In contrast, elevated wind speeds over East Asia are linked to an intensified Mongolia–Siberian High under joint mitigation, as indicated by sea level pressure increases of 40–80 Pa in Fig. 13e. This enhanced pressure gradient strengthens surface winds and promotes dust emissions across source regions in East Asia. This study addresses the critical knowledge gaps about the dust response to future climate change for pursuing carbon neutrality, providing valuable insights to guide the establishment of dust prevention measures and strategies in global pursuit of carbon neutrality.
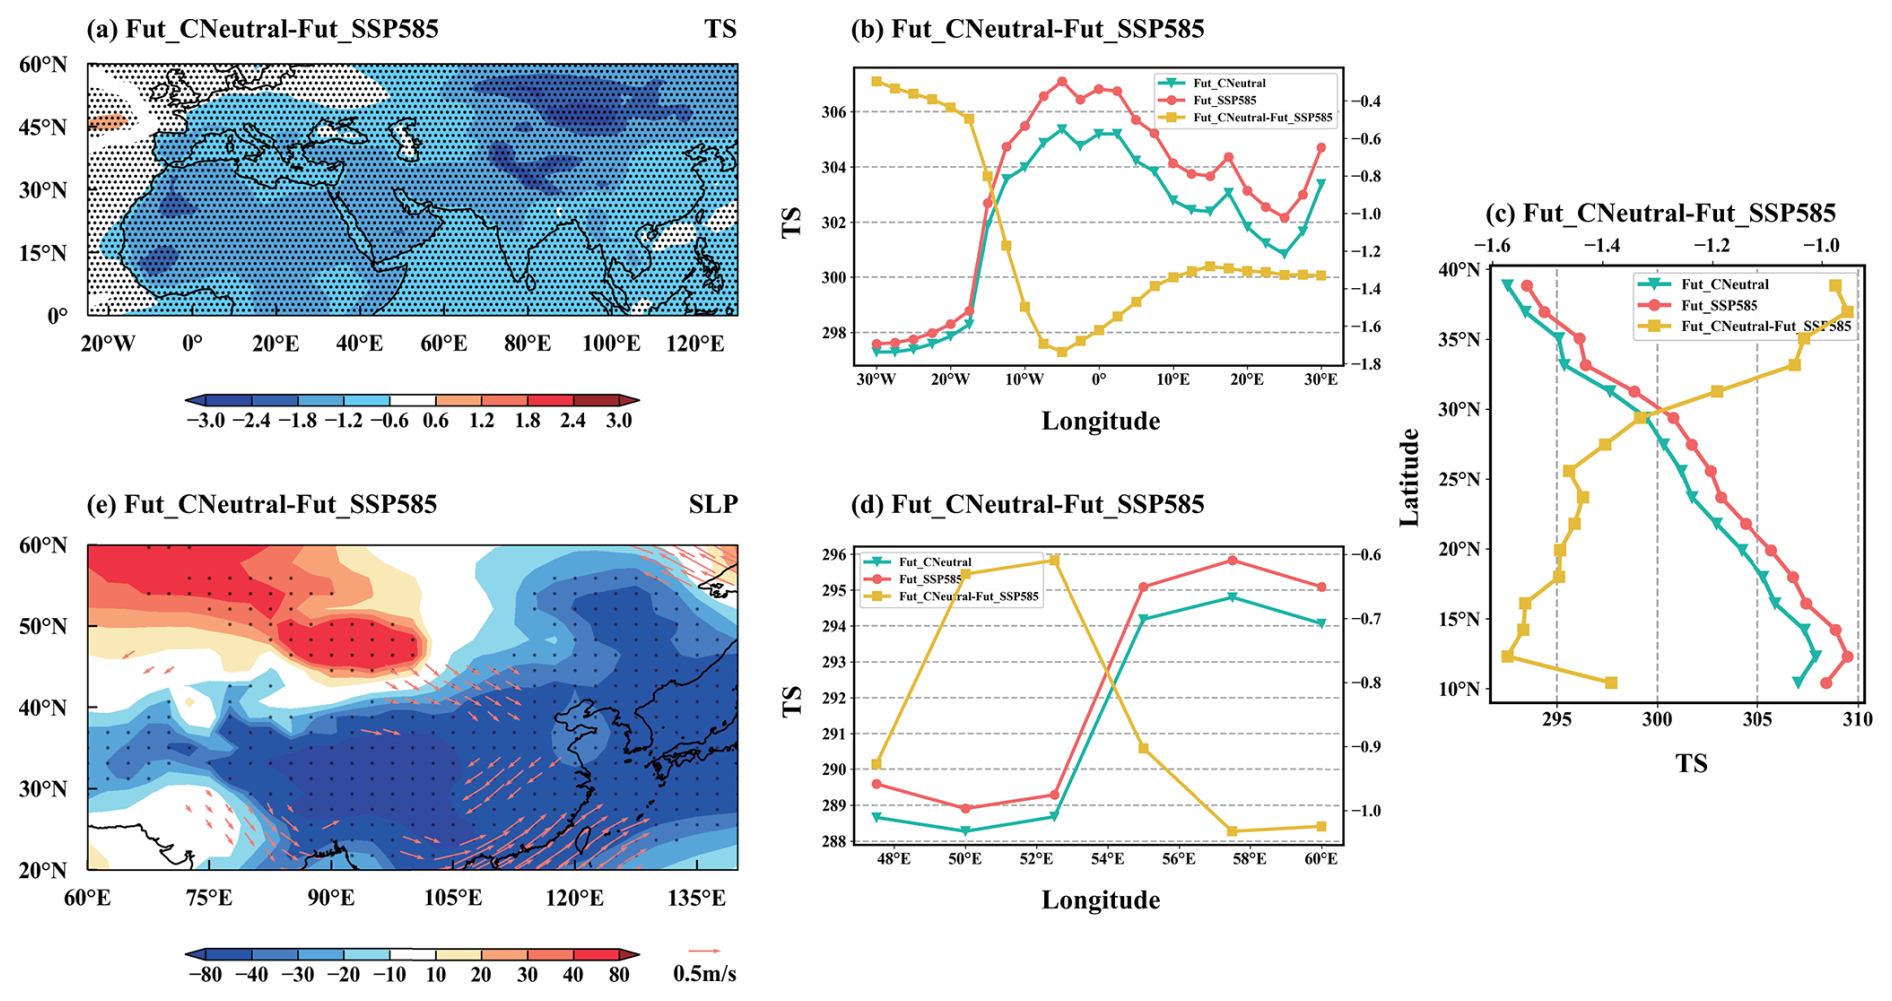
Figure 13Spatial distribution of changes in March–May mean (a) surface temperature (TS, K) and (e) sea level pressure (SLP, Pa) in 2060 for Fut_CNeutral, compared to the Fut_SSP585 simulation. The stippled areas in panels (a) and (b) indicate statistically significant differences at the 90 % confidence level based on a two-tailed Student's t test. (c) Zonal averaged TS (K) over the region (10–40° N, 0–30° E) and (b, d) meridional averaged TS (K) over the regions (5–35° N, 30° W–30° E; 36.5–47° N, 47–62° E) marked in panel (a) from March to May in 2060 for Fut_CNeutral, Fut_SSP5-8.5, and the changes between Fut_CNeutral and Fut_SSP5-8.5.
It is noteworthy that the responses of dust emissions and concentrations to the GHG and aerosol mitigation are not linear. Adding the individual effects of GHGs and aerosols together, dust emissions and concentrations show less decreases and even increases in over the Northern Hemisphere dust belt (Fig. S1 in the Supplement), compared to the combined effect of GHG and aerosol mitigation (Fig. 3). The differences are likely associated with nonlinear response of wind fields, including both the wind direction and wind speed, to the temperature changes induced by GHGs and aerosols, which could offset each other and ultimately lead to divergent responses in dust emissions and concentrations.
Dust emissions in the Northern Hemisphere reach a maximum in spring, the predominant season for dust storm occurrence. Therefore, this study focuses primarily on dust variations in the spring. Nevertheless, changes in the annual mean dust emissions are also important. Annual mean dust emission changes are highly consistent with spring patterns, showing increased emissions from aerosol reductions and decreased emissions from GHGs mitigation (Fig. S2).
Although large model uncertainties exist in the projections of climate response to anthropogenic forcings, and climate simulated in CESM is relatively more sensitive to anthropogenic forcings than many other global models (Wang et al., 2023; Ren et al., 2024), inter-model comparisons nevertheless yield consistent results regarding dust emissions under the SSP1-1.9 and SSP5-8.5 scenarios. Specifically, many CMIP6 models indicate that GHG and aerosol mitigation reduces dust emissions in Northwest Africa (Fig. S3), similar to the CESM simulation. Under future scenario, potential variations in tropospheric ozone concentrations may introduce additional complexity, as ozone can modulate key meteorological drivers as a greenhouse gas (Wang et al, 2023; Gao et al., 2022), which can also regulate dust emission processes. It is reasonable to speculate that the decline in ozone concentrations under carbon neutrality pathways would lead to a greater reduction in dust emissions relative to SSP5-8.5 than is currently estimated in this study, if this factor were accounted for. Also, this study does not consider the land cover change and the potential future forest expansion (Cramer et al., 2001; Notaro et al., 2007; Jiang et al., 2011) may weaken the dust changes toward carbon neutrality, which deserves further investigation in future work. Furthermore, as evidenced in our model validation, the CESM dust simulations exhibit inherent limitations, primarily originating from the topographic source function, the dust emission scheme, coarse spatial and vertical model resolution, and PBL parameterization (Wu et al., 2020; Lindvall et al., 2013), which collectively contribute to systematic biases in dust emission flux estimates.
Our findings demonstrate that the carbon neutrality scenario leads to an overall reduction in dust emissions compared to the high fossil fuel scenario, thereby alleviating future pressures on dust control policies. These results highlight the importance of advancing carbon neutrality, which not only achieves climate mitigation targets but also helps reduce dust pollution. Notably, however, East Asia exhibits anomalous increases in dust emissions. Therefore, while implementing carbon neutrality policies, it is essential to additionally strengthen regional measures such as afforestation and the construction of protective forest belts to further prevent dust storms.
The dust optical depth for 2020 level can be obtained from CALIPSO satellite retrievals (https://search.earthdata.nasa.gov/search/granules?p=C1633034978-LARC_ASDC, last access: 1 June 2025). The CESM model is publicly available at http://www.cesm.ucar.edu/models/ (last access: 1 June 2025). The processed modeling data are available at https://doi.org/10.5281/zenodo.15478736 (Yang, 2025).
The supplement related to this article is available online at https://doi.org/10.5194/acp-25-16877-2025-supplement.
YY designed the research; SY performed the simulations and analyzed the data. All authors including LR, HW, PW, LC, JJ and HL discussed the results and wrote the paper.
At least one of the (co-)authors is a member of the editorial board of Atmospheric Chemistry and Physics. The peer-review process was guided by an independent editor, and the authors also have no other competing interests to declare.
Publisher's note: Copernicus Publications remains neutral with regard to jurisdictional claims made in the text, published maps, institutional affiliations, or any other geographical representation in this paper. While Copernicus Publications makes every effort to include appropriate place names, the final responsibility lies with the authors. Views expressed in the text are those of the authors and do not necessarily reflect the views of the publisher.
The Pacific Northwest National Laboratory is operated for the U.S. Department of Energy by the Battelle Memorial Institute under contract DE-AC05-76RLO1830.
This research has been supported by the National Key Research and Development Program of China (grant 2024YFF0811400), National Natural Science Foundation of China (grant 42475032), Natural Science Foundation of the Jiangsu Higher Education Institutions of China (grant 24KJB170007), and Jiangsu Innovation and Entrepreneurship Team (grant JSSCTD202346).
This paper was edited by Jianping Huang and reviewed by three anonymous referees.
Akinsanola, A. A., Adebiyi, A. A., Bobde, V., Adeyeri, O. E., Tamoffo, A. T., and Danso, D. K.: Projected changes in African easterly wave activity due to climate change, Commun. Earth Environ., 6, 2, https://doi.org/10.1038/s43247-024-01981-9, 2025.
Banerjee, P., Satheesh, S. K., and Krishna Moorthy, K.: Is the Atlantic Ocean driving the recent variability in South Asian dust?, Atmos. Chem. Phys., 21, 17665–17685, https://doi.org/10.5194/acp-21-17665-2021, 2021.
Calvin, K., Bond-Lamberty, B., Clarke, L., Edmonds, J., Eom, J., Hartin, C., Kim, S., Kyle, P., Link, R., Moss, R., McJeon, H., Patel, P., Smith, S., Waldhoff, S., and Wise, M.: The SSP4: A world of deepening inequality, Global Environ. Change, 42, 284–296, 2017.
Chen, L., Msigwa, G., Yang, M., Osman, A. I., Fawzy, S., Rooney, D. W., and Yap, P-S.: Strategies to achieve a carbon neutral society: a review, Environ. Chem. Lett., 20, 2277–2310, https://doi.org/10.1007/s10311-022-01435-8, 2022.
Chen, Y., Chen, S., Bi, H., Zhou, J., and Zhang, Y.: Where is the Dust Source of 2023 Several Severe Dust Events in China?, Bull. Amer. Meteor. Soc., 105, E2085–E2096, https://doi.org/10.1175/BAMS-D-23-0121.1, 2024.
Chen, Z., Zhou, T., Zhang, W., Li, P., and Zhao, S.: Projected changes in the annual range of precipitation under stabilized 1.5 °C and 2.0 °C warming futures, Earth's Future, 8, e2019EF001435, https://doi.org/10.1029/2019EF001435, 2020.
Choobari, O. A., Zawar-Reza, P., and Sturman, A.: The global distribution of mineral dust and its impacts on the climate system: A review, Atmos. Res., 138, 152–165, https://doi.org/10.1016/j.atmosres.2013.11.007, 2014.
Cramer, W., Bondeau, A., Woodward, F. I., Prentice, I. C., Betts, R. A., Brovkin, V., Cox, P. M., Fisher, V., Foley, J. A., Friend, A. D., Kucharik, C., Lomas, M. R., Ramankutty, N., Sitch, S., Smith, B., White, A., and Young-Molling, C.: Global response of terrestrial ecosystem structure and function to CO2 and climate change: Results from six dynamic global vegetation models, Global. Change Biology, 7, 357–373, https://doi.org/10.1046/j.1365-2486.2001.00383.x, 2001.
Das, S., Giorgi, F., Giuliani, G., Dey, S., and Coppola, E.: Near-future anthropogenic aerosol emission scenarios and their direct radiative effects on the present-day characteristics of the Indian summer monsoon, J. Geophys. Res-atmos., 125, e2019JD031414, https://doi.org/10.1029/2019JD031414, 2020.
Dong, Z., Wang, H., Qian, G., Luo, W., and Zhang, Z.: Wind shear with a blowing-sand boundary layer, Geophys. Res. Lett., 33, L22804, https://doi.org/10.1029/2006GL026739, 2006.
Francis, D., Fonseca, R., Nelli, N., Teixido, O., Mohamed, R., and Perry, R.: Increased Shamal winds and dust activity over the Arabian Peninsula during the COVID-19 lockdown period in 2020, Aeolian Res., 55, 100786, https://doi.org/10.1016/j.aeolia.2022.100786, 2022.
Fricko, O., Havlik, P., Rogelj, J., Klimont, Z., Gusti, M., Johnson, N., Kolp, P., Strubegger, M., Valin, H., Amann, M., Ermolieva, T., Forsell, N., Herrero, M., Heyes, C., Kindermann, G., Krey, V., McCollum, D. L., Obersteiner, M., Pachauri, S., Rao, S., Schmid, E., Schoepp, W., and Riahi, K.: The marker quantification of the Shared Socioeconomic Pathway 2: A middle-of-the-road scenario for the 21st century, Global Environ. Change, 42, 251–267, https://doi.org/10.1016/j.gloenvcha.2016.06.004, 2017.
Fujimori, S., Hasegawa, T., Masui, T., Takahashi, K., Herran, D. S., Dai, H., Hijioka, Y., and Kainuma, M.: SSP3: AIM implementation of shared socioeconomic pathways, Global Environ. Change, 42, 268–283, https://doi.org/10.1016/j.gloenvcha.2016.06.009, 2017.
Fussell, J. C. and Kelly, F. J.: Mechanisms underlying the health effects of desert sand dust, Environ. Int., 157, 106790, https://doi.org/10.1016/j.envint.2021.106790, 2021.
Gao, J., Yang, Y., Wang, H., Wang, P., Li, H., Li, M., Ren, L., Yue, X., and Liao, H.: Fast climate responses to emission reductions in aerosol and ozone precursors in China during 2013–2017, Atmos. Chem. Phys., 22, 7131–7142, https://doi.org/10.5194/acp-22-7131-2022, 2022.
Ginoux, P., Prospero, J. M., Torres, O., and Chin, M.: Long-term simulation of global dust distribution with the GOCART model: correlation with North Atlantic Oscillation, Environ. Modell. Softw., 19, 113–128, https://doi.org/10.1016/S1364-8152(03)00114-2, 2004.
Ginoux, P., Prospero, J. M., Gill, T. E., Hsu, N. C., and Zhao, M.: Global-scale attribution of anthropogenic and natural dust sources and their emission rates based on MODIS Deep Blue aerosol products, Rev. Geophys., 50, RG3005, https://doi.org/10.1029/2012RG000388, 2012.
Gomez, J., Allen, R. J., Turnock, S. T., Horowitz, L. W., Tsigaridis, K., Bauer, S. E., Olivié, D., Thomson, E. S., and Ginoux, P.: The projected future degradation in air quality is caused by more abundant natural aerosols in a warmer world, Commun. Earth Environ., 4, 22, https://doi.org/10.1038/s43247-023-00688-7, 2023.
Goudie, A. S.: Desert dust and human health disorders, Environ. Int., 63, 101–113, https://doi.org/10.1016/j.envint.2013.10.011, 2014.
Griffin, D. W.: Atmospheric Movement of Microorganisms in Clouds of Desert Dust and Implications for Human Health, Clin. Microbiol. Rev., 20, 459–477, https://doi.org/10.1128/cmr.00039-06, 2007.
Gui, K., Yao, W., Che, H., An, L., Zheng, Y., Li, L., Zhao, H., Zhang, L., Zhong, J., Wang, Y., and Zhang, X.: Record-breaking dust loading during two mega dust storm events over northern China in March 2021: aerosol optical and radiative properties and meteorological drivers, Atmos. Chem. Phys., 22, 7905–7932, https://doi.org/10.5194/acp-22-7905-2022, 2022.
Hu, Z., Ma, Y., Jin, Q., Idrissa, N. F., Huang, J., and Dong, W.: Attribution of the March 2021 exceptional dust storm in North China, Bull. Am. Meteorol. Soc., 104, E749–E755, https://doi.org/10.1175/BAMS-D-22-0151.1, 2023.
Hurrell, J. W., Holland, M. M., Gent, P. R., Ghan, S., Kay, J. E., Kushner, P. J., Lamarque, J. F., Large, W. G., Lawrence, D., Lindsay, K., Lipscomb, W. H., Long, M. C., Mahowald, N., Marsh, D. R., Neale, R. B., Rasch, P., Vavrus, S., Vertenstein, M., Bader, D., Collins, W. D., Hack, J. J., Kiehl, J., and Marshall, S.: The Community Earth System Model: A Framework for Collaborative Research, Bull. Am. Meteor. Soc., 94, 1339–1360, https://doi.org/10.1175/BAMS-D-12-00121.1, 2013.
Jacobson, M. Z. and Kaufman, Y. J.: Wind reduction by aerosol particles, Geophys. Res. Lett., 33, L24814, https://doi.org/10.1029/2006GL027838, 2006.
Jethva, H., Satheesh, S. K., and Srinivasan, J.: Seasonal variability of aerosols over the Indo-Gangetic basin, J. Geophys. Res., 110, D21204, https://doi.org/10.1029/2005JD005938, 2005.
Jiang, D., Zhang, Y., and Lang, X.: Vegetation feedback under future global warming, Theor. Appl. Climatol., 106, 211–227, https://doi.org/10.1007/s00704-011-0428-6, 2011.
Jickells, T. D., An, Z. S., Andersen, K. K., Baker, A. R., Bergametti, G., Brooks, N., Cao, J. J., Boyd, P. W., Duce, R. A., Hunter, K. A., Kawahata, H., Kubilay, N., Laroche, J., Liss, P. S., Mahowald, N., Prospero, J. M., Ridgwell, A. J., Tegen, I., and Torres, R.: Global Iron Connections Between Desert Dust, Ocean Biogeochemistry, and Climate, Science, 308, 67–71, https://doi.org/10.1126/science.1105959, 2005.
Kok, J. F., Ridley, D. A., Zhou, Q., Miller, R. L., Zhao, C., Heald, C. L., Ward, D. S., Albani, S., and Haustein, K.: Smaller desert dust cooling effect estimated from analysis of dust size and abundance, Nat. Geosci., 10, 274–278, https://doi.org/10.1038/ngeo2912, 2017.
Kok, J. F., Adebiyi, A. A., Albani, S., Balkanski, Y., Checa-Garcia, R., Chin, M., Colarco, P. R., Hamilton, D. S., Huang, Y., Ito, A., Klose, M., Li, L., Mahowald, N. M., Miller, R. L., Obiso, V., Pérez García-Pando, C., Rocha-Lima, A., and Wan, J. S.: Contribution of the world's main dust source regions to the global cycle of desert dust, Atmos. Chem. Phys., 21, 8169–8193, https://doi.org/10.5194/acp-21-8169-2021, 2021.
Kok, J. F., Storelvmo, T., Karydis, V.A., Adebiyi, A. A., Mahowald, N. M., Evan, A. T., He, C., and Leung, D. M.: Mineral dust aerosol impacts on global climate and climate change, Nat. Rev. Earth Environ., 4, 71–86, https://doi.org/10.1038/s43017-022-00379-5, 2023.
Kriegler, E., Bauer, N., Popp, A., Humpenöder, F., Leimbach, M., Strefler, J., Baumstark, L., Bodirsky, B. L., Hilaire, J., Klein, D., Mouratiadou, I., Weindl, I., Bertram, C., Dietrich, J.-P., Luderer, G., Pehl, M., Pietzcker, R., Piontek, F., Lotze-Campen, H., Biewald, A., Bonsch, M., Giannousakis, A., Kreidenweis, U., Müller, C., Rolinski, S., Schultes, A., Schwanitz, J., Stevanovic, M., Calvin, K., Emmerling, J., Fujimori, S., and Edenhofer, O.: Fossil-fueled development (SSP5): an energy and resource intensive scenario for the 21st century, Global Environ. Change, 42, 297–315, 2017.
Kuzmina, S. I., Bengtsson, L., Johannessen, O. M., Drange, H., Bobylev, L. P., and Miles, M. W.: The North Atlantic Oscillation and greenhouse-gas forcing, Geophys. Res. Lett., 32, L04703, https://doi.org/10.1029/2004GL021064, 2005.
Lee, S. and Feldstein, S. B.: Detecting Ozone- and Greenhouse Gas–Driven Wind Trends with Observational Data, Science, 339, 563–567, https://doi.org/10.1126/science.1225154, 2013.
Lei, Y., Wang, Z., Wang, D., Zhang, X., Chen, H., Yue, X., Tian, C., Zhong, J., Guo, L., Li, L., Zhou, H., Liu, L., and Xu, Y.: Co-benefits of carbon neutrality in enhancing and stabilizing solar and wind energy, Nat. Clim. Chang, 13, 693–700, https://doi.org/10.1038/s41558-023-01692-7, 2023.
Li, B., Liao, H., Li, K., Wang, Y., Zhang, L., Guo, Y., Liu, L., Li, J., Jin, J., Yang, Y., Gong, C., Wang, T., Shen, W., Wang, P., Dang, R., Liao, K., Zhu, Q., and Jacob, D. J.: Unlocking nitrogen management potential via large-scale farming for air quality and substantial Co-benefits, Natl. Sci. Rev., 11, nwae324, https://doi.org/10.1093/nsr/nwae324, 2024.
Lindvall, J., Svensson, G., and Hannay, C.: Evaluation of Near-Surface Parameters in the Two Versions of the Atmospheric Model in CESM1 using Flux Station Observations, J. Climate, 26, 26–44, https://doi.org/10.1175/JCLI-D-12-00020.1, 2013.
Liu, J., Wang, X., Wu, D., Wei, H., Li, Y., and Ji, M.: Historical footprints and future projections of global dust burden from bias-corrected CMIP6 models, npj Clim. Atmos. Sci., 7, 1, https://doi.org/10.1038/s41612-023-00550-9, 2024.
Liu, X., Ma, P.-L., Wang, H., Tilmes, S., Singh, B., Easter, R. C., Ghan, S. J., and Rasch, P. J.: Description and evaluation of a new four-mode version of the Modal Aerosol Module (MAM4) within version 5.3 of the Community Atmosphere Model, Geosci. Model Dev., 9, 505–522, https://doi.org/10.5194/gmd-9-505-2016, 2016.
Liu, X., Chen, S., Guo, Z., Zhou, H., Chen, Y., Kang, Y., Liu, Q., Huang, G., Liu, T., Chen, C., and He, Q.: The influence of dusts on radiation and temperature over the eastern Asia with a regional climate model, Sci. Total Environ., 792, 148351, https://doi.org/10.1016/j.scitotenv.2021.148351, 2021.
Ma, X., Huang, G., and Cao, J.: The significant roles of anthropogenic aerosols on surface temperature under carbon neutrality, Sci. Bull., 67, 470–473, https://doi.org/10.1016/j.scib.2021.10.022, 2022.
Meinshausen, M., Nicholls, Z. R. J., Lewis, J., Gidden, M. J., Vogel, E., Freund, M., Beyerle, U., Gessner, C., Nauels, A., Bauer, N., Canadell, J. G., Daniel, J. S., John, A., Krummel, P. B., Luderer, G., Meinshausen, N., Montzka, S. A., Rayner, P. J., Reimann, S., Smith, S. J., van den Berg, M., Velders, G. J. M., Vollmer, M. K., and Wang, R. H. J.: The shared socio-economic pathway (SSP) greenhouse gas concentrations and their extensions to 2500, Geosci. Model Dev., 13, 3571–3605, https://doi.org/10.5194/gmd-13-3571-2020, 2020.
Meng, Q., Yan, C., Li, R., Zhang, T., Zheng, M., Liu, Y., Zhang, M., Wang, G., Du, Y., Shang, C., and Fu, P.: Variations of PM2.5-bound elements and their associated effects during long-distance transport of dust storms: Insights from multi-sites observations, Sci. Total Environ, 889, 164062, https://doi.org/10.1016/j.scitotenv.2023.164062, 2023.
Menut, L., Tuccella, P., Flamant, C., Deroubaix, A., and Gaetani, M.: The role of aerosol–radiation–cloud interactions in linking anthropogenic pollution over southern west Africa and dust emission over the Sahara, Atmos. Chem. Phys., 19, 14657–14676, https://doi.org/10.5194/acp-19-14657-2019, 2019.
Min, Q.-L., Li, R., Lin, B., Joseph, E., Wang, S., Hu, Y., Morris, V., and Chang, F.: Evidence of mineral dust altering cloud microphysics and precipitation, Atmos. Chem. Phys., 9, 3223–3231, https://doi.org/10.5194/acp-9-3223-2009, 2009.
Myhre, G., Forster, P. M., Samset, B. H., Hodnebrog, Ø., Sillmann, J., Aalbergsjø, S. G., Andrews, T., Boucher, O., Faluvegi, G., Fläschner, D., Iversen, T., Kasoar, M., Kharin, V., Lamarque, J. F., Olivié, D., Richardson, T., Shindell, D., Shine, K. P., Stjern, C. W., Takemura, T., Voulgarakis, A., and Zwiers, F.: PDRMIP: A Precipitation Driver and Response Model Intercomparison Project, Protocol and preliminary results, Bull. Am. Meteorol. Soc., 98, 1185–1198, https://doi.org/10.1175/bams-d-16-0019.1, 2017.
Nabavi, S. O., Haimberger, L., and Samimi, Cyrus.: Climatology of dust distribution over West Asia from homogenized remote sensing data, Aeolian Res., 21, 93–107, https://doi.org/10.1016/j.aeolia.2016.04.002, 2016.
Notaro, M., Vavrus, S., and Liu, Z.: Global Vegetation and Climate Change due to Future Increases in CO2 as Projected by a Fully Coupled Model with Dynamic Vegetation, J. Climate, 20, 70–90, https://doi.org/10.1175/JCLI3989.1, 2007.
Oleson, K. W., Lawrence, D. M., Bonan, G. B., Flanner, M. G., Kluzek, E., Lawrence, P. J., Levis, S., Swenson, S. C., Thornton, P. E., Dai, A., and Decker, M.: Technical description of version 4.0 of the Community Land Model (CLM) (NCAR/TN-478+STR), University Corporation for Atmospheric Research, https://doi.org/10.5065/D6FB50WZ, 2010.
Pabortsava, K., Lampitt, R. S., Benson, J., Crowe, C., McLachlan, R., Moigne, F. A., Moore, C. M., Pebody, C., Provost, P., Rees, A. P., Tilstone, G. H., and Woodward, E. M. S.: Carbon sequestration in the deep Atlantic enhanced by Saharan dust, Nat. Geosci., 10, 189–194, https://doi.org/10.1038/ngeo2899, 2017.
Prospero, J. M., Ginoux, P., Torres, O., Nicholson, S. E., and Gill, T. E.: Environmental characterization of global sources of atmospheric soil dust identified with the nimbus 7 total ozone mapping spectrometer (TOMS) absorbing aerosol product, Rev. Geophys., 40, 1002, https://doi.org/10.1029/2000RG000095, 2002.
Qin, Y., Zhou, M., Hao, Y., Huang, X., Tong, D., Huang, L., Zhang, C., Cheng, J., Gu, W., Wang, L., He, X., Zhou, D., Chen, Q., Ding, A., and Zhu, T.: Amplified positive effects on air quality, health, and renewable energy under China's carbon neutral target, Nat. Geosci., 17, 411–418, https://doi.org/10.1038/s41561-024-01425-1, 2024.
Qu, M., Shen, L., Zeng, Z., Yang, B., Zhong, H., Yang, X., and Liu, X.: Prolonged wind droughts in a warming climate threaten global wind power security, Nat. Clim. Chang. 15, 842–849, https://doi.org/10.1038/s41558-025-02387-x, 2025.
Ramanathan, V., Crutzen, P. J., Kiehl, J. T., and Rosenfeld, D.: Aerosols, Climate, and the Hydrological Cycle, Science, 294, 2119–2124, https://doi.org/10.1126/science.1064034, 2001.
Ravi, S. and D'Odorico, P.: A field-scale analysis of the dependence of wind erosion threshold velocity on air humidity, Geophys. Res. Lett., 32, L21404, https://doi.org/10.1029/2005GL023675, 2005.
Ren, L., Yang, Y., Wang, H., Wang, P., Yue, X., and Liao, H.: Co-benefits of mitigating aerosol pollution to future solar and wind energy in China toward carbon neutrality, Geophys. Res. Lett., 51, e2024GL109296, https://doi.org/10.1029/2024GL109296, 2024.
Roy, D., Kim, J., Lee, M., and Park, J.: Adverse impacts of Asian dust events on human health and the environment – A probabilistic risk assessment study on particulate matter-bound metals and bacteria in Seoul, South Korea, Sci. Total Environ., 875, 162637, https://doi.org/10.1016/j.scitotenv.2023.162637, 2023.
Seager, R., Cane, M., Henderson, N., Lee, D., Abernathey, R., and Zhang, H.: Strengthening tropical Pacific zonal sea surface temperature gradient consistent with rising greenhouse gases, Nat. Clim. Change, 9, 517–522, https://doi.org/10.1038/s41558-019-0505-x, 2019.
Shao, Y., Wyrwoll, K.-H., Chappell, A., Huang, J., Lin, Z., McTainsh, G. H., Mikami, M., Tanaka, T. Y., Wang, X., and Yoon, S.: Dust cycle: An emerging core theme in Earth system science, Aeolian Res., 2, 181–204, https://doi.org/10.1016/j.aeolia.2011.02.001, 2011.
Singh, C., Ganguly, D., and Dash, S. K.: Dust load and rainfall characteristics and their relationship over the South Asian monsoon region under various warming scenarios, J. Geophys. Res. Atmos., 122, 7896–7921, https://doi.org/10.1002/2017JD027451, 2017.
Su, B., Huang, J., Mondal, S. K., Zhai, J., Wang, Y., Wen, S., Gao, M., Lv, Y., Jiang, S., Jiang, T., and Li, A.: Insight from CMIP6 SSP-RCP scenarios for future drought characteristics in China, Atmos. Res., 250, 105375, https://doi.org/10.1016/j.atmosres.2020.105375, 2021.
Tanaka, T. Y. and Chiba, M.: A numerical study of the contributions of dust source regions to the global dust budget, Glob. Planet. Change, 52, 88–104, https://doi.org/10.1016/j.gloplacha.2006.02.002, 2006.
Tegen, I., Werner, M., Harrison, S. P., and Kohfeld, K. E.: Relative importance of climate and land use in determining present and future global soil dust emission, Geophys. Res. Lett., 31, L05105, https://doi.org/10.1029/2003GL019216, 2004.
van Vuuren, D. P., Stehfest, E., Gernaat, D. E., Doelman, J. C., van den Berg, M., Harmsen, M., de Boer, H. S., Bouwman, L. F., Daioglou, V., Edelenbosch, O. Y., Girod, B., Kram, T., Lassaletta, L., Lucas, P. L., van Meijl, H., Müller, C., van Ruijven, B. J., van der Sluis, S., and Tabeau, A.: Energy, land-use and greenhouse gas emissions trajectories under a green growth paradigm, Global Environ. Change, 42, 237–250, 2017.
Wang, H., Easter, R. C., Rasch, P. J., Wang, M., Liu, X., Ghan, S. J., Qian, Y., Yoon, J.-H., Ma, P.-L., and Vinoj, V.: Sensitivity of remote aerosol distributions to representation of cloud–aerosol interactions in a global climate model, Geosci. Model Dev., 6, 765–782, https://doi.org/10.5194/gmd-6-765-2013, 2013.
Wang, P., Yang, Y., Xue, D., Ren, L., Tang, J., Leung, L. R., and Liao, H.: Aerosols overtake greenhouse gases causing a warmer climate and more weather extremes toward carbon neutrality, Nat. Commun., 14, 7257, https://doi.org/10.1038/s41467-023-42891-2, 2023.
Woodward, S., Roberts, D. L., and Betts, R. A.: A simulation of the effect of climate change–induced desertification on mineral dust aerosol, Geophys. Res. Lett., 32, L18810, https://doi.org/10.1029/2005GL023482, 2005.
Wu, M., Liu, X., Yu, H., Wang, H., Shi, Y., Yang, K., Darmenov, A., Wu, C., Wang, Z., Luo, T., Feng, Y., and Ke, Z.: Understanding processes that control dust spatial distributions with global climate models and satellite observations, Atmos. Chem. Phys., 20, 13835–13855, https://doi.org/10.5194/acp-20-13835-2020, 2020.
Wubben, E., Spiering, B. R., Veenstra, T., Bos, R., Wang, Z., van Dijk, J., Raffi, I., Witkowski, J., Hilgen, F. J., Peterse, F., Sangiorgi, F., and Sluijs, A.: Tropical warming and intensification of the West African Monsoon during the Miocene Climatic Optimum, Paleoceanogr. Paleoclimatol., 39, e2023PA004767, https://doi.org/10.1029/2023PA004767, 2024.
Xie, X., Myhre, G., Che, H., Wu, F., Guo, J., Shi, Z., Li, X., Liu, X., and Liu, Y.: Anthropogenic sulfate-climate interactions suppress dust activity over East Asia, Commun. Earth Environ., 6, 159, https://doi.org/10.1038/s43247-025-02147-x, 2025.
Yang, Y.: Data for “Impact of reductions in anthropogenic aerosols and greenhouse gases on dust pollution across the dust belt”, Zenodo [data set], https://doi.org/10.5281/zenodo.15478736, 2025.
Yang, Y., Zeng, L., Wang, H., Wang, P., and Liao, H.: Dust pollution in China affected by different spatial and temporal types of El Niño, Atmos. Chem. Phys., 22, 14489–14502, https://doi.org/10.5194/acp-22-14489-2022, 2022.
Yang, Y., Zeng, L., Wang, H., Wang, P., and Liao, H.: Climate effects of future aerosol reductions for achieving carbon neutrality in China, Sci. Bull., 68, 902–905, https://doi.org/10.1016/j.scib.2023.03.048, 2023.
Yuan, T., Huang, J., Cao, J., Zhang, G., and Ma, X.: Indian dust-rain storm: Possible influences of dust ice nuclei on deep convective clouds, Sci. Total Environ., 779, 146439, https://doi.org/10.1016/j.scitotenv.2021.146439, 2021.
Zender, C. S., Bian, H., and Newman, D.: Mineral Dust Entrainment and Deposition (DEAD) model: Description and 1990s dust climatology, J. Geophys. Res., 108, 4416, https://doi.org/10.1029/2002JD002775, 2003.
Zhang, Y., Yu, F., Luo, G., Fan, J., and Liu, S.: Impacts of long-range-transported mineral dust on summertime convective cloud and precipitation: a case study over the Taiwan region, Atmos. Chem. Phys., 21, 17433–17451, https://doi.org/10.5194/acp-21-17433-2021, 2021.
Zhao, Y., Yue, X., Cao, Y., Zhu, J., Tian, C., Zhou, H., Chen, Y., Hu, Y., Fu, W., and Zhao, X.: Multi-model ensemble projection of the global dust cycle by the end of 21st century using the Coupled Model Intercomparison Project version 6 data, Atmos. Chem. Phys., 23, 7823–7838, https://doi.org/10.5194/acp-23-7823-2023, 2023.
Zhou, Y., Wu, T., Zhou, Y., Zhang, J., Zhang, F., Su, X., Jie, W., Zhao, H., Zhang, Y., and Wang, J.: Can global warming bring more dust?, Clim. Dyn., 61, 2693–2715, https://doi.org/10.1007/s00382-023-06706-w, 2023.
Zhu, J., Yang, Y., Wang, H., Gao, J., Liu, C., Wang, P., and Liao, H.: Impacts of projected changes in sea surface temperature on ozone pollution in China toward carbon neutrality, Sci. Total Environ., 915, 170024, https://doi.org/10.1016/j.scitotenv.2024.170024, 2024.