the Creative Commons Attribution 4.0 License.
the Creative Commons Attribution 4.0 License.
 | 06 Feb 2025
Evaluation of the WRF-Chem performance for the air pollutants over the United Arab Emirates
Yesobu Yarragunta
Ricardo Fonseca
Narendra Nelli
This study presents a comprehensive evaluation of the Weather Research and Forecasting model coupled with chemistry (WRF-Chem) in simulating meteorological parameters and concentrations of air pollutants across the United Arab Emirates (UAE) for June and December 2022, representing the contrasting summer and winter climatic conditions. The assessment of WRF-Chem performance involves comparisons with ground-based observations for meteorological parameters and satellite retrievals from the TROPOspheric Monitoring Instrument (TROPOMI) for gaseous pollutants and the Moderate Resolution Imaging Spectroradiometer (MODIS) for aerosols. The comparison with TROPOMI column concentrations demonstrates that WRF-Chem performs well in simulating the spatio-temporal patterns of total column CO and tropospheric column NO2 and O3, despite certain deficiencies in modelling tropospheric NO2 column concentrations. In particular, WRF-Chem shows a strong correlation with TROPOMI retrievals, with correlation coefficients ranging from 0.53 to 0.82 during summer and 0.40 to 0.69 during winter for these gaseous pollutants. The model tends to overestimate NO2 levels, with a higher discrepancy observed in summer (0.50 × 10¹⁵ molecules cm−2) compared to winter (0.18 × 10¹⁵ molecules cm−2). In comparison with TROPOMI-CO data, the discrepancies are more pronounced in winter, with an underestimation of 0.12 × 10¹⁸ molecules cm−2. Additionally, WRF-Chem consistently overestimates ozone levels in both seasons. WRF-Chem also exhibits a moderate correlation with both AERONET and MODIS aerosol optical depth (AOD) measurements. The correlation at Mezaira is 0.60, while a correlation of 0.65 is observed with MODIS AOD. However, the model tends to overestimate AOD, with a bias of 0.46 at Mezaira and 0.35 compared to MODIS AOD.
Meteorological evaluations reveal that the model generally overestimated air temperature at 2 m above ground (T2m) in summer (≤ 0.2 °C) and underestimated it in winter (∼ 3 °C), with correlation coefficients between 0.7 and 0.85. Temperature biases are linked to surface property representation and model physics. For wind speed at 10 m (WS10m), biases were within ± 0.5 m s−1, indicating good agreement, although overestimations suggest deficiencies in surface drag parameterization. The dry bias observed was consistent with other studies due to dry soil, inaccurate mesoscale circulation representation, and bias in forcing data. The model also overestimated incoming shortwave radiation by ∼ 30 W m−2 in December due to reduced cloud cover. Night-time cold and dry biases were observed due to more substantial wind speeds and cooler air advection. Comparisons with ERA5 reanalysis showed regional T2m variations with high correlation coefficients (0.97 in summer, 0.92 in winter). Both WRF-Chem and ERA5 displayed consistent seasonal patterns in the planetary boundary layer, correlating with temperature changes and indicating good overall model performance.
- Article
(4701 KB) - Full-text XML
-
Supplement
(1461 KB) - BibTeX
- EndNote


-
This is the first high-resolution WRF-Chem air quality modelling study over the United Arab Emirates (UAE).
-
WRF-Chem's ability to simulate meteorological parameters and pollutant levels over the UAE is assessed during summer and winter in 2022.
-
The model strongly correlated with TROPOMI satellite data, achieving correlation coefficients of 0.53–0.82 in summer and 0.40–0.69 in winter for gaseous pollutants.
-
There is lower model skill in simulating tropospheric NO2 columns, in contrast to the more accurate modelling of total CO and tropospheric O3 columns, particularly in summer.
-
WRF-Chem demonstrated a moderate correlation with AERONET and MODIS for AOD during the summer, with correlation coefficients of 0.60 and 0.65, respectively.
-
Meteorological analysis revealed a tendency to overestimate surface temperature by 0.2 °C in summer and underestimate it by 3 °C in winter across land regions. Surface wind speed is overestimated by 0.1–0.5 m s−1 in both seasons across various regimes.
The United Arab Emirates (UAE), a federation of seven emirates, has undergone rapid urbanization and industrialization over the last 5 decades, which has had a profound impact on its air quality (Ramadan, 2015). The major factors affecting air quality in the UAE include emissions from industrial activities; vehicular traffic; construction projects (Teixido et al., 2021); and occasionally, natural phenomena such as dust storms, which are quite prevalent in the region due to its desert climate (Environment Agency – Abu Dhabi, 2018; Francis et al., 2020, 2022b; Karagulian et al., 2019). The rapid economic growth of the UAE, especially in cities like Dubai and Abu Dhabi, has led to a surge in energy demand and water, the latter obtained from desalination and cloud seeding activities (Wehbe et al., 2023), largely met through the burning of fossil fuels (Shahbaz et al., 2014). This has resulted in increased emissions of pollutants like oxides of nitrogen (NOx), sulfur dioxide (SO2), particulate matter (PM), and volatile organic compounds (VOCs). Moreover, the heavy traffic in urban areas contributes to the elevated levels of ground-level ozone and particulate pollution (Abuelgasim and Farahat, 2020; Li et al., 2010). Understanding the dynamics of air quality in the UAE involves considering both the environmental challenges posed by rapid development and the steps being taken to mitigate these impacts. The pursuit of balancing economic growth with environmental sustainability is central to this discourse. This area of study not only is vital for ensuring the health and well-being of the population but also plays a crucial role in the UAE's vision for a sustainable future.
The swift urban expansion in the UAE, which is expected to continue in the coming decades, could intensify air pollution sources. With surface observations sparse in this region, satellite remote sensing becomes a crucial method for air quality monitoring (Chudnovsky et al., 2014; Fonseca and Francis, 2023; Francis et al., 2021). What is more, satellite measurements themselves fall short in clarifying the different atmospheric processes responsible for peak pollution levels. Consequently, integrating chemistry transport models with satellite-derived and ground-based observations can significantly improve our understanding of pollutant emissions, distribution, transport, and transformation in the targeted regions (Eltahan et al., 2018; Li et al., 2018; Yarragunta et al., 2020; Yin et al., 2021). Air quality (AQ) modelling is dedicated to unravelling the complicated aspects of atmospheric chemistry and transport across both global and regional levels, as explored in numerous studies conducted around the world (Emmons et al., 2010; Kumar et al., 2011, 2018; Tie et al., 2001; Yarragunta et al., 2019, 2020, 2021). Despite facing limitations due to the often low spatial and temporal resolution of observational data, AQ models effectively generate detailed air quality information for remote regions (e.g. Guo et al., 2024a). They predict the formation and removal of air pollutants and facilitate a thorough examination of the transport and photochemical transformation of trace gases following their emission into the atmosphere (Archer-Nicholls et al., 2015; Georgiou et al., 2018; Nhu et al., 2021; Sicard et al., 2021). They are also employed globally for operational air quality forecasting (Jena et al., 2021; Koo et al., 2012; Kumar et al., 2012, 2021; Srinivas et al., 2016; Zhang et al., 2012). Air quality models are categorized into two types: “fully coupled” models, which integrate interactions between chemistry and meteorology, and “offline” models, where chemistry and meteorology simulations are conducted independently (Gao and Zhou, 2024). Some state-of-the-art AQ models include the Weather Research and Forecasting (WRF) model coupled with chemistry (WRF-Chem; Grell et al., 2005; Skamarock et al., 2008), WRF-Chem-MADRID (Model of Aerosol Dynamics, Reaction, Ionization and Dissolution; Zhang et al., 2010), CESM2 (Community Earth System Model version 2; Emmons et al., 2020), CHIMERE (Menut et al., 2021), LOTOS-EUROS(v2.0) (Long Term Ozone Simulation European Operational Smog; Manders et al., 2017), and COSMO/MESSy (Consortium for Small-scale Modelling/Modular Earth Submodel System; Kerkweg and Jöckel, 2012). However, before using these AQ models for operational or research applications, it is crucial to conduct thorough evaluations to assess the quality of their predictions. The AQ model chosen for the current study is WRF-Chem with its foundational meteorological component, WRF. WRF-Chem has been used for research studies in the Arabian Peninsula (Parajuli et al., 2019, 2023, 2022), with the meteorological component optimized for simulations over the region (Chaouch et al., 2017; Nelli et al., 2020; Abida et al., 2022; Fonseca et al. 2020, 2021, 2022a).
The majority of studies conducted in the UAE and similar arid regions have primarily focused on evaluation of meteorological parameter including temperature, humidity, wind, and solar radiation (Parajuli et al., 2019; Nelli et al., 2020; Fonseca et al., 2020, 2021), with a few others investigating particulate matter (PM) dynamics, especially mineral dust. For instance, Ukhov et al. (2021) noted inaccuracies in the WRF-Chem model related to the commonly used bulk Goddard Chemistry Aerosol Radiation and Transport (GOCART; Chin et al., 2002) aerosol module, affecting PM2.5 and PM10 diagnostics. Karagulian et al. (2019) highlighted the effectiveness of integrating WRF-Chem model simulations with satellite and ground observations to understand and predict the impact of severe dust storms on air quality. Karumuri et al. (2022) reported significant air quality changes due to COVID-19 lockdown measures, with reduced trace gas concentrations but increased particulate matter from dust activities, the latter stressed by Francis et al. (2022a), who attributed it to changes in the atmospheric circulation. Moreover, Parajuli et al. (2022, 2023) utilized high-resolution WRF-Chem simulations and advanced aerosol schemes to analyse the dust and rainfall dynamics, providing insights into the direct and indirect effects of dust on rainfall, which aids in better regional water resource planning through accurate rainfall predictions. In particular, while through indirect effects dust promotes precipitation provided there is sufficient moisture for both normal and extreme rainfall events, the dust direct effects on precipitation shift from negative in normal rainfall events (weaker sea breeze arising from surface cooling) to positive in extreme events (smaller effects on the sea breeze). Zhang et al. (2024) stressed the two-way interaction between dust aerosols and the planetary boundary layer (PBL) dynamics: aerosols directly impact the PBL structure through direct and indirect effects, while the modified PBL characteristics and low-level circulation modulate aerosol processes. All the aforementioned studies focus on dust aerosols; there is no assessment to date of the model performance for the simulation of gaseous pollutants over the region. This is crucial, given the complex dynamics between anthropogenic and natural factors in air quality management and the necessity of tailored model configurations for accurate environmental assessments in arid regions.
This study represents the first comprehensive evaluation of the WRF-Chem model in the Arabian Peninsula, with a focus on the UAE, a country that is representative of the countries in the region, specifically examining concentrations of air pollutants along with crucial meteorological parameters relevant to air quality studies. The primary objective of this study is twofold:
-
Evaluate the WRF-Chem's ability to replicate meteorological conditions. This involves comparing the model's simulation of temperature, wind speed, relative humidity, downward shortwave radiation, and boundary layer height against ground-based observations and data from the European Centre for Medium-Range Weather Forecasting (ECMWF) fifth reanalysis product, ERA5 (Hersbach et al., 2020).
-
Assess the model's performance in simulating concentrations of key gaseous pollutants, specifically NO2, O3, and CO, which are prevalent in the region (Teixido et al., 2021), against data from the TROPOspheric Monitoring Instrument (TROPOMI; Veefkind et al., 2012) on board the Sentinel-5 Precursor (S5P) satellite. Additionally, aerosol optical depth (AOD) at 550 nm from AERONET and MODIS satellite observations is used to evaluate the model's skill in simulating aerosol concentrations.
The structure of the paper is as follows. Section 2 describes the configuration of the WRF-Chem considered in this work. Section 3 elaborates on the methodology and datasets used in this study. Section 4 provides a comprehensive assessment of the model's simulated data against observational datasets and reanalysis and satellite-derived products. Section 5 concludes by outlining the main findings.
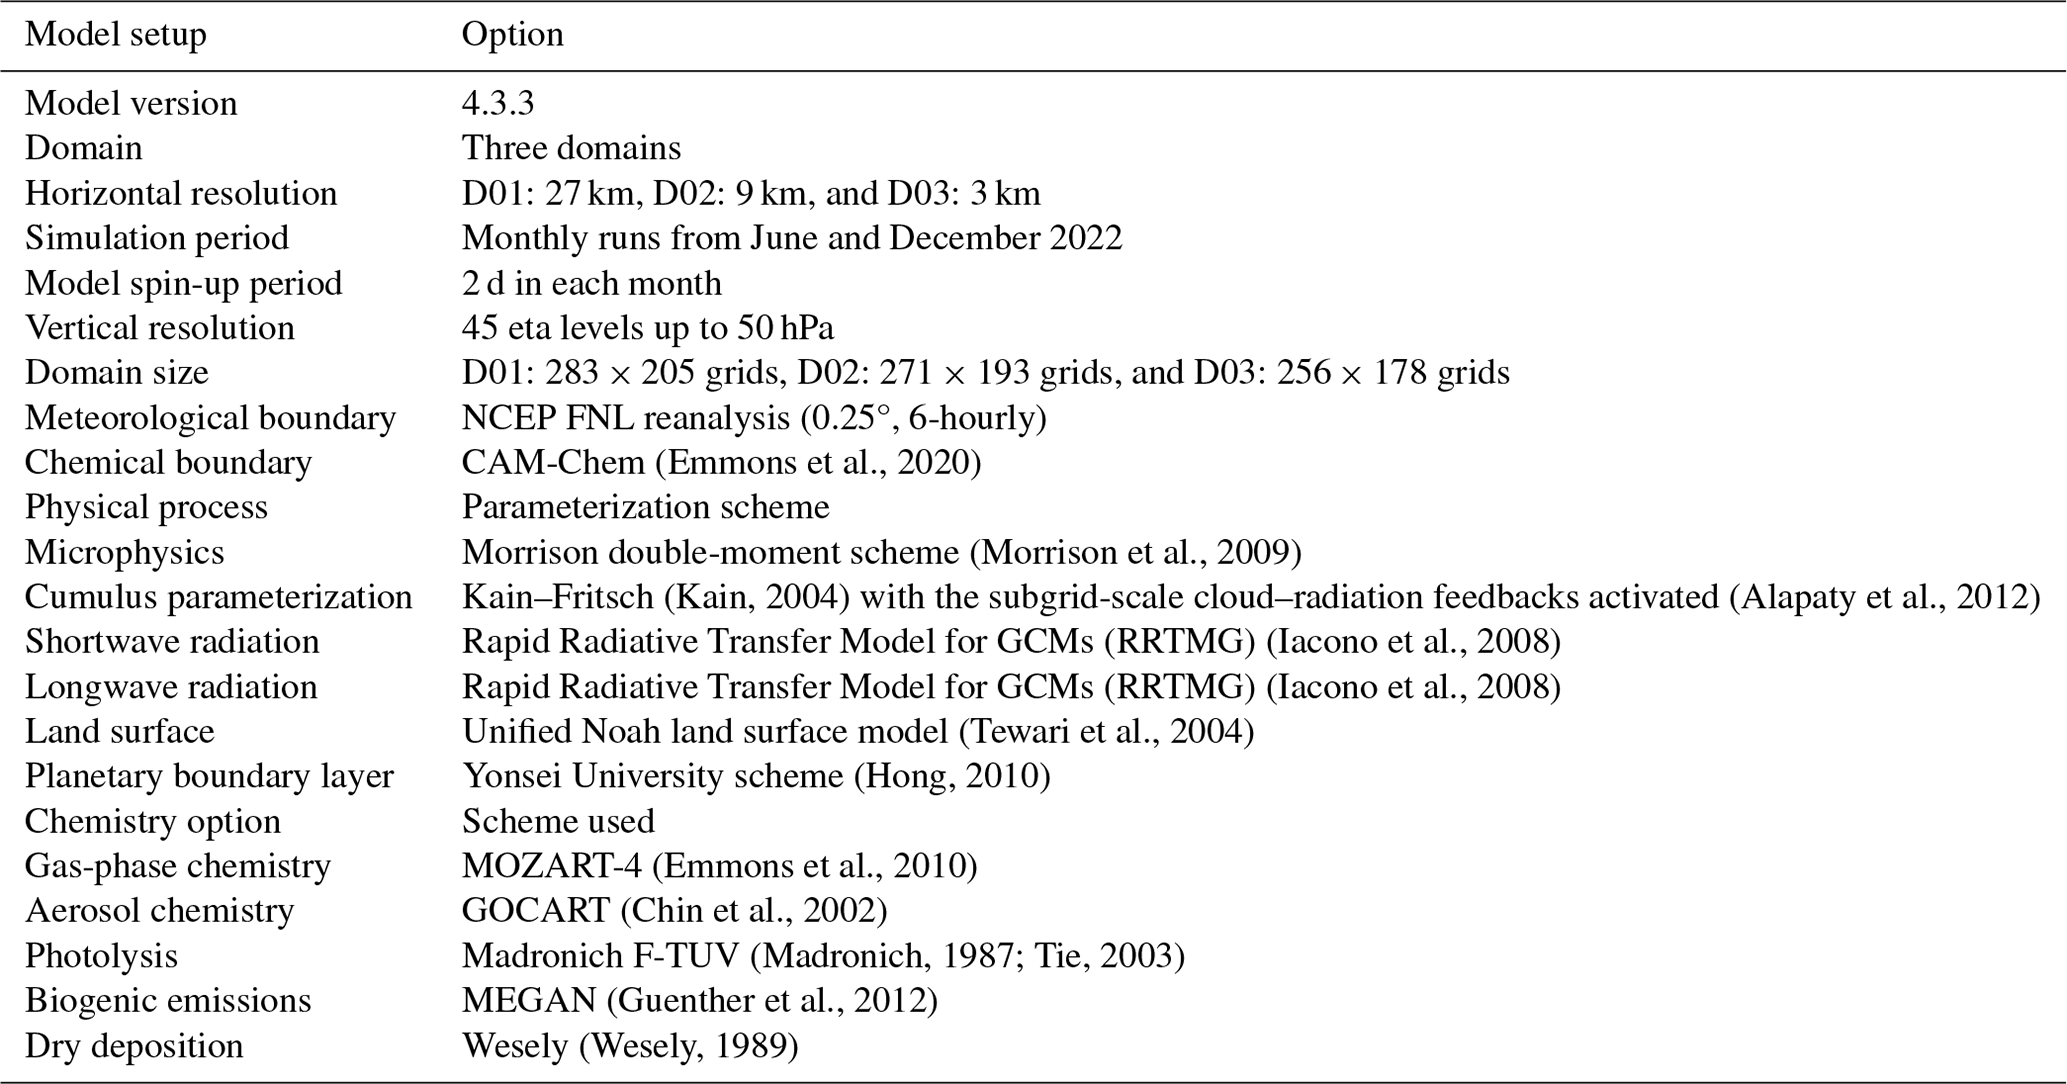
WRF-Chem version 4.3.1 is employed to simulate the atmospheric conditions and transport of pollutants in the UAE. WRF-Chem is a mesoscale regional chemistry transport model, developed by the National Oceanic and Atmospheric Administration (NOAA) Earth System Research Laboratory (ESRL), with contributions from the global science community. In WRF-Chem, the air quality and meteorological components are predicted simultaneously using the same grid, transport, time step, and sub-grid scale physics. A detailed description of the model is found in Grell et al. (2005), Skamarock et al. (2008), and Powers et al. (2017). The physics schemes employed in the simulations are the Rapid Radiative Transfer Model for Global Circulation Models (RRTMG) for radiation parameterization of both short- and longwave radiation (Iacono et al., 2008), the cloud microphysics is represented by the Morrison two-moment scheme (Morrison et al., 2009), and the Kain–Fritsch scheme is used for convective parameterization (Kain, 2004), with the subgrid-scale cloud feedback to radiation switched on (Alapaty et al., 2012). The Unified Noah model is used to represent the land surface model (Tewari et al., 2004), with an improved representation of soil texture and land use–land cover (LULC) over the UAE (Temimi et al., 2020b). The boundary layer dynamics are represented by the Yonsei University (YSU) scheme (Hong, 2010). The chosen physics schemes are listed in Table 1. The simulated mesoscale meteorology is kept in line with the analysed meteorology through spectral nudging to the National Centers for Environmental Prediction (NCEP) Global Forecast System (GFS) analyses used to drive the model, in an attempt to limit errors in the mesoscale transport. During the simulations, horizontal and vertical wind, potential temperature, and water vapour mixing ratio are nudged to GFS analyses in all model layers above the planetary boundary layer on a timescale of 6 h for scales above ∼ 1000 km. Meteorological conditions were initialized by NCEP GFS 6-hourly analyses at 0.25° resolution.
This study utilized the Model for Ozone and Related Chemical Tracers, version 4 (MOZART-4) chemical mechanism for calculating gas-phase chemistry, which includes 81 chemical species with 159 gas-phase reactions and 38 photolysis processes (Emmons et al., 2010). Aerosol chemistry is represented by the GOCART (Chin et al., 2002) module, along with the Tropospheric, Ultraviolet and Visible (TUV) full photolysis scheme (Madronich, 1987; Tie, 2003), which deploys climatological O3 and O2 columns. Dry deposition is calculated using Wesely (1989). Anthropogenic emissions are taken from the Emission Database for Global Atmospheric Research (EDGAR) version 8.1 at a 0.1 × 0.1° horizontal resolution for 2022 (Crippa et al., 2020), consistent with the simulation period. Emissions include SO2, NOx, CO, non-methane volatile organic compounds (NMVOCs), NH3, black carbon (BC), and organic carbon (OC). Biogenic emissions are calculated online by the Model of Emissions of Gases and Aerosol from Nature (MEGAN; Guenther et al., 2012). The chemistry boundary conditions (BCs) used in domain D01 and the initial conditions (ICs) for all domains in the WRF-Chem simulations are extracted from CAM-Chem model forecasts (Emmons et al., 2020). In this work, we run the WRF-Chem model on the three nested domains with horizontal resolutions of 27, 9, and 3 km corresponding to 283 × 205, 271 × 193, and 256 × 178 grid points, respectively. In the vertical, there are 45 layers, with the lowest model level at about 27 m above the surface. The outermost domain covers most of the Middle East and the surrounding region, while the innermost domain covers the entire UAE (Fig. 1a). The analysis in this research article exclusively utilizes results from the inner domain (D03). Figure 1b shows the spatial distribution of UAE airport stations, the WInd-Blown Sand Experiment (WISE)-UAE observational site, and AERONET locations for AOD measurements.
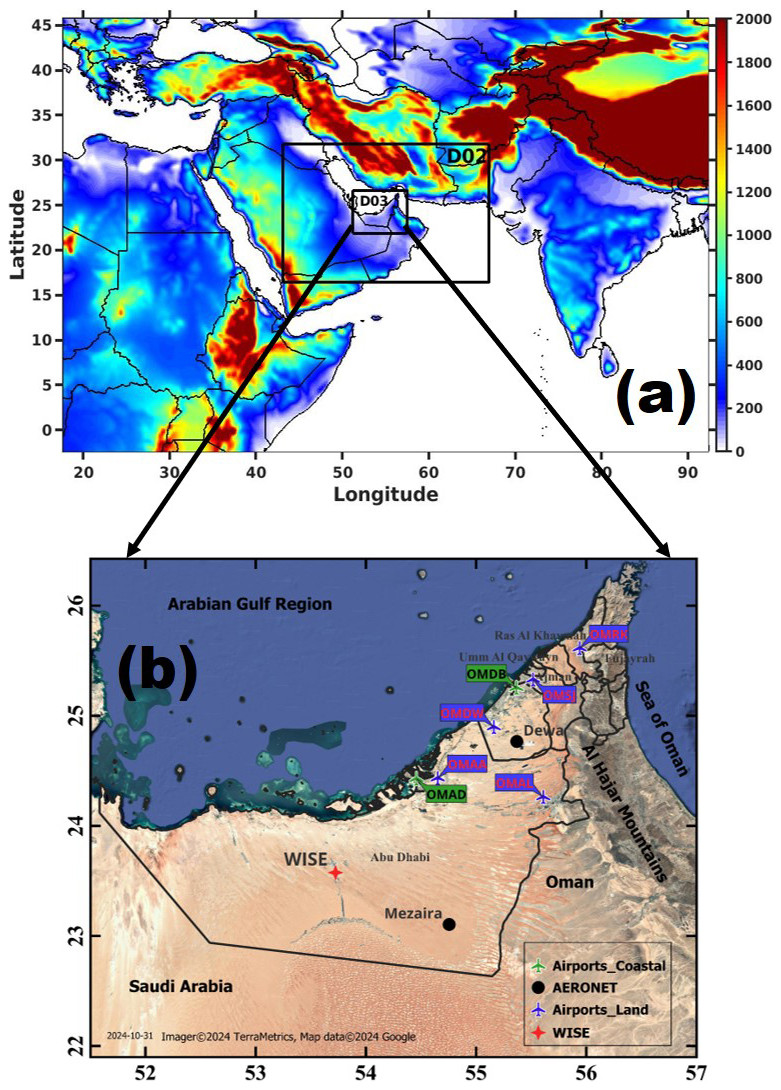
Figure 1Model configuration: (a) the WRF domain configuration consists of three telescoping nests, with the outermost boundaries denoting the parent grid (D01). D02 and D03 are the nested domains. Panel (b) is a zoomed-in view of the innermost domain (D03), showing the spatial distribution of the seven automatic weather stations operated in airports (land stations (5) are denoted in blue, and coastal stations (2) are represented by green) along with the WInd-blown Sand Experiment (WISE)-United Arab Emirates (UAE) site by the red star, and black dots represent two AERONET stations (Mezaira and Dewa). The shading in (a) represents the orography (m). Further details about the stations are given in Table S1.
The WRF-Chem simulation is driven by anthropogenic emissions from the EDGAR database, version 8.1, at a horizontal resolution of 0.1° × 0.1° for the year 2022 (Crippa et al., 2020). The EDGAR emission inventory accounts for day-to-day variability (e.g. weekday versus weekend) and hourly fluctuations (diurnal cycle) of anthropogenic emissions, as detailed by Crippa et al. (2020). For example, road transport emissions are generally lower at night and higher during daytime hours, while agricultural emissions tend to peak during specific months. To achieve an hourly resolution for the model, we scaled the coarsely resolved emission data using predefined hourly, daily, and monthly scaling factors (temporal profiles). The initial temporal profiles are derived from the work of Olivier et al. (2003) and have been refined to place greater emphasis on the most relevant emission sectors for each pollutant within the study region. According to the Environment Agency – Abu Dhabi (2018), the primary sectors contributing to emissions include traffic, the power industry, energy used in buildings, and the manufacturing industry. Using these optimized emission profiles, emissions for NO2 and CO were dynamically adjusted during the model simulations to better capture local emission patterns and their variability. However, the results indicated that emissions for NO2 and CO are underestimated by EDGAR. Although WRF-Chem simulations incorporate temporal profiles of emissions, the impact of these emission estimates on daily variations could not be fully assessed in this study due to the lack of ground-based measurements and the limited temporal resolution of satellite data. MODIS and TROPOMI satellites each pass over the study area only once per day, restricting the ability to capture daily variations comprehensively. Consequently, this article is limited in its assessment of daily emission variability. Moreover, WRF-Chem supports the vertical distribution of trace gas emissions, which is particularly useful for capturing emissions released at elevated altitudes, such as those from combustion stacks. Accurately representing the vertical distribution of emissions is important for simulating atmospheric processes. However, incorporating this complexity would likely provide minimal improvements in model accuracy for regions where surface emissions dominate and where observational constraints are largely limited to coarse-vertical-resolution or surface-level data. Therefore, in this study, all emissions were injected into the lowest model layer to align with the observational data characteristics and the typical conditions in the study area.
3.1 Meteorology observations
In this study, meteorological data from eight automatic weather stations (AWSs) operated at UAE airports are utilized to assess the WRF-Chem air temperature at 2 m above ground (T2m), wind speed at 10 m (WS10m), and relative humidity at 2 m above ground (RH2m) forecasts during June and December 2022. The spatial distribution of the stations across the UAE is illustrated in Fig. 1b (refer to Table S1 in the Supplement for more details). These locations are categorically divided into two regions – land stations (station code OMAA, OMDW, OMAL, OMSJ, OMRK) and coastal stations (station code: OMAD, OMDB) – following the criteria outlined in Branch et al. (2021). Subsequent analyses are based on these two primary categories, with the land region comprising five stations and the coastal region comprising 2 stations (Fig. 1b). In addition to the UAE airport data, we utilized meteorological data from the WInd-Blown Sand Experiment (WISE)-UAE measurements. The WISE-UAE experiment started on 25 July 2022 at Madinat Zayed (23.5761° N, 53.7242° E; elevation: 119 m; Fig. 1b), located 120 km southwest of Abu Dhabi, UAE. An overview of the instrumentation and experiment site used during WISE-UAE is provided in Nelli et al. (2024a, b). This study uses WS10m, T2m, RH2m, and downward shortwave radiation flux (SW) from these measurements to validate the WRF-Chem simulations for December 2022. The specifications and accuracies of the instruments used in WISE-UAE are outlined in detail, along with the stringent quality control procedures applied, as described in Nelli et al. (2024a, b, c).
3.2 AERONET
The Aerosol Robotic Network (AERONET) programme is a global federation of ground-based sun photometers comprising more than 400 stations worldwide (Holben et al., 1998). AERONET utilizes multiple bands ranging from UV to near-IR wavelengths to measure spectral sun irradiance and sky radiances, from which aerosol optical depth (AOD) at 550 nm and other aerosol properties are derived. A detailed description of the AERONET retrievals is provided in Holben et al. (1998). This study uses Level 2.0 AOD data at 550 nm from Mezaira for June and from Dewa for December 2022, with an hourly resolution. It is important to note that AOD retrieved from AERONET is accurate to within 0.01 (Dubovik et al., 2000).
3.3 ERA-5 reanalysis data
The fifth-generation ECMWF reanalysis, known as ERA-5 (Hersbach et al., 2020), represents a significant advancement over its predecessor, ERA-Interim, introduced by Dee et al. (2011). ERA-5 incorporates a sophisticated four-dimensional variational (4D-Var) data assimilation method, utilizing the 41r2 cycle of the Integrated Forecast System (IFS). This system is enhanced by integrating a soil and an ocean wave model, offering a comprehensive approach to climate data analysis. We accessed ERA-5 data through the Copernicus Climate Change Service Climate Data Store (CDS) for this research. The dataset provides atmospheric observations across 137 hybrid vertical levels, with raw model data interpolated onto 37 distinct pressure levels. These levels span 1000 hPa, close to the Earth's surface, up to 1 hPa, reaching altitudes of approximately 80 km. Further details on the ERA-5 dataset are available in Dee et al. (2011) and Hersbach et al. (2020). Our study utilizes explicitly hourly data for a selection of meteorological parameters: T2m, WS10m, SW, and planetary boundary layer height (PBL), for June and December 2022.
3.4 Satellite-borne observations: TROPOMI
Launched by the European Space Agency (ESA) on 13 October 2017, the TROPOMI instrument is aboard the S5P satellite, operating in a near-polar sun-synchronous orbit. Positioned at an altitude of 817 km, the S5P satellite crosses the Equator at a local solar time of 13:30, boasting a wide swath of approximately 2600 km and providing daily global coverage. TROPOMI features four distinct spectrometers that measure the radiation in the ultraviolet (UV) and UV–visible (UV–VIS) range (270 to 500 nm), near-infrared (NIR) range (675 to 775 nm), and shortwave infrared (SWIR) range (2305 to 2385 nm) spectral bands (Veefkind et al., 2012). Notably, the last two spectral bands, NIR and SWIR, are newly introduced in TROPOMI compared to its predecessor OMI (Ozone Monitoring Instrument). TROPOMI's data products encompass daily observations of trace gases, including CO, O3, NO2, CH4, HCHO, aerosols, and cloud properties. This study utilized daily tropospheric NO2, total CO columns, and ozone profile level 2 products downloaded from the GES DISC website (https://disc.gsfc.nasa.gov/, last access: 3 March 2022) for the period of June and December 2022. The specific datasets employed for the present study include S5P_OFFL_L2__O3__PR for O3 (ESA, 2021c), S5P_OFFL_L2__CO for CO (ESA, 2021b), and S5P_OFFL_L2__NO2 for NO2 (ESA, 2021a), covering the study region bounded by longitudes [51, 58°] and latitudes [21, 27°]. Further details on each product, including the retrieval algorithms and validation results, are summarized in the following section.
TROPOMI retrieval of NO2 columns is derived using solar radiation measurements backscattered by the UV–VIS spectrometer in the wavelength range of 405–465 nm and provides total and tropospheric NO2 vertical column density with a near-nadir resolution of 7 × 3.5 km. The total NO2 slant column density (SCD) is retrieved from the measured solar irradiance spectra using the differential optical absorption spectroscopy (DOAS) method. Tropospheric and stratospheric slant column densities are separated from SCD by a data assimilation system based on the chemistry transport model V5 (TM5-MP). Afterwards, they are converted to vertical column densities (VCDs) with the help of a lookup table of altitude-dependent air mass factors (AMFs) and information on the vertical distribution of NO2 from the TM5-MP a priori profile with a horizontal resolution of 1° × 1° and a time step of 30 min (Boersma et al., 2018; Van Geffen et al., 2023). The TROPOMI NO2 product has been extensively evaluated using ground-based and aircraft observations and is found to have a high correlation and low bias of less than 30 % with respect to in situ measurements (Griffin et al., 2019; Ialongo et al., 2020). We used both reprocessed (RPRO) and offline (OFFL) TROPOMI NO2 data files from the most recent processor versions depending on availability for a given day of observations. Additionally, there is another NO2 product available in near-real time (NRTI). NRTI data files are generated using TM5-MP forecast data rather than analysis data, as with REPO and OFFL files (Van Geffen et al., 2023). The differences between the OFFL/REPO and NRTI NO2 products are generally very small (Ialongo et al. (2020) and references therein).
The Shortwave Infrared Carbon Monoxide Retrieval (SICOR) algorithm is used to retrieve CO total column densities from TROPOMI in the spectral range of 2305 to 2385 nm (Landgraf et al., 2016). The SICOR algorithm accounts for a profile-scaling approach that scales retrieved CO total column to the a priori reference profile. The a priori reference profiles are taken from the global chemistry transport model simulations of TM5-MP and vary based on the location, month and year (Krol et al., 2005). The detailed outline of all settings and other auxiliary datasets used for CO retrievals is given in Landgraf et al. (2016). This study limits the analysis to CO pixels corresponding to clear-sky conditions and mid-level clouds by filtering the data using the quality flag variable (qa_value). The scenes corresponding to qa_value > 0.5 are used in this current analysis as suggested in the ATBD (algorithm theoretical baseline document; Landgraf et al., 2016). In this present work, TROPOMI CO measurements for June and December 2022 have been analysed. Moreover, we use either the reprocessed (RPRO) or offline (OFFL) data files from the most recent processor versions depending on availability for a given day of observations. Wizenberg et al. (2021) compared global TROPOMI-retrieved CO total columns with corresponding ACE-FTS (Atmospheric Chemistry Experiment- Fourier transform spectrometer) columns for the period from November 2017 to May 2020 and found a small relative bias of −0.83 % with a correlation coefficient of 0.93 between two datasets. Similar results are also found between TROPOMI CO with corresponding CO fields from the ECMWF assimilation system: Borsdorff et al. (2018) reported a small mean difference between the two datasets of 3.2 % with a correlation coefficient of 0.97.
TROPOMI also provides ozone profiles (5P_OFFL_L2__O3__PR) at 33 pressure levels with a horizontal resolution of 28×28 km. It measures radiances and irradiances in the ultraviolet wavelength of 270–330 nm and provides the ozone profile information. The optimal estimation (OE) algorithm is used to retrieve the ozone profile data. Before this stage, various pre-processing steps are applied to the measured spectra before the estimation of the ozone profile. The main process of the algorithm is the OE method, which combines the information from the measured spectra with the a priori information. The latter is based on climatology as described in Labow et al. (2015). The description of the various pre-processing steps performed to retrieve ozone profiles is presented in the Algorithm Theoretical Basis Document (Veefkind et al., 2023). The validation of TROPOMI-retrieved ozone profile data against the ground-based measurements reported a median bias of 0.3 % for OFFL/REPO products and 0.8 % for NRTI ozone products (Lambert et al., 2023). Our focus is specifically on the tropospheric ozone column due to its direct relevance to surface air quality. Total column ozone measurements are primarily influenced by stratospheric ozone, which accounts for approximately 90 % of the total column, while tropospheric ozone comprises only around 10 %. Given this, we have used ozone profile data from the surface to 100 hPa, designated as tropospheric ozone columns for this study and referred to as TROPOMI-O3, expressed in Dobson units (DU), where 1 DU = 2.69×10¹⁶ molecules cm−2.
3.5 Satellite-borne observations: MODIS
The Moderate Resolution Imaging Spectroradiometer (MODIS) sensor was launched into the polar sun-synchronous orbit at an altitude of 705 km aboard NASA's two Earth Observing System (EOS) satellites, Terra (February 2000) and Aqua (June 2002) (Kaufman et al., 1997; Remer et al., 2005). The Equator crossing times of two satellites were 10:30 LST for Terra and 13:30 LST for Aqua. The MODIS sensor has a swath of ∼ 2330 km and provides near-global coverage with a temporal resolution of 1–2 d. The sensor measures the reflected solar radiation from the Earth's atmosphere and the surface as well as emitted thermal radiation at 36 spectral bands from 0.41 to 14 µm with three spatial resolutions: 250, 500, and 1 km. Seven of these bands operating in the spectral range of 0.415–2.155 µm can effectively retrieve the AOD over land and ocean (Levy et al., 2013; Hsu et al., 2013; Sayer et al., 2014a, b, 2015). The MODIS retrieval algorithm is based on the lookup table approach with a predefined set of aerosol types, loadings, and geometries (Floutsi et al., 2016). A comprehensive description of retrieval algorithms and details of MODIS instrument is found elsewhere (Remer et al., 2008; Levy et al., 2013; Hsu et al., 2013). MODIS AOD retrieval algorithms have been substantially validated against in situ and/or other remote sensing datasets from regional to global scales and are updated periodically (Remer et al., 2008; Li et al., 2009). The uncertainty of AOD retrievals is estimated to be ±0.05 ± 0.20 × AOD over land and ±0.03 ± 0.15 × AOD over ocean (Remer et al., 2005, 2008). The present study utilized Level 2 MODIS aerosol products (Collection 6.1) obtained from the Atmosphere Archive and Distribution System (LAADS DAAC). These products consist of 5 min satellite swaths with a spatial resolution of 10 km, covering the period of June and December 2022 (Levy et al., 2015).
3.6 Satellite data processing
In order to quantitatively compare the WRF-Chem simulations with satellite measurements, the model outputs must be processed using the appropriate method as described in the literature (Kumar et al., 2012). Direct comparison between satellite retrievals and model outputs is not recommended, as satellite measurements depend on column averaging kernels (AKs) and a priori profiles. The AK vector represents the vertical sensitivity of the retrieved column relative to the true vertical profile of the target variable in the atmosphere. It indicates how changes in the true atmospheric profile at different vertical levels influence the retrieved column values, allowing for a more accurate comparison between model simulations and TROPOMI data by convolving the model outputs with the AKs. The typical AK vectors are plotted over the WISE-UAE location to know the sensitivity of AK at different pressure levels (Fig. S7 in the Supplement)
The column density from the WRF-Chem model is re-gridded to match the TROPOMI instrument's grids and is vertically interpolated to the TROPOMI pressure levels before it is multiplied by the AK. This treatment of the WRF-Chem-simulated profile with the column averaging kernels allows for a comparison that is independent of the chemical transport model (CTM) a priori assumptions and the vertical sensitivity of the retrieval process; therefore, it can be directly compared with the TROPOMI-derived tropospheric column of NO2. The TROPOMI-NO2 and TROPOMI-CO products also provide a column averaging kernel matrix. In this case the column AK averaging kernel accounts for the vertical distribution and sensitivity of the measurements, as classically done by Borsdorff et al. (2014) as
where Xtrue is the model simulation profile of trace gas, Xret is the retrieved profile or smoothed model profile, ex represents the error on the retrieved trace gas profile, and Xapriori is the a priori information provided in the TROPOMI dataset. For TROPOMI-NO2 data, the contribution of the a priori profile and error on the retrieved profile can be eliminated, as explained in Borsdorff et al. (2014). In particular, Eq. (1) simplifies to
where Xtrue represents the WRF-Chem simulation profile for both NO2 and CO, AK represents the averaging kernel information provided in the TROPOMI dataset for NO2 and CO, and Xret represents the smoothed model profile for NO2 and CO.
For validation of ozone, we have used the TROPOMI ozone profile level 2 data product 5P_OFFL_L2__O3__PR that provides the ozone concentrations at 33 pressure levels. This data product also includes the a priori information and column averaging kernel for each pressure level. In order to compare our model profile with the one given by this dataset, the model output is horizontally and vertically interpolated to TROPOMI grids and vertical levels. The final model profile was calculated by Eq. (3):
where Xtrue represents WRF-Chem simulation profile for O3, AK represents the averaging kernel information provided in the TROPOMI data, Xret represents smoothed model profile for O3 and Xapriori is the a priori information provided in the TROPOMI data. Since the highest vertical level in WRF-Chem-simulated trace gas concentration is 50 hPa, the remaining vertical layers of ozone and CO are made equal to the a priori concentration of respective trace gases as described by ATBD (Landgraf et al., 2016).
3.7 Evaluation methodology
Meteorological parameters from the WRF-Chem model are extracted for the grid points closest to the surface observation sites of the AWS. As noted before, the meteorological parameters are categorized and averaged for land and marine regions separately for the regional analysis. To enable the comparison of atmospheric column data from the TROPOMI satellite retrievals with WRF-Chem outputs, the data must undergo smoothing through an appropriate method described in Sect. 3.4, as direct comparison between satellite retrievals and simulations is not feasible due to discrepancies highlighted in previous literature. Additionally, and owing to the spatial resolution differences between WRF-Chem and ERA5 datasets, it is necessary to remap the model data to the ERA5 grids for accurate comparison. A wide range of statistical parameters is available for evaluating model simulations. In this study, we employed statistical skill scores including the Pearson correlation coefficient (r), the mean bias (MB), the root mean square error (RMSE), and the mean absolute error (MAE), which have been extensively discussed and applied in similar contexts (Fonseca et al., 2021; Ivatt and Evans, 2020; Temimi et al., 2020b).
The following equations (Eqs. 4 to 7) are used to calculate these statistical matrixes in the present study:
where Oi denotes the ith observation, Mi represents the corresponding WRF-Chem-model-simulated value, and N is the number of model and observation pairs. and are the model and observational means (i.e. average of 1–30 June and 1–31 December), respectively. The correlation coefficient (r) is an indication of the phase agreement between the modelled and observed time series. The RMSE measures the average error in the model predictions, while the MAE determines the mean error between the model forecasts and observations regardless of whether it is an under- or overestimate. The MB is a measure of the systematic error and gives information as to whether the model is over- or underpredicting the corresponding observed values.
4.1 Model performance for key meteorological variables
The capability of the WRF-Chem model to reproduce realistic spatio-temporal patterns of key meteorological variables has been assessed by comparing the model outputs to observational reanalysis data for June and December 2022, representing contrasting summer and winter conditions over the UAE. Evaluating the accuracy of WRF-Chem's meteorological forecasts in the study area is essential before applying the model forecasts to air quality assessments. Accordingly, we compared the model predictions for T2m, RH2m, WS10m, and SW against ground-based observations at seven airport stations and in situ measurements from the WISE-UAE field campaign (details in Table S1). Additionally, the boundary layer height is evaluated against ERA5 reanalysis data, which offers a spatial resolution of approximately 28 km, higher than the other currently available reanalysis datasets. Detailed results of this analysis are presented in the Supplement, with key findings summarized here to support the paper's discussion. The aforementioned meteorological parameters are selected, given their critical role in influencing air pollutant behaviour (Ritter et al., 2013).
4.1.1 Evaluation against in situ observations
The WRF-Chem model evaluation against observations across the seven meteorological stations (Table S1) at the UAE airports for T2m, RH2m, and WS10m during June and December 2022 reveals a close agreement between the modelled and observed values (Table S2). The cold bias reported by several studies, including Branch et al. (2021), Temimi et al. (2020a), and Abida et al. (2022), which occurs primarily at night, is reduced in the WRF-Chem simulations presented here. In fact, and for the June month, the air temperature bias is positive, ∼ 0.2 °C. This stresses the importance of properly simulating the observed aerosol loading in this hyper arid region. Deficiencies in the land surface model and radiation schemes and in the representation of the surface properties, particularly the surface emissivity that may be overestimated in the model (Parajuli et al., 2023), can also account for this discrepancy. The WRF-Chem model also exhibits a noteworthy dry bias in this region, linked to an incorrect simulation of the soil moisture and the mesoscale land–sea breeze circulation, which is present in both seasons. The strength of the near-surface wind speed tends to be overestimated in WRF-Chem in the UAE by about 1–3 m s−1, which has been attributed to an incorrect representation of its subgrid-scale variability and deficiencies in the surface drag parameterization scheme (Nelli et al., 2020; Fonseca et al., 2020; Temimi et al., 2020b). Here, the biases are much smaller, within 0.5 m s−1. This, together with the improved representation of the observed air temperature, reflects an overall improved simulation of the boundary layer dynamics in the model.
The WRF-Chem model evaluation against WISE-UAE measurements (detailed in Table S3 and Fig. S1) reveals a comparable performance to that seen concerning the seven airport stations. SW observations are also available for this site. An evaluation against the WRF-Chem values reveals that the model overestimates the incoming shortwave radiation flux by about 30 W m−2 for December, which can be attributed to reduced cloud cover, a known WRF deficiency (Wehbe et al., 2019; Fonseca et al., 2020, 2022a). An inspection of the diurnal cycle revealed that the cold (typically by 2–3 °C) and dry (by about 20 %) biases occur mostly at night, when the wind speed in the model is higher than that observed, suggesting increased advection of cooler and drier desert air into the site.
4.1.2 Evaluation against ERA5 reanalysis data
The WRF-Chem model predictions are also evaluated against ERA5 reanalysis data for T2m, WS10m, SW, and PBL during June and December 2022. The air temperature biases are within 1 °C, with a cold bias present in both months, more pronounced over inland areas, with a correlation coefficient of 0.9 (Fig. S2). It is important to note that ERA5 overestimates the temperature at night and underestimates it during the day, typically by 1–2 °C in the whole country for all seasons (Nelli et al., 2024a), meaning the cold bias shown by WRF-Chem does not necessarily indicate a poorer performance. The skill scores for WS10m and SW are also similar to those estimated concerning the station observations and the WISE-UAE field measurements. For the PBL height, the model reproduces its spatial and seasonal variations (Fig. S3), largely driven by the temperature seasonal cycle (see Fig. S2; Basha et al., 2019). The PBL height, and over land areas, ranges from 2400–2500 m in the summer during the day to less than 500 m in winter at night. Over the Arabian Gulf, the PBL is deeper in the winter months in both ERA-5 and WRF-Chem (800 m vs. 200 m), owing to stronger winds and enhanced turbulent mixing (Dai, 2024).
This comprehensive evaluation of the predicted meteorological parameters against those observed at seven UAE airport sites, the WISE-UAE experimental site, and ERA5 reanalysis data demonstrates that WRF-Chem reliably captures them, including their spatial and seasonal variations across the UAE. As WRF-Chem integrates meteorological and chemical processes, precise meteorological simulations are essential to ensure accurate chemical computations within the model domain.
4.2 Model performance for the gaseous pollutants
The study incorporates comparative assessments with satellite data from the TROPOMI instrument, including evaluations of the tropospheric column of NO2 (denoted as TROPOMI-NO2), total column CO (TROPOMI-CO), and tropospheric column ozone (TROPOMI-O3) for the corresponding periods within the UAE. The satellite overpass takes place daily at 13:30 local time; therefore, model simulations corresponding to this time are utilized here for comparison over the study area. After smoothing the model concentrations using the a priori and averaging kernel matrix, as detailed in Sect. 3.4, the results are compared with the corresponding TROPOMI products.
In the troposphere, nitrogen oxides (NOx= NO + NO2) are vital for ozone production and depletion processes in sunlight. Due to their relatively short lifespan, NOx concentrations are closely linked to emission sources, making them highly sensitive to inaccuracies in emission estimates compared to other pollutants. In our model setup, we adopt the recommendation of Emmons et al. (2010), assigning 10 % of NOx emissions as NO2. As a result, the model tends to underestimate TROPOMI NO2 levels, particularly in regions with high emission sources, such as urban centres. The Environment Agency – Abu Dhabi (2018) reported that oil and gas, road transport, and electricity generation are the primary sectors contributing to NOx total emissions, accounting for 42 %, 34 %, and 13 %, respectively, for the base year of 2015 in the emirate of Abu Dhabi. Figure 2 presents the average spatial distributions of absolute differences between the model-simulated and the TROPOMI-retrieved tropospheric column NO2, scatter plots, and histograms of relative frequency. The satellite retrievals indicate elevated levels of NO2 columns, exceeding 5×10¹⁵ molecules cm2, in densely populated industrial areas adjacent to the major cities of Dubai and Abu Dhabi in both summer and winter (Fig. S4). Conversely, lower NO2 values, less than 1.5×10¹⁵ molecules cm−2, are observed over the less urbanized areas. The higher columns are associated with significant economic development driven by a high demand in power generation and water desalination projects, which primarily depends on the combustion of fossil fuels (Abuelgasim and Farahat, 2020; Li et al., 2010). The model effectively reproduces the spatial distributions of NO2 during the summer and winter of 2022 as depicted in Fig. 2. Even though the biases are positive in rural areas, the observed column NO2 concentration is underestimated by up to 2×10¹⁵ molecules cm−2 in the heavily populated northeastern UAE, in particular around Ras Al Khaimah and Dubai (Fig. 2a), the sixth-largest city by population in the country and home to a global ceramic manufacturing company. This discrepancy suggests that anthropogenic and industrial emissions might be improperly represented in the EDGAR emission inventory, at least for the UAE. Challenges range from the incomplete characterization of emissions in source regions to the impact of model resolution on capturing sub-grid emission sources. Besides deficiencies in the emission sources, other reasons may explain the model's underperformance in this region. Hoshyaripour et al. (2016) found that the PBL is shallower and more stable at night when simulated with the YSU boundary layer scheme used in the WRF-Chem runs, resulting in a higher accumulation of NOx in the surface layers. As the evaluation conducted here against satellite observations is daily, an incorrect representation of the atmospheric dynamics will be reflected in the WRF-Chem predictions. Additionally, the existing model configuration does not include the formation of secondary aerosols, indicating a potential area for improvement in future versions. The absence of a vertical distribution of anthropogenic emissions in the model simulations also plays a pivotal role in these model discrepancies. The satellite-retrieved TROPOMI-NO2 averaged for the d03 is 1.1×10¹⁵ molecules cm−2 in summer and 1.03×10¹⁵ molecules cm−2 in winter, with the corresponding model-simulated column concentration of 1.6×10¹⁵ and 1.2×10¹⁵ molecules cm−2, respectively. The model demonstrated a moderate correlation with satellite-derived NO2 column measurements, achieving correlation coefficients of 0.59 for summer and 0.58 for winter (refer to Table 2). It tended to overestimate NO2 levels more in summer, with a discrepancy of 0.5×10¹⁵, compared to 0.2×10¹⁵ molecules cm−2 in winter. Moreover, the evaluation shows RMSE values of 0.2×10¹⁵ to 0.1×10¹⁵ molecules cm−2 and MAE values of 0.7×10¹⁵ to 0.5×10¹⁵ molecules cm−2 during the seasons. The frequency distributions in Fig. 2c and f illustrate the differences in NO2 concentrations between the WRF-Chem model and TROPOMI observations during summer and winter, respectively. In panel (c), the distribution of differences is entirely positive, indicating that the WRF-Chem model consistently overestimates NO2 concentrations compared to TROPOMI observations for the summer of 2022. In contrast, Fig. 2f shows both positive and negative differences, indicating that the WRF-Chem model exhibits a mix of overestimations and underestimations of NO2 concentrations in winter, although the majority of differences are still positive. This suggests a more variable alignment between WRF-Chem and TROPOMI-NO2 in winter, with a general tendency toward overestimation but occasional instances of underestimation.
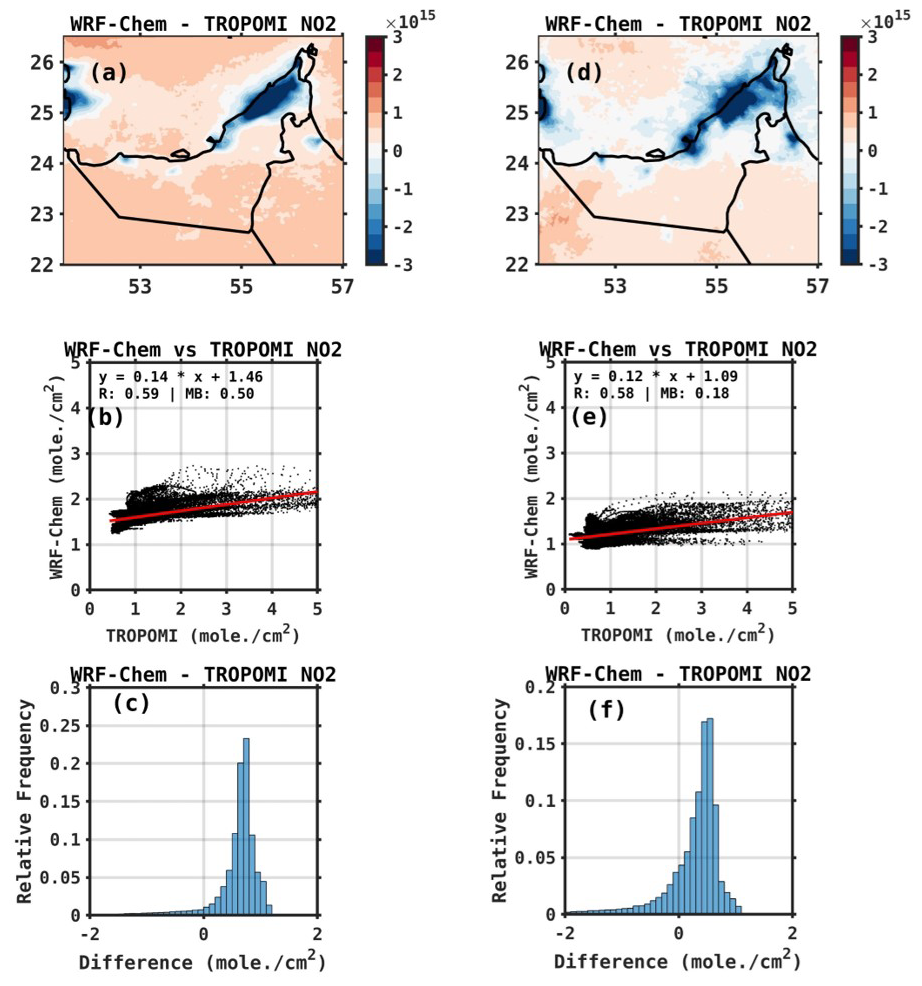
Figure 2Evaluation of WRF-Chem against satellite-derived NO2: the average difference between tropospheric column NO2 (×1015 molecules cm−2) from the TROPOMI satellite and simulated by WRF-Chem, for (a) June and (d) December 2022. Panels (b)–(e) and (c)–(f) are as (a) and (d) but show scatter plots and histograms of the differences, respectively.
In Fig. 3, the assessment of the model-simulated total column CO and the corresponding TROPOMI-retrieved values is presented. The statistical metrics comparing these datasets are provided in Table 2. Figure S5 shows the comparison of total column CO concentrations over the domain as observed by the TROPOMI satellite and simulated by the WRF-Chem model. Figure S5a and c display TROPOMI-CO for summer and winter, showing spatial variations in CO concentration across the region. High concentrations are found particularly over the northern areas, while lower concentrations are found the southern areas. Figure S5b and d illustrate corresponding WRF-Chem CO simulations for the same periods, providing a model-based estimate of CO distribution. The WRF-Chem model appears to capture the general spatial patterns observed by TROPOMI, though there may be some discrepancies in the intensity and precise locations of high CO concentrations. This comparison highlights areas where the WRF-Chem model aligns well with satellite observations and regions where further adjustments in model parameters may be necessary to better replicate observed patterns. The TROPOMI-retrieved CO columns display values of 1.92×10¹⁸ and 1.79×10¹⁸ molecules cm−2 for summer and winter, respectively. In contrast, the simulated column values are of 1.93×10¹⁸ for summer and 1.91×10¹⁸ molecules cm−2 for winter. Thus, comparing WRF-Chem and TROPOMI-CO data reveals more pronounced discrepancies, with a minor overestimation of 0.02×10¹⁸ molecules cm−2 in summer and a significant underestimation of 0.12×10¹⁸ molecules cm−2 in winter. Shami et al. (2022) found that the EDGAR emissions inventory underestimates CO emissions when compared to Lebanon's national emission inventory, identifying the road transport sector as the primary source of CO emissions. Consequently, EDGAR's estimates for CO emissions are lower than those provided by Waked et al. (2012) for the same region. The Environment Agency – Abu Dhabi (2018) reported that the road transport sector is the primary source of CO emissions in Abu Dhabi, accounting for 74 % of the total CO emissions. Additionally, the industrial sector contributes 21 % to the total CO emissions. Kumar et al. (2021) observed an underestimation of CO by the WRF-Chem model, attributing it to an inaccurate representation of anthropogenic emissions on the vertical scale, not represented in the current WRF-Chem simulations as noted for NO2. This could result in a more rapid deposition of CO molecules at the surface, thereby leading to the observed underestimation. In the summer months, the underprediction of the column CO over coastal areas, in particular around the major urban centres, and the overprediction over inland regions suggest deficiencies in the representation of the atmospheric flow (e.g. too strong an onshore flow), coupled with the aforementioned biases in the emission inventory. In contrast, in winter the biases are positive and probably more strongly linked to chemistry than to meteorological dynamics.
The model output correlates reasonably well with TROPOMI-CO, with a correlation coefficient of 0.82 and 0.40 and an RMSE of 0.03×10¹⁸ and 0.04×10¹⁸ molecules cm−2 in summer and winter, respectively (Table 2). The frequency distribution in Fig. 3c shows most differences, with a slight positive skew, suggesting a tendency for the WRF-Chem model to slightly overestimate CO concentrations compared to TROPOMI observations for summer. In contrast, Fig. 3f displays a broader distribution with a more pronounced positive skew, indicating larger and more variable overestimations by WRF-Chem in winter. In winter seasons, the lower correlation coefficients and higher biases for TROPOMI-CO as compared to TROPOMI-NO2 might be attributed to the complexities inherent in modelling and observing CO distributions, which local emission sources, atmospheric chemistry, and transport processes can influence. These findings are consistent with research conducted in India, where Dekker et al. (2019) reported a correlation of 0.81 between TROPOMI and WRF-Chem CO levels during a high pollution episode in November 2017. Similarly, in East Asia, Zhang et al. (2016) documented correlations between WRF-Chem-simulated and Measurements of Pollution in the Troposphere (MOPITT)-retrieved CO columns, with a r value of 0.59 and an RMSE of 4.6×10¹⁷ molecules cm−2 for summer and 0.69 with an RMSE of 5.2×10¹⁷ molecules cm−2 for winter, respectively.
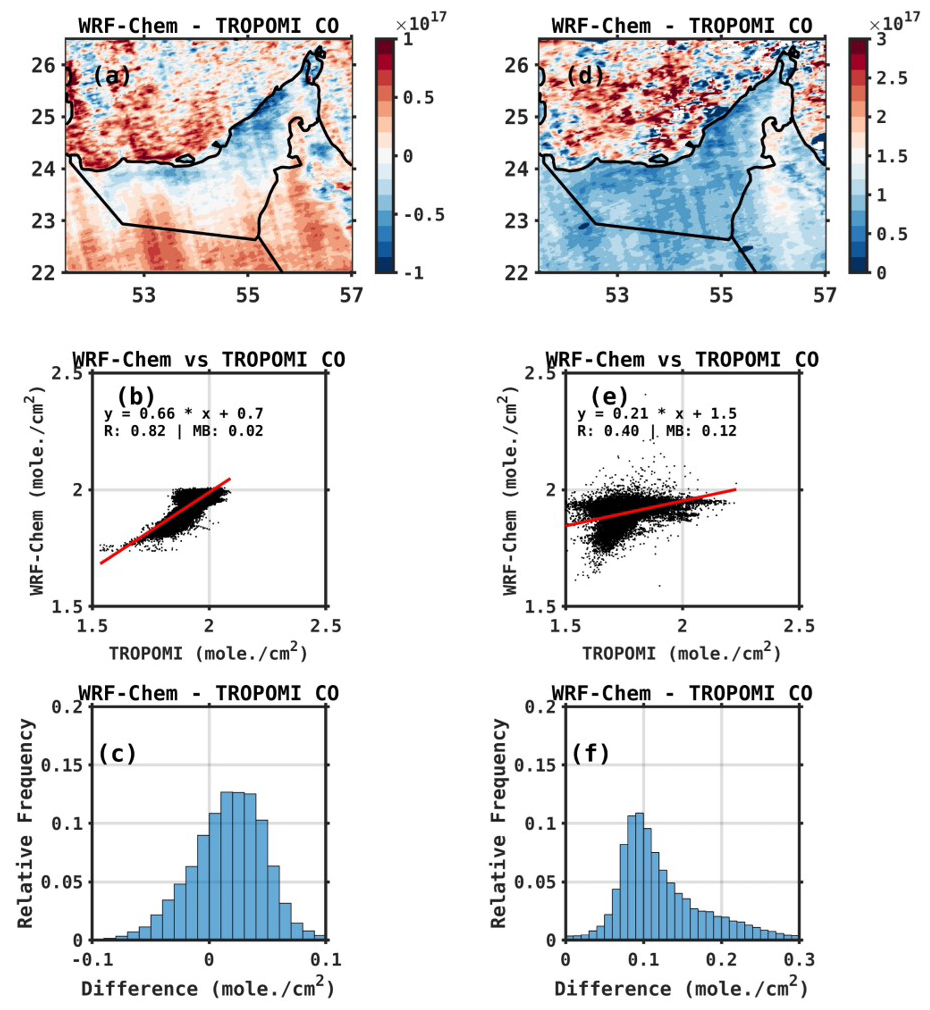
Figure 3Evaluation of WRF-Chem against satellite-derived CO: same as Fig. 2 but for the total column of CO (×1018 molecules cm−2).
Figure S6 presents the spatial distribution of tropospheric ozone concentrations over the UAE as observed by TROPOMI (TROPOMI-O3) and simulated by the WRF-Chem model during the summer and winter of 2022. In Fig. S5a and b, TROPOMI shows varying O3 concentrations with higher values, particularly along the northern coastal regions, where concentrations reach up to 20 DU. Similarly, WRF-Chem demonstrates a comparable spatial pattern, with elevated O3 concentrations in the same regions, reaching up to 40 DU, indicating that the model captures the general distribution observed by TROPOMI. In Fig. S5c, representing winter, TROPOMI exhibits a different distribution pattern, with overall lower O3 concentrations compared to summer. The WRF-Chem simulation in winter also shows a broader distribution of O3, with concentrations reaching up to 25 DU. While the WRF-Chem model aligns reasonably well with TROPOMI observations, discrepancies in concentration levels highlight both the model's ability to replicate seasonal variations and areas where improvements may be needed, especially in the winter months. The comparison of the WRF-Chem-simulated tropospheric ozone columns with the TROPOMI-retrieved columns (TROPOMI-O3) is illustrated in Fig. 4, with the statistical comparisons detailed in Table 2. The TROPOMI-O3 columns show higher in summer, at 16.6 DU, and lower values in winter, at 13.4 DU, which is attributed to increased photochemical activity during the summer months (Reddy et al., 2012; Coates et al., 2016; Badia and Jorba, 2015; Abdallah et al., 2018; Baldasano et al., 2011) The WRF-Chem simulations show these variations, with values of 32.8 DU for summer and 24.8 DU for winter, respectively. Therefore, model output is strongly correlated to the TROPOMI-O3 column concentration, with a correlation coefficient of 0.78 and 0.83 and an RMSE (MAE) of 1.4 and 1.0 DU (15.9 and 11.2 DU) during summer and winter, respectively. The WRF-Chem model systematically overestimates ozone levels by 15.9 and 11.2 DU in summer and winter, respectively. The frequency distribution in Fig. 4c represents the differences between WRF-Chem and TROPOMI-O3 concentrations during the summer, showing that they are more pronounced with a positive skew. This indicates a consistent tendency for the WRF-Chem model to overestimate O3 concentrations compared to TROPOMI observations in summer. Similarly, Fig. 4f displays a frequency distribution for winter with a positive skew and narrower spread, highlighting that WRF-Chem also tends to overestimate O3 concentrations compared to TROPOMI during this season, although with less variability in the overestimations. Therefore, the WRF-Chem model systematically overestimates O3 concentrations throughout the year, with a slightly more consistent bias observed in winter. Hu et al. (2021) highlighted the substantial influence of meteorological factors on ozone production, noting that temperature, relative humidity, and sunshine duration play significant roles in descending order of importance. Strong solar radiation and elevated temperatures enhance photochemical reactions, increasing ozone formation. In comparison with ERA-5 data (Fig. S1) and station data (Table S2), the colder temperatures observed in WRF-Chem, particularly in winter months when tropospheric column O3 biases are less positive (Table 2), may explain the overestimation of O3 concentrations in the model. Zhang et al. (2020) found that low wind speeds and high atmospheric pressure can hinder pollutant dispersion, leading to ozone accumulation, while Lu et al. (2019) observed that high humidity conditions can deplete O3 through interactions with water vapour and the production of OH radicals. WRF-Chem's negative RH2m bias against in situ measurements in both summer and winter (Tables S2 and S3), combined with temperature biases, may contribute to the model's overprediction of O3. Further exploration of these chemical interactions would require additional sensitivity analyses beyond this study's scope. Future work should focus on refining model fidelity by improving the representation of chemical processes and emissions to enhance air quality projections and deepen our understanding of regional pollution patterns.
The disparities between WRF-Chem and TROPOMI data highlight the intrinsic challenges in air quality monitoring and prediction. WRF-Chem's limitations may stem from its dependency on emissions inventories, which, as noted above, can have significant discrepancies compared to actual emissions, uncertainty in the meteorological forcing data, and the representation of atmospheric chemistry. TROPOMI, while offering high-resolution satellite observations, is subject to constraints related to retrieval algorithms and the influence of atmospheric conditions on measurement accuracy. Liu et al. (2022) identified that uncertainties in column observations arise from the challenges in differentiating between stratospheric and tropospheric contributions and uncertainties in the tropospheric air mass factor and its spectral fitting. Integrating model predictions with satellite observations, alongside ground-based measurements, is crucial for enhancing our understanding of air quality dynamics and improving predictive capabilities. This synergistic approach can help mitigate biases, enhance accuracy, and provide a more comprehensive view of atmospheric pollutants' distribution over this region.
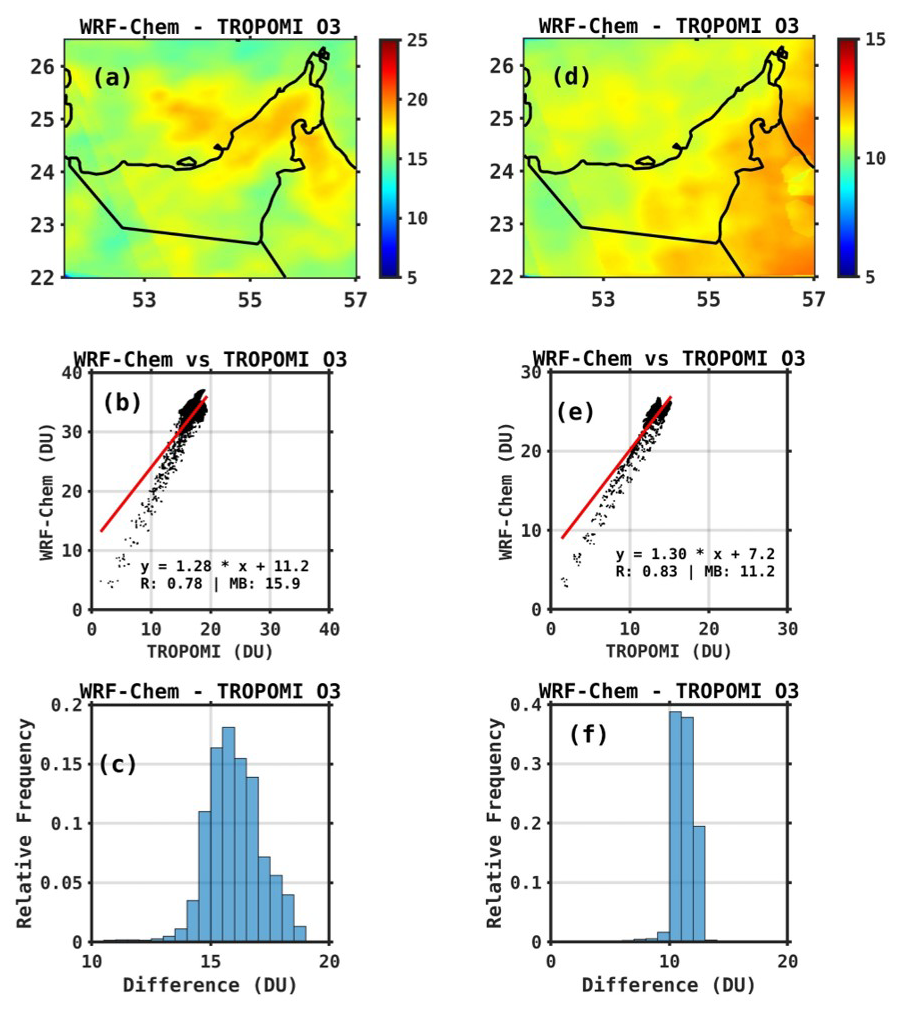
Figure 4Evaluation of WRF-Chem against satellite-derived O3: same as Fig. 5 but for the tropospheric column of ozone.
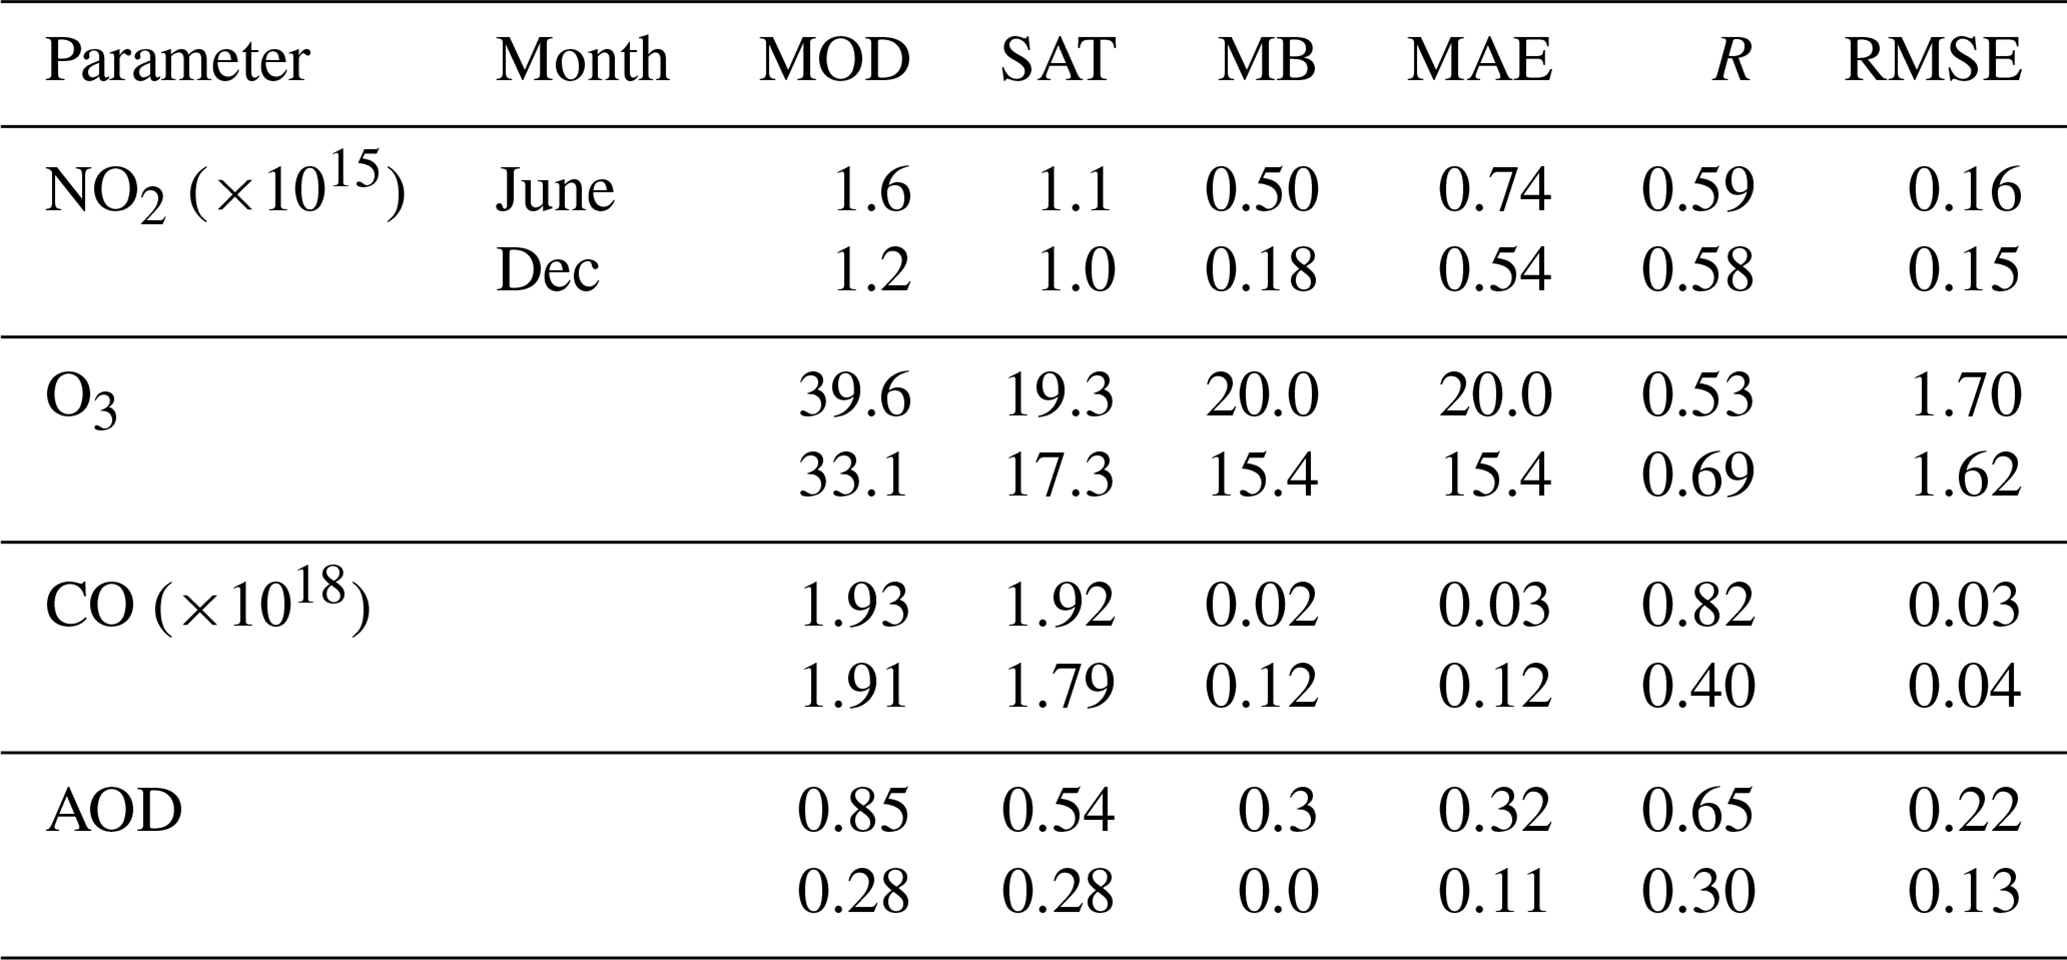
Table 2Statistical verification scores for evaluation against TROPOMI measurements: skill scores between TROPOMI columns (molecules cm−2), tropospheric column NO2 (TROPOMI-NO2), total column carbon monoxide (TROPOMI-CO), tropospheric column ozone (TROPOMI-O3), and MODIS AOD with corresponding WRF-Chem-simulated columns during June and December 2022 over UAE. The first two columns show the model and satellite monthly-mean values, with the other four giving the MB, MAE, and RMSE in units of molecules cm−2 for TROPOMI-NO2 and CO and in DU for O3.
4.3 Model performance with respect to AOD
4.3.1 AERONET
The analysis of daily mean AOD at Mezaira for June 2022 (Fig. 5a) and DEWA for December 2022 (Fig. 5b) reveals the model tends to overestimate the observed AOD values, in particular in the summer months when it is the highest (Nelli et al., 2020, 2022). In June at Mezaira, the AERONET AOD shows a steady increase from around 0.5 to approximately 1.0 by the end of the month, which is in line with the expected build-up of aerosols with the annual maxima typically occurring in July (Nelli et al., 2022). The WRF-Chem model captures this upward variation but consistently overestimates the observed AOD, especially toward the end of the month. This overestimation is highlighted by the MB of 0.46. The general overestimation of the observed wind speed concerning ground-based measurements (Tables S2 and S3; Fig. S1) can at least partially explain this bias, together with an incorrect representation of the particle size distribution and hence the sedimentation rates, leading to excessive amounts of suspended dust (Ukhov et al., 2021; Parajuli et al., 2023). The moderate correlation coefficient (r= 0.60) suggests that the model's day-to-day variability reasonably follows that observed. This is expected, as dust lifting in the warmer months is mainly associated with the shamal winds (Yu et al., 2016), which are fairly well represented in the model. Conversely, at DEWA in December (Fig. 5b), the observed AODs are lower, fluctuating between 0.2 and 0.3, indicative of the season's lower aerosol concentrations (Nelli et al., 2020). The WRF-Chem model again follows the observed variation but shows occasional significant overestimations, most notably on 10 December, where simulated AOD spikes to 1.6, far exceeding the observed AODs. Dust lifting in the colder months is typically associated with the passage of mid-latitude weather systems (Nelli et al., 2022), which the WRF model does not fully reproduce, in particular with respect to its timing (Temimi et al., 2020b; Taraphdar et al., 2021). This discrepancy is reflected in the weak correlation coefficient (r= 0.16) and the MB of 0.05. The overestimation of the near-surface wind speed at the location of the airport stations (Table S2) and the WISE-UAE site (Table S3) is also in line with the higher amounts of atmospheric dust in the model. Figure 5 shows that, while the WRF-Chem model demonstrates the ability to capture seasonal variations in AOD, it tends to overestimate AOD levels in both summer and winter months, suggesting a need for calibration of the aerosol parameterization scheme in the model or the emissions input. This comparison highlights the model's potential and limitations in simulating the UAE-specific aerosol conditions, as well as where research is needed to optimize the model performance.
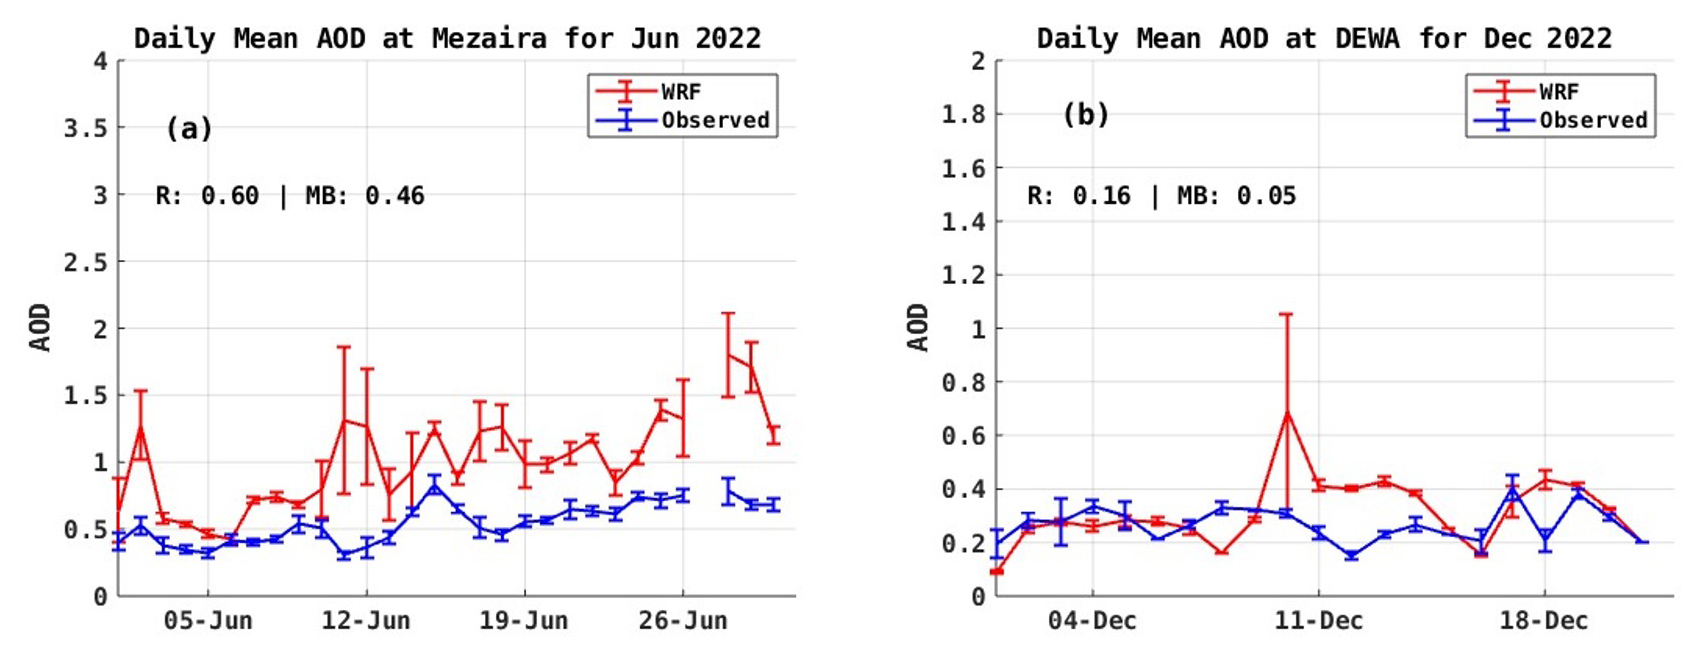
Figure 5Evaluation of WRF-Chem against AERONET AOD: daily mean aerosol optical depth (AOD; dimensionless) from WRF-Chem simulations (red) and AERONET observations (blue) at Mezaira during June 2022 (a) and Dewa during December 2022 (b). The lines give the daily mean values and the error bars show 1 standard deviation from the mean computed using the hourly values. The correlation (r) and mean bias (MB) are given in the plot.
4.3.2 MODIS
The comparison between WRF-Chem-simulated and MODIS AOD (MOD-AOD) is depicted in Fig. 6, with the statistical comparisons summarized in Table 2. The satellite-derived MOD-AOD values follow the same seasonal cycle as the ground-based AERONET observations: they are higher in the summer, averaging 0.54, and lower in winter, averaging 0.28, reflecting the annual cycle in aerosol loading in the region (Nelli et al., 2020). The WRF-Chem simulations capture these seasonal variations, with corresponding AODs of 0.85 in summer and 0.28 in winter. The model AOD demonstrates moderate correlation with MODIS AOD, yielding correlation coefficients of 0.65 for summer and 0.30 for winter, similar to the ones with respect to the AERONET AOD, indicating the satellite-derived and ground-based AOD estimates are in close agreement, which has been noted by Nelli et al. (2020). The WRF-Chem model systematically overestimates AOD by 0.31 in summer, a similar (albeit of a smaller magnitude) bias to that of the AERONET station (Fig. 5a), while it slightly underestimates AOD by 0.004 in winter.
For June, WRF-Chem generally overestimates AOD compared to the MODIS' estimates, in particular over the southern and central UAE, as shown in the spatial distribution of the difference between them (Fig. 6a–c). The frequency distribution shows most differences clustering around zero, with a slight positive skew, reinforcing the model's overestimation tendency for this month. Stronger wind speeds and an incorrect representation of the dust physical and optical properties can explain the model bias. In contrast, in December there are more balanced results, with WRF-Chem showing a closer alignment with MODIS AOD on average. The spatial distribution of the model bias displays areas in the central and southern UAE where the MODIS AOD exceeds the WRF-Chem values, with anomalies of the opposite sign over the Arabian Gulf and parts of the Al Hajar mountains in Oman. Mostamandi et al. (2023) showed that, over the Arabian Gulf and in the WRF-Chem model, the dust deposition rates decrease away from the coastlines, with coastal UAE having lower deposition rates than inland sites. Excessive dust deposition over the Rub' Al Khali Desert is consistent with a clearer atmosphere closer to the coastlines in the model when compared to the MODIS measurements. The positive bias over the Arabian Gulf can be attributed to higher amounts of dust transported upstream by northwesterly winds and/or reduced dust deposition over the water in WRF-Chem. The frequency distribution in December shows a balanced spread around zero, suggesting a more accurate seasonal fit than in June. These findings, together with those in Fig. 5 with respect to the AERONET station observations, underscore the influence of seasonal atmospheric conditions on WRF-Chem's performance and suggest the need for seasonal adjustments in the aerosol parameterization to improve model accuracy in capturing the UAE's unique aerosol dynamics.
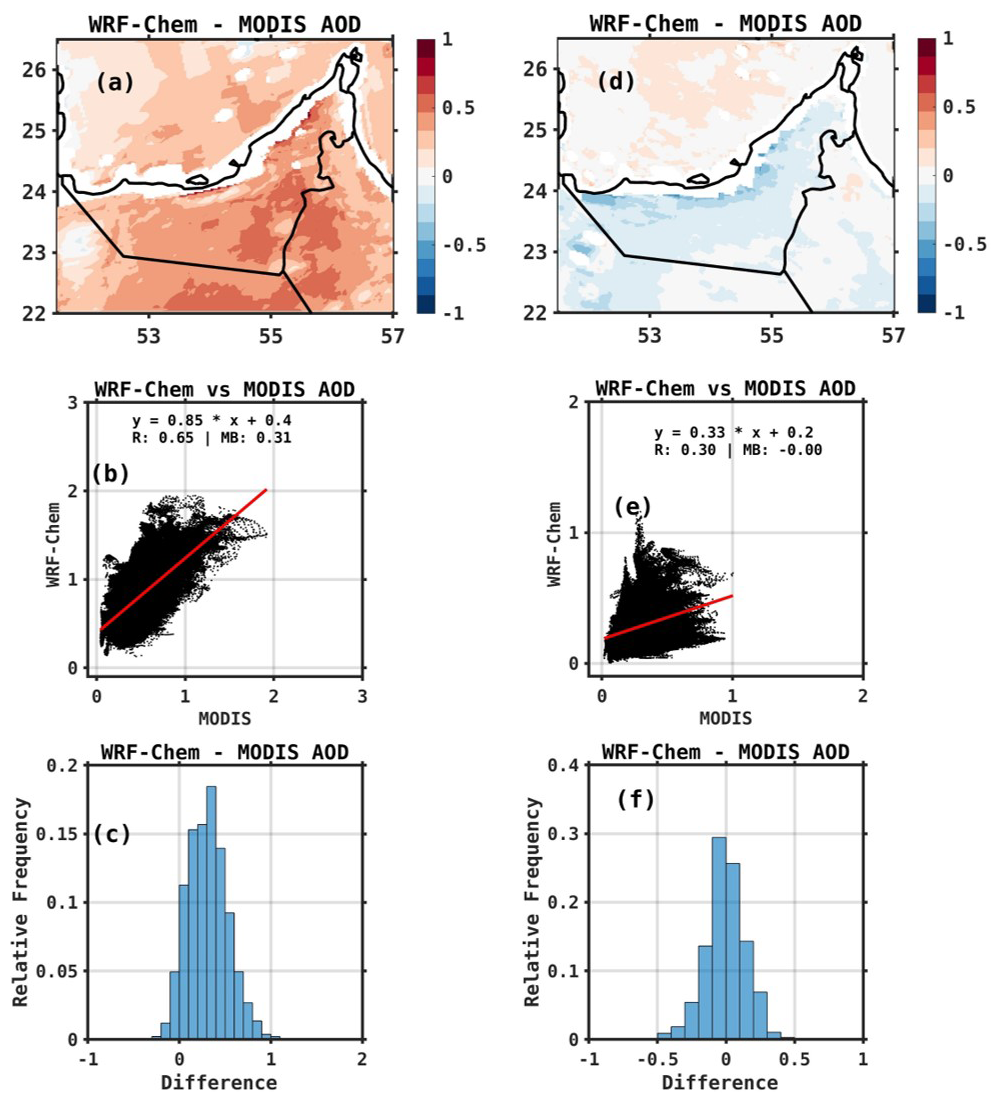
Figure 6Evaluation of WRF-Chem against MODIS AOD: same as Fig. 2 but for the MODIS AOD.
4.4 Aerosol influence on ozone
Tropospheric or surface ozone (O3) is one of the most significant greenhouse gases after carbon dioxide (CO2) and methane (CH4) (Ehhalt and Prather, 2001). It plays a critical role in the Earth's radiation budget, contributing to an increase in radiative forcing of up to 0.47 W m−2 and accounting for 3 %–7 % of global warming (Gauss, 2003; Ehhalt and Prather, 2001). Elevated O3 levels in the atmospheric boundary layer are toxic and can significantly impact human health and vegetation (Adams et al., 1989). The interactions between reactive gaseous pollutants and aerosols are a major focus in the development of air quality and climate models. Aerosols, through scattering and absorption of solar radiation, influence photolysis rates and can either increase or decrease the formation of O3 and its precursors (He and Carmichael, 1999). Studies have shown that aerosols impact ozone production and loss by altering photolysis frequencies (Dickerson et al., 1997; Jacobson, 1998). For example, Li et al. (2011) used an air quality model to evaluate the changes in photolysis frequencies caused by sulfate, nitrate, ammonium, and mineral dust aerosols in central and eastern China, finding a 5.4 % decrease in daily average surface ozone concentrations. Similarly, Lou et al. (2014) found that aerosols reduced annual mean photolysis frequencies, j(O1D) and j(NO2), by 6 %–18 % in polluted eastern China, resulting in reductions of up to 0.5 ppbv in O3 during spring and summer, using a global chemical transport model. Attributing ozone levels to a specific source region is particularly challenging, as ozone concentrations are influenced by various processes, including stratosphere–troposphere exchange, significant hemispheric background levels, dominant local emissions, and complex photochemical reactions involving multiple trace gases (Fiore et al., 2003). Therefore, it is crucial to understand the impact of aerosol feedback on surface ozone in the UAE, a region with high aerosol loading in the Arabian Peninsula.
From Fig. 4 and the discussion in Sect. 4.2, it is evident that ozone levels are higher during the summer season, which coincides with a dominance of aerosols over the UAE. In order to better understand the impact of aerosols on ozone concentrations, we conducted a simulation in which all aerosol components in the WRF-Chem model are turned off (no aerosol + radiative feedback on), simulating an aerosol-free atmosphere over the UAE. This simulation is conducted alongside a control simulation (all aerosol + radiative feedback on) in which all aerosol processes are included, both for June 2022. The results of these simulations, comparing the scenarios with and without aerosols, are presented in Fig. 7 and highlight the influence of aerosols on ozone formation and spatial distribution in the region. This analysis focuses on daytime hours (04:00–12:00 UTC) and non-daytime hours (13:00–03:00 UTC) to delve deeper into ozone dynamics, as ozone production predominantly occurs during the daytime compared to non-daytime hours. Figure 7a–b show the ozone distribution with and without aerosols during the daytime hours (04:00–12:00 UTC; 08:00–16:00 LT). Both panels depict higher ozone concentrations over the northern regions, with a clear gradient decreasing towards the southeastern areas during daytime hours. The influence of aerosols on ozone production is evident in areas where the ozone levels are slightly elevated, suggesting that aerosols contribute to ozone production/loss under daytime conditions based on the nature of the aerosols. Figure 7c highlights the difference in ozone concentrations between simulations with and without aerosols for daytime hours. The difference shows localized areas of positive and negative changes, indicating regions where aerosols either enhance or suppress ozone levels. Notably, over the northern areas, particularly in oceanic regions where the ozone concentrations are the highest, the differences are generally positive, reflecting a positive feedback of aerosols on ozone production, particularly over the Arabian Gulf. On the other hand, over land areas, where the ozone is lower, the lower photolysis rates may limit ozone production. Therefore, the impact of aerosols on ozone varies based on their origin, such as dust events. These aerosols can have anthropogenic, natural, or marine origins (Filioglou et al., 2020; Nelli et al., 2021). Aerosols significantly influence surface ozone through atmospheric chemical and physical processes. Depending on their nature, aerosols can either increase or decrease ozone levels, as observed in various studies (Gao et al., 2023; Shi et al., 2022). As noted in studies such as Wang et al. (2019), Mukherjee et al. (2020), and Qu et al. (2021), the reduction in the incoming shortwave radiation flux will hinder the generation of ozone, as well as an increase in the NO NO2 ratio, which can happen when the pollutants' concentration increases in a shallower boundary layer. On the other hand, higher amounts of CO and NO2 will promote the production of ozone.
Figure 7d and e illustrate ozone concentrations with and without aerosols for the remaining hours (non-daytime). The patterns are largely similar to those observed during the daytime, except over urban areas where the ozone concentration is much reduced, owing to the lack of in situ generation due to the absence of sunlight and underestimation of ozone precursor concentration. Figure 7d shows slightly higher concentrations than Fig. 7e, suggesting that aerosols continue to have an impact on ozone production, albeit less pronounced, during non-daytime periods. Figure 7f presents the difference in ozone concentrations between simulations with and without aerosols for the non-daytime hours. The spatial distribution of positive and negative differences follows a similar pattern to that observed during the daytime hours, though the magnitudes are generally larger. This suggests that ozone advection from upstream sources may play a role. Additionally, marine aerosols can contribute to ozone production through their nature.
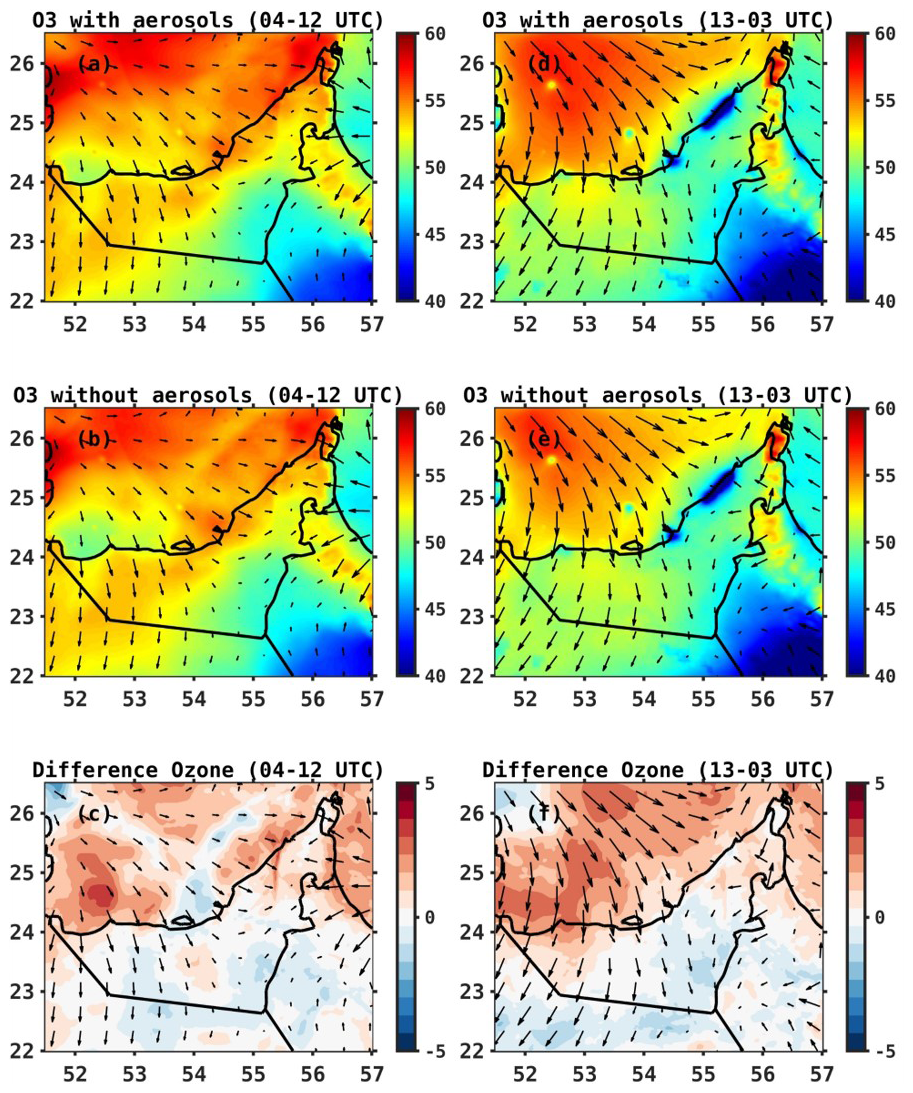
Figure 7Ozone (O3) sensitivity simulations: spatial distribution of surface ozone concentrations (ppb) simulated by the WRF-Chem model with (a) and without (b) aerosols over the UAE for specified daytime hours during June 2022. Panels (d)–(e) are as (a)–(b) for the remaining hours. Panels (c) and (f) illustrate the difference (%) in ozone concentrations (with aerosols minus without aerosols) during daytime hours and the remaining hours, respectively. The 10 m wind vectors (m s−1) are overlaid on each plot, indicating the wind patterns influencing the ozone distribution.
This study rigorously evaluates the performance of the Weather Research and Forecasting model coupled with chemistry (WRF-Chem) in simulating meteorological parameters and air pollutants over the United Arab Emirates (UAE) during June and December 2022, representing contrasting summer and winter conditions. The model's performance is assessed through comparisons with ground-based observations and ERA-5 reanalysis data for meteorological parameters, as well as AERONET, TROPOMI, and MODIS satellite observations for air pollutants.
We evaluated WRF-Chem model's accuracy in simulating meteorological parameters, in particularly 2 m temperature (T2m), 10 m wind speed (WS10m), and 2 m relative humidity (RH2m) across seven locations in the UAE. The model generally overestimates T2m in summer by less than 0.2 °C and underestimates it in winter by 3 °C, with correlation coefficients ranging from 0.7 to 0.85 among the stations. This is comparable performance with compared to that reported studies (e.g. Branch et al., 2021; Temimi et al., 2020b), reflecting the added value of explicitly predicting chemistry fields in this aerosol-rich region. An incorrect representation of surface properties, such as the albedo and surface emissivity, and deficiencies in the model physics and dynamics, may explain the referred temperature biases. For WS10m, the model's bias is within ±0.5 m s−1, indicating good agreement for both land and marine areas. The tendency for the model to overestimate the observed wind speed may arise from deficiencies in the surface drag parameterization scheme and an underrepresentation of its subgrid-scale variability (Nelli et al., 2020). In any case, and as for air temperature, the magnitude of the biases is much smaller than that reported in other studies, for which the wind speed biases exceed 3 m s−1 (Branch et al., 2021; Fonseca et al., 2020; Temimi et al., 2020b). The dry bias noted in these studies, however, is also seen in the WRF-Chem simulations, possibly arising from a drier soil, an incorrect representation of the mesoscale (sea–land breeze) circulations, and a dry bias in the forcing data. The WRF-Chem model evaluation against WISE-UAE measurements reveals a comparable performance to that seen with respect to the airport stations with respect to T2m, WS10m, and RH2m. An evaluation against the WRF-Chem values reveals the model overestimates the incoming shortwave radiation flux (SW) by about 30 W m−2 for December, which can be attributed to reduced cloud cover, a known WRF deficiency (Wehbe et al., 2019; Fonseca et al. 2020, 2022a). An inspection of the diurnal cycle revealed the cold (typically by 2–3 °C) and dry (by about 20 %) biases occur mostly at night, when the wind speed in the model is higher than that observed, suggesting increased advection of cooler and drier desert air into the site.
The comparison of ERA5 reanalysis data with WRF-Chem simulations revealed regional variations in T2m, specifically underestimation in the UAE's southern region and overestimation in the northwestern region. Statistical metrics for summer show an underestimation of 1 °C and a correlation coefficient (r) of 0.97. In comparison, for winter a similar pattern is seen with an underestimation of 1 °C and a r value of 0.92 over the domain. The fact that WRF-Chem performs well against in situ data and ERA5 reanalysis with respect to air temperature is also an indication that the reanalysis dataset performs well in this region, as noted by Fonseca et al. (2022b) and Nelli et al. (2024a). The mean PBL from ERA5 is largely consistent with that from the WRF-Chem outputs, with both datasets displaying a clear seasonal variation – increased PBL during summer and decreased in winter, correlating with temperature changes.
Regarding gaseous pollutants, both WRF-Chem and satellite data show higher TROPOMI-NO2 columns greater than 5×10¹⁵ molecules cm−2 in urban and industrial regions such as Dubai, Abu Dhabi, and Ras Al Khaimah, reflecting emissions from economic activities like power generation, water desalination, and industries. Lower concentrations (< 1.5×10¹⁵ molecules cm−2) are noted in less urbanized areas. The WRF-Chem model closely reproduces the TROPOMI-NO2 spatial patterns, even though it tends to underestimate the observed concentrations in the Abu Dhabi region and underestimate the northeastern UAE, which has been tied to deficiencies in the emission inventory. Moderate correlation coefficients (0.59 in summer and 0.58 in winter) confirm the model's effectiveness in capturing NO2's day-to-day variability. WRF-Chem overestimates the observed TROPOMI-O3 column, as indicated by positive MB values of around 11–16 DU, yet maintains high correlation coefficients (0.78 in summer and 0.83 in winter), suggesting accurate ozone concentration simulations. Colder and drier conditions, along with deficiencies in the representation of the observed chemistry, particularly concerning the NOx emissions linked to the O3 concentration, can explain the WRF-Chem biases. TROPOMI-CO column simulations, on the other hand, exhibit significant discrepancies in winter and lower correlation coefficients, highlighting challenges in accurately modelling CO levels. Besides an incorrect emission inventory, discrepancies in the representation of the atmospheric flow and its effect on the pollutants' dispersion can explain the model performance. In summer, the analysis conducted here stresses the WRF-Chem model's strengths in simulating CO, NO2, and O3 columns with high fidelity with respect to the TROPOMI's observations but also points out its limitations in estimating CO columns accurately in winter.
Regarding aerosol optical depth (AOD) observed by AERONET stations and the MODIS satellite, the WRF-Chem model generally tends to overestimate AOD, particularly during the summer months. At Mezaira in June, AERONET data showed a steady increase in AOD, which the WRF-Chem model captured but consistently overpredicted due to factors such as overestimated wind speeds and inaccuracies in particle size distribution. In December at DEWA, observed AOD levels were lower, and while the model followed the observed trends, it occasionally produced large spikes, reflecting challenges in accurately capturing the effects of mid-latitude weather systems. Correlation coefficients for AOD comparisons reveal moderate (0.60) to weak model performance depending on the season, influenced by dust transport mechanisms. Comparisons with MODIS satellite-derived AOD similarly indicated seasonal overestimations during the summer, with a closer alignment observed in winter. Spatially, overestimations in southern and central UAE in June were linked to strong winds and dust properties, while December results were more balanced. Biases over the Arabian Gulf were attributed to dust transport and deposition dynamics. Overall, the findings indicate that while the WRF-Chem model captures seasonal AOD variations, adjustments to aerosol parameterization and dust representation are necessary to improve model accuracy.
This study also explores the impact of aerosols on surface ozone (O3) in the UAE by altering photolysis rates through the scattering and absorption of solar radiation. Using WRF-Chem model simulations for June 2022, we compared scenarios with and without aerosols to assess their influence. The results show higher ozone concentrations during daytime in northern regions, with aerosols contributing to localized increases or decreases. Marine aerosols notably enhance O3 production over the Arabian Gulf, while lower photolysis rates limit ozone formation over land areas. During non-daytime hours, aerosol influence continues but is less significant, with urban areas experiencing reduced ozone levels due to limited photochemical activity. Additional sensitivity simulations and in situ observations are needed to validate these findings further.
The WRF-Chem model exhibits enhanced capability in simulating key meteorological parameters and satisfactory performance in air pollutants over the UAE, showcasing significant improvements in regional-scale dynamics. This is evidenced by high skill scores with respect to observational data, with a clear improvement over previous research outcomes, particularly during summer. This comprehensive assessment validates the model's effectiveness and identifies potential areas for improvement in simulating air pollutant concentrations across the hyper-arid and aerosol-rich UAE. The discrepancies between model simulations and various observational datasets likely arise from improper emission inventories, particularly anthropogenic emissions, which must be optimized based on existing country-specific datasets. Other sources of uncertainty are model parameterization schemes and the quality of the meteorological and chemistry input data. Integrating model predictions with satellite observations and ground-based measurements is crucial for advancing air quality monitoring and enhancing the predictive accuracy of atmospheric pollutant distributions in the UAE. This collective approach aids in addressing biases and improving the overall understanding of regional air quality dynamics.
The authors would like to acknowledge that the products used in this study are freely accessible online.
- i.
ERA-5 reanalysis data are extracted from the Copernicus Climate Change Service Climate Data Store (https://doi.org/10.24381/cds.adbb2d47, Hersbach et al., 2023a; https://doi.org/10.24381/cds.bd0915c6, Hersbach et al., 2023b).
- ii.
Nitrogen dioxide (NO2, https://doi.org/10.5270/S5P-9bnp8q8, ESA, 2021a), ozone (O3, https://doi.org/10.5270/S5P-j7l9xvd, ESA, 2021c), and carbon monoxide (CO, https://doi.org/10.5270/S5P-bj3nry0, ESA, 2021b) column concentrations estimated from the measurements collected by the Tropospheric Monitoring Instrument (TROPOMI) on board the Sentinel 5-P satellite are extracted from the National Aeronautics and Space Administration's (NASA's) website.
- iii.
Aerosol optical depth is from the Moderate Resolution Imaging Spectroradiometer (MODIS, https://doi.org/10.5067/MODIS/MOD04_L2.061, Levi et al., 2015).
- iv.
National Centers for Environmental Prediction (NCEP) Final (FNL) Operational Global Analysis meteorological data used to drive the WRF-Chem simulations are downloaded from the National Center for Atmospheric Research (NCAR) Research Data Archive website (https://doi.org/10.5065/D6M043C6, NCEP/NWS/NOAA/USDC, 2000), with the chemistry data used to force WRF-Chem, the output of the Community Atmosphere Model with chemistry (CAM-Chem) model, extracted from NCAR's website (https://doi.org/10.5065/NMP7-EP60, Bucholz et al., 2019).
- v.
The WRF-Chem model used, version 4.3.1, is freely available from the developers' website (https://github.com/wrf-model/WRF/releases, WRF, 2023), with the pre-processor tools available from NCAR's website (https://www.acom.ucar.edu/wrf-chem/download.shtml, NCAR, 2023).
- vi.
All figures displayed in this paper were generated with the Matrix Laboratory (MATLAB) software version 2023 (https://uk.mathworks.com/products/matlab.html, Mathworks, 2023).
The supplement related to this article is available online at: https://doi.org/10.5194/acp-25-1685-2025-supplement.
Conceptualization and methodology: DF and YY. Data curation and visualization: YY. Formal analysis and interpretation: YY, RF, NN, and DF. Project administration and supervision: DF. Writing (original draft): YY. Review and editing: all authors.
The contact author has declared that none of the authors has any competing interests.
Publisher's note: Copernicus Publications remains neutral with regard to jurisdictional claims made in the text, published maps, institutional affiliations, or any other geographical representation in this paper. While Copernicus Publications makes every effort to include appropriate place names, the final responsibility lies with the authors.
We are thankful to the development team of the WRF-Chem model for making this model available as an open-source resource for research. We acknowledge the use of WRF-Chem pre-processor tools including mozbc, anthro_emiss, and bio_emiss provided by the Atmospheric Chemistry Observations and Modelling Lab (ACOM) of the National Center for Atmospheric Research (NCAR). Our thanks also go to the Community Atmosphere Model with chemistry (CAM-Chem) for the chemical initial and boundary conditions. In addition, we are also thankful to the National Centers for Environmental Prediction (NCEP) Final (FNL) Operational Global Analysis for supplying meteorological initial and lateral boundary conditions. Additionally, we are grateful to Sentinel-5P TROPOMI for satellite datasets. Finally, this research greatly benefited from the high-performance computing and research computing resources provided by Khalifa University. We express our sincere gratitude for their invaluable support. We would also like to thank the two anonymous reviewers for their several constructive and insightful comments and suggestions that helped to substantially improve the quality of this work.
This paper was edited by Christoph Gerbig and reviewed by two anonymous referees.
Abdallah, C., Afif, C., El Masri, N., Öztürk, F., Keleş, M., and Sartelet, K.: A first annual assessment of air quality modeling over Lebanon using WRF/Polyphemus. Atmos. Pollut. Res., 9, 643–654, https://doi.org/10.1016/j.apr.2018.01.003, 2018.
Abida, R., Addad, Y., Francis, D., Temimi, M., Nelli, N., Fonseca, R., Nesterov, O., and Bosc, E.: Evaluation of the Performance of the WRF Model in a Hyper-Arid Environment: A Sensitivity Study, Atmosphere, 13, 985, https://doi.org/10.3390/atmos13060985,2022, 2022.
Abuelgasim, A. and Farahat, A.: Effect of dust loadings, meteorological conditions, and local emissions on aerosol mixing and loading variability over highly urbanized semiarid countries: United Arab Emirates case study, J. Atmos. Sol.-Terr. Phy., 199, 105215, https://doi.org/10.1016/j.jastp.2020.105215, 2020.
Adams, R. M., Glyer, J. D., Johnson, S. L., and McCarl, B. A.: A reassessment of the eco nomic effects of Ozone on U.S. Agriculture, JAPCA J. Air Waste Ma., 39, 960–968, https://doi.org/10.1080/08940630.1989.10466583, 1989.
Archer-Nicholls, S., Lowe, D., Darbyshire, E., Morgan, W. T., Bela, M. M., Pereira, G., Trembath, J., Kaiser, J. W., Longo, K. M., Freitas, S. R., Coe, H., and McFiggans, G.: Characterising Brazilian biomass burning emissions using WRF-Chem with MOSAIC sectional aerosol, Geosci. Model Dev., 8, 549–577, https://doi.org/10.5194/gmd-8-549-2015, 2015.
Alapaty, K., Herwehe, J. A., Otte, T. L., Nolte, C. G., Bullock, O. R., Mallard, M. S., Kain, J. S., and Dudhia, J.: Introducing subgrid-scale cloud feedbacks to radiation for regional meteorological and climate modeling, Geophys. Res. Lett., 39, L24809, https://doi.org/10.1029/2012GL054031, 2012.
Badia, A. and Jorba, O.: Gas-phase evaluation of the online NMMB/BSC-CTM model over Europe for 2010 in the framework of the AQMEII-Phase2 project, Atmos. Environ., 115, 657–669, https://doi.org/10.1016/j.atmosenv.2014.05.055, 2015.
Baldasano, J. M., Pay, M. T., Jorba, O., Gassó, S., and Jiménez-Guerrero, P.: An annual assessment of air quality with the CALIOPE modeling system over Spain, Sci. Total Environ., 409, 2163–2178, https://doi.org/10.1016/j.scitotenv.2011.01.041, 2011.
Basha, G., Kishore, P., Ratnam, M. V., Ravindra Babu, S., Velicogna, I., Jiang, J. H., and Ao, C. O.: Global climatology of planetary boundary layer top obtained from multi-satellite GPS RO observations, Clim. Dynam., 52, 2385–2398, https://doi.org/10.1007/s00382-018-4269-1, 2019.
Boersma, K. F., Eskes, H. J., Richter, A., De Smedt, I., Lorente, A., Beirle, S., van Geffen, J. H. G. M., Zara, M., Peters, E., Van Roozendael, M., Wagner, T., Maasakkers, J. D., van der A, R. J., Nightingale, J., De Rudder, A., Irie, H., Pinardi, G., Lambert, J.-C., and Compernolle, S. C.: Improving algorithms and uncertainty estimates for satellite NO2 retrievals: results from the quality assurance for the essential climate variables (QA4ECV) project, Atmos. Meas. Tech., 11, 6651–6678, https://doi.org/10.5194/amt-11-6651-2018, 2018.
Borsdorff, T., Hasekamp, O. P., Wassmann, A., and Landgraf, J.: Insights into Tikhonov regularization: application to trace gas column retrieval and the efficient calculation of total column averaging kernels, Atmos. Meas. Tech., 7, 523–535, https://doi.org/10.5194/amt-7-523-2014, 2014.
Borsdorff, T., Aan de Brugh, J., Hu, H., Aben, I., Hasekamp, O., and Landgraf, J.: Measuring Carbon Monoxide With TROPOMI: First Results and a Comparison With ECMWF-IFS Analysis Data, Geophys. Res. Lett., 45, 2826–2832, https://doi.org/10.1002/2018GL077045, 2018.
Branch, O., Schwitalla, T., Temimi, M., Fonseca, R., Nelli, N., Weston, M., Milovac, J., and Wulfmeyer, V.: Seasonal and diurnal performance of daily forecasts with WRF V3.8.1 over the United Arab Emirates, Geosci. Model Dev., 14, 1615–1637, https://doi.org/10.5194/gmd-14-1615-2021, 2021.
Bucholz, R. R., Emmons, L. K., Tilmes, S., and The CESM2 Development Team: CESM2.1/CAM-chem Instantaneous Output for Boundary Conditions, UCAR/NCAR – Atmospheric Chemistry Observations and Modeling Laboratory [data set], Subset used (Lat: −5 to 50; Lon: 15 to 55; June and December 2018), https://doi.org/10.5065/NMP7-EP60, 2019.
Chaouch, N., Temimi, M., Weston, M., and Ghedira, H.: Sensitivity of the meteorological model WRF-ARW to planetary boundary layer schemes during fog conditions in a coastal arid region, Atmos. Res., 187, 106–127, https://doi.org/10.1016/j.atmosres.2016.12.009, 2017.
Chin, M., Ginoux, P., Kinne, S., Torres, O., olben, B. N., Duncan, B. N., Martin, R. V, Logan, J. A., Higurashi, A., and Nakajima, T.: Tropospheric aerosol optical thickness from the GOCART model and comparisons with satellite and Sun photometer measurements, J. Atmos. Sci., 59, 461–483, https://doi.org/10.1175/1520-0469(2002)059-2002, 2002.
Chudnovsky, A., Lyapustin, A., Wang, Y., Tang, C., Schwartz, J., and Koutrakis, P.: High resolution aerosol data from MODIS satellite for urban air quality studies, Cent. Eur. J. Geosci., 6, 17–26, https://doi.org/10.2478/s13533-012-0145-4, 2014.
Coates, J., Mar, K. A., Ojha, N., and Butler, T. M.: The influence of temperature on ozone production under varying NOx conditions – a modelling study, Atmos. Chem. Phys., 16, 11601–11615, https://doi.org/10.5194/acp-16-11601-2016, 2016.
Crippa, M., Solazzo, E., Huang, G., Guizzardi, D., Koffi, E., Muntean, M., Schieberle, C., Friedrich, R., and Janssens-Maenhout, G.: High resolution temporal profiles in the Emissions Database for Global Atmospheric Research, Scientific Data, 7, 121, https://doi.org/10.1038/s41597-020-0462-2, 2020.
Copernicus Sentinel data processed by ESA, Koninklijk Nederlands Meteorologisch Instituut (KNMI): Sentinel-5P TROPOMI Tropospheric NO2 1-Orbit L2 5.5 km x 3.5 km, Greenbelt, MD, USA, Goddard Earth Sciences Data and Information Services Center (GES DISC) [data set], https://doi.org/10.5270/S5P-9bnp8q8, 2021a.
Copernicus Sentinel data processed by ESA, Koninklijk Nederlands Meteorologisch Instituut (KNMI)/Netherlands Institute for Space Research (SRON): Sentinel-5P TROPOMI Carbon Monoxide CO Column 1-Orbit L2 5.5 km x 7 km, Greenbelt, MD, USA, Goddard Earth Sciences Data and Information Services Center (GES DISC) [data set], https://doi.org/10.5270/S5P-bj3nry0, 2021b.
Copernicus Sentinel data processed by ESA, Koninklijk Nederlands Meteorologisch Instituut (KNMI): Sentinel-5P TROPOMI Ozone Profile 1-Orbit L2 30 km x 30 km, Greenbelt, MD, USA, Goddard Earth Sciences Data and Information Services Center (GES DISC) [data set], https://doi.org/10.5270/S5P-j7l9xvd, 2021c.
Dai, A.: The diurnal cycle from observations and ERA5 in precipitation, clouds, boundary layer height, buoyancy, and surface fluxes, Clim. Dynam., 62, 5879–5908, https://doi.org/10.1007/s00382-024-07182-6, 2024.
Dee, D. P., Uppala, S. M., Simmons, A. J., Berrisford, P., Poli, P., Kobayashi, S., Andrae, U., Balmaseda, M. A., Balsamo, G., Bauer, P., Bechtold, P., Beljaars, A. C. M., van de Berg, L., Bidlot, J., Bormann, N., Delsol, C., Dragani, R., Fuentes, M., Geer, A. J., Haimberger, L., Healy, S. B., Hersbach, H., Hólm, E. V., Isaksen, L., Kållberg, P., Köhler, M., Matricardi, M., McNally, A. P., Monge-Sanz, B. M., Morcrette, J. J., Park, B. K., Peubey, C., de Rosnay, P., Tavolato, C., Thépaut, J. N., and Vitart, F.: The ERA-Interim reanalysis: Configuration and performance of the data assimilation system, Q. J. Roy. Meteor. Soc., 137, 553–597, https://doi.org/10.1002/qj.828, 2011.
Dickerson, R. R., Kondragunta, S., Stenchikov, G., Civerolo, K. L., Doddridge, B. G., and Holben, B. N.: The impact of aerosols on solar ultraviolet radiation and photochemical smog, Science, 215, 827–830, https://doi.org/10.1126/science.1172133, 1997.
Dekker, I. N., Houweling, S., Pandey, S., Krol, M., Röckmann, T., Borsdorff, T., Landgraf, J., and Aben, I.: What caused the extreme CO concentrations during the 2017 high-pollution episode in India?, Atmos. Chem. Phys., 19, 3433–3445, https://doi.org/10.5194/acp-19-3433-2019, 2019.
Dubovik, O., Smirnov, A., Holben, B. N., King, M. D., Kaufman, Y. J., Eck, T. F., and Slutsker, I.: Accuracy assessments of aerosol optical properties retrieved from Aerosol Robotic Network (AERONET) Sun and sky radiance measurements, J. Geophys. Res.-Atmos., 105, 9791–9806, https://doi.org/10.1029/2000jd900040, 2000.
Ehhalt, D. and Prather, M.: Atmospheric chemistry and greenhouse gases, Clim. Chang. Sci. Basis, 239–287, https://www.ipcc.ch/report/ar3/wg1/chapter-4-atmospheric-chemistry-and-greenhouse-gases/ (last access: 1 February 2025), 2001.
Eltahan, M., Shokr, M., and Sherif, A. O.: Simulation of severe dust events over egypt using tuned dust schemes in Weather Research Forecast (WRF-Chem), Atmosphere, 9, 246, https://doi.org/10.3390/atmos9070246, 2018.
Emmons, L. K., Walters, S., Hess, P. G., Lamarque, J.-F., Pfister, G. G., Fillmore, D., Granier, C., Guenther, A., Kinnison, D., Laepple, T., Orlando, J., Tie, X., Tyndall, G., Wiedinmyer, C., Baughcum, S. L., and Kloster, S.: Description and evaluation of the Model for Ozone and Related chemical Tracers, version 4 (MOZART-4), Geosci. Model Dev., 3, 43–67, https://doi.org/10.5194/gmd-3-43-2010, 2010.
Emmons, L. K., Schwantes, R. H., Orlando, J. J., Tyndall, G., Kinnison, D., Lamarque, J. F., Marsh, D., Mills, M. J., Tilmes, S., Bardeen, C., Buchholz, R. R., Conley, A., Gettelman, A., Garcia, R., Simpson, I., Blake, D. R., Meinardi, S., and Pétron, G.: The Chemistry Mechanism in the Community Earth System Model Version 2 (CESM2), J. Adv. Model. Earth Sy., 12, e2019MS001882, https://doi.org/10.1029/2019MS001882, 2020.
Environment Agency – Abu Dhabi: Abu Dhabi Air Emissions Inventory, https://www.ead.gov.ae/-/media/Project/EAD/EAD/Documents/Resources/Abu-Dhabi-Air-Emission-Inventory-2018.pdf (last access: 10 June 2024), 2018.
Filioglou, M., Giannakaki, E., Backman, J., Kesti, J., Hirsikko, A., Engelmann, R., O'Connor, E., Leskinen, J. T. T., Shang, X., Korhonen, H., Lihavainen, H., Romakkaniemi, S., and Komppula, M.: Optical and geometrical aerosol particle properties over the United Arab Emirates, Atmos. Chem. Phys., 20, 8909–8922, https://doi.org/10.5194/acp-20-8909-2020, 2020.
Fiore, A., Jacob, D. J., Liu, H., Yantosca, R. M., Fairlie, T. D., and Li, Q.: Variability in surface ozone background over the United States: Implications for air quality policy, J. Geophys. Res.-Atmos., 108, 4787–2003, https://doi.org/10.1029/2003JD003855, 2003.
Floutsi, A. A., Korras-carraca, M. B., Matsoukas, C., Hatzianastassiou, N., and Biskos, G.: Climatology and Trends of Aerosol Optical Depth over the Mediterranean Basin during the Last 12 Years (2002–2014) Based on Collection 006 MODIS-Aqua Data, Sci. Total Environ., 551–552, 292–303, https://doi.org/10.1016/j.scitotenv.2016.01.192, 2016.
Fonseca, R. and Francis, D.: Satellite derived trends and variability of CO2 concentrations in the Middle East during 2014–2023, Frontiers in Environmental Science, 11, 1289142, https://doi.org/10.3389/fenvs.2023.1289142, 2023.
Fonseca, R., Temimi, M., Thota, M. S., Nelli, N. R., Weston, M. J., Suzuki, K., Uchida, J., Kumar, K. N., Branch, O., Wehbe, Y., Al Hosari, T., Al Shamsi, N., and Shalaby, A.: On the analysis of the performance of WRF and nicam in a hyperarid environment, Weather Forecast., 35, 891–919, https://doi.org/10.1175/WAF-D-19-0210.1, 2020.
Fonseca, R., Francis, D., Weston, M., Nelli, N., Farah, S., Wehbe, Y., Alhosari, T., Teixido, O., and Mohamed, R.: Sensitivity of summertime convection to aerosol loading and properties in the United Arab Emirates, Atmosphere, 12, 1687, https://doi.org/10.3390/atmos12121687, 2021.
Fonseca, R., Francis, D., Nelli, N., Farrah, S., Wehbe, Y., Al Hosari, T., and Al Mazroui, A.: Assessment of the WRF model as a guidance tool into cloud seeding operations in the United Arab Emirates, Earth and Space Science, 9, e2022EA002269, https://doi.org/10.1029/2022EA002269, 2022a.
Fonseca, R., Francis, D., Nelli, N., and Thota, M.: Climatology of the heat low and the intertropical discontinuity in the Arabian Peninsula, Int. J. Climatol., 42, 1092–1117, https://doi.org/10.1002/joc.7291, 2022b.
Francis, D., Fonseca, R., Nelli, N., Cuesta, J., Weston, M., Evan, A., and Temimi, M.: The Atmospheric Drivers of the Major Saharan Dust Storm in June 2020, Geophys. Res. Lett., 47, e2020GL090102, https://doi.org/10.1029/2020GL090102, 2020.
Francis, D., Temimi, M., Fonseca, R., Nelli, N. R., Abida, R., Weston, M., and Wehbe, Y.: On the analysis of a summertime convective event in a hyperarid environment, Q. J. Roy. Meteor. Soc., 147, 501–525, https://doi.org/10.1002/qj.3930, 2021.
Francis, D., Fonseca, R., Nelli, N., Teixido, O., Mohamed, R., and Perry, R.: Increased Shamal winds and dust activity over the Arabian Peninsula during the COVID-19 lockdown period in 2020, Aeolian Res., 55, 100786, https://doi.org/10.1016/j.aeolia.2022.100786, 2022a.
Francis, D., Nelli, N., Fonseca, R., Weston, M., Flamant, C., and Cherif, C.: The dust load and radiative impact associated with the June 2020 historical Saharan dust storm, Atmos. Environ., 268, 118808, https://doi.org/10.1016/j.atmosenv.2021.118808, 2022b.
Francis, D., Weston, M., Fonseca, R., Temimi, M., and Alsuwaidi, A.: Trends and variability in methane concentrations over the Southeastern Arabian Peninsula, Frontiers in Environmental Science, 11, 1177877, https://doi.org/10.3389/fenvs.2023.1177877, 2023.
Gao, J., Li, Y., Xie, Z., Wang, L., Hu, B., and Bao, F.: Which aerosol type dominate the impact of aerosols on ozone via changing photolysis rates?, Sci. Total Environ., 854, 158580, https://doi.org/10.1016/j.scitotenv.2022.158580, 2023.
Gao, Z. and Zhou, X.: A review of the CAMx, CMAQ, WRF-Chem and NAQPMS models: Application, evaluation and uncertainty factors, Environ. Pollut., 343, 123183, https://doi.org/10.1016/j.envpol.2023.123183, 2024.
Gauss, M.: Radiative forcing in the 21st century due to ozone changes in the troposphere and the lower stratosphere, J. Geophys. Res., 108, 4292, https://doi. org/10.1029/2002JD002624-2003, 2003.
Georgiou, G. K., Christoudias, T., Proestos, Y., Kushta, J., Hadjinicolaou, P., and Lelieveld, J.: Air quality modelling in the summer over the eastern Mediterranean using WRF-Chem: chemistry and aerosol mechanism intercomparison, Atmos. Chem. Phys., 18, 1555–1571, https://doi.org/10.5194/acp-18-1555-2018, 2018.
Grell, G. a., Peckham, S. E., Schmitz, R., McKeen, S. A., Frost, G., Skamarock, W. C., and Eder, B.: Fully coupled “online” chemistry within the WRF model, Atmos. Environ., 39, 6957–6975, https://doi.org/10.1016/j.atmosenv.2005.04.027, 2005.
Griffin, D., McLinden, C. A., Boersma, F., Bourassa, A., Dammers, E., Degenstein, D., Eskes, H., Fehr, L., Fioletov, V., Hayden, K., Kharol, S. K., Li, S. M., Makar, P., Martin, R. V., Mihele, C., Mittermeier, R. L., Krotkov, N., Sneep, M., Lamsal, L. N., Ter Linden, M., and Zhao, X.: High-Resolution Mapping of Nitrogen Dioxide With TROPOMI: First Results and Validation Over the Canadian Oil Sands, Geophys. Res. Lett., 46, 1049–1060, https://doi.org/10.1029/2018GL081095, 2019.
Guenther, A. B., Jiang, X., Heald, C. L., Sakulyanontvittaya, T., Duhl, T., Emmons, L. K., and Wang, X.: The Model of Emissions of Gases and Aerosols from Nature version 2.1 (MEGAN2.1): an extended and updated framework for modeling biogenic emissions, Geosci. Model Dev., 5, 1471–1492, https://doi.org/10.5194/gmd-5-1471-2012, 2012.
Guo, Y., Roychoudhury, C., Mirrezaei, M. A., Kumar, R., Sorooshian, A., and Arellano, A. F.: Investigating ground-level ozone pollution in semi-arid and arid regions of Arizona using WRF-Chem v4.4 modeling, Geosci. Model Dev., 17, 4331–4353, https://doi.org/10.5194/gmd-17-4331-2024, 2024a.
He, S. and Carmichael, G. R.: Sensitivity of photolysis rates and ozone production in the troposphere to aerosol properties, J. Geophys. Res., 104, 26307–26324, https://doi.org/10.1029/1999JD900789, 1999.
Hersbach, H., Bell, B., Berrisford, P., Hirahara, S., Horányi, A., Muñoz‐Sabater, J., Nicolas, J., Peubey, C., Radu, R., Schepers, D., Simmons, A., Soci, C., Abdalla, S., Abellan, X., Balsamo, G., Bechtold, P., Biavati, G., Bidlot, J., Bonavita, M., Chiara, G.D., Dahlgren, P., Dee, D., Diamantakis, M., Dragani, R., Flemming, J., Forbes, R.G., Fuentes, M., Geer, A.J., Haimberger, L., Healy, S.B., Hogan, R.J., Holm, E.V., Janisková, M., Keeley, S.P., Laloyaux, P., Lopez, P., Lupu, C., Radnoti, G., Rosnay, P.D., Rozum, I., Vamborg, F., Villaume, S., and Thepaut, J.: The ERA5 global reanalysis, Q. J. Roy. Meteor. Soc., 146, 1999–2049, https://doi.org/10.1002/qj.3803, 2020.
Hersbach, H., Bell, B., Berrisford, P., Biavati, G., Horanyi, A., Munoz Sabater, J., Nicolas, J., Peubey, C., Radu, R., Rozum, I., Schepers, D., Simmons, A., Soci, C., Dee, D., and Thepaut, J.-N.: ERA5 hourly data on single levels from 1940 to present, Copernicus Climate Change Service Climate Data Store [data set], https://doi.org/10.24381/cds.adbb2d47, 2023a.
Hersbach, H., Bell, B., Berrisford, P., Biavati, G., Horanyi, A., Munoz Sabater, J., Nicolas, J., Peubey, C., Radu, R., Rozum, I., Schepers, D., Simmons, A., Soci, C., Dee, D., and Thepaut, J.-N.: ERA5 hourly data on pressure levels from 1940 to present, Copernicus Climate Change Service Climate Data Store [data set], https://doi.org/10.24381/cds.bd0915c6, 2023b.
Holben, B. N., Eck, T. F., Slutsker, I., Tanre, D., Buis, J. P., Setzer, A., Vermote, E., Reagan, J. A., Kaufman, Y. J., Nakajima, T., Lavenu, F., Jankowiak, I., and Smirnov, A.: AERONET – A federated instrument network and data archive for aerosol characterization, Remote Sens. Environ., 66, 1–16, https://doi.org/10.1016/s0034-4257(98)00031-5, 1998.
Hong, S. Y.: A new stable boundary-layer mixing scheme and its impact on the simulated East Asian summer monsoon, Q. J. Roy. Meteor. Soc., 136, 1481–1496, https://doi.org/10.1002/qj.665, 2010.
Hoshyaripour, G., Brasseur, G., Andrade, M. F., Gavidia-Calderón, M., Bouarar, I., and Ynoue, R. Y.: Prediction of ground-level ozone concentration in São Paulo, Brazil: Deterministic versus statistic models, Atmos. Environ., 145, 365–375, https://doi.org/10.1016/j.atmosenv.2016.09.061, 2016.
Hsu, N. C., M.-J. Jeong, C. Bettenhausen, A. M. Sayer, R. Hansell, C. S. Seftor, J. Huang, and S.-C. Tsay: Enhanced Deep Blue aerosol retrieval algorithm: The second generation, J. Geophys. Res.-Atmos., 118, 9296–9315, https://doi.org/10.1002/jgrd.50712, 2013.
Hu, C., Kang, P., Jaffe, D. A., Li, C., Zhang, X., Wu, K., and Zhou, M.: Understanding the impact of meteorology on ozone in 334 cities of China, Atmos. Environ., 248, 118221, https://doi.org/10.1016/j.atmosenv.2021.118221, 2021.
Iacono, M. J., Delamere, J. S., Mlawer, E. J., Shephard, M. W., Clough, S. A., and Collins, W. D.: Radiative Forcing by Long-Lived Greenhouse Gases: Calculations with the AER Radiative Transfer Models, J. Geophys. Res.-Atmos., 113, D13103, https://doi.org/10.1029/2008JD009944, 2008.
Ialongo, I., Virta, H., Eskes, H., Hovila, J., and Douros, J.: Comparison of TROPOMI/Sentinel-5 Precursor NO2 observations with ground-based measurements in Helsinki, Atmos. Meas. Tech., 13, 205–218, https://doi.org/10.5194/amt-13-205-2020, 2020.
Ivatt, P. D. and Evans, M. J.: Improving the prediction of an atmospheric chemistry transport model using gradient-boosted regression trees, Atmos. Chem. Phys., 20, 8063–8082, https://doi.org/10.5194/acp-20-8063-2020, 2020.
Jacobson, M. Z.: Studying the effects of aerosols on vertical photolysis rate coefficient and temperature profiles over an urban airshed Gas photochemistry Gasto-pxticle conversion Wind speed Wind direction Air pressure Nucleation Freezing/Melting, J. Geophys. Res., 103, 10593–10604, https://doi.org/10.1029/98JD00287, 1998.
Jena, C., Ghude, S. D., Kumar, R., Debnath, S., Govardhan, G., Soni, V. K., Kulkarni, S. H., Beig, G., and Nanjundiah, R. S.: Performance of high resolution (400 m) PM2.5 forecast over Delhi, Sci. Rep., 11, 4101, https://doi.org/10.1038/s41598-021-83467-8, 2021.
Kain, J. S.: The Kain-Fritsch Convective Parameterization: An Update, J. Appl. Meteorol., 43, 170–181, https://doi.org/10.1175/1520-0450(2004)043<0170:TKCPAU>2.0.CO;2, 2004.
Karagulian, F., Temimi, M., Ghebreyesus, D., Weston, M., Kondapalli, N. K., Valappil, V. K., Aldababesh, A., Lyapustin, A., Chaouch, N., Al Hammadi, F., and Al Abdooli, A.: Analysis of a severe dust storm and its impact on air quality conditions using WRF-Chem modeling, satellite imagery, and ground observations, Air Qual. Atmos. Hlth., 12, 453–470, https://doi.org/10.1007/s11869-019-00674-z, 2019.
Karumuri, R. K., Dasari, H. P., Gandham, H., Viswanadhapalli, Y., Madineni, V. R., and Hoteit, I.: Impact of COVID-19 lockdown on the ambient air-pollutants over the Arabian Peninsula, Frontiers in Environmental Science, 10, 963145, https://doi.org/10.3389/fenvs.2022.963145, 2022.
Kerkweg, A. and Jöckel, P.: The 1-way on-line coupled atmospheric chemistry model system MECO(n) – Part 1: Description of the limited-area atmospheric chemistry model COSMO/MESSy, Geosci. Model Dev., 5, 87–110, https://doi.org/10.5194/gmd-5-87-2012, 2012.
Koo, Y. S., Kim, S. T., Cho, J. S., and Jang, Y. K.: Performance evaluation of the updated air quality forecasting system for Seoul predicting PM10, Atmos. Environ., 58, 56–69, https://doi.org/10.1016/j.atmosenv.2012.02.004, 2012.
Krol, M., Houweling, S., Bregman, B., van den Broek, M., Segers, A., van Velthoven, P., Peters, W., Dentener, F., and Bergamaschi, P.: The two-way nested global chemistry-transport zoom model TM5: algorithm and applications, Atmos. Chem. Phys., 5, 417–432, https://doi.org/10.5194/acp-5-417-2005, 2005.
Kaufman, Y. J., Tanre, D., Rmer, L. A., Vermote, E. F., Chu, A., and Holben, B. N.: Operational remote sensing of tropospheric aerosol over land from EOS moderate resolution imaging spectroradiometer, J. Geophys. Res., 102, 17051–17067, https://doi.org/10.1029/96JD03988, 1997.
Kumar, R., Naja, M., Pfister, G. G., Barth, M. C., Wiedinmyer, C., and Brasseur, G. P.: Simulations over South Asia using the Weather Research and Forecasting model with Chemistry (WRF-Chem): chemistry evaluation and initial results, Geosci. Model Dev., 5, 619–648, https://doi.org/10.5194/gmd-5-619-2012, 2012.
Kumar, R., Barth, M. C., Pfister, G. G., Monache, L. D., Lamarque, J. F., Archer-Nicholls, S., Tilmes, S., Ghude, S. D., Wiedinmyer, C., Naja, M., and Walters, S.: How Will Air Quality Change in South Asia by 2050?, J. Geophys. Res.-Atmos., 123, 1840–1864, https://doi.org/10.1002/2017JD027357, 2018.
Kumar, R., Bhardwaj, P., Pfister, G., Drews, C., Honomichl, S., and D'attilo, G.: Description and evaluation of the fine particulate matter forecasts in the NCAR regional air quality forecasting system. Atmosphere, 12, 302, https://doi.org/10.3390/atmos12030302, 2021.
Labow, G. J., Ziemke, J. R., McPeters, R. D., Haffner, D. P., and Bhartia, P. K.: A total ozone-dependent ozone profile climatology based on ozonesondes and Aura MLS data, J. Geophys. Res., 120, 2537–2545, https://doi.org/10.1002/2014JD022634, 2015.
Lambert, J.-C., Keppens, A., Compernolle, S., Eichmann, K.-U., de Graaf, M., Hubert, D., Langerock, B., Ludewig, A., Sha, M. K., Verhoelst, T., Wagner, T., Ahn, C., Argyrouli, A., Balis, D., Chan, K. L., Coldewey-Egbers, M., De Smedt, I., Eskes, H., Fjæraa, A. M., Garane, K., Gleason, J. F., Goutail, F., Granville, J., Hedelt, P., Heue, K.-P., Jaross, G., Kleipool, Q., Koukouli,M. L., Lutz, R., Martinez Velarte, M. C., Michailidis, K., Pseftogkas, A., Nanda, S., Niemeijer, S., Pazmiño, A., Pinardi, G., Richter, A., Rozemeijer, N., Sneep, M., Stein Zweers, D., Theys, N., Tilstra, G., Torres, O., Valks, P., van Geffen, J., Vigouroux, C., Wang, P., and Weber, M.: Quarterly Validation Report of the Copernicus Sentinel-5 Precursor Operational Data Products #25, S5P MPC Routine Operations Consolidated Validation Report series, Issue #25, Version 25.01.00, 215 pp., https://mpc-vdaf.tropomi.eu (last access: 16 December 2024), 2023.
Landgraf, J., aan de Brugh, J., Scheepmaker, R., Borsdorff, T., Hu, H., Houweling, S., Butz, A., Aben, I., and Hasekamp, O.: Carbon monoxide total column retrievals from TROPOMI shortwave infrared measurements, Atmos. Meas. Tech., 9, 4955–4975, https://doi.org/10.5194/amt-9-4955-2016, 2016.
Levy, R. C., Mattoo, S., Munchak, L. A., Remer, L. A., Sayer, A. M., Patadia, F., and Hsu, N. C.: The Collection 6 MODIS aerosol products over land and ocean, Atmos. Meas. Tech., 6, 2989–3034, https://doi.org/10.5194/amt-6-2989-2013, 2013.
Levy, R., Hsu, C., et al.: MODIS Atmosphere L2 Aerosol Product, NASA MODIS Adaptive Processing System, Goddard Space Flight Center [data set], USA, https://doi.org/10.5067/MODIS/MOD04_L2.061, 2015.
Li, J., Wang, Z. F., Wang, X., Yamaji, K., Takigawa, M., Kanaya, Y., Pochanart, P., Liu, Y., Irie, H., Hu, B., Tanimoto, H., and Akimoto, H.: Impacts of aerosols on summertime tropospheric photolysis frequencies and photochemistry over Central Eastern China, Atmos. Environ., 45, 1817–1829, https://doi.org/10.1016/j.atmosenv.2011.01.016, 2011.
Li, T. Y., Deng, X. J., Li, Y., Song, Y. S., Li, L. Y., Tan, H. B., and Wang, C. L.: Transport paths and vertical exchange characteristics of haze pollution in Southern China, Sci. Total Environ., 625, 1074–1087, https://doi.org/10.1016/j.scitotenv.2017.12.235, 2018.
Li, Y., Gibson, J. M. D., Jat, P., Puggioni, G., Hasan, M., West, J. J., Vizuete, W., Sexton, K., and Serre, M.: Burden of disease attributed to anthropogenic air pollution in the United Arab Emirates: Estimates based on observed air quality data, Sci. Total Environ., 408, 5784–5793, https://doi.org/10.1016/j.scitotenv.2010.08.017, 2010.
Li, Z., Zhao, X., Kahn, R., Mishchenko, M., Remer, L., Lee, K.-H., Wang, M., Laszlo, I., Nakajima, T., and Maring, H.: Uncertainties in satellite remote sensing of aerosols and impact on monitoring its long-term trend: a review and perspective, Ann. Geophys., 27, 2755–2770, https://doi.org/10.5194/angeo-27-2755-2009, 2009.
Liu, F., Tao, Z., Beirle, S., Joiner, J., Yoshida, Y., Smith, S. J., Knowland, K. E., and Wagner, T.: A new method for inferring city emissions and lifetimes of nitrogen oxides from high-resolution nitrogen dioxide observations: a model study, Atmos. Chem. Phys., 22, 1333–1349, https://doi.org/10.5194/acp-22-1333-2022, 2022.
Lou, S. J., Liao, H., and Zhu, B.: Impacts of aerosols on surface-layer ozone concentrations in China through heterogeneous reactions and changes in photolysis rates, Atmos. Environ., 85, 123–138, https://doi.org/10.1016/j.atmosenv.2013.12.004, 2014.
Lu, X., Zhang, L., and Shen, L.: Meteorology and Climate Influences on Tropospheric Ozone: a Review of Natural Sources, Chemistry, and Transport Patterns, Current Pollution Reports, 5, 238–260, https://doi.org/10.1007/s40726-019-00118-3, 2019.
Madronich, S.: Photodissociation in the atmosphere: 1. Actinic flux and the effects of ground reflections and clouds, J. Geophys. Res.-Atmos., 92, 9740–9752, https://doi.org/10.1029/JD092iD08p09740, 1987.
Manders, A. M. M., Builtjes, P. J. H., Curier, L., Denier van der Gon, H. A. C., Hendriks, C., Jonkers, S., Kranenburg, R., Kuenen, J. J. P., Segers, A. J., Timmermans, R. M. A., Visschedijk, A. J. H., Wichink Kruit, R. J., van Pul, W. A. J., Sauter, F. J., van der Swaluw, E., Swart, D. P. J., Douros, J., Eskes, H., van Meijgaard, E., van Ulft, B., van Velthoven, P., Banzhaf, S., Mues, A. C., Stern, R., Fu, G., Lu, S., Heemink, A., van Velzen, N., and Schaap, M.: Curriculum vitae of the LOTOS–EUROS (v2.0) chemistry transport model, Geosci. Model Dev., 10, 4145–4173, https://doi.org/10.5194/gmd-10-4145-2017, 2017.
Mathworks: MATLAB. Maths. Graphic, https://uk.mathworks.com/products/matlab.html (last access: 20 November 2024), 2023.
Menut, L., Bessagnet, B., Briant, R., Cholakian, A., Couvidat, F., Mailler, S., Pennel, R., Siour, G., Tuccella, P., Turquety, S., and Valari, M.: The CHIMERE v2020r1 online chemistry-transport model, Geosci. Model Dev., 14, 6781–6811, https://doi.org/10.5194/gmd-14-6781-2021, 2021.
Morrison, H., Thompson, G., and Tatarskii, V.: Impact of cloud microphysics on the development of trailing stratiform precipitation in a simulated squall line: Comparison of one- and two-moment schemes, Mon. Weather Rev., 137, 991–1007, https://doi.org/10.1175/2008MWR2556.1, 2009.
Mostamandi, S., Ukhov, A., Engelbrecht, J., Shevchenko, I., Osipov, S., and Stenchikov, G.: Fine and coarse dust effects on radiative forcing, mass deposition, and solar devices over the Middle East, J. Geophys. Res.-Atmos., 128, e2023JD039479, https://doi.org/10.1029/2023JD039479, 2023.
Mukherjee, T., Vinoj, V., Midya, S. K., and Adhikary, B.: Aerosol radiative impact on surface ozone during a heavy dust and biomass burning event over South Asia, Atmos. Environ., 223, 117201, https://doi.org/10.1016/j.atmosenv.2019.117201, 2020.
National Center for Atmospheric Research Download WRF-CHEM Processors (NCAR): https://www.acom.ucar.edu/wrf-chem/download.shtml, last access: 10 July 2023.
National Centers for Environmental Prediction/National Weather Service/National Oceanic and Atmospheric Administration/United States Department of Commerce (NCEP/NWS/NOAA/USDC): NCEP FNL Operational Model Global Tropospheric Analyses, continuing from July 1999, Research Data Archive at the National Center for Atmospheric Research, Computational and Information Systems Labotory [data set], https://doi.org/10.5065/D6M043C6, 2000.
Nelli, N., Fissehaye, S., Francis, D., Fonseca, R., Temimi, M., Weston, M., Abida, R., and Nesterov, O.: Characteristics of atmospheric aerosols over the UEA inferred from CALIPSO and sun photometer aerosol optical depth, Earth and Space Science, 8, e2020EA001360, https://doi.org/10.1029/2020EA001360, 2021.
Nelli, N., Francis, D., Fonseca, R., Bosc, E., Addad, Y., Temimi, M., Abida, R., Weston, M., and Cherif, C.: Characterization of the atmospheric circulation near the Empty Quarter Desert during major weather events, Frontiers in Environmental Science, 10, 972380, https://doi.org/10.3389/fenvs.2022.972380, 2022.
Nelli, N., Francis, D., Alkatheeri, A., and Fonseca, R.: Evaluation of Reanalysis and Satellite Products against Ground-Based Observations in a Desert Environment, Remote Sensing, 16, 3593, https://doi.org/10.3390/rs16193593, 2024a.
Nelli, N., Francis, D., Fonseca, R., Masson, O., Sow, M., and Bosc, E.: First measurements of electric field variability during fog events in the United Arab Emirates, J. Arid Environ., 220, 105096, https://doi.org/10.1016/j.jaridenv.2023.105096, 2024b.
Nelli, N., Francis, D., Sow, M., Fonseca, R., Alkatheeri, A., Bosc, E., and Bergametti, G.: The Wind-Blown Sand Experiment in the Empty Quarter Desert: Roughness Length and Saltation Characteristics, Earth and Space Science, 11, e2024EA003512, https://doi.org/10.1029/2024EA003512, 2024c.
Nelli, N. R., Temimi, M., Fonseca, R. M., Weston, M. J., Thota, M. S., Valappil, V. K., Branch, O., Wulfmeyer, V., Wehbe, Y., Al Hosary, T., Shalaby, A., Al Shamsi, N., and Al Naqbi, H.: Impact of roughness length on WRF simulated land-atmospheres interactions over a hyper-arid region, Earth and Space Science, 7, e2020EA001165, https://doi.org/10.1029/2020EA001165, 2020.
Nhu, T., Do, N., Ngo, X. T., Pham, V. H., Vuong, N. L., Le, H. A., and Pham, C. T.: Application of WRF-Chem to simulate air quality over Northern Vietnam, Environ. Sci. Pollut. R., 2016, 12067–12081, https://doi.org/10.1007/s11356-020-08913-y, 2021.
Olivier, J., Peters, J., Granier, C., Pétron, G., Müller, J. F., and Wallens, S.: Present and future surface emissions of atmospheric compounds POET Report #2 EU project EVK2–1999–0001, http://accent.aero.jussieu.fr/Documents/del2_final.doc (last access: 10 September 2024) 2003.
Parajuli, S. P., Stenchikov, G. L., Ukhov, A., and Kim, H.: Dust Emission Modeling Using a New High-Resolution Dust Source Function in WRF-Chem With Implications for Air Quality, J. Geophys. Res.-Atmos., 124, 10109–10133, https://doi.org/10.1029/2019JD030248, 2019.
Parajuli, S. P., Stenchikov, G. L., Ukhov, A., Mostamandi, S., Kucera, P. A., Axisa, D., Gustafson Jr., W. I., and Zhu, Y.: Effect of dust on rainfall over the Red Sea coast based on WRF-Chem model simulations, Atmos. Chem. Phys., 22, 8659–8682, https://doi.org/10.5194/acp-22-8659-2022, 2022.
Parajuli, S. P., Stenchikov, G. L., Ukhov, L., Morrison, H., Shevchenko, I., and Mostamandi, S.: Simulation of a Dust-And-Rain Event Across the Red Sea Using WRF-Chem, J. Geophys. Res.-Atmos., 128, e2022JD038384, https://doi.org/10.1029/2022JD038384, 2023.
Powers, J. G., Klemp, J. B., Skamarock, W. C., Davis, C. A., Dudhia, J., Gill, D. O., Coen, J. L., Gochis, D. J., Ahmadov, R., Peckham, S. E., Grell, G. A., Michalakes, J., Trahan, S., Benjamin, S. G., Alexander, C. R., Dimego, G. J., Wang, W., Schwartz, C. S., Romine, G. S., Liu, Z., Snyder, C., Chen, F., Barlage, M. J., Yu, W., and Duda, M. G: The weather research and forecasting model: Overview, system efforts, and future directions, B. Am. Meteorol. Soc., 98, 1717–1737, https://doi.org/10.1175/BAMS-D-15-00308.1, 2017.
Ramadan, E.: Sustainable Urbanization in the Arabian Gulf Region: Problems and Challenges, Arts and Social Sciences Journal, 6, 109, https://doi.org/10.4172/2151- 6200.1000109 2015.
Qu, Y., Voulgarakis, A., Wang, T., Kasoar, M., Wells, C., Yuan, C., Varma, S., and Mansfield, L.: A study of the effect of aerosols on surface ozone through meteorology feedbacks over China, Atmos. Chem. Phys., 21, 5705–5718, https://doi.org/10.5194/acp-21-5705-2021, 2021.
Reddy, K. K., Naja, M., Ojha, N., Mahesh, P., and Lal, S.: Influences of the boundary layer evolution on surface ozone variations at a tropical rural site in India, J. Earth Syst. Sci., 121, 911–922, https://doi.org/10.1007/s12040-012-0200-z, 2012.
Remer, L. A., Kaufman, Y. J., Tanré, D., Mattoo, S., Chu, D. A., Martins, J. V., Li, R. R., Ichoku, C., Levy, R. C., Kleidman, R. G., and Eck, T. F.: The MODIS Aerosol Algorithm, Products, and Validation, J. Atmos. Sci., 62, 947–973, https://doi.org/10.1175/JAS3385.1, 2005.
Remer, L. A., Kleidman, R. G., Levy, R. C., Kaufman, Y. J., Tanré, D., Mattoo, S., Martins, J. V., Ichoku, C., Koren, I., Yu, H., and Holben, B. N.: Global Aerosol Climatology from the MODIS Satellite Sensors, J. Geophys. Res.-Atmos., 113, D14S07, https://doi.org/10.1029/2007JD009661, 2008.
Ritter, M., Müller, M. D., Tsai, M. Y., and Parlow, E.: Air pollution modeling over very complex terrain: An evaluation of WRF-Chem over Switzerland for two 1-year periods, Atmos. Res., 132–133, 209–222, https://doi.org/10.1016/j.atmosres.2013.05.021, 2013.
Sayer, A. M., Hsu, N. C., Bettenhausen, C., and Jeong, M.-J.: Validation and uncertainty estimates for MODIS Collection 6 “Deep Blue” aerosol data, J. Geophys. Res.-Atmos., 118, 7864–7872, https://doi.org/10.1002/jgrd.50600, 2014a.
Sayer, A. M., Munchak, L. A.,Hsu, N. C., Levy, R. C., Bettenhausen, C., and Jeong, M.-J.: MODIS Collection 6 aerosol products: Comparison between Aqua's Deep Blue, Dark Target, and “merged” data sets, and usage recommendations, J. Geophys. Res.-Atmos., 119, 13965–13989, https://doi.org/10.1002/2014JD022453, 2014b.
Sayer, A. M., Hsu, N. C., Bettenhausen, C., Jeong, M.-J., and Meister, G.: Effect of MODISTerra radiometric calibration improvements on Collection 6 Deep Blue aerosol products: Validation and Terra/Aqua consistency, J. Geophys. Res.-Atmos., 120, 12157–12174, https://doi.org/10.1002/2015JD023878, 2015.
Shahbaz, M., Sbia, R., Hamdi, H., and Ozturk, I.: Economic growth, electricity consumption, urbanization and environmental degradation relationship in United Arab Emirates. Ecol. Indic., 45, 622–631, https://doi.org/10.1016/j.ecolind.2014.05.022, 2014.
Shami, A. Al, Aawar, E. Al, Baayoun, A., Saliba, N. A., Kushta, J., Christoudias, T., and Lakkis, I.: Updated national emission inventory and comparison with the Emissions Database for Global Atmospheric Research (EDGAR): case of Lebanon, Environ. Sci. Pollut. Res., 29, 30193–30205, https://doi.org/10.1007/s11356-021-17562-8, 2022.
Shi, S., Zhu, B., Tang, G., Liu, C., An, J., Liu, D., Xu, J., Xu, H., Liao, H., and Zhang, Y.: Observational Evidence of Aerosol Radiation Modifying Photochemical Ozone Profiles in the Lower Troposphere, Geophys. Res. Lett., 49, e2022GL099274, https://doi.org/10.1029/2022GL099274, 2022.
Sicard, P., Crippa, P., De Marco, A., Castruccio, S., Giani, P., Cuesta, J., Paoletti, E., Feng, Z., and Anav, A.: High spatial resolution WRF-Chem model over Asia: Physics and chemistry evaluation, Atmos. Environ., 244, 118004, https://doi.org/10.1016/j.atmosenv.2020.118004, 2021.
Skamarock, W., Klemp, J., Dudhia, J., Gill, D. O., Barker, D., Duda, M. G., Huang, X.-Y., Wang, W., and Powers, J. G.: A Description of the Advanced Research WRF Version 3. University Corporation for Atmospheric Research, https://doi.org/10.5065/D68S4MVH, 2008.
Srinivas, R., Panicker, A. S., Parkhi, N. S., Peshin, S. K., and Beig, G.: Sensitivity of online coupled model to extreme pollution event over a mega city Delhi, Atmos. Pollut. Res., 7, 25–30, https://doi.org/10.1016/j.apr.2015.07.001, 2016.
Taraphdar, S., Pauluis, O. M., Xue, L., Liu, C., Rasmussen, R., Ajayamohan, R. S., Tessendorf, S., Jing, X., Chen, S., and Grabowski, W. W.: WRF gray zone simulations of precipitation over the Middle-East and the UAE: Impacts of physical parameterizations and resolution, J. Geophys. Res.-Atmos., 126, e2021JD034648, https://doi.org/10.1029/2021JD034648, 2021.
Teixido, O., Tobias, A., Massague, J., Mohamed, R., Ekaabi, R., Hamed, H. I., Perry, R., Querol, X. and Al Hosani, S.: The influence of COVID-19 preventive measures on the air quality in Abu Dhabi (United Arab Emirates), Air Qual. Atmos. Hlth., 14, 1071–1079, https://doi.org/10.1007/s11869-021-01000-2, 2021.
Temimi, M., Fonseca, R., Nelli, N., Valappil, V. K., Weston, M. J., Thota, M. S., Wehbe, Y., and Yousef, L.: On the analysis of ground-based microwave radiometer data during fog conditions, Atmos. Res., 231, 104652, https://doi.org/10.1016/j.atmosres.2019.104652, 2020a.
Temimi, M., Fonseca, R., Nelli, N., Weston, M., Thota, M., Valappil, V., Branch, O., Wizemann, H., Kumar Kondapalli, N., Wehbe, Y., Hosary, T. AL, Shalaby, A., Shamsi, N. A. L., and Naqbi, H. A. L.: Assessing the Impact of Changes in Land Surface Conditions on WRF Predictions in Arid Regions, J. Hydrometeorol., 21, 2829–2853, https://doi.org/10.1175/JHM-D-20-0083.1, 2020b.
Tewari, M., Chen, F., Wang, W., Dudhia, J., Lemone, M. A., Mitchell, K., Ek, M., Gayno, G., Wegiel, J., and Cuenca, R. H.: Implementation and verification of the united NOAH land surface model in the WRF model, https://www2.mmm.ucar.edu/wrf/users/physics/phys_refs/LAND_SURFACE/noah.pdf (last access: 20 November 2024), 2004.
Tie, X.: Effect of clouds on photolysis and oxidants in the troposphere, J. Geophys. Res., 108, 4642, https://doi.org/10.1029/2003jd003659, 2003.
Tie, X., Brasseur, G., Emmons, L., Horowitz, L., and Kinnison, D.: Effects of aerosols on tropospheric oxidants: A global model study, J. Geophys. Res., 106, 22931, https://doi.org/10.1029/2001JD900206-2001, 2001.
Ukhov, A., Ahmadov, R., Grell, G., and Stenchikov, G.: Improving dust simulations in WRF-Chem v4.1.3 coupled with the GOCART aerosol module, Geosci. Model Dev., 14, 473–493, https://doi.org/10.5194/gmd-14-473-2021, 2021.
Van Geffen, J. H. G. M., Eskes, H. J., Boersma, K. F., and Veefkind, J. P.: TROPOMI ATBD of the total and tropospheric NO2 data products document number: S5P-KNMI-L2-0005-RP, https://sentinel.esa.int/documents/247904/2476257/sentinel-5p-tropomi-atbd-no2-data-products (last access: 10 July 2023), 2023.
Veefkind, J. P., Aben, I., McMullan, K., Förster, H., de Vries, J., Otter, G., Claas, J., Eskes, H. J., de Haan, J. F., Kleipool, Q., van Weele, M., Hasekamp, O., Hoogeveen, R., Landgraf, J., Snel, R., Tol, P., Ingmann, P., Voors, R., Kruizinga, B., Vink, R., Visser, H., and Levelt, P. F.: TROPOMI on the ESA Sentinel-5 Precursor: A GMES mission for global observations of the atmospheric composition for climate, air quality and ozone layer applications, Remote Sens. Environ., 120, 70–83, https://doi.org/10.1016/j.rse.2011.09.027, 2012.
Veefkind, J. H. G. M.,, Keppens, A., and de Haan, J.: TROPOMI ATBD Ozone Profile, https://sentinel.esa.int/documents/247904/2476257/Sentinel-5P-TROPOMI-ATBD-Ozone-Profile.pdf (last access: 10 July 2023), 2023.
Waked, A., Afif, C., and Seigneur, C.: An atmospheric emission inventory of anthropogenic and biogenic sources for Lebanon, Atmos. Environ., 50, 88–96, https://doi.org/10.1016/j.atmosenv.2011.12.058, 2012.
Wang, W., Li, X., Shao, M., Hu, M., Zeng, L., Wu, Y., and Tan, T.: The impact of aerosols on photolysis frequencies and ozone production in Beijing during the 4-year period 2012–2015, Atmos. Chem. Phys., 19, 9413–9429, https://doi.org/10.5194/acp-19-9413-2019, 2019.
WRF: Weather Research and Forecasting model, GitHub [code], https://github.com/wrf-model/WRF/releases (last access: 10 July 2023), 2023.
Wehbe, Y., Temimi, M., Weston, M., Chaouch, N., Branch, O., Schwitalla, T., Wulfmeyer, V., Zhan, X., Liu, J., and Al Mandous, A.: Analysis of an extreme weather event in a hyper-arid region using WRF-Hydro coupling, station, and satellite data, Nat. Hazards Earth Syst. Sci., 19, 1129–1149, https://doi.org/10.5194/nhess-19-1129-2019, 2019.
Wehbe, Y., Griffiths. S., Al Mazrouei, A., Al Yazeedi, O., and Al Mandous, A.: Rethinking water security in a warming climate: rainfall enhancement as an innovative augmentation technique, npj Climate and Atmospheric Sciences, 6, 171, https://doi.org/10.1038/s41612-023-00503-2, 2023.
Wesely, M. L.: Parameterization of surface resistance to gaseous dry deposition in regional numerical model, Atmos. Environ., 23, 1293–1304, https://doi.org/10.1016/0004-6981(89)90153-4, 1989.
Wizenberg, T., Strong, K., Walker, K., Lutsch, E., Borsdorff, T., and Landgraf, J.: Intercomparison of CO measurements from TROPOMI, ACE-FTS, and a high-Arctic ground-based Fourier transform spectrometer, Atmos. Meas. Tech., 14, 7707–7728, https://doi.org/10.5194/amt-14-7707-2021, 2021.
Yarragunta, Y., Srivastava, S., Mitra, D., Le Flochmoën, E., Barret, B., Kumar, P., and Chandola, H. C.: Source attribution of carbon monoxide and ozone over the Indian subcontinent using MOZART-4 chemistry transport model, Atmos. Res., 227, 165–177, https://doi.org/10.1016/j.atmosres.2019.04.019, 2019.
Yarragunta, Y., Srivastava, S., Mitra, D., and Chandola, H. C.: Influence of forest fire episodes on the distribution of gaseous air pollutants over Uttarakhand, India, GIScience Remote Sens,, 57, 190–206, https://doi.org/10.1080/15481603.2020.1712100, 2020.
Yarragunta, Y., Srivastava, S., Mitra, D., and Chandola, H. C.: Source apportionment of carbon monoxide over India: a quantitative analysis using MOZART-4, Environ. Sci. Pollut. R., 28, 8722–8742, https://doi.org/10.1007/s11356-020-11099-y, 2021.
Yin, H., Lu, X., Sun, Y., Li, K., Gao, M., Zheng, B., and Liu, C.: Unprecedented decline in summertime surface ozone over eastern China in 2020 comparably attributable to anthropogenic emission reductions and meteorology, Environ. Res. Lett., 16, 124069, https://doi.org/10.1088/1748-9326/ac3e22, 2021.
Yu, Y., Notaro, M., Kalashnikova, O. V., and Garay, M. J.: Climatology of summer Shamal wind in the Middle East, J. Geophys. Res.-Atmos., 121, 289–305, https://doi.org/10.1002/2015JD024063, 2016.
Zhang, X., Chen, H., Xu, X., Hu, X.-M., Gao, L., and Jia, G.: Legacy of aerosol radiative effect predominates daytime dust loading evolution, Atmos. Res., 312, 107735, https://doi.org/10.1016/j.atmosres.2024.107735, 2024.
Zhang, Y., Pan, Y., Wang, K., Fast, J. D., and Grell, G. A.: WRF/Chem-MADRID: Incorporation of an aerosol module into WRF/Chem and its initial application to the TexAQS2000 episode, J. Geophys. Res.-Atmos., 115, D18202, https://doi.org/10.1029/2009JD013443, 2010.
Zhang, Y., Bocquet, M., Mallet, V., Seigneur, C., and Baklanov, A.: Real-time air quality forecasting, part I: History, techniques, and current status, Atmos. Environ., 60, 632–655, https://doi.org/10.1016/j.atmosenv.2012.06.031, 2012.
Zhang, Y., Zhang, X., Wang, K., Zhang, Q., Duan, F., and He, K.: Application of WRF/Chem over East Asia: Part II. Model Improvement and Sensitivity Simulations, Atmos. Environ., 124, 301–320, https://doi.org/10.1016/j.atmosenv.2015.07.023, 2016.
Zhang, Xu, X. and Su, Y.: Impacts of regional transport and meteorology on ground-level ozone in Windsor, Canada, Atmosphere, 11, 1111, https://doi.org/10.3390/atmos11101111, 2020.