the Creative Commons Attribution 4.0 License.
the Creative Commons Attribution 4.0 License.
Organic aerosols mixing across the tropopause and its implication for anthropogenic pollution of the UTLS
Anna Breuninger
Philipp Joppe
Jonas Wilsch
Cornelis Schwenk
Heiko Bozem
Nicolas Emig
Laurin Merkel
Rainer Rossberg
Timo Keber
Arthur Kutschka
Philipp Waleska
Stefan Hofmann
Sarah Richter
Florian Ungeheuer
Konstantin Dörholt
Thorsten Hoffmann
Annette Miltenberger
Johannes Schneider
Peter Hoor
Alexander L. Vogel
Increasing anthropogenic emissions have led to numerous organic compounds in the atmosphere, with uncertain effects on climate, ecosystems, and human health. Particularly, the composition and impact of organic aerosol in the upper troposphere and lower stratosphere (UTLS) remain poorly understood, with few studies addressing the general distribution of aerosols in this layer. In this work, we present a comprehensive analysis of a tropopause fold and convective systems during an airborne campaign over central Europe in summer 2024. We collected filter samples with a multichannel sampler for organic aerosol, effectively separating tropospheric and stratospheric air masses. As a result, we analyzed the chemical composition on a molecular level using ultra-high-performance liquid chromatography coupled with high-resolution Orbitrap mass spectrometry. A subsequent non-target analysis provides novel insights into compositional differences throughout the UTLS. Our findings reveal numerous anthropogenic organic compounds, including C8H19O5PS2 and C15H15NO3S2, alongside dicarboxylic acids, organosulfates, and oxidation products of volatile organic compounds found in stratospheric samples. Additional target analysis identifies pollutants like perfluorooctanoic acid and tris(2-chloropropyl) phosphate that redistribute from the ground. These findings underscore the importance of transport processes to high altitudes and the growing impact of anthropogenic pollution, contributing to a better understanding of the relationship between emissions, the chemical composition of the UTLS, and climate effects.
- Article
(3644 KB) - Full-text XML
-
Supplement
(8833 KB) - BibTeX
- EndNote
The chemical composition of the atmosphere changes as a consequence of urbanization, developing industry and anthropogenic activities (Riese et al., 2005). With regard to a significant increase of emissions (Yu et al., 2016; Lamarque et al., 2010), models suggest a growing urgency to understand its impact on climate and climate model projections (Solomon et al., 2011). As a part of the atmospheric composition, aerosols play an important role in the global atmospheric radiation budget due to their influence on the radiative forcing by scattering, absorption, as well as aerosol-cloud interactions (IPCC, 2023). Especially the upper troposphere and lower stratosphere (UTLS), located between 8–20 km altitude in the mid-latitudes, shows a high sensitivity to changes in atmospheric composition and mixing, yet transport and feedback processes in this region remain poorly understood (Riese et al., 2012; Murphy et al., 2021).
Throughout earlier research the composition of stratospheric aerosol was thought to be mainly particulate sulfate, mostly associated with volcanic eruptions or derived from precursor species such as carbonyl sulfide and sulfur dioxide (Myhre et al., 2004; Neely et al., 2013; Weisenstein et al., 1997). However, recent studies highlight the importance of the organic fraction of UTLS aerosols, especially in the context of an increasing number of wildfires as an important source (Yu et al., 2016; Martinsson et al., 2019; Andreae et al., 2018; Benoit et al., 2023; Dumelié et al., 2024). Wildfires and the related aerosols are moreover suspected to contribute to enhancing ozone loss rates and show the importance of understanding aerosols and their composition in the stratosphere (Solomon et al., 2023).
Organic matter makes up to 50 % of aerosol in the lower stratosphere (Murphy et al., 2013; Froyd et al., 2009) and is either being formed by gas-to-particle conversion (Hallquist et al., 2009) or transported to high altitudes from lower tropospheric sources (Martinsson et al., 2019). Organic aerosols hereby can be directly emitted as primary aerosols or originate from the atmospheric oxidation of volatile organic compounds (VOC) leading to secondary organic aerosol (SOA) (Goldstein and Galbally, 2007). In general aerosols can be of biogenic or anthropogenic origin, where thousands of compounds contribute to a variety of reactions, resulting in different chemical composition, sizes and therefore various properties of aerosol particles (Lippmann, 2011). In particular, organic aerosol present within the UTLS can be transformed by oxidation, cloud-processing and deposition, although detailed processes are still unknown (Jimenez et al., 2009; Pöschl, 2005). Especially in the context of radiative effects on climate, the difference between aerosol produced in the stratosphere or transported into the stratosphere is important to understand to assess the radiative effect (Murphy et al., 2021). The significant organic content in stratospheric aerosol hereby contributes to a substantial impact on the aerosol optical depth, which broadly ranges for different complexes, highlighting the need to understand the composition of stratospheric aerosol (Li et al., 2021).
In-depth studies of organic aerosols in the UTLS by online measurements or offline high-resolution mass spectrometry are limited so far, despite a few novel observations (e.g. Benoit et al., 2023). So far, trace gases, humidity and non-refractory submicron aerosol composition were measured within the UTLS (Köppe et al., 2009; Joppe et al., 2024; Schmale et al., 2010). Since the organic fraction of UTLS aerosol is highly complex and not well understood, source apportionment, transport mechanisms, effects on the radiative forcing as well as the anthropogenic influence are insufficiently represented albeit preliminary studies hint at their importance for modelling current and future climate states. For this reason, a comprehensive understanding on the molecular level is needed to accurately assess the anthropogenic impact, understand microphysical and chemical properties and improve climate predictions as well as facilitate the development of more targeted studies.
In this study, we target the question which differences in chemical compositions of aerosols occur throughout the different regions of the UTLS. Especially the differences above and below the tropopause are of major interest, to further understand transport and mixing. In the following, we present two case studies from the tropopause composition gradients and mixing experiment (TPEx) campaign in June 2024, probing the different regions of the UTLS (Bozem et al., 2025). In comparison to that, we implemented one ground measurement stationed at the rural site Kleiner Feldberg, to contrast the ground based with free tropospheric data. With our in-house built sampler for organic aerosol particles (SOAP), we were able to collect up to five filter samples throughout one flight, including one flight blank. As a consequence of that, different regions within the UTLS can be investigated separately. We further analyzed the organic fraction, using ultra-high performance liquid chromatography (UHPLC), coupled with high-resolution Orbitrap-mass spectrometry (HRMS). This setup facilitates a non-target analysis that allows for the identification of known as well as yet unknown organic compounds. This approach enables us to distinguish stratospheric and tropospheric compounds and detect transport between both layers. Our findings contribute to a more comprehensive understanding of the UTLS aerosol composition, potentially highlighting how anthropogenic emissions are transported across the tropopause and might affect this sensitive region of the atmosphere.
2.1 Measurement Flights
The TPEx campaign, which was an airborne field campaign of the TPChange collaborative research center, was conducted with the aircraft Learjet 35A. Eight scientific flights and one test flight were carried out between 3–21 June 2024 over Germany, the Baltic Sea and parts of Sweden (Fig. 1). All flights took off in Hohn (54.3153° N, 9.5256° E, Schleswig-Holstein, Germany) accomplished by the Gesellschaft für Flugzieldarstellung (GFD). The collected filter samples cover an altitude range of 0.9–12.1 km, with a sampling duration ranging from 15 to 140 min. The latitude range was 49.9–58.8° N and a longitude range from 6.5–14.3° E. SOAP performed on every flight, collecting three to four samples and at least one flight blank per flight. The details on the filter collection are summarized in Table S1 in the Supplement.
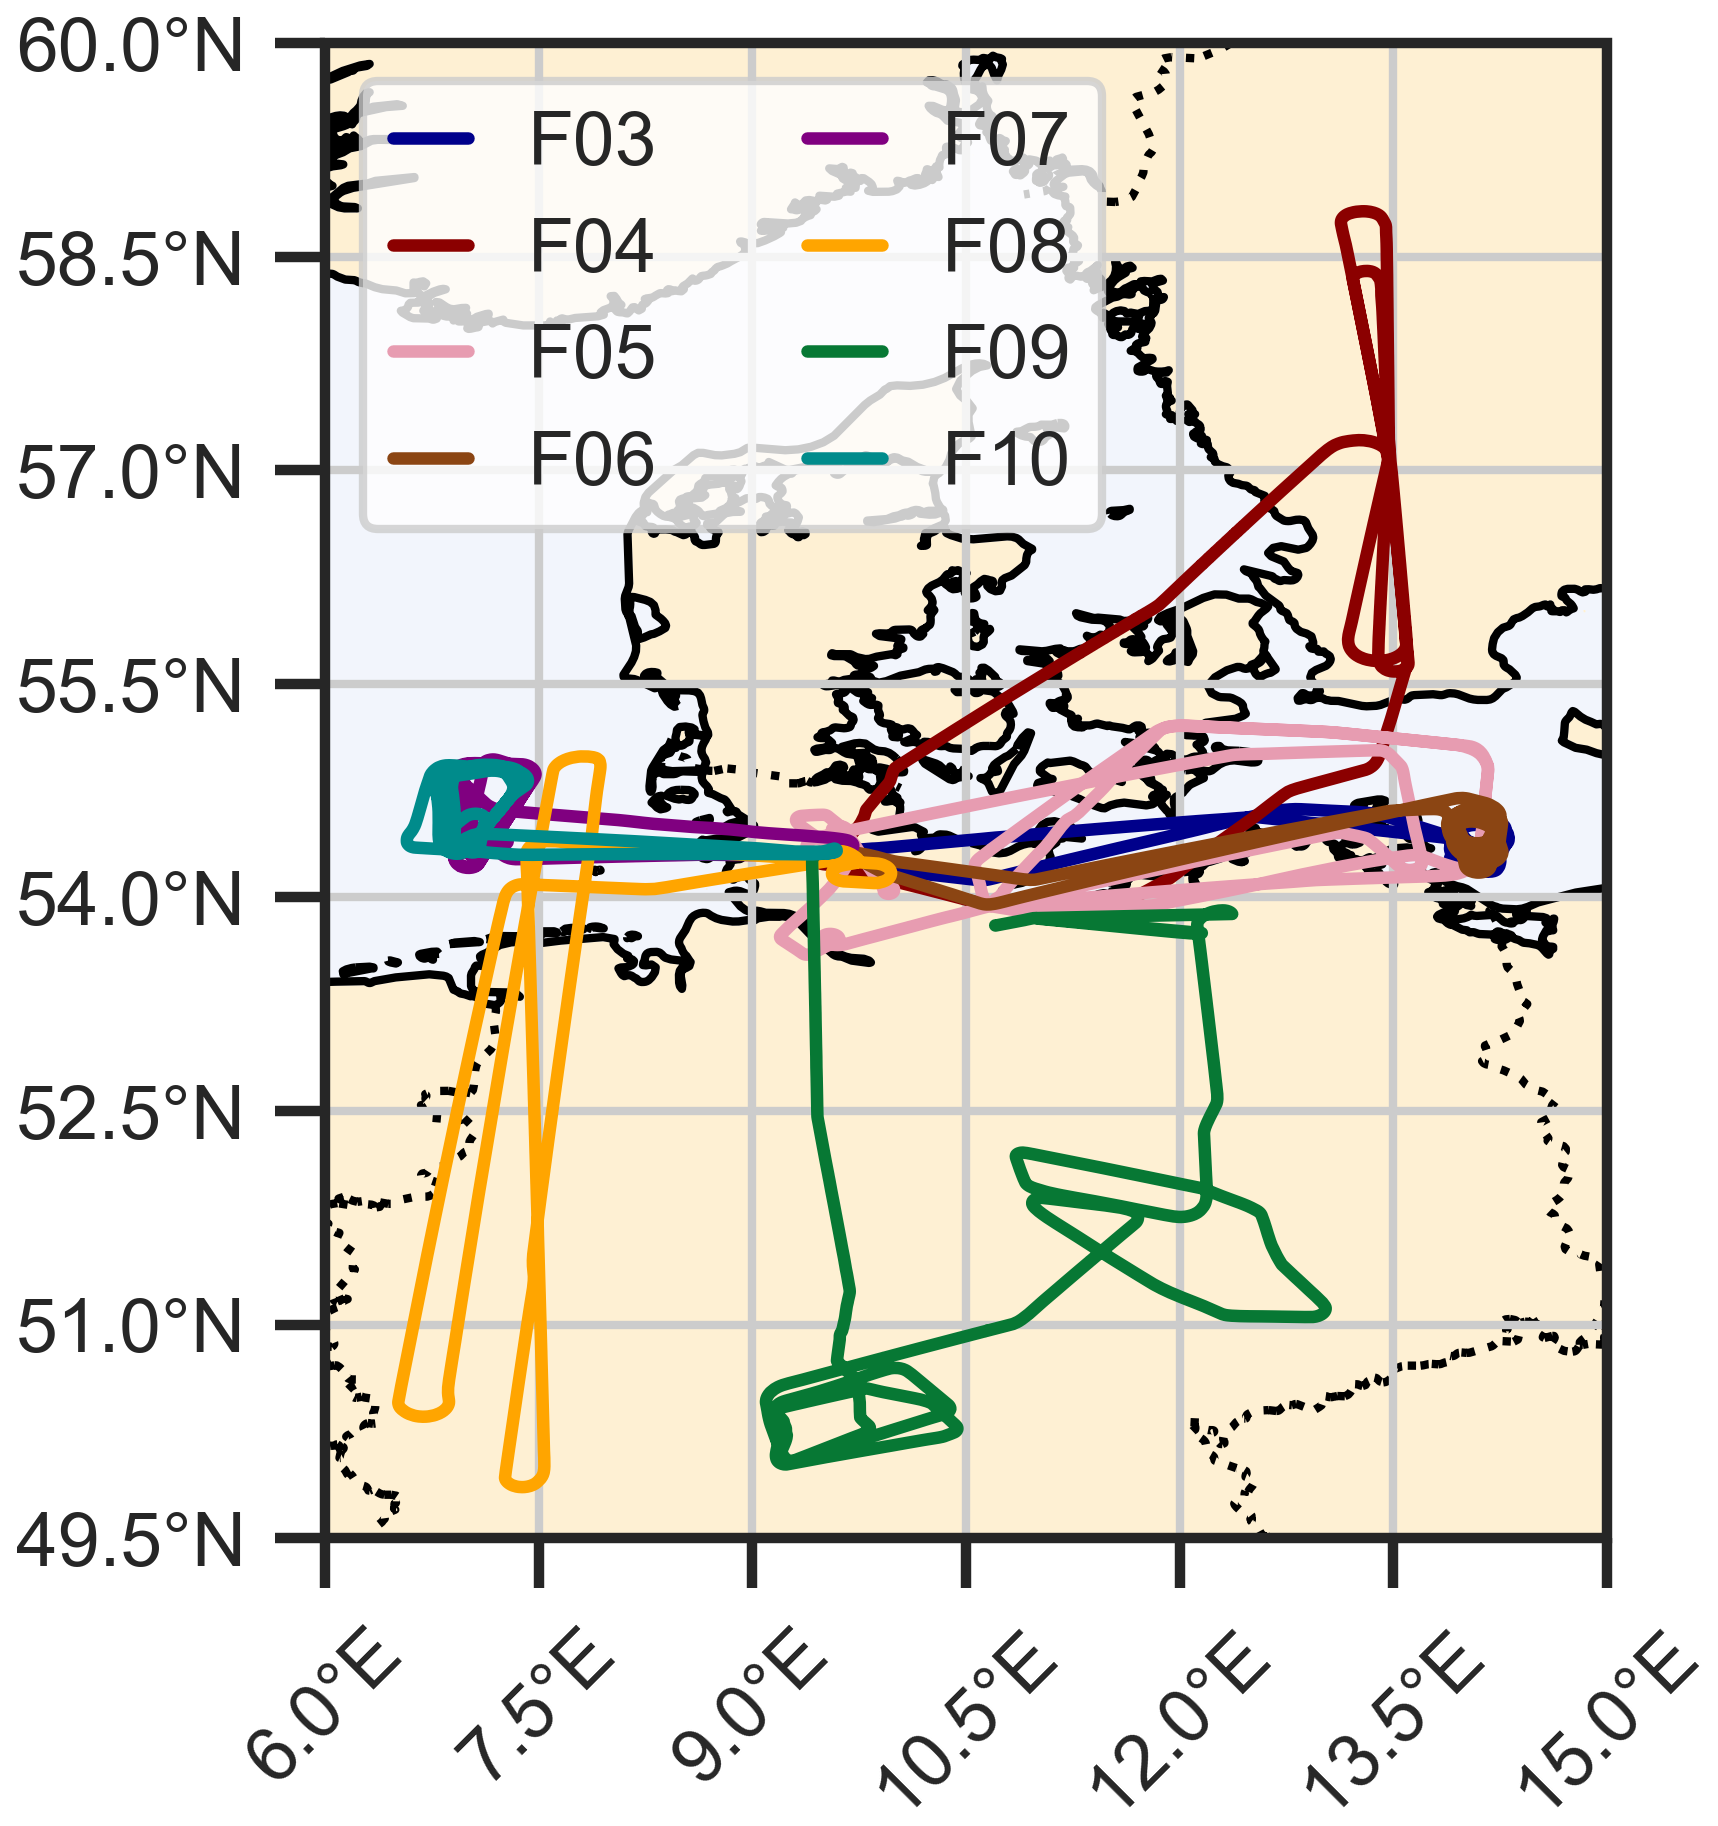
Figure 1Overview of all flight routes during the TPEx campaign. The different flights are marked in one color each and took place in summer 2024. The exact dates are – F03: 11 June, F04: 12 June, F05: 13 June, F06: 14 June, F07: 17 June forenoon, F08: 17 June afternoon, F09: 18 June, F10: 20 June.
2.2 Data and sample acquisition
2.2.1 Sample Collection on Ground
Additionally to the scientific flights, we collected ambient air filter samples at the Taunus Observatory, Kleiner Feldberg (50.2219° N, 8.4468° E). The samples were collected with a high-volume sampler (DHA-80, Digitel Switzerland) on pre-heated glass fiber filters (150 mm diameter, M 160, AHLSTROM MUNKSJÖ). The sampling time was 12 h at a flow rate of 500 L min−1. The particle cut off was 2.5 µm. All filter samples were sealed and stored at −20 °C after sampling.
2.2.2 Sample collection with SOAP
For our study, we built a multichannel aerosol sampler, which has been airborne certified for the integration in the underwing pod of the research aircraft Learjet 35A (Fig. S1 in the Supplement). It consists of two scroll pumps that were able to draw at standard conditions in total 60 L min−1 onto a quartz microfiber filter (47 mm diameter, Whatmann QM-A, cytiva). With a system of five solenoid valves which were normally closed and a bypass, we were able to collect five filter samples individually for each flight. Based on calculations according to von der Weiden et al. (2009), we estimated the particle losses, caused by the design of the inlet system, to be less than 10 % in the size ranges from 10 to 2000 nm (Figs. S2 and S3 in the Supplement). The loss-mechanisms included in the loss-calculations are non-isoaxial sampling, non-isokinetic sampling, diffusion, sedimentation, turbulent inertial deposition, inertial deposition in bend and inertial deposition in contraction. SOAP therefore captures particles in the Aitken and accumulation mode (Seinfeld and Pandis, 2016). Depending on the scientific aim, we sampled three to four samples, with the remaining one to two filters used as a flight blank. After each flight, filters were stored below 0 °C to prevent artefact formation (Resch et al., 2023).
2.2.3 Trace gas and aerosol properties data acquisition
In total 14 instruments were deployed either on board, outside the aircraft in the underwing pod or in the tropopause composition towed sensor shuttle (TOSS). The trace gases carbon monoxide (CO) and dinitrogen oxide (N2O) were measured by university of Mainz airborne quantum cascade lasers spectrometer (UMAQS), as well as ozone (O3) measured by the 2BTech ozone monitor. The mass concentrations of different non-refractory aerosol particles between 80–800 nm were acquired by the civil aircraft for the regular investigation of the atmosphere based on an instrument container-aerosol mass spectrometer (CARIBIC-AMS) with the optical particle counter (Grimm/Durag 11-S, Sky-OPC) (Schneider et al., 2025). The aerosol number-size distribution was determined using an ultra-high sensitivity aerosol spectrometer (UHSAS). An overview of the deployed instruments is described by Bozem et al. (2025).
2.3 Offline filter analysis
2.3.1 Sample extraction
To detect a broad range of compounds, we extracted the filters by using two different methods. (A) We took two 6 mm punches and wetted them with 130 µL of 9:1 ultrapure water (MilliQ Reference A+, Merck KGaA) and methanol (0.1 µm filtered, UHPLC-MS, Thermo Fisher Scentific Inc.). Subsequently, the vials were placed on an orbital shaker (KS-15, Edmund Bühler GmbH) at 300 rpm for 20 min. Afterwards, the solvent was extracted and filtered using a disposable polytetrafluoroethylene (PTFE) filter (pore size: 0.2 µm, macherey nagel).
(B) We cut the remaining filter into pieces and wetted them with 2 mL methanol. After placing the vials on the orbital shaker (20 min, 300 rpm), the solvent was transferred into a sharp bottom vial. The remaining filter pieces were wetted again with 500 µL methanol and placed on the orbital shaker once more. The solvent was added into the sharp bottom vial and evaporated at room temperature using a continuous nitrogen flow. After evaporation, the remaining droplet was resolved in 80 µL 9:1 MilliQ : methanol and filtered using a PTFE filter.
2.3.2 UHPLC-HRMS measurements
The extracts and authentic standards were measured using an UHPLC (Vanquish Flex) combined with HRMS (Q Exactive Focus Hybrid-Quadrupole Orbitrap, both Thermo Fisher Scientific Inc.). The measurements in both positive and negative ionization mode were carried out using a heated electro spray ionization source (HESI). A C18-Column (CORTECSTM T3, 2.7 µm×150 mm, Waters) at 40 °C was used for the chromatographic separation. The separation was carried out by a gradient elution with MilliQ and methanol, both, with 0.1 % formic acid. The injection volume was set to 15 µL. More details can be found in Table S2 in the Supplement.
As authentic standards we used: phthalic acid (99.5 %, Merck), nitrophenol (100 %, Merck SIAL), suberic acid (99 %, Fisher Scientific), azelaic acid (+98.5 %, Merck Supelco), adipic acid (99.5 %, Merck Fluka) and triisobutyl phosphate (99 %, Sigma Aldrich).
2.3.3 Non-target analysis and elemental composition group assignment
The raw data was processed using Compound Discoverer 3.3 and FreeStyle 1.8 SP2 (both Thermo Fisher Scientific Inc.) to run the non-target analysis. For this analysis, Compound Discoverer uses the retention time, mass-to-charge ratio () and isotopic patterns as well as fragmentation patterns to assign molecular formulae. Additionally, the spectra are compared with the databases mzCloud (HighChem LLC, 2013–2021) and a self-built Aerosolomics database in mzVault 2.3 (Thermo Fisher Scientific Inc.) by Thoma et al. (2022), to further identify secondary organic aerosol compounds. The Aerosolomics database contains , retention time and MS2 spectra from laboratory experiments, simulating the atmospheric oxidation of volatile organic compounds.
Apart from comparison with databases, a potential molecular formula is assigned to compounds with a sample-to-blank ratio higher than five, which refers to the flight sample and the flight blank. The elements allowed for the formula prediction are bromine (Br), chlorine (Cl), carbon (C), oxygen (O), hydrogen (H), sulfur (S), nitrogen (N) and phosphorus (P). The forumlae were then classified to the elemental composition groups CHO, CHNO, CHNOS, CHOS, CHOP, CHN, and other, if none of the previous groups applies. Compounds that could not be assigned to a sum formula are excluded from our analysis. By additionally calculating the aromaticity equivalent according to Yassine et al. (2014), the CHO group can be distinguished into CHOa (aromatic organics) and CHOn (aliphatic organics). The details on the workflow applied can be found in Sect. S4.2 in the Supplement. All signals are blank corrected and normalized according to sampling time and flow. Finally, to declare a degree of certainty for our compound identification, we used the confidence levels established by Schymanski et al. (2014). According to this classification, level 1 corresponds to unambiguously identified compounds (reference standard, MS2 spectrum), level 2 to a probable structure (library match and/or diagnostic evidence), level 3 tentative candidate (structure, substituent, class), level 4 unequivocal molecular formula and level 5 exact mass. We used the mzCloud database (HighChem LLC, 2013–2021) for comparing MS2 spectra of commercial chemicals. correspond to confidence level 1.
2.4 Trajectories
For our analysis of the air mass origin and possible transport pathways, we use kinematic trajectories calculated with the Lagrangian analysis tool LAGRANTO (Sprenger and Wernli, 2015). Every minute, 60 trajectories are started from the longitude, latitude and pressure position of the aircraft. This results in a total of 15 316 trajectories for each of the analyzed flights F05 and F09. The position of these air parcels is calculated backward in time for up to ten days. The trajectory calculation uses 3D grid-scale wind data from the operational global ICON model (Zängl et al., 2014) run at the german weather service (DWD). Analysis data for 00:00, 06:00, 12:00, and 15:00 UTC is combined with forecast data for lead-times of 1–5 h to achieve an hourly resolution of the wind field data. The ICON wind field data has been interpolated from its original grid (R3B07, effective grid spacing 13.5 km) onto a regular grid with a resolution of 0.15°×0.15° prior to trajectory calculation. In the vertical ICON uses a SLEVE coordinate system with 120 levels with a constant spacing of 300 m between about 4–15
3.1 Flight selection for investigating the chemical composition of the UTLS
To understand the chemical composition of organic aerosol as well as possible transport processes in the UTLS, eight research flights were conducted with SOAP, sampling filters for offline analysis. Out of those we selected flights F05 and F09 as case studies, that contrast each other with respect to meteorological conditions, altitude ranges and geographical regions, to investigate and compare the chemical composition within different parts of the UTLS.
F05 took place on 13 June 2024 and represents a racetrack pattern over the Baltic Sea, with downward mixing in the first half and low Richardson numbers and a shear layer in the second half. The low Richardson numbers indicate mixing potential at the tropopause (Woods, 1969) and at a tropopause fold in the measurement region, which can be associated with a strong exchange across the usual tropopause barrier (Holton et al., 1995; Shapiro, 1980). Due to the stepwise increase in height, which covered a range from 6000 to 10 000 m, we were able to sample the different regions for at least 40 min each.
Flight F09 was conducted on 18 June 2024 and contains a low altitude pass over Spielberg, Germany (50.3207° N, 9.2638° E), and flight tracks across Germany to capture convective systems. The low altitude flight at around 900 m allows for a direct comparison to ground measurements station at the Taunus Observatory, which is within a 60 km proximity from the ground pass. Throughout the flight, the filters were sampled in four different conditions: before the ground pass, during the ground pass, throughout convective systems and in the lower stratosphere at 12 000 m altitude.
3.2 Characterizing the UTLS region
To understand which air mass was sampled during the flight, the troposphere and stratosphere needs to be defined, which requires the determination of the tropopause e.g. from gridded analysis data. Here, the dynamical tropopause, defined by a threshold value of potential vorticity (Danielsen, 1968; Shapiro, 1978), the thermal tropopause, defined by the world meteorological organization (WMO, 1957), and the chemical tropopause, based on trace gases, can be used (Joppe et al., 2024; Müller et al., 2015; Fischer et al., 2000).
Since we focus on investigating the chemical composition and the occurrence of different compounds in different regimes, we use threshold values of different trace gases as a tool to distinguish stratospheric from tropospheric air masses. This approach is based on trace gases, which have either sources in the troposphere and are rather constant in the stratosphere or the other way around. N2O can be used as a tracer for stratospheric air, since it has no sinks in the troposphere, a long life time and no sources in the stratosphere. Therefore, the mixing ratio is constant in the troposphere, showing a background level of 336–338 ppbv and decreases in the stratosphere. O3 in the contrary is photochemically produced in the stratosphere, with a lifetime of up to six years, and shows relatively low abundance in the troposphere. For this reason, threshold values of 70–100 ppbv have been typically used to determine the lower boundary of the stratosphere, though local chemistry, affecting the O3 mixing rations can complicate its interpretation (Bethan et al., 1996; Zahn et al., 2000). CO in addition is used to determine mixing processes and evaluate tropospheric influence (Hoor et al., 2002; Fischer et al., 2000). In contrast to N2O, CO is considered a tropospheric tracer, which concentration decreases in the stratosphere in the absence of mixing with tropospheric air. The main production of CO in the stratosphere is the temperature-dependent methane oxidation by hydroxyl radicals (OH), which is less efficient than the CO reaction with OH, serving as a sink. Because of a life time of two to three month, elevated CO concentrations indicate recent tropospheric influence on the lowermost stratosphere, since photochemical in situ production of CO is too slow to account for the elevated CO in this region (Pan et al., 2004; Hoor et al., 2002).
In this study, stratospheric air masses are defined by conservative thresholds for mixing ratios of O3>100 ppbv and N2O<330 ppbv, to avoid interference with tropospheric air masses (Lachnitt, 2025). In general, a clear anticorrelation of N2O and O3 is measured, which aligns with the expected tracer-tracer correlations. The CO concentrations show no extraordinary peaks in the stratospheric regimes, which indicates that no recent pollution or exchange events occured. The mixing ratios measured during the flights are displayed in Fig. 2. The filter sampling periods are displayed in colored bars, and the period where stratospheric air was sampled is marked by an orange background. The sampling conditions for each filter as well as the altitude are given in Table 1. Notably, the tropopause fold captured at a constant flight level during F05 is visible by measuring tropospheric air in between stratospheric air.
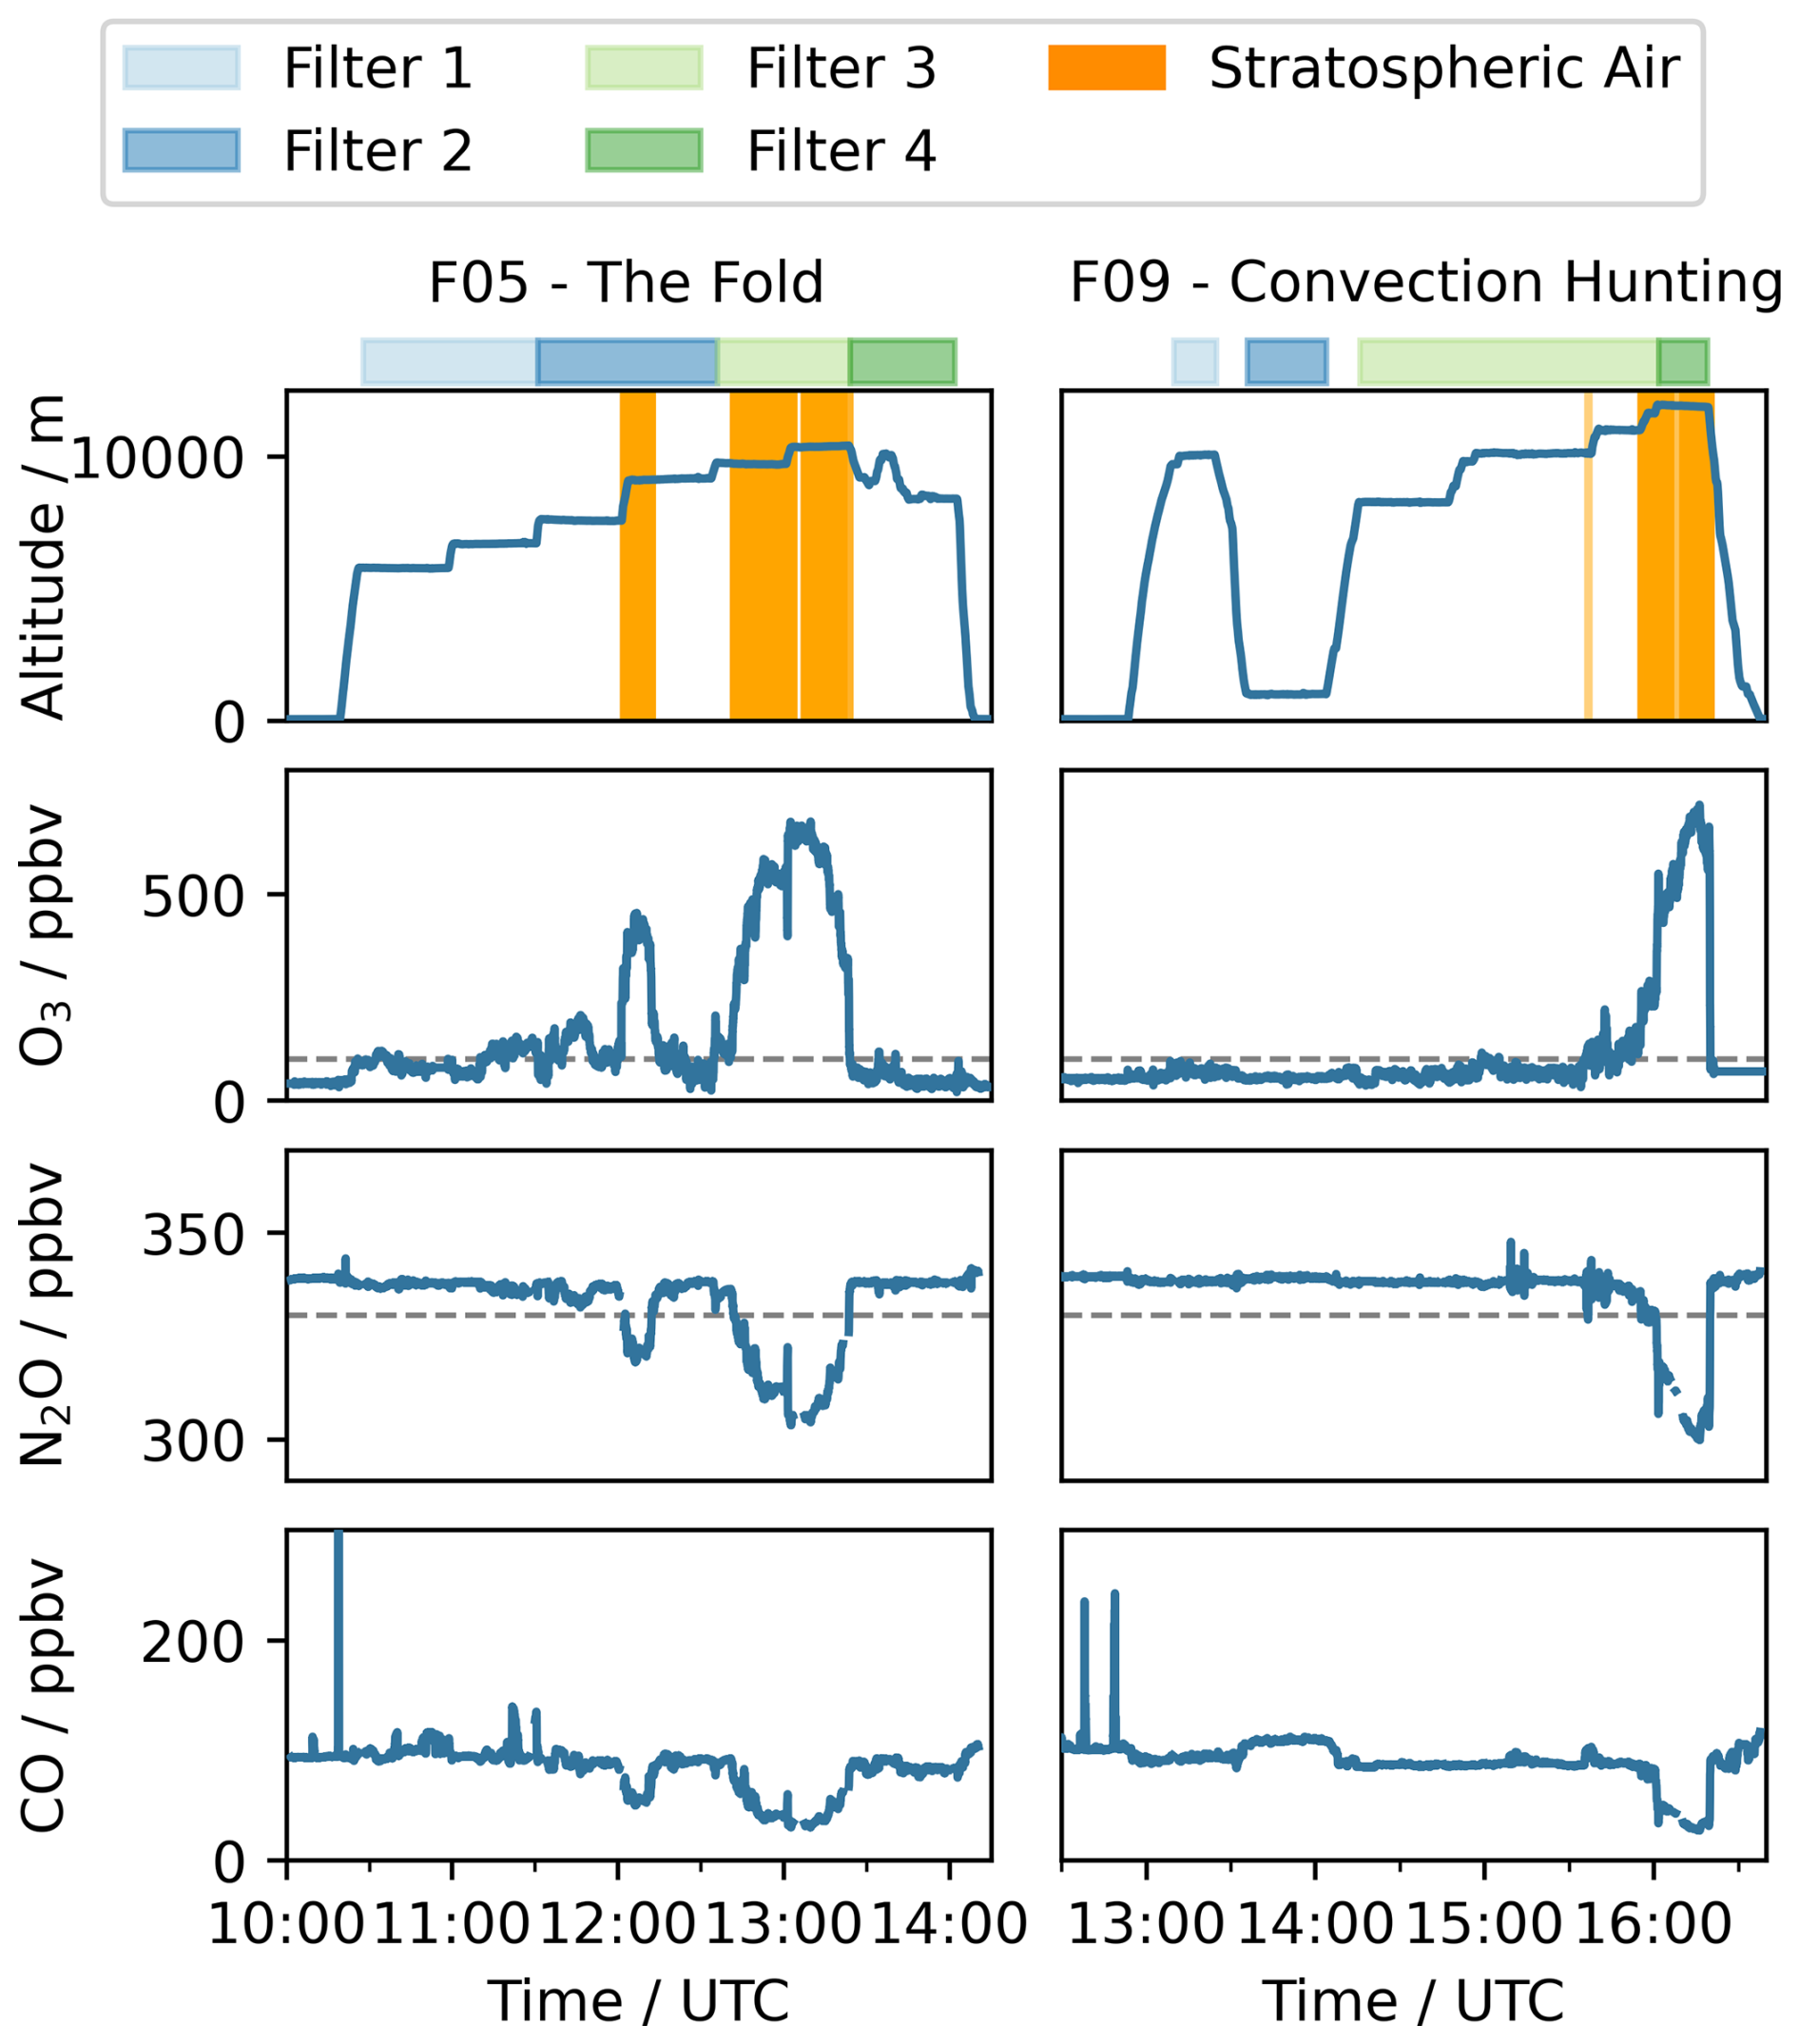
Figure 2Overview of the altitude, measured trace gases CO, N2O, and O3 in ppbv for flight F05 – The Fold and F09 – Convection Hunting at the respective time (UTC). The filter sampling times are displayed with colored bars with light blue: filter 1, dark blue: filter 2, light green: filter 3, and dark green: filter 4. The regimes when stratospheric air was sampled, according to tracer gas observations, are marked in orange. The condition for stratospheric air is N2O<330 ppbv and O3>100 ppbv, marked by grey dashed lines.
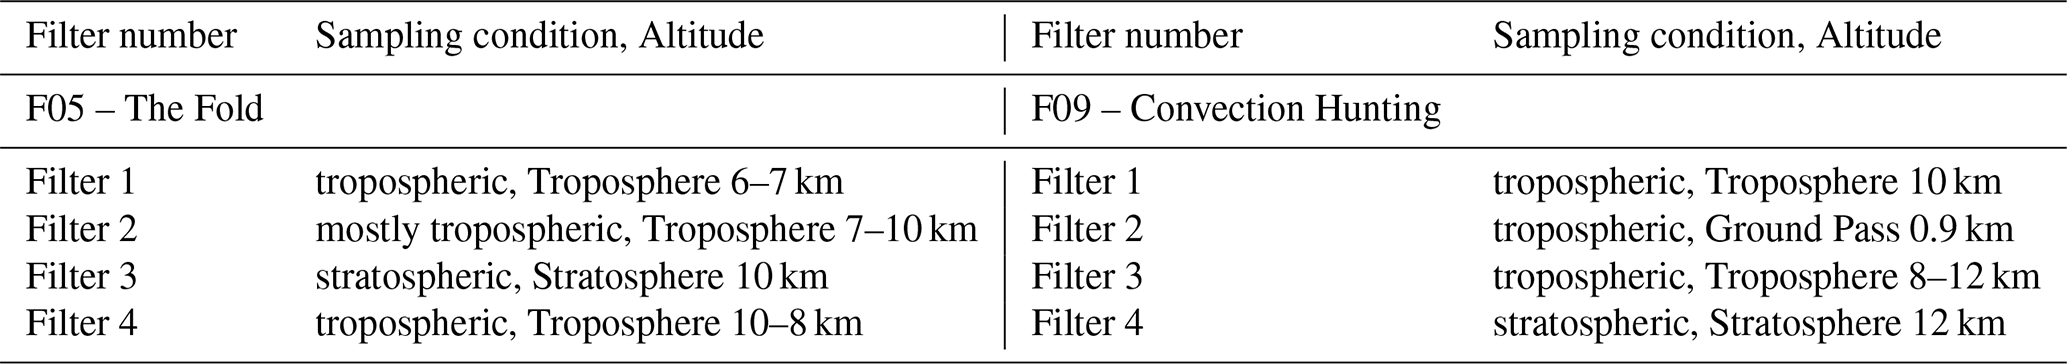
Table 1Filter number of flight F05 and F09 with respective sampling condition and name it will be further referred to.
3.3 Chemical composition of organic aerosols in the different regions of the atmosphere
To analyze the different chemical composition of organic aerosol throughout the UTLS region, each filter, taken at a different part of the atmosphere, was analyzed individually. The chemical composition is derived by UHPLC-HRMS and thus attributing molecular formulae to each compound, based on their exact mass. To get an overall molecular fingerprint of each sample, the compounds are assigned to elemental composition groups (CHOn, CHOa, CHNO, CHOS, CHNOS, CHOP, CHN, and other). The limitations of this setup are derived by the solubility of compounds and the ionization efficiency. Using HESI, only compounds that carry a basic or acidic functional group can be ionized, neglecting compounds such as polycyclic aromatic hydrocarbons (Venter, 2024). The solvent used for extraction and the mobile phase determines detectable compounds as well. The C18-column limits how well compounds can be separated, leading to a poor separation of very polar compounds, which therefore might not be detected as a feature.
Figure 3 shows the relative abundance of each compound group for the respective region (exact numbers can be found in Table 2 and Vogel and Breuninger, 2025). Additionally, AMS measurements of submicron sulfate (, concentration given at standard pressure and temperature) as well as the size distribution measured by UHSAS are compared to our observations (Figs. S4–S6 in the Supplement).
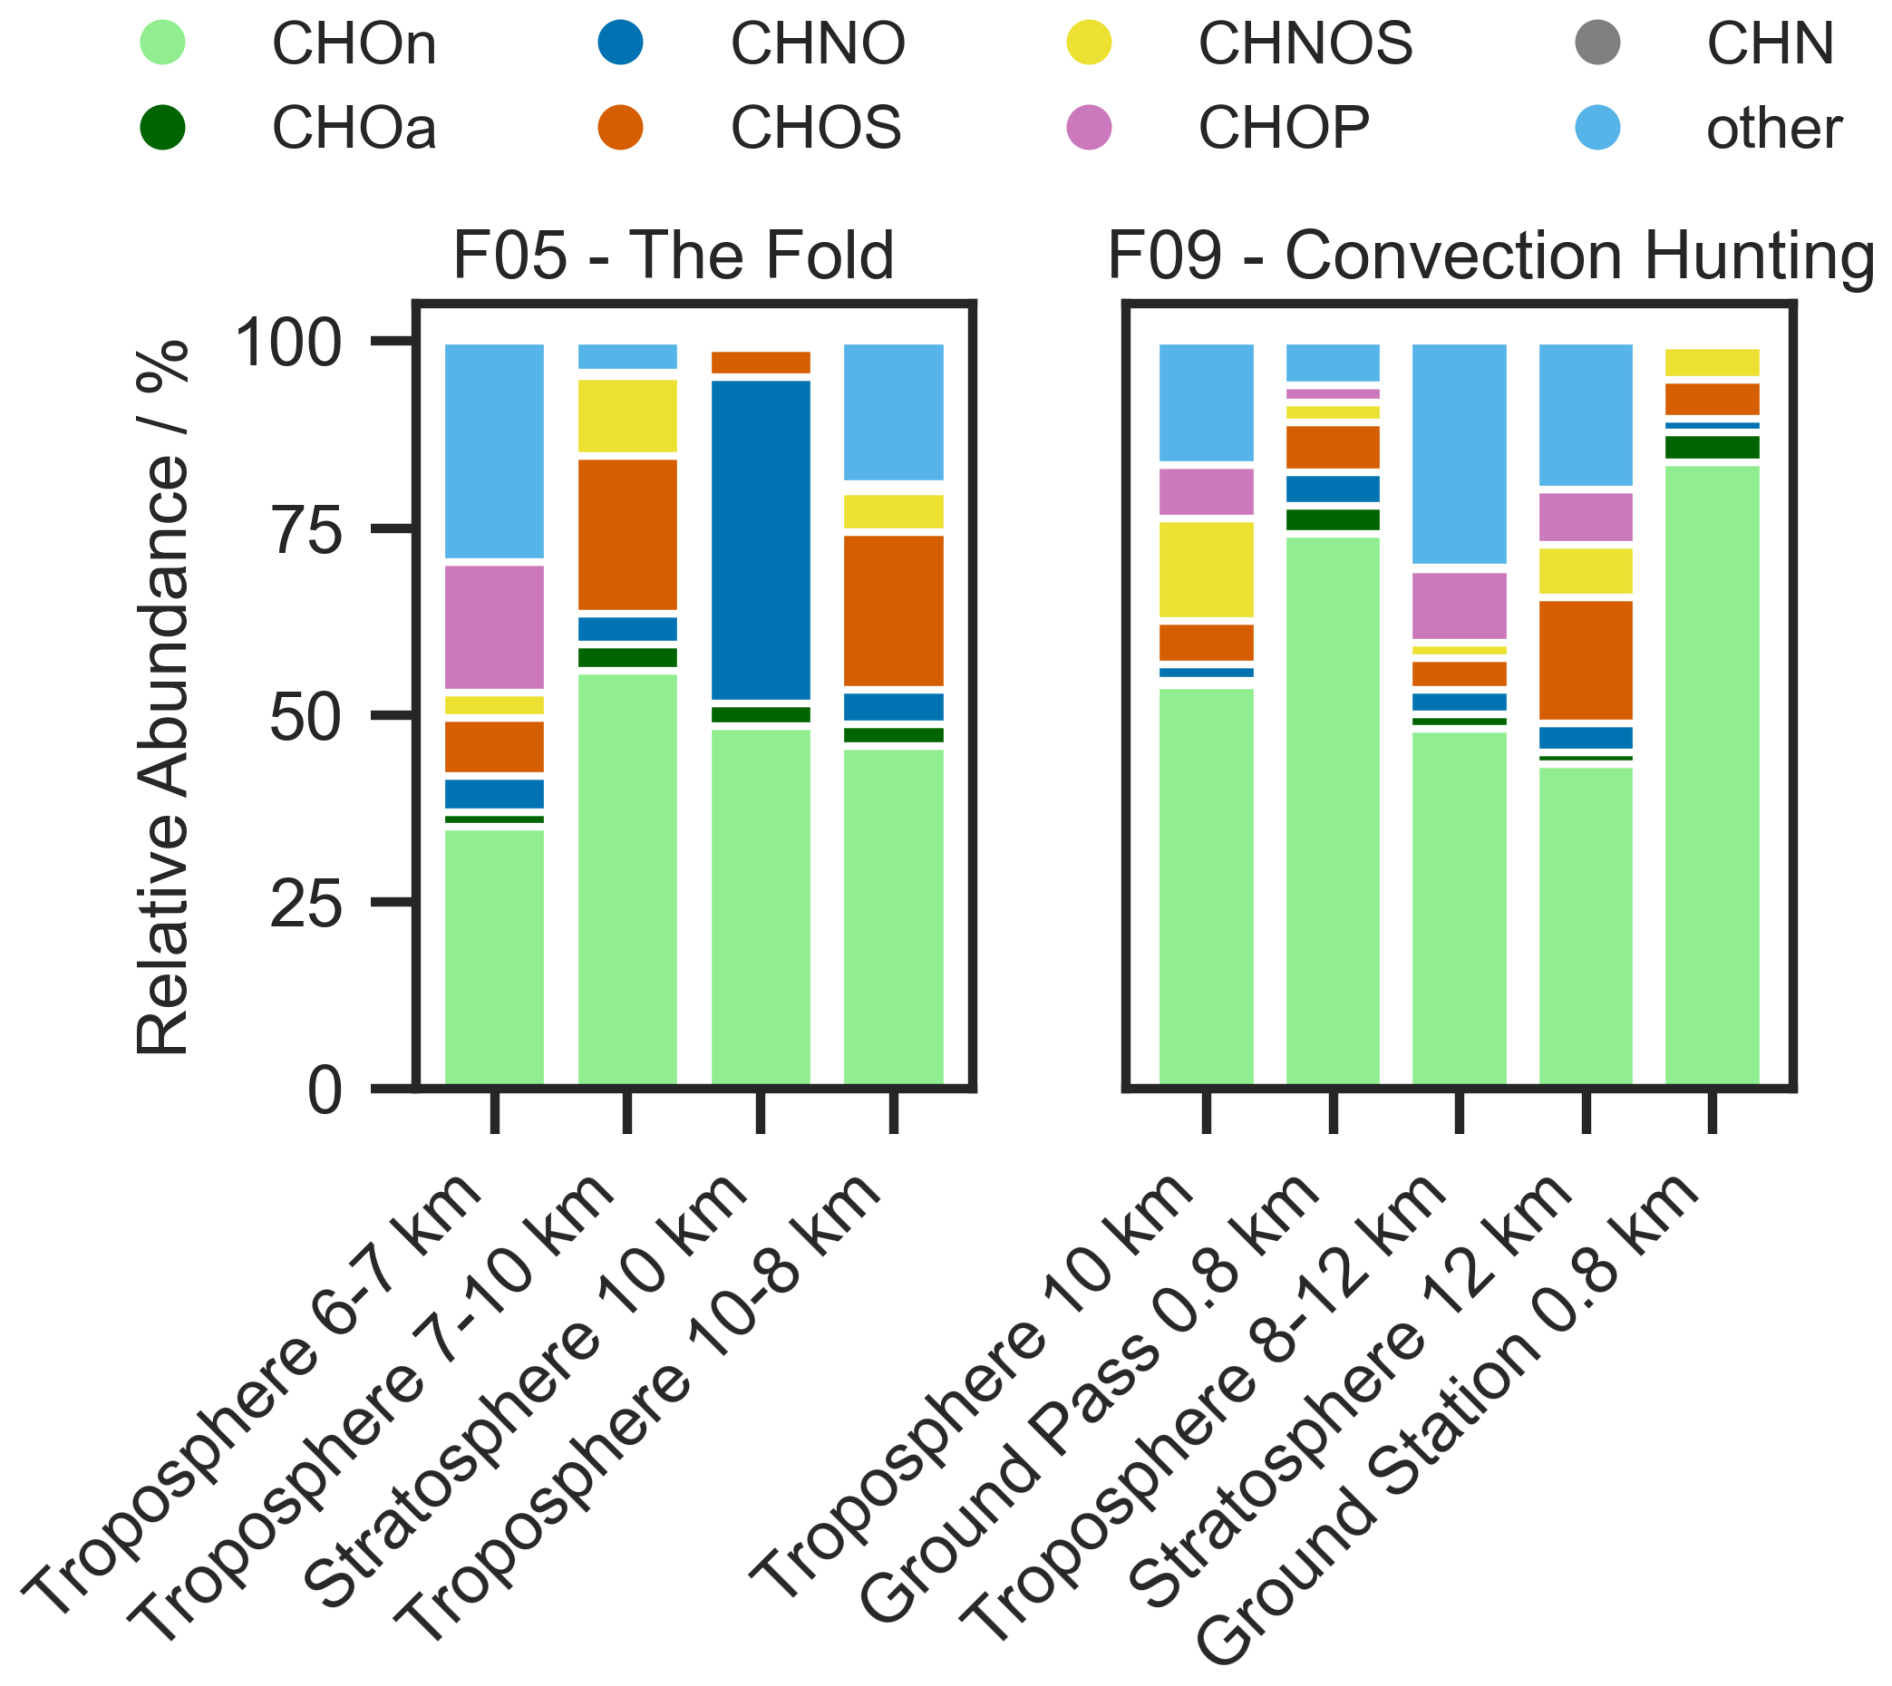
Figure 3Relative abundance in % of the elemental composition groups CHOn, CHOa, CHNO, CHOS, CHNOS, CHOP, CHN, and other (the order mentioned applies to the stacked bars from bottom to top), measured with Orbitrap mass spectrometry in negative ionization mode (also given in Table 2). Displayed are the filters that were sampled throughout the flights F05 and F09. In panel F09, the filter sampled at the ground station Taunus Observatory is added.
Table 2Relative abundance in % of the elemental composition groups CHOn, CHOa, CHNO, CHOS, CHNOS, CHOP, CHN, and other, measured with Orbitrap mass spectrometry in negative ionization mode. The samples displayed correspond to the region where the filter was sampled, including the ground station at the Taunus Observatory.
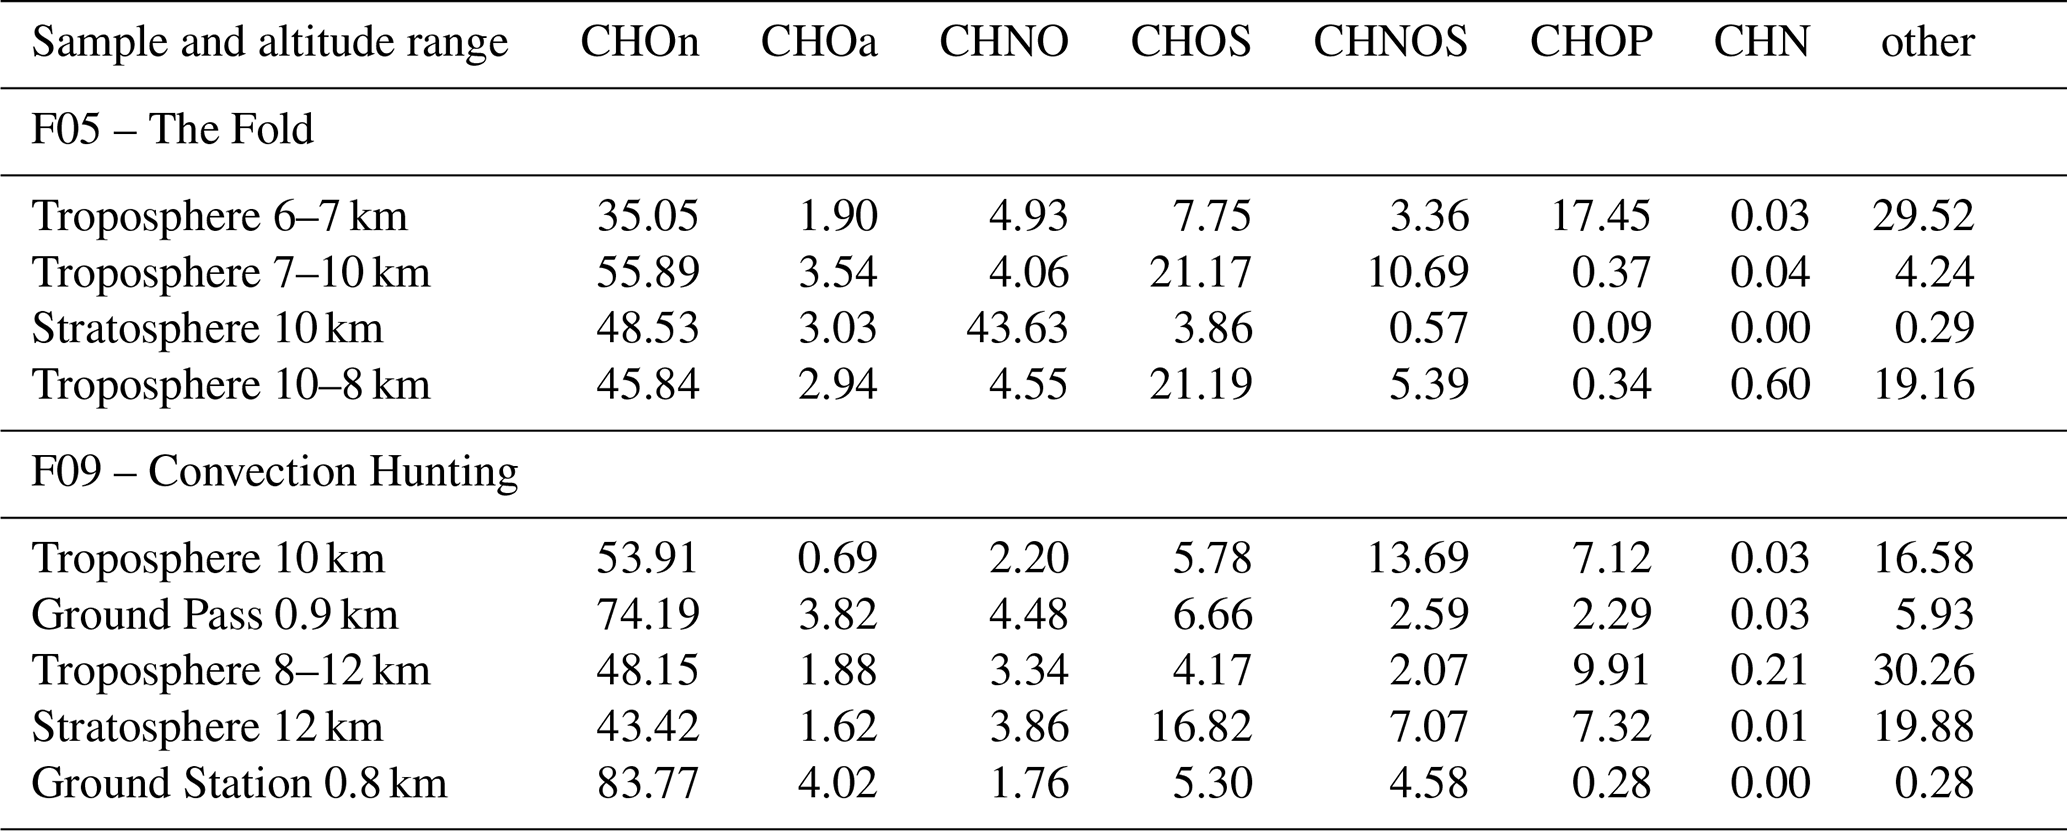
For F09, the ground measurement at the Taunus Observatory from that day is also displayed, to enable a comparison with the air masses sampled during the ground pass. It should be noted that we are mainly discussing the negative ionization mode and that ionization as well as transmission efficiencies vary for each compound. Therefore, the signal intensities or different groups do not directly represent concentrations of the respective compound. Especially the compound group CHN is barley detectable in negative mode. Still, the occurrence of the compound groups can be compared relatively between the samples, indicating changes in the composition of organic aerosol. Since our method is an offline method, the detectability of compounds is dependent on the sampling time. In comparison to online techniques, longer sampling times lead to the detection of more compounds by enriching them on the filter. Additionally, the chromatographic separation through a column provides the retention time as a valuable information, which is used to identify and distinguish compounds. In comparison to AMS, HESI as a soft-ionization technique minimizes fragmentation, allowing for the assignment of molecular formulas based on the molecular ion. As a consequence of filter sampling, artifacts and losses cannot be excluded (Resch et al., 2023) and the time resolution is lower compared to online techniques. Therefore we suggest using online and offline techniques in parallel to retrieve to most information.
In general, each region and each flight shows its own unique chemical composition as it will be discussed in the following sections.
CHOa and CHOn in the UTLS
Across all samples CHO has the highest contribution, splitting up into the aliphatic CHO (CHOn) and a small fraction of aromatic CHO (CHOa) compounds. The measurements at the ground station and the ground pass during F09 show the highest and almost identical abundances, indicating a ground-based source for CHOn and CHOa compounds and served as independent validation of the aircraft sampling. Precursors, such as volatile and semi-volatile alkanes are known to dominate biogenic and anthropogenic emissions, followed by aromatics and unidentified oxygenated compounds (Ziemann and Atkinson, 2012). Further up in the troposphere and with increasing altitude, their abundance decreases and therefore suggests dilution throughout the uplifting process. This theory is supported by other aircraft based observations, described by Johansson et al. (2020) and Höpfner et al. (2019). The dilution is not linear with increasing altitude, which could be due to temperature decrease and thus condensation of intermediate volatile organic compounds. This volatility class is known to be an important source of SOA mass in the atmosphere (Weitkamp et al., 2007; Tkacik et al., 2012; Topping et al., 2013).
CHNO, troposphere vs. stratosphere
When comparing the stratospheric to tropospheric measurements, the high CHNO abundance in F05 in the stratosphere stands out prominently. As a product of VOC oxidation in presence of NOx, which can originate from anthropogenic sources or lightning activity, we identified some of these compounds as organonitrates (Lambe et al., 2017; Curtius et al., 2024). All tropospheric measurements show about ten times lower CHNO abundances. Notably, only a few compounds show large signal intensities that lead to a high CHNO abundance and will be further described in detail below. The stratospheric samples of F09 show in contrast to F05 a whole different chemical composition, where CHNO is not as pronounced, whereas other compounds like CHOS, CHOP and other are mainly contributing to the aerosol composition.
CHOS, troposphere vs. stratosphere
The majority of CHOS are organosulfates, which are especially pronounced in the stratospheric sample of F09, as they are less abundant in the respective tropospheric samples or the ground measurement. Since the formation of organosulfates is often linked to the occurrence of sulfate (Surratt et al., 2006; Lin et al., 2011; Minerath and Elrod, 2009), the observations were compared to the respective AMS measurements. The findings are coherent with our hypothesis, displaying an elevated sulfate concentration of up to 0.6 µg m−3 during the respective sampling time for the stratospheric sample (Fig. S4), compared to on average 0.15 µg m−3. An elevated sulfate abundance is generally expected according to earlier research by Crutzen (1976) and Junge et al. (1961), observing a stratospheric sulfate layer. Moreover, previous work studying the UTLS region shows high sulfate concentrations with increasing altitude (Wilson et al., 2008; Duncan et al., 2007; Tomsche et al., 2022). The same relative abundance of organosulfates is observed in F05's higher tropospheric samples. An explanation might be the influence of the tropopause fold, and the potential cross tropopause mixing at the edges of the fold (Sprenger et al., 2003). The elevated organosulfate abundance in F05 is coherent with elevated sulfate concentrations detected by the AMS (Fig. S5) throughout almost the entire flight. The AMS hence reflects both observations that we made with our filter samples. The opposite trend of CHOS in the stratosphere for F05 and F09 could be due to the difference in a flight over land and a flight over sea, which needs to be investigated in further studies.
CHOP and other, troposphere vs. stratosphere
Another novel finding is the abundance of the compound group other, which does not seem to have any trend or altitude dependency. The ground pass during F09 and the ground station show the lowest abundances for compounds assigned to other and F05's stratospheric sample contains almost no compounds in that compound group. For F09, one reason could be atmospheric processing like the addition of functional groups, oxidation processes or enhanced condensation due to lower temperatures that result in a decrease of volatility and thus enhancing the compounds fraction in the total organic aerosol (Atkinson and Arey, 2003; Pankow and Asher, 2008). A similar pattern is visible for CHOP, which is lowest for the ground pass and the ground station, as well as the stratospheric sample in F05. CHOP as a compound class encompasses organophosphates, which are anthropogenic high-production volume chemicals, such as flame retardants. These compounds appear in the atmosphere as semi-volatile organic compounds that undergo gas-to-particle partitioning and atmospheric processing (Liu et al., 2021). Compounds assigned to other are e.g. CHOPS compounds which can derive from reaction processes of organophosphates with sulfur species and are likely of anthropogneic origin (Chen et al., 2023). Their origin remains unknown and needs further investigation.
The distinct chemical compositions observed across our samples from different altitudes highlight the complexity of atmospheric dynamics and processes. Additionally to the chemical composition, the size distribution highlights the differences between ground pass and UTLS region, showing lower particle mass and a larger contribution of particles between 500–1000 nm in the UTLS (Fig. S6). The atmospheric composition is influenced by both anthropogenic and biogenic sources and illustrates different transport processes. Our results particularly highlight the role of altitude and geographical location in relation to the chemical composition of the organic aerosols. The most abundant compounds for each elemental composition group and their variability is described in Table S3 in the Supplement.
3.4 Origin of the air masses and chemical composition
As the origin of air mass plays a decisive role for the occurring chemical composition of the atmosphere, we calculated 10 d backward trajectories. The trajectories are classified according to the atmospheric region at their start position according to our analysis in Sect. 3.3. Additionally, it has to be noted that the kinematic trajectories based on ICON-global data only capture large-scale ascent, but not vertical motion represented in ICON-global by a convection parameterization. We therefore combined the trajectory position with high-resolution MSG data (IR 10.8 µm and WV 6.2 µm channels) to investigate a potential co-location of trajectories in the upper troposphere (z>7 km) and convective-type clouds. Figure 4 shows a comparison of the path between stratospheric and tropospheric air masses for F05 and F09. The displayed trajectories as well as the corresponding chemical composition displayed in a pie chart, are based on F05 filter 4/F09 filter 2 (tropospheric region) and F05 filter 3/F09 filter 4 (stratospheric region). Trajectories of the path corresponding to the remaining filters of F05 and F09 as well as additional information on vertical lifting prior to the observations can be found in Figs. S7–S15 in the Supplement.
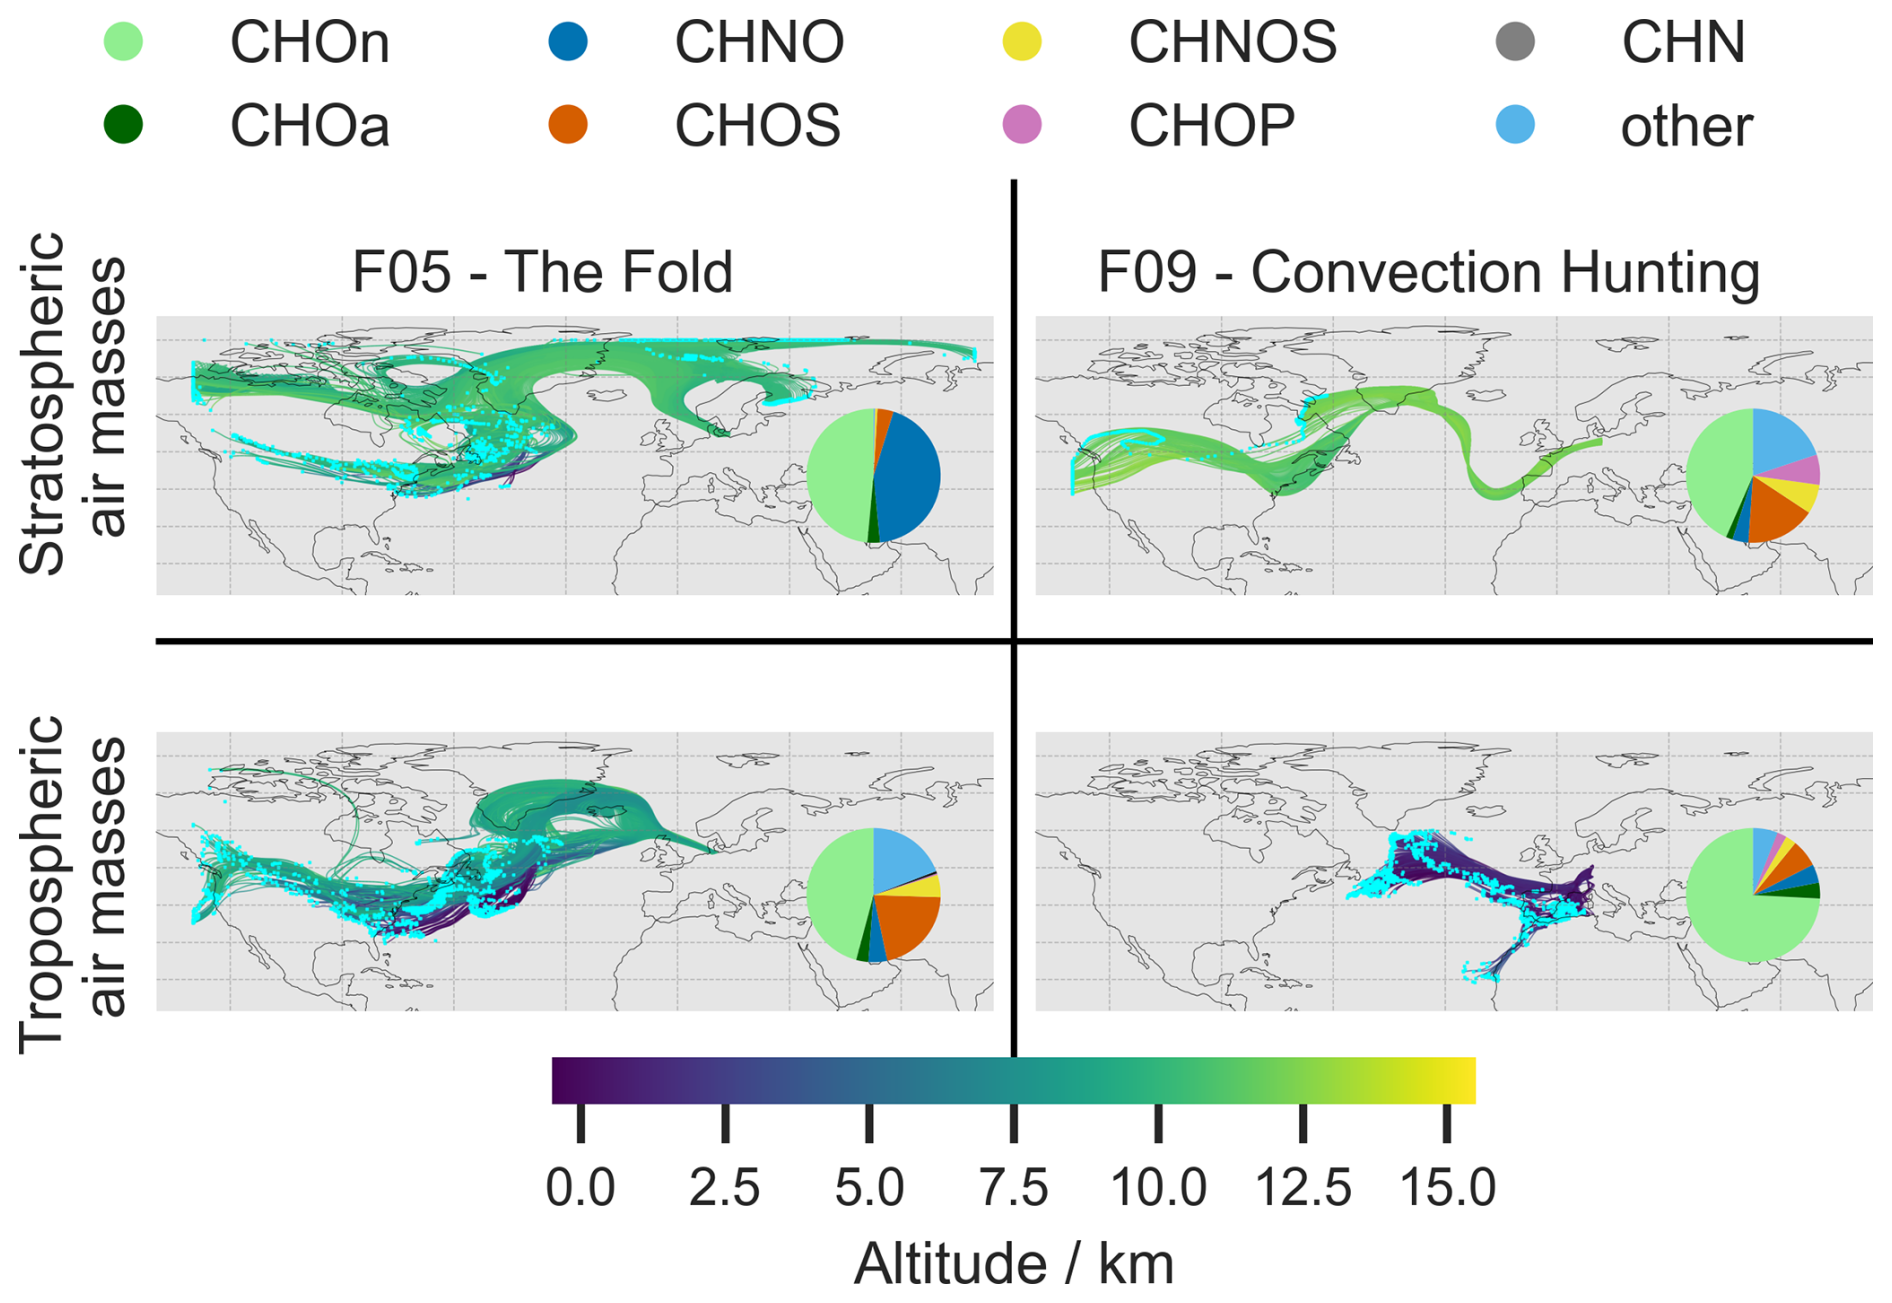
Figure 4Five-day backward trajectories of the sampled period for F05: filter 3 (stratospheric) and 4 (tropospheric) and F09: filter 2 (tropospheric) and filter 4 (stratospheric). The altitude of the air mass is displayed in km and color coded by the color bar displayed. The origin of the respective air mass is marked by a blue dot. The pie charts show the abundance of the respective elemental composition group.
The LAGRANTO trajectories, calculated from the F05 flight path during the sampling period of filter 3, originate from a large area spanning parts of Alaska, Canada, Greenland, Finland and the eastern coast of North America (Fig. 4 top left) and were transported eastwards across the Atlantic towards Europe. The air mass sampled has only a small contribution (below 5 %) of strongly rising parcels and remains at altitudes above 9 km in the ten days prior to the observations (Fig. S9), with its stratospheric origin supported by trace gas data (Fig. 2).
The trajectories for flight F09 indicate that the measured stratospheric air masses (filter 4) originate from the stratosphere over eastern Canada and the western contiguous United States (Fig. 4 top right). These air masses remain at altitudes above 10.5 km in the ten days prior to the observations (Fig. S12, bottom right) and Over the course of five days, the trajectories traverse the Atlantic Ocean, passing the southern tip of Greenland, before turning south towards the Portuguese coast and then arching north again towards the flight area. Their flow pattern, altitude and longitude range between 40–60° N suggest that the air masses are transported by the polar jet stream. Compounds contained in this air mass may derive from local pollution events such as biomass burning events that became globally distributed by long range transport in the jet stream (Stohl, 2001; Dickerson et al., 2007). Notably, transport from North America to Europe, as well as from Canada to Europe, has been described in several studies (Forster et al., 2001; Joppe et al., 2024; Huntrieser et al., 2005; McKendry et al., 2001).
However, they are co-located with a convective system over the French Channel coast in the early hours of 18 June (04:00–07:00 UTC, Fig. S15 top left, green contours) and convection over Northern Germany from about 14:00 UTC (Fig. S15 bottom left, green contours). The air mass altitude at these times is around 12 km. Therefore, there is a possibility of convective transport, mainly from overshoots or turbulent mixing at the top of the anvil, influencing these air masses and possibly transporting organic aerosol from the ground into the stratosphere.
The trajectories calculated for the tropospheric air samples measured during F05 (filter 4) originate from a large area covering the western North Atlantic Ocean and the northern United States and have altitudes below 2 km mainly over the oceanic region (Fig. 4 bottom left and Fig. S11 bottom right). This supports the trace gas observations indicating air of tropospheric origin (Fig. 2). The air masses feature a warm conveyor belt-like ascent over the western North Atlantic Ocean (Fig. S11 bottom left) at times around four to seven days prior to the arrival in the measurement region. Strongly ascending air masses constitute about 25 % of the sampled air mass (Fig. S10). This suggests that their transport might be facilitated by low scale transport and uplift that occured before the flight.
The trajectories calculated for the tropospheric air samples collected during F09 (filter 2) originate from a smaller area than those for F05, covering the North Atlantic Ocean and the north-west of Africa (Fig. 4 bottom right). The air masses are of lower-tropospheric origin and mainly found at altitudes below 4 km in the ten days prior to the observations (Fig. S12 top right), covering the planetary boundary layer and the free troposphere. Trajectory positions below 2 km are spread widely over South-western Europe as well as the central North Atlantic (Fig. S14 top right). Compounds within these air masses can be transported on intercontinental scale, which is likely supported by strong winds and a mostly stable environment (Zhuang et al., 2018).
Using backward trajectories calculated by LAGRANTO, we were able to support the stratospheric or tropospheric origin of air samples collected during flights F05 and F09, which helps us investigate the correlations of atmospheric origin and anthropogenic organic compounds. Further, they highlight varying influences of organic compounds ranging from intercontinental upper tropospheric transport, deep convection and warm conveyor belt uplift. However, a larger number of flights would be required to further investigate the links between origin and anthropogenic organic compounds, and we strongly emphasize the urgency of further research into these links.
3.5 Non-target analysis of organic compounds within different parts of the UTLS
To understand the distribution of organic compounds throughout the UTLS and figure out possible transport processes, we investigated all compounds depending on their occurrence in either stratospheric and/or tropospheric air masses (Fig. 5) and present novel insights on a molecular level (Vogel and Breuninger, 2025). There are only a few studies concerning the general distribution of aerosol between troposphere and stratosphere, and hence there are no characteristics of aerosols studied so far that explain the different occurrences. Here, we present the possibilities of our technique, encouraging more research in this field to gain a better understanding of the findings presented below.
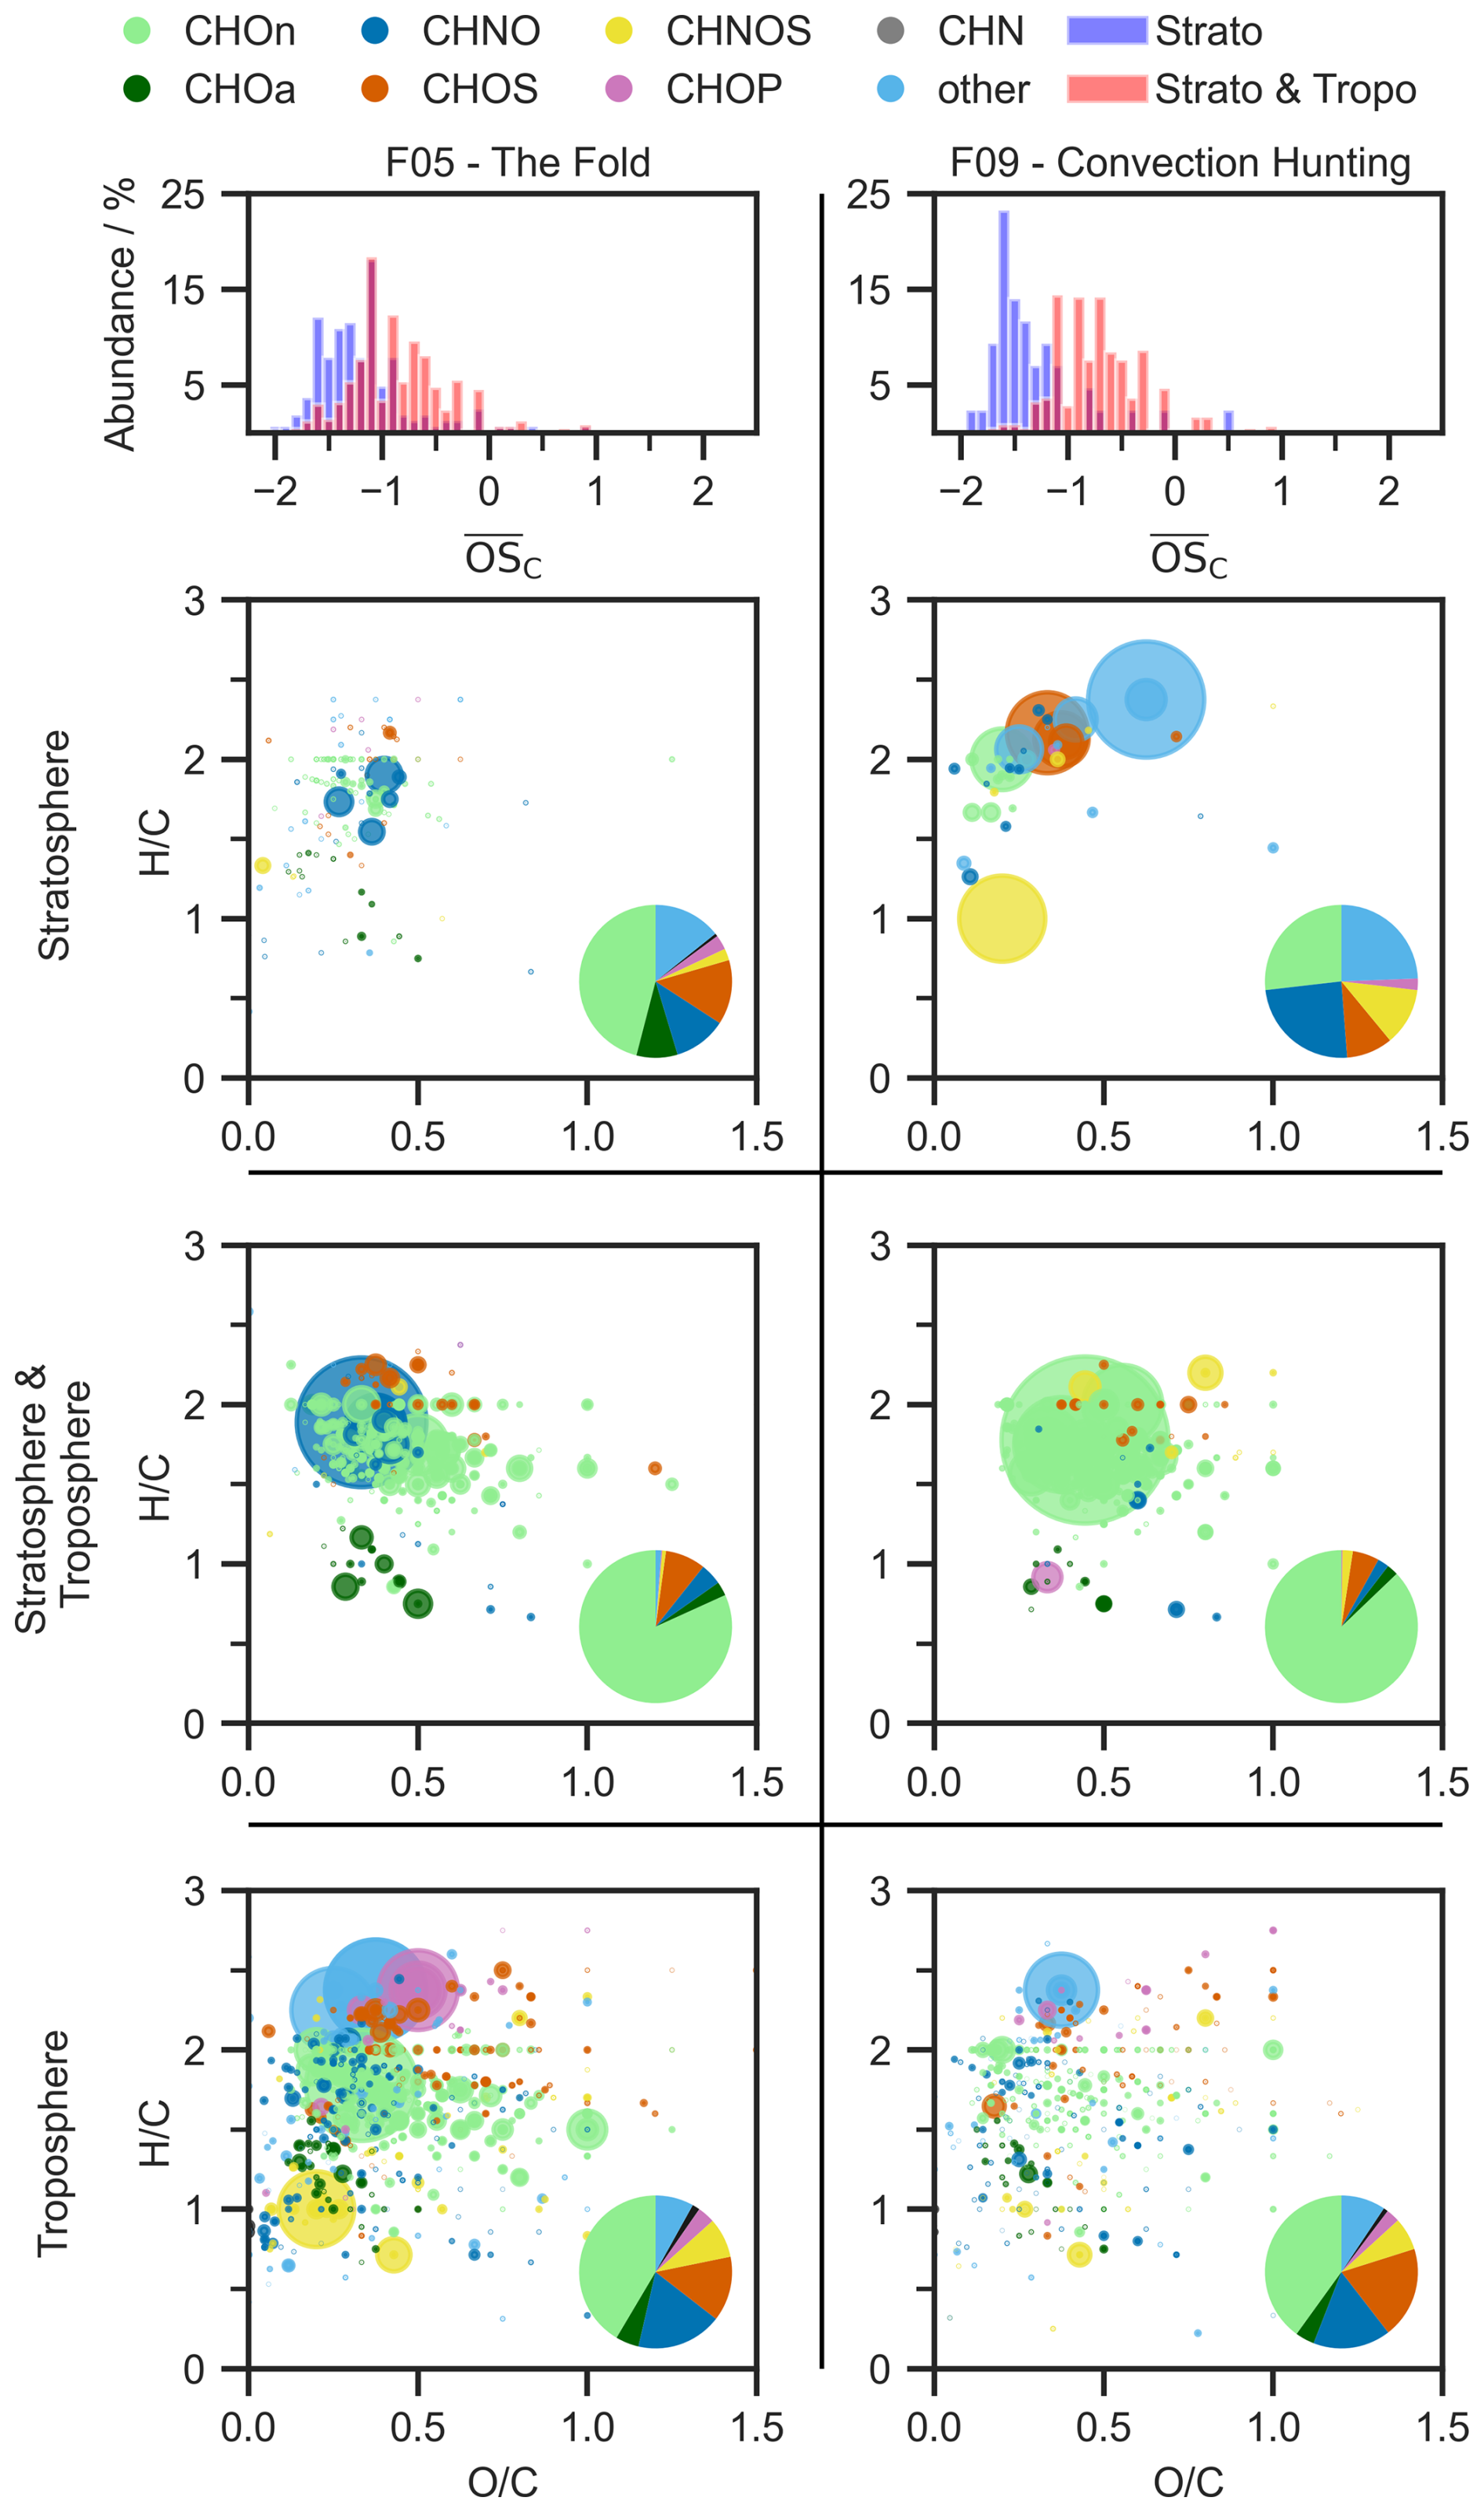
Figure 5The uppermost panel displays the distribution of average oxidation state of the carbon atom () of all compounds for aerosols found in the stratosphere and aerosols found in stratosphere and troposphere. Below are three Van Krevelen plots, which show aerosols that are either found only in the stratosphere, the stratosphere and troposphere or only the troposphere. The y axis displays the ratio and the x axis the ratio. The circle diameter of each compound represents the relative intensity, and the circle colour the group that is assigned (CHOn, CHOa, CHNO, CHOS, CHNOS, CHOP, CHN, and other). The pie chart contains the relative number of each compound group, contributing to the total compounds displayed. The left-hand side is F05 and the right-hand side is F09. All compounds displayed were measured in HESI negative ionization mode.
For our analysis, compounds on the stratospheric filter with a signal intensity one thousand times higher than on all other filters of the respective flight (stratospheric filter: F05 filter 3 and F09 filter 4) are assigned uniquely to the stratosphere. Compounds that can be found in the stratosphere and on every other filter of the corresponding flight representing the troposphere are assigned to both regions. The compounds that cannot be found on stratospheric filters are assigned uniquely to the troposphere. All compounds are displayed in a Van Krevelen diagram, which shows the atomic against ratio, indicating degree of saturation and oxidation state. The pie charts indicate the relative number contribution of each elemental composition group. Additionally, an overall feature of the compounds, which is the average oxidation state of the carbon atom (), is compared to obtain deeper insights into the compounds compositional differences.
Comparison of chemical characteristics
Starting with the difference in characteristics of stratospheric aerosols or aerosols that can be found in both regions, we investigated the of every compound against its respective carbon atom number. Overall, the of the compounds shown ranges from −2 to +1, which is the range where most organic aerosols appear. As described by Kroll et al. (2011), the formation of C–O bonds or cleavage of C–H bonds leads to an increase in , such that more oxidized species exhibit a higher oxidation state. Notably, compounds that are unique to the stratospheric air for both flights tend to have lower , indicating less oxidized species, an observation that has also been reported from balloon-borne measurements in the stratosphere (Benoit et al., 2023). Comparing our findings with Appel et al. (2022), who found higher oxidized compounds in the stratosphere than in the troposphere, we want to highlight that the differences in are more pronounced for the convection hunting flight. In that case we expect the aerosols to have lower residence times in the stratosphere, compared to stable conditions and longer residence times leading to possibly more oxidation. For the fold, where the overlap of both compound groups is larger, stratospheric compounds are still showing the tendency of appearing in the lower , indicating as well new formation in the stratosphere or mixing at the tropopause. As a limitation of our technique it has to be mentioned that uncertainties in the detection of highly oxidized molecules (HOM) derive from the offline filter treatment that may lead to HOM decomposition and therefore an under representation in our dataset (Bianchi et al., 2019).
Compounds unique to the troposphere
First, we want to examine the compounds exclusively detected in the troposphere. Since they cannot be found in the stratospheric samples, they do not seem to undergo vertical transport processes neither upwards nor downwards from the stratosphere, but might experience atmospheric processing. The compounds described can rapidly deplete by reaction with OH and nitrate radicals (NO3), thus forming new compounds (Eliason et al., 2004; Ellison et al., 1999). However, if apperaing in the particle phase, semi-volatile organic compounds can be shielded against atmospheric oxidation, thus enhancing their atmospheric lifetime up to a week (Socorro et al., 2017). We found 604 compounds which are exclusively found in F05's tropospheric samples and 989 compounds that are found in F09. Here, we have an overlap of 194 compounds that are present in both flights. The contribution of different compound groups is almost identical in both flights and shows great diversity, with CHOn predominating over CHNO and CHOS. In both flights we found several oxidation products of anthropogenic and biogenic SOA that lead to a broad variety of compounds and are commonly reported within the boundary layer (Hallquist et al., 2009; McFiggans et al., 2019). Amongst those we identified biogenic SOA like suberic acid and ozonolysis oxidation products of α- and β-pinene, limonene and β-caryophllene that match the Aerosolomics database (C8H14O4, level 2; C8H12O6, level 2; C9H14O4, level 2; C8H14O5, C5H6O4, level 2; C6H10O4, level 1).
Another important source of atmospheric organic aerosol is biomass burning, which can be traced by a variety of organic compounds (Wang et al., 2017; Simoneit and Elias, 2001). Amongst those, we identified phthalic acid, nitrosalicylic acid and nitrophenol (C8H6O4, level 1; C7H5NO5, level 3; C6H5NO3, level 1) (Wang et al., 2017). Likewise, organosulfates are known to contribute to a significant fraction of organic particulate matter, occurring in a large variety (Surratt et al., 2008; Tolocka and Turpin, 2012; Ma et al., 2025). The organosulfates appearing in the area show an aliphatic character and likely originate from combustion of sulfur containing fossil fuel and ship emissions (Blair et al., 2016; Qi et al., 2021). We found a prominent related compound, which is a carbonyl hydroperoxide that can further react to its dihydroperoxide and subsequently forms an organosulfate (C6H16O3, level 4; C9H16O5, level 4; C9H17O7S, level 4) under acidic conditions (Riva et al., 2016).
Notably, F05 shows some large signals that are not as dominant in F09 respectively, which were attributed to other, CHOP and CHNOS. They were identified as C8H19O3PS, level 4; C8H19O4P, level 4; C12H27O4P, level 1 and C5H11NO4S, level 4, with a suspected anthropogenic influence, as some organophosphates are used as flame retardants (de Boer and Stapleton, 2019).
Compounds found in the troposphere and stratosphere
Looking at compounds that are found within the troposphere and the stratosphere, a pronounced change in chemical composition of compounds contributing to this group is notable (Fig. 5). Here, over 75 % of the compounds are attributed to the CHOn group, followed again by CHNO and CHOS. 513 compounds are found for F05 and 502 for F09 with an overlap of 290 compounds that appear in both flights. For this compound category, the similarities between both flights seem to be larger than for the tropospheric-only compounds, emphasizing a distinct characteristic that allows them to cross the tropopause. Moreover, their occurrence in both regions underlines the previously discussed mixing processes in the UTLS taking place (Holton et al., 1995; Shapiro, 1980).
While the ratio for compounds in the troposphere covers a broad range, most compounds found in both regions have a ratio between 1.5–2.2, suggesting a rather aliphatic character. However, the overall range of ratio is the same, with the majority appearing around 0.2–0.6. Moreover, a fraction of organosulfates appearing in the region of remains, while the prominent organophosphates and compounds in other disappear.
In contrast to F09, F05 shows a strong CHNO signal which we attributed to C9H17NO3, level 4. This compound was already reported by Leppla et al. (2025) and Kourtchev et al. (2016) in the context of biomass burning chamber experiments and field measurements in the Amazon rainforest. According to the trajectories source region, Canadian wild fires during that time might provide an explanation for the compounds observed (Filonchyk et al., 2025). Other compounds are traced back to oxidation products of biogenic as well as anthropogenic VOC. Notably, we found several oxidation products driven by OH radicals, which leads to different products than ozonolysis, which were dominantly found in the troposphere. The OH concentration depends on different formation mechanisms that eventually lead to an increased concentration in the sampled region (Crutzen and Zimmermann, 1991). Especially due to varying residence times in the air parcel, an increased exposure to OH might explain the observed compounds (Lelieveld et al., 2016). The lifetime of atmospheric products can vary from minutes to hours depending on the precursor (e.g. sesquiterpene vs. monoterpene) and whether they are oxidized by OH or O3 (Atkinson and Arey, 2003). We were able to identify the photooxidation products of the biogenic VOC β-pinene, β-caryophyllene and δ-3-carene (C5H8O4, level 2; C9H14O3, level 2; C9H8O4, level 2). Additionally, a photooxidation product of the anthropogenic VOC 1,2,4-trimethylbenzene was identified (C9H8O4, level 2). Moreover, several dicarboxylic acids from biogenic origin like levulinic and azelaic acid as well as from anthropogenic origin like adipic acid were found in both troposphere and stratosphere (C5H8O3, level 1; C9H16O4, level 1; C6H10O4, level 1) (Mochida et al., 2003; Hansen et al., 2014). Commonly reported sources for these compounds are fossil fuel combustion (Kawamura and Kaplan, 1987), meat cooking (Rogge et al., 1991; Schauer et al., 1999) and biomass burning (Lefer et al., 1994). Dicarboxylic acids hereby have a low water vapor pressure and make up a large fraction of water-soluble organic aerosols due to their high water solubility (Saxena and Hildemann, 1996). Because of their physico-chemical characteristics, they are able to affect the properties of atmospheric particles including size, hygroscopy and activity as cloud condensation nuclei (Lightstone et al., 2000; Jacobson et al., 2000; Xu and Zhang, 2012).
Similarly in F09, we identified azelaic, adipic acid, and photooxidation products of several biogenic VOC, such as β- and α-pinene, two products of β-caryophyllene and δ-3-carene as well as the anthropogenic VOC naphthalene (C8H12O4, level 2; C9H14O4, level 2; C9H14O5, level 2; C9H14O4, level 2; C9H14O4, level 2; C6H10O4, level 2; C8H12O4, level 2).
Compounds unique to the stratosphere
Compared to the molecular fingerprint observed in the troposphere or for both regions, the compounds unique to the stratosphere show a completely different chemical profile. These compounds might not be transported vertically, but horizontally due to long-range transport or formed by atmospheric processes such as oxidation reactions or condensation of volatile species (Stohl, 2001; Dickerson et al., 2007).
Here, only a few compounds are found to be unique to the stratosphere, which are 166 compounds for F05 and with 43 even less for F09. The difference in number of emerging unique stratospheric compounds can be explained by differing meteorological scenarios, where F09 captures convective processes that increases the probability for vertical transport and mixing. As a consequence of that it is possible that more compounds are found in both layers rather than being identified as unique to the stratosphere. Surprisingly, there is no overlap between the compounds of the two flights, emphasizing the chemical variability of stratospheric organic aerosol composition. Even though a comparably small number of compounds is found as stratospherically unique, especially those could be of large interest to understand their origin, atmospheric mixing, transport processes and the anthropogenic influence on stratospheric OA.
Outstanding signals in F09 are organothiophosphates and a CHNOS compound (C8H19O5PS2, level 3; C12H27O5PS2, level 3; C15H15NO3S2, level 4). These compounds were not found to be reported in other studies and need to be studied further, especially regarding their effects within the stratosphere. Notably, C15H15NO3S2 has an ratio close to 1, indicating an aromatic compound. In this regard, studies by Li et al. (2020) point out the light-absorbing potential which should be noted especially in context of the stratosphere.
While in F05 the compound group CHOn is dominant, there is an almost equal distribution between CHOn, CHNO, and other for F09. Both flights show additionally organosulfates, which show again an aliphatic character (e.g. C18H38O7S, level 4; C16H34O6S, level 4; C12H26O5S, level 4; C14H28O5S, level 4). Some pronounced CHNO signals in F05 show a homologue series of organonitrates that likely derive from oxidation chemistry by NO3 radicals and biogenic derived monoterpenes (Curtius et al., 2024) (C9H15NO3, level 4; C10H19NO4, level 4; C11H17NO4, level 4; C12H21NO5, level 4). Additionally, CHNO compounds with a high nitrogen number, such as C15H26N6O4, level 4 were found, leading to an ratio below 3 (Fig. S6). These compounds indicate the oxidation of nitrogen containing precursors such as amides, that are derived from anthropogenic sources like vehicular exhaust (Yang et al., 2022), rather than organic compounds that react with NO3, attaching a nitrate group (Mayorga et al., 2021).
To conclude this comparison, we want to highlight the novel approach of analyzing different regions of the atmosphere via non-target analysis. By this, we were able to highlight differences in chemical patterns and characteristics, that occur for each region. We saw a broad variety of compounds for both troposphere and stratosphere, differing most for the stratosphere between both flights. Also, indications for transport processes were highlighted, stressing the potential of this measurement method.
3.6 Identified anthropogenic influence in the UTLS
Especially the occurrence of organothiophosphates, which were found in the stratosphere, suspects anthropogenic influence that should be of further concern. To highlight the possibilities of a targeted approach and focus more on investigating the anthropogenic influence within the UTLS, we also searched for target analytes with known origin from anthropogenic emissions. First, we focused on an approximation of the general anthropogenic influence, calculated by the ratio of azelaic acid, a biogenic marker and adipic acid, an anthropogenic marker, as suggested by Ho et al. (2006). Both substances were identified on the confidence level 1 by using authentic standards.
Notably, the strength of biogenic sources varies significantly (Fig. S17 in the Supplement) for the different flights as well as the different altitudes. This emphasizes the present anthropogenic influence and complexity of formation and transport processes, which is coherent with the chemical composition we observed. While both stratospheric samples show almost the same ratio of biogenic to anthropogenic source, the remaining samples go from predominantly anthropogenic influence in the upper troposphere to vast biogenic influence and back to largely anthropogenic influence. The non-existing trends stress the urge for more samples to gain a comprehensive understanding of the different influences.
As for target analytes, we want to give a first impression of compounds whose role and existence in the UTLS is largely unknown and yet are found via our UHPLC-HRMS setup and offline filter sampling (Vogel and Breuninger, 2025). Moreover, target analytes and especially anthropogenic pollutants contain valuable information about redistribution processes from ground to the UTLS that needs to be studied further.
Here, we focused on organophosphates which are or were used as flame retardants, lubrication oil, that is applied in civil aviation, and PFAS, which are known as the “forever chemicals”, with a liftime of decades, centuries or eventually longer (Brunn et al., 2023). The long lifetime of these pollutants in the free troposphere extends their impact from the regional to the continental or even global scale distributed by long-range transport. For this purpose, we investigated the compounds based on the exact masses as well as the isotopic fine structure (Fig. S18 in the Supplement) and aim for deeper investigations and comparison with authentic standards.
The selected pollutants perfluorooctanoic acid (PFOA), perfluorononanoic acid (PFNA), tris(2-chloropropyl) phosphate (TCPP), and the pentaerythritol ester (PEE, C29H52O8) were especially found in F09, which represents a flight over land and suggests redistrubution from emission sources on ground (Fig. 6). In terms of the pentaerythritol ester (C29H52O8), which is used as lubrication oil in jet engines (Ungeheuer et al., 2021), the tendency to form new particles is already studied (Ungeheuer et al., 2022). Here, we only found the major PEE and were not able to measure all other esters that occur in the lubrication oil. The ground pass, which exhibits the largest signals for PEE, took place relatively close to the Frankfurt airport, though we did not specifically aim for measuring aircraft emissions. That being the case, their occurence within the UTLS is an important and understudied source of anthropogenic organic aerosols (Decker et al., 2024).
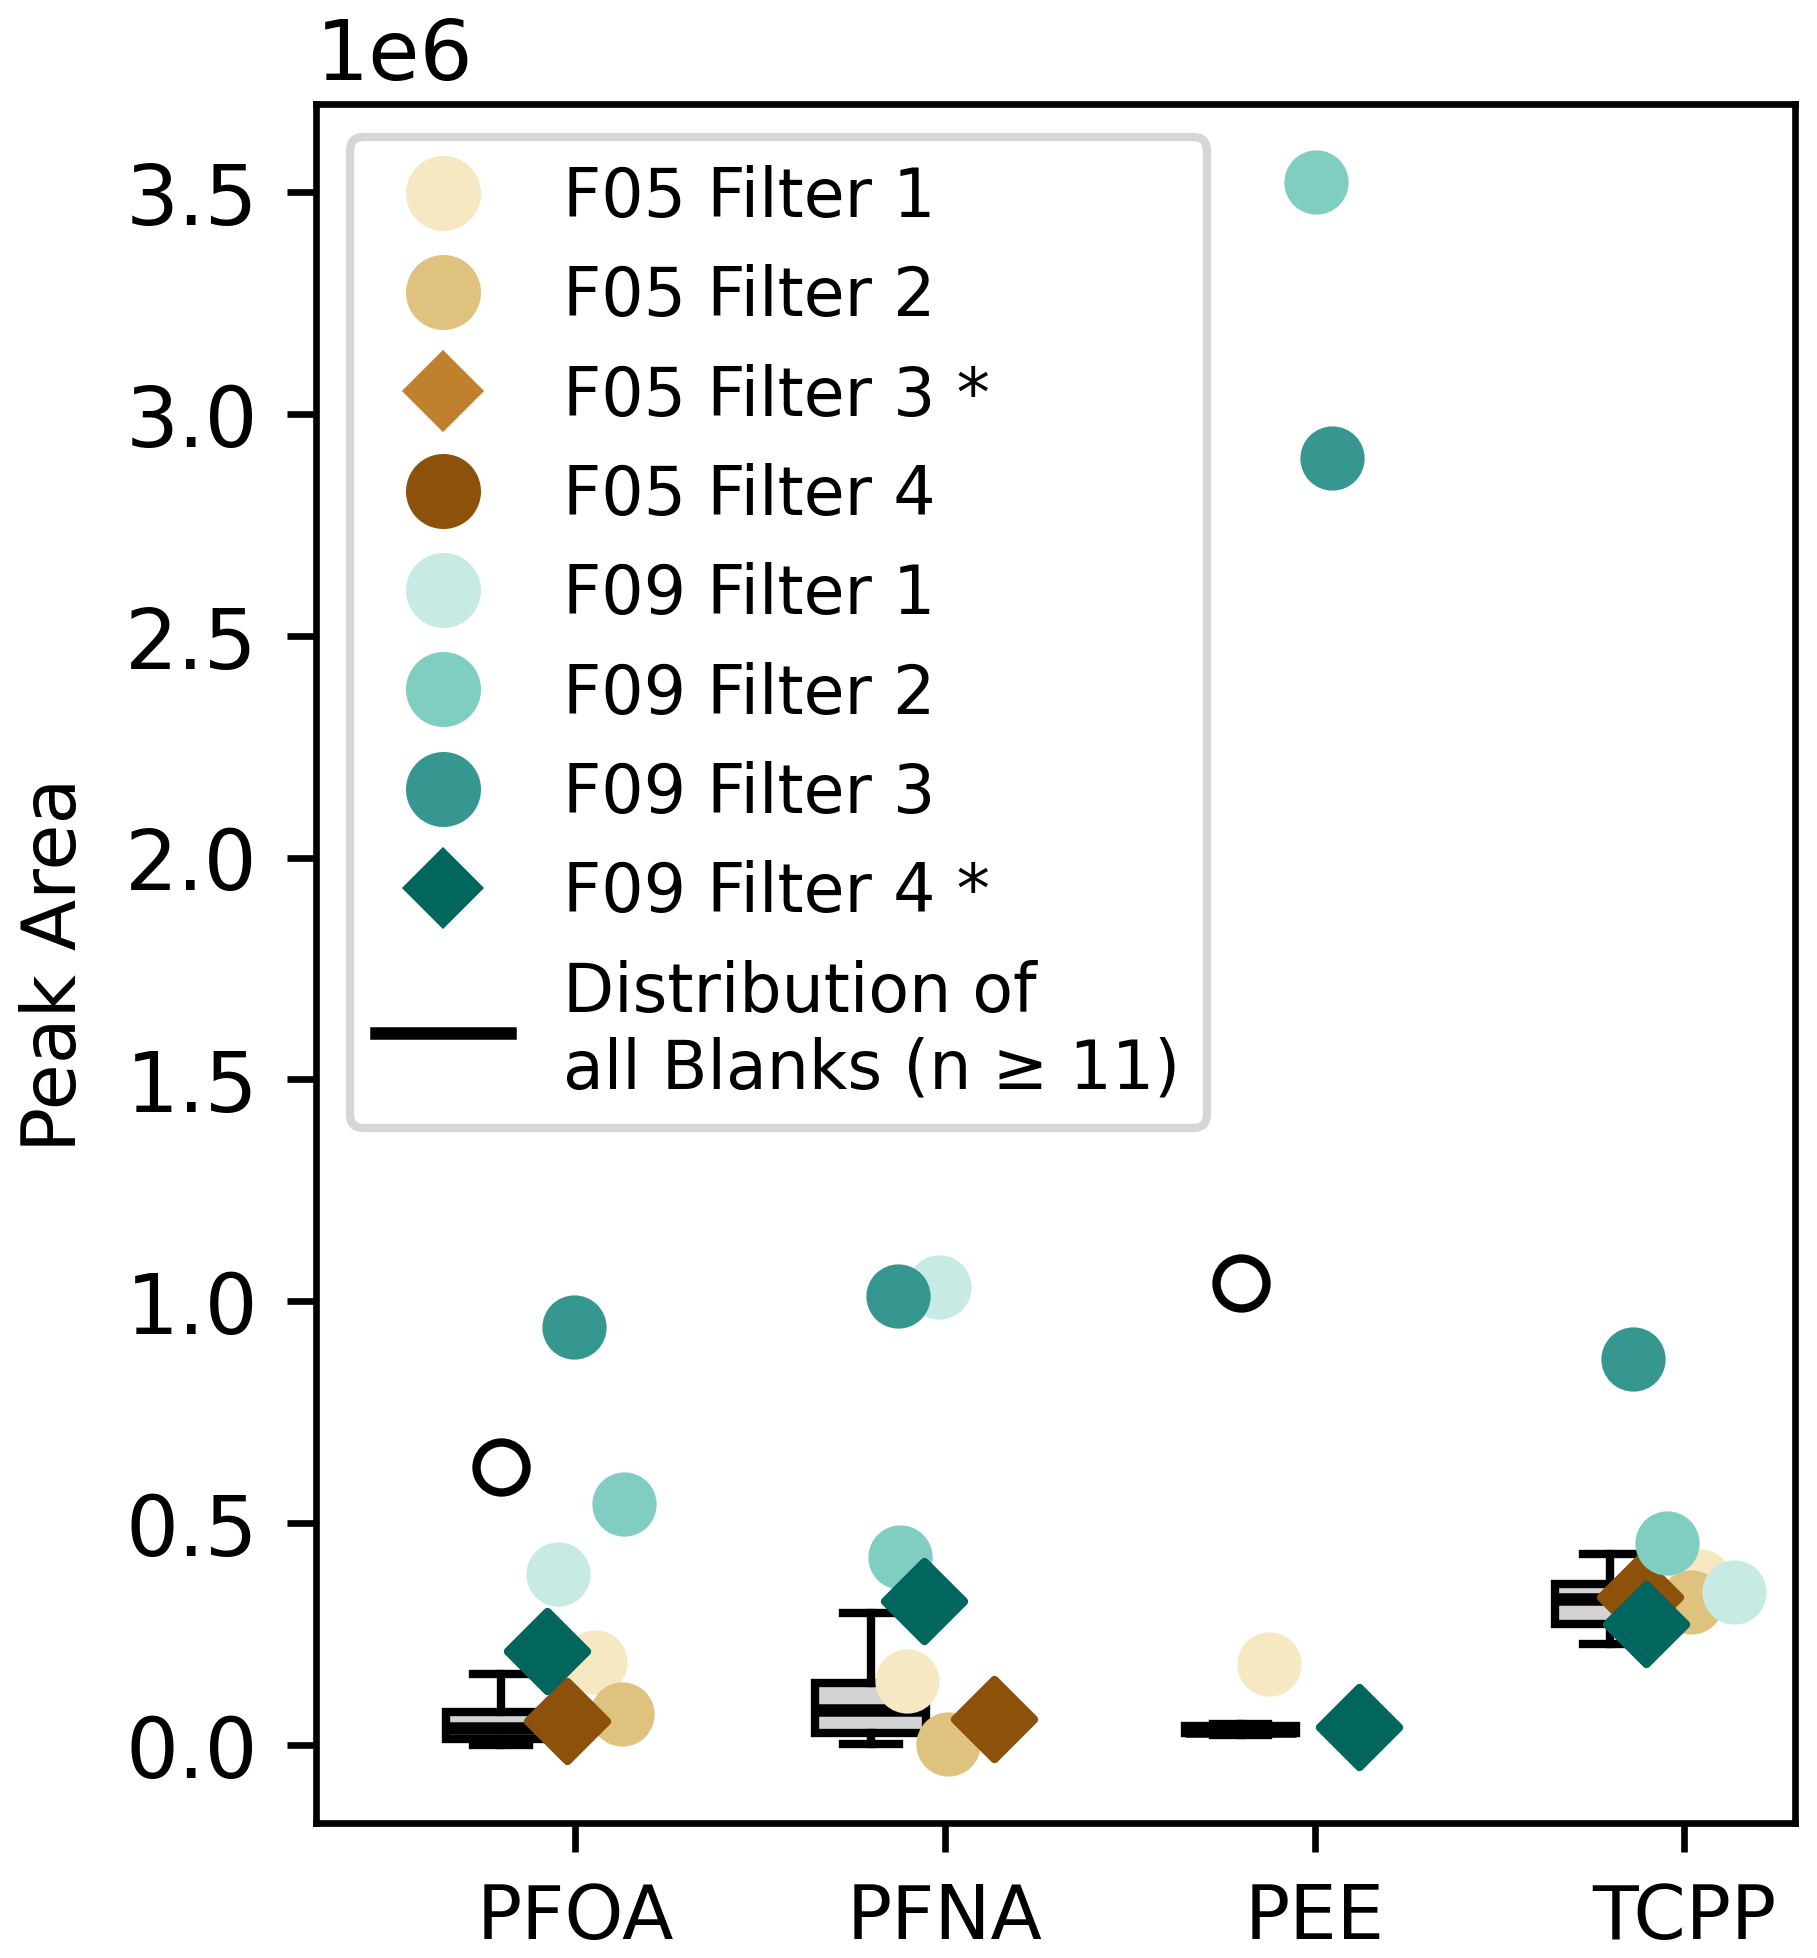
Figure 6The colored dots display the peak area (y axis) of the target compounds PFOA, PFNA, PEE, and TCPP for the respective filter. The boxplot next to it displays all filter blanks (n≥11) that have been collected throughout the whole campaign. The stratospheric filters are marked with a star (*) and displayed as a diamond in the plot. Colorless circles mark outliers that are defined as or with , with IQR as the interquantile range.
In this study, we demonstrated the successful application of UHPLC coupled with HRMS measurements and a subsequent non-target analysisi to investigate organic aerosols within the UTLS. By collecting filters with our in-house built multi-channel offline filter sampler SOAP during eight research flights, we were able to characterize the chemical composition of different parts of the UTLS. The eight flights captured various meteorological events with flight tracks over land and sea, reaching altitudes of up to 12 km. Our focus on a tropopause fold and convective systems allowed us to examine potential transport mechanisms for different aerosols, specifically highlighting F05 and F09 as case studies for this and further studies focusing on more detail on likely transport mechanisms.
Equipped with a comprehensive set of instruments, we were able to distinguish between tropospheric and stratospheric air masses by examining trace gases, capturing and separating their aerosol compositions on different filters. A non-target analysis revealed significant variations between samples from different regions within the UTLS. In particular, we observed a notable abundance of CHNO compounds in the stratosphere over the sea, while above land, a broader chemical variety prevailed. The flights closer to the ground aligned with our expectations of chemical composition and were comparable to ground measurements taken at the Taunus Observatory at Kleiner Feldberg, contrasting with the more diverse chemical profile of the stratosphere.
There is currently a lack of studies concerning the general distribution of aerosols between the troposphere and stratosphere, which limits our understanding of the characteristics that explain their differing occurrences. The origin of the air masses determined by LAGRANTO calculations suggests long-range transport of stratospheric air masses, possibly influenced by the polar jet stream, as well as medium-range transport in the troposphere and planetary boundary layer. In addition, the kinematic trajectories indicate strongly varying contributions from large-scale ascent and convectively transport including overshoots and turbulent mixing in the UTLS, emphasizing the complexity of aerosol found in the UTLS. Most air masses originated over North America and the Northern Atlantic Ocean.
A deeper investigation of compounds unique to either the troposphere or stratosphere revealed changes in general chemical properties. We noted a decrease in the average oxidation state of carbon in compounds found only in the stratosphere. Furthermore, we identified dicarboxylic acids, anthropogenic, and biogenic VOC oxidation products, as well as organosulfates in both regions, suggesting redistribution from ground emissions. An additional target analysis of the anthropogenic pollutants TCPP, PFOA, PFNA, and a PEE used as jet oil highlighted the extensive capabilities of our measurement technique and underscored the anthropogenic influence detected in the stratosphere, which warrants further investigation.
Our analysis is presently limited by the sampling duration, which affects detection limits, and our analytical setup restricts the range of detectable compounds via HESI. However, we identified specific compounds such as C8H19O5PS2 and C15H15NO3S2 that, with future research, could yield valuable insights into various atmospheric processes. Our method, combining offline filter sampling with UHPLC-HRMS measurements and non-target analysis, grants novel insights into the chemical composition of the UTLS and opens new avenues of inquiry to advance our understanding of mixing processes.
This study confirms the anthropogenic influence in the UTLS region, providing a closer examination of potential reaction and transport pathways. Further research is essential to assess the implications how small-scale and synoptic-scale transport redistribute anthropogenic aerosol throughout the atmosphere. Understanding changes in the number and mass of particles in the UTLS resulting from anthropogenic activities is crucial. Overall, our results contribute to a broader understanding of the chemical composition in the UTLS region and emphasize the necessity for additional studies utilizing advanced analytical methods like HRMS to unravel the complexities of atmospheric interactions. We provide evidence of a significant anthropogenic footprint in the UTLS aerosol, offering essential insights to enhance our comprehension of climate-relevant processes and improve future atmospheric modeling efforts aimed at predicting the behavior of aerosols and their implications for air quality and climate change.
The data is available from the Zenodo online repository https://doi.org/10.5281/zenodo.15680610 (Vogel and Breuninger, 2025) and https://doi.org/10.5281/zenodo.15371527 (Lachnitt, 2025). MSG satellite data is available from the EUMETSat archive.
The supplement related to this article is available online at https://doi.org/10.5194/acp-25-16533-2025-supplement.
AB collected and measured the samples, analyzed the data and wrote the manuscript. ALV and TH planned and supported during the campaign. FU helped performing the target analysis. PJ, JS, JW are responsible for the AMS and UHSAS data. NE, IK, HB, and PH provided CO, N2O and O3 data. RR, LM, TK, KD, AK, PW and SH were responsible for planning, manufacturing, certifying and installing SOAP. AM and CS calculated and provided the backward trajectories for the respective flights. PJ and SR acted as scientific operators during the flights. We acknowledge the DWD open data server, which was used to retrieve operational data during the campaign. EuMEtSaT Meteosat Second Generation HRSEVIRI data shown in Fig. S15 has been downloaded via EUMDAC in May 2025. All authors contributed to and commented on the manuscript.
The contact author has declared that none of the authors has any competing interests.
Publisher's note: Copernicus Publications remains neutral with regard to jurisdictional claims made in the text, published maps, institutional affiliations, or any other geographical representation in this paper. While Copernicus Publications makes every effort to include appropriate place names, the final responsibility lies with the authors. Views expressed in the text are those of the authors and do not necessarily reflect the views of the publisher.
This article is part of the special issue “The tropopause region in a changing atmosphere (TPChange) (ACP/AMT/GMD/WCD inter-journal SI)”. It is not associated with a conference.
The authors acknowledge the team of enviscope GmbH and GFD GmbH for the opportunity to carry out the campaign and the technical support during the campaign.
This research has been supported by the Deutsche Forschungsgemeinschaft (grant no. TRR 301 – Project-ID 428312742: “The tropopause region in a changing atmosphere”).
This open-access publication was funded by Goethe University Frankfurt.
This paper was edited by Frank Keutsch and reviewed by two anonymous referees.
Andreae, M. O., Afchine, A., Albrecht, R., Holanda, B. A., Artaxo, P., Barbosa, H. M. J., Borrmann, S., Cecchini, M. A., Costa, A., Dollner, M., Fütterer, D., Järvinen, E., Jurkat, T., Klimach, T., Konemann, T., Knote, C., Krämer, M., Krisna, T., Machado, L. A. T., Mertes, S., Minikin, A., Pöhlker, C., Pöhlker, M. L., Pöschl, U., Rosenfeld, D., Sauer, D., Schlager, H., Schnaiter, M., Schneider, J., Schulz, C., Spanu, A., Sperling, V. B., Voigt, C., Walser, A., Wang, J., Weinzierl, B., Wendisch, M., and Ziereis, H.: Aerosol characteristics and particle production in the upper troposphere over the Amazon Basin, Atmos. Chem. Phys., 18, 921–961, https://doi.org/10.5194/acp-18-921-2018, 2018. a
Appel, O., Köllner, F., Dragoneas, A., Hünig, A., Molleker, S., Schlager, H., Mahnke, C., Weigel, R., Port, M., Schulz, C., Drewnick, F., Vogel, B., Stroh, F., and Borrmann, S.: Chemical analysis of the Asian tropopause aerosol layer (ATAL) with emphasis on secondary aerosol particles using aircraft-based in situ aerosol mass spectrometry, Atmos. Chem. Phys., 22, 13607–13630, https://doi.org/10.5194/acp-22-13607-2022, 2022. a
Atkinson, R. and Arey, J.: Atmospheric degradation of volatile organic compounds, Chem. Rev., 103, 4605–4638, https://doi.org/10.1021/cr0206420, 2003. a, b
Benoit, R., Vernier, H., Vernier, J.-P., Joly, L., Dumelié, N., Wienhold, F. G., Crevoisier, C., Delpeux, S., Bernard, F., Dagaut, P., and Berthet, G.: The first balloon-borne sample analysis of atmospheric carbonaceous components reveals new insights into formation processes, Chemosphere, 326, 138421, https://doi.org/10.1016/j.chemosphere.2023.138421, 2023. a, b, c
Bethan, S., Vaughan, G., and Reid, S. J.: A comparison of ozone and thermal tropopause heights and the impact of tropopause definition on quantifying the ozone content of the troposphere, Q. J. Roy. Meteor. Soc., 122, 929–944, https://doi.org/10.1002/qj.49712253207, 1996. a
Bianchi, F., Kurtén, T., Riva, M., Mohr, C., Rissanen, M. P., Roldin, P., Berndt, T., Crounse, J. D., Wennberg, P. O., Mentel, T. F., Wildt, J., Junninen, H., Jokinen, T., Kulmala, M., Worsnop, D. R., Thornton, J. A., Donahue, N., Kjaergaard, H. G., and Ehn, M.: Highly oxygenated organic molecules (HOM) from gas-phase autoxidation involving peroxy radicals: a key contributor to atmospheric aerosol, Chem. Rev., 119, 3472–3509, https://doi.org/10.1021/acs.chemrev.8b00395, 2019. a
Blair, S. L., MacMillan, A. C., Drozd, G. T., Goldstein, A. H., Chu, R. K., Paša-Tolić, L., Shaw, J. B., Tolić, N., Lin, P., Laskin, J., Laskin, A., and Nizkorodov, S. A.: Molecular characterization of organosulfur compounds in biodiesel and diesel fuel secondary organic aerosol, Environ. Sci. Technol., 51, 119–127, https://doi.org/10.1021/acs.est.6b03304, 2016. a
Bozem, H., Joppe, P., Li, Y., Emig, N., Afchine, A., Breuninger, A., Curtius, J., Hofmann, S., Ismayil, S., Kandler, K., Kunkel, D., Kutschka, A., Lachnitt, H.-C., Petzold, A., Richter, S., Röschenthaler, T., Rolf, C., Schneider, L., Schneider, J., Vogel, A., and Hoor, P.: The TropoPause Composition TOwed Sensor Shuttle (TPC-TOSS): a new airborne dual platform approach for atmospheric composition measurements at the tropopause, Atmos. Meas. Tech., 18, 6545–6568, https://doi.org/10.5194/amt-18-6545-2025, 2025. a, b
Brunn, H., Arnold, G., Körner, W., Rippen, G., Steinhäuser, K. G., and Valentin, I.: PFAS: forever chemicals – persistent, bioaccumulative and mobile. Reviewing the status and the need for their phase out and remediation of contaminated sites, Environmental Sciences Europe, 35, https://doi.org/10.1186/s12302-023-00721-8, 2023. a
Chen, W., Almuhtaram, H., Andrews, R., and Peng, H.: Unanticipated thio-oxidation of organophosphite chemical additives in PVC microplastics following in-situ weathering, ChemRxiv [preprint], https://doi.org/10.26434/chemrxiv-2023-20bx2, 2023. a
Crutzen, P. J.: The possible importance of CSO for the sulfate layer of the stratosphere, Geophys. Res. Lett., 3, 73–76, https://doi.org/10.1029/gl003i002p00073, 1976. a
Crutzen, P. J. and Zimmermann, P. H.: The changing photochemistry of the troposphere, Tellus B, 43, 136, https://doi.org/10.3402/tellusb.v43i4.15403, 1991. a
Curtius, J., Heinritzi, M., Beck, L. J., Pöhlker, M. L., Tripathi, N., Krumm, B. E., Holzbeck, P., Nussbaumer, C. M., Hernández Pardo, L., Klimach, T., Barmpounis, K., Andersen, S. T., Bardakov, R., Bohn, B., Cecchini, M. A., Chaboureau, J.-P., Dauhut, T., Dienhart, D., Dörich, R., Edtbauer, A., Giez, A., Hartmann, A., Holanda, B. A., Joppe, P., Kaiser, K., Keber, T., Klebach, H., Krüger, O. O., Kürten, A., Mallaun, C., Marno, D., Martinez, M., Monteiro, C., Nelson, C., Ort, L., Raj, S. S., Richter, S., Ringsdorf, A., Rocha, F., Simon, M., Sreekumar, S., Tsokankunku, A., Unfer, G. R., Valenti, I. D., Wang, N., Zahn, A., Zauner-Wieczorek, M., Albrecht, R. I., Andreae, M. O., Artaxo, P., Crowley, J. N., Fischer, H., Harder, H., Herdies, D. L., Machado, L. A. T., Pöhlker, C., Pöschl, U., Possner, A., Pozzer, A., Schneider, J., Williams, J., and Lelieveld, J.: Isoprene nitrates drive new particle formation in Amazon's upper troposphere, Nature, 636, 124–130, https://doi.org/10.1038/s41586-024-08192-4, 2024. a, b
Danielsen, E. F.: Stratospheric-tropospheric exchange based on radioactivity, ozone and potential vorticity, J. Atmos. Sci., 25, 502–518, https://doi.org/10.1175/1520-0469(1968)025<0502:stebor>2.0.co;2, 1968. a
de Boer, J. and Stapleton, H. M.: Toward fire safety without chemical risk, Science, 364, 231–232, https://doi.org/10.1126/science.aax2054, 2019. a
Decker, Z. C. J., Alpert, P. A., Ammann, M., Anet, J. G., Bauer, M., Cui, T., Durdina, L., Edebeli, J., Gysel-Beer, M., Prévôt, A. S. H., Qi, L., Slowik, J. G., Spirig, C., Tinorua, S., Ungeheuer, F., Vogel, A., Zhang, J., and Brem, B. T.: Emission and formation of aircraft engine oil ultrafine particles, ACS ES&T Air, 1, 1662–1672, https://doi.org/10.1021/acsestair.4c00184, 2024. a
Dickerson, R. R., Li, C., Li, Z., Marufu, L. T., Stehr, J. W., McClure, B., Krotkov, N., Chen, H., Wang, P., Xia, X., Ban, X., Gong, F., Yuan, J., and Yang, J.: Aircraft observations of dust and pollutants over northeast China: insight into the meteorological mechanisms of transport, J. Geophys. Res.-Atmos., 112, https://doi.org/10.1029/2007jd008999, 2007. a, b
Dumelié, N., Vernier, J.-P., Berthet, G., Vernier, H., Renard, J.-B., Rastogi, N., Wienhold, F., Combaz, D., Angot, M., Burgalat, J., Parent, F., Chauvin, N., Albora, G., Dagaut, P., Benoit, R., Kovilakam, M., Crevoisier, C., and Joly, L.: Toward rapid balloon experiments for sudden aerosol injection in the stratosphere (REAS) by volcanic eruptions and wildfires, B. Am. Meteorol. Soc., 105, E105–E120, https://doi.org/10.1175/bams-d-22-0086.1, 2024. a
Duncan, B. N., Strahan, S. E., Yoshida, Y., Steenrod, S. D., and Livesey, N.: Model study of the cross-tropopause transport of biomass burning pollution, Atmos. Chem. Phys., 7, 3713–3736, https://doi.org/10.5194/acp-7-3713-2007, 2007. a
Eliason, T., Gilman, J., and Vaida, V.: Oxidation of organic films relevant to atmospheric aerosols, Atmos. Environ., 38, 1367–1378, https://doi.org/10.1016/j.atmosenv.2003.11.025, 2004. a
Ellison, G. B., Tuck, A. F., and Vaida, V.: Atmospheric processing of organic aerosols, J. Geophys. Res.-Atmos., 104, 11633–11641, https://doi.org/10.1029/1999jd900073, 1999. a
Filonchyk, M., Peterson, M. P., Zhang, L., Zhang, L., and He, Y.: Estimating air pollutant emissions from the 2024 wildfires in Canada and the impact on air quality, Gondwana Research, 140, 194–204, https://doi.org/10.1016/j.gr.2024.12.012, 2025. a
Fischer, H., Wienhold, F. G., Hoor, P., Bujok, O., Schiller, C., Siegmund, P., Ambaum, M., Scheeren, H. A., and Lelieveld, J.: Tracer correlations in the northern high latitude lowermost stratosphere: influence of cross tropopause mass exchange, Geophys. Res. Lett., 27, 97–100, https://doi.org/10.1029/1999gl010879, 2000. a, b
Forster, C., Wandinger, U., Wotawa, G., James, P., Mattis, I., Althausen, D., Simmonds, P., O'Doherty, S., Jennings, S. G., Kleefeld, C., Schneider, J., Trickl, T., Kreipl, S., Jäger, H., and Stohl, A.: Transport of boreal forest fire emissions from Canada to Europe, J. Geophys. Res.-Atmos., 106, 22887–22906, https://doi.org/10.1029/2001jd900115, 2001. a
Froyd, K. D., Murphy, D. M., Sanford, T. J., Thomson, D. S., Wilson, J. C., Pfister, L., and Lait, L.: Aerosol composition of the tropical upper troposphere, Atmos. Chem. Phys., 9, 4363–4385, https://doi.org/10.5194/acp-9-4363-2009, 2009. a
Goldstein, A. H. and Galbally, I. E.: Known and unexplored organic constituents in the earth's atmosphere, Environ. Sci. Technol., 41, 1514–1521, 2007. a
Hallquist, M., Wenger, J. C., Baltensperger, U., Rudich, Y., Simpson, D., Claeys, M., Dommen, J., Donahue, N. M., George, C., Goldstein, A. H., Hamilton, J. F., Herrmann, H., Hoffmann, T., Iinuma, Y., Jang, M., Jenkin, M. E., Jimenez, J. L., Kiendler-Scharr, A., Maenhaut, W., McFiggans, G., Mentel, Th. F., Monod, A., Prévôt, A. S. H., Seinfeld, J. H., Surratt, J. D., Szmigielski, R., and Wildt, J.: The formation, properties and impact of secondary organic aerosol: current and emerging issues, Atmos. Chem. Phys., 9, 5155–5236, https://doi.org/10.5194/acp-9-5155-2009, 2009. a, b
Hansen, A. M. K., Kristensen, K., Nguyen, Q. T., Zare, A., Cozzi, F., Nøjgaard, J. K., Skov, H., Brandt, J., Christensen, J. H., Ström, J., Tunved, P., Krejci, R., and Glasius, M.: Organosulfates and organic acids in Arctic aerosols: speciation, annual variation and concentration levels, Atmos. Chem. Phys., 14, 7807–7823, https://doi.org/10.5194/acp-14-7807-2014, 2014. a
Ho, K., Lee, S., Cao, J., Kawamura, K., Watanabe, T., Cheng, Y., and Chow, J. C.: Dicarboxylic acids, ketocarboxylic acids and dicarbonyls in the urban roadside area of Hong Kong, Atmos. Environ., 40, 3030–3040, https://doi.org/10.1016/j.atmosenv.2005.11.069, 2006. a
Holton, J. R., Haynes, P. H., McIntyre, M. E., Douglass, A. R., Rood, R. B., and Pfister, L.: Stratosphere troposphere exchange, Rev. Geophys., 33, 403–439, https://doi.org/10.1029/95rg02097, 1995. a, b
Hoor, P., Fischer, H., Lange, L., Lelieveld, J., and Brunner, D.: Seasonal variations of a mixing layer in the lowermost stratosphere as identified by the CO O3 correlation from in situ measurements, J. Geophys. Res.-Atmos., 107, https://doi.org/10.1029/2000jd000289, 2002. a, b
Höpfner, M., Ungermann, J., Borrmann, S., Wagner, R., Spang, R., Riese, M., Stiller, G., Appel, O., Batenburg, A. M., Bucci, S., Cairo, F., Dragoneas, A., Friedl-Vallon, F., Hünig, A., Johansson, S., Krasauskas, L., Legras, B., Leisner, T., Mahnke, C., Möhler, O., Molleker, S., Müller, R., Neubert, T., Orphal, J., Preusse, P., Rex, M., Saathoff, H., Stroh, F., Weigel, R., and Wohltmann, I.: Ammonium nitrate particles formed in upper troposphere from ground ammonia sources during Asian monsoons, Nat. Geosci., 12, 608–612, https://doi.org/10.1038/s41561-019-0385-8, 2019. a
Huntrieser, H., Heland, J., Schlager, H., Forster, C., Stohl, A., Aufmhoff, H., Arnold, F., Scheel, H. E., Campana, M., Gilge, S., Eixmann, R., and Cooper, O.: Intercontinental air pollution transport from North America to Europe: experimental evidence from airborne measurements and surface observations, J. Geophys. Res.-Atmos., 110, https://doi.org/10.1029/2004jd005045, 2005. a
IPCC: Contribution of Working Groups I, II and III to the Sixth Assessment Report of the Intergovernmental Panel on Climate Change, in: Climate Change 2023: Synthesis Report, edited by: Core Writing Team, Lee, H., and Romero, J., IPCC, Geneva, Switzerland, https://doi.org/10.59327/ipcc/ar6-9789291691647, 2023. a
Jacobson, M. C., Hansson, H.-C., Noone, K. J., and Charlson, R. J.: Organic atmospheric aerosols: review and state of the science, Rev. Geophys., 38, 267–294, https://doi.org/10.1029/1998rg000045, 2000. a
Jimenez, J. L., Canagaratna, M. R., Donahue, N. M., Prevot, A. S. H., Zhang, Q., Kroll, J. H., DeCarlo, P. F., Allan, J. D., Coe, H., Ng, N. L., Aiken, A. C., Docherty, K. S., Ulbrich, I. M., Grieshop, A. P., Robinson, A. L., Duplissy, J., Smith, J. D., Wilson, K. R., Lanz, V. A., Hueglin, C., Sun, Y. L., Tian, J., Laaksonen, A., Raatikainen, T., Rautiainen, J., Vaattovaara, P., Ehn, M., Kulmala, M., Tomlinson, J. M., Collins, D. R., Cubison, M. J., Dunlea, J., Huffman, J. A., Onasch, T. B., Alfarra, M. R., Williams, P. I., Bower, K., Kondo, Y., Schneider, J., Drewnick, F., Borrmann, S., Weimer, S., Demerjian, K., Salcedo, D., Cottrell, L., Griffin, R., Takami, A., Miyoshi, T., Hatakeyama, S., Shimono, A., Sun, J. Y., Zhang, Y. M., Dzepina, K., Kimmel, J. R., Sueper, D., Jayne, J. T., Herndon, S. C., Trimborn, A. M., Williams, L. R., Wood, E. C., Middlebrook, A. M., Kolb, C. E., Baltensperger, U., and Worsnop, D. R.: Evolution of organic aerosols in the atmosphere, Science, 326, 1525–1529, https://doi.org/10.1126/science.1180353, 2009. a
Johansson, S., Höpfner, M., Kirner, O., Wohltmann, I., Bucci, S., Legras, B., Friedl-Vallon, F., Glatthor, N., Kretschmer, E., Ungermann, J., and Wetzel, G.: Pollution trace gas distributions and their transport in the Asian monsoon upper troposphere and lowermost stratosphere during the StratoClim campaign 2017, Atmos. Chem. Phys., 20, 14695–14715, https://doi.org/10.5194/acp-20-14695-2020, 2020. a
Joppe, P., Schneider, J., Kaiser, K., Fischer, H., Hoor, P., Kunkel, D., Lachnitt, H.-C., Marsing, A., Röder, L., Schlager, H., Tomsche, L., Voigt, C., Zahn, A., and Borrmann, S.: The influence of extratropical cross-tropopause mixing on the correlation between ozone and sulfate aerosol in the lowermost stratosphere, Atmos. Chem. Phys., 24, 7499–7522, https://doi.org/10.5194/acp-24-7499-2024, 2024. a, b, c
Junge, C. E., Chagnon, C. W., and Manson, J. E.: Stratospheric aerosols, J. Meteorol., 18, 81–108, https://doi.org/10.1175/1520-0469(1961)018<0081:sa>2.0.co;2, 1961. a
Kawamura, K. and Kaplan, I. R.: Motor exhaust emissions as a primary source for dicarboxylic acids in Los Angeles ambient air, Environ. Sci. Technol., 21, 105–110, https://doi.org/10.1021/es00155a014, 1987. a
Köppe, M., Hermann, M., Brenninkmeijer, C. A. M., Heintzenberg, J., Schlager, H., Schuck, T., Slemr, F., Sprung, D., van Velthoven, P. F. J., Wiedensohler, A., Zahn, A., and Ziereis, H.: Origin of aerosol particles in the mid-latitude and subtropical upper troposphere and lowermost stratosphere from cluster analysis of CARIBIC data, Atmos. Chem. Phys., 9, 8413–8430, https://doi.org/10.5194/acp-9-8413-2009, 2009. a
Kourtchev, I., Godoi, R. H. M., Connors, S., Levine, J. G., Archibald, A. T., Godoi, A. F. L., Paralovo, S. L., Barbosa, C. G. G., Souza, R. A. F., Manzi, A. O., Seco, R., Sjostedt, S., Park, J.-H., Guenther, A., Kim, S., Smith, J., Martin, S. T., and Kalberer, M.: Molecular composition of organic aerosols in central Amazonia: an ultra-high-resolution mass spectrometry study, Atmos. Chem. Phys., 16, 11899–11913, https://doi.org/10.5194/acp-16-11899-2016, 2016. a
Kroll, J. H., Donahue, N. M., Jimenez, J. L., Kessler, S. H., Canagaratna, M. R., Wilson, K. R., Altieri, K. E., Mazzoleni, L. R., Wozniak, A. S., Bluhm, H., Mysak, E. R., Smith, J. D., Kolb, C. E., and Worsnop, D. R.: Carbon oxidation state as a metric for describing the chemistry of atmospheric organic aerosol, Nature Chemistry, 3, 133–139, https://doi.org/10.1038/nchem.948, 2011. a
Lachnitt, H.-C.: TPEx 2024 observational data and model data along flight path-Merged, Zenodo [data set], https://doi.org/10.5281/ZENODO.15371527, 2025. a, b
Lamarque, J.-F., Bond, T. C., Eyring, V., Granier, C., Heil, A., Klimont, Z., Lee, D., Liousse, C., Mieville, A., Owen, B., Schultz, M. G., Shindell, D., Smith, S. J., Stehfest, E., Van Aardenne, J., Cooper, O. R., Kainuma, M., Mahowald, N., McConnell, J. R., Naik, V., Riahi, K., and van Vuuren, D. P.: Historical (1850–2000) gridded anthropogenic and biomass burning emissions of reactive gases and aerosols: methodology and application, Atmos. Chem. Phys., 10, 7017–7039, https://doi.org/10.5194/acp-10-7017-2010, 2010. a
Lambe, A., Massoli, P., Zhang, X., Canagaratna, M., Nowak, J., Daube, C., Yan, C., Nie, W., Onasch, T., Jayne, J., Kolb, C., Davidovits, P., Worsnop, D., and Brune, W.: Controlled nitric oxide production via O(1D) + N2O reactions for use in oxidation flow reactor studies, Atmos. Meas. Tech., 10, 2283–2298, https://doi.org/10.5194/amt-10-2283-2017, 2017. a
Lefer, B. L., Talbot, R. W., Harriss, R. H., Bradshaw, J. D., Sandholm, S. T., Olson, J. O., Sachse, G. W., Collins, J., Shipham, M. A., Blake, D. R., Klemm, K. I., Klemm, O., Gorzelska, K., and Barrick, J.: Enhancement of acidic gases in biomass burning impacted air masses over Canada, J. Geophys. Res.-Atmos., 99, 1721–1737, https://doi.org/10.1029/93jd02091, 1994. a
Lelieveld, J., Gromov, S., Pozzer, A., and Taraborrelli, D.: Global tropospheric hydroxyl distribution, budget and reactivity, Atmos. Chem. Phys., 16, 12477–12493, https://doi.org/10.5194/acp-16-12477-2016, 2016. a
Leppla, D., Hildmann, S., Zannoni, N., Kremper, L., Hollanda, B., Williams, J., Pöhlker, C., Wolff, S., Sà, M., Solci, M. C., Pöschl, U., and Hoffmann, T.: Comprehensive Non-targeted Molecular Characterization of Organic Aerosols in the Amazon Rainforest, EGUsphere [preprint], https://doi.org/10.5194/egusphere-2025-141, 2025. a
Li, X., Yang, Y., Liu, S., Zhao, Q., Wang, G., and Wang, Y.: Light absorption properties of brown carbon (BrC) in autumn and winter in Beijing: composition, formation and contribution of nitrated aromatic compounds, Atmos. Environ., 223, 117289, https://doi.org/10.1016/j.atmosenv.2020.117289, 2020. a
Li, Y., Dykema, J., Deshler, T., and Keutsch, F.: Composition dependence of stratospheric aerosol shortwave radiative forcing in northern midlatitudes, Geophys. Res. Lett., 48, https://doi.org/10.1029/2021gl094427, 2021. a
Lightstone, J. M., Onasch, T. B., Imre, D., and Oatis, S.: Deliquescence, efflorescence, and water activity in ammonium nitrate and mixed ammonium nitrate/succinic acid microparticles, J. Phys. Chem. A, 104, 9337–9346, https://doi.org/10.1021/jp002137h, 2000. a
Lin, Y.-H., Zhang, Z., Docherty, K. S., Zhang, H., Budisulistiorini, S. H., Rubitschun, C. L., Shaw, S. L., Knipping, E. M., Edgerton, E. S., Kleindienst, T. E., Gold, A., and Surratt, J. D.: Isoprene epoxydiols as precursors to secondary organic aerosol formation: acid-catalyzed reactive uptake studies with authentic compounds, Environ. Sci. Technol., 46, 250–258, https://doi.org/10.1021/es202554c, 2011. a
Lippmann, M.: Particulate matter (PM) air pollution and health: regulatory and policy implications, Air Qual. Atmos. Health, 5, 237–241, https://doi.org/10.1007/s11869-011-0136-5, 2011. a
Liu, Q., Li, L., Zhang, X., Saini, A., Li, W., Hung, H., Hao, C., Li, K., Lee, P., Wentzell, J. J. B., Huo, C., Li, S.-M., Harner, T., and Liggio, J.: Uncovering global-scale risks from commercial chemicals in air, Nature, 600, 456–461, https://doi.org/10.1038/s41586-021-04134-6, 2021. a
Ma, J., Reininger, N., Zhao, C., Döbler, D., Rüdiger, J., Qiu, Y., Ungeheuer, F., Simon, M., D'Angelo, L., Breuninger, A., David, J., Bai, Y., Li, Y., Xue, Y., Li, L., Wang, Y., Hildmann, S., Hoffmann, T., Liu, B., Niu, H., Wu, Z., and Vogel, A. L.: Unveiling a large fraction of hidden organosulfates in ambient organic aerosol, Nat. Commun., 16, https://doi.org/10.1038/s41467-025-59420-y, 2025. a
Martinsson, B. G., Friberg, J., Sandvik, O. S., Hermann, M., van Velthoven, P. F. J., and Zahn, A.: Formation and composition of the UTLS aerosol, npj Clim. Atmos. Sci., 2, https://doi.org/10.1038/s41612-019-0097-1, 2019. a, b
Mayorga, R. J., Zhao, Z., and Zhang, H.: Formation of secondary organic aerosol from nitrate radical oxidation of phenolic VOCs: implications for nitration mechanisms and brown carbon formation, Atmos. Environ., 244, 117910, https://doi.org/10.1016/j.atmosenv.2020.117910, 2021. a
McFiggans, G., Mentel, T. F., Wildt, J., Pullinen, I., Kang, S., Kleist, E., Schmitt, S., Springer, M., Tillmann, R., Wu, C., Zhao, D., Hallquist, M., Faxon, C., Le Breton, M., Hallquist, A. M., Simpson, D., Bergström, R., Jenkin, M. E., Ehn, M., Thornton, J. A., Alfarra, M. R., Bannan, T. J., Percival, C. J., Priestley, M., Topping, D., and Kiendler-Scharr, A.: Secondary organic aerosol reduced by mixture of atmospheric vapours, Nature, 565, 587–593, https://doi.org/10.1038/s41586-018-0871-y, 2019. a
McKendry, I. G., Hacker, J. P., Stull, R., Sakiyama, S., Mignacca, D., and Reid, K.: Long range transport of Asian dust to the Lower Fraser Valley, British Columbia, Canada, J. Geophys. Res.-Atmos., 106, 18361–18370, https://doi.org/10.1029/2000jd900359, 2001. a
Minerath, E. C. and Elrod, M. J.: Assessing the potential for diol and hydroxy sulfate ester formation from the reaction of epoxides in tropospheric aerosols, Environ. Sci. Technol., 43, 1386–1392, https://doi.org/10.1021/es8029076, 2009. a
Mochida, M., Kawabata, A., Kawamura, K., Hatsushika, H., and Yamazaki, K.: Seasonal variation and origins of dicarboxylic acids in the marine atmosphere over the western North Pacific, J. Geophys. Res.-Atmos., 108, https://doi.org/10.1029/2002jd002355, 2003. a
Müller, S., Hoor, P., Berkes, F., Bozem, H., Klingebiel, M., Reutter, P., Smit, H. G. J., Wendisch, M., Spichtinger, P., and Borrmann, S.: In situ detection of stratosphere troposphere exchange of cirrus particles in the midlatitudes, Geophys. Res. Lett., 42, 949–955, https://doi.org/10.1002/2014gl062556, 2015. a
Murphy, D. M., Froyd, K. D., Schwarz, J. P., and Wilson, J. C.: Observations of the chemical composition of stratospheric aerosol particles, Q. J. Roy. Meteor. Soc., 140, 1269–1278, https://doi.org/10.1002/qj.2213, 2013. a
Murphy, D. M., Froyd, K. D., Bourgeois, I., Brock, C. A., Kupc, A., Peischl, J., Schill, G. P., Thompson, C. R., Williamson, C. J., and Yu, P.: Radiative and chemical implications of the size and composition of aerosol particles in the existing or modified global stratosphere, Atmos. Chem. Phys., 21, 8915–8932, https://doi.org/10.5194/acp-21-8915-2021, 2021. a, b
Myhre, G., Berglen, T. F., Myhre, C. E. L., and Isaksen, I. S.: The radiative effect of the anthropogenic influence on the stratospheric sulfate aerosol layer, Tellus B, 56, 294, https://doi.org/10.3402/tellusb.v56i3.16431, 2004. a
Neely, R. R., Toon, O. B., Solomon, S., Vernier, J., Alvarez, C., English, J. M., Rosenlof, K. H., Mills, M. J., Bardeen, C. G., Daniel, J. S., and Thayer, J. P.: Recent anthropogenic increases in SO2from Asia have minimal impact on stratospheric aerosol, Geophys. Res. Lett., 40, 999–1004, https://doi.org/10.1002/grl.50263, 2013. a
Pan, L. L., Randel, W. J., Gary, B. L., Mahoney, M. J., and Hintsa, E. J.: Definitions and sharpness of the extratropical tropopause: a trace gas perspective, J. Geophys. Res.-Atmos., 109, https://doi.org/10.1029/2004jd004982, 2004. a
Pankow, J. F. and Asher, W. E.: SIMPOL.1: a simple group contribution method for predicting vapor pressures and enthalpies of vaporization of multifunctional organic compounds, Atmos. Chem. Phys., 8, 2773–2796, https://doi.org/10.5194/acp-8-2773-2008, 2008. a
Pöschl, U.: Atmospheric aerosols: composition, transformation, climate and health effects, Angewandte Chemie International Edition, 44, 7520–7540, https://doi.org/10.1002/anie.200501122, 2005. a
Qi, L., Zhang, Z., Wang, X., Deng, F., Zhao, J., and Liu, H.: Molecular characterization of atmospheric particulate organosulfates in a port environment using ultrahigh resolution mass spectrometry: identification of traffic emissions, Journal of Hazardous Materials, 419, 126431, https://doi.org/10.1016/j.jhazmat.2021.126431, 2021. a
Resch, J., Wolfer, K., Barth, A., and Kalberer, M.: Effects of storage conditions on the molecular-level composition of organic aerosol particles, Atmos. Chem. Phys., 23, 9161–9171, https://doi.org/10.5194/acp-23-9161-2023, 2023. a, b
Riese, M., Friedl-Vallon, F., Spang, R., Preusse, P., Schiller, C., Hoffmann, L., Konopka, P., Oelhaf, H., Clarmann, T. v., and Höpfner, M.: GLObal limb Radiance Imager for the Atmosphere (GLORIA): scientific objectives, Adv. Space Res., 36, 989–995, https://doi.org/10.1016/j.asr.2005.04.115, 2005. a
Riese, M., Ploeger, F., Rap, A., Vogel, B., Konopka, P., Dameris, M., and Forster, P.: Impact of uncertainties in atmospheric mixing on simulated UTLS composition and related radiative effects, J. Geophys. Res.-Atmos., 117, https://doi.org/10.1029/2012jd017751, 2012. a
Riva, M., Da Silva Barbosa, T., Lin, Y.-H., Stone, E. A., Gold, A., and Surratt, J. D.: Chemical characterization of organosulfates in secondary organic aerosol derived from the photooxidation of alkanes, Atmos. Chem. Phys., 16, 11001–11018, https://doi.org/10.5194/acp-16-11001-2016, 2016. a
Rogge, W. F., Hildemann, L. M., Mazurek, M. A., Cass, G. R., and Simoneit, B. R. T.: Sources of fine organic aerosol. 1. Charbroilers and meat cooking operations, Environ. Sci. Technol., 25, 1112–1125, https://doi.org/10.1021/es00018a015, 1991. a
Saxena, P. and Hildemann, L. M.: Water-soluble organics in atmospheric particles: a critical review of the literature and application of thermodynamics to identify candidate compounds, J. Atmos. Chem., 24, 57–109, https://doi.org/10.1007/bf00053823, 1996. a
Schauer, J. J., Kleeman, M. J., Cass, G. R., and Simoneit, B. R. T.: Measurement of emissions from air pollution sources. 1. C1 through C29 organic compounds from meat charbroiling, Environ. Sci. Technol., 33, 1566–1577, https://doi.org/10.1021/es980076j, 1999. a
Schmale, J., Schneider, J., Jurkat, T., Voigt, C., Kalesse, H., Rautenhaus, M., Lichtenstern, M., Schlager, H., Ancellet, G., Arnold, F., Gerding, M., Mattis, I., Wendisch, M., and Borrmann, S.: Aerosol layers from the 2008 eruptions of Mount Okmok and Mount Kasatochi: in situ upper troposphere and lower stratosphere measurements of sulfate and organics over Europe, J. Geophys. Res.-Atmos., 115, https://doi.org/10.1029/2009jd013628, 2010. a
Schneider, J., Schulz, C., Rubach, F., Ludwig, A., Wilsch, J., Joppe, P., Gurk, C., Molleker, S., Poulain, L., Obersteiner, F., Gehrlein, T., Bönisch, H., Zahn, A., Hoor, P., Emig, N., Bozem, H., Borrmann, S., and Hermann, M.: CARIBIC-AMS: a fully automated aerosol mass spectrometer for operation on routine passenger flights (IAGOS-CARIBIC) – instrument description and first flight application, Atmos. Meas. Tech., 18, 5103–5128, https://doi.org/10.5194/amt-18-5103-2025, 2025. a
Schymanski, E. L., Jeon, J., Gulde, R., Fenner, K., Ruff, M., Singer, H. P., and Hollender, J.: Identifying small molecules via high resolution mass spectrometry: communicating confidence, Environ. Sci. Technol., 48, 2097–2098, https://doi.org/10.1021/es5002105, 2014. a
Seinfeld, J. H. and Pandis, S. N.: Atmospheric Chemistry and Physics: From Air Pollution to Climate Change, John Wiley and Sons, ISBN 978-118-94740-1, 2016. a
Shapiro, M. A.: Further evidence of the mesoscale and turbulent structure of upper level jet stream–frontal zone systems, Mon. Weather Rev., 106, 1100–1111, https://doi.org/10.1175/1520-0493(1978)106<1100:feotma>2.0.co;2, 1978. a
Shapiro, M. A.: Turbulent mixing within tropopause folds as a mechanism for the exchange of chemical constituents between the stratosphere and troposphere, J. Atmos. Sci., 37, 994–1004, https://doi.org/10.1175/1520-0469(1980)037<0994:tmwtfa>2.0.co;2, 1980. a, b
Simoneit, B. R. and Elias, V.: Detecting organic tracers from biomass burning in the atmosphere, Mar. Pollut. Bull., 42, 805–810, https://doi.org/10.1016/s0025-326x(01)00094-7, 2001. a
Socorro, J., Lakey, P. S. J., Han, L., Berkemeier, T., Lammel, G., Zetzsch, C., Pöschl, U., and Shiraiwa, M.: Heterogeneous OH oxidation, shielding effects, and implications for the atmospheric fate of terbuthylazine and other pesticides, Environ. Sci. Technol., 51, 13749–13754, https://doi.org/10.1021/acs.est.7b04307, 2017. a
Solomon, S., Daniel, J. S., Neely, R. R., Vernier, J.-P., Dutton, E. G., and Thomason, L. W.: The persistently variable “background” stratospheric aerosol layer and global climate change, Science, 333, 866–870, https://doi.org/10.1126/science.1206027, 2011. a
Solomon, S., Stone, K., Yu, P., Murphy, D. M., Kinnison, D., Ravishankara, A. R., and Wang, P.: Chlorine activation and enhanced ozone depletion induced by wildfire aerosol, Nature, 615, 259–264, https://doi.org/10.1038/s41586-022-05683-0, 2023. a
Sprenger, M. and Wernli, H.: The LAGRANTO Lagrangian analysis tool – version 2.0, Geosci. Model Dev., 8, 2569–2586, https://doi.org/10.5194/gmd-8-2569-2015, 2015. a
Sprenger, M., Croci Maspoli, M., and Wernli, H.: Tropopause folds and cross tropopause exchange: a global investigation based upon ECMWF analyses for the time period March 2000 to February 2001, J. Geophys. Res.-Atmos., 108, https://doi.org/10.1029/2002jd002587, 2003. a
Stohl, A.: A 1 year Lagrangian “climatology” of airstreams in the northern hemisphere troposphere and lowermost stratosphere, J. Geophys. Res.-Atmos., 106, 7263–7279, https://doi.org/10.1029/2000jd900570, 2001. a, b
Surratt, J. D., Kroll, J. H., Kleindienst, T. E., Edney, E. O., Claeys, M., Sorooshian, A., Ng, N. L., Offenberg, J. H., Lewandowski, M., Jaoui, M., Flagan, R. C., and Seinfeld, J. H.: Evidence for organosulfates in secondary organic aerosol, Environ. Sci. Technol., 41, 517–527, https://doi.org/10.1021/es062081q, 2006. a
Surratt, J. D., Gómez-González, Y., Chan, A. W. H., Vermeylen, R., Shahgholi, M., Kleindienst, T. E., Edney, E. O., Offenberg, J. H., Lewandowski, M., Jaoui, M., Maenhaut, W., Claeys, M., Flagan, R. C., and Seinfeld, J. H.: Organosulfate formation in biogenic secondary organic aerosol, J. Phys. Chem. A, 112, 8345–8378, https://doi.org/10.1021/jp802310p, 2008. a
Thoma, M., Bachmeier, F., Gottwald, F. L., Simon, M., and Vogel, A. L.: Mass spectrometry-based Aerosolomics: a new approach to resolve sources, composition, and partitioning of secondary organic aerosol, Atmos. Meas. Tech., 15, 7137–7154, https://doi.org/10.5194/amt-15-7137-2022, 2022. a
Tkacik, D. S., Presto, A. A., Donahue, N. M., and Robinson, A. L.: Secondary organic aerosol formation from intermediate-volatility organic compounds: cyclic, linear, and branched alkanes, Environ. Sci. Technol., 46, 8773–8781, https://doi.org/10.1021/es301112c, 2012. a
Tolocka, M. P. and Turpin, B.: Contribution of organosulfur compounds to organic aerosol mass, Environ. Sci. Technol., 46, 7978–7983, https://doi.org/10.1021/es300651v, 2012. a
Tomsche, L., Marsing, A., Jurkat-Witschas, T., Lucke, J., Kaufmann, S., Kaiser, K., Schneider, J., Scheibe, M., Schlager, H., Röder, L., Fischer, H., Obersteiner, F., Zahn, A., Zöger, M., Lelieveld, J., and Voigt, C.: Enhanced sulfur in the upper troposphere and lower stratosphere in spring 2020, Atmos. Chem. Phys., 22, 15135–15151, https://doi.org/10.5194/acp-22-15135-2022, 2022. a
Topping, D., Connolly, P., and McFiggans, G.: Cloud droplet number enhanced by co-condensation of organic vapours, Nat. Geosci., 6, 443–446, https://doi.org/10.1038/ngeo1809, 2013. a
Ungeheuer, F., van Pinxteren, D., and Vogel, A. L.: Identification and source attribution of organic compounds in ultrafine particles near Frankfurt International Airport, Atmos. Chem. Phys., 21, 3763–3775, https://doi.org/10.5194/acp-21-3763-2021, 2021. a
Ungeheuer, F., Caudillo, L., Ditas, F., Simon, M., van Pinxteren, D., Kılıç, D., Rose, D., Jacobi, S., Kürten, A., Curtius, J., and Vogel, A. L.: Nucleation of jet engine oil vapours is a large source of aviation-related ultrafine particles, Commun. Earth Environ., 3, https://doi.org/10.1038/s43247-022-00653-w, 2022. a
Venter, P.: The effects of modifiers on electrospray ionization for small to medium sized molecules in comparison with solution phase ionization, Rapid Commun. Mass. Sp., 38, https://doi.org/10.1002/rcm.9749, 2024. a
Vogel, A. L. and Breuninger, A.: Organic aerosols mixing across the tropopause and its implication for anthropogenic pollution of the UTLS, Zenodo [data set], https://doi.org/10.5281/zenodo.15680610, 2025. a, b, c, d
von der Weiden, S.-L., Drewnick, F., and Borrmann, S.: Particle Loss Calculator – a new software tool for the assessment of the performance of aerosol inlet systems, Atmos. Meas. Tech., 2, 479–494, https://doi.org/10.5194/amt-2-479-2009, 2009. a
Wang, X., Gu, R., Wang, L., Xu, W., Zhang, Y., Chen, B., Li, W., Xue, L., Chen, J., and Wang, W.: Emissions of fine particulate nitrated phenols from the burning of five common types of biomass, Environ. Pollut., 230, 405–412, https://doi.org/10.1016/j.envpol.2017.06.072, 2017. a, b
Weisenstein, D. K., Yue, G. K., Ko, M. K. W., Sze, N., Rodriguez, J. M., and Scott, C. J.: A two dimensional model of sulfur species and aerosols, J. Geophys. Res.-Atmos., 102, 13019–13035, https://doi.org/10.1029/97jd00901, 1997. a
Weitkamp, E. A., Sage, A. M., Pierce, J. R., Donahue, N. M., and Robinson, A. L.: Organic aerosol formation from photochemical oxidation of diesel exhaust in a smog chamber, Environ. Sci. Technol., 41, 6969–6975, https://doi.org/10.1021/es070193r, 2007. a
Wilson, J. C., Lee, S.-H., Reeves, J. M., Brock, C. A., Jonsson, H. H., Lafleur, B. G., Loewenstein, M., Podolske, J., Atlas, E., Boering, K., Toon, G., Fahey, D., Bui, T. P., Diskin, G., and Moore, F.: Steady-state aerosol distributions in the extra-tropical, lower stratosphere and the processes that maintain them, Atmos. Chem. Phys., 8, 6617–6626, https://doi.org/10.5194/acp-8-6617-2008, 2008. a
World Meteorological Organization (WMO), Meteorology: A three-dimensional science, Second session of the commission for aerology, WMO Bull., 6(4), 134–138, 1957. a
Woods, J. D.: On Richardson's number as a criterion for laminar turbulent laminar transition in the ocean and atmosphere, Radio Sci., 4, 1289–1298, https://doi.org/10.1029/rs004i012p01289, 1969. a
Xu, W. and Zhang, R.: Theoretical investigation of interaction of dicarboxylic acids with common aerosol nucleation precursors, J. Phys. Chem. A, 116, 4539–4550, https://doi.org/10.1021/jp301964u, 2012. a
Yang, D., Zhu, S., Ma, Y., Zhou, L., Zheng, F., Wang, L., Jiang, J., and Zheng, J.: Emissions of ammonia and other nitrogen-containing volatile organic compounds from motor vehicles under low-speed driving conditions, Environ. Sci. Technol., 56, 5440–5447, https://doi.org/10.1021/acs.est.2c00555, 2022. a
Yassine, M. M., Harir, M., Dabek Zlotorzynska, E., and Schmitt Kopplin, P.: Structural characterization of organic aerosol using Fourier transform ion cyclotron resonance mass spectrometry: aromaticity equivalent approach, Rapid Commun. Mass. Sp., 28, 2445–2454, https://doi.org/10.1002/rcm.7038, 2014. a
Yu, P., Murphy, D. M., Portmann, R. W., Toon, O. B., Froyd, K. D., Rollins, A. W., Gao, R., and Rosenlof, K. H.: Radiative forcing from anthropogenic sulfur and organic emissions reaching the stratosphere, Geophys. Res. Lett., 43, 9361–9367, https://doi.org/10.1002/2016gl070153, 2016. a, b
Zahn, A., Brenninkmeijer, C. A. M., Maiss, M., Scharffe, D. H., Crutzen, P. J., Hermann, M., Heintzenberg, J., Wiedensohler, A., Güsten, H., Heinrich, G., Fischer, H., Cuijpers, J. W. M., and van Velthoven, P. F. J.: Identification of extratropical two way troposphere stratosphere mixing based on CARIBIC measurements of O3, CO, and ultrafine particles, J. Geophys. Res.-Atmos., 105, 1527–1535, https://doi.org/10.1029/1999jd900759, 2000. a
Zängl, G., Reinert, D., Rípodas, P., and Baldauf, M.: The ICON (ICOsahedral Non hydrostatic) modelling framework of DWD and MPI M: description of the non hydrostatic dynamical core, Q. J. Roy. Meteor. Soc., 141, 563–579, https://doi.org/10.1002/qj.2378, 2014. a
Zhuang, J., Jacob, D. J., and Eastham, S. D.: The importance of vertical resolution in the free troposphere for modeling intercontinental plumes, Atmos. Chem. Phys., 18, 6039–6055, https://doi.org/10.5194/acp-18-6039-2018, 2018. a
Ziemann, P. J. and Atkinson, R.: Kinetics, products, and mechanisms of secondary organic aerosol formation, Chem. Soc. Rev., 41, 6582, https://doi.org/10.1039/c2cs35122f, 2012. a