the Creative Commons Attribution 4.0 License.
the Creative Commons Attribution 4.0 License.
 | 24 Nov 2025
Mount Pinatubo's effect on the moisture-based drivers of plant productivity
Kostas Tsigaridis
Diana Bull
Laura P. Swiler
Benjamin M. Wagman
Kate Marvel
Large volcanic eruptions can significantly influence the climate system by altering the stratospheric sulfate concentrations, atmospheric radiative balance, stratospheric and surface temperature, and regional hydroclimate. A comprehensive understanding of the volcanically-driven regional hydroclimate response is essential for assessing the socio-economic implications of such short-term episodic climate perturbations, which can lead to droughts, with potential significant impacts to vulnerable civilizations that depend on flooding as a natural crops irrigation mechanism. However, the regional rainfall response to volcanic forcings is substantially dominated by the natural variability in the rainfall response, and which creates a gap in our understanding of how eruptions affect ecohydrological conditions and plant productivity. Here, we explore the understudied store (soil moisture) and flux (evapotranspiration) of water as the short-term ecohydrological control over plant productivity in response to the 1991 eruption of Mt. Pinatubo. We used the NASA's Earth system model for modeling of the Mt. Pinatubo eruption and detect the ensuing hydroclimate responses. The model simulates a mean surface cooling of ∼ 0.5 °C following the Mt. Pinatubo eruption. The rainfall response is spatially heterogeneous with large temporal variability, yet still shows suppressed rainfall in the northern hemisphere after the eruption. We find that up to 10 %–15 % of land regions show a statistically significant hydroclimate response (wet and dry) as calculated by the Soil Moisture Deficit Index (SMDI) and Evapotranspiration Deficit Index (ETDI). Results confirm that these impact metrics successfully present a more robust understanding of plant productivity. Our results also explain the geographical dependence of various contributing factors to the compound response and their implications for exploring the climate impacts of such episodic forcings.
- Article
(3781 KB) - Full-text XML
-
Supplement
(3323 KB) - BibTeX
- EndNote


Volcanic eruptions are the most prominent source of sulfate aerosols in the stratosphere and are natural drivers of climate variability. Volcanically injected sulfate aerosols in the stratosphere alter the Earth's radiative balance by simultaneously reflecting incoming solar radiation and absorbing outgoing longwave radiation emitted from the Earth's surface (Robock, 2000). The presence of sulfate aerosol for months to years after an eruption and its microphysical transformation in the stratosphere affect the climate system through numerous direct and indirect effects (Barnes and Hofmann, 1997; Briffa et al., 1998; Deshler et al., 2003; Kremser et al., 2016; LeGrande et al., 2016; Marshall et al., 2022; Tejedor et al., 2021; Timmreck, 2012; Toohey et al., 2019). The Mt. Pinatubo eruption (June 1991) remains the largest eruption in the satellite era, and it has been explicitly documented and analyzed for its radiative and climate impacts. Numerous studies based on satellite observations and supported through different modeling efforts estimated that Mt. Pinatubo injected 10–20 Tg of SO2 at a range of 18–25 km of plume height (Aquila et al., 2012; Bluth et al., 1992; Dhomse et al., 2014; Gao et al., 2023; Sheng et al., 2015a, b; Stenchikov et al., 1998). The radiative impacts of Mt. Pinatubo's eruption estimate an aerosol optical depth of 0.15 for 550 nm wavelength, with an effective radius in the range of 0.16 to 1 micrometer (µm) and net radiative forcing on the order of 5–6 W m−2 (Lacis, 2015; Lacis et al., 1992; Sato et al., 1993; Stenchikov et al., 1998). Estimates of the induced surface cooling range between 0.3 and 0.7 °C; lower stratosphere warming estimates are in the range of 2–3 °C (Dutton and Christy, 1992; Hansen et al., 1992; Labitzke and McCormick, 1992; Lacis et al., 1992; Minnis et al., 1993; Ramachandran et al., 2000; Stenchikov et al., 1998).
In this study, we aim to explore the mechanisms by which the Mt. Pinatubo eruption affected the hydroclimatic conditions and water-based drivers of plant productivity. Agricultural productivity is sensitive to changes in temperature and precipitation (Lobell and Field, 2007; Olesen and Bindi, 2002; Rosenzweig and Parry, 1994). Although much work has been devoted to understanding Mt. Pinatubo's impacts on plant productivity, the literature has been dominated by studies focusing on impacts from changes to the quantity and quality of incoming solar radiation (Farquhar and Roderick, 2003; Gu et al., 2002, 2003; Jones and Cox, 2001; Robock, 2005). Proctor et al. (2018) have estimated a decrease in C4 (maize) and C3 (soy, rice, and wheat) agricultural crop production in response to Mt. Pinatubo driven mainly by changes in incoming radiation. Krakauer and Randerson (2003) evaluated the role of surface cooling in reduced net primary productivity (NPP) using tree ring growth patterns following multiple Mt. Pinatubo-sized eruptions in the last millennium record. Reduced NPP was found in northern mid to high latitudes, while the signal in the lower latitudes and tropics was either insignificant or constrained by other factors. Other studies have further expanded into societal impact research focusing on volcanically induced changes to harvest and agricultural productivity over different regions (van Dijk et al., 2023; Hao et al., 2020; Huhtamaa and Helama, 2017; Manning et al., 2017; Singh et al., 2023; Toohey et al., 2016).
Similarly, a plenty of work has been devoted to understanding the hydroclimate response to Mt. Pinatubo through changes in atmospheric precipitation (Barnes et al., 2016; Paik et al., 2020; Trenberth and Dai, 2007), as the monsoon seasonal rainfall decreases in the season following the eruption (Colose et al., 2016; Iles et al., 2013; Liu et al., 2016; Singh et al., 2023; Tejedor et al., 2021). It is also shown that volcanic eruptions can alter regional rainfall and hydroclimate in general, which could prominently affect regional plant productivity (Zuo et al., 2019a, b). However, rainfall alone provides an incomplete understanding of the drought conditions relevant to plant productivity; a rainfall deficit could, in principle, be overcome by moisture stored in the soil. Hence, meteorological drought indices (e.g. SPI; McKee et al., 1993, or PDSI; Palmer, 1965) ignore a full water balance approach. Furthermore, meteorological drought indices tend to be designed to evaluate prolonged periods of abnormally dry weather conditions. For instance, PDSI is an indicator of drought with a 9-month horizon (Mullapudi et al., 2023). Yet, agricultural crops are heterogeneously sensitive to the timing and degree of moisture deficits during particular portions of the crop growth cycle (Hane and Pumphrey, 1984). Thus, consideration of indices with high temporal frequency can be critical when focusing on agriculture.
Soil moisture is the stock of water stored underground and is a primary source of water flux to the atmosphere and plants through evapotranspiration. Evaporation of water from bare surface soil or transpiration of water during photosynthesis in plants from the root zone soils uses a large portion of absorbed solar energy (Trenberth et al., 2009). Plant transpiration is the largest contributor to land evapotranspiration (Dirmeyer et al., 2006; Lawrence et al., 2007; Nilson and Assmann, 2007; Seneviratne et al., 2010). Soil moisture decrease in the root zone establishes an essential control over plant productivity as transpiration is an integral component of photosynthesis (Chen and Coughenour, 2004; Denissen et al., 2022). Multiple studies have established that water supply is the limiting factor for climatic evapotranspiration over tropical and subtropical land areas, while temperature is an important controlling factor in northern mid- and high latitudes (Dong and Dai, 2017; Mintz and Walker, 1993; Nemani et al., 2003; Pan et al., 2015). However, soil moisture changes in response to the Mt. Pinatubo eruption (1991) are underreported in the literature, and it is unclear how soil moisture would respond given volcanically forced changes in primary drivers (temperature and precipitation).
Studying a large (10xPinatubo) volcanic eruption, Frölicher et al. (2011) have shown that the terrestrial carbon pool is sensitive to the regional (in the tropics and sub-tropics) soil-moisture content through the net-ecosystem productivity. Using the geoengineering large ensemble simulations with the CESM model, Cheng et al. (2019) have analysed the changes in terrestrial hydrological cycle and discussed the future soil-moisture response and its drivers under a geoengineering scenario. To our knowledge, no study has yet investigated multiple indicators of water use with agricultural productivity after a short-duration event like Mt. Pinatubo eruption. Hence, this study looks to explicitly investigate changes in agricultural drought indices from Mt. Pinatubo by considering the store (soil moisture) and flux (evapotranspiration) of water as potential short-term controls over productivity in particular regions. We use NASA's state-of-the-art Earth system model, which incorporates prognostically evolving aerosols, to conduct simulation experiments following the counterfactual inference of causation approach for the Mt. Pinatubo eruption. We assess the impact of the Mt. Pinatubo eruption on the model-simulated climate via multiple pathways, ranging from primary dependent variables to higher-order responses that influence plant productivity. The use of prognostic aerosols enhances the simulations by capturing dynamically consistent feedbacks between the climate response and volcanic aerosols, including aerosol-radiation interactions and stratosphere-troposphere energy flux exchanges (McGraw and Polvani, 2024). Considering the complexity of modeling the terrestrial system, vegetation demographics, and physiological characteristics, we use the soil moisture and evapotranspiration-based agricultural drought indices SMDI (soil moisture deficit index) and ETDI (evapotranspiration deficit index) for short-term and long-term scale to account for agricultural productivity. By focusing on soil moisture and evapotranspiration metrics, the major water-based drivers of plant productivity are explored to deepen our understanding of the Mt. Pinatubo impacts on plant productivity.
2.1 NASA GISS ModelE2.1 (MATRIX)
We use the state-of-the-art Earth system model from the NASA (National Aeronautics and Space Administration) Goddard Institute for Space Studies, NASA GISS ModelE2.1 (Bauer et al., 2020; Kelley et al., 2020). NASA GISS ModelE2.1 has an atmospheric horizontal latitude-longitude grid spacing of 2.0 × 2.5° (at the equator) with 40 vertical levels and a model top at 0.1 hPa. We used the interactive chemistry version MATRIX (Multiconfiguration Aerosol TRacker of mIXing state) aerosol microphysics module (Bauer et al., 2008, 2020), which is based on the Quadrature Method of Moment (QMOM) to predict aerosol particle number, mass, and size distribution for 16 different mixed modes of the aerosol population. New particle formation is represented by Vehkamäki et al. (2002), along with aerosol-phase chemistry, condensational growth, coagulation, and mixing states (Bauer et al., 2013). 16 mixing states with 51 aerosol tracers for sulfate, nitrate, ammonium, aerosol water, black carbon, organic carbon, sea salt, and mineral dust are resolved in this microphysical module (Bauer et al., 2008, 2020). The first indirect effect of aerosols in terms of changes in cloud properties through nucleation is also computed within MATRIX.
The model's ocean component (GISS Ocean v1) has a horizontal resolution of 1 × 1.25°, with 40 vertical layers. The land component is the Ent Terrestrial Biosphere Model (TBM) (Kim et al., 2015; Kiang, 2012) which includes an interactive carbon cycle (Ito et al., 2020), satellite-derived (MODIS-Moderate Resolution Imaging Spectroradiometer) plant functional type, and monthly variation of leaf area index (Gao et al., 2008; Myneni et al., 2002), and tree height (Simard et al., 2011). Interannual variations in the vegetation properties are controlled by rescaling the vegetation fractions (Fig. S9 in the Supplement) using historical crops and pasture at the grid scale to account for land cover and land use changes (Ito et al., 2020; Miller et al., 2021). The land model has two defined tiles for the soil layer: bare and vegetated, and each has six vertical levels to a depth of 3.5 m (11.5 ft) (Rosenzweig and Abramopoulos, 1997). Rooting depths for different plant functional types are also given by Rosenzweig and Abramopoulos (1997), and more than 60 % of roots for crop plant functional types are located within 0.6 m (1.96 ft) of soil depth. In this version of the model, the agricultural grid cells, crop plant functional type, and crop calendar are prescribed according to McDermid et al. (2019). Irrigation in the GISS ModelE is implemented using the water irrigation demand data (IWD) (Wisser et al., 2010) and irrigation potential calculations based on Wada et al. (2013) as discussed in Cook et al. (2020).
2.2 Experiment design
The MATRIX version of GISS ModelE2.1 with active tracers is three times more computationally expensive than the non-interactive (prescribed pre-calculated aerosol concentration and extinction) version. We extended an equilibrated 1400-yearlong PI control run with non-interactive tracers with an additional 500 years using the MATRIX version with prognostic tracers before starting the “historical” run. MATRIX includes the tropospheric chemistry scheme that contains the inorganic (Ox, NOx, HOx, and CO), organic chemistry of CH4, and higher hydrocarbons (Gery et al., 1989; Shindell, 2001; Shindell et al., 2003). The stratospheric chemistry includes bromine, chlorine, and polar stratospheric clouds (Shindell et al., 2006). Dust emission in the model is controlled by climate variables such as winds and soil moisture at the spatial and temporal scales (Miller et al., 2006). However, anthropogenic dust is not included in GISS ModelE2.1. Other anthropogenic emissions, including biomass burning (pre-1997 from van Marle et al. (2017) and 1997 onwards from the GFED4s inventory; van der Werf et al., 2017), are taken from the Community Emission Data System (CEDS) inventory (Hoesly et al., 2018). Most importantly, the volcanic SO2 forcing for the “historical” run (1850–1977) is the daily emission rate from VolcanEESM (Neely and Schmidt, 2016: https://catalogue.ceda.ac.uk/uuid/a8a7e52b299a46c9b09d8e56b283d385, last access: 19 November 2025), and satellite measurement based SO2 inventory (Carn et al., 2016) for 1978 to 2014 (extended up to 2021). The cumulative Mt. Pinatubo emission is 15 194 kt (∼ 15.2 Tg) of SO2 injected from 13 to 16 June 1991 above the Mt. Pinatubo vent, with a maximum of 15 000 kt (15 Tg) emitted on 15 June at a plume height of 25 km (Carn et al., 2016). The MATRIX version of the GISS ModelE2.1 used for all of our simulations predicts the nucleation, evolution, and removal of sulfate aerosols prognostically.
The model simulations we performed (Table 1) are described here. We started from the 1400-year-long preindustrial control run from CMIP6 (GISS-CMIP6-PI) with the prescribed average AOD historical period, which is further extended for 500 years using the GISS ModelE2.1 – MATRIX with prognostic tracers (GISS-PI). Then, the CMIP6 historical run (GISS-HIST-SO2; 1850–2014) started with all forcings as specified by CMIP6 except the daily emission rate of injection of SO2 (VolcanEESM) (Carn et al., 2016; Neely and Schmidt, 2016). We branched out the experiment ensemble with Mt. Pinatubo eruption (GISS-PIN-SO2) and the ensemble without Mt. Pinatubo (GISS-NOPIN-SO2) from the historical (GISS-HIST-SO2) using perturbed initial conditions (1 January 1986) from the year 1986 to 1999. The perturbation to the initial conditions is generated by altering the radiation-related random number generator that deals with fractional cloudiness in the column.
Table 1Simulation experiment details.
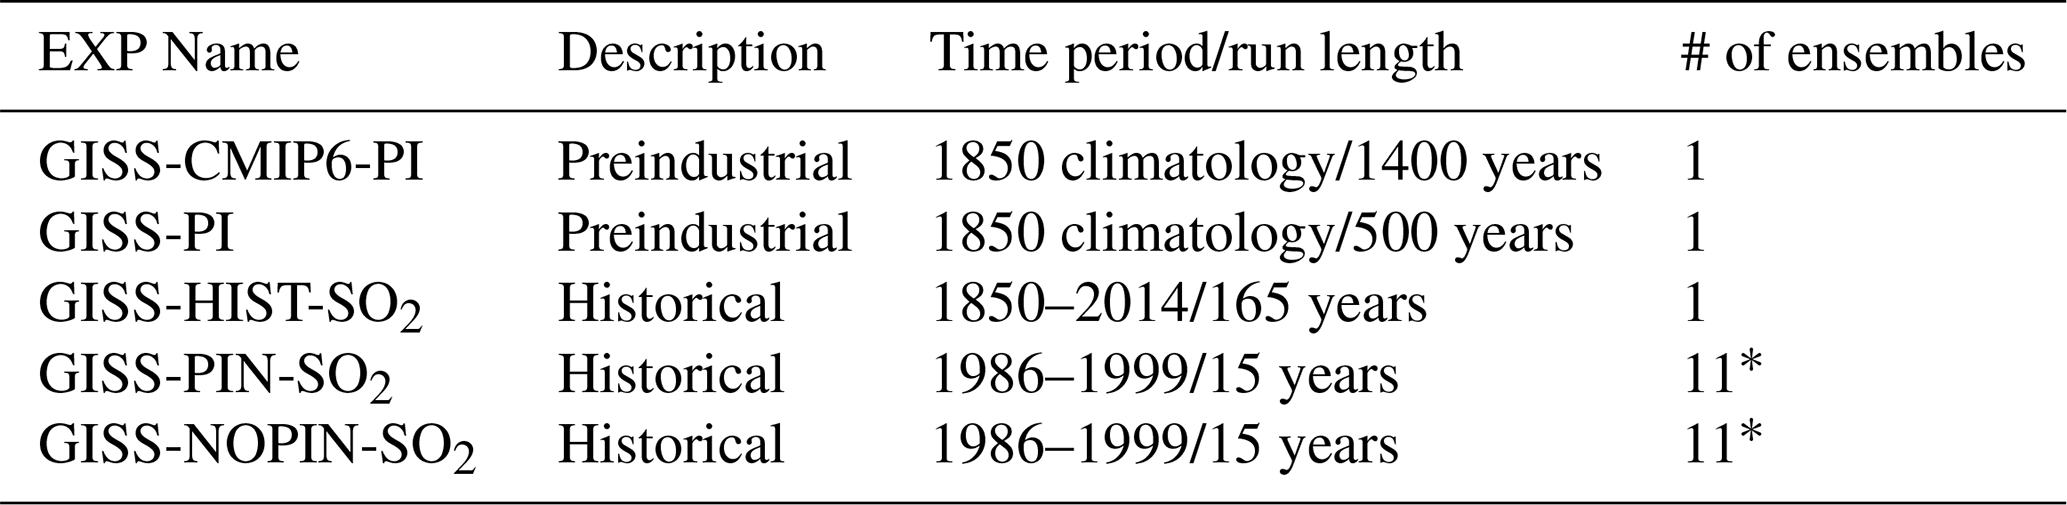
* These ensemble members are branched out from the GISS-HIST-SO2 by perturbing the initial conditions.
2.3 Methods
This study investigates the impacts of the Mt. Pinatubo eruption on the major drivers of primary productivity focusing on soil moisture and evapotranspiration related metrics. We followed the counterfactual inference approach to draw causal inference of the Pinatubo eruption. Hereafter, we use “PCH” (Mt. Pinatubo and Cerro Hudson) to refer to the “GISS-PIN-SO2” and “NP” for the “GISS-NOPIN-SO2” ensembles. We have included the Cerro Hudson eruption in both ensembles since we are focusing on the Mt. Pinatubo-driven climate response.
Statistical analysis for detecting Mt. Pinatubo-significant regions and anomalies calculations.
We treat the no-Pinatubo ensemble (NP) as a counterfactual climate simulation and utilize it to perform the paired Student's t test for causal inference. The null hypothesis is that the ensemble means of a quantity of interest (QoI) in a region over a time period are the same between ensembles (i.e. ). In the subsequent figures in this document, gray regions indicate acceptance of the null hypothesis at the 95 % confidence level, while the coloring emphasizes the rejection of null hypothesis and significant regions of anomalies relative to 1950–2014 climatology (see Sect. S1.0 in the Supplement). However, we also explored the alternate approach of directly comparing the difference between the two ensembles (PCH and NP) for presenting the Pinatubo effect (see Fig. S2). It is concluded that both of the approaches led to the same general conclusions, with only small quantitative differences. Nevertheless, we chose to remain consistent with the baseline requirements for other metrics, and used the historical climatology for the same period 1950–2014 as the baseline for the core of our analysis. Thus, the grey areas indicate no significant differences between the PCH and NP ensembles, while the colored regions represent the statistically significant anomalies, calculated as PCH ensemble mean minus climatology.
2.4 Impact metrics
The distribution of incoming and outgoing radiation influences the hydrological cycle (Kiehl and Trenberth, 1997; Trenberth and Dai, 2007). A reduction of solar radiation at the surface has the potential to reduce rainfall and change the latent heat-dominated atmospheric heating pattern (Trenberth and Stepaniak, 2004). The perturbed atmospheric conditions and surface energy budget could affect soil moisture. Along with the surface air temperature and precipitation, we use soil moisture and surface energy budget-oriented drought indices (the soil moisture deficit index (SMDI) and evapotranspiration deficit index (ETDI)) to evaluate the land-atmosphere interaction and account for the potential drivers of the crop plant productivity in the model simulated post- Mt. Pinatubo environmental conditions (Narasimhan and Srinivasan, 2005). SMDI represents the land-based soil moisture state in selected depth horizons (i.e., SMDI_2 means Soil Moisture Deficit Index for 2 ft (0.6 m) depth). ETDI represents the atmospheric conditions governing the land-atmosphere interaction and is also an indicator of plant health. Lastly, plant transpiration is analyzed to the explore the simulated physiological response to the volcanically induced hydroclimatic conditions. The Palmer drought severity index (PDSI) and other indices are commonly used to represent climatological drought conditions. However, we focus on SMDI and ETDI because these can capture short-term developing agricultural drought conditions that impact plant productivity and are free from the limitations of other metrics like PDSI. For example, SMDI and ETDI are seasonally independent measures and are comparable across space, even for different climatic zones.
SMDI and ETDI were calculated as described in Narasimhan and Srinivasan (2005) using model output at monthly and daily scales. Daily model output is resampled to a weekly scale to compute the indices. The weekly frequency is used because it is suitable for agricultural applications, and the daily frequency is comparatively higher, which makes these indices computationally expensive. Below, we reproduce the weekly calculation of SMDI and ETDI as presented in Narasimhan and Srinivasan (2005).
2.4.1 Soil Moisture Deficit Index (SMDI)
The soil moisture deficit index measures the wetness/dryness of soil moisture conditions in comparison to long-term records spanning 1950–2014.
and
SDi,j is the soil water deficit (%) for week j of the year i. SWi,j is the mean weekly soil water available in the soil profile (mm) for week j of the year i, MSWj is the long-term (calibration period) median available water in the soil profile (mm) for week j, and minSWj and maxSWj are the jth weekly minimum and maximum of soil water available in the soil profile across the calibration period (1950–2014). The soil moisture deficit index for any given week can be calculated as
SMDI can be calculated for different soil depths; we used the 2, 4, and 6 ft depths for SMDI estimation, approximately 0.6, 1.2, and 1.8 m, respectively. For SMDI, it is typical to use feet instead of meters in the literature, which is why we use the same units along with the coventional SI units in brackets here. SMDI-4 means we considered the soil moisture content between 2 (0.6 m) to 4 ft (1.2 m) in depth. Similarly, SMDI-6 indicates the soil moisture content between 4 (1.2 m) to 6 ft (1.8 m) in depth.
2.4.2 Evapotranspiration Deficit Index (ETDI)
The limitations of PDSI (Palmer, 1965) and CMI (Palmer, 1968) in the formulation used for PET calculation (Thornthwaite, 1948), together with the lack of consideration of the land cover type on water balance, have encouraged the exploration of ETDI for agricultural productivity. Also, in the climate models, surface energy fluxes are parameterized in terms of the thermodynamic gradient of atmosphere and land models and thus represent the land-atmosphere interactions, which are not accounted for by these atmosphere-only indices. We utilized model simulated surface energy fluxes (Latent and Sensible heat) to calculate the potential (PET) and actual evapotranspiration (AET) to estimate the water stress ratio. However, the applicability of the Penman–Monteith equation for reference crops (Allen et al., 1998) provides a substitute method for PET calculation, which broadly produced similar results (not shown).
In Eqs. (4) and (5), we used the model simulated energy fluxes to calculate AET and PET as suggested in Milly and Dunne (2016) and Scheff and Frierson (2015).
The energy budget equation at the surface is given by Rn = G + LH + SH, where Rn is net solar radiation, G is net ground heating (heat flux), LH and SH represent the Latent and Sensible heat fluxes, respectively. We then use these to calculate PET and AET (unit as mm per day; 1 W m−2 = 0.0353 mm d−1):
and
The evapotranspiration deficit index is estimated using the water stress condition using the actual evapotranspiration (AET) and potential evapotranspiration (PET) per grid cell, as given below.
WS range, from 0 to 1, where 0 signifies that evapotranspiration is happening at the potential rate and 1 stand for no actual evapotranspiration. WS represents the water stress ratio on a monthly or weekly basis (WSj), which is further utilized to calculate water stress anomaly (WSAi,j) for week j of year i as given below.
and
Here, MWSj, minWSj, and maxWSj represent the long-term median, minimum, and maximum of the water stress ratio over the calibration period. Water stress anomaly ranges between −100 % to 100 %, indicating very dry to wet conditions over the region.
Finally, drought severity is calculated as ETDI, similar to SMDI (Eq. 3) at a monthly/weekly time scale.
The indices SMDI and ETDI range from −4 to +4, representing the excessive wet and dry conditions. The bounding values −4 or +4 represent extremely dry/wet conditions as the deficit/excess of soil-moisture deficit (SM) or water stress anomaly (WSA) reached relative to the maximum over the reference calibration period.
We also highlight the justification for selecting 1950–2014 as the base period for analyzing the response in climate variables and the long-term calibration period for drought indices calculations (Sect. S1).
The result section of this study first presents the NASA GISS model's simulated properties of the 1991 Mt. Pinatubo eruption, and then further the evaluation of the primary (aerosol optical depth, radiation, and temperature) and secondary (precipitation, soil moisture, evapotranspiration, and transpiration) impacts on plant productivity.
3.1 Radiative forcing response
In the Mt. Pinatubo eruption simulation, the volcanically injected SO2 in the stratosphere oxidizes in the presence of prognostically evolving OH radicals to form the stratospheric sulfate aerosols (Sect. S2.0). GISS ModelE (MATRIX) PCH also simulated a peak global mean aerosol optical depth (AOD; for 550 nm wavelength) of 0.22 (Fig. S4 bottom panel) a few months after the eruption, which then decreases with time due to the deposition of volcanic aerosols (English et al., 2013; Sato et al., 1993). In this study, the model-simulated aerosol optical depth (AOD) due to volcanic aerosol and radiative forcing is larger than the previously reported AOD of 0.15 and forcing of −4.0 to −5.0 W m−2 due to the Mt. Pinatubo eruption (Hansen et al., 1992; Lacis et al., 1992). The mass and size of volcanic sulfate aerosol firmly control the scattering of the incoming shortwave radiation and the absorption of longwave (Kinne et al., 1992; Lacis, 2015; Lacis et al., 1992; Lacis and Hansen, 1974). The first-order climate response to the volcanically-injected sulfate aerosol in the stratosphere is the perturbation of the radiative balance of the Earth system (Brown et al., 2024; Hansen et al., 1980; Lacis et al., 1992; Stenchikov et al., 1998). Figure S3 shows that the GISS ModelE PCH has simulated a peak longwave, shortwave, and net radiative response of +3.0, −8.0, and −5.0 W m−2 respectively, a few months after the eruption, which recovers slowly in next 24 months and is consistent with previous studies (Stenchikov et al., 1998; Hansen et al., 1992; Minnis et al., 1993; Brown et al, 2024). The GISS model also simulated a smaller peak ranging within −1 W m−2 in the runs without Mt. Pinatubo eruption (NP), likely due to the Cerro Hudson eruption in August 1991.
3.2 Aerosol dispersion and temperature response
Figure 1 shows the zonal mean anomaly for the aerosol optical depth (AOD) and surface air temperature. The zonal AOD shows the dispersion and transport of aerosol poleward after the eruption. Horizontal dispersion and transport of the aerosols are strictly influenced by the stratospheric meteorology and atmospheric circulation, which is independent in each ensemble member, and depends on the plume height and season. GISS ModelE has simulated AOD consistently with previous studies (Aquila et al., 2012; Rogers et al., 1998; Timmreck et al., 1999; Trepte et al., 1993). Cross-equatorial dispersion to the southern hemisphere might be due to the more robust Brewer–Dobson circulation in the austral winter (Aquila et al., 2012). Meanwhile, the phases of QBO (Quasi-Biennial Oscillation) and local heating also play a crucial role in the poleward and vertical dispersion of stratospheric aerosols (Hitchman et al., 1994). A smaller peak in the southern hemisphere (45° S) in the late 1991, likely due to the Cerro Hudson eruption, which injected ∼ 1.5 Tg of SO2 at a height of 15 km.
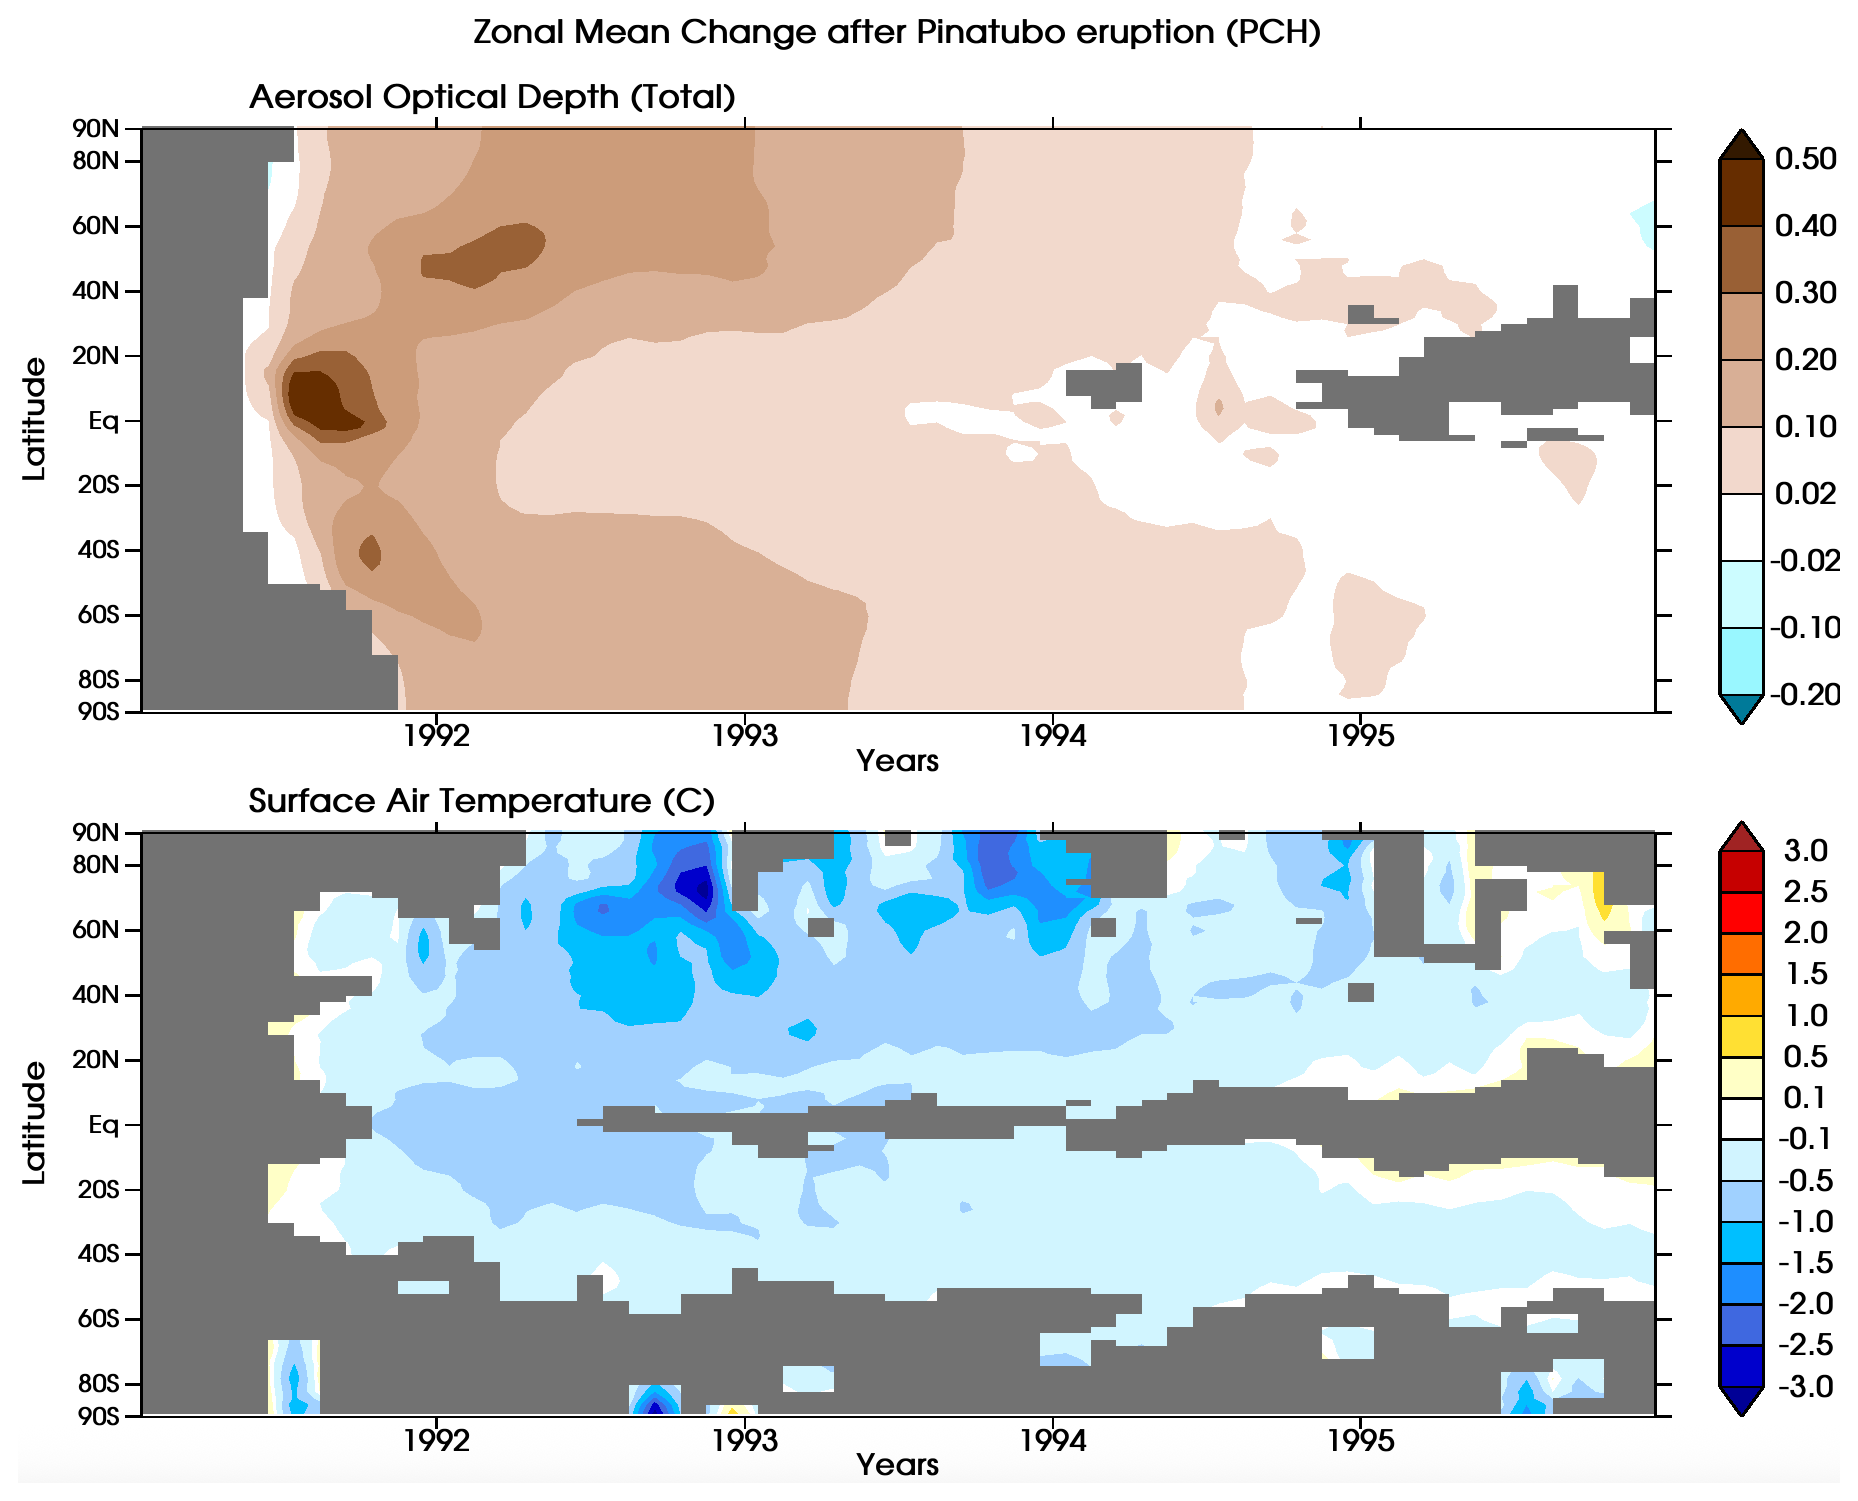
Figure 1Zonal mean of monthly anomalies for multi-ensemble means for aerosol optical depth at 550 nm (upper panel) and surface air temperature (lower panel) with respect to the 1950–2014 climatology. Gray regions show no statistically significant difference between the PCH and NP responses. The colored areas show anomalies of PCH with respect to the climatology from 1950–2014.
The lower panels in Fig. 1 show the surface air temperature response due to the net radiative perturbation, which is dominated by the scattering of incoming solar radiation. The zonal structure of surface temperature shows that the surface cooling follows the aerosol optical depth pattern, and the most significant cooling is simulated in the northern hemisphere high latitudes. Temporal characteristics of lower stratosphere warming, and surface cooling also show the seasonal variations in incoming solar radiation in northern polar latitudes. Model simulated the lower stratospheric warming due to longwave radiation absorption in lower stratosphere is consistent with previous studies (Sect. S3.0).
The spatial pattern of surface air temperature response is evaluated at the seasonal scale for each year from 1991 to 1995, as shown in Fig. 2. We conclude that the volcanic forcing from the Mt. Pinatubo eruption results in a detectable seasonal mean surface air temperature response. Figure 2 shows that a spatial pattern of surface cooling starts appearing after a few months of the eruption (during the SON season of 1991) when the gaseous SO2 is oxidized into sulfate aerosols. The surface cooling signature due to the volcanic aerosols was significant in 1992 and 1993 before recovering in 1994 towards pre-eruption temperature conditions. The highest surface cooling is noticed over the sub-tropics and higher latitude land regions in the northern hemisphere and reaches up to 2.5 °C at a regional scale. To summarize: the PCH GISS ModelE simulated global mean peak cooling response is ∼ 0.5 °C after the eruption, as shown in Fig. S4 (middle panel), with a range between 0.25 and 1.0 °C for individual ensemble members, and this is consistent with the various observation and modeling studies (Dutton and Christy, 1992; Hansen et al., 1996; Kirchner et al., 1999; Minnis et al., 1993; Parker et al., 1996; Ramachandran et al., 2000; Stenchikov et al., 1998).
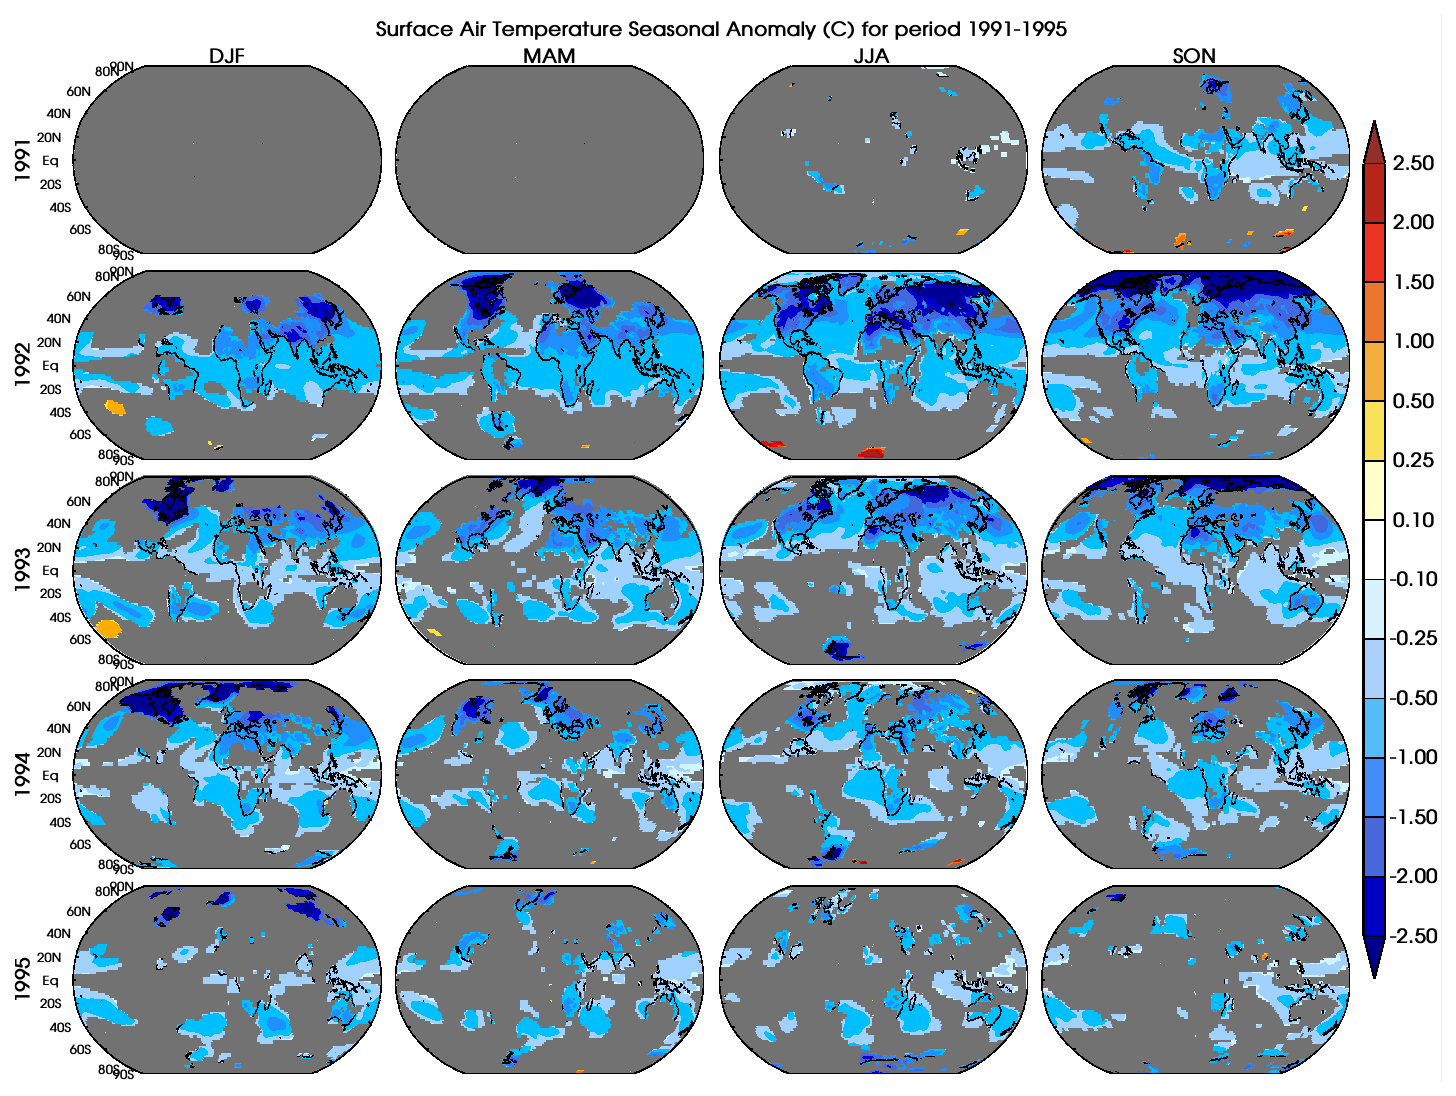
Figure 2Seasonal mean surface temperature anomalies (°C) from the year 1991 to 1995 with respect to the reference period of 1950–2014. A grey color is painted over the grid cells where the surface temperature anomalies are not statistically significant in comparison to the NP ensemble. The colored areas show anomalies of PCH with respect to the climatology from 1950–2014.
3.3 Rainfall response
Precipitation, presented seasonally for the year of eruption (1991) and the following year (1992) in Fig. 3, shows a highly complex and variable response to the volcanically induced tropospheric cooling and radiative balance perturbation because of its sensitivity to the other climate system components. Studies have shown that global mean precipitation decreases after large volcanic eruptions (Gu et al., 2007; Gu and Adler, 2012; Iles et al., 2013; Robock and Liu, 1994; Singh et al., 2023; Trenberth and Dai, 2007). Colose et al. (2016) have postulated that the asymmetrical surface cooling and radiative balance perturbation create an energetic deficit in the hemisphere of eruption that constrains the poleward propagation of tropical rainfall belt (ITCZ) in that hemisphere. In the case of the Mt. Pinatubo eruption, the PCH simulations show that regional patches of significant decrease of up to 1 mm d−1 are noticed over tropical and northern hemispheres (Africa, eastern and northern Asia) after the eruption (Fig. 3). Also, increasing rainfall patterns are simulated over the Mediterranean and European regions. Broadly, the confidence level of precipitation response due to volcanic aerosols is strongly influenced by the uncertainty due to many possible factors and prominent modes of atmospheric variability, such as the strength of El Nino (Paik et al., 2020).
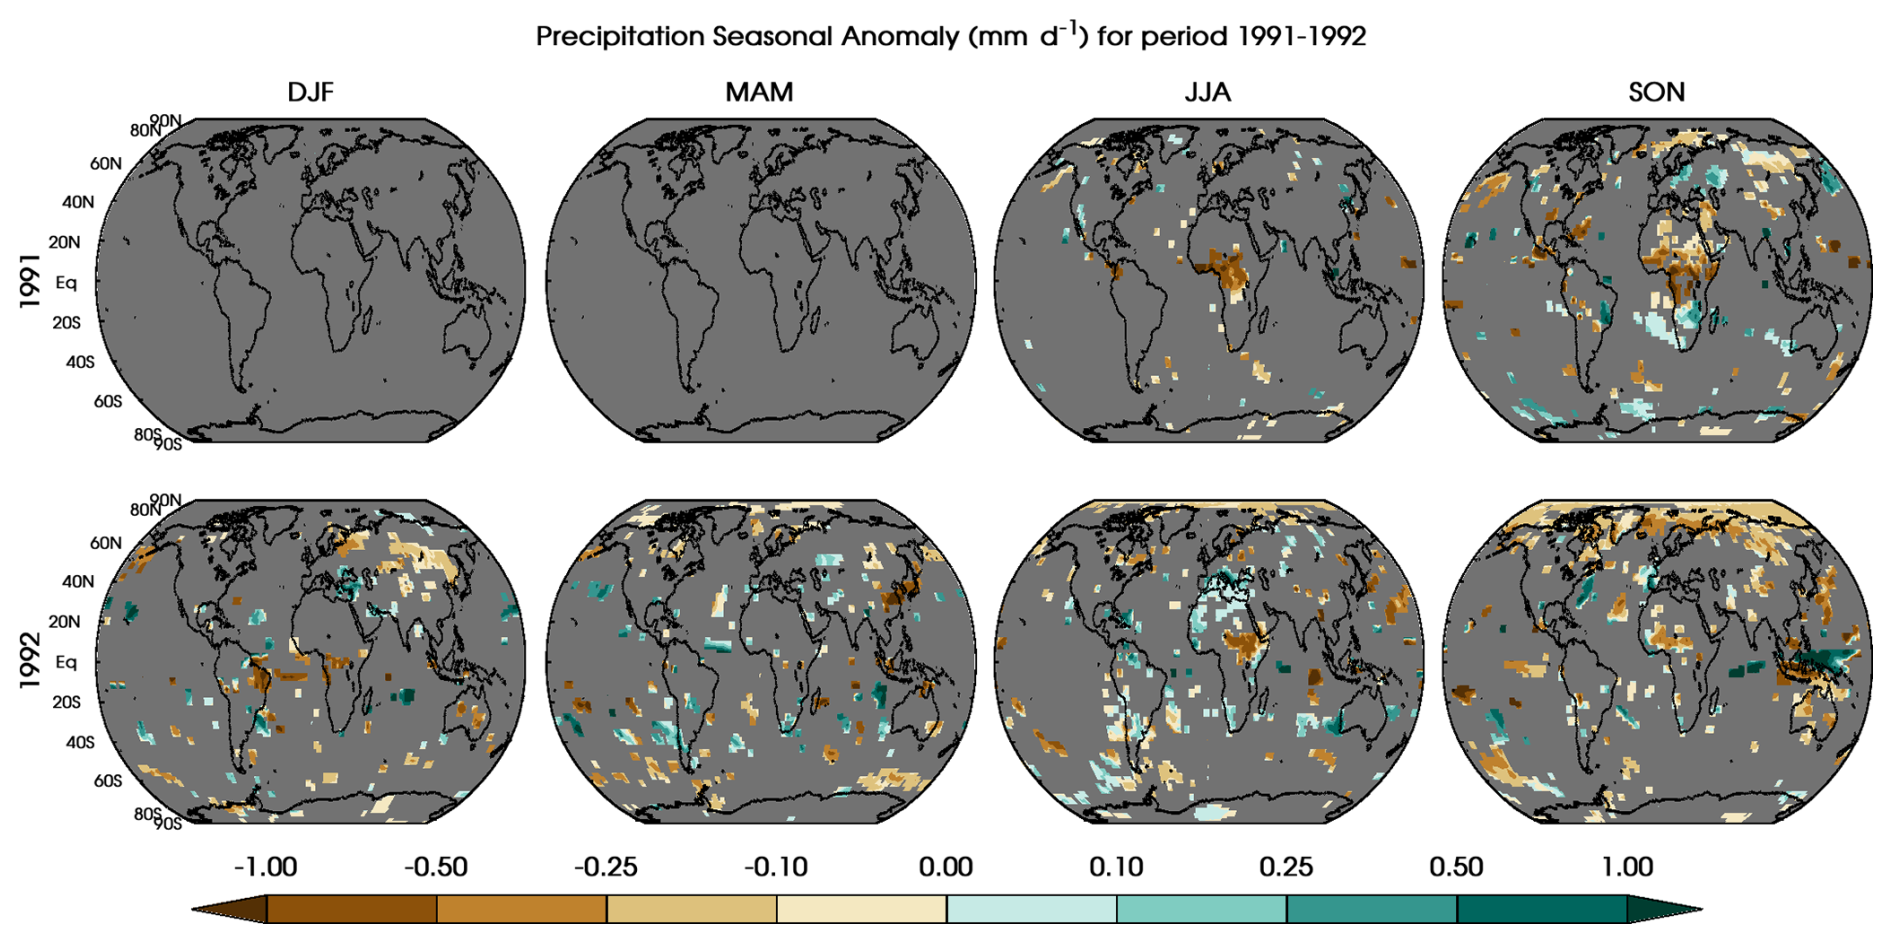
Figure 3Seasonal mean precipitation anomalies (mm per day) from the year 1991 and 1992 with respect to the reference period of 1950–2014. A grey color is painted over the grid cells where the precipitation anomalies are not statistically significant in comparison to the NP ensemble. The colored areas show anomalies of PCH with respect to the climatology from 1950–2014.
The zonal mean of the rainfall response (Fig. S5) shows a clear decreasing trend in the northern hemisphere tropical and higher latitudes with a positive rainfall response band around 20° N. The PCH modelled rainfall response due to the Mt. Pinatubo eruption is broadly consistent with the previous studies (Joseph and Zeng, 2011; Liu et al., 2016; Trenberth and Dai, 2007), but the uncertainty in rainfall response is still high. Although we use statistical significance at 95 % confidence level as our metric for determining significant anomalies and only a few regions exhibit a spatially coherent and detectable forced response (Fig. 3). We acknowledge the signals due to the model's internal variability when averaging the impacts across multiple ensembles, but 11 ensembles are a good compromise between few vs. many ensemble members which was shown to be sufficient to represent significance in climate response at the regional scale (Polvani et al., 2019; Singh and AchutaRao, 2019). The inconsistency and complexity in the precipitation response drive us to explore the compound hydroclimatic pathways that lead to drought risk.
3.4 Drought conditions
Land-atmosphere interactions under a radiatively perturbed environment are crucial in regulating the climate response at regional and sub-regional scales. On short timescales, changes in these interactions can strongly affect plant productivity. Even short-lived adverse conditions in the growth cycle have the potential for outsized impacts, especially if they happen at a particular time in the growing cycle. Hence, we explore the weekly aspects of these drought conditions in Sect. 3.6 to explore the temporal characteristics of variability in the conditions.
3.4.1 Seasonal Soil Moisture Drought Index (SMDI)
The root zone is commonly defined as the top 3–6 ft (0.9–1.8 m) of the soil column (Keshavarz et al., 2014) but most agricultural crops have shallower root systems confined to the top 2 ft (0.6 m) (Narasimhan and Srinivasan, 2005). Hence, we focus on the soil moisture deficit index (SMDI) (Narasimhan and Srinivasan, 2005) for the top 2 ft (0.6 m) of ground depth (SMDI_2) as shown in Fig. 4. As anticipated, more land area is covered by statistically different SMDI_2 than in Fig. 3. This enhances our analysis of water-driven impacts on plant productivity, offering greater insights than precipitation.
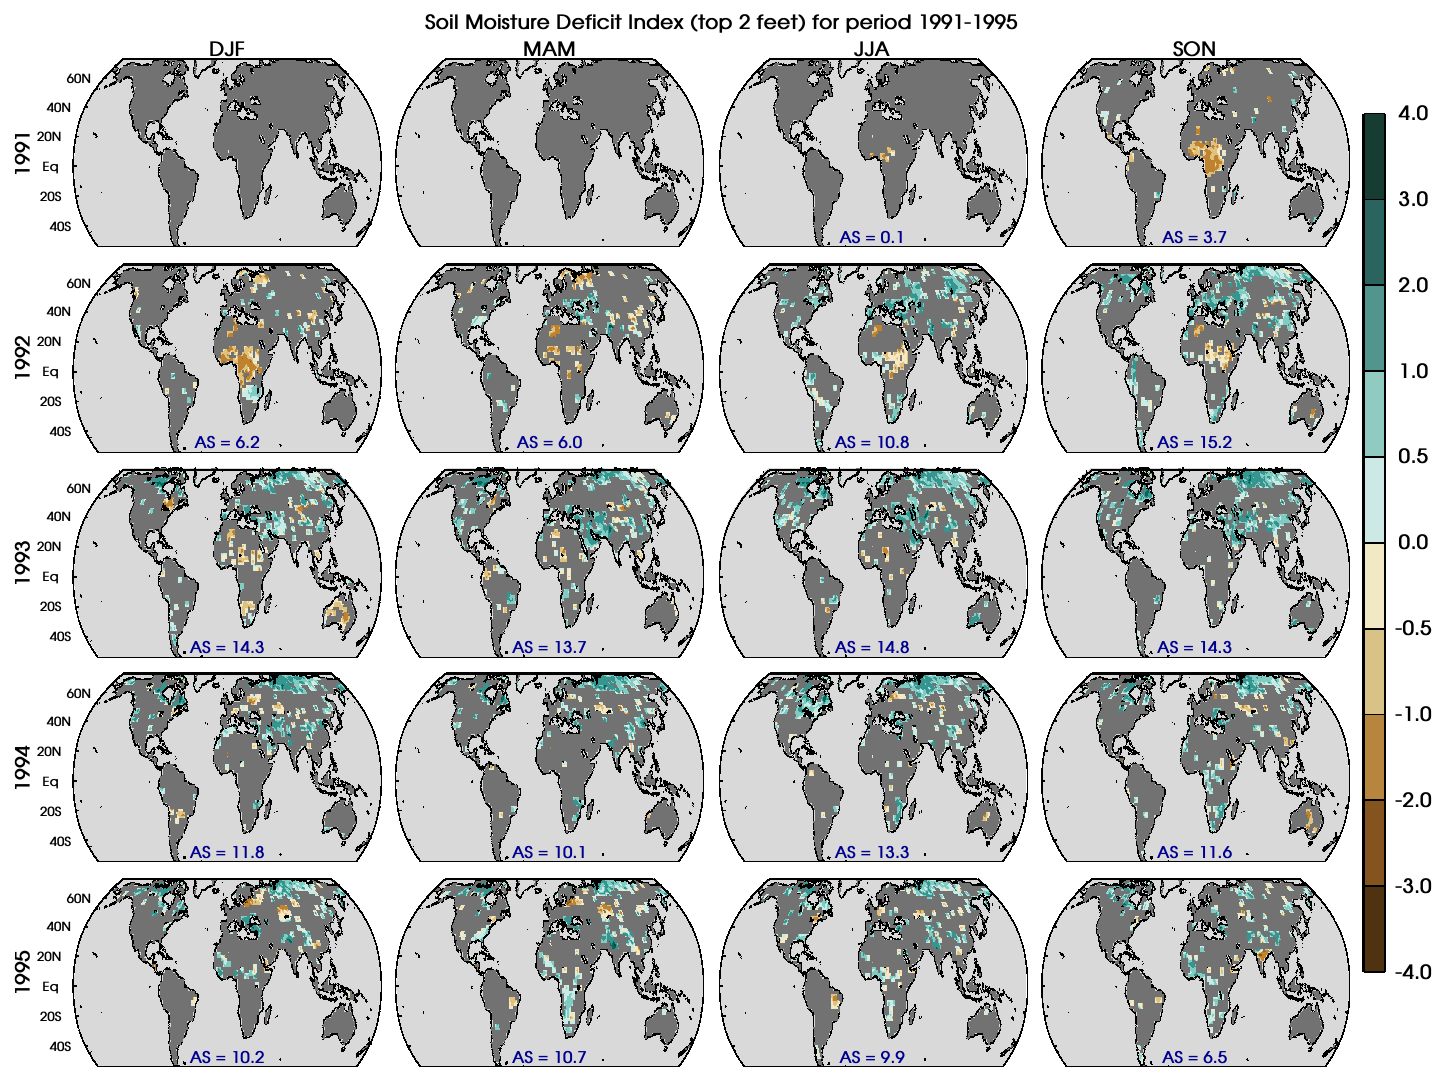
Figure 4Soil moisture deficit index (SMDI_2) for the top 2 (0.6 m) of ground depth evaluated seasonally from 1991 to 1995. Grey color is painted over the grid cell where the SMDI_2 is not statistically significant in contrast to NP ensemble. The parameter AS on each panel marks the percentage of land area that has shown statistically significant dry or wet response after Mt. Pinatubo eruption.
Figure 4 clearly shows that the equatorial region, especially over Africa, has a significant drying response due to Mt. Pinatubo compared to long-term historical data from the SON season of 1991 through the following DJF season. Although less robust, the dryness in this region lasted through MAM of 1993. The severity of drying response reaches up to −2.0 on a scale of extreme wet/dry at 4.0/−4.0, where the severity of −4.0 reflects the maximum dryness (rarest case) over the entire 1950–2014 calibration period. Figure 3 shows a similar pattern in equatorial African rainfall decrease. A decrease in rainfall was present in the first season post-Mt. Pinatubo eruption, indicating an expected lagged response in SMDI_2. Spatial coherence between these signals is again re-established in the JJA and SON 1992 seasons, albeit with more variation in the strength of the signal.
Meanwhile, in the high latitudes of the northern hemisphere, we see an increase in the store of soil moisture despite a decrease in rainfall in higher latitudes. An exception is the Mediterranean (extending towards the east Mediterranean and western Asia) region, where soil moisture and rainfall both show an increase after the Mt. Pinatubo eruption. This increase in soil moisture in the northern hemisphere is comparatively more pronounced in the summer months than in the winter season. Thus, despite less water supply through rainfall, there has been a persistent increase in the soil moisture in the root zone layer since the JJA season of 1992. This is likely due to less water extracted from this layer through evaporation and transpiration as well as due to the implemented irrigation in GISS modelE (details in further sections). Overall, Fig. 4 shows equatorial drying signals mostly dominated through the DJF season of 1993, but the wet conditions over higher latitudes lasted till 1995. Broadly, 6 %–13 % of the land region has shown a statistically significance response in terms of dry/wet conditions by the end of year 1995 because of the Mt. Pinatubo forcing.
Deeper soil layers better approximate longer-term meteorologically defined drought indices (Narasimhan and Srinivasan, 2005). This makes intuitive sense: precipitation provides the recharge for the store of soil moisture, and if there is a longer-term decline in precipitation, all available moisture will be used hydraulically for plant transpiration (both the deeper stores of water and the soil-penetrating precipitation available), not allowing for deeper depth recharge. Here, we evaluate discrete layer depths instead of cumulative depths for two reasons. First, the soil permeability changes with the depth, and the inclusion of top layers erroneously reflects the SMDI_2 signal in potentially impermeable regions; second, the SMDI_2 signal gets superposed over the deeper layer response and misleads the actual soil moisture response for the deeper layers.
As expected, when we evaluate the soil moisture deficit response between 2 and 4 ft (0.6–1.2 m) soil depth (SMDI_4) in Fig. 5 and 4–6 ft (1.2–1.8 m) soil depth (SMDI_6) in Fig. S6, we see similar spatial and temporal distributions as shown in Fig. 4 with a corresponding decrease in the percentage of area response. Spatially, we see high latitudes across North America and Northeastern and western Asia, equatorial Africa, Europe, and Mediterranean regions maintain their SMDI-2 trend in Fig. 4. However, the total response area decreases from peak coverages of 12 %–13 % in SMDI-2 to less than 10 %–12 % in SMDI-4 and 7 %–10 % in SMDI_6 (as shown in Fig. S6). Additional decreases in the degree of impact are also seen between the three soil layers. Note that the light grey colored regions in Figs. 5 and S6 represent regions of impermeability, which does affect the total area of response.
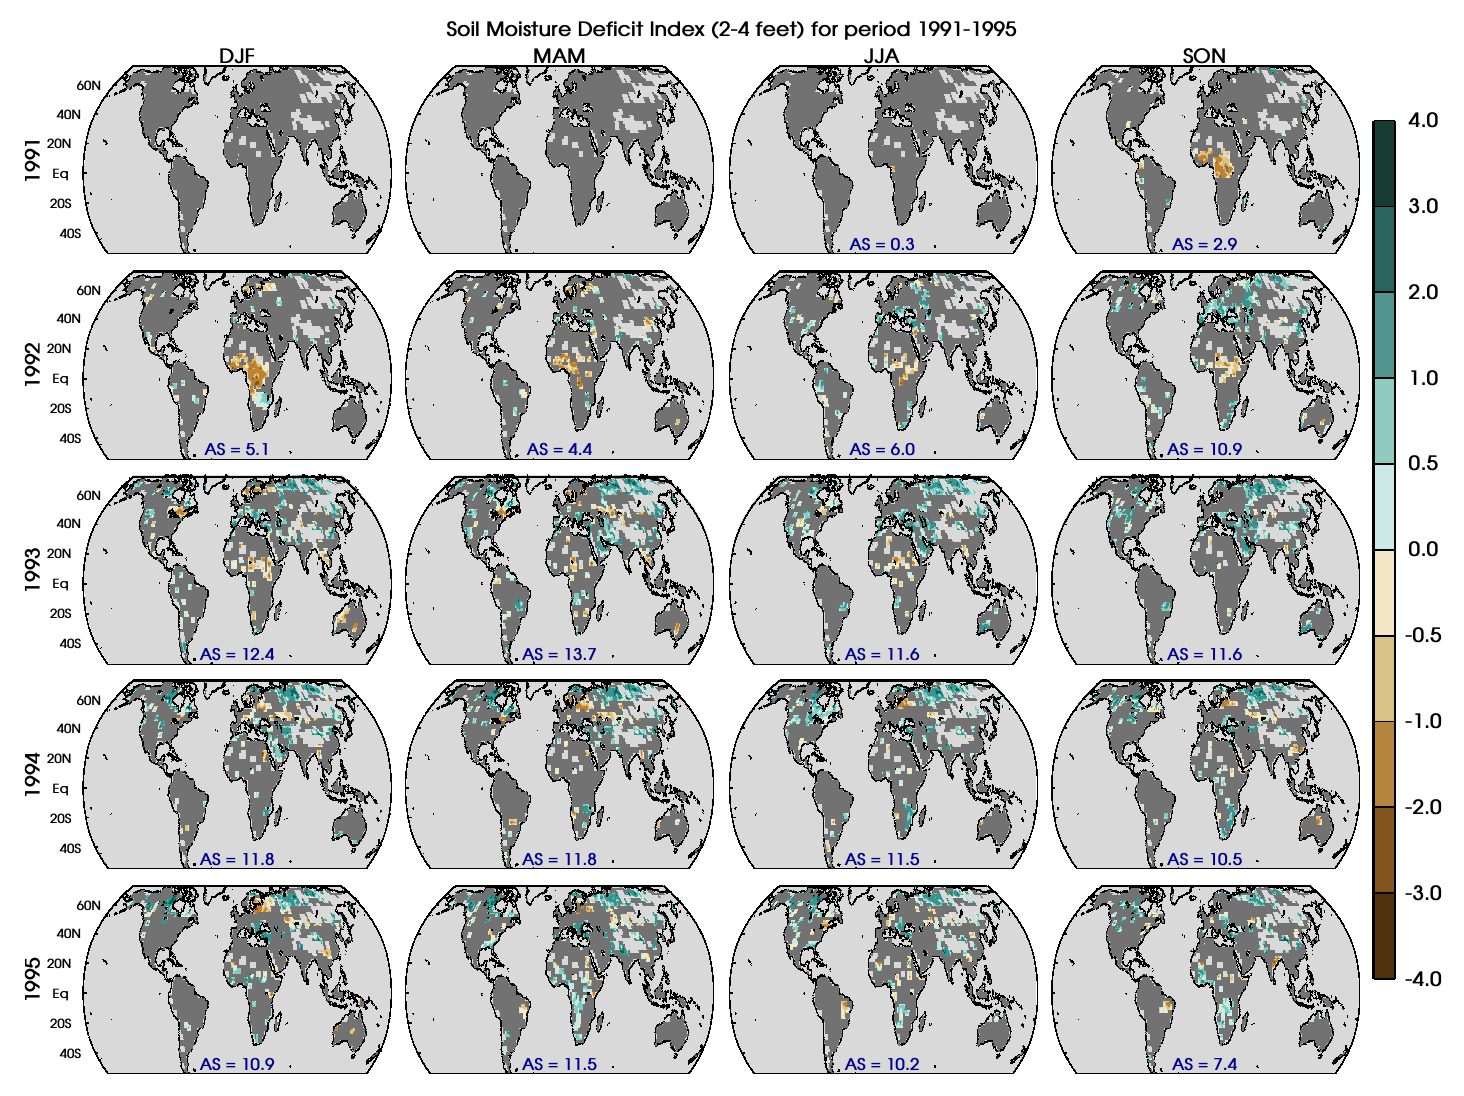
Figure 5Soil moisture deficit index (SMDI_4) for soil depths between 2 and 4 ft (0.6–1.2 m) evaluated seasonally from 1991 to 1995. The grey color is painted over the grid cell where the SMDI_4 is not statistically significant in contrast to the NP ensemble. The light grey colored regions represent regions of impermeability. The parameter AS on each panel marks the percentage of land area showing statistically significant dry or wet response after the Mt. Pinatubo eruption.
3.4.2 Seasonal Evapotranspiration Deficit Index (ETDI)
As indicated in the methodology section, ETDI calculation is similar to SMDI but is based on the water stress anomaly, which accounts for the difference between actual and potential evapotranspiration. ETDI is a measure of the flux of water between land and atmosphere, and like SMDI_2 in Fig. 5, it shows robust statistical differences over land. Figure 6 illustrates the reduction in ETDI response in the equatorial region started developing during the DJF season of the year 1992, and these conditions persisted over the year. Like SMDI_2, ETDI increases over the regions encompassing the Mediterranean and western Asia. However, ETDI differs from the SMDI_2 over some northern hemisphere regions, especially Northeastern Asia. A drying response in terms of ETDI in the northern hemisphere regions persisted during 1993 and 1994, whereas SMDI_2 shows an opposite response. This contrasting response through the ETDI and SMDI_2 points to the complexity of land-atmosphere interactions over these regions. We utilized model simulated surface energy fluxes (Latent and Sensible heat) to calculate the potential (PET) and actual evapotranspiration (AET) to estimate the water stress ratio. In these regions, soil moisture is available during the summer and early winter months. Still, an evapotranspiration deficit reflects the decrease in plant transpiration (latent heat flux), which may be due to the unavailability of plants. Also, the surface temperature (sensible heat flux) response supports the non-water-stressed atmospheric conditions, and thus, overall, it shows an evapotranspiration deficit. Areas of significant response in terms of ETDI vary from 7 % to 14.5 % on a seasonal basis during the years following the eruption. The most significant areas of ETDI coverage occur during the same periods as SMDI_2 (between JJA 1992 and JJA 1993).
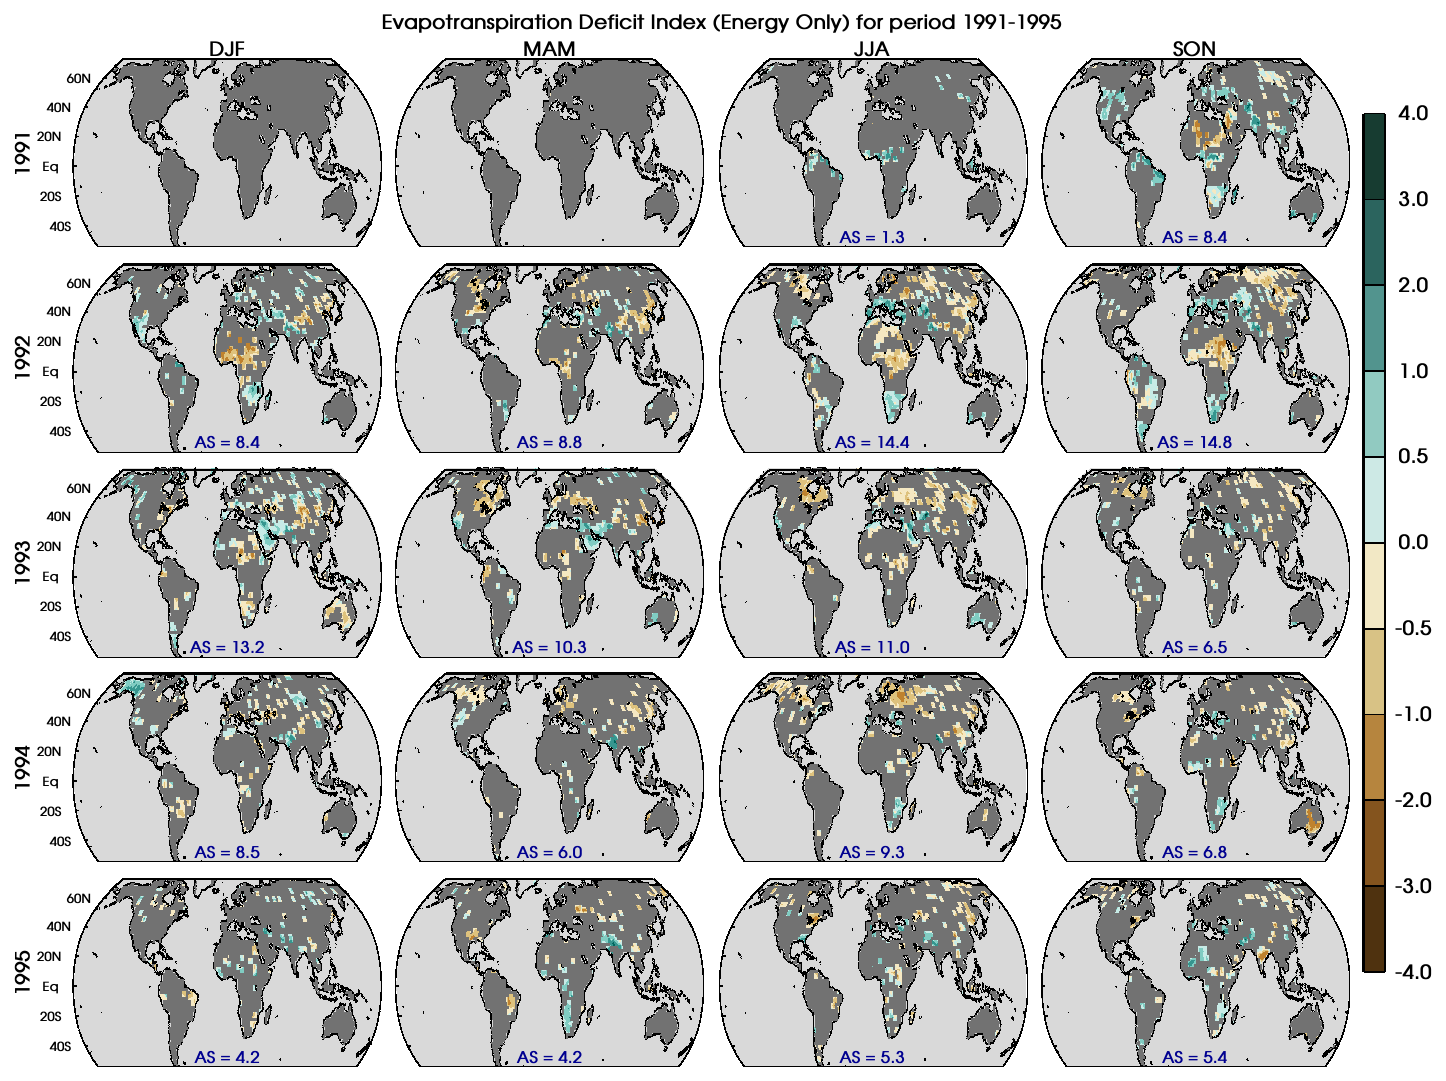
Figure 6Evapotranspiration deficit index (ETDI) at seasonal scale from 1991 to 1995. The grey color is painted over the grid cell where the ETDI is not statistically significant compared to the NP ensemble. The parameter AS on each panel marks the percentage of land area that has shown statistically significant dry or wet response after Mt. Pinatubo eruption.
3.5 Seasonal plant productivity inferences
SMDI (at depths of 0–2 (0.6 m), 2–4 (0.6–1.2m), and 4–6 ft (1.2–1.6 m)) and ETDI have proven helpful in analyzing the climatic impact of the Mt. Pinatubo eruption on a seasonal scale. Additionally, SMDI_2 (top 2 ft or 0.6 m) and ETDI have demonstrated a slow development of drought conditions, beginning by the end of the year 1991 (SON season), reflecting a time lag between seasonal precipitation patterns (Narasimhan and Srinivasan, 2005). Crucially, the seasonal depiction of drying/wet conditions via SMDI and ETDI provides a comprehensive overview of prolonged or recurrent dry/wet conditions in susceptible regions. Moreover, understanding these typical agricultural drought indices indicates potential effects on plant productivity at the seasonal scale.
In equatorial Africa, decreases in both SMDI and ETDI indicated that there was likely a negative impact on plant productivity. The Mediterranean region (encompassing the eastern Mediterranean and western Asian region) showed increased SMDI and ETDI, indicating a positive effect on plant productivity. Northern Asia, on the other hand, exhibited an increase in SMDI with a decrease in ETDI, suggesting that plant productivity likely decreased, but not because of water-based drivers.
3.6 High frequency impact pathways evaluation
Here, we use the daily model output to calculate weekly drought indices in each grid cell. These weekly scale drought indices and changes in other atmospheric variables are explored at the regional scale to understand the associated land-atmosphere interactions pertaining to higher-order impacts. The higher temporal resolution of these parameters is crucial for analyzing different stages of the crop cycle in a region. Considering the complexity of the representation of spatial features, we selected three distinct regions (shown in Fig. S7 and detailed in caption) in the northern hemisphere based on the climate response to Mt. Pinatubo in the seasonal analyses presented in Sect. 3.0. We followed the same strategy described in Sect. 2.3.1 to mask out the statistically insignificant grid cells using the NP ensemble after creating the weekly time series for different drought indices and atmospheric parameters.
3.6.1 Equatorial Africa
Figure 7 shows the weekly response to volcanic forcing for the years 1991–1995 in terms of agricultural drought indices (SMDI_2 and ETDI), AET, PET, transpiration, total soil moisture source, and surface temperature for an equatorial region in northern Africa. This region exhibits consistent statistical differences across the drivers on a weekly scale; thus, for most of the time period, this is unmasked, revealing the degree of anomalous conditions.
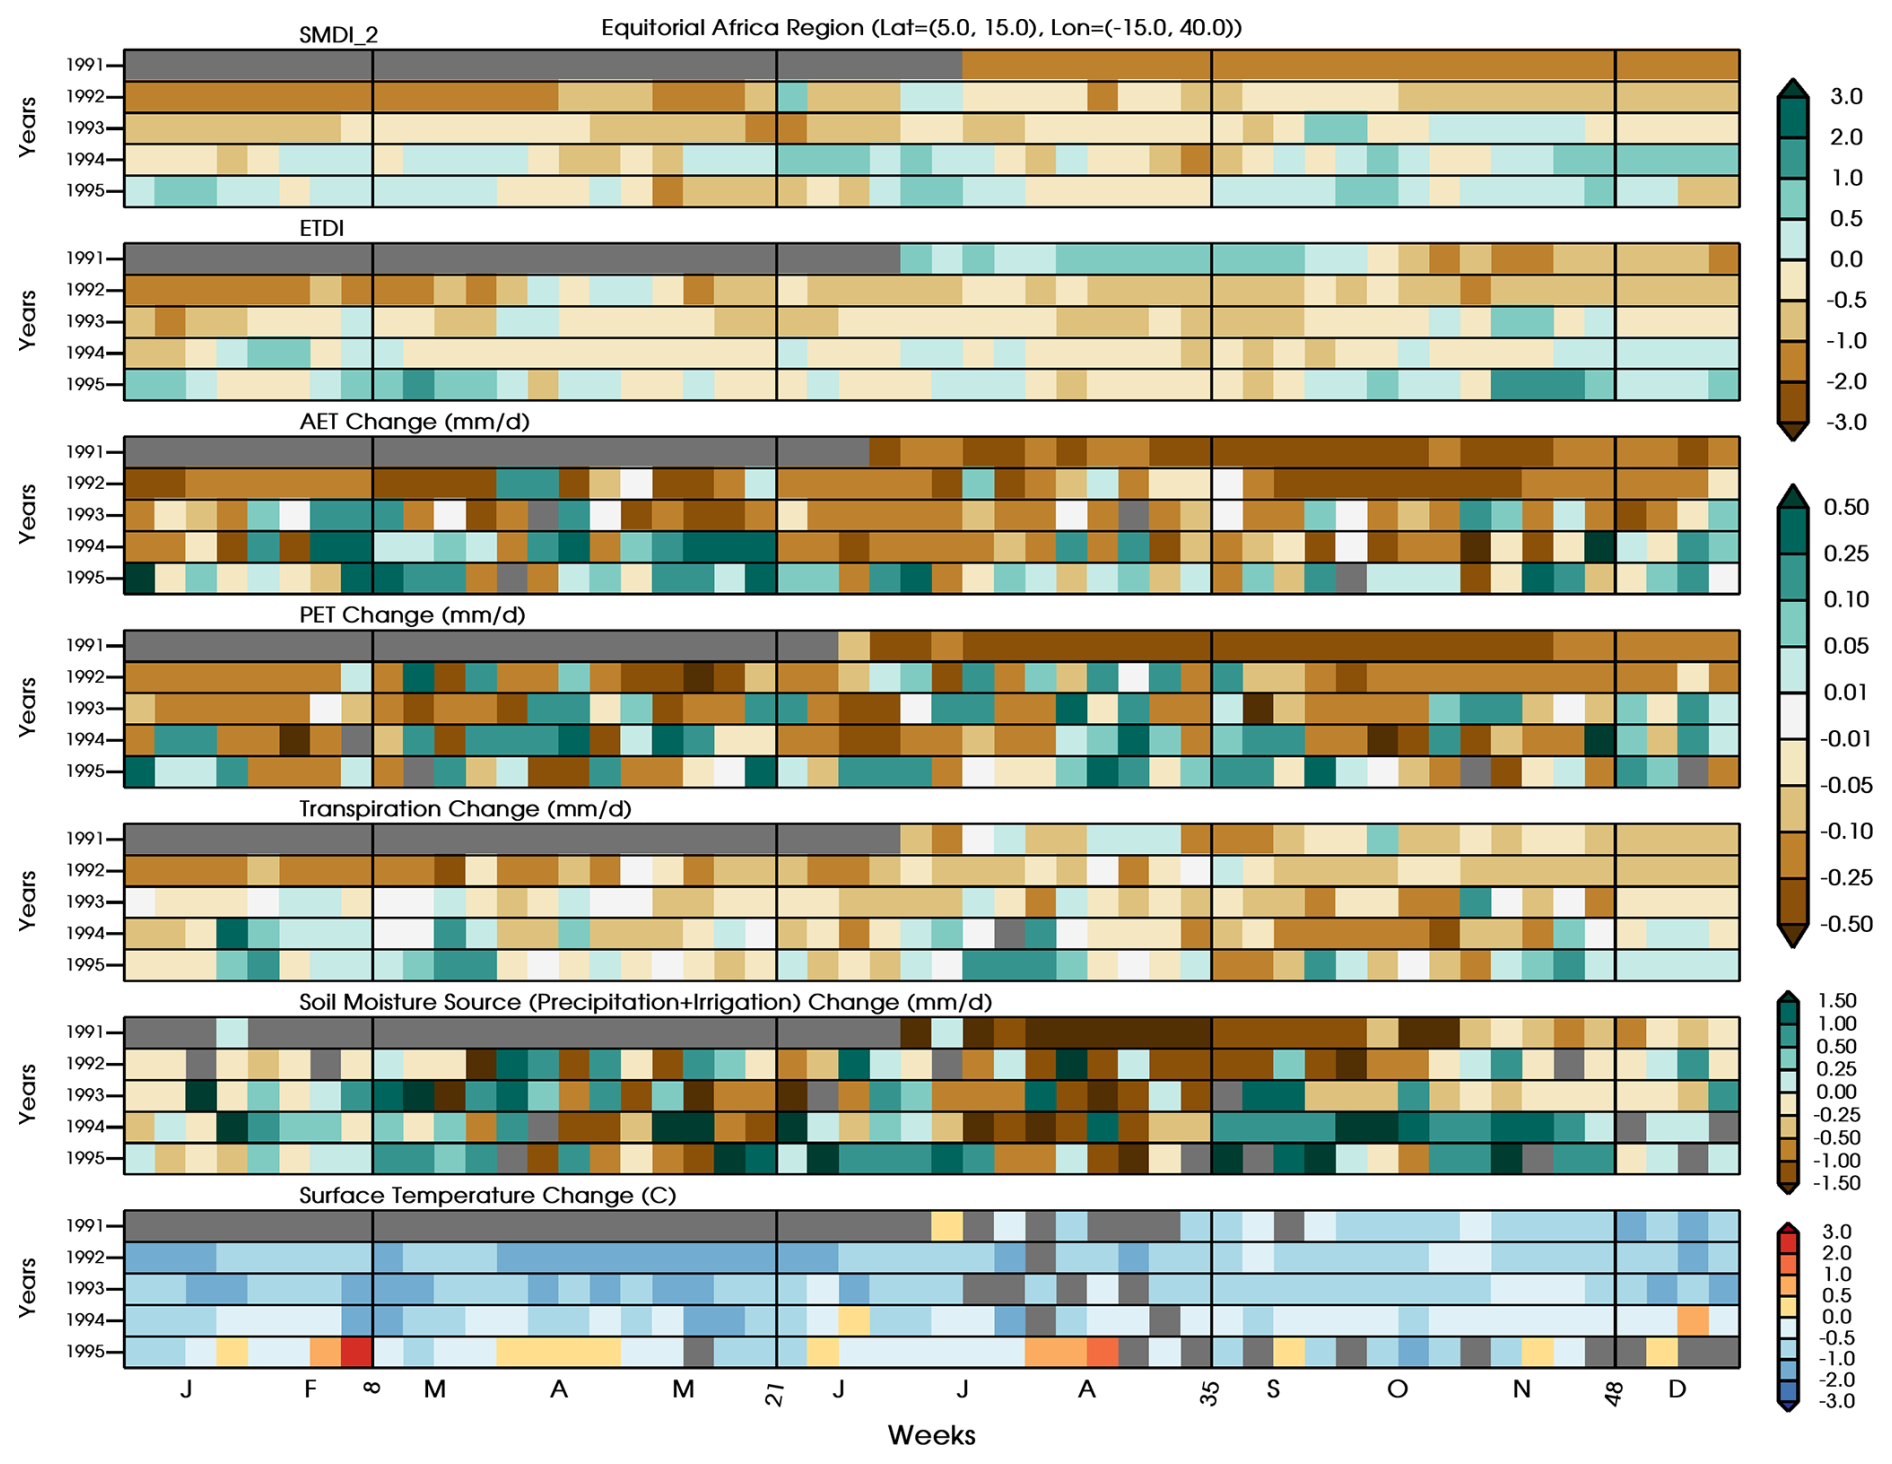
Figure 7Spatially averaged drought indices (SMDI_2 and ETDI) and anomalies for other drivers (Actual and Potential Evapotranspiration, Transpiration, Moisture Source (Precipitation plus irrigation) and Surface Temperature) at weekly scale for the equatorial Africa region (Latitude = 5–15° N, Longitude = 15° W–40° E).
This region lies between the latitude 5–15° N, where the precipitation during the monsoon season shows a decrease in response to a southern migration of the inter-tropical convergence zone (Iles et al., 2013; Colose et al., 2016; Singh et al., 2023). Weekly precipitation change in the equatorial Africa shows a significant deficit of more than 1.5 mm d−1 consistently for several weeks, especially during the JJAS monsoon season. This region also shows that a deficit in precipitation during the major precipitation season (JJAS) can result in a soil moisture deficit in the root zone in the following seasons (DJF and MAM in SMDI_2) and consequently affect the entire crop cycle. The root zone soil moisture, SMDI_2, also shows a persistent drying through 1993, and combined with the lack of precipitation, the potential for recharge is limited. Also, this region has no contribution from irrigation as a source of additional soil moisture, as shown in Fig. S8 (bottom panel) (Cook et al., 2020). Cumulative annual rainfall change over this region shows a deficit of 33.2, 9.5, and 3.2 mm d−1 for the years 1991, 1992, and 1993 and an increase of 10.5 and 13.6 mm d−1 for the years 1994 and 1995, respectively, where soil-moisture response shows a recovery from the dry conditions.
Hence, it is unsurprising that a corresponding decrease in ETDI through 1993 is consistent with this lack of moisture. However, the evaporative demand, as shown by surface temperature change, does not consistently decrease until September of 1991, and hence, ETDI is slow to show a response in the deficit index. After that point, evaporative demand decreases with lower temperatures, but the evapotranspiration is dominated by transpiration (Seneviratne et al., 2010; Nilson and Assmann, 2007), and so the majority of the decrease in ETDI is explained by the shown decrease in plant transpiration. As expected, this decrease in plant transpiration is well correlated with decreases in AET. Conclusively, precipitation response in this region shows dominance in regulating the ecohydrological conditions. A substantial decrease in the weekly rainfall over the region perpetuates a root-zone water deficit, resulting in decreased plant transpiration. Decreases in both SMDI_2 and ETDI thus indicate developing agricultural drought conditions, which are confirmed by a decrease in the direct measure of plant transpiration.
3.6.2 Middle East Region
Figure 8 shows the region covering the eastern Mediterranean and the western Asian regions where rainfall slightly increased after the Mt. Pinatubo eruption. Additionally, this region exhibits a significantly positive trend in irrigation practices post-1950, with a substantial peak over the eastern Mediterranean region following the Mt. Pinatubo eruption (Cook et al., 2020; Figs. 1 and 2).
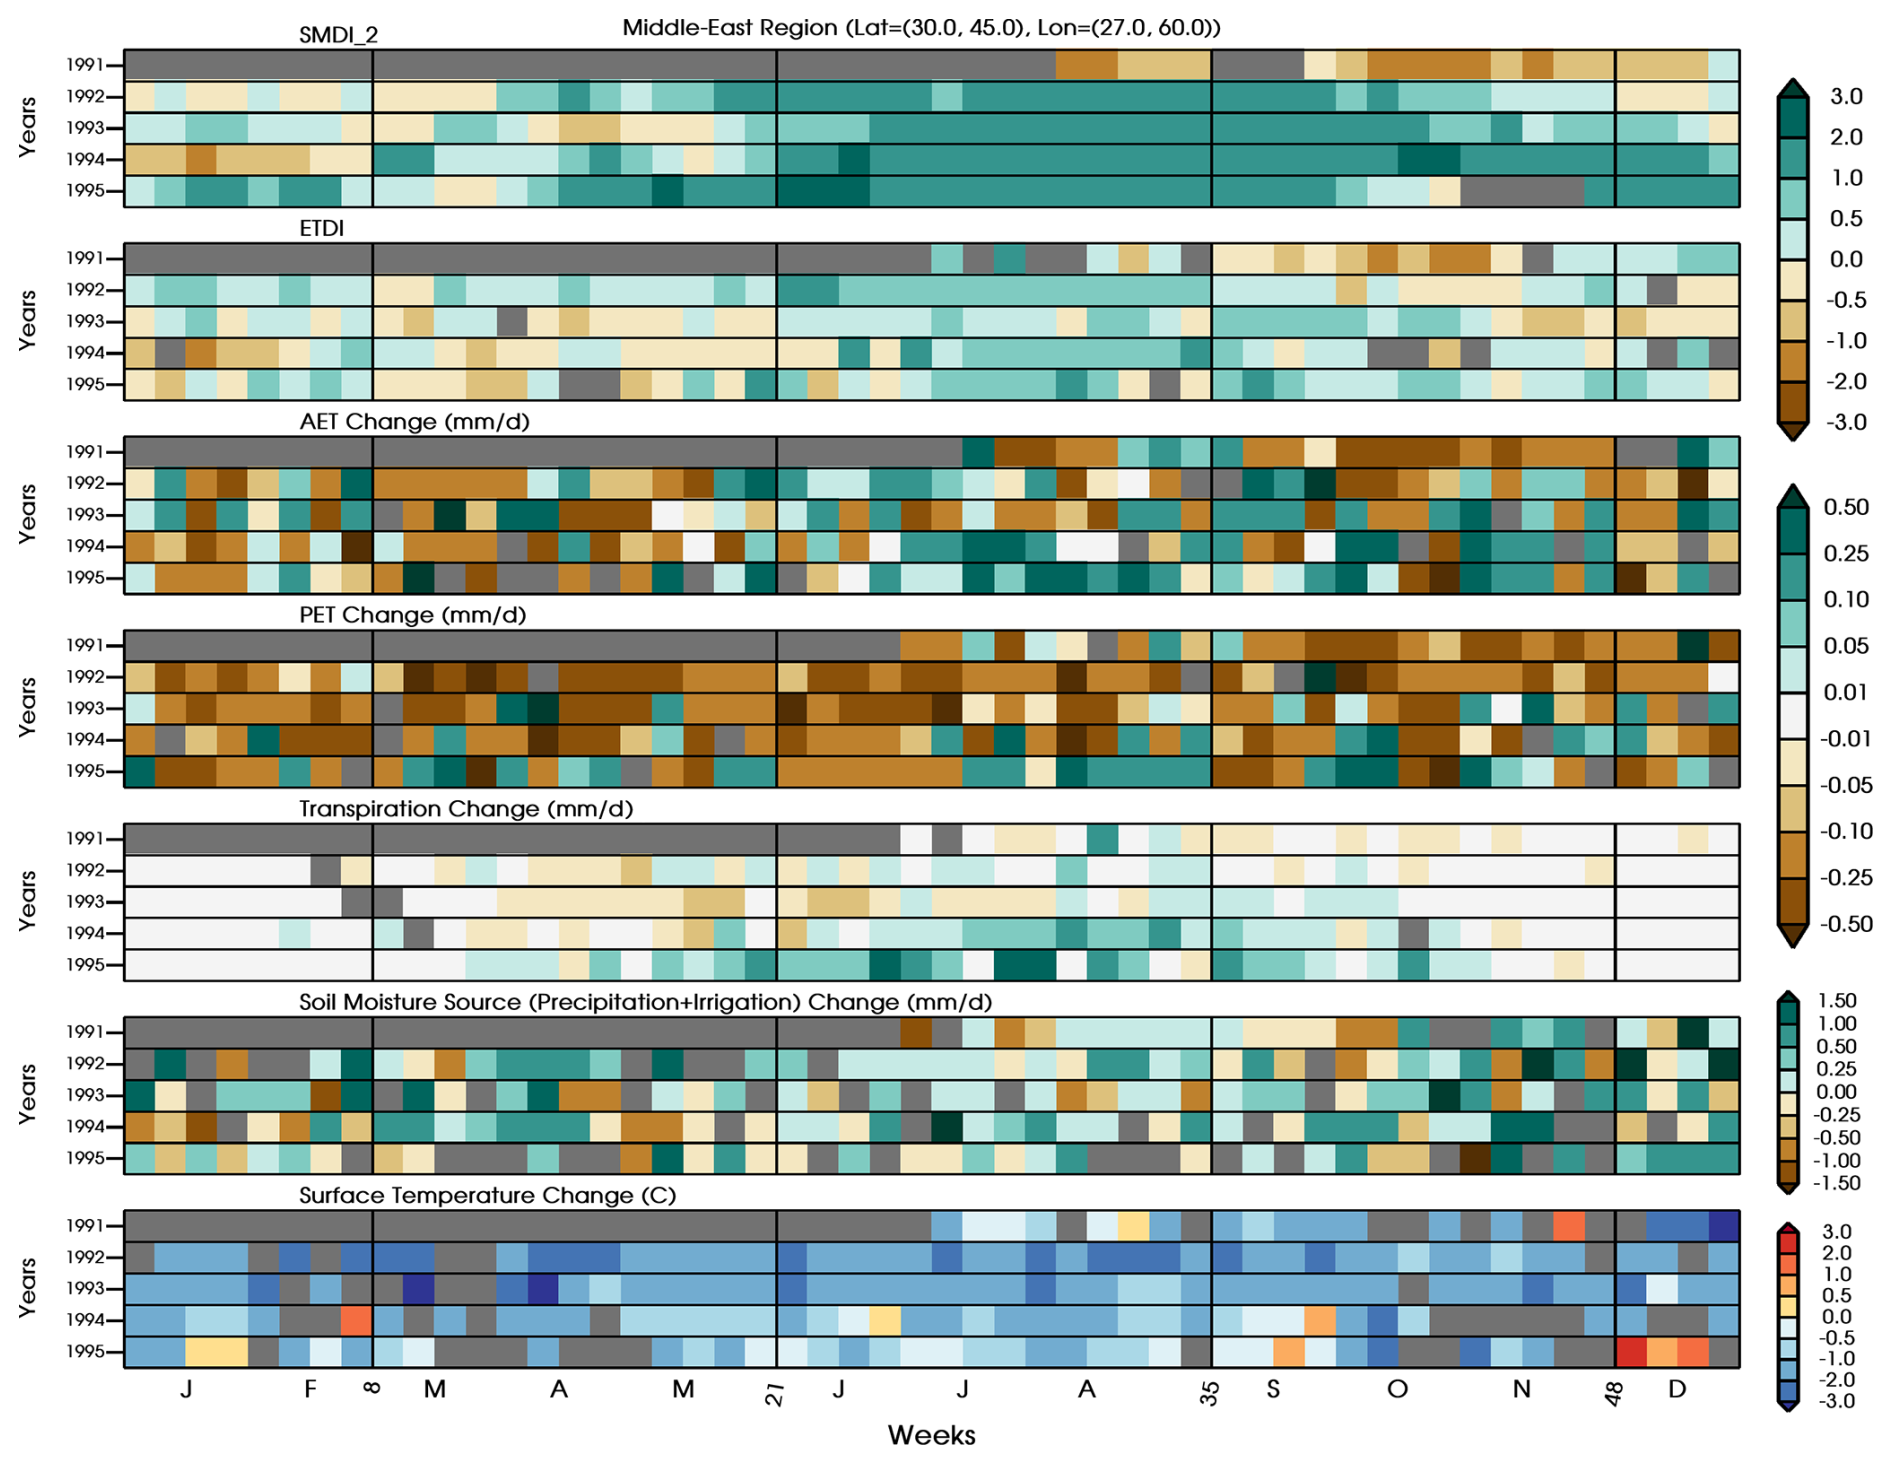
Figure 8Spatially averaged drought indices (SMDI_2 and ETDI) and anomalies for other drivers (Actual and Potential Evapotranspiration, Transpiration, Moisture Source (Precipitation plus irrigation) and Surface Temperature) at weekly scale for Middle East (MDE) Region (Latitude = 30–45° N, Longitude = 27–60° E; Eastern Mediterranean/Western Asian).
In the eastern Mediterranean, wet and cold autumns and winters persist for several years after the Mt. Pinatubo eruption, offering significant root zone recharge potential. The summer months, in general, reflect a slightly uncertain model response in the regional rainfall, with some weeks of deficit and some excess, but an additional water supply through irrigation contributes to the overall moisture content in the region (Fig. S8; middle panel). Root zone soil moisture (SMDI_2) indicates sufficient water availability throughout the growing seasons during the entire analysis period. Overall, the findings demonstrate that this region is not moisture-limited, with adequate precipitation and irrigation ensuring the replenishment of root zone moisture as plants grow. Cumulative weekly anomalies show that precipitation change in 1991 is slightly negative (−0.5 mm d−1), but an increase in annual rainfall of 13.8, 8.0, 10.9, and 4.5 mm d−1 is simulated for the years 1992, 1993, 1994, and 1995, respectively. Irrigation implemented across this Middle East region exhibits a strong positive trend from 1950 to 2005 (Cook et al., 2020). Notably, a significant cumulative increase in irrigation of 0.5, 1.3, 1.3, 0.8, and 0.9 mm d−1 during the years 1991 to 1995 provides an additional source of moisture supply for the region (Cook et al., 2020). This irrigation is particularly crucial during the summer months, compensating for rainfall deficits lasting several weeks and contributing 10 %–20 % of soil moisture source changes (Fig. S8).
The corresponding increases in ETDI and AET indicate the abundant water availability for transpiration in the region. While transpiration remains temporally correlated with AET, the increases are less pronounced. Simultaneously, there is a decline in PET response, which is associated with a more significant temperature decrease in this region compared to equatorial Africa. The reduction in PET, combined with the increase or maintenance of AET through transpiration, leads to an increase in ETDI. Consequently, agricultural productivity in this region is generally positively impacted, as ample moisture provides essential support. Nevertheless, the data reveals heterogeneous patterns, indicating that 1993 may have influenced plant productivity with a positive but lower-magnitude ETDI, inconsistent AET, and reduced transpiration.
Regardless of the presence of a volcanically induced response, the weekly scale analysis demonstrates its importance by virtue of an example from 1993, where rainfall deficit is produced during the 15th and 16th weeks (April) of the year. Combined with lower SMDI_2, this may lead to insufficient moisture availability during a critical stage of the crop cycle. The duration of such moisture deficits could significantly impact overall seasonal crop production. Consequently, even if favorable conditions prevail for most of the crop cycle, adverse effects during essential phases can critically influence yields in ways that seasonal averages fail to capture.
3.6.3 Northern Asia
Finally, we selected a region (NAS; Fig. 9) in higher latitudes to explore the interplay between the various drivers governing the conditions for plant productivity. This region consistently exhibits statistically significant differences across drivers on a weekly scale. However, higher latitudes experience strong seasonal controls on plant productivity, with below-freezing temperatures (indicated by blue stars) halting growth. Therefore, our analysis focuses on months when plant growth is possible (∼ MJJAS).
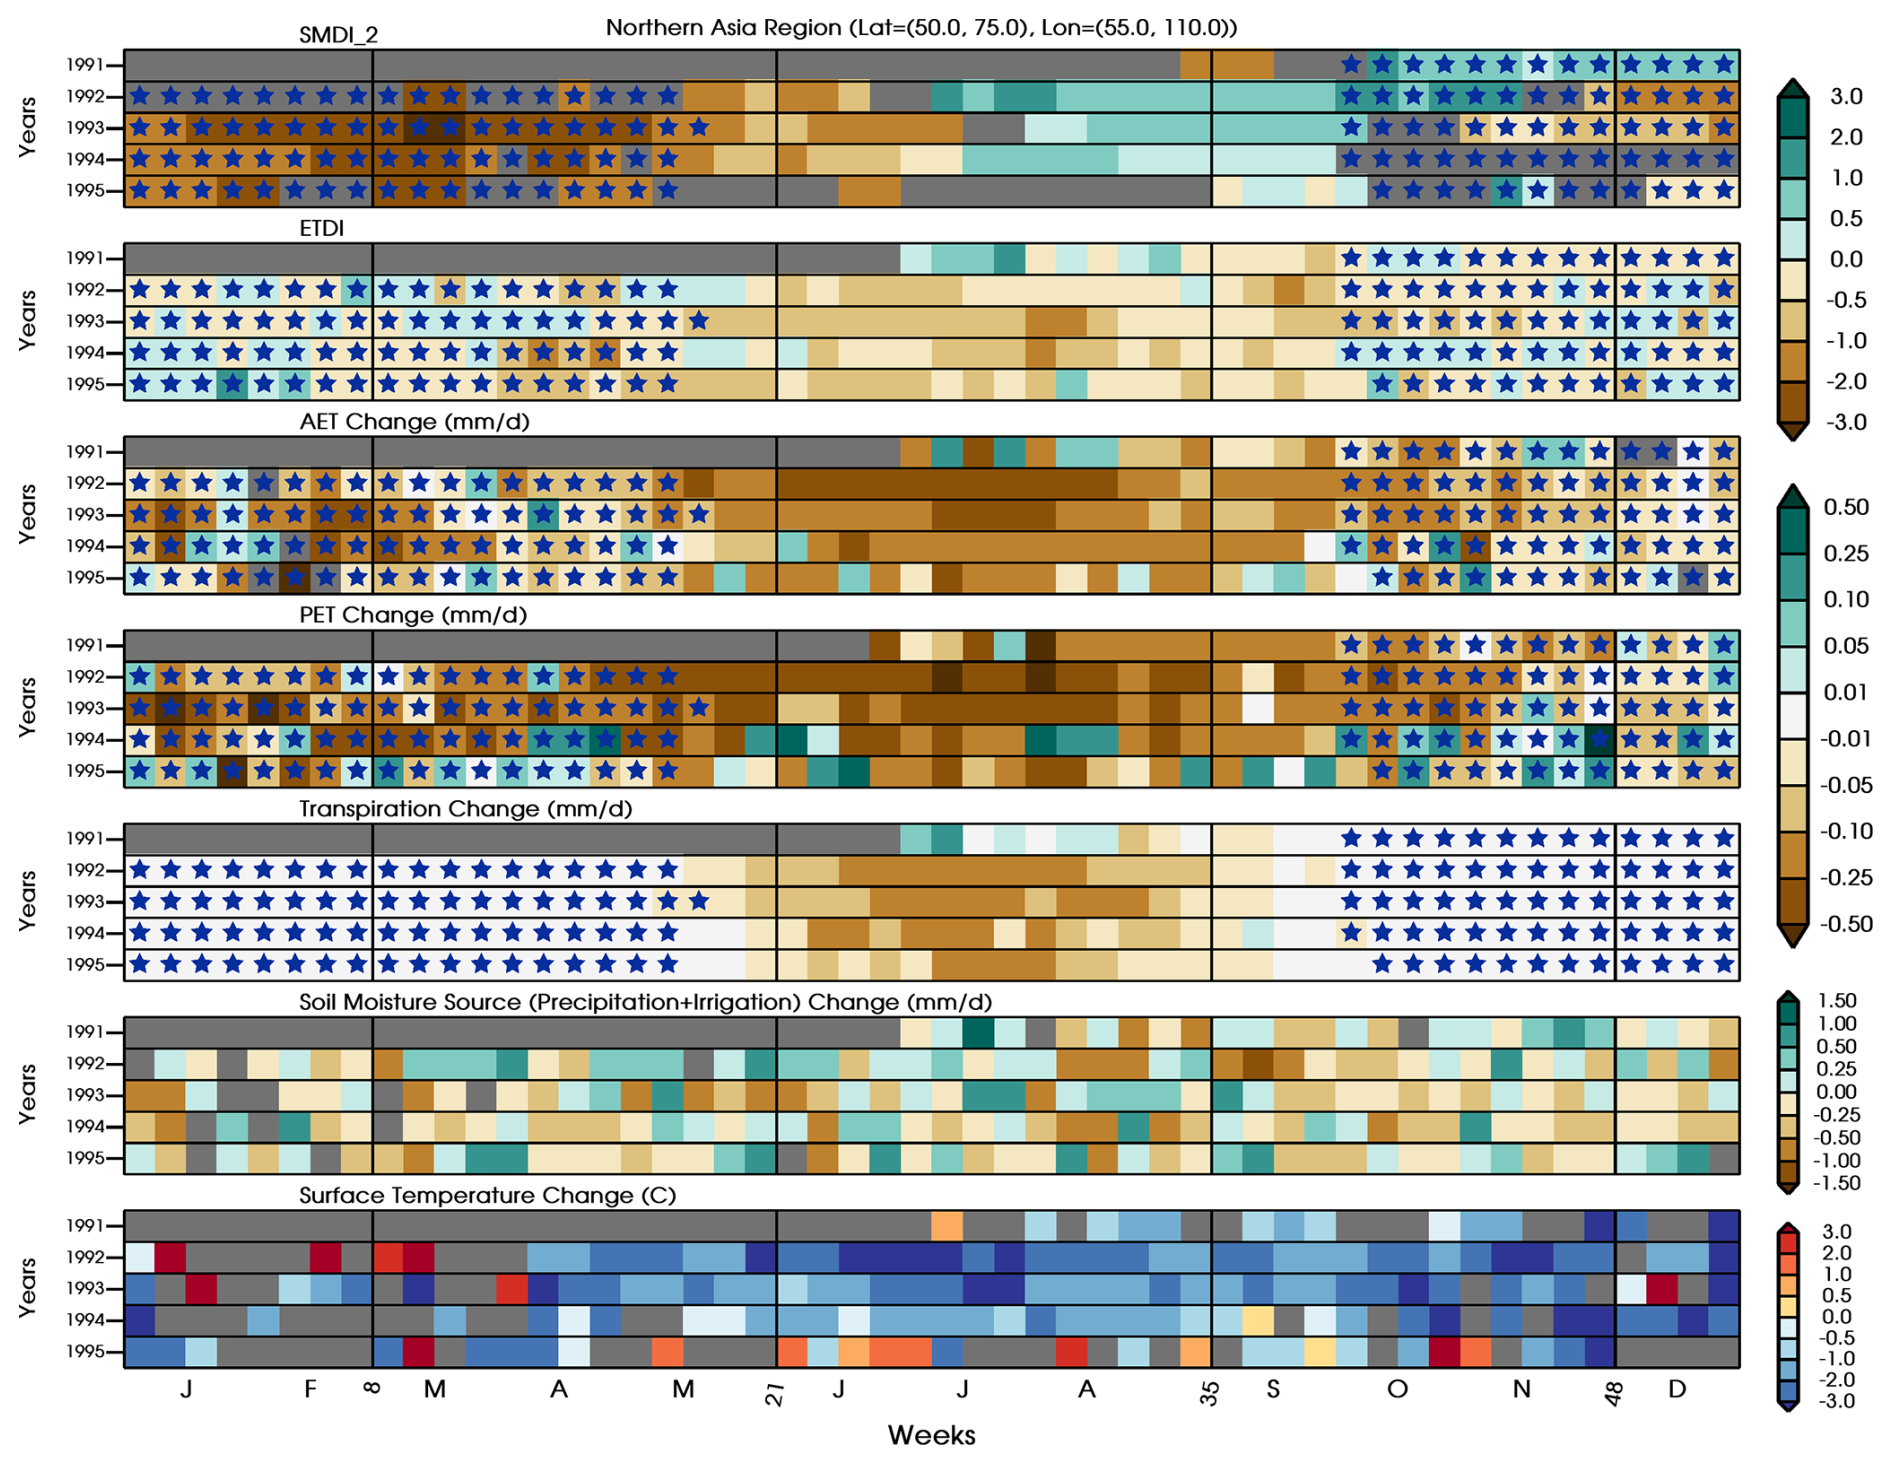
Figure 9Spatially averaged drought indices (SMDI_2 and ETDI) and anomalies for other drivers (Actual and Potential Evapotranspiration, Transpiration, Moisture Source (Precipitation plus irrigation) at weekly scale Northern Asia Region (Latitude = 50–75° N, Longitude = 55–110° E). Blue stars represent the weeks with average surface temperature below freezing point.
Precipitation changes over the entire analysis period are highly uncertain. However, there is generally a slight trend toward increased precipitation from November 1991 to June 1992, followed by a decline through 1994. As shown in Figure S8, the contribution of irrigation to soil moisture in this region is negligible. Cumulative weekly precipitation anomalies indicate an annual increase of 0.05 mm d−1 in 1991, followed by decreases of −2.0, −4.1, −6.8, and −1.0 mm d−1 from 1992 to 1995, respectively. Alternatively, root zone moisture shows that sufficient water available to plants during the JAS (July–August–September) growing months after a substantial deficit in the early MJ (May–June) months. Certainly, during the summer months, the melting of frozen surfaces and snow supplies moisture to the upper layers, resulting in wet conditions, which accounts for this strong dichotomy. However, there were no corresponding increases in ETDI and AET following the 1991 season. This indicates that despite ample water, plants are still not growing; this is conclusively confirmed by the decrease in transpiration starting in 1992. Meanwhile, the simultaneous reduction of PET response is correlated with the most substantial decline in temperature, on the order of 2–3 °C, for this region.
Unlike the other two regions for which SMDI_2 and ETDI exhibited similar wet/dry patterns, this region shows diverging patterns. Overall, this indicates that although moisture is available to support plant productivity, it is not being effectively utilized. Therefore, other factors must be responsible for the decrease in plant transpiration and ETDI. The more significant decline in PET compared to AET suggests that temperature is playing a role. Since temperature is directly related to reduced incident radiation, the combined effects of temperature and radiation are likely the primary factors controlling the reduced plant productivity in this region, rather than moisture conditions.
This study utilized the NASA GISS ModelE2.1 (MATRIX) Earth system modeling framework to investigate the mechanisms by which the 1991 Mt. Pinatubo eruption influenced hydroclimatic conditions and water-based drivers of plant productivity. This study successfully demonstrated the potential of volcanically-induced hydroclimate responses in context to complex but directly relevant impact metrics for societal implications, such as agricultural productivity. The application of process-based compound drought indices (SMDI and ETDI) targeting key climate-relevant quantities, including soil moisture, effectively address the challenge posed by the uncertainties associated with regional rainfall responses and presents a better assessment of its impact on plant productivity. Furthermore, the temporal as well as the latitudinal dependence of dominant hydroclimate drivers in shaping regional plant productivity response provides critical insights for understanding and guiding mitigation strategies to address the adverse impacts of such climate perturbation events. The simulation successfully reproduced key microphysical properties (Reff ≈ 0.5 µm, AOD ≈ 0.22), radiative forcing (∼ −5 W m−2), surface cooling (∼ 0.5 °C), and regional rainfall changes consistent with previous studies. Two metrics, SMDI and ETDI, which account for land-atmosphere interactions, were utilized to capture the progression of short- and long-term conditions affecting plant productivity, particularly in agricultural contexts. These drought indices confirm the moisture-driven dry and wet patterns observed in early 1992 and the following years over the tropical regions and mid-latitudes of the Northern Hemisphere, respectively, as a response to the radiative perturbation caused by the Mt. Pinatubo eruption. Based on both drought indices, we conclude that approximately 10 %–15 % of land areas exhibit statistically significant dry or wet patterns under the volcanically altered climate conditions of 1992 and 1993. The fraction of land region showing a significant dry or wet response range between 5 % and 10 % for the next 2 (1994 and 1995) years. In equatorial Africa, seasonal decreases in both SMDI and ETDI suggested a likely negative impact on plant productivity. In contrast, the Middle East showed increases in both SMDI and ETDI, indicating a positive effect on plant productivity. Northern Asia, by comparison, exhibited an increase in SMDI alongside a decrease in ETDI, implying a reduction in plant productivity, though not driven by water-related factors.
Motivated by these key pattern differences, we extended our analysis of the drought indices by incorporating higher temporal (weekly) frequencies along with AET, PET, and transpiration. These regional analyses generally exhibit much stronger statistical significance on a weekly scale and further confirm the season-based inferences described above. Further, weekly drought indices show the temporal variability characteristics in the signal, which also demonstrates the utility of explaining the effectiveness of short-term dry/wet conditions corresponding to a regional crop cycle. In locations with insufficient/excess soil moisture, there is a corresponding decrease/increase in evapotranspiration (AFR/MDE) and hence decreased/increased plant productivity.
Kandlbauer et al. (2013) examined crop responses (using C3 and C4 grasses as proxies) to the 1815 Tambora eruption using the HadGEM-ES model in three regions very similar to those in our study. Their findings suggest that plant productivity decreases with positive changes in soil moisture in the higher-latitude Asian region. In the mid-latitudes over the Southern Europe/Middle East region (adjacent to our MDE region), volcanic eruptions may enhance plant productivity by providing additional soil moisture through increased rainfall. However, in the MDE region in our study, we found that the applied irrigation also benefits soil moisture supply along with the increased rainfall. Furthermore, both studies report a decrease in productivity in the tropical region. In general, these results complement the findings of this study, which suggest that if sufficient water is available in the Southern Europe/Middle East region, volcanic eruptions may enhance plant productivity. In contrast, in the far northern latitudes, water is not the primary driver of plant responses, and productivity is likely to decline. Seasonal-scale changes in gross primary productivity (GPP) confirm the regional trends in plant productivity following the eruption. The simulations show a more pronounced decrease in GPP in the northern high-latitude region and a significant increase in GPP over the European and Mediterranean regions. Additionally, distinct patterns of decrease and increase in GPP are simulated in the tropical northern and southern regions, respectively (Fig. S10).
This study is the first to conclusively demonstrate that there is an excess of root-zone soil moisture in high-latitude regions (NAS) that plants are not utilizing for growth, indicating that temperature and radiation are likely the primary controlling factors, thus confirming previous findings (Krakauer and Randerson, 2003; Dong and Dai, 2017). The intricate nature of the compounded response, particularly in relation to soil moisture-driven impact pathways in tropical regions and high-latitude areas of the Northern Hemisphere, highlights the need to expand the investigation beyond soil moisture and land-atmosphere interactions. The current configuration of the NASA GISS model operates with prescribed vegetation with static plant functional types and leaf area index. Incorporating dynamic vegetation could be essential for capturing interactive land surface responses. Additionally, evaluating the influence of regional and local biomes on photosynthesis rates could offer deeper insights into how these processes respond to the climatic impacts of volcanic or similar forcings. McDermid et al. (2022) have demonstrated the sensitivity of regional hydroclimate to the local changes in soil organic carbon changes using the soil moisture content. The results presented in this study regarding soil-moisture-based drivers to plant productivity and surface temperature response in the northern hemisphere's high latitudes also hinted towards the dominance of temperature effects on enhanced carbon sink in terms of soil and plant respiration and reduced NPP (Krakauer and Randerson, 2003; Lucht et al., 2002). Meanwhile, water-based drivers predominantly influence productivity responses in many tropical and subtropical regions. Our findings demonstrate that soil moisture conditions across different regions can provide valuable insights into the full impacts on agricultural yields and regional carbon sink responses, particularly under scenarios involving implementation of solar geo-engineering (stratospheric aerosol injection) or future large eruptions along with the changes in dynamic vegetation and crop cover. It needs to noted however that although in the future the physical mechanisms of a forcing response would be similar, the societal impact might be muted compared to that on past civilizations, due to present (and future) widespread irrigation practices and river level control in the presence of dams. A recently developed fully demographic dynamic vegetation model (ModelE-BiomE v.1.0; Weng et al., 2022) incorporates interactive biophysical and biogeochemical feedbacks between climate and land systems within the NASA GISS ModelE framework. This model could be instrumental in evaluating carbon cycle responses under such future forcings.
Details to support the results in the manuscript is available as supplementary information is provided with the manuscript. GISS Model code snapshots are available at https://simplex.giss.nasa.gov/snapshots/ (National Aeronautics and Space Administration, last access: 19 November 2025) and calculated diagnostics are available at Zenodo repository at https://doi.org/10.5281/zenodo.12734905 (Singh et al., 2024). However, raw model output and data at high temporal (daily) resolution and codes are available on request from author due to large data volume.
The supplement related to this article is available online at https://doi.org/10.5194/acp-25-16511-2025-supplement.
RS, KT, DB, LS and KM identified the study period in consultation with the other authors and RS, KT, DB, LS and BW designed the underlying simulations strategies. RS and KT implemented it and performed the simulations using NASA GISS ModelE. RS and KT have performed the analysis. RS created the figures in close collaboration with all authors. RS wrote the first draft of the manuscript, and all other authors has contributed the writing of subsequent drafts. All authors contributed to the interpretation of results.
At least one of the (co-)authors is a member of the editorial board of Atmospheric Chemistry and Physics. The peer-review process was guided by an independent editor, and the authors also have no other competing interests to declare.
Publisher's note: Copernicus Publications remains neutral with regard to jurisdictional claims made in the text, published maps, institutional affiliations, or any other geographical representation in this paper. While Copernicus Publications makes every effort to include appropriate place names, the final responsibility lies with the authors. Views expressed in the text are those of the authors and do not necessarily reflect the views of the publisher.
Resources supporting this work were provided by the NASA High-End Computing (HEC) Program through the NASA Center for Climate Simulation (NCCS) at Goddard Space Flight Center. The authors thank Ben I Cook, Nancy Y Kiang, Igor Aleinov and Michael Puma for their input through multiple discussions with the project members. RS, KT, DB, LS, BW, and KM were supported by the Laboratory Directed Research and Development program at Sandia National Laboratories, a multi-mission laboratory managed and operated by National Technology and Engineering Solutions of Sandia LLC, a wholly owned subsidiary of Honeywell International Inc. for the U.S. Department of Energy's National Nuclear Security Administration under contract DE-NA0003525. This paper describes objective technical results and analysis. Any subjective views or opinions that might be expressed in the paper do not necessarily represent the views of the U.S. Department of Energy or the United States Government.
This research has been supported by the Sandia National Laboratories (grant no. DE-NA0003525).
This paper was edited by Amos Tai and reviewed by five anonymous referees.
Allen, R. G., Pereira, L. S., Raes, D., and Smith, M.: Crop Evapotranspiration – Guidelines for Computing Crop Water Requirements, FAO Irrigation and Drainage Paper 56, FAO, Rome, 300(9), D05109, ISBN 92-5-104219-5, 1998.
Aquila, V., Oman, L. D., Stolarski, R. S., Colarco, P. R., and Newman, P. A.: Dispersion of the volcanic sulfate cloud from a Mount Pinatubo-like eruption, J. Geophys. Res.-Atmos., 117, https://doi.org/10.1029/2011JD016968, 2012.
Barnes, E. A., Solomon, S., and Polvani, L. M.: Robust Wind and Precipitation Responses to the Mount Pinatubo Eruption, as Simulated in the CMIP5 Models, J. Climate, 29, 4763–4778, https://doi.org/10.1175/JCLI-D-15-0658.1, 2016.
Barnes, J. E. and Hofmann, D. J.: Lidar measurements of stratospheric aerosol over Mauna Loa Observatory, Geophys. Res. Lett., 24, 1923–1926, https://doi.org/10.1029/97GL01943, 1997.
Bauer, S. E., Wright, D. L., Koch, D., Lewis, E. R., McGraw, R., Chang, L.-S., Schwartz, S. E., and Ruedy, R.: MATRIX (Multiconfiguration Aerosol TRacker of mIXing state): an aerosol microphysical module for global atmospheric models, Atmos. Chem. Phys., 8, 6003–6035, https://doi.org/10.5194/acp-8-6003-2008, 2008.
Bauer, S. E., Ault, A., and Prather, K. A.: Evaluation of aerosol mixing state classes in the GISS modelE-MATRIX climate model using single-particle mass spectrometry measurements, J. Geophys. Res.-Atmos., 118, 9834–9844, https://doi.org/10.1002/jgrd.50700, 2013.
Bauer, S. E., Tsigaridis, K., Faluvegi, G., Kelley, M., Lo, K. K., Miller, R. L., Nazarenko, L., Schmidt, G. A., and Wu, J.: Historical (1850–2014) Aerosol Evolution and Role on Climate Forcing Using the GISS ModelE2.1 Contribution to CMIP6, J. Adv. Model. Earth Sy., 12, e2019MS001978, https://doi.org/10.1029/2019MS001978, 2020.
Bluth, G. J. S., Doiron, S. D., Schnetzler, C. C., Krueger, A. J., and Walter, L. S.: Global tracking of the SO2 clouds from the June, 1991 Mount Pinatubo eruptions, Geophys. Res. Lett., 19, 151–154, https://doi.org/10.1029/91GL02792, 1992.
Briffa, K. R., Jones, P. D., Schweingruber, F. H., and Osborn, T. J.: Influence of volcanic eruptions on Northern Hemisphere summer temperature over the past 600 years, Nature, 393, 450–455, https://doi.org/10.1038/30943, 1998.
Brown, H. Y., Wagman, B., Bull, D., Peterson, K., Hillman, B., Liu, X., Ke, Z., and Lin, L.: Validating a microphysical prognostic stratospheric aerosol implementation in E3SMv2 using observations after the Mount Pinatubo eruption, Geosci. Model Dev., 17, 5087–5121, https://doi.org/10.5194/gmd-17-5087-2024, 2024.
Carn, S. A., Clarisse, L., and Prata, A. J.: Multi-decadal satellite measurements of global volcanic degassing, J. Volcanol. Geoth. Res., 311, 99–134, https://doi.org/10.1016/j.jvolgeores.2016.01.002, 2016.
Chen, D.-X. and Coughenour, M. B.: Photosynthesis, transpiration, and primary productivity: Scaling up from leaves to canopies and regions using process models and remotely sensed data, Global Biogeochem. Cy., 18, https://doi.org/10.1029/2002GB001979, 2004.
Cheng, W., MacMartin, D. G., Dagon, K., Kravitz, B., Tilmes, S., Richter, J. H., Mills, M. J., and Simpson, I. R.: Soil Moisture and Other Hydrological Changes in a Stratospheric Aerosol Geoengineering Large Ensemble, J. Geophys. Res.-Atmos., 124, 12773–12793, https://doi.org/10.1029/2018JD030237, 2019.
Colose, C. M., LeGrande, A. N., and Vuille, M.: Hemispherically asymmetric volcanic forcing of tropical hydroclimate during the last millennium, Earth Syst. Dynam., 7, 681–696, https://doi.org/10.5194/esd-7-681-2016, 2016.
Cook, B. I., McDermid, S. S., Puma, M. J., Williams, A. P., Seager, R., Kelley, M., Nazarenko, L., and Aleinov, I.: Divergent Regional Climate Consequences of Maintaining Current Irrigation Rates in the 21st Century, J. Geophys. Res.-Atmos., 125, e2019JD031814, https://doi.org/10.1029/2019JD031814, 2020.
Denissen, J. M. C., Teuling, A. J., Pitman, A. J., Koirala, S., Migliavacca, M., Li, W., Reichstein, M., Winkler, A. J., Zhan, C., and Orth, R.: Widespread shift from ecosystem energy to water limitation with climate change, Nat. Clim. Change, 12, 677–684, https://doi.org/10.1038/s41558-022-01403-8, 2022.
Deshler, T., Hervig, M. E., Hofmann, D. J., Rosen, J. M., and Liley, J. B.: Thirty years of in situ stratospheric aerosol size distribution measurements from Laramie, Wyoming (41° N), using balloon-borne instruments, J. Geophys. Res.-Atmos., 108, https://doi.org/10.1029/2002JD002514, 2003.
Dhomse, S. S., Emmerson, K. M., Mann, G. W., Bellouin, N., Carslaw, K. S., Chipperfield, M. P., Hommel, R., Abraham, N. L., Telford, P., Braesicke, P., Dalvi, M., Johnson, C. E., O'Connor, F., Morgenstern, O., Pyle, J. A., Deshler, T., Zawodny, J. M., and Thomason, L. W.: Aerosol microphysics simulations of the Mt. Pinatubo eruption with the UM-UKCA composition-climate model, Atmos. Chem. Phys., 14, 11221–11246, https://doi.org/10.5194/acp-14-11221-2014, 2014.
Dirmeyer, P. A., Gao, X., Zhao, M., Guo, Z., Oki, T., and Hanasaki, N.: GSWP-2: Multimodel Analysis and Implications for Our Perception of the Land Surface, B. Am. Meteorol. Soc., 87, 1381–1398, https://doi.org/10.1175/BAMS-87-10-1381, 2006.
Dong, B. and Dai, A.: The uncertainties and causes of the recent changes in global evapotranspiration from 1982 to 2010, Clim. Dynam., 49, 279–296, https://doi.org/10.1007/s00382-016-3342-x, 2017.
Dutton, E. G. and Christy, J. R.: Solar radiative forcing at selected locations and evidence for global lower tropospheric cooling following the eruptions of El Chichón and Pinatubo, Geophys. Res. Lett., 19, 2313–2316, https://doi.org/10.1029/92GL02495, 1992.
English, J. M., Toon, O. B., and Mills, M. J.: Microphysical simulations of large volcanic eruptions: Pinatubo and Toba, J. Geophys. Res.-Atmos., 118, 1880–1895, https://doi.org/10.1002/jgrd.50196, 2013.
Farquhar, G. D. and Roderick, M. L.: Pinatubo, Diffuse Light, and the Carbon Cycle, Science, 299, 1997–1998, https://doi.org/10.1126/science.1080681, 2003.
Frölicher, T. L., Joos, F., and Raible, C. C.: Sensitivity of atmospheric CO2 and climate to explosive volcanic eruptions, Biogeosciences, 8, 2317–2339, https://doi.org/10.5194/bg-8-2317-2011, 2011.
Gao, C. Y., Naik, V., Horowitz, L. W., Ginoux, P., Paulot, F., Dunne, J., Mills, M., Aquila, V., and Colarco, P.: Volcanic Drivers of Stratospheric Sulfur in GFDL ESM4, J. Adv. Model. Earth Sy., 15, e2022MS003532, https://doi.org/10.1029/2022MS003532, 2023.
Gao, F., Morisette, J. T., Wolfe, R. E., Ederer, G., Pedelty, J., Masuoka, E., Myneni, R., Tan, B., and Nightingale, J.: An Algorithm to Produce Temporally and Spatially Continuous MODIS-LAI Time Series, IEEE Geosci. Remote S., 5, 60–64, https://doi.org/10.1109/LGRS.2007.907971, 2008.
Gery, M. W., Whitten, G. Z., Killus, J. P., and Dodge, M. C.: A photochemical kinetics mechanism for urban and regional scale computer modeling, J. Geophys. Res.-Atmos., 94, 12925–12956, https://doi.org/10.1029/JD094iD10p12925, 1989.
Gu, G. and Adler, R. F.: Large-scale, inter-annual relations among surface temperature, water vapour and precipitation with and without ENSO and volcano forcings, Int. J. Climatol., 32, 1782–1791, https://doi.org/10.1002/joc.2393, 2012.
Gu, G., Adler, R. F., Huffman, G. J., and Curtis, S.: Tropical Rainfall Variability on Interannual-to-Interdecadal and Longer Time Scales Derived from the GPCP Monthly Product, J. Climate, 20, 4033–4046, https://doi.org/10.1175/JCLI4227.1, 2007.
Gu, L., Baldocchi, D., Verma, S. B., Black, T. A., Vesala, T., Falge, E. M., and Dowty, P. R.: Advantages of diffuse radiation for terrestrial ecosystem productivity, J. Geophys. Res.-Atmos., 107, ACL 2-1–ACL 2-23, https://doi.org/10.1029/2001JD001242, 2002.
Gu, L., Baldocchi, D. D., Wofsy, S. C., Munger, J. W., Michalsky, J. J., Urbanski, S. P., and Boden, T. A.: Response of a Deciduous Forest to the Mount Pinatubo Eruption: Enhanced Photosynthesis, Science, 299, 2035–2038, https://doi.org/10.1126/science.1078366, 2003.
Hane, D. C. and Pumphrey, F. V.: Yield-evapotranspiration relationships and seasonal crop coefficients for frequently irrigated potatoes, Am. Potato J., 61, 661–668, https://doi.org/10.1007/BF02852929, 1984.
Hansen, J., Lacis, A., Ruedy, R., and Sato, M.: Potential climate impact of Mount Pinatubo eruption, Geophys. Res. Lett., 19, 215–218, https://doi.org/10.1029/91GL02788, 1992.
Hansen, J., Sato, M., Ruedy, R., Lacis, A., Asamoah, K., Borenstein, S., Brown, E., Cairns, B., Caliri, G., Campbell, M., Curran, B., de Castro, S., Druyan, L., Fox, M., Johnson, C., Lerner, J., McCormick, M. P., Miller, R., Minnis, P., Morrison, A., Pandolfo, L., Ramberrann, I., Zaucker, F., Robinson, M., Russell, P., Shah, K., Stone, P., Tegen, I., Thomason, L., Wilder, J., and Wilson, H.: A Pinatubo Climate Modeling Investigation, in: The Mount Pinatubo Eruption, Berlin, Heidelberg, 233–272, https://doi.org/10.1007/978-3-642-61173-5_20, 1996.
Hansen, J. E., Lacis, A. A., Lee, P., and Wang, W.-C.: Climatic Effects of Atmospheric Aerosols, Ann. NY Acad. Sci., 338, 575–587, https://doi.org/10.1111/j.1749-6632.1980.tb17151.x, 1980.
Hao, Z., Xiong, D., Zheng, J., Yang, L. E., and Ge, Q.: Volcanic eruptions, successive poor harvests and social resilience over southwest China during the 18–19th century, Environ. Res. Lett., 15, 105011, https://doi.org/10.1088/1748-9326/abb159, 2020.
Hitchman, M. H., McKay, M., and Trepte, C. R.: A climatology of stratospheric aerosol, J. Geophys. Res., 99, 20689–20700, 1994.
Hoesly, R. M., Smith, S. J., Feng, L., Klimont, Z., Janssens-Maenhout, G., Pitkanen, T., Seibert, J. J., Vu, L., Andres, R. J., Bolt, R. M., Bond, T. C., Dawidowski, L., Kholod, N., Kurokawa, J.-I., Li, M., Liu, L., Lu, Z., Moura, M. C. P., O'Rourke, P. R., and Zhang, Q.: Historical (1750–2014) anthropogenic emissions of reactive gases and aerosols from the Community Emissions Data System (CEDS), Geosci. Model Dev., 11, 369–408, https://doi.org/10.5194/gmd-11-369-2018, 2018.
Huhtamaa, H. and Helama, S.: Distant impact: tropical volcanic eruptions and climate-driven agricultural crises in seventeenth-century Ostrobothnia, Finland, J. Hist. Geogr., 57, 40–51, https://doi.org/10.1016/j.jhg.2017.05.011, 2017.
Iles, C. E., Hegerl, G. C., Schurer, A. P., and Zhang, X.: The effect of volcanic eruptions on global precipitation, J. Geophys. Res.-Atmos., 118, 8770–8786, https://doi.org/10.1002/jgrd.50678, 2013.
Ito, G., Romanou, A., Kiang, N. Y., Faluvegi, G., Aleinov, I., Ruedy, R., Russell, G., Lerner, P., Kelley, M., and Lo, K.: Global Carbon Cycle and Climate Feedbacks in the NASA GISS ModelE2.1, J. Adv. Model. Earth Sy., 12, e2019MS002030, https://doi.org/10.1029/2019MS002030, 2020.
Jones, C. D. and Cox, P. M.: Modeling the volcanic signal in the atmospheric CO2 record, Global Biogeochem. Cy., 15, 453–465, https://doi.org/10.1029/2000GB001281, 2001.
Joseph, R. and Zeng, N.: Seasonally Modulated Tropical Drought Induced by Volcanic Aerosol, J. Climate, 24, 2045–2060, https://doi.org/10.1175/2009JCLI3170.1, 2011.
Kandlbauer, J., Hopcroft, P. O., Valdes, P. J., and Sparks, R. S. J.: Climate and carbon cycle response to the 1815 Tambora volcanic eruption, J. Geophys. Res.-Atmos., 118, 12497–12507, https://doi.org/10.1002/2013JD019767, 2013.
Kelley, M., Schmidt, G. A., Nazarenko, L. S., Bauer, S. E., Ruedy, R., Russell, G. L., Ackerman, A. S., Aleinov, I., Bauer, M., Bleck, R., Canuto, V., Cesana, G., Cheng, Y., Clune, T. L., Cook, B. I., Cruz, C. A., Del Genio, A. D., Elsaesser, G. S., Faluvegi, G., Kiang, N. Y., Kim, D., Lacis, A. A., Leboissetier, A., LeGrande, A. N., Lo, K. K., Marshall, J., Matthews, E. E., McDermid, S., Mezuman, K., Miller, R. L., Murray, L. T., Oinas, V., Orbe, C., García-Pando, C. P., Perlwitz, J. P., Puma, M. J., Rind, D., Romanou, A., Shindell, D. T., Sun, S., Tausnev, N., Tsigaridis, K., Tselioudis, G., Weng, E., Wu, J., and Yao, M.-S.: GISS-E2.1: Configurations and Climatology, J. Adv. Model. Earth Sy., 12, e2019MS002025, https://doi.org/10.1029/2019MS002025, 2020.
Keshavarz, M. R., Vazifedoust, M., and Alizadeh, A.: Drought monitoring using a Soil Wetness Deficit Index (SWDI) derived from MODIS satellite data, Agr. Water Manage., 132, 37–45, https://doi.org/10.1016/j.agwat.2013.10.004, 2014.
Kiang, N. Y.: Description of the NASA GISS vegetation dynamics model, Tech. rep., NASA, https://www.giss.nasa.gov/projects/ent/ (last access: 20 November 2025), 2012.
Kiehl, J. T. and Trenberth, K. E.: Earth's Annual Global Mean Energy Budget, B. Am. Meteorol. Soc., 78, 197–208, https://doi.org/10.1175/1520-0477(1997)078<0197:EAGMEB>2.0.CO;2, 1997.
Kim, Y., Moorcroft, P. R., Aleinov, I., Puma, M. J., and Kiang, N. Y.: Variability of phenology and fluxes of water and carbon with observed and simulated soil moisture in the Ent Terrestrial Biosphere Model (Ent TBM version 1.0.1.0.0), Geosci. Model Dev., 8, 3837–3865, https://doi.org/10.5194/gmd-8-3837-2015, 2015.
Kinne, S., Toon, O. B., and Prather, M. J.: Buffering of stratospheric circulation by changing amounts of tropical ozone – a Pinatubo case study, Geophys. Res. Lett., 19, 1927–1930, https://doi.org/10.1029/92GL01937, 1992.
Kirchner, I., Stenchikov, G. L., Graf, H.-F., Robock, A., and Antuña, J. C.: Climate model simulation of winter warming and summer cooling following the 1991 Mount Pinatubo volcanic eruption, J. Geophys. Res.-Atmos., 104, 19039–19055, https://doi.org/10.1029/1999JD900213, 1999.
Krakauer, N. Y. and Randerson, J. T.: Do volcanic eruptions enhance or diminish net primary production? Evidence from tree rings, Global Biogeochem. Cy., 17, https://doi.org/10.1029/2003GB002076, 2003.
Kremser, S., Thomason, L. W., von Hobe, M., Hermann, M., Deshler, T., Timmreck, C., Toohey, M., Stenke, A., Schwarz, J. P., Weigel, R., Fueglistaler, S., Prata, F. J., Vernier, J.-P., Schlager, H., Barnes, J. E., Antuña-Marrero, J.-C., Fairlie, D., Palm, M., Mahieu, E., Notholt, J., Rex, M., Bingen, C., Vanhellemont, F., Bourassa, A., Plane, J. M. C., Klocke, D., Carn, S. A., Clarisse, L., Trickl, T., Neely, R., James, A. D., Rieger, L., Wilson, J. C., and Meland, B.: Stratospheric aerosol – Observations, processes, and impact on climate, R. Geophys., 54, 278–335, https://doi.org/10.1002/2015RG000511, 2016.
Labitzke, K. and McCormick, M. P.: Stratospheric temperature increases due to Pinatubo aerosols, Geophys. Res. Lett., 19, 207–210, https://doi.org/10.1029/91GL02940, 1992.
Lacis, A.: Volcanic aerosol radiative properties, PAGES Mag., 23, 50–51, https://doi.org/10.22498/pages.23.2.50, 2015.
Lacis, A., Hansen, J., and Sato, M.: Climate forcing by stratospheric aerosols, Geophys. Res. Lett., 19, 1607–1610, https://doi.org/10.1029/92GL01620, 1992.
Lacis, A. A. and Hansen, J.: A Parameterization for the Absorption of Solar Radiation in the Earth's Atmosphere, Journal of the Atmospheric Sciences, 31, 118–133, https://doi.org/10.1175/1520-0469(1974)031<0118:APFTAO>2.0.CO;2, 1974.
Lawrence, D. M., Thornton, P. E., Oleson, K. W., and Bonan, G. B.: The Partitioning of Evapotranspiration into Transpiration, Soil Evaporation, and Canopy Evaporation in a GCM: Impacts on Land–Atmosphere Interaction, J. Hydrometeorol., 8, 862–880, https://doi.org/10.1175/JHM596.1, 2007.
LeGrande, A. N., Tsigaridis, K., and Bauer, S. E.: Role of atmospheric chemistry in the climate impacts of stratospheric volcanic injections, Nat. Geosci., 9, 652–655, https://doi.org/10.1038/ngeo2771, 2016.
Liu, F., Chai, J., Wang, B., Liu, J., Zhang, X., and Wang, Z.: Global monsoon precipitation responses to large volcanic eruptions, Sci. Rep., 6, 24331, https://doi.org/10.1038/srep24331, 2016.
Lobell, D. B. and Field, C. B.: Global scale climate–crop yield relationships and the impacts of recent warming, Environ. Res. Lett., 2, 014002, https://doi.org/10.1088/1748-9326/2/1/014002, 2007.
Lucht, W., Prentice, I. C., Myneni, R. B., Sitch, S., Friedlingstein, P., Cramer, W., Bousquet, P., Buermann, W., and Smith, B.: Climatic Control of the High-Latitude Vegetation Greening Trend and Pinatubo Effect, Science, 296, 1687–1689, https://doi.org/10.1126/science.1071828, 2002.
Manning, J. G., Ludlow, F., Stine, A. R., Boos, W. R., Sigl, M., and Marlon, J. R.: Volcanic suppression of Nile summer flooding triggers revolt and constrains interstate conflict in ancient Egypt, Nat. Commun., 8, 900, https://doi.org/10.1038/s41467-017-00957-y, 2017.
Marshall, L. R., Maters, E. C., Schmidt, A., Timmreck, C., Robock, A., and Toohey, M.: Volcanic effects on climate: recent advances and future avenues, B. Volcanol, 84, 54, https://doi.org/10.1007/s00445-022-01559-3, 2022.
McDermid, S. S., Montes, C., Cook, B. I., Puma, M. J., Kiang, N. Y., and Aleinov, I.: The Sensitivity of Land–Atmosphere Coupling to Modern Agriculture in the Northern Midlatitudes, J. Climate, 32, 465–484, https://doi.org/10.1175/JCLI-D-17-0799.1, 2019.
McDermid, S. S., Weng, E., Puma, M., Cook, B., Hengl, T., Sanderman, J., Lannoy, G. J. M. D., and Aleinov, I.: Soil Carbon Losses Reduce Soil Moisture in Global Climate Model Simulations, Earth Interact., 26, 195–208, https://doi.org/10.1175/EI-D-22-0003.1, 2022.
McGraw, Z. and Polvani, L. M.: How Volcanic Aerosols Globally Inhibit Precipitation, Geophys. Res. Lett., 51, e2023GL107930, https://doi.org/10.1029/2023GL107930, 2024.
McKee, T. B., Doesken, N. J., and Kleist, J.: The Relationship of Drought Frequency and Duration to Time Scales, in: 8th Conference on Applied Climatology, Anaheim, 17–22 January 1993, 179–184, 1993.
Miller, R. L., Cakmur, R. V., Perlwitz, J., Geogdzhayev, I. V., Ginoux, P., Koch, D., Kohfeld, K. E., Prigent, C., Ruedy, R., Schmidt, G. A., and Tegen, I.: Mineral dust aerosols in the NASA Goddard Institute for Space Sciences ModelE atmospheric general circulation model, J. Geophys. Res.-Atmos., 111, https://doi.org/10.1029/2005JD005796, 2006.
Miller, R. L., Schmidt, G. A., Nazarenko, L. S., Bauer, S. E., Kelley, M., Ruedy, R., Russell, G. L., Ackerman, A. S., Aleinov, I., Bauer, M., Bleck, R., Canuto, V., Cesana, G., Cheng, Y., Clune, T. L., Cook, B. I., Cruz, C. A., Del Genio, A. D., Elsaesser, G. S., Faluvegi, G., Kiang, N. Y., Kim, D., Lacis, A. A., Leboissetier, A., LeGrande, A. N., Lo, K. K., Marshall, J., Matthews, E. E., McDermid, S., Mezuman, K., Murray, L. T., Oinas, V., Orbe, C., Pérez García-Pando, C., Perlwitz, J. P., Puma, M. J., Rind, D., Romanou, A., Shindell, D. T., Sun, S., Tausnev, N., Tsigaridis, K., Tselioudis, G., Weng, E., Wu, J., and Yao, M.-S.: CMIP6 Historical Simulations (1850–2014) With GISS-E2.1, J. Adv. Model. Earth Sy., 13, e2019MS002034, https://doi.org/10.1029/2019MS002034, 2021.
Milly, P. C. D. and Dunne, K. A.: Potential evapotranspiration and continental drying, Nat. Clim. Change, 6, 946–949, https://doi.org/10.1038/nclimate3046, 2016.
Minnis, P., Harrison, E. F., Stowe, L. L., Gibson, G. G., Denn, F. M., Doelling, D. R., and Smith, W. L.: Radiative Climate Forcing by the Mount Pinatubo Eruption, Science, 259, 1411–1415, https://doi.org/10.1126/science.259.5100.1411, 1993.
Mintz, Y. and Walker, G. K.: Global Fields of Soil Moisture and Land Surface Evapotranspiration Derived from Observed Precipitation and Surface Air Temperature, J. Appl. Meteorol. Clim., 32, 1305–1334, https://doi.org/10.1175/1520-0450(1993)032<1305:GFOSMA>2.0.CO;2, 1993.
Mullapudi, A., Vibhute, A. D., Mali, S., and Patil, C. H.: A review of agricultural drought assessment with remote sensing data: methods, issues, challenges and opportunities, Appl. Geomat., 15, 1–13, https://doi.org/10.1007/s12518-022-00484-6, 2023.
Myneni, R. B., Hoffman, S., Knyazikhin, Y., Privette, J. L., Glassy, J., Tian, Y., Wang, Y., Song, X., Zhang, Y., Smith, G. R., Lotsch, A., Friedl, M., Morisette, J. T., Votava, P., Nemani, R. R., and Running, S. W.: Global products of vegetation leaf area and fraction absorbed PAR from year one of MODIS data, Remote Sens. Environ., 83, 214–231, https://doi.org/10.1016/S0034-4257(02)00074-3, 2002.
Narasimhan, B. and Srinivasan, R.: Development and evaluation of Soil Moisture Deficit Index (SMDI) and Evapotranspiration Deficit Index (ETDI) for agricultural drought monitoring, Agr. Forest Meteorol., 133, 69–88, https://doi.org/10.1016/j.agrformet.2005.07.012, 2005.
Neely III, R. R. and Schmidt, A.: VolcanEESM: Global volcanic sulphur dioxide (SO2) emissions database from 1850 to present - Version 1.0, Centre for Environmental Data Analysis [data set], https://doi.org/10.5285/76EBDC0B-0EED-4F70-B89E-55E606BCD568, 2016.
Nemani, R. R., Keeling, C. D., Hashimoto, H., Jolly, W. M., Piper, S. C., Tucker, C. J., Myneni, R. B., and Running, S. W.: Climate-Driven Increases in Global Terrestrial Net Primary Production from 1982 to 1999, Science, 300, 1560–1563, https://doi.org/10.1126/science.1082750, 2003.
Nilson, S. E. and Assmann, S. M.: The Control of Transpiration. Insights from Arabidopsis, Plant Physiol., 143, 19–27, https://doi.org/10.1104/pp.106.093161, 2007.
Olesen, J. E. and Bindi, M.: Consequences of climate change for European agricultural productivity, land use and policy, Eur. J. Agron., 16, 239–262, https://doi.org/10.1016/S1161-0301(02)00004-7, 2002.
Paik, S., Min, S.-K., Iles, C. E., Fischer, E. M., and Schurer, A. P.: Volcanic-induced global monsoon drying modulated by diverse El Niño responses, Science Advances, 6, eaba1212, https://doi.org/10.1126/sciadv.aba1212, 2020.
Palmer, W. C.: Meteorological Drought, Office of Climatology Research Paper 45, US Weather Bureau, Washington, DC, pp. 1–58, 1965.
Palmer, W. C.: Keeping Track of Crop Moisture Conditions, Nationwide: The New Crop Moisture Index, Weatherwise, 21, 156–161, https://doi.org/10.1080/00431672.1968.9932814, 1968.
Pan, F., Nieswiadomy, M., and Qian, S.: Application of a soil moisture diagnostic equation for estimating root-zone soil moisture in arid and semi-arid regions, J. Hydrol., 524, 296–310, https://doi.org/10.1016/j.jhydrol.2015.02.044, 2015.
Parker, D. E., Wilson, H., Jones, P. D., Christy, J. R., and Folland, C. K.: The Impact of Mount Pinatubo on World-Wide Temperatures, Int. J. Climatol., 16, 487–497, https://doi.org/10.1002/(SICI)1097-0088(199605)16:5<487::AID-JOC39>3.0.CO;2-J, 1996.
Polvani, L. M., Banerjee, A., and Schmidt, A.: Northern Hemisphere continental winter warming following the 1991 Mt. Pinatubo eruption: reconciling models and observations, Atmos. Chem. Phys., 19, 6351–6366, https://doi.org/10.5194/acp-19-6351-2019, 2019.
Proctor, J., Hsiang, S., Burney, J., Burke, M., and Schlenker, W.: Estimating global agricultural effects of geoengineering using volcanic eruptions, Nature, 560, 480–483, https://doi.org/10.1038/s41586-018-0417-3, 2018.
Ramachandran, S., Ramaswamy, V., Stenchikov, G. L., and Robock, A.: Radiative impact of the Mount Pinatubo volcanic eruption: Lower stratospheric response, J. Geophys. Res.-Atmos., 105, 24409–24429, https://doi.org/10.1029/2000JD900355, 2000.
Robock, A.: Volcanic eruptions and climate, Rev. Geophys., 38, 191–219, https://doi.org/10.1029/1998RG000054, 2000.
Robock, A.: Cooling following large volcanic eruptions corrected for the effect of diffuse radiation on tree rings, Geophys. Res. Lett., 32, https://doi.org/10.1029/2004GL022116, 2005.
Robock, A. and Liu, Y.: The Volcanic Signal in Goddard Institute for Space Studies Three-Dimensional Model Simulations, J. Climate, 7, 44–55, https://doi.org/10.1175/1520-0442(1994)007<0044:TVSIGI>2.0.CO;2, 1994.
Rogers, H. L., Norton, W. A., Lambert, A., and Grainger, R. G.: Transport of Mt. Pinatubo aerosol by tropospheric synoptic-scale and stratospheric planetary-scale waves, Q. J. Roy. Meteor. Soc., 124, 193–209, https://doi.org/10.1002/qj.49712454509, 1998.
Rosenzweig, C. and Abramopoulos, F.: Land-Surface Model Development for the GISS GCM, J. Climate, 10, 2040–2054, https://doi.org/10.1175/1520-0442(1997)010<2040:LSMDFT>2.0.CO;2, 1997.
Rosenzweig, C. and Parry, M. L.: Potential impact of climate change on world food supply, Nature, 367, 133–138, https://doi.org/10.1038/367133a0, 1994.
Sato, M., Hansen, J. E., McCormick, M. P., and Pollack, J. B.: Stratospheric aerosol optical depths, 1850–1990, J. Geophys. Res.-Atmos., 98, 22987–22994, https://doi.org/10.1029/93JD02553, 1993.
Scheff, J. and Frierson, D. M. W.: Terrestrial Aridity and Its Response to Greenhouse Warming across CMIP5 Climate Models, J. Climate, 28, 5583–5600, https://doi.org/10.1175/JCLI-D-14-00480.1, 2015.
Seneviratne, S. I., Corti, T., Davin, E. L., Hirschi, M., Jaeger, E. B., Lehner, I., Orlowsky, B., and Teuling, A. J.: Investigating soil moisture–climate interactions in a changing climate: A review, Earth-Sci. Rev., 99, 125–161, https://doi.org/10.1016/j.earscirev.2010.02.004, 2010.
Sheng, J.-X., Weisenstein, D. K., Luo, B.-P., Rozanov, E., Arfeuille, F., and Peter, T.: A perturbed parameter model ensemble to investigate Mt. Pinatubo's 1991 initial sulfur mass emission, Atmos. Chem. Phys., 15, 11501–11512, https://doi.org/10.5194/acp-15-11501-2015, 2015a.
Sheng, J.-X., Weisenstein, D. K., Luo, B.-P., Rozanov, E., Stenke, A., Anet, J., Bingemer, H., and Peter, T.: Global atmospheric sulfur budget under volcanically quiescent conditions: Aerosol-chemistry-climate model predictions and validation, J. Geophys. Res.-Atmos., 120, 256–276, https://doi.org/10.1002/2014JD021985, 2015b.
Shindell, D. T.: Climate and ozone response to increased stratospheric water vapor, Geophys. Res. Lett., 28, 1551–1554, https://doi.org/10.1029/1999GL011197, 2001.
Shindell, D. T., Faluvegi, G., and Bell, N.: Preindustrial-to-present-day radiative forcing by tropospheric ozone from improved simulations with the GISS chemistry-climate GCM, Atmos. Chem. Phys., 3, 1675–1702, https://doi.org/10.5194/acp-3-1675-2003, 2003.
Shindell, D. T., Faluvegi, G., Unger, N., Aguilar, E., Schmidt, G. A., Koch, D. M., Bauer, S. E., and Miller, R. L.: Simulations of preindustrial, present-day, and 2100 conditions in the NASA GISS composition and climate model G-PUCCINI, Atmos. Chem. Phys., 6, 4427–4459, https://doi.org/10.5194/acp-6-4427-2006, 2006.
Simard, M., Pinto, N., Fisher, J. B., and Baccini, A.: Mapping forest canopy height globally with spaceborne lidar, J. Geophys. Res.-Biogeo., 116, https://doi.org/10.1029/2011JG001708, 2011.
Singh, R. and AchutaRao, K.: Quantifying uncertainty in twenty-first century climate change over India, Clim. Dynam., 52, 3905–3928, https://doi.org/10.1007/s00382-018-4361-6, 2019.
Singh, R., Tsigaridis, K., LeGrande, A. N., Ludlow, F., and Manning, J. G.: Investigating hydroclimatic impacts of the 168–158 BCE volcanic quartet and their relevance to the Nile River basin and Egyptian history, Clim. Past, 19, 249–275, https://doi.org/10.5194/cp-19-249-2023, 2023.
Singh, R., Tsigaridis, K., Bull, D., Swiler, L. P., Wagman, B. M., and Marvel, K.: Pinatubo's effect on the moisture-based drivers of plant productivity, Zenodo [data set], https://doi.org/10.5281/zenodo.12734905, 2024.
Stenchikov, G. L., Kirchner, I., Robock, A., Graf, H.-F., Antuña, J. C., Grainger, R. G., Lambert, A., and Thomason, L.: Radiative forcing from the 1991 Mount Pinatubo volcanic eruption, J. Geophys. Res.-Atmos., 103, 13837–13857, https://doi.org/10.1029/98JD00693, 1998.
Tejedor, E., Steiger, N. J., Smerdon, J. E., Serrano-Notivoli, R., and Vuille, M.: Global hydroclimatic response to tropical volcanic eruptions over the last millennium, P. Natl. Acad. Sci. USA, 118, e2019145118, https://doi.org/10.1073/pnas.2019145118, 2021.
Thornthwaite, C. W.: An Approach toward a Rational Classification of Climate, Geogr. Rev., 38, 55–94, https://doi.org/10.2307/210739, 1948.
Timmreck, C.: Modeling the climatic effects of large explosive volcanic eruptions, WIREs Climate Change, 3, 545–564, https://doi.org/10.1002/wcc.192, 2012.
Timmreck, C., Graf, H.-F., and Feichter, J.: Simulation of Mt. Pinatubo Volcanic Aerosol with the Hamburg Climate Model ECHAM4, Theor. Appl. Climatol., 62, 85–108, https://doi.org/10.1007/s007040050076, 1999.
Toohey, M., Krüger, K., Sigl, M., Stordal, F., and Svensen, H.: Climatic and societal impacts of a volcanic double event at the dawn of the Middle Ages, Climatic Change, 136, 401–412, https://doi.org/10.1007/s10584-016-1648-7, 2016.
Toohey, M., Krüger, K., Schmidt, H., Timmreck, C., Sigl, M., Stoffel, M., and Wilson, R.: Disproportionately strong climate forcing from extratropical explosive volcanic eruptions, Nat. Geosci., 12, 100–107, https://doi.org/10.1038/s41561-018-0286-2, 2019.
Trenberth, K. E. and Dai, A.: Effects of Mount Pinatubo volcanic eruption on the hydrological cycle as an analog of geoengineering, Geophys. Res. Lett., 34, https://doi.org/10.1029/2007GL030524, 2007.
Trenberth, K. E. and Stepaniak, D. P.: The flow of energy through the earth's climate system, Q. J. Roy. Meteor. Soc., 130, 2677–2701, https://doi.org/10.1256/qj.04.83, 2004.
Trenberth, K. E., Fasullo, J. T., and Kiehl, J.: Earth's Global Energy Budget, B. Am. Meteorol. Soc., 90, 311–324, https://doi.org/10.1175/2008BAMS2634.1, 2009.
Trepte, C. R., Veiga, R. E., and McCormick, M. P.: The poleward dispersal of Mount Pinatubo volcanic aerosol, J. Geophys. Res.-Atmos., 98, 18563–18573, https://doi.org/10.1029/93JD01362, 1993.
van der Werf, G. R., Randerson, J. T., Giglio, L., van Leeuwen, T. T., Chen, Y., Rogers, B. M., Mu, M., van Marle, M. J. E., Morton, D. C., Collatz, G. J., Yokelson, R. J., and Kasibhatla, P. S.: Global fire emissions estimates during 1997–2016, Earth Syst. Sci. Data, 9, 697–720, https://doi.org/10.5194/essd-9-697-2017, 2017.
van Dijk, E., Mørkestøl Gundersen, I., de Bode, A., Høeg, H., Loftsgarden, K., Iversen, F., Timmreck, C., Jungclaus, J., and Krüger, K.: Climatic and societal impacts in Scandinavia following the 536 and 540 CE volcanic double event, Clim. Past, 19, 357–398, https://doi.org/10.5194/cp-19-357-2023, 2023.
van Marle, M. J. E., Kloster, S., Magi, B. I., Marlon, J. R., Daniau, A.-L., Field, R. D., Arneth, A., Forrest, M., Hantson, S., Kehrwald, N. M., Knorr, W., Lasslop, G., Li, F., Mangeon, S., Yue, C., Kaiser, J. W., and van der Werf, G. R.: Historic global biomass burning emissions for CMIP6 (BB4CMIP) based on merging satellite observations with proxies and fire models (1750–2015), Geosci. Model Dev., 10, 3329–3357, https://doi.org/10.5194/gmd-10-3329-2017, 2017.
Vehkamäki, H., Kulmala, M., Napari, I., Lehtinen, K. E. J., Timmreck, C., Noppel, M., and Laaksonen, A.: An improved parameterization for sulfuric acid–water nucleation rates for tropospheric and stratospheric conditions, J. Geophys. Res.- Atmos., 107, AAC 3-1-AAC 3-10, https://doi.org/10.1029/2002JD002184, 2002.
Wada, Y., Wisser, D., Eisner, S., Flörke, M., Gerten, D., Haddeland, I., Hanasaki, N., Masaki, Y., Portmann, F. T., Stacke, T., Tessler, Z., and Schewe, J.: Multimodel projections and uncertainties of irrigation water demand under climate change, Geophys. Res. Lett., 40, 4626–4632, https://doi.org/10.1002/grl.50686, 2013.
Weng, E., Aleinov, I., Singh, R., Puma, M. J., McDermid, S. S., Kiang, N. Y., Kelley, M., Wilcox, K., Dybzinski, R., Farrior, C. E., Pacala, S. W., and Cook, B. I.: Modeling demographic-driven vegetation dynamics and ecosystem biogeochemical cycling in NASA GISS's Earth system model (ModelE-BiomeE v.1.0), Geosci. Model Dev., 15, 8153–8180, https://doi.org/10.5194/gmd-15-8153-2022, 2022.
Wisser, D., Fekete, B. M., Vörösmarty, C. J., and Schumann, A. H.: Reconstructing 20th century global hydrography: a contribution to the Global Terrestrial Network- Hydrology (GTN-H), Hydrol. Earth Syst. Sci., 14, 1–24, https://doi.org/10.5194/hess-14-1-2010, 2010.
Zuo, M., Zhou, T., and Man, W.: Hydroclimate Responses over Global Monsoon Regions Following Volcanic Eruptions at Different Latitudes, J. Climate, 32, 4367–4385, https://doi.org/10.1175/JCLI-D-18-0707.1, 2019a.
Zuo, M., Zhou, T., and Man, W.: Wetter Global Arid Regions Driven by Volcanic Eruptions, J. Geophys. Res.-Atmos., 124, 13648–13662, https://doi.org/10.1029/2019JD031171, 2019b.