the Creative Commons Attribution 4.0 License.
the Creative Commons Attribution 4.0 License.
 | 21 Nov 2025
Conflict-induced ship traffic disruptions constrain cloud sensitivity to stricter marine pollution regulations
Lili F. Boss
Starting in November 2023, the Houthi militia occupying northwestern Yemen has attacked ships passing through the Bab al-Mandab Strait, a chokepoint on the Europe-Asia route via the Suez Canal. Cargo ship traffic through the Red Sea has since plummeted, with ships instead taking the longer route around the Cape of Good Hope. The increase in traffic in the southeastern Atlantic Ocean is readily apparent in satellite retrievals of nitrogen dioxide. Within the stratocumulus deck covering much of the southeastern Atlantic, a previously detectible cloud microphysical perturbation due to ship pollution had largely disappeared following the International Maritime Organization's sulfur-limiting regulations in 2020 but returns during 2024 due to the increase in ship traffic despite the lower cloud brightening efficacy per ship. Because nitrogen dioxide pollution per unit of fuel oil burned is not affected by switching to low-sulfur fuel, quantifying the ratio of shipping-enhanced cloud droplet number and nitrogen dioxide concentrations before and after the fuel sulfur limits went into effect provides a constraint on the cloud changes from the regulations. We find that the ∼ 80 % reduction in sulfur emissions leads to a ∼ 67 % reduction in the increase in cloud droplet number concentration per unit marine fuel oil burned.
- Article
(5414 KB) - Full-text XML
- Companion paper
- BibTeX
- EndNote


How clouds respond to changes in airborne particles (aerosols) is the single largest source of uncertainty in quantifying the anthropogenic perturbation to Earth's radiation budget (Bellouin et al., 2020; Forster et al., 2021). Ship tracks, curvilinear streaks of brighter clouds trailing ship smokestacks (Conover, 1966), are the quintessential example of a “natural experiment” in aerosol–cloud interactions (Christensen et al., 2022) as they provide compelling causal evidence for aerosol effects on cloud properties with a very limited role for meteorological confounding over the order 10 km width of a typical track (Durkee et al., 2000). Ship-emitted aerosol particles that are large and/or hygroscopic enough to serve as cloud condensation nuclei (CCN) increase cloud droplet number concentration (Nd); for a given amount of cloud water, this results in brighter clouds that can reflect more sunlight back to space and produce a cooling effect (Twomey, 1977). Macrophysical adjustments to this change in cloud microphysics can enhance the cooling by reducing drizzle, thus increasing cloud coverage (Albrecht, 1989; Radke et al., 1989; Yuan et al., 2023), or counteract it by encouraging greater turbulent entrainment of dry above-cloud air into the marine boundary layer, thus reducing cloud thickness (Chen et al., 2012; Coakley and Walsh, 2002; Toll et al., 2019).
Starting in January 2020, marine fuel sulfur content restrictions from the International Maritime Organization (IMO 2020) have resulted in an approximately 80 % reduction in sulfur emissions (Diamond, 2023), decreasing the size and hygroscopicity of the remaining aerosol particles and thus their ability to act as CCN (Petzold et al., 2010). Decreases in the detection of ship tracks over open oceans (Watson-Parris et al., 2022; Yuan et al., 2022) and the near disappearance of detectible cloud microphysical perturbations within an isolated shipping corridor in the southeast Atlantic (Benas et al., 2025; Diamond, 2023) have been observed. However, the estimated magnitude of the IMO 2020 effect ranges from ∼ 15 %–75 % depending on the study, quantity assessed, and methodology (Gettelman et al., 2024); estimates near both ends of this range have been reported in studies using air-mass tracking (Gryspeerdt et al., 2019; Manshausen et al., 2023) or computer vision algorithms (Watson-Parris et al., 2022; Yuan et al., 2022) to identify ship perturbations after IMO 2020 or earlier, regional pollution limits went into effect and internally within Diamond (2023) depending on the season and variable analyzed.
An opportunity to better constrain the effect of the IMO 2020 has arisen from an unlikely source: substantial changes in ship traffic patterns following Houthi militia attacks on merchant vessels transiting through the Bab al-Mandab Strait connecting the Indian Ocean and Mediterranean Sea via the Suez Canal (Raydan and Nadimi, 2025). Analysis of satellite-derived (van Geffen et al., 2022; Veefkind et al., 2012) tropospheric columns of nitrogen dioxide (NO2) has revealed clear decreases in ship traffic in the Red Sea and increases around the Cape of Good Hope following the commencement of hostilities in November 2023 (Pseftogkas et al., 2024), consistent with rerouting cargo ships around Africa to avoid the Suez Canal. Because nitrogen oxide (NOx) production is dominated by high temperatures during combustion and is largely unaffected by fuel content or the installation of sulfur scrubbers, if shipping NO2 perturbations and cloud microphysical changes in the southeastern Atlantic stratocumulus deck could be quantified both before IMO 2020 and after the increase in traffic due to the Red Sea crisis, their ratio would provide an estimate of the cloud altering effects per unit marine fuel burned pre- and post-regulation.
Figure 1 contrasts column NO2 concentrations from September-October 2023 and 2024 observed by the TROPOspheric Monitoring Instrument (TROPOMI; van Geffen et al., 2022) over the Red Sea (a, b) and southeast Atlantic (c, d). Decreased ship activity in the Red Sea and the related increase in the southeast Atlantic from 2023 to 2024 is readily visible; shipping corridors are difficult to discern in the southeast Atlantic in 2023 but are clear after the Houthi attacks began (and vice versa for the Red Sea). Because NO2 is difficult to retrieve in the overcast conditions characteristic of the stratocumulus deck (red box in Fig. 1d), the NO2 perturbation from shipping is quantified including less cloudy regions to the north (blue box in Fig. 1d; see Methods in Appendix A).
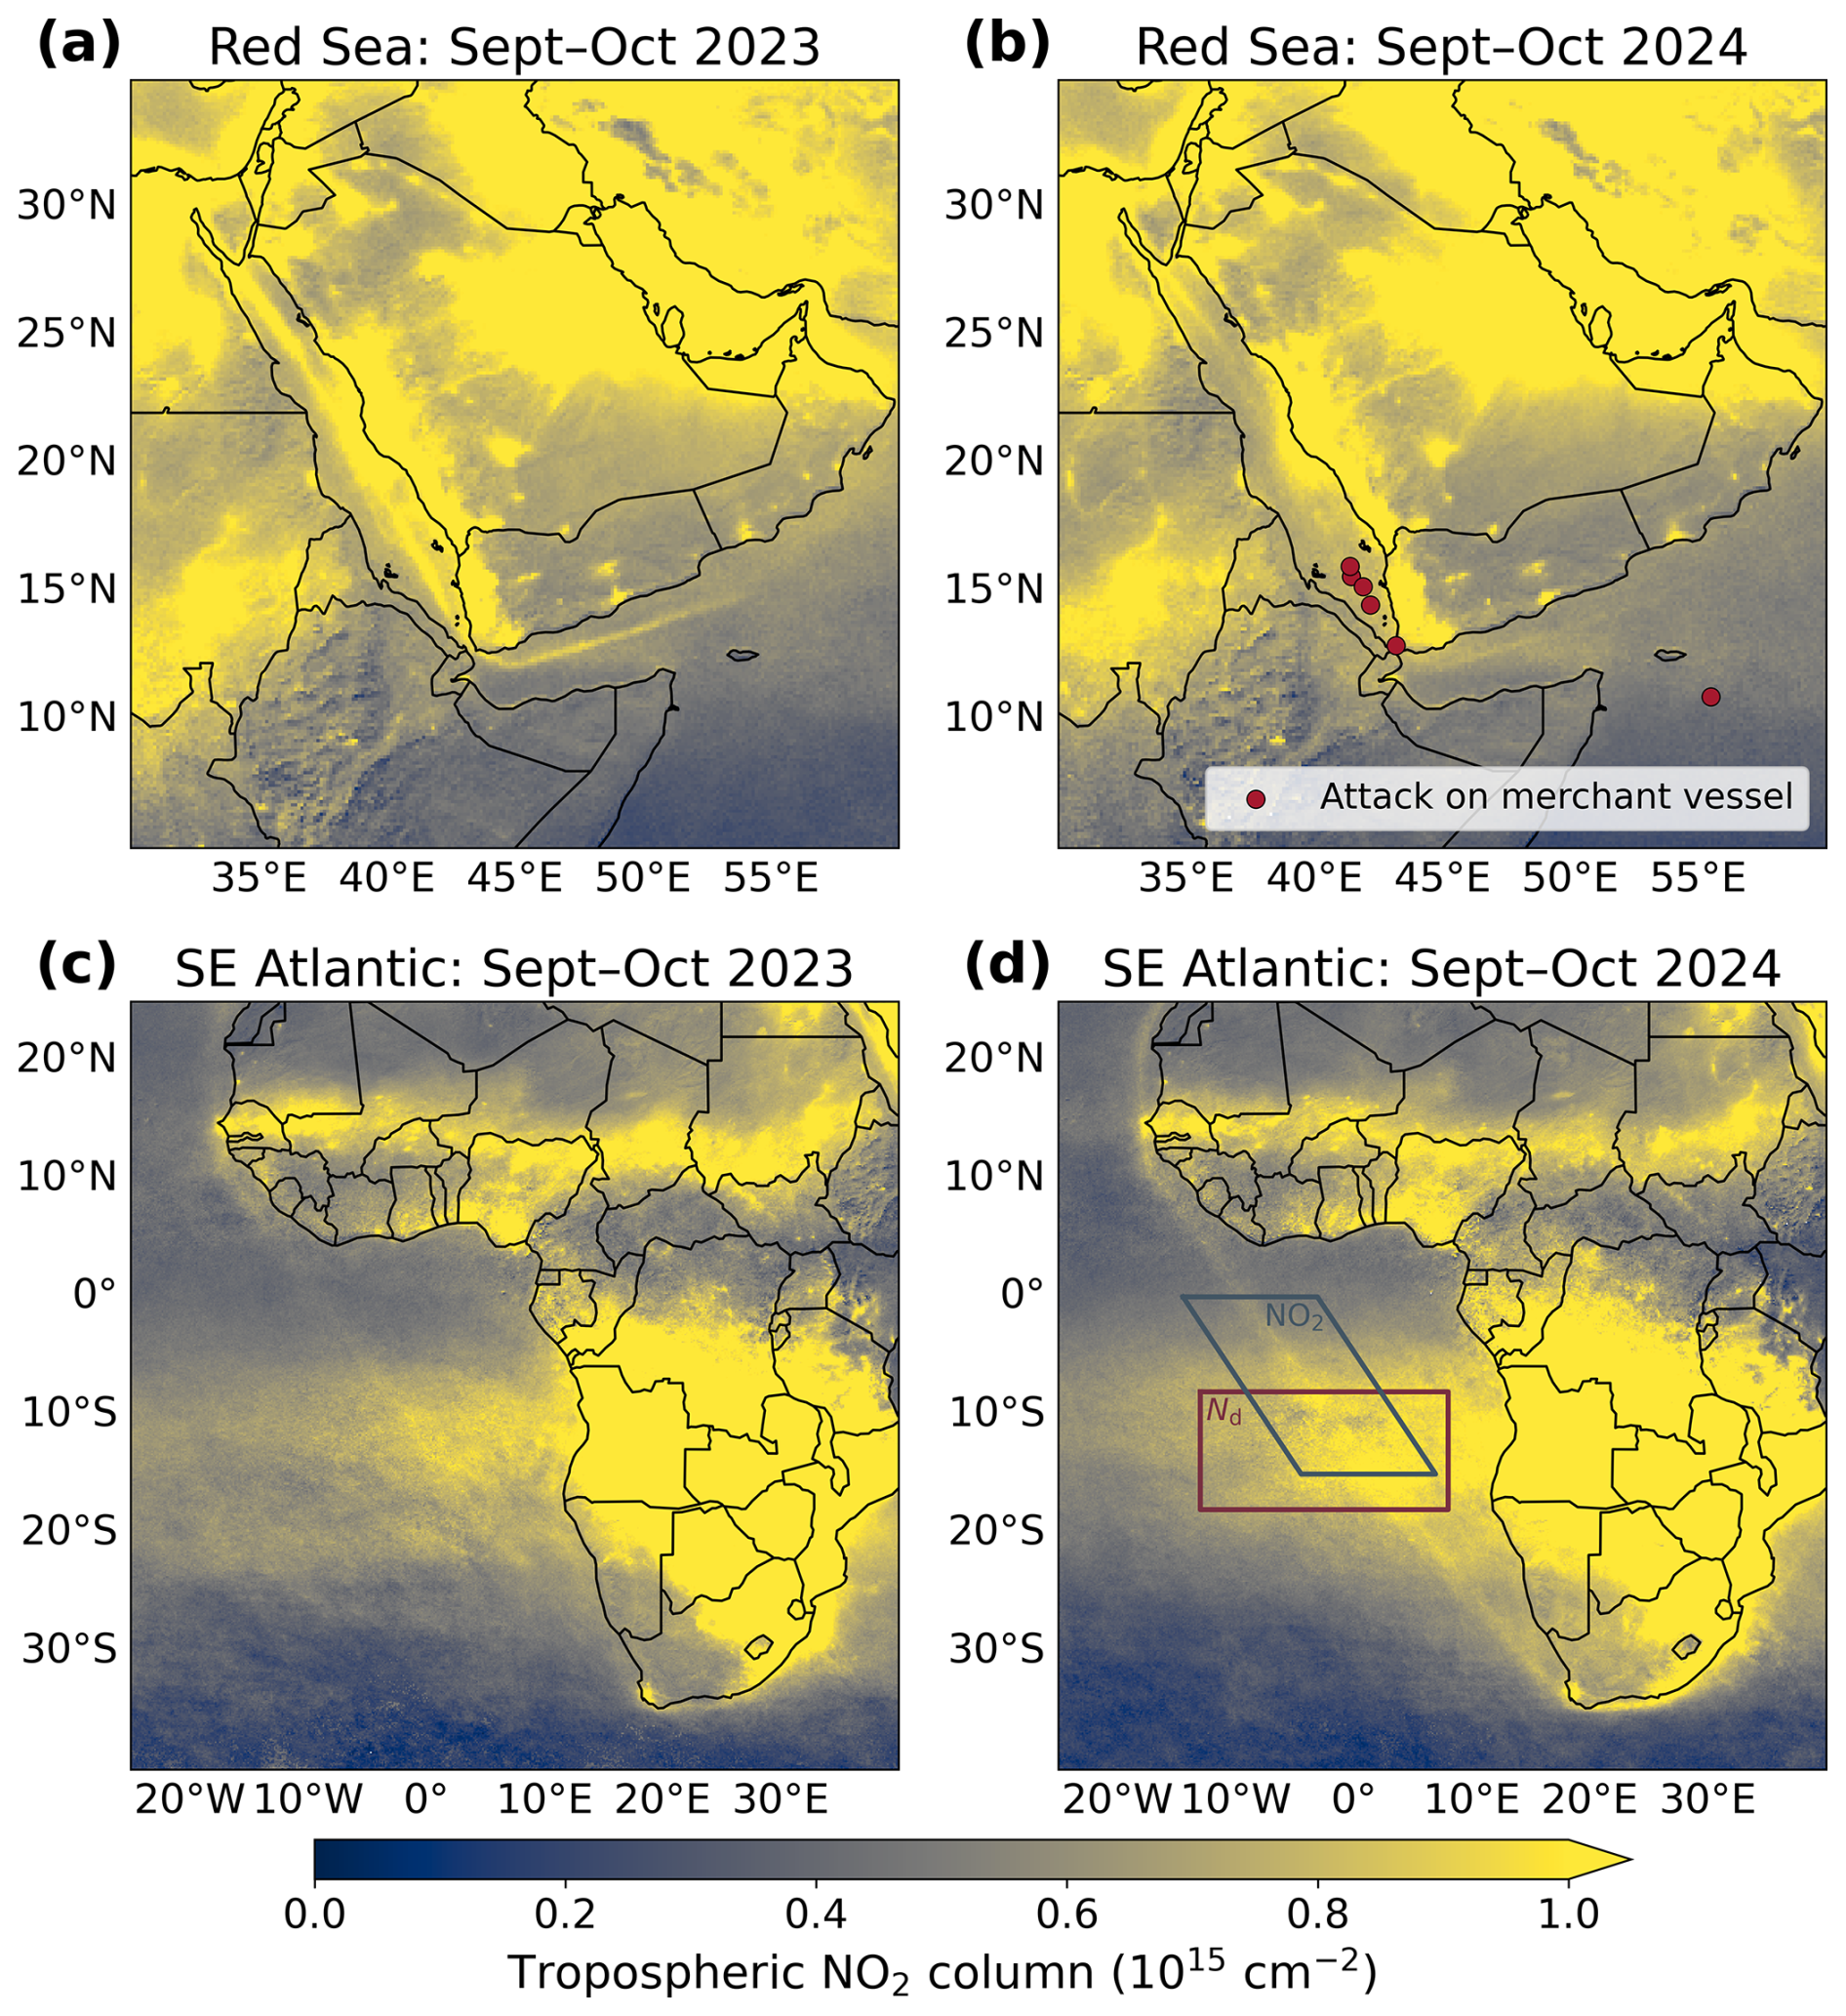
Figure 1TROPOMI NO2 values in the Red Sea (a, b) and southeast Atlantic (c, d) before (a, c) and after (b, d) the Red Sea crisis. Red markers (b) represent locations of attacks on merchant vessels during September–October 2024. Boxes in panel (d) indicate the analysis domains for the NO2 (blue) and Nd (red) data.
The 2024 NO2 perturbation clearly stands out as greater than prior years (Fig. 2a). Essentially no change is seen during the peak of the COVID-19 pandemic in 2020, in line with previous work suggesting minimal ship traffic disruptions in the region (March et al., 2021). Consistent with prior results for the shipping corridor cutting through the southeastern Atlantic stratocumulus deck (Benas et al., 2025; Diamond, 2023; Diamond et al., 2020; Hu et al., 2021), the relative Nd perturbation (Δln Nd) from the Visible Infrared Imaging Radiometer Suite (VIIRS) on NOAA-20 (Fig. 2b; see Methods in Appendix A) is 5 %–10 % before 2020 and indistinguishable from zero afterward, until rebounding to ∼ 6 % (95 % confidence interval: 3 %–9 %) in 2024.
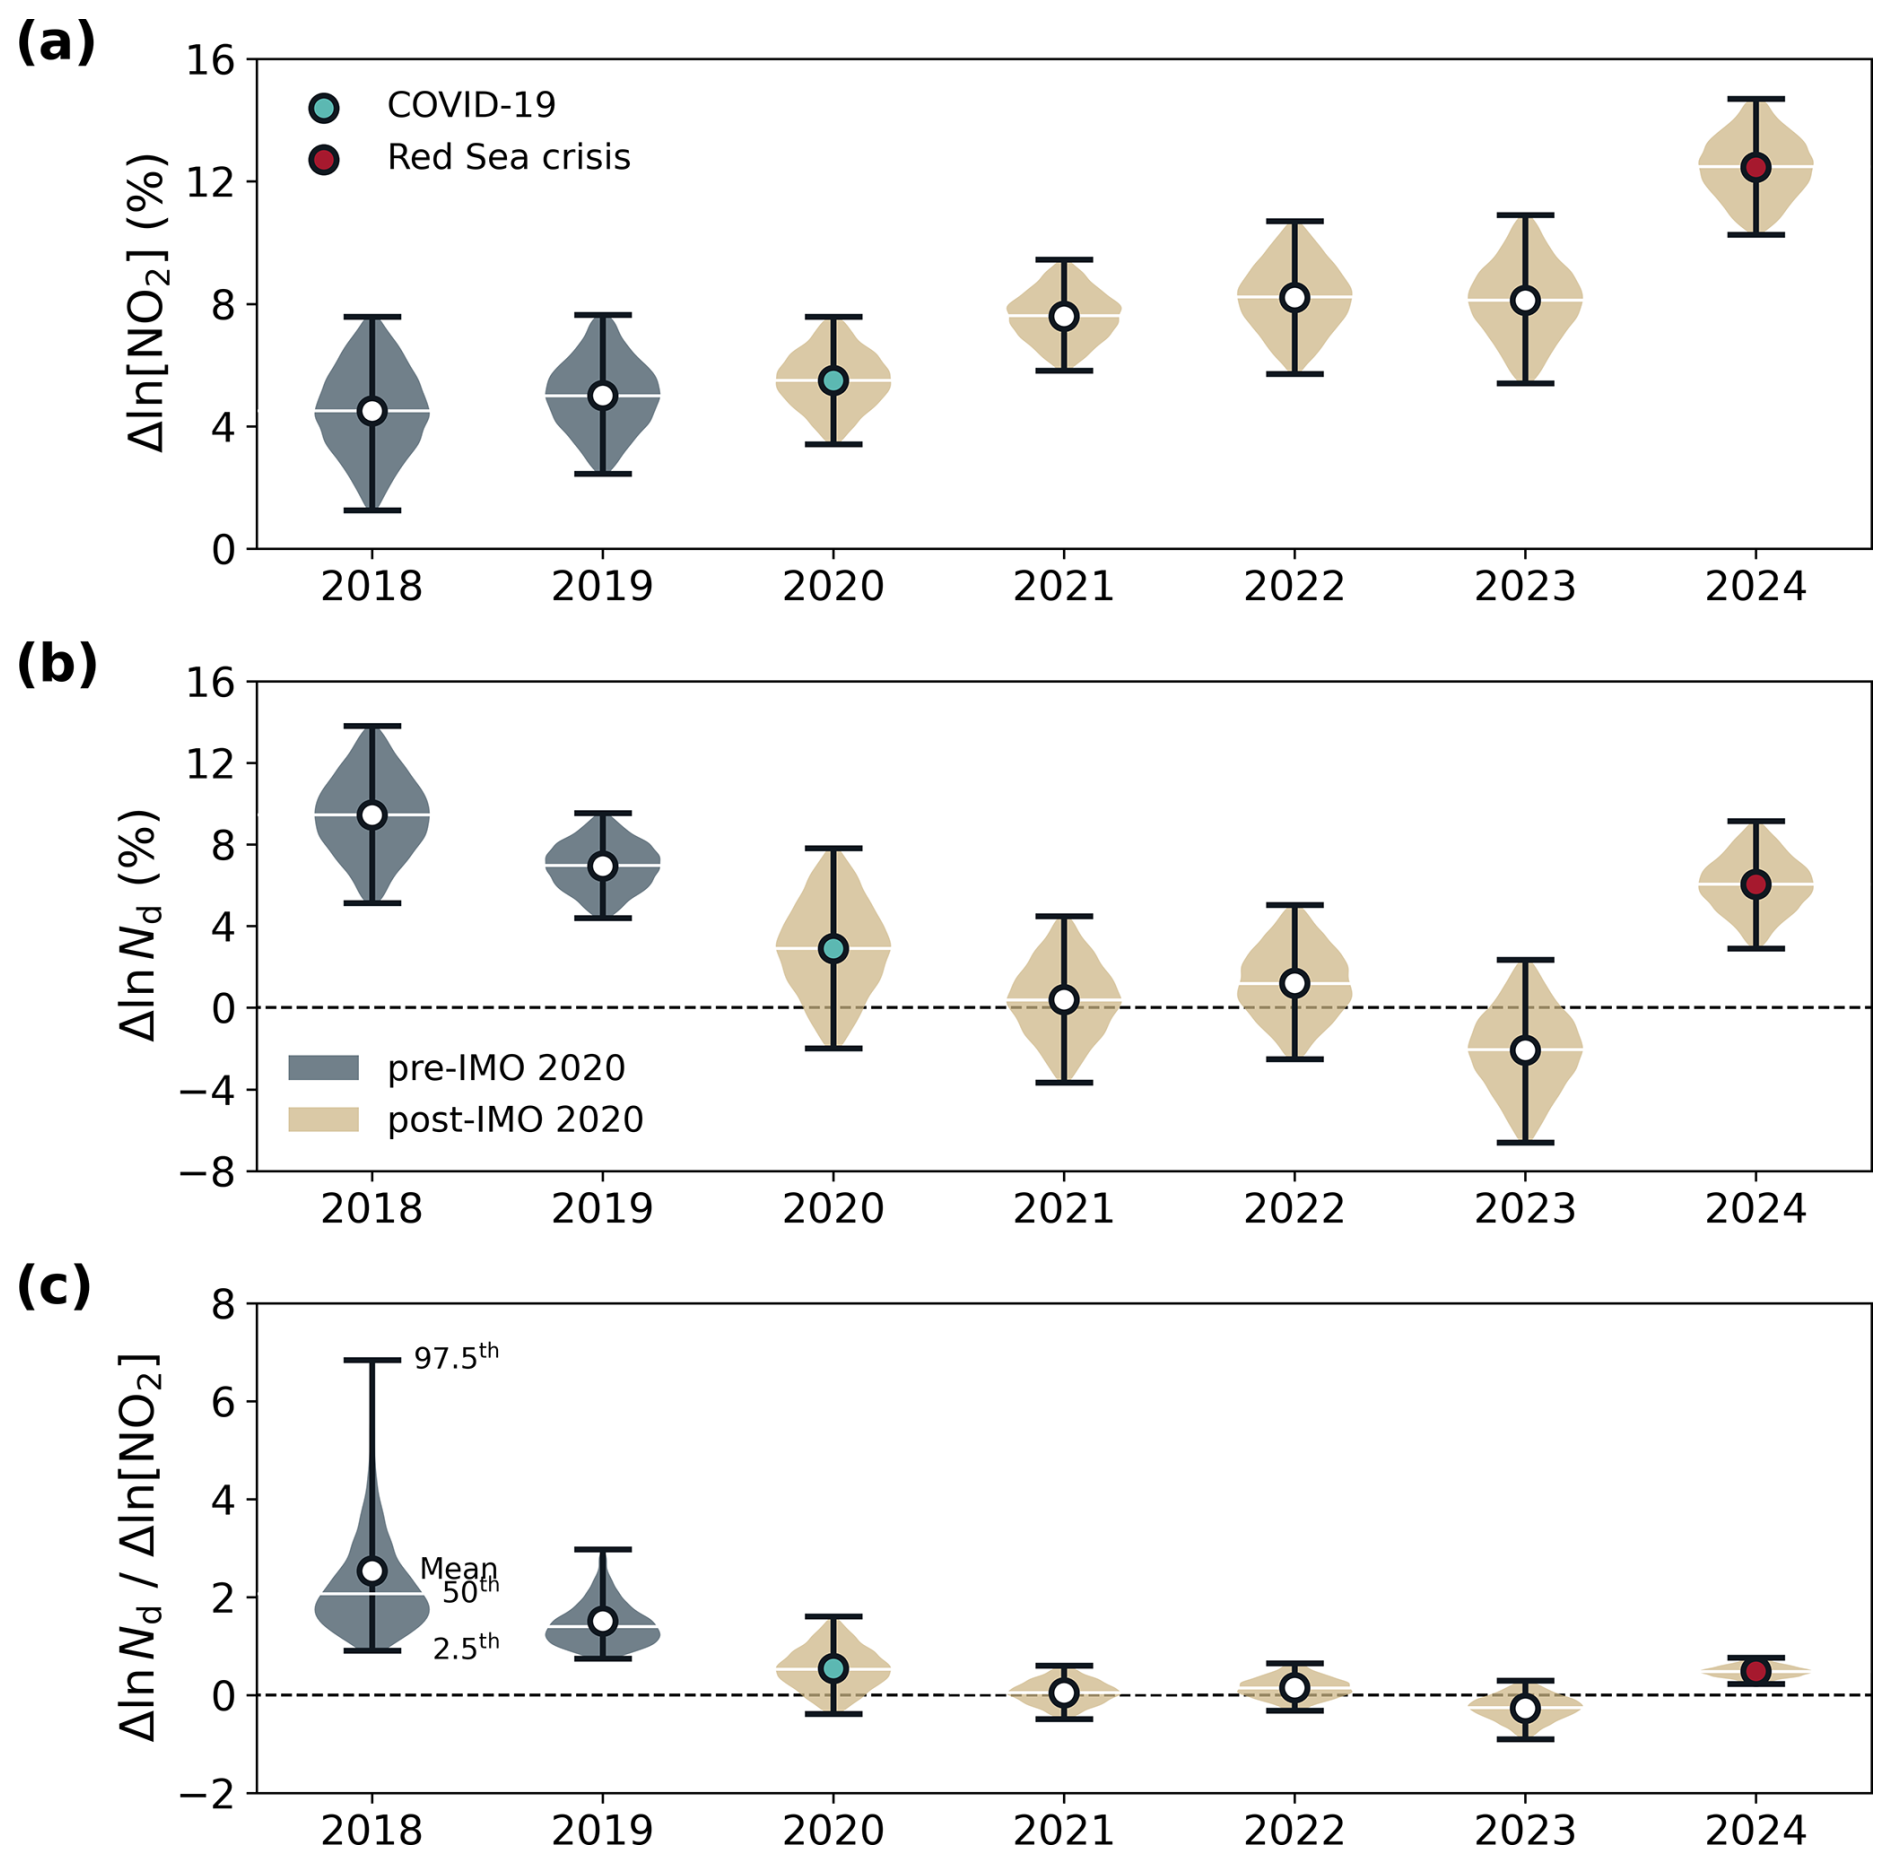
Figure 2Relative shipping perturbations in (a) NO2 and (b) Nd within the southeast Atlantic corridor, and (c) their ratios. Violins represent 95 % confidence, white lines median, and markers mean values for each distribution. NO2 values are averaged over the blue box and Nd values over the red box depicted in Fig. 1d.
Taking the ratio of the relative NO2 and Nd perturbations (Fig. 2c) reveals a marked decrease in the cloud-altering efficiency of marine fuel oils after the IMO 2020 regulations went into effect, including in 2024 when the Nd perturbation is sizeable (Fig. 2b). Because the 2018 NO2 values have a particularly low tail (only year with significant weight below 2.5 %) and Nd values have a high tail (only year with significant weight above 10 %), the ratio for that year is poorly constrained in the mean and on the upper end. As the post-2020 but pre-Red Sea crisis Nd perturbations are indistinguishable from zero at 95 % confidence, their ratios are also poorly constrained. We thus take the 2019 ratio of 1.4 (0.7–3.0) as representative of the pre-IMO 2020 period and contrast with the 2024 post-IMO 2020 value of 0.5 (0.2–0.8). Comparing the 2019 and 2024 sensitivities of cloud properties to unit fuel burnt shows a 66 % (25 %–88 %) reduction in the ability of ship emissions to influence cloud microphysics following IMO 2020.
3.1 Comparison with detectable ship track methods
Combining the 66 % reduction in the Nd–NO2 ratios from Fig. 2c with the ∼ 80 % reduction in sulfur gives a relative sensitivity of 80 % (30 %–110 %), which is more linear in terms of cloud changes per sulfur decline than reported estimates from ship track detections. Over the same region (8–18° S, 13° W–8° E) and season (September–October), a typical year from the 2003–2019 period had 116 ± 61 detected ship tracks in the dataset of Yuan et al. (2022). 59 were detected in 2020, implying a decline in the sensitivity of clouds to ship emissions after IMO 2020 of 49 ± 27 %, or a 61 ± 34 % relative sensitivity accounting for the sulfur change. Similar results are reported for the southeastern Atlantic in Watson-Parris et al. (2022), with global values even lower (∼ 25 % reduction in tracks, or ∼ 30 % relative susceptibility). There are reasons to believe that estimates using a binary detection threshold metric (i.e., “ship track detected” versus “no ship track detected”) should systematically underestimate the linearity of the cloud response to shipping emissions, however. Indeed, a perfect detection algorithm would in theory show no decline in ship tracks post-IMO 2020 so long as some CCN remain, even if the cloud perturbations within the detected ship track were greatly diminished. Estimates based on cloud properties may therefore be more representative of the radiative forcing implications of the IMO 2020 regulations, and thus possible temperature changes (England et al., 2025; Jordan and Henry, 2024; Quaglia and Visioni, 2024; Raghuraman et al., 2024; Watson-Parris et al., 2025), than those based on ship track detectability. Nd perturbations also need to be interpreted with caution in extrapolating to effective radiative forcing, as the ultimate climate effects are highly sensitive to adjustments in cloud amount if the microphysical changes affect precipitation and turbulent mixing.
3.2 Robustness of single-year estimates
A major limitation of the present analysis is the reliance on estimates derived from single years of 2-month data. Even for the clear increase in Nd observable over the shipping corridor, there is substantial noise in single-year estimates of the shipping effect (e.g., Fig. 6 in Diamond et al., 2020). To test how unusual it would be to observe something like the decrease in Nd perturbation in all years after 2019 and before 2024, we repeat the analysis above for VIIRS on NOAA-2020 (available since 2018) with values from the MODerate resolution Imaging Spectrometer (MODIS) on Aqua (available since 2002, with increasing orbital drift since 2022; see Methods in Appendix A). Figure 3 shows how each individual year's data compares to the pre-2020 climatology, the 2020–2023 period, and 2024. Using a Monte Carlo approach, we randomly draw 100 000 samples, with replacement, of 4-year sets from the population of single-year (September–October) Aqua/MODIS data from 2003–2019 and test how frequently the mean Nd for all 4 years is less than half the climatological 2003–2019 value (as was true for 2020–2023). Such a situation occurs in less than 0.02 % of cases. It is thus exceedingly unlikely that the pattern observed in the single-year MODIS or VIIRS data since IMO 2020 went into effect is due to chance.
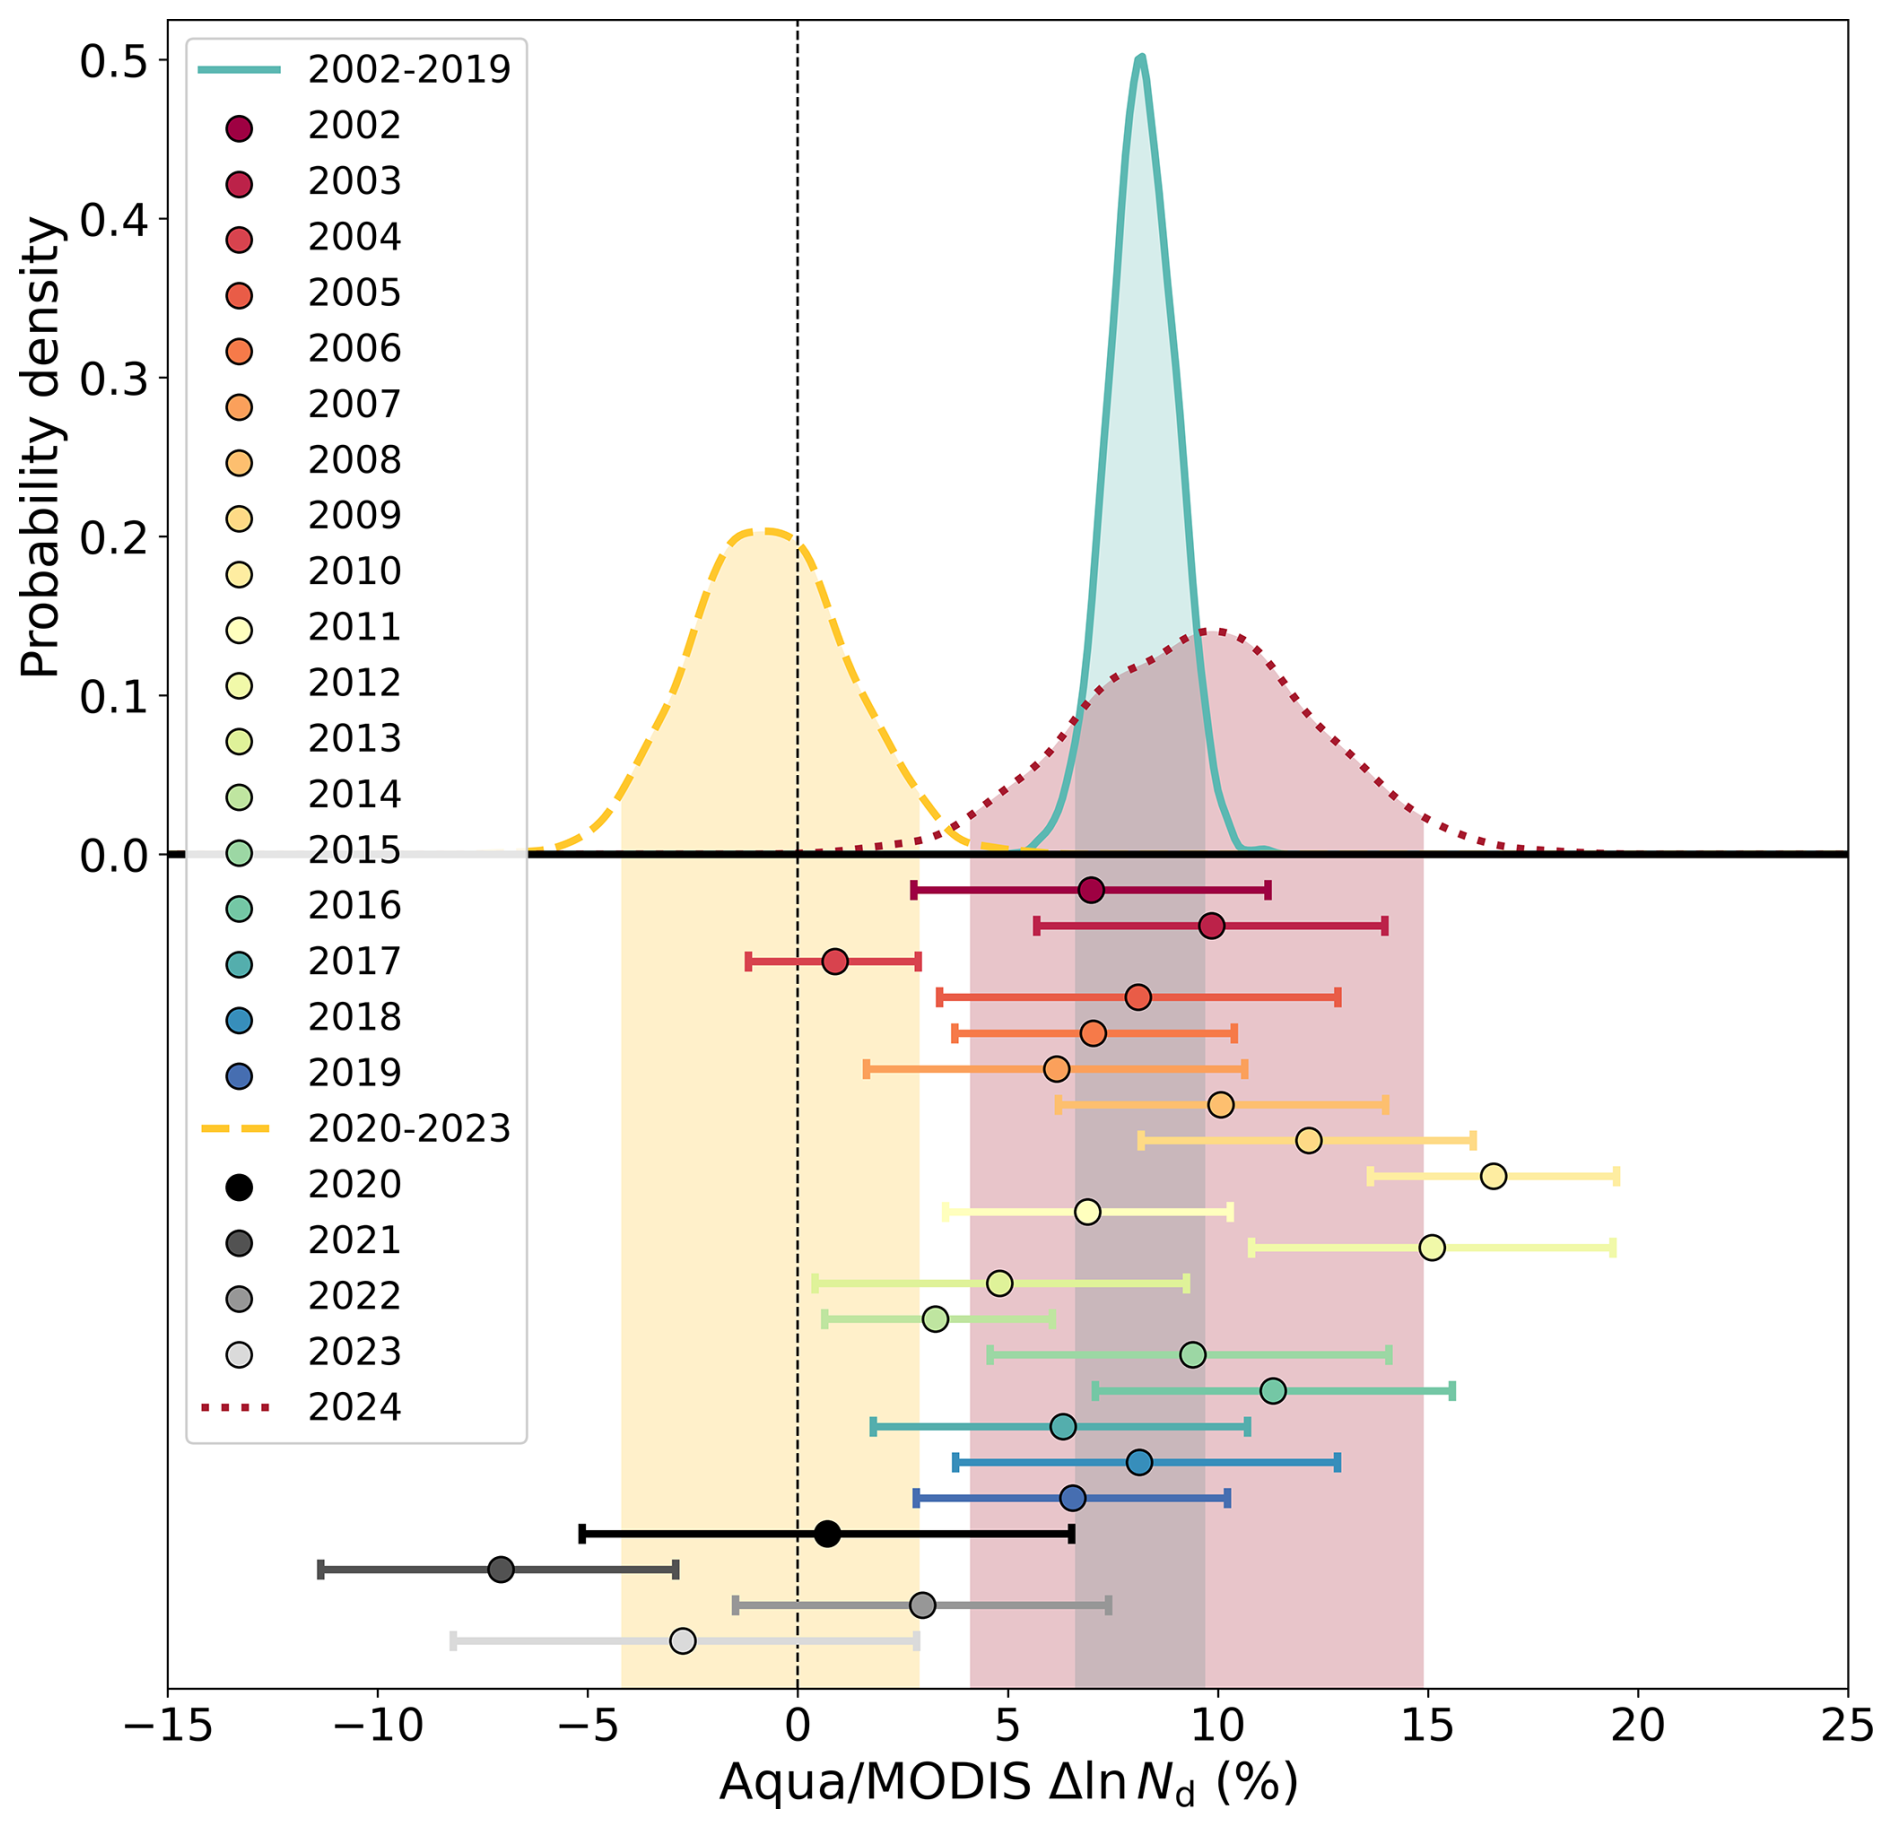
Figure 3Probability densities (via Gaussian kernel density estimation) of relative Nd perturbations for the pre-2020 September–October climatology (blue curve), 2020–2023 period (yellow curve), and 2024 (red curve), with 95 % confidence intervals shown as transparent shading, and individual year mean estimates (colored markers) and their 95 % confidence intervals (error bars) from Aqua/MODIS.
As a further check of the robustness of our results, we analyze whether any of the years between 2018 and 2024 experienced unusual meteorological or non-shipping aerosol conditions (Fig. 4; see Methods in Appendix A). In particular, we are interested in assessing whether the clouds would likely have been drizzling in the absence of shipping aerosol; if 2024 were the only post-IMO 2020 years with likely background drizzle, that could be an alternate explanation for why the cloud microphysics were particularly susceptible to the remaining shipping perturbation that year. We assess the background cloud fraction (lower values would indicate drizzle) and cloud droplet effective radius (re; higher for drizzle). Aerosol optical depth (AOD) would generally indicate drizzle if low (fewer CCN), but in this region is more complicated given that much of the AOD in this season is above-cloud smoke that does not activate to form cloud droplets (Diamond et al., 2018) but could bias the cloud property retrievals (Haywood et al., 2004; Meyer et al., 2015). For background cloud fraction, re, and AOD we exclude all potentially shipping-affected values (see Methods in Appendix A). We also look at a selection of cloud-controlling factors with the expectation that lower sea surface temperatures (SST), greater estimated inversion strength (EIS), and greater wind speed would be associated with thicker stratocumulus clouds (Eastman et al., 2022; Klein and Hartmann, 1993; Scott et al., 2020; Wood and Bretherton, 2006) and thus more drizzle, although the true effect of each could be more complicated and the cloud controlling factors may also interact with each other. We are thus interested in identifying outliers in either direction as potentially problematic for our conclusions about the marine fuel effects.
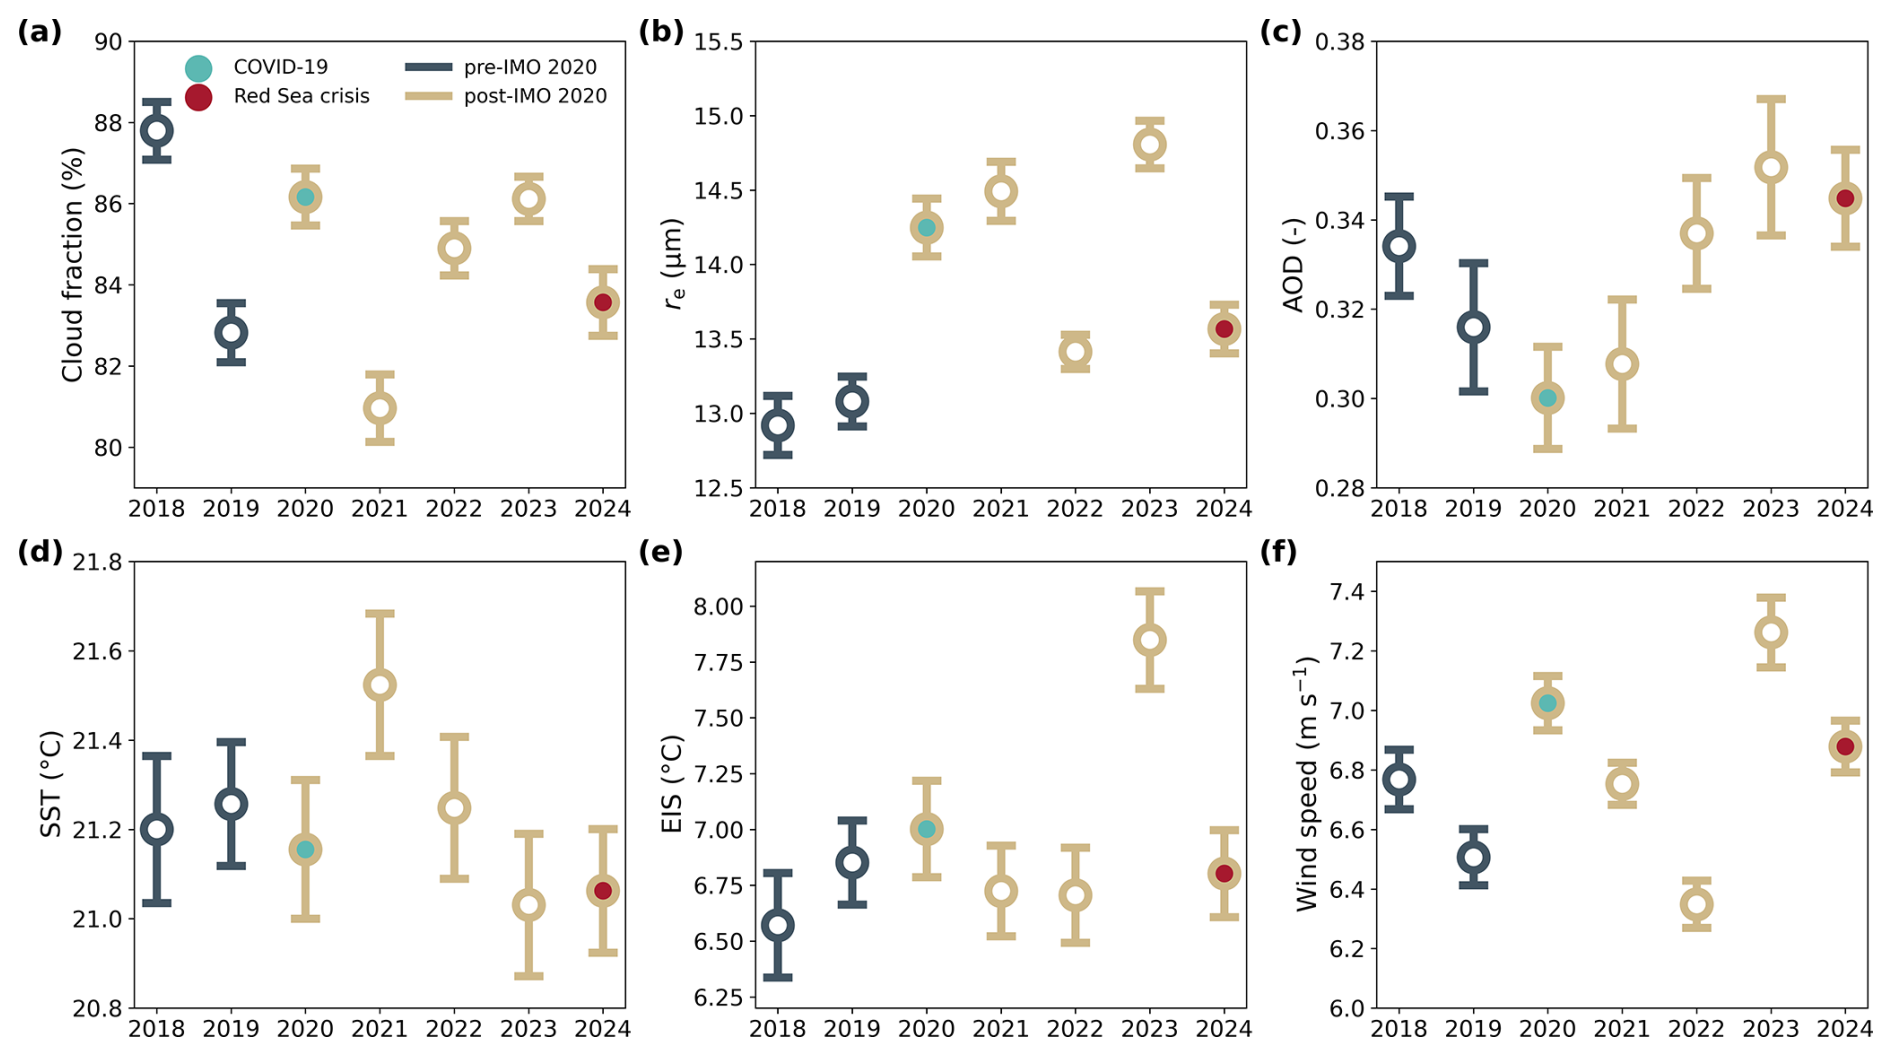
Figure 4Background cloud and aerosol properties (a–c) and meteorological cloud-controlling factors (d–f) over the southeast Atlantic during September–October of each year (red box in Fig. 1d). Markers indicate mean values and error bars two standard errors. For the cloud and aerosol values (a–c), potentially shipping-affected areas are excluded.
Neither 2019 nor 2024 feature particularly unusual values for any of the quantities analyzed (Fig. 4). The only striking outlier noted is the high EIS in 2023 (Fig. 4e), which along with its high values in re and wind speed, would suggest a stronger likelihood of drizzle in the background clouds. Contra our expectations above, however, 2023 has an unusually negative estimate for the shipping corridor Nd perturbation (Fig. 2b). We thus conclude that unusual meteorology in any single year is unlikely to have affected our results.
Changes in ship traffic stemming from armed conflict around the Red Sea came just a few years after ship emissions had already changed dramatically due to sulfur pollution regulations; this unique “experiment-within-an-experiment” setup allows us to better quantify how cloud responses to shipping have changed following IMO 2020. By comparing the shipping perturbation on NO2, which is not strongly affected by fuel composition, with the shipping effect on CCN (as indicated by Nd), which is very sensitive to the fuel composition, we derive a measure of the cloud-altering properties of a given quantity of fuel burned. The spike in shipping activity in the southeast Atlantic in 2024 due to disruption in Suez Canal traffic results in raw Nd perturbations rebounding from being indistinguishable from zero post-IMO to being nearly as large as the pre-2020 values; normalizing by the anomalously large NO2 perturbation, however, reveals a 66 % (25 %–88 %) reduction in the cloud-altering ability of the post-2020 fuel, at least in stratocumulus conditions. If the constraint on cloud microphysical sensitivity to shipping emissions established here could be extrapolated globally, it may provide an emergent constraint on historical radiative forcing from aerosol-cloud interactions from global climate models.
NO2 data (TM5-MP-DOMINO v2.8.0) is from the TROPOspheric Monitoring Instrument (TROPOMI) on Sentinel 5-P (Copernicus Sentinel-5P, 2021; van Geffen et al., 2022). The shipping corridor contribution to column NO2 is calculated by first finding the longitude with the greatest shipping NOx emissions from the Emissions Database for Global Atmospheric Research (EDGAR; Crippa et al., 2020) for each latitude in the domain 13.5° W–3.5° E, 15° S–0° and compositing the data 5° east and west of these points. We then fit a line using simple ordinary least squares linear regression connecting the data between 2 and 5° to the east and west (Fig. A1a) and subtract the regressed values from the observed values within 0.25° east and west of the central point (Fig. A1b). Errors are quantified by propagating the sampling uncertainty in the observed mean value and the root mean square error of the regression.
Nd is calculated (Grosvenor et al., 2018) from the Visible Infrared Imaging Radiometer Suite (VIIRS) on NOAA-20 and the MODerate resolution Imagaing Spectrometer (MODIS) on Aqua (Platnick et al., 2017) using joint histograms of liquid cloud droplet effective radius and optical thickness following Painemal and Zuidema (2011). The shipping corridor contribution to Nd within a domain from 18–8° S and 13° W–8° E is estimated by generating a counterfactual field of non-shipping-influenced values following the universal kriging methodology of Diamond et al. (2020). The definition of potentially shipping-affected pixels follows Diamond (2023) but is expanded 2° to the west; the “core” corridor effect is quantified as the average difference between 5000 simulated plausible counterfactual values and the observed value at the grid points of the greatest shipping SO2 emissions (Crippa et al., 2020) and 2° to the west at each latitude. Sea surface temperature from the Extended Reconstructed Sea Surface Temperature, Version 5 dataset (Huang et al., 2017) is used as the cloud controlling factor in fitting the mean function.
The aerosol and cloud properties and cloud-controlling factors shown in Fig. 4 are from the Clouds and the Earth's Radiant Energy System (CERES) Single-Scanner Footprint Edition 1C level 3 monthly product for NOAA-20 (NASA/LARC/SD/ASDC, 2020). Cloud fraction and cloud effective radius are retrieved using VIIRS radiances (Minnis et al., 2023; Yost et al., 2023). AOD at 550 nm is retrieved using the Deep Blue algorithm (Hsu et al., 2013). SST, EIS, and wind speed data are from the Modern-Era Retrospective Analysis for Research and Applications, Version 2 (Gelaro et al., 2017).
Unless otherwise specified, reported central values represent medians with 95 % confidence intervals in parentheses.
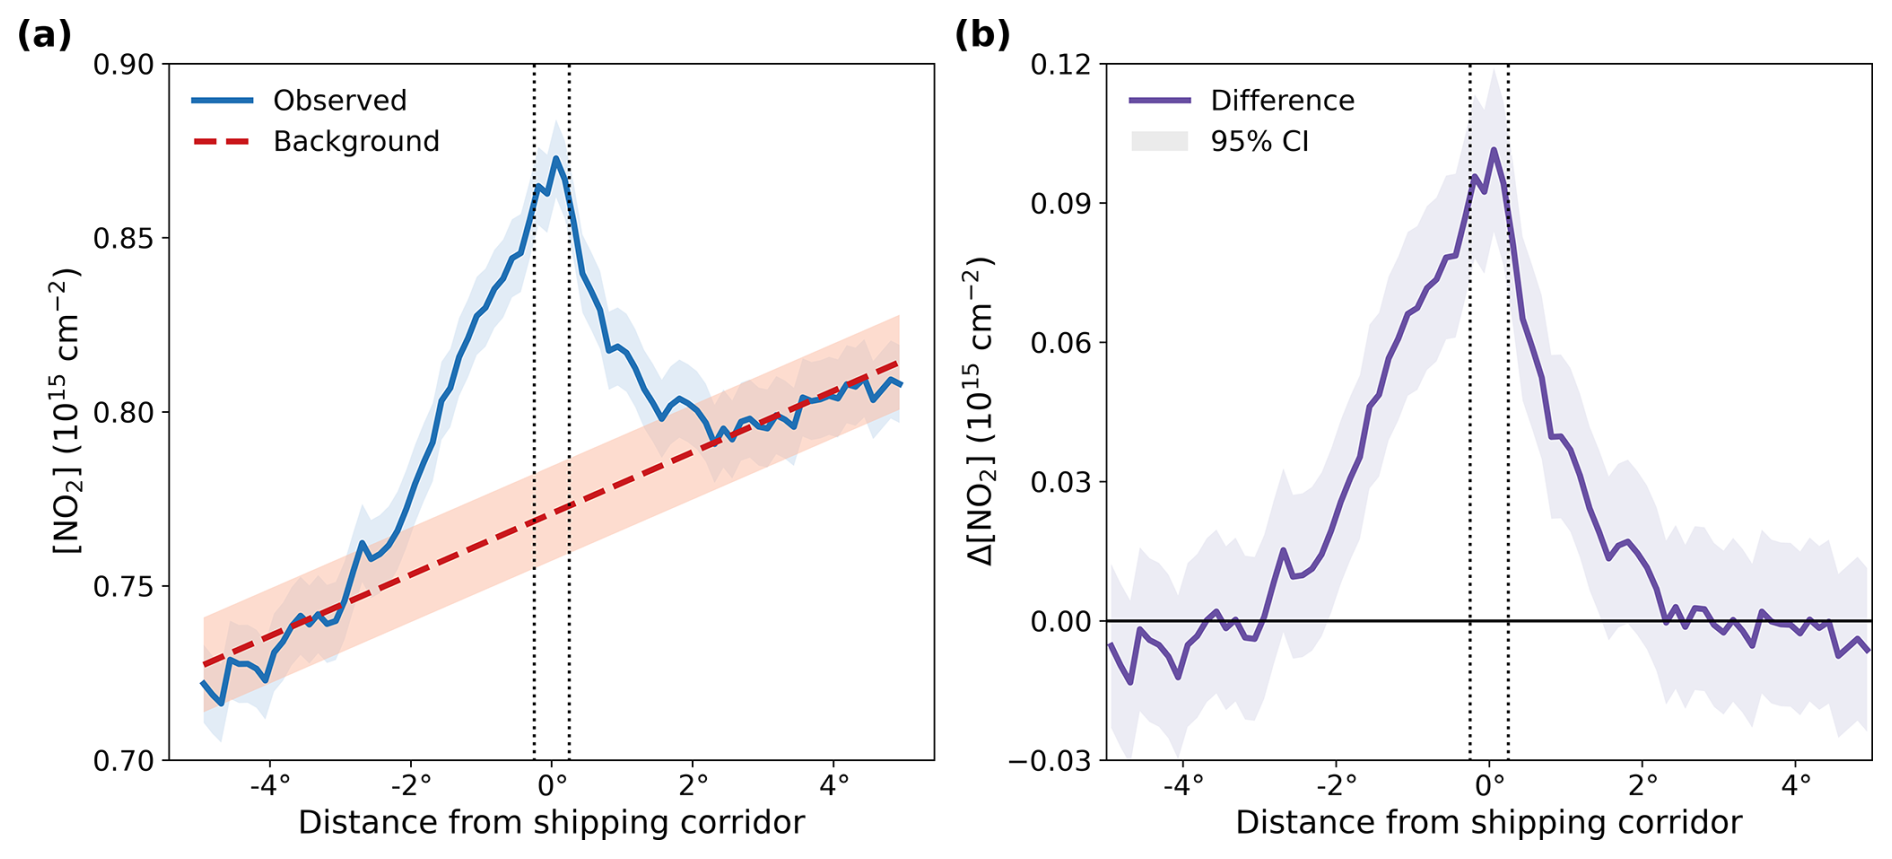
Figure A1Example profiles from September–October 2024 of the method for estimating nitrogen dioxide shipping perturbations. After aggregating observations within 5° east and west of the shipping corridor (a, solid line), a background estimate is created using data from 2–5° on either side of the corridor (a, dashed line). The difference between these values (b) is interpreted as the perturbation caused by shipping activity. Shading represents 95 % confidence based on sampling (a, blue) or the regression fit (a, red) or their propagated combination (b). Dotted lines represent the region within 0.25° of the shipping corridor shown in Fig. 2.
TROPOMI NO2 data were downloaded from the Tropospheric Emission Monitoring Internet Service at https://www.temis.nl/airpollution/no2.php (last access: 30 July 2025) and are also available at https://doi.org/10.5270/S5P-9bnp8q8 (Copernicus Sentinel-5P, 2021). NOAA-20/VIIRS and Aqua/MODIS data are available from the NASA Level-1 and Atmosphere Archive & Distribution System (LAADS) Distributed Active Archive Center (DAAC) at https://doi.org/10.5067/VIIRS/CLDPROP_M3_VIIRS_NOAA20.011 (NASA VIIRS Atmosphere SIPS) and https://doi.org/10.5067/MODIS/CLDPROP_M3_MODIS_Aqua.011 (NASA LAADS DAAC), respectively. The Emissions Database for Global Atmospheric Research is available from the European Commission, Joint Research Centre at https://doi.org/10.2904/JRC_DATASET_EDGAR (European Commission Joint Research Centre, 2018). NOAA Extended Reconstructed SST V5 data are available at https://doi.org/10.7289/V5T72FNM (Huang et al., 2017). Locations of attacks on merchant vessels are from Raydan and Nadimi (2025), available at https://www.washingtoninstitute.org/policy-analysis/tracking-maritime-attacks-middle-east-2019 (last access: 30 July 2025). Ship track locations from Yuan et al. (2022) are available from Harvard Dataverse at https://doi.org/10.7910/DVN/JII4DN (Song, 2022). CERES data are available for ordering at https://ceres.larc.nasa.gov/data/ (last access: 11 October 2025); the NOAA-20 SSF data are also available at https://doi.org/10.5067/NOAA20/CERES/SSF1DEGMONTH_L3.001B (NASA/LARC/SD/ASDC, 2020). The following R and Python libraries were integral to the analysis: cartopy (Met Office, 2010–2015), geoR (Ribeiro and Diggle, 2018), matplotlib (Hunter, 2007), numpy (Harris et al., 2020), scipy (Virtanen et al., 2020), and xarray (Hoyer and Hamman, 2017). Code and processed data used in this analysis are available at https://doi.org/10.5281/zenodo.16637710 (Diamond, 2025) and https://doi.org/10.5281/zenodo.15738910 (Diamond and Boss, 2025), respectively.
MSD conceived the study, secured funding, developed the methods, performed the formal analysis, visualized the results, and wrote the original draft of the manuscript. LFB refined methods, validated and curated data, and reviewed the manuscript.
The contact author has declared that neither of the authors has any competing interests.
Publisher’s note: Copernicus Publications remains neutral with regard to jurisdictional claims made in the text, published maps, institutional affiliations, or any other geographical representation in this paper. While Copernicus Publications makes every effort to include appropriate place names, the final responsibility lies with the authors. Views expressed in the text are those of the authors and do not necessarily reflect the views of the publisher.
We thank Jay Mace and an anonymous reviewer for their constructive feedback.
This research has been supported by NOAA's Climate Program Office Earth's Radiation Budget (ERB), Atmospheric Chemistry, Carbon Cycle, & Climate (AC4), and Climate Variability & Predictability (CVP) programs (grant no. NA23OAR4310297).
This paper was edited by Markus Petters and Ken Carslaw and reviewed by Gerald Mace and one anonymous referee.
Albrecht, B. A.: Aerosols, Cloud Microphysics, and Fractional Cloudiness, Science, 245, 1227–1230, https://doi.org/10.1126/science.245.4923.1227, 1989.
Bellouin, N., Quaas, J., Gryspeerdt, E., Kinne, S., Stier, P., Watson-Parris, D., Boucher, O., Carslaw, K. S., Christensen, M., Daniau, A.-L., Dufresne, J.-L., Feingold, G., Fiedler, S., Forster, P., Gettelman, A., Haywood, J. M., Lohmann, U., Malavelle, F., Mauritsen, T., McCoy, D. T., Myhre, G., Mülmenstädt, J., Neubauer, D., Possner, A., Rugenstein, M., Sato, Y., Schulz, M., Schwartz, S. E., Sourdeval, O., Storelvmo, T., Toll, V., Winker, D., and Stevens, B.: Bounding Global Aerosol Radiative Forcing of Climate Change, Rev. Geophys., 58, e2019RG000660, https://doi.org/10.1029/2019rg000660, 2020.
Benas, N., Meirink, J. F., Roebeling, R., and Stengel, M.: Analysis of ship emission effects on clouds over the southeastern Atlantic using geostationary satellite observations, Atmos. Chem. Phys., 25, 6957–6973, https://doi.org/10.5194/acp-25-6957-2025, 2025.
Chen, Y.-C., Christensen, M. W., Xue, L., Sorooshian, A., Stephens, G. L., Rasmussen, R. M., and Seinfeld, J. H.: Occurrence of lower cloud albedo in ship tracks, Atmos. Chem. Phys., 12, 8223–8235, https://doi.org/10.5194/acp-12-8223-2012, 2012.
Christensen, M. W., Gettelman, A., Cermak, J., Dagan, G., Diamond, M., Douglas, A., Feingold, G., Glassmeier, F., Goren, T., Grosvenor, D. P., Gryspeerdt, E., Kahn, R., Li, Z., Ma, P.-L., Malavelle, F., McCoy, I. L., McCoy, D. T., McFarquhar, G., Mülmenstädt, J., Pal, S., Possner, A., Povey, A., Quaas, J., Rosenfeld, D., Schmidt, A., Schrödner, R., Sorooshian, A., Stier, P., Toll, V., Watson-Parris, D., Wood, R., Yang, M., and Yuan, T.: Opportunistic experiments to constrain aerosol effective radiative forcing, Atmos. Chem. Phys., 22, 641–674, https://doi.org/10.5194/acp-22-641-2022, 2022.
Coakley, J. A. and Walsh, C. D.: Limits to the Aerosol Indirect Radiative Effect Derived from Observations of Ship Tracks, J. Atmos. Sci., 59, 668–680, https://doi.org/10.1175/1520-0469(2002)059<0668:Lttair>2.0.Co;2, 2002.
Conover, J. H.: Anomalous Cloud Lines, J. Atmos. Sci., 23, 778–785, https://doi.org/10.1175/1520-0469(1966)023<0778:Acl>2.0.Co;2, 1966.
Copernicus Sentinel-5P: TROPOMI Level 2 Nitrogen Dioxide total column products, Version 02, European Space Agency [data set], https://doi.org/10.5270/S5P-9bnp8q8, 2021.
Crippa, M., Solazzo, E., Huang, G., Guizzardi, D., Koffi, E., Muntean, M., Schieberle, C., Friedrich, R., and Janssens-Maenhout, G.: High resolution temporal profiles in the Emissions Database for Global Atmospheric Research, Scientific Data, 7, 121–137, https://doi.org/10.1038/s41597-020-0462-2, 2020.
Diamond, M. S.: Detection of large-scale cloud microphysical changes within a major shipping corridor after implementation of the International Maritime Organization 2020 fuel sulfur regulations, Atmos. Chem. Phys., 23, 8259–8269, https://doi.org/10.5194/acp-23-8259-2023, 2023.
Diamond, M. S.: michael-s-diamond/ConflictClouds: Final version, Zenodo [code], https://doi.org/10.5281/zenodo.16637710, 2025.
Diamond, M. S. and Boss, L. F.: Data for Diamond & Boss, ”Conflict-induced ship traffic disruptions constrain cloud sensitivity to stricter marine pollution regulations”, Zenodo [data set], https://doi.org/10.5281/zenodo.15738910, 2025.
Diamond, M. S., Dobracki, A., Freitag, S., Small Griswold, J. D., Heikkila, A., Howell, S. G., Kacarab, M. E., Podolske, J. R., Saide, P. E., and Wood, R.: Time-dependent entrainment of smoke presents an observational challenge for assessing aerosol–cloud interactions over the southeast Atlantic Ocean, Atmospheric Chemistry and Physics, 18, 14623-14636, https://doi.org/10.5194/acp-18-14623-2018, 2018.
Diamond, M. S., Director, H. M., Eastman, R., Possner, A., and Wood, R.: Substantial Cloud Brightening from Shipping in Subtropical Low Clouds, AGU Advances, 1, e2019AV000111, https://doi.org/10.1029/2019av000111, 2020.
Durkee, P. A., Chartier, R. E., Brown, A., Trehubenko, E. J., Rogerson, S. D., Skupniewicz, C., and Nielsen, K. E.: Composite Ship Track Characteristics, J. Atmos. Sci., 57, 2542–2553, 2000.
Eastman, R., McCoy, I. L., and Wood, R.: Wind, Rain, and the Closed to Open Cell Transition in Subtropical Marine Stratocumulus, J. Geophys. Res.-Atmos., 127, https://doi.org/10.1029/2022jd036795, 2022.
England, M. H., Li, Z., Huguenin, M. F., Kiss, A. E., Sen Gupta, A., Holmes, R. M., and Rahmstorf, S.: Drivers of the extreme North Atlantic marine heatwave during 2023, Nature, 642, 636–643, https://doi.org/10.1038/s41586-025-08903-5, 2025.
European Commission Joint Research Centre: Emissions Database for Global Atmospheric Research, Joint Research Centre Data Catalogue [data set], https://doi.org/10.2904/JRC_DATASET_EDGAR, 2018.
Forster, P. M., Storelvmo, T., Armour, K., Collins, W., Dufresne, J.-L., Frame, D., Lunt, D. J., Mauritsen, T., Palmer, M. D., Watanabe, M., Wild, M., and Zhang, H.: The Earth's Energy Budget, Climate Feedbacks, and Climate Sensitivity, in: Climate Change 2021: The Physical Science Basis. Contribution of Working Group I to the Sixth Assessment Report of the Intergovernmental Panel on Climate Change, Cambridge University Press, Cambridge, United Kingdom and New York, NY, USA, 923–1054, https://doi.org/10.1017/9781009157896.009, 2021.
Gelaro, R., McCarty, W., Suárez, M. J., Todling, R., Molod, A., Takacs, L., Randles, C. A., Darmenov, A., Bosilovich, M. G., Reichle, R., Wargan, K., Coy, L., Cullather, R., Draper, C., Akella, S., Buchard, V., Conaty, A., da Silva, A. M., Gu, W., Kim, G.-K., Koster, R., Lucchesi, R., Merkova, D., Nielsen, J. E., Partyka, G., Pawson, S., Putman, W., Rienecker, M., Schubert, S. D., Sienkiewicz, M., and Zhao, B.: The Modern-Era Retrospective Analysis for Research and Applications, Version 2 (MERRA-2), J. Climate, 30, 5419–5454, https://doi.org/10.1175/jcli-d-16-0758.1, 2017.
Gettelman, A., Christensen, M. W., Diamond, M. S., Gryspeerdt, E., Manshausen, P., Stier, P., Watson-Parris, D., Yang, M., Yoshioka, M., and Yuan, T.: Has Reducing Ship Emissions Brought Forward Global Warming?, Geophys. Res. Lett., 51, https://doi.org/10.1029/2024gl109077, 2024.
Grosvenor, D. P., Sourdeval, O., Zuidema, P., Ackerman, A., Alexandrov, M. D., Bennartz, R., Boers, R., Cairns, B., Chiu, J. C., Christensen, M., Deneke, H., Diamond, M., Feingold, G., Fridlind, A., Hünerbein, A., Knist, C., Kollias, P., Marshak, A., McCoy, D., Merk, D., Painemal, D., Rausch, J., Rosenfeld, D., Russchenberg, H., Seifert, P., Sinclair, K., Stier, P., van Diedenhoven, B., Wendisch, M., Werner, F., Wood, R., Zhang, Z., and Quaas, J.: Remote Sensing of Droplet Number Concentration in Warm Clouds: A Review of the Current State of Knowledge and Perspectives, Rev. Geophys., 56, 409–453, https://doi.org/10.1029/2017rg000593, 2018.
Gryspeerdt, E., Smith, T. W. P., O'Keeffe, E., Christensen, M. W., and Goldsworth, F. W.: The Impact of Ship Emission Controls Recorded by Cloud Properties, Geophys. Res. Lett., 46, 12547–12555, https://doi.org/10.1029/2019gl084700, 2019.
Harris, C. R., Millman, K. J., van der Walt, S. J., Gommers, R., Virtanen, P., Cournapeau, D., Wieser, E., Taylor, J., Berg, S., Smith, N. J., Kern, R., Picus, M., Hoyer, S., van Kerkwijk, M. H., Brett, M., Haldane, A., Del Rio, J. F., Wiebe, M., Peterson, P., Gerard-Marchant, P., Sheppard, K., Reddy, T., Weckesser, W., Abbasi, H., Gohlke, C., and Oliphant, T. E.: Array programming with NumPy, Nature, 585, 357–362, https://doi.org/10.1038/s41586-020-2649-2, 2020.
Haywood, J. M., Osborne, S. R., and Abel, S. J.: The effect of overlying absorbing aerosol layers on remote sensing retrievals of cloud effective radius and cloud optical depth, Q. J. Roy. Meteor. Soc., 130, 779–800, https://doi.org/10.1256/qj.03.100, 2004.
Hoyer, S. and Hamman, J. J.: xarray: N-D labeled Arrays and Datasets in Python, Journal of Open Research Software, 5, 10, https://doi.org/10.5334/jors.148, 2017.
Hsu, N. C., Jeong, M.-J., Bettenhausen, C., Sayer, A. M., Hansell, R., Seftor, C. S., Huang, J., and Tsay, S.-C.: Enhanced Deep Blue aerosol retrieval algorithm: The second generation, J. Geophys. Res.-Atmos., 118, 9296–9315, https://doi.org/10.1002/jgrd.50712, 2013.
Hu, S., Zhu, Y., Rosenfeld, D., Mao, F., Lu, X., Pan, Z., Zang, L., and Gong, W.: The Dependence of Ship-Polluted Marine Cloud Properties and Radiative Forcing on Background Drop Concentrations, J. Geophys. Res.-Atmos., 126, e2020JD033852, https://doi.org/10.1029/2020jd033852, 2021.
Huang, B., Thorne, P. W., Banzon, V. F., Boyer, T., Chepurin, G., Lawrimore, J. H., Menne, M. J., Smith, T. M., Vose, R. S., and Zhang, H.-M.: NOAA Extended Reconstructed Sea Surface Temperature (ERSST), Version 5, NOAA National Centers for Environmental Information [data set], https://doi.org/10.7289/V5T72FNM, 2017.
Hunter, J. D.: Matplotlib: A 2D Graphics Environment, Comput. Sci. Eng., 9, 90–95, https://doi.org/10.1109/MCSE.2007.55, 2007.
Jordan, G. and Henry, M.: IMO2020 Regulations Accelerate Global Warming by up to 3 Years in UKESM1, Earth's Future, 12, e2024EF005011, https://doi.org/10.1029/2024ef005011, 2024.
Klein, S. A. and Hartmann, D. L.: The Seasonal Cycle of Low Stratiform Clouds, J. Climate, 6, 1587–1606, 1993.
Manshausen, P., Watson-Parris, D., Christensen, M. W., Jalkanen, J.-P., and Stier, P.: Rapid saturation of cloud water adjustments to shipping emissions, Atmos. Chem. Phys., 23, 12545–12555, https://doi.org/10.5194/acp-23-12545-2023, 2023.
March, D., Metcalfe, K., Tintore, J., and Godley, B. J.: Tracking the global reduction of marine traffic during the COVID-19 pandemic, Nat. Commun., 12, 2415, https://doi.org/10.1038/s41467-021-22423-6, 2021.
Met Office: Cartopy: a cartographic python library with a matplotlib interface, edited by: Met Office, Exeter, Devon, https://doi.org/10.5281/zenodo.13905945, 2010–2015.
Meyer, K., Platnick, S., and Zhang, Z.: Simultaneously inferring above-cloud absorbing aerosol optical thickness and underlying liquid phase cloud optical and microphysical properties using MODIS, J. Geophys. Res.-Atmos., 120, 5524–5547, https://doi.org/10.1002/2015jd023128, 2015.
Minnis, P., Sun-Mack, S., Smith, W. L., Trepte, Q. Z., Hong, G., Chen, Y., Yost, C. R., Chang, F.-L., Smith, R. A., Heck, P. W., and Yang, P.: VIIRS Edition 1 Cloud Properties for CERES, Part 1: Algorithm Adjustments and Results, Remote Sensing, 15, 578, https://doi.org/10.3390/rs15030578, 2023.
NASA LAADS DAAC: CLDPROP_M3_MODIS_Aqua - MODIS/Aqua Cloud Properties Level 3 monthly, 1x1 degree grid, NASA Level-1 and Atmosphere Archive & Distribution System [data set], https://doi.org/10.5067/MODIS/CLDPROP_M3_MODIS_Aqua.011, 2019.
NASA VIIRS Atmosphere SIPS: NOAA20 VIIRS Cloud Properties Level 3 monthly, 1x1 degree grid (CLDPROP_M3_VIIRS_NOAA20), Space Science & Engineering Center, University of Wisconsin-Madison, NASA Level-1 and Atmosphere Archive & Distribution System [data set], https://doi.org/10.5067/VIIRS/CLDPROP_M3_VIIRS_NOAA20.011, 2021.
NASA/LARC/SD/ASDC: CERES Time-Interpolated TOA Fluxes, Clouds and Aerosols Monthly NOAA-20 Edition1B, NASA Langley Atmospheric Science Data Center DAAC [data set], https://doi.org/10.5067/NOAA20/CERES/SSF1DEGMONTH_L3.001B, 2020.
Painemal, D. and Zuidema, P.: Assessment of MODIS cloud effective radius and optical thickness retrievals over the Southeast Pacific with VOCALS-REx in situ measurements, J. Geophys. Res.-Atmos., 116, D24206, https://doi.org/10.1029/2011jd016155, 2011.
Petzold, A., Weingartner, E., Hasselbach, J., Lauer, P., Kurok, C., and Fleischer, F.: Physical Properties, Chemical Composition, and Cloud Forming Potential of Particulate Emissions from a Marine Diesel Engine at Various Load Conditions, Environ. Sci. Technol., 44, 3800–3805, https://doi.org/10.1021/es903681z, 2010.
Platnick, S., Meyer, K. G., King, M. D., Wind, G., Amarasinghe, N., Marchant, B., Arnold, G. T., Zhang, Z., Hubanks, P. A., Holz, R. E., Yang, P., Ridgway, W. L., and Riedi, J.: The MODIS cloud optical and microphysical products: Collection 6 updates and examples from Terra and Aqua, IEEE T. Geosci. Remote, 55, 502–525, https://doi.org/10.1109/TGRS.2016.2610522, 2017.
Pseftogkas, A., Stavrakou, T., Müller, J. F., Koukouli, M. E., Balis, D., and Meleti, C.: Shifts in Maritime Trade Routes as a Result of Red Sea Shipping Crisis Detected in TROPOMI NO2 Data, Geophys. Res. Lett., 51, e2024GL110491, https://doi.org/10.1029/2024gl110491, 2024.
Quaglia, I. and Visioni, D.: Modeling 2020 regulatory changes in international shipping emissions helps explain anomalous 2023 warming, Earth Syst. Dynam., 15, 1527–1541, https://doi.org/10.5194/esd-15-1527-2024, 2024.
Radke, L. F., Coakley, J. A., and King, M. D.: Direct and Remote Sensing Observations of the Effects of Ships on Clouds, Science, 246, 1146–1149, 1989.
Raghuraman, S. P., Soden, B., Clement, A., Vecchi, G., Menemenlis, S., and Yang, W.: The 2023 global warming spike was driven by the El Niño–Southern Oscillation, Atmos. Chem. Phys., 24, 11275–11283, https://doi.org/10.5194/acp-24-11275-2024, 2024.
Raydan, N. and Nadimi, F.: Tracking Maritime Attacks in the Middle East Since 2019, The Washington Institute for Near East Studies, https://www.washingtoninstitute.org/policy-analysis/trackingmaritime-attacks-middle-east-2019 (last access: 19 November 2025), 2025.
Ribeiro, P. A., and Diggle, P. J.: geoR: Analysis of Geostatistical Data. R package version 1.7-5.2.1, CRAN [code], https://CRAN.R-project.org/package=geoR (last access: 19 November 2025), https://doi.org/10.32614/CRAN.package.geoR, 2018.
Scott, R. C., Myers, T. A., Norris, J. R., Zelinka, M. D., Klein, S. A., Sun, M., and Doelling, D. R.: Observed Sensitivity of Low-Cloud Radiative Effects to Meteorological Perturbations over the Global Oceans, J. Climate, 33, 7717–7734, https://doi.org/10.1175/jcli-d-19-1028.1, 2020.
Song, H.: Datetimes and Locations of ship-tracks, https://doi.org/10.7910/DVN/JII4DN, Harvard Dataverse [data set], 2022.
Toll, V., Christensen, M., Quaas, J., and Bellouin, N.: Weak average liquid-cloud-water response to anthropogenic aerosols, Nature, 572, 51–55, https://doi.org/10.1038/s41586-019-1423-9, 2019.
Twomey, S.: The Influence of Pollution on the Shortwave Albedo of Clouds, J. Atmos. Sci., 34, 1149-1152, https://doi.org/10.1175/1520-0469(1977)034<1149:TIOPOT>2.0.CO;2, 1977.
van Geffen, J., Eskes, H., Compernolle, S., Pinardi, G., Verhoelst, T., Lambert, J.-C., Sneep, M., ter Linden, M., Ludewig, A., Boersma, K. F., and Veefkind, J. P.: Sentinel-5P TROPOMI NO2 retrieval: impact of version v2.2 improvements and comparisons with OMI and ground-based data, Atmos. Meas. Tech., 15, 2037–2060, https://doi.org/10.5194/amt-15-2037-2022, 2022.
Veefkind, J. P., Aben, I., McMullan, K., Förster, H., de Vries, J., Otter, G., Claas, J., Eskes, H. J., de Haan, J. F., Kleipool, Q., van Weele, M., Hasekamp, O., Hoogeveen, R., Landgraf, J., Snel, R., Tol, P., Ingmann, P., Voors, R., Kruizinga, B., Vink, R., Visser, H., and Levelt, P. F.: TROPOMI on the ESA Sentinel-5 Precursor: A GMES mission for global observations of the atmospheric composition for climate, air quality and ozone layer applications, Remote Sens. Environ., 120, 70–83, https://doi.org/10.1016/j.rse.2011.09.027, 2012.
Virtanen, P., Gommers, R., Oliphant, T. E., Haberland, M., Reddy, T., Cournapeau, D., Burovski, E., Peterson, P., Weckesser, W., Bright, J., van der Walt, S. J., Brett, M., Wilson, J., Millman, K. J., Mayorov, N., Nelson, A. R. J., Jones, E., Kern, R., Larson, E., Carey, C. J., Polat, I., Feng, Y., Moore, E. W., VanderPlas, J., Laxalde, D., Perktold, J., Cimrman, R., Henriksen, I., Quintero, E. A., Harris, C. R., Archibald, A. M., Ribeiro, A. H., Pedregosa, F., van Mulbregt, P., and SciPy, C.: SciPy 1.0: fundamental algorithms for scientific computing in Python, Nat. Methods, 17, 261–272, https://doi.org/10.1038/s41592-019-0686-2, 2020.
Watson-Parris, D., Christensen, M. W., Laurenson, A., Clewley, D., Gryspeerdt, E., and Stier, P.: Shipping regulations lead to large reduction in cloud perturbations, P. Natl. Acad. Sci. USA, 119, e2206885119, https://doi.org/10.1073/pnas.2206885119, 2022.
Watson-Parris, D., Wilcox, L. J., Stjern, C. W., Allen, R. J., Persad, G., Bollasina, M. A., Ekman, A. M. L., Iles, C. E., Joshi, M., Lund, M. T., McCoy, D., Westervelt, D. M., Williams, A. I. L., and Samset, B. H.: Surface temperature effects of recent reductions in shipping SO2 emissions are within internal variability, Atmos. Chem. Phys., 25, 4443–4454, https://doi.org/10.5194/acp-25-4443-2025, 2025.
Wood, R. and Bretherton, C. S.: On the Relationship between Stratiform Low Cloud Cover and Lower-Tropospheric Stability, J. Climate, 19, 6425–6432, 2006.
Yost, C. R., Minnis, P., Sun-Mack, S., Smith, W. L., and Trepte, Q. Z.: VIIRS Edition 1 Cloud Properties for CERES, Part 2: Evaluation with CALIPSO, Remote Sensing, 15, 1349, https://doi.org/10.3390/rs15051349, 2023.
Yuan, T., Song, H., Wood, R., Wang, C., Oreopoulos, L., Platnick, S. E., von Hippel, S., Meyer, K., Light, S., and Wilcox, E.: Global reduction in ship-tracks from sulfur regulations for shipping fuel, Science Advances, 8, eabn7988, https://doi.org/10.1126/sciadv.abn7988, 2022.
Yuan, T., Song, H., Wood, R., Oreopoulos, L., Platnick, S., Wang, C., Yu, H., Meyer, K., and Wilcox, E.: Observational evidence of strong forcing from aerosol effect on low cloud coverage, Science Advances, 9, eadh7716, https://doi.org/10.1126/sciadv.adh7716, 2023.