the Creative Commons Attribution 4.0 License.
the Creative Commons Attribution 4.0 License.
 | 20 Nov 2025
Measurement report: Variations and environmental impacts of atmospheric N2O5 concentrations in urban Beijing during the 2022 Winter Olympics
Tiantian Zhang
Peng Zuo
Yi Chen
Tong Liu
Linghan Zeng
The chemistry of nitrate radical (NO3) and dinitrogen pentoxide (N2O5) plays a pivotal role in tropospheric nighttime chemistry. Given their close linkage to precursor variations, emission reduction during the 2022 Beijing Winter Olympics likely affected NO3 and N2O5 behavior. In this study, we measured N2O5, NO2, O3, etc. during and after the Olympics, and compared pollutant levels as well as the contributions of reaction pathways to the loss of NO3 and N2O5. Throughout the entire observation period, NO3 production rate averaged 0.5 ± 0.4 ppbv h−1, and the N2O5 mixing ratio could reach up to 875 pptv within 1 min, indicating their active production. The relatively long nighttime N2O5 lifetime (), with an average of 11.9 ± 11.8 min, suggested a slow N2O5 loss rate during winter season. Despite low NO mixing ratio (below 3 ppbv), it dominated NO3 loss (79.0 %). VOCs oxidation contributed 0.2 %, primarily driven by styrene. During the Olympics, emission reductions led to decreased NO and VOCs, which in turn reduced their reaction with NO3. The heterogeneous uptake of N2O5, another key NO3 loss pathway – accounted for 20.8 % of NO3 loss during the Olympics, but this contribution decreased to 10.6 % after the Olympics. This uptake is crucial for nighttime NO3 removal and would be essential for winter nitrate formation in urban Beijing. Our results highlight that under emission control scenarios, the relative importance of heterogeneous processes in nocturnal NO3 cycling increases, providing new insights into how emission reduction measures shape nighttime oxidation processes in polluted urban environments.
- Article
(3097 KB) - Full-text XML
-
Supplement
(718 KB) - BibTeX
- EndNote


Nitrate radical (NO3) and dinitrogen pentoxide (N2O5) play crucial roles in the nocturnal atmospheric chemical cycle, controlling the removal and conversion of nitrogen oxides (NOx) and volatile organic compounds (VOCs). They significantly contribute to the formation of nitrate and secondary organic aerosols during the nighttime (Crutzen, 1979; Wayne et al., 1991). NO3 primarily originates from the reaction of NO2 with O3 (Reaction R1), while it rapidly establishes a thermodynamic equilibrium (Reaction R2) with N2O5. This tight coupling species are frequently considered simultaneously in atmospheric chemistry studies. During daytime, however, the rapid photolysis of NO3 (Reaction R3) and its reaction with NO (Reaction R4) result in a short NO3 lifetime (<5 s). Consequently, the concentrations of NO3 and N2O5 usually fall below the detection limit of analytical instruments during daylight hours.
The direct removal pathways of NO3 include heterogeneous reactions on particulate matter surfaces and gas-phase reactions with NO (Reaction R4) and VOCs (Reaction R5), which can influence the atmospheric lifetimes of nighttime NOx and VOCs (Ng et al., 2017; Wayne et al., 1991). NO3 is also capable of reacting with alkenes in an addition reaction and subsequently with O2 to form peroxy radicals (RO2), which further generates organic nitric acid, one of the important sources of secondary organic aerosols (Fry and Sackinger, 2012; Hoyle et al., 2007; Pye et al., 2010). The removal pathways of N2O5 represent indirect removal pathways for NO3 chemistry (Reaction R6), primarily involving reactions with water vapor and heterogeneous reactions on cloud droplets or particle surfaces (Brown and Stutz, 2012; Chang et al., 2011).
In recent years, anthropogenic emission control measures have played a pivotal role in improving air pollution in China with notable declines in NOx emissions (Li et al., 2020; Zhang et al., 2016). However, NOx emission intensity remains relatively high (Li et al., 2024). Reactive nitrogen-containing compounds have emerged as a prominent factor in China's complex air pollution scenario (Zhu et al., 2023). With advancements in measurement techniques, several research teams have explored the core processes of reactive nitrogen species in atmospheric pollution, particularly in regions with severe atmospheric pollution such as the North China Plain, the Yangtze River Delta, and the Pearl River Delta (Li et al., 2020; Tham et al., 2016; Wang et al., 2018, 2020, 2024, 2013; Yun et al., 2018). While NO3 reactivity is typically attenuated under low-temperature winter conditions, thereby restricting its oxidative capacity, multiple studies – including winter campaigns such as Yun et al. (2018) and Yan et al. (2023) – have demonstrated the significance of nocturnal NO3 chemistry in cold seasons.
Emerging evidence further highlights the sensitivity of nocturnal NO3 chemistry to emission controls: increases in nocturnal NO3 production rates enhance nighttime oxidation capacity (Wang et al., 2023a), and urban nocturnal NO3 concentrations may even experience “explosive” growth under stringent emission reduction policies (Wang et al., 2023b). In the Beijing region specifically, Yan et al. (2023) showed that the contribution of nocturnal nitrogen chemistry to winter haze has increased in recent years. Despite these advances, gaps remain in our understanding how short-term, large-scale emission control measures – such as those implemented during major events – influence the balance between production and loss, and their subsequent impacts on nighttime secondary pollution.
The 2022 Beijing Winter Olympics (BWO) provided a unique opportunity to address this gap. To ensure high air quality during the event, a series of strict emission reduction measures were implemented in Beijing and its surrounding areas, leading to a significant decline in PM2.5 concentrations (average 24 µg m−3) compared to historical levels for the same period (Huang et al., 2024). Given the close linkage between and their precursors (NO2, O3, and VOCs), this emission cuts were expected to alter the behavior of NO3 and N2O5.
In this study, we conducted field observations of N2O5, NO2, O3, NO, VOCs, and meteorological parameters in urban Beijing during (5–20 February 2022) and after (21 February–3 March 2022) the BWO. Our objectives were to: (1) characterize the temporal variations of N2O5 and NO3 in urban Beijing during winter; (2) quantify the contributions of different reaction pathways to NO3 and N2O5 loss; and (3) assess how the BWO emission reduction measures modulated nocturnal chemistry. The findings provide critical insights into the response of nighttime reactive nitrogen chemistry to short-term emission controls, with implications for air quality management in polluted urban environments.
2.1 Site description
Field measurements were conducted from 5 February to 3 March 2022 at an urban site in Beijing. The observation location was situated on the rooftop of the NO. 1 Science Building at Peking University in Beijing (39.99° N, 116.31° E, 61.6 m a.s.l.). As shown in Fig. 1, the location is proximal to the North Fourth Ring Road – one of Beijing's major traffic arteries – and within 1 km of two primary traffic corridors (east-west along the North Fourth Ring Road and north-south along Zhongguancun Street). The surrounding area features mixed land use, including residential complexes (within 500 m) and low-intensity commercial facilities (within 1 km), with no large industrial sources within a 5 km radius. This setting makes the site representative of a typical urban mixed-use area impacted by fresh anthropogenic emissions (e.g., traffic-related NOx and VOCs), consistent with previous characterizations of this location (Hu et al., 2023; Wang et al., 2017a; Yao et al., 2023).
Sampling inlets were installed 1.5 m above the rooftop, approximately 20 m above ground level. Throughout the measurement period, the prevailing wind direction was predominantly from the northwest, with an average wind speed of 2.0 ± 2.0 m s−1.
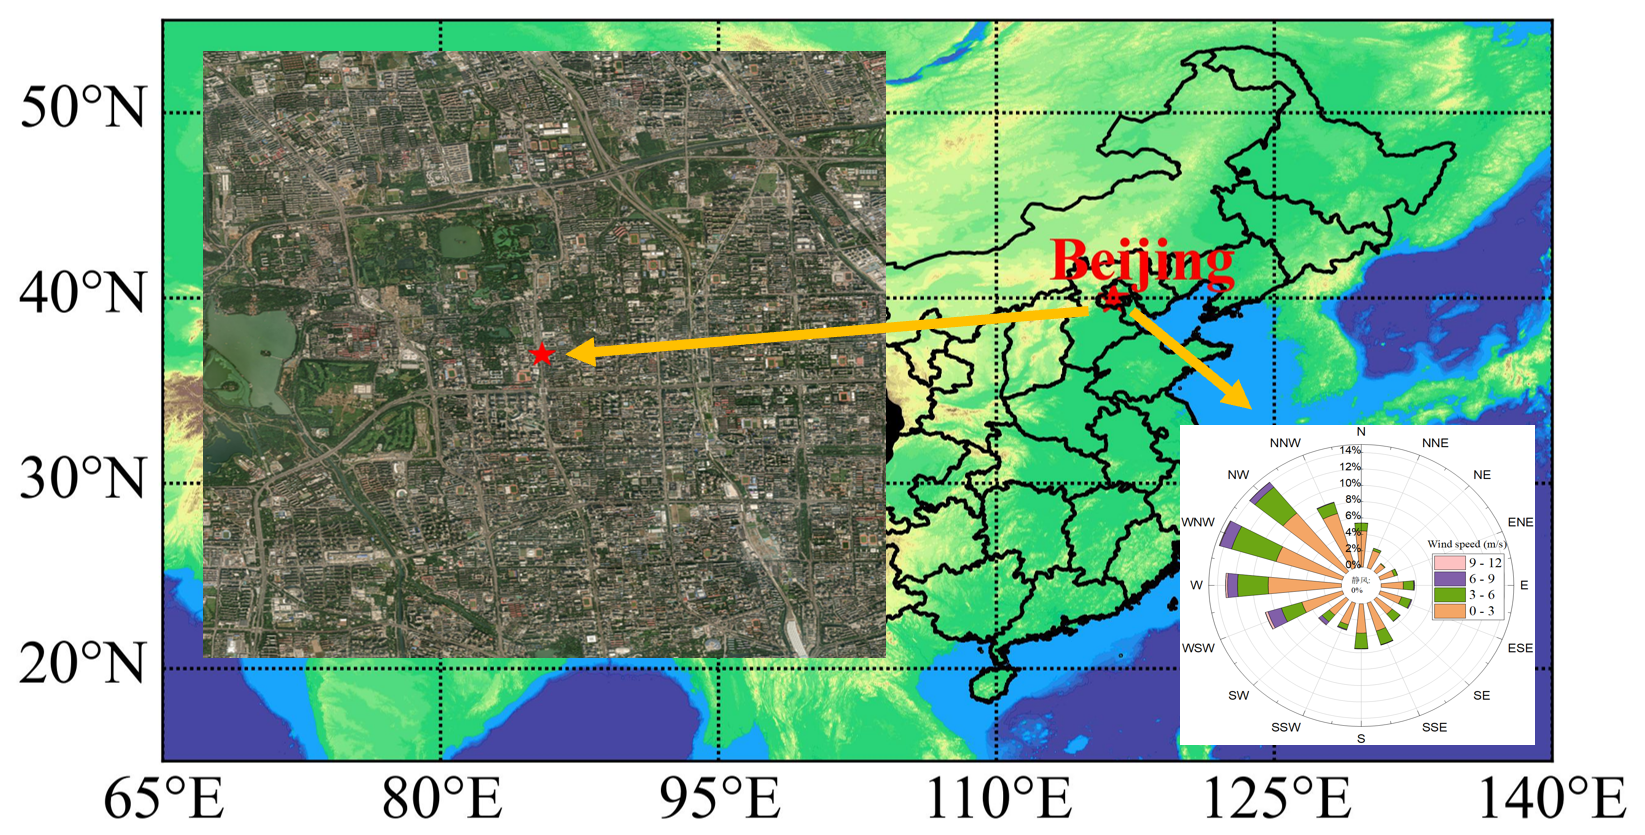
Figure 1Measurement site, surroundings, and wind rose (winter 2022). Base map adapted from https://map.baidu.com/ (last access: 20 September 2025); wind rose generated from on-site meteorological observations.
2.2 Instrument setup
2.2.1 Measurement of NO3 and N2O5
Ambient concentrations of NO3 and N2O5 were determined utilizing an in-house-developed cavity ring-down spectroscopy (CRDS) analyzer, operating at a wavelength of 662 nm (Zhang et al., 2024). The analyzer employs a dual-channel design for simultaneous detection: Channel 1 directly measures NO3 concentrations under ambient temperature conditions; Channel 2 maintained at 150 °C to thermally decompose N2O5 into NO3, enabling quantification of the total concentration of [NO3+ N2O5].
During this observation campaign, the NO3-specific detection channel (Channel 1) malfunctioned due to the damage of the mirror, limiting measurements to the combined [NO3+ N2O5] signal from Channel 2. NO3 concentrations were subsequently derived using the thermodynamic equilibrium relationship between NO3 and N2O5 (Eq. 1 in Sect. 2.3), with input parameters including measured N2O5, NO2 concentrations, and ambient temperature. Under winter conditions (low temperature and relatively high NO2 levels), the ratio is inherently low (∼1 %), ensuring that [NO3+ N2O5] is dominated by N2O5 and derived NO3 concentrations are reliable.
The limit of detection (LOD) of the CRDS system was calculated as 2.9 pptv, with a measurement uncertainty of ± 13.7 % (Zhang et al., 2024). To ensure measurement accuracy, regular calibrations were performed using a stable dynamic generation system for NO3 and N2O5 standard gases (Zhang et al., 2026). The detailed technical specifications of the instrument are provided in Sect. S1 of the Supplement.
2.2.2 Measurement of other species
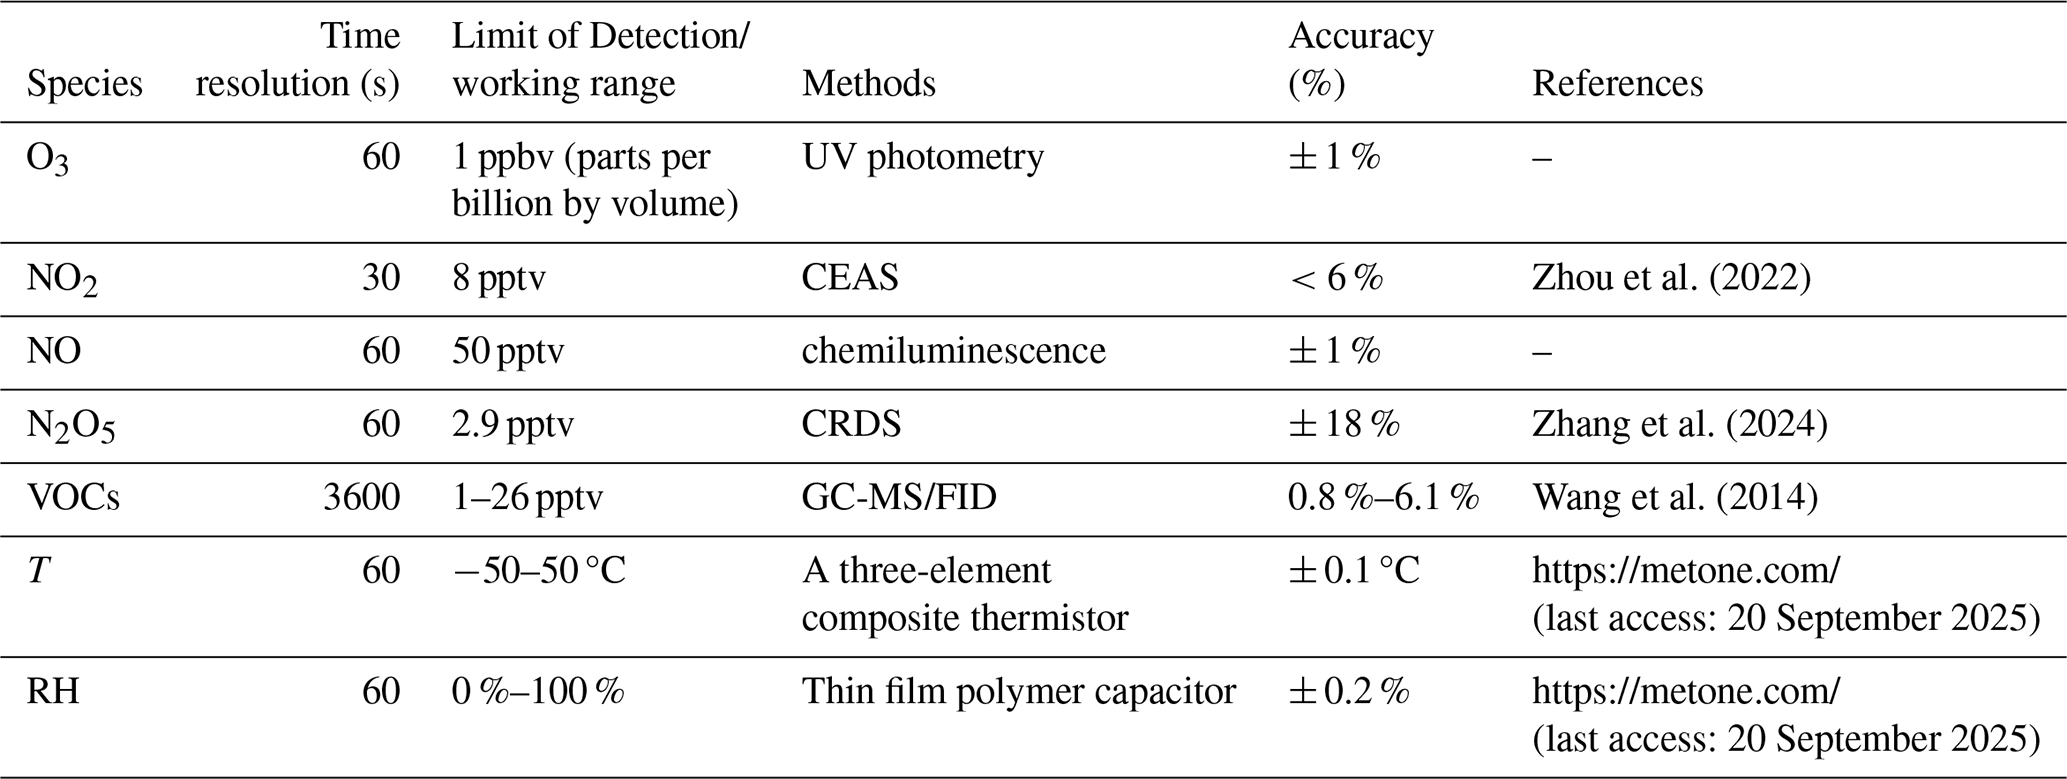
Concentrations of NO, NO2, O3, VOCs, and meteorological parameters were measured using commercial or well-validated analytical instruments, with details summarized in Table 1. NO and O3 mixing ratios were measured using commercial instruments, specifically the Model 42i-Y and Model 49i from Thermo Fisher Scientific (USA). NO2 mixing ratios were observed via a cavity-enhanced absorption spectroscopy (CEAS) (Zhou et al., 2022). Calibrations of these instruments are performed weekly using the standard gases of known concentrations, and the R2 of the standard curve for each calibration is greater than 0.99. VOC concentrations were determined using a gas chromatograph equipped with mass spectrometry and flame ionization detectors (Wang et al., 2014). This system measures 99 VOC species with a time resolution of 1 h, LOD range of 1–26 pptv, and accuracy of 0.8 %–6.1 %. Quality control included weekly zero/span checks (using ultra-high-purity nitrogen and a multi-component VOC standard) and a post-campaign full calibration, which confirmed linearity (R2>0.996) and negligible intercepts for all target VOCs. The photolysis rate constants (j-values) were obtained using a spectroradiometer (Metcon CCD-Spectrograph, Garmisch-Partenkirchen, Germany) (Bohn et al., 2008). This instrument quantifies two primary photolysis channels (NO3+ hv → NO2 + O(3P) and NO3 + hv → NO + O2), with total j(NO3) calculated as the sum of the two channel-specific rate constants (j(NO3)_total = j(NO3)_M + j(NO3)_R). Meteorological parameters, including wind direction, wind speed, temperature (T), and relative humidity (RH), were monitored utilizing a sensor meteorological measurement system (Metone, USA). The PM2.5 concentration data were obtained from the Beijing Municipal Ecological and Environmental Monitoring Center (http://www.bjmemc.com.cn/, last access: 20 September 2025). Detailed information about these instruments is listed in Table 1.
2.3 Calculation methods
When N2O5 concentrations are obtained, the concentration of NO3 can be determined by dividing the concentration of N2O5 by the equilibrium constant Keq and the concentration of NO2 (Osthoff et al., 2006; Wang et al., 2017b), which is specified in Eq. (1).
Here, Keq represents the temperature-dependent equilibrium constant established when NO3 attains steady-state equilibrium with N2O5, and is given by exp(10724/T), where T is the temperature in Kelvin (Wang et al., 2024).
The primary source of NO3 and N2O5 is the chemical reaction of NO2 with O3. Consequently, the concentrations of NO2 and O3 are key factors influencing the production rate of NO3 (P(NO3)). This production rate is mathematically represented by Eq. (2) (Brown et al., 2011). Assuming that the formation and loss processes of NO3 and N2O5 are in a state of dynamic equilibrium, the lifetime of N2O5, denoted as , can be expressed as the ratio of its concentration to the rate of NO3 production, as determined by Eq. (2) (Brown and Stutz, 2012; Lin et al., 2022; Wang et al., 2017a).
The total reactivity of NO3 () represents the sum of all first-order loss processes for NO3, including photolysis, reaction with NO, reaction with VOCs, and indirect loss via N2O5 heterogeneous uptake. It is calculated using Eq. (4) (Wang et al., 2020): The nocturnal NO3 loss rate, denoted as L(NO3), is calculated via Eq. (5).
Here, j(NO3) denotes the photolysis rate constant for NO3 decomposition. The rate coefficients and correspond to the rate coefficients for reaction Eqs. (1) and (4), respectively, as referenced in Atkinson et al. (2004). The reactivity of NO3 with VOCs () is characterized by a first order loss rate constant, calculated as the product of the reaction rate constant ki and the VOC concentrations [VOCi].
represents the total first-order loss rate coefficient for the heterogeneous uptake of N2O5 at the aerosol surface, which is governed by the uptake coefficient γ (N2O5), the aerosol surface area density Sa (µm2 cm−3), and the mean molecular speed of N2O5, c, as described in Eq. (3).
The mean molecular speed c is calculated as , where R is the gas constant (8.314 J mol−1 K−1), T is temperature (K), and M is the molar mass of N2O5 (0.108 kg mol−1). γ (N2O5) is a critical parameter describing the efficiency of N2O5 uptake on aerosol surfaces, influenced by aerosol composition (e.g., organic coatings, nitrate/sulfate content) and meteorological conditions (RH, temperature) (Bertram et al., 2009; Tang et al., 2014; Yu et al., 2020). It was determined using the steady-state method (Brown et al., 2016; Lin et al., 2022; Lu et al., 2022), which relies on linear regression of Keq [NO2] and 1/4 cSaKeq [NO2] (Eq. 7).
Here, the slope of the regression equals γ (N2O5), and the intercept equals . To minimize interference from non-steady-state conditions, data fitting was data fitting was performed under the following constraints:
(1) Meteorological constraint: RH < 70 % (avoiding excessive water vapor interference); (2) Chemical constraints: NO < 1 ppbv (suppressing NO-NO3 titration), [N2O5] > LOD (2.9 pptv, ensuring reliable equilibrium calculations); (2) Timing constraint: Data selected 2–3 h post-sunset (when the NO3-N2O5 equilibrium is most stable). Negative intercepts (physically implausible, arising from ) were excluded, resulting in 23 valid data points for γ (N2O5) calculation.
Aerosol surface area density (Sa)
Due to the unavailability of direct particle size distribution measurements, Sa was derived from PM2.5 concentrations using an empirical formula validated for winter Beijing conditions (Zhang et al., 2022):
This formula exhibits a strong linear correlation (R2=0.82) with PM2.5 and is applicable for PM2.5 concentrations <200 µg m−3 – consistent with the PM2.5 range observed in this study (average: 24 ± 21 µg m−3, maximum: 131 µg m−3).
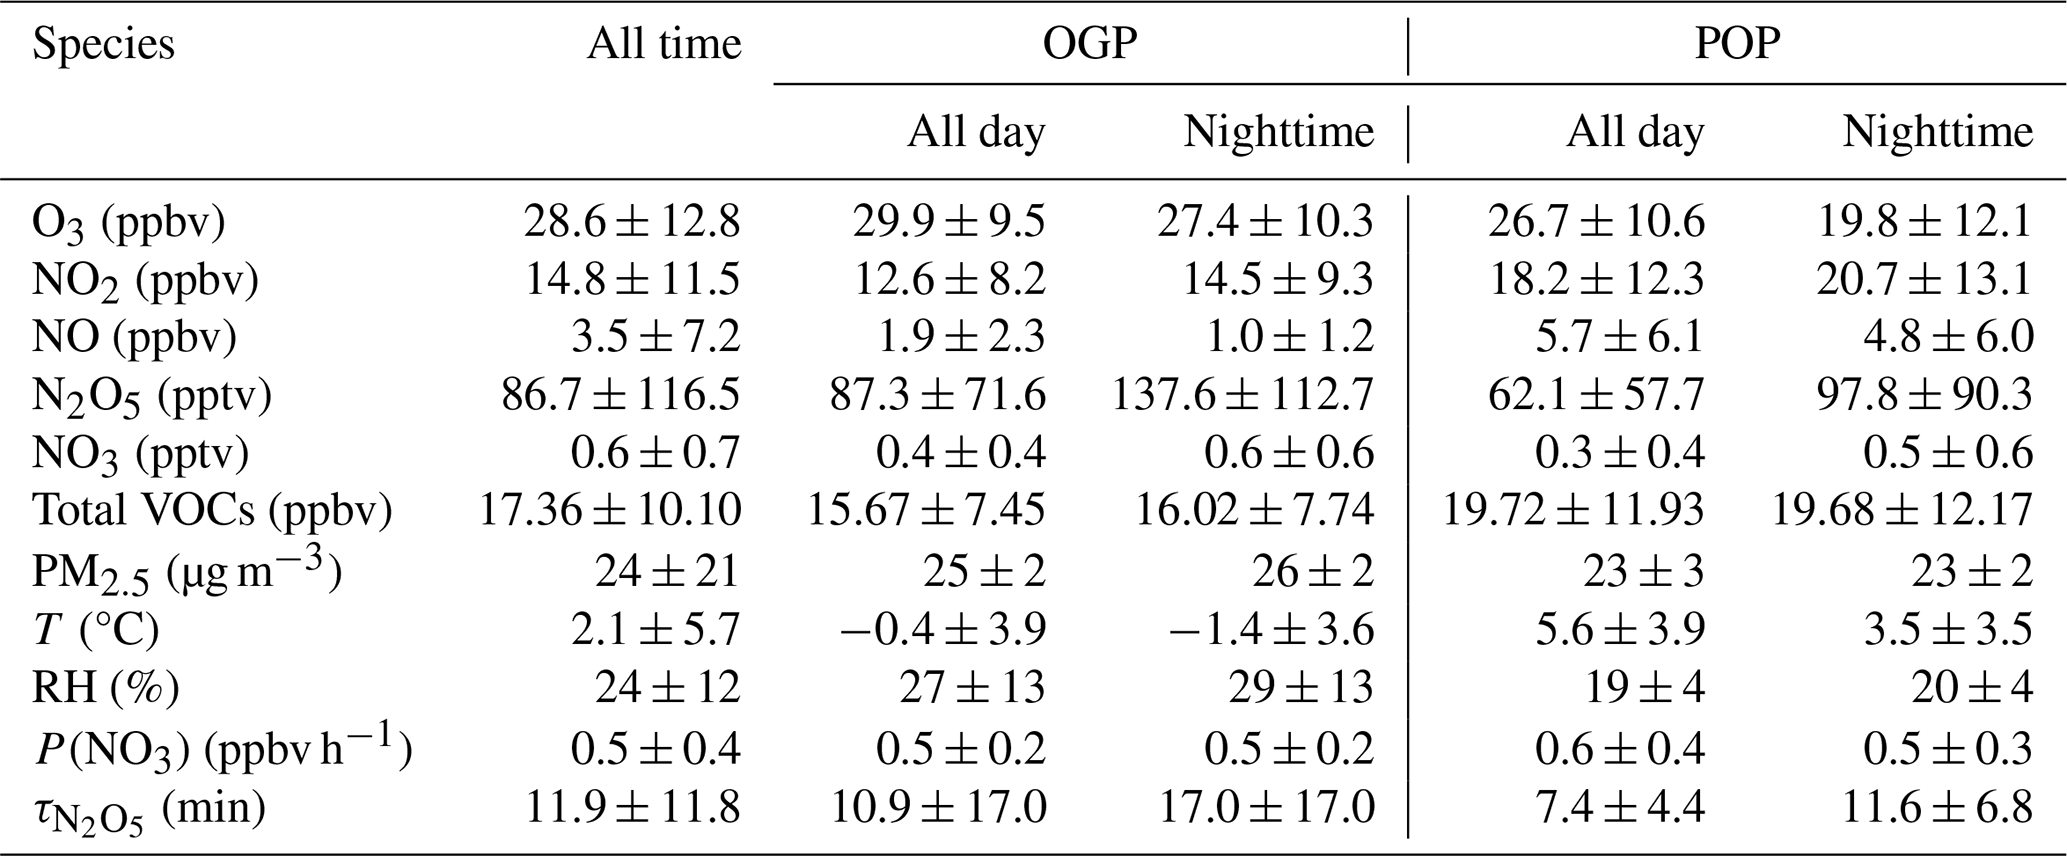
3.1 Measurements overview
Figure 2 illustrates time-series variations in the mixing ratios of N2O5 and associated trace gases, alongside meteorological parameters, captured during the 2022 Beijing Winter Olympics (BWO) at a temporal resolution of 1 min. Valid data were systematically acquired over a 26-d span, from 5 February to 3 March. In alignment with the 2022 Beijing Winter Olympics timeline, the observation interval was bifurcated into two distinct periods: (1) the Olympic Games Period (OGP; spanning 5–20 February), and (2) the Post-Olympics Period (POP; extending from 21 February to 3 March). Comprehensive statistical metrics for each period are meticulously detailed in Table 2.
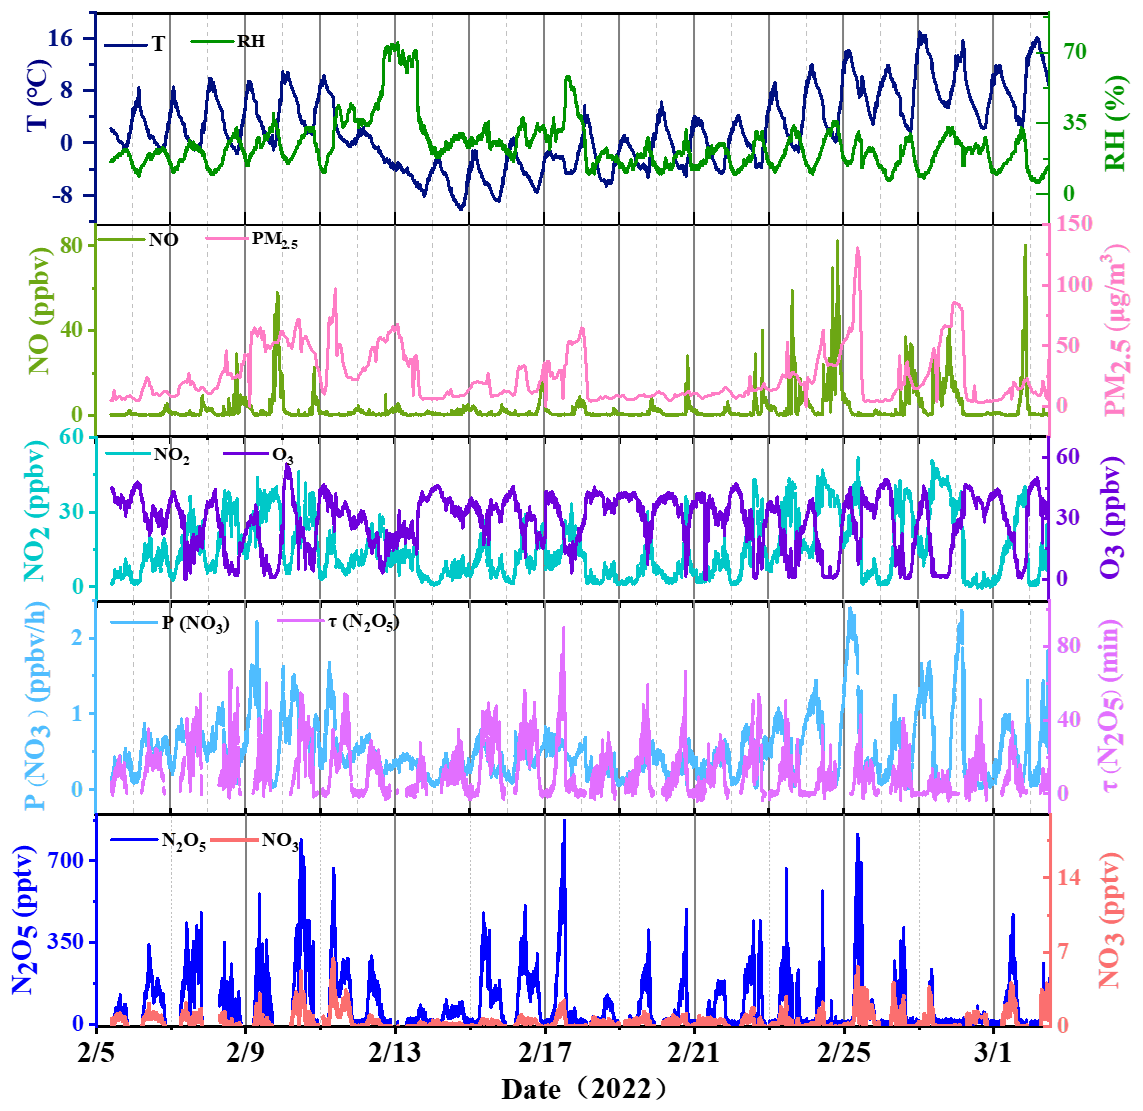
Figure 2Time series for N2O5, NO3, related trace gases, and meteorological data (T and RH) measured in Beijing from 5 February to 3 March 2022.
Table 2Summary of observed parameters for the two periods (mean ± standard deviation).
3.1.1 Meteorological conditions and PM2.5
Meteorological conditions differed notably between the OGP and POP, driving variations in pollutant dispersion and chemical reactivity:
-
Temperature: Nocturnal temperatures during the OGP were predominantly below freezing (average: −1.4 ± 3.6 °C), while the POP saw a marked warming trend – nocturnal temperatures rose to 3.5 ± 3.5 °C (all-day average: 5.6 ± 3.9 °C, vs. −0.4 ± 3.9 °C in the OGP).
-
Relative Humidity (RH): The OGP exhibited higher RH (nocturnal average: 29 ± 13 %) compared to the POP (nocturnal average: 20 ± 4 %). A heavy snowfall event occurred during 13–14 February (OGP), coinciding with peak RH (> 60 %) and a transient increase in PM2.5 concentration (68 µg m−3).
-
PM2.5: The overall average PM2.5 concentration across the entire observation period was 24 ± 21 µg m−3, consistent with the improved air quality during the BWO (Huang et al., 2024). While PM2.5 levels were similar between the OGP (nocturnal average: 26 ± 2 µg m−3) and POP (nocturnal average: 23 ± 2 µg m−3), the POP experienced a severe pollution episode with PM2.5 peaking at 131 µg m−3 – likely driven by relaxed emissions and stagnant meteorological conditions.
The aerosol surface area density, a key parameter for N2O5 heterogeneous uptake calculations (Eq. 8), was derived from PM2.5 concentrations. The overall average Sa was 402 ± 215 µm2 cm−3, with values in the OGP (nocturnal average: 417 ± 208 µm2 cm−3) slightly higher than in the POP (nocturnal average: 385 ± 205 µm2 cm−3), reflecting the influence of PM2.5 and RH-driven aerosol growth.
3.1.2 Precursor gases (NO, NO2, O3)
Concentrations of NOx (NO + NO2) and O3 – key precursors for production (Reaction R1) – exhibited distinct differences between the OGP and POP, directly reflecting the impact of emission controls:
-
NO: The OGP observed significantly lower NO concentrations compared to the POP – nocturnal NO averaged 1.0 ± 1.2 ppbv (OGP) vs. 4.8 ± 6.0 ppbv (POP). This contrast confirms BWO emission reductions effectively curbed primary NO emissions (e.g., traffic, industry), which further modulated O3 and NO2 dynamics.
-
NO2: Inverse to NO, NO2 concentrations were higher in the POP. Nocturnal NO2 averaged 20.7 ± 13.1 ppbv in the POP, compared to 14.5 ± 9.3 ppbv in the OGP. The increase in NO2 during the POP is attributed to enhanced NO oxidation by O3, driven by higher post-Olympic NO emissions.
-
O3: Nocturnal O3 levels were substantially higher in the OGP (27.4 ± 10.3 ppbv) than in the POP (19.8 ± 12.1 ppbv), despite similar all-day averages (OGP: 29.9 ± 9.5 ppbv; POP: 26.7 ± 10.6 ppbv). The lower nocturnal O3 in the POP results from intensified O3 titration by elevated NO, a process that simultaneously increases NO2 concentrations. Notably, the overall mean O3 concentration (28.6 ± 12.8 ppbv) was lower than spring values in Beijing (Wang et al., 2018), consistent with reduced photochemical O3 production in winter.
The average NOx concentration (18.2 ± 16.6 ppbv) during the study was also substantially lower than autumn values at this site (typically >30 ppbv) (Li et al., 2022; Wang et al., 2017a), further highlighting the effectiveness of winter emission controls.
3.1.3 N2O5 and NO3 concentrations
N2O5 concentrations exhibited significant temporal variability throughout the observation period, with a mean daily value of 86.7 ± 116.5 pptv and a maximum of 874.9 pptv (00:15 LST on 18 February, OGP) – coinciding with moderate NO2 (14.6 ppbv), O3 (26.8 ppbv) and extremely low NO (0.4 ppbv) that minimized NO3 titration.
NO3 concentrations were derived from the NO3-N2O5 equilibrium (Eq. 1), with a mean value of 0.6 ± 0.7 pptv (maximum: 4.6 pptv). Nocturnal NO3 levels followed the same trend as N2O5: higher in the OGP (0.6 ± 0.6 pptv) than in the POP (0.5 ± 0.6 pptv). This derived NO3 concentration is notably lower than observations in Shanghai (16 ± 9 pptv) (Wang et al., 2013), likely due to Beijing's lower winter temperatures (which suppress NO3 production) and higher NO emissions (which enhance NO3 loss).
3.1.4 NO3 production rate and N2O5 lifetime
The NO3 production rate, calculated via Eq. (2) as the product of the NO2 + O3 reaction rate constant and precursor concentrations, averaged 0.5 ± 0.4 ppbv h−1 across the entire observation period, with a maximum of 2.4 ppbv h−1. This value aligns with winter observations in the Beijing area (0.4 ppbv h−1) (Wang et al., 2021) and summer measurements at Mount Tai (0.45 ± 0.40 ppbv h−1) (Wang et al., 2017c), but is lower than autumn values in Beijing (2.25 ± 2.02 ppbv h−1) (Wang et al., 2017a) and summer measurements in Taizhou (1.2 ± 0.3 ppbv h−1) (Li et al., 2020). The relatively low P(NO3) in this study is primarily driven by winter's low temperatures, which reduce the NO2 + O3 reaction rate constant: for example, at identical NO2 (15 ppbv) and O3 (30 ppbv) concentrations, increasing temperature from −1 to 5 °C raises the rate constant from to cm3 molecule−1 s−1, leading to a 19 % increase in P(NO3) (from 0.70 to 0.83 ppbv h−1).
The N2O5 lifetime, a key indicator of N2O5 removal efficiency (Eq. 2), averaged 11.9 ± 11.8 min across the study – longer than summer values in Beijing (270 ± 240 s) (Wang et al., 2018) and rural Wangdu (77–172 s) (Tham et al., 2016), but shorter than observations in the Hong Kong boundary layer (Brown et al., 2016). This prolonged winter suggests slower nocturnal loss, consistent with lower winter temperatures and reduced heterogeneous reactivity.
Notably, differed significantly between the OGP and POP: the nocturnal mean lifetime was 17.0 ± 17.0 min in the OGP, compared to 11.6 ± 6.8 min in the POP – a ∼5-min reduction. This difference is primarily driven by variations in N2O5 concentrations (rather than P(NO3), which was similar between periods: OGP nocturnal P(NO3)=0.5 ± 0.2 ppbv h−1; POP = 0.5 ± 0.3 ppbv h−1).
3.2 Mean diurnal variations
Figure 3 displays the average diurnal variations in NO, NO2, N2O5, NO3, O3 mixing ratios, and P(NO3) during the study period. Specifically, panel (a) presents the daily mean patterns for the OGP, whereas panel (b) depicts those for the POP. Notable differences in concentration but similar diurnal trends were observed between the two periods.
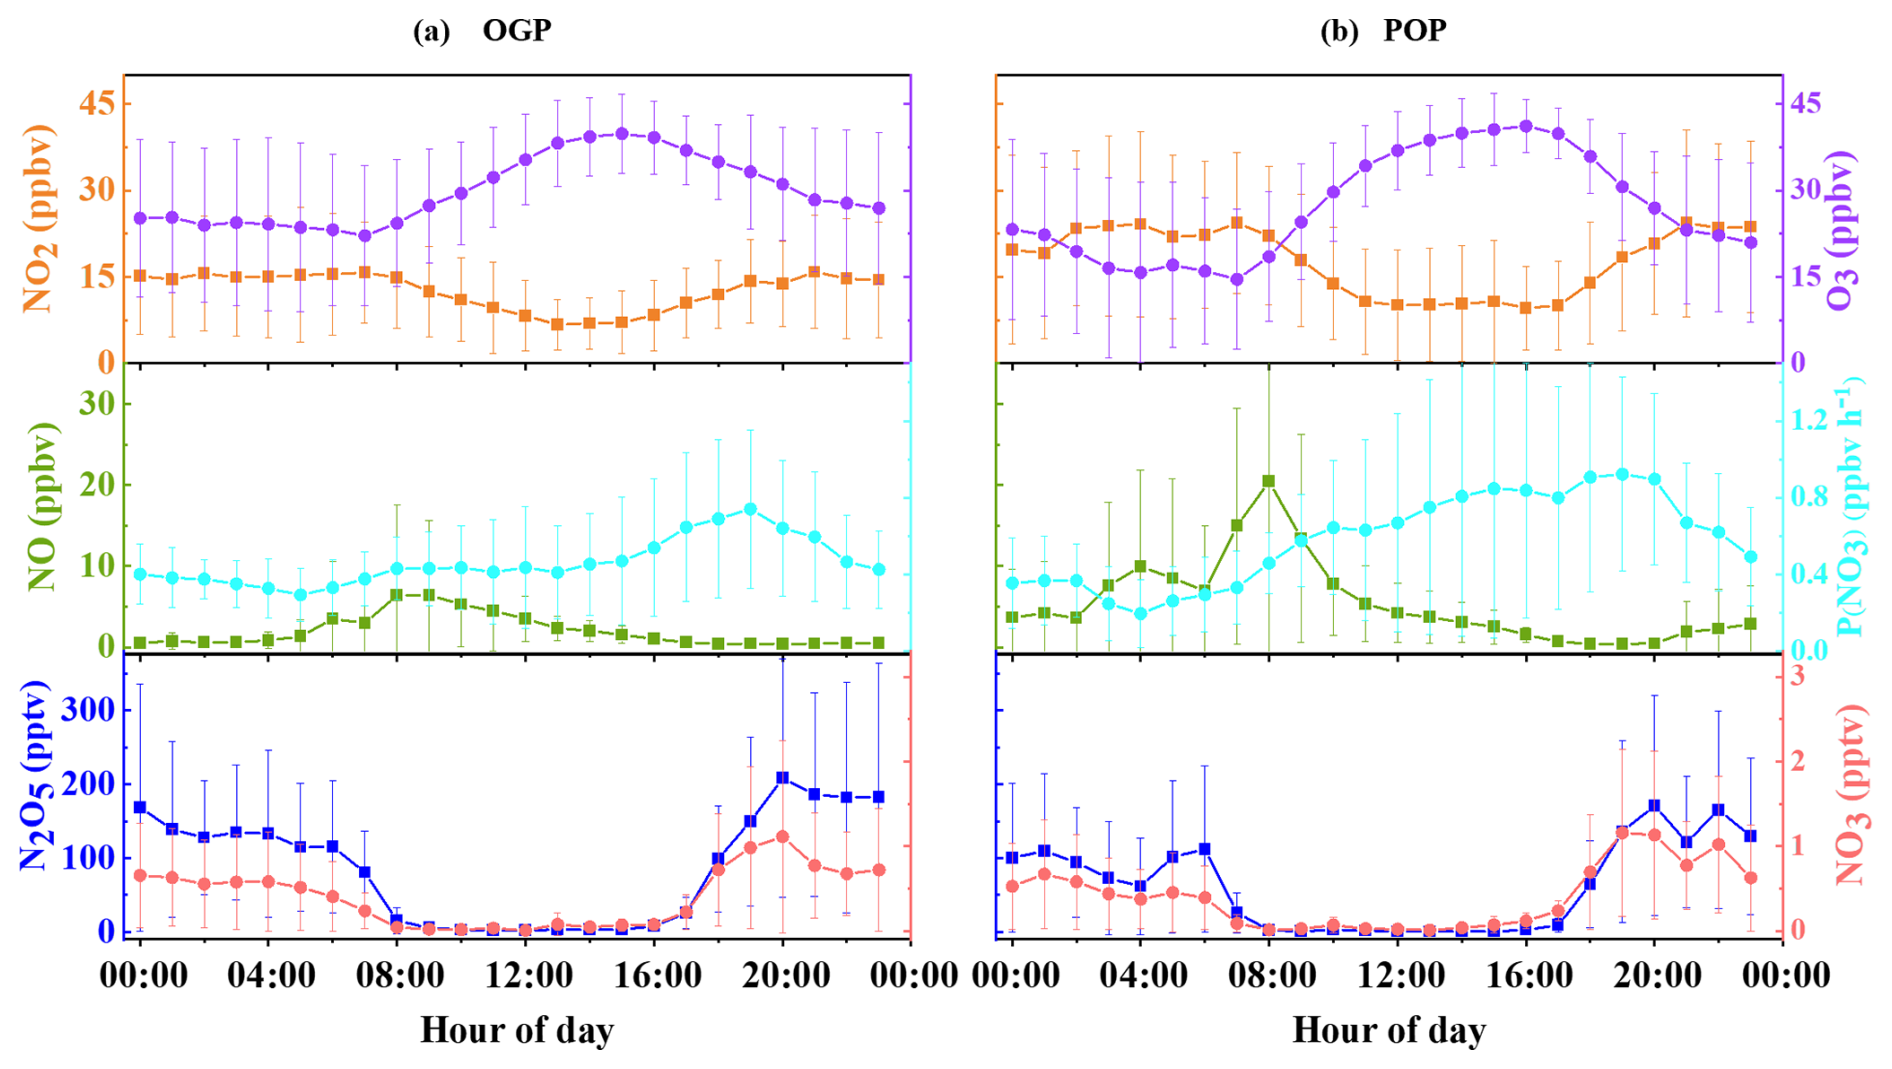
Figure 3Mean diurnal variations in NO, NO2, N2O5, NO3, O3 mixing ratios and P(NO3) during (a) the Olympic Games Period (OGP) and (b) the Post-Olympics Period (POP). Data represent hourly means with error bars indicating the standard deviation; non-physical values <0 (for NO3) have been excluded.
3.2.1 Diurnal cycles of precursor gases (NO, NO2, O3)
The diurnal variations of NO, NO2, and O3 exhibit strong interdependencies, consistent with well-documented atmospheric chemical processes (e.g., O3 titration by NO, NO2 photolysis) and anthropogenic emission patterns.
Nocturnal NO mixing ratios were substantially lower in the OGP than in the POP, with OGP nighttime values remaining below 2 ppbv (average: 1.0 ± 1.2 ppbv) and POP values frequently exceeding 4 ppbv (average: 4.8 ± 6.0 ppbv). Both periods showed two distinct daily peaks in NO, aligned with morning (06:00–08:00 LST) and evening (18:00–20:00 LST) traffic rush hours – confirming traffic as the primary NO source. The morning peak was particularly pronounced in the POP, reaching 20.4 ppbv at 08:00 LST (vs. 6.4 ppbv at 06:00 LST in the OGP), directly attributable to relaxed post-Olympic traffic emission controls.
NO2 concentrations displayed an inverse diurnal trend to O3, with nocturnal levels consistently higher than daytime values (OGP: 14.5 ± 9.3 ppbv nighttime vs. 12.6 ± 8.2 ppbv all-day; POP: 20.7 ± 13.1 ppbv nighttime vs. 18.2 ± 12.3 ppbv all-day). This pattern arises from reduced daytime NO2 photolysis (NO2+ hv → NO + O) and enhanced nocturnal NO oxidation. The POP saw higher NO2 concentrations across all hours, with the nocturnal peak (24.3 ppbv at 21:00 LST) exceeding the OGP peak (15.9 ppbv at 21:00 LST) by ∼ 35 % – a result of elevated NO emissions driving more O3-to-NO2 conversion.
O3 exhibited a classic mid-afternoon peak in both periods, rising gradually after sunrise (07:00 LST) as photochemical production intensified, and peaking between 15:00–16:00 LST (OGP: 39.9 ppbv; POP: 41.2 ppbv). Nocturnal O3 levels, however, differed sharply: the OGP maintained higher nighttime O3 (27.4 ± 10.3 ppbv) compared to the POP (19.8 ± 12.1 ppbv), with the POP O3 concentration dropping to a minimum of 14.6 ppbv at 07:00 LST (vs. 22.2 ppbv in the OGP). This discrepancy stems from intensified O3 titration by NO in the POP – higher NO concentrations rapidly consume O3 via NO + O3→ NO2 + O2, reducing the O3 pool available for NO3 production (Reaction R1).
3.2.2 Diurnal cycles of NO3 production rate
P(NO3) exhibited a strong diurnal pattern tied to the availability of its precursors (NO2 and O3) and the suppression of daytime NO3 loss.
In both periods, P(NO3) peaked shortly after sunset (19:00 LST), when O3 concentrations remained relatively high (OGP: 33.3 ppbv; POP: 30.6 ppbv) and NO emissions (and thus NO3 titration) were still low. The OGP peak P(NO3) was 0.74 ppbv h−1, slightly lower than the POP peak (0.92 ppbv h−1) – a difference driven by the POP's higher NO2 concentrations (18.4 ppbv at 19:00 LST vs. 14.2 ppbv in the OGP) offsetting its lower O3. Throughout the night, P(NO3) gradually declined in both periods: by 04:00 LST, it dropped to 0.33 ppbv h−1 (OGP) and 0.20 ppbv h−1 (POP), mirroring the nocturnal decrease in O3.
Notably, P(NO3) showed a strong first-order exponential decay correlation with NO concentrations (Fig. S2): when NO < 5 ppbv, P(NO3) decreased sharply with increasing NO (from 1.2 to 0.5 ppbv h−1); when NO > 10 ppbv, P(NO3) stabilized at < 0.3 ppbv h−1. This confirms NO is a dominant inhibitor of NO3 production – even small NO increases (e.g., POP rush hours) rapidly consume NO3 as it forms.
3.2.3 Diurnal cycles of N2O5 and NO3
N2O5 and NO3 exhibited nearly identical diurnal patterns in both periods, reflecting their tight thermodynamic equilibrium (Reaction R2) and shared dependence on precursor availability and loss pathways:
-
Post-sunset accumulation: Both species began accumulating rapidly after sunset (18:00 LST), as photolysis (a major daytime NO3 loss pathway) ceased. They reached peak concentrations around 20:00 LST – shortly after the P(NO3) peak – with OGP peaks (N2O5: 208.2 pptv; NO3: 1.1 pptv) exceeding POP peaks (N2O5: 171.2 pptv; NO3: 1.0 pptv) by ∼ 22 %. This difference is driven by the OGP's lower NO concentrations, which reduce NO3 titration (Reaction R4) and allow more N2O5 to form via equilibrium.
-
Nocturnal decline: After the 20:00 LST peak, N2O5 and NO3 concentrations gradually decreased in the OGP, falling to near-detection limits by sunrise (07:00 LST). The POP, however, showed a steeper decline between 02:00–04:00 LST: N2O5 dropped from 94.1 to 61.8 pptv, and NO3 from 0.6 to 0.3 pptv – attributed to elevated nocturnal NO emissions in the POP (peaking at 9.9 ppbv at 04:00 LST) that accelerate NO3 loss.
-
Morning secondary peak (POP only): A notable secondary peak in N2O5 (112.1 pptv at 06:00 LST) and NO3 (0.5 pptv at 06:00 LST) occurred in the POP, coinciding with a transient increase in O3 (1.3 ppbv) and decrease in NO (2.9 ppbv) before morning rush hour. This peak is absent in the OGP, likely because lower POP emission controls led to a larger “pre-rush” O3 pool that drives NO3 production, while OGP NO emissions remained too low to support such a transient precursor balance.
The daily average variation trends of both N2O5 and NO3 aligned with those reported for the Yangtze River Delta and North China regions (Li et al., 2020; Wang et al., 2022, 2017b). While the chemical conditions in this study bore similarities to those in summer Beijing, the meteorological conditions differed, notably characterized by higher relative humidity during the summer. The average nocturnal N2O5 concentration over the observation period was 113.7 ± 103.3 pptv, which was higher than that observed in the Changping area of Beijing (Wang et al., 2018), indicating that the loss process of NO3 and N2O5 in Beijing during winter is more sluggish compared to that in the summer.
4.1 Factoring influencing N2O5 lifetime
RH and Sa are well-recognized as pivotal factors regulating N2O5 lifetime in nocturnal atmospheric chemistry, as they directly modulate the efficiency of N2O5 heterogeneous uptake – the primary indirect loss pathway for NO3 (Brown et al., 2017; Lin et al., 2022). The correlation between these parameters and is presented in Fig. 4.
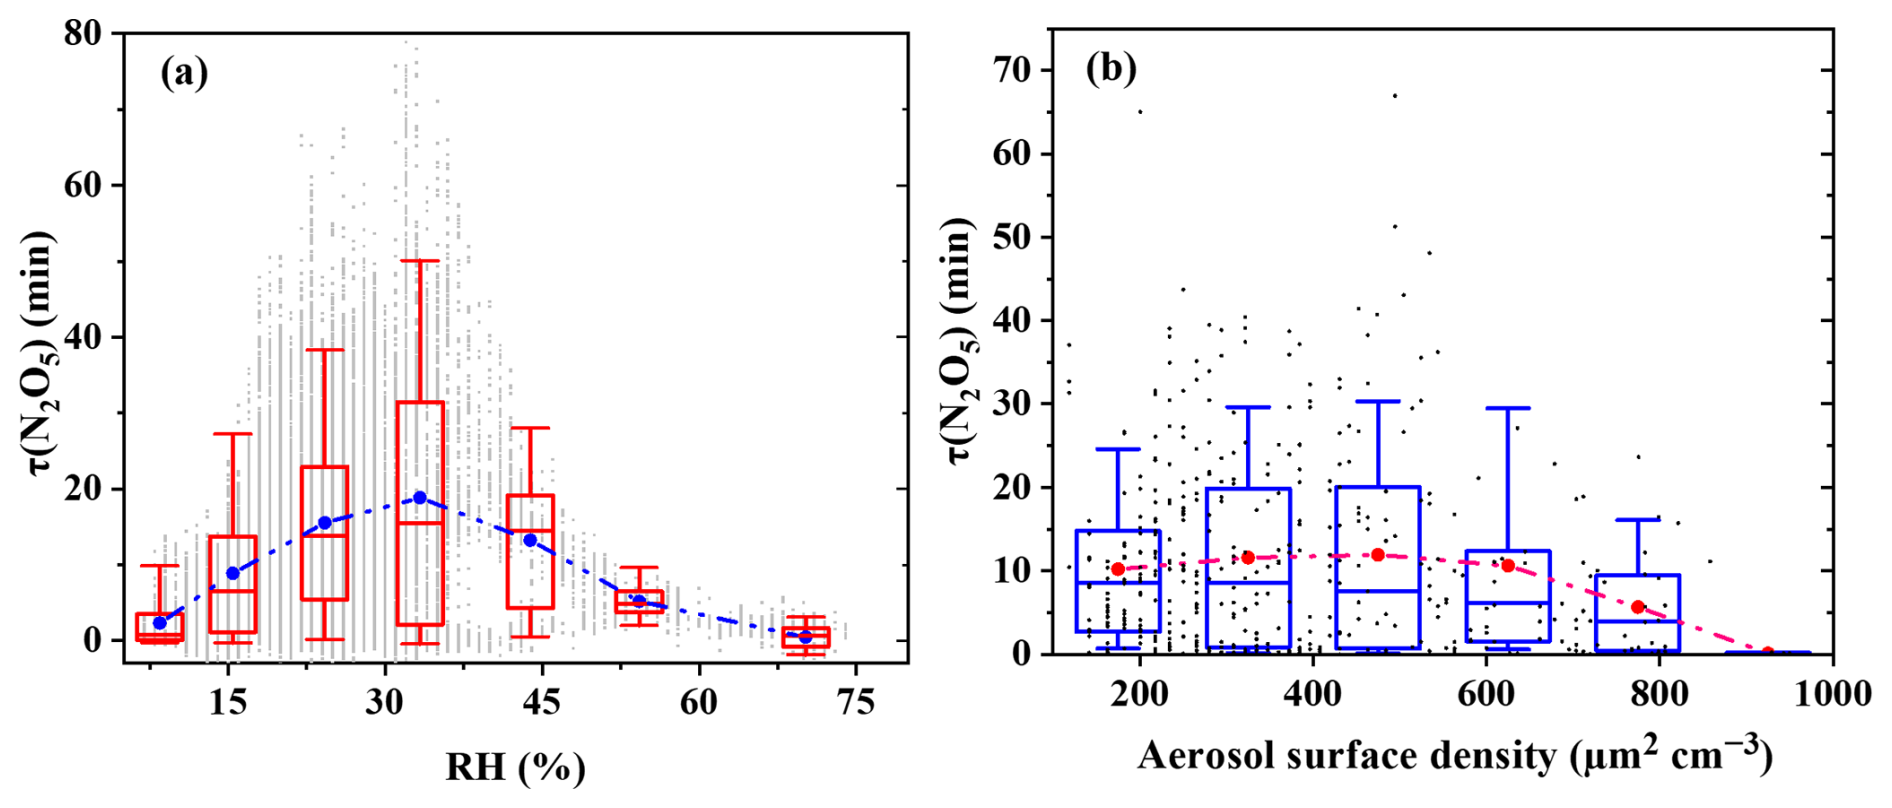
4.1.1 Relationship between and RH
As shown in Fig. 4a, the correlation between and RH exhibits a humidity-dependent dual pattern. At RH < 35 %, increased with RH – slight humidity rises softened hydrophobic organic coatings on aerosols (from traffic VOC oxidation), thereby reducing N2O5 heterogeneous uptake. RH > 35 %, the heterogeneous uptake rate of N2O5 increases, and decreases with increasing RH.
-
RH < 35 %: Counterintuitive increases with rising RH. Minimal aerosol liquid water content drives hydrophobic organic components – primarily oxidation products of traffic-related anthropogenic VOCs (AVOCs, e.g., styrene, propylene) – to condense into dense, impermeable coatings on particle surfaces (Bertram et al., 2009; Folkers et al., 2003; McNeill et al., 2006; Tang et al., 2014). These coatings act as a diffusion barrier, preventing N2O5 from reaching reactive aqueous sites (e.g., nitrate/sulfate-rich droplets) and lowering the heterogeneous uptake coefficient γ (N2O5) (Anttila et al., 2006; Yu et al., 2020). For example, at RH = 25 %, averaged 15.5 min, 43 % longer than the 8.9 min observed at RH = 15 %.
-
RH > 35 %: decreases with increasing RH (conventional trend). Above 35 % RH, the relationship aligns with physical expectations: declines as RH increases, driven by two synergistic effects. First, hygroscopic growth of aerosols (e.g., ammonium sulfate, sodium chloride) increases Sa, providing more reactive surface sites for N2O5 uptake. Second, elevated aerosol liquid water content accelerates N2O5 hydrolysis, which becomes the dominant N2O5 loss pathway (Brown et al., 2016; Chang et al., 2011). This effect is particularly pronounced when RH > 60 %: during the snowfall events on 13–14 February 2022, approached zero (0.8 ± 0.3 min), as high RH (> 85 %) maximized both aerosol growth and hydrolysis efficiency.
Notably, scattered data points in the 30 %–40 % RH range (e.g., ranging from 2 to 33 min at RH = 35 %) suggest interference from transient factors – such as sudden NO spikes or shifts in aerosol organic composition – which obscure the RH- relationship. A more comprehensive discussion of these confounding factors requires consideration of the organic composition of the aerosol.
4.1.2 Relationship between and Sa
Figure 4b depicts the dependence of on Sa, reflecting the interplay between Sa and other regulating factors (e.g., RH, organic coatings).
-
Sa < 325 µm2 cm−3: gradually increases with rising Sa. For low Sa values, gradually rises from ∼ 10 to 12 min as Sa increases. This non-monotonic pattern is driven by the co-occurrence of low Sa with extremely dry conditions (RH < 25 % for 68 % of data points in this Sa range).
-
Sa= 500–1000 µm2 cm−3: Robust negative correlation. Above a threshold Sa of ∼ 500 µm−2 cm−3, a clear negative correlation emerges: decreases from ∼ 12 to 6 min as Sa increases. This aligns with physical expectations, as higher Sa provides more reactive surface area for N2O5 heterogeneous uptake (Lin et al., 2022; Wang et al., 2020; Zhou et al., 2018).
Quantitative discrepancies between our results and summer studies (e.g., Zhou et al., 2018 reported < 5 min at Sa>600 µm2 cm−3in urban Beijing) are attributed to seasonal differences in aerosol liquid water content. Winter's lower RH (average: 24 ± 12 %) reduces aerosol liquid water content, lowering γ (N2O5) and slowing N2O5 loss – even at high Sa. This highlights the need for season-specific parameterizations of Sa- relationships in air quality models.
4.2 NO3 and N2O5 loss pathways
To quantify the mechanisms governing NO3 and N2O5 removal, we calculated total NO3 reactivity via Eq. (4) and dissected the contributions of individual loss pathways. The reaction rate constants for the interaction between VOCs and the oxidizing agent NO3 were obtained from the literature (Atkinson and Arey, 2003; Brown et al., 2011) or extracted from the National Institute of Standards and Technology database (accessible via http://webbook.nist.gov/chemistry/, last access: 20 September 2025). For certain VOC species where quantitative laboratory reaction rate constants were unavailable, these values were estimated based on the reaction rate constants of analogous species.
4.2.1 NO3 Loss via VOC oxidation and N2O5 uptake
VOC-driven NO3 loss is negligible in winter urban Beijing, but distinct patterns emerge in the concentrations and reactivity of different VOC categories. Detailed statistical data regarding VOC concentrations (e.g., styrene, isoprene, and other anthropogenic species) and their corresponding NO3 reaction rates – are provided in Table S1 (Supplement). Time series plots of the concentrations of several highly reactive VOCs (Fig. S3) show that the styrene concentration peaks at 86 pptv, while the isoprene concentration peaks at 96 pptv. Comparative analysis reveals these high-VOC periods coincide with enhanced NO (e.g., NO spikes to 24.8 ppbv on 24 February, POP), suggesting VOCs and NO share a common emission source (traffic exhaust) – consistent with the site's proximity to urban traffic corridors (Sect. 2.1).
-
High-concentration AVOCs contribute minimally. The most abundant VOCs – ethane (3.8 ± 1.8 ppbv), propane (2.1 ± 1.3 ppbv), and acetone (1.4 ± 0.8 ppbv) – exhibit extremely low (e.g., k(NO3+ propane) = 9.49×1015 cm3 molecule−1 s−1 at 298 K (Atkinson and Arey, 2003). As a result, their combined contribution to total VOC-driven NO3 reactivity is < 5 % ( s−1), emphasizing that high VOC concentration does not equate to strong NO3 reactivity. When all AVOCs are considered, they dominate NO3 reactivity (∼ 70.4 % of total VOC-driven NO3 loss), exceeding the contribution of biogenic VOCs (BVOCs, ∼ 29.6 %) (Fig. S4).
-
Reactive VOCs dominate VOC-driven NO3 loss. Despite their low concentrations, styrene and isoprene account for ∼ 74 % of total VOC-driven NO3 reactivity (Fig. S4), due to their high .
-
Styrene: Average reactivity s−1 ( cm3 molecule−1 s−1), contributing ∼44 % of VOC reactivity. Styrene emissions in Beijing are primarily from vehicle exhaust, with minor contributions from evergreen plant emissions (Li et al., 2014).
-
Isoprene: Average reactivity s−1, contributing ∼30 % of VOC reactivity. Isoprene has dual sources: traffic exhaust (anthropogenic) and deciduous/evergreen plant emissions (biogenic), with biogenic sources dominating in winter (Cheng et al., 2018; Yuan et al., 2009).
Notably, biogenic VOCs (BVOCs) other than isoprene (e.g., limonene, α-pinene) were not detected, leading to potential underestimation of BVOC reactivity. For example, the rate constant for limonene ( cm3 molecule−1 s−1) is higher than isoprene's, so including it could increase the total VOC reactivity.
γ(N2O5) – a key parameter describing the efficiency of N2O5 uptake on aerosol surfaces – was calculated via Eq. (7) (steady-state method) with strict data selection, and the calculation results for Sa are presented in Fig. S5. For most of the time, γ(N2O5) ranged from 0.01 to 0.12 (average: 0.032 ± 0.049; Table S2), consistent with observations in urban Beijing (0.01–0.09) (Li et al., 2022; Wang et al., 2017a; Xia et al., 2021; Zhou et al., 2018) but higher than rural sites: Wangdu (Hebei), 0.006–0.034 (Tham et al., 2018); Hong Kong boundary layer, 0.014 ± 0.007 (Brown et al., 2016); Rural Germany, 0.028 ± 0.029 (Phillips et al., 2016). The elevated γ(N2O5) in our study is attributed to urban aerosols' higher water content and reactive composition (e.g., nitrate, sulfate, and organic acids), which enhance N2O5 hydrolysis efficiency (Bertram et al., 2009; Tang et al., 2014).
4.2.2 Temporal Variations in NO3 Reactivity
To characterize how NO3 loss dynamics respond to emission controls and transient environmental events, we analyzed the time series of total NO3 reactivity – the sum of all first-order loss pathways, including reaction with NO, heterogeneous uptake of N2O5, oxidation by VOCs, and photolysis (daytime only). This analysis is supported by Fig. 5 (time series of total and key environmental drivers).
-
OGP: Total averaged 1.14 s−1, with minimal day-to-day variability. A notable exception occurred on 13 February, when a heavy snowfall event (RH = 71 %, PM2.5=61 µg m−3) triggered a transient spike in to 2.35 s−1 – nearly double the OGP average. This spike was driven by enhanced N2O5 heterogeneous uptake (Sect. 4.1.1), as high RH increased aerosol liquid water content and reactive surface sites.
-
POP: Total surged to 3.06 s−1 (2.7× higher than OGP), driven by a 3.7× increase in NO reactivity (from 0.81 to 3.00 s−1; Table 3). The elevated NO reactivity aligns with post-Olympic NO emission rebound (Sect. 3.1.2), which intensified NO3 titration (Reaction R4) and crowded out N2O5 uptake.
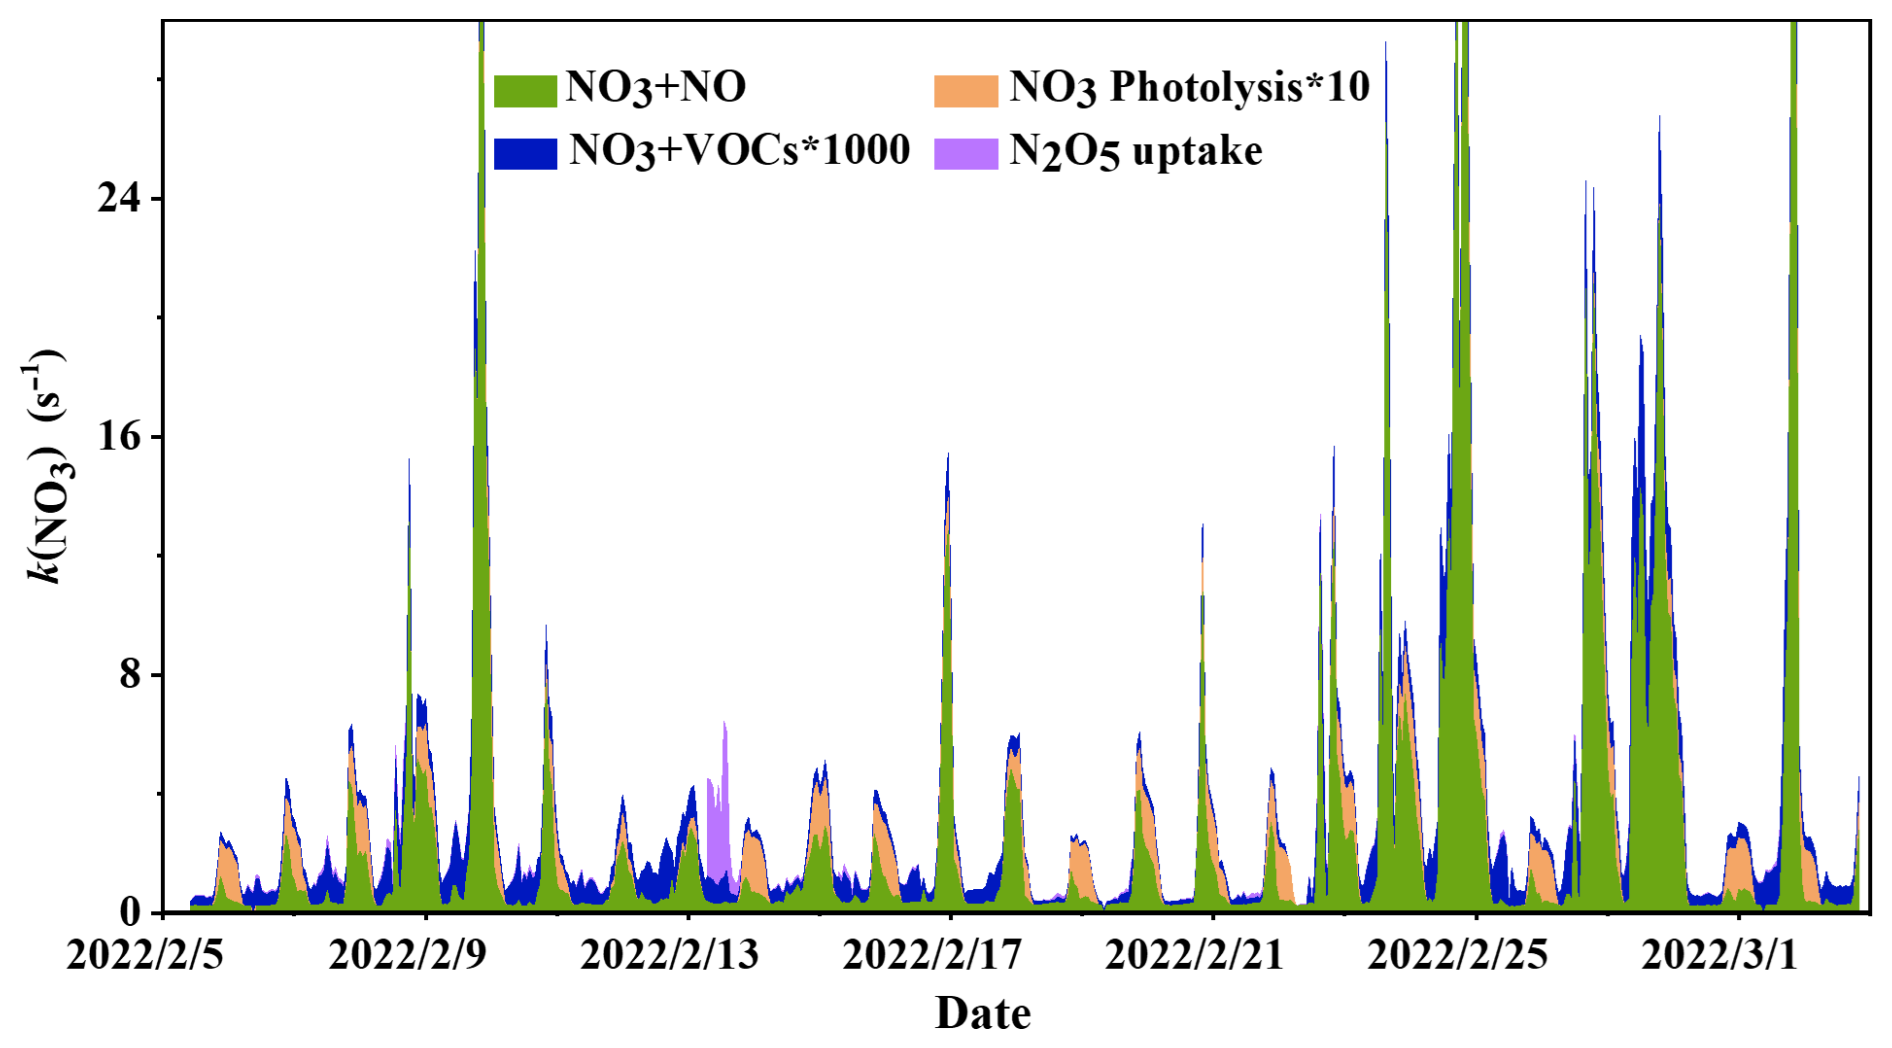
Figure 5Time series variation of (reactions with NO and VOCs, heterogeneous uptake of N2O5 and photolysis of NO3).
Figure 5 also captures the response of to transient NO spikes – critical drivers of non-steady-state NO3 loss. For example, on 24 February (POP), a sudden NO burst (24.8 ppbv, Fig. S6) caused total to jump from 1.3 to 26.5 s−1 within 30 min, with no corresponding change in RH or Sa. This confirms that NO can override the effects of meteorological factors on in winter urban environments.
Table 3Statistics of across various pathways and time periods.
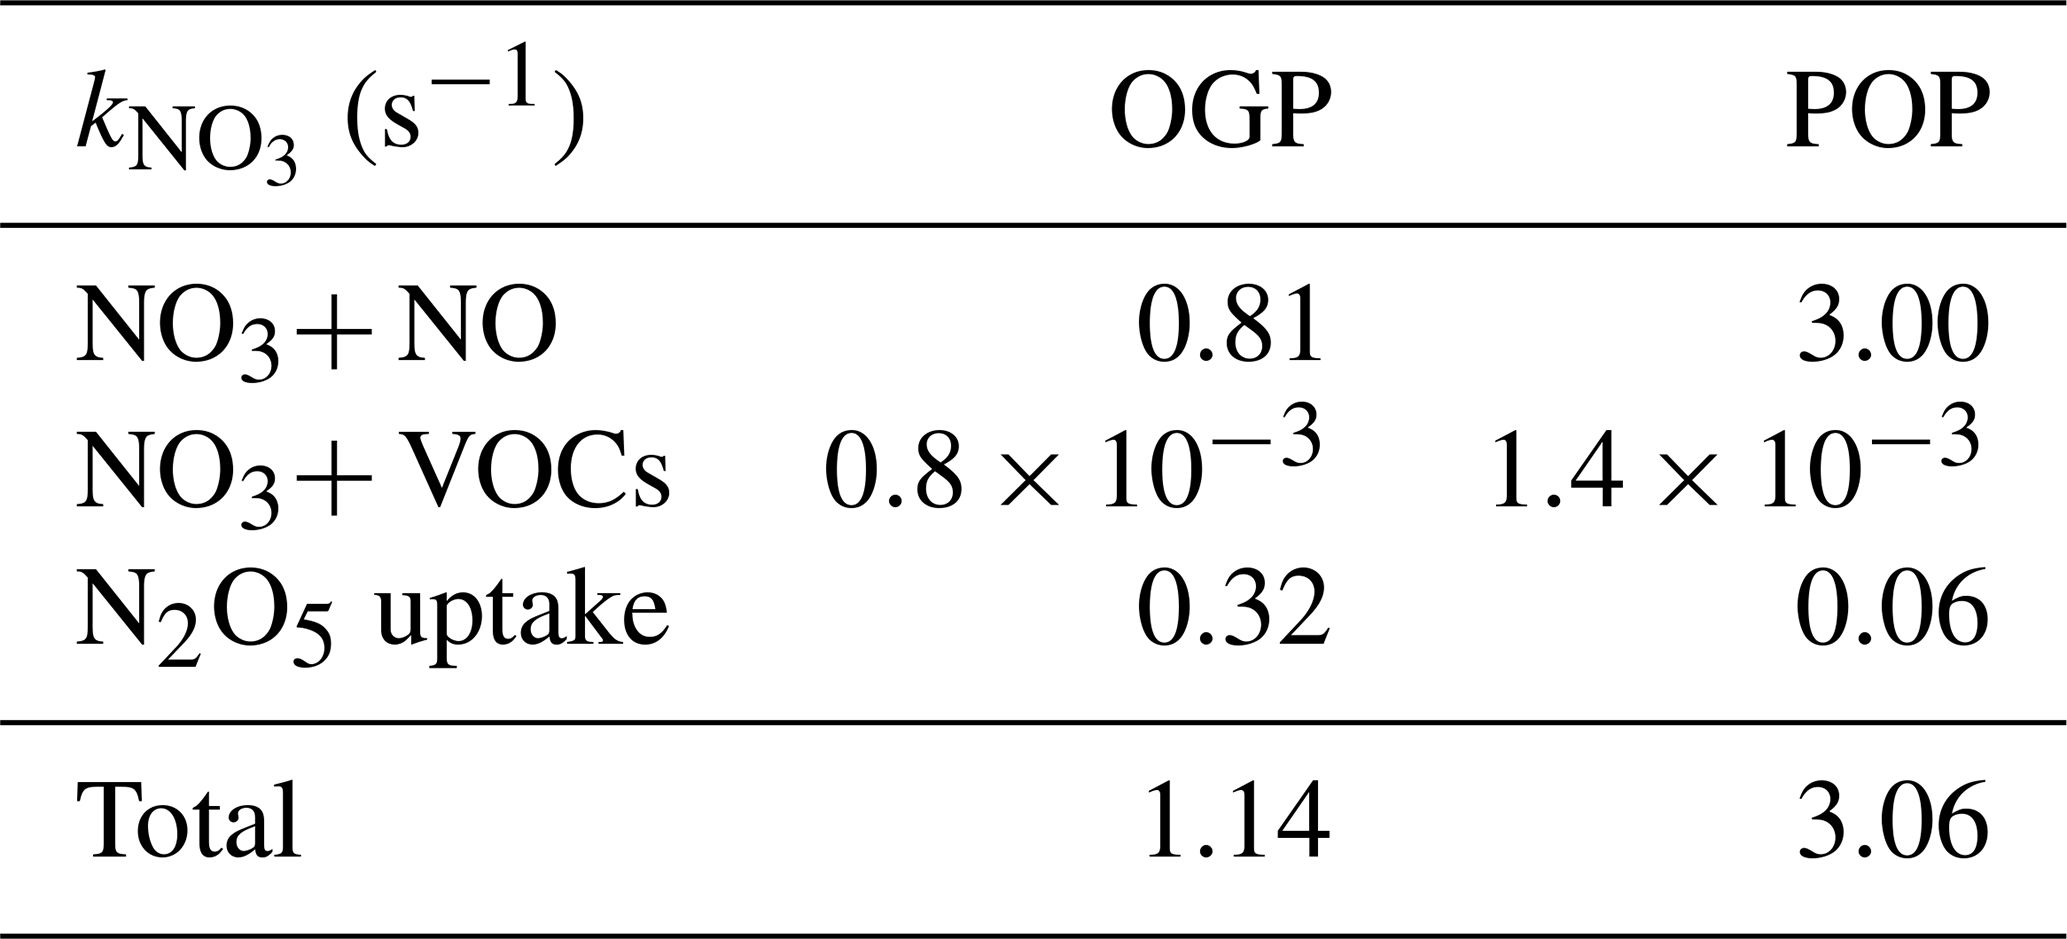
To dissect the drivers of total variation, Table 3 presents the contributions of individual reactivity components (NO reaction, N2O5 uptake, VOC oxidation) for both periods:
-
OGP (Table 3): Reactivity was dominated by two pathways. (1) NO reaction: Contributed 0.81 s−1 (71.1 % of total ), reflecting moderate NO emissions under Olympic controls. (2) N2O5 uptake: Contributed 0.32 s−1 (28.1 % of total ), with the 13 February snowfall event pushing this contribution to 86 % (2.35 s−1 ). VOC oxidation remained negligible at s−1 (< 0.1 % of total ), consistent with winter's low VOC emissions and low NO3-VOC reaction rates (Sect. 4.2.1). For instance, even the styrene contributed only ∼44 % of total VOC reactivity, which remained orders of magnitude lower than NO-driven reactivity.
-
POP (Table 3): A dramatic shift in reactivity partitioning occurred. (1) NO reaction: Exploded to 3.00 s−1 (98.0 % of total ), a 3.7× increase from the OGP. This was driven by post-Olympic NO emissions, which intensified NO3 titration and crowded out other loss pathways. (2) N2O5 uptake: Plummeted to 0.06 s−1 (2.0 % of total ), an 81 % decrease from the OGP. The decline stemmed from lower POP RH (19 % vs. 27 % in OGP), which reduced aerosol liquid water content and suppressed N2O5 hydrolysis (Reaction R6). This RH-dependent hydrolysis inhibition is further validated by Fig. S7 (Supplement): the figure presents the correlation between N2O5 hydrolysis rate and RH during the POP, showing a strong positive linear relationship (R2=0.81). The reduced hydrolysis efficiency directly limited N2O5's role as an indirect NO3 sink, contributing to its diminished share of NO3 loss in the POP. VOC oxidation increased slightly to s−1 (<0.1 % of total ), reflecting a modest rebound in anthropogenic VOC emissions (Table 2: total VOCs = 19.68 ppbv vs. 16.02 ppbv in OGP) but remained functionally irrelevant to NO3 loss.
The combined analysis of Fig. 5 (total trend) and Table 3 reveals two critical findings:
-
Emission controls rewire reactivity partitioning: Olympic NOx reductions reduced NO's dominance as a NO3 sink, allowing N2O5 uptake to emerge as a significant secondary pathway. Relaxing controls reversed this shift, reestablishing NO as the near-exclusive NO3 loss mechanism.
-
Extreme events disrupt baseline reactivity: High-RH events (e.g., snowfall) and NO spikes can temporarily alter reactivity partitioning, but their effects are transient – baseline dynamics remain governed by long-term emission conditions.
4.2.3 NO3 loss budget
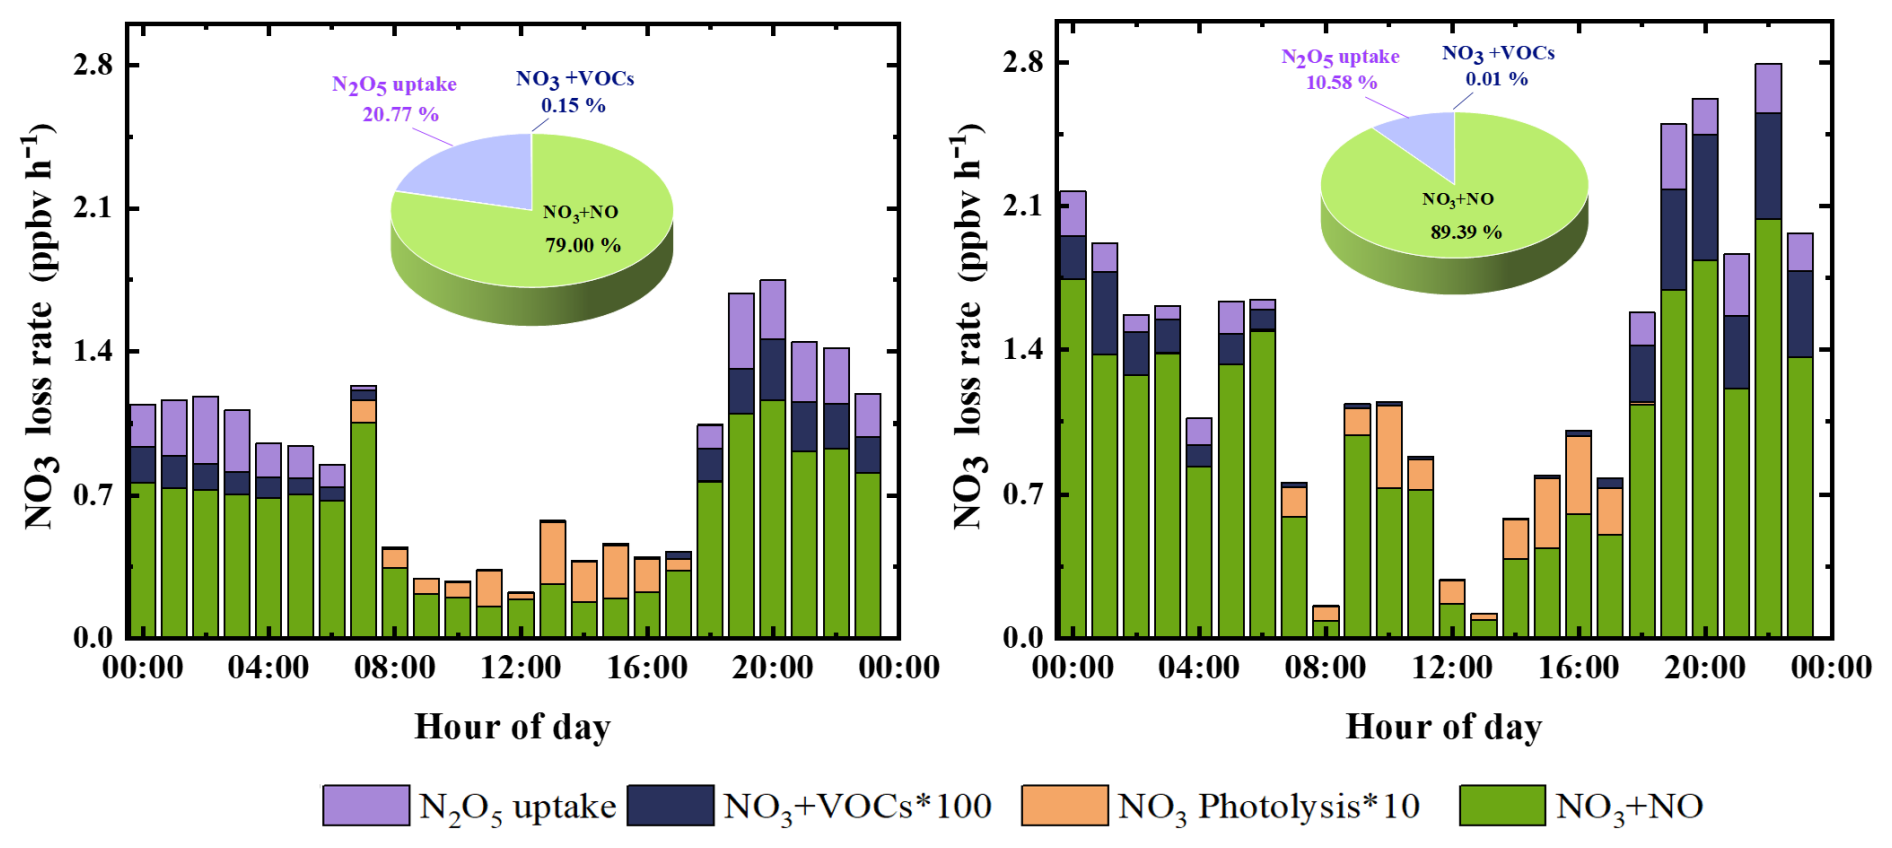
Figure 6 illustrates the diurnal variation and relative contributions of NO3 loss pathways, with distinct differences between the OGP and POP that reflect the impact of Olympic emission controls.
-
OGP: Balanced NO and N2O5 uptake pathways. NO dominated NO3 loss (79.0 %), but N2O5 uptake emerged as a significant secondary pathway (20.8 %), with VOC oxidation contributing <0.2 %. The N2O5 uptake pathway peaked at 19:00 LST (0.37 ppbv h−1), coinciding with high [N2O5] (149.9 pptv). This contribution is comparable to winter observations in urban Beijing (Li et al., 2022).
-
POP: NO dominates NO3 loss. NO's contribution to NO3 loss rose to 89.4 %, with a peak loss rate of 2.04 ppbv h−1 at 22:00 LST – driven by post-Olympic NO emissions that increased significantly (Table 2). In contrast, N2O5 uptake declined to 10.6 %, as lower RH reduced γ (N2O5) and Sa reactivity. Notably, the POP's NO3 loss rate (1.61 ppbv h−1) was 30 % higher than the OGP's (1.14 ppbv h−1), confirming that relaxed emissions accelerated nocturnal NO3 removal.
Compared to summer studies (Lin et al., 2022), winter's low VOC reactivity and high NO emissions make NO the unambiguous primary NO3 sink in urban Beijing. This seasonal contrast underscores the need for season-specific air quality management strategies – prioritizing NOx reduction in winter and VOC reduction in summer.
4.3 Linkage to Olympic Emission Controls and Precursor Dynamics
The 2022 Beijing Winter Olympics provided a unique “natural experiment” to quantify how short-term, large-scale emission controls modulate nocturnal NO3-N2O5 chemistry. Below, we dissect the impacts of these controls on precursor concentrations and loss pathway hierarchies, and explore the interacting roles of NO2 and O3 in shaping NO3-N2O5 dynamics.
4.3.1 Impact of Emission Controls on NO3-N2O5 Chemistry
The Olympic emission control measures – including traffic restrictions (e.g., odd-even license plate policy), industrial shutdowns, and reduced coal combustion – induced significant changes in precursor concentrations and NO3-N2O5 behavior.
-
Precursor modulation: OGP emissions of NOx and VOCs were substantially lower than the POP. Nocturnal NO decreased by 79 % (1.0 vs. 4.8 ppbv), and NO2 by 30 % (14.5 vs. 20.7 ppbv). Nocturnal total VOCs decreased by 18 % (16.02 vs. 19.68 ppbv), with reactive AVOCs (styrene) declining by 40 %.
Lower NO emissions weakened its role as a “NO3 scavenger,” allowing more NO3 to partition into N2O5 via Reaction (R2). This explains why the OGP's nocturnal [N2O5] (137.6 pptv) was 41 % higher than the POP's (97.8 pptv), despite similar NO3 production rates (P(NO3)= 0.5 ppbv h−1 for both periods).
-
Loss pathway shift: Reduced NO emissions elevated the relative importance of N2O5 uptake in NO3 loss – its contribution increased from 10.6 % (POP) to 20.8 % (OGP). This shift demonstrates that emission controls can “rewire” nocturnal loss hierarchies, making heterogeneous processes more significant as primary pollutant emissions decline. This finding extends previous studies (Xia et al., 2020; Zhou et al., 2018 which focused on ClNO2 formation but did not quantify N2O5's role under low-NO conditions.
4.3.2 Precursor (NO2, O3) Influences on NO3-N2O5 Dynamics
NO2 and O3, the primary precursors of NO3 via Reaction (R1), exert dual and interactive controls on NO3-N2O5 chemistry that depend on emission conditions.
-
NO2: Equilibrium driver and precursor tradeoff. NO2 plays two conflicting roles: it is both a precursor for NO3 (via Reaction R1) and a partner in the NO3-N2O5 equilibrium (via Reaction R2). During the OGP, higher nocturnal NO2 (14.5 ppbv) shifted the equilibrium toward N2O5, as low NO prevented rapid NO3 loss. This created a “N2O5 surplus,” with [N2O5] exceeding the POP's by 41 %. In contrast, the POP's higher NO2 (20.7 ppbv) paired with elevated NO (4.8 ppbv) created a “dual sink” effect: more NO3 was produced via Reaction (R1), but immediately titrated by NO via Reaction (R4) – limiting N2O5 accumulation. This tradeoff highlights NO2's context-dependent role in NO3-N2O5 dynamics.
-
O3: Production regulator and persistence enhancer. OGP's higher nocturnal O3 (27.4 vs. 19.8 ppbv in the POP) initially boosted NO3 production (P(NO3)= 0.5 ppbv h−1), but lower NO prevented rapid NO3 loss. This “NO3 surplus” prolonged N2O5 lifetime: the OGP's nocturnal (17.0 min) was 46 % longer than the POP's (11.6 min). This indirect effect of O3 – enhancing N2O5 persistence by supporting NO3 production without accelerating loss – has not been fully quantified in previous winter studies, emphasizing the need to consider O3 alongside NOx in nocturnal chemistry models.
4.4 Broader Atmospheric Implications
Our findings advance understanding of winter urban nocturnal chemistry and provide critical insights for air quality management in polluted regions like Beijing. Three key implications emerge:
-
Emission control efficacy and regional nitrate transport. Olympic controls demonstrated that reducing NOx (not just VOCs) can enhance N2O5 accumulation – potentially extending the lifetime of reactive nitrogen and increasing regional nitrate transport. N2O5 is a stable reservoir species that can be transported long distances before hydrolyzing to form nitrate aerosols; thus, increased N2O5 under NOx reduction may shift winter nitrate pollution from local to regional scales. This suggests that future NOx mitigation strategies should consider regional coordination to address long-range transport of reactive nitrogen.
-
Model parameterization improvements. Our results provide two critical constraints for air quality models, which often underestimate winter N2O5 chemistry.
-
Sa threshold: Sa exerts significant control over only when Sa>500 µm−2 cm−3; below this threshold, organic coatings and NO dominate.
-
γ (N2O5) range: The average γ(N2O5) of 0.032 ± 0.049 (with values up to 0.22 under high RH) is higher than the constant γ(N2O5) = 0.02 (Chang et al., 2011) often used in models. Incorporating these season-specific parameters will improve predictions of winter nitrate formation.
-
Winter mitigation priority: NOx over VOCs. Despite their high reactivity, VOCs contribute <0.5 % of NO3 loss in winter urban Beijing – far less than NO (79.0 %–89.4 %). This confirms that NOx (not VOCs) should be prioritized for mitigating winter nocturnal nitrogen pollution. For example, further reducing traffic-related NO emissions (a major source in urban Beijing) would not only lower direct NO pollution but also enhance N2O5 uptake – a pathway that converts reactive nitrogen to nitrate, which is less toxic and more easily removed via wet deposition.
This study conducted continuous field observations of N2O5, NO3, and their precursor species (NO, NO2, O3, VOCs) in urban Beijing from 5 February to 3 March 2022, covering the 2022 Beijing Winter Olympics (BWO). By analyzing pollutant variations, quantifying the contributions of loss pathways, and linking observations to BWO emission control measures, we clarified the response of winter nocturnal reactive nitrogen chemistry to short-term anthropogenic emission reductions.
During the observation period, P(NO3) averaged 0.5 ± 0.4 ppbv h−1, with N2O5 mixing ratios peaking at 875 pptv (1-min resolution) and derived NO3 concentrations reaching a maximum of 4.6 pptv; averaged 11.9 ± 11.8 min, longer than summer values in Beijing due to slower winter N2O5 loss driven by low temperatures and reduced heterogeneous reactivity. BWO emission controls significantly modulated precursor concentrations: nocturnal NO (1.0 ± 1.2 ppbv) and total VOCs (16.02 ± 7.74 ppbv) in the OGP were 79 % and 18 % lower than in the POP, respectively, while nocturnal O3 was 38 % higher in the OGP (27.4 ± 10.3 ppbv vs. 19.8 ± 12.1 ppbv in the POP) as reduced NO minimized O3 titration – these changes directly led to 41 % higher nocturnal N2O5 concentrations in the OGP (137.6 ± 112.7 pptv vs. 97.8 ± 90.3 pptv in the POP).
RH and Sa exerted context-dependent control over : at RH < 35 %, increased with RH as slight humidity rises softened hydrophobic organic aerosol coatings (derived from traffic VOC oxidation) and reduced N2O5 heterogeneous uptake; at RH > 35 %, decreased with RH due to hygroscopic aerosol growth and enhanced N2O5 hydrolysis, approaching zero during snowfall events (RH > 85 %). For Sa, a threshold of ∼ 500 µm−2 cm−3 was identified – below this value, organic coatings and NO dominated ; above it, Sa became the primary regulator, with decreasing as Sa increased.
NO was the dominant NO3 sink in both periods, though its contribution varied with emission controls: it accounted for 79.0 % of NO3 loss in the OGP, with N2O5 heterogeneous uptake (20.8 %) as a significant secondary pathway, while its contribution rose to 89.2 % in the POP (driven by 3.8× higher NO emissions) and N2O5 uptake declined to 10.6 % (due to lower RH reducing aerosol reactivity). The N2O5 heterogeneous uptake coefficient (γ(N2O5)) averaged 0.032 ± 0.049 in the OGP, higher than rural sites due to urban aerosols' higher water content and reactive components (e.g., nitrate, sulfate). Despite the high reactivity of species like styrene and isoprene, VOC oxidation contributed <0.2 % to NO3 loss in both periods, confirming its negligible role in winter NO3 dynamics in urban Beijing.
These findings hold key implications for air quality management: BWO NOx reductions enhanced N2O5 accumulation, potentially extending reactive nitrogen lifetime and shifting winter nitrate pollution from local to regional scales – highlighting the need for regional coordination in NOx mitigation; the identified Sa threshold (500 µm2 cm−3) and γ(N2O5) range (0.01–0.12) provide critical constraints for air quality models, which often rely on oversimplified and γ (N2O5) parameters; and given NO's dominance in NO3 loss and N2O5 dynamics, NOx (not VOCs) should be prioritized for winter nocturnal nitrogen pollution control in Beijing – reducing traffic-related NO emissions would simultaneously lower direct pollution and enhance N2O5 uptake, promoting nitrate removal via wet deposition.
Data are available at https://doi.org/10.5281/zenodo.15381990 (Zhang et al., 2025).
The supplement related to this article is available online at https://doi.org/10.5194/acp-25-16331-2025-supplement.
TZ, WL and CY designed the research. WL and CY organized this field campaign. TZ, PZ, YC, TL and LZ carried out the field measurements and provided the field measurement dataset. TZ performed data analysis, interpreted the data and wrote the manuscript with revision mainly from WL. All authors have given approval to the final version of the manuscript.
The contact author has declared that none of the authors has any competing interests.
Publisher's note: Copernicus Publications remains neutral with regard to jurisdictional claims made in the text, published maps, institutional affiliations, or any other geographical representation in this paper. While Copernicus Publications makes every effort to include appropriate place names, the final responsibility lies with the authors. Views expressed in the text are those of the authors and do not necessarily reflect the views of the publisher.
The authors would like to thank the field campaign team for the data that they contributed during the 2022 Beijing Winter Olympics.
This research has been supported by the National Natural Science Foundation of China (grant no. 42375088) and the National Key Research and Development Program of China (grant no. 2024YFC3711902).
This paper was edited by Tao Wang and reviewed by Men Xia and one anonymous referee.
Anttila, T., Kiendler-Scharr, A., Tillmann, R., and Mentel, T. F.: On the Reactive Uptake of Gaseous Compounds by Organic-Coated Aqueous Aerosols: Theoretical Analysis and Application to the Heterogeneous Hydrolysis of N2O5, J. Phys. Chem. A, 110, 10435–10443, https://doi.org/10.1021/jp062403c, 2006.
Atkinson, R. and Arey, J.: Atmospheric Degradation of Volatile Organic Compounds, Chem. Rev., 103, 4605–4638, https://doi.org/10.1021/cr0206420, 2003.
Atkinson, R., Baulch, D. L., Cox, R. A., Crowley, J. N., Hampson, R. F., Hynes, R. G., Jenkin, M. E., Rossi, M. J., and Troe, J.: Evaluated kinetic and photochemical data for atmospheric chemistry: Volume I – gas phase reactions of Ox, HOx, NOx and SOx species, Atmos. Chem. Phys., 4, 1461–1738, https://doi.org/10.5194/acp-4-1461-2004, 2004.
Bertram, T. H., Thornton, J. A., Riedel, T. P., Middlebrook, A. M., Bahreini, R., Bates, T. S., Quinn, P. K., and Coffman, D. J.: Direct observations of N2O5 reactivity on ambient aerosol particles, Geophys. Res. Lett., 36, L19803, https://doi.org/10.1029/2009GL040248, 2009.
Bohn, B., Corlett, G. K., Gillmann, M., Sanghavi, S., Stange, G., Tensing, E., Vrekoussis, M., Bloss, W. J., Clapp, L. J., Kortner, M., Dorn, H.-P., Monks, P. S., Platt, U., Plass-Dülmer, C., Mihalopoulos, N., Heard, D. E., Clemitshaw, K. C., Meixner, F. X., Prevot, A. S. H., and Schmitt, R.: Photolysis frequency measurement techniques: results of a comparison within the ACCENT project, Atmos. Chem. Phys., 8, 5373–5391, https://doi.org/10.5194/acp-8-5373-2008, 2008.
Brown, S. S. and Stutz, J.: Nighttime radical observations and chemistry, Chem. Soc. Rev., 41, 6405, https://doi.org/10.1039/c2cs35181a, 2012.
Brown, S. S., Dubé, W. P., Peischl, J., Ryerson, T. B., Atlas, E., Warneke, C., de Gouw, J. A., te Lintel Hekkert, S., Brock, C. A., Flocke, F., Trainer, M., Parrish, D. D., Feshenfeld, F. C., and Ravishankara, A. R.: Budgets for nocturnal VOC oxidation by nitrate radicals aloft during the 2006 Texas Air Quality Study, J. Geophys. Res., 116, 1–15, https://doi.org/10.1029/2011JD016544, 2011.
Brown, S. S., Dubé, W. P., Tham, Y. J., Zha, Q., Xue, L., Poon, S., Wang, Z., Blake, D. R., Tsui, W., Parrish, D. D., and Wang, T.: Nighttime chemistry at a high altitude site above Hong Kong, J. Geophys. Res. Atmos., 121, 2457–2475, https://doi.org/10.1002/2015JD024566, 2016.
Brown, S. S., An, H., Lee, M., Park, J.-H., Lee, S.-D., Fibiger, D. L., McDuffie, E. E., Dubé, W. P., Wagner, N. L., and Min, K.-E.: Cavity enhanced spectroscopy for measurement of nitrogen oxides in the Anthropocene: results from the Seoul tower during MAPS 2015, Faraday Discuss., 200, 529–557, https://doi.org/10.1039/C7FD00001D, 2017.
Chang, W. L., Bhave, P. V., Brown, S. S., Riemer, N., Stutz, J., and Dabdub, D.: Heterogeneous Atmospheric Chemistry, Ambient Measurements, and Model Calculations of N2O5: A Review, Aerosol Sci. Technol., 45, 665–695, https://doi.org/10.1080/02786826.2010.551672, 2011.
Cheng, X., Li, H., Zhang, Y., and Li, Y.: Atmospheric isoprene and monoterpenes in a typical urban area of Beijing: Pollution characterization, chemical reactivity and source identification, J. Environ. Sci., 71, 150–167, https://doi.org/10.1016/j.jes.2017.12.017, 2018.
Crutzen, P. J.: The Role of NO and NO2 in the Chemistry of the Troposphere and Stratosphere, Annu. Rev. Earth Planet. Sci., 7, 443–472, https://doi.org/10.1146/annurev.ea.07.050179.002303, 1979.
Folkers, M., Mentel, Th. F., and Wahner, A.: Influence of an organic coating on the reactivity of aqueous aerosols probed by the heterogeneous hydrolysis of N2O5, Geophys. Res. Lett., 30, 2003GL017168, https://doi.org/10.1029/2003GL017168, 2003.
Fry, J. L. and Sackinger, K.: Model investigation of NO3 secondary organic aerosol (SOA) source and heterogeneous organic aerosol (OA) sink in the western United States, Atmos. Chem. Phys., 12, 8797–8811, https://doi.org/10.5194/acp-12-8797-2012, 2012.
Hoyle, C. R., Berntsen, T., Myhre, G., and Isaksen, I. S. A.: Secondary organic aerosol in the global aerosol – chemical transport model Oslo CTM2, Atmos. Chem. Phys., 7, 5675–5694, https://doi.org/10.5194/acp-7-5675-2007, 2007.
Hu, H., Wang, H., Lu, K., Wang, J., Zheng, Z., Xu, X., Zhai, T., Chen, X., Lu, X., Fu, W., Li, X., Zeng, L., Hu, M., Zhang, Y., and Fan, S.: Variation and trend of nitrate radical reactivity towards volatile organic compounds in Beijing, China, Atmos. Chem. Phys., 23, 8211–8223, https://doi.org/10.5194/acp-23-8211-2023, 2023.
Huang, Z., Hu, W., Jin, R., Hou, S., LI, P., Bi, K., He, C., Wang, Y., Duan, P., Liu, D., Wu, L., Deng, J., Sun, Y., and Fu, P.: Chemical composition and sources of fine particles in Beijing around the Winter Olympics, China Environ. Sci., 44, 5344–5356, https://doi.org/10.19674/j.cnki.issn1000-6923.20240604.002, 2024.
Li, H., Zheng, B., Lei, Y., Hauglustaine, D., Chen, C., Lin, X., Zhang, Y., Zhang, Q., and He, K.: Trends and drivers of anthropogenic NOx emissions in China since 2020, Environ. Sci. Ecotechnol., 21, 100425, https://doi.org/10.1016/j.ese.2024.100425, 2024.
Li, L., Li, H., and Zhang, X.: Pollution characteristics and health risk assessment of benzene homologues in ambient air in the northeastern urban area of Beijing, China, J. Environ. Sci., 26, 214–223, https://doi.org/10.1016/S1001-0742(13)60400-3, 2014.
Li, Z., Xie, P., Hu, R., Wang, D., Jin, H., Chen, H., Lin, C., and Liu, W.: Observations of N2O5 and NO3 at a suburban environment in Yangtze river delta in China: Estimating heterogeneous N2O5 uptake coefficients, J. Environ. Sci., 95, 248–255, https://doi.org/10.1016/j.jes.2020.04.041, 2020.
Li, Z., Wang, D., Xie, P., Hu, R., Chen, H., and Lin, C.: Nighttime N2O5 chemistry in an urban site of Beijing in winter based on the measurements by cavity ring-down spectroscopy, Air Qual. Atmos. Hlth., 15, 867–876, https://doi.org/10.1007/s11869-021-01125-4, 2022.
Lin, C., Hu, R., Xie, P., Lou, S., Zhang, G., Tong, J., Liu, J., and Liu, W.: Nocturnal atmospheric chemistry of NO3 and N2O5 over Changzhou in the Yangtze River Delta in China, J. Environ. Sci., 114, 376–390, https://doi.org/10.1016/j.jes.2021.09.016, 2022.
Lu, X., Qin, M., Xie, P., Duan, J., Fang, W., and Liu, W.: Observation of ambient NO3 radicals by LP-DOAS at a rural site in North China Plain, Sci. Total Environ., 804, 149680, https://doi.org/10.1016/j.scitotenv.2021.149680, 2022.
McNeill, V. F., Patterson, J., Wolfe, G. M., and Thornton, J. A.: The effect of varying levels of surfactant on the reactive uptake of N2O5 to aqueous aerosol, Atmos. Chem. Phys., 6, 1635–1644, https://doi.org/10.5194/acp-6-1635-2006, 2006.
Ng, N. L., Brown, S. S., Archibald, A. T., Atlas, E., Cohen, R. C., Crowley, J. N., Day, D. A., Donahue, N. M., Fry, J. L., Fuchs, H., Griffin, R. J., Guzman, M. I., Herrmann, H., Hodzic, A., Iinuma, Y., Jimenez, J. L., Kiendler-Scharr, A., Lee, B. H., Luecken, D. J., Mao, J., McLaren, R., Mutzel, A., Osthoff, H. D., Ouyang, B., Picquet-Varrault, B., Platt, U., Pye, H. O. T., Rudich, Y., Schwantes, R. H., Shiraiwa, M., Stutz, J., Thornton, J. A., Tilgner, A., Williams, B. J., and Zaveri, R. A.: Nitrate radicals and biogenic volatile organic compounds: oxidation, mechanisms, and organic aerosol, Atmos. Chem. Phys., 17, 2103–2162, https://doi.org/10.5194/acp-17-2103-2017, 2017.
Osthoff, H. D., Sommariva, R., Baynard, T., Pettersson, A., Williams, E. J., Lerner, B. M., Roberts, J. M., Stark, H., Goldan, P. D., Kuster, W. C., Bates, T. S., Coffman, D., Ravishankara, A. R., and Brown, S. S.: Observation of daytime N2O5 in the marine boundary layer during New England Air Quality Study–Intercontinental Transport and Chemical Transformation 2004, J. Geophys. Res. Atmospheres, 111, https://doi.org/10.1029/2006JD007593, 2006.
Phillips, G. J., Thieser, J., Tang, M., Sobanski, N., Schuster, G., Fachinger, J., Drewnick, F., Borrmann, S., Bingemer, H., Lelieveld, J., and Crowley, J. N.: Estimating N2O5 uptake coefficients using ambient measurements of NO3, N2O5, ClNO2 and particle-phase nitrate, Atmos. Chem. Phys., 16, 13231–13249, https://doi.org/10.5194/acp-16-13231-2016, 2016.
Pye, H. O. T., Chan, A. W. H., Barkley, M. P., and Seinfeld, J. H.: Global modeling of organic aerosol: the importance of reactive nitrogen (NOx and NO3), Atmos. Chem. Phys., 10, 11261–11276, https://doi.org/10.5194/acp-10-11261-2010, 2010.
Tang, M. J., Schuster, G., and Crowley, J. N.: Heterogeneous reaction of N2O5 with illite and Arizona test dust particles, Atmos. Chem. Phys., 14, 245–254, https://doi.org/10.5194/acp-14-245-2014, 2014.
Tham, Y. J., Wang, Z., Li, Q., Yun, H., Wang, W., Wang, X., Xue, L., Lu, K., Ma, N., Bohn, B., Li, X., Kecorius, S., Größ, J., Shao, M., Wiedensohler, A., Zhang, Y., and Wang, T.: Significant concentrations of nitryl chloride sustained in the morning: investigations of the causes and impacts on ozone production in a polluted region of northern China, Atmos. Chem. Phys., 16, 14959–14977, https://doi.org/10.5194/acp-16-14959-2016, 2016.
Tham, Y. J., Wang, Z., Li, Q., Wang, W., Wang, X., Lu, K., Ma, N., Yan, C., Kecorius, S., Wiedensohler, A., Zhang, Y., and Wang, T.: Heterogeneous N2O5 uptake coefficient and production yield of ClNO2 in polluted northern China: roles of aerosol water content and chemical composition, Atmos. Chem. Phys., 18, 13155–13171, https://doi.org/10.5194/acp-18-13155-2018, 2018.
Wang, D., Xie, P., Hu, R., Li, Z., Chen, H., and Jin, H.: Reactivity and Loss Mechanisms of NO3 and N2O5 at a Rural Site on the North China Plain, Atmosphere, 13, 1268, https://doi.org/10.3390/atmos13081268, 2022.
Wang, H., Lu, K., Chen, X., Zhu, Q., Chen, Q., Guo, S., Jiang, M., Li, X., Shang, D., Tan, Z., Wu, Y., Wu, Z., Zou, Q., Zheng, Y., Zeng, L., Zhu, T., Hu, M., and Zhang, Y.: High N2O5 Concentrations Observed in Urban Beijing: Implications of a Large Nitrate Formation Pathway, Environ. Sci. Technol. Lett., 4, 416–420, https://doi.org/10.1021/acs.estlett.7b00341, 2017a.
Wang, H., Lu, K., Guo, S., Wu, Z., Shang, D., Tan, Z., Wang, Y., Le Breton, M., Lou, S., Tang, M., Wu, Y., Zhu, W., Zheng, J., Zeng, L., Hallquist, M., Hu, M., and Zhang, Y.: Efficient N2O5 uptake and NO3 oxidation in the outflow of urban Beijing, Atmos. Chem. Phys., 18, 9705–9721, https://doi.org/10.5194/acp-18-9705-2018, 2018.
Wang, H., Chen, X., Lu, K., Hu, R., Li, Z., Wang, H., Ma, X., Yang, X., Chen, S., Dong, H., Liu, Y., Fang, X., Zeng, L., Hu, M., and Zhang, Y.: NO3 and N2O5 chemistry at a suburban site during the EXPLORE-YRD campaign in 2018, Atmos. Environ., 224, 117180, https://doi.org/10.1016/j.atmosenv.2019.117180, 2020.
Wang, H., Lu, K., Chen, S., Li, X., Zeng, L., Hu, M., and Zhang, Y.: Characterizing nitrate radical budget trends in Beijing during 2013–2019, Sci. Total Environ., 795, 148869, https://doi.org/10.1016/j.scitotenv.2021.148869, 2021.
Wang, H., Wang, H., Lu, X., Lu, K., Zhang, L., Tham, Y. J., Shi, Z., Aikin, K., Fan, S., Brown, S. S., and Zhang, Y.: Increased night-time oxidation over China despite widespread decrease across the globe, Nat. Geosci., 16, 217–223, https://doi.org/10.1038/s41561-022-01122-x, 2023a.
Wang, J., Wang, H., Tham, Y. J., Ming, L., Zheng, Z., Fang, G., Sun, C., Ling, Z., Zhao, J., and Fan, S.: Measurement report: Atmospheric nitrate radical chemistry in the South China Sea influenced by the urban outflow of the Pearl River Delta, Atmos. Chem. Phys., 24, 977–992, https://doi.org/10.5194/acp-24-977-2024, 2024.
Wang, M., Zeng, L., Lu, S., Shao, M., Liu, X., Yu, X., Chen, W., Yuan, B., Zhang, Q., Hu, M., and Zhang, Z.: Development and validation of a cryogen-free automatic gas chromatograph system (GC-MS/FID) for online measurements of volatile organic compounds, Anal. Methods, 6, 9424–9434, https://doi.org/10.1039/C4AY01855A, 2014.
Wang, S., Shi, C., Zhou, B., Zhao, H., Wang, Z., Yang, S., and Chen, L.: Observation of NO3 radicals over Shanghai, China, Atmos. Environ., 70, 401–409, https://doi.org/10.1016/j.atmosenv.2013.01.022, 2013.
Wang, X., Wang, H., Xue, L., Wang, T., Wang, L., Gu, R., Wang, W., Tham, Y. J., Wang, Z., Yang, L., Chen, J., and Wang, W.: Observations of N2O5 and ClNO2 at a polluted urban surface site in North China: High N2O5 uptake coefficients and low ClNO2 product yields, Atmos. Environ., 156, 125–134, https://doi.org/10.1016/j.atmosenv.2017.02.035, 2017b.
Wang, Y., Xi, S., Zhao, F., Huey, L. G., and Zhu, T.: Decreasing Production and Potential Urban Explosion of Nighttime Nitrate Radicals amid Emission Reduction Efforts, Environ. Sci. Technol., 57, 21306–21312, https://doi.org/10.1021/acs.est.3c09259, 2023b.
Wang, Z., Wang, W., Tham, Y. J., Li, Q., Wang, H., Wen, L., Wang, X., and Wang, T.: Fast heterogeneous N2O5 uptake and ClNO2 production in power plant and industrial plumes observed in the nocturnal residual layer over the North China Plain, Atmos. Chem. Phys., 17, 12361–12378, https://doi.org/10.5194/acp-17-12361-2017, 2017c.
Wayne, R. P., Barnes, I., Biggs, P., Burrows, J. P., Canosa-Mas, C. E., Hjorth, J., Le Bras, G., Moortgat, G. K., Perner, D., Poulet, G., Restelli, G., and Sidebottom, H.: The nitrate radical: Physics, chemistry, and the atmosphere, Atmos. Environ. Part Gen. Top., 25, 1–203, https://doi.org/10.1016/0960-1686(91)90192-A, 1991.
Xia, M., Peng, X., Wang, W., Yu, C., Sun, P., Li, Y., Liu, Y., Xu, Z., Wang, Z., Xu, Z., Nie, W., Ding, A., and Wang, T.: Significant production of ClNO2 and possible source of Cl2 from N2O5 uptake at a suburban site in eastern China, Atmos. Chem. Phys., 20, 6147–6158, https://doi.org/10.5194/acp-20-6147-2020, 2020.
Xia, M., Peng, X., Wang, W., Yu, C., Wang, Z., Tham, Y. J., Chen, J., Chen, H., Mu, Y., Zhang, C., Liu, P., Xue, L., Wang, X., Gao, J., Li, H., and Wang, T.: Winter ClNO2 formation in the region of fresh anthropogenic emissions: seasonal variability and insights into daytime peaks in northern China, Atmos. Chem. Phys., 21, 15985–16000, https://doi.org/10.5194/acp-21-15985-2021, 2021.
Yan, C., Yee Jun, T., Nie, W., Xia, M., Wang, H., Guo, Y., Ma, W., Zhan, J., Li, Y., Deng, C., Li, Y., Zheng, F., Chen, X., Li, Q., Zhang, G., Mahajan, A., Cuevas, C. A., Huang, D., and Kulmala, M.: Increasing contribution of nighttime nitrogen chemistry to wintertime haze formation in Beijing observed during COVID-19 lockdowns, Nat. Geosci., 16, https://doi.org/10.1038/s41561-023-01285-1, 2023.
Yao, Y., Wang, S., Wei, N., Ye, C., Zhang, C., Gu, X., Zhao, W., and Zhang, W.: Analysis of surface ozone sources in Beijing during the 2022 Beijing Winter Olympic Games based on total peroxyl radical measurement, Acta Sci. Circumst., 43, 290–297, https://doi.org/10.13671/j.hjkxxb.2023.0070, 2023.
Yu, C., Wang, Z., Xia, M., Fu, X., Wang, W., Tham, Y. J., Chen, T., Zheng, P., Li, H., Shan, Y., Wang, X., Xue, L., Zhou, Y., Yue, D., Ou, Y., Gao, J., Lu, K., Brown, S. S., Zhang, Y., and Wang, T.: Heterogeneous N2O5 reactions on atmospheric aerosols at four Chinese sites: improving model representation of uptake parameters, Atmos. Chem. Phys., 20, 4367–4378, https://doi.org/10.5194/acp-20-4367-2020, 2020.
Yuan, Z., Lau, A. K. H., Shao, M., Louie, P. K. K., Liu, S. C., and Zhu, T.: Source analysis of volatile organic compounds by positive matrix factorization in urban and rural environments in Beijing, J. Geophys. Res. Atmospheres, 114, https://doi.org/10.1029/2008JD011190, 2009.
Yun, H., Wang, W., Wang, T., Xia, M., Yu, C., Wang, Z., Poon, S. C. N., Yue, D., and Zhou, Y.: Nitrate formation from heterogeneous uptake of dinitrogen pentoxide during a severe winter haze in southern China, Atmos. Chem. Phys., 18, 17515–17527, https://doi.org/10.5194/acp-18-17515-2018, 2018.
Zhang, H., Wang, S., and Hao, J.: Air pollution and control action in Beijing, J. Clean. Prod., 112, 1519–1527, https://doi.org/10.1016/j.jclepro.2015.04.092, 2016.
Zhang, T., Zuo, P., Ma, J., Ye, C., Lin, W., and Zhu, T.: Characterization and Application of an Online Measurement System for NO3 and N2O5 Based on Cavity Ring-Down Spectroscopy, Acta Sci. Nat. Univ. Pekin., 60, 563–574, https://doi.org/10.13209/j.0479-8023.2024.030, 2024.
Zhang, T., Ma, J., Liu, T., Lin, W., Zuo, P., and Ye, C.: A dynamic generation system for NO3 and N2O5 standard gases, Environ. Chem., 45, 1–7, https://doi.org/10.7524/j.issn.0254-6108.2024091302, 2026.
Zhang, T., Zuo, P., Chen, Y., Liu, T., Zeng, L., Lin, W., and Ye, C.: Measurement report: Variations and environmental impacts of atmospheric N2O5 concentrations in urban Beijing during the 2022 Winter Olympics, Zenodo [data set], https://doi.org/10.5281/zenodo.15381990, 2025.
Zhang, X., Tong, S., Jia, C., Zhang, W., Li, J., Wang, W., Sun, Y., Wang, X., Wang, L., Ji, D., Wang, L., Zhao, P., Tang, G., Xin, J., Li, A., and Ge, M.: The Levels and Sources of Nitrous Acid (HONO) in Winter of Beijing and Sanmenxia, J. Geophys. Res. Atmos., 127, e2021JD036278, https://doi.org/10.1029/2021JD036278, 2022.
Zhou, J., Zhao, W., Zhang, Y., Fang, B., Cheng, F., Xu, X., Ni, S., Zhang, W., Ye, C., Chen, W., and Venables, D. S.: Amplitude-Modulated Cavity-Enhanced Absorption Spectroscopy with Phase-Sensitive Detection: A New Approach Applied to the Fast and Sensitive Detection of NO2, Anal. Chem., 94, 3368–3375, https://doi.org/10.1021/acs.analchem.1c05484, 2022.
Zhou, W., Zhao, J., Ouyang, B., Mehra, A., Xu, W., Wang, Y., Bannan, T. J., Worrall, S. D., Priestley, M., Bacak, A., Chen, Q., Xie, C., Wang, Q., Wang, J., Du, W., Zhang, Y., Ge, X., Ye, P., Lee, J. D., Fu, P., Wang, Z., Worsnop, D., Jones, R., Percival, C. J., Coe, H., and Sun, Y.: Production of N2O5 and ClNO2 in summer in urban Beijing, China, Atmos. Chem. Phys., 18, 11581–11597, https://doi.org/10.5194/acp-18-11581-2018, 2018.
Zhu, T., Tang, M., Gao, M., Bi, X., Cao, J., Che, H., Chen, J., Ding, A., Fu, P., Gao, J., Gao, Y., Ge, M., Ge, X., Han, Z., He, H., Huang, R.-J., Huang, X., Liao, H., Liu, C., Liu, H., Liu, J., Liu, S. C., Lu, K., Ma, Q., Nie, W., Shao, M., Song, Y., Sun, Y., Tang, X., Wang, T., Wang, T., Wang, W., Wang, X., Wang, Z., Yin, Y., Zhang, Q., Zhang, W., Zhang, Y., Zhang, Y., Zhao, Y., Zheng, M., Zhu, B., and Zhu, J.: Recent Progress in Atmospheric Chemistry Research in China: Establishing a Theoretical Framework for the “Air Pollution Complex”, Adv. Atmos. Sci., 40, 1339–1361, 2023.