the Creative Commons Attribution 4.0 License.
the Creative Commons Attribution 4.0 License.
 | 19 Nov 2025
Measurement report: Comprehensive seasonal study of the composition and sources of submicron aerosol during the JULIAC campaign in Germany
Andreas Hofzumahaus
Frank Holland
Hendrik Fuchs
Ralf Tillmann
Birger Bohn
Stefanie Andres
Zhaofeng Tan
Franz Rohrer
Vlassis A. Karydis
Vaishali Vardhan
Philipp Franke
Anne C. Lange
Anna Novelli
Benjamin Winter
Changmin Cho
Iulia Gensch
Sergej Wedel
Andreas Wahner
Astrid Kiendler-Scharr
The seasonal variations of aerosol sources and their atmospheric evolution are investigated using observations from the year-long JULIAC (Jülich Atmospheric Chemistry Project) campaign (January–November 2019) in Jülich, Germany. Non-refractory submicron aerosol components were continuously measured alongside oxidants (OH, O3, NO3), trace gases, and meteorological conditions. Organic aerosols (OA) dominated the aerosol composition throughout the year (39 %–58 %), with secondary formation being the major source. OA, including organic nitrate and organosulfate, peaked during a summer heatwave event due to enhanced daytime and nighttime secondary OA formation driven by elevated concentrations of atmospheric oxidants. Changes in the OA composition during the heatwave suggest a shift in the formation pathways, where isoprene may play an important role. Biomass-burning, mainly wildfires and anthropogenic activities (e.g., heating, industry), is the dominant primary OA source (45 %–83 %), which may grow in influence due to climate change and the expected energy transition. Air masses containing OA from regional transport from marine and wildfire sources are identified through source apportionment. Analysis and modeling prove this method to be more reliable than traditional tracer-based methods. Regional transport to this study site typically shows a cleansing effect on the aerosol concentration, except in winter. Furthermore, seasonal variations in the effects of regional transport are seen, where identical transport pathways led to different influences on aerosol properties, driven by seasonal differences in biogenic and anthropogenic emissions. This study enhances understanding of seasonal variation in submicron aerosol properties in response to their sources, atmospheric evolution, and transport.
- Article
(14046 KB) - Full-text XML
-
Supplement
(2466 KB) - BibTeX
- EndNote


Atmospheric submicron aerosols affect air quality, climate-ecology interaction (Boucher et al., 2013; Ramanathan et al., 2001), and also human health (Dockery et al., 1993; Dockery and Stone, 2007; Pope and Dockery, 2006; Lelieveld et al., 2015). The chemical and physical properties of aerosols change according to diverse primary emissions, secondary formations, and their chemical transformation (e.g., oligomerization, fragmentation, photochemical aging) in the atmosphere (Canagaratna et al., 2010; Jimenez et al., 2009; Ng et al., 2010). Hence, their climate impact varies through direct scattering and absorption of radiation and indirect modification of cloud properties as cloud condensation nuclei (CCN) (Fanourgakis et al., 2019; Myhre et al., 2013). Therefore, understanding aerosol emissions and secondary formation is essential, as these processes determine aerosol properties and how they influence radiation and clouds, altering climate impacts.
Among submicron aerosol compounds, organic aerosols (OA) contribute 20 % to 90 % of the total submicron aerosol mass in the troposphere (Zhang et al., 2007; Jimenez et al., 2009), thus playing a key role in altering the environmental impact of aerosols. OA can be emitted directly from primary sources, including anthropogenic activities (e.g., residential heating, traffic exhaust) and biogenic sources (e.g., wildfire). Additionally, abundant secondary OA (SOA) forms predominantly via atmospheric oxidation of various biogenic and anthropogenic volatile organic compounds (VOCs) by different oxidants (OH, O3, and NO3). For example, the particulate organic nitrate, as a typical secondary species mainly formed via NO3 oxidation (Xu et al., 2015a; Lee et al., 2016), has been shown to contribute 34 % to 44 % of measured submicron aerosol nitrate on a continental scale (Kiendler-Scharr et al., 2016). Organosulfate, another important SOA component, which is essential for determining aerosol physicochemical properties, affects the formation of CCN (Chen et al., 2019). However, sources of organosulfate in the atmosphere are diverse, originating from both gas-phase (Yang et al., 2023) and liquid-phase chemistry (Tan et al., 2022a). While the prevailing view has been that interactions between anthropogenic and biogenic sources primarily contribute to the formation of organosulfate, a recent study (Bruggemann et al., 2020) suggests that reactions of purely anthropogenic precursor species or direct emissions from fossil fuel and biomass-burning may contribute significantly to the formation of organosulfate. Nevertheless, the sources and formation mechanisms of organosulfates remain uncertain and require further studies.
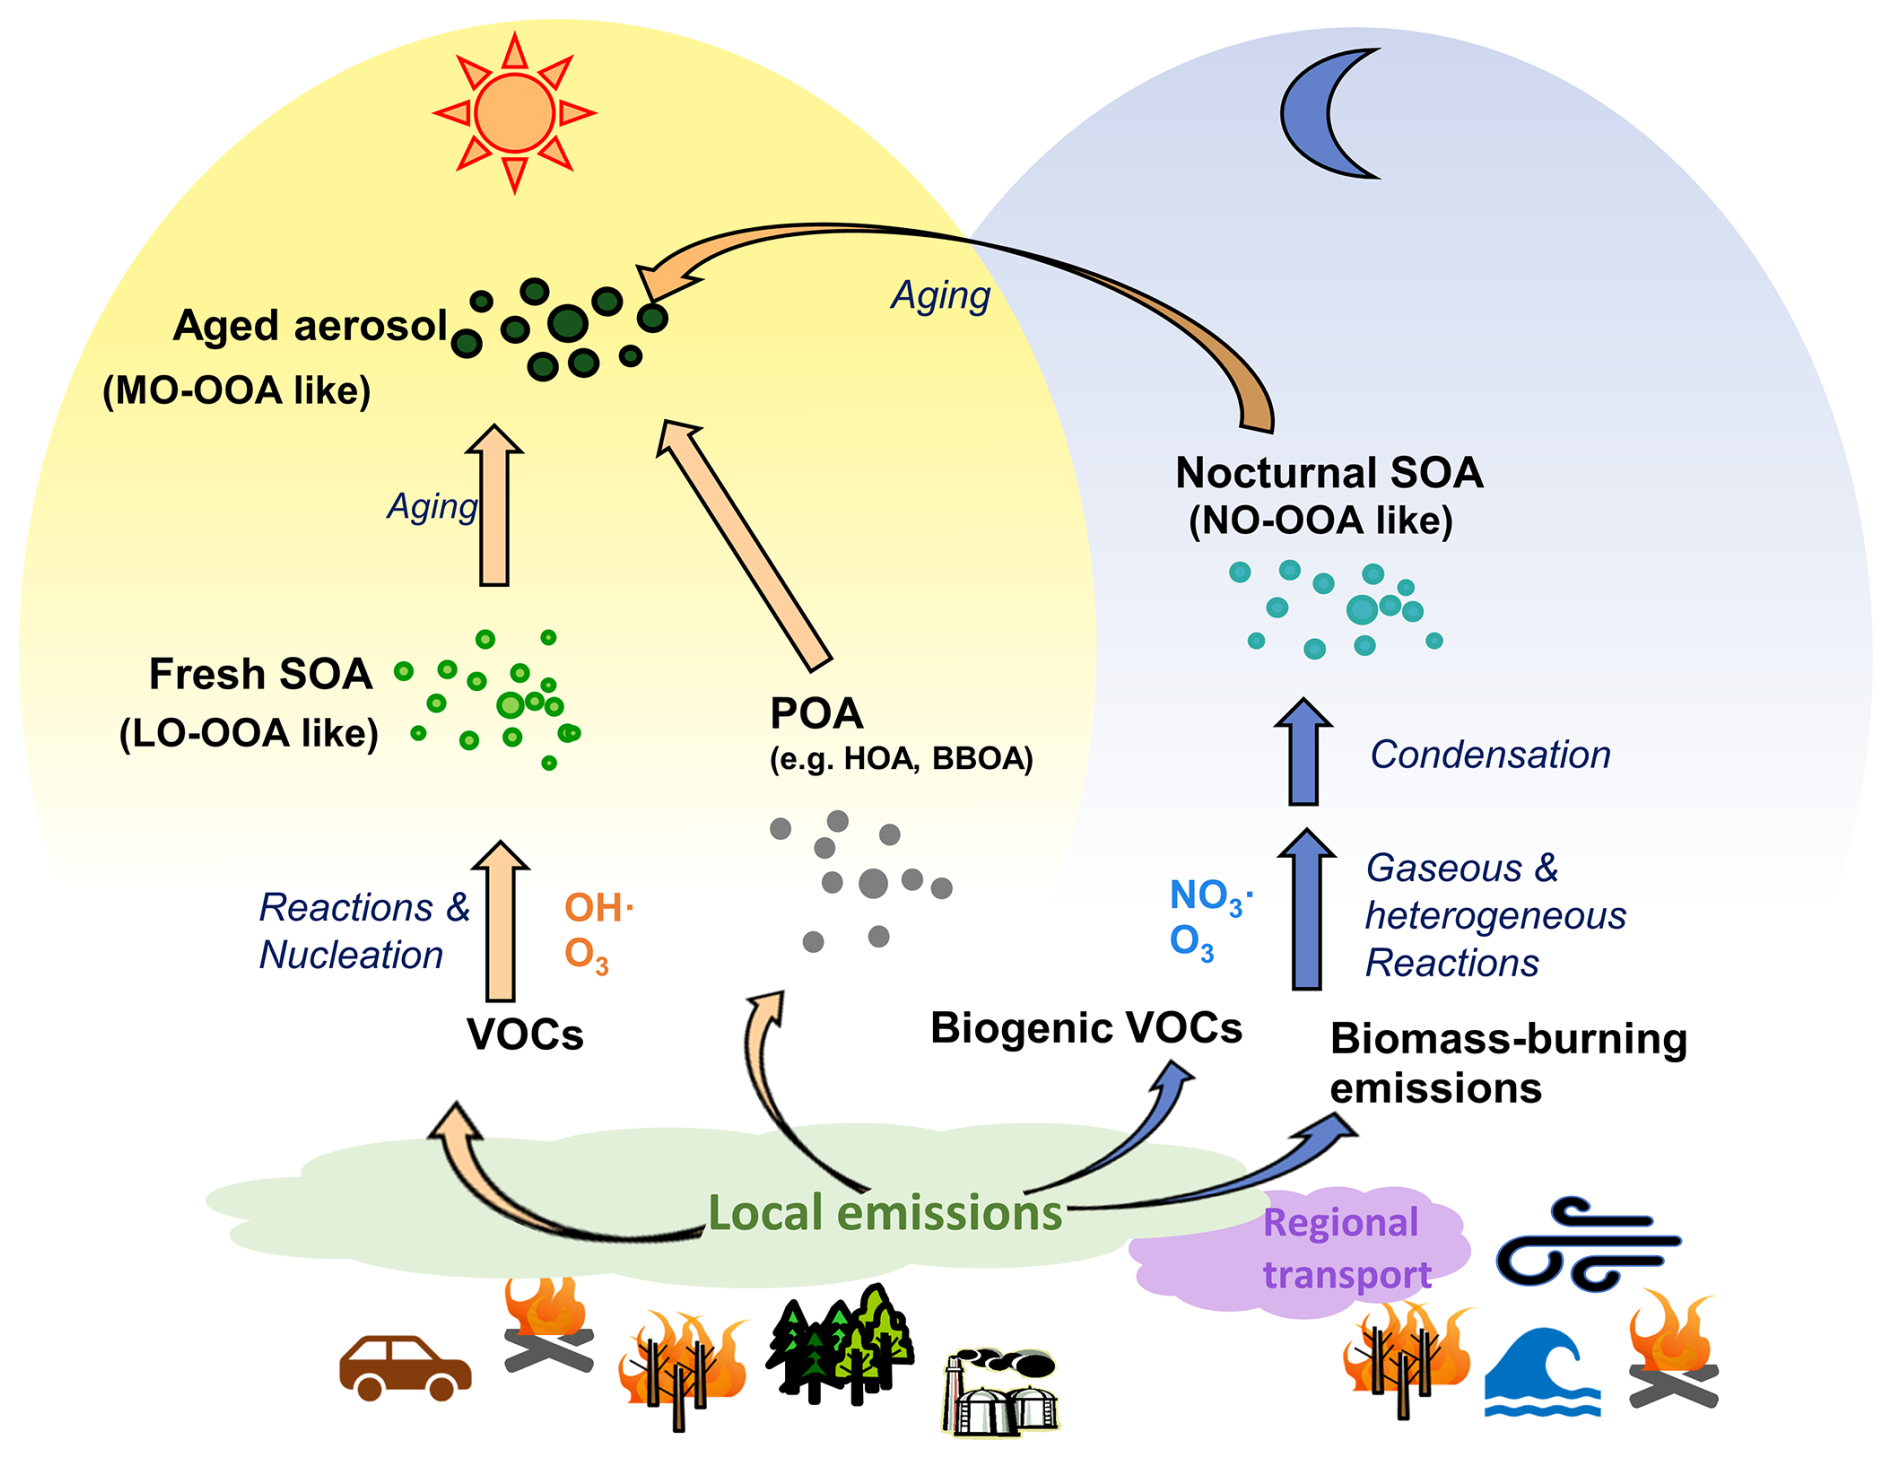
To investigate the complex sources and evolution of OA, receptor models are commonly used to analyze the OA composition, identifying several source factors. These factors primarily include primary OA (POA) components, as well as oxidized OA (OOA) formed through secondary oxidation, as shown in Fig. 1. Previous ambient studies aiming to identify sources primarily attributed OOA formation to photochemical processes (Hildebrandt et al., 2010; Jimenez et al., 2009; Sun et al., 2012; Kostenidou et al., 2015), like less oxidized oxygenated OA (LO-OOA) and more oxidized oxygenated OA (MO-OOA) in Fig. 1. However, laboratory experiments have demonstrated significant OOA production from nocturnal chemistry (Fry et al., 2009; Ng et al., 2008), which has also been supported by model simulations (Hoyle et al., 2007; Pye et al., 2010; Russell, 2005). Observational studies further suggest night-time OOA formation, as evidenced by observations of the enhancement of oxidized OA during the night (Saarikoski et al., 2012; Crippa et al., 2013; Florou et al., 2017; Cheng et al., 2021). The study by Liu et al. (2024a), which investigates data from the JULIAC (Jülich Atmospheric Chemistry Project) campaign, highlights nocturnal OOA formation (marked as NO-OOA in Fig. 1) from NO3 oxidation during all seasons.
In addition to local primary emissions and secondary formation, long-term regional transport affects atmospheric conditions as well as aerosol properties. For example, methanesulfonic acid (MSA, CH3SO3H) is widely regarded as a tracer for marine air transport because its precursor, dimethyl sulfide (Zorn et al., 2008; Ge et al., 2012), is primarily produced by phytoplankton and anaerobic bacteria in the ocean (Charlson et al., 1987). Regional transport carries MSA inland or to higher altitudes, shaping its atmospheric concentration and distribution, which in turn can influence CCN activity and climate (Yan et al., 2019). Methanesulfonic acid-containing organic aerosol (MSA-OA) has been resolved in previous studies, not only in the coastal and oceanic environments (Schmale et al., 2013), but also at continental sites (Crippa et al., 2014).
Several studies (Hass-Mitchell et al., 2024; Otu-Larbi et al., 2020; Ma et al., 2019) have analysed that strong SOA formation is associated with intensive photochemistry during heatwave events with coincident elevated O3 and biogenic VOCs (mainly isoprene) concentrations. However, the detailed changes in aerosol properties and the dominant SOA formation mechanism are less frequently discussed. In this multi-seasonal study, an unusually warm summer is observed, which is reported as the third warmest summer in Germany over the past 39 years (Matzarakis et al., 2020). Notably, the abnormal heatwave lasts 10 d, with ambient air temperatures reaching 36.6 °C at 50 m above ground. The continuous measurement during the heatwave provides a valuable case study for understanding changes in SOA formation under shifts in VOCs emissions due to heat and drought stress of vegetation. In this study, comprehensive measurements and analyses are conducted to investigate the seasonal variations in aerosol composition, with a particular focus on OA contributions from local primary emissions, secondary formation, and long-range regional transport. Building upon the study of Liu et al. (2024a), this study provides a more detailed analysis of the seasonal variations of NO-OOA formation from the perspective of its precursors. Special attention is given to the summer period, when a significant heatwave event occurred.
2.1 Campaign site and setup
The JULIAC campaign, conducted from January to November 2019 at Forschungszentrum Jülich, Germany (50.91° N, 6.41° E), aimed to understand annual variations of atmospheric oxidant concentrations (Cho et al., 2023), the composition of gas-phase species (Tan et al., 2022b), and submicron aerosols (Liu et al., 2024a). Intensive measurements were conducted during four periods in the different seasons: winter (JULIAC-I: 15 January–10 February), spring (JULIAC-II: 8 April–5 May), summer (JULIAC-III: 7 August–1 September), and autumn (JULIAC-IV: 28 October–24 November). The site, near a mixed forest and various anthropogenic sources such as a coal-fired power plant and a sugar factory, is influenced by both biogenic and anthropogenic emissions. During the JULIAC campaign, ambient air was sampled from 50 m height into the SAPHIR atmospheric chamber (Simulation of Atmospheric Photochemistry in a Large Reaction Chamber) (Bohn and Zilken, 2005; Bohn et al., 2005) and then analyzed by instruments connected to the chamber, minimizing the influence from local near-ground emissions, so that the air was representative of the region. Instruments measured radicals (e.g., OH, HO2, RO2) (Cho et al., 2023), trace gases, OH reactivity, submicron aerosol components, and the aerosol size distribution.
2.2 Instrumentations
The physical and chemical properties of ambient submicron aerosol were measured using an Aerodyne aerosol high-resolution time-of-flight aerosol mass spectrometer (HR-ToF-AMS), a scanning mobility particle sizer (SMPS 3080, TSI), and a condensation particle counter (CPC 3788, TSI). The HR-ToF-AMS provided continuous measurements of mass concentrations and size distributions for non-refractory chemical components of the aerosol (e.g., ammonium, nitrate, sulfate, chlorine, and organics). Comprehensive descriptions of the maintenance and data processing of HR-ToF-AMS in this study are provided in prior studies (Liu et al., 2022, 2024a). In brief, ionization calibrations were conducted biweekly throughout the campaign using an ammonium nitrate standard following Drewnick et al. (2005). The relative ionization efficiency (RIE) of species was also determined every two weeks using ammonium sulfate, following Jimenez et al. (2003), and the RIE values applied for each campaign phase are summarized in Table S1 in the Supplement. The AMS collection efficiency (CE) was constrained by comparison with concurrent SMPS measurements, assuming an average aerosol density of 1.4 g cm−3 (Cross et al., 2007). A constant CE of 0.96 was applied for JULIAC-I and II, whereas a composition-dependent CE (Middlebrook et al., 2012) with a value of 0.57 was used for JULIAC-III and IV. One flow rate correction was performed during JULIAC-II by comparing the AMS flow (derived from the lens pressure) with flow rate measurements obtained using a Gilibrator. The SMPS scanned particles in the 10–750 nm range with a 7 min cycle, while a standalone CPC recorded total particle concentrations (diameter >5 nm). N2O5 concentrations were measured by custom-built cavity ring-down spectroscopy (FZJ-CRDS), which is similar to the instrument described in Wagner et al. (2011), and CO, CO2, and CH4 were detected by a commercial cavity ring-down instrument (Picarro, G2401). Nitrogen oxides (NO and NO2) were detected using a chemiluminescence instrument with a photolytic converter (ECO PHYSICS), while O3 levels were measured with two UV photometers (Ansyco 41M and Thermo Scientific 49i), both of which showed good agreement (within 5 %). VOCs were monitored with a proton transfer reaction-time of flight mass spectrometer (PTR-ToF-MS). For the PTR-ToF-MS, the drift tube was operated at an of 126 Td during JULIAC I and II and adjusted to 120 Td during JULIAC III and IV. The PTR was calibrated on a weekly basis whenever possible. For calibration, the instrument was connected to our Liquid Calibration Unit (LCU), and a multi-step calibration was performed using a gas standard at ∼60 % relative humidity. We used four concentration steps and one zero step (five steps in total), with the standard diluted in the range of 1–15 ppb. The list of VOCs included in the calibration standard, along with their mixing ratios and uncertainties, is provided in Table S2. A spectroradiometer measured spectral actinic flux densities to determine photolysis frequencies (Bohn and Zilken, 2005; Bohn et al., 2005). OH, HO2, and RO2 radicals were measured using the FZJ laser-induced fluorescence (LIF) instrument (Cho et al., 2021), and the total OH reactivity (k(OH)) was measured using a laser-flash photolysis LIF instrument (Fuchs et al., 2017). Additional sensors, such as an ultrasonic anemometer (METEK, USA-1) and humidity, temperature, and pressure sensors (Driesen + Kern) monitored ambient 3D wind data, relative humidity (RH), temperature, and pressure at 50 m above ground and inside the chamber. Further details on data quality and instrument performance during the JULIAC campaign are provided in Cho et al. (2023).
2.3 Calculation of particulate organic nitrate and organosulfate concentrations
The concentration of particulate organic nitrate was calculated by an approach using nitrate fragment ratios () as shown in Eq. (1) based on HR-ToF-AMS measurements (Kiendler-Scharr et al., 2016; Farmer et al., 2010; Fry et al., 2013; Xu et al., 2015c).
Rmeasured represents the ratio of NO to NO+ ion fragments for aerosol measurements during the JULIAC campaign. Rcalib represents the corresponding fragment ratio measured from ammonium nitrate during biweekly calibrations of the ionization efficiency (IE) of HR-ToF-AMS during the campaign, while stands for that ratio for pure organic nitrate, with a value of 0.1 suggested by Kiendler-Scharr et al. (2016). Based on this method, lower-limit estimations of organic nitrate concentrations having an uncertainty of ±20 % (Xu et al., 2015c; Kiendler-Scharr et al., 2016) were reported in this study.
Particulate organosulfate concentrations were calculated from total sulfates measured by the HR-ToF-AMS using the sulfate fragment pattern method (Chen et al., 2019). The organosulfate calculation method makes use of the varying degrees of fragmentation of ammonium sulfate, MSA, and organosulfate during AMS measurements, resulting in differences in the distribution of fragments, including SO+, SO, SO, HSO, and H2SO. This method used in this study assumes that the fragment of H2SO is exclusively contributed by ammonium sulfate, while the fragment of HSO originates from only ammonium sulfate and MSA. Then, the mass concentrations of total sulfate measured by the instrument ToF-AMS could be distributed to the sulfate from ammonium sulfate, MSA, and organosulfate, as shown below:
∑HSO represents the sum of molar concentrations of fragments of SO+, SO, SO, HSO, and H2SO. and are the molar fractions of and normalized to ∑HSO for ammonium sulfate, which was measured during biweekly calibrations of the IE of the HR-ToF-AMS instrument during the JULIAC campaign. Similarly, stands for the molar fraction of normalized to the ∑HSO concentration for pure MSA. The value of =0.0587 reported by Chen et al. (2019) was used in this study, as their work showed a similar ammonium sulfate fragment distribution to ours. However, the study by Schueneman et al. (2021) points out that this method described above is not always reliable for identifying organosulfate. Based on that, the feasibility of this sulfate fragment pattern method is further discussed in Sect. 3.
2.4 PMF analysis
Positive matrix factorization (PMF) is applied to attribute the concentrations of aerosol components to various sources (Jimenez et al., 2009; Zhang et al., 2011; Sun et al., 2012; Dai et al., 2019; Crippa et al., 2014). PMF analysis decomposes the variability of a dataset X into a matrix of factor profiles F (source profiles) and a corresponding time series matrix G (source contributions) as shown in Eq. (6). Matrix E represents residuals not attributed to any source. The PMF algorithm minimizes the sum of squared residuals eij weighted by the uncertainty σij for all input points in X, indicated by Q as shown in Eq. (7).
To investigate seasonal variations in the sources and contributions of OA, PMF analysis was performed separately for each season on OA concentrations (mass to charge ratio, 12–160) measured by HR-ToF-AMS during the JULIAC campaign. The SoFi Pro software (version 8.0.3.1) (Canonaco et al., 2013) was used to control the multilinear engine (ME-2) algorithm (Paatero, 1999) for aerosol source apportionment, allowing for the incorporation of prior mass spectral information (Tables S3–S5) to reduce rotational ambiguity (Paatero and Hopke, 2003). A signal-to-noise () threshold of 2 was applied, and down-weighting was used for values below 1 to reduce errors. Factors identified in prior studies were used as references or for constraining the PMF analysis. The SoFi panel's criteria-based selection function was employed to explore similar results based on user-defined criteria, such as correlations with relevant trace gases (e.g., CO for biomass-burning sources). The optimal PMF solution was selected based on the evaluation of parameters, residuals, factor spectra, correlations with external tracers (e.g., VOCs, radicals, wind direction), and the interpretability of the factor's variation patterns. This involved assessing key parameters (e.g., Unexplained variation (UEV)) in Table S6, characteristics of source mass spectra (Tables S2–S4), and examining the agreement between resolved source factors with their diurnal patterns, related tracer, and atmospheric conditions (Figs. S1–S2).
2.5 Trajectory model
To understand the effect of long-term regional transport on aerosol properties, 24 and 72 h backward trajectories with GDAS 1° and a 2 h resolution from the sampling site were computed during the four JULIAC intensive phases using the HYSPLIT model (Version 5.0.0) (Stein et al., 2015), based on GDAS meteorological data from NOAA's Air Resources Laboratory (ARL). The trajectory arrival times match the detection times of instruments at the JULIAC campaign, with the trajectory endpoints set at 50 m above ground level. This altitude corresponds with the height of the sampling tube inlet of ambient air to the SAPHIR chamber. Further analyses, like cluster analysis and concentration field (CF) statistics (Seibert et al., 1994; Debevec et al., 2017), were performed using the ZeFir graphical interface (version 3.7) in Igor Pro (Petit et al., 2017). Additional details on ZeFir's trajectory analysis applications are available in previous studies (Debevec et al., 2021).
2.6 Aerosol liquid water content estimation
The aerosol liquid water content (ALWC) was estimated using the reverse mode of the ISORROPIA-II thermodynamic model (Fountoukis and Nenes, 2007). It uses measured ambient RH, temperature, and aerosol-phase concentrations to infer gas-phase species and predict thermodynamic equilibrium. This approach is advantageous when gas-phase precursors are unavailable, as in our dataset. By contrast, the forward mode of ISORROPIA-II requires both gas- and aerosol-phase inputs to simulate aerosol composition. However, previous evaluations have demonstrated strong consistency in the ALWC between the two modes for major aerosol components. The study of Fountoukis and Nenes (2007) reported normalized mean errors of 3.4±1.1 % for aqueous sulfate and 2.5±1.3 % for aqueous nitrate, which are the main drivers of ALWC. Since ALWC primarily scales with total aerosol mass, it is relatively insensitive to gas-phase constraints; accordingly, Guo et al. (2015) observed nearly identical ALWC predictions in both modes (slope = 0.993, intercept µg m−3, R2=0.99). Consequently, relying on the reverse mode ALWC is a solid approach.
The variations of non-refractory chemical component concentrations of submicron aerosol (NF-PM1), including organics, nitrate, ammonium, chlorine, and sulfate, were measured during each season of the JULIAC campaign. As shown in Table 1, the highest average concentration of NF-PM1 is observed in summer (JULIAC-III) (to be 7.7±4.8 µg m−3), which is more than seven times higher than the lowest concentration recorded in winter (JULIAC-I) (with 1.1±1.0 µg m−3 ). The annual average concentration of NF-PM1 is 4.0 µg m−3 at this semi-rural site, similar to aerosol levels reported in previous studies in Europe and the United States of America (Table 1). In general, OA are the major component, accounting for 39 % to 58 % of the total mass of submicron aerosols. Aerosol sulfate (16 %–26 %) is the second most abundant component, followed by nitrate (5 %–26 %). The mass fractions of aerosol nitrate and organics show distinct seasonal patterns. During summer, nitrate contributes only about 5 % of the total aerosol mass, substantially lower than the 23 %–26 % observed in other seasons, due to its high volatility. In contrast, OA contributes a much higher fraction in summer (58 %) than in the other seasons (ranging from 39 % to 58 %), indicating a pronounced seasonal enhancement. The sulfate fraction remains relatively constant (20 %–26 %) throughout the year. To better understand these trends in aerosol composition and concentration, we conduct a detailed comparison of the properties of OA in each season. Additionally, the contributions of organic nitrate and organosulfate are estimated to evaluate the seasonal formation processes contributing to these aerosol species.
Table 1Overview of the seasonal average concentrations of components of submicron aerosol measured by HR-ToF-AMS, together with atmospheric conditions (RH, and ambient temperature) during the four JULIAC intensive phases, compared with previous field observations.
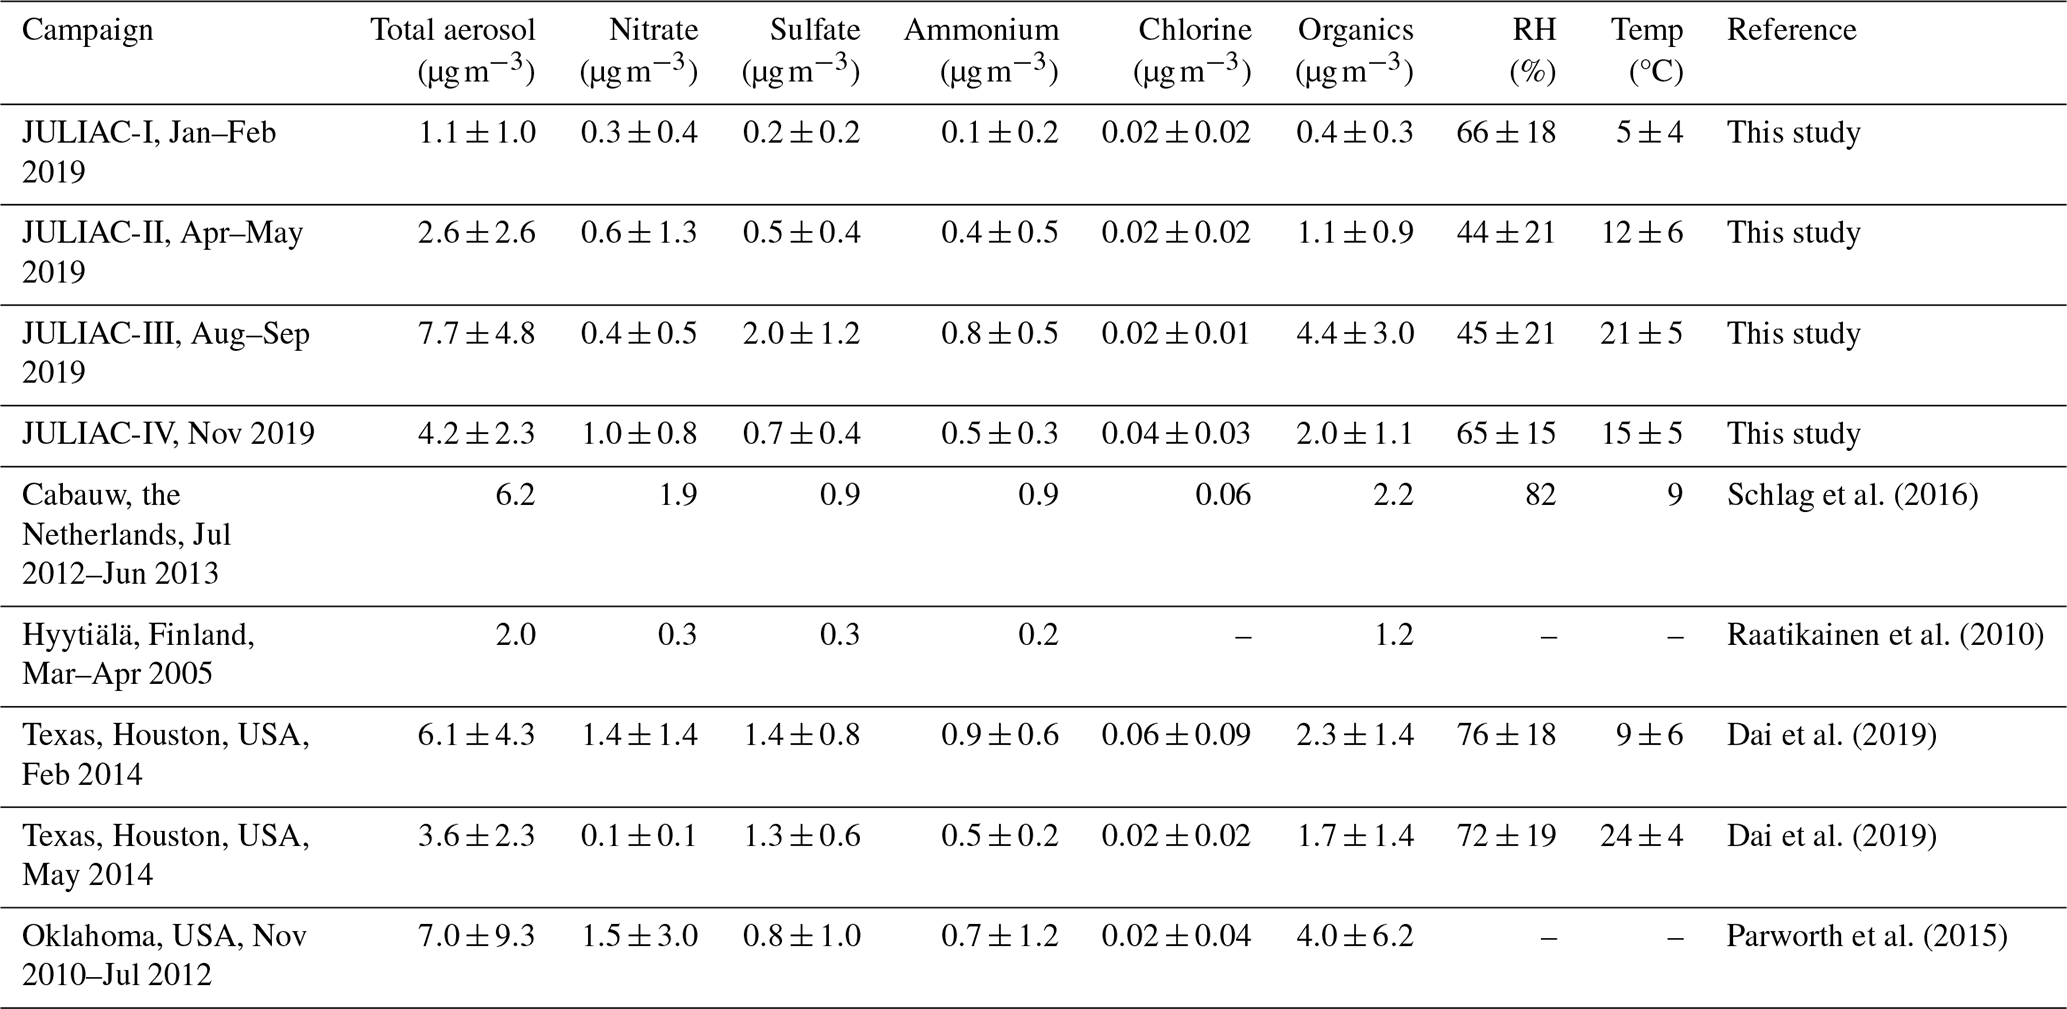
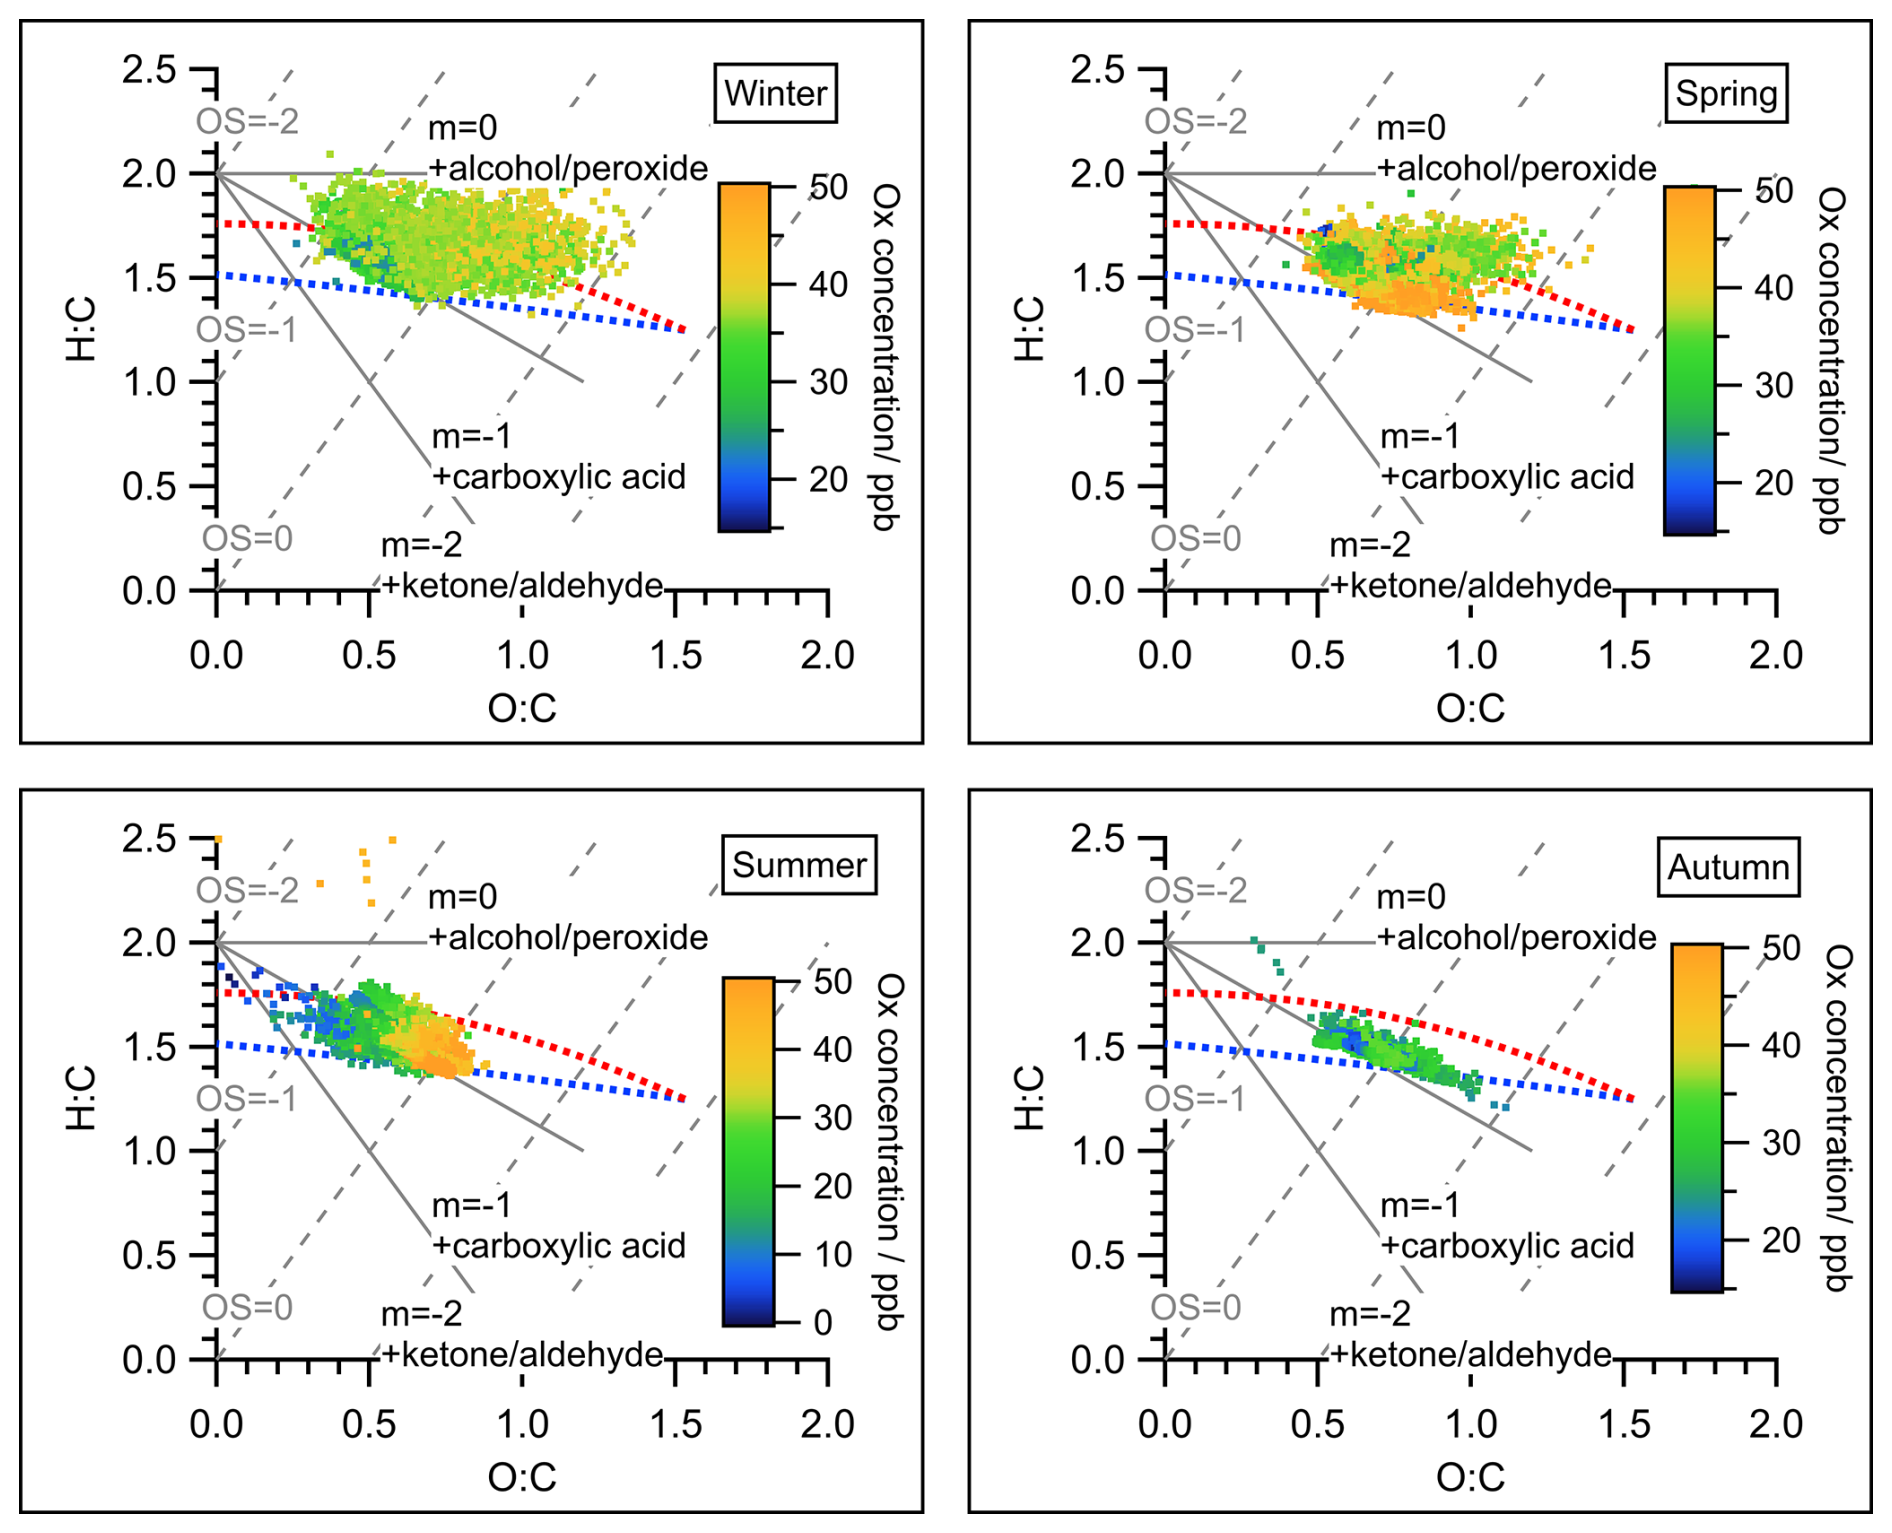
Figure 2Van Krevelen triangle graph for all measurements of OA during the four seasons of the JULIAC campaign. Atomic ratio regions of standard groups for alcohol/peroxide, carboxylic acid, and ketone/aldehyde (Aiken et al., 2007) were marked as references. The dots in all graphs were color-coded by the concentration of the oxidant Ox (NO2+ O3) to represent the intensity of secondary oxidation. The red and blue dashed line corresponds to the right and left lines of the triangle introduced in Ng et al. (2010), representing the lower oxidation level (like POA) and higher oxidation level (like SOA), respectively. The estimated carbon oxidation states (OSc ≈ 2O/C-H/C) were marked as gray dashed lines. An overview of the averaged elemental ratios O:C, H:C, and OSc with corresponding standard deviations of total OA for the four JULIAC intensive phases is given in Table S7.
OA dynamically evolves in the atmosphere, converging to a higher oxidation status with time (Ng et al., 2011), which can be indicated by a high elemental O:C ratio or estimated carbon oxidation states (OSc ≈ 2O/C-H/C) (Canagaratna et al., 2015). Hence, the oxidation degree of OA is a key parameter for understanding the atmospheric evolution of OA. In Fig. 2, the degrees of oxidation of OA during each season are displayed in a Van Krevelen triangle (Ng et al., 2011), color-coded with Ox concentrations. Ox, defined as the sum of O3 and nitrogen dioxide (NO2), is a conserved quantity under photochemical cycling and is often used as a proxy for atmospheric oxidation capacity and, consequently, the intensity of secondary oxidation in the atmosphere (Li et al., 2015; Canonaco et al., 2015). During summer, the strongest correlation between the O:C ratios of OA and the Ox concentrations is observed, suggesting the significant contribution of SOA formation to total OA. This assumption is further discussed and supported by the results of the source apportionment analysis presented in Sect. 4.1. The average oxidation degrees of OA for each season are calculated (Table S7). The overall oxidation degree of OA reaches the minimum during summer with an average O:C of 0.64 and the maximum in spring with an average O:C equal to 0.76. The difference in OA properties originates from the difference in emission sources and SOA formation mechanisms among seasons, which will be confirmed by the aerosol source apportionment analysis below (Sect. 4.1).
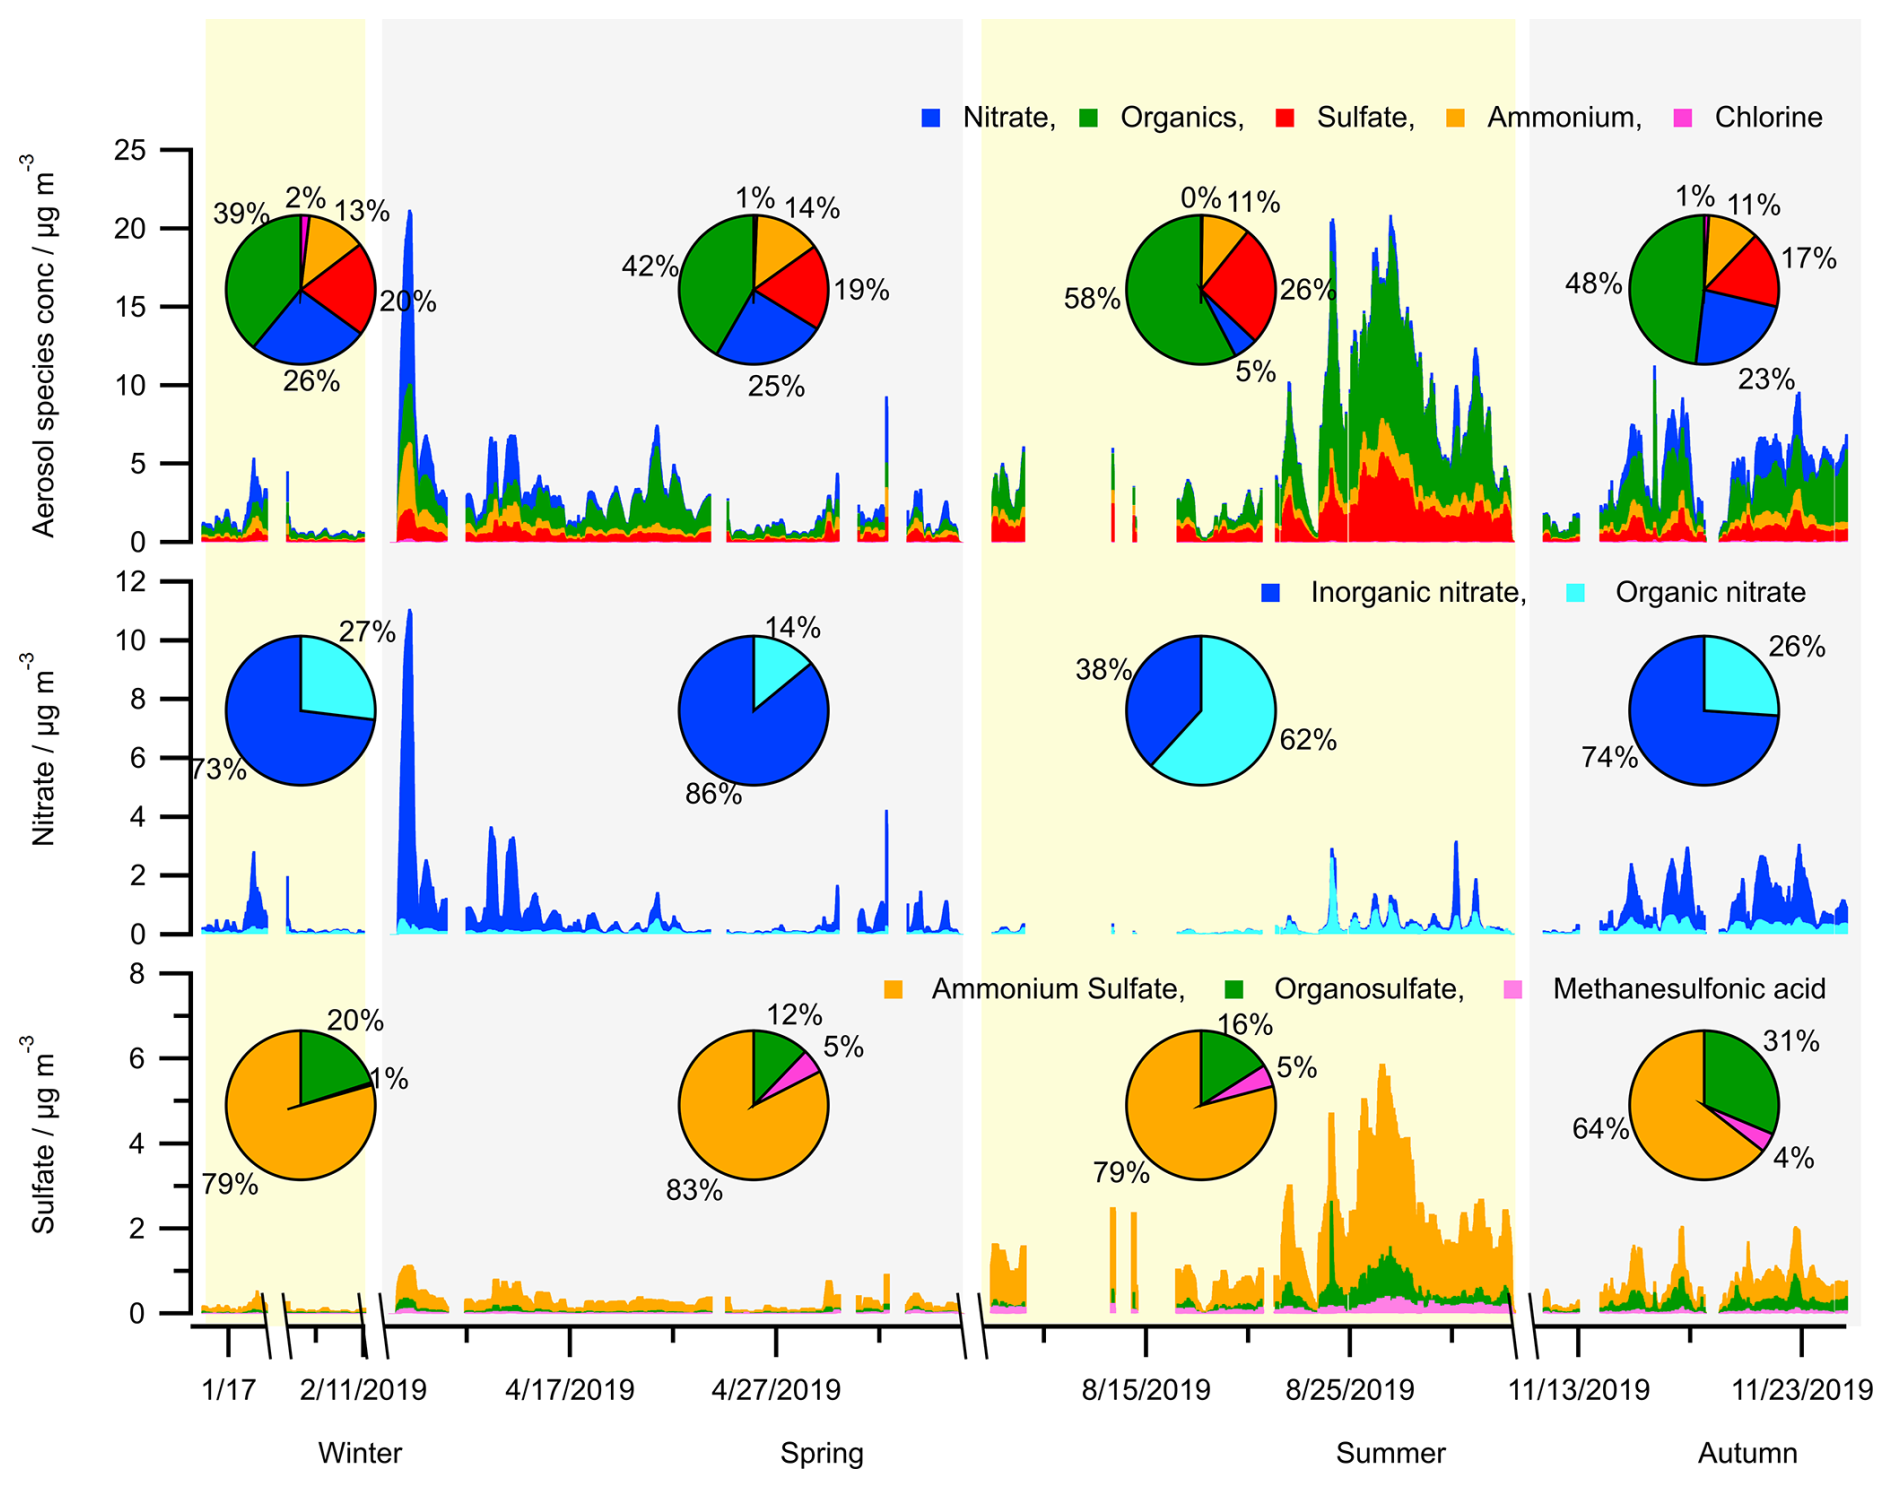
Figure 3Seasonal variation in the concentrations of aerosol bulk components (organics, sulfate, nitrate, ammonium, chlorine) and calculated concentrations of species (organic nitrate, organosulfate, methanesulfonic acid) from HR-ToF-AMS measurements.
Particulate organic nitrates have been reported as ubiquitous components and significant contributors to OA mass in both Europe and the United States of America (Kiendler-Scharr et al., 2016; Ng et al., 2017). In this study, a high mass fraction of organic nitrate to total aerosol nitrate, up to 62 %, is found during the summer (JULIAC-III) (Fig. 3). This is not the first time that a high mass fraction of organic nitrate has been observed in the European area. For instance, the fraction of organic nitrate to total aerosol nitrate was found to be 67 % at Cabauw, Netherlands in March 2008, 73 % at Melpitz, Germany in March 2009, 63 % at Harwell, UK in October 2008, and 67 % at Vavihill, Sweden in October 2008 (Kiendler-Scharr et al., 2016). In this previous study based on combined analyses of chemistry transport models, abundant organic nitrate is found to be mainly formed via the NO3 oxidation of biogenic VOCs (especially of monoterpenes). In the JULIAC campaign, significant nocturnal oxidized OA production in all seasons is observed, and rich particulate organic nitrate during summer has been found to originate from the NO3 oxidation of biogenic VOCs in a previous study (Liu et al., 2024a). Additionally, a high level of organic nitrate contribution, up to 20 % of the submicron nitrate, is observed during wintertime of the JULIAC campaign in Fig. 3, which is demonstrated to be related to the NO3 chemistry of anthropogenic VOCs, such as phenolics from residential heating (Liu et al., 2024a).
The concentration of organosulfate is the highest in summer (JULIAC-III, up to 2.5 µg m−3) (Fig. 3), followed by autumn (JULIAC-IV, up to 0.85 µg m−3). Previous studies have reported that the most abundant aerosol organosulfate species are mainly derived from the oxidation of isoprene and monoterpenes (Wang et al., 2021). The strong correlation between organosulfate and biogenic OOA during summer (JULIAC-III; see Fig. S3) indicates that biogenic precursors also play a dominant role in the formation of organosulfate during this period. In addition, the high consistency between the variation of biogenic OOA and organosulfate concentrations, as well as the total surface and volume of aerosols detected by SMPS (Table S8), demonstrates that multi-phase reactions involving SOA and sulfur dioxide (SO2) are one potential pathway for organosulfate formation during summer. A previous chamber experiment on organosulfate formation from multiphase reactions (Yao et al., 2019) emphasizes the crucial role of ALWC in regulating the reactive uptake coefficient of SO2, ultimately influencing aerosol organosulfate formation. In our study, we observed significantly higher organosulfate concentration during a summertime heatwave event. During the heatwave event, despite a modest 10 % decrease in RH, the ALWC increased by a factor of 2.3 compared to the summer period before the heatwave. This increase is likely driven by enhanced concentrations of particulate sulfate, nitrate, and organics (Meng et al., 2024), which can contribute to greater aerosol hygroscopicity and subsequently promote SO2 uptake and organosulfate formation. However, due to the absence of SO2 measurements in this study, this interpretation remains highly uncertain. More investigations of the heatwave event will be discussed in Sect. 4.2. Figure 3 further illustrates that the mass fraction of organosulfate to the total sulfate shows a high relative value of 20 %–31 % during cold seasons (autumn and winter) compared to values of 12 %–16 % during warmer seasons (spring and summer). Numerous laboratory studies have demonstrated that organosulfate can be produced through aqueous-phase oxidation of aromatic compounds in the presence of inorganic sulfate (Wang et al., 2021; Huang et al., 2020). The elevated ALWC and enhanced continuous anthropogenic activities during colder seasons, such as residential heating (Sect. 4.1), may further promote the aqueous-phase formation of organosulfate. However, further research is required to reach a definitive conclusion.
The feasibility of the method used here to calculate organosulfate concentrations (Sect. 2.3) has been evaluated in a previous study (Schueneman et al., 2021). The results indicate that this method can reliably determine ambient organosulfate concentrations when aerosol properties fall within a specific range: aerosol acidity pH >0 and an ammonium nitrate fraction below 0.3 (corresponding to condition II, marked by red dashed box in Fig. 4). Outside of this range, there is a high likelihood that organosulfate concentrations are underestimated. In this study, high concentrations of aerosol organosulfate were found in summer and autumn based on this method, with high reliability indicated by 84 %–99 % of the periods falling within condition II (Fig. 4). In contrast, the greatest uncertainty occurs in winter, when only 43 % of the measurements meet condition II, suggesting an underestimation of organosulfate concentrations during that season.
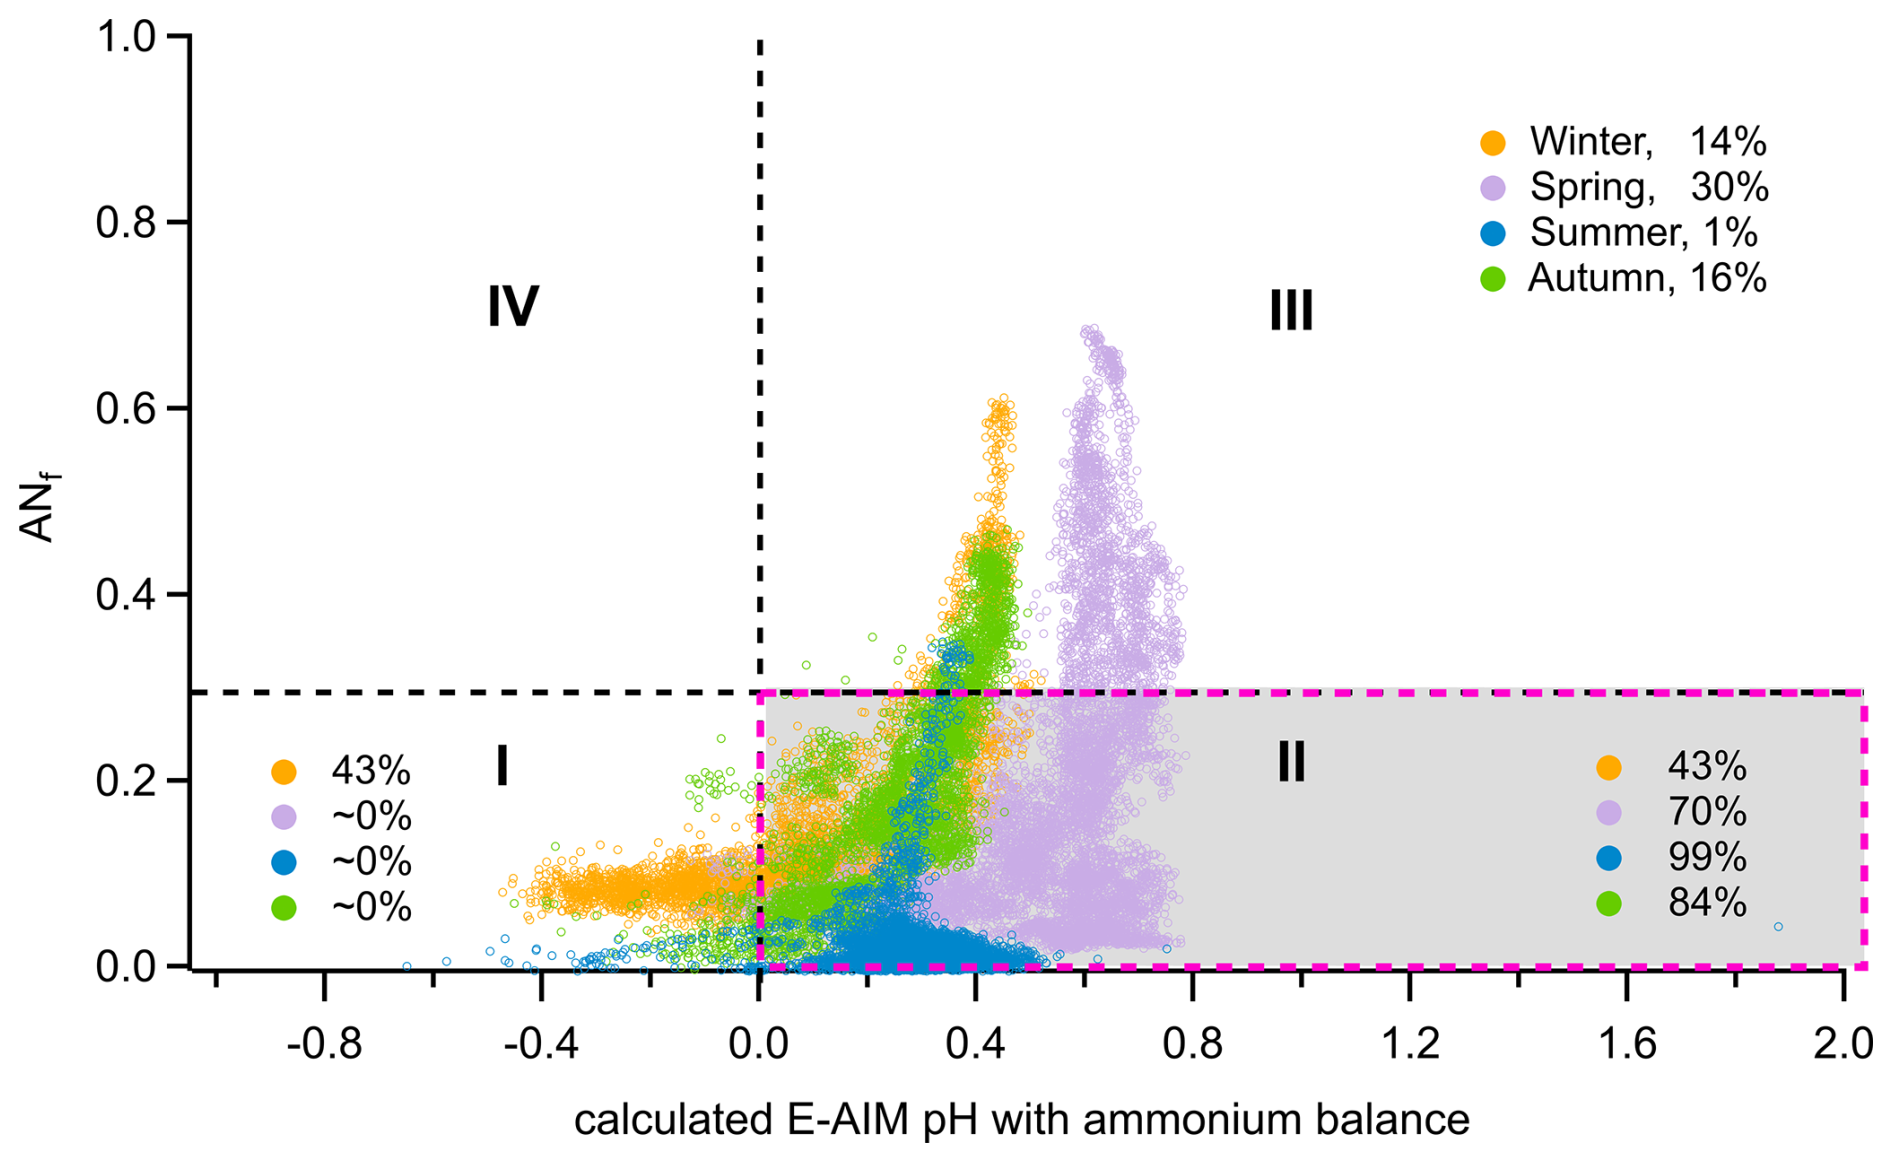
Figure 4Distribution of aerosol data points measured during the four seasons of the JULIAC campaign for chemical conditions defined by the ammonium nitrate mass fraction (ANf) and the pH predicted by the Extended Aerosol Inorganics Model (E-AIM) as established by Schueneman et al. (2021). The E-AIM pH was estimated from the measured ammonium balance using HR-ToF-AMS via the empirical calculation method introduced by Schueneman et al. (2021). For all seasons, the fractions of data points under the four conditions were calculated and displayed within the corresponding areas.
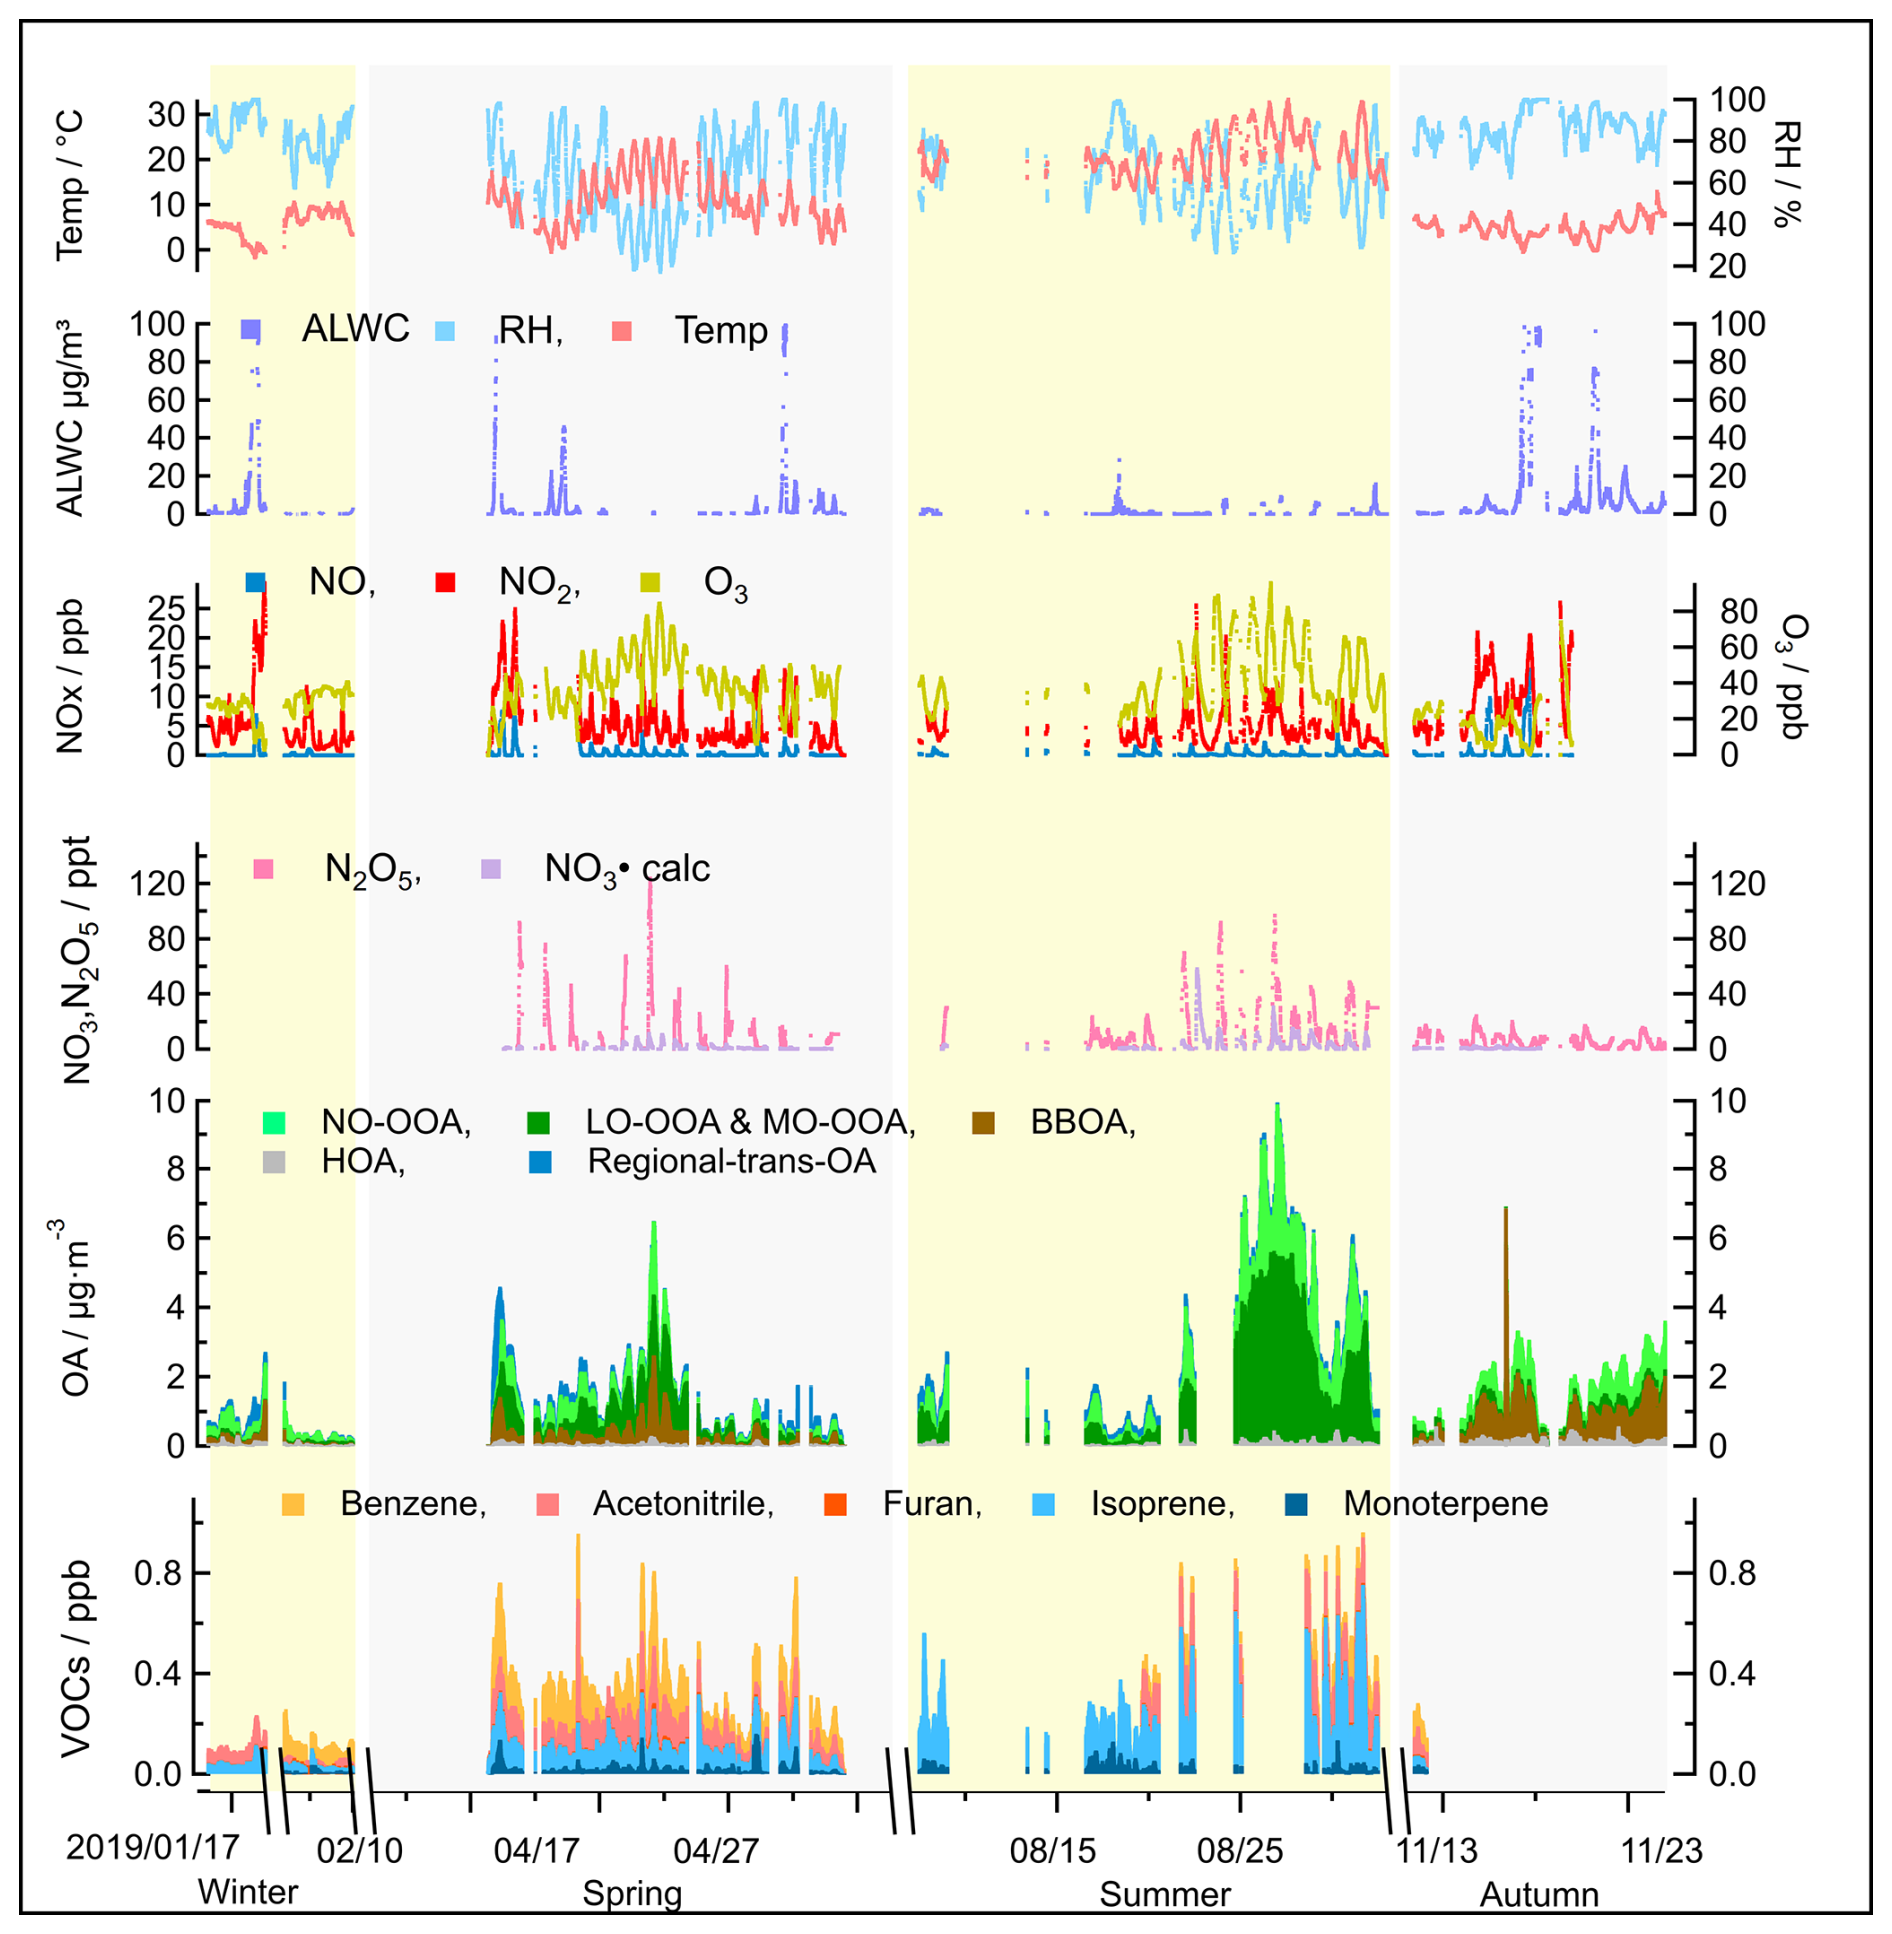
Figure 5Overview of seasonal variations in source contributions derived from the PMF analysis of OA measurements, including supporting ambient measurements that can be used to identify sources, such as ALWC, trace gase concentrations (VOCs, O3, NOx, N2O5, NO3 radicals), and meteorological parameters (temperature and RH), measured during the JULIAC campaign.
4.1 Overview of seasonal sources of organic aerosols
The seasonal variations of meteorological parameters (e.g., RH, wind conditions) and various tracers, including VOCs (e.g., monoterpenes, furan), radicals, trace gases (e.g., NO, NO2, CO), are displayed in Fig. 5. For the OA concentrations, the contributions of the identified sources are shown, with the complete mass spectra and diurnal patterns of seasonal OA sources provided in Figs. S4–S7. The comprehensive measurements enhance and strengthen the accuracy of the identification of POA sources and improve the understanding of the dominant mechanisms driving SOA formation (Liu et al., 2024a).
Overall, SOA formation, consisting of LO-OOA, MO-OOA, and NO-OOA, dominates the OA mass in most seasons, contributing 46 % to 88 % of total OA (Figs. 5, 6). The only exception was observed in autumn, when primary emissions, particularly from biomass-burning, became more abundant. Nighttime SOA formation via NO3-initiated oxidation, represented by NO-OOA, accounts for 21 % to 48 % of the total OA, highlighting the importance of nocturnal oxidation processes (Liu et al., 2024a). The balance of daytime (LO-OOA, MO-OOA) and nighttime (NO-OOA) oxidation varies seasonally, reflecting shifts in the dominant OA formation pathways. In summer, daytime biogenic oxidation processes dominate, contributing more than 50 % of the OA mass. Conversely, during colder periods such as autumn and winter, nighttime oxidation surpasses daytime oxidation, indicating a stronger influence of nocturnal pathways. POA and SOA related to biomass-burning sources comprise 83 % of the total OA mass during autumn. This emphasizes the need for emission control measures targeting biomass-burning, especially with respect to residential heating and industrial activities (Sect. 4.1.1) to improve air quality in autumn and winter. The seasonal changes of OA source factors are displayed in the space of fCO (fragment fraction of CO in OA) vs. fC2H3O+ (fragment fraction of C2H3O+ in OA) as shown in Fig. 6, complemented by a correlation analysis of the source spectra (Tables S3–S5). Primary emissions, represented by hydrocarbon-like OA (HOA) and biomass-burning OA (BBOA), cluster at low fCO and low fC2H3O+ values, similar to primary source characteristics reported in previous studies (Sun et al., 2012; Zhang et al., 2015; Crippa et al., 2013; Chen et al., 2015). Seasonal variability in biomass-burning emissions is evident from the scattered distribution of BBOA (Sect. 4.1.1). For secondary sources, LO-OOA factors found during spring and summer have higher fC2H3O+ but lower fCO than the MO-OOA factors in winter and autumn, which implies biogenic derived SOA formation during spring and summer (Canonaco et al., 2015). For nocturnal oxidation sources, NO-OOA factors cluster closely in the fCO vs. fC2H3O+ space in spring, autumn and winter, while summer NO-OOA exhibits the highest fC2H3O+ and lowest fCO values. The distinct oxidation level of summer NO-OOA, as discussed in the prior study (Liu et al., 2024a), is attributed to biogenic precursors driving NO3-initiated oxidation in summer, in contrast to biomass-burning emissions being the precursors in the other seasons.
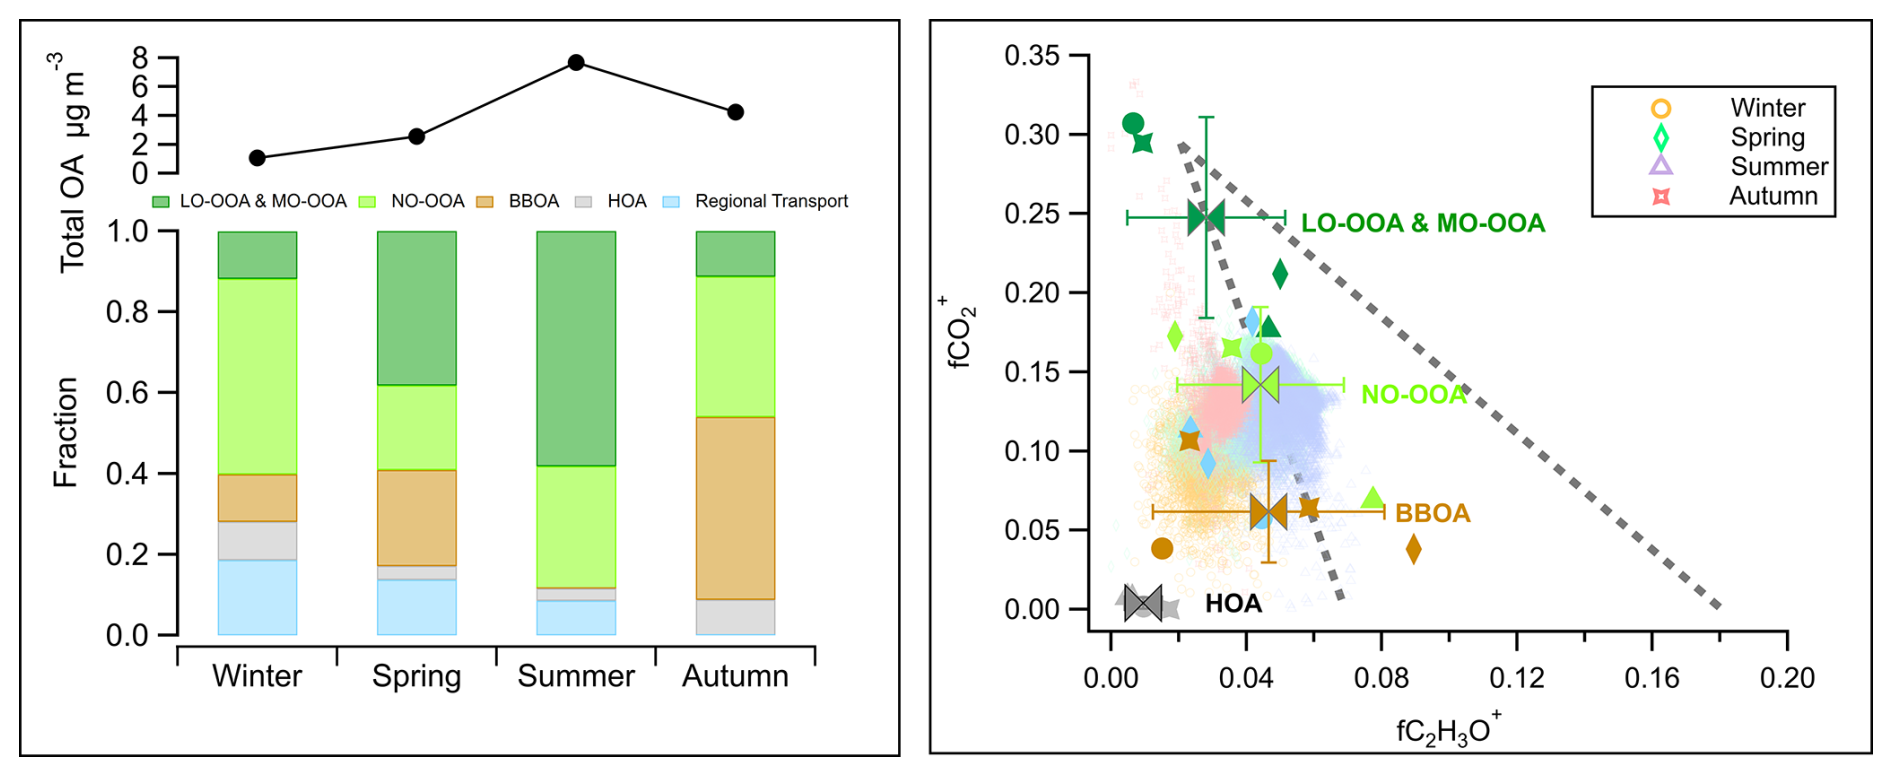
Figure 6Left panel: Comparison of the average total mass concentration of OA measured by HR-ToF-AMS and the mass fraction of primary and secondary sources' contributions to OA during the JULIAC campaign. Right panel: fCO (fraction of fragment CO in OA) vs. fC2H3O+ (fraction of fragment C2H3O+ in OA) for all OA during the JULIAC campaign (small transparent dots). The OA source factors (including LO-OOA, MO-OOA, NO-OOA, BBOA, HOA, and regional transport factors) resolved by PMF during each season are shown in fCO vs. fC2H3O+ space (the marker types representing the different seasons, the marker color stands for factor type). Mean values and standard deviations for these four types of source factors are also displayed. The coarser dashed lines represent the distribution triangular region of ambient OOA factors reported in Ng et al. (2010), where corresponds to the mass to charge ratio of CO ( 44) to C2H3O+ ( 43).
4.1.1 Primary emissions of organic aerosols
The HOA factors show the lowest O:C ratios (0.03–0.13) and the highest H:C ratios (1.61–2.1) among all source factors identified in the JULIAC campaign (Figs. S4–S7), consistent with previous results (DeCarlo et al., 2010; Mohr et al., 2012; Crippa et al., 2013; Sun et al., 2016). A comparison of the HOA spectra with previous studies is presented in Table S3, showing high correlation coefficients (R2 ranging from 0.72 to 0.99) and θ, the angular distance between unit mass spectra vectors (Kostenidou et al., 2009), between 12.8 and 33.1°, which confirms the robustness of the method to identify HOA in this study. The diurnal pattern of the HOA factor shows a significant peak during the morning rush hour, indicating that traffic exhaust is the primary source. In Fig. 7, the HOA factor shows the highest correlation coefficients with the traffic emission tracer gases compared to other factors, with R2 values of 0.36 for NO, 0.35 for NOx, 0.41 for toluene, and 0.40 for xylene. Additionally, the diurnal variations of these traffic emission tracer gases are well correlated with the variation of HOA (Fig. S8), which further supports our conclusion that the HOA source mainly represents the OA contribution from traffic emissions.
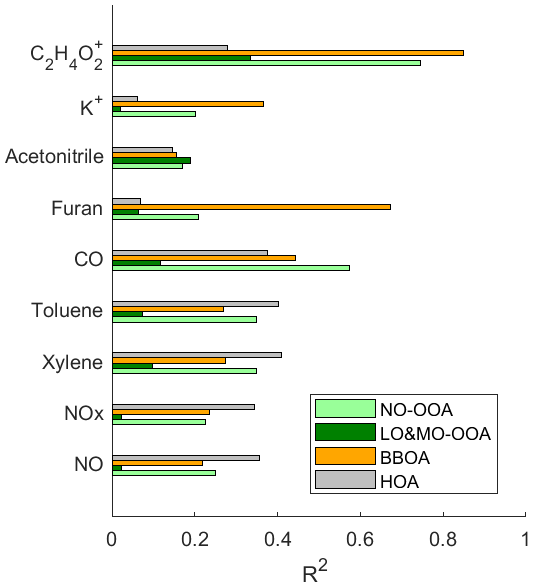
Figure 7Cross-correlation R2 of major OA sources among tracer gases of car exhaust (NO, NOx, xylene, toluene), trace gases of combustion and biomass-burning (CO, furan, acetonitrile), and characteristic aerosol fragments of biomass-burning (K+, C2H4O). OA regional transport factors are not shown due to their extremely low correlation with all primary emission tracers.
Characteristic fragments C2H4O ( 60) and C3H5O ( 73) are well-established indicators for biomass-burning in AMS mass spectra (Simoneit et al., 1999; Alfarra et al., 2007). In this study, these ion mass signals are prominently detected in the BBOA factor spectrum. Furthermore, the BBOA time series aligns closely with the time series of fragment C2H4O ( 60) during the whole JULIAC campaign, showing the highest correlation coefficient of R2=0.85 (Fig. 7). In addition, the correlation coefficients between the time series of the OA factors and the biomass-burning tracers, such as furan (Akherati et al., 2020; Coggon et al., 2016) and aerosol potassium (K+) (Li et al., 2003; Yu et al., 2018; Zhang et al., 2013; Tao et al., 2014) are shown in Fig. 7. The BBOA factor exhibits a significantly higher correlation value with all mentioned tracers than other primary sources (HOA) and secondary sources (LO-OOA and MO-OOA), supporting its identification as BBOA. The BBOA factors show a lower O:C ratio (0.28 to 0.36) than the OOA factors but a higher ratio than the HOA factors, consistent with previously reported BBOA oxidation levels (Mohr et al., 2012; DeCarlo et al., 2010; Aiken et al., 2009). The high-resolution BBOA spectra from prior studies (Mohr et al., 2012; Hu et al., 2013) are similar to the BBOA spectra from each JULIAC phase (Table S4). The BBOA identified in this study closely resembles findings from Hu et al. (2013), with R2 ranging from 0.76 to 0.94 and θ from 14.2 to 27.9°, confirming the BBOA factor identification.
As mentioned above, BBOA source factors show seasonal differences (Fig. 6), suggesting distinct types of biomass-burning during each season. The BBOA factor observed in spring is also associated with a different type of biomass-burning, as indicated by the high fC2H3O+ ratio (Fig. 6). This BBOA factor is confirmed to be related to the regional transport of wildfire emissions (Sect. 4.1.3.2). The most abundant OA contribution from biomass-burning is found in autumn, where two distinct BBOA sources are identified: one dominated by local emissions and the other associated with regional transport (Fig. S2). The local BBOA source is likely related to residential heating and nearby emissions from the sugar factory, which have active production of sugar only during the autumn phase. Some industries in Germany, such as sugar factories, are adopting biomass fuels like beet pulp to reduce fossil fuel use and achieve climate-neutral production by 2040 (Insight, 2023). This shift is part of a broader energy transition that includes biomass-burning as an alternative energy source (Lipiäinen et al., 2022; Bataille, 2020). These changes are expected to affect anthropogenic emissions and, in turn, atmospheric chemistry.
4.1.2 Secondary formation of organic aerosols
In this study, LO-OOA is predominantly observed during spring and summer, while MO-OOA is dominant during autumn and winter (Figs. S4–S7). Both LO-OOA and MO-OOA spectra exhibited strong contributions from fragments at 44 (with the signal at 28 assumed to be equal to that at 44; Aiken et al., 2008), with dominant ion families CxHyO and CxHyOz (z>1). The oxidation degrees of LO-OOA and MO-OOA are the highest among OA sources in all seasons, with O:C ratios ranging from 0.7 to 1.0, comparable to previous studies (Hu et al., 2013; Xu et al., 2015b; Sun et al., 2016; Dai et al., 2019). The high-resolution mass spectra of LO-OOA and MO-OOA identified in this study can be compared with those of prior source apportionment studies (Mohr et al., 2012; Crippa et al., 2013; Hayes et al., 2013; Hu et al., 2013; Hu et al., 2015), with R2 0.93–0.99 and θ ranging from 5.9 to 15.7°. The highest similarity is observed with the results of Hu et al. (2013). LO-OOA and MO-OOA are the only source factors showing distinct diurnal peaks around noon (11:00–14:00 UTC, Figs. S4–S7), a pattern characteristic of SOA formed through photochemical processes. High correlations between O3 and LO-OOA or MO-OOA time series are observed during the warmer seasons, specifically in spring and summer, with R2 values of 0.56 and 0.71, respectively. Therefore, the LO-OOA and MO-OOA factors identified during the JULIAC campaign are mainly dominated by daytime oxidation processes.
The NO-OOA factor resolved in this study is attributed to nocturnal OOA formation dominated by NO3 chemistry, with a diurnal peak around midnight (20:00–04:00 UTC, Figs. S4–S7). The O:C ratios of NO-OOA vary from 0.39 to 0.91, which depends on the seasonal precursors, biogenic VOCs, particularly monoterpenes in summer, and biomass-burning emissions in the colder seasons (Liu et al., 2024a). The potential phase partitioning, nocturnal boundary layer development, and various reaction pathways (such as ozonolysis, aqueous phase reactions, and NO3 chemistry) have been thoroughly discussed in the study of Liu et al. (2024a). That study has introduced an improved source apportionment method, using PMF analysis of aerosol organic and nitrate bulk measurements to differentiate between the OOA formed from nocturnal and daytime oxidation. Also, the NO-OOA factor shows typical characteristics, such as a higher ion intensity fraction of nitrate fragments (NO NO) normalized to the total ion intensity (f(NO NO) >0.1) and higher nitrogen to carbon ratios (N:C, 0.05–0.15) than the OOA formed from daytime oxidation (LO-OOA and MO-OOA). High OA mass fractions of NO-OOA (21 %–48 %) highlight a significant formation via NO3-initiated nocturnal oxidation in all seasons.
Overall, SOA sources, represented by OOA factors (LO-OOA, MO-OOA, NO-OOA), contribute 46 %–88 % of the total OA mass throughout the campaign. Seasonal variations in the relative contributions of daytime (LO-OOA, MO-OOA) and nighttime (NO-OOA) oxidation pathways indicate that OOA formation is dominated by daytime oxidation of biogenic VOCs in spring and summer, accounting for 64 %–66 % of OOA. In contrast, during autumn and winter, nocturnal oxidation (NO-OOA) exceeds daytime oxidation and dominates OOA formation, contributing 75 %–80 %.
4.1.3 Regional transport effect on organic aerosols
In this study, OA transport events are identified by a PMF analysis. These events are air masses originating from marine regions or wildfires. The regional influences inferred from source factor characteristics align well with trajectory model results, further supporting the PMF analysis as an appropriate method for resolving regional transport events. However, the PMF analysis becomes less effective under conditions of persistent and strong regional influence. For instance, during autumn, sustained strong winds can create a continuous influx of regional air masses, leading to a more homogeneous aerosol composition. This continuity reduces the variability needed for PMF to distinguish between distinct sources or transport patterns. Additional discussion on the regional transport of OA is provided below.
Regional transport from the ocean
The OA contribution from regional transport of the ocean is attributed during spring (JULIAC-II) and summer (JULIAC-III) to the MSA-OA source factor. As shown in Fig. 8, the MSA-OA factor contains typical marker fragments: CHS+ ( 44.98), CH2SO ( 77.98), CH3SO ( 78.99), and CH4SO ( 95.99). Among these fragments, CH3SO is regarded to be a characteristic fragment for the MSA containing ambient aerosols and has been reported as the most abundant organosulfate ion in the MSA-OA factor profile in previous studies (Zorn et al., 2008; Huang et al., 2017). The MSA-OA factor in this study shows a high similarity in the marker fragments as well as in the full mass spectrum (R2=0.84) with the MSA-OA factor resolved by Schlag et al. (2017). We also find the ion fragment CH3S+ ( 47.00) in the MSA-OA factor, which has been mentioned in Schmale et al. (2013). The low intensity of the CH3S+ ( 47.00) ion mass signal may be one possible reason why it has not been reported frequently so far and is not commonly considered a stable marker ion.
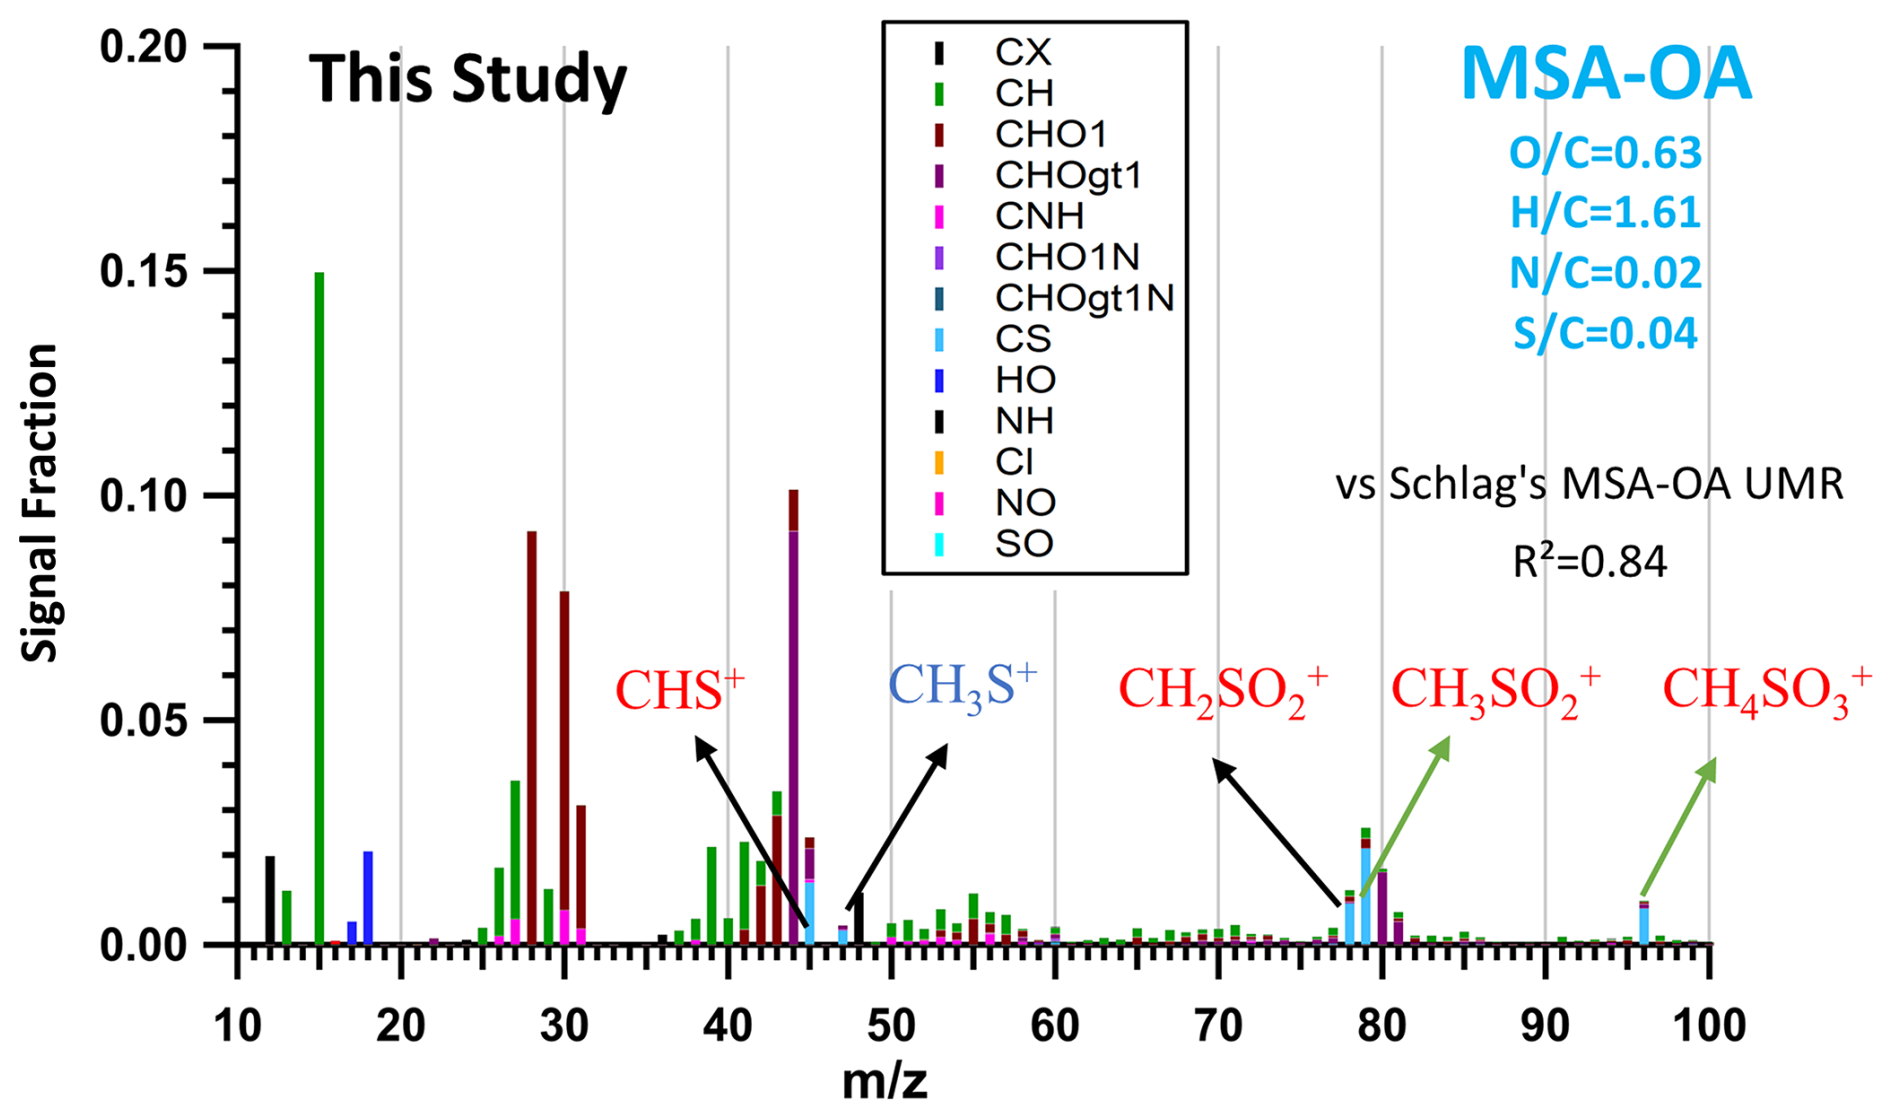
Figure 8MSA-OA factor profile of this study. Typical MSA marker fragments: CHS+ ( 44.98), CH3S+ ( 47.00), CH2SO ( 77.98), CH3SO ( 78.99), and CH4SO ( 95.99) are highlighted in the factor profile. Normalized ion attribution is colored by corresponding ion family groups, and elemental ratios (, , , ) of the MSA-OA factor are also marked in the graph. The y axis presents the ion signal intensity fraction.
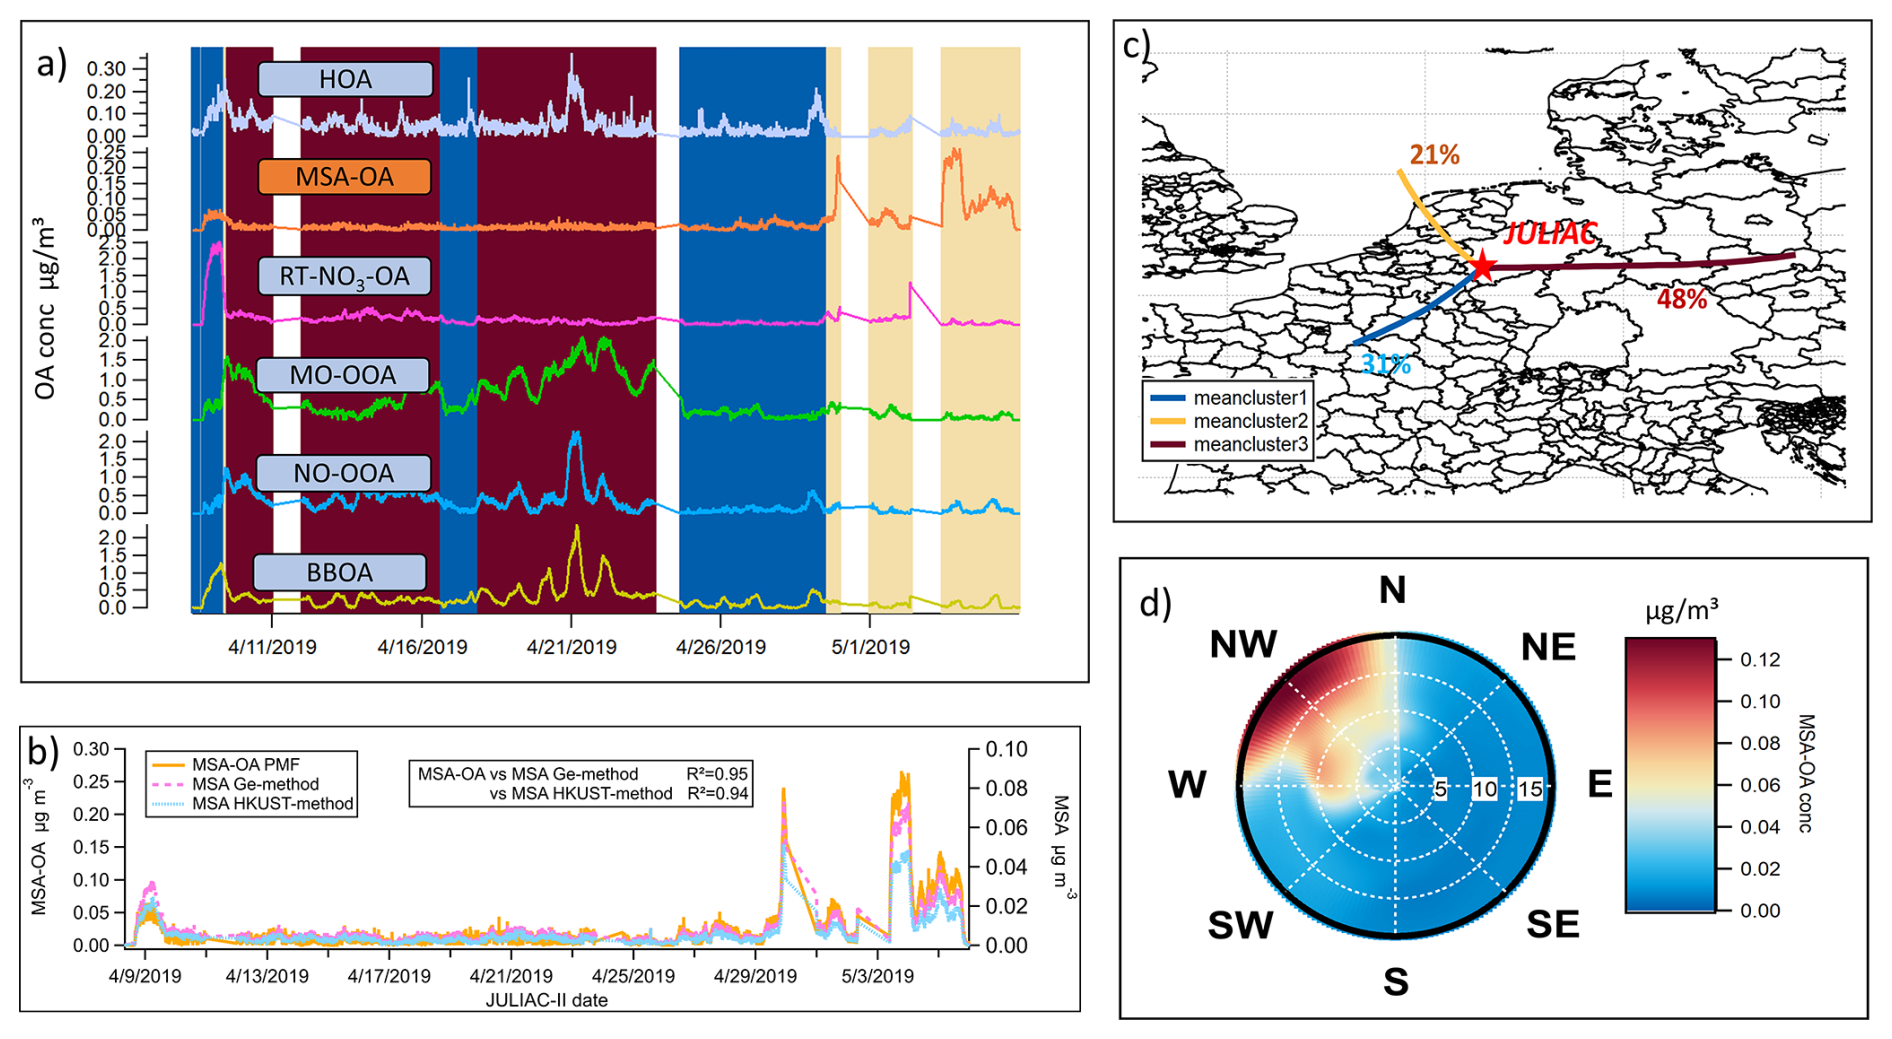
Figure 9(a) Time series of all source factors of OA resolved by the PMF analysis during spring (JULIAC-II) with the background color corresponding to different clusters of the 24 h back-trajectories (of panel c); (b) Comparison of MSA variations calculated using the Ge method (Ge et al., 2012) and the HKUST method (Huang et al., 2015), and the contribution variation of MSA-OA source resolved by PMF during spring (JULIAC-II). (c) Clusters of 24 h back-trajectories simulated by HYSPLIT4 during spring (JULIAC-II) at the Jülich site, with the proportion of each trajectory cluster marked. (d) Polar diagram of MSA-OA concentration during spring, based on non-parametric wind regressions. The wind speeds are shown as the radius with the unit of m s−1.
In Fig. 9c, 24 h back-trajectories (yellow) show a fast air mass transport from ocean to the measurement site, which occurred 21 % of the time during spring (JULIAC-II). During this time, the concentration of the MSA-OA factor increases while the contributions of other sources remain low and stable. The polar diagram in Fig. 9d shows that high MSA-OA concentrations (>0.1 µg m−3) are associated with high wind speeds (>10 m s−1) originating from the northwest, which align well with the marine origin trajectory. Additionally, the time series of the aerosol MSA is calculated using two different characteristic ion methodologies (Ge et al., 2012; Huang et al., 2015) (Fig. 9b), which also shows good agreement with the variations of MSA-OA factor, with a correlation coefficient R2=0.95 for MSA-OA vs. MSA (Ge method, Ge et al., 2012) and 0.94 for MSA-OA vs. MSA (HKUST method, Huang et al., 2015). Because the MSA-OA factor is not only composed of MSA but also contains other organic fragments, the concentration level of the MSA-OA factor is around 3 times higher than the concentration of the aerosol MSA. Overall, this comparison supports the influence of marine transport at this inland site.
In contrast, during summer (JULIAC-III), the contribution of the MSA-OA factor and the calculated concentration of MSA (using the Ge and HKUST methods) both increase during periods when air masses are not transported from ocean (Fig. 10a). The corresponding 72 h back trajectory cluster (Fig. 10c) shows a slow movement of air masses or relatively steady conditions of the local atmosphere in summer, suggesting that local emissions are the dominant influence at the site during this period. Additionally, poor agreement of the time series in calculated MSA and MSA-OA factors is also shown, with an R2 value of approximately 0.2. The strong local formation of organosulfate during summer (Fig. 3) may complicate the identification of MSA and potentially introduce a bias. Another possibility is the existence of unidentified terrestrial sources for aerosol MSA formation, as suggested by previous studies (Zhou et al., 2017; Young et al., 2016; Ge et al., 2012), though the mechanisms remain unclear and warrant further investigation. However, using the mass fraction of MSA-OA normalized to the total OA and the mass fraction of MSA normalized to the total aerosol leads to notable differences in the results. In Fig. 10b, the variations in MSA-OA and MSA mass fractions show an increasing trend in their similarity (R2=0.72–0.76) and exhibit better agreement with the back trajectory analysis. In conclusion, the observed increase in the MSA-OA concentration during the non-marine-transported period in summer could be attributed to a methodological bias or a potential unknown formation pathway of MSA. Compared to their absolute concentration, the mass fraction of the MSA-OA factor serves as a more reliable indicator of marine transport influences, especially during summer.
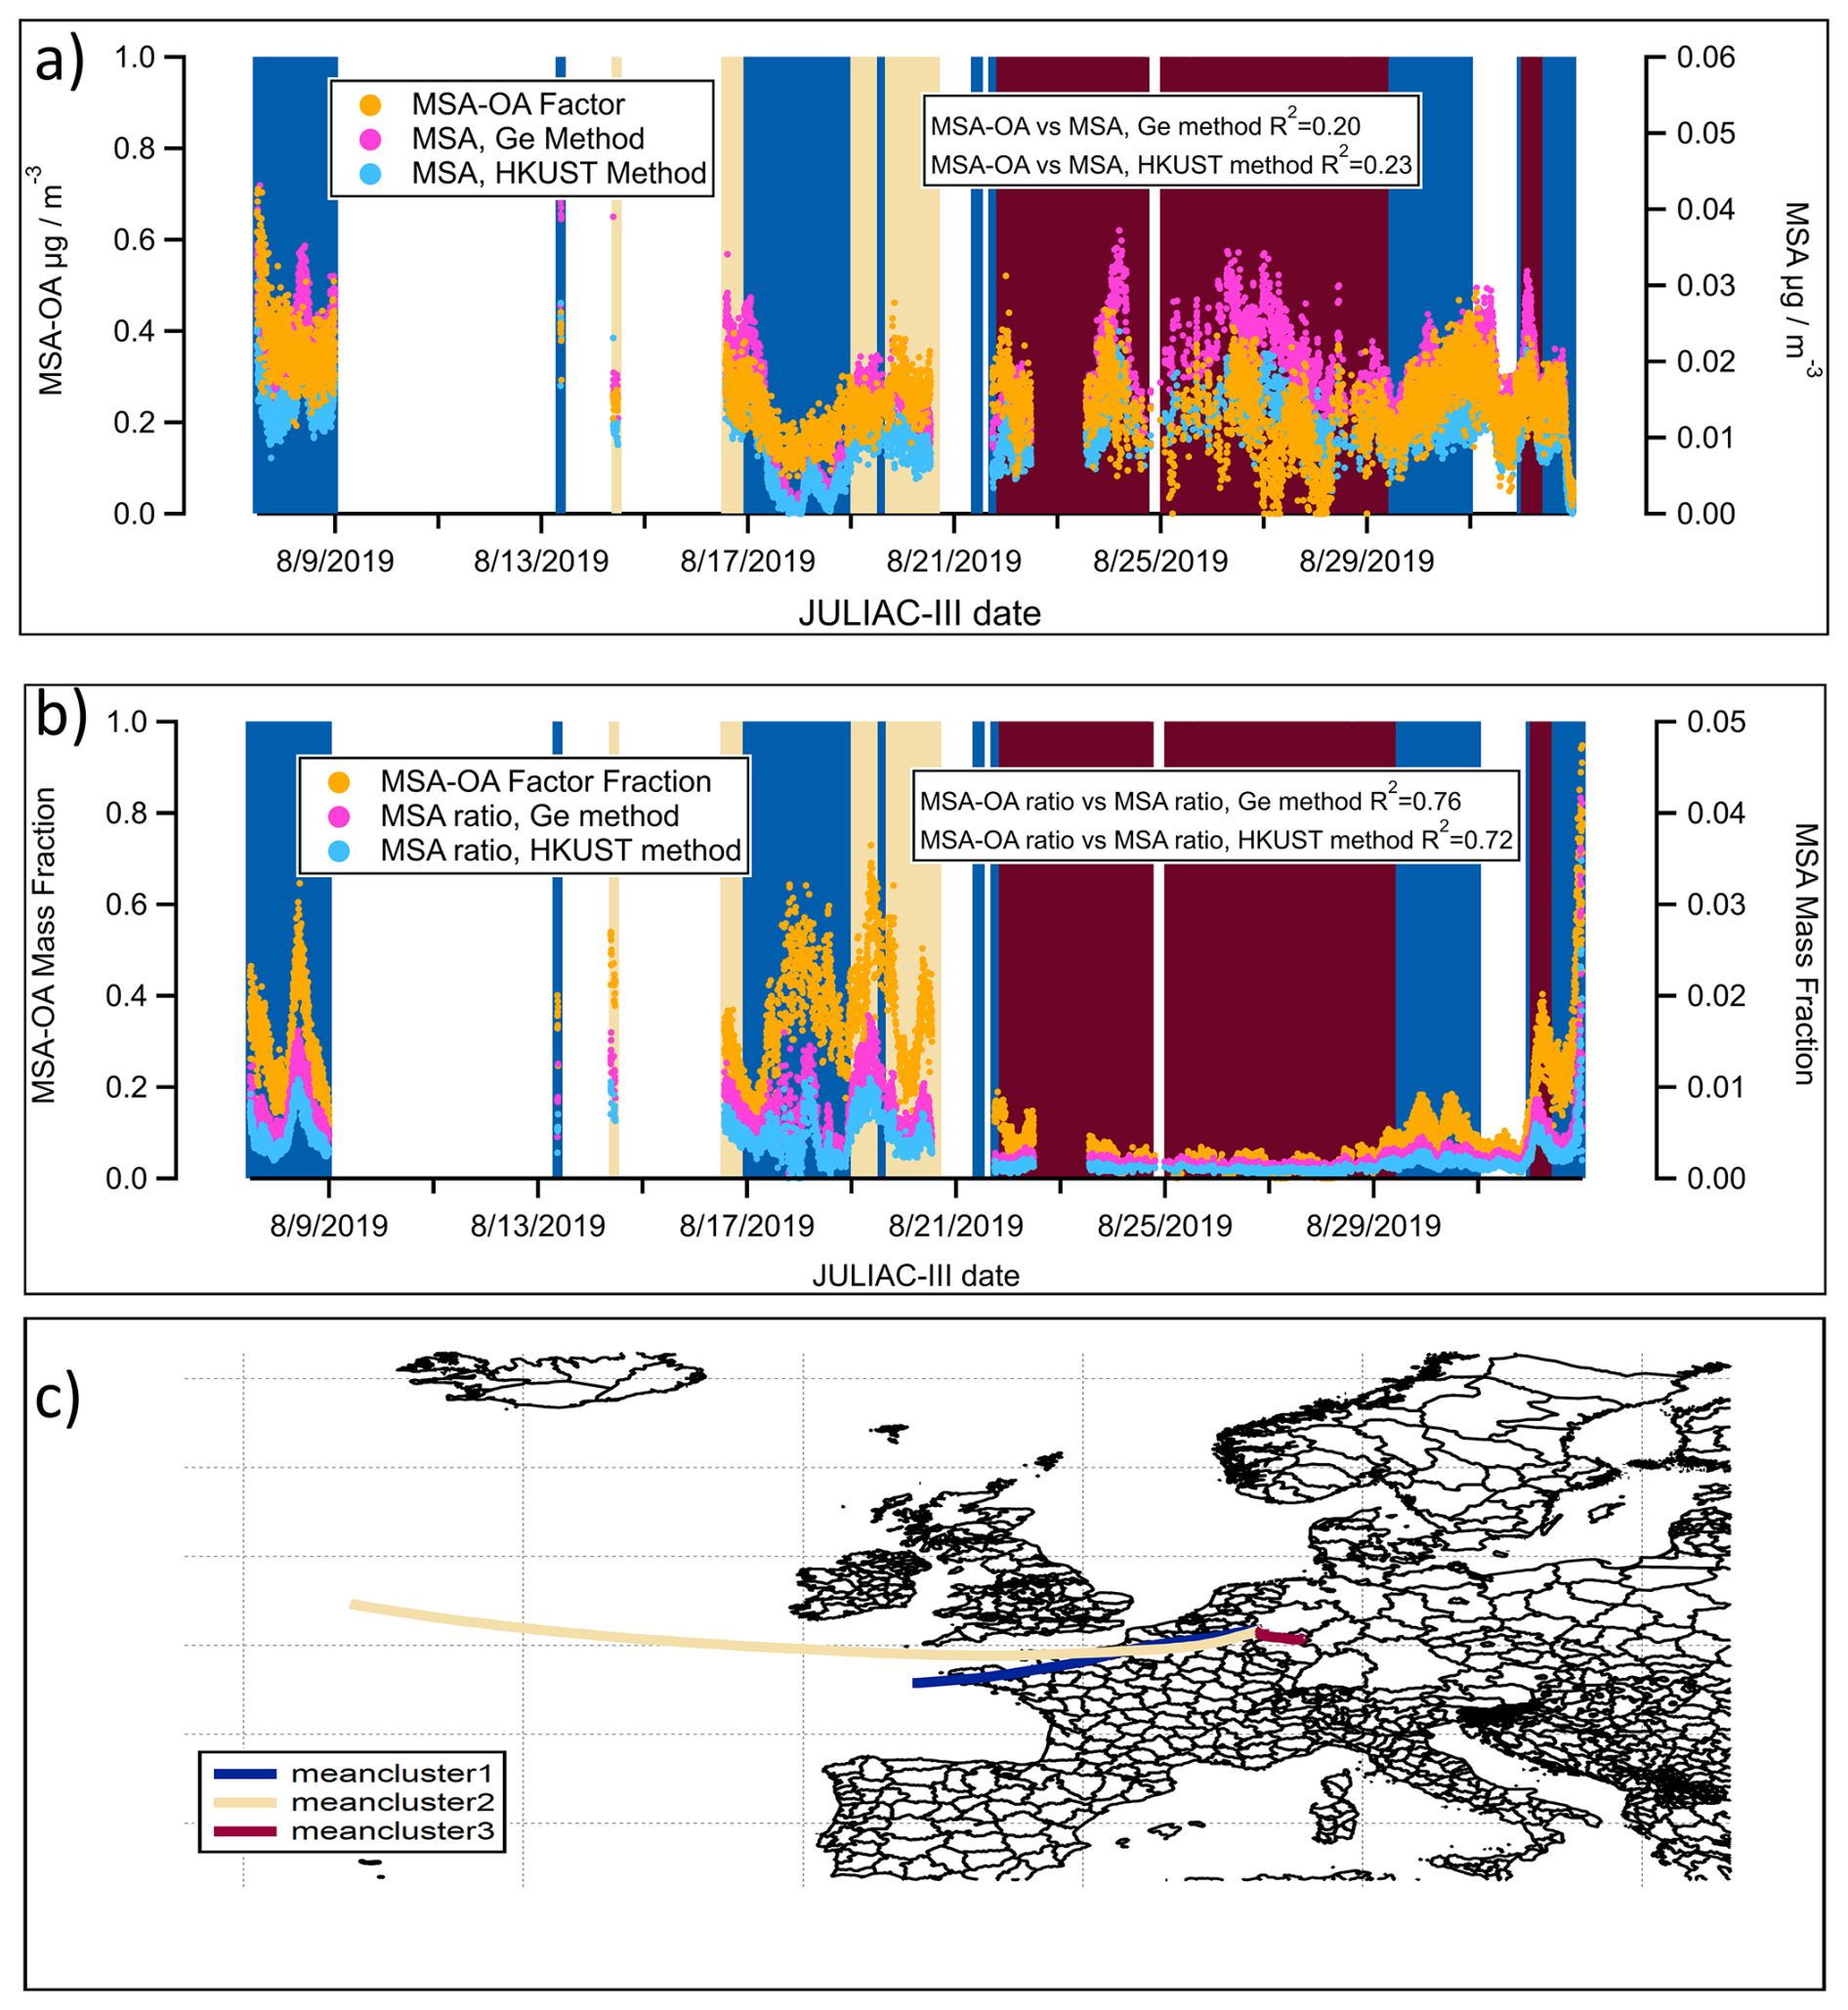
Figure 10(a) Time series of the contribution of the MSA-OA factor and the concentrations of calculated MSA using the Ge and HKUST methods during the summer (JULIAC-III), with background colors matching the corresponding back-trajectory clusters; (b) Mass fraction of the MSA-OA factor (normalized to the aerosol organic mass) and MSA (normalized to the total aerosol mass) calculated using the Ge and HKUST methods during the summer (JULIAC-III); (c) Clusters of 72 h back-trajectories during the summer (JULIAC-III), simulated by HYSPLIT4.
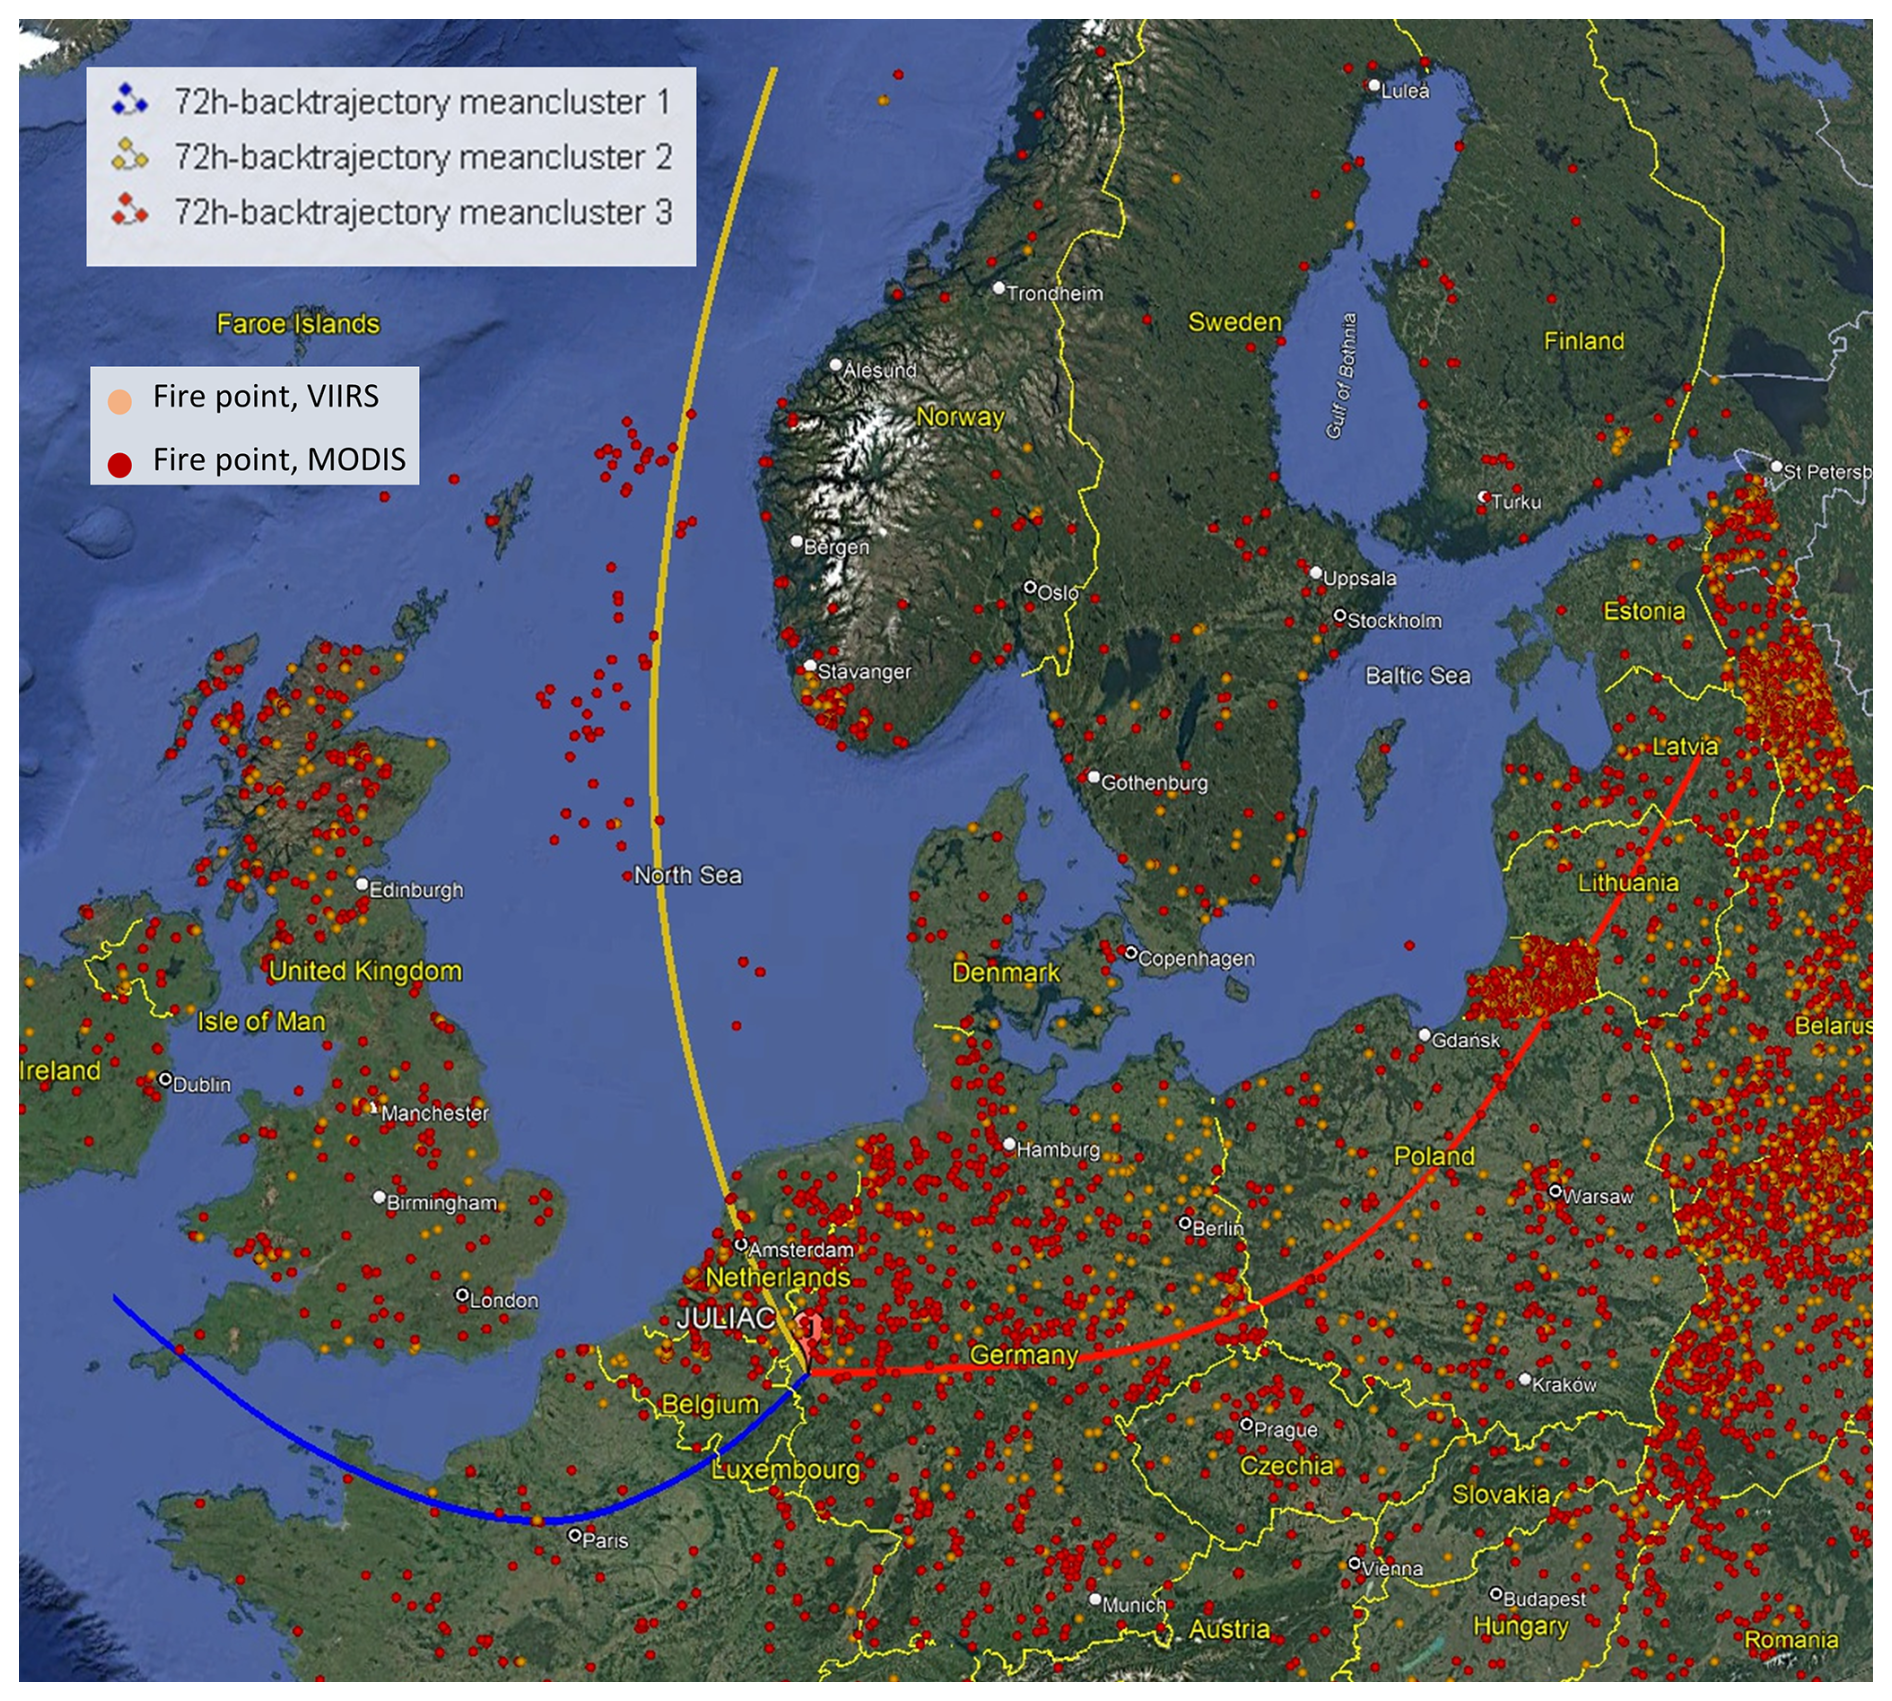
Figure 11Trajectory clusters (yellow, blue, and red lines) of the 72 h back-trajectories simulated by HYSPLIT4 at the measurement site in Jülich during spring (JULIAC-II). Hotspot counts during spring are shown as yellow (VIIRS) and red (MODIS) dots, provided by the Fire Information for Resource Management System (FIRMS) of NASA (accessible at https://firms.modaps.eosdis.nasa.gov/, last access: 13 February 2022). Map background © Google Earth, image © Maxar Technologies 2025.
Regional transport of wildfire plumes from the Russian area
A regional transport event of wildfire plumes during spring is confirmed using source apportionment analysis coupled with the analysis of 72 h back trajectories (an extension of the previous 24 h back trajectory) and the hotspot data from MODIS (Aqua & Terra) with a resolution of 1 km and VIIRS (S-NPP, NOAA-20 & NOAA-21) with a resolution of 375 m, provided by the Fire Information for Resource Management System (FIRMS) of NASA (Fig. 11). Hotspots are detected based on thermal anomalies in satellite imagery, and therefore single and isolated dots are often due to noise but not real fire. Wildfire activity indicated by clusteres of hotspot are observed during spring in the Russian region and affects this study area via long-distance transport. During this time, BBOA concentrations peak in spring. In addition, the mass fraction of the biomass-burning tracer, fC2H4O, in BBOA from spring is clearly lower than that observed in other seasons (Fig. S9). This observation is consistent with chamber experiments of biomass-burning dark aging, where fC2H4O decreases with increasing aging time (Kodros et al., 2020). This further confirms that the BBOA in spring is primarily influenced by the regional transport of fire emissions. The high frequency of fires in Russia during spring is consistent with the results of previous studies on the occurrence of Russian wildfires (Kharuk and Ponomarev, 2017). As discussed previously (Liu et al., 2024a), the NO-OOA formation during spring is predominantly driven by nitrate radical (NO3) chemistry of biomass-burning emissions. Consequently, the POA and SOA linked to the regional transport of wildfire plumes contribute to approximately half of the total OA observed during spring. This highlights wildfire emissions transport as a key factor influencing the atmospheric conditions at the site during spring.
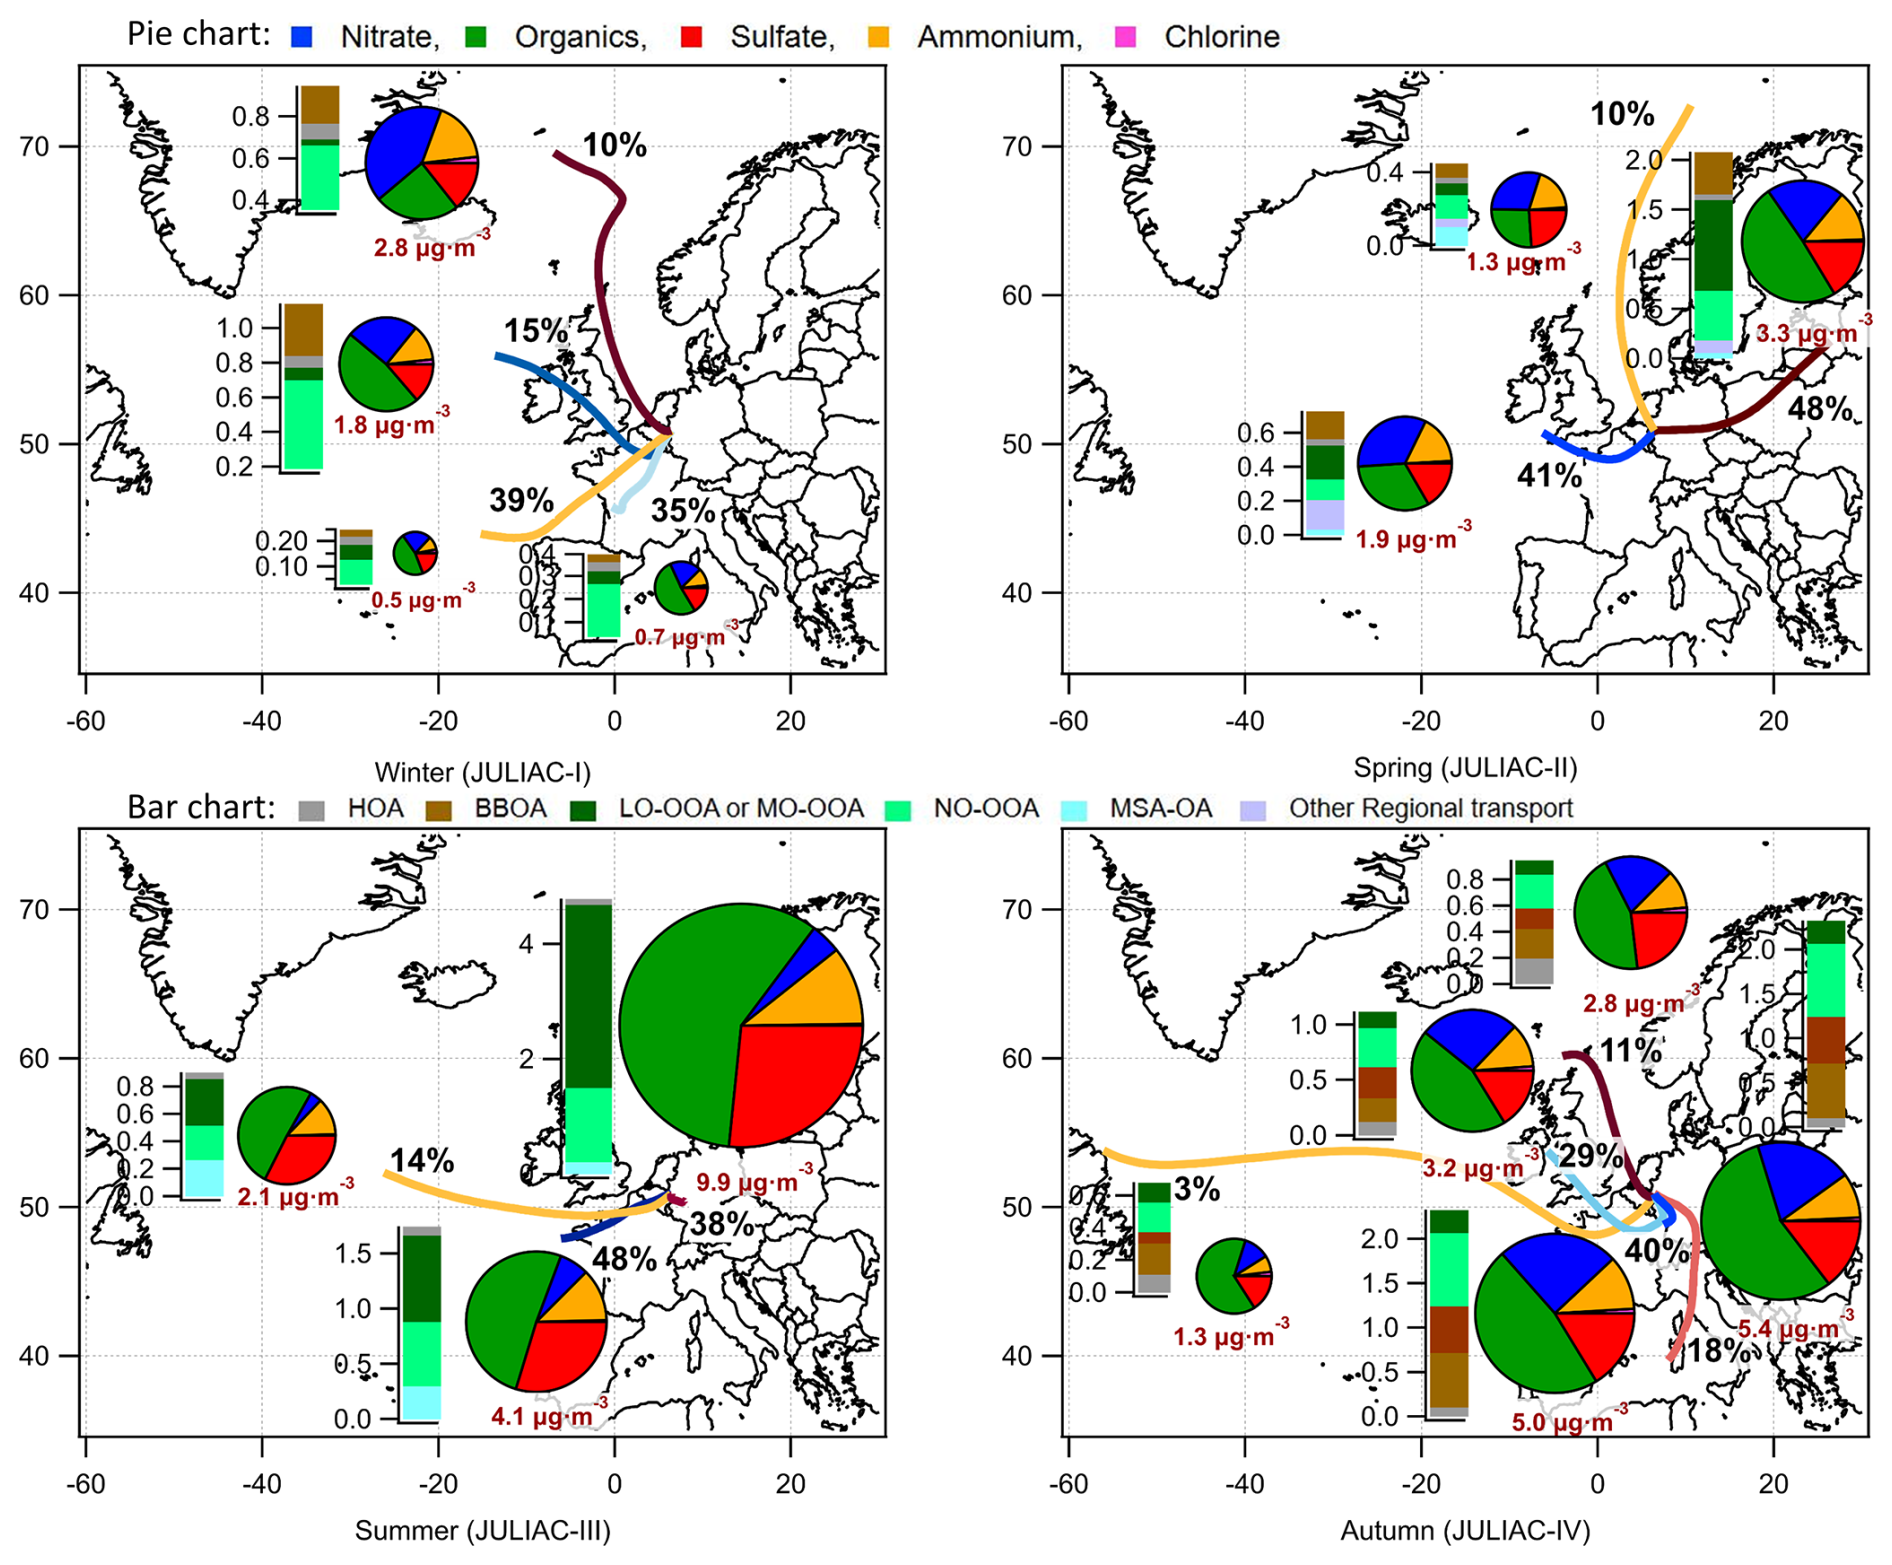
Figure 12Trajectory clusters representing 72 h back-trajectories simulated by HYSPLIT4 for each season at the Jülich site, annotated with the frequency proportions of each respective cluster. Additionally, the average composition and concentration of submicron aerosols, together with the average source contributions of organics derived from PMF analysis, are presented for each corresponding cluster period.
Seasonal variability of regional contributions to aerosols
To further understand the effect of long-range transport on the aerosol composition at the site, the back-trajectory clusters combined with the average aerosol composition and source contributions of organics during the corresponding cluster periods are analyzed. As shown in Fig. 12, more than half of the long-range transport plumes originate from the west of the site. During the periods influenced by transport from these directions, the total aerosol mass consistently shows a clear decrease compared to the periods dominated by local emissions in each season, implying a general cleansing effect for the aerosol level at the site by regional transport. The only exception occurred in winter (JULIAC-I), when the aerosol mass reaches a maximum due to regional influences from air masses originating in the northwest, with an enhanced mass fraction of nitrate and an increased BBOA contribution. A clear increase in the contributions of sulfate is also observed when trajectories originate from marine regions. This increase is accompanied by a rise in the MSA-OA fraction, which is associated with the enhanced activity of phytoplankton and anaerobic bacteria in the ocean during summer, the primary natural sources of sulfur-containing compounds (Charlson et al., 1987). A similar increase in sulfate and MSA-OA is observed during spring for marine-origin transport but is absent in colder seasons. This suggests that the seasonal activity of phytoplankton and anaerobic bacteria plays a significant role in modulating the influence of marine regional transport. In conclusion, regional influences are highly diverse, affected not only by the source regions but also by the seasonal variations in biogenic and anthropogenic activity within these regions.
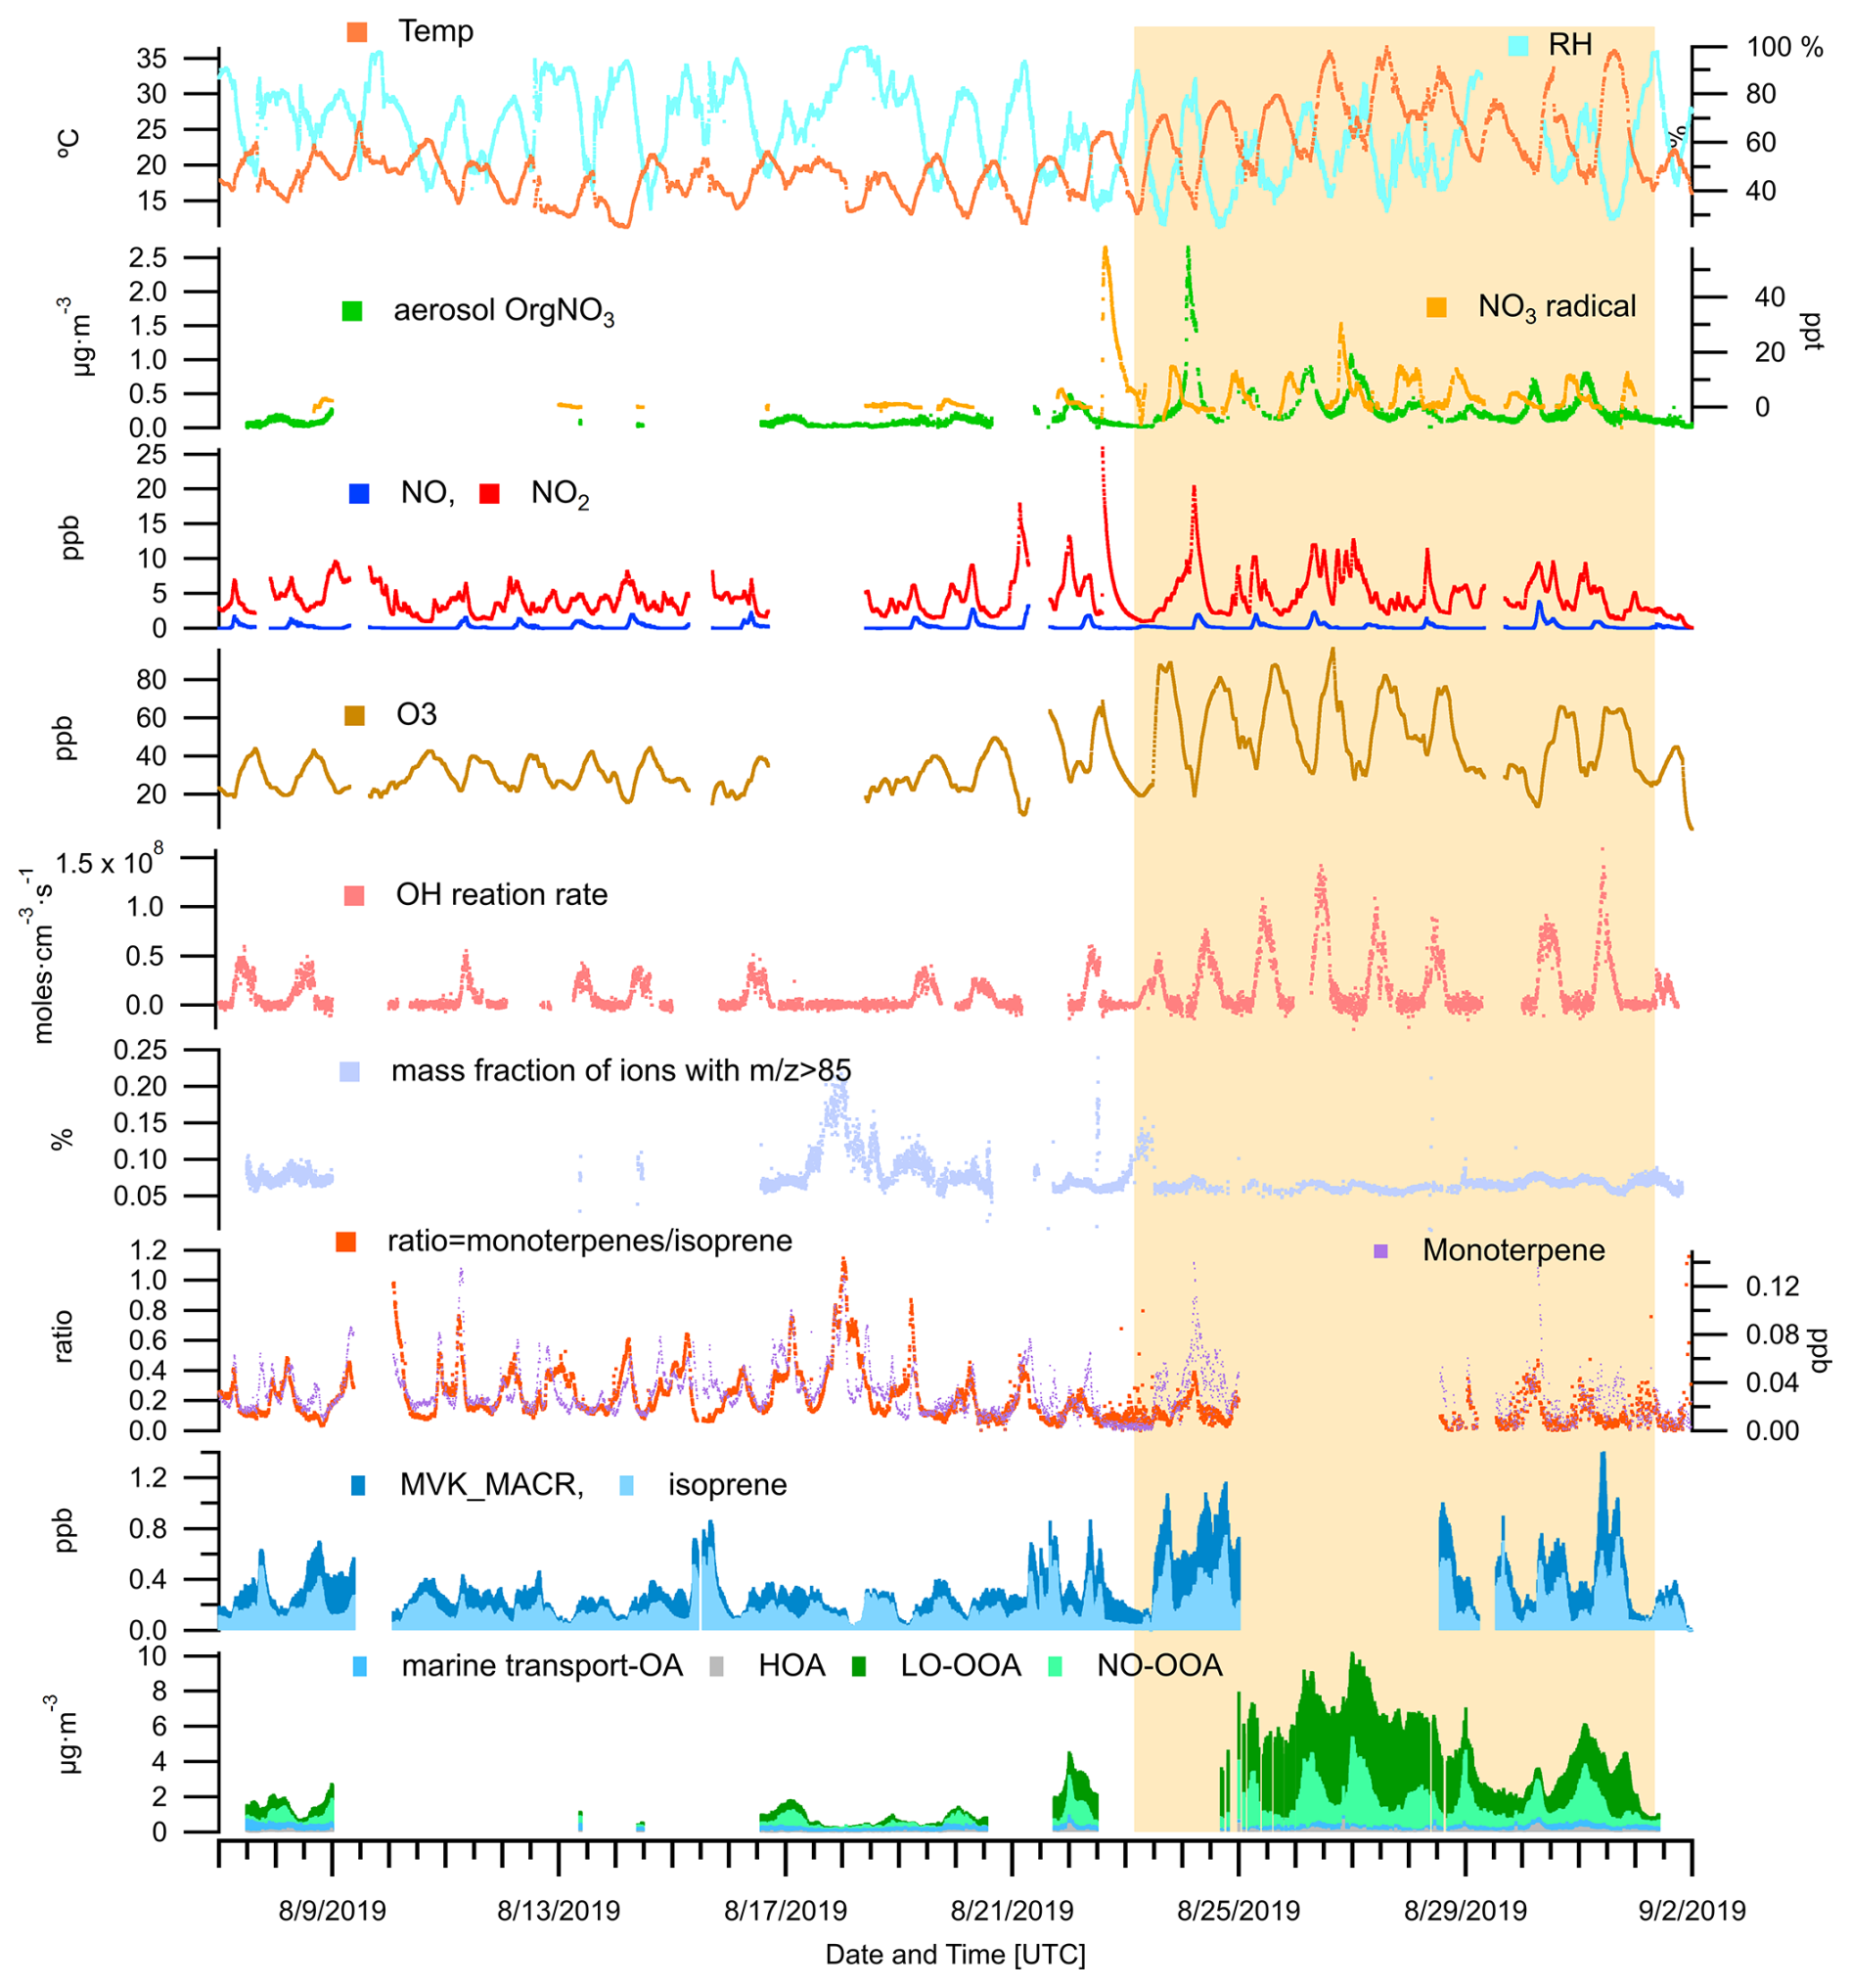
Figure 13An overview of OA source contributions, ambient measurements of trace gases (VOCs, O3, NOx, N2O5, NO3 radicals), meteorological parameters (temperature and RH), and calculated parameters are provided for the JULIAC summer period. The calculated parameters include the OH reaction rate (derived from measured OH concentrations and OH reactivity), the mass fraction of ions with in OA measured by the ToF-AMS, and the concentration ratio of monoterpenes to isoprene. The period of the heatwave event observed in summer is highlighted with a yellow background.
4.2 Heatwave-induced changes in the formation of OOA
A previous chamber study (Mentel et al., 2013) has demonstrated that heat and drought stress can reduce monoterpenes emissions, thereby suppressing biogenic OOA formation. In this study, a decrease in monoterpene concentrations is observed during a heatwave event, with the average levels dropping to 60 % of the pre-heatwave values (Fig. 13). Conversely, isoprene concentration increases by a factor of 1.4, leading to a substantial shift in the monoterpene-to-isoprene concentration ratio, which decreases from 0.24 to 0.11 during the heatwave event. Despite the reduced monoterpene concentrations, no suppression of biogenic OOA formation is observed. On the contrary, total biogenic OOA mass increases notably during the heatwave, with the contribution of LO-OOA rising by a factor of 5 and NO-OOA by a factor of 3. This suggests that, beyond changes in biogenic emissions, other atmospheric processes induced by the heatwave conditions play a critical role in enhancing the OOA formation.
The increase of the atmospheric oxidation potential during heatwave events, triggered by elevated temperatures, low RH, and intense radiation, has been reported in previous studies (Desai et al., 2024; Zhang et al., 2024). This phenomenon is primarily reflected in the rise of the concentration of oxidants and the reaction rate of BVOCs. In this study, a similar rise in atmospheric oxidation capacity is suggested by the observed increases in O3 and NO3 concentrations, as well as the total reaction rate of OH (Cho et al., 2023), as shown in Fig. 13. Consequently, the enhanced formation of OOA from both daytime (LO-OOA) and nighttime (NO-OOA) chemistry may be linked to this increased atmospheric oxidation potential. Additionally, the observed decrease in monoterpene concentrations could be partially attributed to their faster oxidation in the presence of high oxidant levels.
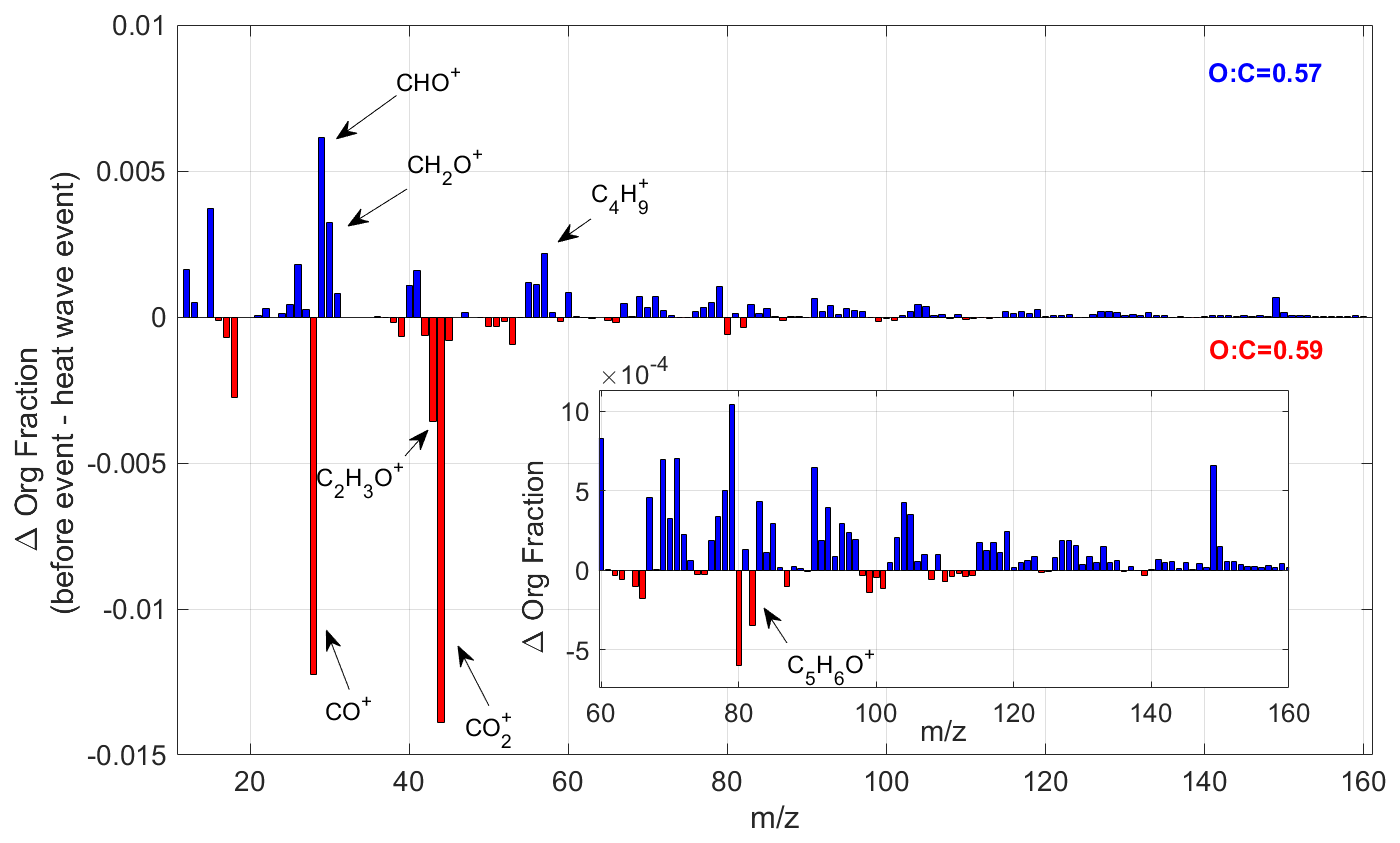
Figure 14The change in the average organic signal mass fraction, normalized to total OA mass, between pre-heatwave and heatwave periods. The insert window shows the detailed mass spectrum difference at regions of higher molecular weight with . The blue color bar shows the ion peaks, which have a higher intensity before the heatwave event, while the red color bar represents the ions enhanced during the heatwave event.
In addition, the changes in OA properties during the heatwave event are examined to assess whether shifts in the dominant SOA formation pathways occurred. Figure 14 compares the average OA composition before and during the heatwave, revealing a noticeable decrease in the fraction of ions with relative to total ions during the heatwave. This decline occurs sharply at the onset of the heatwave event, as shown in Fig. 13. Additionally, although the fraction of CO ions increases during the heatwave, the average ratio of OA remains relatively stable (0.57 before and 0.59 during the heatwave). This suggests that the shift of OA composition is not driven by the increased fragmentation of highly oxygenated OA. Previous studies have used the fraction of ions with as an indicator for the abundance of oligomers in SOA (Faust et al., 2017; Liggio and Li, 2006; Riva et al., 2019). The rapid formation of highly oxygenated organic molecules (HOM) from the oxidation of BVOCs, primarily monoterpenes, is a well-known pathway for biogenic SOA formation (Bianchi et al., 2019). In addition, isoprene has been reported to suppress HOM formation and subsequent SOA production by OH scavenging (McFiggans et al., 2019). However, in this study, a co-increase of isoprene and OOA is observed during the heatwave. As shown in Fig. 14, the isoprene-derived SOA tracer ion, C5H6O+ ( 82) (Hu et al., 2015), increases in the OA during the heatwave event, with the mass fraction varying from 1.7 ‰ to 4 ‰ (Fig. S10). When source apportionment is conducted separately for the periods before and during the heatwave, the increase in C5H6O+ ( 82) within LO-OOA is more pronounced (Fig. S11). These findings suggest a potential shift in the SOA formation pathways during the heatwave, where isoprene may play a role in the aerosol formation and growth. Additionally, particulate organic nitrates and organosulfates both reach their annual maximum during the heatwave period (Fig. 3). These findings highlight the need for further investigations of the atmospheric chemistry during heatwaves. A combination of gas- and aerosol-phase molecular measurements could provide new insights into the potential impacts of extreme heat events on SOA formation in the ambient atmosphere.
The 2019 Jülich Atmospheric Chemistry Project (JULIAC) campaign conducted continuous measurements of submicron aerosol composition, trace gases, and atmospheric conditions at a rural site in Germany during four seasons. Ambient air was sampled from a height of 50 m into the SAPHIR atmospheric simulation chamber, ensuring that all connected instruments sampled the same air and minimizing influence from local emissions. This study indicates that OA dominated the submicron aerosol composition throughout the year, comprising 39 %–58 % of the aerosol mass, followed by sulfate (16 %–26 %) and nitrate (5 %–26 %). Peak organic nitrate concentrations occur in summer, contributing up to 62 % of the bulk nitrate, driven by nocturnal NO3 oxidation. Organosulfates reach their maximum concentrations in summer, likely driven by biogenic formation pathways. Interestingly, organosulfate also contributes significantly to the bulk aerosol sulfate (20 %–31 %) during winter and autumn, though their source remains uncertain and requires further investigation.
As the major compound of submicron aerosol, OA shows distinct seasonal variations in both mass and chemical properties. The highest OA concentrations with the lowest oxidation levels occur during summer. In contrast, autumn and winter exhibit lower OA concentrations but higher oxidation degrees, with a more pronounced nocturnal increase in OA concentration. Seasonal source apportionment analysis reveals that over 80 % of OA mass originates from SOA formed via both daytime and nighttime oxidation of biogenic emissions during summer. In contrast, OA is dominated by biomass-burning sources during autumn and winter, with POA and related SOA formation of biomass-burning sources contributing 60 % to 83 % of OA mass. Traffic emissions are found to be a minor OA source throughout the year (3 %–10 %). These findings suggest that effective air quality mitigation during the cold season should focus on controlling biomass-burning emissions, such as those from residential heating and industrial activities. In addition, the enhancement of SOA formation during the heatwave is attributed to increased atmospheric oxidation potential, driven by elevated oxidant levels (O3, NO3, and OH). A shift in SOA formation pathways during the heatwave, potentially influenced by isoprene chemistry, is also observed. These findings highlight the need for further investigation into heatwave-induced changes in atmospheric composition, particularly using molecular-level measurements.
This study examines the seasonal influence of regional transport on aerosol composition. While summer aerosol composition is primarily driven by local emissions and biogenic SOA formation, regional transport significantly influences the colder seasons. OA mass contributions from regional transport sources (marine, wildfire) resolved by source apportionment align well with back trajectory model results, suggesting that source apportionment is a more robust framework than traditional tracer-based methods for interpreting regional influences. Overall, the influence of regional transport at this site generally led to a decrease in total aerosol concentration, except in winter. Notably, identical regional transport pathways exhibit distinct seasonal impacts. For instance, marine plumes contribute clearly to OA only in warmer seasons, driven by enhanced phytoplankton and anaerobic bacterial activity.
The data used in this study are available from the Jülich DATA platform (https://doi.org/10.26165/JUELICH-DATA/TPPXNL; Liu et al., 2024b).
The supplement related to this article is available online at https://doi.org/10.5194/acp-25-16189-2025-supplement.
AH designed the JULIAC campaign and coordinated its execution together with TH, HF, and FH. LL conducted the aerosol measurements, performed data analysis, and drafted the manuscript. All co-authors contributed to data processing and provided valuable input through extensive discussions during the manuscript preparation.
At least one of the (co-)authors is a member of the editorial board of Atmospheric Chemistry and Physics. The peer-review process was guided by an independent editor, and the authors also have no other competing interests to declare.
Publisher's note: Copernicus Publications remains neutral with regard to jurisdictional claims made in the text, published maps, institutional affiliations, or any other geographical representation in this paper. While Copernicus Publications makes every effort to include appropriate place names, the final responsibility lies with the authors. Views expressed in the text are those of the authors and do not necessarily reflect the views of the publisher.
We gratefully acknowledge Dr. Sören Zorn, Dr. Hui Wang, and Dr. Quanfu He for their support during manuscript revision. We also acknowledge the use of AI-assisted tools for language polishing in preparing this manuscript.
This research has been supported by the European Research Council, H2020 European Research Council (SARLEP (grant no. 681529)) and the European Commission, Horizon 2020 Framework Programme (Eurochamp 2020 (grant no. 730997)).
The article processing charges for this open-access publication were covered by the Forschungszentrum Jülich.
This paper was edited by Luis A. Ladino and reviewed by three anonymous referees.
Aiken, A. C., DeCarlo, P. F., and Jimenez, J. L.: Elemental Analysis of Organic Species with Electron Ionization High-Resolution Mass Spectrometry, Analytical Chemistry, 79, 8350–8358, https://doi.org/10.1021/ac071150w, 2007.
Aiken, A. C., DeCarlo, P. F., Kroll, J. H., Worsnop, D. R., Huffman, J. A., Docherty, K. S., and Jimenez, J. L.: and Ratios of Primary, Secondary, and Ambient Organic Aerosols with High-Resolution Time-of-Flight Aerosol Mass Spectrometry, Environ. Sci. Technol., 42, 4478–4485, https://doi.org/10.1021/es703009q, 2008.
Aiken, A. C., Salcedo, D., Cubison, M. J., Huffman, J. A., DeCarlo, P. F., Ulbrich, I. M., Docherty, K. S., Sueper, D., Kimmel, J. R., Worsnop, D. R., Trimborn, A., Northway, M., Stone, E. A., Schauer, J. J., Volkamer, R. M., Fortner, E., de Foy, B., Wang, J., Laskin, A., Shutthanandan, V., Zheng, J., Zhang, R., Gaffney, J., Marley, N. A., Paredes-Miranda, G., Arnott, W. P., Molina, L. T., Sosa, G., and Jimenez, J. L.: Mexico City aerosol analysis during MILAGRO using high resolution aerosol mass spectrometry at the urban supersite (T0) – Part 1: Fine particle composition and organic source apportionment, Atmos. Chem. Phys., 9, 6633–6653, https://doi.org/10.5194/acp-9-6633-2009, 2009.
Akherati, A., He, Y., Coggon, M. M., Koss, A. R., Hodshire, A. L., Sekimoto, K., and Jathar, S. H.: Oxygenated Aromatic Compounds are Important Precursors of Secondary Organic Aerosol in Biomass-Burning Emissions, Environ. Sci. Technol., 54, 8568–8579, https://doi.org/10.1021/acs.est.0c01345, 2020.
Alfarra, M. R., Prevot, A. S. H., Szidat, S., Sandradewi, J., Weimer, S., Lanz, V. A., and Baltensperger, U.: Identification of the Mass Spectral Signature of Organic Aerosols from Wood Burning Emissions, Environ. Sci. Technol., 41, 5770–5777, https://doi.org/10.1021/es062289b, 2007.
Bataille, C.: Low and zero emissions in the steel and cement industries: Barriers, technologies and policies, OECD Publishing, https://doi.org/10.1787/5ccf8e33-en, 2020.
Bianchi, F., Kurten, T., Riva, M., Mohr, C., Rissanen, M. P., Roldin, P., and Ehn, M.: Highly Oxygenated Organic Molecules (HOM) from Gas-Phase Autoxidation Involving Peroxy Radicals: A Key Contributor to Atmospheric Aerosol, Chem. Rev., 119, 3472–3509, https://doi.org/10.1021/acs.chemrev.8b00395, 2019.
Bohn, B. and Zilken, H.: Model-aided radiometric determination of photolysis frequencies in a sunlit atmosphere simulation chamber, Atmos. Chem. Phys., 5, 191–206, https://doi.org/10.5194/acp-5-191-2005, 2005.
Bohn, B., Rohrer, F., Brauers, T., and Wahner, A.: Actinometric measurements of NO2 photolysis frequencies in the atmosphere simulation chamber SAPHIR, Atmos. Chem. Phys., 5, 493–503, https://doi.org/10.5194/acp-5-493-2005, 2005.
Boucher, O., Randall, D., Artaxo, P., Bretherton, C., Feingold, G., Forster, P., and Zhang, X. Y.: Clouds and aerosols, edited by: Stocker, T. F., Qin, D., Plattner, G.-K., Tignor, M., Allen, S. K., Boschung, J., Nauels, A., Xia, Y., Bex, V. and Midgley, P. M., Cambridge University Press, Cambridge, UK, https://doi.org/10.1017/CBO9781107415324.016, 2013.
Bruggemann, M., Xu, R., Tilgner, A., Kwong, K. C., Mutzel, A., Poon, H. Y., and Herrmann, H.: Organosulfates in Ambient Aerosol: State of Knowledge and Future Research Directions on Formation, Abundance, Fate, and Importance, Environ. Sci. Technol., 54, 3767–3782, https://doi.org/10.1021/acs.est.9b06751, 2020.
Canagaratna, M. R., Onasch, T. B., Wood, E. C., Herndon, S. C., Jayne, J. T., Cross, E. S., and Worsnop, D. R.: Evolution of Vehicle Exhaust Particles in the Atmosphere, Journal of the Air & Waste Management Association, 60, 1192–1203, https://doi.org/10.3155/1047-3289.60.10.1192, 2010.
Canagaratna, M. R., Jimenez, J. L., Kroll, J. H., Chen, Q., Kessler, S. H., Massoli, P., Hildebrandt Ruiz, L., Fortner, E., Williams, L. R., Wilson, K. R., Surratt, J. D., Donahue, N. M., Jayne, J. T., and Worsnop, D. R.: Elemental ratio measurements of organic compounds using aerosol mass spectrometry: characterization, improved calibration, and implications, Atmos. Chem. Phys., 15, 253–272, https://doi.org/10.5194/acp-15-253-2015, 2015.
Canonaco, F., Crippa, M., Slowik, J. G., Baltensperger, U., and Prévôt, A. S. H.: SoFi, an IGOR-based interface for the efficient use of the generalized multilinear engine (ME-2) for the source apportionment: ME-2 application to aerosol mass spectrometer data, Atmos. Meas. Tech., 6, 3649–3661, https://doi.org/10.5194/amt-6-3649-2013, 2013.
Canonaco, F., Slowik, J. G., Baltensperger, U., and Prévôt, A. S. H.: Seasonal differences in oxygenated organic aerosol composition: implications for emissions sources and factor analysis, Atmos. Chem. Phys., 15, 6993–7002, https://doi.org/10.5194/acp-15-6993-2015, 2015.
Charlson, R. J., Lovelock, J. E., Andreae, M. O., and Warren, S. G.: Oceanic phytoplankton, atmospheric sulphur, cloud albedo and climate, Nature, 326, 655–661, https://doi.org/10.1038/326655a0, 1987.
Chen, Q., Farmer, D. K., Rizzo, L. V., Pauliquevis, T., Kuwata, M., Karl, T. G., Guenther, A., Allan, J. D., Coe, H., Andreae, M. O., Pöschl, U., Jimenez, J. L., Artaxo, P., and Martin, S. T.: Submicron particle mass concentrations and sources in the Amazonian wet season (AMAZE-08), Atmos. Chem. Phys., 15, 3687–3701, https://doi.org/10.5194/acp-15-3687-2015, 2015.
Chen, Y., Xu, L., Humphry, T., Hettiyadura, A. P. S., Ovadnevaite, J., Huang, S., and Ng, N. L.: Response of the Aerodyne Aerosol Mass Spectrometer to Inorganic Sulfates and Organosulfur Compounds: Applications in Field and Laboratory Measurements, Environ. Sci. Technol., 53, 5176–5186, https://doi.org/10.1021/acs.est.9b00884, 2019.
Cheng, Y., Ma, Y., and Hu, D.: Tracer-based source apportioning of atmospheric organic carbon and the influence of anthropogenic emissions on secondary organic aerosol formation in Hong Kong, Atmos. Chem. Phys., 21, 10589–10608, https://doi.org/10.5194/acp-21-10589-2021, 2021.
Cho, C., Hofzumahaus, A., Fuchs, H., Dorn, H.-P., Glowania, M., Holland, F., Rohrer, F., Vardhan, V., Kiendler-Scharr, A., Wahner, A., and Novelli, A.: Characterization of a chemical modulation reactor (CMR) for the measurement of atmospheric concentrations of hydroxyl radicals with a laser-induced fluorescence instrument, Atmos. Meas. Tech., 14, 1851–1877, https://doi.org/10.5194/amt-14-1851-2021, 2021.
Cho, C., Fuchs, H., Hofzumahaus, A., Holland, F., Bloss, W. J., Bohn, B., Dorn, H.-P., Glowania, M., Hohaus, T., Liu, L., Monks, P. S., Niether, D., Rohrer, F., Sommariva, R., Tan, Z., Tillmann, R., Kiendler-Scharr, A., Wahner, A., and Novelli, A.: Experimental chemical budgets of OH, HO2, and RO2 radicals in rural air in western Germany during the JULIAC campaign 2019, Atmos. Chem. Phys., 23, 2003–2033, https://doi.org/10.5194/acp-23-2003-2023, 2023.
Coggon, M. M., Veres, P. R., Yuan, B., Koss, A., Warneke, C., Gilman, J. B., and de Gouw, J. A.: Emissions of nitrogen-containing organic compounds from the burning of herbaceous and arboraceous biomass: Fuel composition dependence and the variability of commonly used nitrile tracers, Geophysical Research Letters, 43, 9903–9912, https://doi.org/10.1002/2016GL070562, 2016.
Crippa, M., DeCarlo, P. F., Slowik, J. G., Mohr, C., Heringa, M. F., Chirico, R., Poulain, L., Freutel, F., Sciare, J., Cozic, J., Di Marco, C. F., Elsasser, M., Nicolas, J. B., Marchand, N., Abidi, E., Wiedensohler, A., Drewnick, F., Schneider, J., Borrmann, S., Nemitz, E., Zimmermann, R., Jaffrezo, J.-L., Prévôt, A. S. H., and Baltensperger, U.: Wintertime aerosol chemical composition and source apportionment of the organic fraction in the metropolitan area of Paris, Atmos. Chem. Phys., 13, 961–981, https://doi.org/10.5194/acp-13-961-2013, 2013.
Crippa, M., Canonaco, F., Lanz, V. A., Äijälä, M., Allan, J. D., Carbone, S., Capes, G., Ceburnis, D., Dall'Osto, M., Day, D. A., DeCarlo, P. F., Ehn, M., Eriksson, A., Freney, E., Hildebrandt Ruiz, L., Hillamo, R., Jimenez, J. L., Junninen, H., Kiendler-Scharr, A., Kortelainen, A.-M., Kulmala, M., Laaksonen, A., Mensah, A. A., Mohr, C., Nemitz, E., O'Dowd, C., Ovadnevaite, J., Pandis, S. N., Petäjä, T., Poulain, L., Saarikoski, S., Sellegri, K., Swietlicki, E., Tiitta, P., Worsnop, D. R., Baltensperger, U., and Prévôt, A. S. H.: Organic aerosol components derived from 25 AMS data sets across Europe using a consistent ME-2 based source apportionment approach, Atmos. Chem. Phys., 14, 6159–6176, https://doi.org/10.5194/acp-14-6159-2014, 2014.
Cross, E. S., Slowik, J. G., Davidovits, P., Allan, J. D., Worsnop, D. R., Jayne, J. T., and Onasch, T. B.: Laboratory and Ambient Particle Density Determinations using Light Scattering in Conjunction with Aerosol Mass Spectrometry, Aerosol Sci. Tech., 41, 343–359, https://doi.org/10.1080/02786820701199736, 2007.
Dai, Q., Schulze, B. C., Bi, X., Bui, A. A. T., Guo, F., Wallace, H. W., Sanchez, N. P., Flynn, J. H., Lefer, B. L., Feng, Y., and Griffin, R. J.: Seasonal differences in formation processes of oxidized organic aerosol near Houston, TX, Atmos. Chem. Phys., 19, 9641–9661, https://doi.org/10.5194/acp-19-9641-2019, 2019.
Debevec, C., Sauvage, S., Gros, V., Salameh, T., Sciare, J., Dulac, F., and Locoge, N.: Seasonal variation and origins of volatile organic compounds observed during 2 years at a western Mediterranean remote background site (Ersa, Cape Corsica), Atmos. Chem. Phys., 21, 1449–1484, https://doi.org/10.5194/acp-21-1449-2021, 2021.
Debevec, C., Sauvage, S., Gros, V., Sciare, J., Pikridas, M., Stavroulas, I., Salameh, T., Leonardis, T., Gaudion, V., Depelchin, L., Fronval, I., Sarda-Esteve, R., Baisnée, D., Bonsang, B., Savvides, C., Vrekoussis, M., and Locoge, N.: Origin and variability in volatile organic compounds observed at an Eastern Mediterranean background site (Cyprus), Atmos. Chem. Phys., 17, 11355–11388, https://doi.org/10.5194/acp-17-11355-2017, 2017.
DeCarlo, P. F., Ulbrich, I. M., Crounse, J., de Foy, B., Dunlea, E. J., Aiken, A. C., Knapp, D., Weinheimer, A. J., Campos, T., Wennberg, P. O., and Jimenez, J. L.: Investigation of the sources and processing of organic aerosol over the Central Mexican Plateau from aircraft measurements during MILAGRO, Atmos. Chem. Phys., 10, 5257–5280, https://doi.org/10.5194/acp-10-5257-2010, 2010.
Desai, N. S., Moore, A. C., Mouat, A. P., Liang, Y., Xu, T., Takeuchi, M., and Kaiser, J.: Impact of Heatwaves and Declining NOx on Nocturnal Monoterpene Oxidation in the Urban Southeastern United States, Journal of Geophysical Research: Atmospheres, 129, e2024JD041482, https://doi.org/10.1029/2024JD041482, 2024.
Dockery, D. W., Pope, C. A., Xu, X., Spengler, J. D., Ware, J. H., Fay, M. E., and Speizer, F. E.: An Association between Air Pollution and Mortality in Six U.S. Cities, New England Journal of Medicine, 329, 1753–1759, https://doi.org/10.1056/NEJM199312093292401, 1993.
Dockery, D. W. and Stone, P. H.: Cardiovascular Risks from Fine Particulate Air Pollution, New England Journal of Medicine, 356, 511–513, https://doi.org/10.1056/NEJMe068274, 2007.
Drewnick, F., Hings, S. S., DeCarlo, P., Jayne, J. T., Gonin, M., Fuhrer, K. and Worsnop, D. R.: A New Time-of-Flight Aerosol Mass Spectrometer (TOF-AMS)—Instrument Description and First Field Deployment, Aerosol Sci Tech, 39, 637–658, https://doi.org/10.1080/02786820500182040, 2005.
Fanourgakis, G. S., Kanakidou, M., Nenes, A., Bauer, S. E., Bergman, T., Carslaw, K. S., Grini, A., Hamilton, D. S., Johnson, J. S., Karydis, V. A., Kirkevåg, A., Kodros, J. K., Lohmann, U., Luo, G., Makkonen, R., Matsui, H., Neubauer, D., Pierce, J. R., Schmale, J., Stier, P., Tsigaridis, K., van Noije, T., Wang, H., Watson-Parris, D., Westervelt, D. M., Yang, Y., Yoshioka, M., Daskalakis, N., Decesari, S., Gysel-Beer, M., Kalivitis, N., Liu, X., Mahowald, N. M., Myriokefalitakis, S., Schrödner, R., Sfakianaki, M., Tsimpidi, A. P., Wu, M., and Yu, F.: Evaluation of global simulations of aerosol particle and cloud condensation nuclei number, with implications for cloud droplet formation, Atmos. Chem. Phys., 19, 8591–8617, https://doi.org/10.5194/acp-19-8591-2019, 2019.
Farmer, D. K., Matsunaga, A., Docherty, K. S., Surratt, J. D., Seinfeld, J. H., Ziemann, P. J., and Jimenez, J. L.: Response of an aerosol mass spectrometer to organonitrates and organosulfates and implications for atmospheric chemistry, P. Natl. Acad. Sci. USA, 107, 6670–6675, https://doi.org/10.1073/pnas.0912340107, 2010.
Faust, J. A., Wong, J. P. S., Lee, A. K. Y., and Abbatt, J. P. D.: Role of Aerosol Liquid Water in Secondary Organic Aerosol Formation from Volatile Organic Compounds, Environ. Sci. Technol., 51, 1405–1413, https://doi.org/10.1021/acs.est.6b04700, 2017.
Florou, K., Papanastasiou, D. K., Pikridas, M., Kaltsonoudis, C., Louvaris, E., Gkatzelis, G. I., Patoulias, D., Mihalopoulos, N., and Pandis, S. N.: The contribution of wood burning and other pollution sources to wintertime organic aerosol levels in two Greek cities, Atmos. Chem. Phys., 17, 3145–3163, https://doi.org/10.5194/acp-17-3145-2017, 2017.
Fountoukis, C. and Nenes, A.: ISORROPIA II: a computationally efficient thermodynamic equilibrium model for K+–Ca2+–Mg2+–NH–Na+–SO–NO–Cl—H2O aerosols, Atmos. Chem. Phys., 7, 4639–4659, https://doi.org/10.5194/acp-7-4639-2007, 2007.
Fry, J. L., Kiendler-Scharr, A., Rollins, A. W., Wooldridge, P. J., Brown, S. S., Fuchs, H., Dubé, W., Mensah, A., dal Maso, M., Tillmann, R., Dorn, H.-P., Brauers, T., and Cohen, R. C.: Organic nitrate and secondary organic aerosol yield from NO3 oxidation of β-pinene evaluated using a gas-phase kinetics/aerosol partitioning model, Atmos. Chem. Phys., 9, 1431–1449, https://doi.org/10.5194/acp-9-1431-2009, 2009.
Fry, J. L., Draper, D. C., Zarzana, K. J., Campuzano-Jost, P., Day, D. A., Jimenez, J. L., Brown, S. S., Cohen, R. C., Kaser, L., Hansel, A., Cappellin, L., Karl, T., Hodzic Roux, A., Turnipseed, A., Cantrell, C., Lefer, B. L., and Grossberg, N.: Observations of gas- and aerosol-phase organic nitrates at BEACHON-RoMBAS 2011, Atmos. Chem. Phys., 13, 8585–8605, https://doi.org/10.5194/acp-13-8585-2013, 2013.
Fuchs, H., Novelli, A., Rolletter, M., Hofzumahaus, A., Pfannerstill, E. Y., Kessel, S., Edtbauer, A., Williams, J., Michoud, V., Dusanter, S., Locoge, N., Zannoni, N., Gros, V., Truong, F., Sarda-Esteve, R., Cryer, D. R., Brumby, C. A., Whalley, L. K., Stone, D., Seakins, P. W., Heard, D. E., Schoemaecker, C., Blocquet, M., Coudert, S., Batut, S., Fittschen, C., Thames, A. B., Brune, W. H., Ernest, C., Harder, H., Muller, J. B. A., Elste, T., Kubistin, D., Andres, S., Bohn, B., Hohaus, T., Holland, F., Li, X., Rohrer, F., Kiendler-Scharr, A., Tillmann, R., Wegener, R., Yu, Z., Zou, Q., and Wahner, A.: Comparison of OH reactivity measurements in the atmospheric simulation chamber SAPHIR, Atmos. Meas. Tech., 10, 4023–4053, https://doi.org/10.5194/amt-10-4023-2017, 2017.
Ge, X. L., Zhang, Q., Sun, Y. L., Ruehl, C. R., and Setyan, A.: Effect of aqueous-phase processing on aerosol chemistry and size distributions in Fresno, California, during wintertime, Environmental Chemistry, 9, 221–235, https://doi.org/10.1071/en11168, 2012.
Guo, H., Xu, L., Bougiatioti, A., Cerully, K. M., Capps, S. L., Hite Jr., J. R., Carlton, A. G., Lee, S.-H., Bergin, M. H., Ng, N. L., Nenes, A., and Weber, R. J.: Fine-particle water and pH in the southeastern United States, Atmos. Chem. Phys., 15, 5211–5228, https://doi.org/10.5194/acp-15-5211-2015, 2015.
Hass-Mitchell, T., Joo, T., Rogers, M., Nault, B. A., Soong, C., Tran, M., and Gentner, D. R.: Increasing Contributions of Temperature-Dependent Oxygenated Organic Aerosol to Summertime Particulate Matter in New York City, ACS ES&T Air, 1, 113–128, https://doi.org/10.1021/acsestair.3c00037, 2024.
Hayes, P. L., Ortega, A. M., Cubison, M. J., Froyd, K. D., Zhao, Y., Cliff, S. S., and Jimenez, J. L.: Organic aerosol composition and sources in Pasadena, California, during the 2010 CalNex campaign, Journal of Geophysical Research: Atmospheres, 118, 9233–9257, https://doi.org/10.1002/jgrd.50530, 2013.
Hildebrandt, L., Engelhart, G. J., Mohr, C., Kostenidou, E., Lanz, V. A., Bougiatioti, A., DeCarlo, P. F., Prevot, A. S. H., Baltensperger, U., Mihalopoulos, N., Donahue, N. M., and Pandis, S. N.: Aged organic aerosol in the Eastern Mediterranean: the Finokalia Aerosol Measurement Experiment – 2008, Atmos. Chem. Phys., 10, 4167–4186, https://doi.org/10.5194/acp-10-4167-2010, 2010.
Hoyle, C. R., Berntsen, T., Myhre, G., and Isaksen, I. S. A.: Secondary organic aerosol in the global aerosol – chemical transport model Oslo CTM2, Atmos. Chem. Phys., 7, 5675–5694, https://doi.org/10.5194/acp-7-5675-2007, 2007.
Hu, W. W., Hu, M., Yuan, B., Jimenez, J. L., Tang, Q., Peng, J. F., Hu, W., Shao, M., Wang, M., Zeng, L. M., Wu, Y. S., Gong, Z. H., Huang, X. F., and He, L. Y.: Insights on organic aerosol aging and the influence of coal combustion at a regional receptor site of central eastern China, Atmos. Chem. Phys., 13, 10095–10112, https://doi.org/10.5194/acp-13-10095-2013, 2013.
Hu, W. W., Campuzano-Jost, P., Palm, B. B., Day, D. A., Ortega, A. M., Hayes, P. L., Krechmer, J. E., Chen, Q., Kuwata, M., Liu, Y. J., de Sá, S. S., McKinney, K., Martin, S. T., Hu, M., Budisulistiorini, S. H., Riva, M., Surratt, J. D., St. Clair, J. M., Isaacman-Van Wertz, G., Yee, L. D., Goldstein, A. H., Carbone, S., Brito, J., Artaxo, P., de Gouw, J. A., Koss, A., Wisthaler, A., Mikoviny, T., Karl, T., Kaser, L., Jud, W., Hansel, A., Docherty, K. S., Alexander, M. L., Robinson, N. H., Coe, H., Allan, J. D., Canagaratna, M. R., Paulot, F., and Jimenez, J. L.: Characterization of a real-time tracer for isoprene epoxydiols-derived secondary organic aerosol (IEPOX-SOA) from aerosol mass spectrometer measurements, Atmos. Chem. Phys., 15, 11807–11833, https://doi.org/10.5194/acp-15-11807-2015, 2015.
Huang, D. D., Li, Y. J., Lee, B. P., and Chan, C. K.: Analysis of Organic Sulfur Compounds in Atmospheric Aerosols at the HKUST Supersite in Hong Kong Using HR-ToF-AMS, Environ. Sci. Technol., 49, 3672–3679, https://doi.org/10.1021/es5056269, 2015.
Huang, L., Liu, T., and Grassian, V. H.: Radical-Initiated Formation of Aromatic Organosulfates and Sulfonates in the Aqueous Phase, Environ. Sci. Technol., 54, 11857–11864, https://doi.org/10.1021/acs.est.0c05644, 2020.
Huang, S., Poulain, L., van Pinxteren, D., van Pinxteren, M., Wu, Z., Herrmann, H., and Wiedensohler, A.: Latitudinal and Seasonal Distribution of Particulate MSA over the Atlantic using a Validated Quantification Method with HR-ToF-AMS, Environ. Sci. Technol., 51, 418–426, https://doi.org/10.1021/acs.est.6b03186, 2017.
Insight, B.: German sugar manufacturer Pfeifer & Langen converts to biomass boilers, Woodcote Media Ltd publishes Bioenergy Insight, https://www.bioenergy-news.com/news/german-sugar-manufacturer-pfeifer-langen-converts-to-biomass-boilers (last access: 15 May 2025), 2023.
Jimenez, J. L., Jayne, J. T., Shi, Q., Kolb, C. E., Worsnop, D. R., Yourshaw, I. and Davidovits, P.: Ambient aerosol sampling using the Aerodyne Aerosol Mass Spectrometer, Journal of Geophysical Research: Atmospheres, 108, https://doi.org/10.1029/2001JD001213, 2003.
Jimenez, J. L., Canagaratna, M. R., Donahue, N. M., Prevot, A. S., Zhang, Q., Kroll, J. H., and Worsnop, D. R.: Evolution of organic aerosols in the atmosphere, Science, 326, 1525–1529, https://doi.org/10.1126/science.1180353, 2009.
Kharuk, V. I. and Ponomarev, E.: Spatiotemporal characteristics of wildfire frequency and relative area burned in larch-dominated forests of Central Siberia, Russian Journal of Ecology, 48, 507–512, https://doi.org/10.1134/S1067413617060042, 2017.
Kiendler-Scharr, A., Mensah, A. A., Friese, E., Topping, D., Nemitz, E., Prevot, A. S. H., and Wu, H. C.: Ubiquity of organic nitrates from nighttime chemistry in the European submicron aerosol, Geophysical Research Letters, 43, 7735–7744, https://doi.org/10.1002/2016gl069239, 2016.
Kodros, J. K., Papanastasiou, D. K., Paglione, M., Masiol, M., Squizzato, S., Florou, K., and Pandis, S. N.: Rapid dark aging of biomass burning as an overlooked source of oxidized organic aerosol, P. Natl. Acad. Sci. USA, 117, 33028–33033, https://doi.org/10.1073/pnas.2010365117, 2020.
Kostenidou, E., Lee, B.-H., Engelhart, G. J., Pierce, J. R., and Pandis, S. N.: Mass Spectra Deconvolution of Low, Medium, and High Volatility Biogenic Secondary Organic Aerosol, Environ. Sci. Technol., 43, 4884–4889, https://doi.org/10.1021/es803676g, 2009.
Kostenidou, E., Florou, K., Kaltsonoudis, C., Tsiflikiotou, M., Vratolis, S., Eleftheriadis, K., and Pandis, S. N.: Sources and chemical characterization of organic aerosol during the summer in the eastern Mediterranean, Atmos. Chem. Phys., 15, 11355–11371, https://doi.org/10.5194/acp-15-11355-2015, 2015.
Lee, B. H., Mohr, C., Lopez-Hilfiker, F. D., Lutz, A., Hallquist, M., Lee, L., and Thornton, J. A.: Highly functionalized organic nitrates in the southeast United States: Contribution to secondary organic aerosol and reactive nitrogen budgets, P. Natl. Acad. Sci. USA, 113, 1516–1521, https://doi.org/10.1073/pnas.1508108113, 2016.
Lelieveld, J., Evans, J. S., Fnais, M., Giannadaki, D., and Pozzer, A.: The contribution of outdoor air pollution sources to premature mortality on a global scale, Nature, 525, 367–371, https://doi.org/10.1038/nature15371, 2015.
Li, J., Pósfai, M., Hobbs, P. V., and Buseck, P. R.: Individual aerosol particles from biomass burning in southern Africa: 2, Compositions and aging of inorganic particles, Journal of Geophysical Research: Atmospheres, 108, https://doi.org/10.1029/2002JD002310, 2003.
Li, Y. J., Lee, B. P., Su, L., Fung, J. C. H., and Chan, C. K.: Seasonal characteristics of fine particulate matter (PM) based on high-resolution time-of-flight aerosol mass spectrometric (HR-ToF-AMS) measurements at the HKUST Supersite in Hong Kong, Atmos. Chem. Phys., 15, 37–53, https://doi.org/10.5194/acp-15-37-2015, 2015.
Liggio, J. and Li, S.-M.: Reactive uptake of pinonaldehyde on acidic aerosols, Journal of Geophysical Research: Atmospheres, 111, https://doi.org/10.1029/2005JD006978, 2006.
Lipiäinen, S., Kuparinen, K., Sermyagina, E., and Vakkilainen, E.: Pulp and paper industry in energy transition: Towards energy-efficient and low carbon operation in Finland and Sweden, Sustainable Production and Consumption, 29, 421–431, https://doi.org/10.1016/j.spc.2021.10.029, 2022.
Liu, L., Hohaus, T., Franke, P., Lange, A. C., Tillmann, R., Fuchs, H., and Kiendler-Scharr, A.: Seasonal Comparison of the Chemical Composition and Source Apportionment of Aerosols during the Year-Long JULIAC Campaign, Doctoral Thesis, Energy & Environment, University of Wuppertal, Forschungszentrum Jülich GmbH, https://juser.fz-juelich.de/record/916580 (last access: 28 February 2022), 2022.
Liu, L., Hohaus, T., Franke, P., Lange, A. C., Tillmann, R., Fuchs, H., and Kiendler-Scharr, A.: Observational evidence reveals the significance of nocturnal chemistry in seasonal secondary organic aerosol formation, npj Climate and Atmospheric Science, 7, 207, https://doi.org/10.1038/s41612-024-00747-6, 2024a.
Liu, L., Hohaus, T., Franke, P., Lange, A. C., Tillmann, R., Fuchs, H., Tan, Z., Rohrer, F., Karydis, V., He, Q., Vardhan, V., Andres, S., Bohn, B., Holland, F., Winter, B., Wedel, S., Novelli, A., Hofzumahaus, A., Wahner, A., and Kiendler-Scharr, A.: Replication data for Aerosol chemical composition and aerosol source apportionment (PMF) for the JULIAC 2019 campaign, https://doi.org/10.26165/JUELICH-DATA/TPPXNL, Jülich DATA, V1 [data set], 2024b.
Ma, M., Gao, Y., Wang, Y., Zhang, S., Leung, L. R., Liu, C., Wang, S., Zhao, B., Chang, X., Su, H., Zhang, T., Sheng, L., Yao, X., and Gao, H.: Substantial ozone enhancement over the North China Plain from increased biogenic emissions due to heat waves and land cover in summer 2017, Atmos. Chem. Phys., 19, 12195–12207, https://doi.org/10.5194/acp-19-12195-2019, 2019.
Matzarakis, A., Laschewski, G., and Muthers, S.: The Heat Health Warning System in Germany-Application and Warnings for 2005 to 2019, Atmosphere, 11, https://doi.org/10.3390/atmos11020170, 2020.
McFiggans, G., Mentel, T. F., Wildt, J., Pullinen, I., Kang, S., Kleist, E., and Kiendler-Scharr, A.: Secondary organic aerosol reduced by mixture of atmospheric vapours, Nature, 565, 587–593, https://doi.org/10.1038/s41586-018-0871-y, 2019.
Meng, X., Wu, Z., Chen, J., Qiu, Y., Zong, T., Song, M., Lee, J., and Hu, M.: Particle phase state and aerosol liquid water greatly impact secondary aerosol formation: insights into phase transition and its role in haze events, Atmos. Chem. Phys., 24, 2399–2414, https://doi.org/10.5194/acp-24-2399-2024, 2024.
Mentel, Th. F., Kleist, E., Andres, S., Dal Maso, M., Hohaus, T., Kiendler-Scharr, A., Rudich, Y., Springer, M., Tillmann, R., Uerlings, R., Wahner, A., and Wildt, J.: Secondary aerosol formation from stress-induced biogenic emissions and possible climate feedbacks, Atmos. Chem. Phys., 13, 8755–8770, https://doi.org/10.5194/acp-13-8755-2013, 2013.
Middlebrook, A. M., Bahreini, R., Jimenez, J. L., and Canagaratna, M. R.: Evaluation of Composition-Dependent Collection Efficiencies for the Aerodyne Aerosol Mass Spectrometer using Field Data, Aerosol Sci. Tech., 46, 258–271, https://doi.org/10.1080/02786826.2011.620041, 2012.
Mohr, C., DeCarlo, P. F., Heringa, M. F., Chirico, R., Slowik, J. G., Richter, R., Reche, C., Alastuey, A., Querol, X., Seco, R., Peñuelas, J., Jiménez, J. L., Crippa, M., Zimmermann, R., Baltensperger, U., and Prévôt, A. S. H.: Identification and quantification of organic aerosol from cooking and other sources in Barcelona using aerosol mass spectrometer data, Atmos. Chem. Phys., 12, 1649–1665, https://doi.org/10.5194/acp-12-1649-2012, 2012.
Myhre, G., Samset, B. H., Schulz, M., Balkanski, Y., Bauer, S., Berntsen, T. K., Bian, H., Bellouin, N., Chin, M., Diehl, T., Easter, R. C., Feichter, J., Ghan, S. J., Hauglustaine, D., Iversen, T., Kinne, S., Kirkevåg, A., Lamarque, J.-F., Lin, G., Liu, X., Lund, M. T., Luo, G., Ma, X., van Noije, T., Penner, J. E., Rasch, P. J., Ruiz, A., Seland, Ø., Skeie, R. B., Stier, P., Takemura, T., Tsigaridis, K., Wang, P., Wang, Z., Xu, L., Yu, H., Yu, F., Yoon, J.-H., Zhang, K., Zhang, H., and Zhou, C.: Radiative forcing of the direct aerosol effect from AeroCom Phase II simulations, Atmos. Chem. Phys., 13, 1853–1877, https://doi.org/10.5194/acp-13-1853-2013, 2013.
Ng, N. L., Kwan, A. J., Surratt, J. D., Chan, A. W. H., Chhabra, P. S., Sorooshian, A., Pye, H. O. T., Crounse, J. D., Wennberg, P. O., Flagan, R. C., and Seinfeld, J. H.: Secondary organic aerosol (SOA) formation from reaction of isoprene with nitrate radicals (NO3), Atmos. Chem. Phys., 8, 4117–4140, https://doi.org/10.5194/acp-8-4117-2008, 2008.
Ng, N. L., Canagaratna, M. R., Zhang, Q., Jimenez, J. L., Tian, J., Ulbrich, I. M., Kroll, J. H., Docherty, K. S., Chhabra, P. S., Bahreini, R., Murphy, S. M., Seinfeld, J. H., Hildebrandt, L., Donahue, N. M., DeCarlo, P. F., Lanz, V. A., Prévôt, A. S. H., Dinar, E., Rudich, Y., and Worsnop, D. R.: Organic aerosol components observed in Northern Hemispheric datasets from Aerosol Mass Spectrometry, Atmos. Chem. Phys., 10, 4625–4641, https://doi.org/10.5194/acp-10-4625-2010, 2010.
Ng, N. L., Canagaratna, M. R., Jimenez, J. L., Chhabra, P. S., Seinfeld, J. H., and Worsnop, D. R.: Changes in organic aerosol composition with aging inferred from aerosol mass spectra, Atmos. Chem. Phys., 11, 6465–6474, https://doi.org/10.5194/acp-11-6465-2011, 2011.
Ng, N. L., Brown, S. S., Archibald, A. T., Atlas, E., Cohen, R. C., Crowley, J. N., Day, D. A., Donahue, N. M., Fry, J. L., Fuchs, H., Griffin, R. J., Guzman, M. I., Herrmann, H., Hodzic, A., Iinuma, Y., Jimenez, J. L., Kiendler-Scharr, A., Lee, B. H., Luecken, D. J., Mao, J., McLaren, R., Mutzel, A., Osthoff, H. D., Ouyang, B., Picquet-Varrault, B., Platt, U., Pye, H. O. T., Rudich, Y., Schwantes, R. H., Shiraiwa, M., Stutz, J., Thornton, J. A., Tilgner, A., Williams, B. J., and Zaveri, R. A.: Nitrate radicals and biogenic volatile organic compounds: oxidation, mechanisms, and organic aerosol, Atmos. Chem. Phys., 17, 2103–2162, https://doi.org/10.5194/acp-17-2103-2017, 2017.
Otu-Larbi, F., Bolas, C. G., Ferracci, V., Staniaszek, Z., Jones, R. L., Malhi, Y., and Ashworth, K.: Modelling the effect of the 2018 summer heatwave and drought on isoprene emissions in a UK woodland, Glob Chang Biol, 26, 2320–2335, https://doi.org/10.1111/gcb.14963, 2020.
Paatero, P.: The Multilinear Engine: A Table-Driven, Least Squares Program for Solving Multilinear Problems, including the n-Way Parallel Factor Analysis Model, Journal of Computational and Graphical Statistics, 8, 854–888, https://doi.org/10.2307/1390831, 1999.
Paatero, P. and Hopke, P. K.: Discarding or downweighting high-noise variables in factor analytic models, Analytica Chimica Acta, 490, 277–289, https://doi.org/10.1016/S0003-2670(02)01643-4, 2003.
Parworth, C., Fast, J., Mei, F., Shippert, T., Sivaraman, C., Tilp, A., and Zhang, Q.: Long-term measurements of submicrometer aerosol chemistry at the Southern Great Plains (SGP) using an Aerosol Chemical Speciation Monitor (ACSM), Atmospheric Environment, 106, 43–55, https://doi.org/10.1016/j.atmosenv.2015.01.060, 2015.
Petit, J. E., Amodeo, T., Meleux, F., Bessagnet, B., Menut, L., Grenier, D., and Favez, O.: Characterising an intense PM pollution episode in March 2015 in France from multi-site approach and near real time data: Climatology, variabilities, geographical origins and model evaluation, Atmospheric Environment, 155, 68–84, https://doi.org/10.1016/j.atmosenv.2017.02.012, 2017.
Pope, C. A. and Dockery, D. W.: Health Effects of Fine Particulate Air Pollution: Lines that Connect, Journal of the Air & Waste Management Association, 56, 709–742, https://doi.org/10.1080/10473289.2006.10464485, 2006.
Pye, H. O. T., Chan, A. W. H., Barkley, M. P., and Seinfeld, J. H.: Global modeling of organic aerosol: the importance of reactive nitrogen (NOx and NO3), Atmos. Chem. Phys., 10, 11261–11276, https://doi.org/10.5194/acp-10-11261-2010, 2010.
Raatikainen, T., Vaattovaara, P., Tiitta, P., Miettinen, P., Rautiainen, J., Ehn, M., Kulmala, M., Laaksonen, A., and Worsnop, D. R.: Physicochemical properties and origin of organic groups detected in boreal forest using an aerosol mass spectrometer, Atmos. Chem. Phys., 10, 2063–2077, https://doi.org/10.5194/acp-10-2063-2010, 2010.
Ramanathan, V., Crutzen, P. J., Kiehl, J. T., and Rosenfeld, D.: Aerosols, Climate, and the Hydrological Cycle, Science, 294, 2119, https://doi.org/10.1126/science.1064034, 2001.
Riva, M., Heikkinen, L., Bell, D. M., Peräkylä, O., Zha, Q., Schallhart, S., and Ehn, M.: Chemical transformations in monoterpene-derived organic aerosol enhanced by inorganic composition, npj Climate and Atmospheric Science, 2, https://doi.org/10.1038/s41612-018-0058-0, 2019.
Russell, M.: Predicting secondary organic aerosol formation rates in southeast Texas, Journal of Geophysical Research, 110, https://doi.org/10.1029/2004jd004722, 2005.
Saarikoski, S., Carbone, S., Decesari, S., Giulianelli, L., Angelini, F., Canagaratna, M., Ng, N. L., Trimborn, A., Facchini, M. C., Fuzzi, S., Hillamo, R., and Worsnop, D.: Chemical characterization of springtime submicrometer aerosol in Po Valley, Italy, Atmos. Chem. Phys., 12, 8401–8421, https://doi.org/10.5194/acp-12-8401-2012, 2012.
Schlag, P., Kiendler-Scharr, A., Blom, M. J., Canonaco, F., Henzing, J. S., Moerman, M., Prévôt, A. S. H., and Holzinger, R.: Aerosol source apportionment from 1-year measurements at the CESAR tower in Cabauw, the Netherlands, Atmos. Chem. Phys., 16, 8831–8847, https://doi.org/10.5194/acp-16-8831-2016, 2016.
Schlag, P., Rubach, F., Mentel, T. F., Reimer, D., Canonaco, F., Henzing, J. S., and Kiendler-Scharr, A.: Ambient and laboratory observations of organic ammonium salts in PM1, Faraday Discuss., 200, 331–351, https://doi.org/10.1039/c7fd00027h, 2017.
Schmale, J., Schneider, J., Nemitz, E., Tang, Y. S., Dragosits, U., Blackall, T. D., Trathan, P. N., Phillips, G. J., Sutton, M., and Braban, C. F.: Sub-Antarctic marine aerosol: dominant contributions from biogenic sources, Atmos. Chem. Phys., 13, 8669–8694, https://doi.org/10.5194/acp-13-8669-2013, 2013.
Schueneman, M. K., Nault, B. A., Campuzano-Jost, P., Jo, D. S., Day, D. A., Schroder, J. C., Palm, B. B., Hodzic, A., Dibb, J. E., and Jimenez, J. L.: Aerosol pH indicator and organosulfate detectability from aerosol mass spectrometry measurements, Atmos. Meas. Tech., 14, 2237–2260, https://doi.org/10.5194/amt-14-2237-2021, 2021.
Seibert, P., Kromp-Kolb, H., Baltensperger, U., Jost, D. T., and Schwikowski, M.: Air Pollution Modeling and Its Application X, edited by: van Dop, H. and Kallos, G., Plenum Press, ISBN 0-306-44876-0, 1994.
Simoneit, B. R. T., Schauer, J. J., Nolte, C. G., Oros, D. R., Elias, V. O., Fraser, M. P., and Cass, G. R.: Levoglucosan, a tracer for cellulose in biomass burning and atmospheric particles, Atmospheric Environment, 33, 173–182, https://doi.org/10.1016/S1352-2310(98)00145-9, 1999.
Stein, A. F., Draxler, R. R., Rolph, G. D., Stunder, B. J., Cohen, M. D., and Ngan, F.: NOAA's HYSPLIT atmospheric transport and dispersion modeling system, Bulletin of the American Meteorological Society, 96, 2059–2077, https://doi.org/10.1175/BAMS-D-14-00110.1, 2015.
Sun, Y., Du, W., Fu, P., Wang, Q., Li, J., Ge, X., Zhang, Q., Zhu, C., Ren, L., Xu, W., Zhao, J., Han, T., Worsnop, D. R., and Wang, Z.: Primary and secondary aerosols in Beijing in winter: sources, variations and processes, Atmos. Chem. Phys., 16, 8309–8329, https://doi.org/10.5194/acp-16-8309-2016, 2016.
Sun, Y. L., Zhang, Q., Schwab, J. J., Yang, T., Ng, N. L., and Demerjian, K. L.: Factor analysis of combined organic and inorganic aerosol mass spectra from high resolution aerosol mass spectrometer measurements, Atmos. Chem. Phys., 12, 8537–8551, https://doi.org/10.5194/acp-12-8537-2012, 2012.
Tan, S., Zhang, X., Lian, Y., Chen, X., Yin, S., Du, L., and Ge, M.: OH Group Orientation Leads to Organosulfate Formation at the Liquid Aerosol Surface, Journal of the American Chemical Society, 144, 16953–16964, https://doi.org/10.1021/jacs.2c05807, 2022a.
Tan, Z., Fuchs, H., Hofzumahaus, A., Bloss, W. J., Bohn, B., Cho, C., Hohaus, T., Holland, F., Lakshmisha, C., Liu, L., Monks, P. S., Novelli, A., Niether, D., Rohrer, F., Tillmann, R., Valkenburg, T. S. E., Vardhan, V., Kiendler-Scharr, A., Wahner, A., and Sommariva, R.: Seasonal variation in nitryl chloride and its relation to gas-phase precursors during the JULIAC campaign in Germany, Atmos. Chem. Phys., 22, 13137–13152, https://doi.org/10.5194/acp-22-13137-2022, 2022b.
Tao, J., Gao, J., Zhang, L., Zhang, R., Che, H., Zhang, Z., Lin, Z., Jing, J., Cao, J., and Hsu, S.-C.: PM2.5 pollution in a megacity of southwest China: source apportionment and implication, Atmos. Chem. Phys., 14, 8679–8699, https://doi.org/10.5194/acp-14-8679-2014, 2014.
Wagner, N. L., Dubé, W. P., Washenfelder, R. A., Young, C. J., Pollack, I. B., Ryerson, T. B., and Brown, S. S.: Diode laser-based cavity ring-down instrument for NO3, N2O5, NO, NO2 and O3 from aircraft, Atmos. Meas. Tech., 4, 1227–1240, https://doi.org/10.5194/amt-4-1227-2011, 2011.
Wang, Y., Zhao, Y., Wang, Y., Yu, J.-Z., Shao, J., Liu, P., Zhu, W., Cheng, Z., Li, Z., Yan, N., and Xiao, H.: Organosulfates in atmospheric aerosols in Shanghai, China: seasonal and interannual variability, origin, and formation mechanisms, Atmos. Chem. Phys., 21, 2959–2980, https://doi.org/10.5194/acp-21-2959-2021, 2021.
Xu, L., Guo, H., Boyd, C. M., Klein, M., Bougiatioti, A., Cerully, K. M., and Ng, N. L.: Effects of anthropogenic emissions on aerosol formation from isoprene and monoterpenes in the southeastern United States, P. Natl. Acad. Sci. USA, 112, E4506–4507, https://doi.org/10.1073/pnas.1512277112, 2015a.
Xu, L., Guo, H., Boyd, C. M., Klein, M., Bougiatioti, A., Cerully, K. M., and Ng, N. L.: Effects of anthropogenic emissions on aerosol formation from isoprene and monoterpenes in the southeastern United States, P. Natl. Acad. Sci. USA, 112, 37–42, https://doi.org/10.1073/pnas.1417609112, 2015b.
Xu, L., Suresh, S., Guo, H., Weber, R. J., and Ng, N. L.: Aerosol characterization over the southeastern United States using high-resolution aerosol mass spectrometry: spatial and seasonal variation of aerosol composition and sources with a focus on organic nitrates, Atmos. Chem. Phys., 15, 7307–7336, https://doi.org/10.5194/acp-15-7307-2015, 2015c.
Yan, J. P., Jung, J. Y., Zhang, M. M., Xu, S. Q., Lin, Q., Zhao, S. H., and Chen, L. Q.: Significant Underestimation of Gaseous Methanesulfonic Acid (MSA) over Southern Ocean, Environ. Sci. Technol., 53, 13064–13070, https://doi.org/10.1021/acs.est.9b05362, 2019.
Yang, J.-R., Liu, A., and Long, B.: An unexpected feasible route for the formation of organosulfates by the gas phase reaction of sulfuric acid with acetaldehyde catalyzed by dimethylamine in the atmosphere, Environmental Science: Atmospheres, 3, 672–682, https://doi.org/10.1039/D2EA00159D, 2023.
Yao, M., Zhao, Y., Hu, M., Huang, D., Wang, Y., Yu, J. Z., and Yan, N.: Multiphase Reactions between Secondary Organic Aerosol and Sulfur Dioxide: Kinetics and Contributions to Sulfate Formation and Aerosol Aging, Environmental Science & Technology Letters, 6, 768–774, https://doi.org/10.1021/acs.estlett.9b00657, 2019.
Young, D. E., Kim, H., Parworth, C., Zhou, S., Zhang, X., Cappa, C. D., Seco, R., Kim, S., and Zhang, Q.: Influences of emission sources and meteorology on aerosol chemistry in a polluted urban environment: results from DISCOVER-AQ California, Atmos. Chem. Phys., 16, 5427–5451, https://doi.org/10.5194/acp-16-5427-2016, 2016.
Yu, J., Yan, C., Liu, Y., Li, X., Zhou, T., and Zheng, M.: Potassium: A Tracer for Biomass Burning in Beijing?, Aerosol and Air Quality Research, 18, 2447–2459, https://doi.org/10.4209/aaqr.2017.11.0536, 2018.
Zhang, G., Yu, X., Yin, H., Feng, C., Ma, C., Sun, S., and Liu, X.: Heatwave-amplified atmospheric oxidation in a multi-province border area in Xuzhou, China, Frontiers in Environmental Science, 12, 1496584, https://doi.org/10.3389/fenvs.2024.1496584, 2024.
Zhang, Q., Jimenez, J. L., Canagaratna, M. R., Allan, J. D., Coe, H., Ulbrich, I., and Worsnop, D. R.: Ubiquity and dominance of oxygenated species in organic aerosols in anthropogenically-influenced Northern Hemisphere midlatitudes, Geophysical Research Letters, 34, https://doi.org/10.1029/2007GL029979, 2007.
Zhang, Q., Jimenez, J. L., Canagaratna, M. R., Ulbrich, I. M., Ng, N. L., Worsnop, D. R., and Sun, Y.: Understanding atmospheric organic aerosols via factor analysis of aerosol mass spectrometry: a review, Anal. Bioanal. Chem., 401, 3045–3067, https://doi.org/10.1007/s00216-011-5355-y, 2011.
Zhang, R., Jing, J., Tao, J., Hsu, S.-C., Wang, G., Cao, J., Lee, C. S. L., Zhu, L., Chen, Z., Zhao, Y., and Shen, Z.: Chemical characterization and source apportionment of PM2.5 in Beijing: seasonal perspective, Atmos. Chem. Phys., 13, 7053–7074, https://doi.org/10.5194/acp-13-7053-2013, 2013.
Zhang, Y. J., Tang, L. L., Wang, Z., Yu, H. X., Sun, Y. L., Liu, D., Qin, W., Canonaco, F., Prévôt, A. S. H., Zhang, H. L., and Zhou, H. C.: Insights into characteristics, sources, and evolution of submicron aerosols during harvest seasons in the Yangtze River delta region, China, Atmos. Chem. Phys., 15, 1331–1349, https://doi.org/10.5194/acp-15-1331-2015, 2015.
Zhou, S., Collier, S., Jaffe, D. A., Briggs, N. L., Hee, J., Sedlacek III, A. J., Kleinman, L., Onasch, T. B., and Zhang, Q.: Regional influence of wildfires on aerosol chemistry in the western US and insights into atmospheric aging of biomass burning organic aerosol, Atmos. Chem. Phys., 17, 2477–2493, https://doi.org/10.5194/acp-17-2477-2017, 2017.
Zorn, S. R., Drewnick, F., Schott, M., Hoffmann, T., and Borrmann, S.: Characterization of the South Atlantic marine boundary layer aerosol using an aerodyne aerosol mass spectrometer, Atmos. Chem. Phys., 8, 4711–4728, https://doi.org/10.5194/acp-8-4711-2008, 2008.