the Creative Commons Attribution 4.0 License.
the Creative Commons Attribution 4.0 License.
 | 18 Nov 2025
Chemical characterization and source apportionment of fine particulate matter in Kigali, Rwanda, using aerosol mass spectrometry
Theobard Habineza
Allen L. Robinson
H. Langley DeWitt
Jimmy Gasore
Philip L. Croteau
Ambient air pollution poses a significant threat to public health, particularly in low and middle-income countries, where detailed data on particulate matter (PM) mass and composition are scarce. We conducted a year-long study on PM composition and sources in Eastern Africa (Kigali, Rwanda). The annual mean concentration of PM1 was , with slightly higher concentrations during the dry season. Organic aerosols (OA) contributed 73 % of the observed PM1 mass, black carbon (BC) 16 %, nitrate 6 %, sulfate and ammonium 2 % each, and chlorine 1 %. BC is approximately 60 % due to fossil fuel emissions and 40 % from biomass burning emissions. Tracer ions detected by the aerosol mass spectrometer suggest that photochemistry plays a significant role in the formation of secondary OA during the daytime (06:00 a.m.–06:00 p.m.), while primary OA dominates in the morning and evening due to increased anthropogenic activity and shallower boundary layer height. PM1 OA in Kigali is primarily composed of Oxygenated Organic Aerosols (OOA, 45 %), Hydrocarbon-like OA (HOA, 32 %), and Biomass Burning OA (BBOA, 23 %). Secondary organic aerosol (SOA) accounted for 47 % and 41 % of PM1 OA during the rainy and dry seasons, while primary OA (POA: BBOA + HOA) contributed 53 % and 59 %. Short-term interventions that limit traffic activity on some Saturdays and Sundays had a mixed impact on ambient PM1 and PM2.5 concentrations, with car-free Sundays reducing PM1 concentrations throughout most of the day.
- Article
(6373 KB) - Full-text XML
-
Supplement
(3531 KB) - BibTeX
- EndNote


Air pollution exposure has severe impacts on public health. Air pollution is classified as the second leading risk factor for deaths in Africa (Health Effects Institute, 2022). The adverse effects of air pollution manifest as cardiovascular diseases, respiratory diseases, and cerebrovascular diseases (Brito et al., 2018; Health Effects Institute, 2023; WHO, 2025). In 2019, ambient air pollution was estimated to cause 4.2×10⁶ premature deaths globally, with 89 % occurring in low- and middle-income countries (LMICs), including 1.1×10⁶ deaths in Africa (Subramanian et al., 2020; UN Environment, 2019; WHO, 2025). Studies in the Global South, including Eastern Africa, have revealed that particulate matter (PM), defined as solid or liquid particles suspended in the air, is the air pollutant most responsible for human health impacts and a leading risk factor across sub-Saharan Africa (SSA) (Health Effects Institute, 2022). PM mass concentrations in Africa often reach unhealthy levels compared to the World Health Organization's (WHO) air quality guidelines, posing significant health risks to public health and the environment (Andersson et al., 2020; Gaita et al., 2014; Onyango et al., 2024; Singh et al., 2021). Rapid population growth, urbanization, energy consumption, and motorization have been reported as drivers of air pollution in LMICs (Brito et al., 2018; Health Effects Institute, 2022; REMA, 2018; Tefera et al., 2021).
Eastern Africa and the Global South, in general, face a noticeable scarcity of air pollution measurements (Global Air pollution measurements, 2024; openaq, 2025). This hinders the understanding of air pollution impacts. Developing effective regulatory strategies requires information on air pollutant sources, which in turn requires measurements of PM composition. The data gaps are even larger for PM composition measurements than for PM mass concentrations (Dhammapala, 2019).
The few published studies on air pollution in Eastern Africa showed that PM concentrations exceed the World Health Organization (WHO) guidelines (Gahungu and Kubwimana, 2022; Kalisa et al., 2025; McFarlane et al., 2021; Ndamuzi et al., 2024; Onyango et al., 2024; REMA, 2018), and higher concentrations of PM2.5 (particulate matter smaller than 2.5 µm in diameter) are present in urban areas (Health Effects Institute, 2022). PM2.5 concentrations in eastern African cities are 3 to higher than the 5 µg m−3 air quality guidelines (AQG) set forth by the World Health Organization (Health Effects Institute, 2022). Gahungu used low-cost sensors and found that the daily mean concentration of PM2.5 in Kigali, Rwanda, was approximately 30 µg m−3 in the rainy season and 55 µg m−3 in the dry season (Gahungu and Kubwimana, 2022). Kalisa (2028) measured hourly average PM2.5 concentrations of 25 µg m−3 in the city center of Kigali (Kalisa et al., 2018). Onyango et al. (2024) using US State Department PM2.5 monitor data and filter collection, reported that the mean PM2.5 in Kampala, Uganda, is 59.4 µg m−3 (Onyango et al., 2024). McFarlane et al. (2021) reported mean PM2.5 concentrations of 43.5 µg m−3 in the central African city of Kinshasa, Democratic Republic of Congo (DRC (McFarlane et al., 2021). Ndamuzi et al. (2024) using low-cost sensors coupled with mathematical models, reported an annual mean PM2.5 of 35.0 µg m−3 in Bujumbura, Burundi (Ndamuzi et al., 2024).
Data on PM composition and sources are scarce. Some composition information comes from the Rwanda Climate Observatory, a remote site outside Kigali (Kirago et al., 2022). Within Kigali, studies have reported BC, PAHs, and NPAHs (Kalisa et al., 2018, 2025; Kalisa and Adams, 2022; Subramanian et al., 2020), but no detailed PM composition data have been reported for the city itself.
Studies on PM2.5 chemical speciation and source apportionment in Eastern Africa identified traffic emissions (36 %) and biomass/secondary aerosols (28 %) as the main sources of PM2.5 in Mbarara, Uganda (Onyango et al., 2024b), while mineral dust and traffic emissions together account for 74 % of PM2.5 in Nairobi, Kenya (Gaita et al., 2014). The chemical composition and sources of PM2.5 in other Eastern African cities are still unexplored, and without detailed data on PM composition, source identification remains unknown.
Rwanda, an Eastern African country, is experiencing rapid population growth in its urban centers, particularly in its capital city, Kigali. The annual rate of urbanization is 4.1 %, contributing to a high population density of 2330 inhabitants per km2 as of 2023 (Kigali City, 2025). Notably, 85 % of households in Kigali rely on biomass burning for cooking, which includes wood, charcoal, and waste materials (MINEFRA, 2015, 2018b). Additionally, 13 % of households use petroleum-based fuels such as diesel, kerosene, and liquified petroleum gas (LPG) (MINEFRA, 2018b; UNFCCC_Rwanda, 2021). In 2019, air pollution-related deaths in Rwanda were estimated at 9286, and an estimated economic cost of USD 349 million (Fisher et al., 2021) following a rise of 41 % from 2008 to 2019 (Global Burden of Disease, 2024; Taghian et al., 2024).
Governments are deploying a range of policies to curb air pollution and its impacts. In Rwanda, the transport sector is targeting traffic-related PM by discouraging imports of vehicles older than 20 years and advancing electric-mobility policies (Rwanda, 2021). Demand-side measures, including car-free days and nationwide community work (Umuganda), further reduce traffic during peak windows. In the industrial and energy sectors, Rwanda is aligning with East African Community (EAC) emission standards, EAS 750:2010 (ambient air), EAC 751:2010 (cement factories), and EAC 1047:2022 (tailpipe emissions) and expanding access to low-emission cookstoves in rural communities to cut household PM (Republic of Rwanda, 2022).
To better understand PM chemical composition, concentration, and sources in Eastern Africa, we conducted long-term ground measurements of PM mass concentration and chemical composition using an aerosol mass spectrometer at a central site in Kigali, Rwanda. This study uses a 12 month (April 2023–May 2024) dataset that captures the four alternating rainy and dry seasons in Rwanda and Eastern Africa in general. These data represent the first mass spectrometry-based PM composition measurements in the region, offering high-time resolution insights. The findings not only enhance an understanding of PM composition but also provide a tool for policymakers to develop data-driven air pollution mitigation strategies and targeted interventions in this region.
2.1 Sampling location
Real-time PM1 data were collected from April 2023 to May 2024 at a fixed monitoring station located at the University of Rwanda, College of Science and Technology (UR/CST) at latitude −1.9619, longitude 30.0645 in Nyarugenge District, Kigali City (Fig. S1 in the Supplement).
Kigali is characterized by rolling hills, with steep slopes connecting a network of valleys and ridges at an altitude of approximately 1500 (Climatology of eastern Africa, 2025). The monitoring site is in the city center, on the third floor of a three-story building at UR/CST. The site is surrounded by a mix of commercial and residential neighbourhoods, with busy roads in the city center in Nyarugenge District, making it representative of an urban background station.
Like many Eastern African cities, Kigali experiences four alternating seasons: the long dry season (June, July, and August), the short rainy season (September, October, and November), the short dry season (December, January, and February), and the long rainy season (March, April, and May). The terms “short” and “long” refer to the intensity and consistency of rainfall and sunshine, rather than their duration (Nicholson, 2017). The annual average rainfall in Kigali is 1170 mm, the annual mean temperature is 22 °C, and the annual maximum temperature is 33 °C (Kigali City, 2025; The World Bank Group., 2021).
Kigali City is experiencing rapid urbanization with a population of 1 745 555 inhabitants (Kigali City, 2025), leading to an increase in traffic and frequent traffic congestion. As of 2018, the vehicle fleet in Kigali was dominated by imported used vehicles, with 95.2 % of the total fleet being older than 10 years (Miller and Jin, 2018; UN Environment, 2019).
2.2 In-situ measurements of PM and BC
A quadrupole Aerosol Chemical Speciation Monitor (Q-ACSM) from Aerodyne Research was used to measure the ambient concentration and composition of non-refractory PM1 (NR-PM1) in real-time (Ng et al., 2011). The ACSM uses aerosol mass spectrometry to speciate NR-PM1 components, including organic aerosol (Org), sulfate (SO4), nitrate (NO3), ammonium (NH4), and chloride (Chl). During sampling, ambient air is sampled through an inlet line equipped with a 1 µm cyclone to remove larger particles. The sample air is drawn into the ACSM through a in. stainless steel tube at a flow rate of 3 L min−1 using an isokinetic sampling line. The particles are then focused by aerodynamic lenses before impacting on the vaporizer, heated at ∼620 °C to generate gas-phase molecules that are then ionized by the filament. The ionized particles are then detected by the quadrupole mass spectrometer with unit mass resolution.
As described by Ng et al. (2011), aerosol mass concentrations are calculated from the difference between the sample mode and filter mode of the instrument, with each scan comprising 28 filter samples and 28 ambient samples, scanning over 32 s each to generate 30 min time resolution data for our analysis.
The instrument's aerodynamic lens was aligned, and the flow calibration was performed before starting the data collection in April 2023. Similarly, the relative ionization efficiency (RIE) calibration (Ng et al., 2011) was conducted at the beginning of the data collection period, during sampling, and again after 12 months of sampling, which covers the data duration. Time-dependent RIE values and ammonium nitrate (NH4NO3) response factors (RF) were applied to their respective sampling period. During all RIE calibrations, the response factor and RIE for both NO3 and SO4 remained stable within a 10 % variation across the four calibrations conducted during the campaign.
Ambient black carbon (BC) mass concentration was measured using a seven-wavelength (370, 470, 520, 590, 660, 880, and 950 nm) aethalometer model AE33, which shared the same sampling line as the ACSM. The reported total BC concentration values were determined based on light absorption at 880 nm.
The AE33 automatically corrects for filter loading effects using a dual-spot sample collection method; hence, the filter loading effect compensation was not applied (Magee Scientific, 2017). BC source apportionment to distinguish BC from biomass burning and BC from fossil fuel burning was performed using the method described by Sandradewi et al. (2008). This approach assumes that the total optical absorption at 950 and 470 nm is the sum of biomass burning and fossil fuel burning fractions.
PM2.5 mass concentrations were obtained from a Teledyne T640 PM2.5 mass monitor (Teledyne, 2016) installed at the U.S. embassy in Kigali. The embassy is located approximately 6 km from the University of Rwanda sampling site. Temperature, relative humidity, wind speed, wind direction, and rainfall data were obtained from a nearby automatic meteorological station owned by Meteo Rwanda located at lat −1 955 793 and long 30.05641 for the same period of time.
2.3 Data analysis
ACSM data were processed offline using ACSM local v1.6.2.1 in Igor Pro (Oregon USA WaveMetrics, 2024). Given that the instrument is equipped with a standard vaporizer, the particle Collection Efficiency (CE) was adjusted to 0.5, as recommended in the literature (Ng et al., 2011). The CE accounts for particle loss associated with shape-related collection losses at the vaporizer due to the inefficient focusing of non-spherical particles, particle losses resulting from bounce effects of larger particles in the ionization region, and aerodynamic inlet losses as a function of particle diameter (Huffman et al., 2005; Liu et al., 2007; Matthew et al., 2008; Ng et al., 2011). The RIE values for NH4 and SO4, along with the Response Factor (RF) for NO3, were automatically loaded into the instrument's data acquisition software and applied to the raw data after each calibration. These factors were also used during post-processing to ensure that the correction factors were consistently applied, ensuring accuracy in the final data analysis. To ensure the quality of the calibration and instrument performance, the total NR-PM1 was compared to the PM2.5 data obtained from the USA embassy T-640 (see Fig. S3).
Positive matrix factorization (Paatero and Tapper, 1994) and the PMF evaluation tool (PET v.3.06) were used to perform the source apportionment of the organic-only aerosol for the whole dataset. The PMF-derived source profiles were systematically selected based on the approach explained by Zhang et al. (2011).
3.1 NR-PM1, BC, and PM2.5 mass concentration, chemical composition, and seasonal variation
Figure 1 shows the temporal variations in weekly mean concentrations of PM1 components, including organic aerosols (Org), nitrate (NO3), sulfate (SO4), ammonium (NH4), chloride (Cl), and black carbon (BC). There is a clear seasonal variation in both speciated PM1 (NR-PM1+BC) and PM2.5 concentrations, with higher concentrations during the dry seasons (mean, for both JJA and DJF, ) than the rainy seasons (mean, for both MAM and SON, ; Fig. S4). In Kigali, at the urban background site, the annual mean PM1 was 31±15 µg m3 with an annual mean BC concentration of . At the U.S. Embassy in Kigali (PM2.5_UE in Fig. 1), the annual mean PM2.5 concentration was 41±23 µg m3.
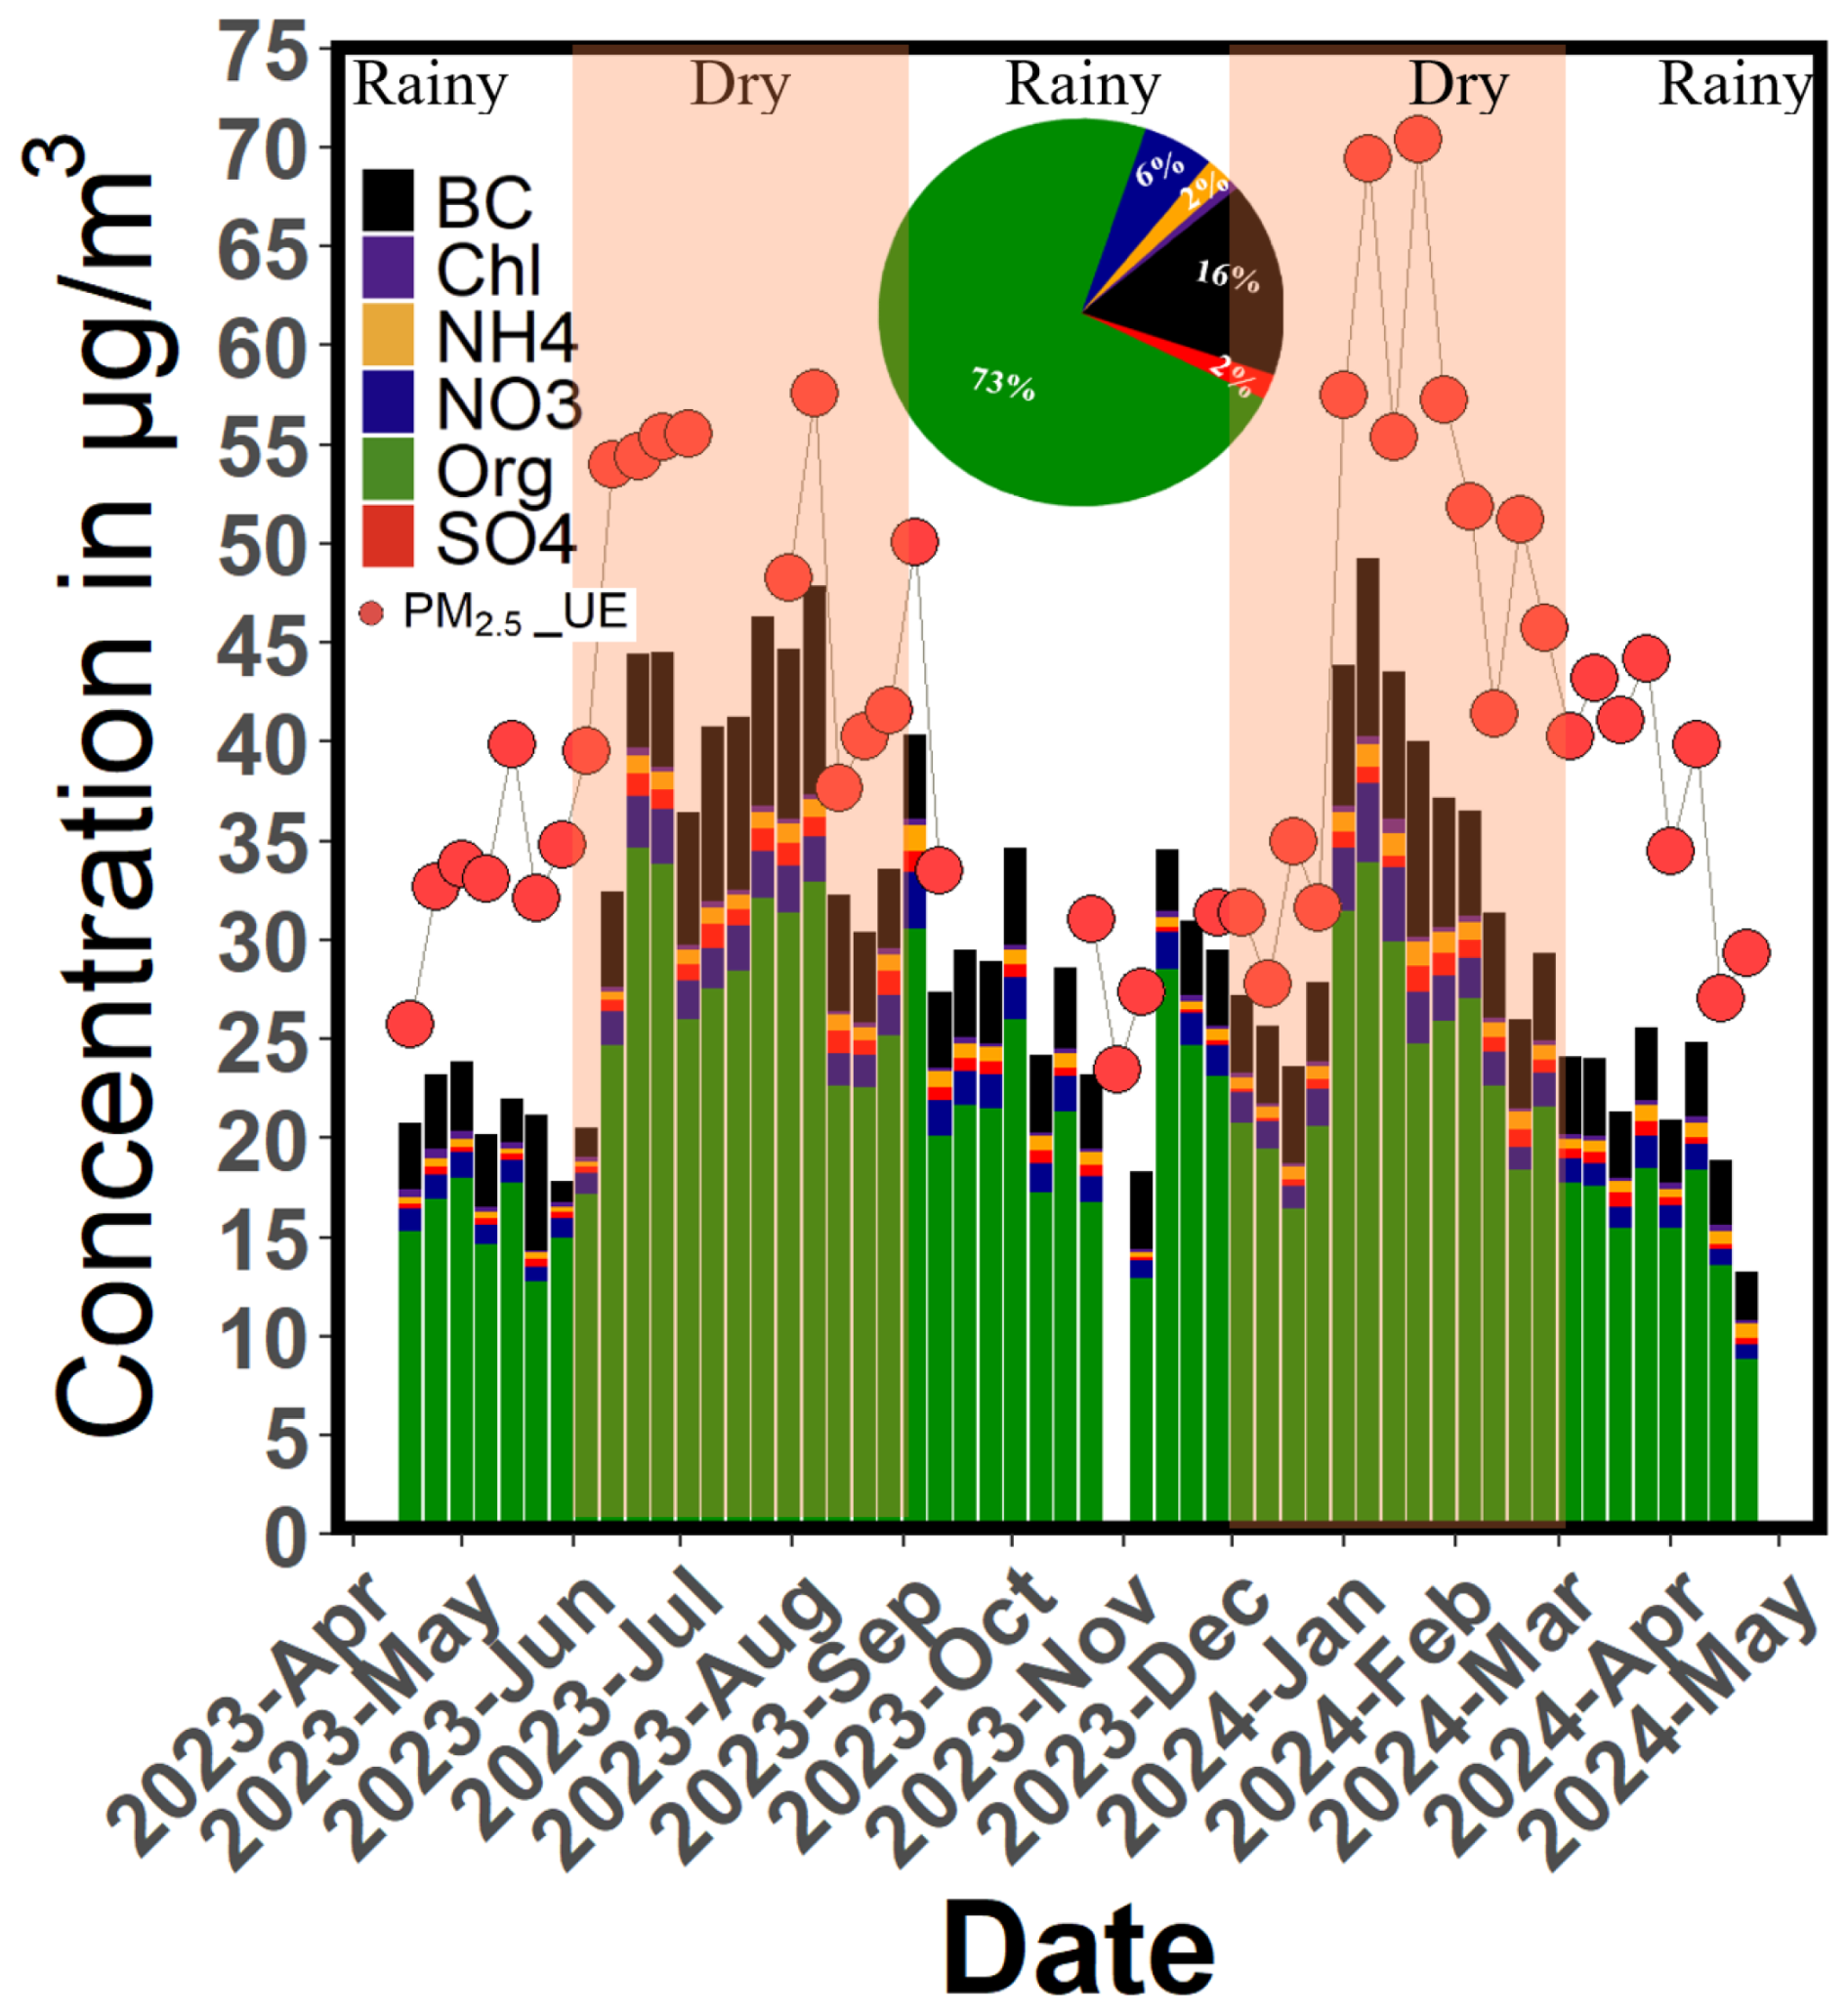
Figure 1Measured PM1 and PM2.5 in Kigali, Rwanda. Each stacked bar represents the weekly mean concentrations of NR-PM1 components (SO4, Org, NO3, NH4, Chl) and Black Carbon (BC). Red dots indicate PM2.5 concentrations measured at the U.S. Embassy, located about 6 km from the ACSM sampling site. The pie chart depicts the overall mean fractional contribution of the total PM1 mass loading (NR-PM1+BC). The shaded areas highlight the dry seasons in Rwanda, providing context for seasonal variations in particulate matter.
Concurrent measurements of speciated PM1 and PM2.5 in urban Kigali showed a strong correlation (R2=0.91) with a slope of 0.65 (See Fig. S3). Some of the mass differences between speciated PM1 and PM2.5 can likely be attributed to the impact of dust, which cannot be detected by the ACSM. In addition, site characteristics may play a role, as the US embassy site is classified as an urban near-road site compared to the UR/CST site, classified as an urban background site. The annual mean concentration of PM2.5 of 41 µg m3 is comparable with the mean PM2.5 concentration of 42.6 µg m3 reported by Gahungu and Kubwimana in the same city (Gahungu and Kubwimana 2022b). However, it was higher than the daily mean concentration of PM2.5 of 25 µg m3 reported by Kalisa et al. (2018) for a 3 month data span in both dry and rainy seasons (Kalisa et al., 2018) and comparatively higher than the nighttime filter-based measurements at the Rwanda Climate Observatory (Andersson et al., 2020; Dewitt et al., 2019; Kirago et al., 2022).
Organic aerosols (OA) dominate the PM1 composition, accounting for 73 % of the total mass loading, followed by black carbon (BC) at 16 %. Inorganic species collectively contributed 11 % of the total PM1, distributed as follows: NO3 at 6 %, SO4 at 2 %, NH4 at 2 %, and Cl at 1 %. The compositions are similar to the findings from a remote area in the same country by Kirago et al. (2022) (mean of all seasons: OM at 72 %, BC at 4.5 %, SO4 at 12.6 %, NO3 at 4 %, and NH4 at 5.2 %). However, the SO4 fraction was 6× lower, and the BC fraction was 3.5× higher at this urban site compared to the remote site.
The high contribution of OA to PM1 mass was also recorded in previous studies in African cities. For example, aircraft measurements in South Africa showed that OA contributed 53 % of PM1 mass, though there was a larger contribution of sulfate (27 %) (Brito et al., 2018). Additionally, filter-based measurements in Dar es Salaam, Tanzania, showed that OA accounted for 68 % and inorganic species accounted for 24 % of PM1 mass (Mkoma et al., 2009).
OA dominates the PM1 composition across both rainy and dry seasons with a relatively stable fractional contribution: 74 % on average during the dry season (mean of JJA and DJF) and 71 % during the rainy season (mean of MAM and SON). A similar seasonal composition was also recorded at a remote site in the same country, with 72 % and 69 % as the mean of the dry and rainy seasons, respectively (Kirago et al., 2022).
3.2 Diurnal variations in PM1 mass and composition
The seasonal average diurnal variation in PM1 components (NR-PM1 and BC) is presented in Fig. 2; and the annual average diurnal patterns are shown in Fig. S4. In all four seasons, the diurnal patterns show the interplay of emissions and atmospheric processes on pollutant concentrations. These include traffic emissions from busy roads near the sampling site, with 85 % of vehicles in Kigali being over 20 years old (MINEFRA, 2018a; NIS Rwanda, 2021; Niyibizi et al., 2015; UN Environment, 2019).Additionally, emissions from solid fuels contribute significantly, as biomass energy accounts for approximately 85 % of the total energy used for cooking in Kigali (MINEFRA, 2015, 2018b; UN Environment, 2019), including emissions from restaurants in the downtown area and densely populated residential areas near the station. Diurnal variability is also influenced by meteorology, including changes in the planetary boundary layer height (PBLH) that is expected to be shallower during night and morning time (06:00 p.m.–07:00 a.m.) and expand during the daytime, and hence controls the particle mixing volume and concentration (Engeln and Teixeira, 2013; Nyeki et al., 1998).
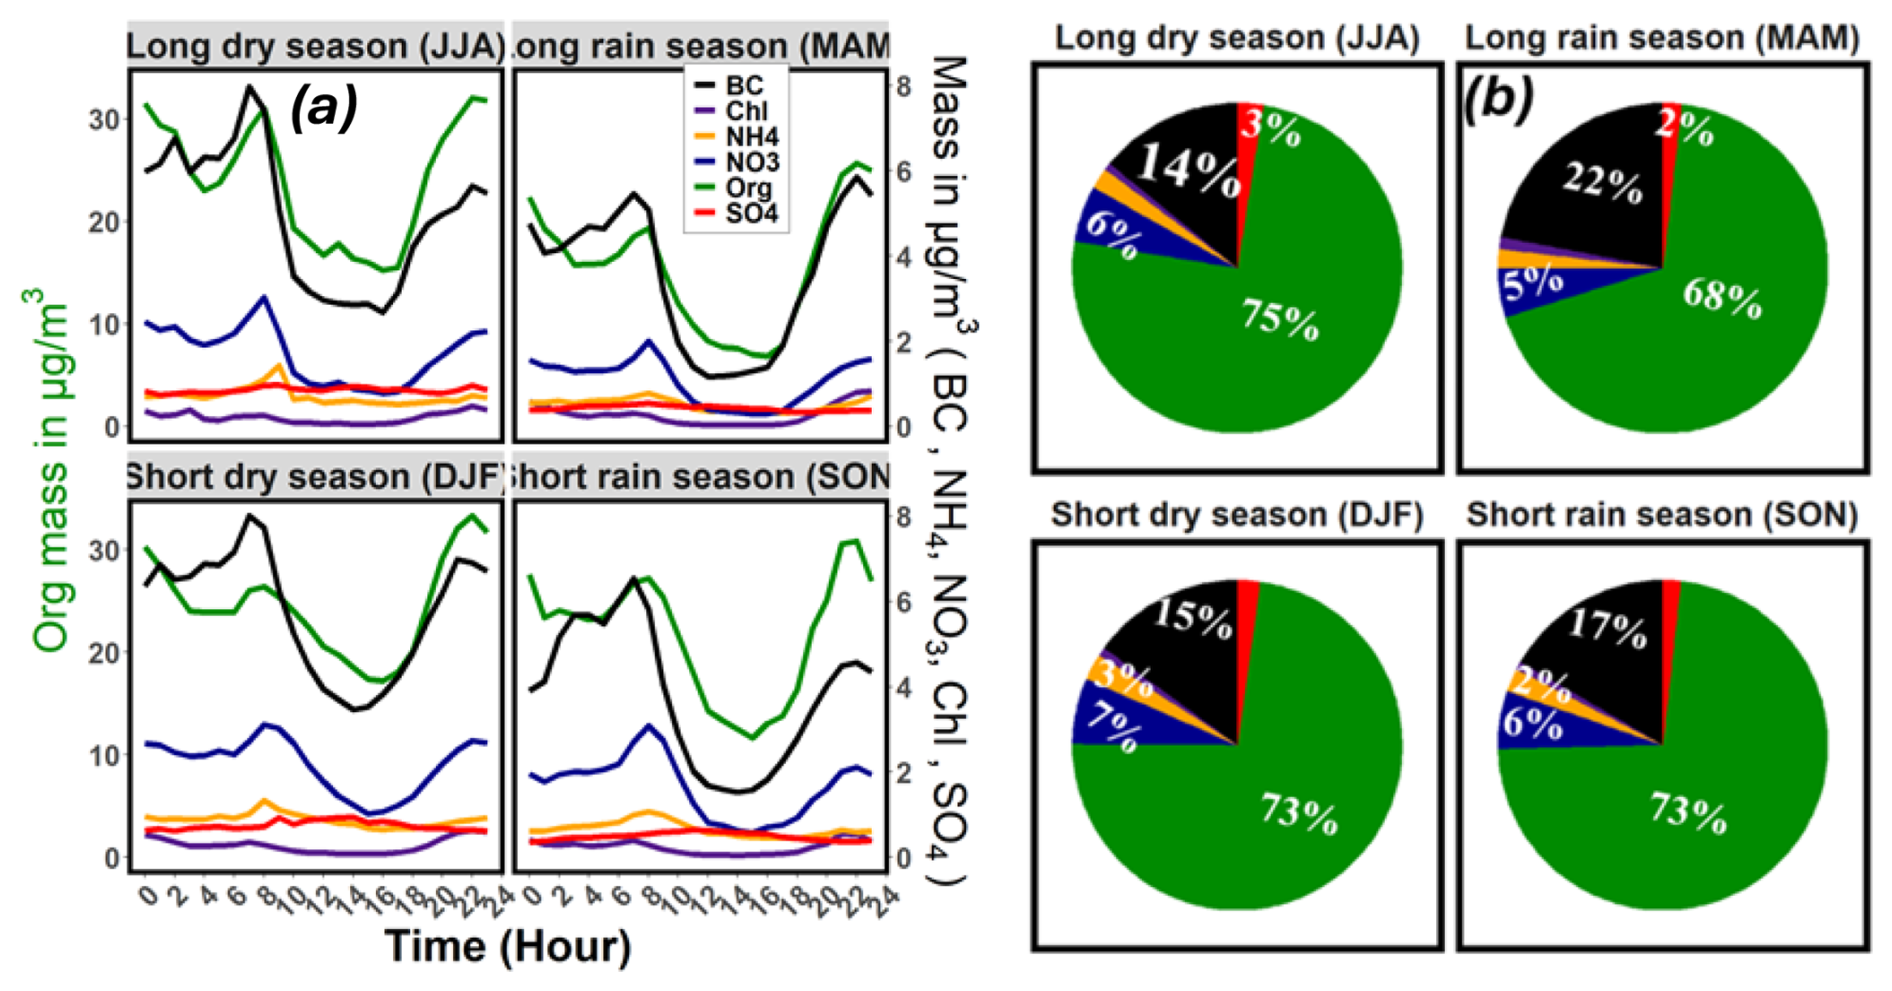
Figure 2Seasonal (JJA, SON, DJF, and MAM) diurnal profiles of NR-PM1 components (Chl, , , , Org), and BC (a). Organic aerosol (Org) concentrations are shown on the left y axis, while all inorganic species are plotted on the right y axis. (b) shows the season PM1 compositions.
OA, BC, and NO3 all exhibit an early morning peak (06:00 a.m.–09:00 a.m.), a midday decrease, and a second evening peak (06:00 p.m.–10:00 p.m.). The morning peak coincides with increased anthropogenic activities, likely associated with rush hour traffic and cooking activities in the morning. The midday dips in particle concentrations can be attributed to enhanced atmospheric mixing and reduced anthropogenic activities. Daytime increases in the planetary boundary layer height increase the mixing volume and hence reduce the particle concentration during the daytime (Subramanian et al., 2020). Additionally, higher wind speeds during the daytime contribute to particle dilution (Fig. S2b). The evening peak is likely due to a combination of decreasing boundary layer height (von Engeln and Teixeira, 2013) after sunset (typically around 06:00 p.m.) and the evening rush hour.
The overall intra-day variations in concentrations of OA, BC, and NO3 are large. Annually averaged, OA concentrations are ∼20–25 µg m3 from midnight to 10:00 a.m. but fall to ∼12 µg m3 in mid-afternoon. Similarly, BC concentrations change from ∼7 to ∼2.5 µg m3 over the same period (see Fig. S4). Across all seasons, organic components dominate PM1, with their proportion peaking during the long dry season (75 % of total PM1) and being slightly lower during the short rainy season (73 % of total PM1). Black Carbon (BC) is the second-largest component, with its contribution ranging between 15 %–22 %. The highest BC composition was observed during the long rainy season, showing a similar trend to Abidjan, Côte d'Ivoire (Anand et al., 2024). The diurnal patterns during the dry seasons show a higher magnitude on an hourly basis compared to those in the rainy season. However, SO4 remained relatively constant across all four seasons. The JJA season exhibits the highest morning and evening peaks, reflecting the influence of morning rush hour emissions, a shallower planetary boundary layer height, and the absence of major PM removal processes such as precipitation scavenging.
The shape of the diurnal patterns offers insight into potential emission sources and aerosol processing. The morning peak in BC occurs at 07:00 a.m. This is one hour earlier than the corresponding morning peak in both OA and NO3. There are a few possible reasons for the earlier peak in BC. One is that the anthropogenic source mix changes throughout the morning, with the relative impacts of cooking and traffic changing over the period from ∼06:00–10:00 a.m. A second possibility is that the slight delay in the OA and NO3 peaks reflects the importance of secondary OA and nitrate formation, and the one-hour delay in their peaks relative to BC is the result of the time needed for chemical conversion from precursor gases to PM components.
OA, BC, and NO3 all have contributions from local emissions and, therefore, exhibit strong intra-day patterns associated with anthropogenic activities. SO4, on the other hand, has a much flatter diurnal profile. There is no morning increase in sulfate, though there is a slight midday increase from 10:00 a.m. to 06:00 p.m. This suggests that SO4 concentrations in Kigali are regional, reflecting the lack of local SO4 emissions or SO2 sources that would contribute to daytime SO4 formation. For example, there are no coal-fired power plants in Rwanda or the nearby areas of neighbouring countries (Global Energy Monitor, 2025). Back trajectory analysis (Fig. S12) showed that the emissions from the active stratovolcano Nyiragongo, which erupted in June 2021 and is located at 1.52° S latitude and 29.25° E longitude in the Democratic Republic of Congo (DRC), do not move toward Kigali (Smithsonia Institute, 2025).
3.3 Average mass spectrum and contribution of tracer ions
Figure S7 shows the campaign-average mass spectrum (MS) measured by the ACSM. The most abundant ions in the mass spectrum are 18 (H2O+) and 44 (). 44 is commonly used as a tracer for aged OA (Ng et al., 2011). It accounts for 10.5 % of the measured organic aerosol mass, whereas 18 is for particle water contents.
Other prominent tracer ions in the mass spectrum include 43, which has contributions from both , associated with fresh emissions, and C2H3O+, linked to secondary organic aerosol. 43 contributed 7 % of the OA mass in Kigali. Additional tracer ions, such as tracers for urban fresh traffic emissions (e.g. 57 ()) and fresh biomass burning emissions ( 60, ()) (Ng et al., 2011), together contribute approximately 3.5 % of the average PM1 mass loading.
Inorganic species also contribute significantly to PM1, with notable nitrate peaks at 30 and 46, sulfate at 48 and 64, and ammonium at 16 and 17. Small peaks at 35 and 36 indicate that chloride makes a minimal contribution (see Fig. S7).
NO3 accounts for 6 % of the total PM1 mass and consists of both organic and inorganic nitrate species. The ratio of 46 to 30 is often used to quantify the relative amounts of inorganic and organic nitrate using Eq. (1) (Farmer et al., 2010).
Here, is the mass fraction of the total ACSM nitrate that is organic, R is the ratio of 46 to 30, Rambient is a calculated ratio using time series ambient data, is calculated ratio using periodic instrument relative ionization efficiency (RIE) calibration data, whereas can be determined from atomizing laboratory standards of organic nitrates or from literature values. A value of propose by Farmer et al. (2010) showed a good estimate of and has been widely adopted in subsequent studies (Brito et al., 2018; Farmer et al., 2010; Werden et al., 2023). In addition, can be estimated from field measurements using the ratio-of-ratios (RoR) method, defined as . A mean value of was proposed by Day et al. (2022). The advantage of the ratio-of-ratios approach is that it accounts for instrument-to-instrument variations in both and .
Using the above ratio method on the ambient measurement, the mean calculated ratios were , , and (falling in the range of –0.2 found in the US by Xu et al. (2015) and can be rounded to 0.1 as used by Brito et al. (2018)). We observe a mean which is in range with the value reported by Day et al (2022). Figure S5 shows the diurnal profile and time series variation in calculated organic nitrate fraction. The calculated ambient ratio (blue lines in Fig. S5) method attributes the particle organic nitrate as ∼61 % of the total nitrate, assuming yields an organic nitrate fraction of ∼70 %, and the ratio-of-ratios (RoR=2.75) yields near 100 %. The presence of a slight peak in NH4 during the morning rush hour (Fig. 2) suggests that at least a portion of the nitrate is inorganic, and therefore, the from the ratio-of-ratios approach might be an overestimation.
The annual average diurnal profile of four OA tracer ions ( 43, 44, 57, and 60) is shown in Fig. 3. The mass concentrations of all four tracer ions show a similar diurnal pattern as the total OA mass (shown in Figs. 2 and S4): there is a morning increase in concentration, followed by an afternoon minimum, and concentrations rise again in the evening. While all four of these ions show the same general pattern, the slight differences in their behavior provide insights into PM sources and chemical processing in Kigali.
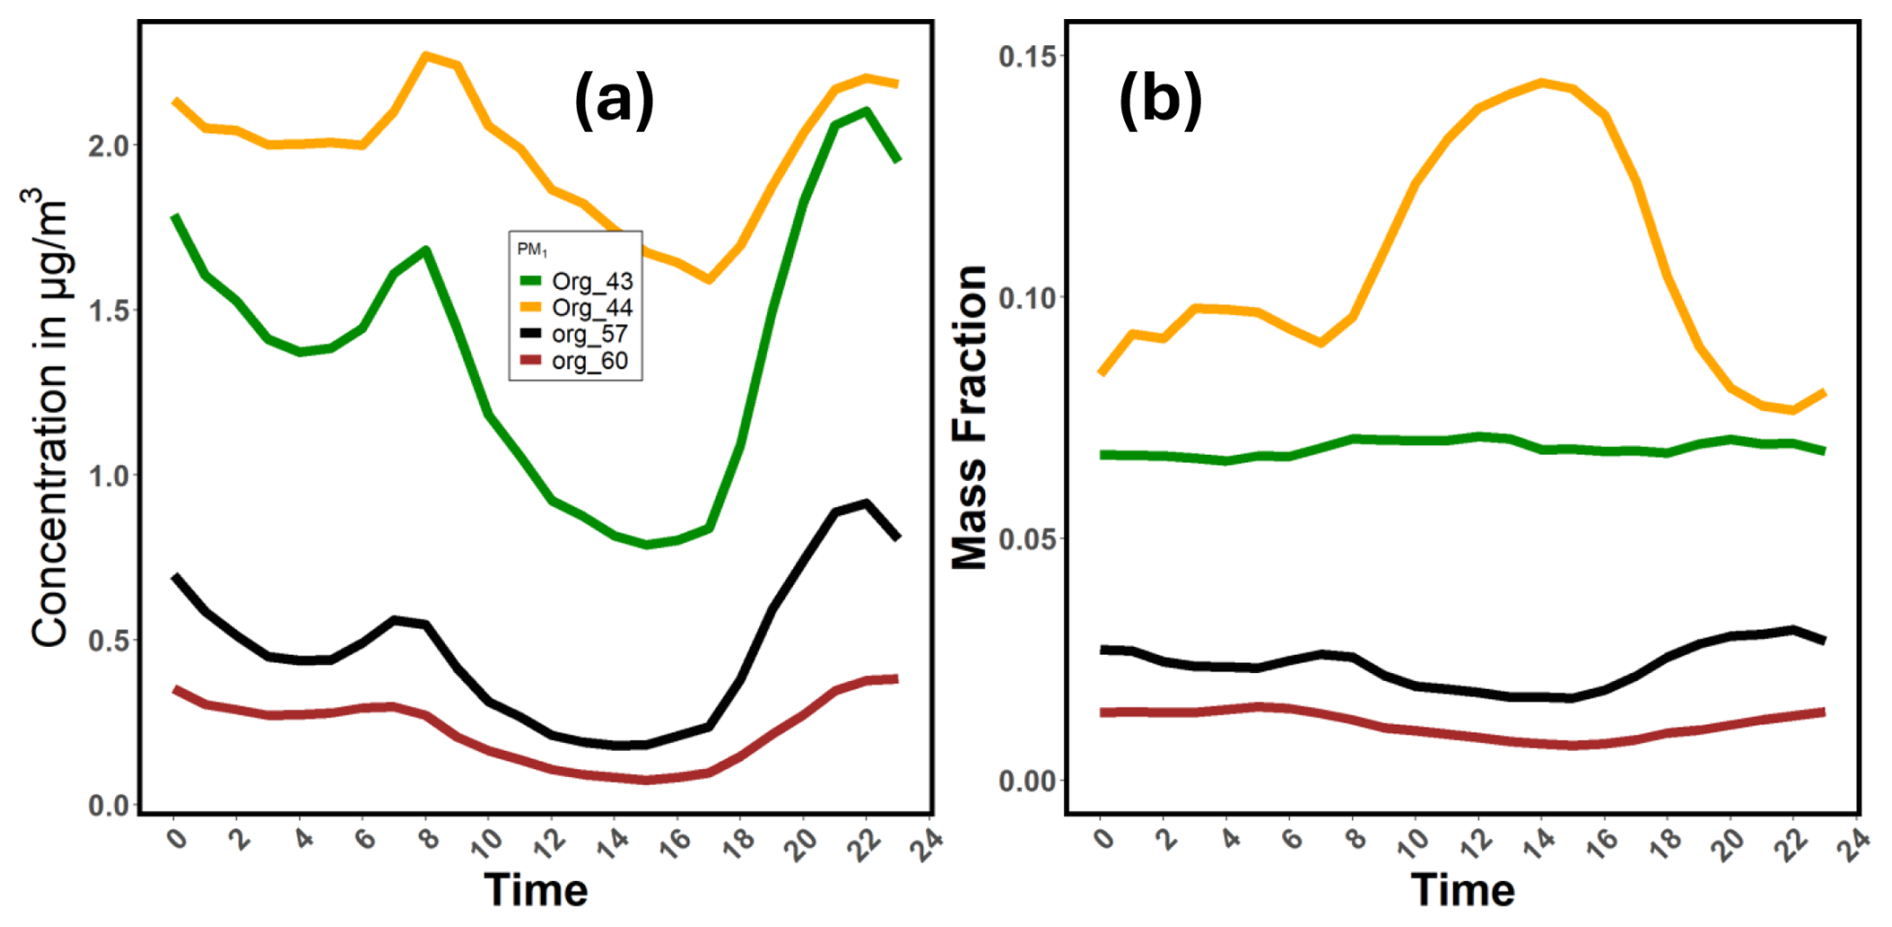
Figure 3Diurnal patterns of individual tracer ions: (a) absolute mass concentrations and (b) mass fractions.
60 is a tracer for biomass burning emissions. The morning maximum concentration occurs from 06:00–07:00 a.m. and is 1.5× higher than the minimum concentration observed from 02:00–04:00 a.m. Many people in Kigali (85 %) use biomass fuel for cooking (MINEFRA, 2015). This morning's increase in 60 is likely from cooking activities before the start of the workday.
57 is commonly used as a tracer for fresh fossil fuel combustion emissions, especially from traffic. The morning peak in 57 mass concentration (0.6 µg m−3) occurs at 07:00 a.m., with slightly lower concentrations at 08:00 a.m. This mirrors the diurnal pattern of BC (Fig. 2), which also has a morning maximum at 07:00 a.m. (6.8 µg m−3 see Fig. S4). The high concentrations of both BC and 57 suggest that the morning rush hour is most intense from 07:00–08:00 a.m. The morning peaks in BC and 57 occur slightly after the morning peak in 60 (0.3 µg m−3); this suggests that while both cooking and traffic are important sources in the morning hours, cooking activity starts slightly before traffic volume increases.
44 is a tracer for oxygenated secondary organic aerosol (SOA). 44 also has a morning peak. The morning peak in 44 (2.3 µg m−3) occurs at 08:00–09:00 a.m., after the earlier morning peaks in 60 and 57. This is suggestive that the morning increase in 44 is due to the rapid formation of SOA and that the vehicle and biomass-burning emissions associated with anthropogenic activities are important sources of SOA precursors. Traffic emissions are a well-known source of SOA precursor (Gentner, 2016). This is especially true for older vehicles, poorly maintained, or otherwise higher-emitting than new vehicles with modern emission control systems (Sitati et al., 2022).
43 is a marker for both primary emissions () and SOA (C2H3O+). Our quadrupole ACSM has unit mass resolution and, therefore, cannot separate these isobaric ions. The diurnal pattern of 43 reflects its dual nature as a marker of primary and secondary OA in Q-ACM. The concentration of 43 rises rapidly from 06:00–07:00 a.m., coincident with the morning increase in the concentration of 57. This initial increase in 43 concentration is likely associated with fresh vehicle emissions. There is a further increase in 43 concentration from 08:00–09:00 a.m., coincident with the rapid increase in 44 concentration. This further increase in 43 is likely due to SOA formation from vehicles and biomass burning emissions.
The temporal patterns of the four marker ions shown in Fig. 3 provide insight into sources and atmospheric processes. They all decrease during the afternoon. As with the PM components shown in Fig. 2, this decrease is likely due to a combination of changing anthropogenic emissions (e.g. less traffic outside of the morning rush hour), increasing boundary layer height, and faster winds. Concentration rises again in the evening due to a combination of a sinking boundary layer after sunset and evening traffic and cooking activities.
While concentrations of all four tracer ions decrease during the day, the decrease in 44 is much smaller than for the other ions. For example, the ratio of the morning peak (07:00 a.m.) to the afternoon trough (02:00 p.m.) in 57 is ∼3.3, and the ratio in 44 concentration (08:00 a.m. vs. 04:00 p.m.) is This is likely due to the sustained formation of SOA throughout the day. Days in Kigali are consistently sunny (Fig. S2), and there is likely a large pool of reactive organic gases available to form SOA. Thus, the impact of boundary-layer driven dilution is larger for ions associated purely with primary emissions (e.g. 57) than for ions associated with SOA.
Concentrations of 43, 57, and 60 are all higher in the evening hours (∼08:00–11:00 p.m.) than during the morning rush hour. The pattern of traffic and cooking emissions is also reversed in the evening compared to the morning. The late-day increase in the concentrations of 57 and 43 precedes the increase in 60. This is consistent with expected activity patterns, as people travel home from work before cooking at night.
The mass fractions of each tracer ion, shown in Fig. 3b, offer additional insight into the competition between emissions, chemistry, and dilution. The diurnal variation of the mass fraction of 57 in OA (f57) is similar to the trend in 57 mass. There are morning and evening peaks, with a slightly higher peak in the evening and a midday trough. The ratio of the peaks to the trough is smaller for f57 than for 57 mass (1.5 and 3.3 for f57 and 57, respectively). This reflects the large role that boundary layer dilution plays on mass concentrations and suggests that traffic activity, and hence emissions, remain high throughout the day.
The diurnal pattern in f44 shows a different trend. It rapidly increases after 07:00 a.m. and peaks at f44=0.14 at 02:00 p.m. The diurnal trend in f44 thus indicates that there is rapid formation of SOA, especially in the hours immediately following the high emissions associated with the morning rush hour. After 02:00 p.m., f44 gradually decreases as solar intensity diminishes until sunset at 06:00 p.m. Taken together, Fig. 3a and b suggest that there is strong and sustained SOA production throughout the day and that SOA production is fast enough to at least partly counteract the large and rapid boundary layer-driven dilution that occurs during midday.
The diurnal profile of the normalized contribution of 43 (f43) remains relatively flat throughout the day. This is a result of the combined role of 43 as an indicator for primary and secondary OA. is emitted during the morning rush hour, and its concentration decreases with the expansion of the boundary layer and oxidation chemistry. C2H3O+ increases due to SOA formation through photochemistry. These opposing behaviors result in a relatively constant f43 throughout the day.
3.4 PM Source Apportionment
We performed PMF source apportionment of the OA-only PM1 masses using PMF2.exe and PMF Evaluation Tool version 3.08. The number of factors and source profiles were systematically selected and validated following the recommendations of Ulbrich et al. (2009). The most interpretable solutions were chosen based on (Q: sum of squared scaled residuals), changes in the total sum of squared scaled residuals with an increasing number of factors, normalized fractional contributions of individual source profiles, and factor spectra comparisons with standard AMS mass spectra (Zhang et al., 2011). Section S4 in the Supplement shows more details on the PMF analysis, including a comparison of three vs. four-factor solutions.
Figure 4 shows the mass spectral profiles of deconvolved organic-only PM1 source apportionment using PMF. Three factors, Oxygenated Organic Aerosol (OOA), Hydrocarbon-like Organic Aerosol (HOA), and Biomass-Burning Organic Aerosol (BBOA) were identified (Fig. 4). The mass spectrum of HOA is characterized by the pronounced hydrocarbon ion series of CnH2n+1 and CnH2n−1, consistent with primary emissions from traffic and fossil fuel combustion (He et al., 2022; Zhang et al., 2011). Important peaks in this mass spectrum include 41, 43, 55, 57, 69, and 71 The HOA source profile has a high f57 (=0.095), further supporting the assignment of this factor to primary hydrocarbon sources.
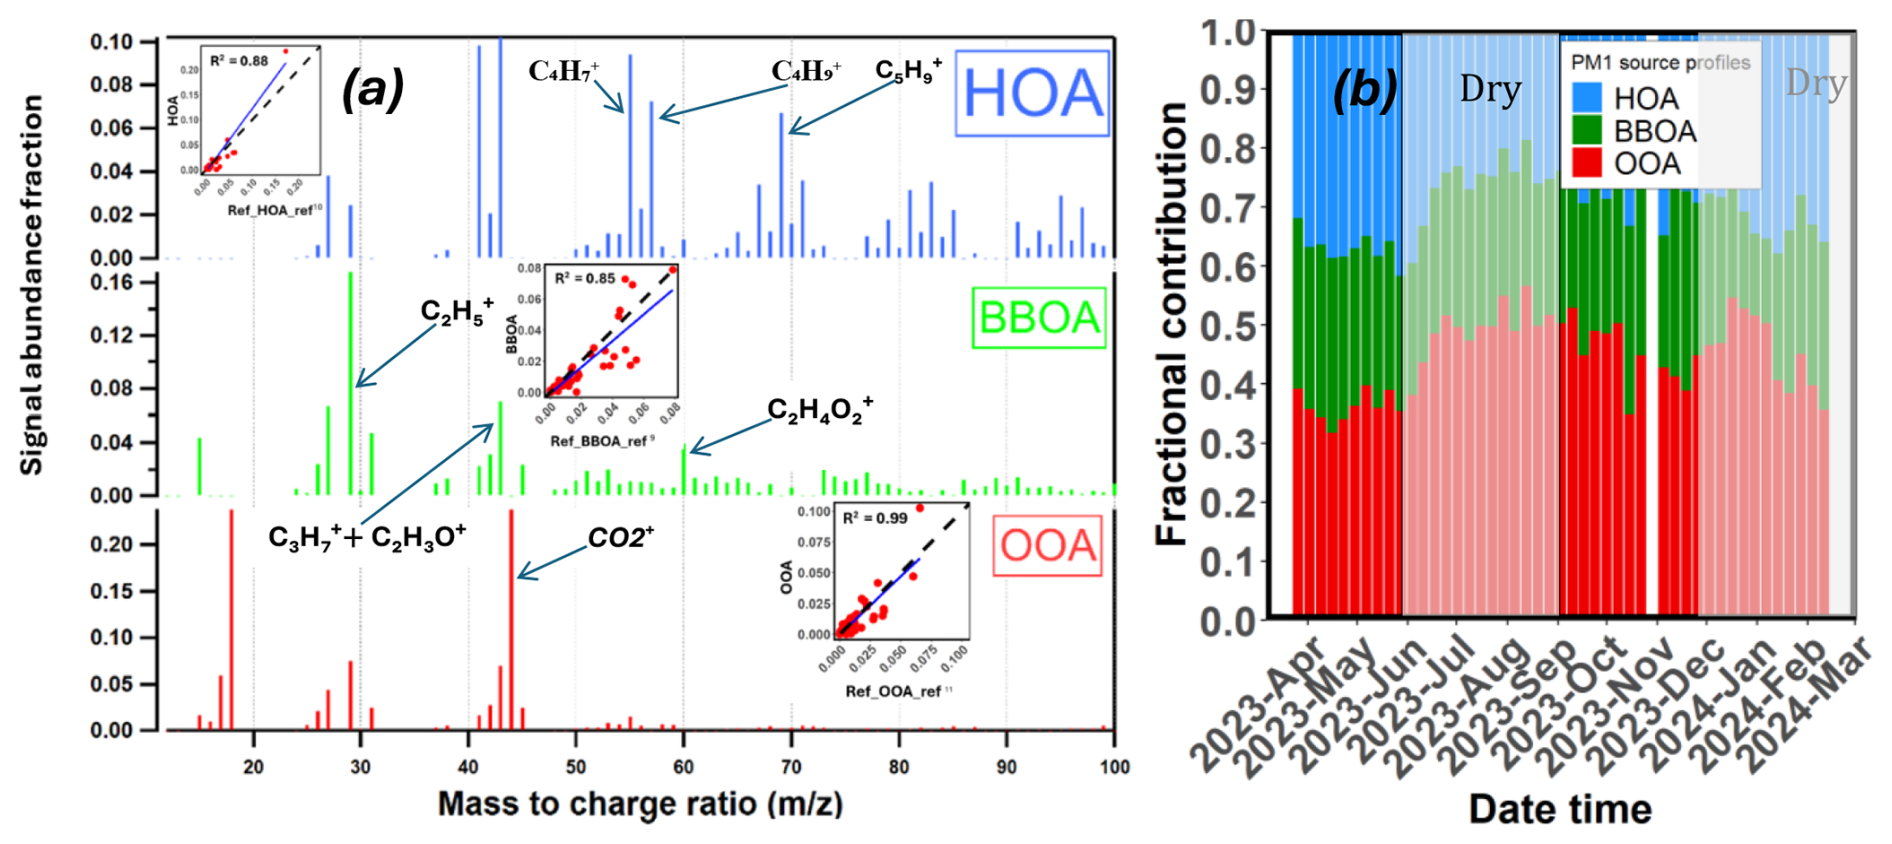
Figure 4PMF source profiles and factor contriutions: (a) PMF factor profiles for HOA, BBOA, and OOA. The inset scatter plots show the comparison of the PMF source profiles with reference source profiles. (b) Seasonal variations in source fractional contributions, with each bar representing the mean relative fractional contribution of the three sources for each week. The shading indicates the two dry seasons.
In the BBOA mass spectrum, the most prominent peak is at 29 (f29=0.17), likely indicating small oxygenated fragments associated with the incomplete combustion of biomass. Another significant peak is at 60 (f60=0.035), which is a widely recognized tracer for levoglucosan-like compounds, supporting the biomass burning origin. The peak at 43 (f43=0.08) reflects mixed hydrocarbon and oxygenated fragments.
The OOA mass spectrum is characterized by the large abundance of 44 (f44=0.24), indicative of aged, highly oxidized organic material dominated by fragments. This ion is a well-established marker for secondary organic aerosol (SOA) formation (Matthew et al., 2008; Ng et al., 2011; Zhang et al., 2011).
The HOA, BBOA, and OOA factor profiles show strong similarity to published profiles from ambient deconvolved spectra in other cities, indicating consistency with existing data. When compared to the reference mass spectra (AMS Spectral Database (Unit Mass Resolution), 2025), all three factors exhibited strong correlations. The HOA factor had an R2 value of 0.88 and a slope of 0.85, while the BBOA factor achieved an R2 of 0.85 and a slope of 0.94. Similarly, the OOA factor profile showed an exceptionally strong correlation with the reference spectra, with an R2 value of 0.99 (see Fig. S10).
PMF results indicate that there are large contributions from both primary and secondary OA. Over the course of the year, the mean contributions of each factor are 45 % OOA, 32 % HOA, and 23 % BBOA. Figure 4b further shows that there is little seasonal variation in source strengths. During the dry season, the mean composition is 47 % OOA, 23 % BBOA, and 30 % HOA, vs. 41 % OOA, 28 % BBOA, and 31 % HOA during the rainy season. This suggests that the changes in PM1 mass between the dry and rainy seasons (Fig. 1) are due more to changes in particle loss (e.g. via wet deposition) and chemical production rather than shifts in primary emissions.
The diurnal pattern of the source strengths is shown in Fig. 5. As expected, they mirror the trends in tracer ions shown in Fig. 3. The OOA factor peaked during the daytime, mirroring f44, underscoring the important role of photochemistry and secondary organic aerosol production at the site. OOA concentrations are less impacted by dilution than HOA and BBOA due to strong daytime SOA production (Figs. 5a and S13).
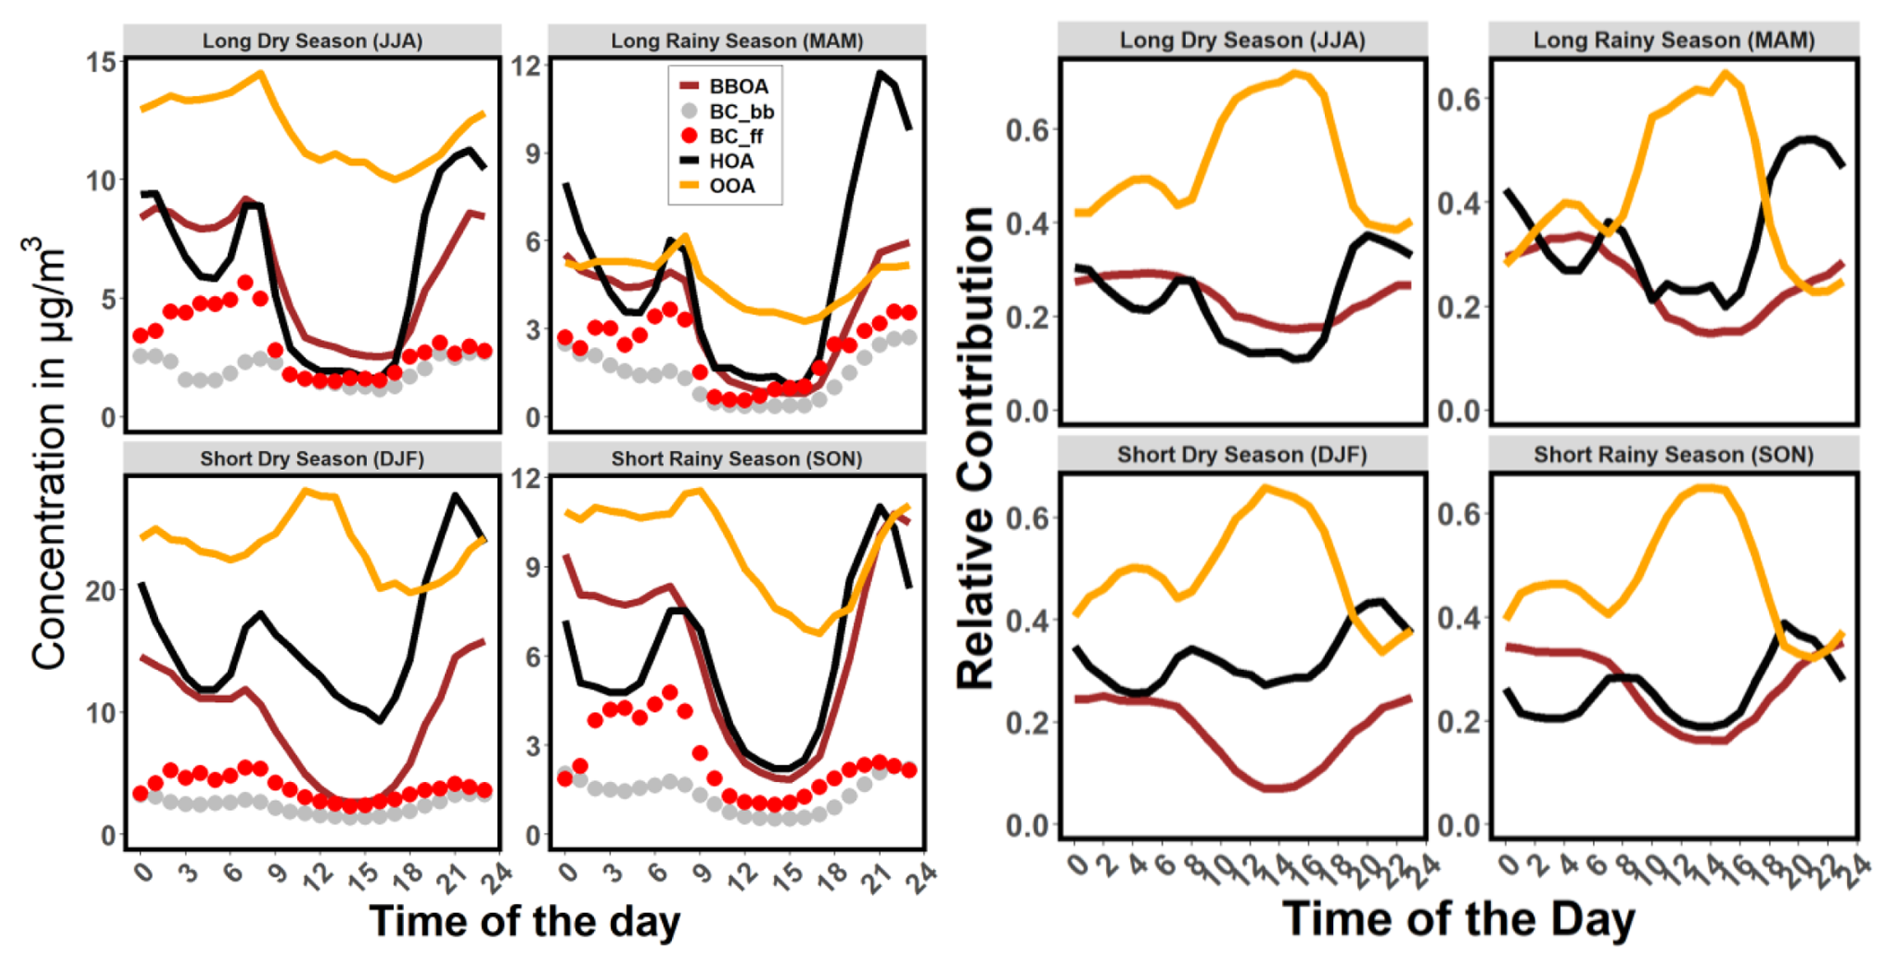
Figure 5Seasonal diurnal patterns of PMF-resolved organic-only PM1 sources and BC components (BCBC_ff and BC_bb), presented as absolute mass concentrations (a) and relative PMF source contributions (b).
Both BBOA and HOA factors show morning and evening peaks, which mirror anthropogenic activities (Fig. 5a). The morning peak in BBOA occurs before the morning peak in HOA (except during the MAM season, when they are coincident), associated with rush hour traffic. In the afternoon, the trend is reversed, with HOA concentrations increasing and reaching an evening peak before BBOA. For both BBOA and HOA, the evening peak in concentrations is larger than the morning peak in all seasons. Throughout most of the day, concentrations of HOA are smaller than concentrations of OOA. However, during the evening peak from ∼06:00–10:00 p.m., HOA concentrations are larger than OOA concentrations.
Figure 5b shows the fractional contribution of each source factor to the total OA for each season. In all seasons, OOA is the most abundant factor at nearly all hours of the day. The OOA fraction rises dramatically during daylight hours from ∼40 % of OA mass overnight to >60 % during the day, consistent with strong production of secondary OA. The fractional abundance of HOA shows strong diurnal peaks associated with the morning and evening rush hours.
BC contributes ∼16 % of the PM1 mass. Using the algorithm developed by Sandradewi et al. (2008), BC was decomposed into BC from fossil fuel combustion (BC_ff) and BC from biomass burning (BC_bb) fractions (Sandradewi et al., 2008). The annual mean BC measured in Kigali consists of 59 % BC_ff and 41 % BC_bb. Figure S6 shows that there is minimal seasonal variation in BC source apportionment. Across all seasons, BC_ff contributed 55 %–63 % of the total BC mass loading, with BC_bb contributing 37 %–45 % of the observed BC mass. These results are contrary to the BC composition recorded at the Rwanda Climate Observatory (RCO), which is located in a remote area. There, BC was 8 %–13 % BC_ff and 87 %–92 % BC_bb (Andersson et al., 2020; Kirago et al., 2022). This difference may be attributed to the site characteristics, where RCO is a remote site compared to the measurement at this urban site, which is likely to be influenced by the anthropogenic emissions from cooking and traffic.
The diurnal patterns of both BC_ff and BC_bb are shown alongside the PMF analysis in Fig. 5a. Overall, the diurnal patterns of BC_ff and BC_bb are similar to the diurnal patterns of HOA and BBOA, respectively. The BC_ff component, represented by the red markers, exhibits pronounced peaks during the morning (06:00–09:00 a.m.) and evening (05:00–09:00 p.m.) hours, corresponding to increased vehicular emissions during rush hours under the influence of a shallower planetary boundary layer. In contrast, the BC_bb component, depicted by the grey markers, shows more consistent levels throughout the day, with slight increases observed during the late evening (08:00–10:00 p.m.) and early morning (06:00–10:00 a.m.) hours.
There was a positive correlation between hourly BC and BBOA (R2=0.86), BC_bb and BBOA (R2=0.86), and BC and 60 (R2=0.94). Similarly, the HOA factor showed a linear relationship with BC (R2=0.73), BC_ff (R2=0.61), and 57 (R2=0.95) (see Figs. S10 and S11), indicating significant contributions from fossil fuel combustion and biomass burning to the total PM mass at the site.
While there is limited data on air pollution sources in other East African countries, our estimate that traffic emissions (HOA + BC_ff) contribute approximately 34 %–38 % of Organic PM1 is consistent with the past filter-based source apportionment studies in the region. For example, in Mbarara, Uganda, a neighbouring country of Rwanda, elemental PM2.5 composition analysis and PMF revealed large contributions of traffic emissions and biomass burning, contributing 36 % and 28 % of the total PM2.5 mass, respectively (Onyango et al., 2024). In Nairobi, Kenya, Gauta (2014) reported that traffic-related emissions accounted for 39 % of the total PM2.5 mass (Gaita et al., 2014).
In Western African countries, primary organic aerosols (POA) are also major contributors to PM2.5 mass. For instance, in Bamako, Mali, POA contributes 60 %–65 % of the total PM2.5 mass. Similarly, in Dakar, Senegal, traffic emissions (including motor vehicle tailpipe emissions and resuspended road dust) account for 45 %–49 % of the total PM2.5 mass loading (Environment, 2018; UN Environment, 2019).
3.5 Car-free day and community work initiatives' impact on PM
Different countries in Eastern Africa are implementing various measures to reduce PM emissions. For example, in the transportation sector, Rwanda has adopted electric mobility policies to reduce traffic-related PM emissions (Rwanda, 2021). A 2021 strategic paper on electric mobility adaptation by the Ministry of Infrastructure (Rwanda, 2021) outlines import and excise duty exemptions on electric vehicles (EVs), spare parts, investments in charging infrastructure, and access to high-occupancy vehicle lanes for EVs. Additionally, this strategy applies to a carbon tax on high-emission vehicles (old petrol-powered vehicles) to discourage the use and importation of older and polluting vehicles. This strategy introduced tax exemptions on LPG to improve the affordability and adoption of EVs. To enhance compliance, the government of Rwanda has established motor vehicle inspection centers, requiring commercial vehicles to undergo biannual inspections and personal vehicles to be inspected annually. This initiative ensures that older, high-PM-emitting vehicles are monitored and regulated.
Rwanda also enforces car-free days in Kigali. These occur on first and third Sunday each month from 08:00–11:00 LT. Research by Subramanian et al. (2020) showed that Rwanda's car-free initiatives, such as car-free zones and car-free days, reduced PM2.5 concentrations by 7–12 µg m−3 and black carbon (BC) by 1 µg m−3, demonstrating the effectiveness of vehicle emissions reductions in PM concentrations.
Rwanda also has a monthly community work initiative called Umuganda (Uwimbabazi, 2012). Umuganda occurs on the last Saturday every month from 08:00–11:00 LT. During Umuganda, there is a severe reduction in on-road traffic and commercial activities, as Rwandans use this time to focus on community cleaning and improvement projects.
Figures 6 and 7 examine the impacts of car-free days and Umuganda on PM1 and PM2.5 concentrations. For this analysis, we divide the day into three broad time periods: during the car-free or Umuganda period (08:00–11:00), before the car-free or Umuganda period (00:00–07:00), and after (11:00–23:00). On car-free days, we observe reductions of 4±1.5 µg m3 in NR-PM1 (−17 % relative to regular Sundays) and 3±1 µg m3 in PM2.5 (−6 %) during the car-free period. This is smaller than the 7–12 µg m3 PM2.5 decreases reported by Subramanian et al. (2020) for the same city. The car-free days also had lower concentrations of PM1 (until 17:00 LT) and PM2.5 (until 21:00 LT), compared to regular Sundays, after the car-free period ended.
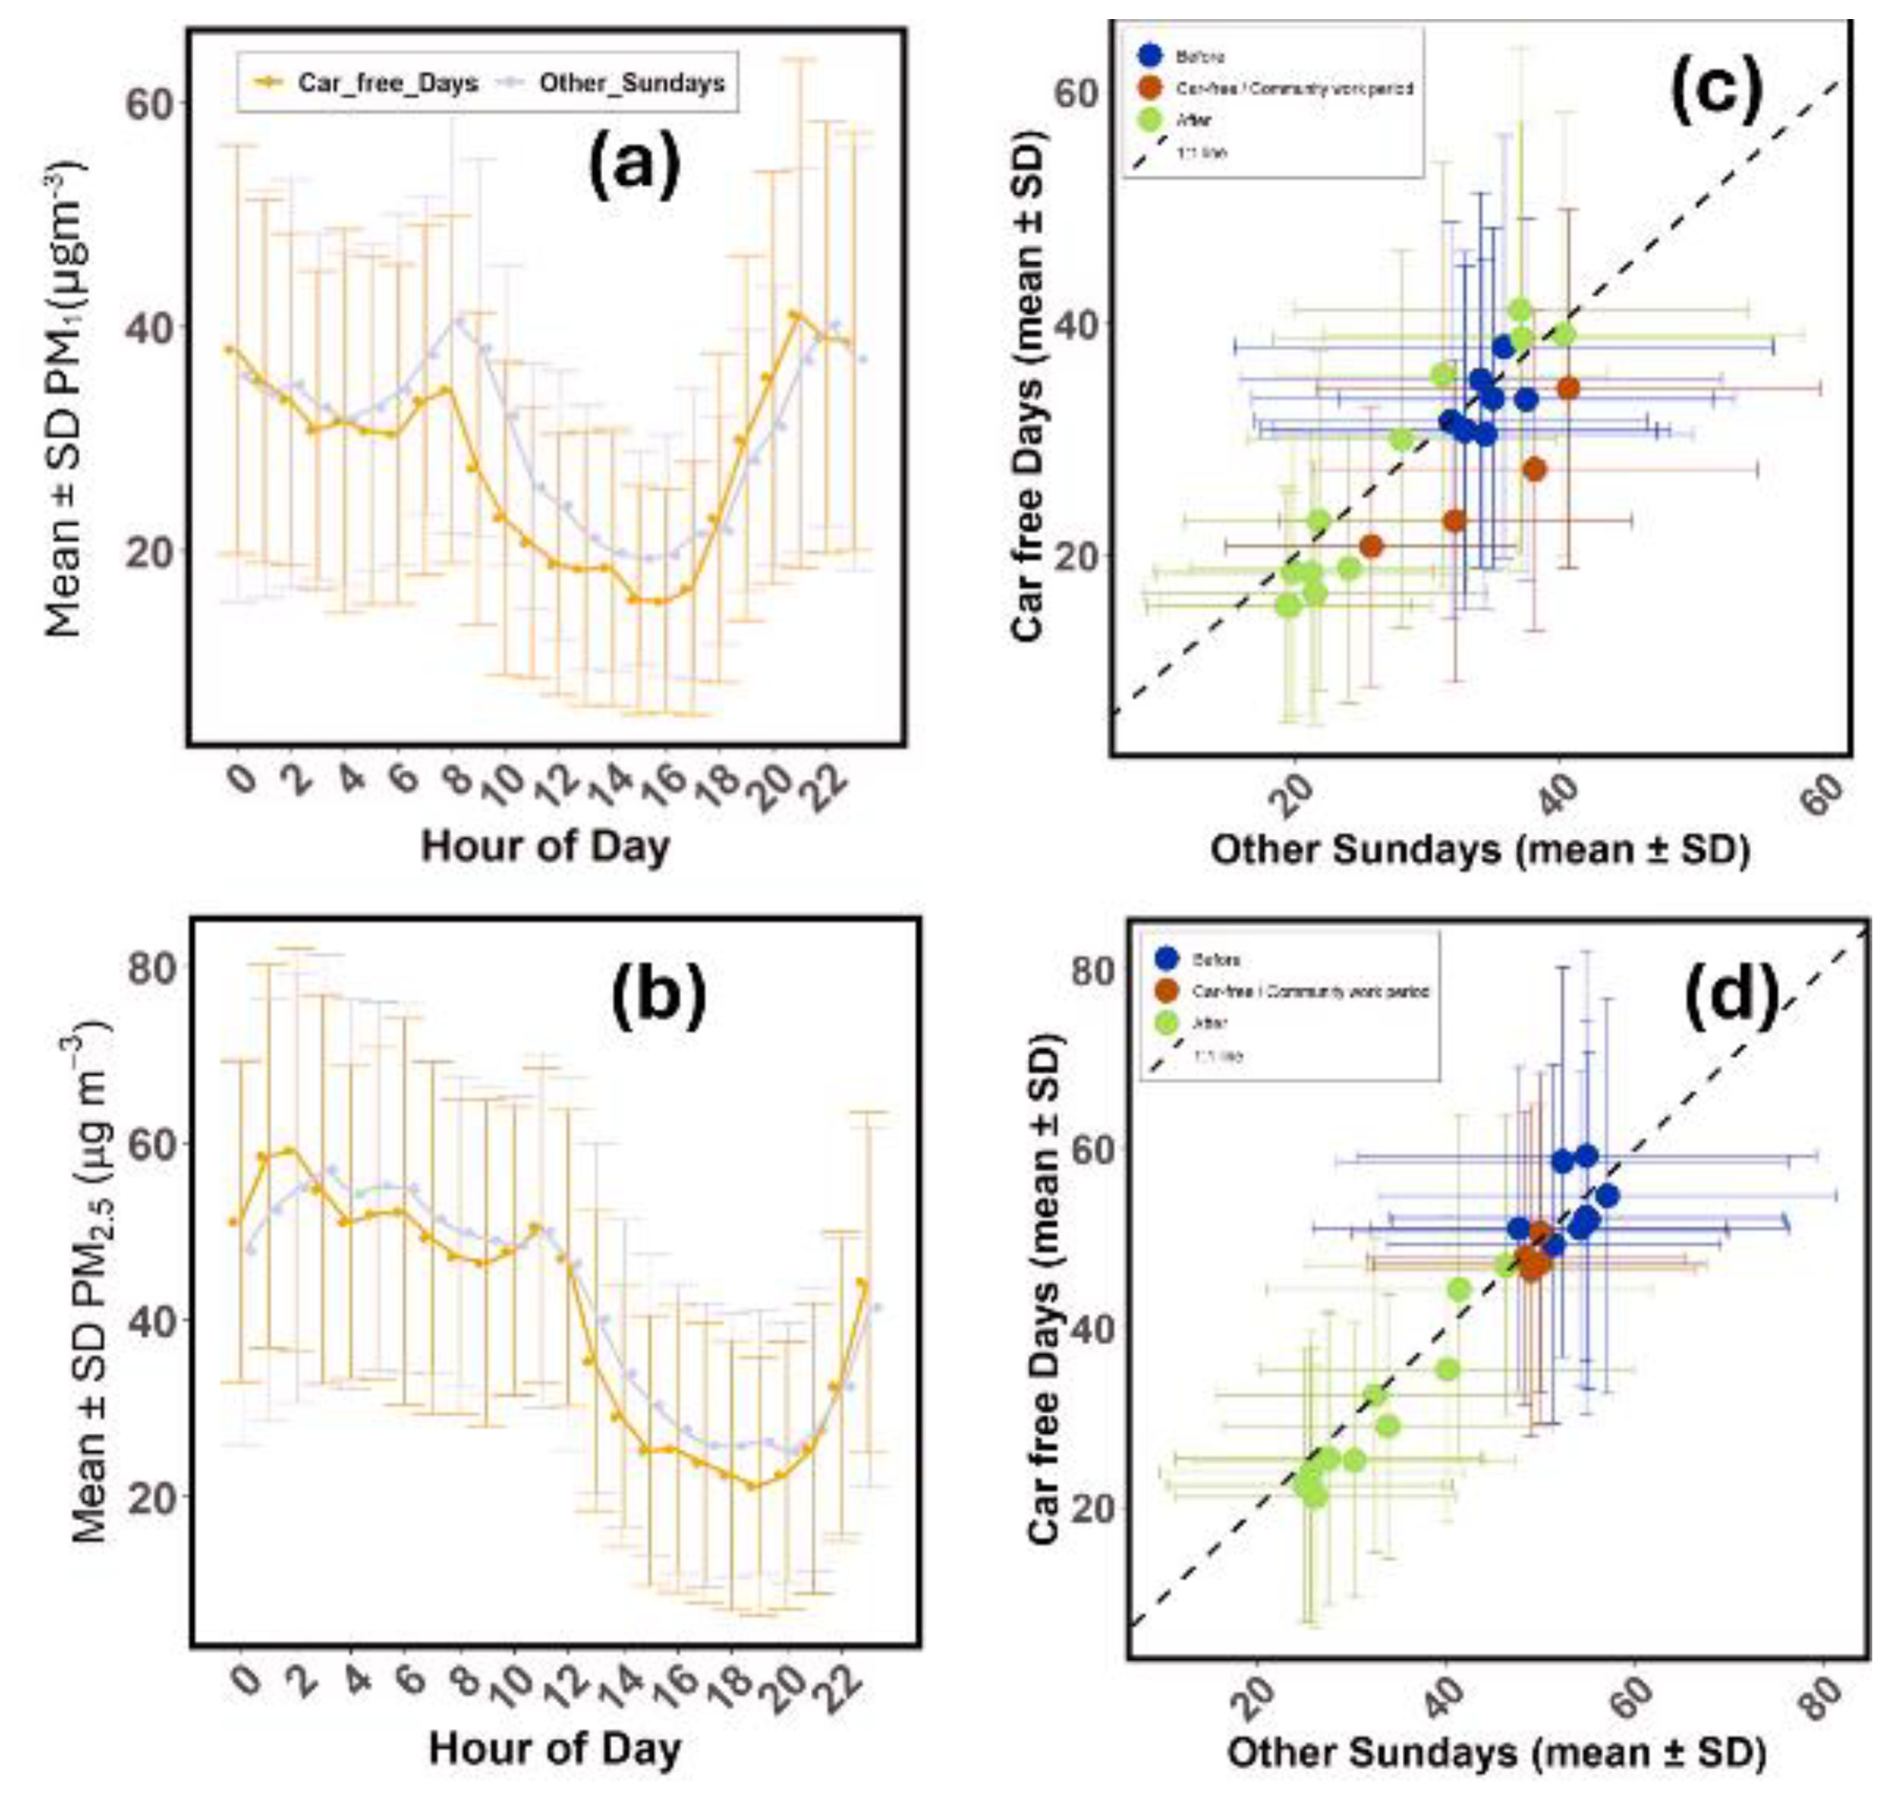
Figure 6Impact of limiting vehicle movement on Sundays in Kigali on PM1 and PM2.5. (a) and (b) show the hourly average diurnal patterns for PM1 and PM2.5, respectively, across 25 car-free Sundays and 28 regular Sundays from April 2023 to May 2024. (c) and (d) show scatter plots for PM1 and PM2.5 for comparing both car-free day and regular Sundays.
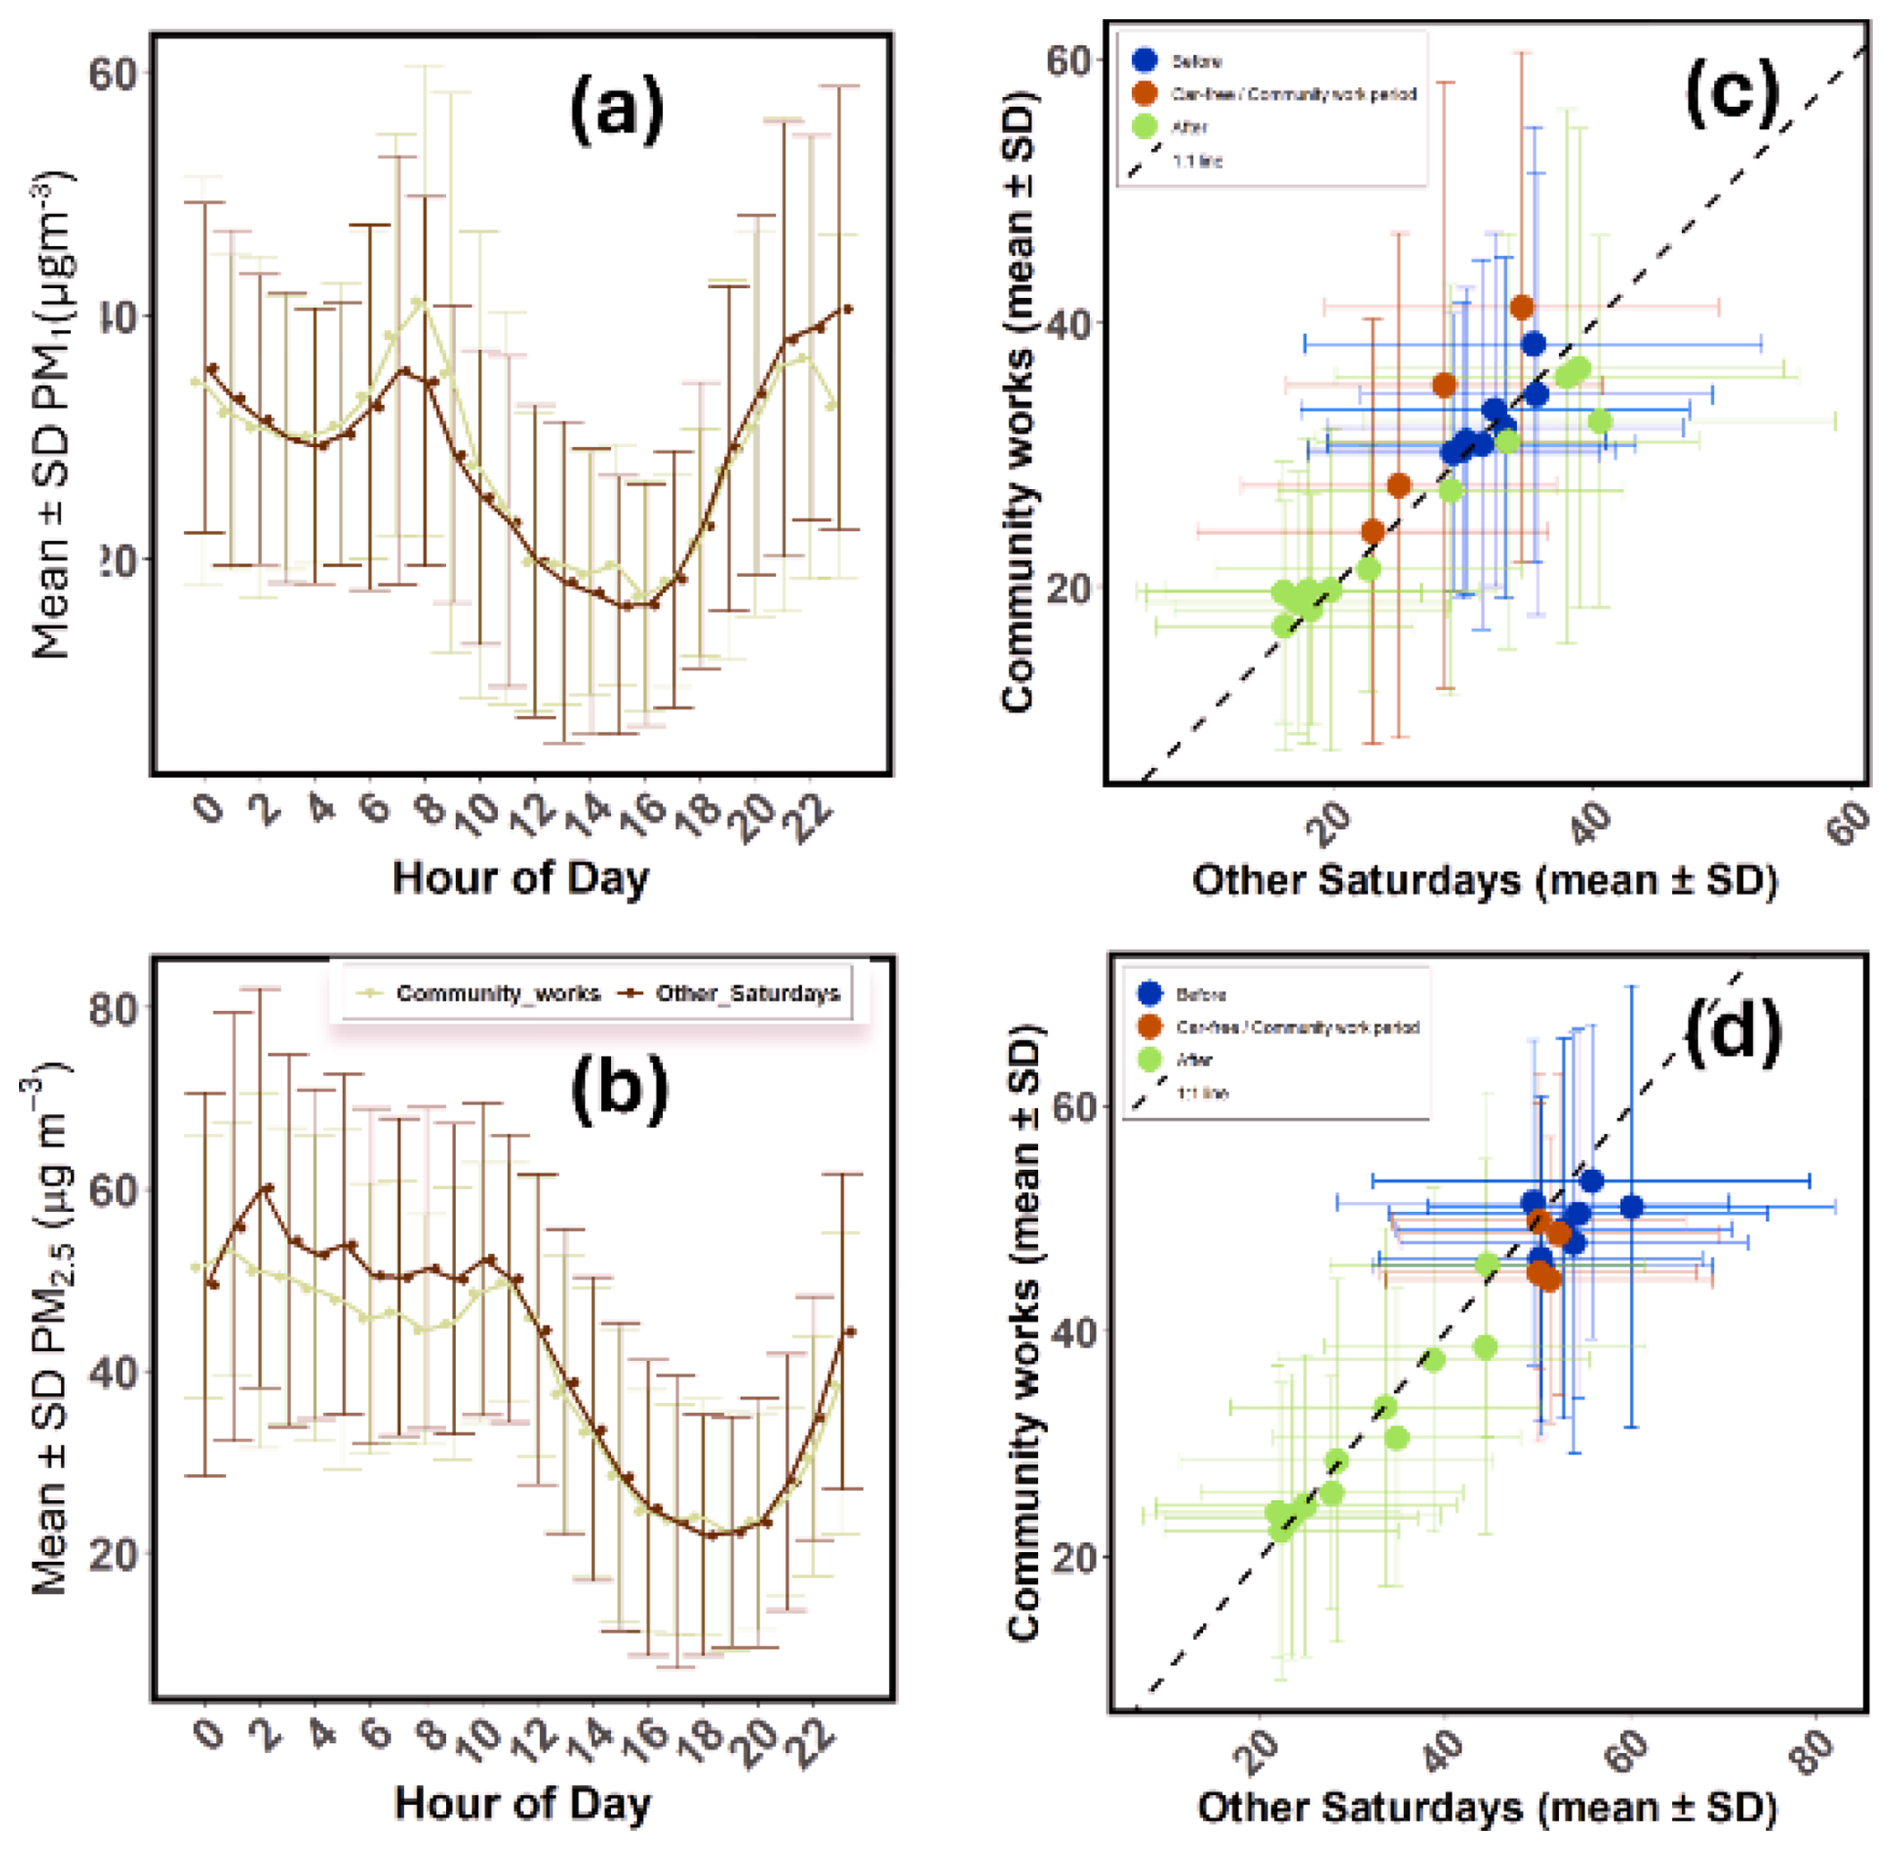
Figure 7Impact of community work on every last Saturday of each month in Kigali on PM1 and PM2.5. (a) and (b) show the hourly average patterns for PM1 and PM2.5, respectively, across 13 community works and 40 regular Saturdays from April 2023 to May 2024. (c) and (d) show scatter plots for PM1 and PM2.5 for the same period for the community works vs regular Saturday.
In contrast, during the Umuganda period, we find an increase of 4 µg m3 in total PM1 (+13 %) accompanied by a decrease of 4 µg m3 in PM2.5 (−8 %). On Umuganda days, PM2.5 concentrations are reduced, compared to regular Saturdays, from 01:00–12:00, whereas PM1 concentrations are higher during the morning from 06:00–09:00 a.m. The changes in PM1 mass concentrations on car-free and Umuganda days are only about 10 %, and the mass composition (the relative fraction of organics, BC, and inorganic ions) does not change significantly between these days and normal Saturdays and Sundays (Fig. S17), except for a higher BC fractional contribution (mean 34.3 %) during community work in the rainy season.
During the car-free periods, concentrations of HOA and BBOA are both reduced relative to normal Sundays. HOA concentrations are 17 % lower during car-free periods compared to normal Sundays, and, surprisingly, BBOA concentrations are 52 % lower. In addition, the reduced emissions also reduce SOA formation, and OOA concentrations are 28 % lower during the car-free period (Table S1 and Fig. S18). The reduced emissions during the car-free period also impact OOA concentrations when averaged across the entire day, with daily average OOA concentrations on car-free days being 16 % lower than on normal Sundays. The impact of potential emission reductions is not apparent on Umuganda days. On those days, both concentrations of PM1 and OA components are higher than on normal Saturdays. Neither intervention produced a significant change in the relative contributions of OA sources to the overall PM1 mass (Fig. S17).
Seasonally, the wet-to-dry season ratio of relative changes indicates that car-free day interventions are more effective in the dry season, with lower ratios across all species (0.84–0.97), reflecting higher baseline concentrations and stronger relative reductions. In contrast, community work events show higher wet-to-dry ratios (1.02–1.25), particularly for household and biomass-related species (HOA and BBOA), indicating a stronger relative impact of domestic emissions during the wet season. (see Table S1).
The measurements presented here show that PM1 in Kigali is impacted by high primary emissions of BC and OA, along with strong secondary production of OA and nitrate. This is consistent with Rwanda being a nation with a relatively old and higher-emitting vehicle fleet, high usage of solid biomass fuels for cooking, and high solar insolation.
The transport sector in Rwanda is dominated by old vehicles imported from other countries. Rwanda's registered motor vehicles, including two-wheeled taxis (“motos”) but excluding security organs and government vehicles, totaled 191 015 in 2017 and 264 524 in 2020. Of these, only 15 % were new vehicles, while the remaining 85 % were imported used vehicles, 95 % of which were manufactured before 2005 (Environment, 2018; Niyibizi et al., 2015; REMA, 2018; STATISTICAL, 2021; UN Environment, 2019). While we do not have specific emissions measurements for the vehicle fleet, the ambient data presented here suggest that vehicles in Rwanda are high emitters of both BC and OA. Additionally, these vehicle emissions contribute precursor vapors for SOA production.
In Rwanda, as in most Eastern African countries, biomass (e.g. charcoal, wood, and biogas derived from waste materials) accounts for more than 80 % of total energy consumption (MINEFRA, 2018b). Our analyses show that biomass burning, even in urban Kigali, contributes 23 % of OA and 41 % of BC. Some of the OA and BC attributable to biomass burning are emitted locally, as evidenced by the morning and evening peaks in BBOA and BC_bb. However, the morning and evening enhancements in BBOA and BC_bb are relatively small, and there are also high concentrations of BBOA and BC_bb overnight (e.g. from 12:00 to 04:00 a.m.). Andersson et al. (2020) and Kirago et al (2022) measured a mean concentration of ∼0.5 mg m3 at the remote Rwanda Climate Observatory; this BC was 91 % attributed to biomass burning. If we assume that the Rwanda Climate Observatory measurements represent a regional concentration of biomass-related BC, then about one-third of the biomass-burning BC in Kigali is from regional sources.
In the household energy sector, Rwanda is actively working to reduce PM emissions from biomass cooking by lowering biomass energy use from 85 % to 44 % (Republic of Rwanda, 2022). The 2022 ministerial guidelines on clean cooking technologies promote the adoption of LPG, biogas, liquid fuels, and improved clean-burning cookstoves to reduce indoor and outdoor PM emissions from biomass combustion. Hence, the large-scale distribution of low-emission cookstoves to rural communities further supports this transition (Republic of Rwanda, 2022). For industrial PM emissions, the eastern African community developed different air emission standards, for instance EAS 750:2010, EAC 751:2010, and EAC 1047:2022, which regulate ambient air, cement factory, and tailpipe emissions, respectively (Rwanda Standard Board, 2010, 2011).
There are modest seasonal variations in PM1 mass concentrations, with about 10 % higher concentrations of both PM1 and PM2.5 during the dry season. Source apportionment analysis of both OA and BC shows smaller variations in source strengths across seasons. This suggests that the main reason for higher PM concentrations in the dry seasons is a reduction in wet deposition, rather than increased source strengths. However, there remains the possibility that there exist season-dependent shifts in emission sources. For example, the rainy seasons have a higher fraction of BC from biomass-burning sources than the dry seasons. This may be due to biomass burning for agricultural residue disposal or because of transported emissions from open burning in the northern and southern regions of Rwanda (Andersson et al., 2020).
This study shows that short-term interventions, such as car-free days and community works (Umuganda), can effectively reduce traffic-related emissions. Combined with the long-term decline in traffic emissions, these findings emphasize the importance of pairing social initiatives with sustained emission control strategies, including vehicle inspection enforcement, fleet electrification, and cleaner household energy. By providing baseline source apportionment data, this study supports evidence-based policy design and highlights the need for regular monitoring, stronger enforcement, and regional cooperation to address transboundary sources. Together, these actions can deliver lasting improvements in urban air quality and public health across the region.
All data presented in this work can be obtained directly upon request from the corresponding author (apresto@andrew.cmu.edu). Data have also been posted to a publicly available server (https://kilthub.cmu.edu/articles/dataset/_b_Chemical_characterization_and_source_apportionment_of_fine_particulate_matter_in_Kigali_Rwanda_using_aerosol_mass_spectrometry_b_/30442775, last access: 11 November 2025; Habineza et al., 2025).
The supplement related to this article is available online at https://doi.org/10.5194/acp-25-15953-2025-supplement.
The experimental design was done by AAP, ALR, and TH. Data collection was carried out by AAP and TH. TH performed the data analysis and compiled the instrumental data. TH, AAP, and ALR wrote the paper, with all authors contributing significantly to the interpretation of the results, discussions, and finalization of the paper.
The contact author has declared that none of the authors has any competing interests.
Publisher's note: Copernicus Publications remains neutral with regard to jurisdictional claims made in the text, published maps, institutional affiliations, or any other geographical representation in this paper. While Copernicus Publications makes every effort to include appropriate place names, the final responsibility lies with the authors. Views expressed in the text are those of the authors and do not necessarily reflect the views of the publisher.
This work was funded by National Science Foundation grants 2420751 and 2020666 and the Steinbrenner Institute for Environmental Education and Research at Carnegie Mellon University. We thank the Rwanda Space Agency and Earth and Space Science Division for providing the Q-ACSM and AE33 instrument data used in this study. We also extend our gratitude to the Rwanda Space Agency technical team (Ntwali Didier, Olivier Shyaka, Gaston Munyampundu, Jacques Nshuti, Eric Byiringiro, and Emmanuel Iradukunda) from the Rwanda Climate Observatory Project for their technical support and assistance with instrument operation.
This research has been supported by the National Science Foundation (grant nos. 2420751 and 2020666 to Albert A. Presto).
This paper was edited by Steven Brown and reviewed by two anonymous referees.
AMS Spectral Database (Unit Mass Resolution): http://cires.colorado.edu/jimenez-group/AMSsd/, last access: 10 September 2025.
Anand, A., Touré, N. E., Bahino, J., Gnamien, S., Hughes, A. F., Arku, R. E., Tawiah, V. O., Asfaw, A., Mamo, T., Hasheminassab, S., Bililign, S., Moschos, V., Westervelt, D. M., and Presto, A. A.: Low-Cost Hourly Ambient Black Carbon Measurements at Multiple Cities in Africa, Environ. Sci. Technol., 58, 12575–12584, https://doi.org/10.1021/acs.est.4c02297, 2024.
Andersson, A., Kirillova, E. N., Decesari, S., DeWitt, L., Gasore, J., Potter, K. E., Prinn, R. G., Rupakheti, M., de Dieu Ndikubwimana, J., Nkusi, J., and Safari, B.: Seasonal source variability of carbonaceous aerosols at the Rwanda Climate Observatory, Atmos. Chem. Phys., 20, 4561–4573, https://doi.org/10.5194/acp-20-4561-2020, 2020.
Brito, J., Freney, E., Dominutti, P., Borbon, A., Haslett, S. L., Batenburg, A. M., Colomb, A., Dupuy, R., Denjean, C., Burnet, F., Bourriane, T., Deroubaix, A., Sellegri, K., Borrmann, S., Coe, H., Flamant, C., Knippertz, P., and Schwarzenboeck, A.: Assessing the role of anthropogenic and biogenic sources on PM1 over southern West Africa using aircraft measurements, Atmos. Chem. Phys., 18, 757–772, https://doi.org/10.5194/acp-18-757-2018, 2018.
Climatology of eastern Africa, http://maproom.meteorwanda.gov.rw/maproom/ (last access: 30 July 2025).
Day, D. A., Campuzano-Jost, P., Nault, B. A., Palm, B. B., Hu, W., Guo, H., Wooldridge, P. J., Cohen, R. C., Docherty, K. S., Huffman, J. A., de Sá, S. S., Martin, S. T., and Jimenez, J. L.: A systematic re-evaluation of methods for quantification of bulk particle-phase organic nitrates using real-time aerosol mass spectrometry, Atmos. Meas. Tech., 15, 459–483, https://doi.org/10.5194/amt-15-459-2022, 2022.
DeWitt, H. L., Gasore, J., Rupakheti, M., Potter, K. E., Prinn, R. G., Ndikubwimana, J. D. D., Nkusi, J., and Safari, B.: Seasonal and diurnal variability in O3, black carbon, and CO measured at the Rwanda Climate Observatory , Atmos. Chem. Phys., 19, 2063–2078, https://doi.org/10.5194/acp-19-2063-2019, 2019.
Dhammapala, R.: Analysis of fine particle pollution data measured at 29 US diplomatic posts worldwide, Atmos. Environ., 213, 367–376, https://doi.org/10.1016/j.atmosenv.2019.05.070, 2019.
Engeln, A. V. and Teixeira, J.: A planetary boundary layer height climatology derived from ECMWF reanalysis data, J. Climate, 26, 6575–6590, https://doi.org/10.1175/JCLI-D-12-00385.1, 2013.
Farmer, D. K., Matsunaga, A., Docherty, K. S., Surratt, J. D., Seinfeld, J. H., Ziemann, P. J., and Jimenez, J. L.: Response of an aerosol mass spectrometer to organonitrates and organosulfates and implications for atmospheric chemistry, P. Natl. Acad. Sci. USA, 107, 6670–6675, https://doi.org/10.1073/pnas.0912340107, 2010.
Fisher, S., Bellinger, D. C., Cropper, M. L., Kumar, P., Binagwaho, A., Koudenoukpo, J. B., Park, Y., Taghian, G., and Landrigan, P. J.: Air pollution and development in Africa: impacts on health, the economy, and human capital, Lancet Planet. Health, 5, e681–e688, https://doi.org/10.1016/S2542-5196(21)00201-1, 2021.
Gahungu, P. and Kubwimana, J. R.: Trend Analysis and Forecasting air Pollution in Rwanda, https://doi.org/10.48550/arXiv.2205.10024, 2022.
Gaita, S. M., Boman, J., Gatari, M. J., Pettersson, J. B. C., and Janhäll, S.: Source apportionment and seasonal variation of PM2.5 in a Sub-Saharan African city: Nairobi, Kenya, Atmos. Chem. Phys., 14, 9977–9991, https://doi.org/10.5194/acp-14-9977-2014, 2014.
Gentner, D. R.: Review of urban secondary organic aerosol formation from gasoline and Diesel motor vehicle emissions, ACSP Publisher, https://doi.org/10.1021/acs.est.6b04509, 2016.
Global Burden of Disease: The State of Air Quality and Health Impacts in Africa, A Report from the State of Global Air Initiative, Boston, MA:Health Effects Institute, GBD, Africa, 2024.
Global Energy Monitor: Worldwide coal plants, 1200, https://globalenergymonitor.org/projects/global-coal-plant-tracker/tracker/ (last access: 20 November 2024), 2025.
Global Air pollution measurements, https://www.airnow.gov/?city=Kacyiru&country=RWA (last access: 5 June 2024).
Habineza, T., Presto, A., Gasore, J., Robinson, A., DeWitt H. L., and Croteau, P. L.: Chemical characterization and source apportionment of fine particulate matter in Kigali, Rwanda, using aerosol mass spectrometry, Carnegie Mellon University [data set], https://kilthub.cmu.edu/articles/dataset/_b_Chemical_characterization_and_source_apportionment_of_fine_particulate_matter_in_Kigali_Rwanda_using_aerosol_mass_spectrometry_b_/30442775 (last access: 11 November 2025), 2025.
He, X., Zheng, X., You, Y., Zhang, S., Zhao, B., Wang, X., Huang, G., Chen, T., Cao, Y., He, L., Chang, X., Wang, S., and Wu, Y.: Comprehensive chemical characterization of gaseous I/SVOC emissions from heavy-duty diesel vehicles using two-dimensional gas chromatography time-of-flight mass spectrometry, Environ. Pollut., 305, https://doi.org/10.1016/j.envpol.2022.119284, 2022.
Health Effects Institute: The State of Air Quality and Health Impacts in Africa, A Report from the State of Global Air Initiative, Health Effects Institute, Boston, MA, Health Effects Institute, Africa, 2022.
Health Effects Institute: The State of Air Quality and Health Impacts in Africa, A Report from the State of Global Air Initiative, Health Effects Institute, Boston, MA, Health Effects Institute, Africa, 2023.
Huffman, J. A., Jayne, J. T., Drewnick, F., Aiken, A. C., Onasch, T., Worsnop, D. R., and Jimenez, J. L.: Design, modeling, optimization, and experimental tests of a particle beam width probe for the aerodyne aerosol mass spectrometer, Aerosol Sci. Tech., 39, 1143–1163, https://doi.org/10.1080/02786820500423782, 2005.
Kalisa, E. and Adams, M.: Population-scale COVID-19 curfew effects on urban black carbon concentrations and sources in Kigali, Rwanda, Urban Clim., 46, https://doi.org/10.1016/j.uclim.2022.101312, 2022.
Kalisa, E., Nagato, E. G., Bizuru, E., Lee, K. C., Tang, N., Pointing, S. B., Hayakawa, K., Archer, S. D. J., and Lacap-Bugler, D. C.: Characterization and risk assessment of atmospheric PM2.5 and PM10 particulate-bound PAHs and NPAHs in Rwanda, Central-East Africa, Environ. Sci. Technol., 52, 12179–12187, https://doi.org/10.1021/acs.est.8b03219, 2018.
Kalisa, E., Sudmant, A., Ruberambuga, R., and Bower, J.: Natural experiments in urban air quality: lessons from car-free days and COVID-19 lockdowns in Kigali, Rwanda, Cities Health, https://doi.org/10.1080/23748834.2025.2468017, 2025.
Kigali City: Overview, https://www.kigalicity.gov.rw/about/overview, last access: 30 July 2025.
Kirago, L., Gustafsson, Ö., Gaita, S. M., Haslett, S. L., Dewitt, H. L., Gasore, J., Potter, K. E., Prinn, R. G., Rupakheti, M., Ndikubwimana, J. D. D., Safari, B., and Andersson, A.: Atmospheric black carbon loadings and sources over Eastern Sub-Saharan Africa are governed by the regional Savanna fires, Environ. Sci. Technol., 56, 15460–15469, https://doi.org/10.1021/acs.est.2c05837, 2022.
Liu, P. S. K., Deng, R., Smith, K. A., Williams, L. R., Jayne, J. T., Canagaratna, M. R., Moore, K., Onasch, T. B., Worsnop, D. R., and Deshler, T.: Transmission efficiency of an aerodynamic focusing lens system: comparison of model calculations and laboratory measurements for the aerodyne aerosol mass spectrometer, Aerosol Sci. Tech., 41, 721–733, https://doi.org/10.1080/02786820701422278, 2007.
Magee Scientific: Aethalometer Model AE33 User Manual, Magee scentific, 2017.
Matthew, B. M., Middlebrook, A. M., and Onasch, T. B.: Collection efficiencies in an aerodyne aerosol mass spectrometer as a function of particle phase for laboratory generated aerosols, Aerosol Sci. Tech., 42, 884–898, https://doi.org/10.1080/02786820802356797, 2008.
McFarlane, C., Isevulambire, P. K., Lumbuenamo, R. S., Ndinga, A. M. E., Dhammapala, R., Jin, X., McNeill, V. F., Malings, C., Subramanian, R., and Westervelt, D. M.: First measurements of ambient PM2.5 in Kinshasa, Democratic Republic of Congo and Brazzaville, Republic of Congo using field-calibrated low-cost sensors, Aerosol Air Qual. Res., 21, https://doi.org/10.4209/aaqr.200619, 2021.
MINEFRA: Republic Of Rwanda Ministry Of Infrastructure Rwanda Energy Policy, Mifrotra, Rwanda, 2015.
MINEFRA: Republic Of Rwanda Ministry Of Infrastructure, Energy Sector Strategic Plan, Guideline No. 12957, 3,1–176, Ministry of infrastructure, Rwanda, 2018a.
MINEFRA: Republic Of Rwanda Ministry Of Infrastructure, Energy Sector Strategic Plan, Ministry of Infrastructure, Rwanda, 2018b.
Miller, J. and Jin, L.: Global progress toward soot-free diesel vehicles in 2018, ICCT, Africa, 2018.
Mkoma, S. L., Maenhaut, W., Chi, X., Wang, W., and Raes, N.: Characterisation of PM10 atmospheric aerosols for the wet season 2005 at two sites in East Africa, Atmos. Environ., 43, 631–639, https://doi.org/10.1016/j.atmosenv.2008.10.008, 2009.
Ndamuzi, E., Akimana, R., Gahungu, P., and Bimenyimana, E.: Modeling and characterization of fine particulate matter dynamics in Bujumbura using low-cost sensors, J. Appl. Math. Phys., 12, 256–267, https://doi.org/10.4236/jamp.2024.121020, 2024.
Ng, N. L., Canagaratna, M. R., Jimenez, J. L., Zhang, Q., Ulbrich, I. M., and Worsnop, D. R.: Real-time methods for estimating organic component mass concentrations from aerosol mass spectrometer data, Environ. Sci. Technol., 45, 910–916, https://doi.org/10.1021/es102951k, 2011.
Nicholson, S. E.: Climate and climatic variability of rainfall over eastern Africa, Rev. Geophys., 55, 590–635, https://doi.org/10.1002/2016RG000544, 2017.
NIS Rwanda: Rwanda statistical year book 2021, Rwanda national Institute of statistics, Rwanda, 2021.
Niyibizi, A., Baptiste Nduwayezu, J., Ishimwe, T., and Ngirabakunzi, B.: Quantification of air pollution in Kigali City and its environmental and socio-economic impact in Rwanda, Am. J. Environ. Eng., 5, 106–119, https://doi.org/10.5923/j.ajee.20150504.03, 2015.
Nyeki, S., Li, F., Weingartner, E., Streit, N., Colbeck, I., Gäggeler, H. W., and Baltensperger, U.: The background aerosol size distribution in the free troposphere: an analysis of the annual cycle at a high-alpine site, J. Geophys. Res.-Atmos., 103, 31749–31761, https://doi.org/10.1029/1998JD200029, 1998.
Onyango, S., North, C. M., Ellaithy, H. A., Tumwesigye, P., Kang, C. M., Matthaios, V., Mukama, M., Nambogo, N., Wolfson, J. M., Ferguson, S., Asiimwe, S., Atuyambe, L., Santorino, D., Christiani, D. C., and Koutrakis, P.: Ambient PM2.5 temporal variation and source apportionment in Mbarara, Uganda, Aerosol Air Qual. Res., 24, https://doi.org/10.4209/aaqr.230203, 2024.
openaq: Explore the data, https://explore.openaq.org/?parameter=pm25#1/24.6/55.8, last access: 2 January 2025.
Oregon USA WaveMetrics: Igor pro wave matrix, https://www.wavemetrics.com/downloads/current/Igor%20Pro%209 (last access: 6 November 2024), 2024.
Paatero, P. and Tapper, U.: Positive matrix factorization: a non-negative factor model with optimal utilization of error estimates of data values, Environmetrics, 5, 111–126, https://doi.org/10.1002/env.3170050203, 1994.
REMA: Inventory of Sources of Air Pollution in Rwanda Determination of Future Trends and Development of a National Air Quality Control Strategy, inventory no. 382754, 1–176, Rwanda Environment Management Authority (REMA), Rwanda, 2018.
Republic of Rwanda: Ministerial Guidelines for Clean Cooking Technologies, Ministry of Infrastracture, Rwanda, 2022.
Rwanda Standards Board: Ambient Air quality specification in Rwanda, RS EAC 751:2010, https://portal.rsb.gov.rw/webstore_preview.php?id=OTY3RkJrTndaM0EzcA (last access: 7 March 2024), 2010.
Rwanda Standards Board: Air quality specification by ciment facory in Rwanda, RS EAC 752:2011, https://portal.rsb.gov.rw/webstore_preview.php?id=OTY3RkJrTndaM0EzcA (last access: 7 March 2024), 2011.
Sandradewi, J., Prévôt, A. S. H., Szidat, S., Perron, N., Alfarra, M. R., Lanz, V. A., Weingartner, E., and Baltensperger, U. R. S.: Using aerosol light abosrption measurements for the quantitative determination of wood burning and traffic emission contribution to particulate matter, Environ. Sci. Technol., 42, 3316–3323, https://doi.org/10.1021/es702253m, 2008.
Singh, A., Ng'ang'a, D., Gatari, M. J., Kidane, A. W., Alemu, Z. A., Derrick, N., Webster, M. J., Bartington, S. E., Thomas, G. N., Avis, W., and Pope, F. D.: Air quality assessment in three east african cities using calibrated low-cost sensors with a focus on road-based hotspots, Environ. Res. Commun., 3, https://doi.org/10.1088/2515-7620/ac0e0a, 2021.
Sitati, C. N., Oludhe, C., Oyake, L., and Mbandi, A. M.: A street-level assessment of greenhouse gas emissions associated with traffic congestion in the city of Nairobi, Kenya, Clean Air J., 32, https://doi.org/10.17159/caj/2022/32/1.12546, 2022.
Smithsonia Institute: Global Volcanism Program, 2024, Report on Nyiragongo (DR Congo), in: Weekly Volcanic Activity Report, 3–9 July 2024, edited by: Sennert, S., Smithsonian Institution and US Geological Survey, https://volcano.si.edu/volcanolist_countries.cfm?country=DRC (last access: 7 March 2024), 2025.
STATISTICAL: Rwanda statistical year book 2021, Rwanda national Institute of statistics, Rwanda, 2021.
Subramanian, R., Kagabo, A. S., Baharane, V., Guhirwa, S., Sindayigaya, C., Malings, C., Williams, N. J., Kalisa, E., Li, H., Adams, P., Robinson, A. L., DeWitt, H. L., Gasore, J., and Jaramillo, P.: Air pollution in Kigali, Rwanda: spatial and temporal variability, source contributions, and the impact of car-free Sundays, Clean Air J., 30, 1–15, https://doi.org/10.17159/caj/2020/30/2.8023, 2020.
Taghian, G., Fisher, S., Chiles, T. C., Binagwaho, A., and Landrigan, P. J.: The burden of cardiovascular disease from air pollution in Rwanda, Ann. Glob. Health, 90, https://doi.org/10.5334/aogh.4322, 2024.
Tefera, W., Kumie, A., Berhane, K., Gilliland, F., Lai, A., Sricharoenvech, P., Patz, J., Samet, J., and Schauer, J. J.: Source apportionment of fine organic particulate matter (PM2.5) in central Addis Ababa, Ethiopia, Int. J. Environ. Res. Public. Health, 18, https://doi.org/10.3390/ijerph182111608, 2021.
Teledyne: User Manual Model T640 PM Mass Monitor, 2016.
The World Bank Group: Climate Change Knowledge Portal For Development Practitioners and Policy Makers, https://climateknowledgeportal.worldbank.org/country/rwanda/climate-data-historica, last access: 30 July 2025.
Ulbrich, I. M., Canagaratna, M. R., Zhang, Q., Worsnop, D. R., and Jimenez, J. L.: Interpretation of organic components from Positive Matrix Factorization of aerosol mass spectrometric data, Atmos. Chem. Phys., 9, 2891–2918, https://doi.org/10.5194/acp-9-2891-2009, 2009.
UN Environment: Kigali City Air Quality Policy and Regulatory Situational Analysis, A report published by UN Environment in collaboration with Environmental Compliance Institute, 2018.
UN Environment: Kigali City Air Quality Policy and Regulatory Situational Analysis, A report published by UN Environment in collaboration with Environmental Compliance Institute, UN, Kigali City, 2019.
UNFCCC_Rwanda: REPUBLIC OF RWANDA Rwanda's First Biennial Update Report Under the United Nations Framework Convention on Climate Change (UNFCCC), 2021.
Uwimbabazi, P.: An Analysis of Umuganda: the Policy and Practice of Community Work in Rwanda, PhD Thesis, KwaZulu-Natal, 2012.
Werden, B. S., Giordano, M. R., Mahata, K., Islam, M. R., Goetz, J. D., Puppala, S. P., Saikawa, E., Panday, A. K., Yokelson, R. J., Stone, E. A., and DeCarlo, P. F.: Submicron aerosol composition and source contribution across the Kathmandu Valley, Nepal, in winter, ACS Earth Space Chem., 7, 49–68, https://doi.org/10.1021/acsearthspacechem.2c00226, 2023.
World Health Organization (WHO): The Global Health Observatory, Explore a world of health data, Air pollution data portal https://www.who.int/data/gho/data/themes/air-pollution, last access: 2 January 2025.
Xu, Q., Wang, S., Jiang, J., Bhattarai, N., Li, X., Chang, X., Qiu, X., Zheng, M., Hua, Y., and Hao, J.: Nitrate dominates the chemical composition of PM2.5 during haze event in Beijing, China, Sci. Total Environ., 689, 1293–1303, https://doi.org/10.1016/j.scitotenv.2019.06.294, 2015.
Zhang, Q., Jimenez, J. L., Canagaratna, M. R., Ulbrich, I. M., Ng, N. L., Worsnop, D. R., and Sun, Y.: Understanding atmospheric organic aerosols via factor analysis of aerosol mass spectrometry: a review, Anal. Bioanal. Chem., 401, 3045–3067, https://doi.org/10.1007/s00216-011-5355-y, 2011.