the Creative Commons Attribution 4.0 License.
the Creative Commons Attribution 4.0 License.
 | 18 Nov 2025
Biomass burning smoke transport and radiative impact over the city of São Paulo: an extreme event case study
Gabriela Lima da Silva
Marcia Akemi Yamasoe
Nilton Èvora do Rosario
Biomass burning is a worldwide practice applied to deforestation that can have disastrous consequences for local and regional environments. This paper describes a case study of an extreme event of biomass burning smoke transport toward the São Paulo metropolitan area (MASP), on 19 August 2019, when the city experienced an uncommon completely dark sky around 15:00 UTC−3. A synergy between air mass back trajectories, satellite-retrieved aerosol fields and surface radiometric measurements was used to find the origin of the smoke plume affecting the city and to analyse the radiative impact of the transport of the smoke toward the city. Results showed that the MASP atmosphere was affected by the transport of a dense smoke plume with aerosol optical depth at 550 nm above 1. Air mass back trajectories and auxiliary data indicated that most of the smoke was emitted 2 d before arrival. The smoke plume in combination with clouds, associated with a frontal system, produced a strong radiative impact, as observed by a regional network of pyranometers. During the day of darkness, the diurnal clearness index was below 0.1 in all five MASP stations, and a maximum of the cloud optical depth higher than 300 was retrieved, producing irradiances at surface that dropped to 0 for approximately 40 min. The strong radiative efficiency (cloud radiative effect per cloud optical depth unit) of this extreme event was 7 % higher than other overcast days observed in a 2-year period.
- Article
(7265 KB) - Full-text XML
- BibTeX
- EndNote


Biomass burning (BB) is one of the most important sources of aerosol particles in the tropical regions driven by activities such as deforestation, clearing residual fields, pest control and grassland management. The smoke particles influence air quality with several health consequences (Keywood et al., 2015), mainly related to respiratory diseases. Some aerosol particles, such as the polycyclic aromatic hydrocarbons, have carcinogenic properties (Pereira et al., 2017). Significant reduction in visibility under smoke scenarios has also been reported (Lee et al., 2017), which represents a problem for the transport sector; lowered visibility, for instance, can cause flight delays and road accidents.
Aerosols emitted from BB sources have significant radiative impacts in the atmosphere, directly and indirectly, also affecting its dynamics and the circulation of air masses.
Radiative effects of BB aerosols can lead to a reduction of sensible and latent heat fluxes near the surface, the boundary layer height, and wind speed and to an increase in relative humidity (Li et al., 2022). In the Amazon, under high concentrations of BB aerosols, the net positive radiative effect dominates, favouring the warming of atmospheric layers, which increased evaporation, and consequently enhancing convective updrafts (Liu et al., 2020). Arola et al. (2007) reported a UV cooling effect of 35 % at noon during a strong BB transport event reaching Finland. In Greece, strong attenuation of UV irradiance by BB aerosols up to 90 % and 53 % was observed during wildfire outbreak episodes, as reported by Michailidis et al. (2024) and Masoom et al. (2023), respectively.
Above the southeastern Atlantic Ocean, BB aerosols were found to influence the vertical circulation, by warming the layers where they are present (Mallet et al., 2020). Chang et al. (2021) and Mallet et al. (2020) showed stronger radiative cooling at the surface during BB events in Australia comparable to volcanic eruptions. They reported a reduction of temperature between 3.7 and 4.4 °C, with a radiative effect of around −14.8 to −17.7 W m−2.
In addition, in the presence of BB aerosols, during the dry season, there is an increase in the gross primary productivity in the Amazon Forest (Moreira et al., 2017). This is due to the increase in photosynthetic activity caused by the enhancement of diffuse radiation, which results from the scattering of solar radiation by these aerosols (Moreira et al., 2017; Yamasoe et al., 2006).
In the well-known “Twomey effect” (Twomey, 1977), given the same amount of water vapour, the cloud albedo is expected to be enhanced due to the increase in atmospheric aerosol concentration. However, the response of clouds to the aerosol particles depends on the characteristics and the dynamics of the cloud systems. Koren et al. (2004) observed a reduction in the cumulus cloud cover in the presence of heavy smoke in the Amazon region. By contrast, Brioude et al. (2009) showed an increase in maritime cloud fraction and cloud albedo associated with a biomass burning aerosol layer above the marine boundary layer. For strong convective clouds, the effect of “cloud invigoration” due to the increase in aerosol concentration leads to a chain of events that strengthen the upwards currents inside clouds (Altaratz et al., 2014; Rosenfeld et al., 2008). Gautam et al. (2016) found strong impacts in the spectral radiance values measured by satellites when clouds are embedded in a smoke layer.
In South America, BB aerosols emitted by vegetation fires in the central and northern portions of the continent are often transported towards the west and south of the continent. When cold-front systems from the south penetrate the continental area, polluted air masses from these biomass burning regions can be pushed southeastward reaching the most populated urban areas of Brazil (Freitas et al., 2005). Those polluted events are more frequent from August to October (Landulfo et al., 2003), leading to significant changes in the regional aerosol optical properties and radiative impacts (Rosário et al., 2013; Yamasoe et al., 2017). Eventually, under certain circumstances, smoke transported also affects particulate matter concentrations at the surface, causing a degradation of air quality (de Almeida Castanho et al., 2008; de Miranda et al., 2017). In Brazil, biomass burning activity presented a declining trend in the first decade of the 21st century, but an increasing trend has been observed in recent years, particularly over the Amazon rainforest and Pantanal and Cerrado biomes (Mataveli et al., 2021; Rosário et al., 2022).
In August 2019, large areas in the central portion of South America, particularly in the deforestation arch of the Brazilian Amazon, underwent an outbreak of forest fires that had strong consequences for the flora, fauna and nearby human settlements. There was a high increase (150 %) in the seasonal mean aerosol optical depth at 550 nm compared to 2018 (from 0.15 to peaks of 0.4) in South America. As a response, a 30 % increase in the cooling effect at the surface in the Amazon wildfire region was observed (with radiative forcing values from −29 to −38 W m−2) (Yuan et al., 2022). Bencherif et al. (2020) identified two major successive events of transportation of BB aerosols from the Amazon to southern South America during August 2019. In the second event, starting on 14 August, a massive aerosol plume moved toward the southeastward direction, reaching the Metropolitan Area of São Paulo (MASP) by 19 August, and, in combination with the cloudiness, contributed to a sudden darkness in broad daylight, and later on that day, dark rain was observed, what has been called a “black” rain event (Pereira et al., 2021).
Focused on this event of 19 August, this paper analyses the transportation of smoke and the impact on the downward shortwave irradiance at the surface integrating modelling and observational dataset. The observational dataset includes a synergy between a regional surface broadband irradiance measurement network, aerosol optical properties and backscatter profiles, which were also employed to characterize the source of the plume arriving at the MASP.
This paper is structured as follows: the “Materials and methods” section describes the study area and the dataset used in the analysis and provides details on the synergies and the retrieval methods and the modelling systems used. In the Results section, we analyse the source and spatial distribution of the smoke plume transported toward MASP and discuss the radiative impact of this transport event on the regional pyranometer network. More detailed analysis is presented for the Metropolitan Area of São Paulo (MASP), including changes in cloud optical depth. The conclusions are wrapped up with the main findings and suggestions for further studies.
2.1 Study region and ground-based measurements
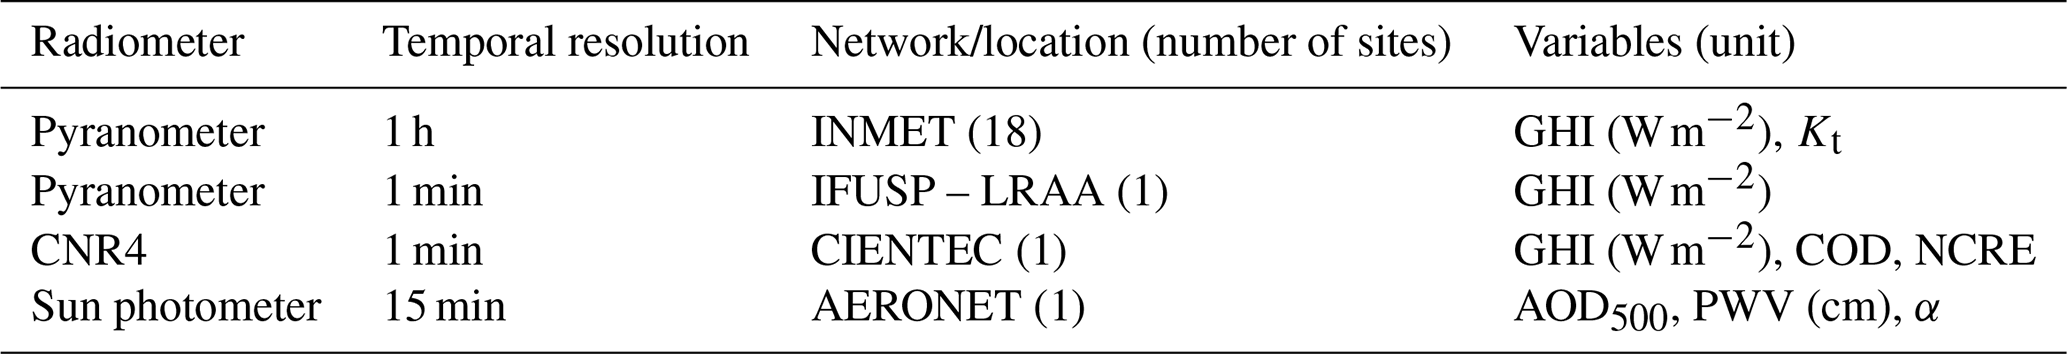
Table 1 lists the instruments, the temporal resolution of measurements, the network names or locations of each radiometer and the variables employed from each one. We analysed global horizontal irradiance (GHI) measurements from 18 pyranometers operated by the Instituto Nacional de Meteorologia (INMET). Additionally, GHI measurements were obtained from two instruments maintained by the Laboratório de Radiação e Aerossóis Atmosféricos (LRAA) from the Instituto de Astronomia, Geofísica e Ciências Atmosféricas (IAG): CNR4 Net Radiometer located at the Parque de Ciência e Tecnologia of the University of São Paulo (CIENTEC) and a pyranometer located on the roof of the Pelletron building at the Instituto de Física da Universidade de São Paulo (IFUSP). From the GHI, we computed the diurnal clearness index (Kt), defined as the ratio of diurnal GHI at the surface to the equivalent value at the top of the atmosphere (TOA). Furthermore, the normalized cloud radiative effect (NCRE) is estimated using GHI along with radiative transfer simulations (Sect. 2.4).
Table 1Radiometer type, temporal resolution of data acquisition, the institution responsible for the specific network or location of each radiometer, and analysed/estimated variables. In parentheses are the number of sites analysed in this study or the variable unit.
We obtained data of version 2.0 of column-integrated precipitable water vapour (PWV), the aerosol optical depth at 500 nm (AOD500), and the Angström coefficient estimated from AOD at 440 and 870 nm (α) from measurements of the AERONET (Aerosol Robotic Network) (Holben et al., 1998) sun photometer installed at IF, level 2.0.
Figure 1 depicts the region of study, which includes part of the central, southeast and south portions of Brazil and the locations of the surface stations. The stations are grouped into four sub-areas: stations located in the Metropolitan Area of São Paulo (eastern part of São Paulo state) (MASP), stations located in Mato Grosso do Sul state (MS), stations located in Paraná state (PR) and stations located at the northwestern portion of São Paulo state (SP-W). Table 2 presents a geographical summary of each station and the acronyms that will be used throughout the paper.
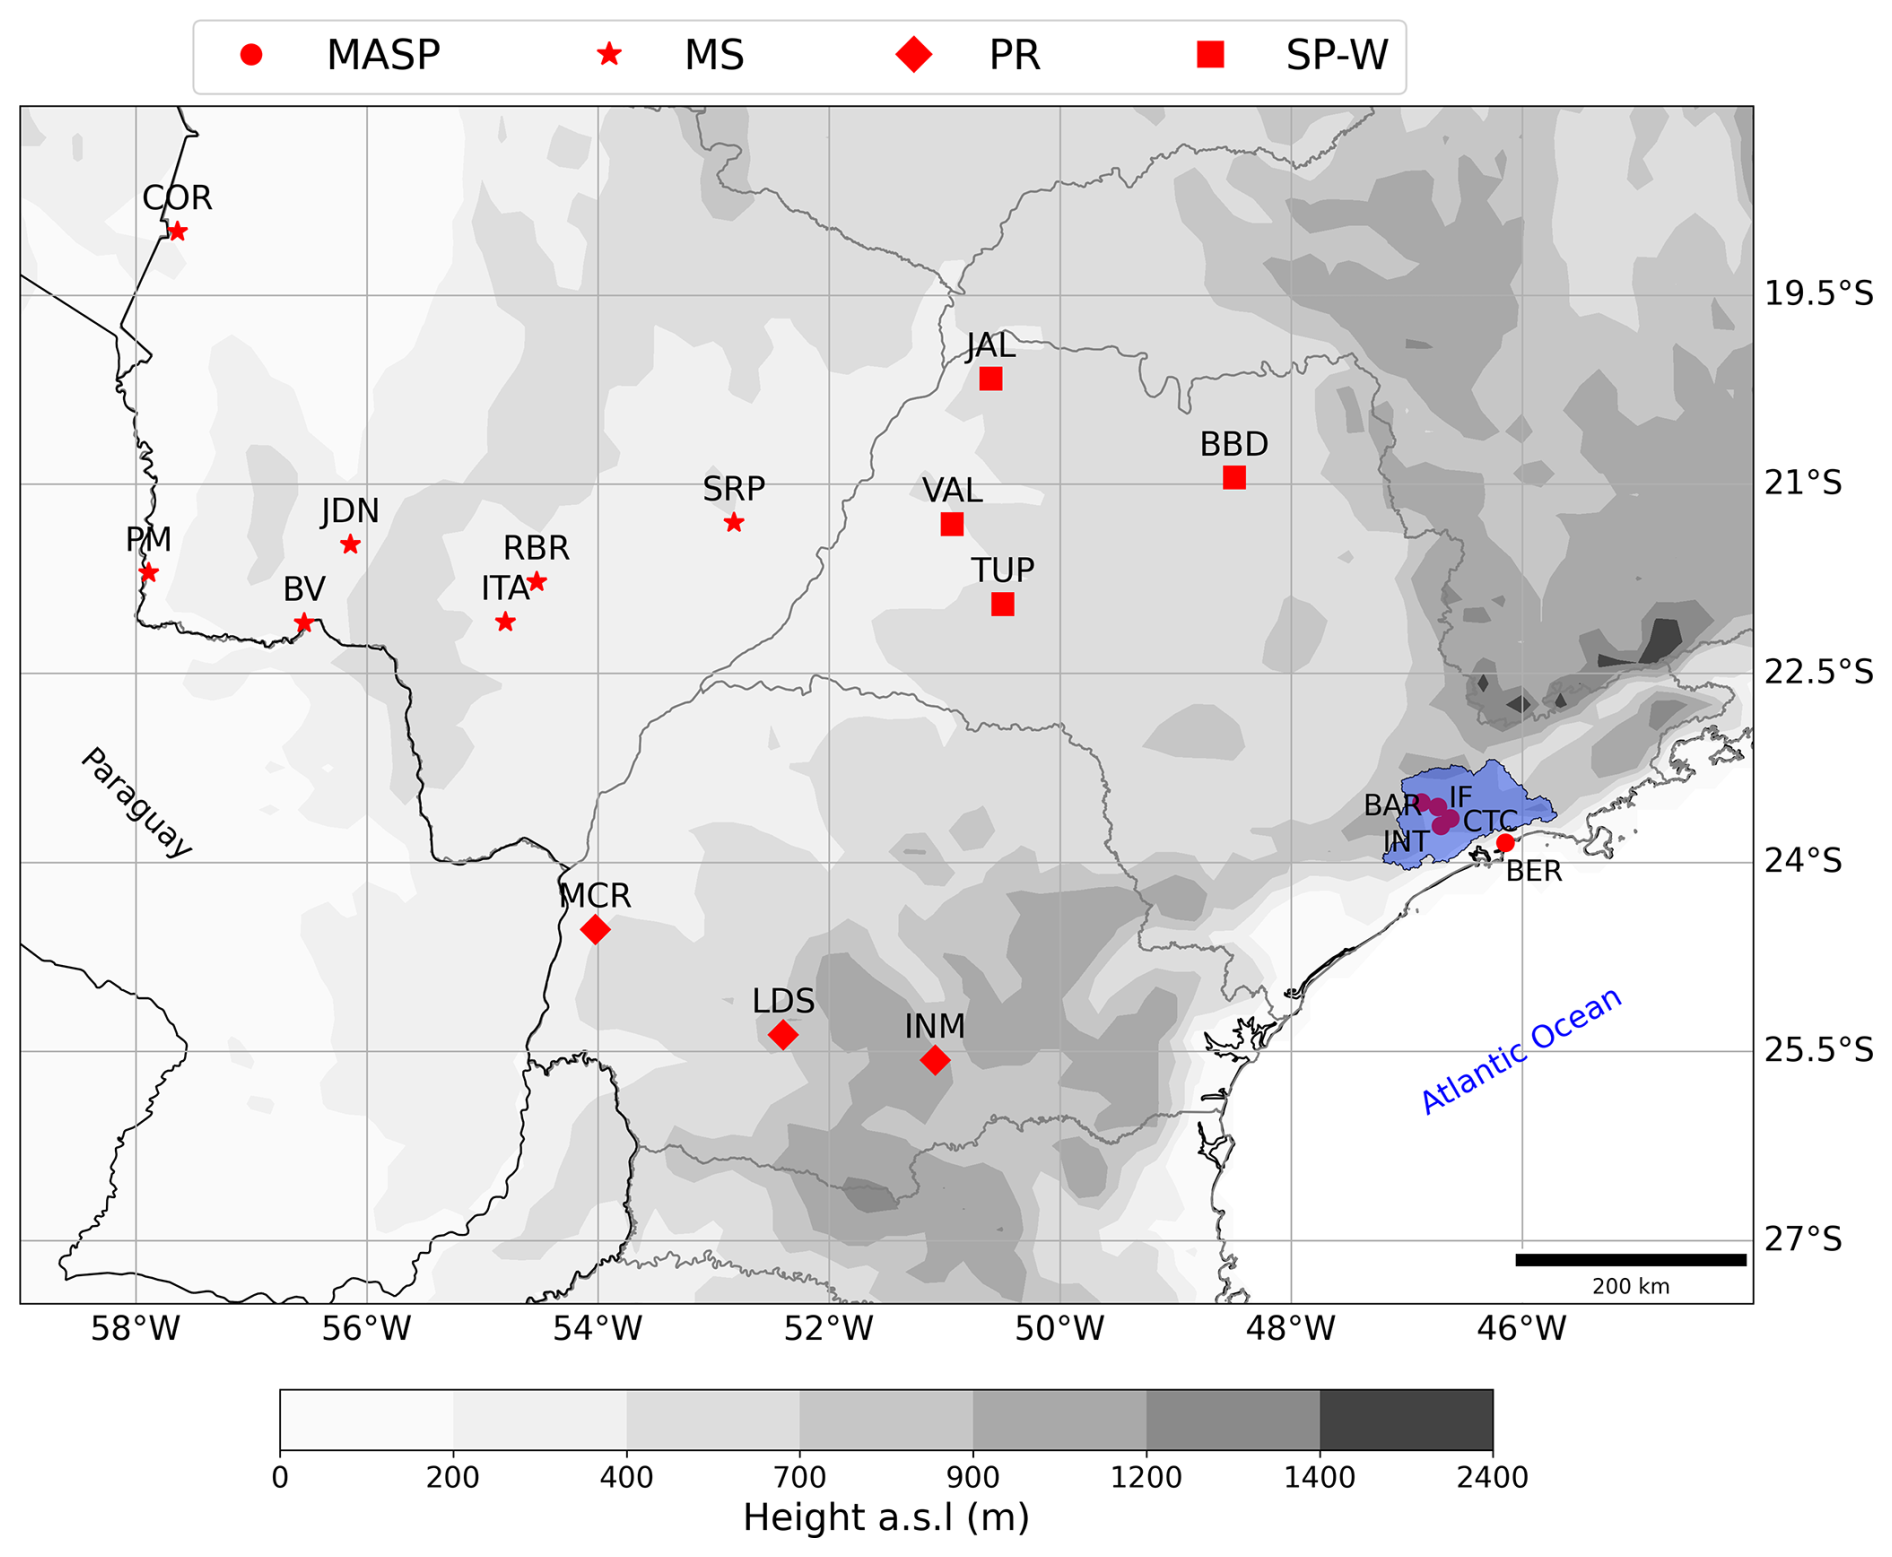
Figure 1The regions of Brazil analysed in this study: Central (MS), Southeast (SP) and South (PR). The red symbols indicate the locations of the meteorological stations considered in the analysis and their different formats indicate the related administrative domain (SP-W – western portion of São Paulo state; MS – Mato Grosso do Sul state; PR – Paraná state; MASP – Metropolitan Area of São Paulo). The blue area highlights the MASP area.
Table 2Location of INMET stations and two other data sources (CIENTEC and IFUSP) analysed in this study.
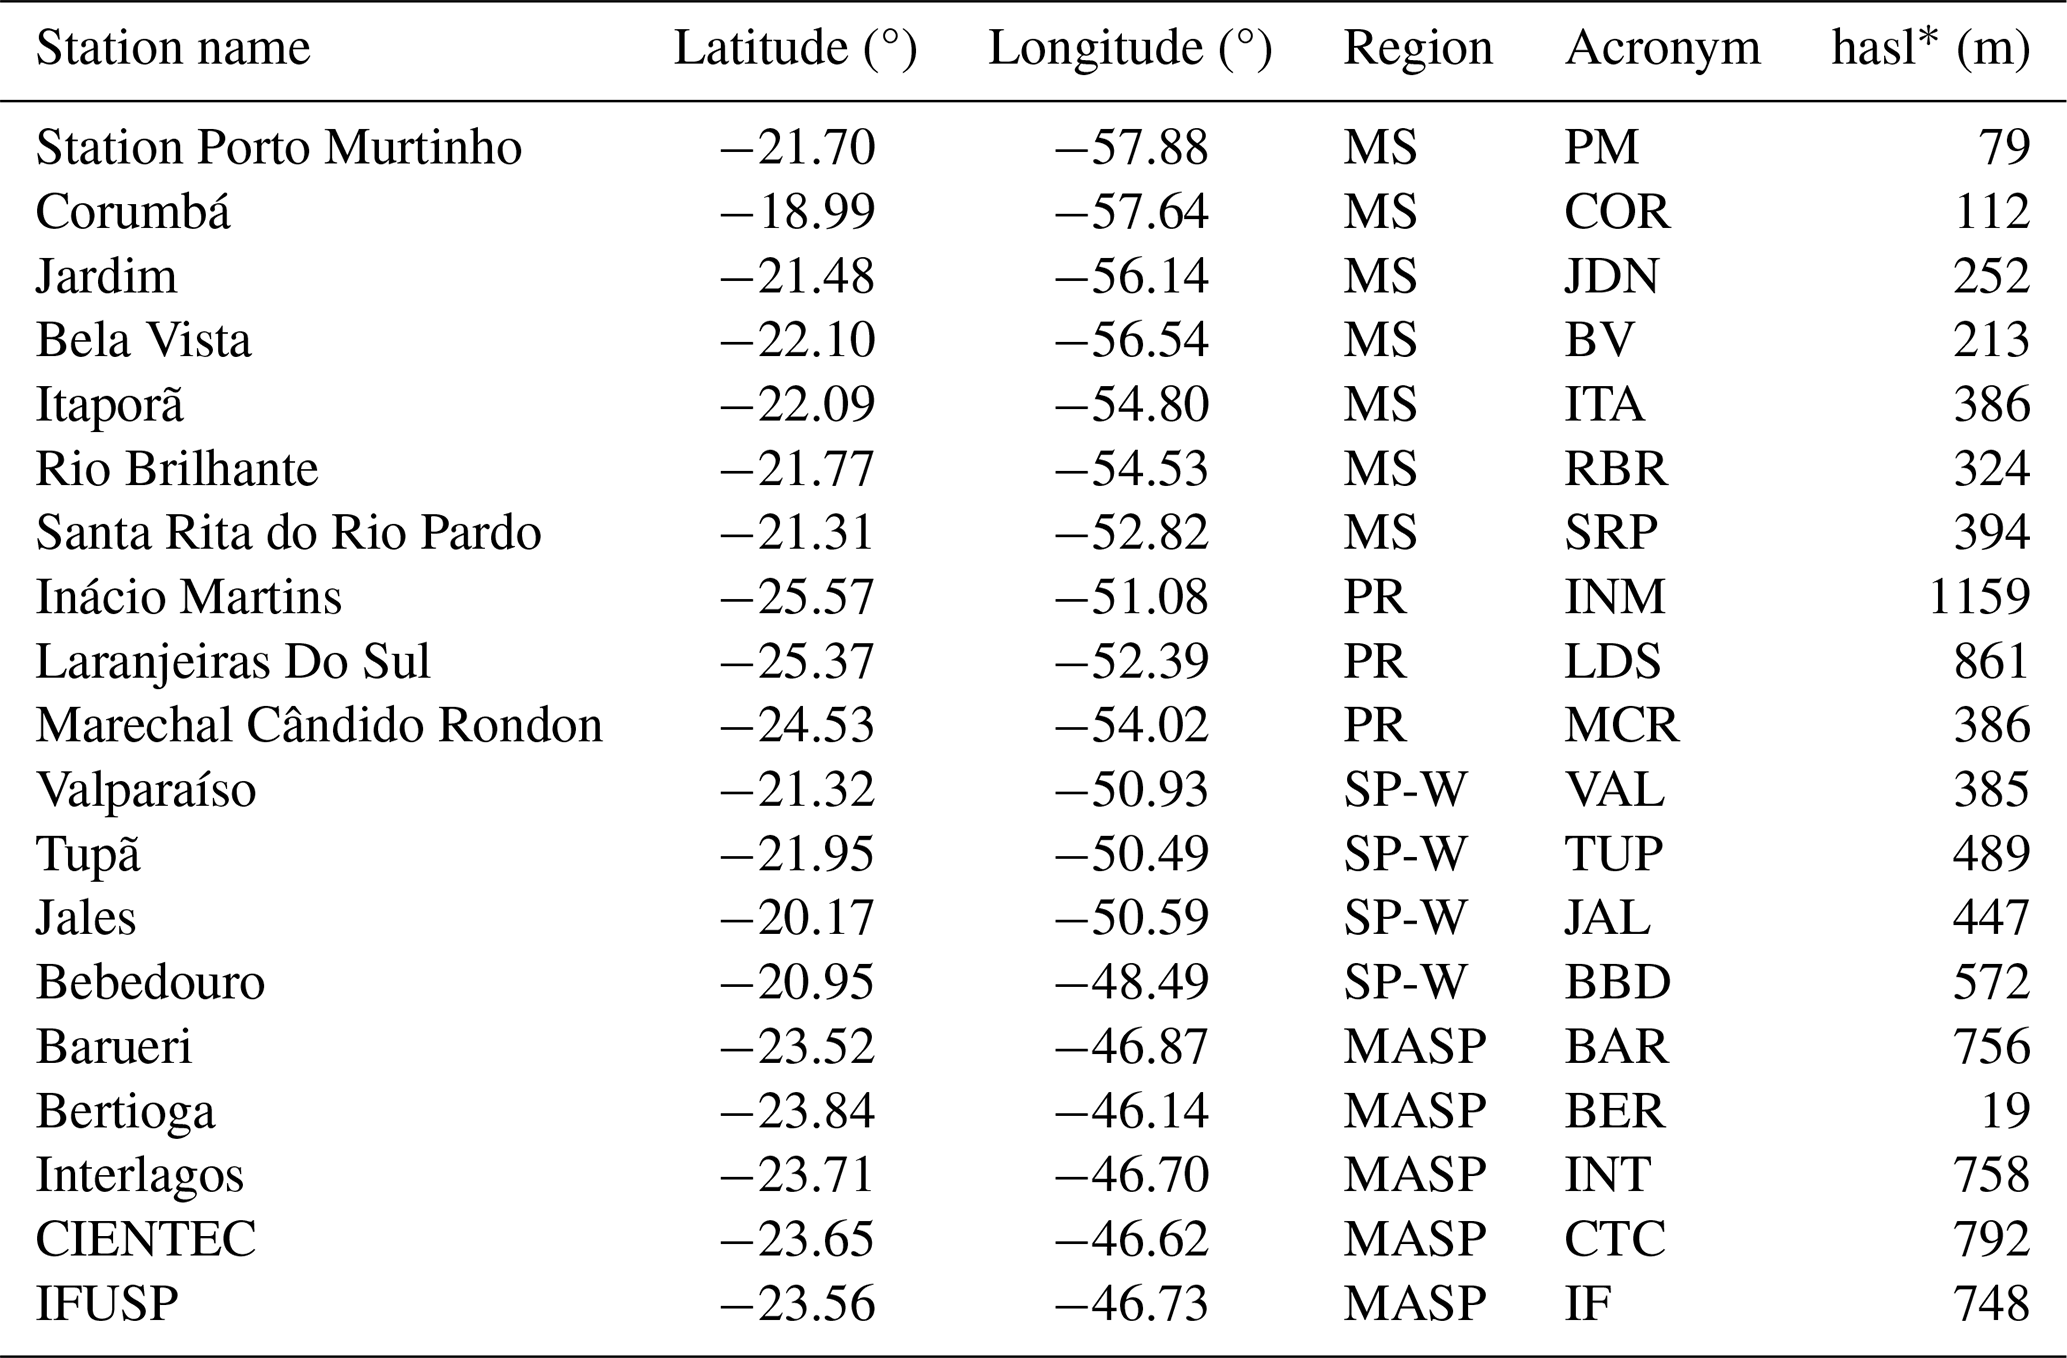
∗ hasl – height above sea level.
2.2 Satellite-derived and reanalysis products
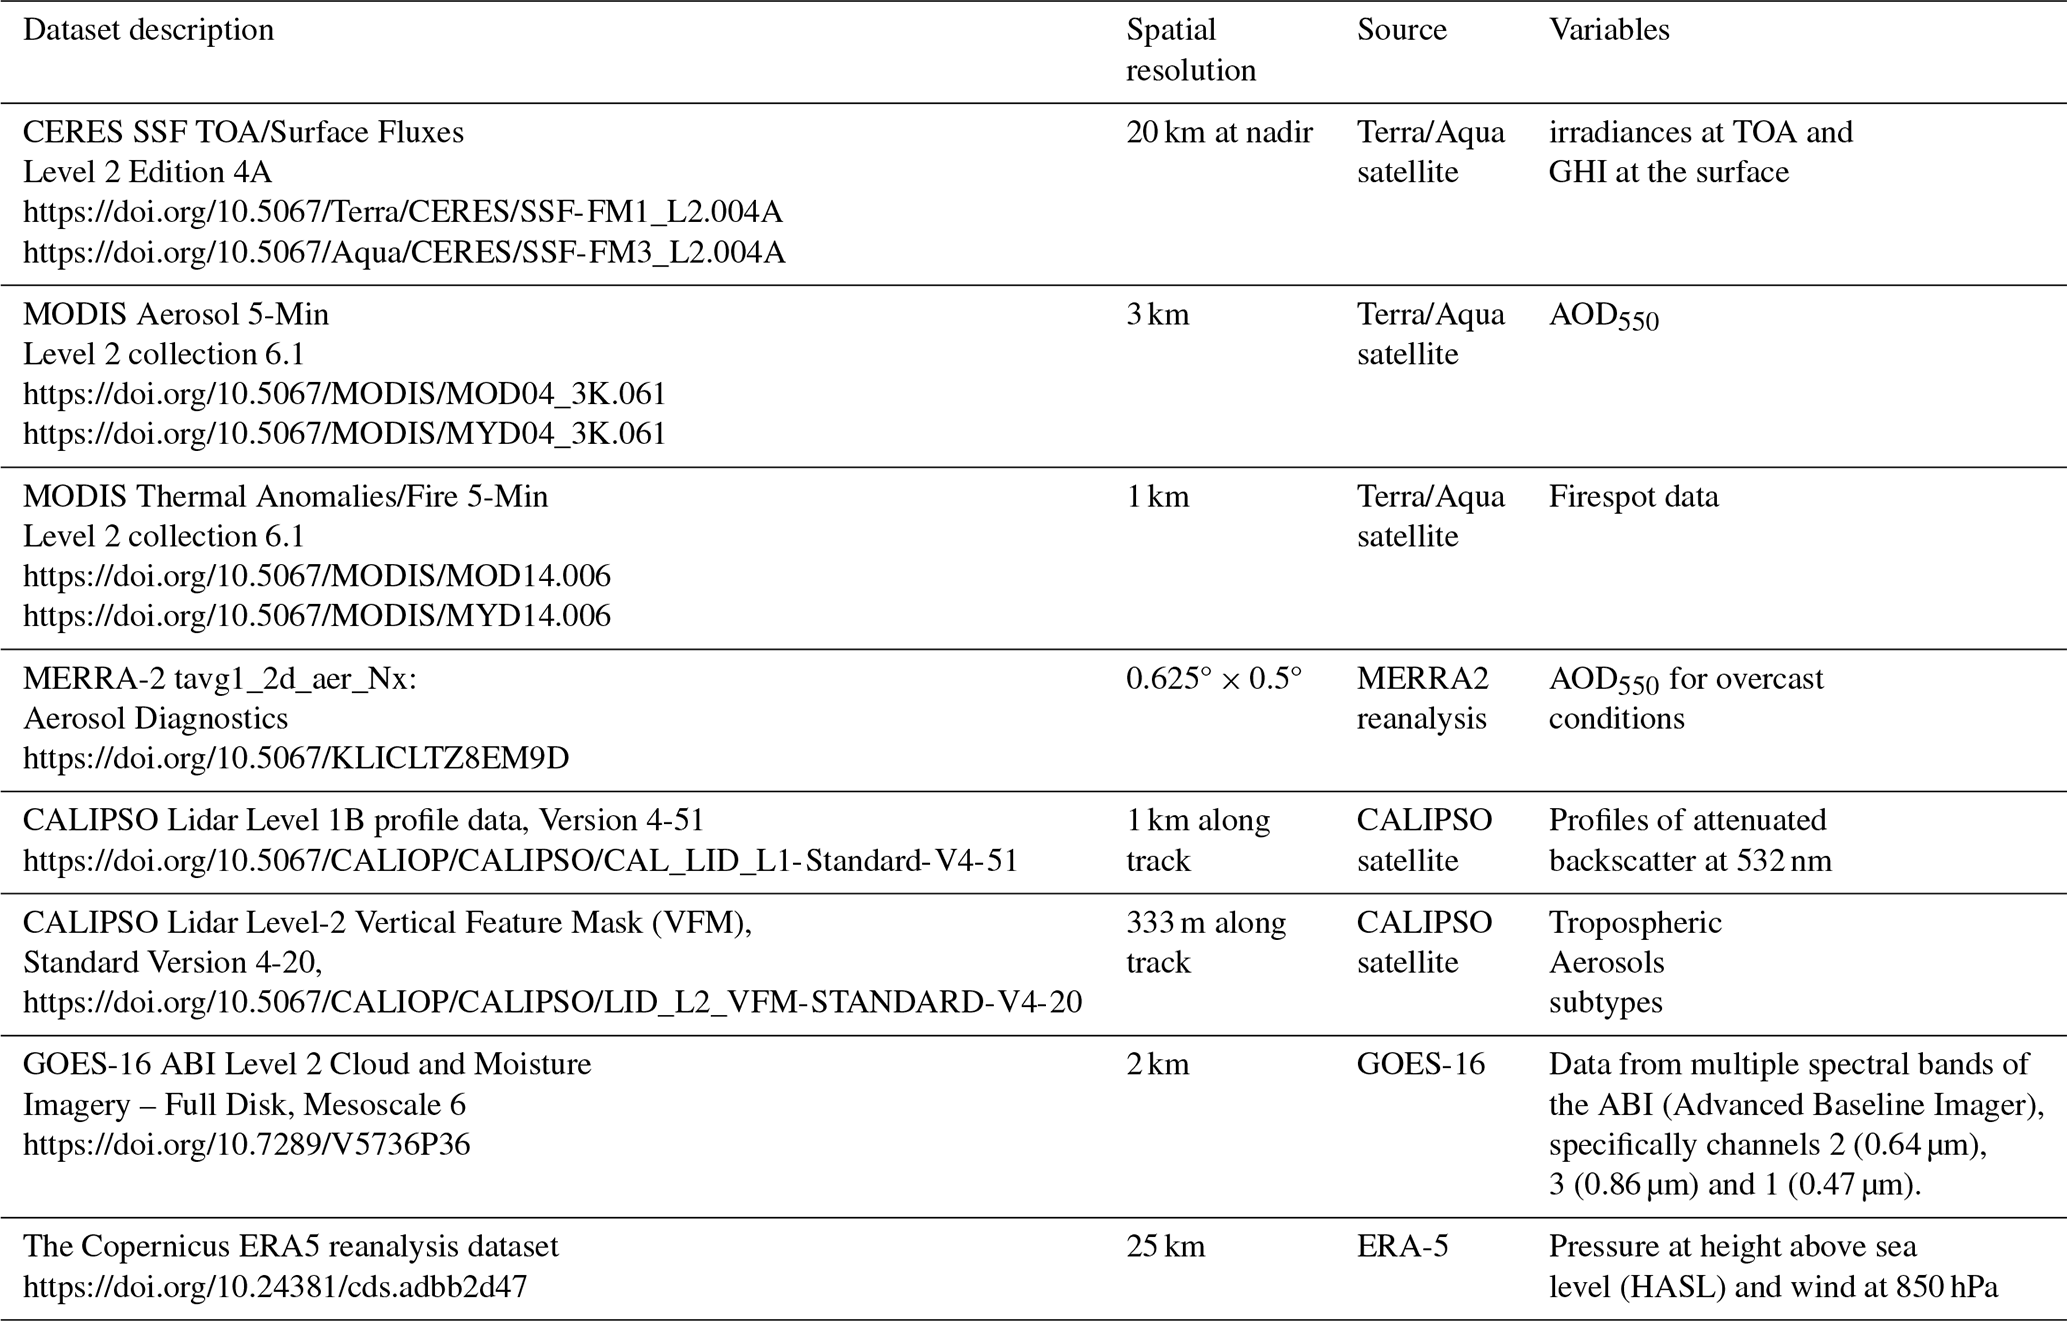
Table 3 provides an overview of the satellite products and reanalysis datasets utilized in this study. Satellite data were extracted from pixels within a 40 km radius surrounding each ground station. To account for spatial representativeness, a distance-weighted averaging method was applied, assigning higher influence on pixels in closer proximity to the station.
Table 3Description of satellite and reanalysis data used, including the spatial resolution, the source and variables employed.
In the following, a brief description of each analysed product is presented.
Instantaneous all-sky radiative fluxes at the top of the atmosphere and at the surface (GHI) were obtained from the Clouds and the Earth's Radiant Energy System (CERES) project (Loeb et al., 2016; Scott et al., 2022). The data from CERES used the sensor Single Scanner Footprint (SSF), with horizontal resolution of 20 km at nadir. The data were provided by the Langley Research Center (LARC) of the National Aeronautics and Space Administration (NASA) at the website https://ceres.larc.nasa.gov/data/ (last access: 10 July 2024).
Moderate Resolution Imaging Spectroradiometer (MODIS) sensors are aboard the polar-orbiting satellites Aqua and Terra, giving a good horizontal resolution but with the limitation of delivering information at specific local times for each point overpassed. For instance, in the study region, MODIS overpasses from Aqua and Terra generally occur between 13:00 and 20:00 UTC. The MODIS Collection 6.1 3 km aerosol products (MOD04_3K for Terra and MYD04_3K for Aqua) offer higher spatial resolution than the earlier 10 km products, improving aerosol detection. However, this finer resolution can introduce more noise (mainly over land due to surface heterogeneity and fewer pixels per retrieval box). To ensure reliability, we apply quality assurance filtering, requiring at least five valid pixels within each 6 × 6 array of 0.5 km pixels over land (good-quality condition). Our analysis uses aerosol optical depth at 550 nm (AOD550) derived from the Dark Target (DT) algorithm (Levy et al., 2013) for the study area, where BB aerosols predominantly originated from wildfires in vegetated surfaces.
In addition, vertical profile information of the presence of aerosols was taken from the polar-orbiting Cloud-Aerosol Lidar and Infrared Pathfinder Satellite Observation (CALIPSO) Satellite (Winker et al., 2009). On board CALIPSO, the Cloud-Aerosol Lidar with Orthogonal Polarization (CALIOP) is the primary instrument, providing measurements at 532 and 1064 nm, with a very high vertical resolution of 30 m and a horizontal resolution of 333 m. Tropospheric aerosols are classified based on lidar depolarization into seven categories, including aerosols originating from smoke (Kim et al., 2018). We analysed the total attenuated backscatter signal at 532 nm and the aerosol classification from the Lidar Level 1B profile data, version 4-51 product of CALIPSO, to help identify the aerosols layers. In addition, we employ the CALIPSO Level 2 Vertical Feature Mask (VFM), version 4.20, which provides detailed information on aerosol subtypes based on the depolarization and backscatter signals from the CALIOP instrument (Kim et al., 2018).
The FireMask data in the Level-2 MODIS Thermal Anomalies/Fire products (MOD14 for Terra and MYD14 for Aqua; 1 km resolution) classify each pixel using mid-infrared radiance thresholds to indicate fire presence and confidence (Giglio et al., 2016). By selecting only pixels with FireMask > 7 (i.e., 8 or 9), we ensure that only nominal- to high-confidence fire detections are analysed. The FireMask data are used solely to contextualize the presence of fire spots.
GOES-16 data from the Advanced Baseline Imager (ABI) sensor provide detailed information on cloud cover and the presence of aerosol plumes, with a horizontal resolution of 2 km. Specifically, we use a combination of channels 2 (0.64 µm), 3 (0.86 µm) and 1 (0.47 µm) to depict the presence of clouds and aerosols.
We employed ancillary information from ERA-5, including pressure fields at sea level and wind at 850 hPa. Pressure fields help in identifying synoptic-scale systems. Additionally, wind data at 850 hPa provide information on low-level wind flows that play a role in the transport of aerosol plumes.
When the scene was cloudy, aerosol products were not retrieved from any satellite or ground-based measurements. In those cases, we needed to estimate the aerosol parameters equivalent to clear skies, to evaluate the radiative impact due only to clouds. AOD hourly mean values for cloudy conditions were obtained from the M2T1NXAER Modern-Era Retrospective analysis for Research and Applications version 2 (MERRA-2) (Randles et al., 2017).
A bias correction of the AOD at 550 nm from MERRA2 was conducted by comparing it with colocated AOD at 550 nm from AERONET 2008–2019 for the months of July, August and September. Since AERONET does not provide AOD at this wavelength directly, the estimation was made using α. The bias was corrected using simple linear regression of data spanning the period. Error propagation (not shown) resulted in a final uncertainty of 0.06 for the bias-corrected AOD at 550 nm.
2.3 HYSPLIT and the sources of the aerosol smoke plume
The Hybrid Single-Particle Lagrangian Integrated Trajectory (HYSPLIT) (Draxler and Hess, 1998) is a dispersion model which allows the estimation of the air mass trajectories with Lagrangian and Eulerian approaches. A variety of simulation methods can be applied using different meteorological model outputs. For this study we used HYSPLIT to compute backward trajectories of air masses that arrived in São Paulo on 19 August, using the meteorological data from the GFS (Global Forecast System) with 0.25° horizontal resolution as input.
The HYSPLIT model simulated the route of air parcels that arrived over the CTC site at different times (from 03:00 UTC on 19 August to 02:00 UTC on 20 August, every hour) and selected altitudes above ground level (2, 3 and 4 km). The backward position of each trajectory was calculated until 06:00 UTC on 17 August 2019, to coincide with CALIPSO overpass time. A total of 72 air parcel trajectories were simulated. Using the HYSPLIT model, a heat map was created to show the origins of air parcels arriving at CIENTEC throughout 19 August, based on their positions at 06:00 UTC on 17 August. This analysis allowed us to estimate the regions from which these air parcels originated and to verify whether these areas correspond to the wildfire locations and smoke layer observed in the CALIPSO measurements.
2.4 Downward shortwave irradiance simulations and cloud optical depth retrievals
Broadband simulations of GHI at the surface for clear-sky and cloudy conditions at the CTC station were performed using the uvspec radiative transfer model from LibRadtran library (Emde et al., 2016; Mayer and Kylling, 2005). Simulations were carried out for observed overcast days, including the extreme smoke event of 19 August to retrieve the cloud optical depth (COD) and the NCRE. For each measurement timestamp on every overcast day, aerosols, cloud cover, surface conditions and water vapour were retrieved or inferred and used as inputs for GHI simulations.
For this study, the simulations done with uvspec employed both the “discrete ordinates” (Stamnes et al., 1988) and the “two-streams” (Kylling et al., 1995) methods as solvers of the radiative transfer equation, the latter being used to estimate the cloud optical depth due to its faster computation. We assumed a spectrally homogeneous surface albedo of 0.15, typical of urban regions at midlatitudes (Sailor and Fan, 2002). The solar spectral irradiance at TOA from Gueymard (2004) was adopted. The simulations were performed for cosine of the solar zenith angle (CSZA) values in the range from 0.2 to 1.0, applying a pseudo-spherical condition (Kylling et al., 1995) at CSZA below 0.5. The vertical profiles of pressure, O3, O2, water vapour and NO2 were assumed to follow the tropical atmosphere from Anderson et al. (1986). The adopted absorption spectral parametrization was REPTRAN (Gasteiger et al., 2014), with a spectral resolution of 15 cm−1. The vertical profiles of optical properties were defined by the aerosol models below 2 km and above 2 km. Below 2 km, the aerosol model was the rural type (Shettle, 1989), while above, we assumed the “background” model (Shettle, 1989). Profiles were corrected by the column-integrated values included as input in the uvspec. Single-scattering albedo of aerosols was defined by the seasonal variability. The largest differences in the aerosol optical properties are expected between the dry season, in the months of August to October (due to biomass burning), and the rest of the year. We adopted the values of aerosol single-scattering albedo (α) and asymmetry factor proposed by De Almeida Castanho et al. (2008), depending on the season. We used AOD550 with bias correction and α from MERRA2. PWV data from AERONET were interpolated for the overcast days using PWV retrieved 1 d before and after each analysed day.
Cloud properties, assumed as a homogeneous plane-parallel layer, were also included with fixed values for the effective radius of 11.6 µm and cloud base and top of 893 and 1700 m, respectively, obtained from CLOUDSAT 2B-CWC-RO product (Austin, 2007) climatology for the MASP region. Data from CLOUDSAT 2B-CWC-RO have a horizontal and vertical resolution of 1.1 km and 240 m, respectively. The average value was computed using overpasses within a maximum distance of 100 km from the MASP. The assumption of mean values for the region helps to improve the retrievals and computations with uvspec. Simulations were performed at every 1 min following the frequency of surface irradiance measurements at the CTC, in the MASP.
To obtain the COD, the cloud modification factor (CMF) was simulated by LibRadtran for completely overcast sky conditions. CMF is defined as the ratio between the measured GHI at the surface to the GHI estimated for clear sky conditions. COD was estimated by iteratively adjusting COD values and computing the CMF, until the difference between the simulated and measured CMF converged to a very low value, considered less than 0.05 %. CMF was used for retrieving COD because it is strongly associated with transmittances of clouds (Serrano et al., 2015). Propagation error of the retrieval (not shown) shows an error of the retrieval of 18 % considering employing a CNR4. When comparing the retrieval of COD using CMF with the one estimated with Multifilter Rotating Shadowband Radiometer (MFRSR) 415 nm measurements for overcast days (Leontyeva and Stamnes, 1994) we observed a maximum difference of 15 %.
The solar broadband cloud radiative effect at the surface was estimated using NCRE, obtained as presented in Eq. (1). The superscripts clr and obs refer, respectively, to the surface irradiances simulated for clear sky using LibRadtran and observed under cloudy conditions from CNR4.
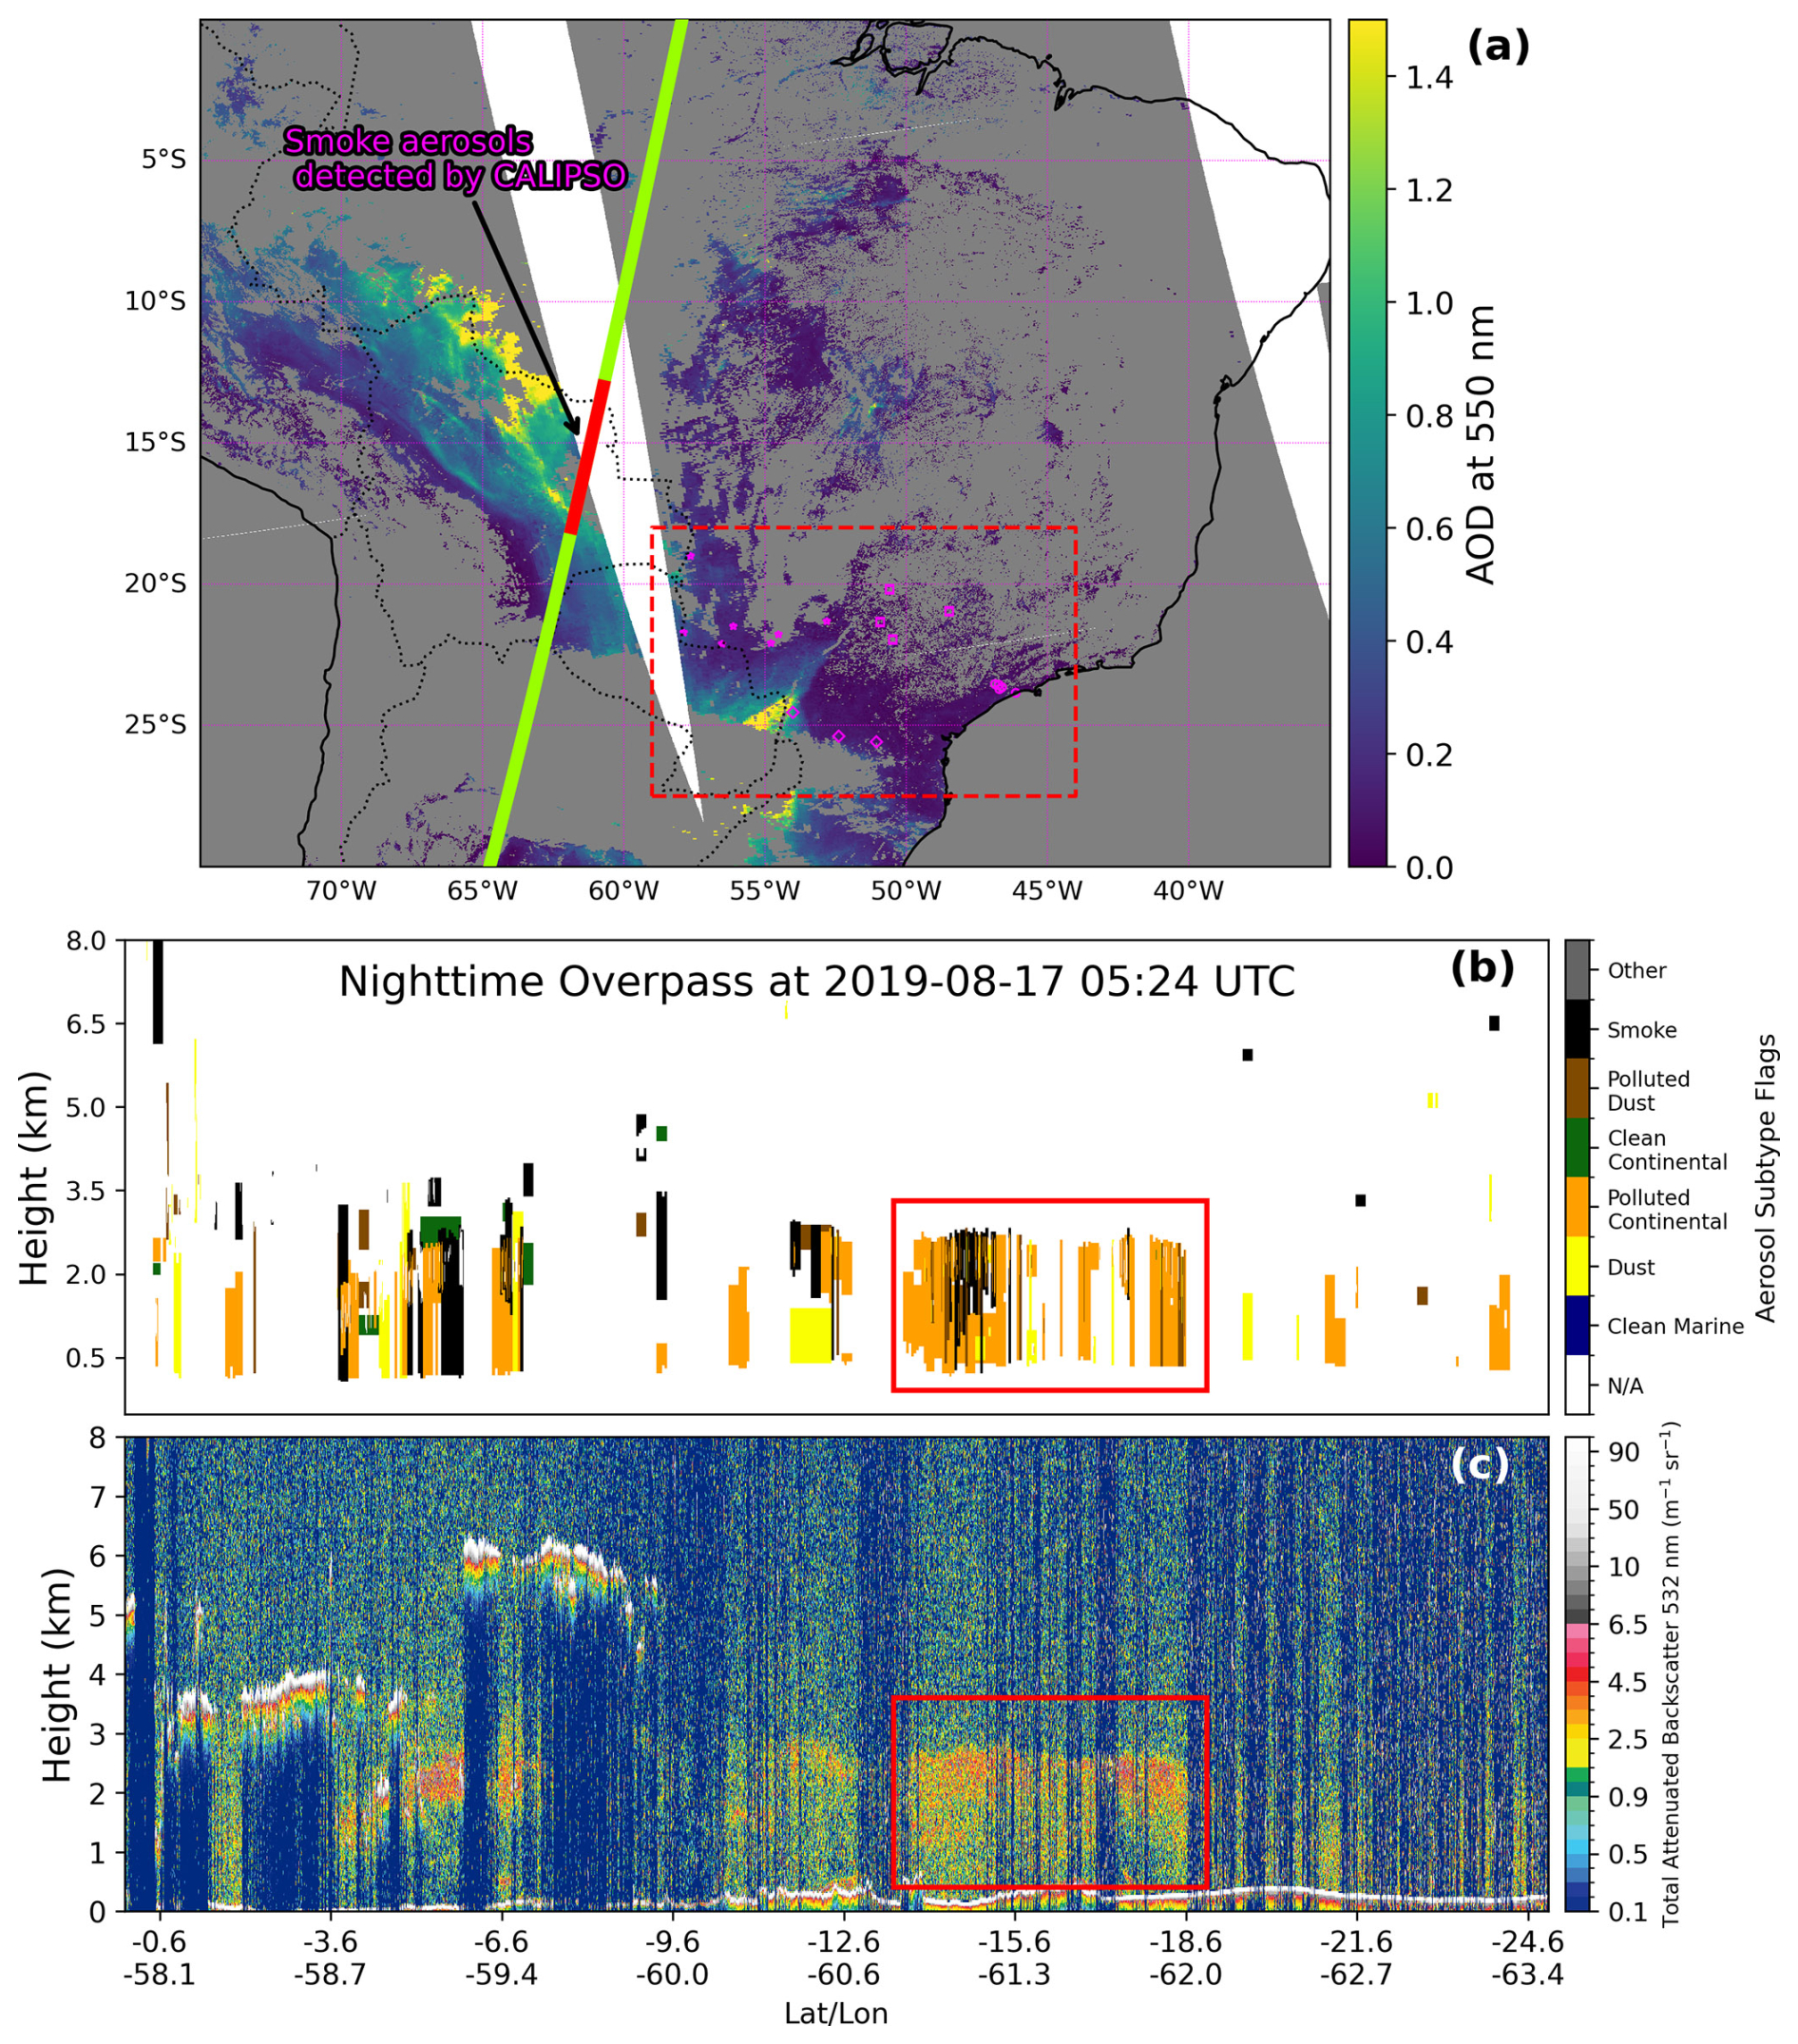
Figure 2MODIS aerosol optical depth at 550 nm (AOD550) for the Aqua overpass on 17 August 2019 (15:10–20:05 UTC) (a), CALIPSO aerosol subtype profile (b) and total attenuated backscatter at 532 nm (c) during the 05:42–05:49 UTC overpass across South America on the same day. The dashed rectangle in (a) denotes the study area and the station locations shown in Fig. 1. The solid line represents the CALIPSO track (width not to scale), with the aerosol layer that potentially arrives over the MASP region 2 d later highlighted in red. In panels (b) and (c), the rectangle marks the aerosol layers identified in panel (a) as potential contributors to the AOD increase over the MASP region 2 d later.
3.1 MASP's air parcels origin on 19 August
Figure 2 depicts the AOD550 map from MODIS Aqua on 17 August 2019, between 17:00 and 18:00 UTC and the profile of aerosol subtypes and of total attenuation backscatter signal from CALIPSO at 532 nm on the same day, between 05:42 and 05:49 UTC. Note, over South America, between 14–18° S and 61–62° W, there is a layer with the bottom at about 1.5 km and the top at 3 km, whose total attenuated backscatter values varied from 1.5 to 5 . This layer was identified as the subtype polluted continental/smoke with elevated smoke by the CALIPSO retrieval algorithm.
Figure 3 shows the area density of the origin of air parcels at 06:00 UTC on 17 August, which arrived at MASP on 19 August, and the fire spots and the CALIPSO satellite overpass track on 17 August. The trajectories of air mass originated around the border of Brazil and Bolivia, where a high number of fire spots were detected. Note that the aerosol layer observed by the CALIPSO (a.s.l) overpass crossed this region characterized by high density of air parcels and high fire spot number.
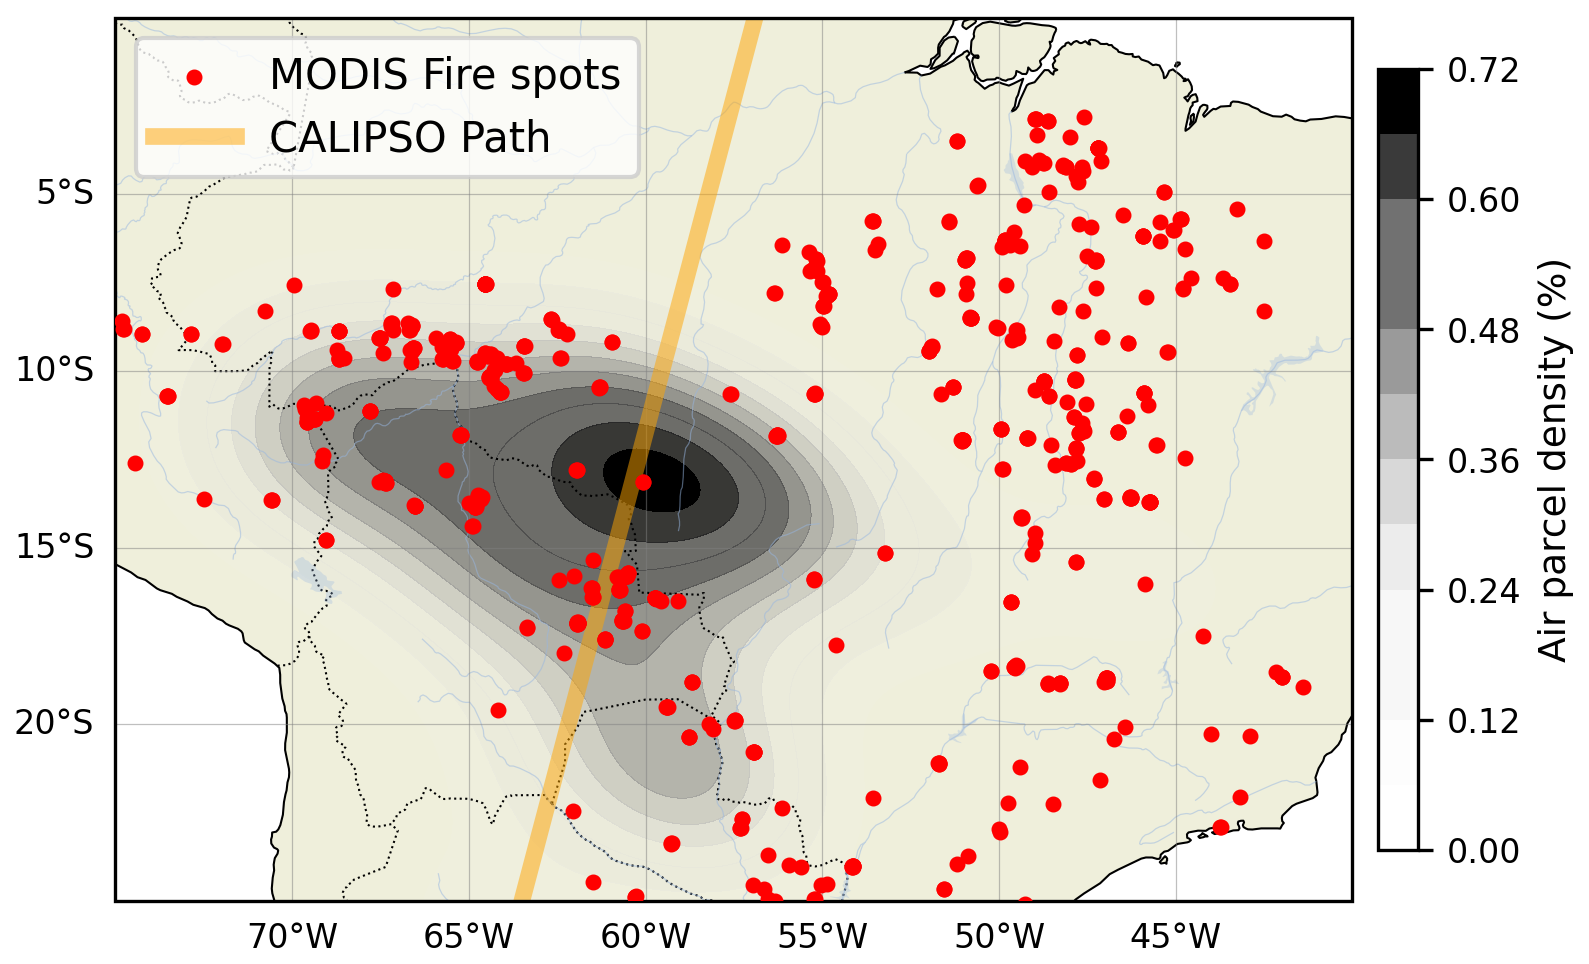
Figure 3Density of an air parcel's departure position (shaded) toward CTC estimated with HYSPLIT back trajectories analysis at 06:00 UTC on 17 August for arrival heights of 2, 3 and 4 km; the CALIPSO's path on that day (width not in scale); and fire spots detected by the FireMask(red dots) are also plotted.
Figure 4 shows the HYSPLIT back trajectories arriving at MASP (CTC station) at three altitude levels: 2, 3 and 4 , at 06:00, 12:00, 18:00 and 21:00 UTC. The air parcels followed a northwest to southeast trajectory, originating in the Brazilian middle west, east of Bolivia and north of Paraguay. The parcels' altitude increased with time, except for the ones arriving at MASP at 12:00 UTC and at the altitude of 2 km above ground. Some parcels originated near the surface 2 d before, especially those that arrived at CTC at 3 km at 12:00 and 21:00 UTC and parcels arriving at 2 km around 18:00 UTC.
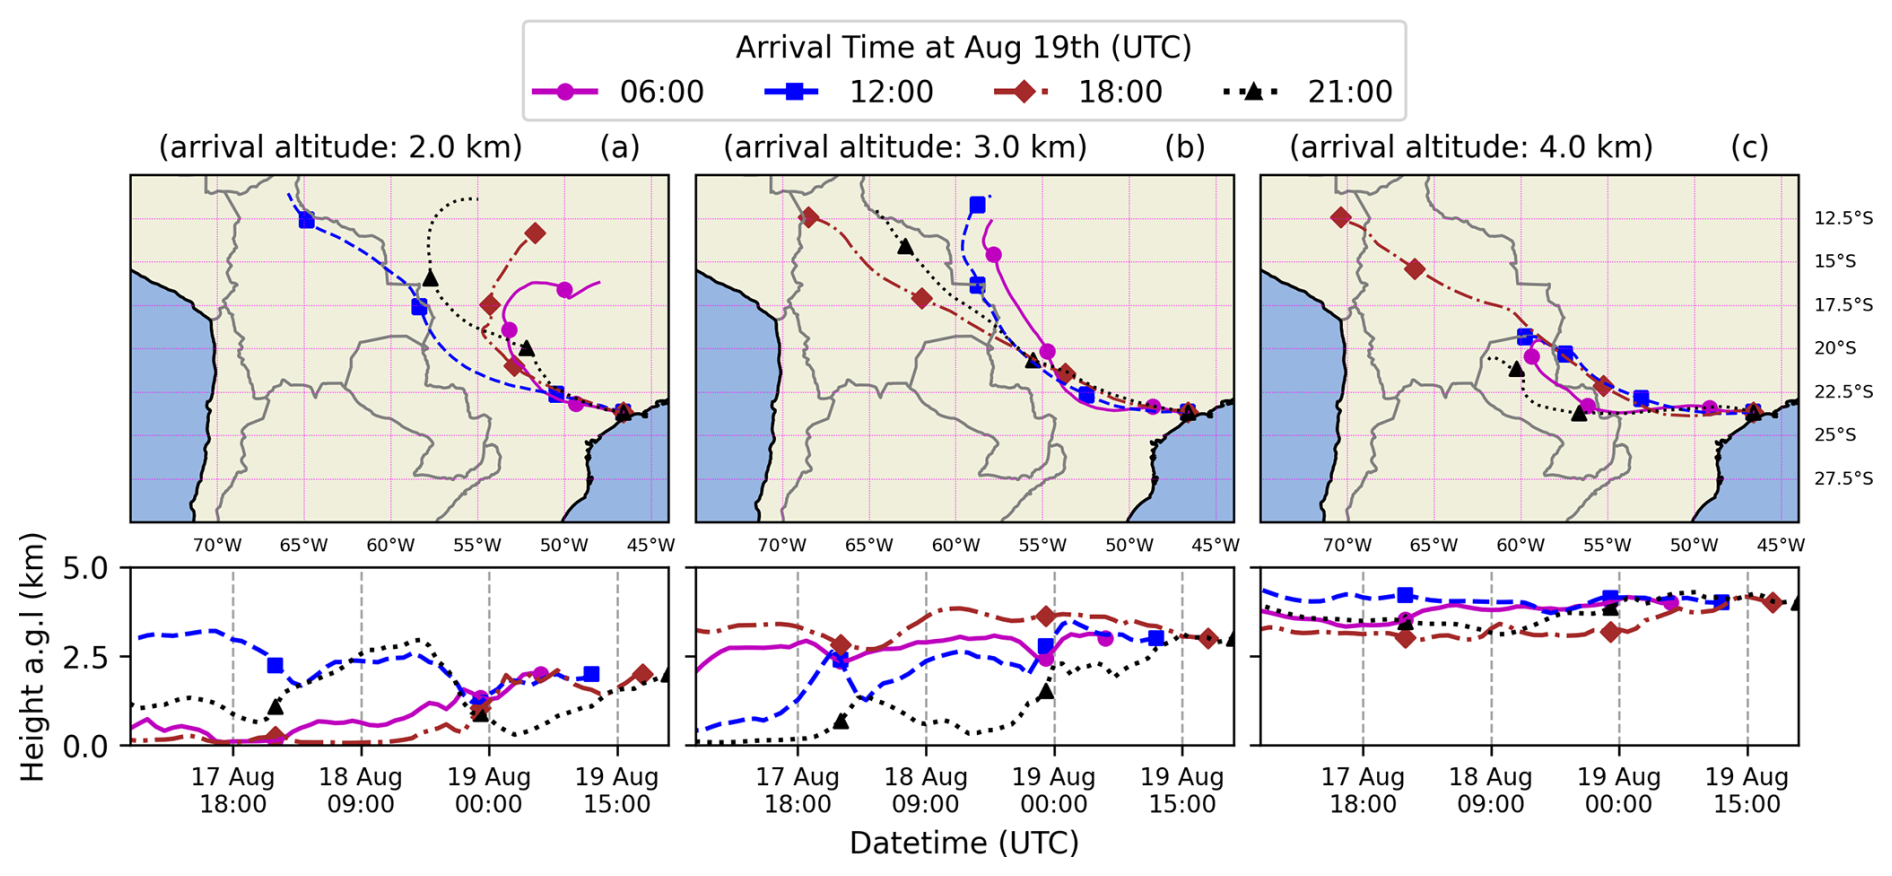
Figure 4Air parcels which arrived at CTC in MASP, at 06:00, 12:00, 18:00 and 21:00 UTC on 19 August 2019, at three altitude levels 2 km (a), 3 km (b) and 4 km (c). Markers represent the last hour of each day.
3.2 Regional radiative impact of the smoke
This section analyses the transport of the smoke plume and what happened to the surface solar radiation along the way and when/where the smoke and the clouds mixed, using satellite-derived products, reanalysis data and surface measurements collected at the meteorological station network.
Figure 5 presents GOES-16 natural colour RGB imagery combined with 850 hPa wind vectors and pressure field at sea level, covering the study region from 16 to 19 August at 16:00 UTC. Clear skies were predominant on 16 and 17 August, with stronger northerly winds observed in the western part of the region. On 18 August, there was a noticeable increase in smoke, accompanied by westerly winds and clouds extending across Paraná (MS), parts of Mato Grosso do Sul (MS) and São Paulo (SP-W). A cold front reached the Metropolitan Area of São Paulo (MASP) on 19 August, pushing the smoke plume observed above the cloud layers toward MASP. Consequently, the combination of clouds and smoke became more prevalent between 18 and 19 August across the southeast region and especially over MASP on 19 August.
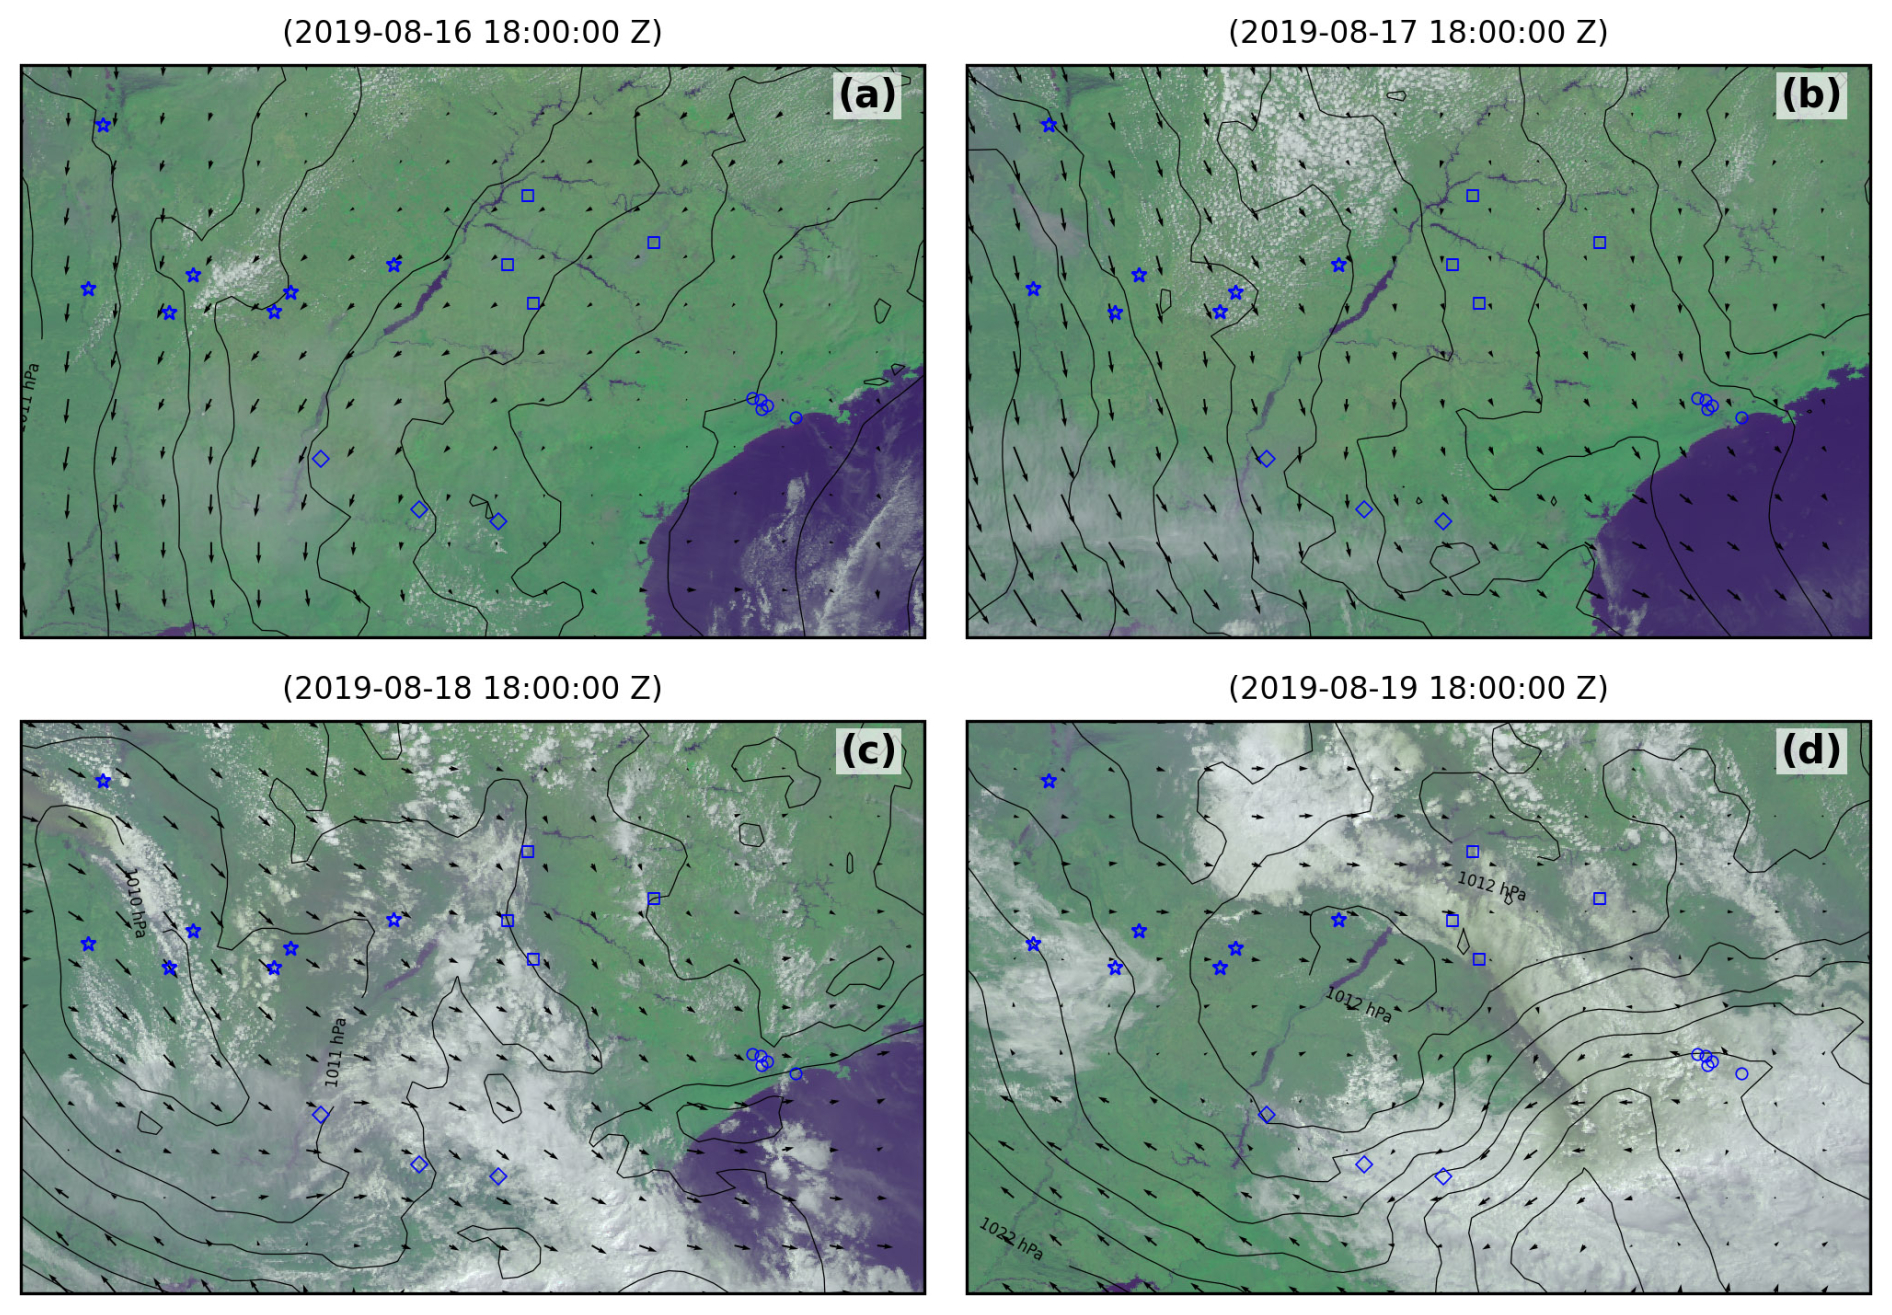
Figure 5Sequence of RGB satellite maps in natural colour using channels 2 (0.64 µm), 3 (0.86 µm) and 1 (0.47 µm) from GOES-16, allowing observation of cloud cover and the smoke plume. The maps also display wind components at 850 hPa (arrows) and mean sea level pressure isobars (lines) from ERA5 Reanalysis around 18:00 UTC (15:00 LT), for 16 August (a), 17 August (b), 18 August (c) and 19 August (d). The selected region is the same as in Fig. 1 and includes the stations, shown as markers.
Daily time series of the maximum AOD at 550 nm from MODIS and MERRA-2 are shown in Fig. 6, with MERRA-2 AOD included only when the corresponding MODIS data were unavailable within a maximum distance of 0.4°. AOD increase was first observed at stations near the wildfires' source (MS), followed by PR state, around 18 August and 1 d later at stations in the eastward regions (SP-W and MASP). Note that maximum AOD values, exceeding 1.1, at MASP were estimated by MERRA-2 with bias correction on 18, 19 and 20 August. A particularly significant event occurred on 19 August at MASP, marked by strong darkness due to the combination of smoke and clouds.
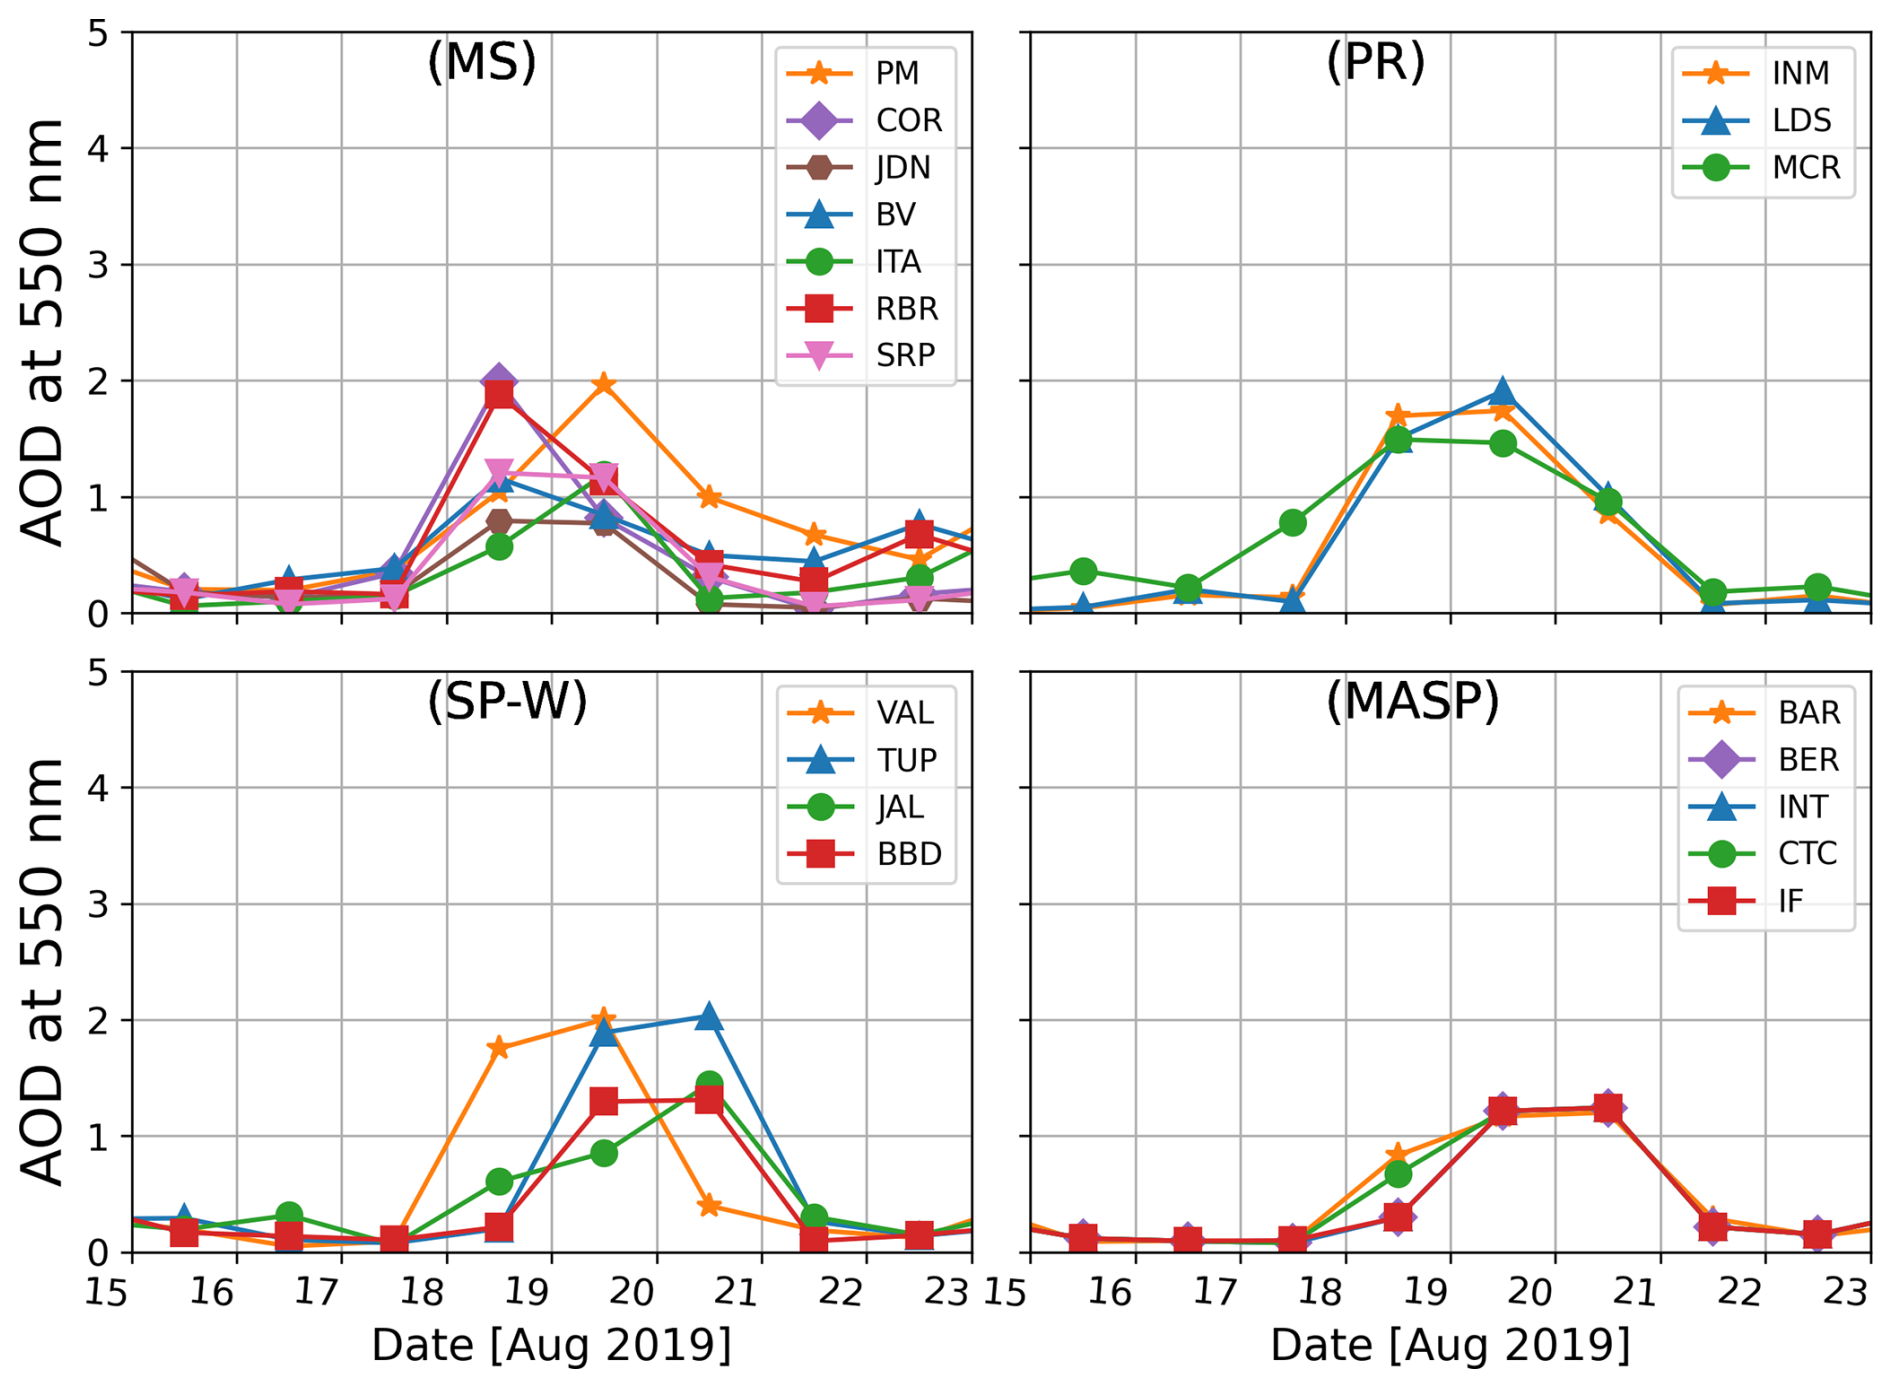
Figure 6Time series of daily maximum AOD at 550 nm measured by MODIS or estimated by MERRA 2 over each meteorological station considered in this study (INMET, IF and CTC). MERRA-2 AOD was included only when the corresponding MODIS data were unavailable within a maximum distance of 0.4°.
Figure 7 shows all-sky values of upward irradiance at TOA at 13:00 and 18:00 UTC from CERES on board Terra and Aqua satellites, respectively. On 18 August, irradiance increased over the MS region, coinciding with higher AOD at 550 nm, and exceeded 250 W m−2 over station SRP, in the MS state. In other regions, the increase in irradiance was attributed to the combined effects of clouds and smoke. The SP-W region showed increased upward shortwave irradiance at the TOA between 18 and 19 August. The highest TOA irradiance was observed over MASP on 19 August, reaching above 500 W m−2, an increase in 350 W m−2 compared to previous days.
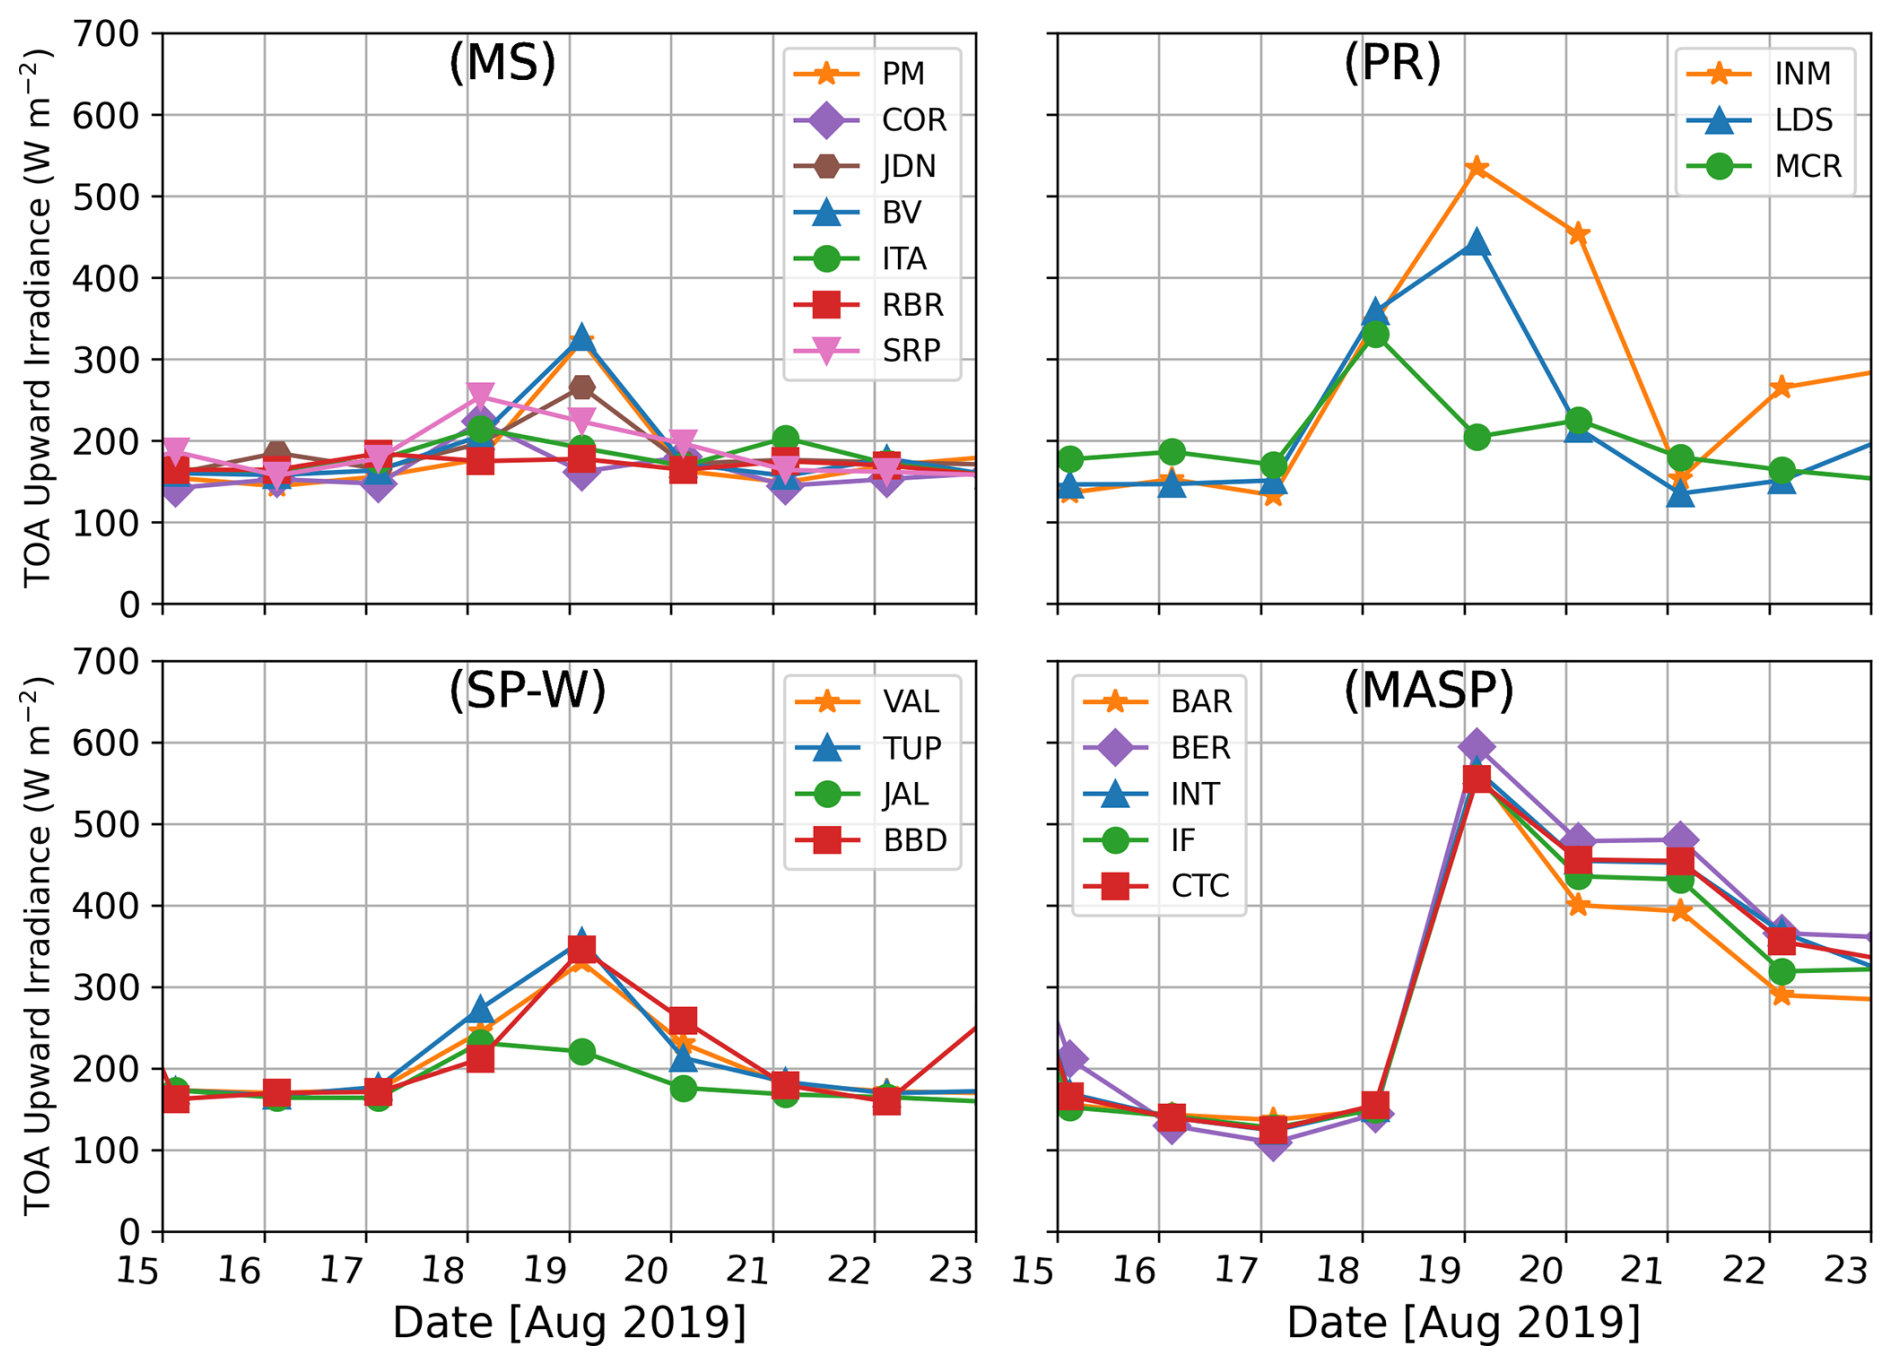
Figure 7Upward solar irradiance at the top of the atmosphere (TOA) estimated from CERES at the time of the overpasses in each region at 13:00 and 18:00 UTC.
Figures 8 and 9 present the evolution of the all-sky daily mean of GHI at the surface estimated from CERES, along with the Kt from ground-based measurements. Note that the CERES mean values only take into account hours between 13:00 and 18:00 UTC, while the ground-based data consider hours from sunrise to sunset. As previously noted, an increase in smoke combined with clouds is observed starting on 18 August, particularly in the MS region in the northeast of the study area and the PR region in the southwest, influenced by the cold front approaching. The MS stations showed a minimum in irradiance 1 d before the smoke-affected day in MASP, with Kt values near 0.4 and CERES downward irradiance around 400 W m−2. In addition, the southernmost PR region experienced lower values due to stronger cloud front influence, with Kt near 0.3 and average GHI from CERES around 200 W m−2 .
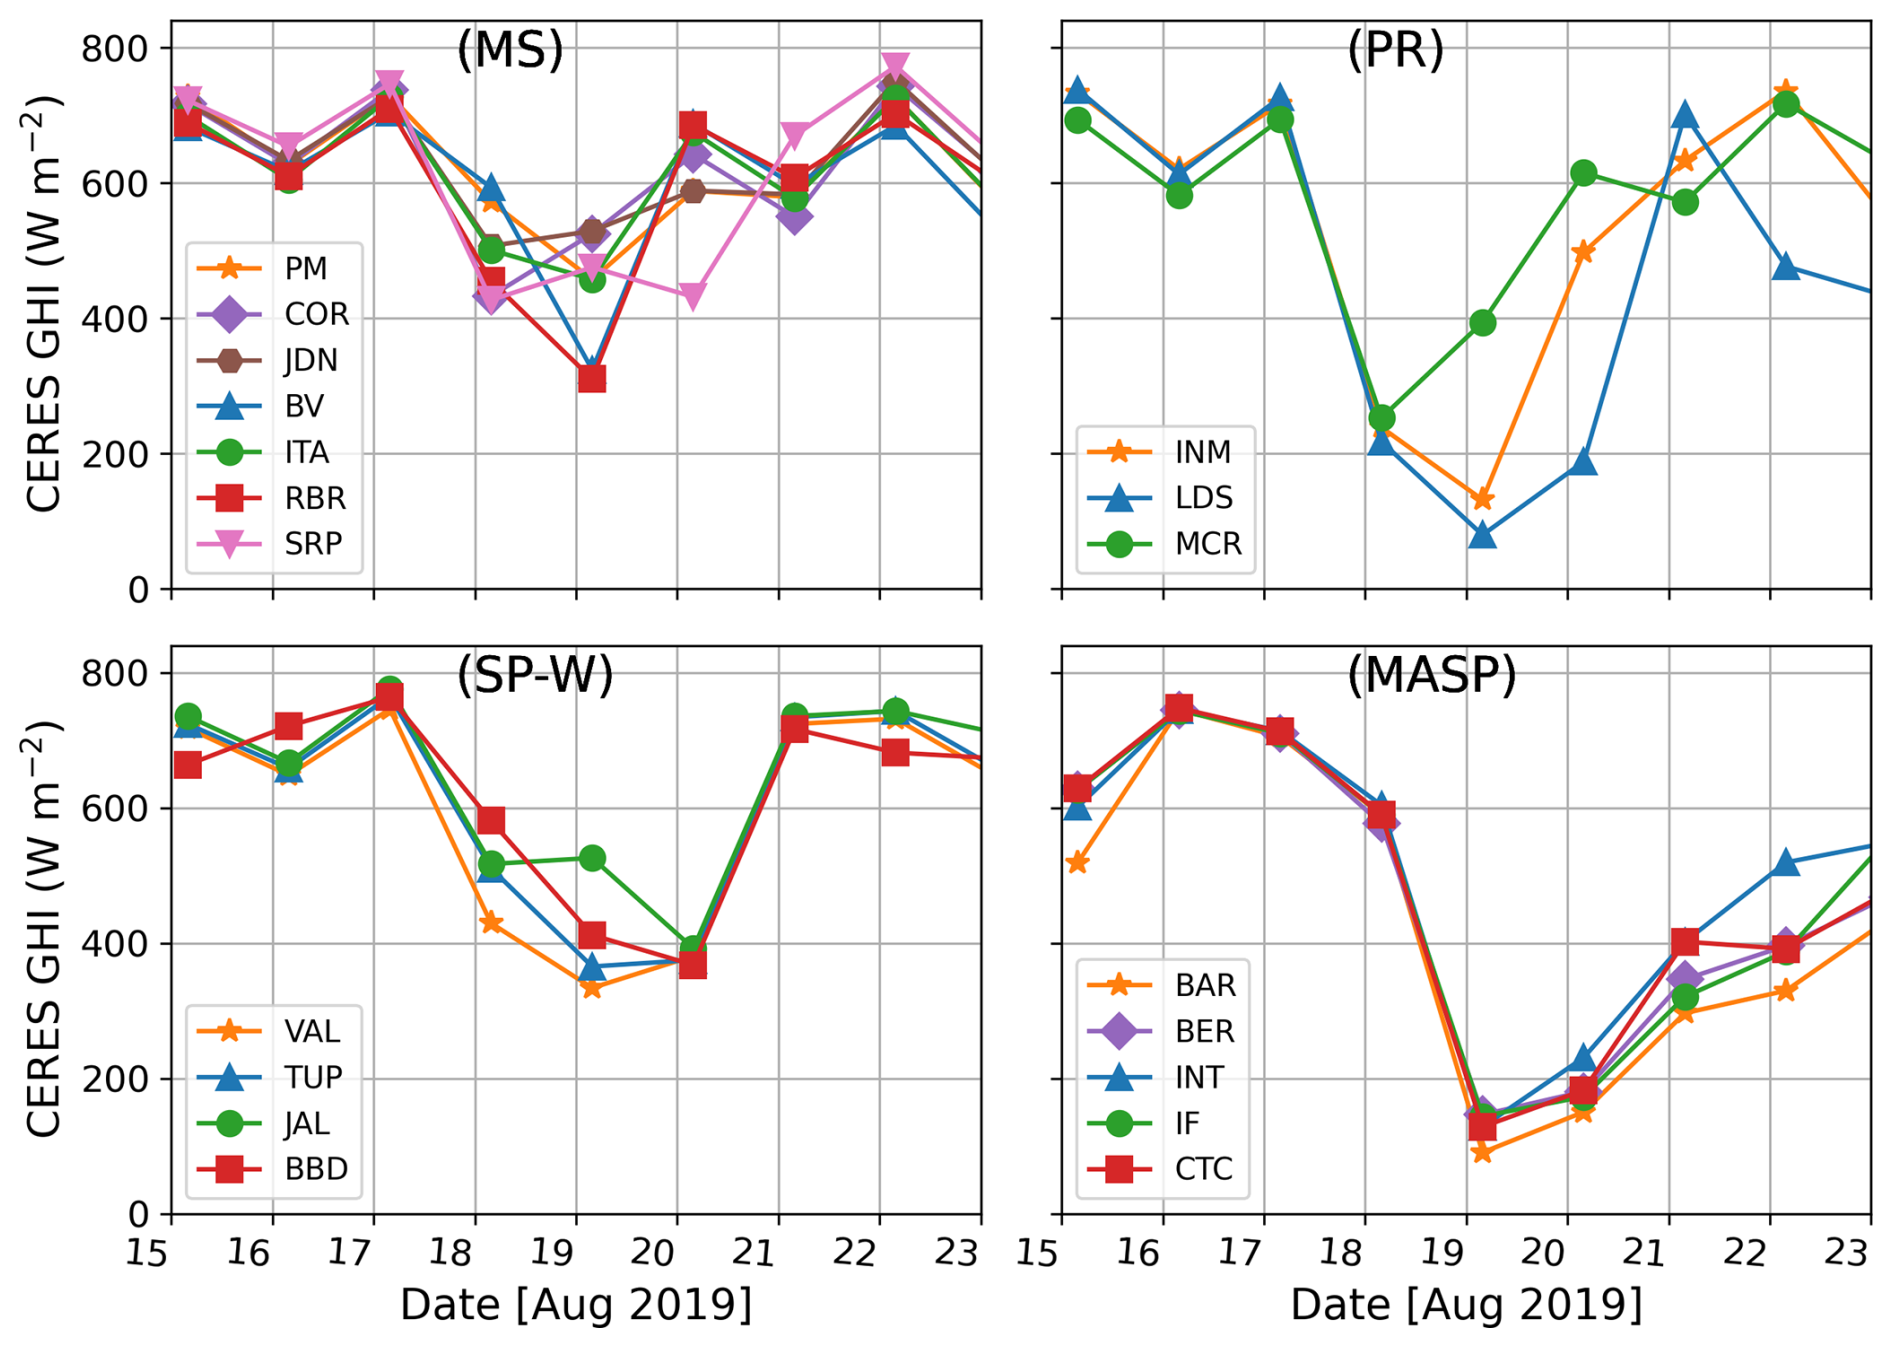
Figure 8CERES daily-mean all-sky GHI estimated at INMET, IF and CTC stations. Daily-mean values were computed only using the available hours from CERES.
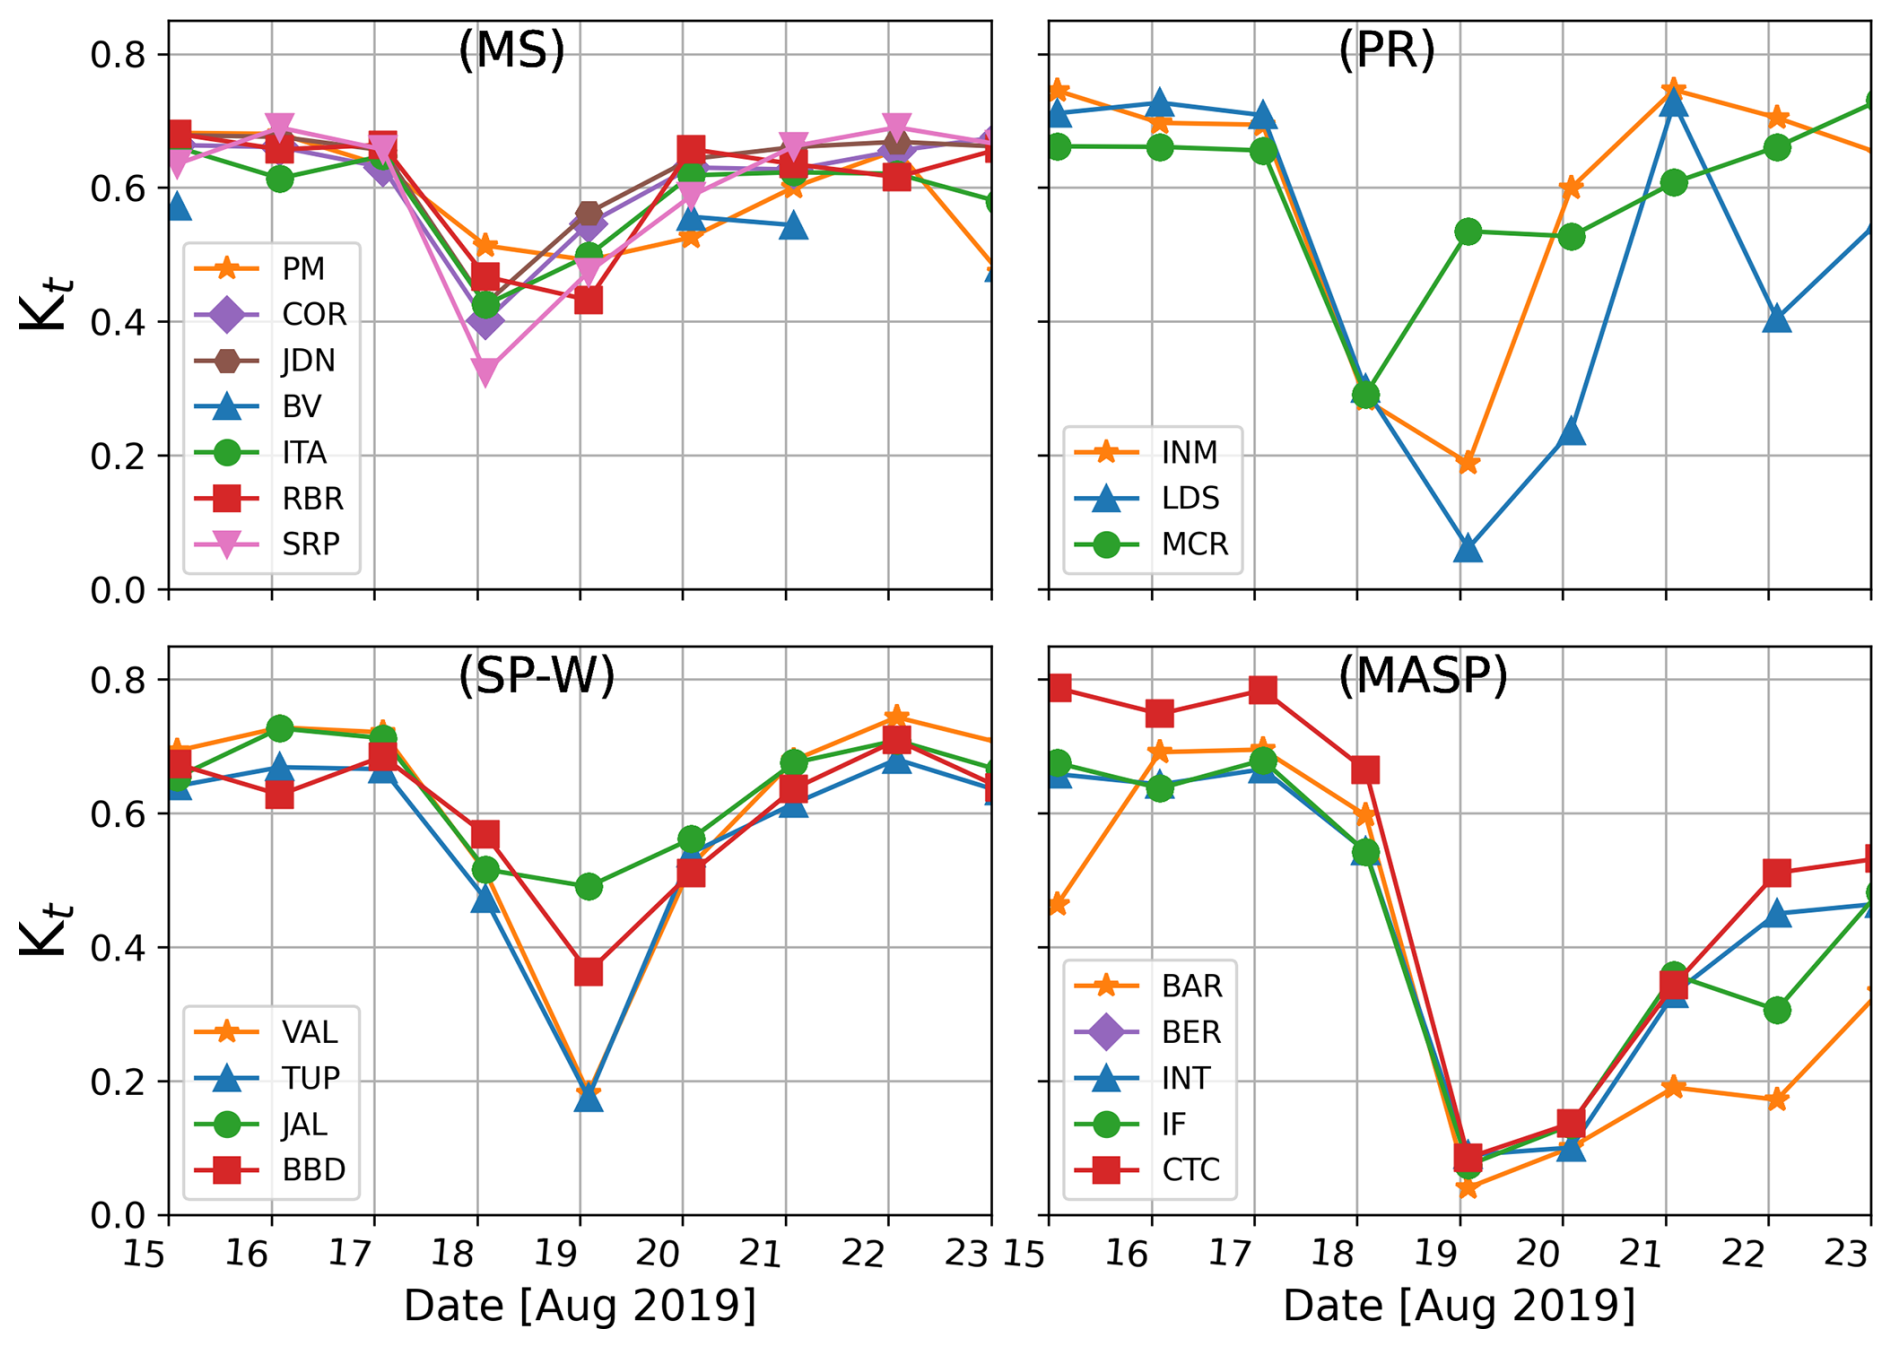
Figure 9Evolution of diurnal clearness index (Kt) in the four regions from 15 to 23 August 2019 computed from the meteorological station measurement network.
In the MASP, on 19 August, all stations agree with daily GHI dropped from 600 W m−2 on the previous day to around 100 W m−2 (Fig. 8), while Kt decreased from 0.6 to near 0.1 (Fig. 9). The daily Kt values near of 0.1 in MASP fall below the first percentile of the distribution from the past 2 years of all-sky observations in the region, indicating an extreme reduction in surface downward shortwave irradiance.
3.3 Cloud radiative impacts and the darkness event on 19 August at MASP
The high-temporal-resolution (1 min) measurements of global horizontal irradiance (GHI) at the CTC station are analysed and discussed in this section, with particular emphasis on their behaviour during the darkness event on 19 August 2019. This date is hereafter referred to as the “smoke-affected day”.
In Fig. 10, we present the 1 min diurnal cycle of GHI, along with the average diurnal cycle for the 15 d before and after the smoke-affected day, all under all-sky conditions. Note that the darkness conditions (irradiances to zero) lasted around 40 min, starting near 15:00 LT. The average diurnal cycle of the preceding and following 15 d shows irradiances up to 150 W m−2, after 15:00 LT. When the darkness event began, CSZA was 0.6, which corresponds to a moderate Sun elevation angle of around 36°. The duration of the darkness event on 19 August 2019 was twice the maximum darkness period observed on any single day during the last 2 years of measurements.
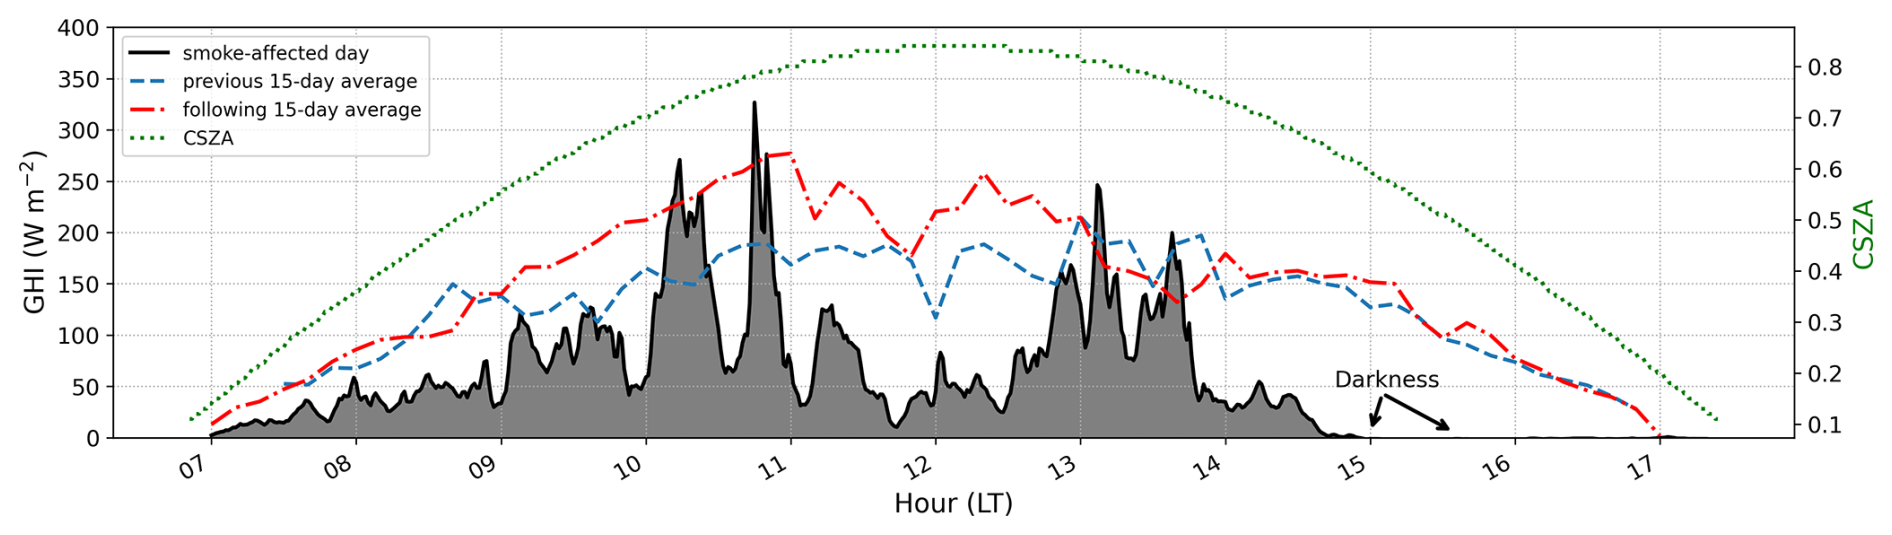
Figure 10Downward solar irradiance at the surface (GHI) during the smoke-affected day (19 August 2019) and average of 15 d before and after for all-sky conditions. In addition, the diurnal cycle of the cosine of the solar zenith angle (CSZA) for the smoke-affected day is shown.
In Fig. 11, a comparison of 1 min COD between overcast days and the smoke-affected day is shown. Overcast days were selected as days with 100 % of cloud amount, including low clouds, throughout the entire day, confirmed by visual observations at the CTC station. A total of 6 overcast days with valid CNR4 measurements were found in the range 2018–2020.
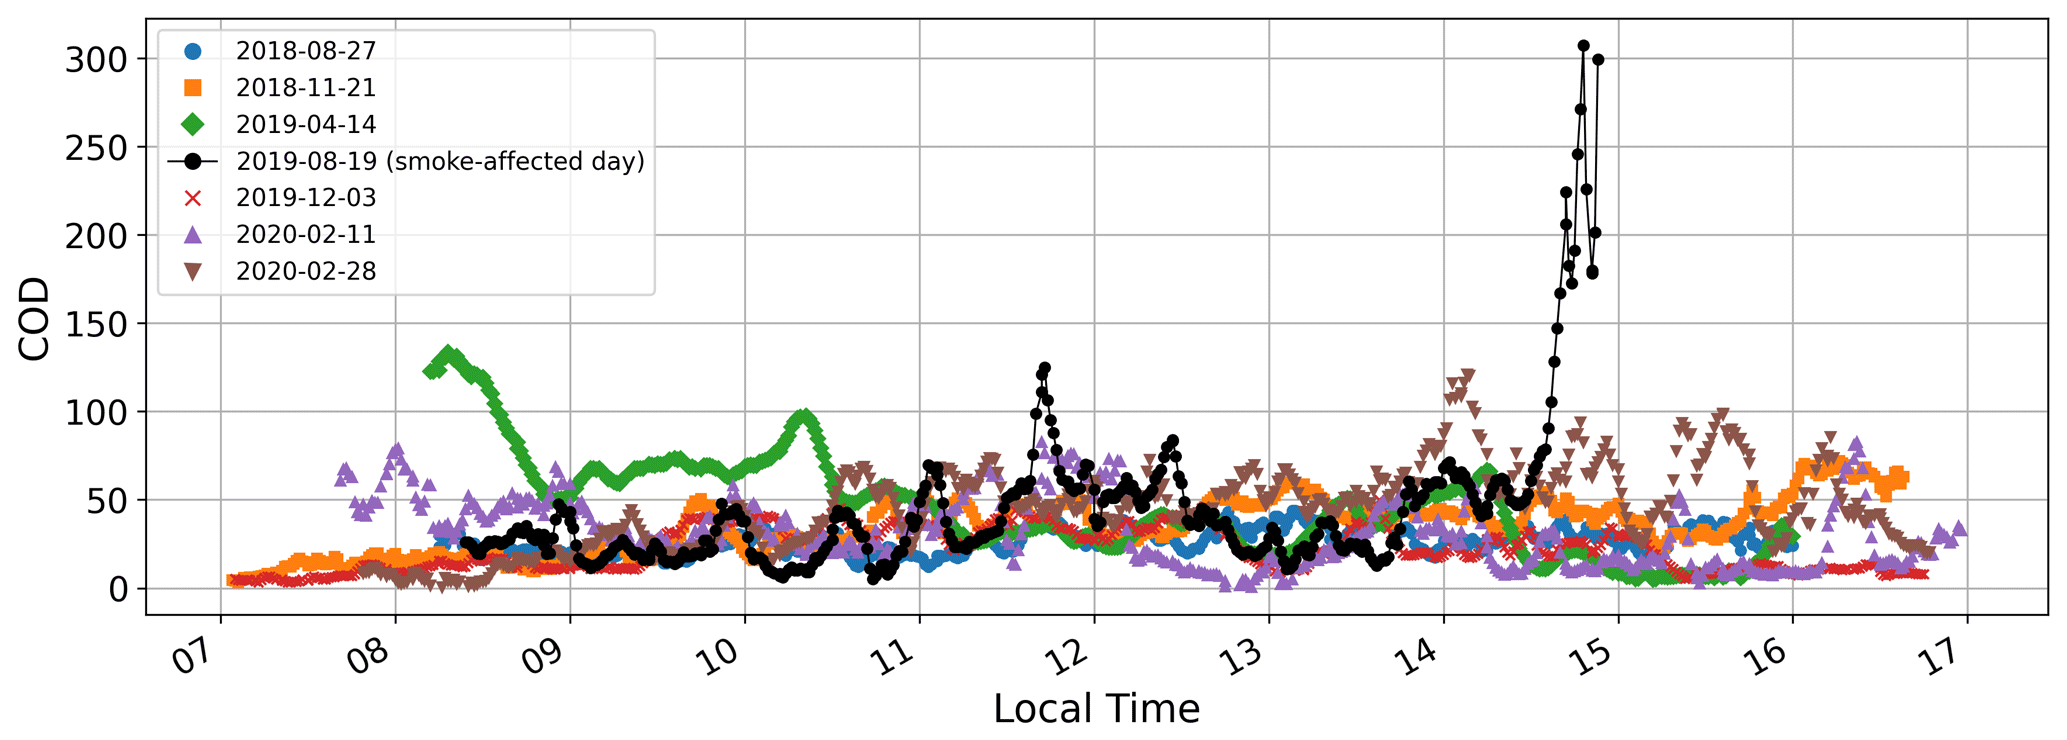
Figure 11Cloud optical depth (COD) retrieved from CNR4 measurements for the smoke-affected day (19 August 2019) and 6 other overcast days found for the period of 2018–2020.
Note that COD values rarely exceed 100 on the overcast days. However, on the smoke-affected day we observed exceptionally high COD values between 14:40 and 15:00 LT, with peaks reaching 300. After 15:00 LT, the irradiance dropped to zero, making it impossible to retrieve COD data. This peak, near 300, was twice as high as the maximum COD observed on any of the other 6 overcast days. This significant increase in COD is clearly attributed to an extremely thick cloud band associated with the arrival of a cold-front system in the MASP region. The passage of the cold front favoured the transport of smoke aerosols into the MASP region. Combined with convective activity, this likely enhanced the presence of optically thick clouds.
The relationship of NCRE and COD was proposed by Mateos et al. (2014) for estimating cloud radiative efficiency. The cloud radiative efficiency quantifies the cloud radiative effect per unit of COD and can be used to analyse how the changes in aerosol and cloud properties can change the cloud radiative properties. The radiative efficiency of clouds can be sensitive to CSZA, aerosols and cloud properties. For instance, we expect a more radiative effect per unit of COD at high CSZA values, as well as in clouds with higher extinction properties (scattering and absorption). Errors in aerosol properties, estimated under clear-sky conditions, lead to uncertainties in the COD retrieval and, consequently, in the NCRE.
Figure 12 shows the relationship between NCRE and COD for the overcast days selected, along with the aerosol properties errors on the COD retrieval and the NCRE. The error analysis considered the propagation of uncertainties in aerosol optical depth (AOD) and single-scattering albedo (SSA). We assumed an uncertainty of 0.06 for AOD at 550 nm and 0.1 for SSA, resulting in a 2 % uncertainty in NCRE and a 15 % in COD, respectively.
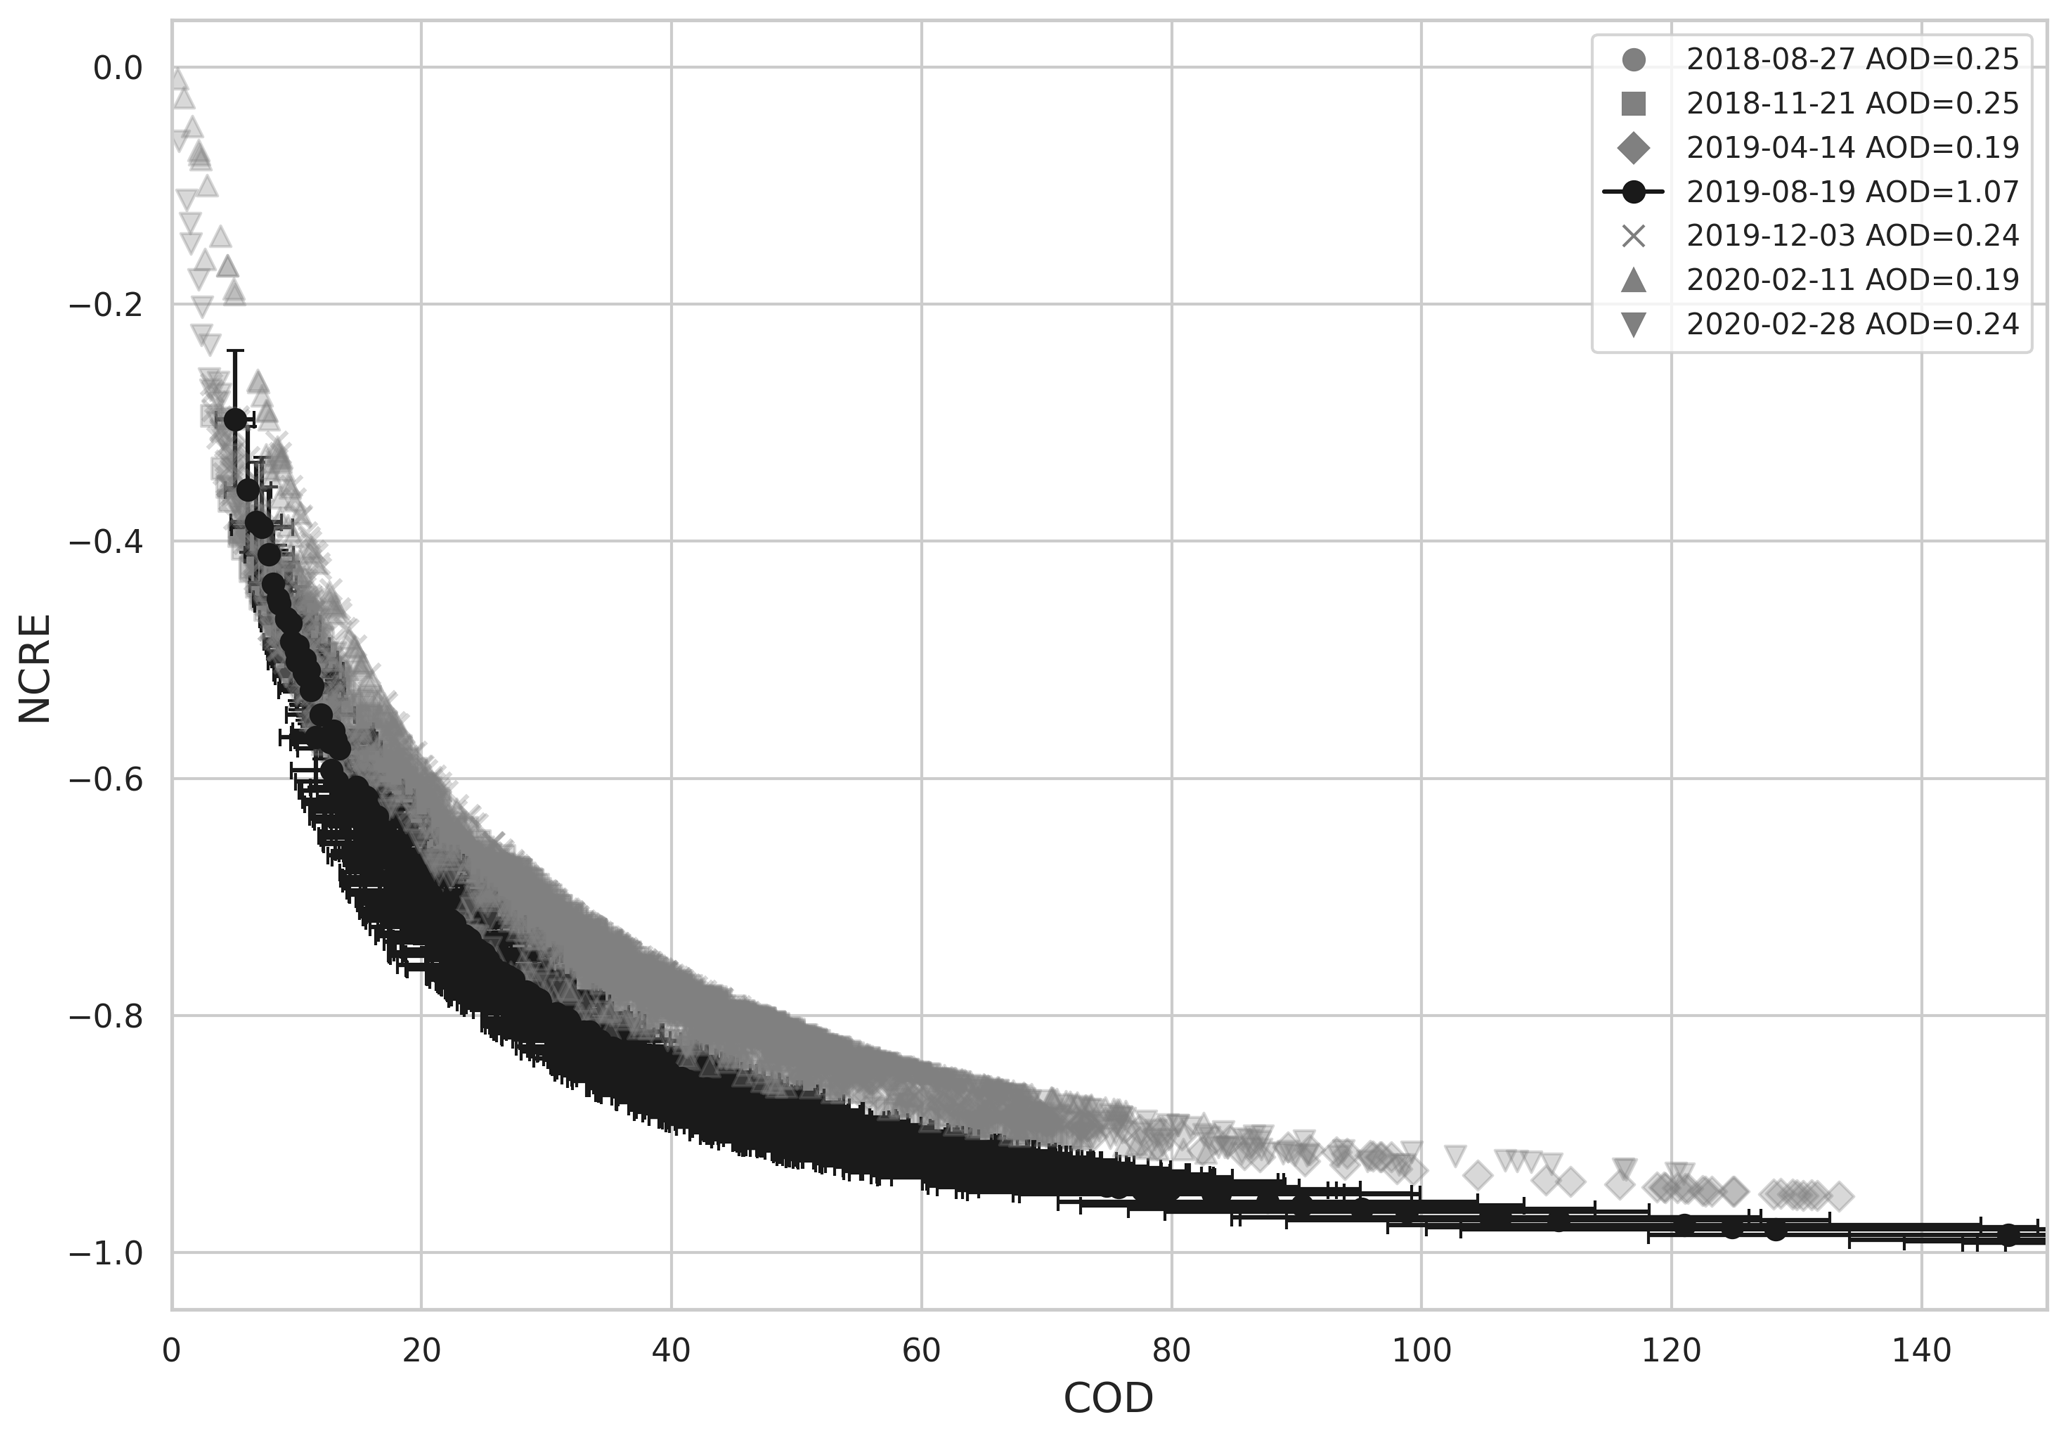
Figure 12Normalized cloud radiative effect (NCRE) versus cloud optical depth (COD) for the smoke-affected day (“19 August 2019”) and 6 other overcast days. Uncertainties associated with the estimation of each variable are also shown as vertical and horizontal bars.
As expected, NCRE became more negative (indicating a stronger radiative effect) with increasing COD, until it remained steady at a COD value above 100. The smoke-affected day exhibited the highest efficiency (NCRE per unit of COD). Note that on this day, NCRE reached a value of −0.96, within the COD interval of 0–100 equivalent to a 96 % reduction in downward irradiance. By contrast, for the other overcast days within the same interval, NCRE reached −0.93. The differences in NCRE between other overcast days and the smoke-affected day are approximately 7 %, with statistical significance at the 5 % confidence level, as confirmed by the Mann–Whitney U test (Mann and Whitney, 1947). Note that the difference with the other days is more evident for higher COD, where there is no overlap between the curves, including the error bars. To remove the effect of the CSZA in the analysis we compared the smoke-affected day with an overcast day in the same season (27 August 2018). Differences revealed a 6 % more cooling effect on the smoke-affected day, confirming that the high radiative efficiency is due to changes in the radiative properties of clouds affected by the aerosol intrusion. The increase in extinction capacity of shortwave radiation by clouds embedded in the biomass burning absorbing aerosol layers can explain the increase in absorption and multiple scattering of cloud droplets. These results analysed here highlight the unique and extreme characteristics of clouds embedded within smoke plumes and are also consistent with those observed in various regions. Gautam et al. (2016) reported spectral modifications in clouds influenced by smoke, particularly in the visible (VIS) and ultraviolet (UV) regions, with an enhancement of approximately 20 %. Kaufman and Fraser (1997) observed a 28 % increase in reflectance in clouds affected by smoke in the Amazon and Cerrado basins of Brazil. Sarkar et al. (2022) found a 50 %–60 % increase in the fraction of low clouds over the Indian landmass due to elevated smoke levels. Twohy et al. (2021) documented higher cloud droplet concentrations and smaller droplet sizes in low cumulus clouds during the wildfire season in the western United States. Conrick et al. (2021) studied dense smoke over the Pacific Northwest and reported changes in cloud microphysics, including an increase in small droplet concentrations, as well as thermodynamic effects that enhanced cloud lifetimes.
This study analyses a strong event of biomass burning aerosol transport from the central portions of South America during August 2019, with a particular focus on its intrusion into the southeastern of Brazil and the Metropolitan Area of São Paulo (MASP), where a “black rain” and an extreme radiative darkness event occurred on 19 August 2019.
According to HYSPLIT back trajectories, air parcels arriving over MASP on this day followed a northwest-to-southeast trajectory, originating in the Brazilian middle west, east of Bolivia and north of Paraguay. The displacement of the smoke plume was tracked by ground-based and satellite data.
The combination of clouds with smoke led to a strong radiative effect over MASP. The clearness index (Kt) dropped to 0.1, which is below the first percentile of the distribution for all-sky observations over the previous 2 years, indicating an extreme reduction in surface downward shortwave irradiance, particularly in MASP.
The combination of clouds and smoke also exhibited a 7 % higher radiative extinction efficiency compared to other overcast days during the previous 2 years, suggesting that the presence of smoke particles may have resulted in more effective solar radiation extinction per unit of cloud optical depth, particularly for higher COD values.
The 19 August 2019 darkness event in the MASP was a unique event in regard to the complex interaction between smoke aerosol plumes and clouds. This study hopes to shed light on important aspects, from a radiative point of view, that can drive such types of impact. The lack of public policies and the recurrence of severe dry conditions in Brazil in recent years have caused smoke transport towards MASP to be more frequent and intense, therefore impacting, for instance, initiatives of greenhouse gas mitigation using the sun as the main source of energy using photovoltaic systems. Further studies, especially in the field of modelling, are encouraged to evaluate the role of microphysical aspects in the discussed cloud smoke interaction and darkness event.
CERES SSF TOA/Surface Fluxes – Terra Level 2, Edition 4A: https://doi.org/10.5067/TERRA/CERES/SSF_Terra-FM1_L2.004A (NASA/LARC/SD/ASDC, 2014).
CERES SSF TOA/Surface Fluxes – Aqua Level 2, Edition 4A: https://doi.org/10.5067/Aqua/CERES/SSF-FM3_L2.004A (NASA/LARC/SD/ASDC, 2014).
MOD04_3K – MODIS/Terra Aerosol 5-Min L2 Swath 3km, Collection 6.1: https://doi.org/10.5067/MODIS/MOD04_3K.061 (Levy et al., 2015a).
MYD04_3K – MODIS/Aqua Aerosol 5-Min L2 Swath 3 km, Collection 6.1: https://doi.org/10.5067/MODIS/MYD04_3K.061 (Levy and Hsu, 2015b).
MODIS/Terra Thermal Anomalies/Fire 5-Min L2 Swath 1 km: https://doi.org/10.5067/MODIS/MOD14.006 (Giglio and Justice, 2015a).
MODIS/Aqua Thermal Anomalies/Fire 5-Min L2 Swath 1 km: https://doi.org/10.5067/MODIS/MYD14.006 (Giglio and Justice, 2015).
MERRA-2 tavg1_2d_aer_Nx: Aerosol Diagnostics: https://doi.org/10.5067/KLICLTZ8EM9D (Global Modeling and Assimilation Office (GMAO), 2015).
CALIPSO Lidar Level 1B Profile Data (CAL_LID_L1-Standard-V4-51): https://doi.org/10.5067/CALIOP/CALIPSO/CAL_LID_L1-Standard-V4-51 (NASA/LARC/SD/ASDC, 2025).
CALIPSO Lidar Level 2 Vertical Feature Mask (VFM), Standard, Version 4-20: https://doi.org/10.5067/CALIOP/CALIPSO/LID_L2_VFM-STANDARD-V4-20 (NASA/LARC/SD/ASDC, 2018).
GOES-16 ABI Level 2 Cloud and Moisture Imagery – Full Disk, Mesoscale 6: https://doi.org/10.7289/V5736P36 (GOES-R Algorithm Working Group and GOES-R Series Program, 2017).
Copernicus ERA5 Reanalysis Dataset: https://doi.org/10.24381/cds.adbb2d47 (Hersbach et al., 2023).
Instituto Nacional de Meteorologia (INMET), Banco de Dados Meteorológicos para Ensino e Pesquisa (BDMEP) – Surface Irradiance Data: https://bdmep.inmet.gov.br/ (last access: 5 August 2024).
The libRadtran Software Package for Radiative Transfer Calculations: http://www.libradtran.org/doku.php?id=download (last access: 1 September 2023).
JRS conceptualized the study, conducted the computations of the radiative transfer processes and drafted the initial manuscript. GLdS focused on the HYSPLIT analysis, the analysis of data from CERES and MODIS, and the identification of the aerosol smoke plume source. MAY contributed to the development of the methodology, verified and corrected computations, and provided significant support in drafting the manuscript. NÈdR helped in the theoretical analysis of the radiative processes and contributed extensively to writing and presenting the results.
The contact author has declared that none of the authors has any competing interests.
Publisher's note: Copernicus Publications remains neutral with regard to jurisdictional claims made in the text, published maps, institutional affiliations, or any other geographical representation in this paper. While Copernicus Publications makes every effort to include appropriate place names, the final responsibility lies with the authors.
The authors would like to thank the AERONET, CALIPSO and MODIS teams for providing valuable information on aerosol properties. We also thank the Instituto Nacional de Meteorologia (INMET) for granting access to the pyranometer measurement network. Our appreciation extends to the staff at Parque de Ciência e Tecnologia of the University of São Paulo (CIENTEC) for their dedication in maintaining the deployed instruments. Special thanks are due to Bernard Mayer for the LibRadtran radiative transfer code.
This research has been supported by the Conselho Nacional de Desenvolvimento Científico e Tecnológico (grant nos. 140117/2019-9, 313005/2018-4 and 311984/2021-5) and the Fundação de Amparo à Pesquisa do Estado de São Paulo (grant nos. 2018/16048-6, 2019/20794-8, 2016/18438-0 and 2022/02609-1).
This paper was edited by Stelios Kazadzis and reviewed by three anonymous referees.
Altaratz, O., Koren, I., Remer, L. A., and Hirsch, E.: Review: Cloud invigoration by aerosols–Coupling between microphysics and dynamics, Atmos. Res., 140–141, 38–60, https://doi.org/10.1016/j.atmosres.2014.01.009, 2014.
Anderson, G. P., Clough, S. A., Kneizys, F. X., Chetwynd, J. H., Shettle, E. P., U. S. Air Force Geophysics Laboratory, and Optical Physics Division: AFGL atmospheric constituent profiles (0–120 km),Tech. Rep. AFGL–TR–86–0110, Air Force Geophys. Lab., Hanscom Air Force Base, Bedford, Mass., https://apps.dtic.mil/sti/tr/pdf/ADA175173.pdf (last access: 5 September 2023), 1986.
Arola, A., Lindfors, A., Natunen, A., and Lehtinen, K. E. J.: A case study on biomass burning aerosols: effects on aerosol optical properties and surface radiation levels, Atmos. Chem. Phys., 7, 4257–4266, https://doi.org/10.5194/acp-7-4257-2007, 2007.
Austin, R.: Level 2B Radar-only Cloud Water Content (2B-CWC-RO) Process Description Document, NASA CloudSat Project Doc., Updated October 21, 2007. https://www.cloudsat.cira.colostate.edu/cloudsat-static/info/dl/2b-cwc-ro/2B-CWC-RO_PDICD.P_R04.20071021.pdf (last access: 1 August 2022), 2007.
Bencherif, H., Bègue, N., Kirsch Pinheiro, D., Du Preez, D. J., Cadet, J.-M., Da Silva Lopes, F. J., Shikwambana, L., Landulfo, E., Vescovini, T., Labuschagne, C., Silva, J. J., Anabor, V., Coheur, P.-F., Mbatha, N., Hadji-Lazaro, J., Sivakumar, V., and Clerbaux, C.: Investigating the Long-Range Transport of Aerosol Plumes Following the Amazon Fires (August 2019): A Multi-Instrumental Approach from Ground-Based and Satellite Observations, Remote Sens.-Basel, 12, 3846, https://doi.org/10.3390/rs12223846, 2020.
Brioude, J., Cooper, O. R., Feingold, G., Trainer, M., Freitas, S. R., Kowal, D., Ayers, J. K., Prins, E., Minnis, P., McKeen, S. A., Frost, G. J., and Hsie, E.-Y.: Effect of biomass burning on marine stratocumulus clouds off the California coast, Atmos. Chem. Phys., 9, 8841–8856, https://doi.org/10.5194/acp-9-8841-2009, 2009.
Chang, D. Y., Yoon, J., Lelieveld, J., Park, S. K., Yum, S. S., Kim, J., and Jeong, S.: Direct radiative forcing of biomass burning aerosols from the extensive Australian wildfires in 2019–2020, Environ. Res. Lett., 16, 044041, https://doi.org/10.1088/1748-9326/abecfe, 2021.
Conrick, R., Mass, C. F., Boomgard-Zagrodnik, J. P., and Ovens, D.: The Influence of Wildfire Smoke on Cloud Microphysics during the September 2020 Pacific Northwest Wildfires, Weather Forecast., 36, 1519–1536, https://doi.org/10.1175/WAF-D-21-0044.1, 2021.
De Almeida Castanho, A. D., Vanderlei Martins, J., and Artaxo, P.: MODIS Aerosol Optical Depth Retrievals with high spatial resolution over an Urban Area using the Critical Reflectance, J. Geophys. Res.-Atmos., 113, 2007JD008751, https://doi.org/10.1029/2007JD008751, 2008.
De Miranda, R. M., Lopes, F., do Rosário, N. É., Yamasoe, M. A., Landulfo, E., and de Fatima Andrade, M.: The relationship between aerosol particles chemical composition and optical properties to identify the biomass burning contribution to fine particles concentration: a case study for São Paulo city, Brazil, Environ. Monit. Assess., 189, https://doi.org/10.1007/s10661-016-5659-7, 2017.
Draxler, R. R. and Hess, G. D.: An Overview of the HYSPLIT_4 Modelling System for Trajectories, Dispersion, and Deposition, https://www.arl.noaa.gov/documents/reports/MetMag.pdf (last access: 1 August 2023), 1998.
Emde, C., Buras-Schnell, R., Kylling, A., Mayer, B., Gasteiger, J., Hamann, U., Kylling, J., Richter, B., Pause, C., Dowling, T., and Bugliaro, L.: The libRadtran software package for radiative transfer calculations (version 2.0.1), Geosci. Model Dev., 9, 1647–1672, https://doi.org/10.5194/gmd-9-1647-2016, 2016.
Freitas, S. R., Longo, K. M., Silva Dias, M. A. F., Silva Dias, P. L., Chatfield, R., Prins, E., Artaxo, P., Grell, G. A., and Recuero, F. S.: Monitoring the transport of biomass burning emissions in South America, Environ. Fluid Mech., 5, 135–167, https://doi.org/10.1007/s10652-005-0243-7, 2005.
Gasteiger, J., Emde, C., Mayer, B., Buras, R., Buehler, S. A., and Lemke, O.: Representative wavelengths absorption parameterization applied to satellite channels and spectral bands, J. Quant. Spectrosc. Radiat. Transf., 148, 99–115, https://doi.org/10.1016/j.jqsrt.2014.06.024, 2014.
Gautam, R., Gatebe, C., Singh, M., Varnai, T., and Poudyal, R.: Radiative characteristics of Clouds Embedded in Smoke derived from airborne multi-angular measurements: Clouds Embedded in Smoke, J. Geophys. Res.-Atmos., https://doi.org/10.1002/2016JD025309, 2016.
Giglio, L. and Justice, C.: MOD14 MODIS/Terra Thermal Anomalies/Fire 5-Min L2 Swath 1km V006, NASA Land Processes Distributed Active Archive Center [data set], https://doi.org/10.5067/MODIS/MOD14.006, 2015a.
Giglio, L. and Justice, C.: MYD14 MODIS/Aqua Thermal Anomalies/Fire 5-Min L2 Swath 1km V006, NASA Land Processes Distributed Active Archive Center [data set], https://doi.org/10.5067/MODIS/MYD14.006, 2015b.
Giglio, L., Schroeder, W., and Justice, C. O.: The collection 6 MODIS active fire detection algorithm and fire products, Remote Sens. Environ., 178, 31–41, https://doi.org/10.1016/j.rse.2016.02.054, 2016.
Global Modeling and Assimilation Office (GMAO): MERRA-2 tavg1_2d_aer_Nx: 2d,1-Hourly,Time-averaged,Single-Level,Assimilation,Aerosol Diagnostics V5.12.4, Goddard Earth Sciences Data and Information Services Center (GES DISC) [data set], Greenbelt, MD, USA, https://doi.org/10.5067/KLICLTZ8EM9D, 2015.
GOES-R Algorithm Working Group and GOES-R Series Program: NOAA GOES-R Series Advanced Baseline Imager (ABI) Level 2 Cloud and Moisture Imagery Products (CMIP), NOAA National Centers for Environmental Information [data set], https://doi.org/10.7289/V5736P36, 2017.
Gueymard, C. A.: The sun's total and spectral irradiance for solar energy applications and solar radiation models, Sol. Energy, 76, 423–453, https://doi.org/10.1016/j.solener.2003.08.039, 2004.
Hersbach, H., Bell, B., Berrisford, P., Biavati, G., Horányi, A., Muñoz Sabater, J., Nicolas, J., Peubey, C., Radu, R., Rozum, I., Schepers, D., Simmons, A., Soci, C., Dee, D., and Thépaut, J.-N.: ERA5 hourly data on single levels from 1940 to present, Copernicus Climate Change Service (C3S) Climate Data Store (CDS) [data set], https://doi.org/10.24381/cds.adbb2d47, 2023.
Holben, B. N., Eck, T. F., Slutsker, I., Tanré, D., Buis, J. P., Setzer, A., Vermote, E., Reagan, J. A., Kaufman, Y. J., Nakajima, T., Lavenu, F., Jankowiak, I., and Smirnov, A.: AERONET—A Federated Instrument Network and Data Archive for Aerosol Characterization, Remote Sens. Environ., 66, 1–16, https://doi.org/10.1016/S0034-4257(98)00031-5, 1998.
Kaufman, Y. J. and Fraser, R. S.: The Effect of Smoke Particles on Clouds and Climate Forcing, Science, 277, 1636–1639, https://doi.org/10.1126/science.277.5332.1636, 1997.
Keywood, M., Cope, M., Meyer, C. P. M., Iinuma, Y., and Emmerson, K.: When smoke comes to town: The impact of biomass burning smoke on air quality, Atmos. Environ., 121, 13–21, https://doi.org/10.1016/j.atmosenv.2015.03.050, 2015.
Kim, M.-H., Omar, A. H., Tackett, J. L., Vaughan, M. A., Winker, D. M., Trepte, C. R., Hu, Y., Liu, Z., Poole, L. R., Pitts, M. C., Kar, J., and Magill, B. E.: The CALIPSO version 4 automated aerosol classification and lidar ratio selection algorithm, Atmos. Meas. Tech., 11, 6107–6135, https://doi.org/10.5194/amt-11-6107-2018, 2018.
Koren, I., Kaufman, Y. J., Remer, L. A., and Martins, J. V.: Measurement of the Effect of Amazon Smoke on Inhibition of Cloud Formation, Science, 303, 1342–1345, https://doi.org/10.1126/science.1089424, 2004.
Kylling, A., Stamnes, K., and Tsay, S.-C.: A reliable and efficient two-stream algorithm for spherical radiative transfer: Documentation of accuracy in realistic layered media, J. Atmos. Chem., 21, 115–150, https://doi.org/10.1007/BF00696577, 1995.
Landulfo, E., Papayannis, A., Artaxo, P., Castanho, A. D. A., de Freitas, A. Z., Souza, R. F., Vieira Junior, N. D., Jorge, M. P. M. P., Sánchez-Ccoyllo, O. R., and Moreira, D. S.: Synergetic measurements of aerosols over São Paulo, Brazil using LIDAR, sunphotometer and satellite data during the dry season, Atmos. Chem. Phys., 3, 1523–1539, https://doi.org/10.5194/acp-3-1523-2003, 2003.
Lee, H.-H., Bar-Or, R. Z., and Wang, C.: Biomass burning aerosols and the low-visibility events in Southeast Asia, Atmos. Chem. Phys., 17, 965–980, https://doi.org/10.5194/acp-17-965-2017, 2017.
Leontyeva, E. and Stamnes, K.: Estimations of Cloud Optical Thickness from Ground-Based Measurements of Incoming Solar Radiation in the Arctic, J. Climate, 7, 566–578, https://doi.org/10.1175/1520-0442(1994)007<0566:EOCOTF>2.0.CO;2, 1994.
Levy, R. and Hsu, C. et al.: MOD04_3K – MODIS/Terra Aerosol 5-Min L2 Swath 3km, MODIS Atmosphere L2 Aerosol Product, NASA MODIS Adaptive Processing System, Goddard Space Flight Center, USA [data set], https://doi.org/10.5067/MODIS/MOD04_3K.061, 2015a.
Levy, R., Hsu, C., et al.: MODIS Atmosphere L2 Aerosol Product, NASA MODIS Adaptive Processing System, Goddard Space Flight Center, USA [data set], https://doi.org/10.5067/MODIS/MYD04_3K.061, 2015b.
Levy, R. C., Mattoo, S., Munchak, L. A., Remer, L. A., Sayer, A. M., Patadia, F., and Hsu, N. C.: The Collection 6 MODIS aerosol products over land and ocean, Atmos. Meas. Tech., 6, 2989–3034, https://doi.org/10.5194/amt-6-2989-2013, 2013.
Li, J., Han, Z., Surapipith, V., Fan, W., Thongboonchoo, N., Wu, J., Li, J., Tao, J., Wu, Y., Macatangay, R., Bran, S. H., Yu, E., Zhang, A., Liang, L., and Zhang, R.: Direct and indirect effects and feedbacks of biomass burning aerosols over Mainland Southeast Asia and South China in springtime, Sci. Total Environ., 842, 156949, https://doi.org/10.1016/j.scitotenv.2022.156949, 2022.
Liu, L., Cheng, Y., Wang, S., Wei, C., Pöhlker, M. L., Pöhlker, C., Artaxo, P., Shrivastava, M., Andreae, M. O., Pöschl, U., and Su, H.: Impact of biomass burning aerosols on radiation, clouds, and precipitation over the Amazon: relative importance of aerosol–cloud and aerosol–radiation interactions, Atmos. Chem. Phys., 20, 13283–13301, https://doi.org/10.5194/acp-20-13283-2020, 2020.
Loeb, N. G., Manalo-Smith, N., Su, W., Shankar, M., and Thomas, S.: CERES Top-of-Atmosphere Earth Radiation Budget Climate Data Record: Accounting for in-Orbit Changes in Instrument Calibration, Remote Sens.-Basel, 8, 182, https://doi.org/10.3390/rs8030182, 2016.
Mallet, M., Solmon, F., Nabat, P., Elguindi, N., Waquet, F., Bouniol, D., Sayer, A. M., Meyer, K., Roehrig, R., Michou, M., Zuidema, P., Flamant, C., Redemann, J., and Formenti, P.: Direct and semi-direct radiative forcing of biomass-burning aerosols over the southeast Atlantic (SEA) and its sensitivity to absorbing properties: a regional climate modeling study, Atmos. Chem. Phys., 20, 13191–13216, https://doi.org/10.5194/acp-20-13191-2020, 2020.
Mann, H. B. and Whitney, D. R.: On a Test of Whether one of Two Random Variables is Stochastically Larger than the Other, Ann. Math. Stat., 18, 50–60, https://doi.org/10.1214/aoms/1177730491, 1947.
Masoom, A., Fountoulakis, I., Kazadzis, S., Raptis, I.-P., Kampouri, A., Psiloglou, B. E., Kouklaki, D., Papachristopoulou, K., Marinou, E., Solomos, S., Gialitaki, A., Founda, D., Salamalikis, V., Kaskaoutis, D., Kouremeti, N., Mihalopoulos, N., Amiridis, V., Kazantzidis, A., Papayannis, A., Zerefos, C. S., and Eleftheratos, K.: Investigation of the effects of the Greek extreme wildfires of August 2021 on air quality and spectral solar irradiance, Atmos. Chem. Phys., 23, 8487–8514, https://doi.org/10.5194/acp-23-8487-2023, 2023.
Mataveli, G. A. V., de Oliveira, G., Seixas, H. T., Pereira, G., Stark, S. C., Gatti, L. V., Basso, L. S., Tejada, G., Cassol, H. L. G., Anderson, L. O., and Aragão, L. E. O. C.: Relationship between Biomass Burning Emissions and Deforestation in Amazonia over the Last Two Decades, Forests, 12, 1217, https://doi.org/10.3390/f12091217, 2021.
Mateos, D., Antón, M., Valenzuela, A., Cazorla, A., Olmo, F. J., and Alados-Arboledas, L.: Efficiency of clouds on shortwave radiation using experimental data, Appl. Energy, 113, 1216–1219, https://doi.org/10.1016/j.apenergy.2013.08.060, 2014.
Mayer, B. and Kylling, A.: Technical note: The libRadtran software package for radiative transfer calculations - description and examples of use, Atmos. Chem. Phys., 5, 1855–1877, https://doi.org/10.5194/acp-5-1855-2005, 2005.
Michailidis, K., Garane, K., Karagkiozidis, D., Peletidou, G., Voudouri, K.-A., Balis, D., and Bais, A.: Extreme wildfires over northern Greece during summer 2023 – Part A: Effects on aerosol optical properties and solar UV radiation, Atmos. Res., 311, 107700, https://doi.org/10.1016/j.atmosres.2024.107700, 2024.
Moreira, D. S., Longo, K. M., Freitas, S. R., Yamasoe, M. A., Mercado, L. M., Rosário, N. E., Gloor, E., Viana, R. S. M., Miller, J. B., Gatti, L. V., Wiedemann, K. T., Domingues, L. K. G., and Correia, C. C. S.: Modeling the radiative effects of biomass burning aerosols on carbon fluxes in the Amazon region, Atmos. Chem. Phys., 17, 14785–14810, https://doi.org/10.5194/acp-17-14785-2017, 2017.
NASA/LARC/SD/ASDC: CERES Single Scanner Footprint (SSF) TOA/Surface Fluxes, Clouds and Aerosols Terra-FM1 Edition4A, NASA Langley Atmospheric Science Data Center DAAC [data set], https://doi.org/10.5067/TERRA/CERES/SSF_Terra-FM1_L2.004A, 2014.
NASA/LARC/SD/ASDC: CALIPSO Lidar Level 2 Vertical Feature Mask (VFM), V4-20, NASA Langley Atmospheric Science Data Center DAAC [data set], https://doi.org/10.5067/CALIOP/CALIPSO/LID_L2_VFM-STANDARD-V4-20, 2018.
NASA/LARC/SD/ASDC: CALIPSO Lidar Level 1B profile data, V4-51, NASA Langley Atmospheric Science Data Center DAAC [data set], https://doi.org/10.5067/CALIOP/CALIPSO/CAL_LID_L1-Standard-V4-51, last access: 1 June 2025.
Pereira, G. M., De Oliveira Alves, N., Caumo, S. E. S., Soares, S., Teinilä, K., Custódio, D., Hillamo, R., Alves, C., and Vasconcellos, P. C.: Chemical composition of aerosol in São Paulo, Brazil: influence of the transport of pollutants, Air Qual. Atmosphere Health, 10, 457–468, https://doi.org/10.1007/s11869-016-0437-9, 2017.
Pereira, G. M., da Silva Caumo, S. E., Grandis, A., do Nascimento, E. Q. M., Correia, A. L., de Melo Jorge Barbosa, H., Marcondes, M. A., Buckeridge, M. S., and de Castro Vasconcellos, P.: Physical and chemical characterization of the 2019 “black rain” event in the Metropolitan Area of São Paulo, Brazil, Atmos. Environ., 248, 118229, https://doi.org/10.1016/j.atmosenv.2021.118229, 2021.
Randles, C. A., Silva, A. M. D., Buchard, V., Colarco, P. R., Darmenov, A., Govindaraju, R., Smirnov, A., Holben, B., Ferrare, R., Hair, J., Shinozuka, Y., and Flynn, C. J.: The MERRA-2 Aerosol Reanalysis, 1980 Onward. Part I: System Description and Data Assimilation Evaluation, J. Climate, 30, 28, 2017.
Rosário, N. É, Longo, K. M., Freitas, S. R., Yamasoe, M. A., and Fonseca, R. M.: Modeling the South American regional smoke plume: aerosol optical depth variability and surface shortwave flux perturbation, Atmos. Chem. Phys., 13, 2923–2938, https://doi.org/10.5194/acp-13-2923-2013, 2013.
Rosário, N. É. D., Sena, E. T., and Yamasoe, M. A.: South American 2020 regional smoke plume: intercomparison with previous years, impact on solar radiation, and the role of Pantanal biomass burning season, Atmos. Chem. Phys., 22, 15021–15033, https://doi.org/10.5194/acp-22-15021-2022, 2022.
Rosenfeld, D., Lohmann, U., Raga, G. B., O'Dowd, C. D., Kulmala, M., Fuzzi, S., Reissell, A., and Andreae, M. O.: Flood or Drought: How Do Aerosols Affect Precipitation?, Science, 321, 1309–1313, https://doi.org/10.1126/science.1160606, 2008.
Sailor, D. J. and Fan, H.: Modeling the diurnal variability of effective albedo for cities, Atmos. Environ., 36, 713–725, https://doi.org/10.1016/S1352-2310(01)00452-6, 2002.
Sarkar, A., Panda, J., Kant, S., and Mukherjee, A.: Influence of smoke aerosols on low-level clouds over the Indian region during winter, Atmos. Res., 278, 106358, https://doi.org/10.1016/j.atmosres.2022.106358, 2022.
Scott, R. C., Rose, F. G., Stackhouse, P. W., Loeb, N. G., Kato, S., Doelling, D. R., Rutan, D. A., Taylor, P. C., and Smith, W. L.: Clouds and the Earth's Radiant Energy System (CERES) Cloud Radiative Swath (CRS) Edition 4 Data Product, J. Atmos. Ocean. Tech., 39, 1781–1797, https://doi.org/10.1175/JTECH-D-22-0021.1, 2022.
Serrano, D., Marín, M. J., Núñez, M., Gandía, S., Utrillas, M. P., and Martínez-Lozano, J. A.: Relationship between the effective cloud optical depth and different atmospheric transmission factors, Atmos. Res., 160, 50–58, https://doi.org/10.1016/j.atmosres.2015.03.004, 2015.
Shettle, E. P.: Models of aerosols, clouds and precipitation for atmospheric propagation studies, Paper Presented at Conference on Atmospheric Propagation in the UV, Visible, IR and MM-region and Related System Aspects, NATO Adv. Group for Aerosp. Res. And Dev., Copenhagen, https://ui.adsabs.harvard.edu/abs/1990apuv.agar.....S/abstract (last access: 5 September 2023), 1989.
Stamnes, K., Tsay, S.-C., Wiscombe, W., and Jayaweera, K.: Numerically stable algorithm for discrete-ordinate-method radiative transfer in multiple scattering and emitting layered media, Appl. Optics, 27, 2502–2509, https://doi.org/10.1364/AO.27.002502, 1988.
Twohy, C. H., Toohey, D. W., Levin, E. J. T., DeMott, P. J., Rainwater, B., Garofalo, L. A., Pothier, M. A., Farmer, D. K., Kreidenweis, S. M., Pokhrel, R. P., Murphy, S. M., Reeves, J. M., Moore, K. A., and Fischer, E. V.: Biomass Burning Smoke and Its Influence on Clouds Over the Western U. S., Geophys. Res. Lett., 48, e2021GL094224, https://doi.org/10.1029/2021GL094224, 2021.
Twomey, S.: The Influence of Pollution on the Shortwave Albedo of Clouds, J. Atmos. Sci., 34, 1149–1152, https://doi.org/10.1175/1520-0469(1977)034<1149:TIOPOT>2.0.CO;2, 1977.
Winker, D. M., Vaughan, M. A., Omar, A., Hu, Y., Powell, K. A., Liu, Z., Hunt, W. H., and Young, S. A.: Overview of the CALIPSO Mission and CALIOP Data Processing Algorithms, J. Atmos. Ocean. Tech., 26, 2310–2323, https://doi.org/10.1175/2009JTECHA1281.1, 2009.
Yamasoe, M. A., von Randow, C., Manzi, A. O., Schafer, J. S., Eck, T. F., and Holben, B. N.: Effect of smoke and clouds on the transmissivity of photosynthetically active radiation inside the canopy, Atmos. Chem. Phys., 6, 1645–1656, https://doi.org/10.5194/acp-6-1645-2006, 2006.
Yamasoe, M. A., do Rosário, N. M. E., and Barros, K. M.: Downward solar global irradiance at the surface in São Paulo city-The climatological effects of aerosol and clouds: SW Aerosol and Cloud Radiative Effect, J. Geophys. Res.-Atmos., 122, 391–404, https://doi.org/10.1002/2016JD025585, 2017.
Yuan, S., Bao, F., Zhang, X., and Li, Y.: Severe Biomass-Burning Aerosol Pollution during the 2019 Amazon Wildfire and Its Direct Radiative-Forcing Impact: A Space Perspective from MODIS Retrievals, Remote Sens.-Basel, 14, 2080, https://doi.org/10.3390/rs14092080, 2022.