the Creative Commons Attribution 4.0 License.
the Creative Commons Attribution 4.0 License.
 | 18 Nov 2025
Simulation of the seasonal and spatial variability of the concentrations and chemical composition of ultrafine particulate matter over Europe
Konstantinos Mataras
Evangelia Siouti
David Patoulias
Spyros N. Pandis
Ultrafine particles (UFPs) have attracted interest as perhaps the most dangerous fraction of atmospheric PM. This study focuses on the ultrafine particulate matter (PM0.1) mass concentrations and their chemical composition during a summer and winter period in Europe.
Predicted levels of PM0.1 varied substantially, both in space and in time. The average predicted PM0.1 mass concentration was 0.6 µg m−3 in the summer, higher than the 0.3 µg m−3 predicted in the winter period. PM0.1 chemical composition exhibited significant seasonality. In summer, PM0.1 was mostly comprised of secondary inorganic matter (38 % sulfate and 13 % ammonium) and organics (9 % primary and 32 % secondary). During the winter, the fraction of secondary inorganic matter increased, with sulfate contributing 47 % and ammonium 19 %, on average. Primary organic matter contribution also increased from 9 % in summer to 23 % in winter, while secondary organic matter decreased significantly to 6 % on average during winter.
During summertime, the model performance at 12 sites for daily average ultrafine particle volume (PV0.1) concentrations was considered good, with normalized mean error (NME) equal to 46 % and normalized mean bias (NMB) equal to 15 %. For the winter period, the corresponding values for daily average levels were −27 % for NMB and 64 % for NME, indicating an average model performance.
Correlations between PM0.1 and the currently regulated PM2.5 (particulate matter with a diameter less than or equal to 2.5 µm) were generally low. Better correlations were observed in cases where the primary component of PM0.1 was significant. This suggests that there are significant differences between the dominant sources and processes of PM0.1 and PM2.5.
- Article
(8302 KB) - Full-text XML
-
Supplement
(2309 KB) - BibTeX
- EndNote


UFPs dominate atmospheric particle number distribution (Seinfeld and Pandis, 2006). High concentrations of both UFP number and mass are found in urban areas and are a result of human activity, directly emitting particulates or producing them by gas-to-particle conversion processes. Atmospheric particle exposure is one of the most significant risk factors affecting human health (HEI Report, 2013; EPA, 2019). Ultrafine particles have attracted interest because they may be the most dangerous fraction of atmospheric particulate matter. They can reach the lung alveoli, pass into the bloodstream and from there they can move to many different organs (Schraufnagel, 2020; Sioutas et al., 2005). Their increased specific surface area (total surface area of the particles per unit mass) with decreasing size also enhances their chemical and physical interactions, both with gaseous species outside the body and also with tissues inside the body (Kwon et al., 2020). Some epidemiological studies have noted a positive correlation between UFPs exposure and brain tumor incidence (Weichenthal et al., 2020). However, there are still questions about the links between ultrafine particle exposure and damage to human health (EPA, 2019).
Past studies of ultrafine particles have focused on their number concentrations (Baranizadeh et al., 2016; Merikanto et al., 2009; Patoulias et al., 2015, 2018; Wang and Penner, 2009; Yu and Luo, 2009). The comparatively scarce modelling attempts aimed at ultrafine particle mass have mostly been conducted in California and the US (Hu et al., 2014a, b, 2017; Venecek et al., 2019; Yu et al., 2019).
In the study by Hu et al. (2014a, b) for the 7-year (2000–2006) period, daily predictions of primary PM0.1 from the UCD-P (University of California Davis-Primary) model were evaluated for California. They found good agreement of model predictions with observed PM0.1 mass and elemental carbon (EC), with a Pearson correlation coefficient (R>0.92) during these periods (Kuwayama et al., 2013). They reported model difficulties in reproducing observed values of PM0.1 > 4 or < 1 µg m−3. In a subsequent study of PM0.1, Hu et al. (2017) utilized again the UCD/CIT (University of California Davis/California Institute of Technology) model. The authors reported that primary organic matter was the major component (50 %–90 %) of PM0.1 organic aerosol (OA) in California, with 9-year average concentrations above 2 µg m−3 in major urban areas. They predicted that secondary organics contribute less than 10 % to PM0.1 OA in these areas, with that contribution increasing to up to 50 % in rural areas, with low organic matter content. PM0.1 secondary organic aerosol (SOA) concentrations were predicted to be mostly biogenic (64 % of SOA for the domain) and between 0.02–0.05 µg m−3 in the winter and 0.1–0.3 µg m−3 in the summer. Underprediction of secondary organic aerosol concentrations was proposed as an explanation of the PM0.1 organic mass underprediction. Yu et al. (2019) along with Venecek et al. (2019) considered nucleation along with the rest of the major aerosol processes in a PM0.1 study. Venecek et al. (2019) investigated PM0.1 concentration and sources during summertime pollution events in several metropolitan areas of the US. Predicted daily average PM0.1 levels were generally above 2 µg m−3, reaching 5 µg m−3 in areas influenced by wildfire events. The PM0.1 spatial gradients were much sharper than those of PM2.5 due to the dominance of the primary PM0.1. The dominant source of PM0.1 was found to be natural gas combustion across all major cities in the US. Yu et al. (2019) studied UFP number as well as mass concentrations and sources in California. Xue et al. (2019) reported that meat cooking was a major source of PM0.1 organic carbon across all California cities (13 %–29 %), while nucleation contributed negligibly to UFP mass on an annual scale.
Experimental studies investigating ultrafine particles have focused on particle number concentrations and their spatial and temporal differences. The first detailed measurements of UFP mass have been performed in California (Kuwayama et al., 2013; Xue et al., 2018, 2019, 2020a, b; Xue and Kleeman, 2022). In these studies, researchers collected one sample every day or used even longer averaging intervals because of the low UFP mass concentrations. Hughes et al. (1998) reported daily average mass concentrations varying from 0.8 to 1.6 µg m−3 in Pasadena, CA. A novel method to measure UFP mass continuously has been recently developed and tested by Argyropoulou et al. (2023, 2024), but has not been applied in field studies yet.
Major sources of PM0.1 in the US include vehicular emissions (Hu et al., 2014a), biomass (wood burning and meat cooking) burning (Kleeman et al., 2009) but also natural gas combustion (Xue et al., 2018) and aviation in areas close to airports (Venecek et al., 2019). Relatively little is known in areas outside the US about ultrafine particle mass properties other than their number concentrations and size distribution (del Águila et al., 2018; Putaud et al., 2010).
The few studies, however, using PM0.1 as the exposure metric have shown positive correlations of ultrafine particle organic and trace metal components with negative health effects (Laurent et al., 2016; Ostro et al., 2015). For UFP mass, field studies as well as modelling studies have been largely restricted to California or parts of Asia, which are dominated by primary sources (Phairuang et al., 2022; Xue et al., 2019, 2020b; Zhu et al., 2002). As such, large uncertainties about their health effects still remain (Delfino et al., 2005; EPA, 2019; Ohlwein et al., 2019).
In this work, PM0.1 mass concentrations as well as their chemical composition were studied during a typical summer (5 June–8 July 2012) and winter period (1–30 January 2009) for several urban and rural sites in Europe using the PMCAMx-UF (Particulate Matter Comprehensive Air-quality Model with extensions – Ultra-Fine) chemical transport model (CTM). Due to the difficulty of measuring PM0.1 mass, PV0.1 is used in this study to evaluate the model predictions on an hourly and daily scale.
PMCAMx-UF is a Eulerian regional three-dimensional chemical transport model (Jung et al., 2010) that is an extension of the PMCAMx model (Gaydos et al., 2007). The extended Dynamic Model for Aerosol Nucleation (DMANx) module is used in PMCAMx-UF for the better description of ambient ultrafine particulate matter processes (Patoulias et al., 2015). PMCAMx-UF solves the mass conservation equation for each pollutant in the gas, aqueous and particulate phases focusing especially on the aerosol number and mass size distributions and the ultrafine particles.
Processes simulated by PMCAMx-UF include transport of pollutants via advection and eddy diffusion, their chemical transformation in the gas, aerosol and aqueous (cloud) phases, their removal from the atmosphere through dry (without water involvement) and wet (with water involvement) processes, their introduction into the atmosphere by direct emission, whether from natural planetary processes or by human activity, and lastly specific physical processes for the particle phase, namely coagulation, condensation/evaporation and nucleation. PMCAMx-UF simulates the temporal variation of the complete aerosol number size distribution, beginning from particles as small as 0.8 nm and up to 10 µm using 41 size bins. At the same time, the mass concentration of 18 major aerosol components is simulated, including inorganics (ammonium, sulfate, metals, nitrate, sodium, chloride), primary and secondary organic aerosol, elemental carbon and aerosol phase water. The secondary organic aerosol species are split into 4 volatility bins for the anthropogenic and another 4 for those of biogenic origin. An extremely low volatility secondary organic aerosol (ELSOA) component was added by Patoulias and Pandis (2022) to simulate the extremely low volatility secondary organic compounds.
Gas phase chemistry in PMCAMx-UF is described by the extended Statewide Air Pollution Research Center (SAPRC) mechanism (ENVIRON, 2003; Patoulias and Pandis, 2022), which involves 219 thermochemical and photochemical reactions, 64 gaseous compounds, of which 11 reactivity lumped organic compounds (5 alkanes, 2 olefins, 2 aromatics, a mono- and a sesqui-terpene) and 18 free radicals. PMCAMx-UF utilizes the variable sizes resolution (VRSM) aqueous phase chemical module (Fahey and Pandis, 2001). The algorithm for horizontal advection is based on the piecewise parabolic method of Colella and Woodward (1984) and its implementation by Odman and Ingram (1996). Dry deposition is described by a first order kinetic removal rate. For gaseous pollutants, the dry deposition velocity is calculated from the series resistance to impaction model of Wesely (1989). For aerosol species, the gravitational settling velocity is in addition factored in. Its calculation follows the implementation of Slinn and Slinn (1980). Additional information about PMCAMx-UF can be found in Patoulias et al. (2018).
Ultrafine particle levels, size distributions, and chemical compositions are shaped by the complex interplay of atmospheric processes such as nucleation, condensation of low-volatility compounds, condensation and evaporation of semivolatile compounds, coagulation, and direct emissions. Nucleation and condensation are critical for the formation and initial growth of new particles, whereas coagulation decreases particle number by removing smaller particles due to collisions with larger ones. Primary emissions, particularly from traffic and other combustion-related activities, are a major source of PM0.1, especially in densely populated urban environments. Condensation is also a sink of PM0.1 because it can lead to growth of nanoparticles to sizes larger than 100 nm. Xue et al. (2018) highlighted that combustion of natural gas and biogas can significantly contribute to atmospheric ultrafine particles. While CTMs can reasonably capture emissions and large-scale transport, considerable uncertainties persist in simulating nucleation processes, organic aerosol formation, and the removal mechanisms of ultrafine particles. Nucleation is expected to be a minor to negligible source of PM0.1 so the corresponding uncertainties in its simulation are expected to have a small effect on the accuracy of PM0.1 predictions in continental areas. One of the objectives of this study is to obtain some insights into the ability of models like PMCAMx-UF to simulate the ensemble processes that drive PM0.1 levels and variability.
PMCAMx-UF was applied to a modelling domain spanning the European continental area, covering a 5400 × 5832 km2 area, using a rotated polar stereographic domain projection. This region is divided into 36 × 36 km2 cells resulting in 24 300 cells in each vertical level. In the vertical axis there are 14 levels, extending to approximately 7.2 km. The ground level, which is the main focus of this study, has a 60 m top boundary height.
The two periods examined correspond to 5 June to 8 July 2012 and 1 to 30 January 2009, during the PEGASOS and EUCAARI campaigns respectively. These periods have been selected because the corresponding emission inventories and meteorological inputs have been evaluated and improved in past modeling studies and the PMCAMx model has shown good performance in reproducing the PM2.5 mass and composition (Skyllakou et al., 2014; Patoulias et al., 2018; Patoulias and Pandis, 2022). Inputs for this version of PMCAMx-UF for the two periods have been described by Patoulias and Pandis (2022).
Meteorological input data for both periods were generated by the Weather Research and Forecasting (WRFv2) model (Skamarock et al., 2005). This model utilizes geospatial time-varying meteorology data as inputs that are a product of the Global Forecast System (GFSv15) of the National Oceanic and Atmospheric Administration (NOAA). WRF model grids correspond to those of the chemical transport model. The original meteorological fields prepared by this older version of WRF have been evaluated in past studies and have been reused here to maintain consistency with these previous applications of PMCAMx and PMCAMx-UF. The more recent versions of WRF that offer improvements in model physics, computational efficiency, grid flexibility, and data assimilation capabilities will be used in future applications.
Anthropogenic particulate matter emissions have hourly space resolution and are based on the pan-European anthropogenic particle number emissions inventory and the carbonaceous aerosol inventory, both developed during the European Integrated project on Aerosol, Cloud, Climate, and Air Quality Interactions (EUCAARI) (Kulmala et al., 2011). These datasets include various anthropogenic sources such as ground transportation, shipping, industrial processes, domestic activities, etc. Anthropogenic gas-phase emissions are based on the Global and regional Earth-system Monitoring using satellite and in situ data (GEMS) inventory. Continental natural ecosystem emissions were derived using the Model of Emissions of Gases and Aerosol from Nature (MEGANv2.1) (Guenther et al., 2006). MEGAN requires the meteorological inputs described above, as well as surface area type indicators. Natural marine emissions are based on the model of O'Dowd et al. (2008). Wildfire emissions included in our simulation were taken from the Sofiev et al. (2008a, b) emission inventory. Intermediate volatility organic compound emissions were estimated based on the primary organic aerosol emission rates, with proportionality factors depending on estimated volatility (Patoulias and Pandis, 2022) to maintain consistent inputs with previous studies. Murphy et al. (2023) have shown that it is better to estimate the IVOC emissions based on the total VOC emissions, instead of the POA. This approach will be used in future work.
Initial and boundary conditions used in this application were constant and low to minimize their influence on model predictions. The first two days of the summer and winter simulation periods are not included in the analysis. This is a time interval which has been shown to be adequate to exclude most of the influence of initial conditions in previous PMCAMx-UF applications (Patoulias et al., 2018; Patoulias and Pandis, 2022).
Measurements
Ultrafine particle mass is difficult to measure, primarily due to its low concentration. In order to evaluate hourly model predictions of ultrafine particulate matter concentrations and due to the availability of the corresponding measurements, we use here surface level measurements of particle number size distributions, available through the EBAS database (https://ebas-data.nilu.no, last access: 13 November 2025), during the Pan-European-Gas-AeroSol-climate interaction Study (PEGASOS) and the European Integrated project on Aerosol, Cloud, Climate, and Air Quality Interactions (EUCAARI) (Kulmala et al., 2011) intensive measurement campaigns. The locations of the 12 measurement sites are shown in Fig. 1. These include Mace Head (Ireland), Varrio, Hyytiala (Finland), Aspvreten, Vavihill (Sweden), Helsinki (Finland), Waldhof, Melpitz, Dresden, Hohenpeissenberg (Germany), Kosetice (Czech Republic) and Finokalia (Greece). Particle number distribution measurements in each site were made through mobility particle sizers, either scanning (SMPS) or differential (DMPS). The ultrafine particle volume concentrations, PV0.1, was then calculated by integrating these distributions up to 100 nm assuming spherical particles. We used this observed PV0.1 directly for the model evaluation, because there were no available measurements of the chemical composition of the ultrafine particles, and therefore it was not possible to estimate their density based on the measurements. In contrast, the model provides detailed information on the PM0.1 composition, allowing us to calculate its predicted density. As a result, PV0.1 was the most appropriate variable for model evaluation in this study. For some sites, there were gaps in the available measurements. The corresponding analysis was based only on the days with available data for both measurements and predictions. As a result, these measurement gaps did not affect the model evaluation and corresponding conclusions.
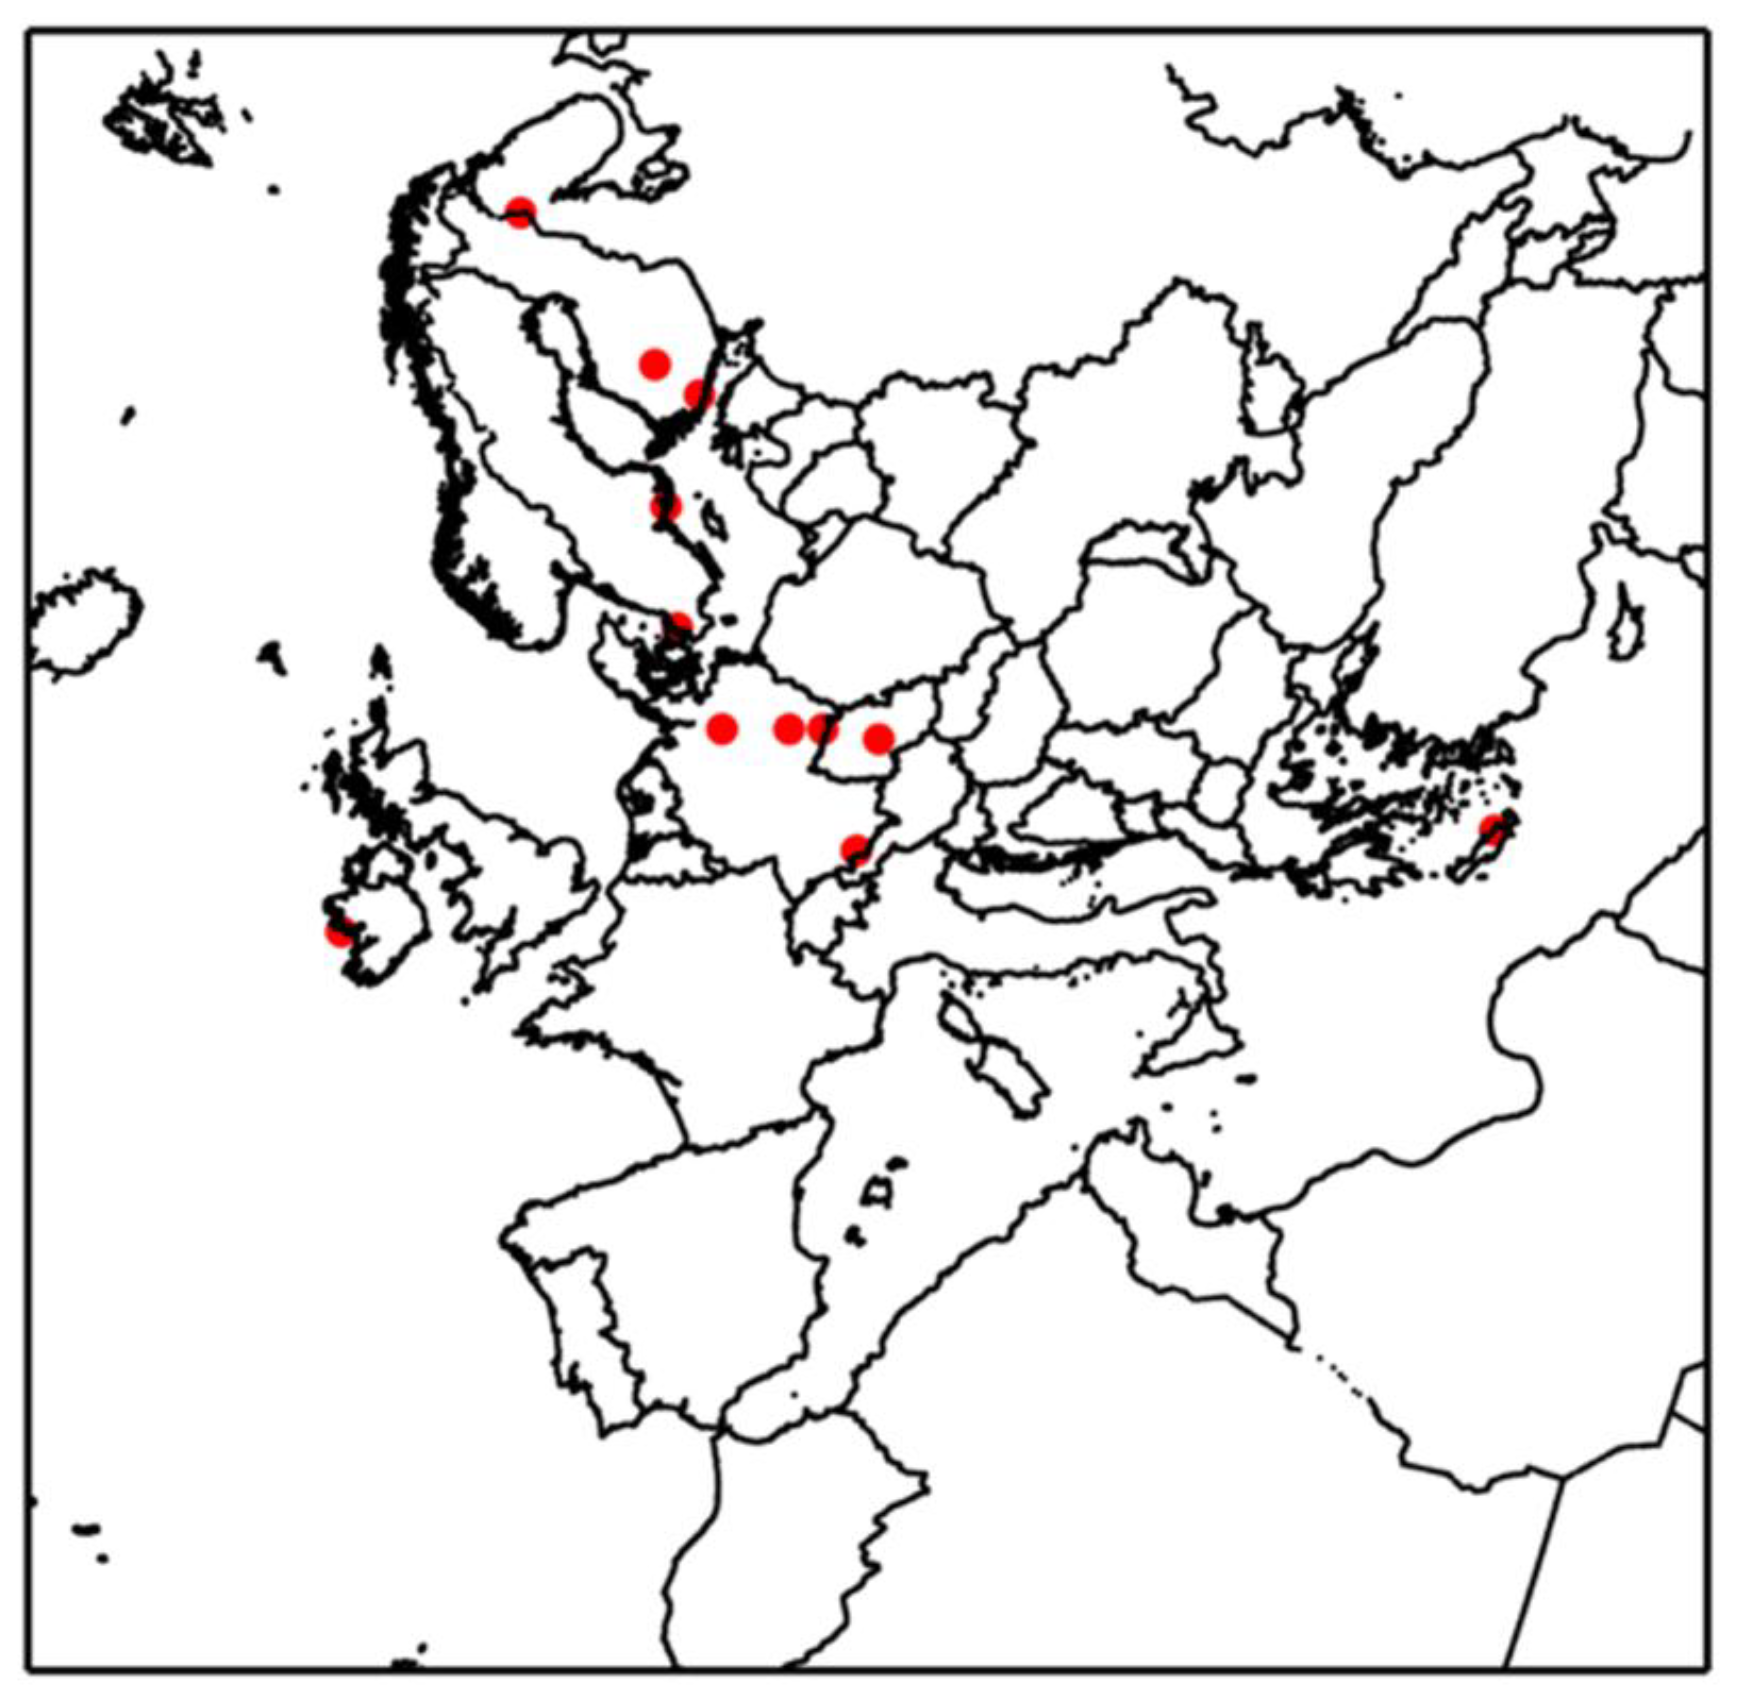
Figure 1Map of the European modelling domain indicating (red dots) the 12 measurement sites with available particle number distribution measurements for both simulation periods.
The PM0.1 predicted by PMCAMx-UF was converted to PV0.1 by estimating the average ultrafine particle density, ρUFP, based on the predicted particle composition at each point at time:
where N is the total number of components, ρi is the density of component i, PM0.1,i is the PM0.1 mass concentration of component i, and PM0.1 is the total mass concentration.
Measurement uncertainties stem from both instrument limitations and the assumption that particles are spherical. On the modeling side, inaccuracies primarily result from the predicted concentrations of PM0.1 chemical composition and the corresponding estimation of particle density. Additionally, the use of the 100 nm cutoff to define PM0.1 introduces some uncertainty, as this threshold is somewhat arbitrary. However, it was chosen to align with existing definitions and to ensure consistency with previous studies. The U.S. Environmental Protection Agency (EPA, 2025) classifies ultrafine particles as those smaller than 0.1 µm in diameter.
4.1 Average spatial variation of PM0.1
The average PM0.1 predictions at the ground level during the summertime simulated period are shown in Fig. 2. There was considerable spatial variability of PM0.1 levels throughout Europe. The mean value over the full domain (0.4 µg m−3) was heavily influenced by the fact that a significant part of the domain is over the Atlantic Ocean and Northern Africa, regions with much lower concentrations of PM0.1. Averaging without those parts and considering only the continental regions of the domain, the average predicted PM0.1 concentration was equal to 0.6 µg m−3.
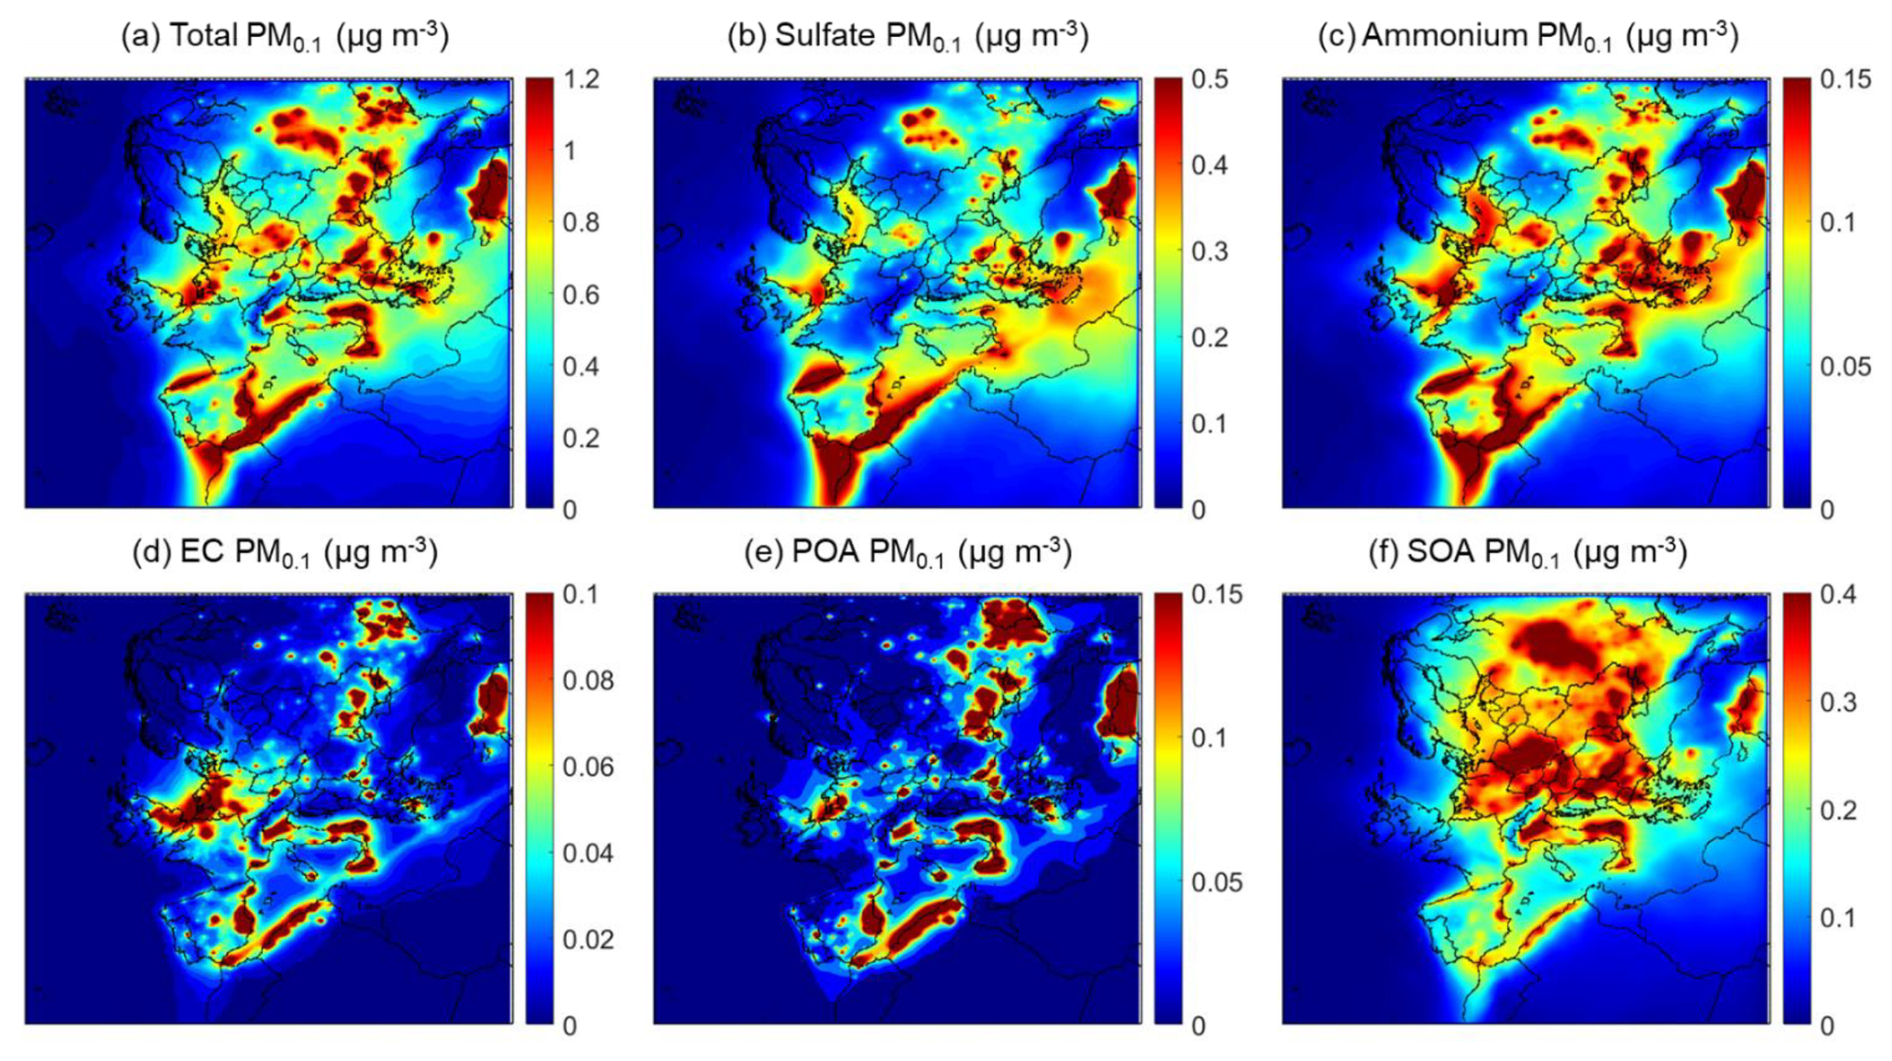
Figure 2Average predicted ground level PM0.1 mass concentrations (µg m−3) of (a) total PM0.1, (b) PM0.1 sulfate, (c) PM0.1 ammonium, (d) PM0.1 elemental carbon, (e) PM0.1 primary organic aerosol and (f) PM0.1 secondary organic aerosol during 5 June–8 July 2012.
PM0.1 was predicted to have higher values, up to 1.2 µg m−3, in parts of southern and eastern Europe. High levels were also predicted for major urban areas like Paris, as well as areas with high ship traffic like the North Sea or the western Mediterranean. PM0.1 was predicted to be, on average, 51 % secondary inorganic matter (38 % sulfate and 13 % ammonium), 41 % organic matter (9 % primary and 32 % secondary), with smaller contributions from elemental carbon (5 %), metal oxides (2 %) and trace contributions (<1 %) of nitrate, sodium and chloride. Sulfate levels were higher in the North Sea, the Mediterranean, parts of the Middle East and the Strait of Gibraltar, as well as the lower Bay of Biscay. Ammonium spatial patterns mirror those of sulfate. SOA was a major PM0.1 contributor in most of eastern and central Europe. Primary organic aerosol (POA) and elemental carbon contributed relatively little mass on the domain scale, with sharp spatial gradients in regions of increased human activity.
The average predicted PM0.1 concentration and composition for the winter period are shown in Fig. 3. The average level over Europe was 0.3 µg m−3 considering only continental regions and was lower than during the summer.
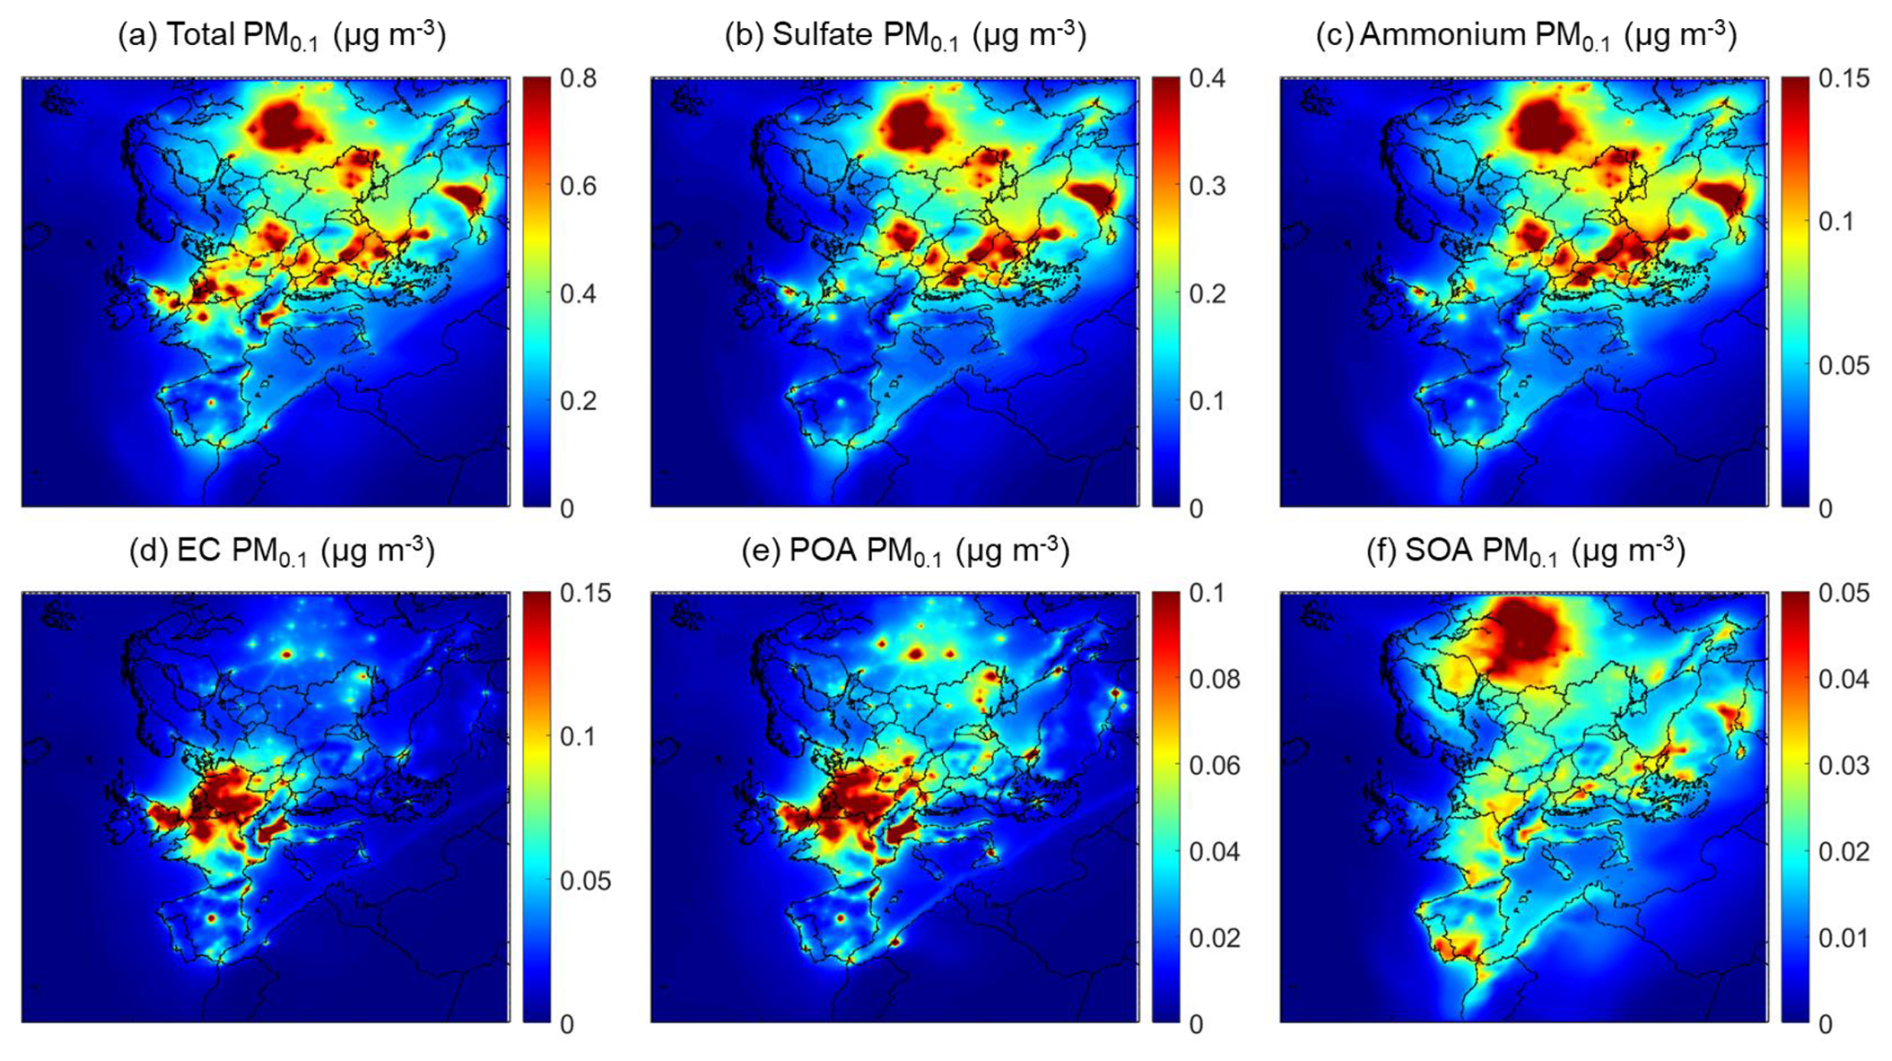
Figure 3Average predicted ground level PM0.1 mass concentrations (µg m−3) of (a) total PM0.1, (b) PM0.1 sulfate, (c) PM0.1 ammonium, (d) PM0.1 elemental carbon, (e) PM0.1 primary organic aerosol and (f) PM0.1 secondary organic aerosol during 1–30 January 2009.
Wintertime PM0.1 was predicted to consist of an average of 66 % secondary inorganic material (47 % sulphate and 19 % ammonium), 23 % primary matter (9 % elemental carbon, 9 % organic matter and 5 % metals), with small amounts of nitrate, sodium and chloride (<5 %). SOA contributed 6 % to the mean predicted PM0.1, with higher contribution in northwestern Russia, northern Italy and southern Spain and Portugal. The highest SOA average concentration was 0.1 µg m−3 in northwestern Russia. PM0.1 in central and western Europe, as well as in key urban areas of the Iberian Peninsula and northern Italy, was mainly composed of primary (emitted) matter. Primary matter concentration was as high as 0.9 µg m−3 in urban areas. Sulfate, and the associated ammonium, were the major contributors to PM0.1 in eastern Europe according to PMCAMx-UF, however with reduced concentration relative to the summer. The PM0.1 levels in northwestern and central Europe were lower by around 0.2 µg m−3 compared to the summer. In southern Italy, the concentrations were reduced from more than 1 µg m−3 to less than 0.4 µg m−3. On the other hand, in many urban areas (e.g. Paris) the PM0.1 levels were similar or even higher during the winter.
4.2 Predicted PM0.1 chemical composition in urban areas
The average predicted chemical composition of PM0.1 for selected sites is depicted in Fig. 4 for the summer and winter period. During the summer period, sulfate was a major PM0.1 component, with its fractional mass contribution varying from 17 % to 52 % depending on location, while SOA contributed from 18 % to 50 %. Ammonium (7 %–16 %), primary organics (4 %–18 %), elemental carbon (2 %–30 %) and metals (1 %–5 %) were the remaining contributors. The mass percentage of sodium, chloride and nitrate was in most sites less than 1 %. The predicted PM0.1 summertime concentration was mostly (52 % to 91 %) secondary (organic or inorganic). A significant fraction of the SOA (40 %–73 %) was predicted to be anthropogenic in all sites, 21 %–36 % was predicted to be biogenic, and 7 %–25 % was predicted to be extremely low volatility secondary organic compounds (Table S3 in the Supplement).
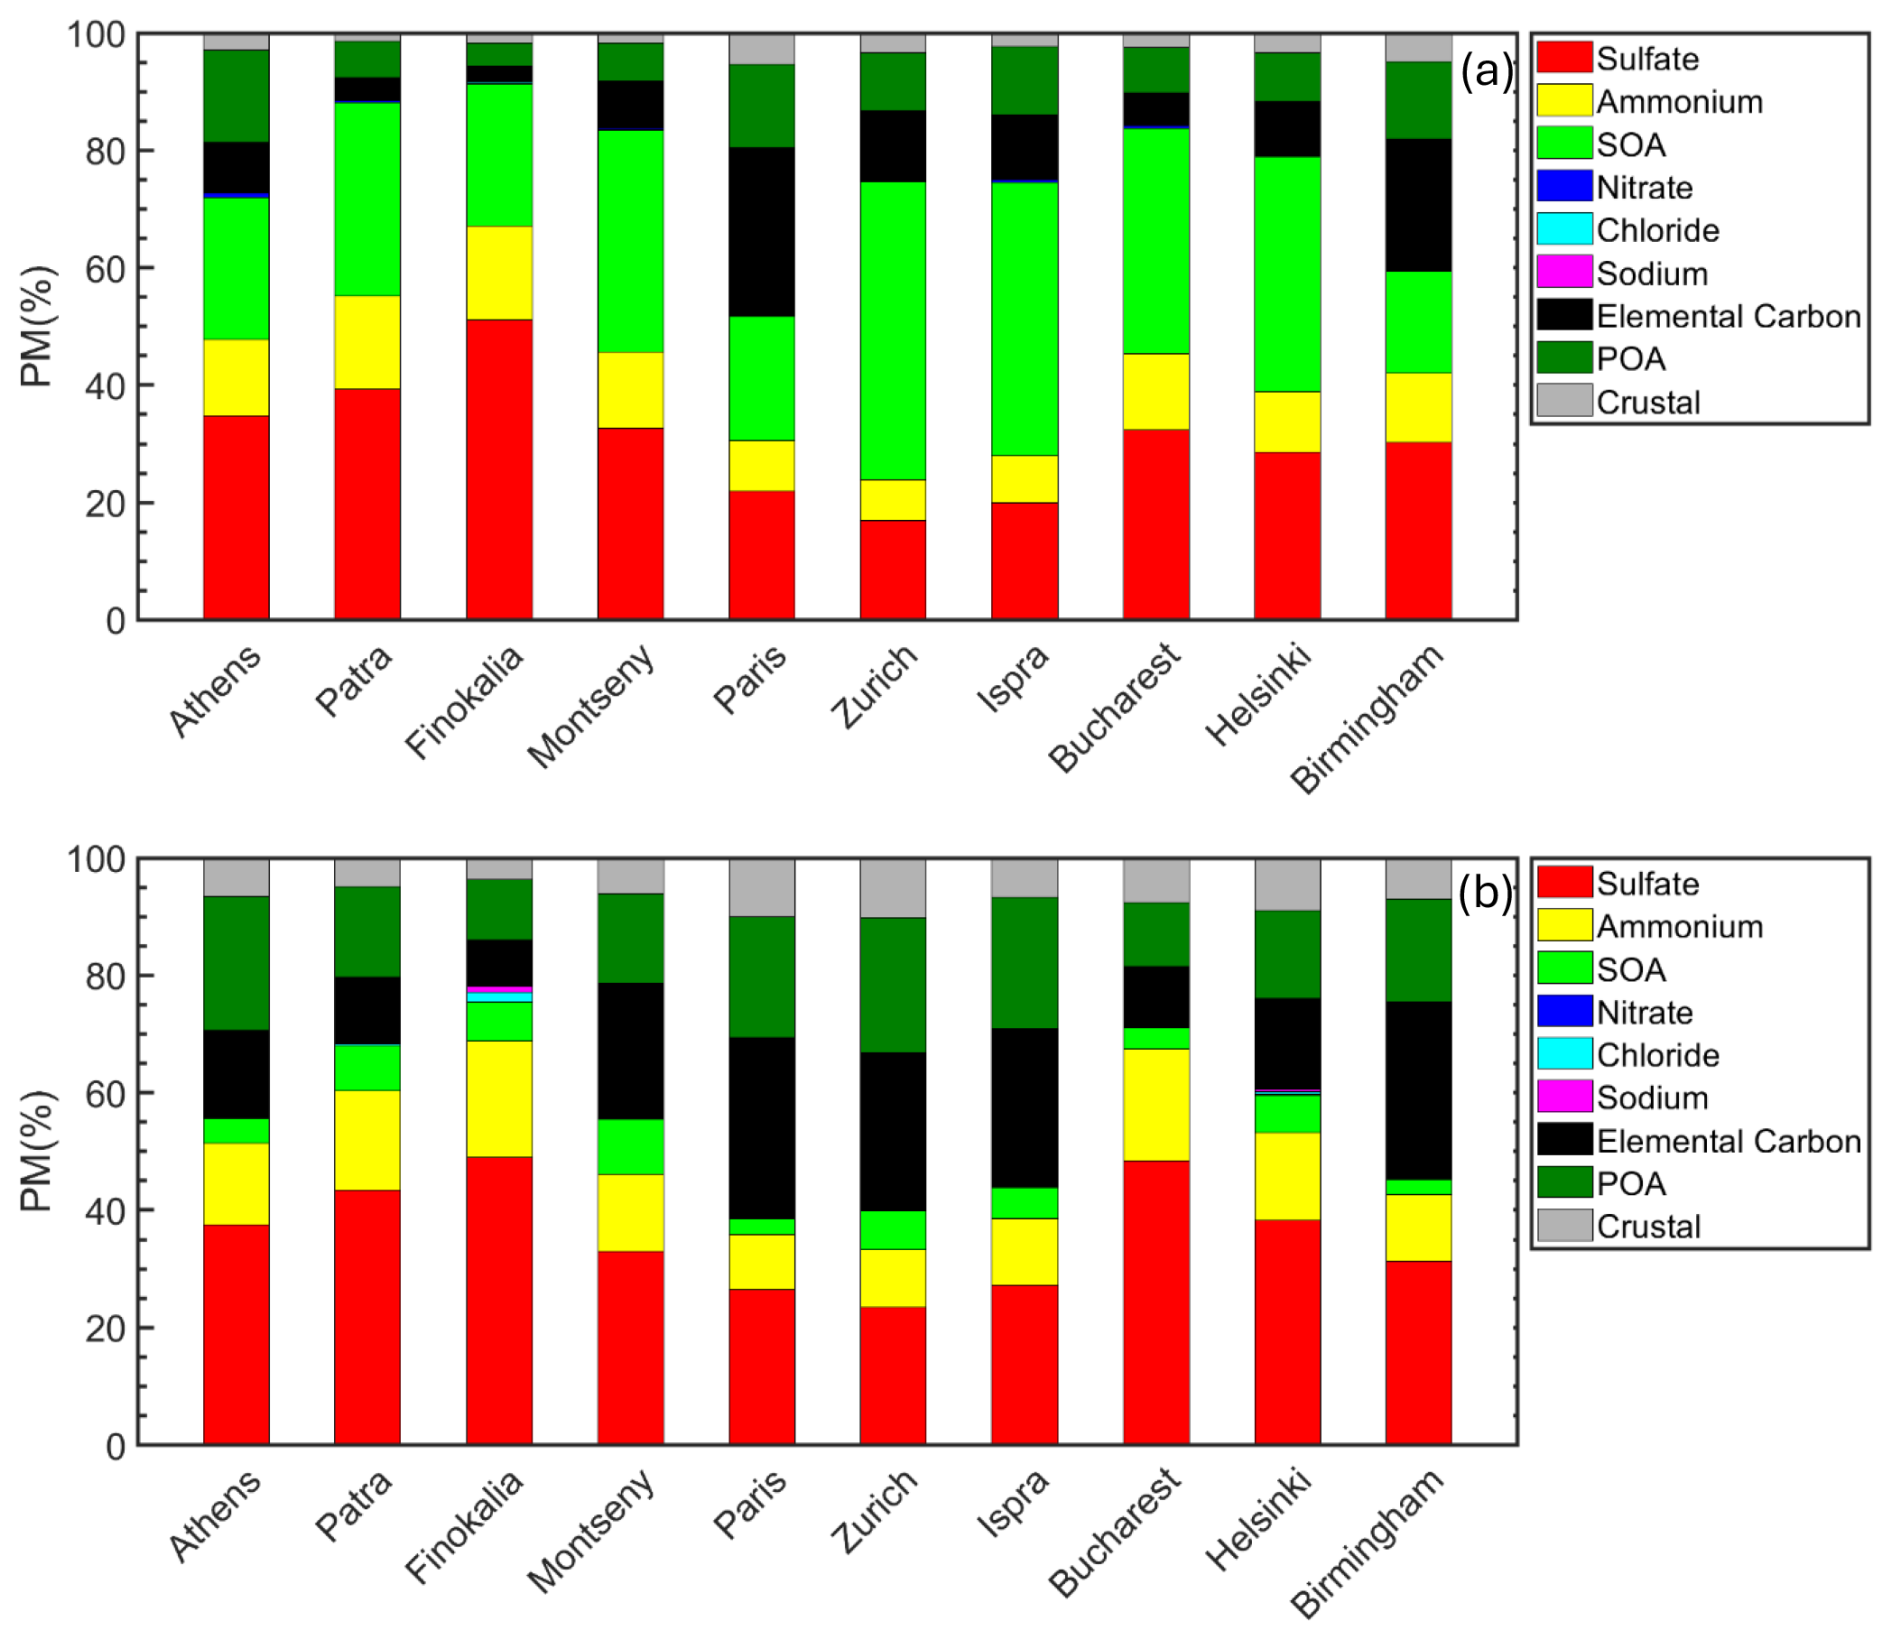
Figure 4Predicted chemical composition of ultrafine particles in the areas studied during the (a) summer and (b) winter period. POA (dark green) and SOA (green) stand for primary and secondary organic aerosol.
During the winter period, primary material contributed from 22 % to 61 % to PM0.1 depending on location (Fig. 4). Primary organic aerosol ranged from 10 % to 23 %. Elemental carbon was predicted to contribute 8 % to 31 %, while metals from 4 % to 10 % across all sites during this period. Ammonium and sulfate remained a significant fraction of PM0.1 (33 % to 69 %), especially in the urban areas in eastern Europe. The sulfate fraction ranged from 24 % to 49 %, with ammonium contributing from 9 % to 20 %. The contribution of SOA was limited, up to 9 % at the sites examined. The remaining PM0.1 components, namely nitrate, chloride and sodium, were predicted to contribute up to 1 % in almost all the examined sites.
In summer, in the urban area of Athens, the major component of PM0.1 was sulfate (33 %), followed by SOA (23 %), primary organic aerosol (18 %) and ammonium (13 %). In Paris, elemental carbon had the highest contribution (30 %) to PM0.1. Sulfate contributed 20 % and SOA 20 %. At the rural site of Finokalia, PM0.1 consisted of 52 % sulfate, 23 % SOA and 17 % ammonium, with smaller contributions of elemental carbon (2 %) and primary organic aerosol (4 %).
In Athens, wintertime PM0.1 consisted of sulfate (37 %), POA (23 %), elemental carbon (15 %) and ammonium (13 %). The remaining were metals (7 %) and SOA (5 %). In Paris, elemental carbon was the major PM0.1 component with a contribution of 30 %, similar to summer, as transportation was its major source. Sulfate contributed 25 %, while POA 20 %. Lower contributions were predicted for ammonium (10 %), metals (10 %) and SOA (5 %). In both Athens and Paris, PM0.1 was highly correlated with EC, especially during the periods with high PM0.1 concentrations (Fig. S2 in the Supplement). This was also the case in other sites like Montseny, Zurich, Ispra, and Birmingham indicating the importance of combustion sources for wintertime PM0.1 and the significant contribution of elemental carbon made to PM0.1 during the more polluted periods. At the rural site of Finokalia, PM0.1 mainly consisted of sulfate (49 %) and ammonium (16 %), with smaller contributions of primary organic aerosol (10 %), elemental carbon (8 %), chloride and sodium.
The average chemical composition of PM2.5 and PM0.1 was similar in most areas as they were both dominated by secondary components during the summer period (Fig. S1). SOA was the major component of PM2.5 in most sites, contributing between 12 % and 45 %, with the highest levels in Zurich, Ispra, and Bucharest. Sulfate also played a significant role (13 %–34 %), particularly in Finokalia and Patras. Ammonium contributed between 6 % and 15 % across all sites. Sulfate contributed a little more to PM0.1 than to PM2.5 accounting for 30 % to 50 % of the PM0.1, while SOA and ammonium contributions remained comparable to those in PM2.5.
In winter, the composition of PM2.5 was in general different from that of PM0.1 in several cities, reflecting differing major emission sources and formation mechanisms. POA contributed more to PM2.5 (4 %–38 %) than to PM0.1 (10 %–23 %), whereas elemental carbon contributed less to PM2.5 (2 %–17 %) compared to PM0.1 (8 %–31 %) (Fig. S1). At coastal sites like Patras, Finokalia, and Helsinki, secondary inorganic aerosol (including sulfate, nitrate, and ammonium) along with crustal elements and sea salt, dominated the PM2.5 composition, accounting for 82 %–90 %. Sulfate concentrations were generally lower PM2.5 (17 %–34 %) than in PM0.1 fraction (24 %–49 %) during winter.
4.3 PMCAMx-UF evaluation
4.3.1 Summer
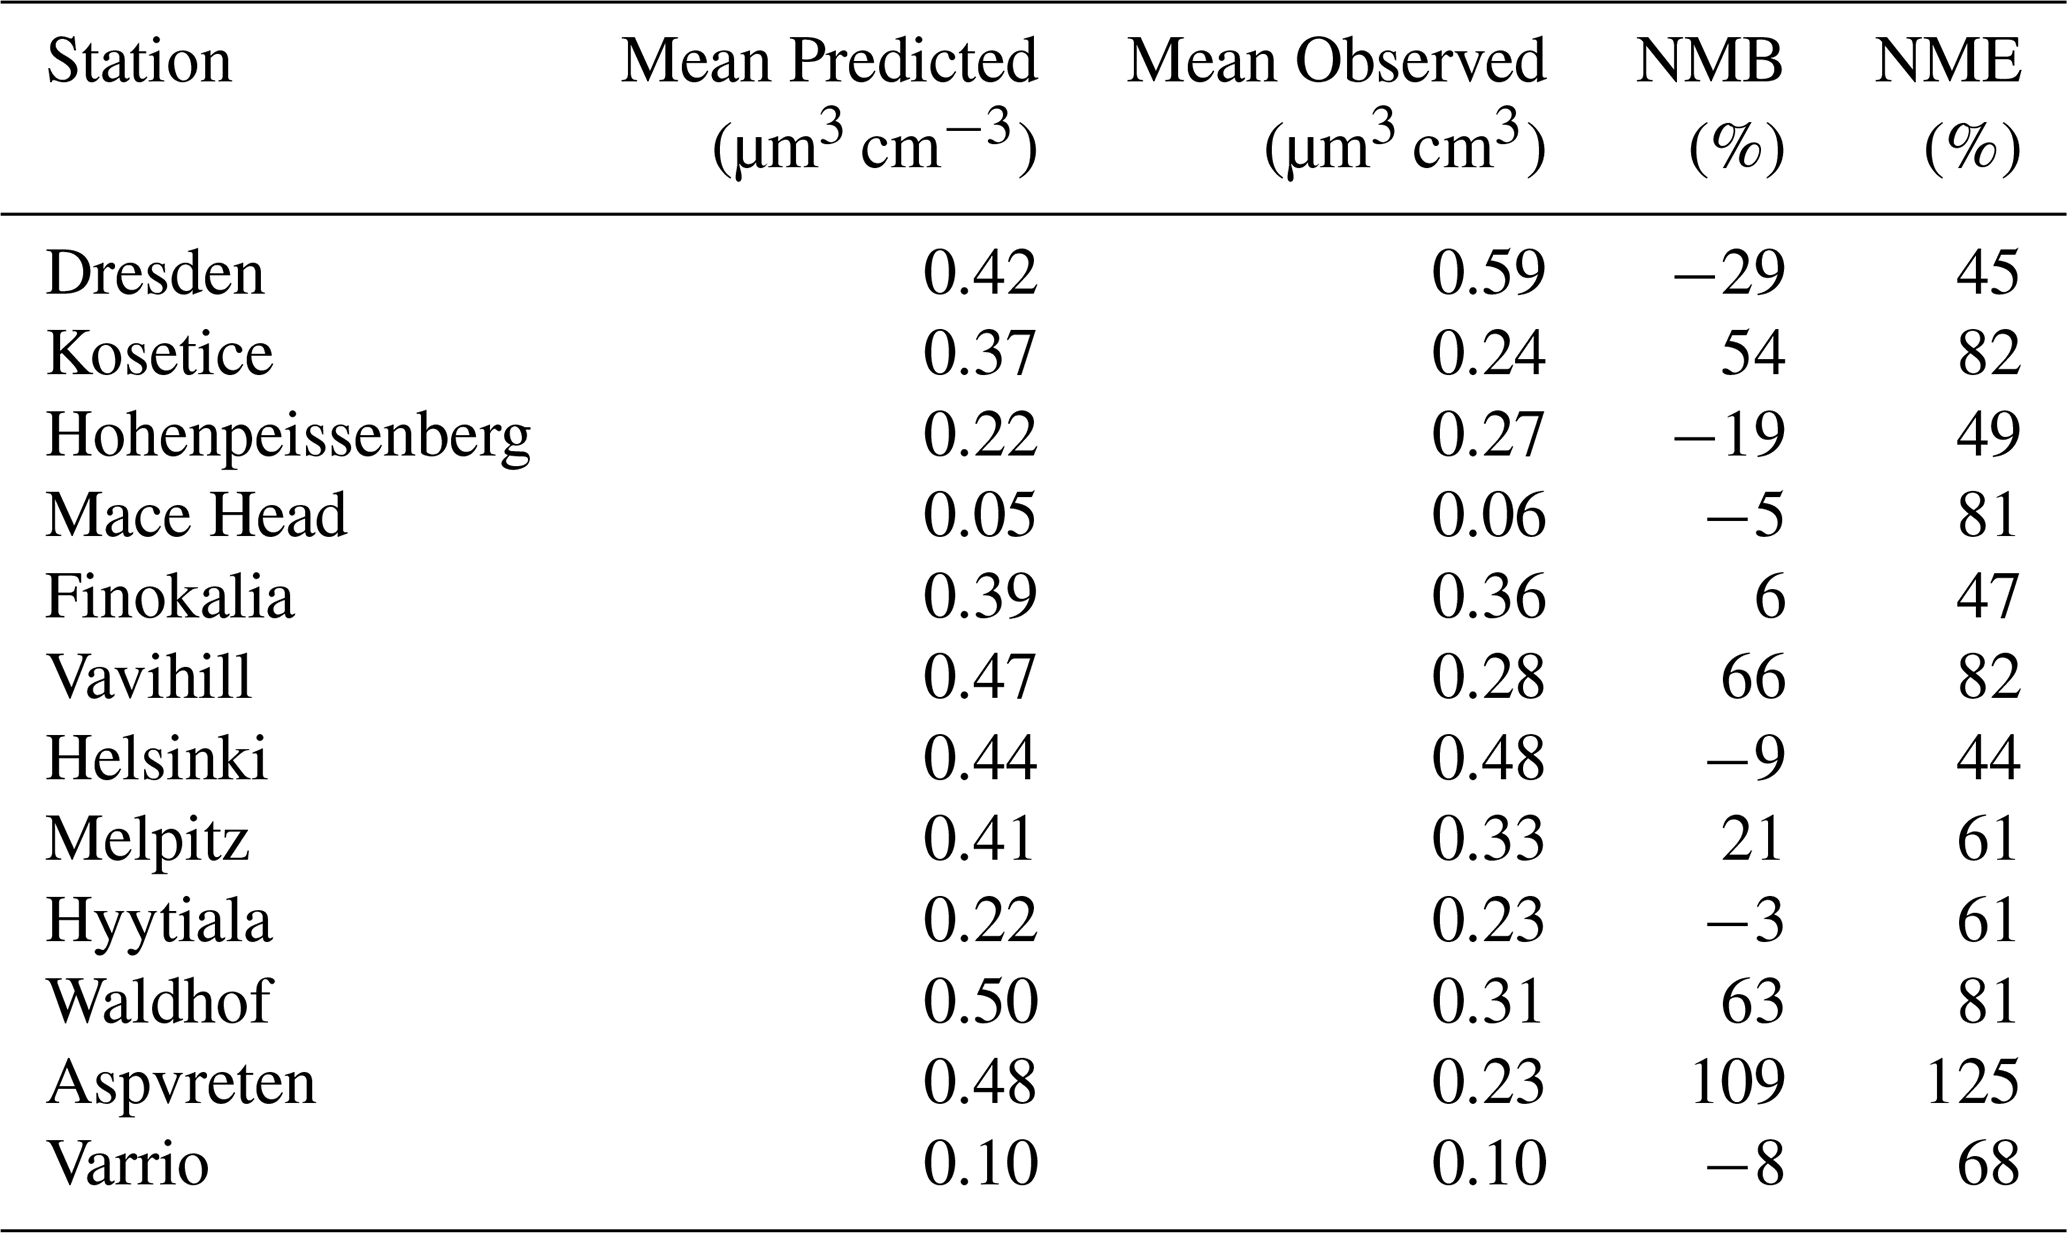
During the summer period, PMCAMx-UF predictions showed on average little bias with a NMB equal to 15 % for hourly average concentrations (Table 1). The NME, on an hourly level, was on average 62 %, a level similar to that of PM2.5 predictions of CTMs in Europe. The model performance in this first application was clearly quite encouraging (Fig. S3). NMB and NME hourly metrics in the various stations ranged from −29 % to +109 % and from +44 % to +125 %, respectively. The model's performance improved, as expected, for daily average concentrations (Table S1). The NME was reduced to 46 %. The NMB remained at the low level of 15 %.
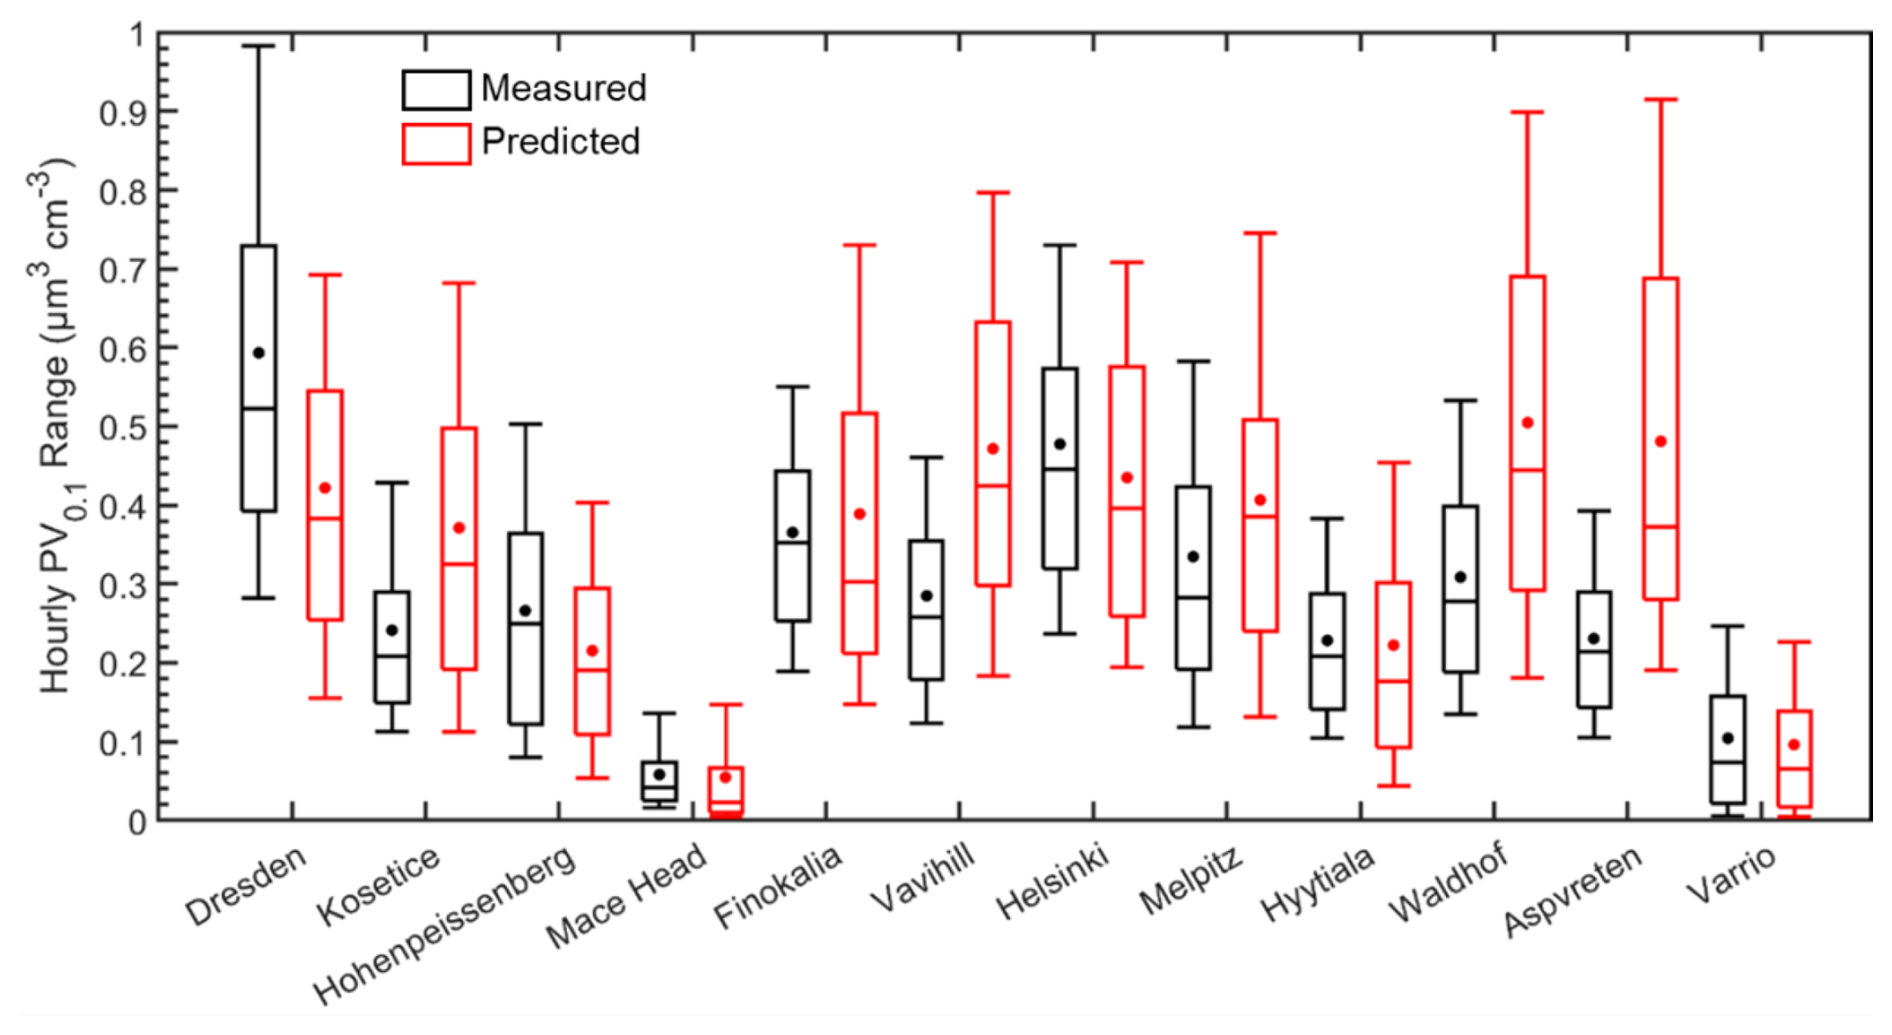
Figure 5Distributions of predicted (red) and measured (black) hourly ground-level UFP volume (in µm3 cm−3) during 5 June–8 July 2012, in the 12 sites examined. Stars and lines inside each box designate the mean and the median value of the PV0.1 distribution. Box top and bottom lines indicate the upper (75 %) and lower (25 %) quartiles. The upper and lower extended lines (whiskers) are for the 90th and the 10th UFP volume distribution percentiles.
Table 1PMCAMx-UF hourly evaluation metrics of PV0.1 during the period of 5 June–8 July 2012 for the 12 measurement sites.
During the summer, for most locations, model predictions as well as measured values exhibited significant variability (Fig. 5). This spatial and temporal variability is mainly related to the spatial and temporal variability of emission sources, secondary aerosol production and to the variability of meteorological conditions. In most sites, the mean was larger than the median due to short-term elevated concentrations. PMCAMx-UF on average did a reasonable job predicting the observations, with overpredictions and underpredictions of PV0.1, depending on the location. Average concentrations for the full period were captured within 0.1 µm3 cm−3 for 7 out of 12 of the examined sites, with all the predicted averages being within 0.25 µm3 cm−3 of measurements. Regarding the urban sites, in Dresden, mean ultrafine particle volume concentration was underpredicted by 0.17 µm3 cm−3. For Helsinki, the mean predicted PV0.1 was quite consistent with the measurements. In rural background areas (Vavihill, Aspvreten, Waldhof and Kosetice), PMCAMx-UF overpredicted PV0.1 by 0.13 to 0.25 µm3 cm−3. In general, predicted concentrations were higher than measurements. Mean predicted PV0.1 for all the sites examined was 0.34 µm3 cm−3 and the corresponding measured value was 0.29 µm3 cm−3.
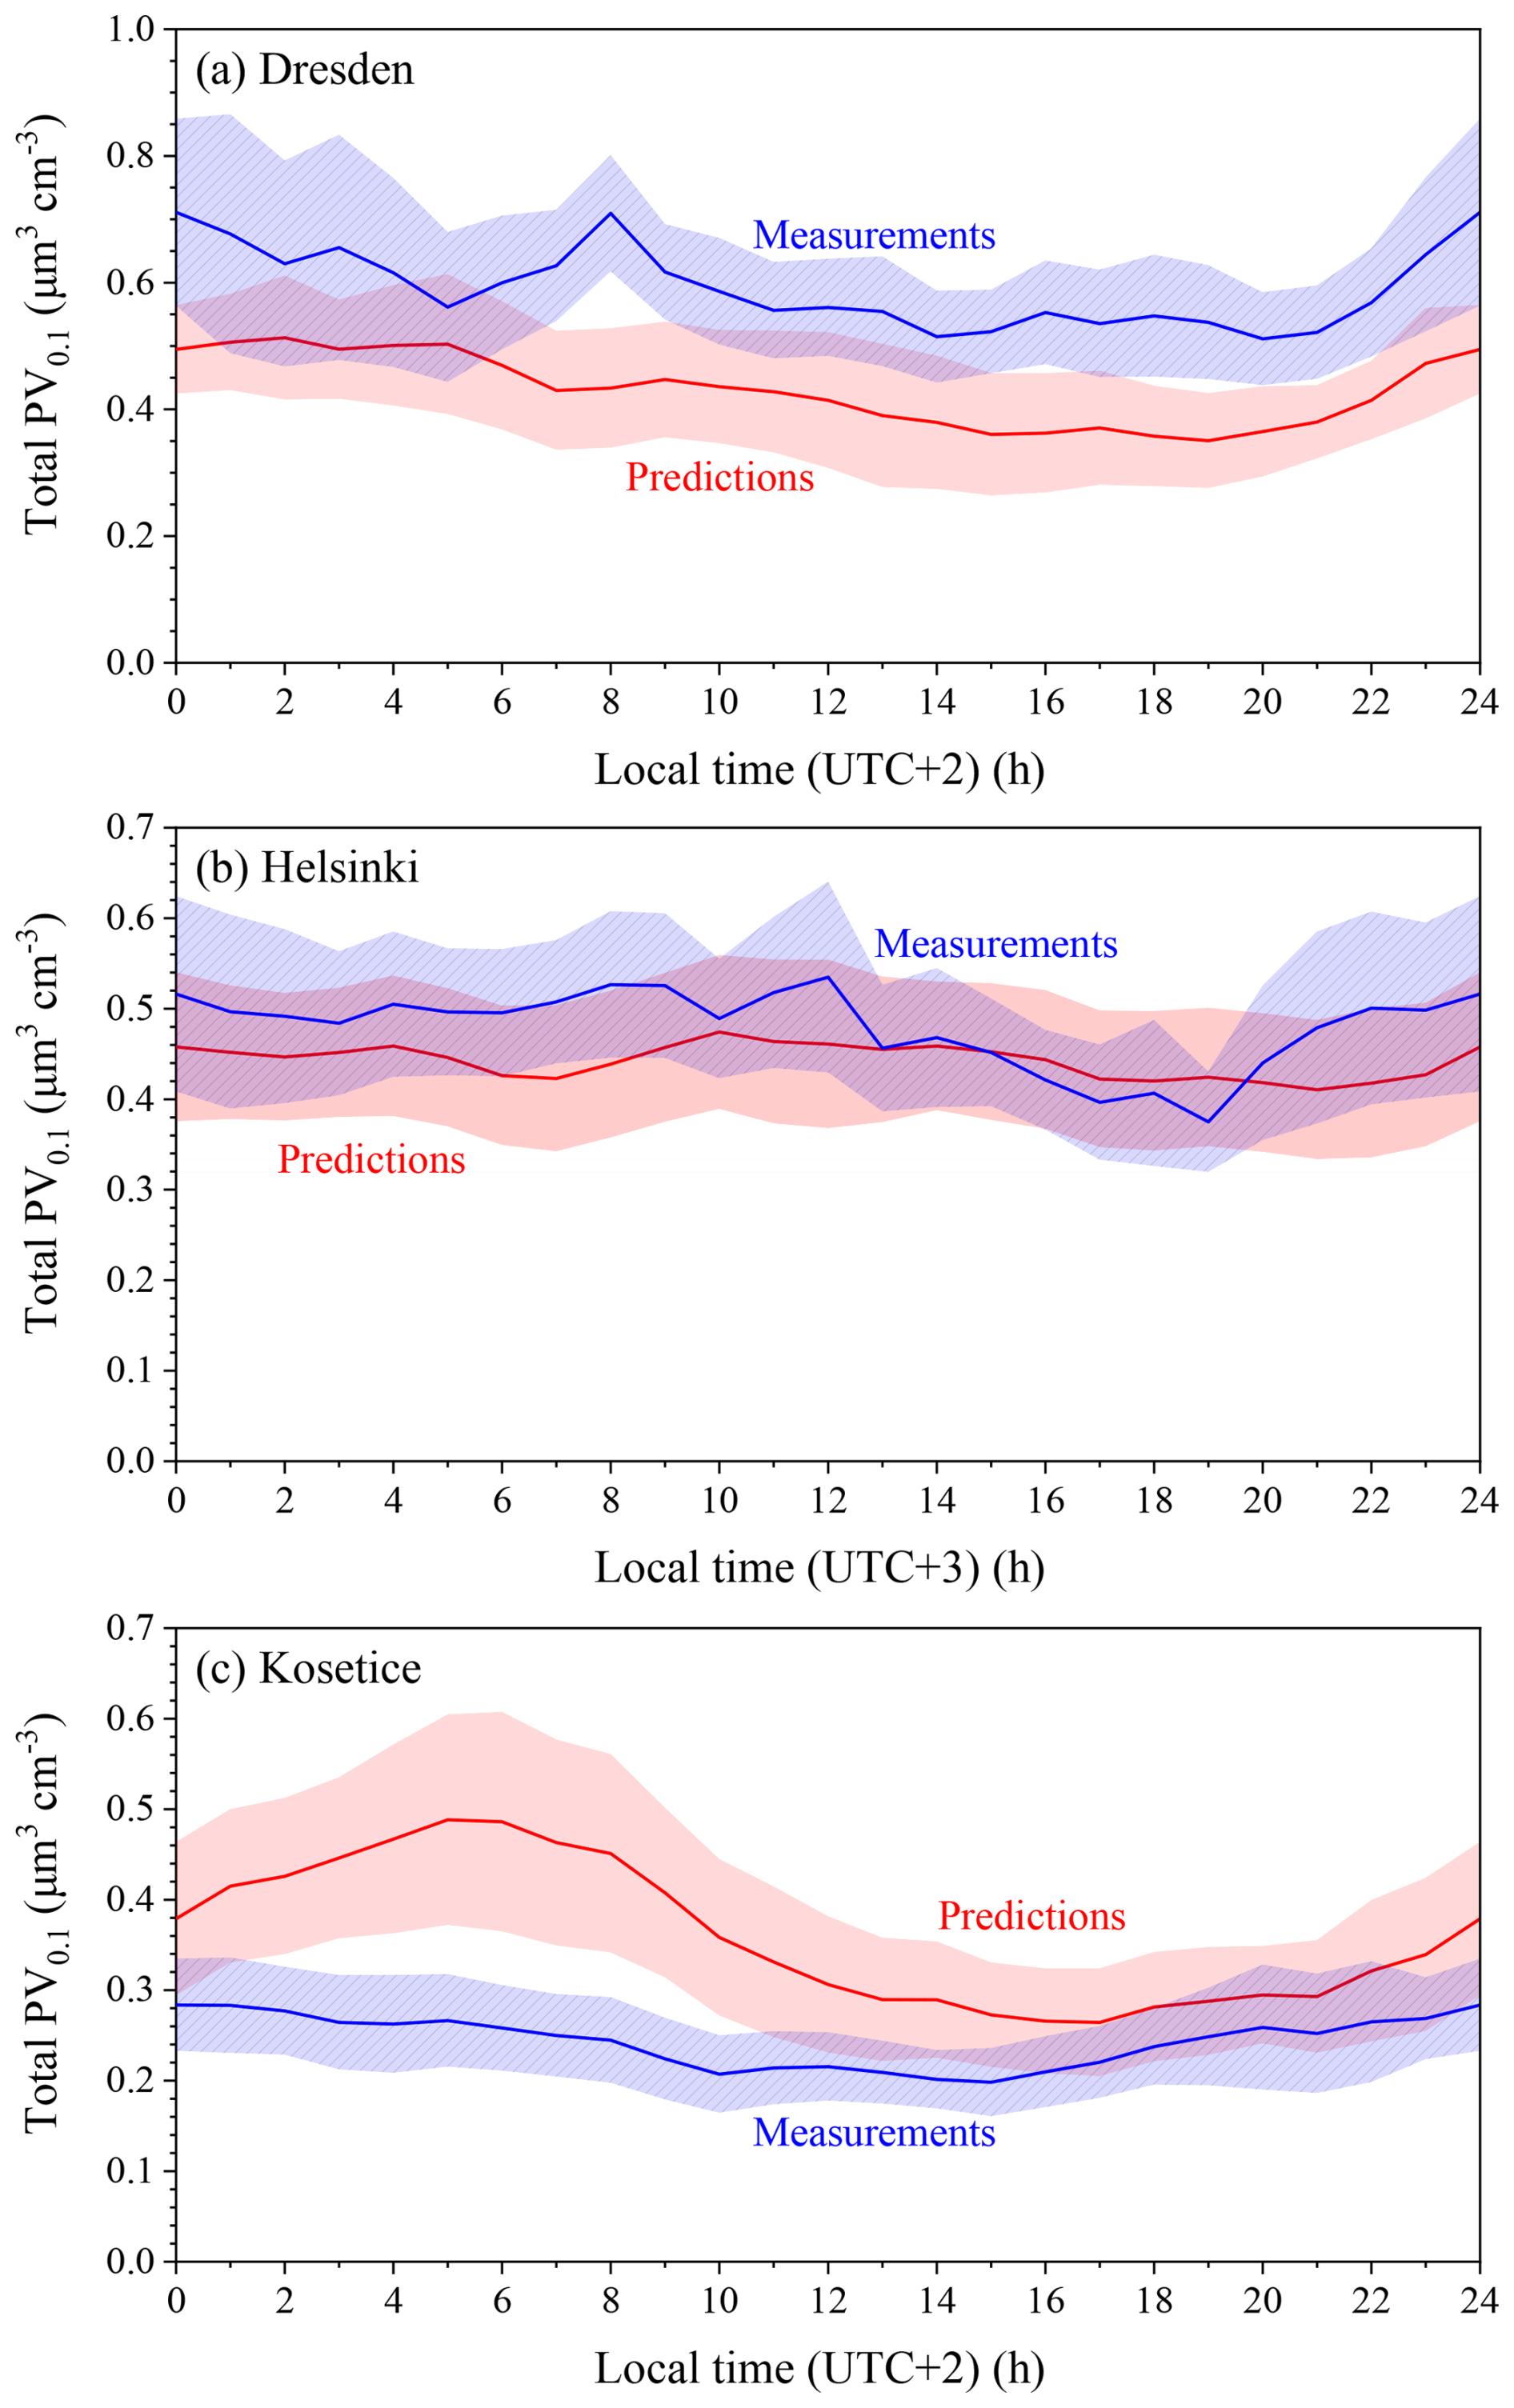
Figure 6Average diurnal profiles of predicted and measured total volume concentrations (µm3 cm−3) in (a) Dresden, (b) Helsinki and (c) Kosetice for the period of 5 June–8 July 2012. The shaded regions reflect plus or minus one standard deviation of the mean.
In Dresden, the model predicted a weaker diurnal variation to that observed, but its main weakness was its underprediction of the baseline by around 0.2 µm3 cm−3 (Fig. 6). A noticeable measured peak at 08:00 LST probably indicates traffic emissions which were not captured in the model, either through omission or due to grid resolution. The model tended overall to capture the hourly variations (Fig. S4), though it missed some high concentration periods on the 8, 10, 16 and 24 June.
For Helsinki, the average measured diurnal pattern was relatively flat (Fig. 6). Measured values were reproduced well by PMCAMx-UF, with differences of around 0.05 µm3 cm−3 throughout most of the average day. The detailed time series was also well reproduced (Fig. S4).
In Kosetice, for the first half of the day, predictions were far larger than the corresponding measurements, starting the night at +0.1 µm3 cm−3 and peaking at 05:00–06:00 with a more than +0.2 µm3 cm−3 difference (Fig. 6). This increase in predicted levels was due to an increase in traffic emissions. For the second half of the day, predicted and measured values were in reasonable agreement. Excluding the first two days, which were influenced by the initial conditions, the model overpredicted nighttime to early morning concentrations in several periods (10–12, 16–17, 24 and 26 June) (Fig. S4). Measured concentrations were rarely higher than those predicted, for example on 2 and 3 July, when sharp peaks indicated possible nearby sources. The overprediction could indicate that emissions of UFPs in the area were overestimated.
The average diurnal profiles of measured and predicted PV0.1 concentrations as well as their corresponding hourly levels for the rest of the 12 sites for the summer period can be found in Figs. S4 and S5. PMCAMx-UF predicted well the average diurnal profile of measured PV0.1 in Hyytiala, with an average value of 0.25 µm3 cm−3, while there were overpredictions during the whole day for Vavihill, Waldhof and Aspvreten.
4.3.2 Winter
PMCAMx-UF tended to underpredict the winter PV0.1 levels with an NMB equal to −30 % for hourly averaged values (Table 2). The NME for hourly predictions was higher than during the summer with a value of 72 %. For daily average levels, the NMB was −27 % and the NME equal to 64 % (Table S2). The model overpredicted PV0.1 by 0.03 to 0.09 µm3 cm−3 in the sites of Vavihill, Hyytiala, Aspvreten and Varrio.
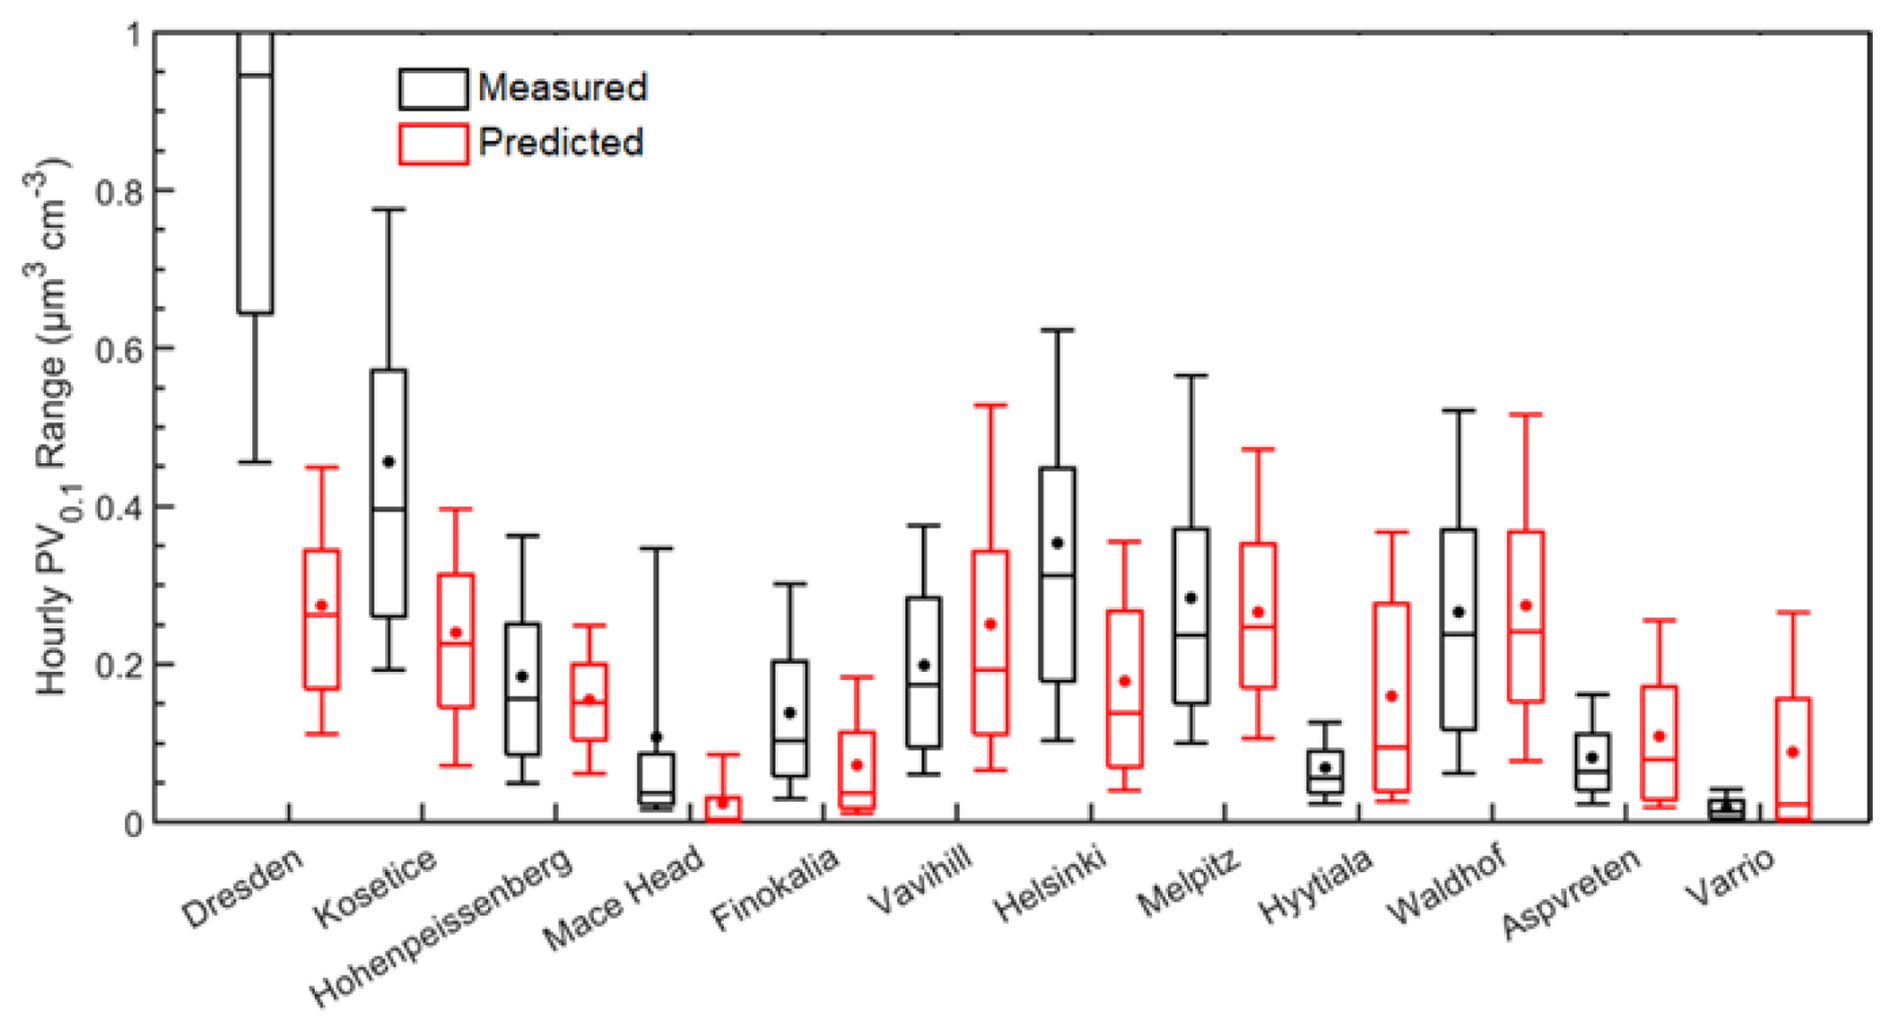
Figure 7Distributions of predicted (red) and measured (black) ground-level UFP volume during 1–30 January 2009, in the 12 sites examined. Stars and lines inside each box designate the mean and the median value of the PV0.1 distribution. Box top and bottom lines indicate the upper (75 %) and lower (25 %) quartiles. The upper and lower extended lines (whiskers) are for the 90th and the 10th UFP volume distribution percentiles.
Table 2PMCAMx-UF hourly evaluation metrics of PV0.1 during the period of 1–30 January 2009 for the 12 measurement sites.
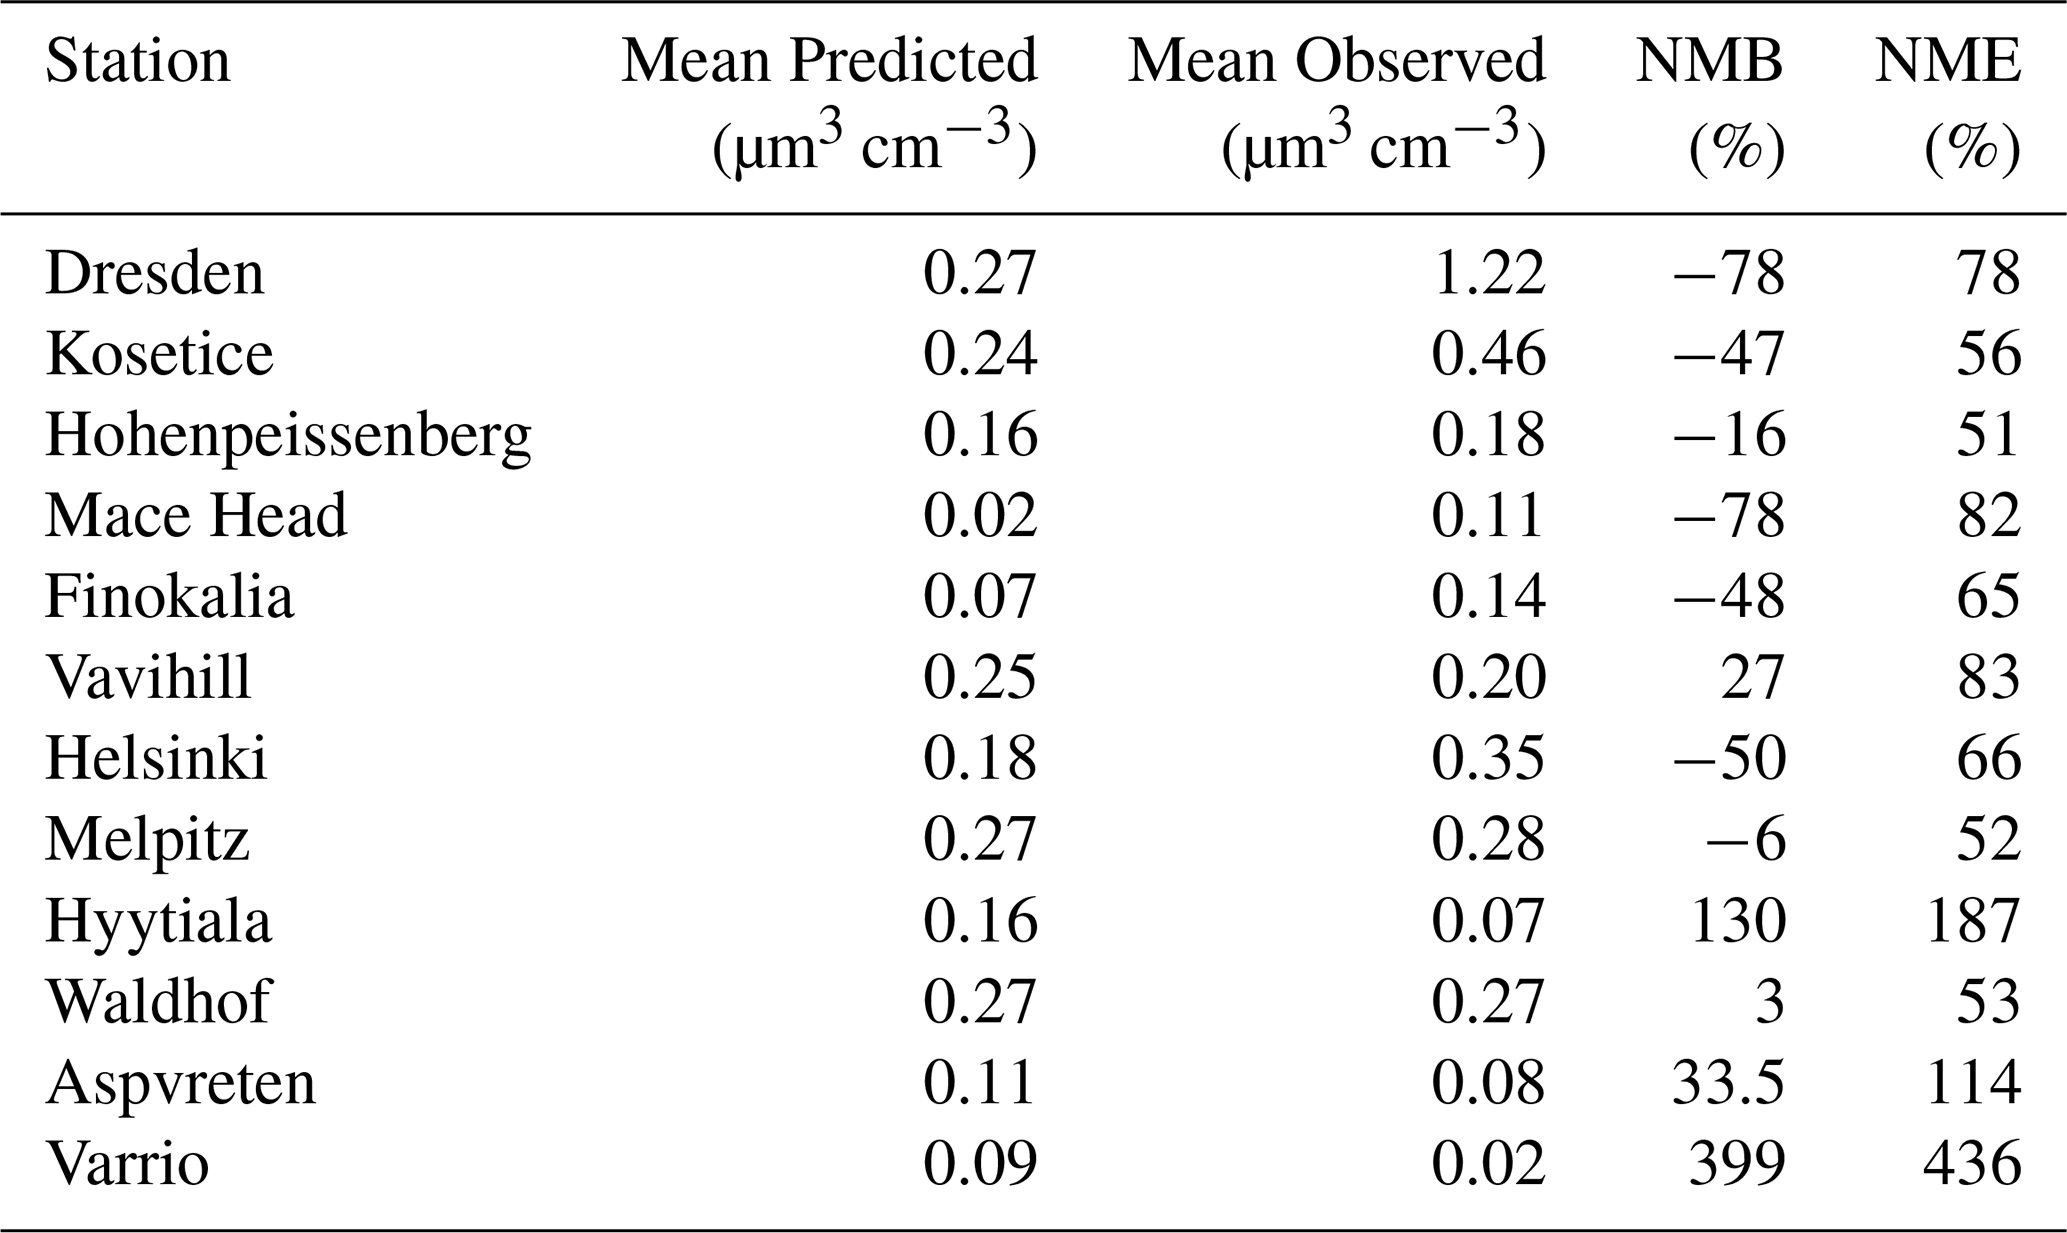
Mean predicted values in 9 out of 12 sites were within 0.1 µm3 cm−3 of the measured mean (Fig. 7). PV0.1 was underpredicted in 7 out of 12 sites. Despite the increased frequency of underprediction, major positive deviations between predictions and observations were found in the Varrio and Hyytiala sites, with high model error also in the Aspvreten, Vavihill, Mace Head and Dresden sites. Mean predicted PV0.1 was 0.17 µm3 cm−3 for all sites and mean measured PV0.1 was 0.24 µm3 cm−3.
In Dresden, the ultrafine particle volume concentration was seriously underpredicted, 0.27 to 1.22 µm3 cm−3 respectively. Mean ultrafine particle volume concentration for Helsinki was also underpredicted, with a predicted value of 0.18 µm3 cm−3 and a measured value of 0.35 µm3 cm−3. On the other hand, for the remote Hyytiala site in Finland, mean predicted total PV0.1 was 0.16 µm3 cm−3, compared to a measured average of 0.07 µm3 cm−3. This suggests that the underpredictions in Helsinki were mostly due to local sources and not to regional underprediction.
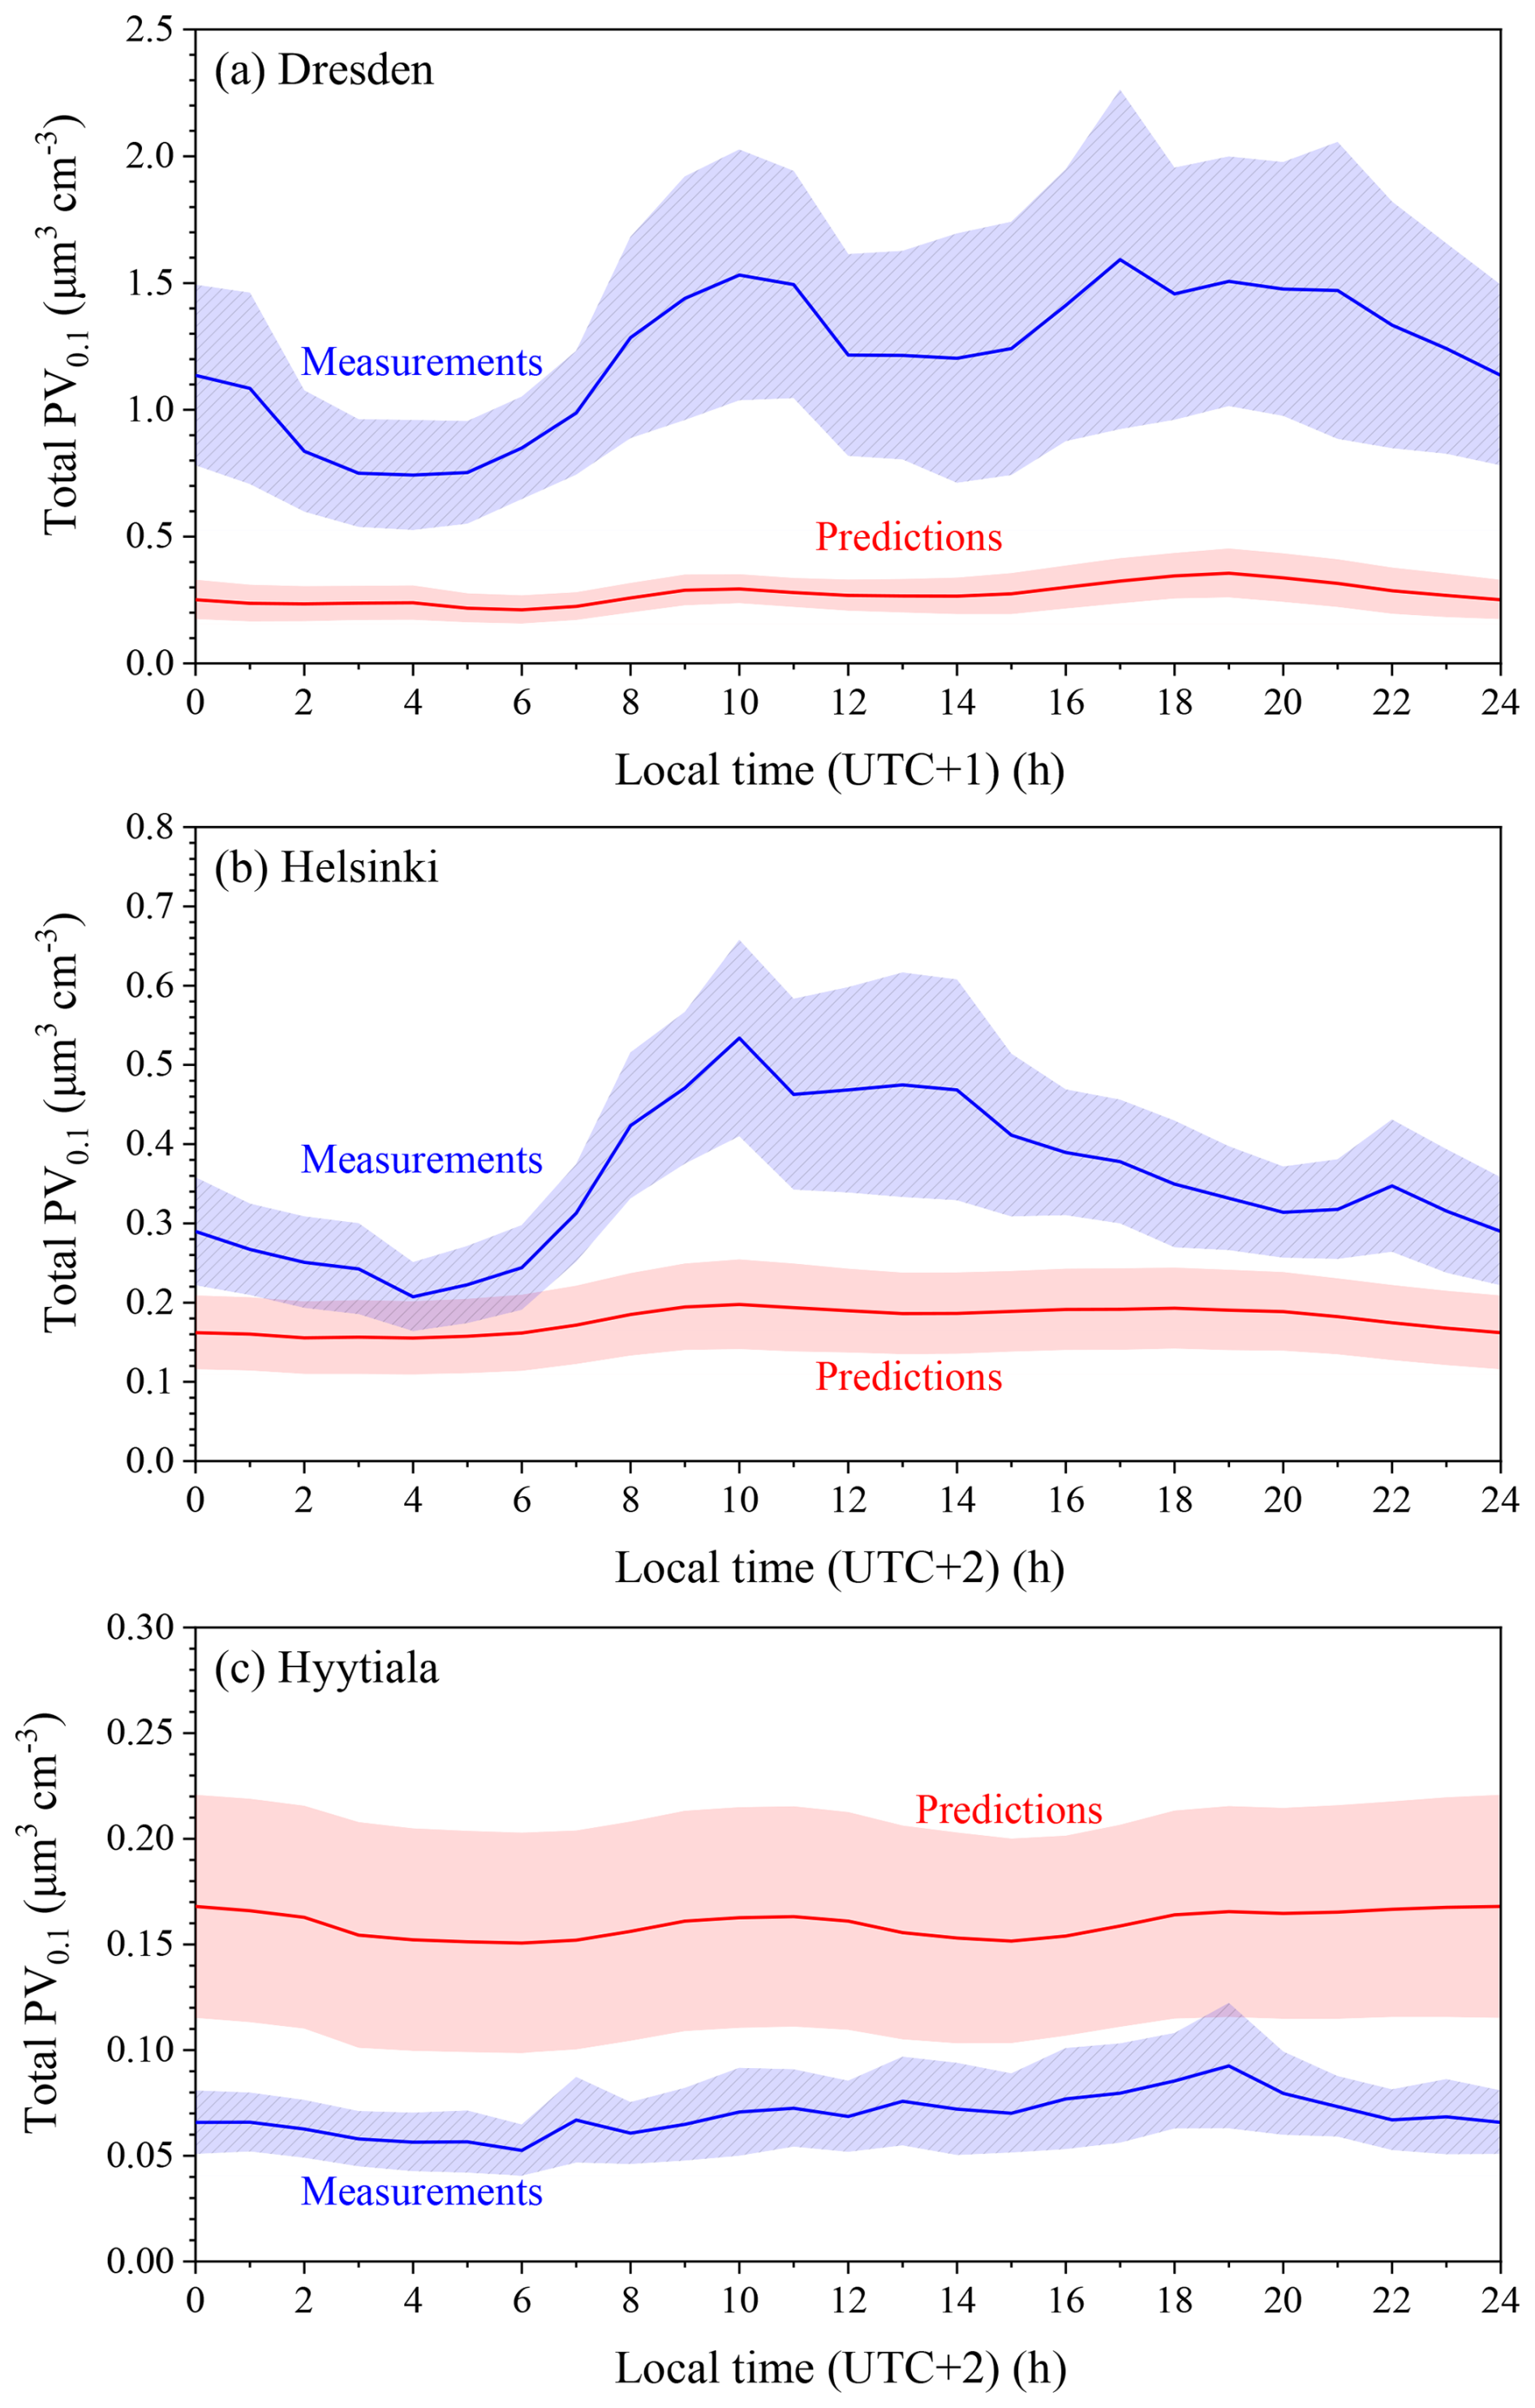
Figure 8Average diurnal profiles of predicted and measured total volume concentrations (µm3 cm−3) in (a) Dresden, (b) Helsinki and (c) Hyytiala for the period of 1–30 January 2009. The shaded regions reflect plus or minus one standard deviation of the mean.
In Dresden, the measured levels increased by a factor of two early in the morning while the predicted profile remained practically flat (Fig. 8). This suggests strongly the lack of one or more major local sources, probably transportation and residential heating. It could also be partially due to the coarse resolution of the model; local emissions were diluted in the large computational cell of the model covering the area of the city. The corresponding hourly concentrations are shown in Fig. S6.
For Helsinki, the predicted average diurnal profile was nearly flat (variation less than 0.05 µm3 cm−3) throughout the day, while the measurements peaked at 10:00, remaining near constant during midday and then gradually decreasing (Fig. 8). The hourly concentrations suggested that the model was rarely able to predict observed elevated concentration levels during specific one to two-day periods (Fig. S6). The sources of ultrafine particles during these periods need to be further examined. Errors in the meteorological inputs and especially the mixing height were also a possible explanation of these persistent errors.
In Hyytiala, the diurnal average profiles of measured and predicted values were both flat but they differed by approximately 0.1 µm3 cm−3 (Fig. 8). This suggests that the model agreed with observations regarding the relatively low local contributions but it overpredicted the regional background. This could be partially due to the assumed boundary conditions that influenced the Nordic countries more than the rest of Europe due to the choice of modeling domain. Turning our attention to the full period hourly concentrations, substantial deviations became readily apparent (Fig. S7). For the first half of the simulated period, predicted UFP volume concentrations tended to follow measured values, with rapid increases in measured concentrations not generally predicted. These were again possibly indicative of local sources influencing the measurement site. After 17 January, the model overpredicted PV0.1. The reasons for this overprediction require future analysis. The corresponding hourly PV0.1 concentrations as well as their average diurnal profiles for the rest of the 12 sites for this winter period can be found in Figs. S6 and S7.
Average volume distributions for measured and predicted PV0.1 were in general consistent with a monotonically increasing shape (Fig. S8). For sites in which PMCAMx-UF was in good agreement with the PV0.1, the measured size distributions were also in good agreement for all sizes, suggesting that the good performance of the model was not due to offsetting errors. In most areas where there were discrepancies the predicted size distribution was correct but there were errors in the magnitude. Dresden during the winter was the exception, with the measured volume distribution starting to increase at 15 nm while the predicted one started to rise at 30 nm. This suggests that the model was missing a major ultrafine particle source in this site during the cold period. In all sites the predicted and measured volume distributions suggested that nucleation made a minor contribution to ultrafine particle mass concentrations.
The spatial and seasonal variation in PM0.1 concentrations is largely driven by emission patterns, which fluctuate across different timescales – from monthly to hourly. The geographic distribution of these emissions, influenced by land-use characteristics across the study area, contributes to regional differences. Weather conditions also have a strong influence, with variables like wind speed and direction, boundary layer height, and solar radiation affecting how particles are dispersed, transported, formed and removed. Additionally, photochemical processes are a key factor, as a substantial portion of PM0.1 is produced in the atmosphere from gas-to-particle conversion processes, making chemical reactivity and sunlight-driven transformations major contributors to its variability.
The depth of our analysis of the evaluation of PMCAMx-UF for PM0.1 is at present limited by the lack of measurements of the chemical composition of PM0.1 and the related measurement-based source apportionment studies in Europe. This limits our ability to reach firm conclusions about what the model gets right and where it fails. For a lot of the aspects of PM0.1 behavior (e.g., composition and sources) our work presents our present understanding based on model predictions (emissions and atmospheric processes) to motivate and help in the design of future studies.
4.4 Predicted links between PM0.1 and PM2.5
Current regulations are focusing on the reduction of PM2.5. It is not clear if these strategies will be effective in the reduction of PM0.1 too. One way to address this issue at least as a first step is to examine the temporal correlation between PM0.1 and PM2.5. A correlation would suggest that the sources and processes driving particle mass concentrations in both size ranges are similar, and therefore control strategies that will work for PM2.5 will also be effective for PM0.1. Low correlations would suggest that different approaches may be needed for the reduction of both fine and ultrafine particle mass.
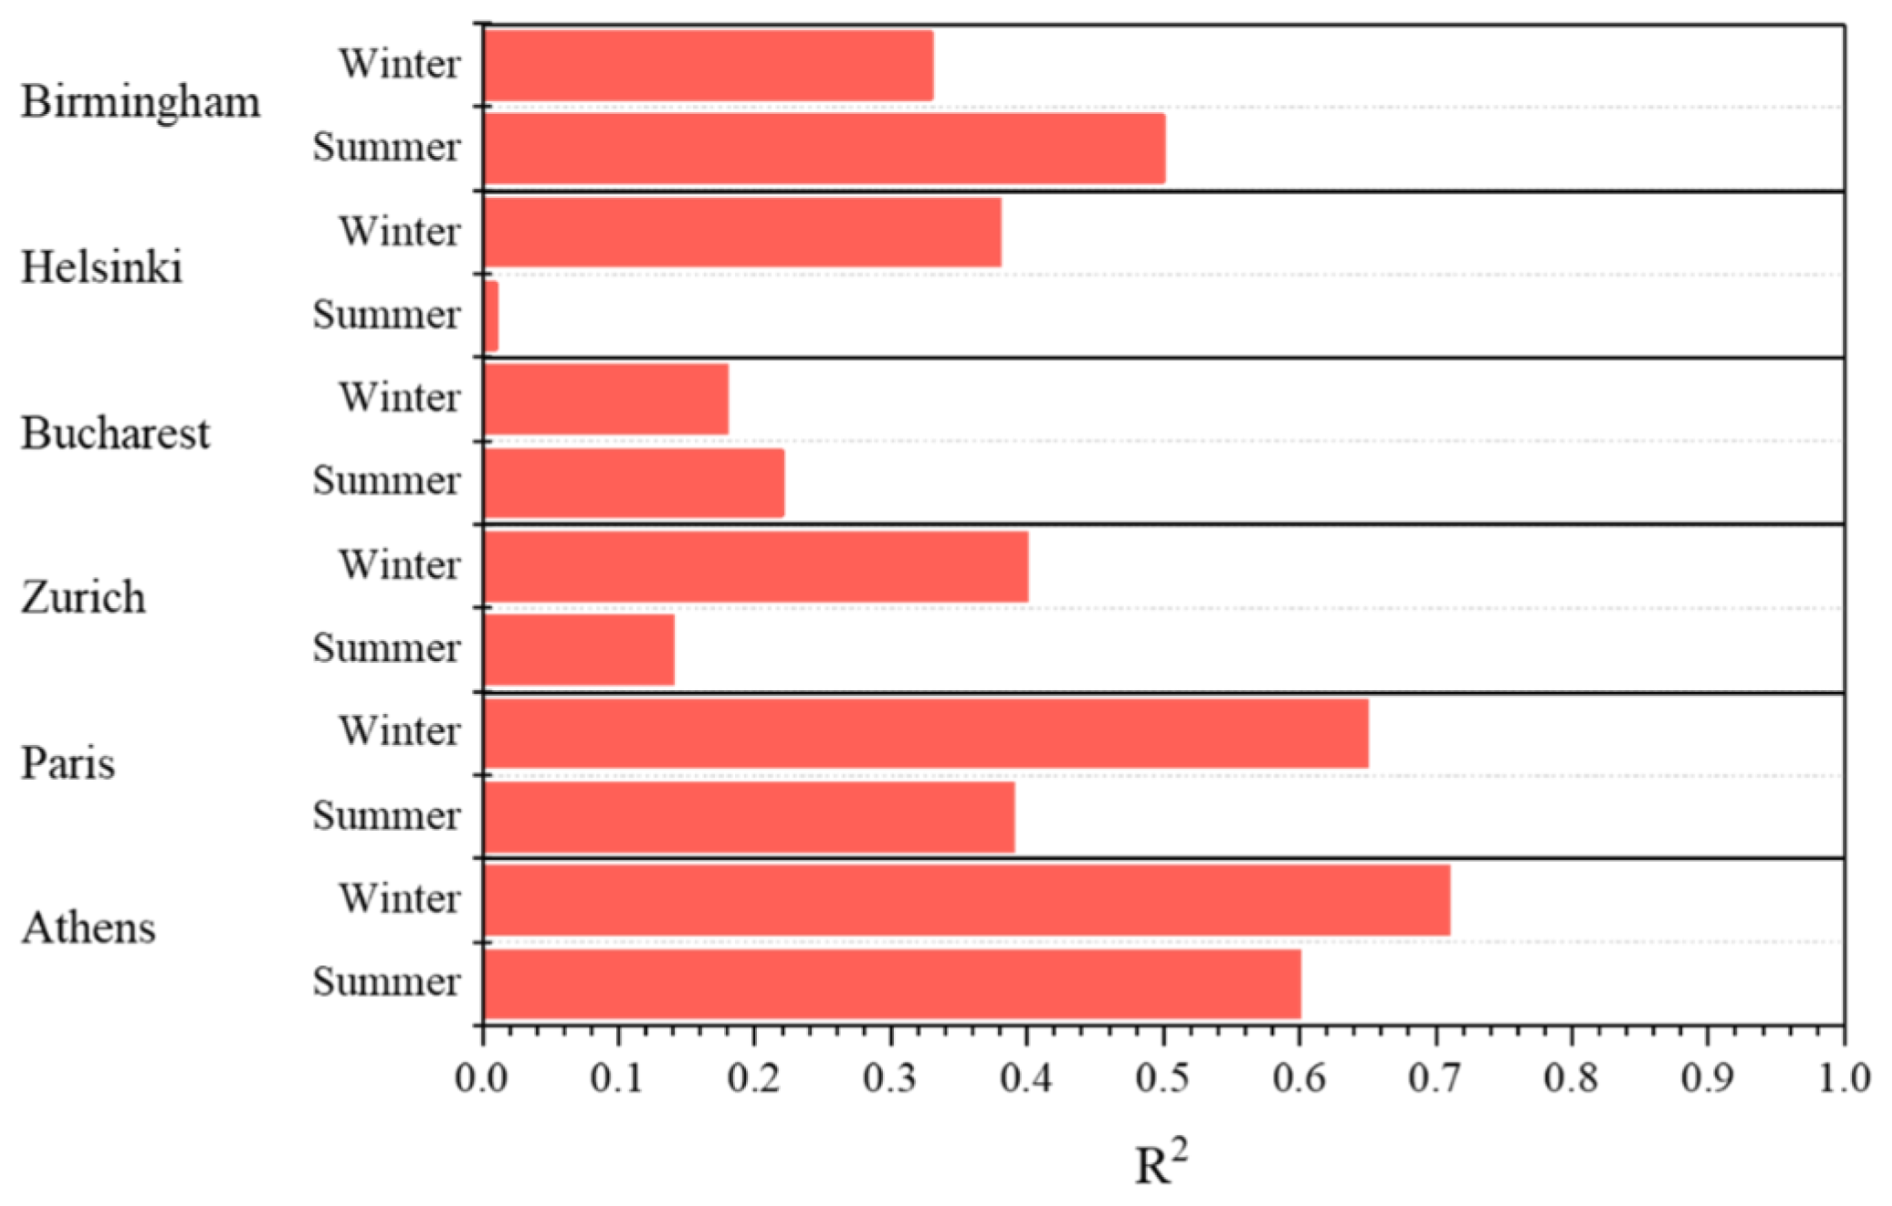
Figure 9R2 values (square of the samples Pearson's correlation coefficient) between PM0.1 and PM2.5 for Athens, Paris, Zurich, Bucharest, Helsinki and Birmingham during the summer and winter periods.
The correlation of predicted PM2.5 with PM0.1 was examined during the summer and winter period. For the summer period, the mass concentration of fine and ultrafine particles had low correlation in Zurich, Bucharest and Helsinki, with comparatively better correlations in Athens, Birmingham and Paris (Fig. 9). In Helsinki, the two values have a coefficient of determination (R2) of 0.01. Ultrafine particle mass in Helsinki, as well as in Bucharest and Zurich was mostly secondary inorganic and organic during the summer period. In Athens, Paris and Birmingham, the correlation was significantly better, around 0.4 to 0.6. For Athens, the correlation was driven by wildfire episode (Fig. S9). If this period is excluded the correlation decreases significantly.
For the winter period, correlations were high across most major cities examined, with the notable exceptions of Bucharest and Birmingham (Fig. S10). The R2 for Zurich, Birmingham, Bucharest and Helsinki was less than or equal to 0.4, but it was higher for Athens (0.71) and Paris (0.65).
For most major cities, an increase in the primary component of PM0.1, was accompanied by an increase in its correlation with PM2.5. The exceptions were again Birmingham and Bucharest. The predicted R2 value in both cities seems to be influenced by outliers of substantially elevated PM2.5 values. Yu et al. (2019) reported an R2 between predicted PM2.5 and PM0.1 in a year-long study in California, for all domain cells, of 0.63. In that study, PM0.1 was mostly comprised of primary matter from combustion processes. This value is comparable to the highest observed in our study, specifically in Athens and Paris.
The correlation between PM0.1 and PM2.5 was typically weak, but stronger associations were found when the primary component of PM0.1 played a significant role. This suggests notable differences in the sources and processes that contribute to PM0.1 and PM2.5.
Predicted levels of PM0.1 were quite variable in space and time. The average predicted total PM0.1 for the continental regions over Europe was 0.6 µg m−3 for the summer and 0.3 µg m−3 for the winter period. On average, sulfate (38 %), SOA (32 %), ammonium (13 %) and POA (8 %) were the most significant PM0.1 components during the summer. Primary and secondary inorganic matter had an increased mass fraction (16 % to 23 % and 51 % to 66 %) during the winter period. The secondary organic matter contribution was quite low (6 %) during the winter. The high secondary contribution to PM0.1 is rather surprising.
PMCAMx-UF showed little bias (15 %) in predicting summertime ultrafine volume observations in 12 sites across Europe. During the winter, the model tended to underpredict PM0.1 with a NMB of −30 % for hourly average values. The model NME for daily average levels was 46 % during the summer and 64 % during the winter. Using the CTM performance criteria for PM2.5, the model performance was considered good for the summer and average for the winter. Missing winter sources and processes need additional investigation. Given that this is the first effort to predict PM0.1 in Europe with PMCAMx-UF, the model performance was quite encouraging. Potential model improvements include corrections in emissions especially during the winter, use of higher grid resolution for the major urban areas and revisiting of the boundary conditions over the northern Atlantic. Evaluation of its composition predictions is also needed. Future work will focus on more recent periods, providing a more detailed analysis of not only total PM0.1 concentration but also the contribution of individual sources.
The predicted lack of correlation between ultrafine and fine particle mass concentration suggests different sources and processes and that future emission reduction strategies will have different effects on PM0.1 and PM2.5. For example, sources which tend to emit smaller particles will have a larger impact on PM0.1 than PM2.5. Condensation of secondary material will increase PM2.5 but it may decrease PM0.1 by growing particles outside the ultrafine particle range. Coagulation is also expected to be a net sink for PM0.1 as the small particles in this size range collide with larger particles mainly in accumulation mode. Coagulation has a minor effect on PM2.5 because under most conditions it does not transfer mass outside this size range. The analysis of the processes and sources that affect PM0.1 will be examined in detail in future work. The main objective of the present work has been to lay the foundation for such a study by demonstrating that we can simulate PM0.1 with a reasonable level of accuracy and therefore it makes sense to use the corresponding CTM for more detailed process analysis and source attribution.
The model code and data used in this study are available from the authors upon request (spyros@chemeng.upatras.gr).
The supplement related to this article is available online at https://doi.org/10.5194/acp-25-15785-2025-supplement.
KM carried out the simulations, the analysis, ES wrote the final manuscript with support from SNP, KM and DP, SNP supervised and coordinated the work.
The contact author has declared that none of the authors has any competing interests.
Publisher's note: Copernicus Publications remains neutral with regard to jurisdictional claims made in the text, published maps, institutional affiliations, or any other geographical representation in this paper. While Copernicus Publications makes every effort to include appropriate place names, the final responsibility lies with the authors. Views expressed in the text are those of the authors and do not necessarily reflect the views of the publisher.
This research has been supported by the Hellenic Foundation for Research and Innovation project NANOSOMs (grant no. 11504) and the EU H2020 project RIURBANS (grant no. 101036245).
This paper was edited by Stefania Gilardoni and reviewed by three anonymous referees.
Argyropoulou, G., Patoulias, D., and Pandis, S. N.: Exploring the potential for continuous measurement of ultrafine particle mass concentration (PM0.1) based on measurements of particle number concentration above 50 nm (N50), Aerosol Science and Technology, 57, 1117–1127, https://doi.org/10.1080/02786826.2023.2249075, 2023.
Argyropoulou, G. A., Kaltsonoudis, C., Patoulias, D., and Pandis, S. N.: Novel method for the continuous mass concentration measurement of ultrafine particles (PM0.1) with a water-based condensation particle counter (CPC), Aerosol Science and Technology, 1–12, https://doi.org/10.1080/02786826.2024.2368196, 2024.
Baranizadeh, E., Murphy, B. N., Julin, J., Falahat, S., Reddington, C. L., Arola, A., Ahlm, L., Mikkonen, S., Fountoukis, C., Patoulias, D., Minikin, A., Hamburger, T., Laaksonen, A., Pandis, S. N., Vehkamäki, H., Lehtinen, K. E. J., and Riipinen, I.: Implementation of state-of-the-art ternary new-particle formation scheme to the regional chemical transport model PMCAMx-UF in Europe, Geosci. Model Dev., 9, 2741–2754, https://doi.org/10.5194/gmd-9-2741-2016, 2016.
Colella, P. and Woodward, P. R.: The Piecewise Parabolic Method (PPM) for gas-dynamical simulations, J. Comput. Phys., 54, 174–201, https://doi.org/10.1016/0021-9991(84)90143-8, 1984.
del Águila, A., Sorribas, M., Lyamani, H., Titos, G., Olmo, F. J., Arruda-Moreira, G., Yela, M., and Alados-Arboledas, L.: Sources and physicochemical characteristics of submicron aerosols during three intensive campaigns in Granada (Spain), Atmos. Res., 213, 398–410, https://doi.org/10.1016/j.atmosres.2018.06.004, 2018.
Delfino, R. J., Sioutas, C., and Malik, S.: Potential role of ultrafine particles in associations between airborne particle mass and cardiovascular health, Environ. Health Perspect., 113, 934, https://doi.org/10.1289/EHP.7938, 2005.
ENVIRON: Environ: User's guide to the comprehensive air quality model with extensions (CAMx), version 4.02, Novato, CA, https://www.camx.com/download/source/ (last access: 13 November 2025), 2003.
EPA (Environmental Protection Agency, United States): Integrated science assessment (ISA) for particulate matter, Washington, DC: US Environmental Protection Agency, https://www.epa.gov/isa/integrated-science-assessment-isa-particulate-matter (last access: 13 November 2025), 2019.
EPA (Environmental Protection Agency, United States): Particle pollution exposure, US Environmental Protection Agency, https://www.epa.gov/pmcourse/particle-pollution-exposure, last access: 13 November 2025.
Fahey, K. M. and Pandis, S. N.: Optimizing model performance: variable size resolution in cloud chemistry modeling, Atmos. Environ., 35, 4471–4478, https://doi.org/10.1016/S1352-2310(01)00224-2, 2001.
Gaydos, T. M., Pinder, R., Koo, B., Fahey, K. M., Yarwood, G., and Pandis, S. N.: Development and application of a three-dimensional aerosol chemical transport model, PMCAMx, Atmos. Environ., 41, 2594–2611, https://doi.org/10.1016/j.atmosenv.2006.11.034, 2007.
Guenther, A., Karl, T., Harley, P., Wiedinmyer, C., Palmer, P. I., and Geron, C.: Estimates of global terrestrial isoprene emissions using MEGAN (Model of Emissions of Gases and Aerosols from Nature), Atmos. Chem. Phys., 6, 3181–3210, https://doi.org/10.5194/acp-6-3181-2006, 2006.
HEI Report: Review panel on ultrafine particles, Understanding the health effects of ambient ultrafine particles HEI Perspectives 3Health Effects Institute, Boston, MA, 122, https://www.healtheffects.org/system/files/Perspectives3.pdf (last access: 13 November 2025), 2013.
Hu, J., Zhang, H., Chen, S., Ying, Q., Wiedinmyer, C., Vandenberghe, F., and Kleeman, M. J.: Identifying PM2.5 and PM0.1 sources for epidemiological studies in California, Environ. Sci. Technol., 48, 4980–4990, https://doi.org/10.1021/ES404810Z, 2014a.
Hu, J., Zhang, H., Chen, S. H., Wiedinmyer, C., Vandenberghe, F., Ying, Q., and Kleeman, M. J.: Predicting primary PM2.5 and PM0.1 trace composition for epidemiological studies in California, Environ. Sci. Technol., 48, 4971–4979, 2014b.
Hu, J., Jathar, S., Zhang, H., Ying, Q., Chen, S.-H., Cappa, C. D., and Kleeman, M. J.: Long-term particulate matter modeling for health effect studies in California – Part 2: Concentrations and sources of ultrafine organic aerosols, Atmos. Chem. Phys., 17, 5379–5391, https://doi.org/10.5194/acp-17-5379-2017, 2017.
Hughes, L. S., Cass, G. R., Gone, J., Ames, M., and Olmez, I.: Physical and chemical characterization of atmospheric ultrafine particles in the Los Angeles area, Environ. Sci. Technol., 32, 1153–1161, 1998.
Jung, J. G., Fountoukis, C., Adams, P. J., and Pandis, S. N.: Simulation of in situ ultrafine particle formation in the eastern United States using PMCAMx-UF, J. Geophys. Res., 115, https://doi.org/10.1029/2009JD012313, 2010.
Kleeman, M. J., Riddle, S. G., Robert, M. A., Jakober, C. A., Fine, P. M., Hays, M. D., Schauer, J. J., and Hannigan, M. P.: Source apportionment of fine (PM1.8) and ultrafine (PM0.1) airborne particulate matter during a severe winter pollution episode, Environ. Sci. Technol., 43, 272–279, 2009.
Kulmala, M., Asmi, A., Lappalainen, H. K., Baltensperger, U., Brenguier, J.-L., Facchini, M. C., Hansson, H.-C., Hov, Ø., O'Dowd, C. D., Pöschl, U., Wiedensohler, A., Boers, R., Boucher, O., de Leeuw, G., Denier van der Gon, H. A. C., Feichter, J., Krejci, R., Laj, P., Lihavainen, H., Lohmann, U., McFiggans, G., Mentel, T., Pilinis, C., Riipinen, I., Schulz, M., Stohl, A., Swietlicki, E., Vignati, E., Alves, C., Amann, M., Ammann, M., Arabas, S., Artaxo, P., Baars, H., Beddows, D. C. S., Bergström, R., Beukes, J. P., Bilde, M., Burkhart, J. F., Canonaco, F., Clegg, S. L., Coe, H., Crumeyrolle, S., D'Anna, B., Decesari, S., Gilardoni, S., Fischer, M., Fjaeraa, A. M., Fountoukis, C., George, C., Gomes, L., Halloran, P., Hamburger, T., Harrison, R. M., Herrmann, H., Hoffmann, T., Hoose, C., Hu, M., Hyvärinen, A., Hõrrak, U., Iinuma, Y., Iversen, T., Josipovic, M., Kanakidou, M., Kiendler-Scharr, A., Kirkevåg, A., Kiss, G., Klimont, Z., Kolmonen, P., Komppula, M., Kristjánsson, J.-E., Laakso, L., Laaksonen, A., Labonnote, L., Lanz, V. A., Lehtinen, K. E. J., Rizzo, L. V., Makkonen, R., Manninen, H. E., McMeeking, G., Merikanto, J., Minikin, A., Mirme, S., Morgan, W. T., Nemitz, E., O'Donnell, D., Panwar, T. S., Pawlowska, H., Petzold, A., Pienaar, J. J., Pio, C., Plass-Duelmer, C., Prévôt, A. S. H., Pryor, S., Reddington, C. L., Roberts, G., Rosenfeld, D., Schwarz, J., Seland, Ø., Sellegri, K., Shen, X. J., Shiraiwa, M., Siebert, H., Sierau, B., Simpson, D., Sun, J. Y., Topping, D., Tunved, P., Vaattovaara, P., Vakkari, V., Veefkind, J. P., Visschedijk, A., Vuollekoski, H., Vuolo, R., Wehner, B., Wildt, J., Woodward, S., Worsnop, D. R., van Zadelhoff, G.-J., Zardini, A. A., Zhang, K., van Zyl, P. G., Kerminen, V.-M., S Carslaw, K., and Pandis, S. N.: General overview: European Integrated project on Aerosol Cloud Climate and Air Quality interactions (EUCAARI) – integrating aerosol research from nano to global scales, Atmos. Chem. Phys., 11, 13061–13143, https://doi.org/10.5194/acp-11-13061-2011, 2011.
Kuwayama, T., Ruehl, C. R., and Kleeman, M. J.: Daily trends and source apportionment of ultrafine particulate mass (PM0.1) over an annual cycle in a typical California city, Environ. Sci. Technol., 47, 13957–13966, 2013.
Kwon, H. S., Ryu, M. H., and Carlsten, C.: Ultrafine particles: unique physicochemical properties relevant to health and disease, Experimental & Molecular Medicine, 52, 318–328, https://doi.org/10.1038/s12276-020-0405-1, 2020.
Laurent, O., Hu, J., Li, L., Kleeman, M. J., Bartell, S. M., Cockburn, M., Escobedo, L., and Wu, J.: A statewide nested case–Control study of preterm birth and air pollution by source and composition: California, 2001-2008, Environ Health Perspect., 124, 1479–1486, 2016.
Merikanto, J., Spracklen, D. V., Mann, G. W., Pickering, S. J., and Carslaw, K. S.: Impact of nucleation on global CCN, Atmos. Chem. Phys., 9, 8601–8616, https://doi.org/10.5194/acp-9-8601-2009, 2009.
Murphy, B. N., Sonntag, D., Seltzer, K. M., Pye, H. O. T., Allen, C., Murray, E., Toro, C., Gentner, D. R., Huang, C., Jathar, S., Li, L., May, A. A., and Robinson, A. L.: Reactive organic carbon air emissions from mobile sources in the United States, Atmos. Chem. Phys., 23, 13469–13483, https://doi.org/10.5194/acp-23-13469-2023, 2023.
Odman, M. and Ingram, C.: Multiscale Air Quality Simulation Platform (MAQSIP): Source Code Documentation and Validation, Tech. Rep. ENV-96TR002v1, MCNC North Carolina Supercomputing Center, Research Triangle Park, NC, 1996.
O'Dowd, C. D., Langmann, B., Varghese, S., Scannell, C., Ceburnis, D., and Facchini, M. C.: A combined organic-inorganic sea-spray source function, Geophys. Res. Lett., 35, https://doi.org/10.1029/2007GL030331, 2008.
Ohlwein, S., Kappeler, R., Kutlar Joss, M., Künzli, N., and Hoffmann, B.: Health effects of ultrafine particles: a systematic literature review update of epidemiological evidence, Int. J. Public Health, 64, 547–559, https://doi.org/10.1007/S00038-019-01202-7, 2019.
Ostro, B., Hu, J., Goldberg, D., Reynolds, P., Hertz, A., Bernstein, L., and Kleeman, M. J.: Associations of mortality with long-term exposures to fine and ultrafine particles, species and sources: Results from the California teachers study cohort, Environ Health Perspect., 123, 549–556, 2015.
Patoulias, D. and Pandis, S. N.: Simulation of the effects of low-volatility organic compounds on aerosol number concentrations in Europe, Atmos. Chem. Phys., 22, 1689–1706, https://doi.org/10.5194/acp-22-1689-2022, 2022.
Patoulias, D., Fountoukis, C., Riipinen, I., and Pandis, S. N.: The role of organic condensation on ultrafine particle growth during nucleation events, Atmos. Chem. Phys., 15, 6337–6350, https://doi.org/10.5194/acp-15-6337-2015, 2015.
Patoulias, D., Fountoukis, C., Riipinen, I., Asmi, A., Kulmala, M., and Pandis, S. N.: Simulation of the size-composition distribution of atmospheric nanoparticles over Europe, Atmos. Chem. Phys., 18, 13639–13654, https://doi.org/10.5194/acp-18-13639-2018, 2018.
Phairuang, W., Inerb, M., Hata, M., and Furuuchi, M.: Characteristics of trace elements bound to ambient nanoparticles (PM0.1) and a health risk assessment in southern Thailand, J. Hazard. Mater., 425, 127986, https://doi.org/10.1016/j.jhazmat.2021.127986, 2022.
Putaud, J. P., Van Dingenen, R., Alastuey, A., Bauer, H., Birmili, W., Cyrys, J., Flentje, H., Fuzzi, S., Gehrig, R., Hansson, H. C., Harrison, R. M., Herrmann, H., Hitzenberger, R., Hüglin, C., Jones, A. M., Kasper-Giebl, A., Kiss, G., Kousa, A., Kuhlbusch, T. A. J., Löschau, G., Maenhaut, W., Molnar, A., Moreno, T., Pekkanen, J., Perrino, C., Pitz, M., Puxbaum, H., Querol, X., Rodriguez, S., Salma, I., Schwarz, J., Smolik, J., Schneider, J., Spindler, G., ten Brink, H., Tursic, J., Viana, M., Wiedensohler, A., and Raes, F.: A European aerosol phenomenology – 3: Physical and chemical characteristics of particulate matter from 60 rural, urban, and kerbside sites across Europe, Atmos. Environ., 44, 1308–1320, https://doi.org/10.1016/J.ATMOSENV.2009.12.011, 2010.
Schraufnagel, D. E.: The health effects of ultrafine particles, Exp. Mol. Med., 52, 311–317, https://doi.org/10.1038/S12276-020-0403-3, 2020.
Seinfeld, J. H. and Pandis, S. N.: Atmospheric Chemistry and Physics of Air Pollution- From Air Pollution to Climate Change, 2nd Edition, John Wiley & Sons, Hoboken, New Jersey, 2006.
Sioutas, C., Delfino, R. J., and Singh, M.: Exposure assessment for atmospheric ultrafine particles (UFPs) and implications in epidemiologic research, Environ Health Perspect., 113, 947–955, https://doi.org/10.1289/EHP.7939, 2005.
Skamarock, W. C., Klemp, J. B., Dudhi, J., Gill, D. O., Barker, D. M., Duda, M. G., Huang, X.-Y., Wang, W., and Powers, J. G.: A Description of the Advanced Research WRF Version 2, NCAR Technical Note NCAR/TN–468+STR, National Center for Atmospheric Research, Boulder, Colorado, USA, 113, https://doi.org/10.5065/D6DZ069T, 2005.
Skyllakou, K., Murphy, B. N., Megaritis, A. G., Fountoukis, C., and Pandis, S. N.: Contributions of local and regional sources to fine PM in the megacity of Paris, Atmos. Chem. Phys., 14, 2343–2352, https://doi.org/10.5194/acp-14-2343-2014, 2014.
Slinn, S. A. and Slinn, W. G. N.: Predictions for particle deposition on natural waters, Atmos. Environ., 14, 1013–1016, https://doi.org/10.1016/0004-6981(80)90032-3, 1980.
Sofiev, M., Lanne, M., Vankevich, R., Prank, M., Karppinen, A., and Kukkonen, J.: Impact of wild-land fires on European air quality in 2006–2008, WIT Transactions on Ecology and the Environment, 119, 353–361, https://doi.org/10.2495/FIVA080351, 2008a.
Sofiev, M., Vankevich, R., Lanne, M., Koskinen, J., and Kukkonen, J.: On integration of a fire assimilation system and a chemical transport model for near-real time monitoring of the impact of wild-land fires on atmospheric composition and air quality, WIT Transactions on Ecology and the Environment, 119, 343–351, https://doi.org/10.2495/FIVA080341, 2008b.
Venecek, M. A., Yu, X., and Kleeman, M. J.: Predicted ultrafine particulate matter source contribution across the continental United States during summertime air pollution events, Atmos. Chem. Phys., 19, 9399–9412, https://doi.org/10.5194/acp-19-9399-2019, 2019.
Wang, M. and Penner, J. E.: Aerosol indirect forcing in a global model with particle nucleation, Atmos. Chem. Phys., 9, 239–260, https://doi.org/10.5194/acp-9-239-2009, 2009.
Weichenthal, S., Olaniyan, T., Christidis, T., Lavigne, E., Hatzopoulou, M., Van Ryswyk, K., Tjepkema, M., and Burnett, R.: Within-city spatial variations in ambient ultrafine particle concentrations and incident brain tumors in adults, Epidemiology, 31, 177–183, 2020.
Wesely, M. L.: Parameterization of surface resistances to gaseous dry deposition in regional-scale numerical models, Atmos. Environ., 23, 1293–1304, https://doi.org/10.1016/0004-6981(89)90153-4, 1989.
Xue, J., Li, Y., Peppers, J., Wan, C., Kado, N. Y., Green, P. G., Young, T. M., and Kleeman, M. J.: Ultrafine particle emissions from natural gas, biogas, and biomethane combustion, Environ. Sci. Technol., 52, 13619–13628, 2018.
Xue, J., Xue, W., Sowlat, M. H., Sioutas, C., Lolinco, A., Hasson, A., and Kleeman, M. J.: Seasonal and annual source appointment of carbonaceous ultrafine particulate matter (PM0.1) in polluted California cities, Environ. Sci. Technol., 53, 39–49, 2019.
Xue, W. and Kleeman, M. J.: Comparison of size-resolved PM elements measured using aluminum foil and Teflon impaction substrates: Implications for ultrafine particle source apportionment and future sampling networks in California, Sci. Total Environ., 838, 156523, https://doi.org/10.1016/j.scitotenv.2022.156523, 2022.
Xue, W., Xue, J., Shirmohammadi, F., Sioutas, C., Lolinco, A., Hasson, A., and Kleeman, M. J.: Day-of-week patterns for ultrafine particulate matter components at four sites in California, Atmos. Environ., 222, 117088, https://doi.org/10.1016/j.atmosenv.2019.117088, 2020a.
Xue, W., Xue, J., Mousavi, A., Sioutas, C., and Kleeman, M. J.: Positive matrix factorization of ultrafine particle mass (PM0.1) at three sites in California, Sci. Total Environ., 715, 136902, https://doi.org/10.1016/j.scitotenv.2020.136902, 2020b.
Yu, F. and Luo, G.: Simulation of particle size distribution with a global aerosol model: contribution of nucleation to aerosol and CCN number concentrations, Atmos. Chem. Phys., 9, 7691–7710, https://doi.org/10.5194/acp-9-7691-2009, 2009.
Yu, X., Venecek, M., Kumar, A., Hu, J., Tanrikulu, S., Soon, S.-T., Tran, C., Fairley, D., and Kleeman, M. J.: Regional sources of airborne ultrafine particle number and mass concentrations in California, Atmos. Chem. Phys., 19, 14677–14702, https://doi.org/10.5194/acp-19-14677-2019, 2019.
Zhu, Y., Hinds, W. C., Kim, S., and Sioutas, C.: Concentration and size distribution of ultrafine particles near a major highway, J. Air. Waste. Manage. Assoc., 52, 1032–1042, https://doi.org/10.1080/10473289.2002.10470842, 2002.