the Creative Commons Attribution 4.0 License.
the Creative Commons Attribution 4.0 License.
 | 06 Nov 2025
Enhancement of O3–CO ratios at tropospheric subtropical latitudes: Photochemistry and stratospheric influence
Andrea Pozzer
Peter Hoor
Florian Obersteiner
Andreas Zahn
Thomas B. Ryerson
Chelsea R. Thompson
Jeff Peischl
Róisín Commane
Bruce Daube
Ilann Bourgeois
Jos Lelieveld
Horst Fischer
The subtropics are influenced by stratosphere-troposphere exchange processes through the subtropical jet streams and tropopause folding events, which are commonly identified by the opposing gradients of ozone (O3) and carbon monoxide (CO) and thus their ratio. Here, we used airborne observations of CO and O3, as well as the global three-dimensional ECHAM5/MESSy Atmospheric Chemistry (EMAC) model, to investigate whether there is another important mechanism that conditions the subtropics. We show that high O3–CO ratios extend deeply into the troposphere in the subtropics, which is evident in both in situ observations and model results. Tropospheric photochemistry leads to similar O3–CO ratios as those for stratospheric air diluted into the troposphere. In the upper tropical troposphere, frequent deep convective events produce lightning that leads to high concentrations of nitrogen oxides (), which drive O3 production and which further catalyze the recycling of hydroxyl (OH) radicals, which reduces CO. These lightning-affected air masses can be transported from the tropics into the subtropics via the Hadley circulation. We have excluded NO production through lightning in a sensitivity run of the EMAC model and see an annual relative reduction of the O3–CO ratio of up to almost 50 % in the tropics and up to 40 % in the northern subtropics, with even larger seasonal variability and major effects on the vertical profiles of O3 and CO. We therefore show that photochemistry is an additional key factor alongside stratosphere-troposphere mixing in determining O3-rich and CO-poor air masses in the troposphere.
- Article
(7413 KB) - Full-text XML
-
Supplement
(23273 KB) - BibTeX
- EndNote


Transport processes in the subtropical troposphere are dominated by the Hadley circulation and stratosphere–troposphere exchange processes (STE). These processes shape the chemistry of the subtropics. Moist tropical air masses are lifted through deep convection within the intertropical convergence zone (ITCZ), distributed polewards in the upper troposphere. During the poleward transport the air cools and sinks at approximately 30° N and S, in the subtropical high-pressure belts. This thermally driven circulation which connects the tropics and the subtropics is known as the Hadley circulation (Seinfeld and Pandis, 2016).
Rapid chemical mixing in the upper troposphere and lower stratosphere (UTLS) occurs mainly through tropopause folding (Danielsen, 1968; Holton et al., 1995; Hoor et al., 2002), adiabatic mixing along isentropes, and up- and downdrafts of convective overshoots (Frey et al., 2015). Tropopause faults mostly occur in association with Rossby wave breaking or by the zonal shift of the subtropical jet streams at 30° N and S, resulting in bending of the tropopause (Postel and Hitchman, 2001). The transport of tropical air masses into the subtropics along the Hadley circulations is thought to take around 10 to 50 d (Seinfeld and Pandis, 2016), while mixing within the tropospheric hemispheres takes 1–2 months (Singh, 1995), and between the troposphere and stratosphere up to 0.8–2 years. Overall, the subtropical troposphere plays a critical role in the Earth's climate and atmospheric chemistry due to its unique position as a transition zone between the tropics and mid-latitudes as well as between the stratosphere and troposphere.
Ozone (O3) and carbon monoxide (CO) are key trace gases in the troposphere and lower stratosphere. Ozone influences air quality, climate, and UV protection, while CO is an important combustion pollutant and regulates the atmosphere's oxidative capacity. The interactions and distributions of these two trace gases are critical for understanding air quality, atmospheric chemistry, and climate dynamics. Tropospheric O3 originates naturally from the stratosphere (Danielsen, 1968) or through photodissociation of nitrogen oxides NOx () in the presence of UV and visible light:
where M indicates a third molecule which stabilizes the O3 formed as it absorbs the excess vibrational energy from the reaction (Seinfeld and Pandis, 2016). NOx is produced by anthropogenic burning processes such as pollution emissions through aircraft, and industry, but also from natural sources, like biomass burning, soil emissions, and through lightning. Lightning NOx (LNOx) has been found to dominate O3 chemistry in the upper troposphere (Nussbaumer et al., 2023a), particularly in the tropics, where 77 % of the world's lightning occurs. LNOx in the upper troposphere has an approximated lifetime of 4–7 d (Schumann and Huntrieser, 2007).
In the presence of H2O, and therefore mostly in the lower troposphere, ozone can be destroyed by photodissociation to form O(1D) and reaction with H2O to form hydroxyl (OH) radicals through Reactions (R3) and (R4):
These reactions are the primary source of highly reactive OH radicals, which play a crucial role in removing most natural and anthropogenic gases from the atmosphere (Lelieveld et al., 2016). They can react within 1–2 s with CH4, non-methane volatile organic compounds (VOCs), and CO to form peroxy radicals (HO2 + RO2). In the free troposphere, the most important sink of OH radicals is through the reaction with CO (Lelieveld et al., 2016; Seinfeld and Pandis, 2016):
HO2 radicals can further combine to form peroxides. Further propagation of the formed peroxides leads to higher-generation products, and reaction with NO for OH recycling, a secondary source of OH radicals. Different OH recycling mechanisms exist (e.g., Ox recycling, OVOC recycling, NOx recycling), with NOx recycling (Reaction R6) being the most prominent in highly NOx-polluted regions and in the upper troposphere (Lelieveld et al., 2018):
In the tropics, CO emissions are mostly derived from biomass burning and anthropogenic emissions (Crutzen and Andreae, 1990). In the free and upper troposphere, CO can further be produced through oxidation of CH4 or other hydrocarbons (Strode et al., 2018). At the same time, high concentrations of OH through primary production on the surface, and secondary production in the upper troposphere, provide a strong sink for CO in the tropics. Overall, this shortens the lifetime of CO in the tropics to about one month, while its global lifetime is approximately three months in the troposphere (Lelieveld et al., 2016).
The subtropical troposphere is known to be mainly influenced by STE. The purpose of this study is to investigate the effect of transport and distribution of photochemistry via the Hadley circulation in the upper troposphere of the tropics into the subtropics. To study the relevance of that mechanism, we first present the zonal distribution of CO, O3, and the O3–CO ratio derived from airborne observations and further simulated by the dynamic EMAC chemistry model. Furthermore, we show with a sensitivity study of the model that internal tropospheric mixing processes along with chemical reactions make a higher-than-expected contribution to the tropospheric subtropical air masses.
This study uses airborne in situ measurements of CO and O3 from 12 different aircraft research campaigns as well as numerical results of the ECHAM5/MESSy EMAC model.
2.1 Airborne observations
The observations used in this work are from a combined data set of 12 different aircraft research missions, carried out from 2012 to 2024, covering all seasons (Table 1). Each campaign focused on investigations of dynamic and/or chemical processes of the troposphere and lower stratosphere based each in a different location around the world. The flight tracks of each campaign are shown in Fig. 1 and provide zonal and meridional coverage of the Earth, except for large parts of Asia. However, due to the long lifetimes of CO and O3 in the troposphere, the Asian emissions are covered by long-distance transport processes, which also have been among the research goals of some of the campaigns (e.g., the Asian Summer Monsoon by OMO, WISE, PHILEAS). Specific research goals, and accordingly the flight planning, have been selected with consideration of specific weather or extreme events (e.g., deep convection, biomass burning events) and therefore can be biased to some extent. To minimize these biases, the medians of the averaged distributions are used in this study. Furthermore, the statistical representativeness of the selected observations has been tested with a model comparison of a full climatology and data just along the flight tracks. This comparison can be found in the Supplement. In particular, the modeled O3–CO ratios along the flight tracks in the northern hemisphere and tropics have been found to agree well with the model climatology.
Table 1Overview of aircraft campaigns used for this study. Most of the campaigns have been carried out with the HALO aircraft of the DLR (German Aerospace Center, Oberpfaffenhofen, Germany). The ATom campaigns have been carried out with the NASA DC-8 aircraft (Wofsy et al., 2018).
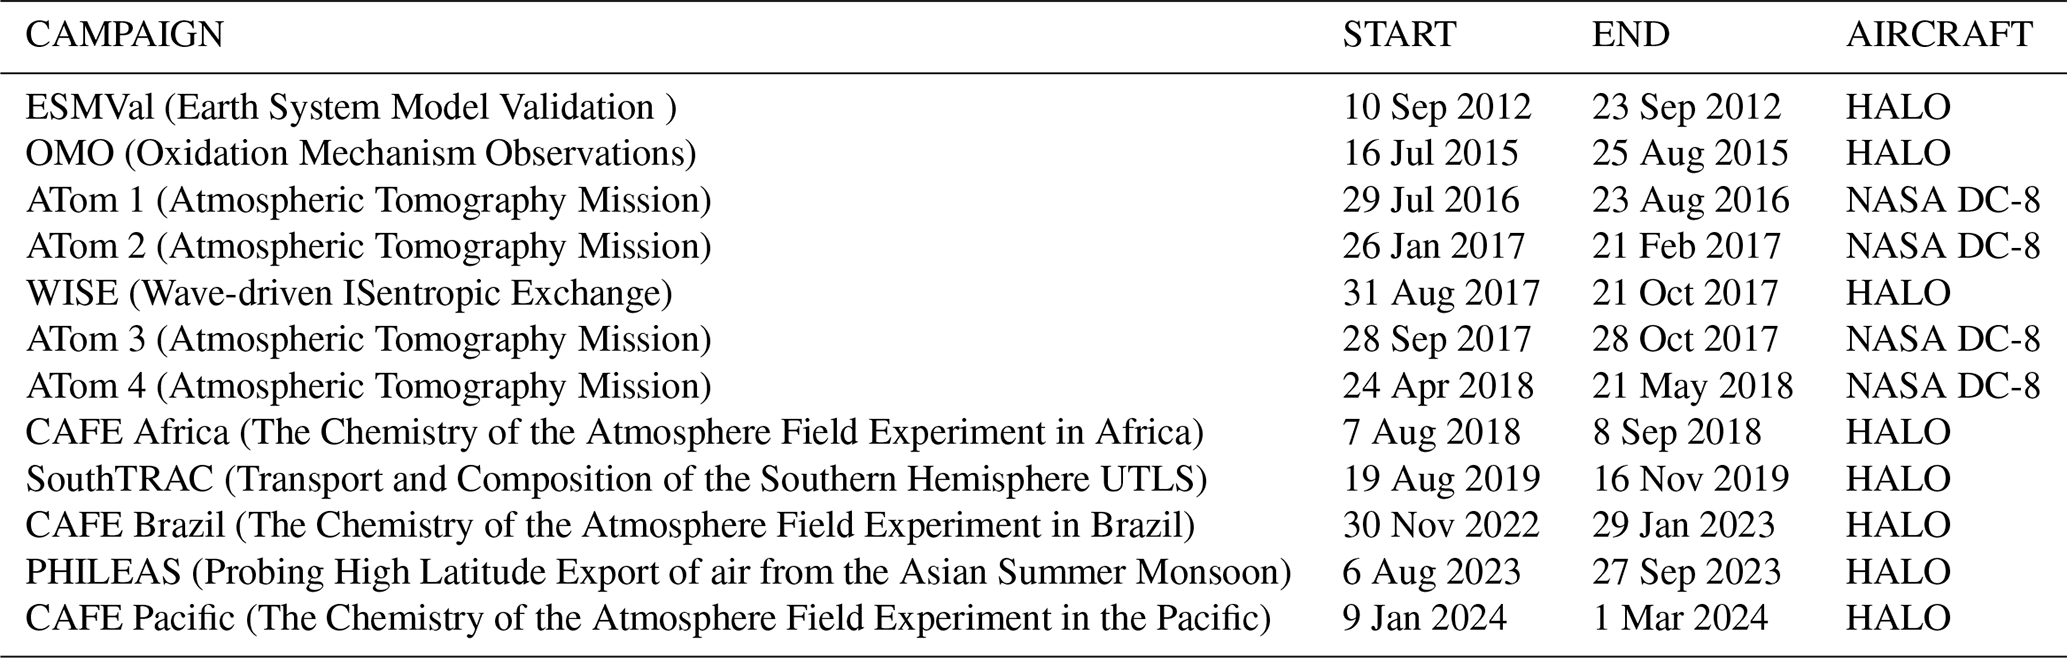
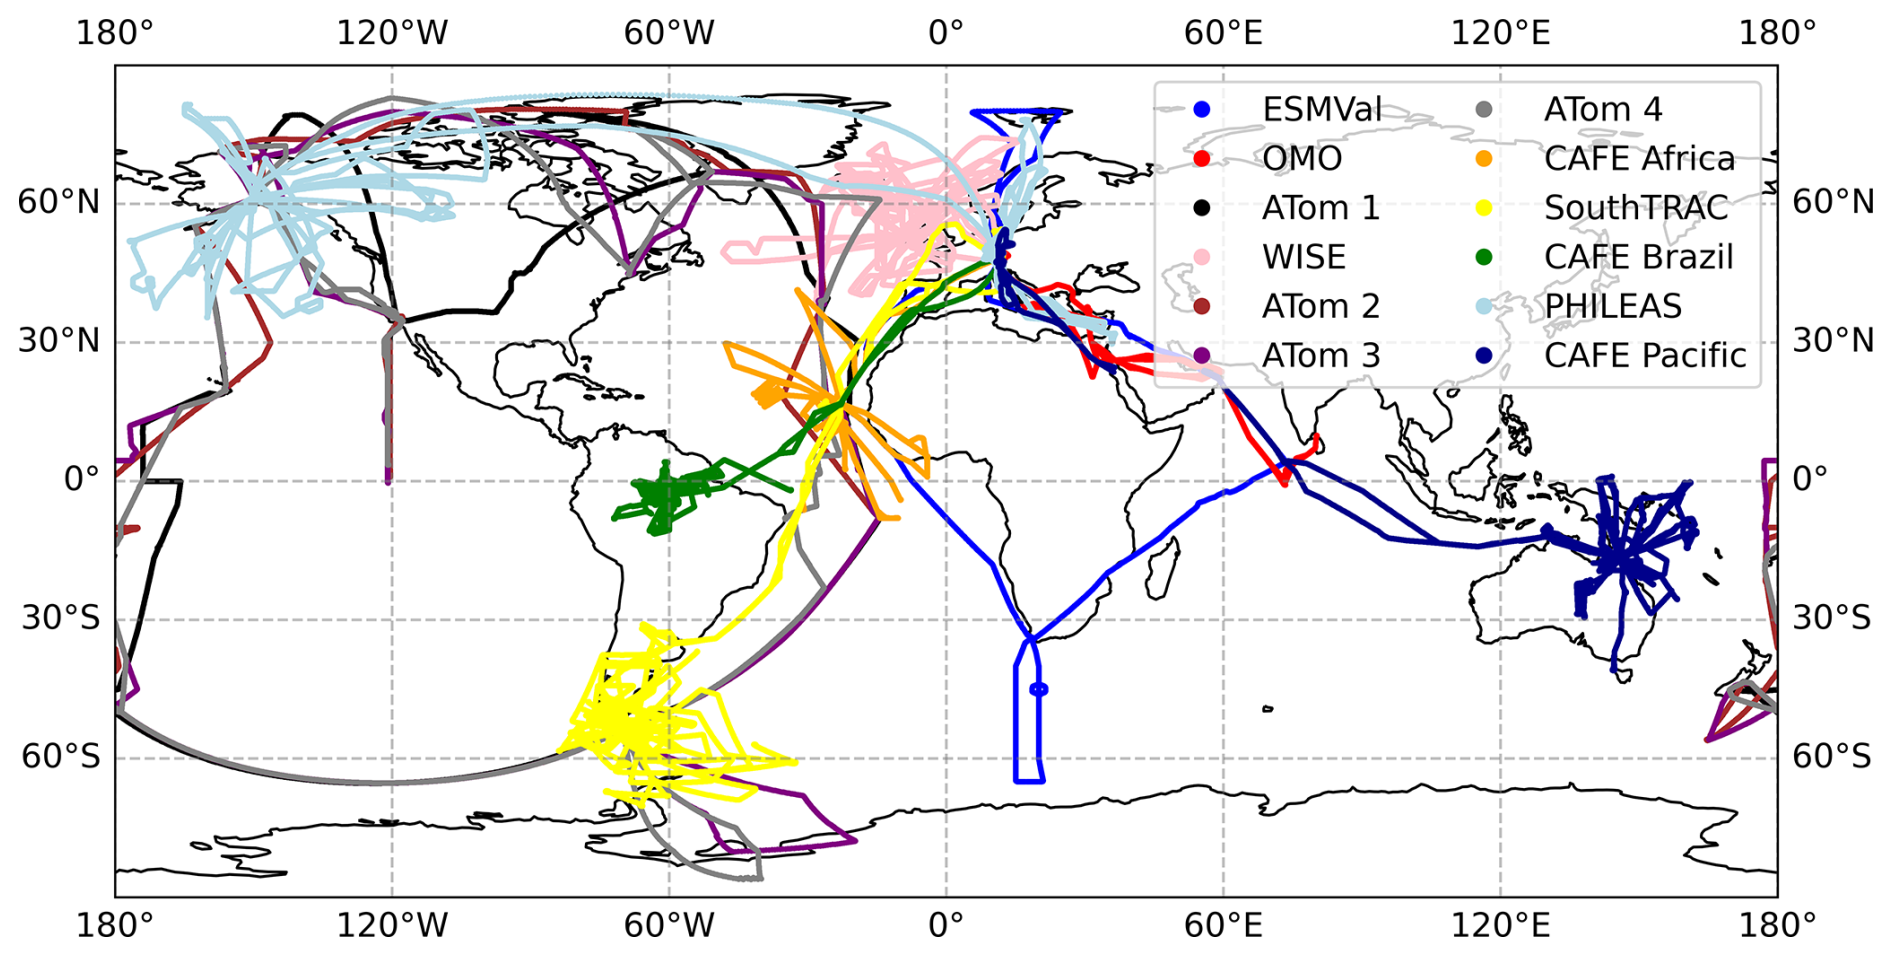
Figure 1Overview of the flight tracks of the aircraft campaigns used in this study.
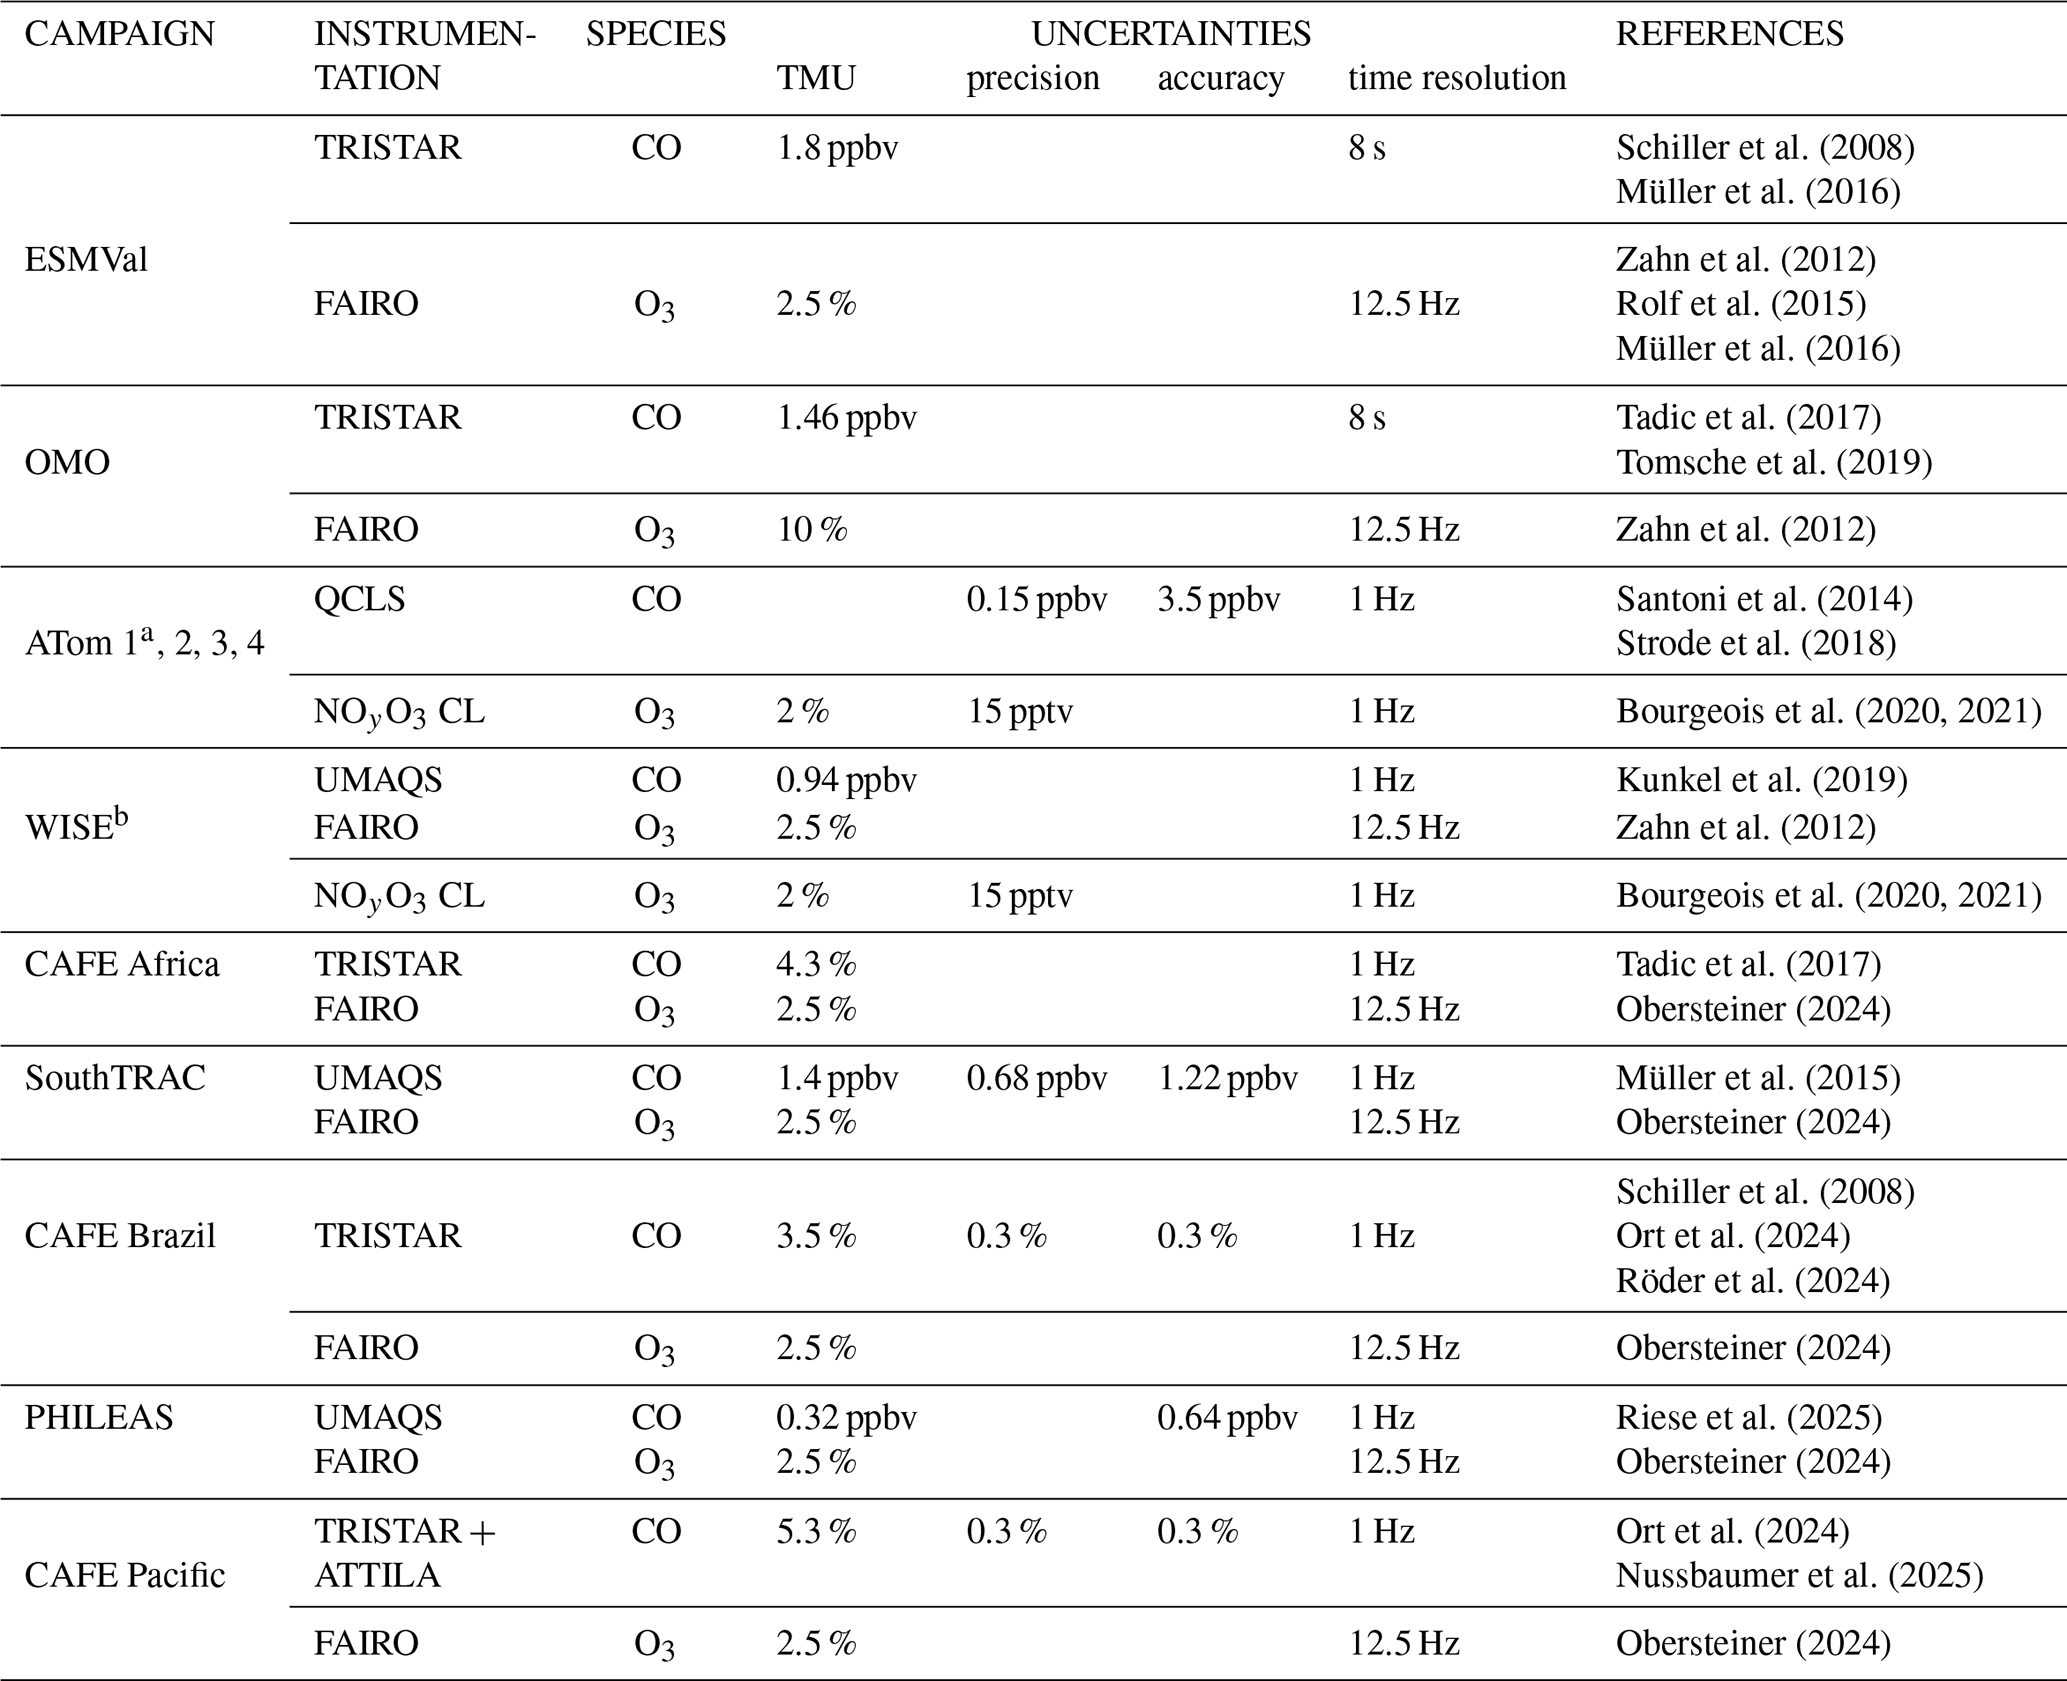
Two aircrafts were used throughout these campaigns: the High Altitude LOng-range (HALO) Gulfstream G550 research aircraft, run by the German Aerospace Center (DLR) and the NASA DC-8 aircraft, owned by the NASA Armstrong (Dryden) Flight Research Center. For CO measurements, four different instruments (UMAQS, QCLS, TRISTAR, ATTILA) and for O3, two different instruments (FAIRO (Obersteiner, 2024), NOyO3) collected the data sets used in the scope of this work. The total measurement uncertainties for CO vary in a range of 0.94–1.8 ppbv and for O3 from 2 % to 2.5 %. More detailed information on the uncertainties and equipment used during the campaigns can be found in Table 2 and in the Supplement. The measurement techniques for each tracer were similar. CO was measured by infrared absorption spectroscopy (Fried and Richter, 2006) with quantum cascade lasers (QCLS) (Faist et al., 1994; Pal and Pradhan, 2021) and multipass circulations of the types of White and Herriott (White, 1957; Herriott and Schulte, 1965; McManus et al., 1995; Wienhold et al., 1998) throughout all campaigns. The O3 measurements were taken using UV absorption and chemiluminescence (CL) techniques (e.g., Toby, 1984; Ridley et al., 1992; Zahn et al., 2012). Frequent calibrations against primary and secondary standards during the research flights ensured comparability of the CO observations. For O3, simultaneous UV absorption measurements alongside CL detection provide high accuracy and continuous in-flight calibrations.
Schiller et al. (2008)Müller et al. (2016)Zahn et al. (2012)Rolf et al. (2015)Müller et al. (2016)Tadic et al. (2017)Tomsche et al. (2019)Zahn et al. (2012)Santoni et al. (2014)Strode et al. (2018)Bourgeois et al. (2020, 2021)Kunkel et al. (2019)Zahn et al. (2012)Bourgeois et al. (2020, 2021)Tadic et al. (2017)Obersteiner (2024)Müller et al. (2015)Obersteiner (2024)Schiller et al. (2008)Ort et al. (2024)Röder et al. (2024)Obersteiner (2024)Riese et al. (2025)Obersteiner (2024)Ort et al. (2024)Nussbaumer et al. (2025)Obersteiner (2024)Table 2Information on the instrumentation, total measurement uncertainties (TMU), precision, data accuracy, time resolutions, and references for each campaign used in the scope of this work.
a Thompson et al. (2022), b Riese and Hoor (2017).
From 2012 to 2024 there was no significant trend in the global average atmospheric mixing ratios of CO and O3 in remote regions according to the measurements from the Carbon Cycle Cooperative Air Sampling Network (Laboratories, 1988) and the TOAR network data sets (Tarasick et al., 2019). Nevertheless, studies have shown annual variations, especially in more polluted and more densely populated regions. Field et al. (2016) has shown that in 2015 strong open biomass burning events caused by the global climate phenomenon El Niño resulted in the peaking of CO emissions in Indonesia which then spread into the upper troposphere over East Africa to the western Pacific Ocean. Furthermore, continuous control measures targeting industrial and transportation emissions in developed countries are leading to a moderate reduction of pollutants. For example, in China, from 2010 to 2017, a 16 % decrease in CO emissions could be achieved by replacing pollutant fuels (e.g., biofuel, coal) with cleaner fuels (e.g., natural gas, electricity) (Li et al., 2024).
Besides annual trends, there are seasonal and local variations in source regions (Hoor et al., 2002; Li et al., 2024). Emission rates in general depend on the amount of biomass burning and anthropocentric activity (e.g., heating, combustion), which are strongly season-dependent. In the tropics, the strongest seasonal differences are due to shifts of the zonal positioning of the ITCZ (Waliser and Somerville, 1994), in particular above land surface. The CAFE Brazil and CAFE Pacific campaigns collected a larger data set for continental areas in the tropics; these were run from December 2022 to January 2023 above the Amazon rainforest, and January to February 2024 above Australia, respectively. During CAFE Brazil, the seasonal shift of the ITCZ influences the contribution of air masses from the southern or northern hemispheres, affecting the Amazon basin. In January, the ITCZ is slightly south of the Amazon region, which leads to a stronger influence of air masses originating from the northern hemisphere in this region. The seasonal variation slightly shifts the deep convection activity zonally, and hence results in a broadening strong uptake of surface emissions in the vertical profile of the tropics. Note that meridional variations will also be averaged for this study.
However, zonal and annual averages, and the long lifetimes of O3 and CO which ensure globally well transported and mixed distributions, tend to weaken the effects of those local and temporal emission variations. Nevertheless, these will be taken into account and further discussed in Sect. 3.
Overall, the twelve campaigns listed in Table 2 provide a good global coverage of in situ measurements from the boundary layer up to the lower stratosphere. In particular, good coverage can be found in the northern hemisphere, especially in the northern subtropical region. As the data sets have been measured using various time resolutions, all sets were averaged to 60 s before they were combined. Furthermore, the measurements were transferred into the same grid resolution as the modeled data. More statistical information can be found in the Supplement.
2.2 EMAC model
The numerical results used for this study were simulated with the ECHAM5/MESSy Atmospheric Chemistry (EMAC) model (Jöckel et al., 2006, 2016 and publications therein). EMAC is a three-dimensional numerical chemistry and climate model which includes several sub-models describing lower and middle atmospheric processes and their interactions with the ocean, land, biosphere, human factors, and many other parameters. The simulation of atmospheric dynamics and transport processes is based on the fifth-generation of the European Centre Hamburg general circulation model (version 2.54.0; ECHAM5; Roeckner et al., 2006). Fully coupled chemistry and miscellaneous processes are provided by a set of submodels controlled by the second-generation Modular Earth Submodel System (version 2.54.0; MESSy; Jöckel et al., 2005, 2010).
Numerous experimental evaluations of the EMAC model have revealed it to be reliable (e.g., Jöckel et al., 2016; Tomsche et al., 2019; Lelieveld et al., 2018; Tadic et al., 2021; Nussbaumer et al., 2023b, 2024). In Lelieveld et al. (2018) a variety of atmospheric gases measured during the OMO aircraft campaign have been compared to the EMAC model, revealing a slight overestimation of tropospheric column O3, and CO. O3 overestimation by the model is attributed to an overestimation of transport from the stratosphere, related to the limited horizontal grid resolution of the model (1.875° × 1.875°) (Lelieveld et al., 2018). However, by reducing LNOx emissions associated with deep convection, photochemical O3 production declines in the upper troposphere. Difficulties in representing the intermittent nature of convection and lightning has been shown in the study of Lelieveld et al. (2018) and are generally known to be a challenge for climate models. Comparisons of the CAFE Africa campaign measurements with the EMAC model show a weak correlation between measured and modeled NO in the upper troposphere (Nussbaumer et al., 2024). Nevertheless, this seems to be a regional issue, as, in general, measured NOx, O3, and HO2 values are found to correlate well with the EMAC model (correlation coefficients of 0.5 and larger) in the OMO, CAFE Africa, CAFE Brazil, and ATom campaigns (Nussbaumer et al., 2024). More details on the EMAC model and its evaluation with measurements can be found in Righi et al. (2015) and Jöckel et al. (2016) and citations within.
The model resolution is T63L47MA, i.e., with a quadratic Gaussian grid resolution of 1.875° × 1.875° and a vertical resolution up to 0.1 Pa, so as to include the stratosphere. The model has been weakly nudged by Jeuken et al. (1996) towards the European Center for Medium-Range Weather Forecasts (ECMWF) ERA5-interim data (Hersbach et al., 2020). The simulations cover a period of 20 years (i.e., 2000–2019). In this work, the hybrid pressure coordinates of the numerical simulations have been interpolated to an altitude of 1 km vertically; additionally, only monthly climatology of the data set has been used. In addition to the reference numerical simulation, a sensitivity numerical integration has been performed, binary identical to the reference simulation but with the lightning emissions of NOx deactivated. In the following, we will refer to those two simulations as “REF” to the standard simulation and “without LNOx” to the sensitivity run excluding LNOx emissions globally. Other sources of NOx in the troposphere, such as surface and aviation emissions and mixing from the stratosphere, are included in both simulations. These simulations have been used before in Nussbaumer et al. (2023a) to investigate O3 production from LNOx in the upper tropical troposphere. In that study, the authors concluded that the only source of NOx in the upper tropical troposphere is lightning, which is hence crucial for ozone production in that region.
A comparison along the flight tracks with the observations has shown good agreement of the climatology with the single point data (Supplement). Therefore, the full model is used for the investigation of the importance of LNOx for the northern subtropics.
3.1 Trace gas distributions based on observations
Figure 2a and b show the annual median zonal distributions of CO and O3 mixing ratios, respectively, derived from all airborne in situ observations listed in Table 1. The data points are averaged over 1 km of altitude, 1.875° of latitude and over all longitudes. Their scales have been adjusted to emphasize tropospheric values. The black lines represent the lines of constant potential temperatures (Θ), which are calculated via Eq. (1), including the measured air temperature T and static pressure p, the surface pressure p0 = 1000 hPa, and κ = 0.286.
The grid cell has been hatched with white “xxx” if two conditions are met: (1) at least ten counts per grid cell (counts ≥ 10) and (2) good to moderate precision of the mean (standard error of the mean relative to the mean in percent: RSEM ≤ 15 %). Note that each point is already an average to 60 s depending on each time resolution of the individual measurements, and that the precision includes seasonal and atmospheric variability. More details and the zonal distributions of the grid cell counts and the RSEM for each tracer individually can be found in the Supplement.
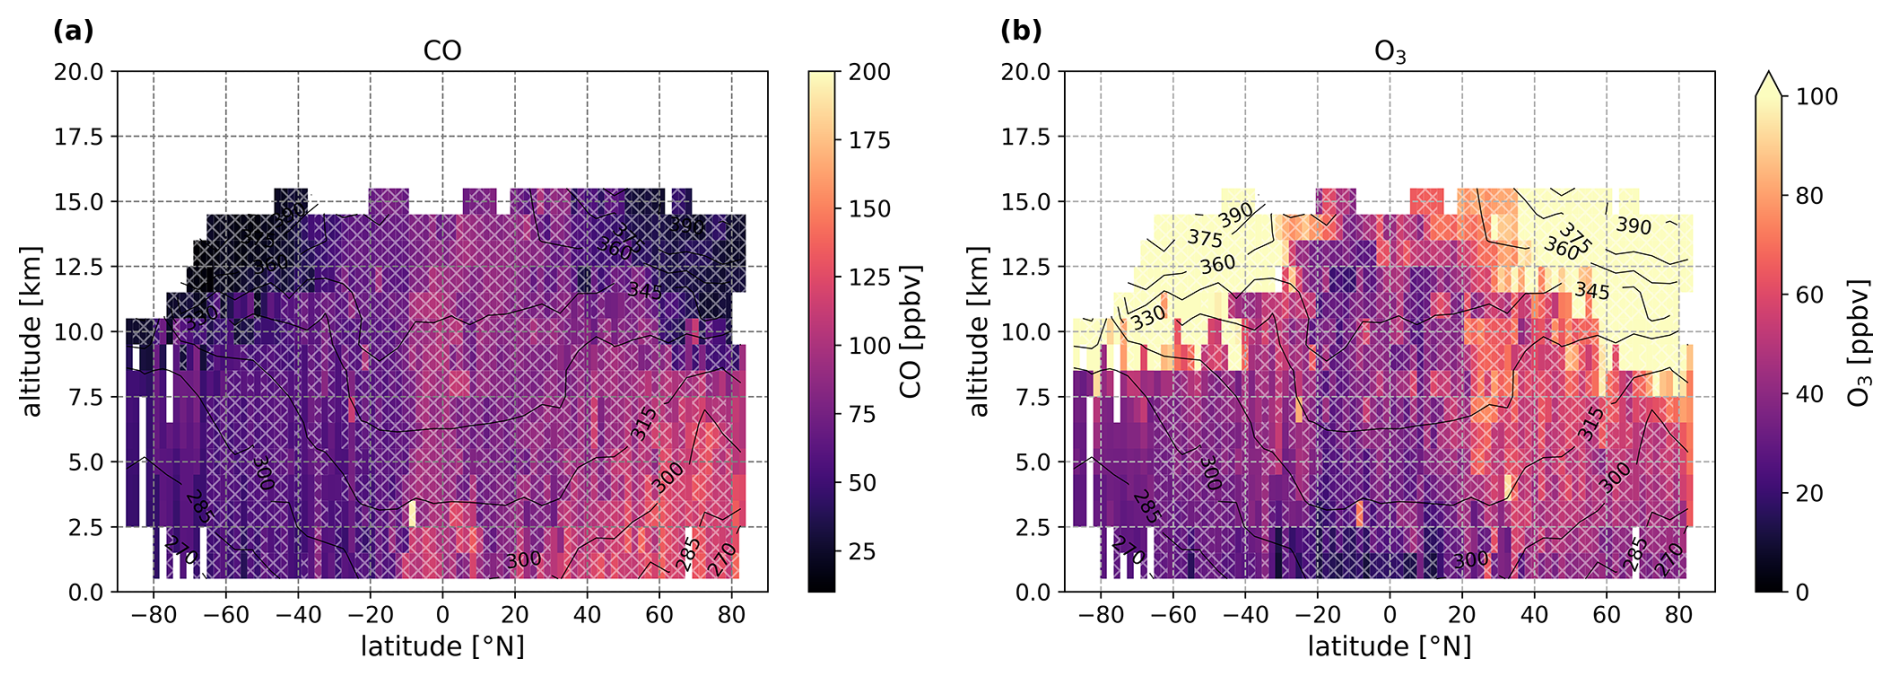
Figure 2Zonal median distribution of CO (a) and O3 (b) from the campaigns listed in Table 1. All airborne measurements have been averaged over 1 km of altitude, and 1.875° of latitude. The scale has been adjusted for O3 to focus on tropospheric values. Black lines indicate layers of constant potential temperature, calculated using Eq. (1), and averaged over 5° and 1 km. Grid boxes, which represent averages with good to moderate standard error relative to the mean (≤15 %), and at least ten points per grid cell, are hatched with white “xxx”. Note that each count represents an average of 60 s, depending on the time resolution of the measurements.
Both zonal distributions show a good coverage of the troposphere, despite some data gaps in the polar high latitudes, especially in the southern hemisphere. The observations made in the northern hemisphere are, with a few exceptions, contained within the confidence intervals previously defined (i.e., counts ≥ 10; RSEM ≤ 15 %). Conversely, the southern hemisphere exhibits lower coverage within these conditions, particularly in the subtropics and polar latitudes.
The observations show the highest CO mixing ratios near the surface in the tropics and northern mid- to high latitudes, peaking with median mixing ratios of 120–140 ppbv, due to the close proximity to combustion sources (anthropogenic or natural). In the tropics, large amounts of CO can be released from biomass burning events mainly during the dry seasons (Galanter et al., 2000), and in the northern mid- to high latitudes, industrial combustion and other anthropogenic emissions are the main sources of CO (Tomsche et al., 2019). Highest CO is found at approx. 7.5° S and 2.5 km, a biomass burning plume originating from Africa captured along a single latitude transect during the CAFE Africa campaign (Crowley et al., 2025). The tropospheric background value of CO is approximately 60 ppbv in the southern hemisphere and 70–100 ppbv in the northern hemisphere, generally decreasing with increasing altitude. In the vicinity of deep convection or warm conveyor belts, close to a source region, CO shows instead a C-shaped vertical profile, which can be observed especially in the tropics in the ITCZ and the northern extra tropics. In the ITCZ, the level of main convective outflow is 10–12 km (potential temperature of 350–360 K), where the CO mixing ratio nearly achieves boundary layer mixing ratios. In the northern hemisphere, a local minimum of tropospheric CO mixing ratios can be identified in the subtropics. This minimum has been already observed during previous aircraft measurements, e.g., in 1997 and 1998, where surface CO mixing ratios in the northern subtropics varied from 60 to 140 ppbv and from 80 to 200 ppbv in the northern extra tropics (Hoor et al., 2002). With the increasing distance from the source regions towards higher altitudes, CO decreases to values below 40 ppbv. In the polar UTLS region, we record CO values of below 20 ppbv, which is due to the downward transport of stratospheric low-CO air. Close to the isentropic surfaces of 360 K, the tropopause can be expected in the tropics (Holton et al., 1995), while towards higher latitudes cross-tropopause exchange can happen at lower isentropic lines of 300–330 K (Sprenger and Wernli, 2003).
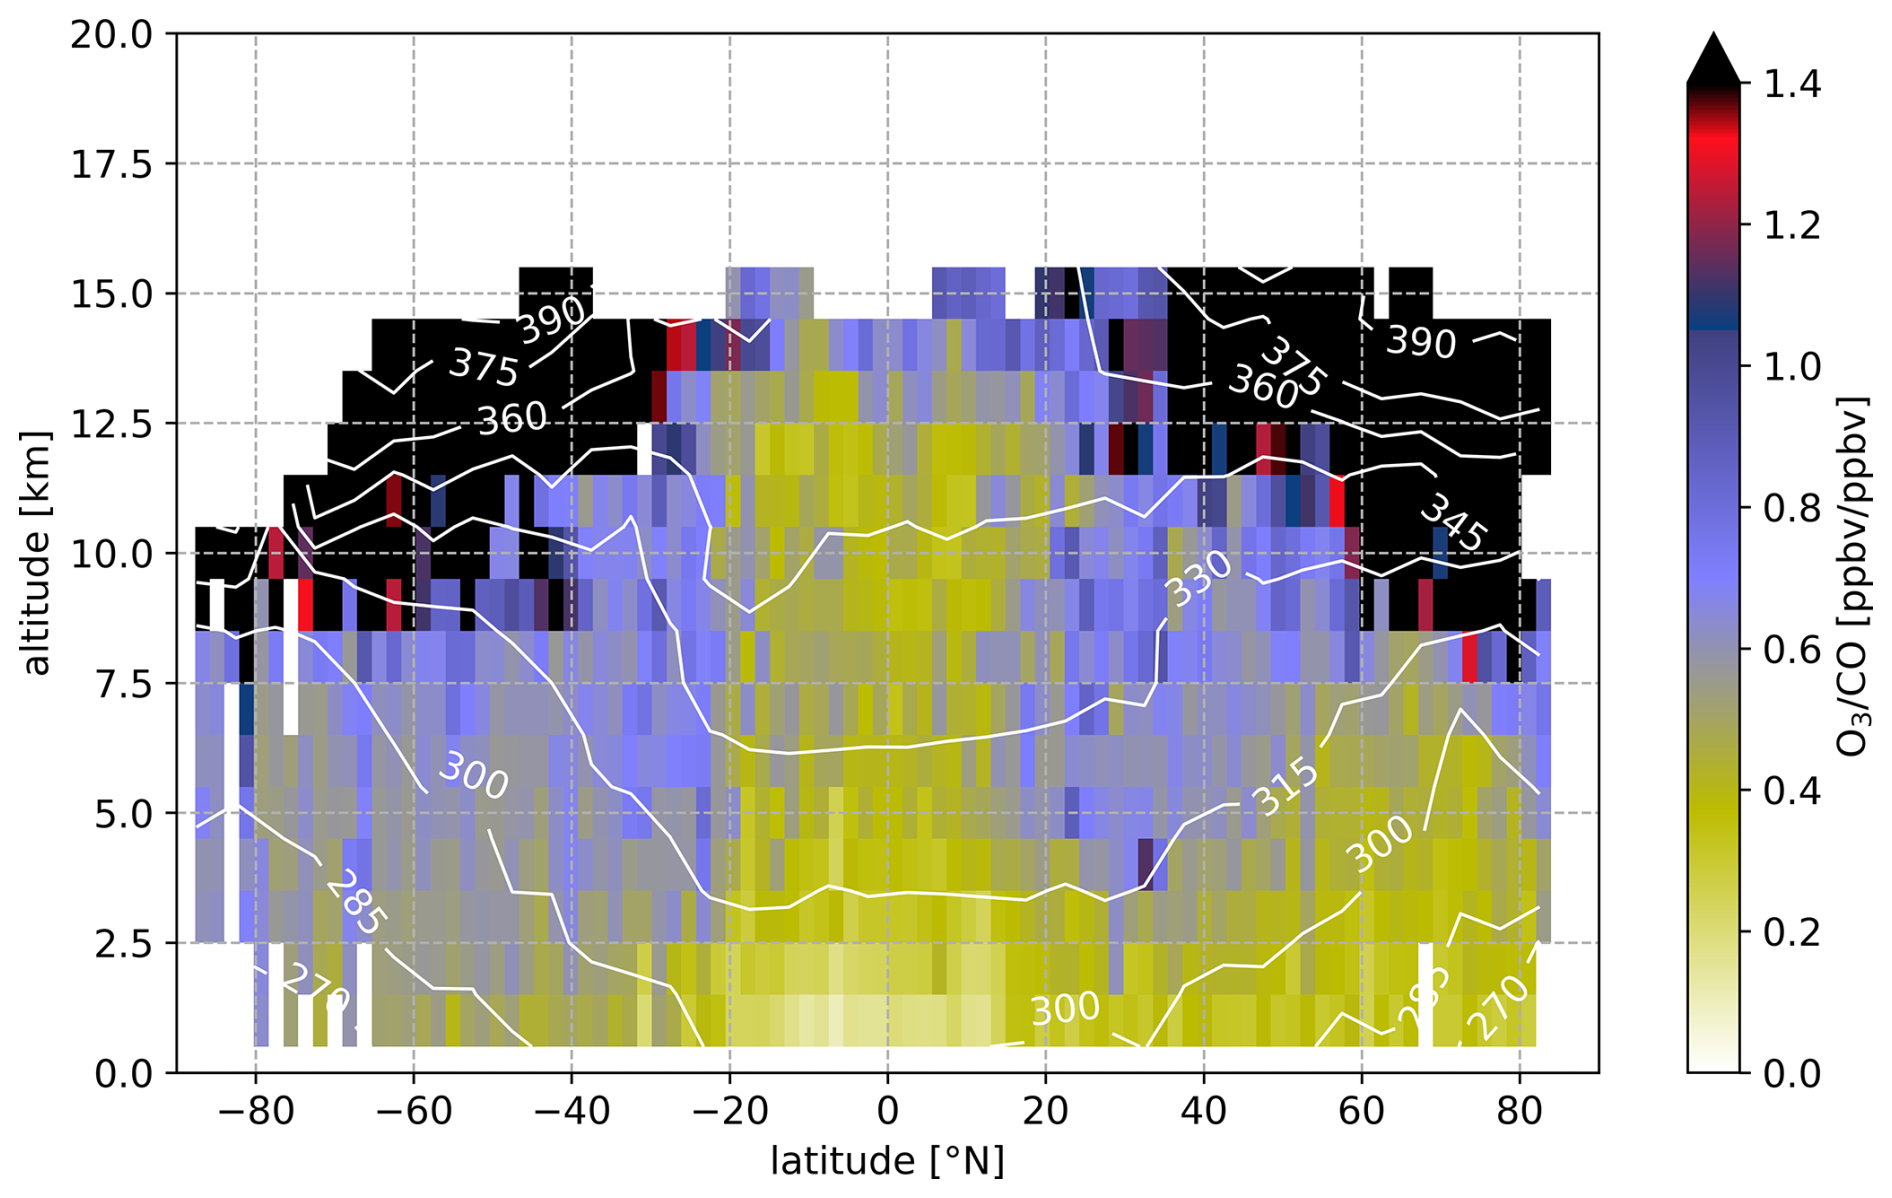
Figure 3Same as Fig. 2, for the O3–CO ratio, but without hatching and Θ shown as white lines.
The O3 zonal distribution in Fig. 2b, shows similar but inverted behavior compared to the CO zonal distribution. Low O3 mixing ratios in the boundary layer are linked to dry deposition (Wesely and Hicks, 2000; Sumner et al., 2001), photodissociation (Reactions R3 and R4), and NO titration. These losses outweigh O3 production through NO2 photolysis (Reactions R1 and R2) especially in areas of low combustion NOx emissions, e.g., remote places, forests, oceans. In the vicinity of strong NOx combustion sources (biomass burning or industrial emissions), O3 can be produced also at the surface. Nevertheless, low ozone values are prominent close to the surface, with minimum values in the tropics, where the median surface mixing ratios are lower than 20 ppbv. In the free troposphere, O3 gradually increases with slightly higher values in the northern compared to southern hemisphere up to the O3-rich stratosphere. In the ITCZ, through deep convection, low surface O3 can be vertically mixed towards higher altitudes. Together with strong uptake, convective activity is a source of lightning, which produces O3 via LNOx, particularly in the convective outflow region in the ITCZ (Nussbaumer et al., 2023a). In contrast to the O3 values in the tropics, a slight increase in O3 mixing ratios can be noted in the vertical column of the northern subtropics around 30° N. While O3 mixing ratios range from a few ppbv up to ∼100 ppbv (Prather et al., 2011) in the troposphere, in the stratosphere, O3 increases dramatically up to several thousands of ppmv due to photochemical production through higher energetic UV radiation and oxygen photolysis with a typical residence time of 1–2 years. In the stratospheric mid-latitudes and polar regions, the downward motion of the Brewer–Dobson circulation (Brewer, 1949; Dobson, 1956) transports stratospheric O3-rich air closer to the tropopause. Here, ppbv values in the low hundreds have already been observed.
The ratio of O3 to CO is shown in Fig. 3. In the absence of strong vertical transport, O3 shows an increasing gradient towards higher altitudes, while CO decreases with altitude. This would result in low O3–CO ratios near the surface and increasing ratios with altitude. This behavior is particularly observed in the southern extra tropics. Low O3–CO ratios (< 0.6 ppbv ppbv−1) up to 12.5 km in the ITCZ and up to 7.5 km in the northern mid-latitudes indicate transport of surface air masses with high CO and low O3 mixing ratios. Higher O3–CO ratios (> 0.6 ppbv ppbv−1) represent air masses with lower CO and higher O3, which can be observed closer to the stratosphere but also in the subtropics, which we will further define from 23.3–40°. This O3–CO ratio enhancement is more pronounced in the northern compared to southern hemispheric subtropics in the observations. Although values are similar in the southern subtropics, the zonal gradient to higher latitudes is less pronounced than in the northern hemisphere, probably due to less data coverage, flight tracks that mostly traverse the ocean, and in general a lower CO background (no significant CO source in the southern high latitudes). In the following, we will focus on the northern subtropical region.
3.1.1 Observed northern hemispheric gradient
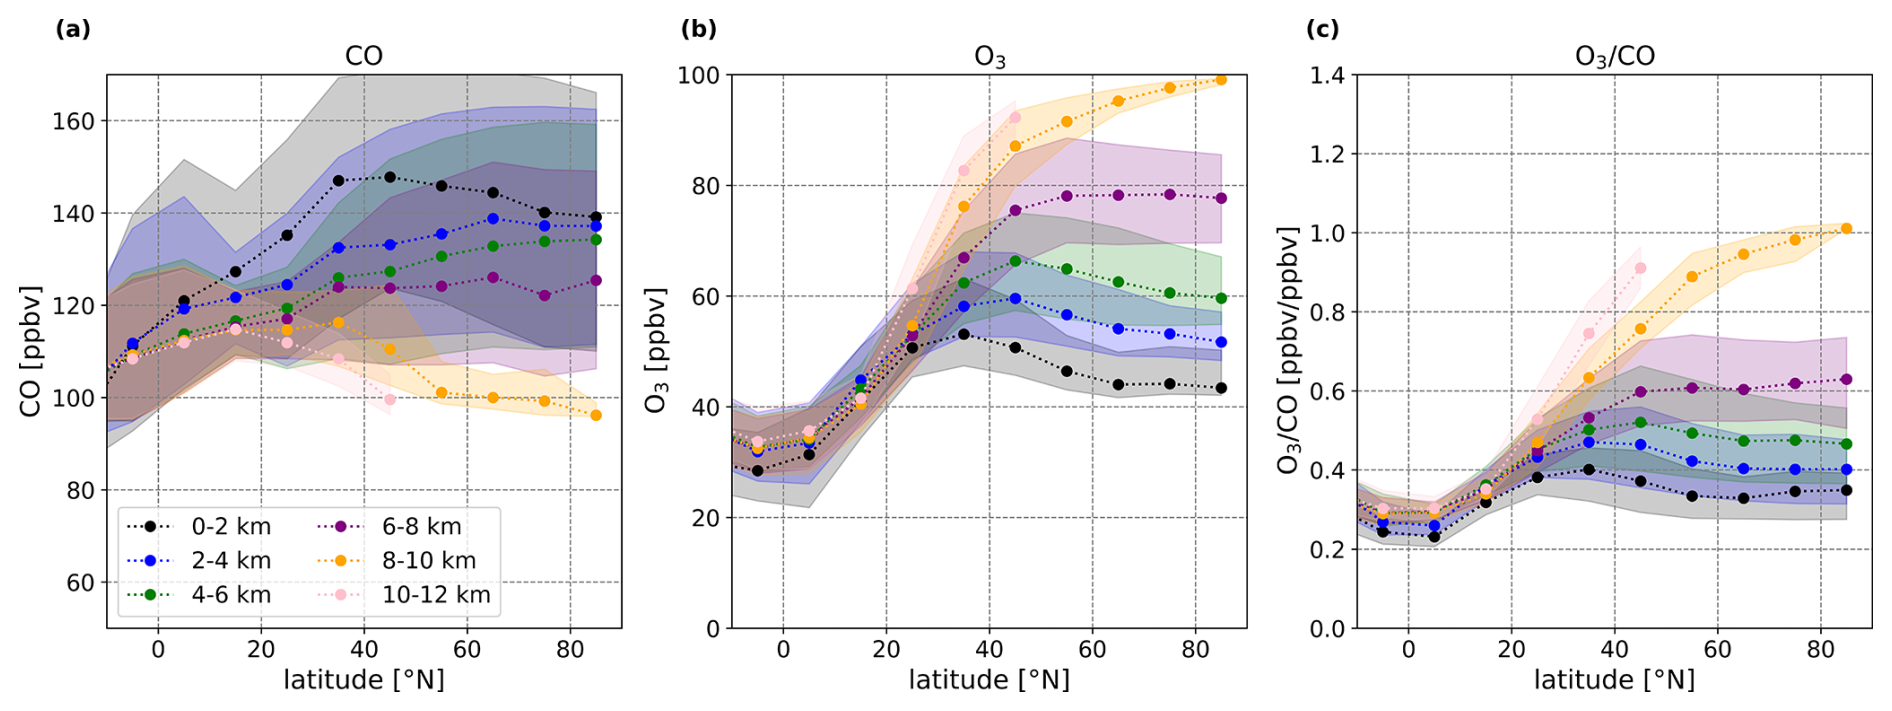
In the zonal distribution in Fig. 3, an increase in the O3–CO ratio was observed in the northern subtropics around 23.3–40° N. For further analysis, we have calculated the zonal 10°, 2 km altitude-binned medians of the airborne measurements for CO, O3, and their ratio for the northern hemisphere and shown in Fig. 4a, b, and c, respectively. The global gradients for the zonal medians, including the southern hemisphere, can be found in the Supplement. Only tropospheric values have been used based on O3 mixing ratios lower than 100 ppbv, according to Prather et al. (2011).
The subtropics are dominated by relatively low CO and high O3 mixing ratios, resulting in a median O3–CO ratio of 0.7 ppbv ppbv−1 in the upper troposphere. Towards the tropics and the mid- to high latitudes, the O3–CO ratios decrease to 0.4–0.45 and 0.55–0.6 ppbv ppbv−1, respectively, in the upper troposphere. This tendency is evident throughout all altitudes from 0 to 12 km. From the boundary layer to the upper troposphere, in the northern subtropics, CO mixing ratios range from 120 to 80 ppbv, and O3 mixing ratios range from 35 to 65 ppbv, resulting in ratios of 0.35–0.7 ppbv ppbv−1. Closer to the pole, we observe an enhancement of O3 at higher altitudes (above 6 km), which could be due to the proximity of the tropopause and exchange processes with stratospheric O3-rich air (Hoor et al., 2002, 2004).
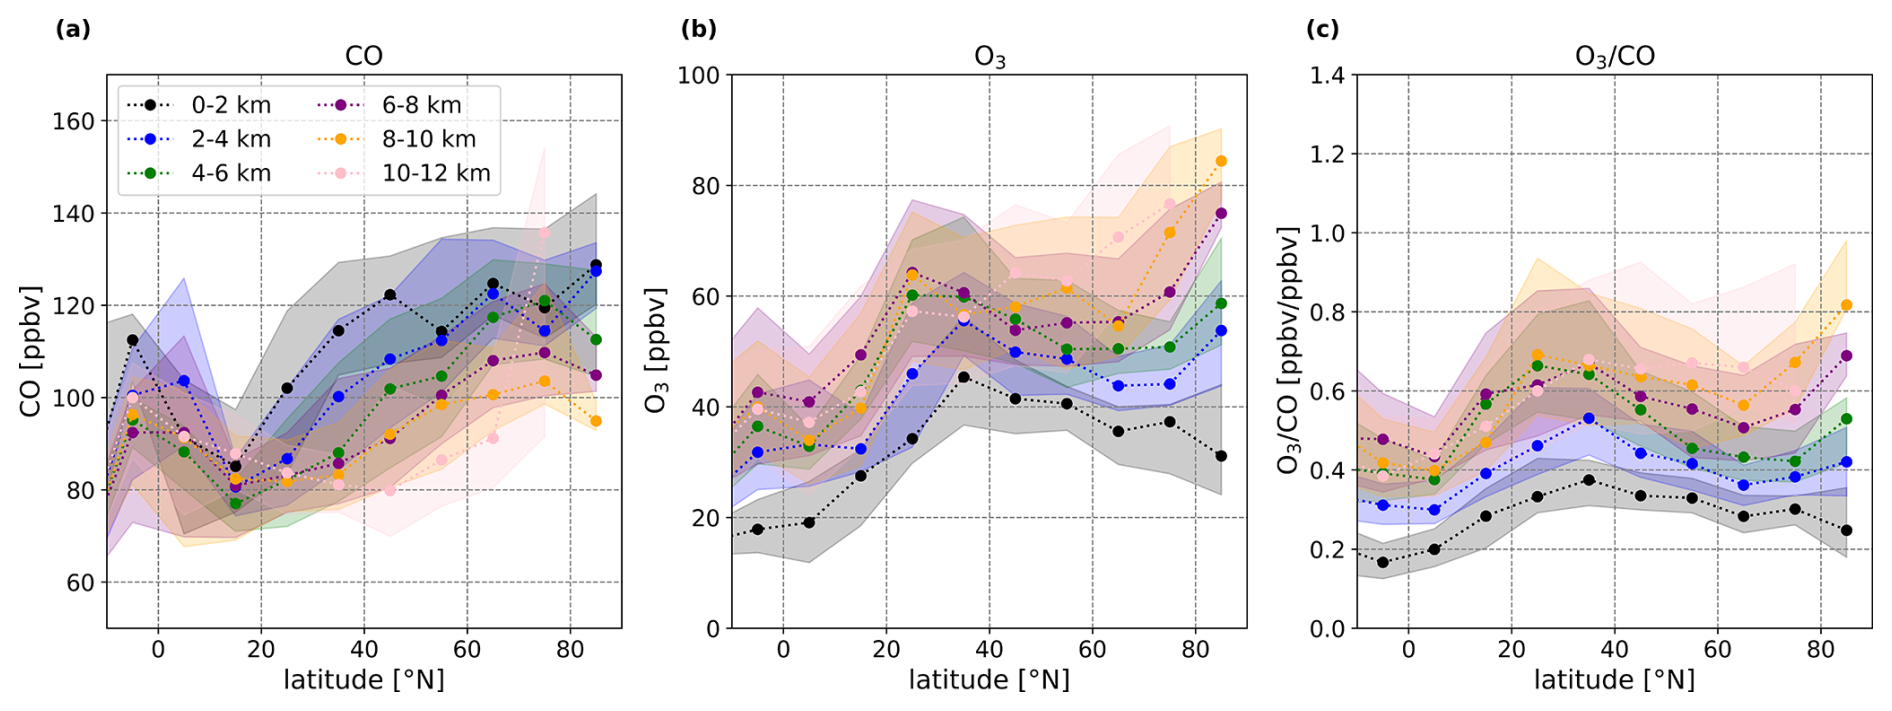
Figure 4Northern hemispheric zonal gradients of CO (a), O3 (b), and their ratio (c) based on all aircraft measurements, which are listed in Table 1, averaged over 10° of latitude, and 2 km of altitude. Displayed are the medians as dots and the 25th and 75th percentiles as shaded areas. Before the calculations, stratospheric values have been filtered out through excluding all measurements with O3 values lower than 100 ppbv, according to the chemical troposphere definition of Prather et al. (2011).
Assuming that cross-tropopause exchange takes place mostly in the vicinity of the subtropical and polar jet streams and along isentropic layers, as has been shown in numerous studies (e.g., Lelieveld et al., 1997; Fischer et al., 2000; Krasauskas et al., 2021), enhanced O3–CO ratios are expected in the subtropics and at the poles. Finding a negative correlation between O3 and CO, several studies have identified air masses to originate from either the stratosphere or troposphere (Fischer et al., 2000; Hoor et al., 2002, 2004; Joppe et al., 2024). Here, we observe enhanced O3–CO ratios covering the whole tropospheric column down to the boundary layer in the subtropics. This deep intrusion raises the question of whether cross-tropopause exchange, which transports high O3 and low CO downward from the stratosphere into the troposphere, is the predominant mechanism affecting the troposphere subtropical column. To address this question, we investigated another possible mechanism that can lead to similar changes in the O3–CO ratios in the subtropics. In the upper tropical troposphere, LNOx emissions can lead to significant O3 production, and simultaneously, catalyze OH recycling, which decreases CO in the atmosphere. Those emissions can be distributed via the Hadley circulation from the tropics into the subtropics. In the following, this hypothesis will be investigated using sensitivity simulations with the EMAC model (Sect. 2.2).
3.2 EMAC model simulations
To investigate whether a chemical mechanism contributes to the O3 enhancement and CO decline in the subtropical troposphere, we use the three-dimensional chemistry and dynamic EMAC model. The model results cover 20 years of simulation (2000–2019) with monthly values and a spacial resolution of 1.875° × 1.875° × 1 km. This climatology has proven to be comparable to empirical observations (see Supplement). In the following, we test, whether the model reproduces the same subtropical O3–CO ratio enhancement in its standard simulation (REF) which could be identified in the observations. As for the empirical observations, an annual zonal distribution of the modeled O3–CO ratio has been calculated from this data set, shown in Fig. 5. An overview of the monthly zonal distributions can be found in the Supplement.
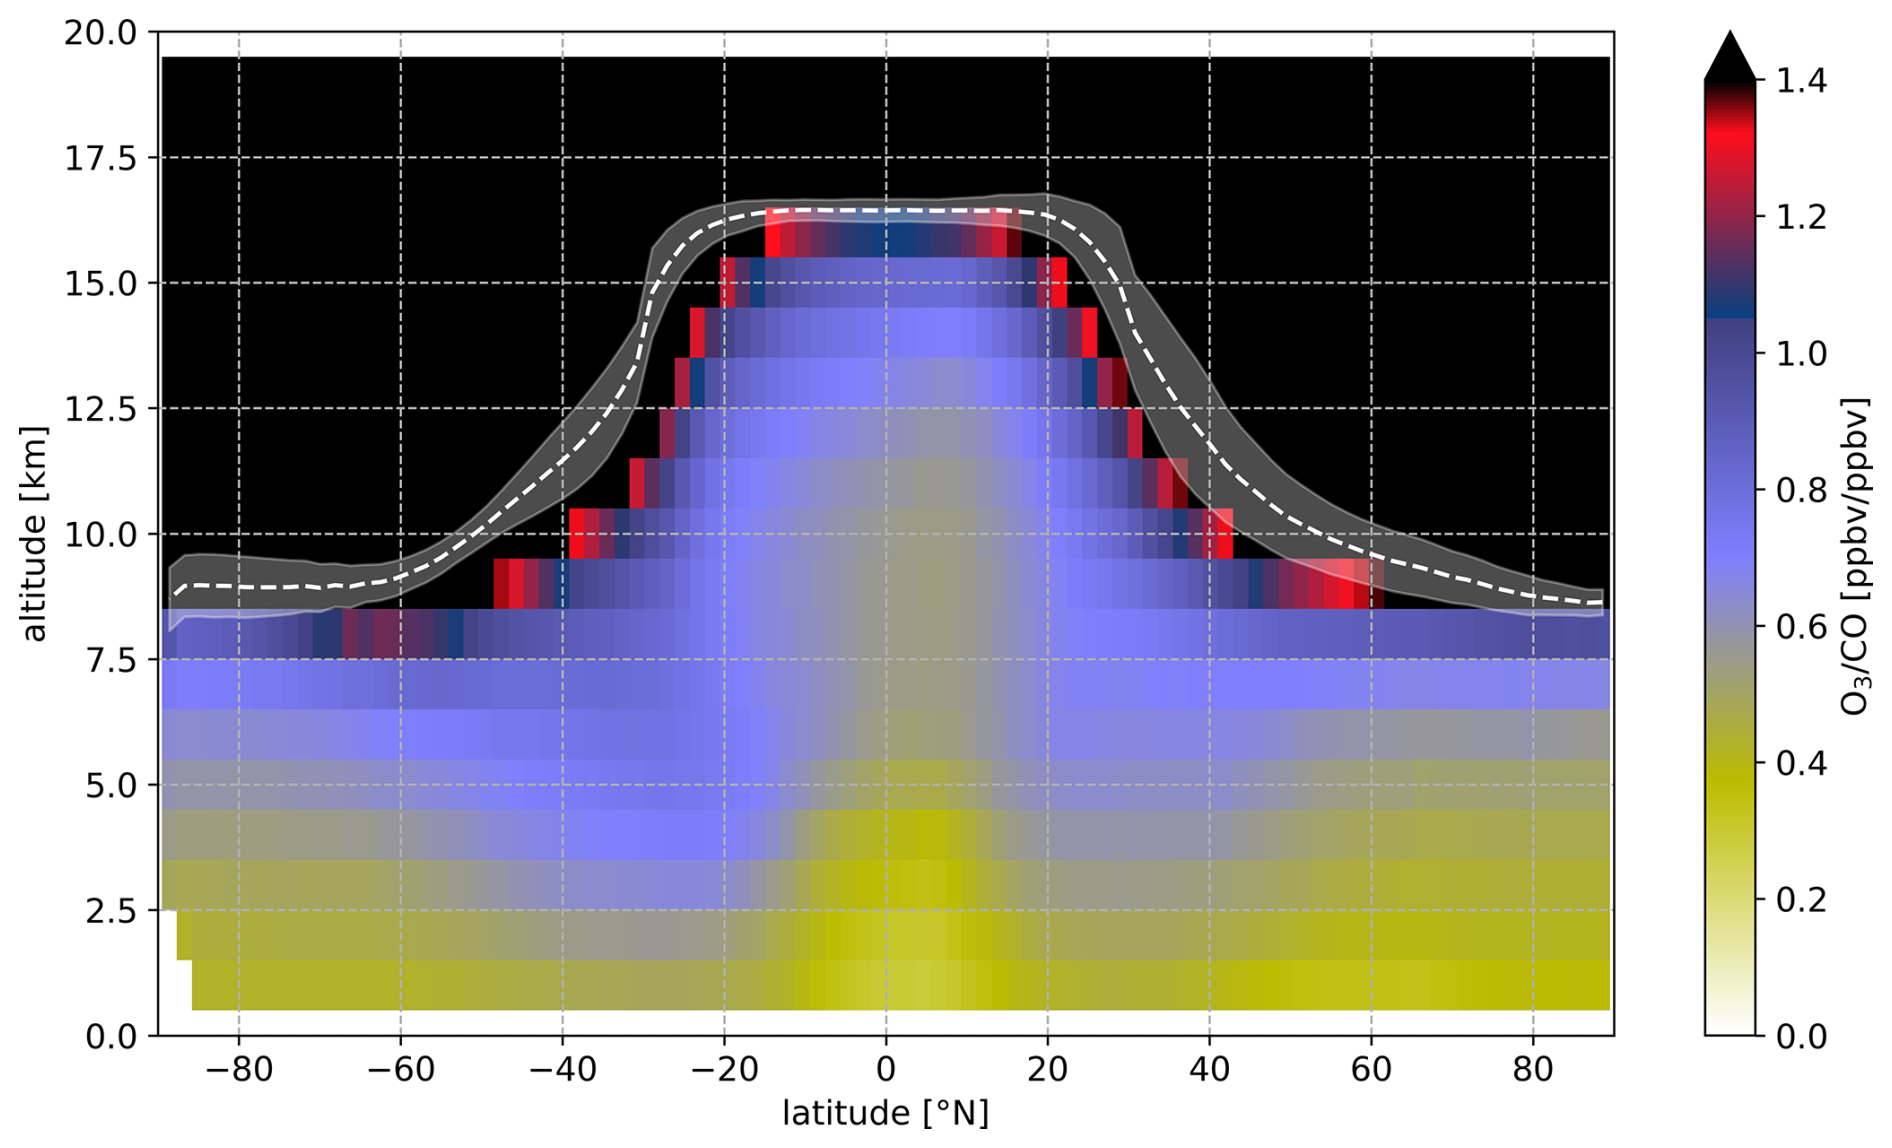
Figure 5The median annual zonal distribution of the O3–CO ratio calculated from the EMAC model data (REF). All data points are averaged over 1 km of altitude and 1.875° of latitude. The scale has been adjusted to display tropospheric values. The white dashed lines indicate the tropopause layer height with its standard deviation shaded in white.
The ratio plotted in Fig. 5 shows similar features as identified in the zonal distribution of the airborne observations (Figs. 2 and 3). Low O3–CO ratios are generally found in the lower troposphere and extend into higher altitudes in the mid- and high latitudes and in the tropics. Closer to the tropopause, O3–CO ratios increase. Here, the model shows a slight overestimation of O3 and CO, and hence of the O3–CO ratio in the upper troposphere. A further difference can be noted in the tropical troposphere. The tropical “belt” of low O3–CO ratio representing the ITCZ with strong uptake of surface mixing ratios through frequent convection seems to be less pronounced in the model than in the observations. This difference remains when looking at the model data extracted from the flight track (not shown here), which means that the representation of convection in the model is likely to cause this difference (Lelieveld et al., 2018; Nussbaumer et al., 2024).
The model shows a strong enhancement in both hemispheres, while the observations could not capture such ratios in the southern hemisphere, most likely due to the lack of observational data, especially towards the southern high-latitudes. In the model, relatively high O3 and low CO values, indicated by high O3–CO ratios, are found immediately above the boundary layer in both subtropical regions, compared to the values towards the tropics and mid-latitudes. However, background O3 and CO ratios differ strongly between both hemispheres, mostly caused by the difference in land cover (natural) and anthropogenic emissions. This results in slightly lower O3–CO ratios in the northern compared to the southern hemisphere, ranging from 0.4–1.1 and 0.45–1.4 ppbv ppbv−1, respectively. Focusing on the northern hemisphere, the model captures well the features of observed zonal O3–CO ratios.
3.2.1 Modeled northern hemispheric gradient
For a better comparison with the observations, we will focus on the northern hemispheric gradients in the following; however, we present the global zonal gradients, including the southern hemisphere, in the Supplement. In Fig. 6 the northern hemispheric gradients of the modeled CO, O3, and the O3–CO ratio for different altitude ranges are shown in (a), (b), and (c), respectively. Similar to the observations, the modeled data was averaged over 2 km and 10° of latitude over all longitudes for tropospheric values only, excluding data points with O3 values higher than 100 ppbv, according to Prather et al. (2011).
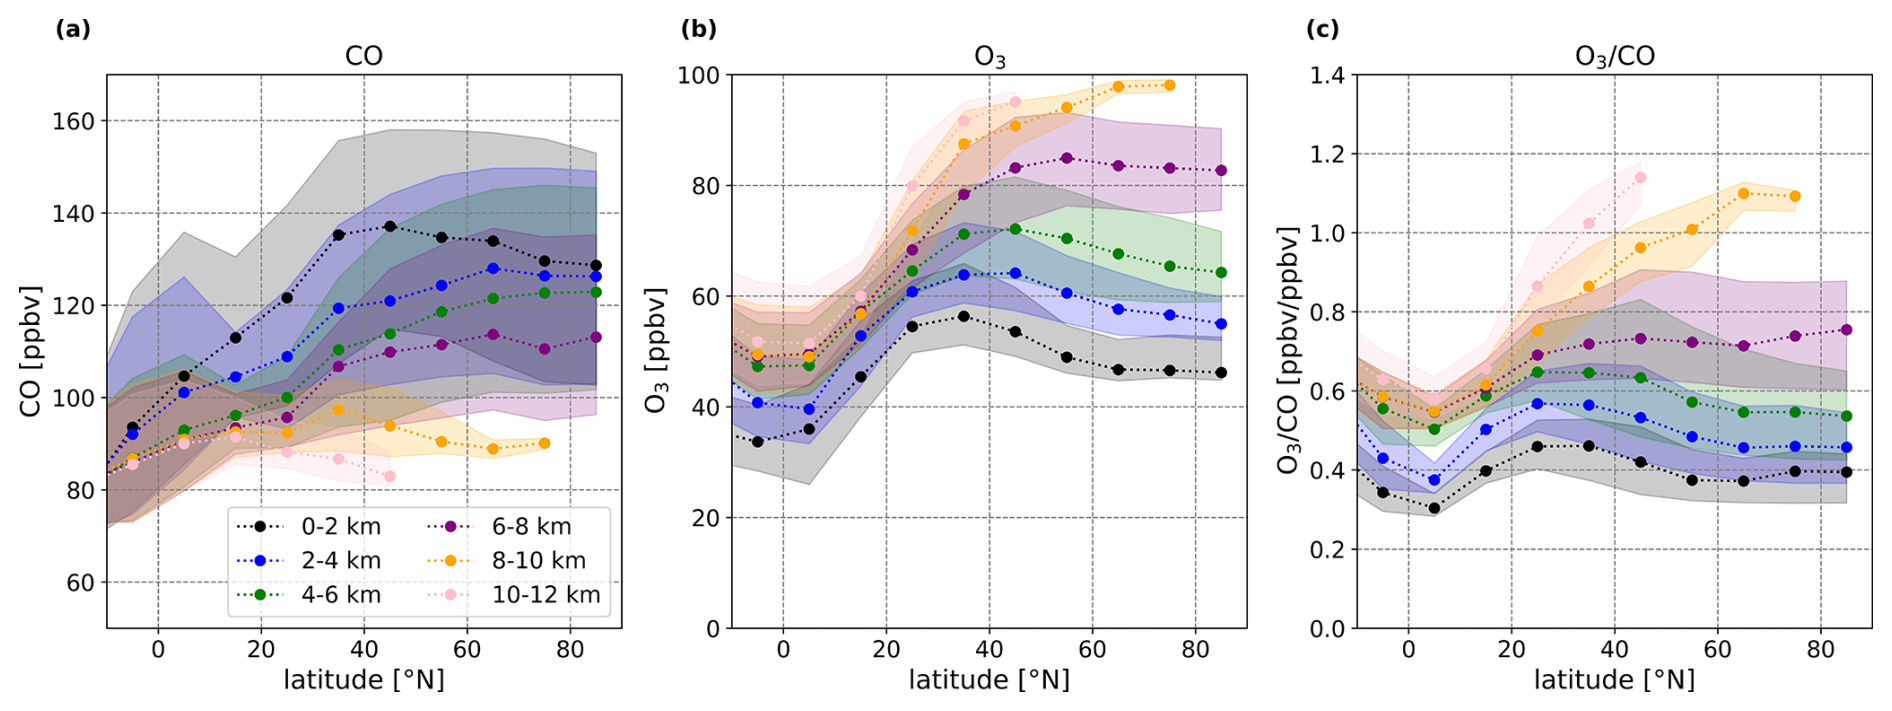
Figure 6Northern hemispheric zonal gradients of CO (a), O3 (b), and the O3–CO ratio (c) from the EMAC model data (REF), averaged over 10° of latitude and 2 km of altitude. Dots represent medians and shaded areas denote the 25th and 75th percentiles. Before the calculations, only tropospheric data was selected based on the chemical definition of the tropopause by Prather et al. (2011) at 100 ppbv of O3.
In comparison to the observations, the modeled gradients for CO and O3 mixing ratios are slightly higher except for the CO mixing ratios in the tropics, where the observations show higher CO mixing ratios throughout all altitudes. Furthermore, the decrease of CO in the northern subtropics is much more pronounced in the observations than in the model. Nevertheless, the difference between the model and the observations lies mostly within the range of the 25th and 75th percentiles and the gradients show a similar pattern: a higher O3–CO ratio in the subtropics compared to the northern extra tropics and tropics, particularly at lower altitudes. The underestimation of CO in the tropics results from applying global climatology, which results in the smoothing of emission regions with more remote regions. The flight track extraction tends to overestimate surface CO mixing ratios in the tropics, due to the complexity of modeling occasional biomass burning events and their exact emission rates.
Overall, the gradients of the O3–CO ratio in Fig. 6c show a similar enhancement in the subtropics as has been observed (Fig. 4c), with modeled O3–CO ratios ranging from 0.45 to 0.8 ppbv ppbv−1 in the northern subtropics with highest values close to the tropopause. The slight overestimation of the modeled median mixing ratios of CO and O3 leads to ∼0.1 ppbv ppbv−1 higher O3–CO ratios than in the observations. Nevertheless, the decreasing gradients towards the tropics and mid- to high latitudes are reproduced by the model.
3.3 Modeled sensitivity study: without LNOx
The measured and modeled zonal distributions of the O3–CO ratio, shown in Figs. 3 and 5, as well as the northern hemispheric gradients in Figs. 4 and 6, all indicate a strong enhancement in the O3–CO ratio in the northern subtropics. It is to be expected that STE at the subtropical jet has a pronounced effect on the composition of the subtropical troposphere. This results in high O3 and low CO mixing ratios in the troposphere of the subtropics. This process might be responsible for the O3–CO ratio enhancement identified in the in situ observations and the model results. However, chemical processes in the upper troposphere driven by LNOx emissions lead in principle to similar conditions, according to Reactions (R1), (R2), (R5), and (R6). Tropical convection associated with the ITCZ transports surface emissions into the upper troposphere. Lightning associated with deep convection produces significant amounts of NO, which catalyze a series of chemical reactions that yield O3. In addition, NO is an important secondary OH source via recycling of peroxy radicals, leading to higher OH concentrations in the convective outflow (Lelieveld et al., 2018). This potentially shortens the lifetime of CO and other hydrocarbons (Lelieveld et al., 2016). The secondary production of highly reactive OH radicals results in reduced CO levels in the tropics. Overall, lightning is expected to yield enhanced O3 and low CO mixing ratios. These air masses are transported within the troposphere following the Hadley circulation that transports tropical air masses into the subtropics. Thus, we hypothesise that high O3–CO ratios in the subtropical troposphere are not only due to exchange processes with the stratosphere but result also through photochemistry within the troposphere. To test this hypothesis, we used a model sensitivity study without lightning NOx production. By excluding LNOx, the effect of high O3 production and, indirectly, the loss of CO in the upper troposphere is excluded from the simulations, while all other mechanisms are kept as usual. Note that other reactions linked to NOx chemistry, like the depletion of CH4 and other hydrocarbons through OH, are also affected by the absence of LNOx. However, dynamic processes, like STE, transport through tropospheric mesoscale circulations, surface emissions, and other chemical reactions which are not effected by LNOx are unchanged. The difference between the “REF” and the “without LNOx” simulations of the EMAC model can thus be interpreted as the effect of LNOx on tropospheric chemistry (including, e.g., Reactions R1, R2, R5, R6). This effect we study on the basis of the absolute and relative differences of the zonal distribution, the change of the northern hemispheric gradients, and the vertical profile of the northern subtropics in the following sections. A zonal distribution of the annual average O3–CO ratio from the sensitivity simulation can be found in the Supplement.
3.3.1 Relative and absolute differences due to LNOx emissions
In Fig. 7 the absolute and relative differences for CO (a, b), O3 (c, d), and OH (e, f) between the standard model run and the sensitivity run without lightning emissions are shown for the annual average, respectively. The absolute difference (Dabsolute), calculated in Eq. (2), represents the total change of mixing ratios (MR) caused by LNOx, and the relative difference (Drelative, Eq. 3) represents changes relative to the local mixing ratios provided by the standard simulation (REF) in percent.
As expected, by excluding LNOx from the EMAC model simulations, generally, OH radicals are decreasing, CO is increasing and O3 is decreasing. The largest impact is found in the tropics in the upper troposphere where the largest emissions of LNOx are found (Schumann and Huntrieser, 2007; Nussbaumer et al., 2023b). The absence of NO reduces the secondary production of OH radicals by a factor of two to three (Reaction R6), according to Lelieveld et al. (2016), and are highly reactive with CO in the upper troposphere. Here, OH is reduced by a factor of 2.4, which increases absolute CO mixing ratios by 15–25 ppbv south and north of the ITCZ. This is a difference of over 30 % compared to values measured for CO in the upper tropical troposphere by excluding LNOx.
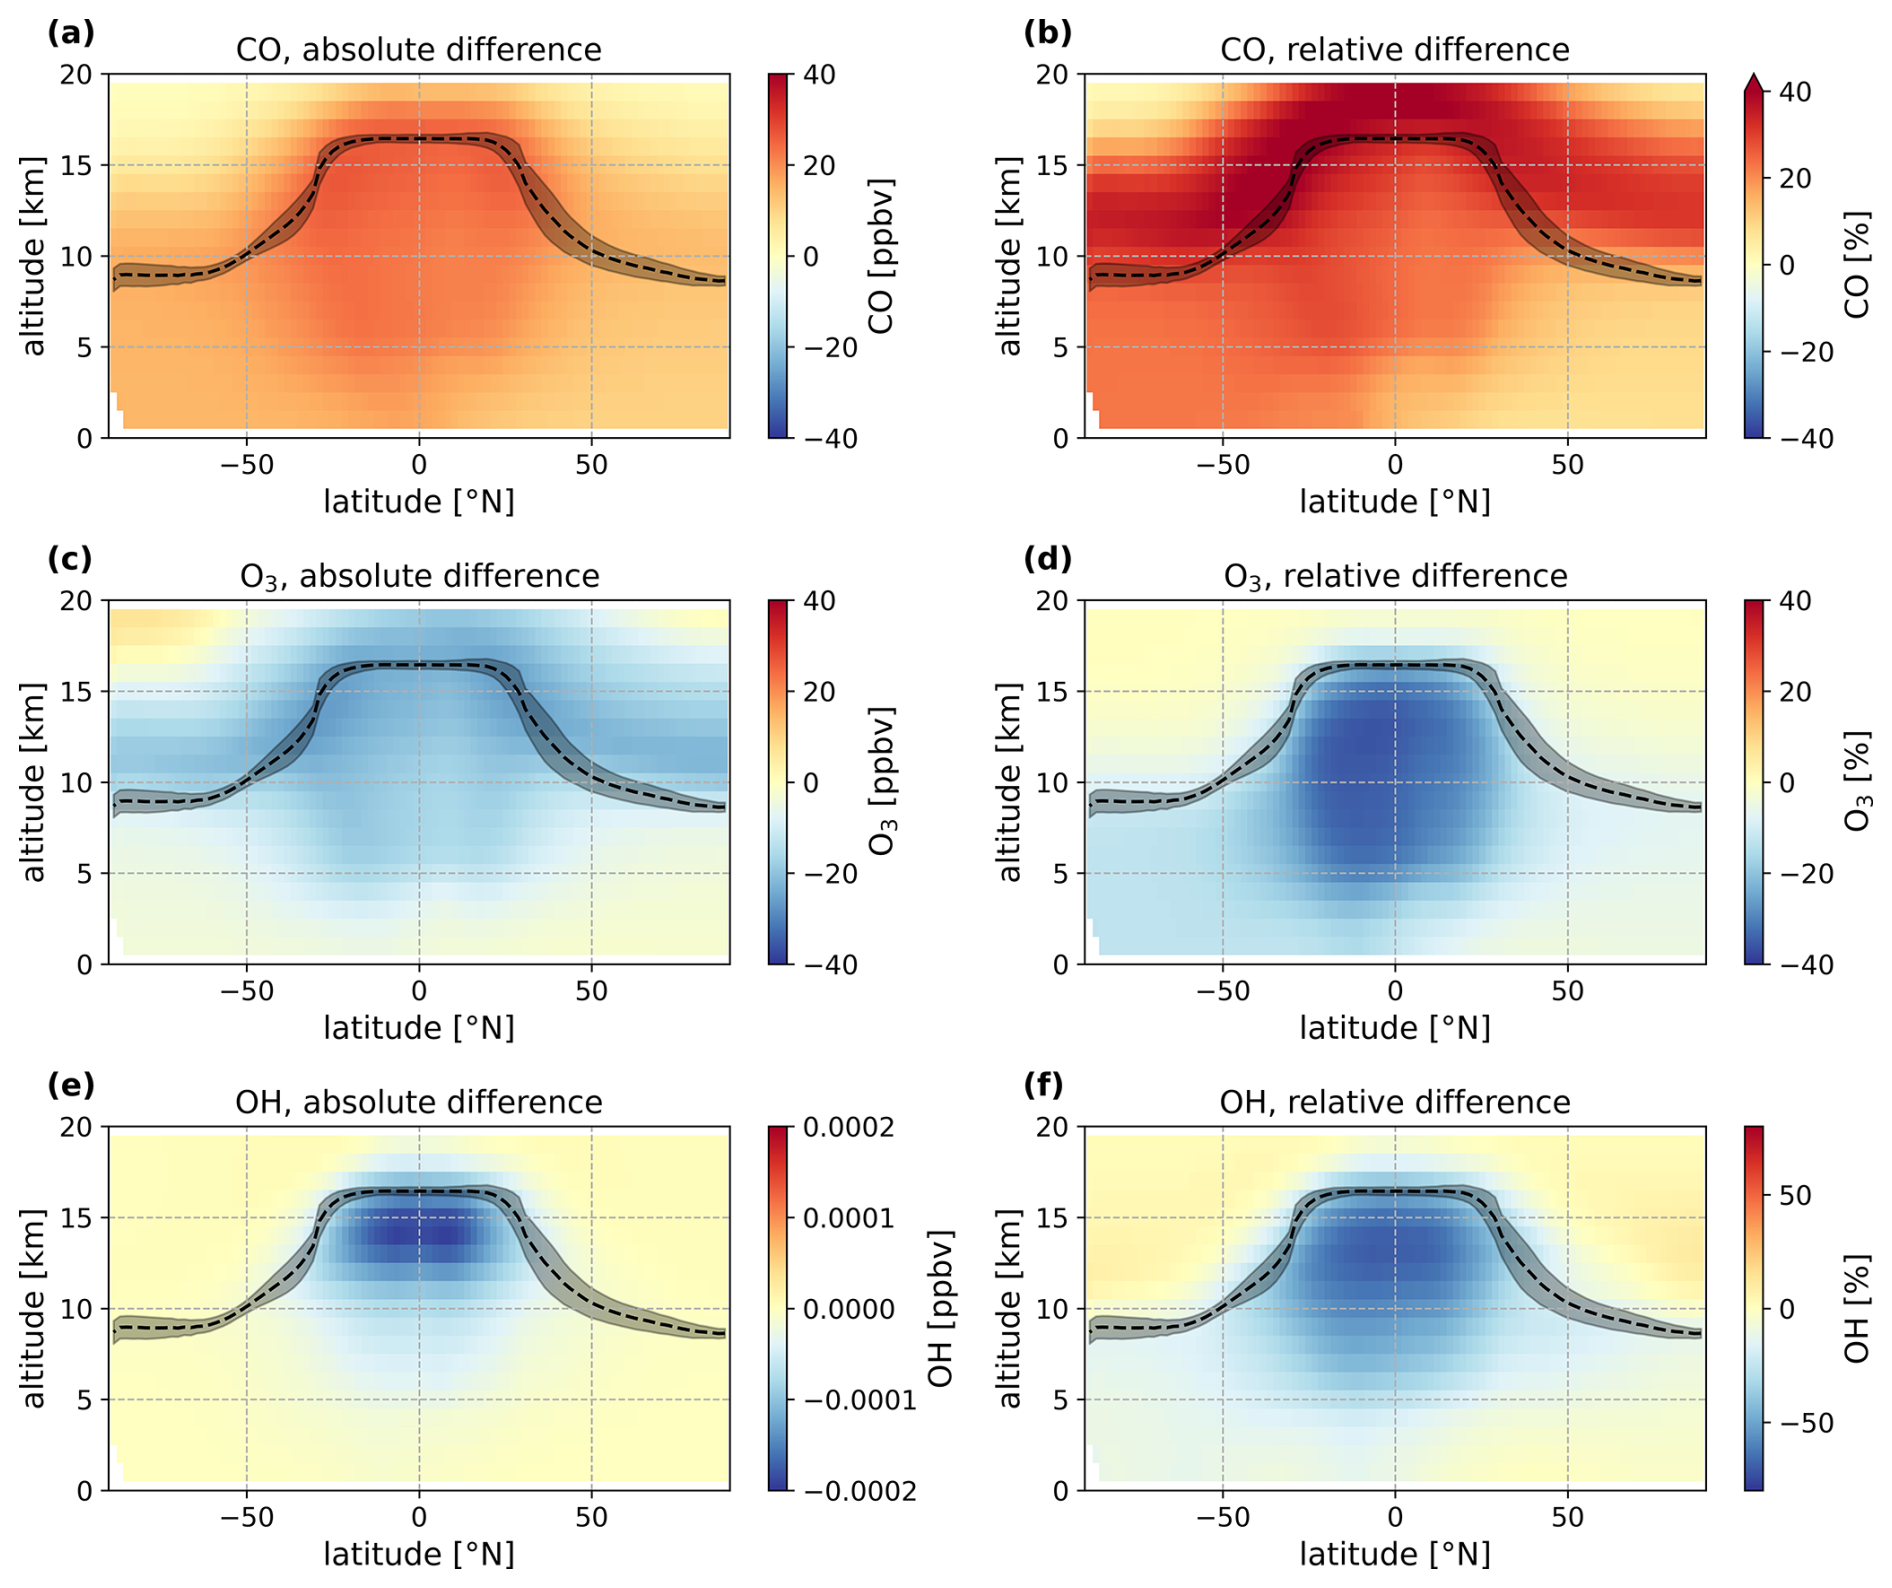
Figure 7Relative and absolute differences of CO (a, b), O3 (c, d), and OH (e, f) caused by excluding LNOx emissions in the global 3D model EMAC, shown on annual averaged zonal mean distributions. On the left side (a, c, e) the absolute differences (Eq. 2) of the gas concentration are shown and on the right side (b, d, f) the relative differences (Eq. 3) in percentages normalized to the background concentrations. Note the scales for OH differ from CO and O3. The black dashed lines and shaded area indicate the mean height of the tropopause layer and its standard deviation, respectively, by taking the zonal and annual average.
Simultaneously, O3 is reduced in the upper tropical troposphere by up to 40 % by excluding LNOx. Average O3 mixing ratios in the tropical upper troposphere are in the range of 50 ppbv. Inhibiting production through LNOx decreases O3 by 15–20 ppbv in that region. Especially in the upper tropical troposphere, LNOx is expected to be the predominant driver of photochemically formed O3, which we confirm with these results.
Overall, the sensitivity run indicates that without LNOx, O3 and OH production decreases. This yields lower O3 and higher CO mixing ratios in the upper tropical troposphere. Subsequent transport in the Hadley circulation results in similar changes for O3 and CO in the subtropics. Note that switching off LNOx also affects the mixing ratios of CO and O3 in the lowermost stratosphere, although to a lesser extent, compared to typical CO and O3 values in the stratosphere. Nevertheless, these changes in the lowermost stratosphere are expected to be mainly caused by upwelling air transported through the tropical tropopause layer (TTL) into the stratosphere and distributed in the lowermost stratosphere.
The chemical lifetime of CO can be estimated with OH concentrations, assuming only its major atmospheric sink through OH in the upper troposphere and standard pressure and temperature conditions (200 hPa, 250 K) and a reactivity rate of k = 1.57 cm3 molecules−1 s−1 according to McCabe et al. (2001). Using this approximation and only focusing on the absence of NO recycling the OH increases CO lifetimes in the upper tropical troposphere from approximately two months (67 d) up to five months (161 d). In comparison, Lelieveld et al. (2016) achieved a CO lifetime of 38 d for the upper tropical troposphere. Furthermore, we noticed a relative change in OH radicals also towards higher latitudes, which suggests OH recycling through transported NO, which lifetime is at ∼4–7 d (Schumann and Huntrieser, 2007). Transport through the Hadley circulation into the subtropics takes 10 to 50 d according to Seinfeld and Pandis (2016). Therefore, the photochemistry that results in higher O3 and reduced CO is expected to continue during transport from the tropics to the subtropics. By calculating the change of chemical lifetimes of CO for the northern subtropics, we achieve a change from 56 d to approx. 70 d, over the whole tropospheric column. This is an increase of CO lifetimes by a factor of 1.24. Note that the production of CO by CH4 oxidation is also altered by the absence of LNOx emissions. While OH acts as an important sink for CH4 as well (Lelieveld et al., 2016), longer lifetimes and thus higher levels of CH4 are also expected as a consequence of excluding LNOx emissions. Through the increase in CH4 mixing ratios, more CO can be produced by its oxidation. However, CH4 is quite stable with a lifetime of approximately 9 years (Szopa et al., 2021) and with mixing ratios an order of magnitude higher than CO (approx. 1770–1870 ppbv in the annual global mean at marine surfaces in the years from 2000 to 2019 according to the NOAA background stations network, Lan and Dlugokencky, 2025). Therefore, we expect the contribution to the increase of CO resulting from enhanced CH4 to be rather small.
Overall, upper tropical LNOx emissions can exert a profound influence all the way down to the lower troposphere of the subtropics (approximately 3 km). Therefore, the resulting changes in the subtropics are linked directly to LNOx production in the upper tropical troposphere affecting the chemistry there, and along the path ways of the Hadley circulation.
3.3.2 Modeled northern hemispheric gradient without LNOx
In Fig. 8, the modeled annual zonal northern hemispheric gradients of the CO (a), O3 (b), and O3–CO ratio (c) are shown for the “without LNOx” simulation. The corresponding gradients for all latitudes can be found in the Supplement.
There are three main differences to the standard simulation, in addition to the above-mentioned generally higher CO and lower O3 mixing ratios: lower O3–CO ratios over the whole northern hemisphere; less vertical variation in the tropics and subtropics; and, a partially smaller meridional variability indicated by the 25th and 75th percentiles.
First, we focus on the generally lower O3–CO ratios. Excluding LNOx emissions causes an increase in tropospheric CO and a reduction in tropospheric O3, as shown before, resulting in a smaller ratio. This reduction is most pronounced in the upper troposphere and continues into the free troposphere and lower troposphere with decreasing influence. Hence, the annual average of the O3–CO ratio is nearly constant at 0.4 ppbv ppbv−1 throughout the whole subtropical troposphere and is even lower in the tropics at 0.3 ppbv ppbv−1. Nevertheless, the local high of the O3–CO ratio in the subtropics is still present, albeit weaker.
Secondly, vertical changes of the mixing ratios seem to be smaller, yielding similar O3–CO ratios from the boundary to the upper troposphere. Only towards the pole, where the tropopause is much lower and the influence from the tropics much weaker, the vertical gradient is still visible.
Finally, the percentiles provide an indication of meridional variations over the zonal-vertical averages, showing reduced variability for the sensitivity run without lightning relative to the base run. This indicates enhanced homogeneity not only vertically but also meridionally.
The absolute and relative differences between the base run and the sensitivity run for the northern hemispheric gradients of the O3–CO ratios are shown in Fig. 9a and b, respectively. Again, the corresponding gradients for the global distribution can be found in the Supplement.
Focusing on the absolute differences (Fig. 9a), calculated in Eq. (2), we find the largest change in the upper troposphere in the subtropics with O3–CO ratios smaller by −0.4 ppbv ppbv−1 than for “REF”. The least impact is found at the lowest altitude range (0–2 km) and towards the higher latitudes.
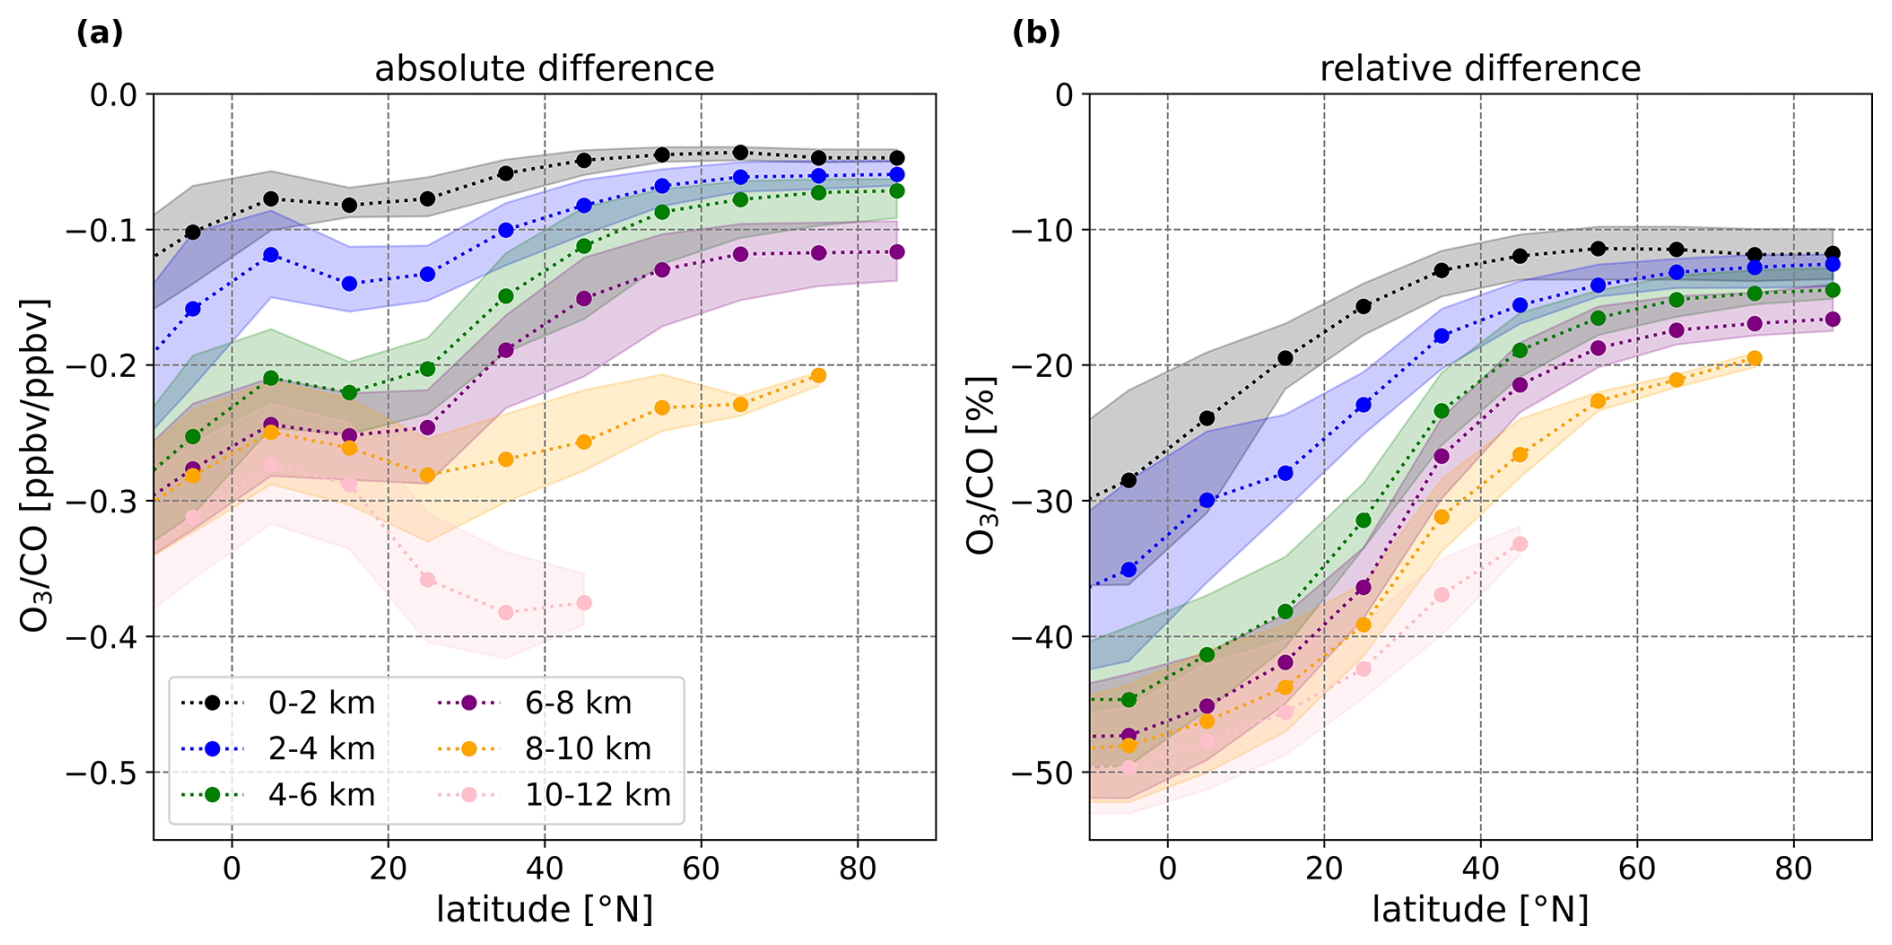
Figure 9Same as Fig. 6, but for the absolute differences (a) and relative differences (b) of the O3–CO ratio between the base run and the sensitivity run without LNOx.
The relative differences, which are calculated with Eq. (3), show the normalized influences, which are strongest in the tropics slightly south of the equator extending into the subtropics. The relative effect is smallest again towards higher latitudes and lower altitudes but results in a change in the O3–CO ratio of 50 % in the tropical upper troposphere and over 40 % in the subtropics.
3.3.3 Vertical distribution of the northern subtropics
The vertical distribution of the mean relative differences between the base run and the sensitivity run without LNOx of CO, O3 and the O3–CO ratio for the northern subtropics, ranging from 23.3–40° N, are shown in Fig. 10. The main effect of switching off LNOx is found in the upper troposphere, mainly around 12 km.
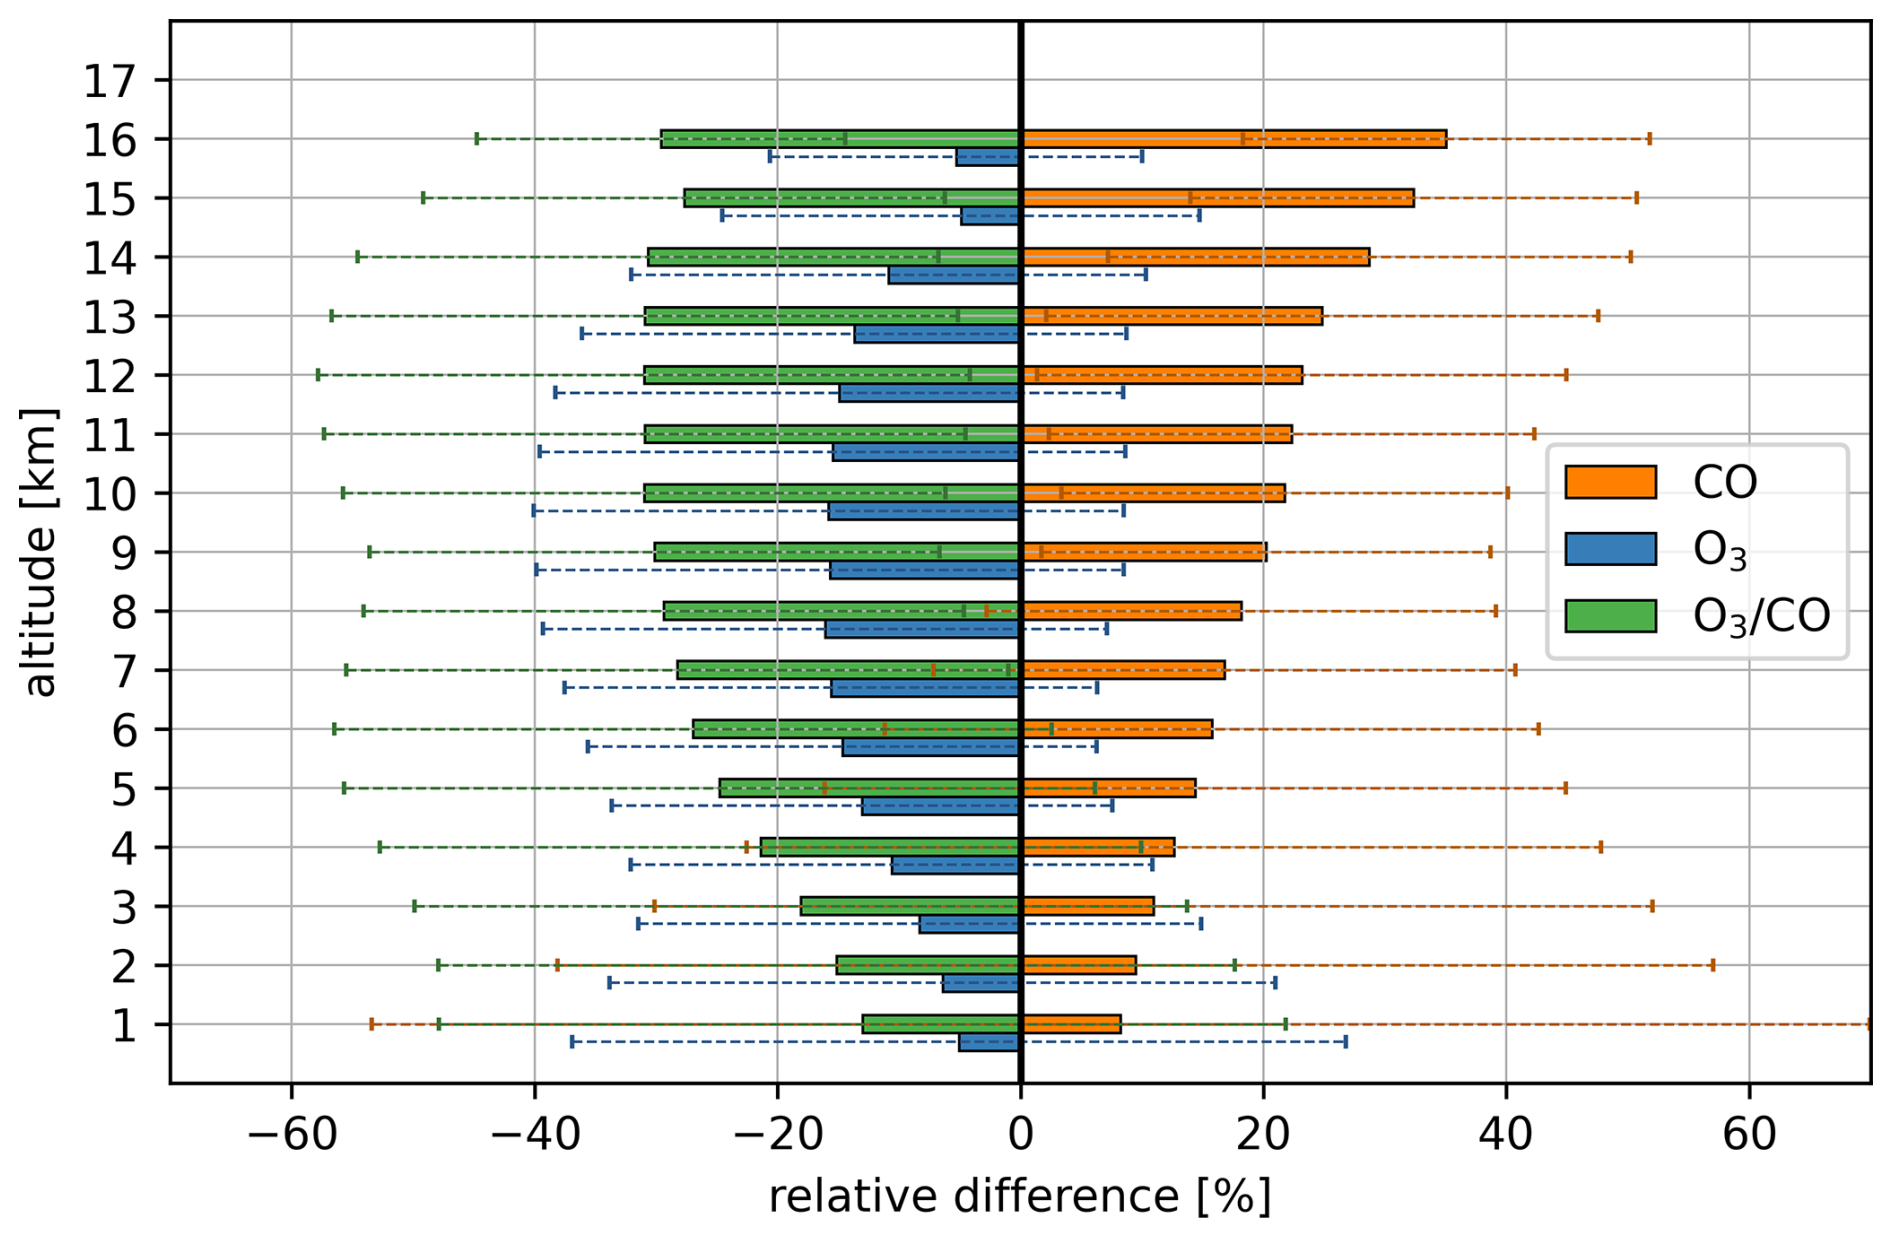
Figure 10The mean relative differences in O3 (blue bars), CO (orange bars), and their ratio (green bars) averaged over all longitudes, the northern subtropics ranging from 23.3–40° N, and for each kilometer, with exclusion of stratospheric values selected by O3 values higher than 100 ppbv. This mean includes an average over all months. The error bars show the standard deviation and represent the meridional variability of the relative differences. Calculated using Eq. (3).
We can assume that deep convection, and hence local LNOx emissions, are rare in the subtropical regions due to a general downward motion via the Hadley circulation. Nussbaumer et al. (2023a), who used a similar simulation with EMAC, concluded that lightning occurs and is observed mainly over land in the upper tropical troposphere.
As has already been seen in the zonal gradients, LNOx emissions cause a strong impact on the subtropical mixing ratios of O3 and CO, yielding enhanced O3 and diminished CO. For zonal and annual averages, excluding LNOx emissions increase CO by ∼ 30 % and decrease O3 by ∼ 20 % in the upper subtropical troposphere (orange and blue bars in Fig. 10). This results in a change of the subtropical ratio of these two gases by over 30 % in the mean value of the upper subtropical troposphere. In general, the effect of LNOx on O3, CO, and the O3–CO ratio decreases towards the surface in the subtropics. Nevertheless, there are still changes in the O3–CO ratio of over 10 % attributable to the effect of LNOx in altitudes lower than 1 km. Overall, the LNOx effect on CO removal by OH recycling is one-third of the northern subtropical CO mixing ratio. Taking into account that seasonality and spatial differences have been averaged, the impact of tropical LNOx on the subtropics is not expected to be equally distributed, and therefore stronger and lesser for each region and time.
3.3.4 Seasonal variability
The annual zonal distributions, shown and discussed in the previous sections, provided an average over all seasons. Therefore, seasonal variability has been smoothed out. To show the effect of excluding global LNOx emissions on the seasonality, we first show zonal distributions of the O3–CO ratio of both simulations for the two most contrasting months, January and July, in Fig. 11. Later in this section in Fig. 12, all monthly medians are shown for CO, O3, and their ratio separately, as well as the fraction of different mechanisms of O3 generation contributing to the northern subtropical troposphere. A selection of all monthly means of CO, O3, and their ratio of the standard and the sensitivity run of the model can be found in the Supplement.
The strongest seasonal difference can be perceived in the standard run in the northern subtropics reaching a ratio difference of 0.5 ppbv ppbv−1 (Fig. 11a, c). Generally, the tropospherical O3–CO ratio is strongest in the subtropics in summer in both hemispheres, and weakest in winter. By excluding LNOx emissions in (b) and (d), the seasonal difference becomes even more pronounced, as the O3–CO ratio is nearly constant throughout the whole troposphere in the northern subtropics in January (Fig. 11b). In the southern hemisphere the seasonality is much weaker, but the O3–CO ratio is still shifted towards lower values by excluding LNOx. Many studies have linked this hemispheric difference to tropopause height changes resulting in net mass transfer between the stratosphere and troposphere (Staley, 1962; Robinson, 1980; Murgatroyd et al., 1980; Sprenger and Wernli, 2003), with a more pronounced seasonal cycle in the northern than southern hemisphere (Appenzeller et al., 1996), also coupled to the amount of land cover. However, as the sensitivity run still shows strong seasonality, LNOx is not expected to be the mechanism controlling the seasonal variation.
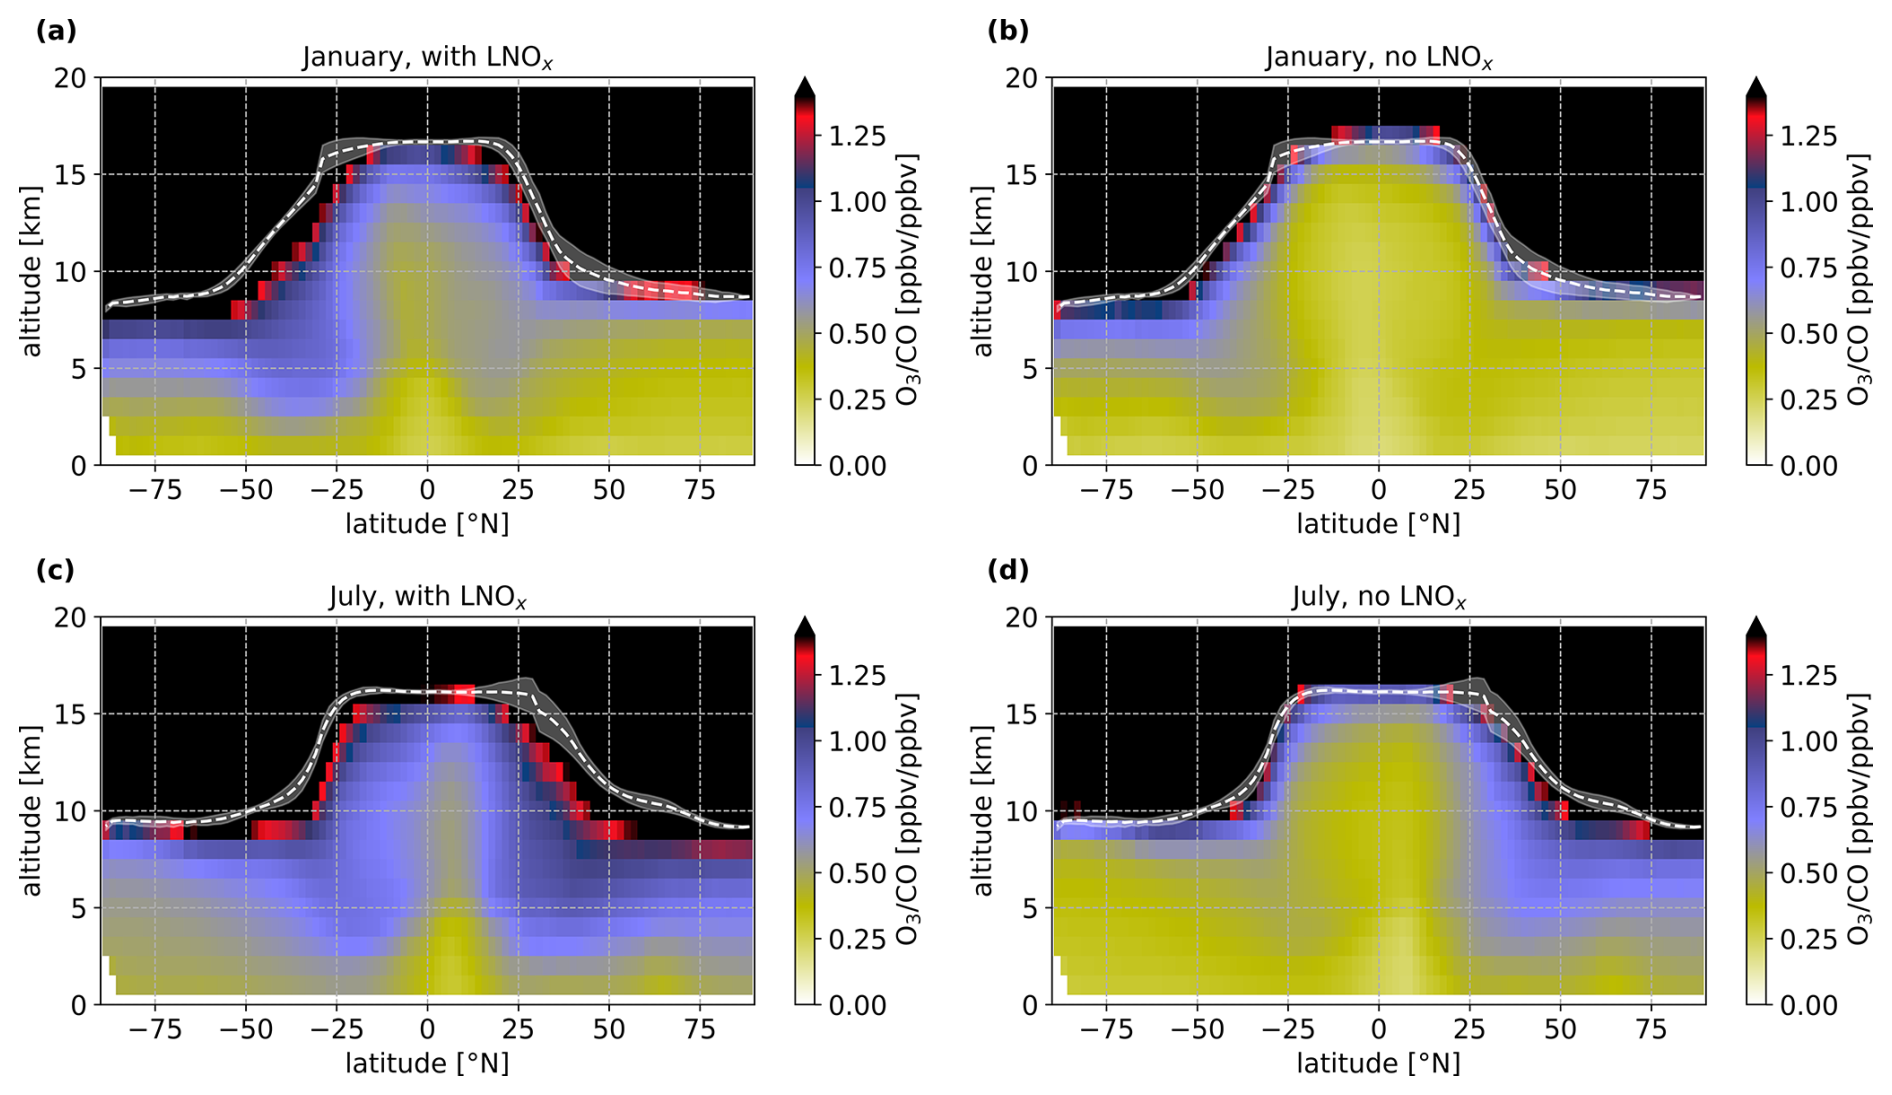
Figure 11Monthly medians of the zonal distribution of the modeled O3–CO ratio from January (a, b) and July (c, d), with (a, c) and without (b, d) LNOx. All monthly medians can be found in the Supplement.
NOx emissions from lightning have distinct spatial and temporal variations in the extra tropics, being highest in summer and lowest in winter, and pronounced in the northern hemisphere due to the larger land cover (Collier and Hughes, 2011b). Yet, 77 % of the world's lightning activity occurs in the tropics, between 30° S and 30° N (Schumann and Huntrieser, 2007), and mainly over land (Ricciardulli and Sardeshmukh, 2002; Williams and Stanfill, 2002). The occurrence of lightning in the tropics is to be expected to show no significant seasonal variation, as it moves along the ITCZ, even though lightning activity is highly complex and depends on thunderstorm activity and the properties of the aerosols, which have stronger spatial variations than temporal ones (Williams, 1985; Rycroft et al., 2000; Williams et al., 2002; Zipser et al., 2006; Collier and Hughes, 2011b, a). Tropical LNOx, and its distribution of chemical successors seem to have a global impact over all seasons, as can be seen in the comparison of the standard and sensitivity simulation in Fig. 11. This is consistent with the findings of Mickley et al. (2001), who modeled an overestimation of 50 % of preindustrial O3 during winter in the northern mid-latitudes compared to measurements and linked it to tropical LNOx emissions.
When excluding LNOx from the model simulations, seasonality is still strong. The remaining effects controlling O3 production and CO loss are therefore expected to depend on another mechanism, like stratosphere–troposphere exchange, other NOx sources, and changing background emissions.
In Fig. 12a, the monthly medians of CO, O3, and their ratio are shown, averaged over the whole troposphere in the northern subtropics, from 23.3–40° N. Anthropogenic emissions peak during the winter and spring, especially in the northern hemisphere, with the background CO mixing ratios increasing up to 125 ppbv in the zonal median. Biomass burning also contributes to the background CO but is more common in the tropics, and at higher latitudes. O3 is at a maximum in May at approximately 80 ppbv, with a gradually decreasing gradient up until winter. In winter, photolysis rates are lowest, hence the O3 lifetime is longer and more O3 accumulates (Mickley et al., 2001). During the summer, O3 depletion is strongest due to higher photochemical activity.
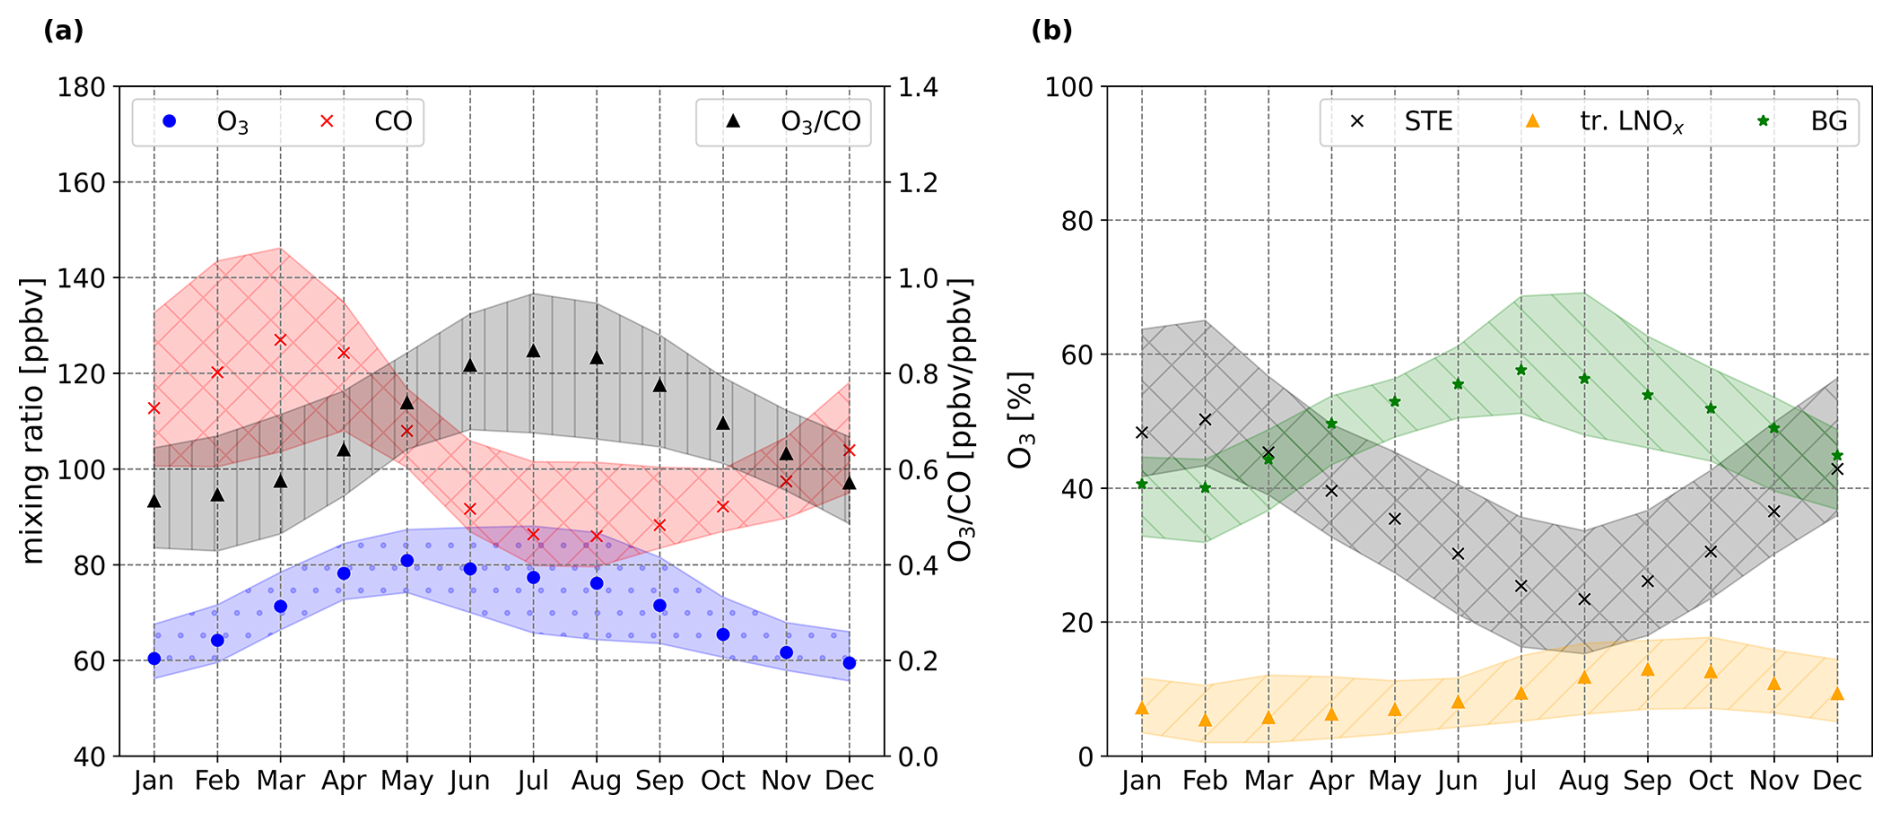
Figure 12Monthly medians of CO, O3, and the O3–CO ratio in (a), and different O3 sources in (b) averaged over the whole troposphere of the northern subtropics, defined from 23.3–40° N. The shaded areas display the 25th and 75th percentiles. The different O3 sources are defined by calculations of O3 from the two model runs and the O3S tracer of the model, which is the O3 originating from the stratosphere only (STE, black crosses). The background O3 mixing ratios of the northern subtropics are derived from the difference of all O3 minus O3S from the “without LNOx” run (BG, green stars), and O3 produced and transported from tropical LNOx (tr. LNOx, triangles) is calculated from the difference of total O3 minus the O3S tracer of “REF” minus the background mixing ratios. Adding all three O3 origins in (b) results in the O3 mixing ratios shown in (a), being 100 %. Only tropospheric values have been taken for the calculations, by excluding O3 higher than 100 ppbv according to Prather et al. (2011).
For a clearer identification of seasonality in the model simulation we introduce the O3S tracer, provided by the model, which identifies all O3 originating from the stratosphere and propagating into the troposphere. With this tracer and the sensitivity run, by excluding the chemical production of O3 by lightning emissions, we can identify different O3 origins that contribute to the O3–CO ratio. These are shown in Fig. 12b.
First, the O3S tracer reveals the amount of O3 coming from the stratosphere, which can be linked directly to STE. O3S changes marginally between the two model simulations (not shown here). Therefore, we conclude that O3 produced in the tropics and distributed from the TTL through the stratosphere seems to have a minor influence on O3 transported into subtropical regions. The contribution of STE to the total tropospheric column O3 budget in the northern subtropics comes to about 25 %–50 %, peaking in February and has a minimum in August. The STE influence is strongest close to the tropopause and diminishes towards the surface. Previous analyses showed that storm tracks and mountain chains in the subtropics are preferred regions for STE (Škerlak et al., 2014), being strongest in late spring–early summer, particularly over continents (Sprenger and Wernli, 2003). STE is strongly affected by the intensity of the jet streams, due to their role in the formation of tropopause folds, and the height of the tropopause. The location and strength of jet streams are strongly influenced by temperature differences between high and low latitudes. Jing and Banerjee (2018) found that anticyclonic wave-breaking events become more frequent in summer, and can be associated with stronger isentropic STE. Overall, STE seems to have a strong impact on the mixing ratios in the UTLS region; however, averaging over the whole troposphere, STE is found to have a minor effect on the seasonality driving the O3–CO ratio in the northern subtropics. Škerlak et al. (2014) showed that STE influence on O3 can be found all the way down to the planetary boundary layer throughout all seasons with global hot spots along mountain chains mainly in the subtropical summer. However, they identified an accumulation of O3 below the tropopause, rather than originating directly from the stratosphere. Similar seasonality can be found in the southern hemisphere (not shown here).
The contribution of O3 produced by LNOx has been calculated by subtracting total O3 from the “without LNOx” run from total O3 from the “REF” simulation of the model (tr. LNOx, Fig. 12b). As most LNOx is expected to be in the tropics (Schumann and Huntrieser, 2007), we conclude that this O3 is mostly produced by tropical LNOx emissions, transported via the Hadley circulation into the subtropics. The median contribution of photochemically produced O3 to the northern subtropical tropospheric column varies between 5 % and 15 % throughout the year, with slightly higher contributions in summer than in winter. This modest seasonality indicates a minor contribution of local induced LNOx emissions in summer and autumn.
Strong convective activity transports surface emissions upward, with impacts depending heavily on the inflow region. In highly polluted regions with strong NOx emissions (e.g., anthropogenic, biomass burning), enhanced O3–CO ratios can be transported upwards by convection (e.g., Asian Summer Monsoon, see Mickley et al., 2001). While in remote areas, especially over the oceans and in the tropics, low O3 is common at the surface through the strong sink of photodissociation and the reaction of O(1D) with water vapor, which leads to rather low O3–CO ratios. Therefore, seasonal convective activity supports higher O3–CO ratios in the tropospheric column, notably in summer (also noticed as a slight increase of O3 from LNOx during summer in Fig. 12b). Furthermore, deep convection is also linked to stratospheric–tropospheric mixing through overshoots and corresponding downdrafts (Frey et al., 2015), additionally mixing high O3 and low CO air masses into the upper troposphere.
Extracting O3S from the total O3 from the sensitivity run excluding LNOx results in the background O3 mixing ratio, defining O3 which is neither coming from the stratosphere nor from tropical photochemistry including lightning NOx. This remaining O3 mixing ratio (BG, Fig. 12b) shows a strong seasonality, peaking in summer and having its minimum in winter. It contributes approximately 40 %–60 % to the total O3 column of the northern subtropics, and mainly drives its seasonality. The seasonal variation of the background O3 could be linked to other NOx sources like soil, anthropogenic emissions, or biomass burning emissions (Škerlak et al., 2014), but these possibilities have not been further investigated in this study. Possible transport of PAN via the Ferrell circulation from the mid-latitudes into the subtropics and its thermal depletion in the downward branch is another potential source of NOx.
In conclusion, STE seems to have a minor role in controlling the seasonality. Tropical LNOx meridionally transported via the Hadley circulation influences the O3 mixing ratio in the northern subtropics, and possible also the depletion of CO, throughout the year. The strongest effects on seasonality are exerted by the remaining factors defining the background mixing ratios.
Tropospheric chemistry and transport processes, within the troposphere as well as STE processes are important in conditioning the background mixing ratios of greenhouse gases and other trace gases in the troposphere. This study used in situ observations from 12 aircraft campaigns, from 2012–2024, to investigate the tropospherical zonal distribution of O3 and CO and their ratio. Particularly in the northern subtropics, a strong enhancement in the O3–CO ratio almost down to the boundary layer could be identified, which is usually expected to be caused by STE processes in the vicinity of the subtropical jet stream, bringing high-O3 and low-CO air from the stratosphere into the troposphere. In this study, we have investigated another possible mechanism contributing to the chemical composition of the tropospherical subtropics, which had not yet been considered. High O3–CO ratios can also be produced through photochemistry and transport within the troposphere. In the upper tropical troposphere, substantial emissions of LNOx, especially in the ITCZ, are a major source of O3, and, simultaneously, catalyze the recycling of OH radicals in the upper troposphere. Those highly reactive radicals are the main sink of CO in the free and upper troposphere, shortening the lifetime of CO. Thus, through the presence of LNOx, high O3–CO ratios can also be photochemically generated and distributed by the Hadley circulation into the subtropics. To test this hypothesis, we have used the general circulation and chemistry model EMAC and run a sensitivity study on the effect of LNOx on the troposphere O3–CO ratio. First, we show that the modeled zonal distributions give the same enhancement of O3–CO ratio in the subtropics than the observations. Second, we identified a strong effect of LNOx, which is mainly produced in the tropical troposphere, on the chemical composition of the subtropics outside the convective regions in the down-welling branch of the Hadley circulation. Photochemistry contributes by 40 % to the O3–CO ratio in the upper troposphere of the northern subtropics. These air masses propagate through the whole vertical column of the northern subtropics, supported by the Hadley circulation. The effect of LNOx on O3 and CO in the southern subtropics, tropics, extra tropics, as well as in the UTLS region were also noticed, but were not in the focus of this work. We conclude that tropical LNOx emissions are crucial for O3 production and subsequently for CO loss through the secondary production of OH radicals, which can be distributed in significant amounts throughout the whole troposphere. Furthermore, we see a strong inter-annual variability, mainly influenced by a complex interaction of STE and background concentrations. The highest O3–CO ratios have been identified in summer in the northern subtropics, corresponding with low CO and high O3 mixing ratios. Besides contributing to the seasonality of background concentrations, STE is weakest in summer, which is in contrast to the enhancement of the O3–CO ratios in summer. However, more frequent Rossby wave occurrences in summer are expected to contribute to stronger mixing throughout the troposphere. Furthermore, other tropospheric sources of NOx seem to play an important role in conditioning the troposphere as well, which needs further investigation.
Meridional variations have been briefly discussed in this study. More detailed investigations could verify the impact of tropopheric photochemistry on the background concentrations of specific regions. Furthermore, LNOx emissions are dependent on the frequency of deep convective systems as well as many other factors (e.g., ice-nucleating particles, emissions, turbulence, cloud top height), which can be hard to model. There are still major uncertainties in understanding the varying manifestations of these emissions over continental and maritime surfaces. However, we showed that lightning emissions have a strong effect on tropospheric photochemistry and global distributions of the O3–CO ratio. This effect along tropospherical transport plays a key role in conditioning the troposphere and needs to be considered in future studies.
The data measured during the campaigns ESMVal https://halo-db.pa.op.dlr.de/mission/14, OMO https://halo-db.pa.op.dlr.de/mission/0, WISE https://halo-db.pa.op.dlr.de/mission/96, CAFE Africa https://halo-db.pa.op.dlr.de/mission/98, SouthTRAC https://halo-db.pa.op.dlr.de/mission/116, CAFE Brazil https://halo-db.pa.op.dlr.de/mission/135, PHILEAS https://halo-db.pa.op.dlr.de/mission/138 and CAFE Pacific https://halo-db.pa.op.dlr.de/mission/140 are available on the HALO database platform via Deutsches Zentrum für Luft- und Raumfahrt (DLR) (2012); DLRDeutsches Zentrum für Luft- und Raumfahrt (DLR) (2015); Deutsches Zentrum für Luft- und Raumfahrt (DLR) (2017, 2018, 2019, 2023a, b, 2024), respectively. Specifically, data and code of FAIRO O3 data processing can be accessed via https://doi.org/10.5281/zenodo.11275355 (Obersteiner, 2024). The ATom missions data sets can be accessed through the NASA website (Wofsy et al., 2018). EMAC model simulations can be accessed at https://doi.org/10.5281/zenodo.17476643 (Ort and Pozzer, 2025).
The supplement related to this article is available online at https://doi.org/10.5194/acp-25-14987-2025-supplement.
LO, AP and HF designed the study; LO, HF, FO, AZ provided the HALO campaign data sets; TR, JP, IB, CT, BD provided the ATom data sets; AP provided the modeling data; LO analyzed and processed the data and wrote the paper; All others proofread and edited the paper.
At least one of the (co-)authors is a member of the editorial board of Atmospheric Chemistry and Physics. The peer-review process was guided by an independent editor, and the authors also have no other competing interests to declare.
Publisher’s note: Copernicus Publications remains neutral with regard to jurisdictional claims made in the text, published maps, institutional affiliations, or any other geographical representation in this paper. While Copernicus Publications makes every effort to include appropriate place names, the final responsibility lies with the authors. Views expressed in the text are those of the authors and do not necessarily reflect the views of the publisher.
This article is part of the special issue “The Modular Earth Submodel System (MESSy) (ACP/GMD inter-journal SI)”. It is not associated with a conference.
The authors gratefully acknowledge the whole HALO and NASA DC-8 team, which were present for and contributed to all campaigns used for this study. Additionally, all institutes which took place in those campaigns are hereby acknowledged, including the Max Planck Institute of Chemistry, the atmospheric department of the University of Frankfurt, Karlsruhe Institute of Technology, the institute of physics at the University of Mainz, the NASA Armstrong (Dryden) Flight Research Center, the NOAA Earth System Research Laboratories, the University of Havard, and the Deutsches Zentrum für Luft- und Raumfahrt (DLR) in Oberpfaffenhofen. Acknowledgment is also given to ChatGPT (open AI), who helped out by coding problems now and then.
This research has been supported by the Max-Planck-Institut für Chemie. Jeff Peischl, Ilann Bourgeois, and Chelsea R. Thompson were supported in part by NOAA cooperative agreement NA17OAR4320101.
The article processing charges for this open-access publication were covered by the Max Planck Society.
This paper was edited by Frank Dentener and reviewed by two anonymous referees.
Appenzeller, C., Holton, J. R., and Rosenlof, K. H.: Seasonal variation of mass transport across the tropopause, Journal of Geophysical Research: Atmospheres, 101, 15071–15078, https://doi.org/10.1029/96JD00821, 1996. a
Bourgeois, I., Peischl, J., Thompson, C. R., Aikin, K. C., Campos, T., Clark, H., Commane, R., Daube, B., Diskin, G. W., Elkins, J. W., Gao, R.-S., Gaudel, A., Hintsa, E. J., Johnson, B. J., Kivi, R., McKain, K., Moore, F. L., Parrish, D. D., Querel, R., Ray, E., Sánchez, R., Sweeney, C., Tarasick, D. W., Thompson, A. M., Thouret, V., Witte, J. C., Wofsy, S. C., and Ryerson, T. B.: Global-scale distribution of ozone in the remote troposphere from the ATom and HIPPO airborne field missions, Atmos. Chem. Phys., 20, 10611–10635, https://doi.org/10.5194/acp-20-10611-2020, 2020. a, b
Bourgeois, I., Peischl, J., Neuman, J. A., Brown, S. S., Thompson, C. R., Aikin, K. C., Allen, H. M., Angot, H., Apel, E. C., Baublitz, C. B., Breweri, J. F., Campuzano-Josta, P., Commane, R., Crounse, J. D., Daube, B. C., DiGangi, J. P., Diskin, G. S., Emmons, L. K., Fiore, A. M., Gkatzelis, G. I., Hills, A., Hornbrook, R. S., Huey, L. G., Jimenez, J. L., Kim, M., Lacey, F., McKain, K., Murray, L. T., Nault, B. A., Parrish, D. D., Ray, E., Sweeney, Colmand Tanner, D., Wofsy, S. C., and Ryerson, T. B.: Large contribution of biomass burning emissions to ozone throughout the global remote troposphere, P. Natl. Acad. Sci. USA, 118, e2109628118, https://doi.org/10.1073/pnas.2109628118, 2021. a, b
Brewer, A. W.: Evidence for a world circulation provided by the measurements of helium and water vapour distribution in the stratosphere, Quarterly Journal of the Royal Meteorological Society, 75, 351–363, https://doi.org/10.1002/qj.49707532603, 1949. a
Collier, A. B. and Hughes, A. R.: Lightning and the African ITCZ, Journal of Atmospheric and Solar-Terrestrial Physics, 73, 2392–2398, https://doi.org/10.1016/j.jastp.2011.08.010, 2011a. a
Collier, A. B. and Hughes, A. R. W.: A harmonic model for the temporal variation of lightning activity over Africa, Journal of Geophysical Research: Atmospheres, 116, https://doi.org/10.1029/2010JD014455, 2011b. a, b
Crowley, J. N., Dörich, R., Eger, P., Helleis, F., Tadic, I., Fischer, H., Williams, J., Edtbauer, A., Wang, N., Holanda, B. A., Pöhlker, M., Pöschl, U., Pozzer, A., and Lelieveld, J.: Peroxy acetyl nitric anhydride (PAN) and peroxy acetic acid (PAA) over the Atlantic west of Africa during CAFE-Africa and the influence of biomass-burning, Environmental Science: Atmospheres, 5, 620–635, https://doi.org/10.1039/d5ea00006h, 2025. a
Crutzen, P. J. and Andreae, M. O.: Biomass Burning in the Tropics: Impact on Atmospheric Chemistry and Biogeochemical Cycles, Science, 250, 1669–1678, https://doi.org/10.1126/science.250.4988.1669, 1990. a
Danielsen, E. F.: Stratospheric-Tropospheric Exchange Based on Radioactivity, Ozone and Potential Vorticity, Journal of Atmospheric Sciences, 25, 502–518, https://doi.org/10.1175/1520-0469(1968)025<0502:STEBOR>2.0.CO;2, 1968. a, b
Deutsches Zentrum für Luft- und Raumfahrt (DLR): Mission: ESMVal, HALO database [data set], https://halo-db.pa.op.dlr.de/mission/14 (last access: 18 June 2024), 2012. a
Deutsches Zentrum für Luft- und Raumfahrt (DLR): Mission: OMO, HALO database [data set], https://halo-db.pa.op.dlr.de/mission/0 (last access: 18 June 2024), 2015. a
Deutsches Zentrum für Luft- und Raumfahrt (DLR): Mission: WISE, HALO database [data set], https://halo-db.pa.op.dlr.de/mission/96 (last access: 18 June 2024), 2017. a
Deutsches Zentrum für Luft- und Raumfahrt (DLR): Mission: CAFE Africa, HALO database [data set], https://halo-db.pa.op.dlr.de/mission/98 (last access: 18 June 2024), 2018. a
Deutsches Zentrum für Luft- und Raumfahrt (DLR): Mission: SouthTRAC, HALO database [data set], https://halo-db.pa.op.dlr.de/mission/116 (last access: 18 June 2024), 2019. a
Deutsches Zentrum für Luft- und Raumfahrt (DLR): Mission: CAFE Brazil, HALO database [data set], https://halo-db.pa.op.dlr.de/mission/135 (last access: 18 June 2024), 2023a. a
Deutsches Zentrum für Luft- und Raumfahrt (DLR): Mission: PHILEAS, HALO database [data set], https://halo-db.pa.op.dlr.de/mission/138 (last access: 18 June 2024), 2023b. a
Deutsches Zentrum für Luft- und Raumfahrt (DLR): Mission: CAFE Pacific, HALO database [data set], https://halo-db.pa.op.dlr.de/mission/140 (last access: 23 December 2024), 2024. a
Dobson, G. M. B.: Origin and distribution of the polyatomic molecules in the atmosphere, Proceedings of the Royal Society of London. Series A. Mathematical and Physical Sciences, 236, 187–193, https://doi.org/10.1098/rspa.1956.0127, 1956. a
Faist, J., Capasso, F., Sivco, D. L., Sirtori, C., Hutchinson, A. L., and Cho, A. Y.: Quantum cascade laser, Science, 264, 553–556, https://doi.org/10.1126/science.264.5158.553, 1994. a
Field, R. D., van der Werf, G. R., Fanin, T., Fetzer, E. J., Fuller, R., Jethva, H., Levy, R., Livesey, N. J., Luo, M., Torres, O., and Worden, H. M.: Indonesian fire activity and smoke pollution in 2015 show persistent nonlinear sensitivity to El Nino-induced drought, Proceedings of the National Academy of SCiences of the United States of America, 113, 9204–9209, https://doi.org/10.1073/pnas.1524888113, 2016. a
Fischer, H., Wienhold, F., Hoor, P., Bujok, O., Schiller, C., Siegmund, P., Ambaum, M., Scheeren, H., and Lelieveld, J.: Tracer correlations in the northern high latitude lowermost stratosphere: Influence of cross-tropopause mass exchange, Geophysical Research Letters, 27, 97–100, https://doi.org/10.1029/1999GL010879, 2000. a, b
Frey, W., Schofield, R., Hoor, P., Kunkel, D., Ravegnani, F., Ulanovsky, A., Viciani, S., D'Amato, F., and Lane, T. P.: The impact of overshooting deep convection on local transport and mixing in the tropical upper troposphere/lower stratosphere (UTLS), Atmos. Chem. Phys., 15, 6467–6486, https://doi.org/10.5194/acp-15-6467-2015, 2015. a, b
Fried, A. and Richter, D.: Infrared Absorption Spectroscopy, in: Analytical Techniques for Atmospheric Measurement, edited by: Heard, D. E., Wiley Online Library, Chichester, UK, 72–146, https://doi.org/10.1002/9780470988510.ch2, 2006. a
Galanter, M., Levy II, H., and Carmichael, G. R.: Impacts of biomass burning on tropospheric CO, NO, and O3, Journal of Geophysical Research: Atmospheres, 105, 6633–6653, https://doi.org/10.1029/1999JD901113, 2000. a
Herriott, D. R. and Schulte, H. J.: Folded Optical Delay Lines, Appl. Opt., 4, 883–889, https://doi.org/10.1364/AO.4.000883, 1965. a
Hersbach, H., Bell, B., Berrisford, P., Hirahara, S., Horanyi, A., Munoz-Sabater, J., Nicolas, J., Peubey, C., Radu, R., Schepers, D., Simmons, A., Soci, C., Abdalla, S., Abellan, X., Balsamo, G., Bechtold, P., Biavati, G., Bidlot, J., Bonavita, M., De Chiara, G., Dahlgren, P., Dee, D., Diamantakis, M., Dragani, R., Flemming, J., Forbes, R., Fuentes, M., Geer, A., Haimberger, L., Healy, S., Hogan, R. J., Holm, E., Janiskova, M., Keeley, S., Laloyaux, P., Lopez, P., Lupu, C., Radnoti, G., de Rosnay, P., Rozum, I., Vamborg, F., Villaume, S., and Thepaut, J.-N.: The ERA5 global reanalysis, Q. J. Roy. Meteor. Soc., 146, 1999–2049, 2020. a
Holton, J. R., Haynes, P. H., McIntyre, M. E., Douglass, A. R., Rood, R. B., and Pfister, L.: Stratosphere-troposphere exchange, Reviews of Geophysics, 33, 403–439, https://doi.org/10.1029/95RG02097, 1995. a, b
Hoor, P., Fischer, H., Lange, L., Lelieveld, J., and Brunner, D.: Seasonal variations of a mixing layer in the lowermost stratosphere as identified by the CO-O3 correlation from in situ measurements, Journal of Geophysical Research: Atmospheres, 107, ACL–1, https://doi.org/10.1029/2000JD000289, 2002. a, b, c, d, e
Hoor, P., Gurk, C., Brunner, D., Hegglin, M. I., Wernli, H., and Fischer, H.: Seasonality and extent of extratropical TST derived from in-situ CO measurements during SPURT, Atmos. Chem. Phys., 4, 1427–1442, https://doi.org/10.5194/acp-4-1427-2004, 2004. a, b
Jeuken, A., Siegmund, P., Heijboer, L., Feichter, J., and Bengtsson, L.: On the potential of assimilating meteorological analyses in a global climate model for the purpose of model validation, Journal of Geophysical Research: Atmospheres, 101, 16939–16950, https://doi.org/10.1029/96JD01218, 1996. a
Jing, P. and Banerjee, S.: Rossby Wave Breaking and Isentropic Stratosphere-Troposphere Exchange During 1981–2015 in the Northern Hemisphere, Journal of Geophysical Research: Atmospheres, 123, 9011–9025, https://doi.org/10.1029/2018JD028997, 2018. a
Jöckel, P., Sander, R., Kerkweg, A., Tost, H., and Lelieveld, J.: Technical Note: The Modular Earth Submodel System (MESSy) – a new approach towards Earth System Modeling, Atmos. Chem. Phys., 5, 433–444, https://doi.org/10.5194/acp-5-433-2005, 2005. a
Jöckel, P., Tost, H., Pozzer, A., Brühl, C., Buchholz, J., Ganzeveld, L., Hoor, P., Kerkweg, A., Lawrence, M. G., Sander, R., Steil, B., Stiller, G., Tanarhte, M., Taraborrelli, D., van Aardenne, J., and Lelieveld, J.: The atmospheric chemistry general circulation model ECHAM5/MESSy1: consistent simulation of ozone from the surface to the mesosphere, Atmos. Chem. Phys., 6, 5067–5104, https://doi.org/10.5194/acp-6-5067-2006, 2006. a
Jöckel, P., Kerkweg, A., Pozzer, A., Sander, R., Tost, H., Riede, H., Baumgaertner, A., Gromov, S., and Kern, B.: Development cycle 2 of the Modular Earth Submodel System (MESSy2), Geosci. Model Dev., 3, 717–752, https://doi.org/10.5194/gmd-3-717-2010, 2010. a
Jöckel, P., Tost, H., Pozzer, A., Kunze, M., Kirner, O., Brenninkmeijer, C. A. M., Brinkop, S., Cai, D. S., Dyroff, C., Eckstein, J., Frank, F., Garny, H., Gottschaldt, K.-D., Graf, P., Grewe, V., Kerkweg, A., Kern, B., Matthes, S., Mertens, M., Meul, S., Neumaier, M., Nützel, M., Oberländer-Hayn, S., Ruhnke, R., Runde, T., Sander, R., Scharffe, D., and Zahn, A.: Earth System Chemistry integrated Modelling (ESCiMo) with the Modular Earth Submodel System (MESSy) version 2.51, Geosci. Model Dev., 9, 1153–1200, https://doi.org/10.5194/gmd-9-1153-2016, 2016. a, b, c
Joppe, P., Schneider, J., Kaiser, K., Fischer, H., Hoor, P., Kunkel, D., Lachnitt, H.-C., Marsing, A., Röder, L., Schlager, H., Tomsche, L., Voigt, C., Zahn, A., and Borrmann, S.: The influence of extratropical cross-tropopause mixing on the correlation between ozone and sulfate aerosol in the lowermost stratosphere, Atmos. Chem. Phys., 24, 7499–7522, https://doi.org/10.5194/acp-24-7499-2024, 2024. a
Krasauskas, L., Ungermann, J., Preusse, P., Friedl-Vallon, F., Zahn, A., Ziereis, H., Rolf, C., Plöger, F., Konopka, P., Vogel, B., and Riese, M.: 3-D tomographic observations of Rossby wave breaking over the North Atlantic during the WISE aircraft campaign in 2017, Atmos. Chem. Phys., 21, 10249–10272, https://doi.org/10.5194/acp-21-10249-2021, 2021. a
Kunkel, D., Hoor, P., Kaluza, T., Ungermann, J., Kluschat, B., Giez, A., Lachnitt, H.-C., Kaufmann, M., and Riese, M.: Evidence of small-scale quasi-isentropic mixing in ridges of extratropical baroclinic waves, Atmos. Chem. Phys., 19, 12607–12630, https://doi.org/10.5194/acp-19-12607-2019, 2019. a
Laboratories, N. G. M. L. E. S. R.: Carbon Cycle Greenhouse Gases - GGGRN Data – CO – Cooperative Air Sampling Network, https://gml.noaa.gov/ccgg/data/co.html (last access: 12 July 2024), 1988. a
Lan, X., K. T. and Dlugokencky, E.: Trends in globally-averaged CH4, N2O, and SF6 determined from NOAA Global Monitoring Laboratory measurements, NOAA Global Monitoring Laboratory, https://doi.org/10.15138/P8XG-AA10, 2025. a
Lelieveld, J., Bregman, B., Arnold, F., Bürger, V., Crutzen, P. J., Fischer, H., Waibel, A., Siegmund, P., and van Velthoven, P. F. J.: Chemical perturbation of the lowermost stratosphere through exchange with the troposphere, Geophysical Research Letters, 24, 603–606, https://doi.org/10.1029/97GL00255, 1997. a
Lelieveld, J., Gromov, S., Pozzer, A., and Taraborrelli, D.: Global tropospheric hydroxyl distribution, budget and reactivity, Atmos. Chem. Phys., 16, 12477–12493, https://doi.org/10.5194/acp-16-12477-2016, 2016. a, b, c, d, e, f, g
Lelieveld, J., Bourtsoukidis, E., Brühl, C., Fischer, H., Fuchs, H., Harder, H., Hofzumahaus, A., Holland, F., Marno, D., Neumaier, M., Pozzer, A., Schlager, H., Williams, J., Zahn, A., and Ziereis, H.: The South Asian monsoon – pollution pump and purifier, Science, 361, 270–273, https://doi.org/10.1126/science.aar2501, 2018. a, b, c, d, e, f, g
Li, M., Kurokawa, J., Zhang, Q., Woo, J.-H., Morikawa, T., Chatani, S., Lu, Z., Song, Y., Geng, G., Hu, H., Kim, J., Cooper, O. R., and McDonald, B. C.: MIXv2: a long-term mosaic emission inventory for Asia (2010–2017), Atmos. Chem. Phys., 24, 3925–3952, https://doi.org/10.5194/acp-24-3925-2024, 2024. a, b
McCabe, D. L., Trevino, L. K., and Butterfield, K. D.: Cheating in Academic Institutions: A Decade of Research, Ethics & Behavior, 11, 219–232, https://doi.org/10.1207/S15327019EB1103_2, 2001. a
McManus, J. B., Kebabian, P. L., and Zahniser, M. S.: Astigmatic mirror multipass absorption cells for long-path-length spectroscopy, Appl. Opt., 34, 3336–3348, https://doi.org/10.1364/AO.34.003336, 1995. a
Mickley, L. J., Jacob, D. J., and Rind, D.: Uncertainty in preindustrial abundance of tropospheric ozone: Implications for radiative forcing calculations, Journal of Geophysical Research: Atmospheres, 106, 3389–3399, https://doi.org/10.1029/2000JD900594, 2001. a, b, c
Müller, S., Hoor, P., Berkes, F., Bozem, H., Klingebiel, M., Reutter, P., Smit, H., Wendisch, M., Spichtinger, P., and Borrmann, S.: In situ detection of stratosphere-troposphere exchange of cirrus particles in the midlatitudes, Geophysical Research Letters, 42, 949–955, https://doi.org/10.1002/2014GL062556, 2015. a
Müller, S., Hoor, P., Bozem, H., Gute, E., Vogel, B., Zahn, A., Bönisch, H., Keber, T., Krämer, M., Rolf, C., Riese, M., Schlager, H., and Engel, A.: Impact of the Asian monsoon on the extratropical lower stratosphere: trace gas observations during TACTS over Europe 2012, Atmos. Chem. Phys., 16, 10573–10589, https://doi.org/10.5194/acp-16-10573-2016, 2016. a, b
Murgatroyd, R. J., O'Neill, A., Massey, H. S. W., Beynon, W. J. G., Houghton, J. T., and Thomas, L.: Interaction between the troposphere and stratosphere, Philosophical Transactions of the Royal Society of London. Series A, Mathematical and Physical Sciences, 296, 87–102, https://doi.org/10.1098/rsta.1980.0158, 1980. a
Nussbaumer, C. M., Fischer, H., Lelieveld, J., and Pozzer, A.: What controls ozone sensitivity in the upper tropical troposphere?, Atmos. Chem. Phys., 23, 12651–12669, https://doi.org/10.5194/acp-23-12651-2023, 2023a. a, b, c, d
Nussbaumer, C. M., Place, B. K., Zhu, Q., Pfannerstill, E. Y., Wooldridge, P., Schulze, B. C., Arata, C., Ward, R., Bucholtz, A., Seinfeld, J. H., Goldstein, A. H., and Cohen, R. C.: Measurement report: Airborne measurements of NOx fluxes over Los Angeles during the RECAP-CA 2021 campaign, Atmos. Chem. Phys., 23, 13015–13028, https://doi.org/10.5194/acp-23-13015-2023, 2023b. a, b
Nussbaumer, C. M., Kohl, M., Pozzer, A., Tadic, I., Rohloff, R., Marno, D., Harder, H., Ziereis, H., Zahn, A., Obersteiner, F., Hofzumahaus, A., Fuchs, H., Künstler, C., Brune, W. H., Ryerson, T. B., Peischl, J., Thompson, C. R., Bourgeois, I., Lelieveld, J., and Fischer, H.: Ozone Formation Sensitivity to Precursors and Lightning in the Tropical Troposphere Based on Airborne Observations, Journal of Geophysical Research: Atmospheres, 129, e2024JD041168, https://doi.org/10.1029/2024JD041168, 2024. a, b, c, d
Nussbaumer, C. M., Pozzer, A., Hewson, M., Ort, L., Krumm, B., Byron, J., Williams, J., Joppe, P., Obersteiner, F., Zahn, A., Lelieveld, J., and Fischer, H.: Low tropospheric ozone over the Indo‐Pacific warm pool related to non‐ electrified convection, Geophysical Research Letters, 52, https://doi.org/10.1029/2024GL112788, 2025. a
Obersteiner, F.: FAIROmeta, version: v0.1.9, Zenodo [data set/code], https://doi.org/10.5281/zenodo.11275355, 2024. a, b, c, d, e, f, g
Ort, L. and Pozzer, A.: Supporting data for: Enhancement of O3 – CO ratios at tropospheric subtropical latitudes: Photochemistry and stratospheric influence, Version 1.0, Zenodo [data set], https://doi.org/10.5281/zenodo.17476643, 2025. a
Ort, L., Röder, L. L., Parchatka, U., Königstedt, R., Crowley, D., Kunz, F., Wittkowski, R., Lelieveld, J., and Fischer, H.: In-flight characterization of a compact airborne quantum cascade laser absorption spectrometer, Atmos. Meas. Tech., 17, 3553–3565, https://doi.org/10.5194/amt-17-3553-2024, 2024. a, b
Pal, M. and Pradhan, M.: Quantum Cascade Laser Spectroscopy, Modern Techniques of Spectroscopy: Basics, Instrumentation, and Applications, 363–387 pp., https://doi.org/10.1007/978-981-33-6084-6_14, 2021. a
Postel, G. A. and Hitchman, M. H.: A Case Study of Rossby Wave Breaking along the Subtropical Tropopause, Monthly Weather Review, 129, 2555–2569, https://doi.org/10.1175/1520-0493(2001)129<2555:ACSORW>2.0.CO;2, 2001. a
Prather, M. J., Zhu, X., Tang, Q., Hsu, J., and Neu, J. L.: An atmospheric chemist in search of the tropopause, Journal of Geophysical Research: Atmospheres, 116, https://doi.org/10.1029/2010JD014939, 2011. a, b, c, d, e, f
Ricciardulli, L. and Sardeshmukh, P. D.: Local Time- and Space Scales of Organized Tropical Deep Convection, Journal of Climate, 15, 2775–2790, https://doi.org/10.1175/1520-0442(2002)015<2775:LTASSO>2.0.CO;2, 2002. a
Ridley, B., Grahek, F., and Walega, J.: A small high-sensitivity, medium-response ozone detector suitable for measurements from light aircraft, Journal of Atmospheric and Oceanic Technology, 9, 142–148, https://doi.org/10.1175/1520-0426(1992)009<0142:ASHSMR>2.0.CO;2, 1992. a
Riese, M., K. M. and Hoor, P.: WISE: project description, https://www.halo.dlr.de/science/missions/wise/wise.html (last access: 15 July 2024), 2017. a
Riese, M., Hoor, P., Rolf, C., et al.: Long-range transport of polluted Asian summer monsoon air to high latitudes during the PHILEAS campaign in the boreal summer 2023, Bulletin of the American Meteorological Society, BAMS–D–24–0232.1, https://doi.org/10.1175/BAMS-D-24-0232.1, 2025. a
Righi, M., Eyring, V., Gottschaldt, K.-D., Klinger, C., Frank, F., Jöckel, P., and Cionni, I.: Quantitative evaluation of ozone and selected climate parameters in a set of EMAC simulations, Geosci. Model Dev., 8, 733–768, https://doi.org/10.5194/gmd-8-733-2015, 2015. a
Robinson, G. D.: The transport of minor atmospheric constituents between troposphere and stratosphere, Quarterly Journal of the Royal Meteorological Society, 106, 227–253, https://doi.org/10.1002/qj.49710644802, 1980. a
Röder, L. L., Ort, L., Lelieveld, J., and Fischer, H.: Quantitative analysis of temporal stability and instrument performance during field experiments of an airborne QCLAS via Allan–Werle-plots, Applied Physics B, 130, 118, https://doi.org/10.1007/s00340-024-08254-5, 2024. a
Roeckner, E., Brokopf, R., Esch, M., Giorgetta, M., Hagemann, S., Kornblueh, L., Manzini, E., Schlese, U., and Schulzweida, U.: Sensitivity of simulated climate to horizontal and vertical resolution in the ECHAM5 atmosphere model, Journal of Climate, 19, 3771–3791, https://doi.org/10.1175/JCLI3824.1, 2006. a
Rolf, C., Afchine, A., Bozem, H., Buchholz, B., Ebert, V., Guggenmoser, T., Hoor, P., Konopka, P., Kretschmer, E., Müller, S., Schlager, H., Spelten, N., Sumińska-Ebersoldt, O., Ungermann, J., Zahn, A., and Krämer, M.: Transport of Antarctic stratospheric strongly dehydrated air into the troposphere observed during the HALO-ESMVal campaign 2012, Atmos. Chem. Phys., 15, 9143–9158, https://doi.org/10.5194/acp-15-9143-2015, 2015. a
Rycroft, M., Israelsson, S., and Price, C.: The global atmospheric electric circuit, solar activity and climate change, Journal of Atmospheric and Solar-Terrestrial Physics, 62, 1563–1576, https://doi.org/10.1016/S1364-6826(00)00112-7, 2000. a
Santoni, G. W., Daube, B. C., Kort, E. A., Jiménez, R., Park, S., Pittman, J. V., Gottlieb, E., Xiang, B., Zahniser, M. S., Nelson, D. D., McManus, J. B., Peischl, J., Ryerson, T. B., Holloway, J. S., Andrews, A. E., Sweeney, C., Hall, B., Hintsa, E. J., Moore, F. L., Elkins, J. W., Hurst, D. F., Stephens, B. B., Bent, J., and Wofsy, S. C.: Evaluation of the airborne quantum cascade laser spectrometer (QCLS) measurements of the carbon and greenhouse gas suite – CO2, CH4, N2O, and CO – during the CalNex and HIPPO campaigns, Atmos. Meas. Tech., 7, 1509–1526, https://doi.org/10.5194/amt-7-1509-2014, 2014. a
Schiller, C., Bozem, H., Gurk, C., Parchatka, U., Königstedt, R., Harris, G., Lelieveld, J., and Fischer, H.: Applications of quantum cascade lasers for sensitive trace gas measurements of CO, CH4, N2O and HCHO, Applied Physics B, 92, 419–430, https://doi.org/10.1007/s00340-008-3125-0, 2008. a, b
Schumann, U. and Huntrieser, H.: The global lightning-induced nitrogen oxides source, Atmos. Chem. Phys., 7, 3823–3907, https://doi.org/10.5194/acp-7-3823-2007, 2007. a, b, c, d, e
Seinfeld, J. H. and Pandis, S. N.: Atmospheric chemistry and physics: from air pollution to climate change, John Wiley & Sons, 3rd edn., ISBN: 978-1-118-94740-1, 2016. a, b, c, d, e
Singh, H. B.: Composition, chemistry, and climate of the atmosphere, Van Nostrand Reinhold New York, ISBN 0-442-01264-0, 1995. a
Sprenger, M. and Wernli, H.: A northern hemispheric climatology of cross-tropopause exchange for the ERA15 time period (1979–1993), Journal of Geophysical Research: Atmospheres, 108, https://doi.org/10.1029/2002JD002636, 2003. a, b, c
Staley, D. O.: On the Mechanism of Mass and Radioactivity Transport from Stratosphere to Troposphere, Journal of Atmospheric Sciences, 19, 450–467, https://doi.org/10.1175/1520-0469(1962)019<0450:OTMOMA>2.0.CO;2, 1962. a
Strode, S. A., Liu, J., Lait, L., Commane, R., Daube, B., Wofsy, S., Conaty, A., Newman, P., and Prather, M.: Forecasting carbon monoxide on a global scale for the ATom-1 aircraft mission: insights from airborne and satellite observations and modeling, Atmos. Chem. Phys., 18, 10955–10971, https://doi.org/10.5194/acp-18-10955-2018, 2018. a, b
Sumner, A. L., Shepson, P. B., Couch, T. L., Thornberry, T., Carroll, M. A., Sillman, S., Pippin, M., Bertman, S., Tan, D., Faloona, I., Brune, W., Young, V., Cooper, O., Moody, J., and Stockwell, W.: A study of formaldehyde chemistry above a forest canopy, Journal of Geophysical Research: Atmospheres, 106, 24387–24405, https://doi.org/10.1029/2000JD900761, 2001. a
Szopa, S., Naik, V., Adhikary, B., Artaxo, P., Berntsen, T., Collins, W. D., Fuzzi, S., Gallardo, L., Kiendler-Scharr, A., Klimont, Z., Liao, H., Unger, N., and Zanis, P.: Short-Lived Climate Forcers (Chapter 6), in: IPCC 2021: Climate Change 2021: The Physical Science Basis. Contribution of Working Group I to the Sixth Assessment Report of the Intergovernmental Panel on Climate Change, edited by: Masson-Delmotte, V., Zhai, P., Pirani, A., Connors, S., Péan, C., Berger, S., Caud, N., Chen, Y., Goldfarb, L., Gomis, M., Huang, M., Leitzell, K., Lonnoy, E., Matthews, J., Maycock, T., Waterfield, T., Yelekçi, K., Yu, R., and Zhu, B., 817–922 pp., Cambridge University Press, Cambridge, United Kingdom and New York, NY, USA, https://doi.org/10.1017/9781009157896.008, 2021. a
Tadic, I., Parchatka, U., Königstedt, R., and Fischer, H.: In-flight stability of quantum cascade laser-based infrared absorption spectroscopy measurements of atmospheric carbon monoxide, Applied Physics B, 123, 1–9, https://doi.org/10.1007/s00340-017-6721-z, 2017. a, b
Tadic, I., Nussbaumer, C. M., Bohn, B., Harder, H., Marno, D., Martinez, M., Obersteiner, F., Parchatka, U., Pozzer, A., Rohloff, R., Zöger, M., Lelieveld, J., and Fischer, H.: Central role of nitric oxide in ozone production in the upper tropical troposphere over the Atlantic Ocean and western Africa, Atmos. Chem. Phys., 21, 8195–8211, https://doi.org/10.5194/acp-21-8195-2021, 2021. a
Tarasick, D., Galbally, I. E., Cooper, O. R., Schultz, M. G., Ancellet, G., Leblanc, T., Wallington, T. J., Ziemke, J., Liu, X., Steinbacher, M., Staehelin, J., Vigouroux, C., Hannigan, J. W., García, O., Foret, G., Zanis, P., Weatherhead, E., Petropavlovskikh, I., Worden, H., Osman, M., Liu, J., Chang, K.-L., Gaudel, A., Lin, M., Granados-Muñoz, M., Thompson, A. M., Oltmans, S. J., Cuesta, J., Dufour, G., Thouret, V., Hassler, B., Trickl, T., and Neu, J. L.: Tropospheric Ozone Assessment Report: Tropospheric ozone from 1877 to 2016, observed levels, trends and uncertainties, Elementa: Science of the Anthropocene, 7, 39, https://doi.org/10.1525/elementa.376, 2019. a
Thompson, C. R., Wofsy, S. C., Prather, M. J., et al.: The NASA Atmospheric Tomography (ATom) mission: Imaging the chemistry of the global atmosphere, Bulletin of the American Meteorological Society, 103, E761–E790, https://doi.org/10.1175/BAMS-D-20-0315.1, 2022. a
Toby, S.: Chemiluminescence in the reactions of ozone, Chemical Reviews, 84, 277–285, https://doi.org/10.1021/cr00061a003, 1984. a
Tomsche, L., Pozzer, A., Ojha, N., Parchatka, U., Lelieveld, J., and Fischer, H.: Upper tropospheric CH4 and CO affected by the South Asian summer monsoon during the Oxidation Mechanism Observations mission, Atmos. Chem. Phys., 19, 1915–1939, https://doi.org/10.5194/acp-19-1915-2019, 2019. a, b, c
Škerlak, B., Sprenger, M., and Wernli, H.: A global climatology of stratosphere–troposphere exchange using the ERA-Interim data set from 1979 to 2011, Atmos. Chem. Phys., 14, 913–937, https://doi.org/10.5194/acp-14-913-2014, 2014. a, b, c
Waliser, D. E. and Somerville, R. C.: Preferred latitudes of the intertropical convergence zone, Journal of Atmospheric Sciences, 51, 1619–1639, https://doi.org/10.1175/1520-0469(1994)051<1619:PLOTIC>2.0.CO;2, 1994. a
Wesely, M. and Hicks, B.: A review of the current status of knowledge on dry deposition, Atmospheric Environment, 34, 2261–2282, https://doi.org/10.1016/S1352-2310(99)00467-7, 2000. a
White, J. U.: Optical system providing a long optical path, uS Patent 2,779,230, https://patents.google.com/patent/US2779230A (last access: 24 June 2024), 1957. a
Wienhold, F., Fischer, H., Hoor, P., Wagner, V., Königstedt, R., Harris, G., Anders, J., Grisar, R., Knothe, M., Riedel, W., Liibken, F.-J., and Schilling, T.: TRISTAR-A tracer in-situ TDLAS for atmospheric research, Applied Physics B, 67, 411–417, https://doi.org/10.1007/s003400050524, 1998. a
Williams, E. and Stanfill, S.: The physical origin of the land–ocean contrast in lightning activity, Comptes Rendus Physique, 3, 1277–1292, https://doi.org/10.1016/S1631-0705(02)01407-X, 2002. a
Williams, E., Rosenfeld, D., Madden, N., Gerlach, J., Gears, N., Atkinson, L., Dunnemann, N., Frostrom, G., Antonio, M., Biazon, B., Camargo, R., Franca, H., Gomes, A., Lima, M., Machado, R., Manhaes, S., Nachtigall, L., Piva, H., Quintiliano, W., Machado, L., Artaxo, P., Roberts, G., Renno, N., Blakeslee, R., Bailey, J., Boccippio, D., Betts, A., Wolff, D., Roy, B., Halverson, J., Rickenbach, T., Fuentes, J., and Avelino, E.: Contrasting convective regimes over the Amazon: Implications for cloud electrification, Journal of Geophysical Research: Atmospheres, 107, LBA 50-1–LBA 50-19, https://doi.org/10.1029/2001JD000380, 2002. a
Williams, E. R.: Large-scale charge separation in thunderclouds, Journal of Geophysical Research: Atmospheres, 90, 6013–6025, https://doi.org/10.1029/JD090iD04p06013, 1985. a
Wofsy, S. C., Afshar, S., Allen, H. M., Apel, E. C., Asher, E. C., Barletta, B., Bent, J., Bian, H., Biggs, B. C., Blake, D. R., Blake, N., Bourgeois, I., Brock, C. A., Brune, W. H., Budney, J. W., Bui, T. P., Butler, A., Campuzano-Jost, P., Chang, C. S., Chin, M., Commane, R., Correa, G., Crounse, J. D., Cullis, P. D., Daube, B. C., Day, D. A., Dean-Day, J. M., Dibb, J. E., DiGangi, J. P., Diskin, G. S., Dollner, M., Elkins, J. W., Erdesz, F., Fiore, A. M., Flynn, C. M., Froyd, K. D., Gesler, D. W., Hall, S. R., Hanisco, T. F., Hannun, R. A., Hills, A. J., Hintsa, E. J., Hoffman, A., Hornbrook, R. S., Huey, L. G., Hughes, S., Jimenez, J. L., Johnson, B. J., Katich, J. M., Keeling, R. F., Kim, M. J., Kupc, A., Lait, L. R., Lamarque, J.-F., Liu, J., McKain, K., McLaughlin, R. J., Meinardi, S., Miller, D. O., Montzka, S. A., Moore, F. L., Morgan, E. J., Murphy, D. M., Murray, L. T., Nault, B. A., Neuman, J. A., Newman, P. A., Nicely, J. M., Pan, X., Paplawsky, W., Peischl, J., Prather, M. J., Price, D. J., Ray, E., Reeves, J. M., Richardson, M., Rollins, A. W., Rosenlof, K. H., Ryerson, T. B., Scheuer, E., Schill, G. P., Schroder, J. C., Schwarz, J. P., St. Clair, J. M., Steenrod, S. D., Stephens, B. B., Strode, S. A., Sweeney, C., Tanner, D., Teng, A. P., Thames, A. B., Thompson, C. R., Ullmann, K., Veres, P. R., Vieznor, N., Wagner, N. L., Watt, A., Weber, R., Weinzierl, B., Wennberg, P. O., Williamson, C. J., Wilson, J. C., Wolfe, G. M., Woods, C. T., and Zeng, L. H.: ATom: Merged Atmospheric Chemistry, Trace Gases, and Aerosols, ORNL DAAC [data set], https://doi.org/10.3334/ORNLDAAC/1581, 2018. a, b
Zahn, A., Weppner, J., Widmann, H., Schlote-Holubek, K., Burger, B., Kühner, T., and Franke, H.: A fast and precise chemiluminescence ozone detector for eddy flux and airborne application, Atmos. Meas. Tech., 5, 363–375, https://doi.org/10.5194/amt-5-363-2012, 2012. a, b, c, d
Zipser, E. J., Cecil, D. J., Liu, C., Nesbitt, S. W., and Yorty, D. P.: WHERE ARE THE MOST INTENSE THUNDERSTORMS ON EARTH?, Bulletin of the American Meteorological Society, 87, 1057–1072, https://doi.org/10.1175/BAMS-87-8-1057, 2006. a