the Creative Commons Attribution 4.0 License.
the Creative Commons Attribution 4.0 License.
 | 06 Nov 2025
Distinct aerosol populations and their vertical gradients in central Amazonia revealed by optical properties and cluster analysis
Bruno B. Meller
Marco A. Franco
Luciana V. Rizzo
Luiz A. T. Machado
Sebastian Brill
Bruna A. Holanda
Leslie A. Kremper
Subha S. Raj
Samara Carbone
Cléo Q. Dias-Júnior
Fernando G. Morais
Meinrat O. Andreae
Ulrich Pöschl
Christopher Pöhlker
Paulo Artaxo
In central Amazonia, aerosol sources, weather, and chemical processes create a highly variable aerosol population. The aerosols' optical properties, shaped by composition and size, determine sunlight interaction and the regional radiation budget. Previous studies observed differences in the particles' physical properties during smoke events and described their vertical gradients during clean periods. However, a complete characterization of these properties at two height levels considering both seasons is still missing. This study connects aerosol optical measurements from the Amazon Tall Tower Observatory (ATTO), at 60 and 325 m heights, to particle composition and sources, characterizing different aerosol populations, assessing their vertical gradients, and associating them with the influence of various emission sources and atmospheric processes. A seasonally segregated clustering method was applied to five years of optical data (2018–2023), allowing for the identification of periods with low biomass-burning impact, long-range transport (LRT) events, and regional pollution episodes. Aerosols from Saharan dust events showed the highest real and imaginary refractive index, along with a large inorganic mass fraction (around 26 %), which differs from typical Amazonian conditions. Furthermore, regional biomass-burning emissions during the dry season promoted elevated fine-mode particle concentrations (median 2250 cm−3), dominated by absorbing carbonaceous material. These particles also showed the maximum mass scattering efficiency, which was consistently higher at the 60 m height, underscoring the importance of vertical transport and aerosol aging processes. These results indicate that the clustering method can discriminate between aerosol populations and elucidate differences between particles of different sources and processes influencing the Amazonian atmosphere.
- Article
(2781 KB) - Full-text XML
-
Supplement
(6372 KB) - BibTeX
- EndNote


Globally, aerosols are critical in influencing human health and climate dynamics. The aerosol optical properties determine the direct interactions between the particles in the atmosphere and the incoming solar radiation, and are a result of the particles' shape, composition and size. Reflection, absorption, and scattering of solar radiation by atmospheric aerosol particles directly and indirectly affect the global radiative forcing (Boucher, 2015). On average, the net direct effect is to reduce the amount of radiation reaching the surface, effectively cooling the planet (Bellouin et al., 2020), although some aerosols can absorb radiation and locally heat the atmosphere. Aerosols also modify atmospheric instability and consequently play an essential role in the water cycle through influences in the formation, development, and life cycle of clouds (Rosenfeld et al., 2008; Nascimento et al., 2021). In addition, the presence of scattering particles in the atmosphere can also have ecosystem impacts in forests by increasing the photosynthetic activity of plants, as the leaves more effectively absorb diffuse radiation than direct radiation (Cirino et al., 2014), although evapotranspiration is critically affected by high aerosol loads (Palácios et al., 2024).
Aerosol particles in the Amazon region can have a wide range of sources (Artaxo et al., 2013). Primary emissions from biogenic sources within the forest comprise most of the coarse mode particles in the atmosphere during the wet season (Artaxo et al., 1988; Pöschl et al., 2010; Huffman et al., 2012), but are also frequently found in the fine mode (Pöhlker et al., 2012, 2016; Machado et al., 2021; Franco et al., 2022). Most of the mass of fine mode particles, however, is comprised of secondary organic aerosols (SOA), formed by the oxidation products of volatile organic compounds (VOCs) such as isoprene and monoterpenes, emitted by the vegetation (Chen et al., 2015; Yáñez Serrano et al., 2015, 2018; Machado et al., 2024b). With median aerosol concentrations as low as 220 cm−3 in the fine mode (Varanda Rizzo et al., 2018; Franco et al., 2022), the wet season period frequently presents pristine-like atmospheric conditions, with virtually undetectable human footprint in the aerosols at central Amazonia, particularly during the rainiest months (April and May; Pöhlker et al., 2016, 2018).
In contrast, anthropogenic contributions such as biomass-burning particles are increasingly significant during the dry season (Liu et al., 2020; Artaxo et al., 2022). Long-range transport (LRT) events happen throughout the year, bringing a mixture of Saharan dust (mainly from December to April; Talbot et al., 1990; Moran-Zuloaga et al., 2018), African biomass-burning particles, and marine aerosols to Amazonia (Pöhlker et al., 2019; Holanda et al., 2020). Furthermore, convective events such as downdrafts, mainly during the wet season, transport air masses from higher altitudes in the atmosphere to within the boundary layer, contributing to the aerosol population at lower levels (Wang et al., 2016a; Andreae et al., 2018). Previous studies found that downdraft events, largely associated with precipitation (Machado et al., 2021), are frequently accompanied by a sudden increase in the concentration of ultrafine particles, with diameters smaller than 50 nm, which undergo growth processes (Franco et al., 2022) such as photo-chemical reactions and deposition over existing particles, eventually reaching optically active sizes and influencing climate by scattering radiation and acting as cloud condensation nuclei (Pöhlker et al., 2016).
This variety of aerosol particle sources in central Amazonia has been thoroughly studied recently, as the particulate matter's climate effects might differ depending on their physical and chemical properties (Palácios et al., 2020), which rely on their origin and atmospheric processing. Previous studies have shown that the contribution of biomass-burning particles from Africa to the absorption of radiation by aerosols in central Amazonia is significant, playing a major role during the beginning of the dry season (mainly August and September; Saturno et al., 2018; Holanda et al., 2020), and most biomass-burning aerosols are comprised of a mixture of fresh particles from South American fires and aged particles from LRT (Holanda et al., 2023). In addition, the influence of El Niño events on the dry season precipitation regime is significant, increasing the probability and severity of droughts and the activity of fires (Alencar et al., 2006), as recently observed for 2024 (Marengo et al., 2024).
The spectral dependence of the intensive aerosol optical properties (e.g., the absorption and scattering Ångström exponents) provide hints at the aerosol populations' composition and size distribution. The absorption Ångström exponent (AAE) relates to the nature of the absorbing particles (Russell et al., 2010; Rizzo et al., 2011; Lack and Langridge, 2013; Szopa et al., 2021), as values close to 1.0 indicate that the absorption comes mainly from black carbon (BC) particles from fossil fuel and biomass burning, although the BC core size and coating thickness also affect the AAE value for these particles (Wang et al., 2016b). In contrast, higher AAE values are related to the presence of other absorbing compounds, either organic, such as brown carbon (Andreae and Gelencsér, 2006), or inorganic, such as mineral dust. Similarly, the scattering Ångström exponent (SAE) is associated with the size distribution of the aerosols, with higher values indicating the predominance of smaller particles belonging to the fine mode. In contrast, lower values indicate a strong presence of coarse mode particles (Schuster et al., 2006).
Other intensive optical properties, such as the refractive index, the mass scattering efficiency (MSE), and the single scattering albedo (SSA), provide information about the intensity and the nature of the particle-light interactions in the atmosphere, shedding light on the lifetime, coating state, and origin of the aerosol particles. Biomass-burning particles in the Amazon are known to be highly absorbing, with a higher imaginary part of the refractive index, despite showing similar real parts to the background population observed in the region (between 1.3 and 1.5), related to scattering (Martins et al., 1998; Guyon et al., 2003; Reid et al., 2005; Rizzo et al., 2013; Franco et al., 2025). Similarly, the SSA is usually higher in the cleanest periods of the wet season, when biogenic aerosols prevail. Moreover, aerosol MSE has yet to be thoroughly studied in Amazonia since only a few studies have evaluated this property. Measurements in the southern region of the forest (Chand et al., 2006; Rizzo et al., 2013; Ponczek et al., 2022) showed values between 4.8 and 5.0 m2 g−1 at 545 nm, while Franco et al. (2024) obtained slightly higher values during clean wet season conditions (5.49 ± 0.11 m2 g−1), but with a pronounced vertical gradient, decreasing with height. The chemical composition and aging stages of particles significantly affect these values (Hand and Malm, 2007), reinforcing the need for studying the variations, seasonality, and vertical gradient of the aerosol optical properties in Amazonia.
Previous studies have examined the aerosol sources in central Amazonia, at the 325 m tall Amazon Tall Tower Observatory (ATTO), using BC core size distributions to isolate the contributions from South American and African biomass-burning (BB) particles (Holanda et al., 2023). Aerosols from different sources have distinct size distributions and compositions, with these characteristics impacting the radiative properties as discussed above. Therefore, their optical properties could also be used to identify and classify aerosol populations, evaluating their sources and the action of atmospheric processes. This study introduces a novel method for distinguishing aerosol populations in central Amazonia by integrating optical properties and aerosol composition, along with an analysis of the seasonal variations in the vertical gradients of optical and chemical characteristics. This was achieved considering simultaneous measurements at the ATTO site from 60 and 325 m heights. Additionally, this classification allows for a comprehensive characterization of the physical and chemical properties of these particles. Understanding aerosol sources, transport mechanisms, and their representation in models is crucial for improving climate predictions in the Amazon.
2.1 The Amazon Tall Tower Observatory
A variety of measurements are used in this study, mainly performed at the Amazon Tall Tower Observatory (ATTO). The site is located in central Amazonia ( S, W, 150 m a.s.l.), about 150 km northeast of Manaus, the largest nearby city, with over 2 million inhabitants. Surrounded by a nearly pristine forest with an average canopy height of 35 m (Lang et al., 2023), the ATTO site is ideal for studying biosphere-atmosphere interactions in a tropical ecosystem. Atmospheric measurements are performed at two 80 m high towers, one equipped with an aerosol inlet positioned at a height of 60 m, and at the ATTO tower, which is 325 m tall, allowing an assessment of the atmospheric composition at multiple height levels above the canopy. All instruments are located in containers at the base of the towers, where temperature and humidity are controlled, and operate with a 2.5 µm cutoff size, encompassing the fine mode and part of the coarse mode particles. Additional information on the ATTO site can be found elsewhere (Andreae et al., 2015).
2.2 Instrumentation and data treatment
In this study, the measurements at the ATTO site were performed by numerous instruments, continuously sampling air from heights of 60 and 325 m between May 2018 and December 2023, in 30 min averages. The period from March to November 2020 was excluded from the dataset due to a lack of maintenance on-site and calibrations of the instruments caused by the COVID-19 pandemic.
2.2.1 Aerosol optical properties
The aerosol optical properties were evaluated using multiple instruments. At both heights (60 and 325 m), nephelometers (Aurora Ecotech 3000) measure the light scattering component at three wavelengths in the visible spectrum (450, 525, and 635 nm). The nephelometers require frequent calibrations, performed during the considered period. The measurements were normalized to standard temperature and pressure (STP) conditions (273.15 K and 1013.25 hPa), and truncation corrections followed the standard procedure for this instrument (Müller et al., 2011). Two Multi-Angle Absorption Photometers (MAAPs) and two aethalometers (Magee Scientific AE33) measured the absorption coefficient, one for each height. The MAAP is the reference instrument for equivalent black carbon (eBC) estimations, measuring at 637 nm, with an average absorption efficiency of 11.4 m2 g−1 during the wet season and 12.3 m2 g−1 during the dry season, both values derived by Saturno et al. (2018) for the ATTO site. The aethalometers operate at seven wavelengths (370, 470, 520, 590, 660, 880, and 950 nm). The measurements were standardized for STP conditions, and the aethalometers were corrected following the procedure in Saturno et al. (2018). A validation analysis for the absorption coefficients measured at ATTO can be found in Franco et al. (2024), where it has been found that, after corrections, the MAAP and AE33 measurements at the same height are within their respective uncertainties when interpolated to the same wavelength.
The optical measurements also allow for the estimation of some intensive properties. The single scattering albedo (SSA) was calculated with Eq. (1), where σscat,λ and σabs,λ are the scattering and absorption coefficients measured at a particular wavelength. In this study, we chose to calculate the SSA at 637 nm, which required extrapolation of the nephelometer measurements to this wavelength.
Furthermore, the scattering and absorption Ångström exponents (SAE and AAE, respectively) were calculated by fitting the log-linear function shown in Eq. (2) to the measured coefficients, where σ(λ) is either the scattering or absorption coefficient as a function of the wavelength λ, and åmean is the mean Ångström exponent.
In addition, the aerosol refractive indices (real and imaginary parts) were obtained following the methodology described by Franco et al. (2024). Lastly, the black and brown carbon (BC and BrC, respectively) components of the absorption coefficients were obtained following Wang et al. (2016b). Previous studies have already performed similar analyses for the Amazon region (Ponczek et al., 2022; Morais et al., 2022) and specifically for the ATTO site as well (Saturno et al., 2018; Franco et al., 2024).
2.2.2 Aerosol size distributions
The particle number size distributions (PNSDs) were measured at both heights with two Scanning Mobility Particle Sizers (SMPSs), TSI model 3082, coupled with Condensation Particle Counters (CPCs), TSI model 3772. These instruments operate solely on the fine mode, measuring size distributions for particles from 10 to 400 nm in diameter. The measurements were corrected for STP conditions and transmission losses due to dry deposition on the inlet lines, which is significant for particles smaller than 50 nm. The transmission efficiency curve was explicitly obtained for the inlet line geometry (Von der Weiden et al., 2009), and further details can be found in Holanda et al. (2023) and Franco et al. (2024). The aerosol number concentration for each size mode is achieved by integrating the PNSDs for each size range, while the fine mode volume is calculated assuming spherical particles (Seinfeld and Pandis, 2012). The determination of the modes' mean geometric diameter (Dg) was achieved by fitting a sum of three log-normal distributions to the PNSDs, similar to Franco et al. (2022), representing the Sub-50 nm, Aitken, and accumulation modes. In all cases, the multi-modal fitting was satisfactory and the sum of the three modes well represented the PNSDs. The accumulation mode range was defined as particles with diameters between 100 and 400 nm, the Aitken mode spans from 50 to 100 nm, and the Sub-50 nm mode accounts for the particles between 10 and 50 nm in diameter. Furthermore, in this study, the coarse mode was defined as comprising the particles with diameters larger than 1 µm.
2.2.3 Aerosol chemical composition
The aerosol fine-mode composition was measured at 60 and 325 m heights using two Aerosol Chemical Speciation Monitors (ACSMs) with quadrupole detectors. These instruments can detect the aerosol components evaporated at about 600 °C, including organic compounds, nitrate, sulfate, ammonium, and chloride, and excluding refractive species such as minerals and soot. The data processing was performed with the ACSM local v. 1.6.1.7 toolkit within Igor Pro version 6.37. The bulk aerosol composition was determined using the fragmentation table according to Allan et al. (2004) and Canagaratna et al. (2015), which reports bulk sulfate and does not resolve individual species (e.g., H2SO4, NH4HSO4, (NH4)2SO4). Given that sulfate typically accounts for < 5 %–15 % of PM1 mass at ATTO (Chen et al., 2009; Artaxo et al., 2022), this simplification has a negligible impact on the bulk density estimates. All measurements were standardized to STP conditions, and furthermore, two primary corrections were applied: the dependent ion transmission calibration and the normalization by the N signal, which corrects for the system's changing sensitivity and external variations, such as the air pressure. Calibrations were performed occasionally with ammonium nitrate and ammonium sulfate particles with 300 nm mobility diameter as described in Ng et al. (2011).
In addition, the aerosol concentration data was corrected by a collection efficiency (CE) to account for particle bouncing and other minor effects (Docherty et al., 2013). The typical method of calculating a composition-dependent CE (Middlebrook et al., 2012), which relies on the ammonium concentration, could not be applied to our dataset because the ammonium signals were often too low and noisy, frequently falling below the instrument's detection limit. Our approach was based on Heikkinen et al. (2020), which addresses infrequent calibrations and unknown CE by applying an average of the calibrations and a final varying correction based on an effective CE (eCE). The eCE corrects the changing instrument response over time and addresses the correction for the bouncing effect.
The eCE was calculated as a four-month moving median ratio between the ACSM aerosol mass concentrations and the difference between the mass estimates obtained from the SMPS and the eBC measurements. The SMPS-derived mass concentration was calculated by multiplying the volume concentration, assuming spherical particles, by the average aerosol density at the site. The ACSM aerosol composition was used to estimate aerosol density, with the following densities for the species: g cm−3, g cm−3, ρBC=1.8 g cm−3, and ρOrg calculated based on Kuwata et al. (2012). The resulting median ± standard deviation values of ρOrg, based on daily calculations, were 1.53±0.11 g cm−3 at 60 m and 1.65±0.07 g cm−3 at 325 m.
Figure S1 in the Supplement shows that the eCE consistently decreased over time at both heights, which implies that a single average calibration value applied for five years would not accurately represent the ACSM sensitivity changes throughout the entire period. Lastly, Figure S1b–c shows that the scatter and linear regression between ACSM daily concentrations and SMPS-derived daily concentrations minus eBC indicate that the methodology could accurately represent ACSM aerosol concentrations at both heights.
2.2.4 Complementary measurements and data coverage
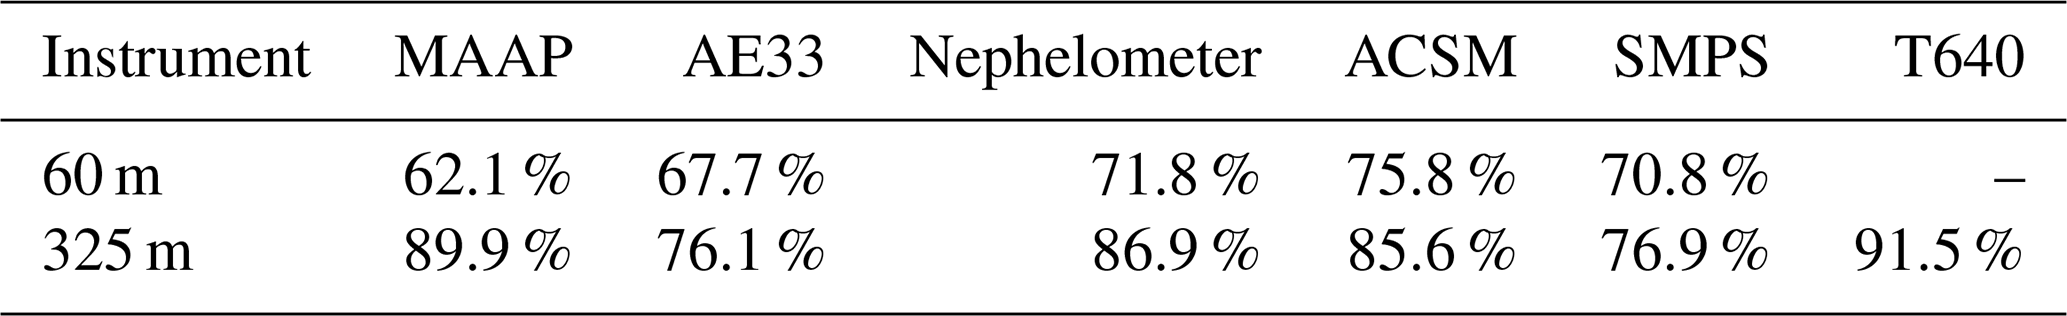
Meteorological parameters, such as air temperature (T), precipitation (PATTO) and relative humidity (RH), are measured at the ATTO site with a compact weather station (Lufft, WS600-LMB) installed at 324 m, close to the aerosol inlet height. Furthermore, the PM2.5 mass has been measured at 325 m since December 2021 using a T640 monitor (Teledyne API Inc.) that evaluates the aerosol mass based on scattered light spectrometry. Data coverage was satisfactory throughout the analyzed period for all instruments at both 60 and 325 m heights, as summarized in Table 1. Each instrument's data coverage is shown as monthly averages in Fig. S2.
Table 1Data coverage by all instruments used in this study during their respective analyzed periods, at different heights above ground at the ATTO site.
2.3 Season definitions
In this study, the definitions of the wet and dry seasons are a vital part of the methodology. In the literature, the usual definitions for the seasons at ATTO were defined by Pöhlker et al. (2016), with the wet season comprising the months of February to May, while the dry season spans from August to November. However, as the changes in the ENSO phase and other large-scale systems affect the precipitation regimes in the Amazon, the best description of the atmosphere allows for variable start and end dates for the seasons. The present study solely divides the year into two sections based on the aerosol concentrations, without transitional periods. Thus, the transitional periods can also be characterized as showing wet and dry season conditions based on the aerosol concentrations found during December, January, June, and July. For this purpose, the number concentration of accumulation mode particles at 325 m was chosen as the primary indicator of a change in the atmospheric patterns related to wet and dry seasons. This choice of indicator variable is based on the scavenging and deposition of accumulation mode particles during rainfall. This is much more common during the wet season, which means that the average number concentration of accumulation mode particles should steadily increase at the beginning of the dry season.
The choice of the 325 m height data was based on the better representation of the larger scale of the atmosphere at this height, whilst the 60 m measurements are more indicative of local processes within the canopy. Here, the transition dates were defined by the 1-week moving mean of the accumulation mode number concentration and a threshold determined by the 90th percentile of this variable during the fixed wet season (February to May). Once the moving mean becomes larger than the threshold and does not return to lower values, the dry season starts, and when it falls below the threshold without surpassing it again, the wet season starts. This method proved quite effective, as the 90th percentile threshold avoids ambiguity since the moving mean does not cross this value many times during the transition period, and the obtained transition dates roughly divide the year into two seasons of similar duration, as shown in Fig. S3. There was slight variation among the years, with the dry season beginning usually in early June and the wet season starting in early December. The large-scale ENSO events had some impact, as the dry season of 2023 (a strong El Niño year) was the longest, starting in late May and ending only in late December.
2.4 Clustering procedure
A cluster analysis procedure was performed to distinguish periods with similar aerosol optical properties associated with different particle sources and atmospheric processes. This analysis consists of grouping data points that show similar values of independent variables. For this study, the chosen clustering variables were the scattering and absorption Ångström exponents, and the eBC concentration, all measured at the 325 m height. These variables are not directly correlated, as both SAE and AAE are intensive properties and come from independent measurements of separate aspects of particle-radiation interactions, while the eBC concentration evaluates the amount of pollution in the atmosphere. This variable choice was motivated by the Ångström matrix, which is a well-known method of separating possible particle populations based on intensive properties, as well as the availability of measurements of the aerosol particles' optical properties. The choice of the 325 m measurements was based on a desire to represent a larger footprint area and larger-scale atmospheric conditions, whereas the ones from 60 m are more affected by local canopy processes and the nocturnal boundary layer. To minimize the influence of outliers, the data were organized into 3 h averages, similarly to Holanda et al. (2023), before applying the cluster algorithms and manually verified for occasional instrument failures. After these procedures, the final dataset consisted of over 10 000 samples, equivalent to 3.5 years of measurements, between May 2018 and December 2023.
There are many different clustering methods, each more suited to different applications and objectives within the algorithm, the data, or the clusters themselves (Govender and Sivakumar, 2020). This study employed the k-means algorithm, which performed the best on commonly used tools to evaluate cluster assignments (Aliaga et al., 2025), and more details about the algorithm itself can be found elsewhere (MacQueen, 1967; Li et al., 2022). Here, the sample set consists of arrays of the three predictor variables (SAE, AAE and eBC), which have been normalized through a Z-score calculation. This normalization is necessary for the k-means algorithm to make all variables equivalent, as they have different distributions and units.
Although the k-means clustering method can be applied simultaneously to the entire dataset, the main processes and drivers of aerosol population changes differ between the wet and dry seasons. Therefore, the dataset was first divided between wet and dry seasons, and the clustering process was performed separately for the two periods before naming the clusters. Furthermore, despite the need for variable equivalency within the algorithm, the best description of an aerosol population might not consider all variables equally. Although the eBC concentration directly measures the amount of pollution in the atmosphere, both the AAE and SAE are indirectly related to aerosol composition and size distribution, respectively. Weights were then attributed to each variable in each season before applying the k-means algorithm. During the wet season, low particle counts in the optically active range cause very low absorption and scattering coefficients, which greatly increase the uncertainties and fluctuations of the AAE and SAE values. Due to these higher uncertainties on the intensive properties, it was chosen to increase the importance of the eBC concentration for the algorithm by a factor of 1.5 during the wet season, applied directly to its normalized values. Similarly, for the dry season measurements, the size distributions for different conditions are more similar due to the substantial concentrations in the accumulation mode contributing to the scattering of radiation (Rizzo et al., 2013), which motivated the choice of decreasing the importance of the SAE values by a factor of 0.5 during this period before clustering.
Albeit this is an unsupervised method, meaning that the data points are not labeled before the execution of the algorithm, the number of clusters has to be chosen first. This complex task was performed carefully because the clusters need to have some physical meaning. The k-means algorithm was applied multiple times to each sample set, varying the number of clusters from 2 to 8, as shown in the example run of Fig. S4. The evaluation of the optimal number of clusters was made using silhouette scores (s), and the possibility of a physical interpretation of the clusters. For the wet season analysis, the silhouette score was highest in the 2-clusters case, with a clear physical meaning for each one, and the consideration of one more cluster did not add much information, which led to the final choice of 2 clusters for the wet season. Similarly, in the dry season, the s values of the two and three cluster cases were the highest. Including the third cluster improved the interpretation of the results, resulting in choosing 3 clusters for the dry season.
The sensitivity study shown in Fig. S5 corroborates the choices mentioned above for the attributed weights. For the wet season classification into two clusters, the eBC weight practically had no effect for values above 1.0. The separation of only the relatively rare, more polluted periods from the overall cleaner background typical of the wet season, is one of the desired results of this clustering effort. This is already achieved for an eBC weight marginally above 1.0, which indicates that the chosen value of 1.5 is within the desired range. For the dry season, the occurrence of African plume events is relatively scarce as well, with less than 15 % of the days being flagged as such by Holanda et al. (2023). In this scenario, these events are identified only for lower SAE weights, with the chosen value of 0.5 representing the most accurate separation from the regional biomass-burning episodes.
The following sections discuss the seasonality of the aerosol optical properties, along with their vertical gradients between 60 and 325 m. The distribution of the identified clusters throughout the year is also discussed, allowing an interpretation of the actual aerosol populations they represent.
3.1 Seasonality
Throughout the year, the eBC concentrations at ATTO vary significantly, with the cleanest months being April and May (with median values of 0.025 µg m−3 at 325 m), while the highest concentrations were observed between August and October (median of 0.36 µg m−3). Furthermore, the eBC concentration was slightly higher at 325 m at times, with a statistically significant difference being observed during pristine-like conditions, in line with the findings of Franco et al. (2024). The aerosol intensive physical properties shown in Fig. 1 also hint at a more profound change in the aerosol population throughout the year. The SAE is lower at 60 m during the whole year due to the consistent presence of coarse mode aerosols closer to the canopy (Schuster et al., 2006; Prass et al., 2021; Barbosa et al., 2022), mainly from primary biogenic sources. The higher SAE values observed during the dry season result from a larger fraction of fine mode aerosols at both heights, mostly of anthropogenic origin, while the minimum observed between January and March at both heights indicates the higher abundance of coarse mode particles, marking the peak of Saharan dust influx (Moran-Zuloaga et al., 2018).
During the wet season, there is significant variability in the SAE at 325 m, represented by the large variations in the interquartile ranges, which could result from low scattering coefficients, increasing the uncertainty of the derived exponent. In contrast, the annual cycle of the AAE is less pronounced, with lower values generally occurring at the dry-to-wet season transition and the beginning of the wet season (December to February). This is due to a larger BC fraction in the absorbing component of the aerosols, as during this time of the year, the intrusion of BC-rich plumes from Africa is frequent. The similar AAE values between the two heights indicate that no local sources of absorbing particles are relevant. The similarity of eBC at both heights is really impressive, showing that eBC is controlled by sources and processes that act similarly at 60 and 325 m, such as long-range transport of absorbing particles, unlike the findings of Sun et al. (2020), obtained for a large urban area, where the observed height gradient of BC concentration is indicative of nearby ground sources of pollution. Furthermore, the diurnal cycles of these variables are shown in Fig. S6, where it was noted that both the SAE and eBC exhibit minimal variation in comparison to their seasonal cycle. Lastly, the diurnal trend in the AAE is more notable, which could result in a similar diurnal cycle for the cluster fractions, but this was not observed in the results, as the difference between clusters is larger than the magnitude of the diurnal cycles of the considered variables.
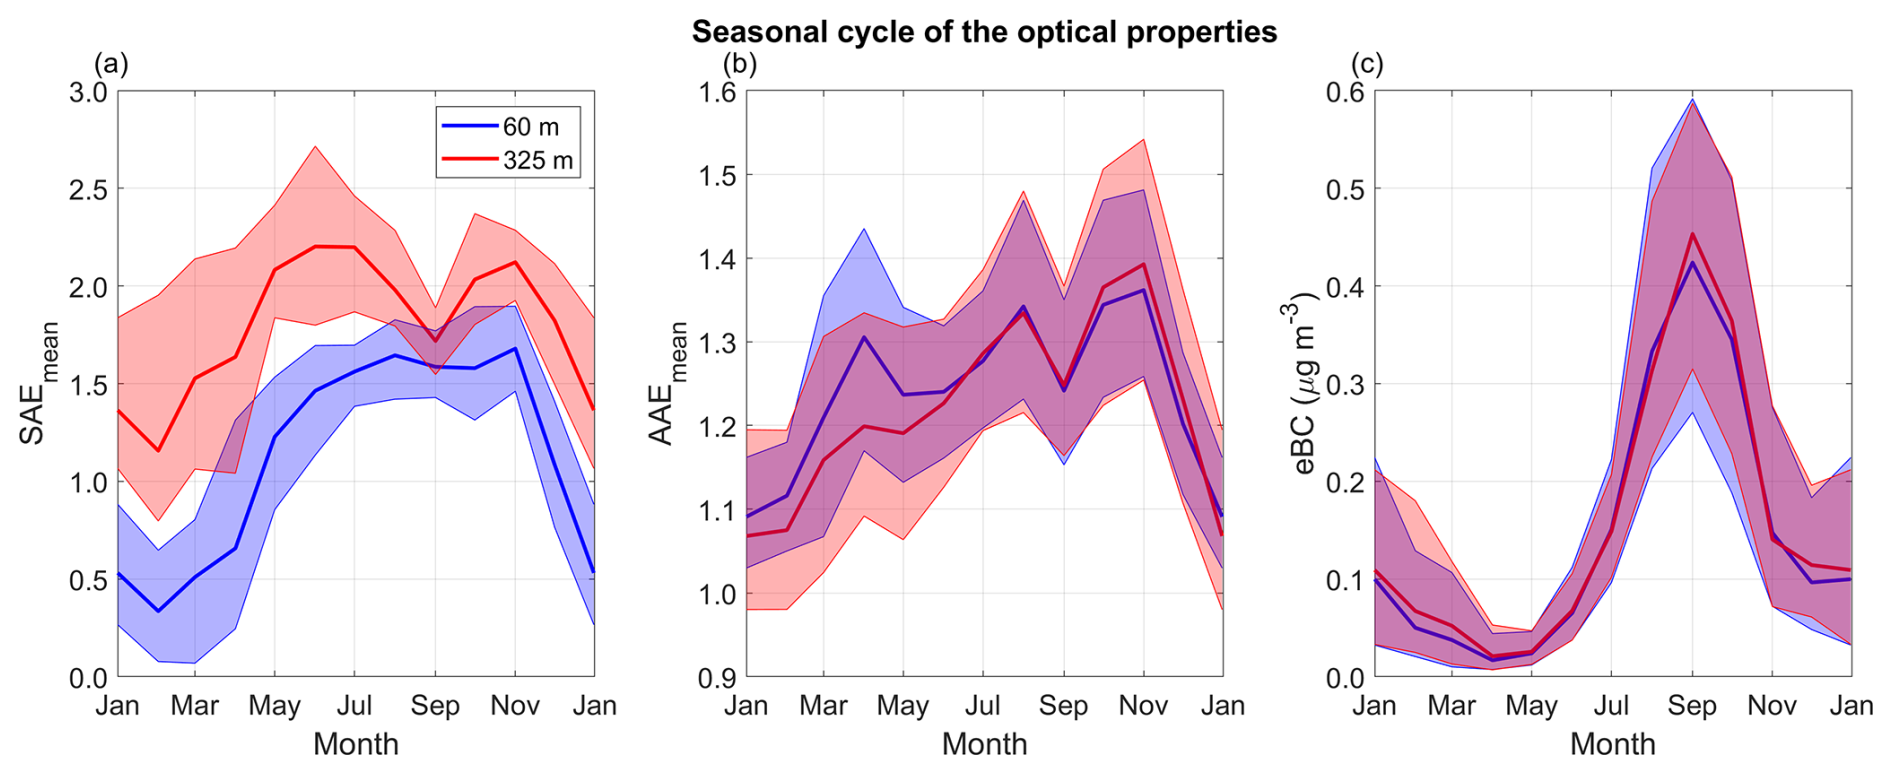
Figure 1Seasonal cycle of the aerosol optical properties (SAE, AAE, and eBC concentration) averaged over 5 years from 2018 to 2023 at the Amazon Tall Tower Observatory (ATTO) tower. The blue and red lines indicate the medians at 60 and 325 m above ground, respectively, and the shaded areas mark the corresponding interquartile ranges.
3.2 Cluster attribution and interpretation
The separation of the data into 5 clusters (2 in the wet season and 3 in the dry season, as detailed in the methodology) is shown in the Ångström matrix in Fig. 2a, with the dot colors indicating each cluster, obtained from the 325 m measurements. The purple and blue clusters were assigned to the wet season data, while the green, yellow, and red clusters were within the dry season. Furthermore, Fig. S7 shows the Ångström matrix for the 60 m measurements highlighted with the colors that represent each cluster.
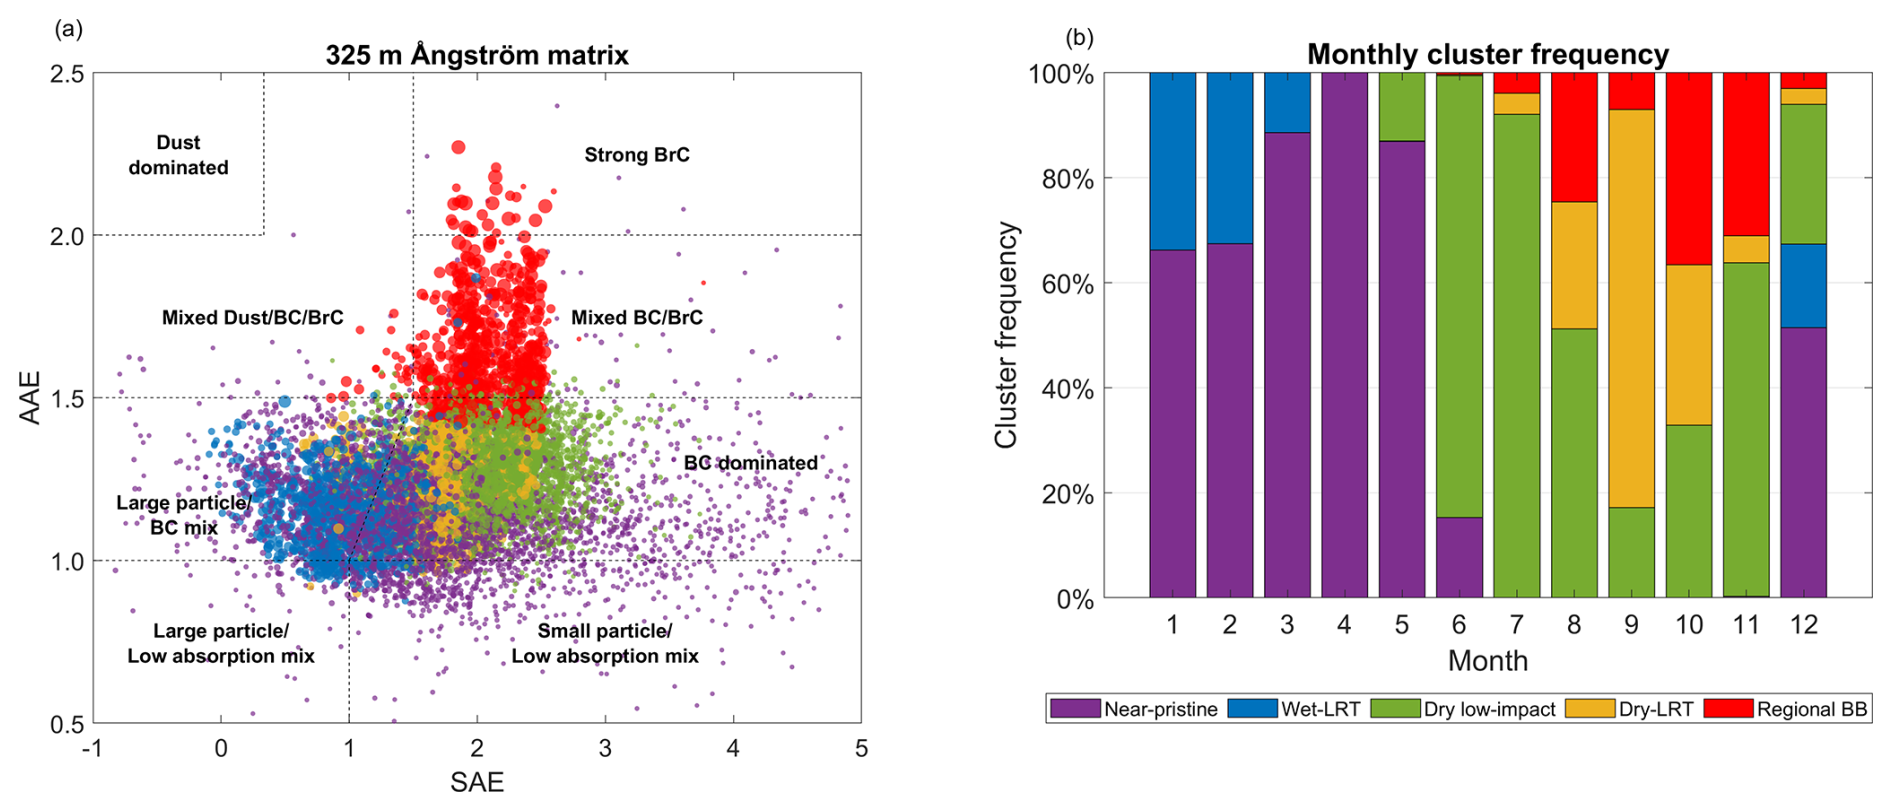
Figure 2Results for the clustering analysis of the aerosol optical properties at 325 m, using the k-means algorithm with 5 clusters and the binary season separation. In panel (a), the Ångström matrix shows the distribution of clusters, with the point size indicating the equivalent black carbon concentration, and the different highlighted regions relate to possible particle composition as introduced by Cappa et al. (2016). Panel (b) shows the annual cycle of the cluster frequencies.
During the wet season, the association of samples into the blue cluster occurred solely on relatively high eBC concentrations (> 0.15 µg m−3), with low mean values of SAE and AAE, while the purple cluster indicates a cleaner atmosphere. Furthermore, the annual cycle shown in Fig. 2b indicates that blue cluster occurrence is quite common from December to February and almost nonexistent during April and May, consistent with LRT events carrying Saharan dust and biomass-burning particles from North Africa at the beginning of the wet season. These conditions are also characterized by low SAE and AAE values (medians of 1.0 and 1.13, respectively), indicating a large contribution of coarse mode particles and low BrC fractions, consistent with aged particles from faraway sources. Hence, from hereon, the blue cluster is referred to as “wet season LRT conditions”, and the purple cluster as “near-pristine conditions”. Figure S7 also shows that during near-pristine periods the SAE rarely surpasses 2.0 at 60 m, highlighting the role of larger particles found at this height. During the analyzed wet seasons, 81 % of the data was considered near-pristine conditions, while 19 % of the available measurements were classified as LRT events. This indicates that while the purple cluster defines the typical background conditions for the wet season, there might be some diluted LRT signal within these samples, as the rigorous pristine conditions defined in the literature are much rarer. Pristine conditions are defined in the literature (Pöhlker et al., 2018) by periods with absorption by aerosols below the instrument's detection limit, which is an eBC concentration below 0.011 µg m−3 for 30 min averages. These conditions are a subset only of the near-pristine cluster, with the lowest eBC and particle concentrations, comprising around 11 % of the conditions outlined by the purple cluster, or on average 35 d yr−1.
In the dry season, red cluster samples show the highest AAE values and eBC concentrations, followed by yellow and green. Green cluster measurements are usually associated with relatively low eBC concentrations within the dry season, meaning there is little impact from biomass burning or other anthropogenic sources during these periods, which are more common at the beginning of the dry season (mainly June and July). This represents another period of “background conditions”, although for the dry season in this case, which could be characterized by different aerosol sources such as distinct biogenic activity. During the core of the dry season, from August to October, the more polluted clusters are more frequent, with occasional green cluster points intercalated, indicating lower pollution concentrations usually occurring after rainfall. The difference in the seasonality of these clusters, along with back trajectories calculated for continuous periods within each one (Fig. S8) and their mean values of AAE and SAE, indicate that the yellow cluster might be related to LRT conditions, with African biomass-burning particles.
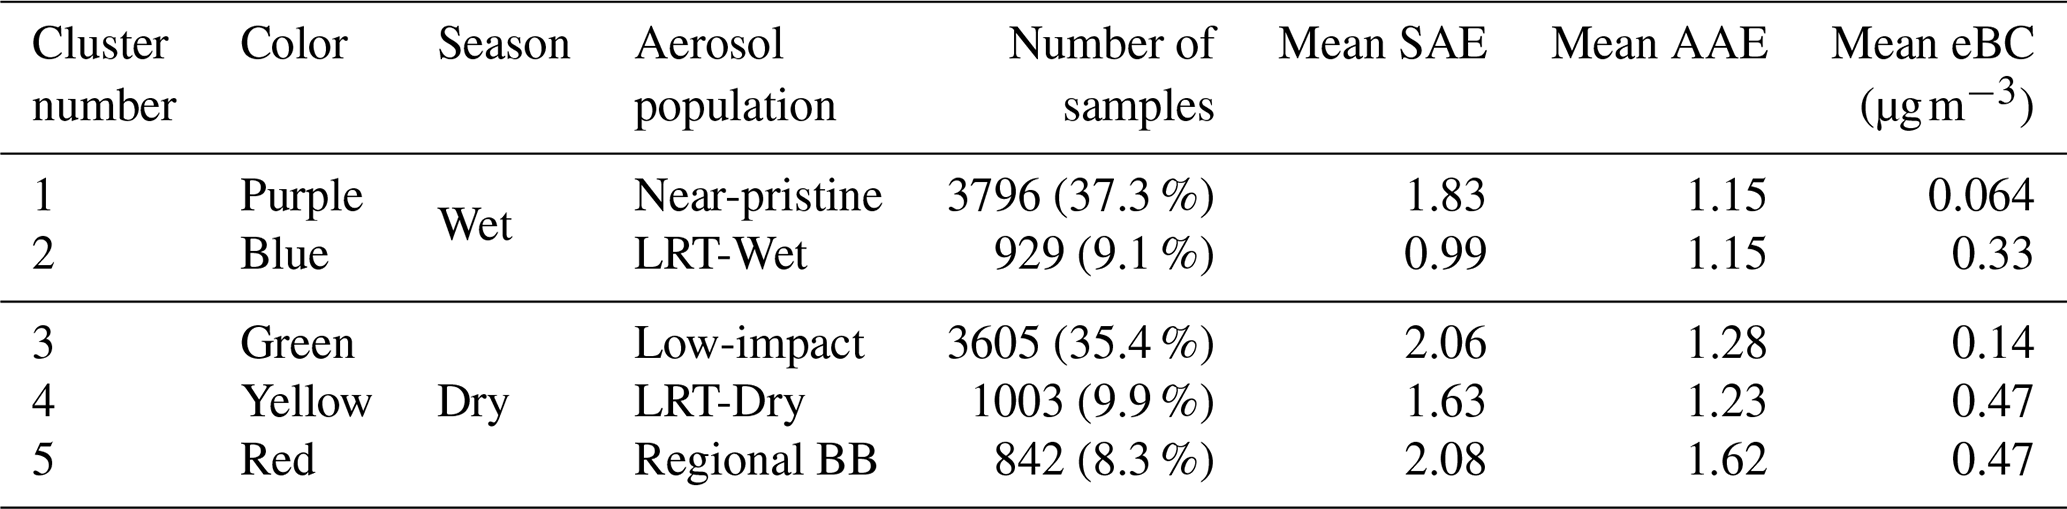
Similarly, the red cluster is more associated with regional BB pollution episodes, as these periods show higher AAE values, indicative of a freshly emitted aerosol plume with a higher BrC fraction. The red cluster is more concentrated in October and November, suggesting a higher importance of South American BB in the latter part of the dry season, in agreement with (Holanda et al., 2020). Thus, the green cluster is named “dry season low-impact conditions”, the yellow represents “dry season LRT events”, and the red cluster indicates periods with the influence of “regional pollution episodes”, as summarized in Table 2. The centroids of each cluster are also shown, which allows for the inclusion of more measurements into the same clusters in the future, by calculating the closest centroid to each sample, after the season separation. During the analyzed dry seasons, 66 % of the available measurements were classified as low-impact periods, 19 % as LRT events, and 15 % as regional pollution events. The abnormally large fraction of yellow-classified points in September might be caused by a lack of data during Sep 2022 and 2023 due to failures in the 325 m aethalometer (Fig. S2). During the dry season of the referred years, transport of regional or even local pollution from biomass burning was more common than in previous years, with the 2023 El Niño influencing the precipitation regime in Amazonia, increasing drought severity and the number of fires in the region (Espinoza et al., 2024). If the data had been available for these months, the contribution of red cluster points occurring in September would possibly be larger.
Table 2Summary of the identified clusters associated with their respective atmospheric conditions related to the aerosol populations. The centroids of each cluster as determined by the k-means algorithm is also shown.
3.3 Cluster aerosol properties at 325 m
The aerosol populations represented by each cluster exhibit different physical and chemical properties. Figure 3a,d,g compares the distribution of the predictor variables among the clusters with measurements from the 325 m height, where the lowest eBC concentrations were associated with near-pristine conditions with a median value of 0.05 µg m−3. This cluster represents the background conditions of the wet seasons, with little or no influence of pollution. Meanwhile, the highest eBC concentrations were classified into the more heavily polluted clusters of the dry season (yellow and red), both averaging almost 0.50 µg m−3, which is consistent with the influence of biomass-burning aerosols. A large SAE dispersion also characterizes near-pristine conditions due to the higher uncertainty caused by very low scattering coefficients and a prominent Aitken mode (Fig. S9a, f). At the same time, the periods influenced by regional emissions of biomass-burning particles show the highest AAE values, with a median of 1.59. The number of accumulation mode particles, fine mode volume, and PM2.5 mass increased from clusters 1 to 5, and the scattering coefficient followed the same trend, as expected.
During the dry season, LRT conditions showed lower SSA values than the regional pollution episodes, with median values and interquartile ranges of 0.82(0.79–0.85) and 0.88(0.85–0.90), respectively (Fig. 3j). The statistical significance of this difference was evaluated using both the Wilcoxon rank-sum test, which yielded a virtually null p-value, and a Z-test of the means, which resulted in a Z-score above the 99 % significance level, indicating that the SSA distributions for dry season LRT and regional BB influences are indeed different. This hints at a higher contribution of BC absorption during events of LRT and agrees well with the values obtained by Holanda et al. (2020). As shown in Fig. 3l, the fraction of the absorption at 440 nm attributed to BrC is on average 11 % during dry season LRT and 13 % during episodes of regional BB aerosols. This is a statistically significant difference pointing to the same conclusion, although such a small difference might not fully explain the radically contrasting AAE values between the two clusters. Amazonian BB aerosols are also known to have smaller BC cores (Holanda et al., 2023), which is a factor in the AAE value of pure black carbon particles, being larger than 1.0 for diameters between 100 and 200 nm (Wang et al., 2016b).
The average chemical composition of the non-refractive PM1 aerosols during these events shows a higher eBC and inorganic fraction for the LRT conditions. Only a 3 % contribution of eBC and 12 % of inorganic compounds were found during the influence of fresh biomass-burning plumes. In contrast, dry season LRT events show 6 % of eBC and 14 % of inorganics (Fig. 3i). Furthermore, despite having similar eBC mass concentrations, the regional pollution episodes show a much higher aerosol load, with a 120 % increase in the accumulation mode number concentration, a 103 % increase in the fine mode volume, and between 50 % and 60 % in the PM2.5 mass and scattering coefficient, in comparison with the LRT events, as shown in Fig. 3b, e, h, k.
LRT events in both seasons also showed the highest values of both real and imaginary parts of the refractive index. The real part, related to radiation scattering, reached values of 1.40(1.34–1.49) and 1.35(1.30–1.53) for LRT events in the wet and dry seasons, respectively, in contrast to mean/median values below 1.3 for the remaining periods (Fig. 3c). The imaginary part, indicative of light absorption, registered median values and interquartile ranges of 0.047(0.039–0.058) during wet season LRT events and 0.030(0.022–0.046) during dry season LRT conditions, much higher than the average values between 0.010 and 0.020 for the other clusters (Fig. 3f). These differences are statistically significant, and indicate that the aerosols arriving in central Amazonia during LRT events from Africa are highly efficient in absorbing radiation and much more refringent than those of local/regional biogenic origin.
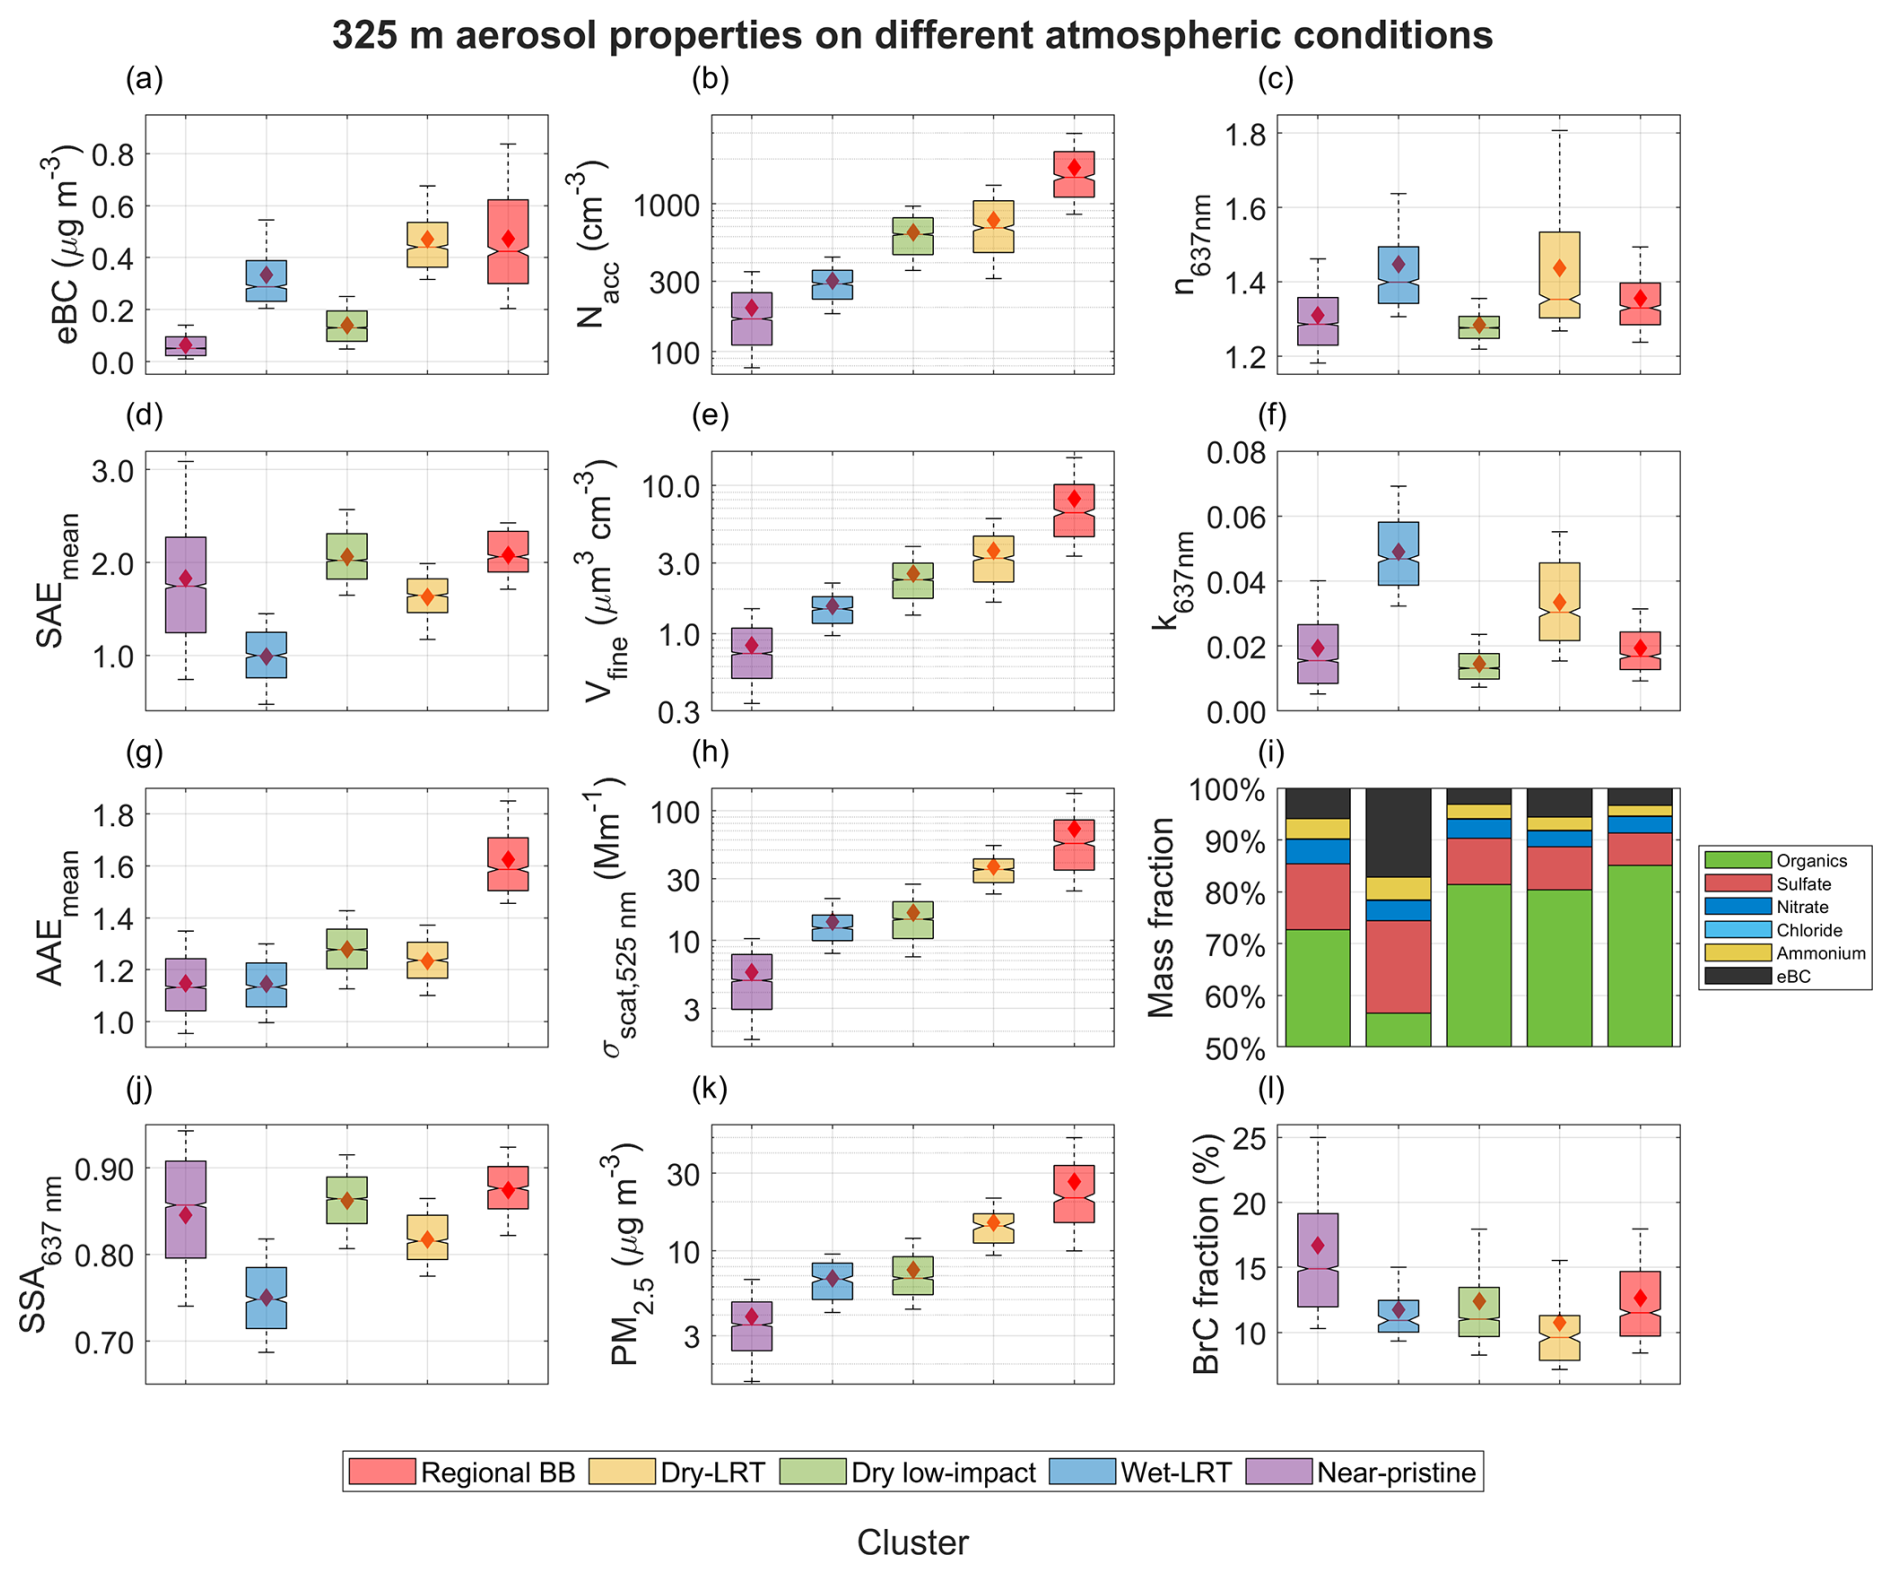
Figure 3Box plots for the measured variables at the 325 m height when separated by the identified clusters, ordered from 1 to 5. The whiskers extend to the 10th and 90th percentiles, and the mean values are indicated with a red diamond. In (a) the eBC concentration, in (d) the SAE, and in (g) the AAE are the clustering seed variables. In (b) the accumulation mode particles, in (e) the fine mode volume, in (h) the scattering coefficient, and in (k) the PM2.5 mass are the extensive variables. In (c) and (f), the real and imaginary parts of the refractive index, respectively, in (i) the chemical composition, in (j) the SSA, and in (l) the BrC fraction are the other intensive properties. Note that the chemical composition fractions are shown from 50 % to 100 % to facilitate the visualization of more minor differences due to the strong organic aerosol dominance.
Aerosols in central Amazonia are known for having a very stable chemical composition, in terms of the overall fraction of each species, despite the substantial differences in concentration between the wet and dry seasons (Chen et al., 2009; Shilling et al., 2018; Artaxo et al., 2022). Pristine periods, a subset of the near-pristine cluster, consist of particles with high organic content (82 %) and low eBC fraction (1 %), while the more polluted periods of the dry season also show an organic fraction above 80 %. On the other hand, LRT events in the wet season are unique because their average aerosol chemical composition is significantly different, with much higher eBC (17 %) and inorganic (26 %) fractions. Comparing the periods classified as LRT in both seasons, the LRT conditions in the wet season also show much lower SAE and SSA values, consistent with highly absorbing particles and a significant presence of dust and coarse mode aerosols. The differences between these clusters can be attributed mainly to two factors. Firstly, the varying position of the Intertropical Convergence Zone (ITCZ) throughout the year, primarily bringing dust from the Sahara Desert during the Amazonian wet season (Pöhlker et al., 2019) and biomass-burning particles from Southern-Hemisphere Africa during the dry season. Secondly, the frequency of precipitation leading to wet deposition during the wet season and the different amounts of regionally influenced aerosols in the atmosphere upon the arrival of the African plume. During the dry season, the low precipitation leads to an increased lifetime of aerosols in the atmosphere, and the higher aerosol load of regional origin still dominates the physical and chemical properties observed at the site, whereas the lower concentrations found in the wet season lead to an increased importance of the African plume to the overall aerosol population.
Dry season low-impact periods, represented by the green cluster, are frequent during the transition months, mainly June and July, as well as November and December. In the wet-to-dry transition, precipitation decreases gradually, keeping the aerosols in the atmosphere for extended periods, leading to increased particle concentrations. However, biomass-burning aerosols have virtually no impact during these months, keeping the eBC concentrations relatively low. In contrast, precipitation rapidly increases during the dry-to-wet transition, leading to frequent wet deposition of aerosols and lowering the eBC concentration. Transitioning to wet season conditions with frequent rainfall and low particle concentration is quicker. This difference in the transition mechanisms favors the classification of points in the dry-to-wet transition period toward wet season clusters.
Furthermore, low-impact dry season and near-pristine wet season aerosols exhibit remarkably similar intensive properties, with relatively high SAE and SSA values, and the single scattering albedo reaching 0.86(0.84–0.89) and 0.86(0.80–0.91), respectively. The characteristic refractive indices of these two clusters are also similar, with relatively low values in both the real and imaginary parts, averaging around 1.28–0.014i. This indicates that the aerosol populations are quite similar, with the main differences being the average lifetime of the particles in the atmosphere and the total aerosol load, which is 3 to 4 times higher during low-impact dry season periods. Despite their similarities, the BrC fraction of the absorption is significantly higher during near-pristine and pristine wet season conditions, reaching 15 % and 21 %, respectively, against a median of 11 % for low-impact dry season periods. The importance of newly formed absorbing aerosols may be larger during the cleanest periods (Updyke et al., 2012), as anthropogenic pollution in the atmosphere has little to no impact. The presence of absorbing fungal spores, more abundant in the wet season, might also contribute to this difference, as many spores are pigmented with melanin (Suthar et al., 2023).
3.4 Vertical gradients
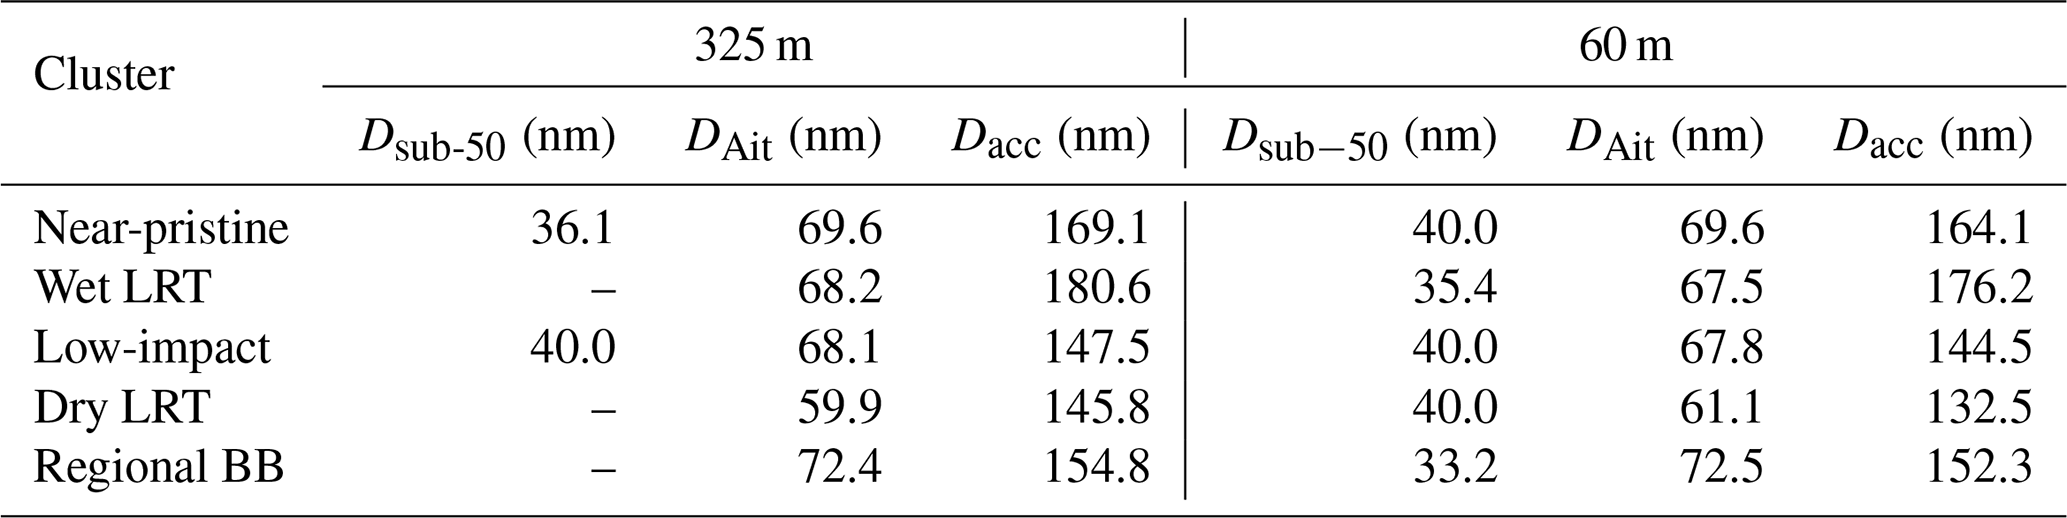
This section explores the similarities and differences observed for the analyzed variables at the two height levels among the identified clusters. The median 60 and 325 m PNSDs for the conditions outlined by each cluster are shown in Fig. S9, with the fitted parameters of the aerosol size distributions given in Table 3. The accumulation mode mean geometric diameter is larger at 325 m for all clusters, highlighting the occurrence of upward transport and aging throughout the year. The difference between the 60 and 325 m Dacc is larger during dry season LRT events, reaching 13 nm in these periods. This finding yields similar conclusions reached by Franco et al. (2024), but now extended for the entire year, and the obtained values mostly agree with Pöhlker et al. (2016), showing consistency on these studies. Overall, the accumulation mode contributes to a larger volume fraction of the fine mode aerosols at 325 m, especially during near-pristine conditions, when the Sub-50 nm and Aitken modes are more prevalent in both heights. A larger accumulation mode also characterizes Saharan dust events, shifted towards the largest diameters with the peak located at 180.6 nm for the measurements at 325 m and at 176.2 nm for the particles measured at the 60 m height.
Table 3Parameters of the fitted bimodal log-normal functions to each cluster's median particle size distributions. Dsub-50, DAit and Dacc indicate the fitted mean geometric diameter of the Sub-50 nm, Aitken, and accumulation modes, respectively. The missing values indicate the cases when the fitting algorithm did not find a significant Sub-50 nm mode.
As previously discussed in Sect. 3.1, the coarse mode particle concentration is always higher at 60 m, which is the cause for the lower overall SAE. Additionally, the SAE gradient is more significant during near-pristine conditions, as shown in Fig. 4a, due to the lower aerosol load in the fine mode at both heights leading to the exacerbation of the coarse mode relative contribution difference between 60 and 325 m. The AAE is similar between the two heights throughout the year, despite minor differences found during near-pristine conditions, when it is higher at 60 m, and in regional pollution episodes, when it is higher at 325 m. The significance of these differences was evaluated using the Wilcoxon rank-sum test, which yielded virtually null p-values. Further verification was achieved using a Z-test of the means, confirming Z-scores above the significance level of 95 % for both cases, indicating that these differences are indeed significant. These differences could indicate a larger contribution of pigmented biogenic particles such as fungal spores closer to the canopy, which becomes statistically significant during cleaner periods when the influence of other particle sources is diminished.
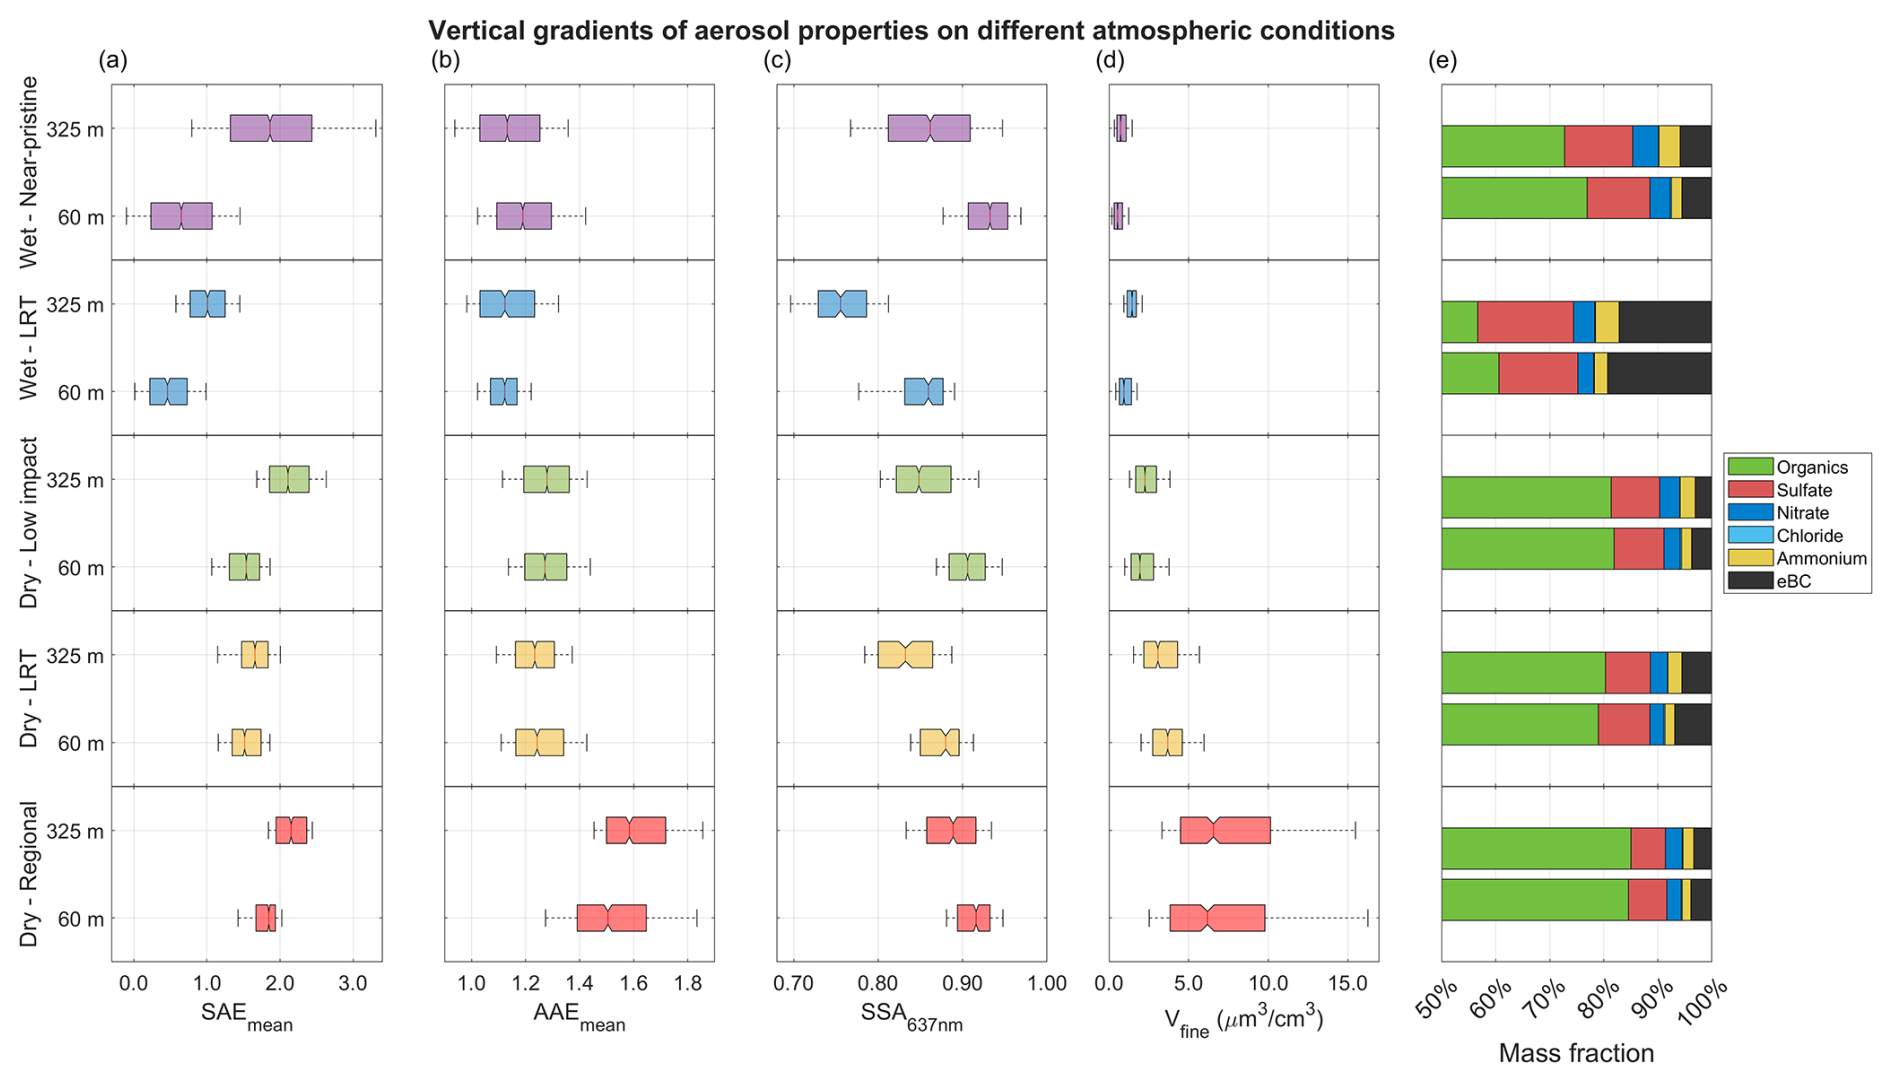
Figure 4Box plots of the vertical gradient comparison for the main aerosol properties at each cluster, with measurements at 60 and 325 m. In (a) the SAE and in (b) the AAE, variables used in the clustering process, in (c) the SSA and in (e) the chemical composition, other intensive properties of the aerosol population, and in (d) the fine mode volume, and extensive quantity. Note that the chemical composition fractions are shown from 50 % to 100 % to facilitate the visualization of smaller differences due to the large organic aerosol dominance.
The SSA is lower at 325 m at all times, as the aerosol population closer to the canopy is less absorbing. This difference is more prominent during the wet season, with greater importance of the aging processes of primary particles to the overall aerosol population (Franco et al., 2024). The more advanced stages of aging and thicker particle coating at 325 m are consistent with a higher aerosol volume at tower top height, found on most periods. The larger differences were found again in the wet season, with a fine mode aerosol volume 38 % higher in near-pristine conditions and 55 % higher during Saharan dust events. For the dry season clusters, low-impact conditions and regional BB episodes showed the highest differences in aerosol volume towards higher values at 325 m. At the same time, the pattern was reversed during LRT events, as higher volumes were observed at 60 m. The higher aerosol load during the dry season and the higher average lifetime of particles in the atmosphere lead to smaller SSA and fine mode volume gradients.
The chemical composition of the aerosols at different heights shows minor differences that might be related to canopy sources, vertical transport processes, and advection of air parcels with different origins. The organic fraction is identical at both heights during the dry season, while a difference of, on average, 4 p.p. (percentage points) was found during the wet season, with higher values at 60 m. This shows that biogenic emissions from below the canopy are increasingly important during the wet season. Moreover, sulfate concentrations and fractions were significantly higher at 325 m during wet season LRT events, while smaller differences occurred for the remaining conditions, highlighting the occurrence of Saharan dust intrusion. Finally, statistical significance was achieved for larger ammonium and nitrate fractions observed at 325 m, which could be attributed to biomass-burning aerosols transported together with the dust in LRT events or the formation of NOx by lightning at higher levels (Tost, 2017), as the differences appear to be more prominent during the rainiest periods, or in-canopy reactions with emitted VOCs (Machado et al., 2024a).
Figure 5a and b compares the 60 and 325 m refractive indices. The real part has a more pronounced vertical gradient during the wet season, with higher median values closer to the canopy of 1.47 and 1.58 during near-pristine and LRT events, respectively. In contrast, medians of 1.29 and 1.41 were obtained at 325 m, highlighting the effectiveness of coating in reducing the refringence of aerosols. Once again, the statistical significance of these claims was verified with the Wilcoxon rank-sum test, which resulted in virtually null p-values. Dry season measurements yielded a less intense vertical gradient and more stable values throughout the season, especially at 60 m height. Furthermore, the imaginary part is almost always higher at 325 m, strengthening the current understanding of more absorbing aerosols at the top of the tower. Despite this, some variations occur, with low-impact conditions showing no statistically significant difference between the two heights (at a median of 0.014). At the same time, LRT events in both seasons have the largest gradient (0.051 at 325 m and 0.038 at 60 m during Saharan dust events, and 0.035 against 0.025, respectively, during dry season African BB influx).
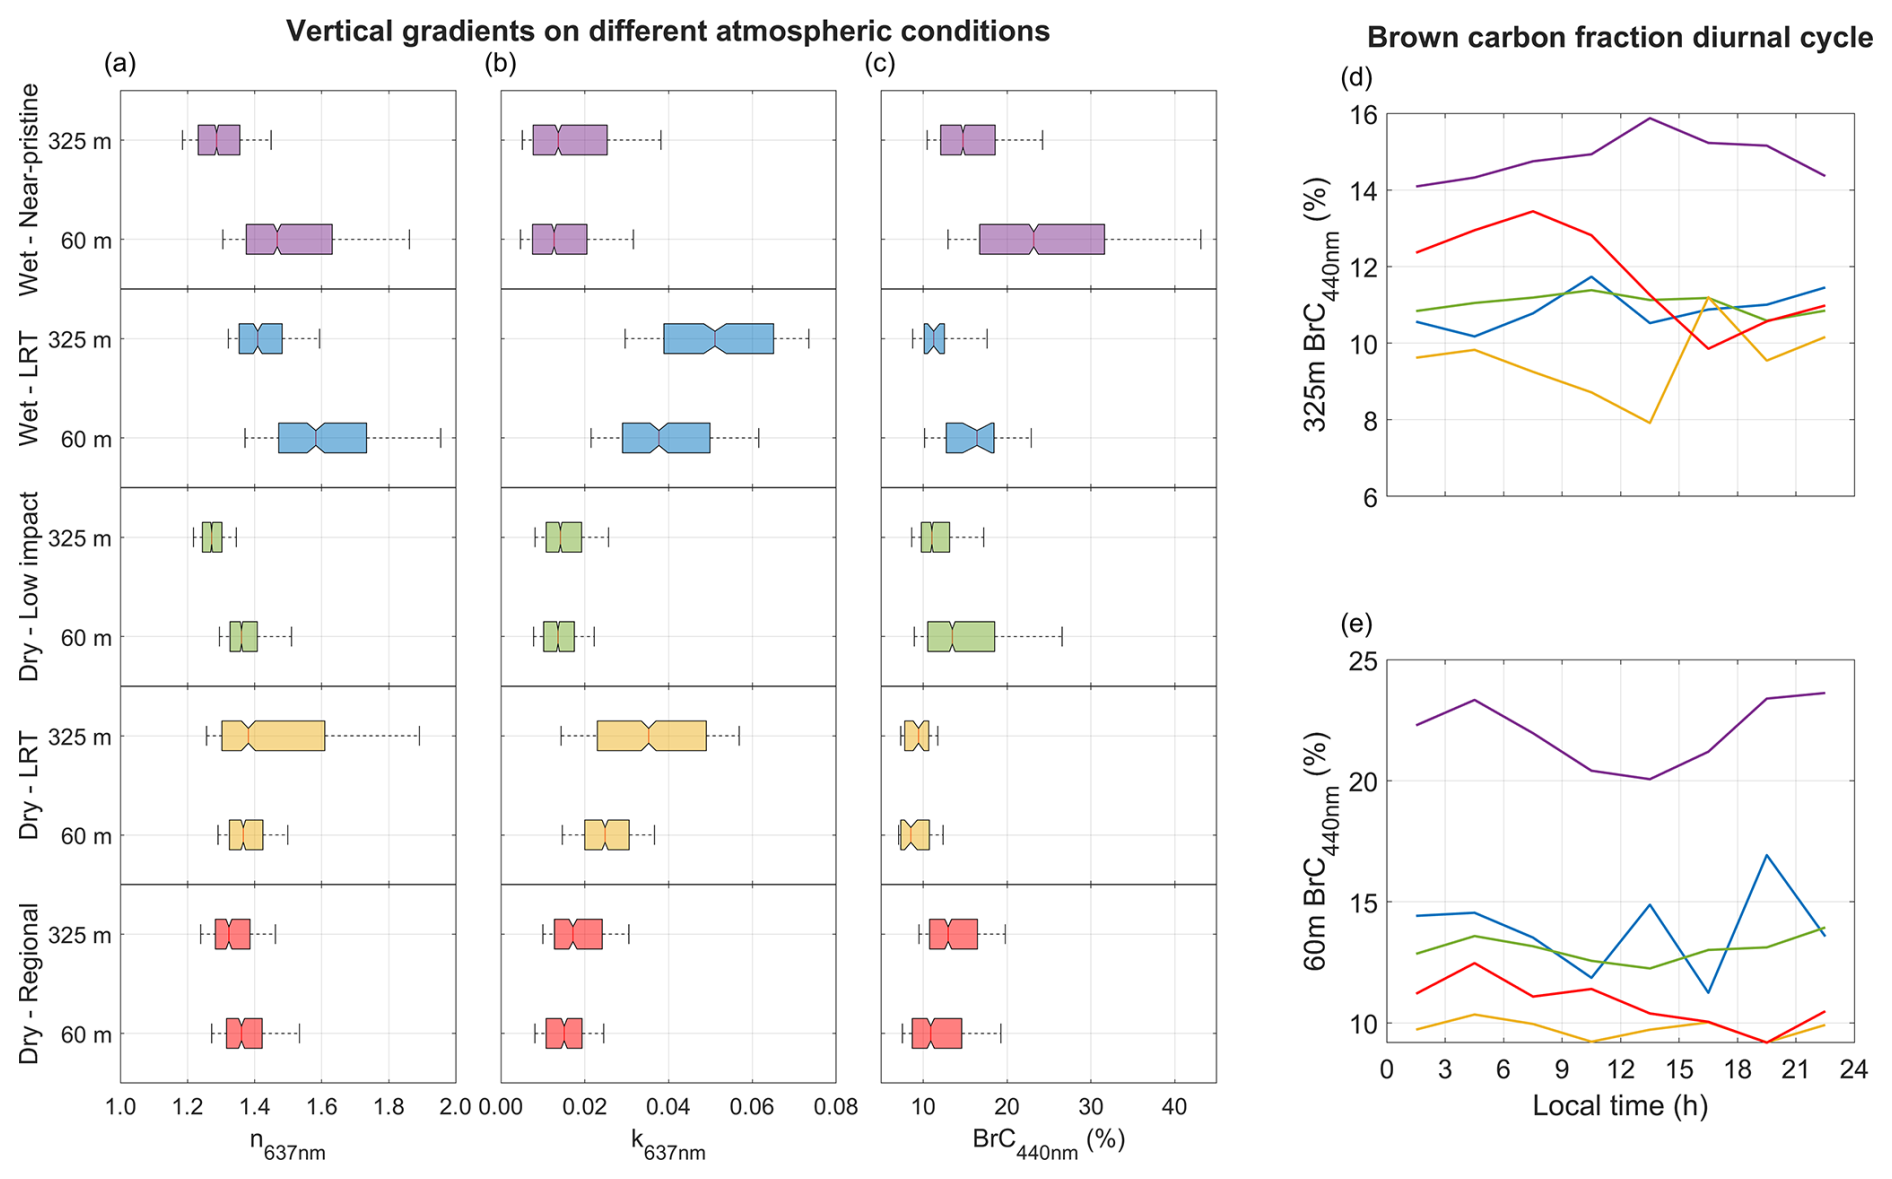
Figure 5(a–c) Box plots of the vertical gradient comparison for the refractive index and BrC absorption fraction at each cluster, with measurements at 60 and 325 m. (d–e) Median diurnal cycle of the brown carbon absorption fraction for each cluster.
The brown carbon fraction of the total absorption at 440 nm also shows large differences among the clusters regarding its vertical profile (Fig. 5c). The largest gradients were found during near-pristine conditions when the median BrC contribution is more than 50 % higher at 60 m, agreeing with previous results (Franco et al., 2024). The processes that lead to this difference can be elucidated by evaluating the diurnal cycles (Fig. 5d, e), as the BrC fraction increases during the night at 60 m, following the emission of absorbing organic compounds by the forest, from primary biogenic aerosol particles (Graham et al., 2003; Huffman et al., 2012; Moran-Zuloaga et al., 2018), which are more prevalent close to the canopy (Prass et al., 2021). Tropical fungi are known to emit their spores at night when humidity is high (Löbs et al., 2020), to protect them from the intense UV radiation. As an additional protection measure, most spores use melanin as a pigment, which makes them highly absorbing in the 440 nm range (Suthar et al., 2023), and might be a factor in the BrC gradient and diurnal profile.
In addition to the emission cycle, the nocturnal stable boundary layer development traps these particles at lower levels. The stable layer also favors the dry deposition of accumulation mode particles, as the total eBC concentration at 60 m drops during the night. The BrC fraction then decreases after sunrise due to photochemical degradation and the start of turbulent processes and vertical transport. In contrast, at 325 m the BrC contribution increases during the early morning and afternoon, as BrC-rich aerosols are transported upwards by turbulent vertical mixing. However, more polluted conditions of the dry season showed a reversed gradient, with higher BrC fractions at 325 m, although still at very low values around 10 %. These periods also show mainly unclear and noisy diurnal cycles, as there are few simultaneous measurements available at both heights.
3.5 Aerosol mass scattering efficiency
In the previous sections, we showed how the clustering separation was able to distinguish different atmospheric conditions by grouping periods with similar aerosol populations. For these different particle groups, the definition of mass scattering efficiency (MSE) is the amount of scattering that a unit of aerosol particle mass can produce. The MSE can also be used to characterize the particle populations, as it indicates the scattering power of an aerosol type and relates mass concentration to visibility and aerosol optical thickness. Eq. (3) describes the linear relation between the mass concentration and scattering coefficient,
where σscat is the scattering coefficient measured by the nephelometers, αscat is the mass scattering efficiency, is the non-refractive fine mode mass, estimated by the ACSM, and M0 is the aerosol mass that scatters radiation but cannot be measured by the ACSM, mainly part of the coarse mode between 1 and 2.5 µm, as well as dust particles and BC. This is a widely used method, applied by previous studies (Ponczek et al., 2022; Franco et al., 2024), but the assumption that M0 is approximately the same for all considered points is flawed, especially during periods with large coarse mode contributions, which most-likely leads to overestimations of the MSE values. Note that Eq. (3) is wavelength-dependent, so the following analyses were performed considering only the scattering coefficients at 525 nm. For the linear regressions applied to the datasets corresponding to each cluster, the scattering coefficient and aerosol mass uncertainties are important steps to achieve the correct values of αscat, and they were determined following previous works. Massoli et al. (2009) and Müller et al. (2011) determined that Aurora and TSI nephelometer measurements at 1 min time resolution show a 3.0 % uncertainty, which converts to 0.22 % in 3 h averages, as utilized in this study. This contribution is combined with a fixed value of 0.13 Mm−1, related to the instruments' lower detection limit. Similarly, the mass uncertainties are comprised of a relative term of 1.5 % at the utilized time resolution (Crenn et al., 2015), and an absolute value term of 0.08 µg m−3 related to the detection limit (Ng et al., 2011). These errors were combined with a statistical uncertainty, represented by the standard deviation of the means for the 3 h averages for both scattering and aerosol mass. In addition, to avoid biases that can occur with linear fitting methods that consider uncertainties on both variables, the x-axis uncertainty was converted to the y-axis iteratively, and a standard least squares fitting was applied.
Figure 6 shows the correlation plots between the aerosol mass and scattering coefficient measured at 60 and 325 m during the conditions flagged by each cluster, while Table 4 summarizes the values found by the linear regressions for both heights, which were statistically significant for all cases with the fitted coefficients showing p<0.05. The correlation is higher for the dry season clusters due to the higher aerosol mass and reduced relative uncertainty, as well as an increased fine mode fraction, which leads to a better estimation of the total aerosol mass by the ACSM. The average MSE at 325 m is always lower than at 60 m, as the presence of freshly emitted primary aerosols is more dominant closer to the canopy. These particles are very efficient in scattering radiation, while more advanced aging stages and larger particle coating are responsible for a decrease of MSE at higher levels.
On top of this general trend, distinct features can be observed for each cluster. The MSE at 325 m was nearly identical during the wet season clusters, reaching (3.96 ± 0.07) m2 g−1 at near-pristine conditions and (4.09 ± 0.17) m2 g−1 for LRT events. In fact, when performing a Z-test of these values, statistical difference is not achieved within a 95 % confidence interval (Z=0.7). These results show remarkably stable values despite the very different aerosol compositions of the particle populations that comprise these clusters. This stability, however, is not observed at 60 m, where the mean MSE values increase from (5.99 ± 0.14) m2 g−1 during near-pristine conditions to (7.34 ± 0.54) m2 g−1 during Saharan dust events, representing a 23 % average rise from one cluster to the other. Note that these values are probably overestimated due to the large coarse mode contributions during wet season conditions, especially at 60 m. Similarly, low-impact and dry season LRT conditions also showed nearly the same mass scattering efficiencies at 325 m, at (3.60 ± 0.05) and (3.70 ± 0.20) m2 g−1, respectively, compatible within the 95 % confidence interval, and around 9 % lower than the wet season average. Regional pollution episodes showed slightly higher scattering efficiency, as the aerosol population is comprised of more freshly emitted particles, resulting in an average MSE of (4.43 ± 0.10) m2 g−1.
Furthermore, the linear coefficients of the regressions yielded different amounts of dust/coarse mode mass, which the ACSM did not measure. Clusters 2 and 4, associated with LRT events, showed higher M0 values at 325 m, of (1.38 ± 0.09) and (3.19 ± 0.45) µg m−3 respectively, in comparison with the background conditions, indicating a high contribution of coarse mode and dust particles during these events. Wet season near-pristine, dry season low-impact conditions, and regional pollution episodes registered lower values of M0, indicating a relatively lower impact of coarse mode and dust particles at the 325 m height during these conditions.
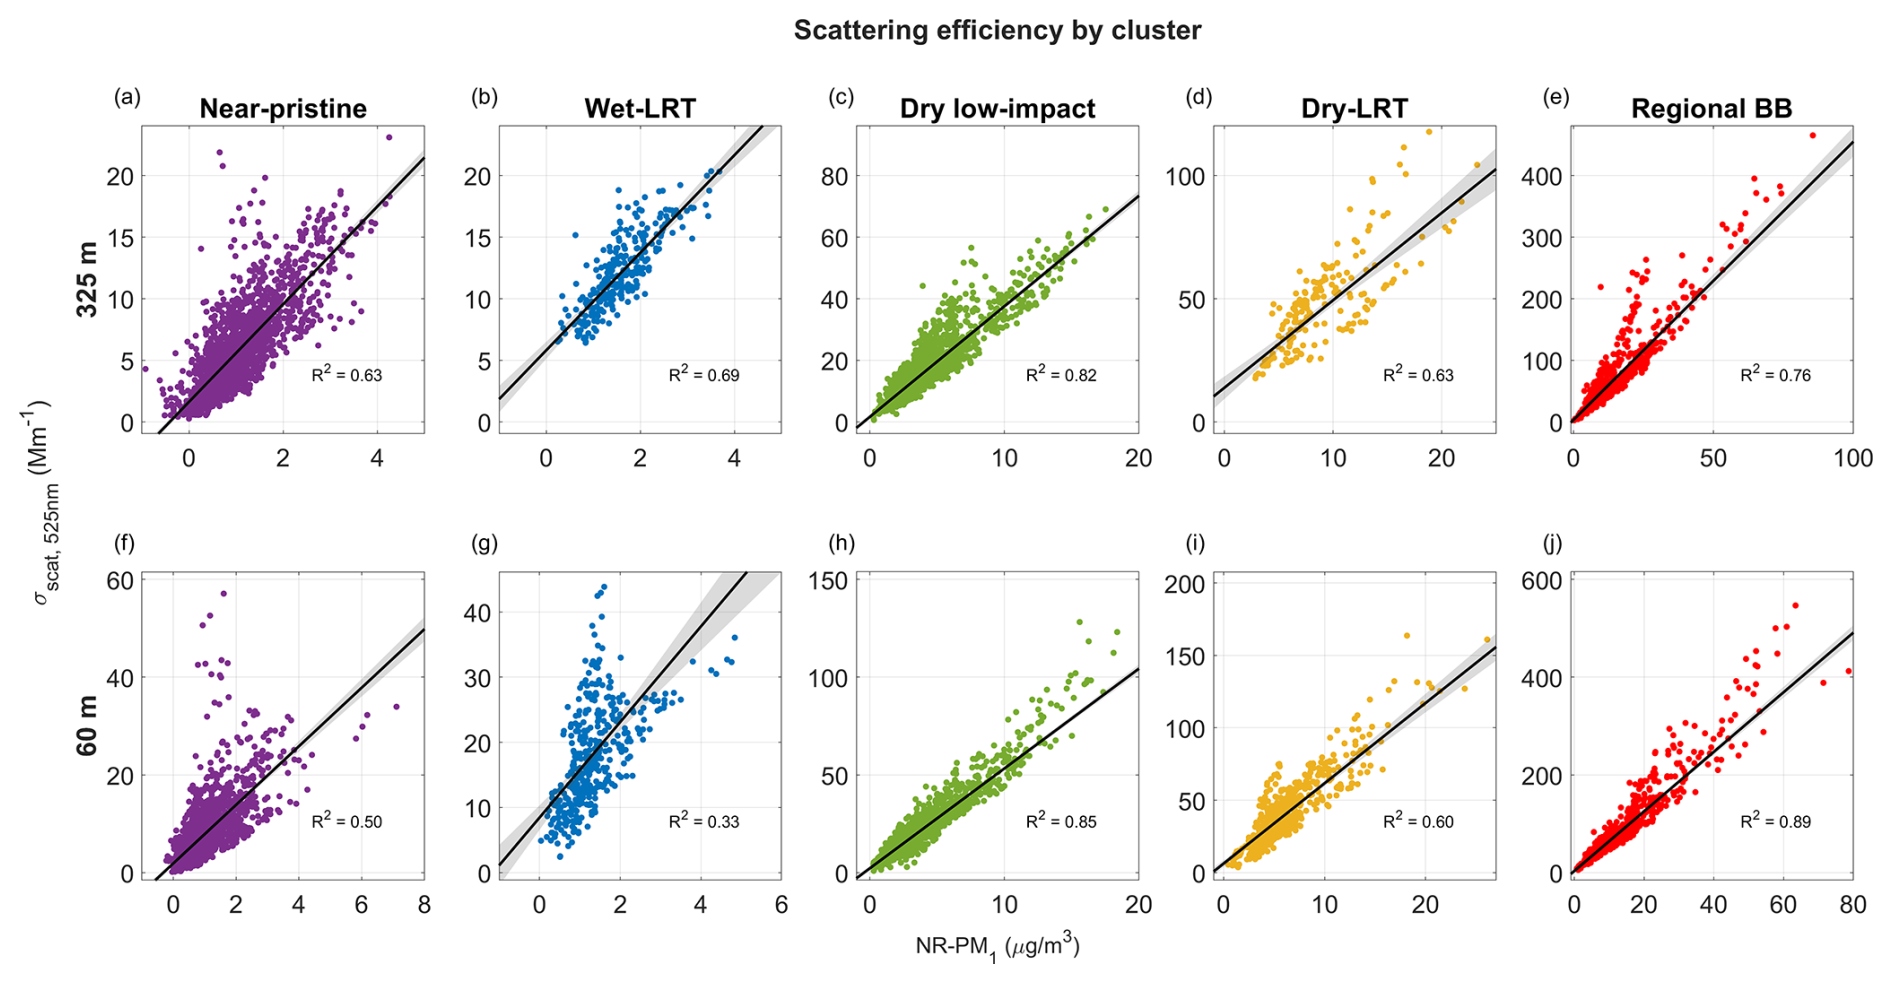
Figure 6Scatter plots of non-refractive PM1 mass and scattering coefficient at 525 nm measured at 325 m (a–e) and 60 m (f–j) for each cluster, with linear fit and the R2 determination coefficient. The shaded areas indicate the 95 % confidence interval.
Table 4Aerosol mass scattering efficiency and dust/coarse mode mass calculated for each cluster at 325 and 60 m.
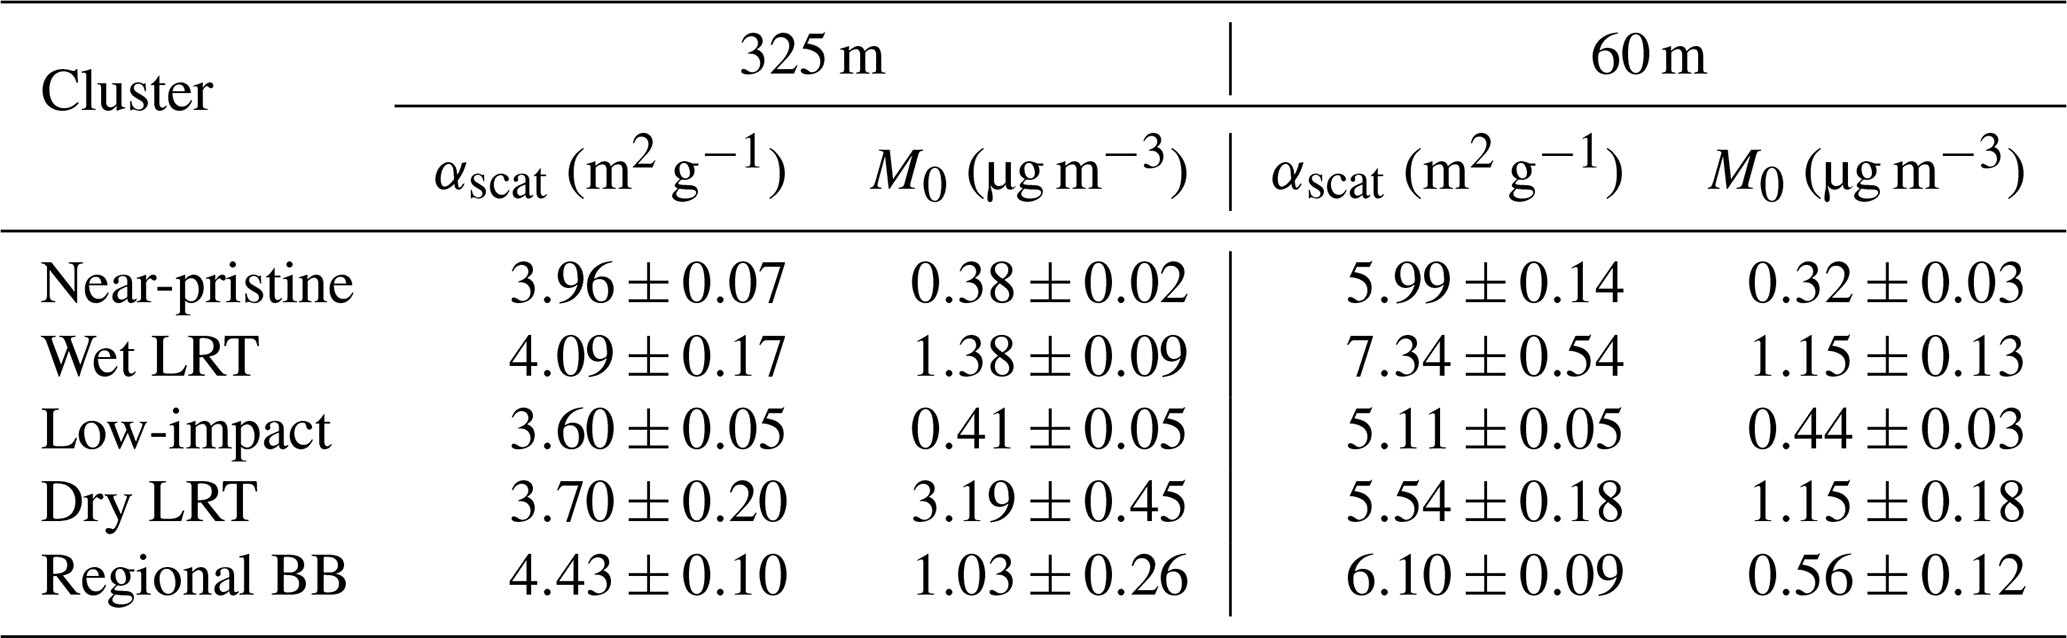
Low-impact conditions showed the lowest MSE at both heights, with an average value of (5.11 ± 0.05) m2 g−1 at 60 m, agreeing with the values found by previous studies for the cleanest periods of the year. A direct comparison with near-pristine conditions (mean MSE of (5.99 ± 0.14) m2 g−1) is possible, as the aerosols that compose these periods have similar intensive properties. As previously stated, the main difference between these two clusters is the average lifetime of the particles in the atmosphere due to the less frequent wet scavenging by rainfall. This increased lifetime during low-impact dry season periods allows for aging processes to occur, lowering their MSE compared to near-pristine periods. Aerosol coating is usually comprised of organic compounds and water vapor, both of which act as an absorbent layer, decreasing the scattering efficiency of the particles (Li et al., 2011), as well as increasing the aerosol volume and mass faster than the scattering cross-section. Furthermore, LRT events significantly affect the scattering efficiency at 60 m, especially in the wet season, with both wet and dry season LRT events showing higher MSE values (reaching (7.34 ± 0.54) and (5.54 ± 0.18) m2 g−1, respectively) than during low-impact conditions, in contrast to what was found for the 325 m height. Based on these differences, one can postulate that the more aged aerosols are almost permanently found at 325 m. In contrast, at 60 m, the particle population is less aged and thus more responsive to sudden changes in chemical composition and lifetime of the arriving particles from LRT, resulting in a more variable MSE at different events. Furthermore, the dry season scattering coefficients and NR-PM1 masses are more correlated than the wet season measurements at 60 m, as coarse mode particle bursts, mainly comprised of bioaerosols (Prass et al., 2021), are frequent at this height during the wet season, when fungi are more active. The ACSM does not measure these particles, but they do scatter radiation, leading to the events shown as apparent vertical lines in Fig. 6f, g. These measurements also show the lowest values of SAE within each cluster, reinforcing the higher importance of coarse mode particles during these periods (Fig. S10).
This study developed a comprehensive method for discriminating between five major aerosol populations associated with different transport processes, sources and air masses in central Amazonia, using the aerosol optical properties measured at the ATTO site at two different heights. The algorithm separated aerosol populations related to wet and dry season background conditions, African LRT events, and regional biomass-burning influenced periods, and the resulting analyses proved effective in resolving the vertical gradients of many physical and chemical properties of the identified aerosol populations. The main takeaways from this effort are:
-
African biomass-burning particles exhibit lower AAE and SSA than South American BB aerosols and lower BrC fractions, both at 60 and 325 m.
-
Saharan dust events profoundly change the chemical composition of the central Amazonian atmosphere, introducing particles with large inorganic (26 % at 325 m and 20 % at 60 m) and eBC (17 % at 325 m and 19 % at 60 m) fractions and, on average, a higher refractive index (1.41–0.051i at 325 m and 1.58–0.038i at 60 m).
-
Background conditions during both the wet and dry seasons, here identified as near-pristine and low-impact periods, show similar optical and chemical properties, indicating that ecosystem-derived sources likely dominate the aerosols found during these conditions.
-
Vertical transport of fine mode aerosols likely promotes the aging of these particles, playing a major role in the gradients observed between the 60 and 325 m mass scattering efficiencies.
The wet season clusters were mainly characterized by differences in the eBC concentration, with near-pristine conditions showing the lowest aerosol loading and Saharan dust events bringing more particulate matter to the atmosphere. The aerosol populations of these periods are very different despite the similar wind patterns and air mass trajectories caused by the large-scale circulation and ITCZ position. Rainfall amounts were 3 times higher during near-pristine conditions, resulting in wet deposition and scavenging of larger particles.
The findings in this study suggest that the differences observed on the intensive properties of periods dominated by African and South American BB particles are likely related to lower BrC fractions on LRT particles (11 % against 13 % during regional BB conditions), as the BrC is quickly degraded in the atmosphere, with a lifetime typically lower than the transport time from Africa to South America (Wong et al., 2019; Fleming et al., 2020; Schnitzler et al., 2022). Furthermore, periods classified as regional BB showed the highest aerosol loadings, indicating that the atmospheric and ecosystem impact during the dry season is larger overall during fresh biomass-burning conditions, which was more common in recent years.
Similarities between near-pristine and low-impact conditions consisted of high SSA (0.85) and SAE (1.9) at 325 m, low refractive indices (∼1.3–0.015i), and relatively high BrC fractions with pronounced vertical gradients. In both cases, the chemical composition is dominated by organics, showing a high predominance of biogenic particle sources, encompassing primary emissions and SOA formation. This indicates that although the particle concentrations are higher during low-impact than during near-pristine periods, the intrinsic characteristics of the aerosols are very similar between these periods, pointing to the main difference being the decreased wet scavenging by precipitation, less common in the dry season, and increased lifetime of the particles in the atmosphere, being able to achieve more advanced aging stages and higher concentrations.
The brown carbon vertical gradient was found to be steeper during the wet season, particularly under near-pristine conditions, when larger BrC fractions are observed closer to the canopy. Vertical mixing processes tend to smooth out some of the differences during the day, also lowering the vertical gradient of the BrC fraction as more BrC-rich particles can be transported upwards after sunrise, and the emissions of pigmented bioaerosols may play a role in the observed fraction gradient during near-pristine conditions. Further studies might benefit from a more thorough understanding of BrC formation processes near the canopy in central Amazonia.
Lastly, the importance of aging processes to the aerosol populations found at 60 and 325 m is highlighted when calculating the mass scattering efficiencies of the particles during the conditions outlined by the five clusters. The MSE values found at 325 m are very stable throughout the year. This indicates that the coating thickness and aging stage of these particles are so significant that they often overcome the different chemical compositions. In contrast, higher scattering efficiencies are usually found at the 60 m height, on average 52 % above the 325 m values, as freshly emitted and formed particles are less coated and scatter radiation more efficiently. Future studies will analyze the particles' internal structure with X-ray and electron microscopy to better assess the coating effects. The differences among the clusters are also more significant than at 325 m, since the aerosols are usually younger and less coated at 60 m, intensifying the impact of LRT plumes with highly aged particles and different chemical compositions closer to the canopy.
Therefore, this study provides a comprehensive characterization of the commonly occurring aerosol populations in central Amazonia, focusing on the intensive properties of the aerosols and the processes influencing their vertical gradients within the boundary layer. These findings highlight the complex variability of aerosol sources and processes that must be considered in modeling efforts of the Amazonian atmosphere.
The aerosol optical properties data for the entire observation period are available via the ATTO data portal (https://www.attodata.org/, last access: 4 November 2025). Please refer to the corresponding authors for requests beyond the available data.
The supplement related to this article is available online at https://doi.org/10.5194/acp-25-14923-2025-supplement.
RV and BBM designed this study. RV, BBM and MAF processed and analysed the utilized data. LVR, LATM, SB, BAH, LAK, SSR, SC, CQDJ, FGM, MOA, UP, CP and PA contributed with important ideas and comments to the analysis. RV wrote the manuscript. All authors contributed to the discussion of the results as well as the finalization of the manuscript. PA and CP supervised the study.
At least one of the (co-)authors is a member of the editorial board of Atmospheric Chemistry and Physics. The peer-review process was guided by an independent editor, and the authors also have no other competing interests to declare.
Publisher’s note: Copernicus Publications remains neutral with regard to jurisdictional claims made in the text, published maps, institutional affiliations, or any other geographical representation in this paper. While Copernicus Publications makes every effort to include appropriate place names, the final responsibility lies with the authors. Views expressed in the text are those of the authors and do not necessarily reflect the views of the publisher.
RV acknowledges the CAPES scholarship 88887.835022/2023-00. MAF acknowledges the Conselho Nacional de Desenvolvimento Científico e Tecnológico (CNPq), project number 407752/2023-4. PA acknowledges the support from FAPESP – Fundação de Amparo à Pesquisa do Estado de São Paulo through grant number 2023/04358-9 and CNPq grant 440012/2024-4. BBM acknowledges the support from FAPESP through grants number 2020/15405-0 and 2023/01902-0. The ATTO research has been supported by the Max Planck Society, the German Federal Ministry of Education and Research (BMBF contracts 01LB1001A, 01LK1602A, 01LK1602B, and 01LK2101B), the Brazilian Ministério da Ciência, Tecnologia e Inovação (MCTI/FINEP contract 01.11.01248.00), the FAPESP project (grant nos. 2017/17047-0, 2022/07974-0 and 2023/04358-9), the CNPq project (grant no. 169842/2017-7), the CAPES project (grant no. 88887.368025/2019-00 and 88887.611308/2021-00), LBA/INPA, the Amazon State University (UEA), FAPEAM, and SDS/CEUC/RDS-Uatumã. SB, LAK, and BAH acknowledge the Max Planck Graduate Center with Johannes Gutenberg-Universität Mainz (MPGC). We acknowledge the support by the Instituto Nacional de Pesquisas da Amazônia (INPA), and would like to thank the ATTO members involved in the technical, logistical, and scientific support within the ATTO project.
This research has been supported by the Fundação de Amparo à Pesquisa do Estado de São Paulo (grant no. 2023/04358-9).
This paper was edited by Eija Asmi and reviewed by two anonymous referees.
Alencar, A., Nepstad, D., and Diaz, M. C. V.: Forest understory fire in the Brazilian Amazon in ENSO and non-ENSO years: area burned and committed carbon emissions, Earth Interact., 10, 1–17, 2006. a
Aliaga, D., Sinclair, V. A., Krejci, R., Andrade, M., Artaxo, P., Blacutt, L., Cai, R., Carbone, S., Gramlich, Y., Heikkinen, L., Heslin-Rees, D., Huang, W., Kerminen, V.-M., Koenig, A. M., Kulmala, M., Laj, P., Mardoñez-Balderrama, V., Mohr, C., Moreno, I., Paasonen, P., Scholz, W., Sellegri, K., Ticona, L., Uzu, G., Velarde, F., Wiedensohler, A., Worsnop, D., Wu, C., Xuemeng, C., Zha, Q., and Bianchi, F.: New particle formation dynamics in the central Andes: contrasting urban and mountaintop environments, Aerosol Research, 3, 15–44, https://doi.org/10.5194/ar-3-15-2025, 2025. a
Allan, J. D., Delia, A. E., Coe, H., Bower, K. N., Alfarra, M. R., Jimenez, J. L., Middlebrook, A. M., Drewnick, F., Onasch, T. B., Canagaratna, M. R., Jayne, J. T., and Worsnop, D. R.: A generalised method for the extraction of chemically resolved mass spectra from Aerodyne aerosol mass spectrometer data, J. Aerosol Sci., 35, 909–922, https://doi.org/10.1016/j.jaerosci.2004.02.007, 2004. a
Andreae, M. O. and Gelencsér, A.: Black carbon or brown carbon? The nature of light-absorbing carbonaceous aerosols, Atmos. Chem. Phys., 6, 3131–3148, https://doi.org/10.5194/acp-6-3131-2006, 2006. a
Andreae, M. O., Acevedo, O. C., Araùjo, A., Artaxo, P., Barbosa, C. G. G., Barbosa, H. M. J., Brito, J., Carbone, S., Chi, X., Cintra, B. B. L., da Silva, N. F., Dias, N. L., Dias-Júnior, C. Q., Ditas, F., Ditz, R., Godoi, A. F. L., Godoi, R. H. M., Heimann, M., Hoffmann, T., Kesselmeier, J., Könemann, T., Krüger, M. L., Lavric, J. V., Manzi, A. O., Lopes, A. P., Martins, D. L., Mikhailov, E. F., Moran-Zuloaga, D., Nelson, B. W., Nölscher, A. C., Santos Nogueira, D., Piedade, M. T. F., Pöhlker, C., Pöschl, U., Quesada, C. A., Rizzo, L. V., Ro, C.-U., Ruckteschler, N., Sá, L. D. A., de Oliveira Sá, M., Sales, C. B., dos Santos, R. M. N., Saturno, J., Schöngart, J., Sörgel, M., de Souza, C. M., de Souza, R. A. F., Su, H., Targhetta, N., Tóta, J., Trebs, I., Trumbore, S., van Eijck, A., Walter, D., Wang, Z., Weber, B., Williams, J., Winderlich, J., Wittmann, F., Wolff, S., and Yáñez-Serrano, A. M.: The Amazon Tall Tower Observatory (ATTO): overview of pilot measurements on ecosystem ecology, meteorology, trace gases, and aerosols, Atmos. Chem. Phys., 15, 10723–10776, https://doi.org/10.5194/acp-15-10723-2015, 2015. a
Andreae, M. O., Afchine, A., Albrecht, R., Holanda, B. A., Artaxo, P., Barbosa, H. M. J., Borrmann, S., Cecchini, M. A., Costa, A., Dollner, M., Fütterer, D., Järvinen, E., Jurkat, T., Klimach, T., Konemann, T., Knote, C., Krämer, M., Krisna, T., Machado, L. A. T., Mertes, S., Minikin, A., Pöhlker, C., Pöhlker, M. L., Pöschl, U., Rosenfeld, D., Sauer, D., Schlager, H., Schnaiter, M., Schneider, J., Schulz, C., Spanu, A., Sperling, V. B., Voigt, C., Walser, A., Wang, J., Weinzierl, B., Wendisch, M., and Ziereis, H.: Aerosol characteristics and particle production in the upper troposphere over the Amazon Basin, Atmos. Chem. Phys., 18, 921–961, https://doi.org/10.5194/acp-18-921-2018, 2018. a
Artaxo, P., Storms, H., Bruynseels, F., Van Grieken, R., and Maenhaut, W.: Composition and sources of aerosols from the Amazon Basin, J. Geophys. Res.-Atmos., 93, 1605–1615, https://doi.org/10.1029/JD093iD02p01605, 1988. a
Artaxo, P., Rizzo, L. V., Brito, J. F., Barbosa, H. M. J., Arana, A., Sena, E. T., Cirino, G. G., Bastos, W., Martin, S. T., and Andreae, M. O.: Atmospheric aerosols in Amazonia and land use change: from natural biogenic to biomass burning conditions, Faraday Discuss., 165, 203–235, https://doi.org/10.1039/C3FD00052D, 2013. a
Artaxo, P., Hansson, H.-C., Andreae, M. O., Bäck, J., Gomes-Alves, E., Barbosa, H. M. J., Bender, F., Bourtsoukidis, E., Carbone, S., Chi, J., Decesari, S., Després, V. R., Ditas, F., Ezhova, E., Fuzzi, S., Hasselquist, N. J., Heintzenberg, J., Holanda, B. A., Guenther, A., Hakola, H., Heikkinen, L., Kerminen, V.-M., Kontkanen, J., Krejci, R., Kulmala, M., Lavrič, J. V., de Leeuw, G., Lehtipalo, K., Machado, L. A. T., McFiggans, G., Franco, M. A. M., Meller, B. B., Morais, F. G., Mohr, C., Morgan, W., Nilsson, M. B., Peichl, M., Petäjä, T., Praß, M., Pöhlker, C., Pöhlker, M. L., Pöschl, U., von Randow, C., Riipinen, I., Rinne, J., Rizzo, L. V., Rosenfeld, D., Silva Dias, M. A. F., Sogacheva, L., Stier, P., Swietlicki, E., Sörgel, M., Tunved, P., Virkkula, A., Wang, J., Weber, B., Yáñez-Serrano, A. M., Zieger, P., Mikhailov, E., Smith, J. N., and Kesselmeier, J.: Tropical and boreal forest–atmosphere interactions: a review, Tellus B, 24, 24–163, https://doi.org/10.16993/tellusb.34, 2022. a, b, c
Barbosa, C. G. G., Taylor, P. E., Sá, M. O., Teixeira, P. R., Souza, R. A. F., Albrecht, R. I., Barbosa, H. M. J., Sebben, B., Manzi, A. O., Araújo, A. C., Prass, M., Pöhlker, C., Weber, B., Andreae, M. O., and Godoi, R. H. M.: Identification and quantification of giant bioaerosol particles over the Amazon rainforest, npj Clim. Atmos. Sci., 5, 1–10, https://doi.org/10.1038/s41612-022-00294-y, 2022. a
Bellouin, N., Quaas, J., Gryspeerdt, E., Kinne, S., Stier, P., Watson-Parris, D., Boucher, O., Carslaw, K. S., Christensen, M., Daniau, A.-L., Dufresne, J.-L., Feingold, G., Fiedler, S., Forster, P., Gettelman, A., Haywood, J. M., Lohmann, U., Malavelle, F., Mauritsen, T., McCoy, D. T., Myhre, G., Mülmenstädt, J., Neubauer, D., Possner, A., Rugestein, M., Sato, Y., Schulz, M., Schwartz, S. E., Sourdeval, O., Storelvmo, T., Toll, V., Winker, D., and Stevens, B.: Bounding global aerosol radiative forcing of climate change, Rev. Geophys., 58, e2019RG000660, https://doi.org/10.1029/2019RG000660, 2020. a
Boucher, O.: Atmospheric aerosols, Springer, https://doi.org/10.1007/978-94-017-9649-1_2, 2015. a
Canagaratna, M. R., Jimenez, J. L., Kroll, J. H., Chen, Q., Kessler, S. H., Massoli, P., Hildebrandt Ruiz, L., Fortner, E., Williams, L. R., Wilson, K. R., Surratt, J. D., Donahue, N. M., Jayne, J. T., and Worsnop, D. R.: Elemental ratio measurements of organic compounds using aerosol mass spectrometry: characterization, improved calibration, and implications, Atmos. Chem. Phys., 15, 253–272, https://doi.org/10.5194/acp-15-253-2015, 2015. a
Cappa, C. D., Kolesar, K. R., Zhang, X., Atkinson, D. B., Pekour, M. S., Zaveri, R. A., Zelenyuk, A., and Zhang, Q.: Understanding the optical properties of ambient sub- and supermicron particulate matter: results from the CARES 2010 field study in northern California, Atmos. Chem. Phys., 16, 6511–6535, https://doi.org/10.5194/acp-16-6511-2016, 2016. a
Chand, D., Guyon, P., Artaxo, P., Schmid, O., Frank, G. P., Rizzo, L. V., Mayol-Bracero, O. L., Gatti, L. V., and Andreae, M. O.: Optical and physical properties of aerosols in the boundary layer and free troposphere over the Amazon Basin during the biomass burning season, Atmos. Chem. Phys., 6, 2911–2925, https://doi.org/10.5194/acp-6-2911-2006, 2006. a
Chen, Q., Farmer, D. K., Schneider, J., Zorn, S. R., Heald, C. L., Karl, T. G., Guenther, A., Allan, J. D., Robinson, N., Coe, H., Kimmel, J. R., Pauliquevis, T., Borrmann, S., Pöschl, U., Andreae, M. O., Artaxo, P., Jimenez, J. L., and Martin, S. T.: Mass spectral characterization of submicron biogenic organic particles in the Amazon Basin, Geophys. Res. Lett., 36, https://doi.org/10.1029/2009GL039880, 2009. a, b
Chen, Q., Farmer, D. K., Rizzo, L. V., Pauliquevis, T., Kuwata, M., Karl, T. G., Guenther, A., Allan, J. D., Coe, H., Andreae, M. O., Pöschl, U., Jimenez, J. L., Artaxo, P., and Martin, S. T.: Submicron particle mass concentrations and sources in the Amazonian wet season (AMAZE-08), Atmos. Chem. Phys., 15, 3687–3701, https://doi.org/10.5194/acp-15-3687-2015, 2015. a
Cirino, G. G., Souza, R. A. F., Adams, D. K., and Artaxo, P.: The effect of atmospheric aerosol particles and clouds on net ecosystem exchange in the Amazon, Atmos. Chem. Phys., 14, 6523–6543, https://doi.org/10.5194/acp-14-6523-2014, 2014. a
Crenn, V., Sciare, J., Croteau, P. L., Verlhac, S., Fröhlich, R., Belis, C. A., Aas, W., Äijälä, M., Alastuey, A., Artiñano, B., Baisnée, D., Bonnaire, N., Bressi, M., Canagaratna, M., Canonaco, F., Carbone, C., Cavalli, F., Coz, E., Cubison, M. J., Esser-Gietl, J. K., Green, D. C., Gros, V., Heikkinen, L., Herrmann, H., Lunder, C., Minguillón, M. C., Močnik, G., O'Dowd, C. D., Ovadnevaite, J., Petit, J.-E., Petralia, E., Poulain, L., Priestman, M., Riffault, V., Ripoll, A., Sarda-Estève, R., Slowik, J. G., Setyan, A., Wiedensohler, A., Baltensperger, U., Prévôt, A. S. H., Jayne, J. T., and Favez, O.: ACTRIS ACSM intercomparison – Part 1: Reproducibility of concentration and fragment results from 13 individual Quadrupole Aerosol Chemical Speciation Monitors (Q-ACSM) and consistency with co-located instruments, Atmos. Meas. Tech., 8, 5063–5087, https://doi.org/10.5194/amt-8-5063-2015, 2015. a
Docherty, K. S., Jaoui, M., Corse, E., Jimenez, J. L., Offenberg, J. H., Lewandowski, M., and Kleindienst, T. E.: Collection efficiency of the aerosol mass spectrometer for chamber-generated secondary organic aerosols, Aerosol Sci. Tech., 47, 294–309, https://doi.org/10.1080/02786826.2012.752572, 2013. a
Espinoza, J.-C., Jimenez, J. C., Marengo, J. A., Schongart, J., Ronchail, J., Lavado-Casimiro, W., and Ribeiro, J. V. M.: The new record of drought and warmth in the Amazon in 2023 related to regional and global climatic features, Sci. Rep.-UK, 14, 8107, https://doi.org/10.1038/s41598-024-58782-5, 2024. a
Fleming, L. T., Lin, P., Roberts, J. M., Selimovic, V., Yokelson, R., Laskin, J., Laskin, A., and Nizkorodov, S. A.: Molecular composition and photochemical lifetimes of brown carbon chromophores in biomass burning organic aerosol, Atmos. Chem. Phys., 20, 1105–1129, https://doi.org/10.5194/acp-20-1105-2020, 2020. a
Franco, M. A., Ditas, F., Kremper, L. A., Machado, L. A. T., Andreae, M. O., Araújo, A., Barbosa, H. M. J., de Brito, J. F., Carbone, S., Holanda, B. A., Morais, F. G., Nascimento, J. P., Pöhlker, M. L., Rizzo, L. V., Sá, M., Saturno, J., Walter, D., Wolff, S., Pöschl, U., Artaxo, P., and Pöhlker, C.: Occurrence and growth of sub-50 nm aerosol particles in the Amazonian boundary layer, Atmos. Chem. Phys., 22, 3469–3492, https://doi.org/10.5194/acp-22-3469-2022, 2022. a, b, c, d
Franco, M. A., Valiati, R., Holanda, B. A., Meller, B. B., Kremper, L. A., Rizzo, L. V., Carbone, S., Morais, F. G., Nascimento, J. P., Andreae, M. O., Cecchini, M. A., Machado, L. A. T., Ponczek, M., Pöschl, U., Walter, D., Pöhlker, C., and Artaxo, P.: Vertically resolved aerosol variability at the Amazon Tall Tower Observatory under wet-season conditions, Atmos. Chem. Phys., 24, 8751–8770, https://doi.org/10.5194/acp-24-8751-2024, 2024. a, b, c, d, e, f, g, h, i, j
Franco, M. A., Tavares, P. H. T., Rizzo, L. V., Morais, F. G., Palácios, R., and Artaxo, P.: AERONET sun photometer as a didactic tool for understanding aerosol refractive index in the atmosphere: a case study for central Amazon, Rev. Bras. Ensino Fís., 47, e20240341, https://doi.org/10.1590/1806-9126-RBEF-2024-0341, 2025. a
Govender, P. and Sivakumar, V.: Application of k-means and hierarchical clustering techniques for analysis of air pollution: A review (1980–2019), Atmospheric Pollution Research, 11, 40–56, https://doi.org/10.1016/j.apr.2019.09.009, 2020. a
Graham, B., Guyon, P., Maenhaut, W., Taylor, P. E., Ebert, M., Matthias-Maser, S., Mayol-Bracero, O. L., Godoi, R. H., Artaxo, P., Meixner, F. X., Moura, M. A. L., Rocha, C. H. E. D., Grieken, R. V., Glovsky, M. M., Flagan, R. C., and Andreae, M. O.: Composition and diurnal variability of the natural Amazonian aerosol, J. Geophys. Res.-Atmos., 108, https://doi.org/10.1029/2003JD004049, 2003. a
Guyon, P., Boucher, O., Graham, B., Beck, J., Mayol-Bracero, O. L., Roberts, G. C., Maenhaut, W., Artaxo, P., and Andreae, M. O.: Refractive index of aerosol particles over the Amazon tropical forest during LBA-EUSTACH 1999, J. Aerosol Sci., 34, 883–907, https://doi.org/10.1016/S0021-8502(03)00052-1, 2003. a
Hand, J. L. and Malm, W. C.: Review of aerosol mass scattering efficiencies from ground-based measurements since 1990, J. Geophys. Res.-Atmos., 112, https://doi.org/10.1029/2007JD008484, 2007. a
Heikkinen, L., Äijälä, M., Riva, M., Luoma, K., Dällenbach, K., Aalto, J., Aalto, P., Aliaga, D., Aurela, M., Keskinen, H., Makkonen, U., Rantala, P., Kulmala, M., Petäjä, T., Worsnop, D., and Ehn, M.: Long-term sub-micrometer aerosol chemical composition in the boreal forest: inter- and intra-annual variability, Atmos. Chem. Phys., 20, 3151–3180, https://doi.org/10.5194/acp-20-3151-2020, 2020. a
Holanda, B. A., Pöhlker, M. L., Walter, D., Saturno, J., Sörgel, M., Ditas, J., Ditas, F., Schulz, C., Franco, M. A., Wang, Q., Donth, T., Artaxo, P., Barbosa, H. M. J., Borrmann, S., Braga, R., Brito, J., Cheng, Y., Dollner, M., Kaiser, J. W., Klimach, T., Knote, C., Krüger, O. O., Fütterer, D., Lavrič, J. V., Ma, N., Machado, L. A. T., Ming, J., Morais, F. G., Paulsen, H., Sauer, D., Schlager, H., Schneider, J., Su, H., Weinzierl, B., Walser, A., Wendisch, M., Ziereis, H., Zöger, M., Pöschl, U., Andreae, M. O., and Pöhlker, C.: Influx of African biomass burning aerosol during the Amazonian dry season through layered transatlantic transport of black carbon-rich smoke, Atmos. Chem. Phys., 20, 4757–4785, https://doi.org/10.5194/acp-20-4757-2020, 2020. a, b, c, d
Holanda, B. A., Franco, M. A., Walter, D., Artaxo, P., Carbone, S., Cheng, Y., Chowdhury, S., Ditas, F., Gysel-Beer, M., Klimach, T., Kremper, L. A., Krüger, O. O., Lavrič, J. V., Lelieveld, J., Ma, C., Machado, L. A. T., Modini, R. L., Morais, F. G., Pozzer, A., Saturno, J., Su, H., Wendisch, M., Wolff, S., Pöhlker, M. L., Andreae, M. O., Pöschl, U., and Pöhlker, C.: African biomass burning affects aerosol cycling over the Amazon, Commun. Earth Environ., 4, 154, https://doi.org/10.1038/s43247-023-00795-5, 2023. a, b, c, d, e, f
Huffman, J. A., Sinha, B., Garland, R. M., Snee-Pollmann, A., Gunthe, S. S., Artaxo, P., Martin, S. T., Andreae, M. O., and Pöschl, U.: Size distributions and temporal variations of biological aerosol particles in the Amazon rainforest characterized by microscopy and real-time UV-APS fluorescence techniques during AMAZE-08, Atmos. Chem. Phys., 12, 11997–12019, https://doi.org/10.5194/acp-12-11997-2012, 2012. a, b
Kuwata, M., Zorn, S. R., and Martin, S. T.: Using elemental ratios to predict the density of organic material composed of carbon, hydrogen, and oxygen, Environ. Sci. Technol., 46, 787–794, https://doi.org/10.1021/es202525q, 2012. a
Lack, D. A. and Langridge, J. M.: On the attribution of black and brown carbon light absorption using the Ångström exponent, Atmos. Chem. Phys., 13, 10535–10543, https://doi.org/10.5194/acp-13-10535-2013, 2013. a
Lang, N., Jetz, W., Schindler, K., and Wegner, J. D.: A high-resolution canopy height model of the Earth, Nat. Ecol. Evol., 7, 1778–1789, https://doi.org/10.1038/s41559-023-02206-6, 2023. a
Li, J., Hendricks, J., Righi, M., and Beer, C. G.: An aerosol classification scheme for global simulations using the K-means machine learning method, Geosci. Model Dev., 15, 509–533, https://doi.org/10.5194/gmd-15-509-2022, 2022. a
Li, Y., Ezell, M. J., and Finlayson-Pitts, B. J.: The impact of organic coatings on light scattering by sodium chloride particles, Atmos. Environ., 45, 4123–4132, https://doi.org/10.1016/j.atmosenv.2011.05.031, 2011. a
Liu, L., Cheng, Y., Wang, S., Wei, C., Pöhlker, M. L., Pöhlker, C., Artaxo, P., Shrivastava, M., Andreae, M. O., Pöschl, U., and Su, H.: Impact of biomass burning aerosols on radiation, clouds, and precipitation over the Amazon: relative importance of aerosol–cloud and aerosol–radiation interactions, Atmos. Chem. Phys., 20, 13283–13301, https://doi.org/10.5194/acp-20-13283-2020, 2020. a
Löbs, N., Barbosa, C. G. G., Brill, S., Walter, D., Ditas, F., de Oliveira Sá, M., de Araújo, A. C., de Oliveira, L. R., Godoi, R. H. M., Wolff, S., Piepenbring, M., Kesselmeier, J., Artaxo, P., Andreae, M. O., Pöschl, U., Pöhlker, C., and Weber, B.: Aerosol measurement methods to quantify spore emissions from fungi and cryptogamic covers in the Amazon, Atmos. Meas. Tech., 13, 153–164, https://doi.org/10.5194/amt-13-153-2020, 2020. a
Machado, L. A. T., Franco, M. A., Kremper, L. A., Ditas, F., Andreae, M. O., Artaxo, P., Cecchini, M. A., Holanda, B. A., Pöhlker, M. L., Saraiva, I., Wolff, S., Pöschl, U., and Pöhlker, C.: How weather events modify aerosol particle size distributions in the Amazon boundary layer, Atmos. Chem. Phys., 21, 18 065–18 086, https://doi.org/10.5194/acp-21-18065-2021, 2021. a, b
Machado, L. A. T., Kesselmeier, J., Botía, S., van Asperen, H., O. Andreae, M., de Araújo, A. C., Artaxo, P., Edtbauer, A., R. Ferreira, R., Franco, M. A., Harder, H., Jones, S. P., Dias-Júnior, C. Q., Haytzmann, G. G., Quesada, C. A., Komiya, S., Lavric, J., Lelieveld, J., Levin, I., Nölscher, A., Pfannerstill, E., Pöhlker, M. L., Pöschl, U., Ringsdorf, A., Rizzo, L., Yáñez-Serrano, A. M., Trumbore, S., Valenti, W. I. D., Vila-Guerau de Arellano, J., Walter, D., Williams, J., Wolff, S., and Pöhlker, C.: How rainfall events modify trace gas mixing ratios in central Amazonia, Atmos. Chem. Phys., 24, 8893–8910, https://doi.org/10.5194/acp-24-8893-2024, 2024a. a
Machado, L. A. T., Unfer, G. R., Brill, S., Hildmann, S., Pöhlker, C., Cheng, Y., Williams, J., Hartwig, H., Andreae, M. O., Artaxo, P., Curtius, J., Franco, M. A., Cecchini, M. A., Edtbauer, A., Hoffmann, T., Holanda, B., Khadir, T., Krejci, R., Kremper, L. A., Liu, Y., Meller, B. B., Pöhlker, M. L., Quesada, C. A., Ringsdorf, A., Riipinen, I., Trumbore, S., Wolff, S., Lelieveld, J., and Pöschl, U.: Frequent rainfall-induced new particle formation within the canopy in the Amazon rainforest, Nat. Geosci., 1–8, https://doi.org/10.1038/s41561-024-01585-0, 2024b. a
MacQueen, J.: Some methods for classification and analysis of multivariate observations, in: Proceedings of the fifth Berkeley symposium on mathematical statistics and probability, Oakland, CA, USA, 281–297, https://api.semanticscholar.org/CorpusID:6278891 (last access: 4 November 2025), 1967. a
Marengo, J., Cunha, A., Espinoza, J., Fu, R., Schöngart, J., Jimenez, J., Costa, M., Ribeiro, J., Wongchuig, S., and Zhao, S.: The Drought of Amazonia in 2023-2024, American Journal of Climate Change, 13, 567–597, https://doi.org/10.4236/ajcc.2024.133026, 2024. a
Martins, J. V., Artaxo, P., Liousse, C., Reid, J. S., Hobbs, P. V., and Kaufman, Y. J.: Effects of black carbon content, particle size, and mixing on light absorption by aerosols from biomass burning in Brazil, J. Geophys. Res.-Atmos., 103, 32041–32050, https://doi.org/10.1029/98JD02593, 1998. a
Massoli, P., Murphy, D. M., Lack, D. A., Baynard, T., Brock, C. A., and Lovejoy, E. R.: Uncertainty in light scattering measurements by TSI nephelometer: Results from laboratory studies and implications for ambient measurements, Aerosol Sci. Tech., 43, 1064–1074, https://doi.org/10.1080/02786820903156542, 2009. a
Middlebrook, A. M., Bahreini, R., Jimenez, J. L., and Canagaratna, M. R.: Evaluation of composition-dependent collection efficiencies for the aerodyne aerosol mass spectrometer using field data, Aerosol Sci. Tech., 46, 258–271, https://doi.org/10.1080/02786826.2011.620041, 2012. a
Morais, F. G., Franco, M. A., Palácios, R., Machado, L. A. T., Rizzo, L. V., Barbosa, H. M. J., Jorge, F., Schafer, J. S., Holben, B. N., Landulfo, E., and Artaxo, P.: Relationship between land use and spatial variability of atmospheric brown carbon and black carbon aerosols in Amazonia, Atmosphere-Basel, 13, 1328, https://doi.org/10.3390/atmos13081328, 2022. a
Moran-Zuloaga, D., Ditas, F., Walter, D., Saturno, J., Brito, J., Carbone, S., Chi, X., Hrabě de Angelis, I., Baars, H., Godoi, R. H. M., Heese, B., Holanda, B. A., Lavrič, J. V., Martin, S. T., Ming, J., Pöhlker, M. L., Ruckteschler, N., Su, H., Wang, Y., Wang, Q., Wang, Z., Weber, B., Wolff, S., Artaxo, P., Pöschl, U., Andreae, M. O., and Pöhlker, C.: Long-term study on coarse mode aerosols in the Amazon rain forest with the frequent intrusion of Saharan dust plumes, Atmos. Chem. Phys., 18, 10055–10088, https://doi.org/10.5194/acp-18-10055-2018, 2018. a, b, c
Müller, T., Laborde, M., Kassell, G., and Wiedensohler, A.: Design and performance of a three-wavelength LED-based total scatter and backscatter integrating nephelometer, Atmos. Meas. Tech., 4, 1291–1303, https://doi.org/10.5194/amt-4-1291-2011, 2011. a, b
Nascimento, J. P., Bela, M. M., Meller, B. B., Banducci, A. L., Rizzo, L. V., Vara-Vela, A. L., Barbosa, H. M. J., Gomes, H., Rafee, S. A. A., Franco, M. A., Carbone, S., Cirino, G. G., Souza, R. A. F., McKeen, S. A., and Artaxo, P.: Aerosols from anthropogenic and biogenic sources and their interactions – modeling aerosol formation, optical properties, and impacts over the central Amazon basin, Atmos. Chem. Phys., 21, 6755–6779, https://doi.org/10.5194/acp-21-6755-2021, 2021. a
Ng, N. L., Herndon, S. C., Trimborn, A., Canagaratna, M. R., Croteau, P. L., Onasch, T. B., Sueper, D., Worsnop, D. R., Zhang, Q., Sun, Y. L., and Jayne, J. T.: An Aerosol Chemical Speciation Monitor (ACSM) for routine monitoring of the composition and mass concentrations of ambient aerosol, Aerosol Sci. Tech., 45, 780–794, https://doi.org/10.1080/02786826.2011.560211, 2011. a, b
Palácios, R., Castagna, D., Barbosa, L., Souza, A. P., Imbiriba, B., Zolin, C. A., Nassarden, D., Duarte, L., Morais, F. G., Franco, M. A., Cirino, G., Kuhn, P., Sodré, G., Curado, L., Basso, J., Roberto de Paulo, S., and Rodrigues, T.: ENSO effects on the relationship between aerosols and evapotranspiration in the south of the Amazon biome, Environ. Res., 250, 118516, https://doi.org/10.1016/j.envres.2024.118516, 2024. a
Palácios, R. S., Romera, K. S., Curado, L. F. A., Banga, N. M., Rothmund, L. D., da Silva Sallo, F., Morais, D., Santos, A. C. A., Moraes, T. J., Morais, F. G., Landulfo, E., Franco, M. A. M., Kuhnen, I. A., Marques, J. B., Nogueira, J. S., do Valle Júnior, L. C. G., and Rodrigues, T. R.: Long term analysis of optical and radiative properties of aerosols in the Amazon Basin, Aerosol Air Qual. Res., 20, 139–154, https://doi.org/10.4209/aaqr.2019.04.0189, 2020. a
Ponczek, M., Franco, M. A., Carbone, S., Rizzo, L. V., dos Santos, D. M., Morais, F. G., Duarte, A., Barbosa, H. M. J., and Artaxo, P.: Linking the chemical composition and optical properties of biomass burning aerosols in Amazonia, Environ. Sci. Atmos., 2, 252–269, https://doi.org/10.1039/D1EA00055A, 2022. a, b, c
Prass, M., Andreae, M. O., de Araùjo, A. C., Artaxo, P., Ditas, F., Elbert, W., Förster, J.-D., Franco, M. A., Hrabe de Angelis, I., Kesselmeier, J., Klimach, T., Kremper, L. A., Thines, E., Walter, D., Weber, J., Weber, B., Fuchs, B. M., Pöschl, U., and Pöhlker, C.: Bioaerosols in the Amazon rain forest: temporal variations and vertical profiles of Eukarya, Bacteria, and Archaea, Biogeosciences, 18, 4873–4887, https://doi.org/10.5194/bg-18-4873-2021, 2021. a, b, c
Pöhlker, C., Huffmann, J. A., and Pöschl, U.: Autofluorescence of atmospheric bioaerosols-fluorescent biomolecules and potential interferences, Atmos. Meas. Tech., 5, 37–71, https://doi.org/10.5194/amt-5-37-2012, 2012. a
Pöhlker, C., Walter, D., Paulsen, H., Könemann, T., Rodríguez-Caballero, E., Moran-Zuloaga, D., Brito, J., Carbone, S., Degrendele, C., Després, V. R., Ditas, F., Holanda, B. A., Kaiser, J. W., Lammel, G., Lavrič, J. V., Ming, J., Pickersgill, D., Pöhlker, M. L., Praß, M., Löbs, N., Saturno, J., Sörgel, M., Wang, Q., Weber, B., Wolff, S., Artaxo, P., Pöschl, U., and Andreae, M. O.: Land cover and its transformation in the backward trajectory footprint region of the Amazon Tall Tower Observatory, Atmos. Chem. Phys., 19, 8425–8470, https://doi.org/10.5194/acp-19-8425-2019, 2019. a, b
Pöhlker, M. L., Pöhlker, C., Ditas, F., Klimach, T., Hrabe de Angelis, I., Araújo, A., Brito, J., Carbone, S., Cheng, Y., Chi, X., Ditz, R., Gunthe, S. S., Kesselmeier, J., Könemann, T., Lavrič, J. V., Martin, S. T., Mikhailov, E., Moran-Zuloaga, D., Rose, D., Saturno, J., Su, H., Thalman, R., Walter, D., Wang, J., Wolff, S., Barbosa, H. M. J., Artaxo, P., Andreae, M. O., and Pöschl, U.: Long-term observations of cloud condensation nuclei in the Amazon rain forest – Part 1: Aerosol size distribution, hygroscopicity, and new model parametrizations for CCN prediction, Atmos. Chem. Phys., 16, 15709–15740, https://doi.org/10.5194/acp-16-15709-2016, 2016. a, b, c, d, e
Pöhlker, M. L., Ditas, F., Saturno, J., Klimach, T., Hrabě de Angelis, I., Araùjo, A. C., Brito, J., Carbone, S., Cheng, Y., Chi, X., Ditz, R., Gunthe, S. S., Holanda, B. A., Kandler, K., Kesselmeier, J., Könemann, T., Krüger, O. O., Lavrič, J. V., Martin, S. T., Mikhailov, E., Moran-Zuloaga, D., Rizzo, L. V., Rose, D., Su, H., Thalman, R., Walter, D., Wang, J., Wolff, S., Barbosa, H. M. J., Artaxo, P., Andreae, M. O., Pöschl, U., and Pöhlker, C.: Long-term observations of cloud condensation nuclei over the Amazon rain forest – Part 2: Variability and characteristics of biomass burning, long-range transport, and pristine rain forest aerosols, Atmos. Chem. Phys., 18, 10289–10331, https://doi.org/10.5194/acp-18-10289-2018, 2018. a, b
Pöschl, U., Martin, S. T., Sinha, B., Chen, Q., Gunthe, S. S., Huffman, J. A., Borrmann, S., Farmer, D. K., Garland, R. M., Helas, G., Jimenez, J. L., King, S. M., Manzi, A., Mikhailov, E., Pauliquevis, T., Petters, M. D., Prenni, A. J., Roldin, P., Rose, D., Schneider, J., Su, H., Zorn, S. R., Artaxo, P., and Andreae, M. O.: Rainforest aerosols as biogenic nuclei of clouds and precipitation in the Amazon, Science, 329, 1513–1516, https://doi.org/10.1126/science.1191056, 2010. a
Reid, J. S., Eck, T. F., Christopher, S. A., Koppmann, R., Dubovik, O., Eleuterio, D. P., Holben, B. N., Reid, E. A., and Zhang, J.: A review of biomass burning emissions part III: intensive optical properties of biomass burning particles, Atmos. Chem. Phys., 5, 827–849, https://doi.org/10.5194/acp-5-827-2005, 2005. a
Rizzo, L. V., Correia, A. L., Artaxo, P., Procópio, A. S., and Andreae, M. O.: Spectral dependence of aerosol light absorption over the Amazon Basin, Atmos. Chem. Phys., 11, 8899–8912, https://doi.org/10.5194/acp-11-8899-2011, 2011. a
Rizzo, L. V., Artaxo, P., Müller, T., Wiedensohler, A., Paixão, M., Cirino, G. G., Arana, A., Swietlicki, E., Roldin, P., Fors, E. O., Wiedemann, K. T., Leal, L. S. M., and Kulmala, M.: Long term measurements of aerosol optical properties at a primary forest site in Amazonia, Atmos. Chem. Phys., 13, 2391–2413, https://doi.org/10.5194/acp-13-2391-2013, 2013. a, b, c
Rosenfeld, D., Lohmann, U., Raga, G. B., O'Dowd, C. D., Kulmala, M., Fuzzi, S., Reissell, A., and Andreae, M. O.: Flood or drought: how do aerosols affect precipitation?, Science, 321, 1309–1313, https://doi.org/10.1126/science.1160606, 2008. a
Russell, P. B., Bergstrom, R. W., Shinozuka, Y., Clarke, A. D., DeCarlo, P. F., Jimenez, J. L., Livingston, J. M., Redemann, J., Dubovik, O., and Strawa, A.: Absorption Angstrom Exponent in AERONET and related data as an indicator of aerosol composition, Atmos. Chem. Phys., 10, 1155–1169, https://doi.org/10.5194/acp-10-1155-2010, 2010. a
Saturno, J., Holanda, B. A., Pöhlker, C., Ditas, F., Wang, Q., Moran-Zuloaga, D., Brito, J., Carbone, S., Cheng, Y., Chi, X., Ditas, J., Hoffmann, T., Hrabe de Angelis, I., Könemann, T., Lavrič, J. V., Ma, N., Ming, J., Paulsen, H., Pöhlker, M. L., Rizzo, L. V., Schlag, P., Su, H., Walter, D., Wolff, S., Zhang, Y., Artaxo, P., Pöschl, U., and Andreae, M. O.: Black and brown carbon over central Amazonia: long-term aerosol measurements at the ATTO site, Atmos. Chem. Phys., 18, 12817–12843, https://doi.org/10.5194/acp-18-12817-2018, 2018. a, b, c, d
Schnitzler, E. G., Gerrebos, N. G. A., Carter, T. S., Huang, Y., Heald, C. L., Bertram, A. K., and Abbatt, J. P. D.: Rate of atmospheric brown carbon whitening governed by environmental conditions, P. Natl. Acad. Sci. USA, 119, e2205610119, https://doi.org/10.1073/pnas.2205610119, 2022. a
Schuster, G. L., Dubovik, O., and Holben, B. N.: Angstrom exponent and bimodal aerosol size distributions, J. Geophys. Res.-Atmos., 111, https://doi.org/10.1029/2005JD006328, 2006. a, b
Seinfeld, J. H. and Pandis, S. N.: Atmospheric Chemistry and Physics: From Air Pollution to Climate Change, John Wiley & Sons, Washington, United States of America, ISBN 9781119221166, 2012. a
Shilling, J. E., Pekour, M. S., Fortner, E. C., Artaxo, P., de Sá, S., Hubbe, J. M., Longo, K. M., Machado, L. A. T., Martin, S. T., Springston, S. R., Tomlinson, J., and Wang, J.: Aircraft observations of the chemical composition and aging of aerosol in the Manaus urban plume during GoAmazon 2014/5, Atmos. Chem. Phys., 18, 10773–10797, https://doi.org/10.5194/acp-18-10773-2018, 2018. a
Sun, T., Wu, C., Wu, D., Liu, B., Sun, J. Y., Mao, X., Yang, H., Deng, T., Song, L., Li, M., Li, Y. J., and Zhou, Z.: Time-resolved black carbon aerosol vertical distribution measurements using a 356-m meteorological tower in Shenzhen, Theor. Appl. Climatol., 140, 1263–1276, 2020. a
Suthar, M., Dufossé, L., and Singh, S. K.: The enigmatic world of fungal melanin: a comprehensive review, Journal of Fungi, 9, 891, https://doi.org/10.3390/jof9090891, 2023. a, b
Szopa, S., Naik, V., Adhikary, B., Artaxo, P., Berntsen, T., Collins, W. D., Fuzzi, S., Gallardo, L., Kiendler-Scharr, A., Klimont, Z., Liao, H., Unger, N., and Zanis, P.: Short-Lived Climate Forcers (Chapter 6), https://doi.org/10.1017/9781009157896.008, 2021. a
Talbot, R., Andreae, M., Berresheim, H., Artaxo, P., Garstang, M., Harriss, R., Beecher, K., and Li, S.: Aerosol chemistry during the wet season in central Amazonia: The influence of long-range transport, J. Geophys. Res.-Atmos., 95, 16955–16969, https://doi.org/10.1029/JD095iD10p16955, 1990. a
Tost, H.: Chemistry–climate interactions of aerosol nitrate from lightning, Atmos. Chem. Phys., 17, 1125–1142, https://doi.org/10.5194/acp-17-1125-2017, 2017. a
Updyke, K. M., Nguyen, T. B., and Nizkorodov, S. A.: Formation of brown carbon via reactions of ammonia with secondary organic aerosols from biogenic and anthropogenic precursors, Atmos. Environ., 63, 22–31, https://doi.org/10.1016/j.atmosenv.2012.09.012, 2012. a
Varanda Rizzo, L., Roldin, P., Brito, J., Backman, J., Swietlicki, E., Krejci, R., Tunved, P., Petäjä, T., Kulmala, M., and Artaxo, P.: Multi-year statistical and modeling analysis of submicrometer aerosol number size distributions at a rain forest site in Amazonia, Atmos. Chem. Phys., 18, 10255–10274, https://doi.org/10.5194/acp-18-10255-2018, 2018. a
von der Weiden, S.-L., Drewnick, F., and Borrmann, S.: Particle Loss Calculator – a new software tool for the assessment of the performance of aerosol inlet systems, Atmos. Meas. Tech., 2, 479–494, https://doi.org/10.5194/amt-2-479-2009, 2009. a
Wang, J., Krejci, R., Giangrande, S., Kuang, C., Barbosa, H. M., Brito, J., Carbone, S., Chi, X., Comstock, J., Ditas, F., Lavric, J., Manninen, H. E., Mei, F., Moran-Zuloaga, D., Pöhlker, C., Pöhlker, M. L., Saturno, J., Schmid, B., Souza, R. A. F., Springston, S. R., Tomlinson, J. M., Toto, T., Walter, D., Wimmer, D., Smith, J. N., Kulmala, M., Machado, L. A. T., Artaxo, P., Andreae, M. O., Petäjä, T., and Martin, S. T.: Amazon boundary layer aerosol concentration sustained by vertical transport during rainfall, Nature, 539, 416–419, https://doi.org/10.1038/nature19819, 2016a. a
Wang, X., Heald, C. L., Sedlacek, A. J., de Sá, S. S., Martin, S. T., Alexander, M. L., Watson, T. B., Aiken, A. C., Springston, S. R., and Artaxo, P.: Deriving brown carbon from multiwavelength absorption measurements: method and application to AERONET and Aethalometer observations, Atmos. Chem. Phys., 16, 12733–12752, https://doi.org/10.5194/acp-16-12733-2016, 2016b. a, b, c
Wong, J. P. S., Tsagkaraki, M., Tsiodra, I., Mihalopoulos, N., Violaki, K., Kanakidou, M., Sciare, J., Nenes, A., and Weber, R. J.: Atmospheric evolution of molecular-weight-separated brown carbon from biomass burning, Atmos. Chem. Phys., 19, 7319–7334, https://doi.org/10.5194/acp-19-7319-2019, 2019. a
Yáñez-Serrano, A. M., Nölscher, A. C., Williams, J., Wolff, S., Alves, E., Martins, G. A., Bourtsoukidis, E., Brito, J., Jardine, K., Artaxo, P., and Kesselmeier, J.: Diel and seasonal changes of biogenic volatile organic compounds within and above an Amazonian rainforest, Atmos. Chem. Phys., 15, 3359–3378, https://doi.org/10.5194/acp-15-3359-2015, 2015. a
Yáñez-Serrano, A. M., Nölscher, A. C., Bourtsoukidis, E., Gomes Alves, E., Ganzeveld, L., Bonn, B., Wolff, S., Sa, M., Yamasoe, M., Williams, J., Andreae, M. O., and Kesselmeier, J.: Monoterpene chemical speciation in a tropical rainforest:variation with season, height, and time of dayat the Amazon Tall Tower Observatory (ATTO), Atmos. Chem. Phys., 18, 3403–3418, https://doi.org/10.5194/acp-18-3403-2018, 2018. a