the Creative Commons Attribution 4.0 License.
the Creative Commons Attribution 4.0 License.
 | 14 Nov 2025
How COVID-19 related policies reshaped organic aerosol source contributions in Central London
Anja H. Tremper
Max Priestman
Anna Font
David C. Green
Organic aerosol (OA), a major component of submicron particulate matter (PM1), has significant impacts on both human health and climate. Quantifying its sources is therefore crucial for developing effective mitigation strategies. Positive matrix factorisation (PMF) applied to aerosol chemical speciation monitor (ACSM) mass spectral data offers a robust approach for quantifying OA sources. A year-long study of ACSM data from London's Marylebone Road monitoring station during the COVID-19 pandemic provides insights into the impact of lockdown and the Eat Out To Help Out (EOTHO) scheme, which offered support to the hospitality industry during the pandemic, on PM composition and OA sources. Five OA sources were identified including hydrocarbon-like OA (HOA, traffic-related, 11 % to OA), cooking OA (COA, 20 %), biomass burning OA (BBOA, 12 %), more-oxidized oxygenated OA (MO-OOA, 38 %), and less-oxidized oxygenated OA (LO-OOA, 21 %). Lockdown significantly reduced HOA (−52 %), COA (−67 %), and BBOA (−42 %) compared to their pre-COVID levels, while EOTHO doubled COA (+100 %) compared to the post-lockdown period. However, MO-OOA and LO-OOA were less affected, as these primarily originated from long-range transport. This research has demonstrated the importance of commercial cooking as a significant source of OA (20 %) and PM1 (9 %) in urban areas. The co-emission of BBOA with COA observed in Central London showed a similar diurnal cycle and response to the EOTHO policy, indicating that cooking activities might be currently underestimated and contribute to urban BBOA. Therefore, more effort is required to quantify this source and develop targeted abatement policies to mitigate emissions as currently limited regulation is in force.
- Article
(4736 KB) - Full-text XML
-
Supplement
(2364 KB) - BibTeX
- EndNote


Atmospheric particulate matter (PM) are tiny particles suspended in the air, which impact the climate directly and indirectly (IPCC, 2021; Seinfeld et al., 2006), and cause adverse human health effects (Kelly and Fussell, 2012; World Health Organization, 2021). The PM present in urban areas, such as London, is emitted directly or indirectly from a wide range of natural and anthropogenic sources, can be changed through atmospheric reactions and remain airborne for many days. It is consequently a complex mixture including inorganic species (metals, minerals, black carbon, nitrate, sulphate, etc.) and thousands of organic compounds whose origins remain too complicated to fully quantify. PM2.5 (PM with aerodynamic diameter smaller than 2.5 µm) is strongly associated with increased risks of cardiovascular and respiratory related mortalities and hospital admissions (Dominici et al., 2006; Joo et al., 2024; Pye et al., 2021; Wei et al., 2022, 2024). Some studies (Lippmann et al., 2013; UK Health Security Agency (UKHSA), 2022) have begun to demonstrate that some PM constituents and sources have stronger associations with a range of health metrics, including mortality, morbidity, and toxicities although the evidence remains inconsistent (Kelly and Fussell, 2012; Liu et al., 2023; Vasilakopoulou et al., 2023). With 99 % of the urban population in Europe exposed to PM2.5 concentrations exceeding the WHO air quality guideline (European Environment Agency, 2024; World Health Organization, 2021), delivering clean air is a target for European and international governments according to the EU air quality directive (European Union, 2024). However, delivering publicly acceptable policies to improve air quality remains challenging (Mebrahtu et al., 2023; Oltra et al., 2021). Targeting the sources of PM that are most health-relevant could be a more cost-effective (Wu et al., 2023), more easily communicated and more publicly acceptable approaches (Pinakidou, 2025) to improve public health. It is therefore important to better quantify the sources of PM and understand how they respond to policy interventions.
The COVID-19 pandemic is a natural experiment to assess the impact of policies which, while not aiming to reduce PM2.5 concentrations, significantly restricted social and economic activities and consequently reduced emissions. During the UK national lockdown, people were ordered to stay at home, and all non-essential businesses were closed, including pubs, cafes and restaurants from the end of 26 March 2020. Non-essential shops were allowed to open from 15 June 2020, and the first national lockdown came to an end on 23 June 2020. However, pubs, restaurants, and cafes were only allowed to open from 4 July 2020. The UK recorded a 2.5 % drop in Gross Domestic Product (GDP) in the first quarter of 2020, partly as people reduced their own activity prior to national lockdown. This accelerated to a 19.8 % fall in GDP in April to June 2020 and household spending fell by over 20 % over this period, the largest quarterly contraction on record, which was driven by falls in spending on restaurants, hotels, transport, and recreation (ONS, 2022). The UK Government Eat Out to Help Out (EOTHO) Scheme is examined specifically in this study as it influenced emissions from the commercial cooking sector. It was designed to help the hospitality industry recover from the financial impact of the national lockdown, offering a 50 % meal discount up to a maximum of GBP 10, which operated Monday to Wednesday, 3 August to 31 August 2020.
While the impact of these lockdown policies on some air quality metrics was smaller than expected given the large change in emissions (Shi et al., 2021), the abrupt nature of the intervention ensures it is easier to detect than other air quality policies that are more incremental in nature (Mudway et al., 2019). Some studies have investigated the lockdown impacts on chemical composition and sources of PM, which mainly focused on cities in China (Hu et al., 2022; Tian et al., 2021; Xu et al., 2020), a kerbside site in Toronto, Canada (Jeong et al., 2022), and an urban background site in Paris, France (Petit et al., 2021). These studies all resolved primary sources including traffic related emissions, biomass burning emissions from residential heating, cooking emissions (except Paris), and secondary sources from positive matrix factorisation (PMF) analysis on organic aerosol (OA). Traffic and cooking emissions appeared to decrease during the lockdown in all sites, while biomass burning predominately from residential heating sources in Chinese cities increased as result of remote work and rather early lockdown measures (January–February 2020) compared to France. Secondary organic aerosol (SOA) showed a more complex phenomenon given its abundance in organic components and dynamic spatiotemporal conditions. Overall, the lockdowns resulted in decreased SOA in both northwest cities in China (Tian et al., 2021; Xu et al., 2020) and Paris (Petit et al., 2021) due to lower primary emissions, and therefore fewer SOA formation products. However, Beijing experienced a large increase in SOA concentrations due to increased fossil fuel and biomass burning emissions, long-range transport influences as well as favourable meteorological conditions (high RH, low wind speed and low boundary layer height) for SOA formation during the lockdown period (Hu et al., 2022). Therefore, the lockdown effects on the SOA were dependent on the abundance of primary emissions, long-range transported air masses, and meteorological conditions. To date, there are few studies that investigate how COVID-related policies could have impacted PM chemical composition and sources. Petit et al. (2021) and Gamelas et al. (2023) are the only two studies in Europe. The unique COVID-related policies in the UK therefore provide a rare opportunity to investigate the impacts these policies had on chemical composition and OA. We used highly time resolved measurements from an air quality supersite located in the Central London from 2019 to 2020, and advanced source apportionment approaches to quantify the PM composition and OA sources before, during and after the UK national lockdown and EOTHO scheme. This study provides valuable insight into PM sources and composition in a global mega city and how air quality responds to abrupt changes in emissions from different sources. Importantly, it helps to establish the importance of cooking as a source of PM and uniquely associates biomass burning organic aerosol with commercial cooking emissions. This provides crucial information to policy makers as they attempt to reduce exposure to air pollution in urban areas.
2.1 Air quality monitoring supersite in Central London
The London Marylebone Road supersite (MY, 51.52° N, −0.15° E) is a kerbside air quality monitoring site, one meter away from a busy 6-lane road in Central London. It is a well-established air quality supersite that has consistently generated high-quality air pollution data since 1997 including mass concentration of bulk PM1, PM2.5, and PM10, as well as PM composition including black carbon, heavy metals, nitrate (NO3), sulphate (SO4), ammonium (NH4), OA, Chloride (Cl), etc. More details of this site can be found at https://uk-air.defra.gov.uk/networks/site-info?site_id=MY1 (last access: 23 September 2025).
2.2 Instrumentations
Quadrupole aerosol chemical speication monitor (Q-ACSM, Aerodyne, Ltd., Ng et al., 2011) with a standard vaporizer provides 30 min mass loadings of chemical species within non-refractory submicron aerosol (NR-PM1), including NH4, NO3, SO4, Cl, and OA. Sampled particles are focused into a narrow beam using the aerodynamic lens and impacted on a filament surface at 600 °C, where the NR-PM1 is vaporised and ionised instantly by an electron impact source (70 eV). These ions are detected by the RGA quadrupole mass spectroscopy to provide a mass spectrum of NR-PM1 up to a mass-to-charge ratio () of 148 Th. The mass concentration of different chemical species are calculated using the fragmentation table developed by Allan et al. (2004), updated for Cl following suggestions provided by Tobler et al. (2020), and a composition-dependent collection efficiency (CDCE) correction suggested by Middlebrook et al. (2012) by following the ACTRIS standard operation procedure (https://www.actris-ecac.eu/pmc-non-refractory-organics-and-inorganics, last access: 23 September 2025). With co-located black carbon (BC) measurement using a PM2.5 cyclone with AE33 (Aerosol Magee Scientific, Ltd.) and PM1 measurements using FIDAS (Palas, GmbH), we conducted the mass closure for fine particles measurements. The sum of NR-PM1 and BC (in PM2.5) reproduces PM1 concentrations well, with a slope of 1.13 and an R2 of 0.73 (Fig. S1 in the Supplement).
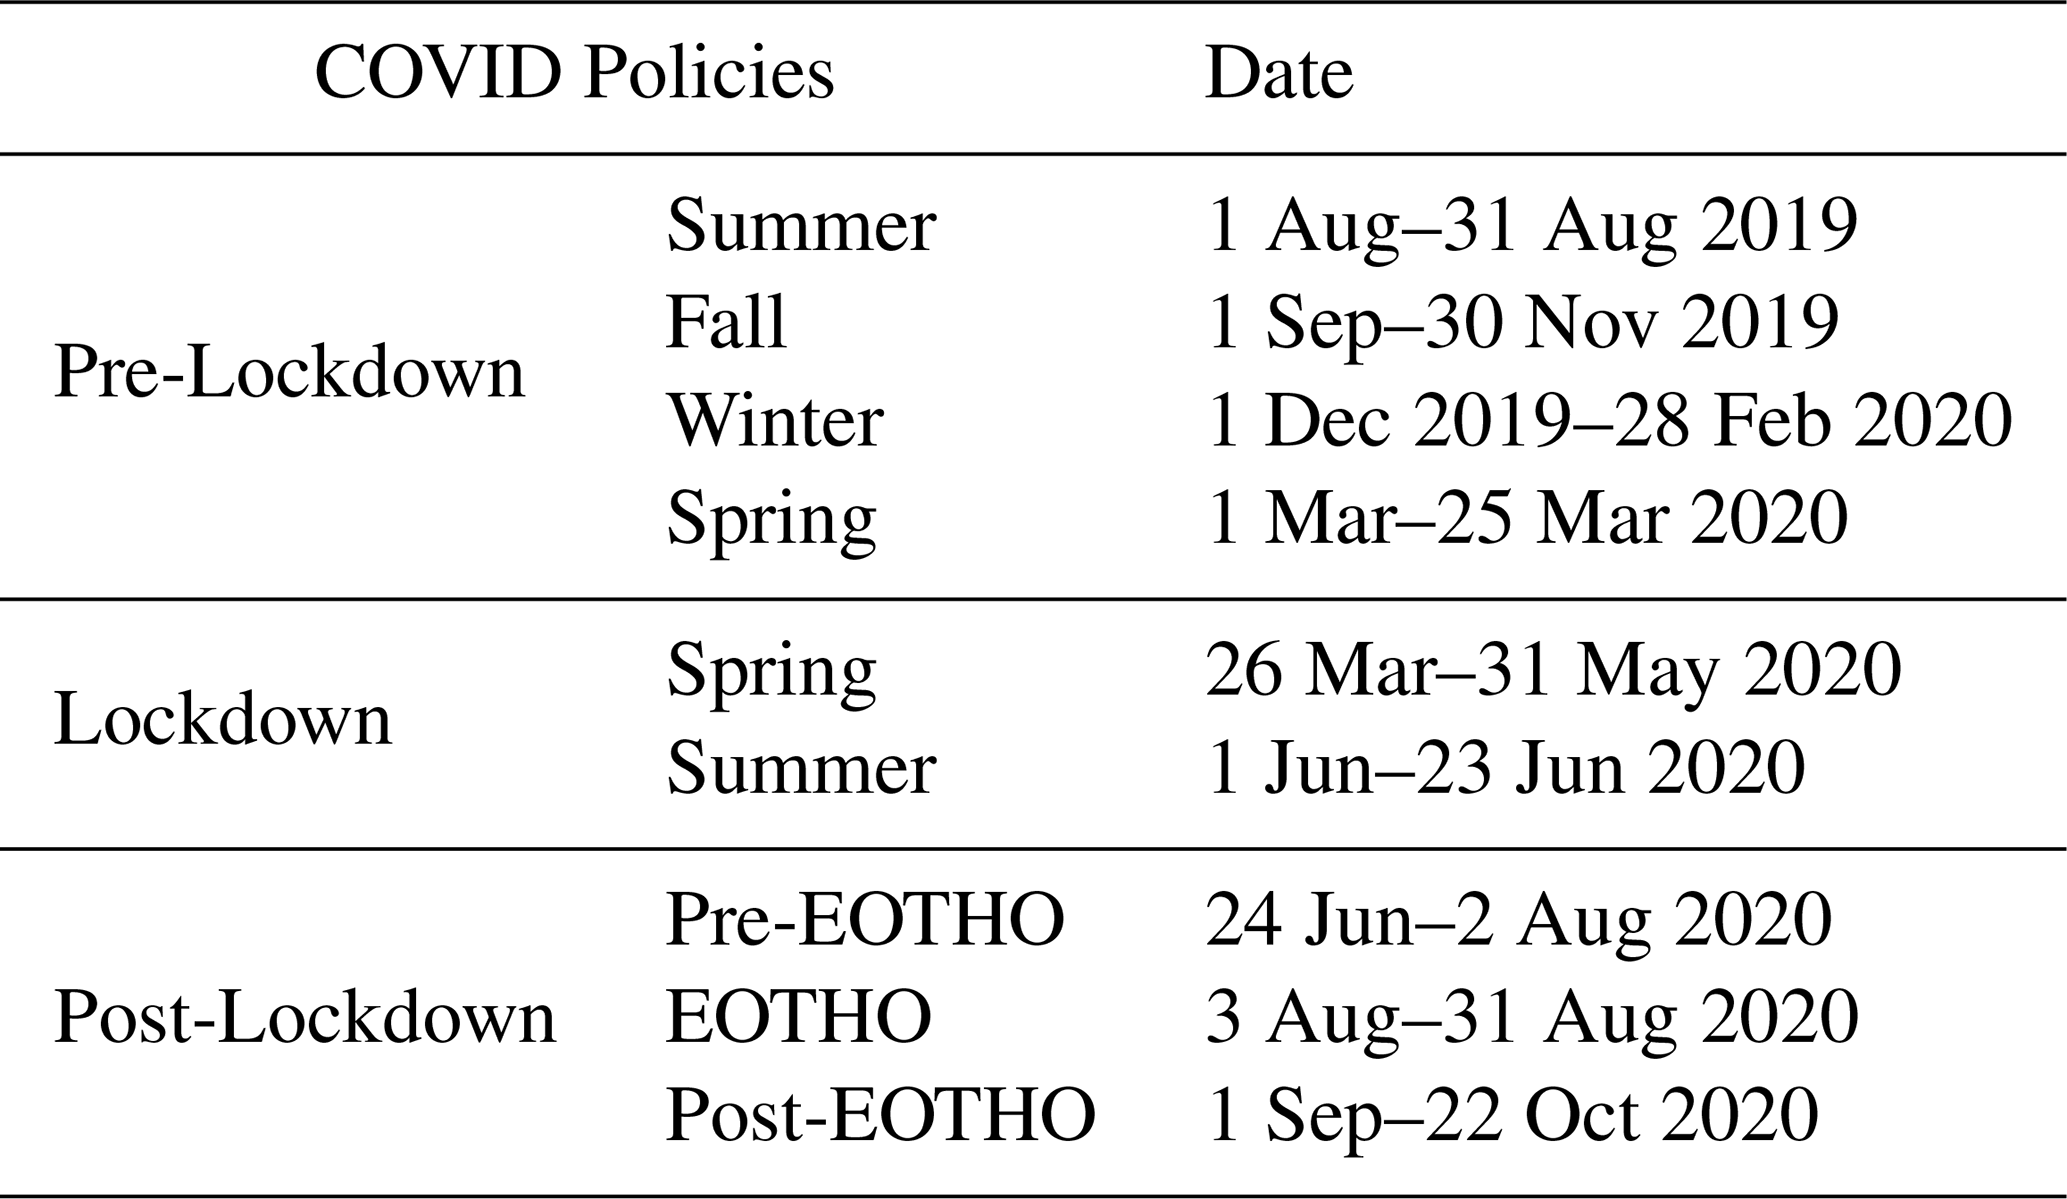
2.3 Sampling periods and COVID-related policies
PM1 chemical composition from 1 August 2019 to 22 October 2020, was analysed as this covered the first lockdown period (26 March–23 June 2020) and the EOTHO Scheme (Monday–Wednesday during from 3 August to 31 August 2020, Table 1). In order to isolate the seasonal effects on the PM chemical composition and OA sources from the COVID-related policies, we further split the data based on seasons (Table 1).
2.4 Source apportionment
Source apportionment is a common but powerful approach to identifying and quantifying the emission sources and atmospheric constituents of PM based on measurements. As the sources of inorganic species (black carbon, ammonium, nitrate, chloride, sulphate, etc.) are relatively well-studied, most of the studies are focused on deconvoluting the sources of OA, which contains thousands of compounds. Positive matrix factorization (PMF) is one of the receptor models that is widely utilized in the field to conduct source apportionment analysis (Jimenez et al., 2009; Zhang et al., 2007). Typically, an Aerodyne aerosol mass spectrometer (AMS, Aerodyne Ltd., USA, Jayne et al., 2000) is used to measure the time series of both inorganic and organic species of non-refractory PM, in which, organic mass spectra are used for PMF analysis. However, operating an AMS is labour-intense and expensive. In contrast, the ACSM (Aerodyne, Ltd., Fröhlich et al., 2013; Ng et al., 2011) has been designed for long-term monitoring purposes with less maintenance and lower capital cost, which has gained popularity across Europe (Chebaicheb et al., 2024; Chen et al., 2022; Laj et al., 2024) and the U.S. (https://ascent.research.gatech.edu/, last access: 23 September 2025, Hass-Mitchell et al., 2024; Joo et al., 2024). Chen et al. (2022) demonstrated a robust protocol to conduct advanced PMF analysis on long-term ACSM datasets, which delivers high-quality and consistent source apportionment results. This study follows this standardized protocol to resolve the OA sources in London by implementing advanced PMF techniques.
Advanced source apportionment approaches have been used in this study, including rolling positive matrix factorization (PMF), ME-2 with random a value approach, bootstrap and criteria-based selections (Canonaco et al., 2021; Chen et al., 2022). The standardized protocol of rolling PMF as presented in Chen et al. (2022) was used to ensure high-quality and comparable sources of OA were retrieved in London. Specifically, PMF was firstly done on four different seasons as suggested in Chen et al. (2022) to determine the optimum number of factors. A total of 5 OA factors were identified: hydrocarbon-like OA (HOA), cooking-like OA (COA), biomass burning OA (BBOA), more-oxidized OOA (MO-OOA) and less-oxidized OOA (LO-OOA). Adding an additional factor resulted in splitting of COA factor, decreasing it to four factors caused mixing between the MO-OOA and COA factors. Therefore, 5 factor-solution was determined across the whole year. In addition, site-specific factor profiles were derived for HOA, COA, and BBOA through a seasonal bootstrap PMF analysis for winter (December, January, and February) and used as constraints as suggested in Chen et al. (2022) and Via et al. (2022). However, the MY site is surrounded by many restaurants with prevalent cooking emissions. Thus, the chemical fingerprint for both HOA and COA might not be fully separated. Therefore, we constrained the trend of NOx time series, BBOA and COA profiles from a previous winter bootstrap solution collected in London North Kensington (2015–2018, Chen et al., 2022) to retrieve environmentally reasonable results with five factors in winter data, so-called base case solution. Then, a bootstrap resampling analysis with 100 iterations and five factors was conducted by constraining the factor profiles of HOA, COA, and BBOA from the base case with random a value from 0.1–0.5 with step of 0.1. It results in stable factor profiles of these three primary sources as shown in Fig. S2, which shows good agreements with published reference profiles (Chen et al., 2022; Crippa et al., 2013).
Rolling PMF was conducted with a time window of 14 d and a step of 1 d by constraining primary factor profiles of HOA, COA, BBOA in Fig. S2 (averaged bootstrap results) and two additional unconstrained factors with bootstrap resampling and the random a-value option (0.1–0.5, step of 0.1, 50 iterations/window). A criteria list including selections based on both time series and factor profiles as shown in Table S1 in the Supplement was applied as per Chen et al. (2022). With the help of t test in temporal-based criteria (1–3 in Table S1), we can minimize subjective judgements in determining the environmentally reasonable results as suggested by Chen et al. (2021). Eventually, 3166 runs (14.1 %) of the PMF runs were selected across different rolling windows across the whole year to average as the final results (utilized a values were averaged to two decimal places) with 4.9 % unmodelled data points, which is comparable with other rolling PMF analyses (Chen et al., 2022).
2.5 Meteorological normalisation using boosted regression tree model
Meteorological normalisation, also known as deweathering analysis, has been conducted using the “worldmet” R package (Carslaw, 2025) to build boosted regression tree (BRT) models for all resolved OA factors from PMF as well as chemical species measured. Considered variables, included relative humidity, wind speed, wind direction, and air temperature trend, hours of the day (local time), day of the week, Julian dates, week of the year as suggested by Carslaw (2025). While Grange and Carslaw (2019) have also suggested boundary layer height, air mass cluster, or back trajectory information would be beneficial to include to deal with pollutants primarily controlled by regional scale process. However, the aim of this study is understanding how COVID-related policies affect primary/local emission sources (i.e., BC, HOA, COA, and BBOA), which will not be affected significantly by regional process, therefore additional metrics will most likely not improve the quantification of these PM components. It is consistent and comparable with previous studies (Font et al., 2022; Grange et al., 2021; Yao and Zhang, 2024) that includes similar meteorological parameters (i.e., wind speed, wind direction, relative humidity, temperature). In addition, since the trained BRT models are sufficiently good even without considering boundary layer height and back trajectories, performing random forest model will not improve the model significantly, nor change the results drastically as suggested by Yao and Zhang (2024). Thus, in this study, only BRT models were trained and the meteorological effects subsequently removed (i.e., relative humidity, wind speed, wind direction, and air temperature) on all PM OA.
3.1 Model performance of meteorological normalisation
The performance of each model (for individual species/source) is shown in Table S2 with slopes from 0.97 to 1.02 and R2 (Pearson) from 0.77 to 0.94, which have similar or somewhat better performances compared with previous studies (Font et al., 2022; Grange et al., 2018, 2021; Grange and Carslaw, 2019; Krechmer et al., 2018; Shi et al., 2021; Yao and Zhang, 2024). As shown in the Supplement (Figs. S8 and S9) and the lower panel of Fig. 5, meteorological effects were generally considerable, especially for Pre-lockdown Spring period, while it does not change the conclusion of the effects from lockdown and EOTHO policies. Therefore, the main results presented in this study are based on the original measurements.
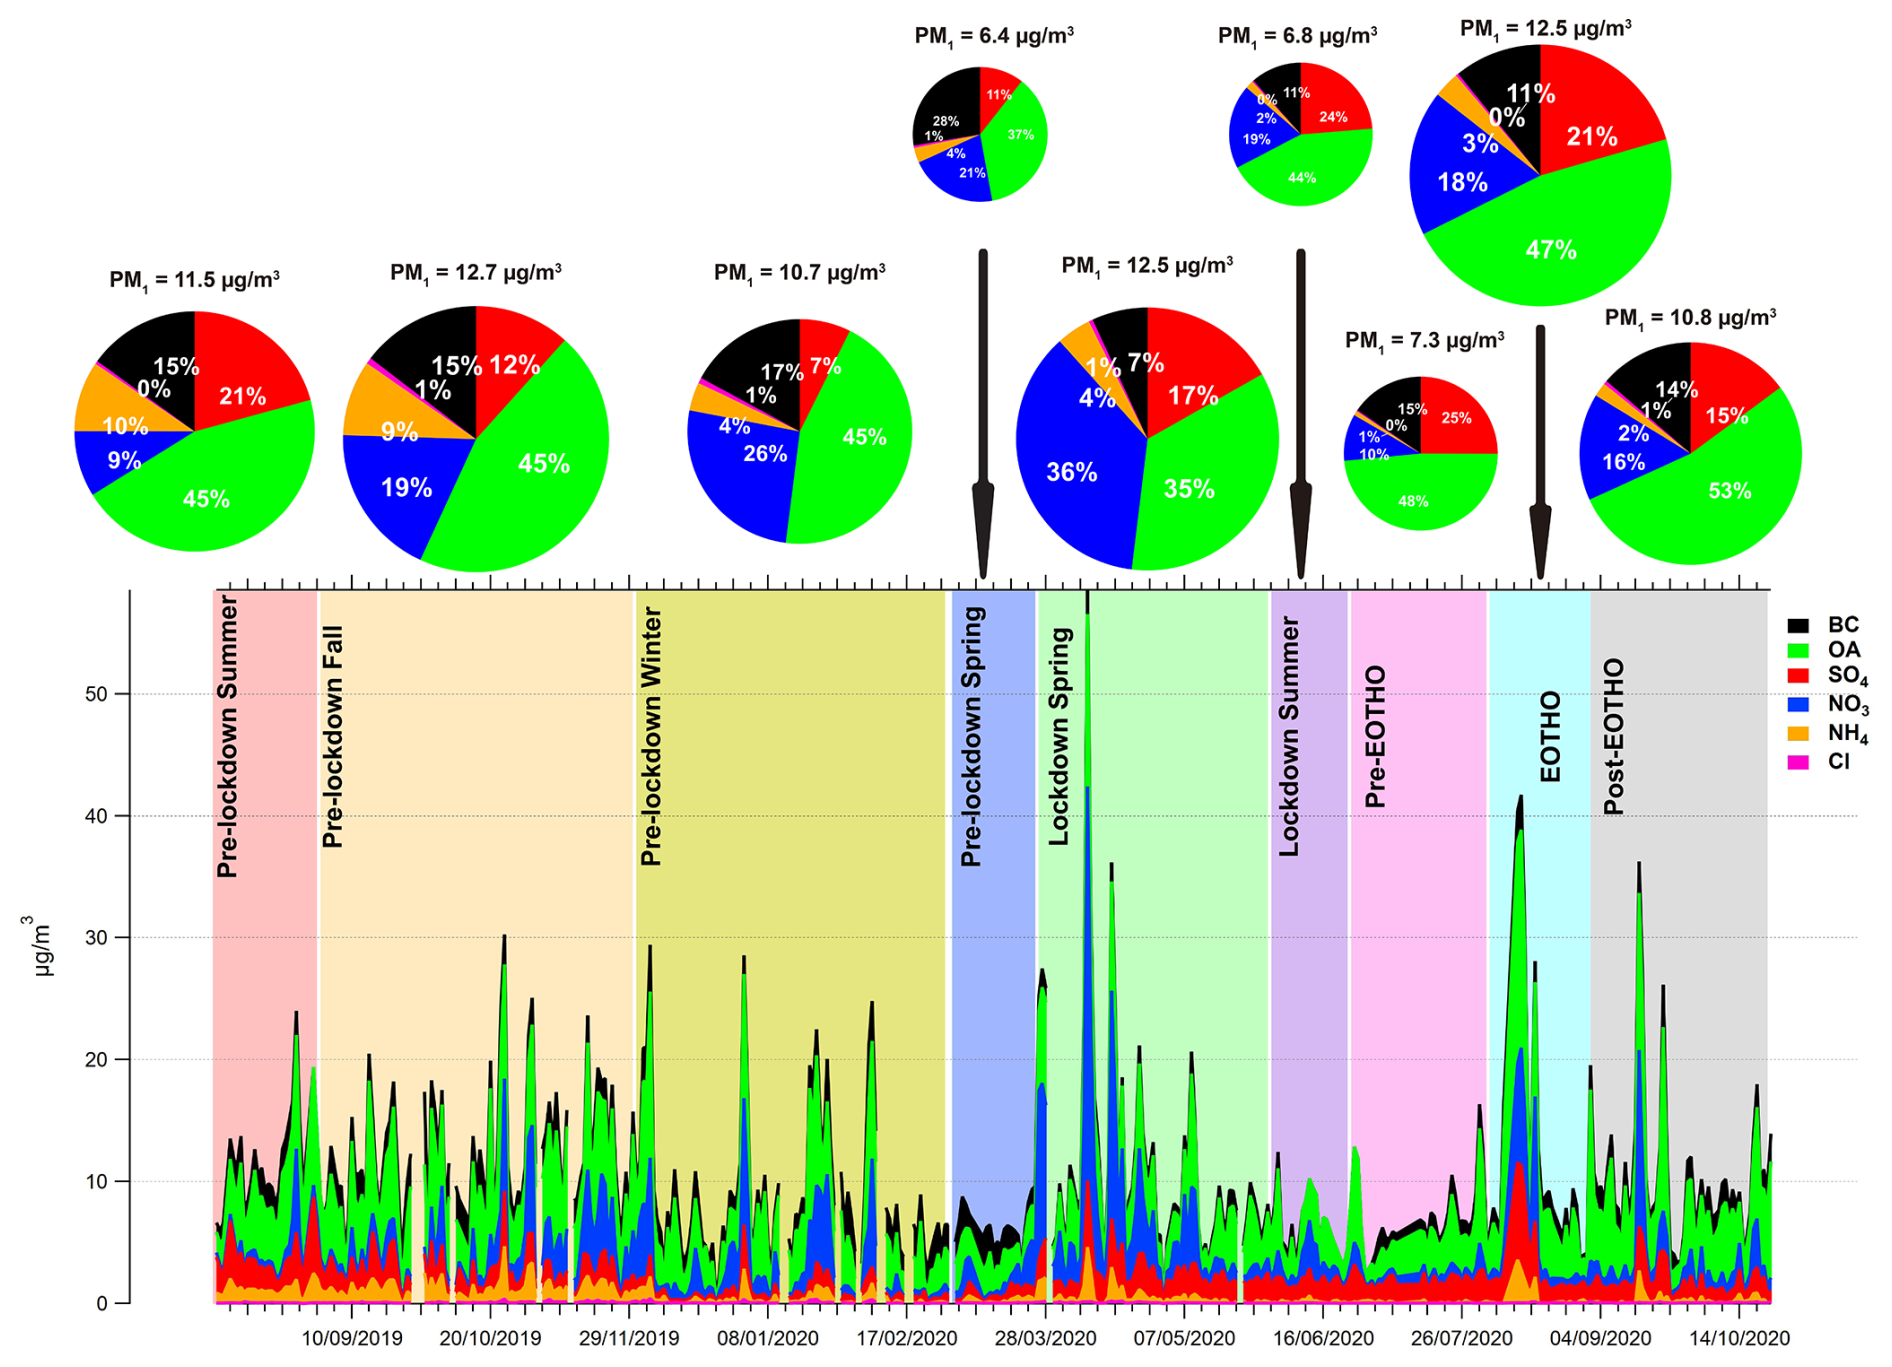
Figure 1Chemical compositions of PM1 at MY from August 2019 to October 2020 (daily resolution) and averaged for the different periods as shown in Table 1.
3.2 Chemical composition of submicron PM for different periods around the COVID-19 Lockdown
The average PM1 mass concentration at MY site was 11 µg m−3 for the study period with 44 % OA, 21 % NO3, 15 % SO4, 16 % BC, 5 % NH4, and 0.6 % Cl. The distribution of the chemical composition on PM1 varied depending on the season and variation was associated with the lockdown and EOTHO policies (Fig. 1). PM1 increased by 95 % in lockdown spring (26 March–31 May 2020) compared to pre-lockdown spring (1 March–25 March 2020). Specifically, Org, SO4, NO3, NH4, and Cl all increased by 87 %, 211 %, 73 %, 237 %, and 132 %, respectively. Except for BC, which decreased by 52 %. This is due to the polluted airmass originating from mainland Europe and the enhanced agricultural emissions in spring from the UK and wider continental Europe (Aksoyoglu et al., 2020). It was further confirmed, through back trajectory analysis, that elevated PM1 events (25 March–28 March, 8 April–10 April, and 15 April–17 April), where the result of airmasses passing over northern continental Europe (Fig. S6). In addition, the Org, SO4, NO3, NH4, and Cl were only increased by 21 %, 107 %, 50 %, and 28 % respectively after the deweathering analysis (Fig. S8), suggesting significant meteorological influences during this period. NO3 concentration reduced in summer 2019 and 2020 as expected compared to spring or fall seasons due to the semi-volatile nature of NH4NO3 and lower agricultural emissions, while SO4 concentrations increased in summer due to enhanced photochemistry across Europe (Bressi et al., 2021; Chen et al., 2022). During the lockdown in spring, SO4 concentrations remained high, which was associated with long-range transport and marine aerosols (e.g., methanesulfonic acid, MSA) (Fig. S7).
BC concentrations during the spring lockdown (26 March–31 May 2020) reduced from 1.78 to 0.86 µg m−3 (−52 %) compared to the pre-lockdown level in spring (1 March–25 March 2020), due to the significant reduction in traffic during the first lockdown (Transport for London, 2020). Similar decreasing of BC has been observed elsewhere during COVID lockdown as described in introduction (Gamelas et al., 2023; Jeong et al., 2022; Petit et al., 2021; Tian et al., 2021; Xu et al., 2020). It is worth noting that the BC concentration had already reduced by 3 % in pre-lockdown spring (1 March–25 March) compared to the pre-lockdown winter. This is likely due to vehicle mileage reducing as the UK government implemented travel restrictions and advised people to work from home on 16 March 2020 (Transport for London, 2020). BC increased to 1.13 µg m−3 (+44 %) after the lockdown and before the EOTHO (24 June–2 August 2020, pre-EOTHO in Fig. 1) as people returned to work and travel. However, BC concentrations remained 34 % lower than the pre-lockdown summer (1 August–31 August 2019) concentration of 1.72 µg m−3 (Fig. S9), which suggests that the traffic emissions reduced considerably as the fewer economic activities even after the ease of the first lockdown (e.g., suggestions of hybrid working mode, restricted international travel, reduced tourism, limited access to entertainments). BC also increased to 1.35 µg m−3 (+19 %) during the EOTHO scheme (3 August–31 August 2020). This was not only because of increased traffic emission during this period, but may also result from cooking activities (e.g. barbecuing or wood-fired cooking styles) in Central London (Defra, 2023). Since the EOTHO was only in place from Monday to Wednesday, BC concentrations (likely due to increased traffic and cooking emissions) increased on Monday–Wednesday compared to post-lockdown but before EOTHO (24 June–2 August 2020) (Fig. S10).
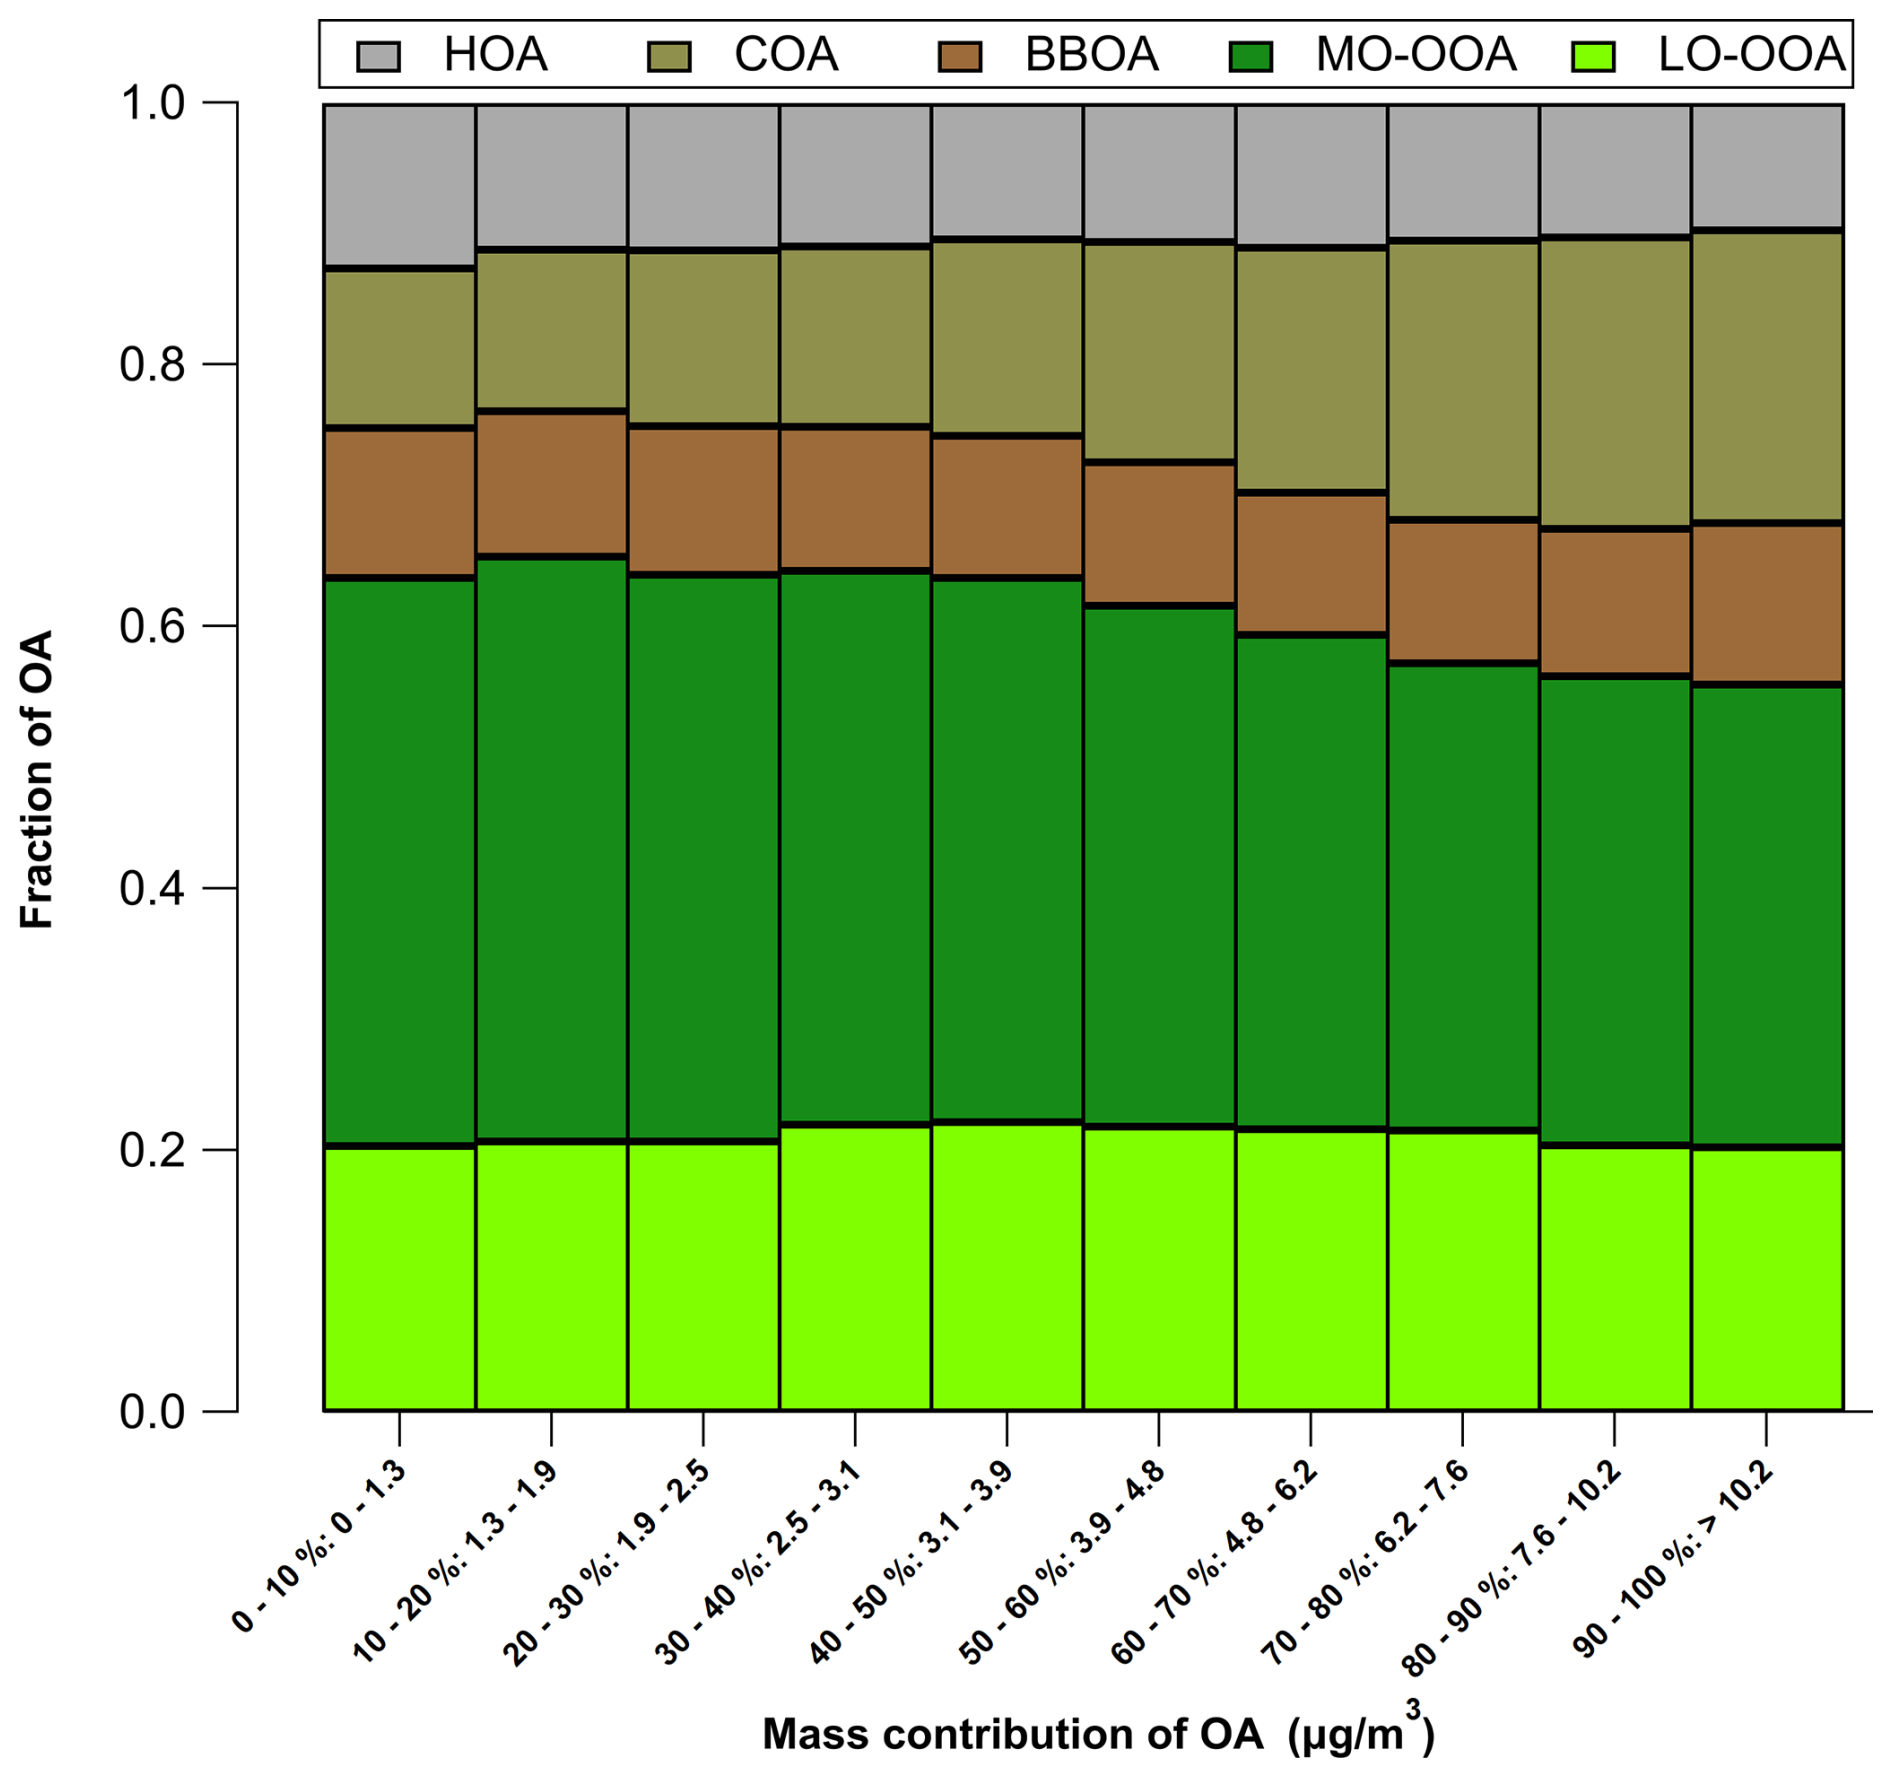
Figure 2Contributions to total OA from the different identified OA sources at different OA concentrations. Total OA concentrations were split in 10 equally distributed bins.
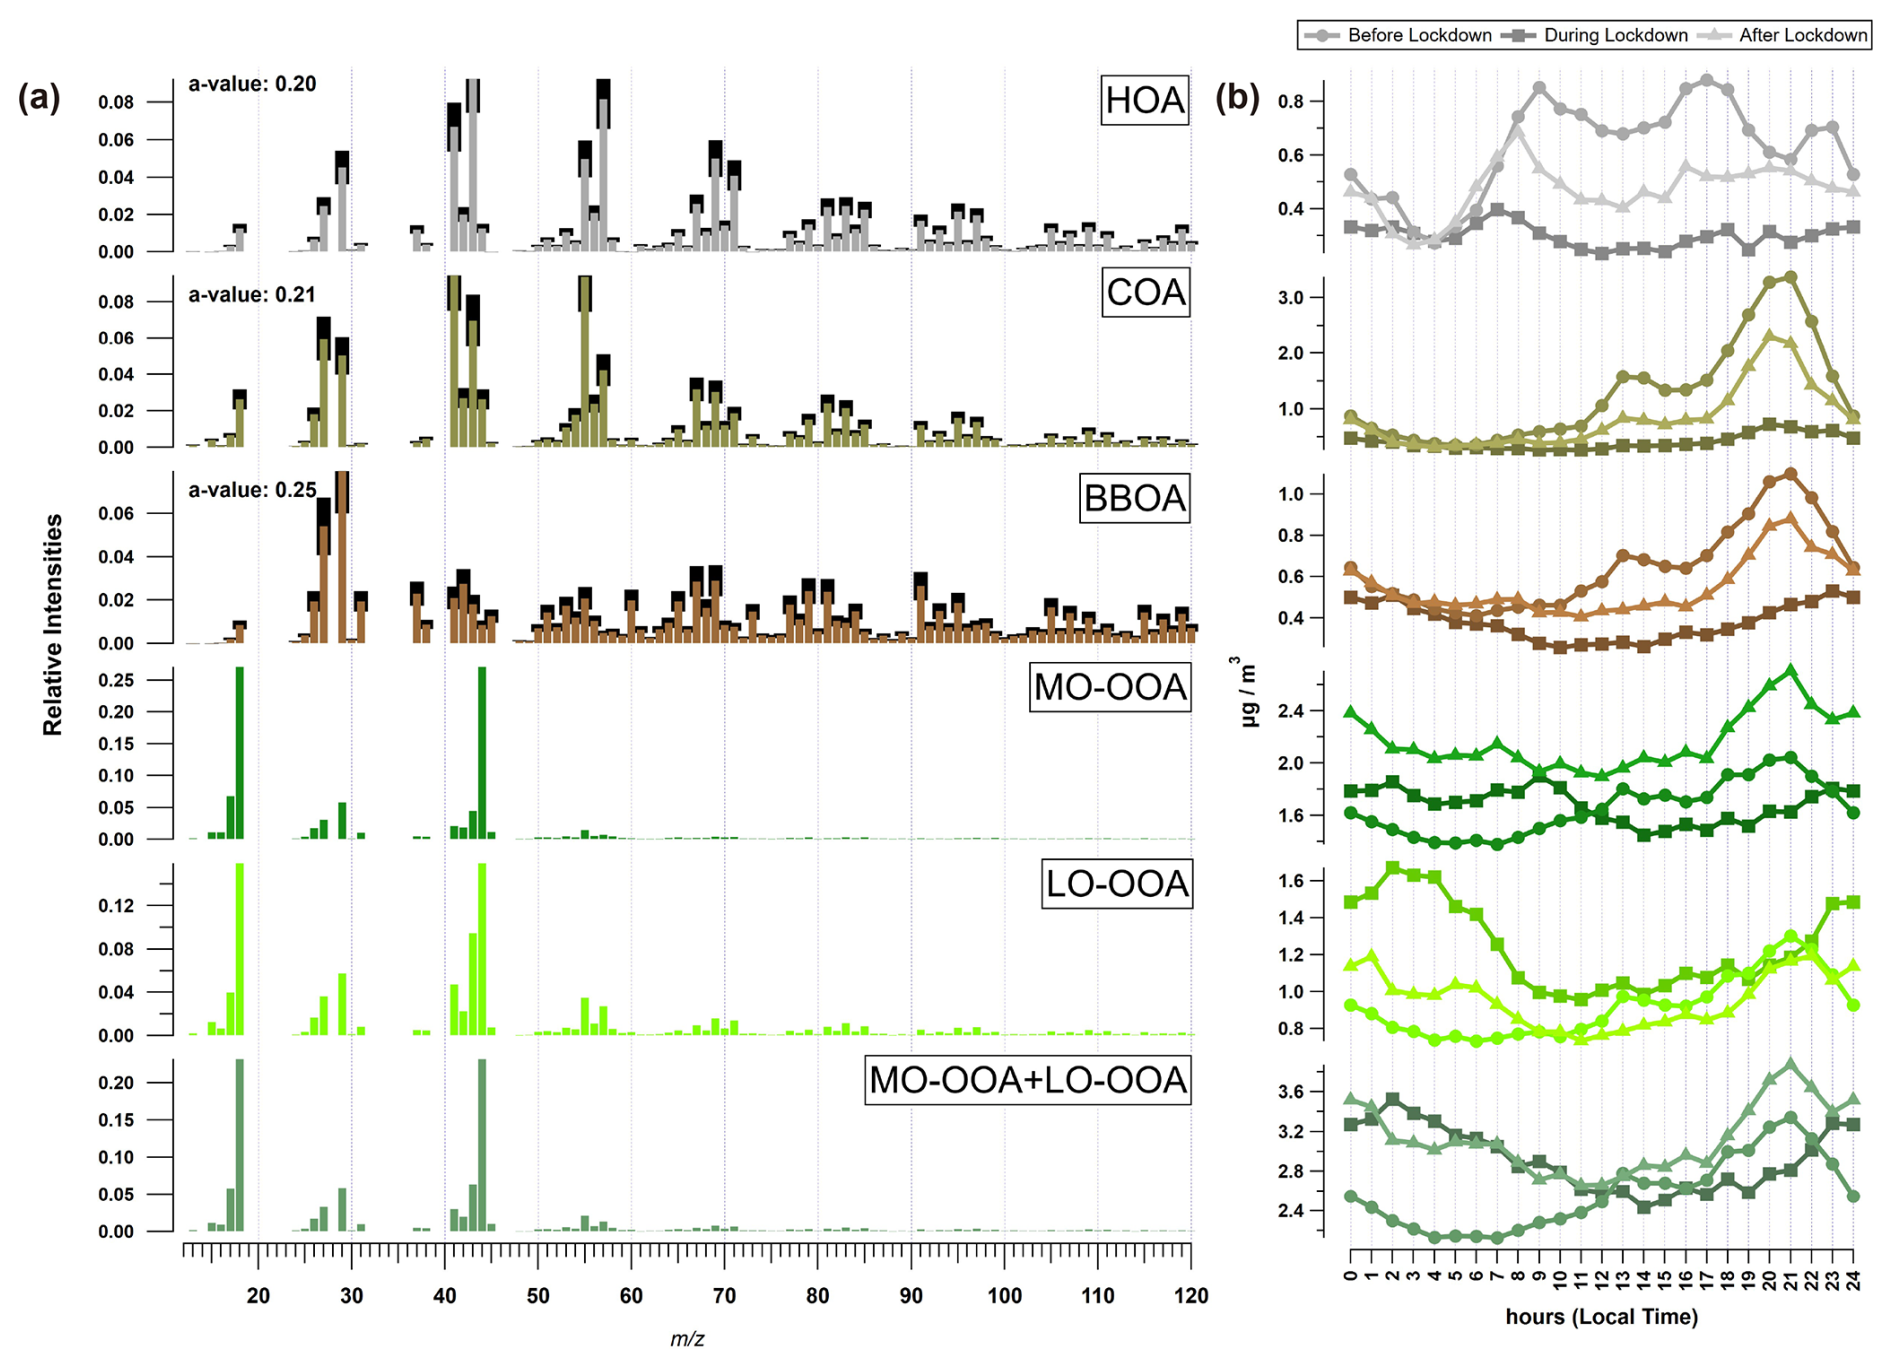
Figure 3Yearly averaged profiles (a) and diurnal cycles (b) of resolved factors from the rolling PMF analysis at the MY site. Time is expressed in local time.
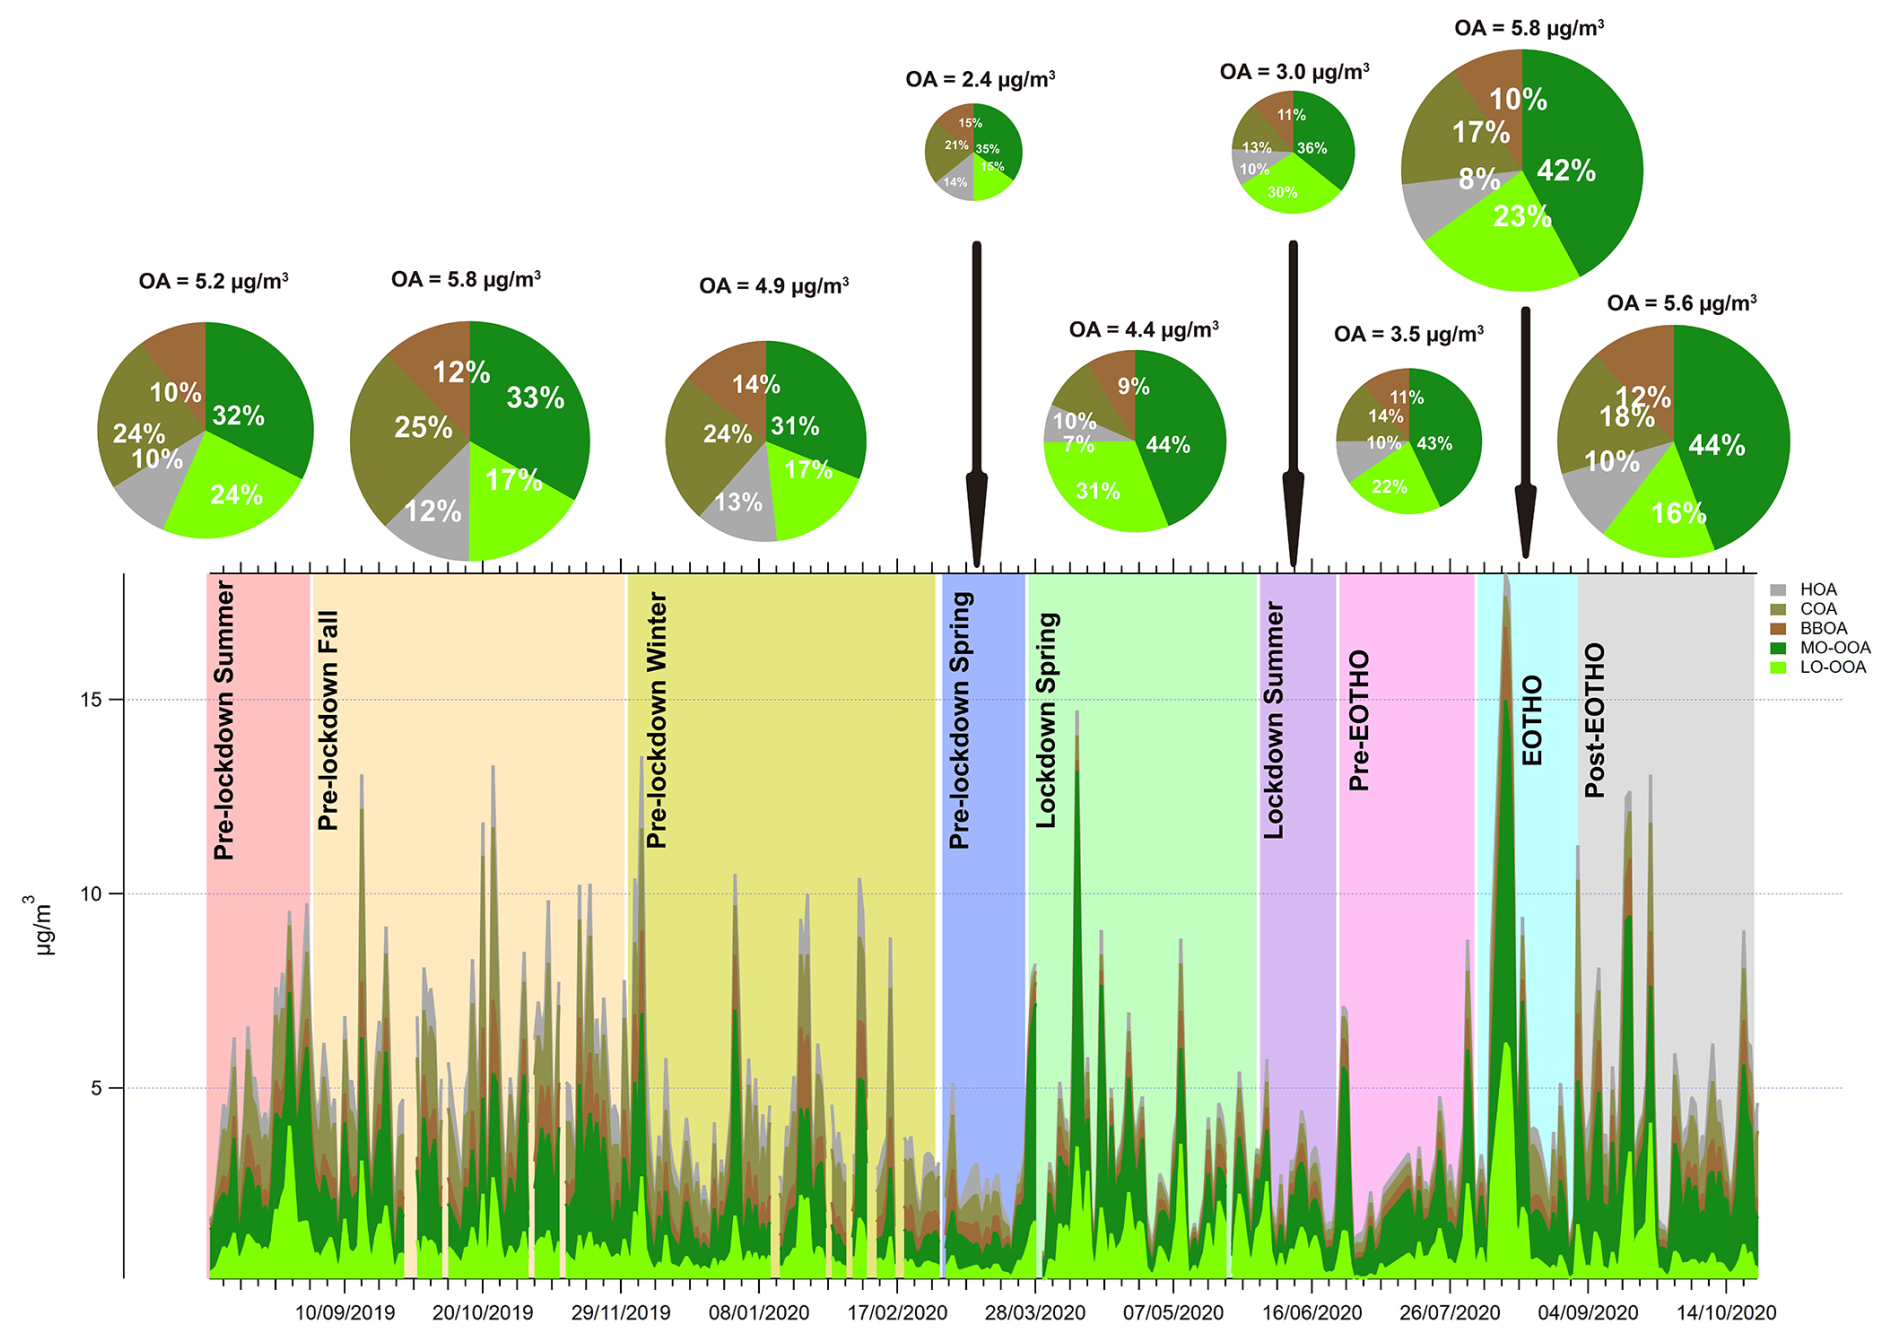
Figure 4Average mass concentrations for OA sources at MY during different periods from August 2019 to October 2020.
3.3 OA sources in Central London
As mentioned above, the rolling PMF analysis resolved 5 factor solutions, including HOA, COA, BBOA, MO-OOA, and LO-OOA as shown in Figs. 3 and 4. The left panel of Fig. 3 shows the yearly averaged factor profiles of resolved PMF factors and total OOA calculated as the sum of LO-OOA and MO-OOA. All factors show good agreements with previous studies in terms of key tracers. In addition, as shown in Fig. 2, the contribution to total OA concentrations from HOA, BBOA, and LO-OOA was consistent at different OA concentrations. However, the contribution of COA increased as total OA concentrations increased. This suggests that cooking emissions in Central London are responsible for elevated OA concentrations, which was also the case in Athens as shown in Chen et al. (2022).
3.3.1 General characteristics of OA factors
The right panel of Fig. 3 shows diurnal cycles and Fig. 4 shows time series (daily averaged) for each OA factor. The mean concentrations of HOA, COA, BBOA, MO-OOA, LO-OOA, and OOA (MO-OOA + LO-OOA) were 0.50±0.1, 0.93±0.14, 0.55±0.11, 1.81±0.41, 1.00±0.44, and 2.80±0.70 µg m−3, and contributed to OA (PM1) with the fractions of 11 % (5 % to PM1), 20 % (9 % to PM1), 12 % (5 % to PM1), 38 % (17 % to PM1), 21 % (9 % to PM1), and 59 % (26 % to PM1), respectively. The concentration of all OA factors shows strong time variations over the year as shown on the Fig. 4. OA factors also showed seasonality besides the effects from COVID-related policies (Figs. 4 and S3). Primary organic aerosol (POA) concentrations were generally lower in the warmer seasons than in winter as lower temperature favours particle formation via condensation and dilution and dispersion are reduced due to the lower boundary layer and lower wind speed. It's worth mentioning that the reduced POA concentrations in the warm season was not caused by reduced residential heating and energy consummation since Central London mainly uses natural gas and renewable energy rather than solid fuel combustions (Cliff et al., 2025). The OOA factor concentrations remain relatively consistent across seasons, while its contribution was larger during the warmer seasons (Fig. S4). This is because both high temperature and strong solar radiation will enhance the photochemistry and evaporation of POA sources, and increased volatile organic compound (VOC) emissions lead to high OOA production despite the evaporation of semi-volatile OOA (Fig. S4) (Chen et al., 2022). The temporal variations observed here in Central London was consistent with the other urban sites across Europe (Chen et al., 2022). Therefore, this study focuses on the impacts of COVID-related polices on OA sources.
The right side of Fig. 3 shows the diurnal cycles before, during, and after the lockdown. POA factors showed distinct diurnal variations, in which HOA showed morning and evening rush hour peaks, COA showed distinct lunchtime and evening peaks, and BBOA showed a similar pattern as COA before and after the lockdown. This indicates that the part of what is measured as BBOA in Central London is most likely co-emitted from cooking activity, most likely from barbecuing style or wood-oven pizza restaurants in the area. A survey about use of domestic fuels in the hospitality sector was conducted by Department for Environment Food and Rural Affairs (Defra), suggesting that restaurants use solid fuel to cook to provide unique flavours (Defra, 2023). Mohr et al. (2009) showed that meat-cooking can slightly elevate 60, which is an important ion in the BBOA factor profile. OOA factors showed much less diurnal variation compared to POA factors in all periods, this is in agreement with the other 22 European sites reported in Chen et al. (2022). The MO-OOA showed a smaller diurnal variation compared to LO-OOA. This is because the LO-OOA is also known as semi-volatile OOA (SV-OOA), which evaporate during the day due to higher temperatures and accumulate in the evening due to the shallower boundary layer (Chen et al., 2022).
3.3.2 Pre-lockdown Spring
In general, OA concentration decreased by 51 % in pre-lockdown spring compared to pre-lockdown winter (1 December 2019–28 February 2020) due to seasonality, origins of airmass (Fig. S5), and the impact of lockdown. OOA concentrations also decreased drastically by 50 %. Primary emissions were significantly lower due to reduced vehicle mileage and other economic activity before the official lockdown measure came into force on 26 March 2020 (Fig. 4) as suggested by the 1st quarter drop in GDP (ONS, 2022). Atmospheric components related to vehicle emissions (HOA and BC) decreased by 48 % and 3 % respectively, in early March 2020. COA decreased by 58 % due to fewer restaurant activity, BBOA decreased by 50 % was likely due to the reduced commercial cooking using charcoal and wood as well as warmer weather requiring less domestic space heating.
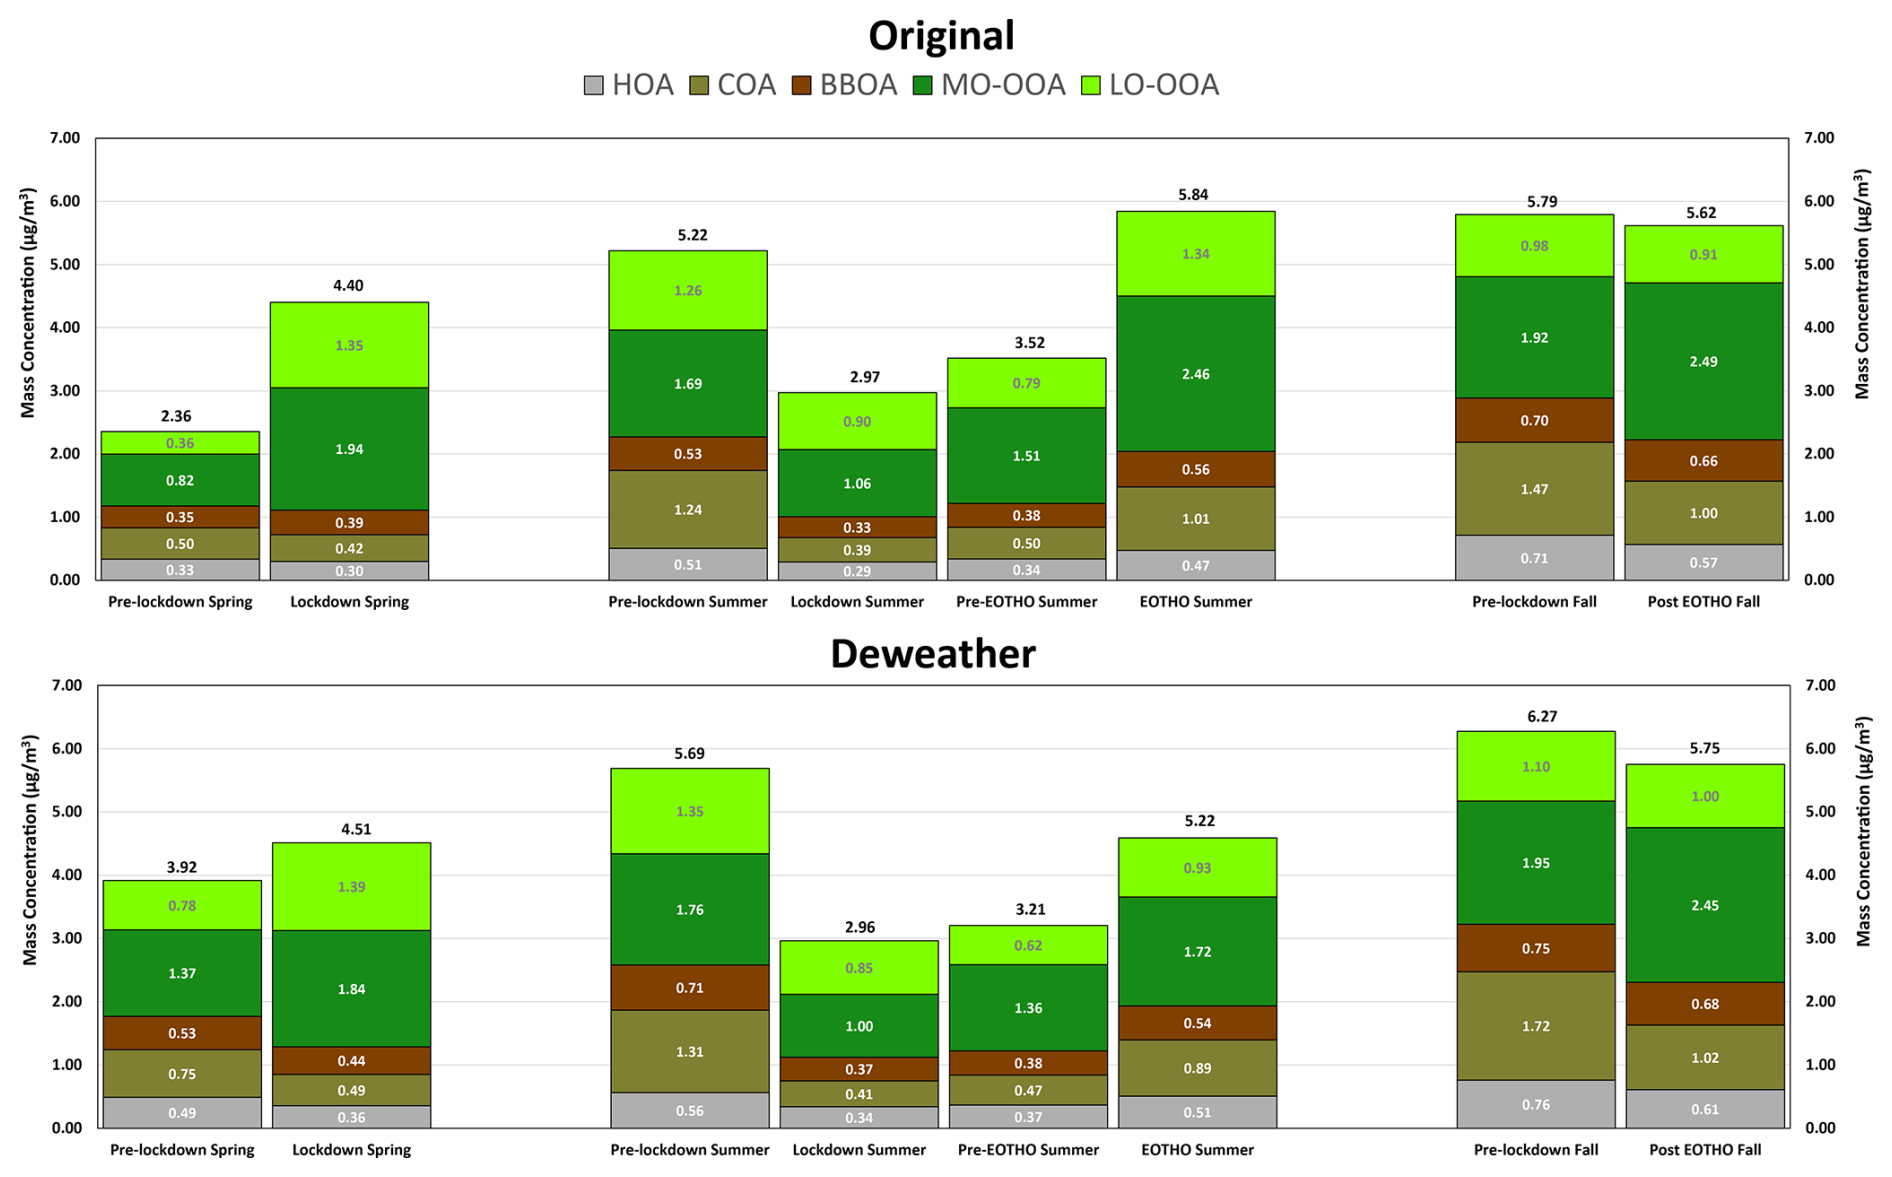
Figure 5The impacts on OA sources during different periods compared with business-as-usual cases with and without deweathering analysis.
3.3.3 Lockdown
The diurnal variation of COA and BBOA during lockdown showed much less intensity overall but the distinctive lunchtime peak remained as the pre-lockdown; and the evening peak reduced its intensity (Fig. 3b). HOA retained distinct morning and evening rush hour peaks but at lower mass concentrations during lockdown (Fig. 3b). This is because the takeout activities of some restaurants were still active as well as the potential increases for residential cooking activities during lockdown. After the first lockdown, the distinct lunch and evening peaks in diurnal patterns of COA and BBOA reappeared as the open-up of nearby restaurants. The morning and evening rush hour peaks for HOA enhanced considerably as the ease of the travel restrictions after the first lockdown. However, POA concentrations did not reach pre-COVID levels (Fig. 5). This is likely due to widespread hybrid working and the remaining oversea travel restrictions supressing tourism, which reduced traffic activity and restaurants visits. Conversely, OOA concentrations during lockdown were slightly higher than pre-lockdown levels. These were related to long-range transport, with relatively high mass concentrations of MO-OOA and LO-OOA during the lockdown (Figs. S5 and S6). Compared to the pre-lockdown spring, HOA and COA in the lockdown spring decreased by 11 % and 15 %, respectively, while BBOA increased marginally by 13 % (from 0.35 to 0.39 µg m−3) (Fig. 5). MO-OOA and LO-OOA increased by 136 % and 279 %, respectively due to long-range transportation of airmasses from continental Europe (Figs. S5 and S6) and increased photochemistry (enhanced temperature and ozone levels in Fig. S4) compared to the first 25 d in March 2020. This was accompanied by increased SO4 (+211 %), NH4 (+132 %) and NO3 (+237 %) as shown in Fig. S9, despite the higher temperature could favour partitioning these species into the gas phase.
In June 2020, still in lockdown (1 June–23 June 2020), POA showed further but marginal decreases (−3 %, −8 %, and −15 % for HOA, COA, and BBOA, respectively, Fig. 4) compared to the lockdown spring as the enhanced photochemistry leads to increased formation of OOA from the POA. However, the overall mass concentration of MO-OOA and LO-OOA decreased significantly by 45 %, and 34 %, respectively as the result of fewer long-range transported airmasses (Fig. S5).
3.3.4 Pre-EOTHO
During pre-EOTHO (24 June–2 August 2020) after the lockdown policy was eased, HOA, COA, and BBOA all showed considerably increases of 16 %, 30 %, and 14 %, respectively when compared to lockdown summer period. In which, MO-OOA increased by 45 % and LO-OOA decreased by 13 %, respectively as the relatively higher temperature and solar radiation favoured the evaporation of LO-OOA and production of MO-OOA from LO-OOA and POA. As shown in Fig. 5, the POA concentrations were much lower when compared to summer 2019 (1 August–31 August 2019) as travel and economic activities did not return to pre-COVID levels (ONS, 2022; Transport for London, 2020). Specifically, lower HOA (−33 %), BC (−37 %) due to reduced vehicle mileage resulted, and COA (−59 %) due to the reduced commercial cooking activity. As BBOA is co-emitted with COA during of cooking activities, BBOA also decreased slightly from 0.53 to 0.38 µg m−3 (−28 %, Fig. 5).
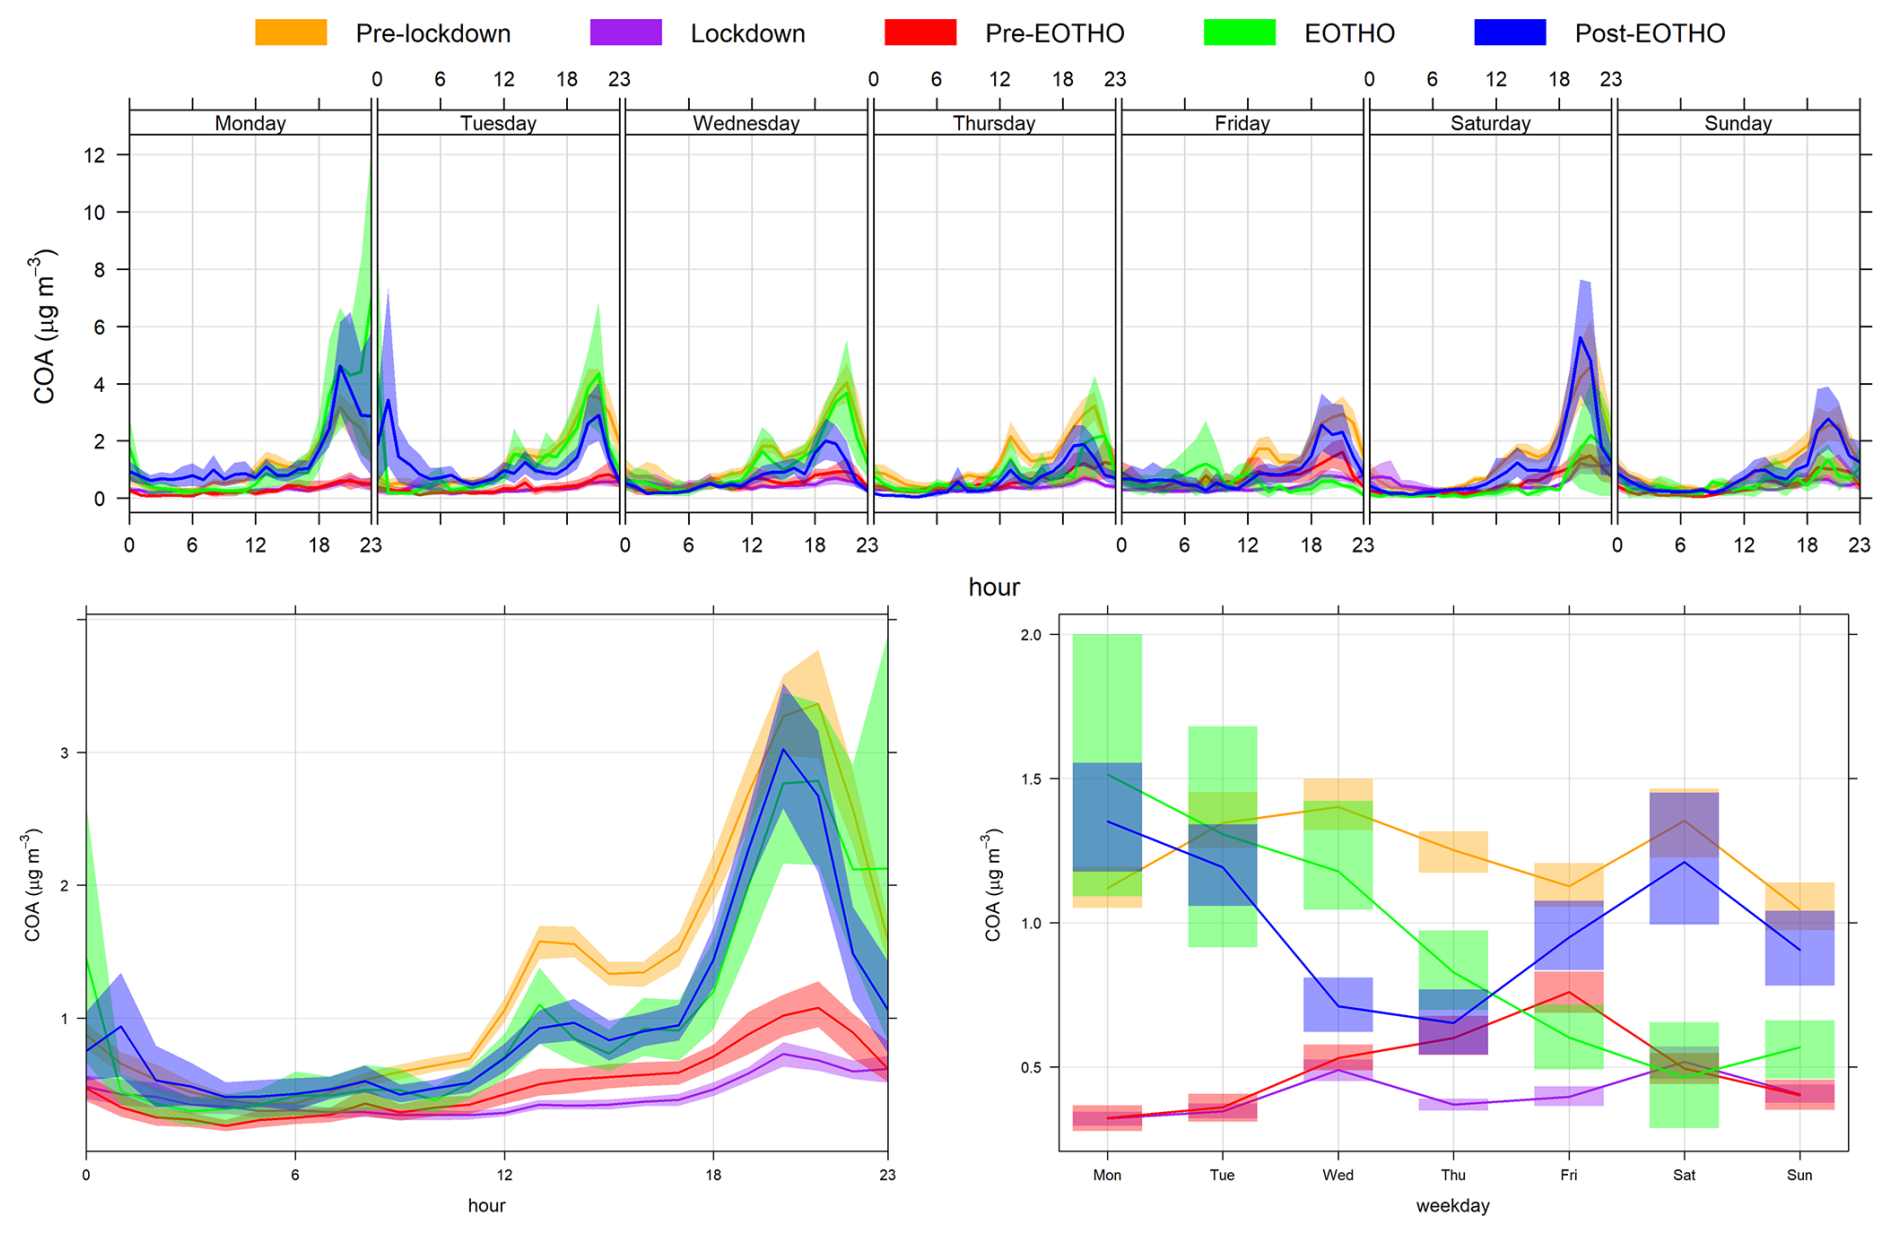
Figure 6COA diurnal plots for each weekday, diurnal plots, and weekly plots at different periods in relation with COVID-related policies.
3.3.5 Eat Out To Help Out (EOTHO)
EOTHO policy (3 August–31 August 2020) had a significant impact on all POA factors. In particular, the COA concentration increased by 100 % compared to the post-lockdown period (Pre-EOTHO Summer) from 24 June to 2 August 2020 (0.5 to 1.0 µg m−3, Fig. 6). HOA and BBOA concentrations also increased by 40 % and 48 %, respectively, which suggested the human activities resulting in these emissions recovered slowly after the lockdown (ONS, 2022; Transport for London, 2020). COA was significantly higher due to EOTHO, however, it did not reach pre-COVID concentrations (Figs. 5 and 6) as its level was lower on each weekday except for Monday.
EOTHO only operated from Monday to Wednesday, and this was clear in the diurnal plots (Figs. 6 and S12) with larger COA concentrations from Monday to Wednesday, in contrast to larger concentrations over the weekend (Friday to Sunday) before EOTHO (24 June–2 August 2020). Interestingly, even after the EOTHO policy ceased (1 September–22 October 2020), COA levels remained elevated on Monday and Tuesday but a much higher level during the weekend was observed. This suggests that EOTHO had an influence on the consumer behaviour even after the lockdown. It is also worth noting that the high concentrations of COA and BBOA (Figs. 6 and S11) on Monday night were caused by the last day of EOTHO policy coinciding with a UK public holiday on 31 August.
Also, during EOTHO, MO-OOA and LO-OOA increased by 63 % and 70 % respectively compared to post-lockdown concentrations before EOTHO and correlated with increased NH4, NO3 and SO4 concentrations. This was mainly due to long-ranged transported airmasses (Fig. S5) and enhanced photochemistry with increased temperature and mass concentration of POAs (Fig. S4).
This study demonstrates the importance of source apportionment studies to better understand how national and local government policies can impact the PM mixture, and how these effects can be differentiated from the influences of meteorology and large-scale atmospheric processes. PM concentrations increased at the beginning of the lockdown (March–April 2020) despite reduced economic activities, which was caused by long-range transported airmasses instead of primary emissions. Through examining the source apportionment (and inorganic PM composition), COVID-related policies were found to have profound but largely unintended impacts on air quality. The first lockdown significantly reduced POA sources: including HOA by 52 %, COA by 67 %, and BBOA by 42 %. While all these components reduced dramatically during the lockdown, they only gradually increased again and did not reach pre-COVID levels during the duration of this study (August 2019–October 2020).
Most significantly, while the Eat Out To Help Out (EOTHO) policy was effective in helping the hospitality industry to recover from economic losses during the lockdown, it had unintended impacts on air quality as cooking emissions increased. Clearly detecting this change confirms the presence of COA (20 % to OA) as an important source of OA in London and the importance of commercial cooking as a source. Also of note was the impact that EOTHO had on BBOA concentrations, which increased by 48 % while this policy was in place. This establishes a clear link between commercial cooking activity and BBOA measured in cities due to the use of charcoal and wood as cooking fuels (Defra, 2023), as well as potentially emissions from cooking ingredients. Cooking may therefore be underestimated as a source if COA concentrations are considered in isolation, and BBOA is only associated with other sources of solid fuel burning. This emphasises the need to develop policies and technical solutions to mitigate commercial cooking emissions in the urban environment, especially as there are limited regulations on this industry in terms of air pollution. There are filter technologies (e.g., electrostatic precipitators, UV-C lamp exhaust hood, hydrovents) available that have been implemented as law in Hong Kong to effectively control cooking emissions (Hong Kong EPD, 2024). It also demonstrated the importance in continuous monitoring with subsequent source apportionment analysis to better understand the influence of government policies to improve air quality more effectively.
Rolling PMF analyses is run using SoFi Pro from Datalystica (https://datalystica.com/sofi-pro/, last access: 23 September 2025) under Igor Pro 9 platform from WaveMetrics® (https://www.wavemetrics.com/, last access: 23 September 2025) and they are both available for purchase. Raw data/results from the study are available upon request to the corresponding author Gang I. Chen (gang.chen@imperial.ac.uk).
The supplement related to this article is available online at https://doi.org/10.5194/acp-25-14825-2025-supplement.
GIC: Writing – review & editing, Writing – original draft, Visualization, Validation, Project administration, Methodology, Investigation, Formal analysis, Data curation, Conceptualization. AHT: Writing – review & editing, Methodology, Formal analysis, Data curation. MP: Methodology, Formal analysis, Data curation. AF: Writing – review & editing, Methodology, Formal analysis, Data curation. DCG: Writing – review & editing, Supervision, Project administration, Methodology, Resources, Funding acquisition, Conceptualization.
The contact author has declared that none of the authors has any competing interests.
The views expressed are those of the authors and not necessarily those of the NIHR, UKHSA or the Department of Health and Social Care.
Publisher’s note: Copernicus Publications remains neutral with regard to jurisdictional claims made in the text, published maps, institutional affiliations, or any other geographical representation in this paper. While Copernicus Publications makes every effort to include appropriate place names, the final responsibility lies with the authors. Views expressed in the text are those of the authors and do not necessarily reflect the views of the publisher.
This article is part of the special issue “Quantifying the impacts of stay-at-home policies on atmospheric composition and properties of aerosol and clouds over the European regions using ACTRIS related observations (ACP/AMT inter-journal SI)”. It is not associated with a conference.
The authors gratefully acknowledge the valuable input provided by Professor Frank Kelly during the review of this manuscript prior to submission. We also thank Dr. Gary Fuller for sharing information on cooking emission control solutions in Hong Kong and on solid fuel usage in the hospitality industry in the UK.
This study is part funded by the National Institute for Health Research (NIHR) Health Protection Research Unit in Environmental Exposures and Health, a partnership between UK Health Security Agency (UKHSA) and Imperial College London. This research has also been supported by the Natural Environment Research Council (NERC) Integrated Research Observation System for Clean Air (OSCA) grant under UK Research and Innovation (UKRI) funding schemes (grant nos. NE/1007806/1 and NE/T001909/2).
This paper was edited by Dara Salcedo and reviewed by three anonymous referees.
Aksoyoglu, S., Jiang, J., Ciarelli, G., Baltensperger, U., and Prévôt, A. S. H.: Role of ammonia in European air quality with changing land and ship emissions between 1990 and 2030, Atmos. Chem. Phys., 20, 15665–15680, https://doi.org/10.5194/acp-20-15665-2020, 2020.
Allan, J. D., Delia, A. E., Coe, H., Bower, K. N., Alfarra, M. R., Jimenez, J. L., Middlebrook, A. M., Drewnick, F., Onasch, T. B., Canagaratna, M. R., Jayne, J. T., and Worsnop, D. R.: A generalised method for the extraction of chemically resolved mass spectra from Aerodyne aerosol mass spectrometer data, J. Aerosol Sci., 35, 909–922, https://doi.org/10.1016/j.jaerosci.2004.02.007, 2004.
Bressi, M., Cavalli, F., Putaud, J. P., Fröhlich, R., Petit, J. E., Aas, W., Äijälä, M., Alastuey, A., Allan, J. D., Aurela, M., Berico, M., Bougiatioti, A., Bukowiecki, N., Canonaco, F., Crenn, V., Dusanter, S., Ehn, M., Elsasser, M., Flentje, H., Graf, P., Green, D. C., Heikkinen, L., Hermann, H., Holzinger, R., Hueglin, C., Keernik, H., Kiendler-Scharr, A., Kubelová, L., Lunder, C., Maasikmets, M., Makeš, O., Malaguti, A., Mihalopoulos, N., Nicolas, J. B., O'Dowd, C., Ovadnevaite, J., Petralia, E., Poulain, L., Priestman, M., Riffault, V., Ripoll, A., Schlag, P., Schwarz, J., Sciare, J., Slowik, J., Sosedova, Y., Stavroulas, I., Teinemaa, E., Via, M., Vodička, P., Williams, P. I., Wiedensohler, A., Young, D. E., Zhang, S., Favez, O., Minguillón, M. C., and Prevot, A. S. H.: A European aerosol phenomenology - 7: High-time resolution chemical characteristics of submicron particulate matter across Europe, Atmos. Environ. X, 10, 100108, https://doi.org/10.1016/J.AEAOA.2021.100108, 2021.
Canonaco, F., Tobler, A., Chen, G., Sosedova, Y., Slowik, J. G., Bozzetti, C., Daellenbach, K. R., El Haddad, I., Crippa, M., Huang, R.-J., Furger, M., Baltensperger, U., and Prévôt, A. S. H.: A new method for long-term source apportionment with time-dependent factor profiles and uncertainty assessment using SoFi Pro: application to 1 year of organic aerosol data, Atmos. Meas. Tech., 14, 923–943, https://doi.org/10.5194/amt-14-923-2021, 2021.
Carslaw, D.: deweather: Remove the influence of weather on air quality data, https://openair-project.github.io/deweather/ (last access: 23 September 2025), 2025.
Chebaicheb, H., de Brito, J. F., Amodeo, T., Couvidat, F., Petit, J.-E., Tison, E., Abbou, G., Baudic, A., Chatain, M., Chazeau, B., Marchand, N., Falhun, R., Francony, F., Ratier, C., Grenier, D., Vidaud, R., Zhang, S., Gille, G., Meunier, L., Marchand, C., Riffault, V., and Favez, O.: Multiyear high-temporal-resolution measurements of submicron aerosols at 13 French urban sites: data processing and chemical composition, Earth Syst. Sci. Data, 16, 5089–5109, https://doi.org/10.5194/essd-16-5089-2024, 2024.
Chen, G., Canonaco, F., Tobler, A., Aas, W., Alastuey, A., Allan, J., Atabakhsh, S., Aurela, M., Baltensperger, U., Bougiatioti, A., De Brito, J. F., Ceburnis, D., Chazeau, B., Chebaicheb, H., Daellenbach, K. R., Ehn, M., El Haddad, I., Eleftheriadis, K., Favez, O., Flentje, H., Font, A., Fossum, K., Freney, E., Gini, M., Green, D. C., Heikkinen, L., Herrmann, H., Kalogridis, A.-C., Keernik, H., Lhotka, R., Lin, C., Lunder, C., Maasikmets, M., Manousakas, M. I., Marchand, N., Marin, C., Marmureanu, L., Mihalopoulos, N., Močnik, G., Nęcki, J., O'Dowd, C., Ovadnevaite, J., Peter, T., Petit, J.-E., Pikridas, M., Matthew Platt, S., Pokorná, P., Poulain, L., Priestman, M., Riffault, V., Rinaldi, M., Różański, K., Schwarz, J., Sciare, J., Simon, L., Skiba, A., Slowik, J. G., Sosedova, Y., Stavroulas, I., Styszko, K., Teinemaa, E., Timonen, H., Tremper, A., Vasilescu, J., Via, M., Vodička, P., Wiedensohler, A., Zografou, O., Cruz Minguillón, M., and Prévôt, A. S. H.: European aerosol phenomenology −8: Harmonised source apportionment of organic aerosol using 22 Year-long ACSM/AMS datasets, Environ. Int., 166, 107325, https://doi.org/10.1016/j.envint.2022.107325, 2022.
Chen, G., Sosedova, Y., Canonaco, F., Fröhlich, R., Tobler, A., Vlachou, A., Daellenbach, K. R., Bozzetti, C., Hueglin, C., Graf, P., Baltensperger, U., Slowik, J. G., El Haddad, I., and Prévôt, A. S. H.: Time-dependent source apportionment of submicron organic aerosol for a rural site in an alpine valley using a rolling positive matrix factorisation (PMF) window, Atmos. Chem. Phys., 21, 15081–15101, https://doi.org/10.5194/acp-21-15081-2021, 2021.
Cliff, S. J., Drysdale, W., Lewis, A. C., Møller, S. J., Helfter, C., Metzger, S., Liddard, R., Nemitz, E., Barlow, J. F., and Lee, J. D.: Evidence of Heating-Dominated Urban NOx Emissions, Environ. Sci. Technol., 59, 4399–4408, https://doi.org/10.1021/acs.est.4c13276, 2025.
Crippa, M., DeCarlo, P. F., Slowik, J. G., Mohr, C., Heringa, M. F., Chirico, R., Poulain, L., Freutel, F., Sciare, J., Cozic, J., Di Marco, C. F., Elsasser, M., Nicolas, J. B., Marchand, N., Abidi, E., Wiedensohler, A., Drewnick, F., Schneider, J., Borrmann, S., Nemitz, E., Zimmermann, R., Jaffrezo, J.-L., Prévôt, A. S. H., and Baltensperger, U.: Wintertime aerosol chemical composition and source apportionment of the organic fraction in the metropolitan area of Paris, Atmos. Chem. Phys., 13, 961–981, https://doi.org/10.5194/acp-13-961-2013, 2013.
Defra: Use of domestic fuels in the hospitality sector – a qualitative review of hospitality businesses, Department for Environment, Food & Rural Affairs, https://sciencesearch.defra.gov.uk/ProjectDetails?ProjectId=21104 (last access: 22 October 2025), 2023.
Dominici, F., Peng, R. D., Bell, M. L., Pham, L., McDermott, A., Zeger, S. L., and Samet, J. M.: Fine Particulate Air Pollution and Hospital Admission for Cardiovascular and Respiratory Diseases, JAMA, 295, 1127, https://doi.org/10.1001/jama.295.10.1127, 2006.
European Environment Agency: Europe's air quality status 2024, European Environment Agency, https://doi.org/10.2800/5970, 2024.
European Union: Directive (EU) 2024/2881 of the European Parliament and of the Council of 23 October 2024 on ambient air quality and cleaner air for Europe (recast), The European Parliament and the Council of the European Union, http://data.europa.eu/eli/dir/2024/2881/oj (last access: 23 September 2025), 2024.
Font, A., Ciupek, K., Butterfield, D., and Fuller, G. W.: Long-term trends in particulate matter from wood burning in the United Kingdom: Dependence on weather and social factors, Environmental Pollution, 314, 120105, https://doi.org/10.1016/j.envpol.2022.120105, 2022.
Fröhlich, R., Cubison, M. J., Slowik, J. G., Bukowiecki, N., Prévôt, A. S. H., Baltensperger, U., Schneider, J., Kimmel, J. R., Gonin, M., Rohner, U., Worsnop, D. R., and Jayne, J. T.: The ToF-ACSM: a portable aerosol chemical speciation monitor with TOFMS detection, Atmos. Meas. Tech., 6, 3225–3241, https://doi.org/10.5194/amt-6-3225-2013, 2013.
Gamelas, C. A., Canha, N., Vicente, A., Silva, A., Borges, S., Alves, C., Kertesz, Z., and Almeida, S. M.: Source apportionment of PM2.5 before and after COVID-19 lockdown in an urban-industrial area of the Lisbon metropolitan area, Portugal, Urban Clim., 49, 101446, https://doi.org/10.1016/j.uclim.2023.101446, 2023.
Grange, S. K. and Carslaw, D. C.: Using meteorological normalisation to detect interventions in air quality time series, Science of The Total Environment, 653, 578–588, https://doi.org/10.1016/j.scitotenv.2018.10.344, 2019.
Grange, S. K., Carslaw, D. C., Lewis, A. C., Boleti, E., and Hueglin, C.: Random forest meteorological normalisation models for Swiss PM10 trend analysis, Atmos. Chem. Phys., 18, 6223–6239, https://doi.org/10.5194/acp-18-6223-2018, 2018.
Grange, S. K., Lee, J. D., Drysdale, W. S., Lewis, A. C., Hueglin, C., Emmenegger, L., and Carslaw, D. C.: COVID-19 lockdowns highlight a risk of increasing ozone pollution in European urban areas, Atmos. Chem. Phys., 21, 4169–4185, https://doi.org/10.5194/acp-21-4169-2021, 2021.
Hass-Mitchell, T., Joo, T., Rogers, M., Nault, B. A., Soong, C., Tran, M., Seo, M., Machesky, J. E., Canagaratna, M., Roscioli, J., Claflin, M. S., Lerner, B. M., Blomdahl, D. C., Misztal, P. K., Ng, N. L., Dillner, A. M., Bahreini, R., Russell, A., Krechmer, J. E., Lambe, A., and Gentner, D. R.: Increasing Contributions of Temperature-Dependent Oxygenated Organic Aerosol to Summertime Particulate Matter in New York City, ACS ES&T Air, 1, 113–128, https://doi.org/10.1021/acsestair.3c00037, 2024.
Hong Kong EPD: Control of Oily Fume and Cooking Odour from Restaurants and Food Business, Hong Kong Environmental Protection Department, https://www.epd.gov.hk/epd/sites/default/files/epd/english/environmentinhk/air/guide_ref/files/pamphlet_oilfume_eng.pdf (last access: 23 September 2025), 2024.
Hu, R., Wang, S., Zheng, H., Zhao, B., Liang, C., Chang, X., Jiang, Y., Yin, R., Jiang, J., and Hao, J.: Variations and Sources of Organic Aerosol in Winter Beijing under Markedly Reduced Anthropogenic Activities During COVID-2019, Environ. Sci. Technol., 56, 6956–6967, https://doi.org/10.1021/acs.est.1c05125, 2022.
IPCC: Climate Change 2021 – The Physical Science Basis, Cambridge University Press, https://doi.org/10.1017/9781009157896, 2021.
Jayne, J. T., Leard, D. C., Zhang, X., Davidovits, P., Smith, K. A., Kolb, C. E., and Worsnop, D. R.: Development of an Aerosol Mass Spectrometer for Size and Composition Analysis of Submicron Particles, Aerosol Science and Technology, 33, 49–70, https://doi.org/10.1080/027868200410840, 2000.
Jeong, C.-H., Yousif, M., and Evans, G. J.: Impact of the COVID-19 lockdown on the chemical composition and sources of urban PM2.5, Environmental Pollution, 292, 118417, https://doi.org/10.1016/j.envpol.2021.118417, 2022.
Jimenez, J. L., Canagaratna, M. R., Donahue, N. M., Prevot, A. S. H. H., Zhang, Q., Kroll, J. H., DeCarlo, P. F., Allan, J. D., Coe, H., Ng, N. L., Aiken, A. C., Docherty, K. S., Ulbrich, I. M., Grieshop, A. P., Robinson, A. L., Duplissy, J., Smith, J. D., Wilson, K. R., Lanz, V. A., Hueglin, C., Sun, Y. L., Tian, J., Laaksonen, A., Raatikainen, T., Rautiainen, J., Vaattovaara, P., Ehn, M., Kulmala, M., Tomlinson, J. M., Collins, D. R., Cubison, M. J., Dunlea, J., Huffman, J. A., Onasch, T. B., Alfarra, M. R., Williams, P. I., Bower, K., Kondo, Y., Schneider, J., Drewnick, F., Borrmann, S., Weimer, S., Demerjian, K., Salcedo, D., Cottrell, L., Griffin, R., Takami, A., Miyoshi, T., Hatakeyama, S., Shimono, A., Sun, J. Y., Zhang, Y. M., Dzepina, K., Kimmel, J. R., Sueper, D., Jayne, J. T., Herndon, S. C., Trimborn, A. M., Williams, L. R., Wood, E. C., Middlebrook, A. M., Kolb, C. E., Baltensperger, U., Worsnop, D. R., Dunlea, E. J., Huffman, J. A., Onasch, T. B., Alfarra, M. R., Williams, P. I., Bower, K., Kondo, Y., Schneider, J., Drewnick, F., Borrmann, S., Weimer, S., Demerjian, K., Salcedo, D., Cottrell, L., Griffin, R., Takami, A., Miyoshi, T., Hatakeyama, S., Shimono, A., Sun, J. Y., Zhang, Y. M., Dzepina, K., Kimmel, J. R., Sueper, D., Jayne, J. T., Herndon, S. C., Trimborn, A. M., Williams, L. R., Wood, E. C., Middlebrook, A. M., Kolb, C. E., Baltensperger, U., and Worsnop, D. R.: Evolution of Organic Aerosols in the Atmosphere, Science (1979), 326, 1525–1529, https://doi.org/10.1126/science.1180353, 2009.
Joo, T., Rogers, M. J., Soong, C., Hass-Mitchell, T., Heo, S., Bell, M. L., Ng, N. L., and Gentner, D. R.: Aged and Obscured Wildfire Smoke Associated with Downwind Health Risks, Environ. Sci. Technol. Lett., 11, 1340–1347, https://doi.org/10.1021/acs.estlett.4c00785, 2024.
Kelly, F. J. and Fussell, J. C.: Size, source and chemical composition as determinants of toxicity attributable to ambient particulate matter, Atmos Environ, 60, 504–526, https://doi.org/10.1016/j.atmosenv.2012.06.039, 2012.
Krechmer, J., Lopez-Hilfiker, F., Koss, A., Hutterli, M., Stoermer, C., Deming, B., Kimmel, J., Warneke, C., Holzinger, R., Jayne, J., Worsnop, D., Fuhrer, K., Gonin, M., and de Gouw, J.: Evaluation of a New Reagent-Ion Source and Focusing Ion–Molecule Reactor for Use in Proton-Transfer-Reaction Mass Spectrometry, Anal. Chem., 90, 12011–12018, https://doi.org/10.1021/acs.analchem.8b02641, 2018.
Laj, P., Lund Myhre, C., Riffault, V., Amiridis, V., Fuchs, H., Eleftheriadis, K., Petäjä, T., Salameh, T., Kivekäs, N., Juurola, E., Saponaro, G., Philippin, S., Cornacchia, C., Alados Arboledas, L., Baars, H., Claude, A., De Mazière, M., Dils, B., Dufresne, M., Evangeliou, N., Favez, O., Fiebig, M., Haeffelin, M., Herrmann, H., Höhler, K., Illmann, N., Kreuter, A., Ludewig, E., Marinou, E., Möhler, O., Mona, L., Eder Murberg, L., Nicolae, D., Novelli, A., O'Connor, E., Ohneiser, K., Petracca Altieri, R. M., Picquet-Varrault, B., van Pinxteren, D., Pospichal, B., Putaud, J.-P., Reimann, S., Siomos, N., Stachlewska, I., Tillmann, R., Voudouri, K. A., Wandinger, U., Wiedensohler, A., Apituley, A., Comerón, A., Gysel-Beer, M., Mihalopoulos, N., Nikolova, N., Pietruczuk, A., Sauvage, S., Sciare, J., Skov, H., Svendby, T., Swietlicki, E., Tonev, D., Vaughan, G., Zdimal, V., Baltensperger, U., Doussin, J.-F., Kulmala, M., Pappalardo, G., Sorvari Sundet, S., and Vana, M.: Aerosol, Clouds and Trace Gases Research Infrastructure (ACTRIS): The European Research Infrastructure Supporting Atmospheric Science, B. Am. Meteorol. Soc., 105, E1098–E1136, https://doi.org/10.1175/BAMS-D-23-0064.1, 2024.
Lippmann, M., Chen, L. C., Gordon, T., Ito, K., and Thurston, G. D.: National Particle Component Toxicity (NPACT) Initiative: Integrated Epidemiologic and Toxicologic Studies of the Health Effects of Particulate Matter Components, Boston, Health Effects Institute, https://www.healtheffects.org/system/files/RR177-Lippmann.pdf (last access: 23 September 2025), 2013.
Liu, F., Joo, T., Ditto, J. C., Saavedra, M. G., Takeuchi, M., Boris, A. J., Yang, Y., Weber, R. J., Dillner, A. M., Gentner, D. R., and Ng, N. L.: Oxidized and Unsaturated: Key Organic Aerosol Traits Associated with Cellular Reactive Oxygen Species Production in the Southeastern United States, Environ. Sci. Technol., 57, 14150–14161, https://doi.org/10.1021/acs.est.3c03641, 2023.
Mebrahtu, T. F., McEachan, R. R. C., Yang, T. C., Crossley, K., Rashid, R., Hossain, R., Vaja, I., and Bryant, M.: Differences in public's perception of air quality and acceptability of a clean air zone: A mixed-methods cross sectional study, J. Transp. Health, 31, 101654, https://doi.org/10.1016/J.JTH.2023.101654, 2023.
Middlebrook, A. M., Bahreini, R., Jimenez, J. L., and Canagaratna, M. R.: Evaluation of Composition-Dependent Collection Efficiencies for the Aerodyne Aerosol Mass Spectrometer using Field Data, Aerosol Science and Technology, 46, 258–271, https://doi.org/10.1080/02786826.2011.620041, 2012.
Mohr, C., Huffman, J. A., Cubison, M. J., Aiken, A. C., Docherty, K. S., Kimmel, J. R., Ulbrich, I. M., Hannigan, M., and Jimenez, J. L.: Characterization of primary organic aerosol emissions from meat cooking, trash burning, and motor vehicles with high-resolution aerosol mass spectrometry and comparison with ambient and chamber observations, Environ. Sci. Technol., 43, 2443–2449, https://doi.org/10.1021/es8011518, 2009.
Mudway, I. S., Dundas, I., Wood, H. E., Marlin, N., Jamaludin, J. B., Bremner, S. A., Cross, L., Grieve, A., Nanzer, A., Barratt, B. M., Beevers, S., Dajnak, D., Fuller, G. W., Font, A., Colligan, G., Sheikh, A., Walton, R., Grigg, J., Kelly, F. J., Lee, T. H., and Griffiths, C. J.: Impact of London's low emission zone on air quality and children's respiratory health: a sequential annual cross-sectional study, Lancet Public Health, 4, e28–e40, https://doi.org/10.1016/S2468-2667(18)30202-0, 2019.
Ng, N. L., Herndon, S. C., Trimborn, A., Canagaratna, M. R., Croteau, P. L., Onasch, T. B., Sueper, D., Worsnop, D. R., Zhang, Q., Sun, Y. L., and Jayne, J. T.: An Aerosol Chemical Speciation Monitor (ACSM) for Routine Monitoring of the Composition and Mass Concentrations of Ambient Aerosol, Aerosol Science and Technology, 45, 780–794, https://doi.org/10.1080/02786826.2011.560211, 2011.
Oltra, C., Sala, R., López-asensio, S., Germán, S., and Boso, À.: Individual-Level Determinants of the Public Acceptance of Policy Measures to Improve Urban Air Quality: The Case of the Barcelona Low Emission Zone, Sustainability, 13, 1168, https://doi.org/10.3390/SU13031168, 2021.
ONS: GDP and events in history: how the COVID-19 pandemic shocked the UK economy, Office for National Statistics, https://www.ons.gov.uk/economy/grossdomesticproductgdp/articles/gdpandeventsinhistoryhowthecovid19pandemicshockedtheukeconomy/2022-05-24 (last access: 23 September 2025), 2022.
Petit, J.-E., Dupont, J.-C., Favez, O., Gros, V., Zhang, Y., Sciare, J., Simon, L., Truong, F., Bonnaire, N., Amodeo, T., Vautard, R., and Haeffelin, M.: Response of atmospheric composition to COVID-19 lockdown measures during spring in the Paris region (France), Atmos. Chem. Phys., 21, 17167–17183, https://doi.org/10.5194/acp-21-17167-2021, 2021.
Pinakidou, S.: People's perceptions of air pollution and their awareness of official indexes at the start of the twenty-first century: a review, Discover Environment, 3, 1–20, https://doi.org/10.1007/S44274-025-00213-X, 2025.
Pye, H. O. T., Ward-Caviness, C. K., Murphy, B. N., Appel, K. W., and Seltzer, K. M.: Secondary organic aerosol association with cardiorespiratory disease mortality in the United States, Nat. Commun., 12, 7215, https://doi.org/10.1038/s41467-021-27484-1, 2021.
Seinfeld, J. H., Wiley, J., and Pandis, S. N.: ATMOSPHERIC From Air Pollution to Climate Change SECOND EDITION, 628–674 pp., 2006.
Shi, Z., Song, C., Liu, B., Lu, G., Xu, J., Van Vu, T., Elliott, R. J. R., Li, W., Bloss, W. J., and Harrison, R. M.: Abrupt but smaller than expected changes in surface air quality attributable to COVID-19 lockdowns, Sci Adv, 7, 6696–6709, https://doi.org/10.1126/sciadv.abd6696, 2021.
Tian, J., Wang, Q., Zhang, Y., Yan, M., Liu, H., Zhang, N., Ran, W., and Cao, J.: Impacts of primary emissions and secondary aerosol formation on air pollution in an urban area of China during the COVID-19 lockdown, Environ. Int., 150, 106426, https://doi.org/10.1016/j.envint.2021.106426, 2021.
Tobler, A. K., Skiba, A., Wang, D. S., Croteau, P., Styszko, K., Nęcki, J., Baltensperger, U., Slowik, J. G., and Prévôt, A. S. H.: Improved chloride quantification in quadrupole aerosol chemical speciation monitors (Q-ACSMs), Atmos. Meas. Tech., 13, 5293–5301, https://doi.org/10.5194/amt-13-5293-2020, 2020.
Transport for London: Travel in London Report 13, Transport for London, https://content.tfl.gov.uk/travel-in-london-report-13.pdf (last access: 23 September 2025), 2020.
UK Health Security Agency (UKHSA): Statement on the differential toxicity of particulate matter according to source or constituents, https://www.gov.uk/government/publications/particulate-air-pollution-health-effects-of-exposure/statement-on-the-differential-toxicity-of-particulate-matter-according-to-source-or-constituents-2022 (last access: 23 September 2025), 27 July 2022.
Vasilakopoulou, C. N., Matrali, A., Skyllakou, K., Georgopoulou, M., Aktypis, A., Florou, K., Kaltsonoudis, C., Siouti, E., Kostenidou, E., Błaziak, A., Nenes, A., Papagiannis, S., Eleftheriadis, K., Patoulias, D., Kioutsioukis, I., and Pandis, S. N.: Rapid transformation of wildfire emissions to harmful background aerosol, NPJ Clim. Atmos. Sci., 6, 218, https://doi.org/10.1038/s41612-023-00544-7, 2023.
Via, M., Chen, G., Canonaco, F., Daellenbach, K. R., Chazeau, B., Chebaicheb, H., Jiang, J., Keernik, H., Lin, C., Marchand, N., Marin, C., O'Dowd, C., Ovadnevaite, J., Petit, J.-E., Pikridas, M., Riffault, V., Sciare, J., Slowik, J. G., Simon, L., Vasilescu, J., Zhang, Y., Favez, O., Prévôt, A. S. H., Alastuey, A., and Cruz Minguillón, M.: Rolling vs. seasonal PMF: real-world multi-site and synthetic dataset comparison, Atmos. Meas. Tech., 15, 5479–5495, https://doi.org/10.5194/amt-15-5479-2022, 2022.
Wei, Y., Qiu, X., Yazdi, M. D., Shtein, A., Shi, L., Yang, J., Peralta, A. A., Coull, B. A., and Schwartz, J. D.: The Impact of Exposure Measurement Error on the Estimated Concentration–Response Relationship between Long-Term Exposure to PM2.5 and Mortality, Environ. Health Perspect., 130, https://doi.org/10.1289/EHP10389, 2022.
Wei, Y., Feng, Y., Danesh Yazdi, M., Yin, K., Castro, E., Shtein, A., Qiu, X., Peralta, A. A., Coull, B. A., Dominici, F., and Schwartz, J. D.: Exposure-response associations between chronic exposure to fine particulate matter and risks of hospital admission for major cardiovascular diseases: population based cohort study, BMJ, e076939, https://doi.org/10.1136/bmj-2023-076939, 2024.
World Health Organization: WHO global air quality guidelines. Particulate matter (PM2.5 and PM10), ozone, nitrogen dioxide, sulfur dioxide and carbon monoxide, Geneva, World Health Organization, https://www.who.int/publications/i/item/9789240034228 (last access: 23 September 2025), 2021.
Wu, D., Zheng, H., Li, Q., Wang, S., Zhao, B., Jin, L., Lyu, R., Li, S., Liu, Y., Chen, X., Zhang, F., Wu, Q., Liu, T., Jiang, J., Wang, L., Li, X., Chen, J., and Hao, J.: Achieving health-oriented air pollution control requires integrating unequal toxicities of industrial particles, Nature Communications, 14, 1–12, https://doi.org/10.1038/s41467-023-42089-6, 2023.
Xu, J., Ge, X., Zhang, X., Zhao, W., Zhang, R., and Zhang, Y.: COVID-19 Impact on the Concentration and Composition of Submicron Particulate Matter in a Typical City of Northwest China, Geophys. Res. Lett., 47, https://doi.org/10.1029/2020GL089035, 2020.
Yao, X. and Zhang, L.: Identifying decadal trends in deweathered concentrations of criteria air pollutants in Canadian urban atmospheres with machine learning approaches, Atmos. Chem. Phys., 24, 7773–7791, https://doi.org/10.5194/acp-24-7773-2024, 2024.
Zhang, Q., Jimenez, J. L., Canagaratna, M. R., Allan, J. D., Coe, H., Ulbrich, I., Alfarra, M. R., Takami, A., Middlebrook, A. M., Sun, Y. L., Dzepina, K., Dunlea, E., Docherty, K., DeCarlo, P. F., Salcedo, D., Onasch, T., Jayne, J. T., Miyoshi, T., Shimono, A., Hatakeyama, S., Takegawa, N., Kondo, Y., Schneider, J., Drewnick, F., Borrmann, S., Weimer, S., Demerjian, K., Williams, P., Bower, K., Bahreini, R., Cottrell, L., Griffin, R. J., Rautiainen, J., Sun, J. Y., Zhang, Y. M., and Worsnop, D. R.: Ubiquity and dominance of oxygenated species in organic aerosols in anthropogenically-influenced Northern Hemisphere midlatitudes, Geophys. Res. Lett., 34, https://doi.org/10.1029/2007GL029979, 2007.