the Creative Commons Attribution 4.0 License.
the Creative Commons Attribution 4.0 License.
 | 05 Nov 2025
Optimizing ammonia emissions for PM2.5 mitigation: environmental and health co-benefits in Eastern China
Keqin Tang
Haoran Zhang
Ge Xu
Fengyi Chang
Yang Xu
Ji Miao
Xian Cui
Jianbin Jin
Baojie Li
Hong Liao
Nan Li
Ammonia (NH3) is a key precursor of PM2.5, contributing to the formation of secondary inorganic aerosols and playing a crucial role in haze events. However, current bottom-up emission inventories in China often underestimate NH3 emissions, particularly with significant uncertainties in urban areas. This study developed a “top-down” iterative algorithm that integrates the IASI satellite observations with the WRF-Chem model to optimize bottom-up NH3 emissions, and further quantified the impacts of source-specific emission reductions on PM2.5 pollution. The result reveals that the updated NH3 emissions in Eastern China for 2016 amounted to 4.2 Tg yr−1, 27.3 % higher than prior estimations. The optimized NH3 emissions peak in summer at 463.1 Gg month−1, with agricultural sources accounting for 85 %, while winter emissions drop to 217 Gg month−1 when the contribution from non-agricultural sources (e.g., industry, vehicle) significantly increases. The optimized NH3 emission significantly improved the simulation of both total column and surface NH3 concentrations, with improvements in magnitude (31 %–42 %) and variations (17 %–55 %). Sensitivity simulations show that a 30 %–60 % reduction in NH3 emission led to decreases of 1.5–8.8 µg m−3 in city-level PM2.5 concentrations and the potential effect of reducing non-agricultural emissions is comparable with that from agricultural sources. Furthermore, the NH3 reduction positively impacts public health, resulting in a 6.5 %–10.3 % decrease in premature deaths attributed to PM2.5 exposure. Our study evaluated NH3 emissions from various sources in Eastern China, emphasizing the impact of reducing non-agricultural ammonia emissions on air quality and public health benefits.
- Article
(4659 KB) - Full-text XML
-
Supplement
(2243 KB) - BibTeX
- EndNote


In recent years, China has continued to face significant challenges associated with PM2.5 pollution (Geng et al., 2024; Lei et al., 2022). This issue adversely affects atmospheric environment via reducing visibility (Hu et al., 2021; Yang et al., 2022) and deteriorating air quality (Lei et al., 2024; Song et al., 2025), impacts climate change by altering radiation balance (Tang et al., 2025) and cloud formation (Gao et al., 2023; Yang et al., 2021), and poses substantial threats to human health (Du et al., 2024; Feng et al., 2016; Liu et al., 2025; Xiao et al., 2022; Zhu et al., 2025). Ammonia (NH3), a key precursor of PM2.5, neutralizes sulfuric acid (H2SO4) and nitric acid (HNO3), leading to the formation of secondary inorganic aerosols (SIA), which contributes 19.4 %–55.0 % of the total PM2.5 (Huang et al., 2014; Liu et al., 2022b; Wang et al., 2016; Wei et al., 2023; Zheng et al., 2015; Zhou et al., 2022). Reducing NH3 emissions is a highly effective strategy for mitigation of PM2.5 pollution (Bessagnet et al., 2014; Xu et al., 2022), particularly in light of the successful control of sulfur dioxide (SO2) and nitrogen dioxide (NO2) in China over the past decade (Li et al., 2023b; Wang et al., 2017; Zhang et al., 2019; Zheng et al., 2018).
The anthropogenic sources of NH3 include agriculture, industry, power generation, transportation and residential activities. Numerous studies have estimated NH3 emissions using a bottom-up approach, reporting emissions in China ranging from 9.7 to 13.2 Tg yr−1 (Chen et al., 2021; Huang et al., 2012; Kang et al., 2016; Li et al., 2021; Ma, 2020). Among these sources, the agricultural (AGR) sector is identified as the dominant contributor nationwide, accounting for 75.0 %–94.5 % of total NH3 emissions (Guo et al., 2020; Ma, 2020; Zhou et al., 2021). Additionally, some studies have highlighted that in densely populated regions, NH3 from non-agricultural (non-AGR) activities, such as industrial production/slip, vehicles, and waste disposal, contributing up to 50 % of regional emissions and should not be overlooked (Chang et al., 2015, 2016; Chen et al., 2022; Feng et al., 2022; Pan et al., 2016, 2018b; Pu et al., 2020; Song et al., 2021; Sun et al., 2017; Van Damme et al., 2018; Wu et al., 2020). However, despite considerable progress, bottom-up estimates still exhibit considerable discrepancies and are often outdated, with a time lag of 1–2 years, mainly due to the lack of accurate and timely statistical data.
The uncertainty in the emission estimation further contributes to significant discrepancies, reflecting the range of results (1 %–50 %) reported in the literature, in assessing the impacts of NH3 reduction on PM2.5 level (Guo et al., 2018, 2024; Li et al., 2024; Liu et al., 2019, 2021, 2023; Pan et al., 2024; Zhang et al., 2022). Cheng et al. (2021) employed WRF-Chem simulations to demonstrate a 24.6 % reduction in PM2.5 from the removal of AGR NH3 emissions. Concurrently, Ti et al. (2022) determined that a 74 % decrease in AGR NH3 resulted in a 34.9 % reduction in PM2.5 in China.
To enhance the accuracy and reliability of bottom-up emission estimations, air quality monitoring satellites are increasingly regarded as valuable tools from a top-down perspective, offering advantages in both magnitude and timeliness (Chen et al., 2025, 2021; Guo et al., 2020; Jin et al., 2023; Qi et al., 2017; Xia et al., 2025; Zhou et al., 2021, 2017). Many studies have estimated optimized NH3 emissions in China to be between 10.0 and 18.9 Tg yr−1 by coupling chemical transport models, mass balance approaches, or machine learning techniques with various NH3 measurements (satellite retrieval or ground monitoring). Some studies have also improved the description of the spatial and monthly variations of NH3 emissions (Kong et al., 2019; Liu et al., 2022a; Paulot et al., 2014; Zhang et al., 2018, 2017). However, most top-down studies lack further investigation into the source-specific allocation of emissions based on the optimal total emission assessment (Fu et al., 2015; Sun et al., 2017; Zhang et al., 2024). Hence, a more comprehensive understanding of NH3 emissions from diverse sources across varying seasons is needed to improve existing top-down inventories and enhance the scientific accuracy of NH3 emission reduction assessments.
In this study, we used satellite and surface NH3 measurements alongside the regional chemical model WRF-Chem to constrain bottom-up and source-specific NH3 emission estimates over Eastern China, with the aim of more accurately assessing the impacts of NH3 emission reductions from different sources on PM2.5 concentrations. The paper is structured as follows: Sect. 2 describes the detailed methodology, Sect. 3 presents the simulated NH3 with prior emission, Sect. 4 provides a top-down estimate of NH3 emissions, and Sect. 5 demonstrates the direct correlation between NH3 emission reductions and PM2.5 concentration levels, as well as the associated health benefits. Our work differs from previous studies in that we constrain NH3 emissions by sector, season, and region, and further assess the potential mitigation effects of NH3 based on the optimized NH3 inventory.
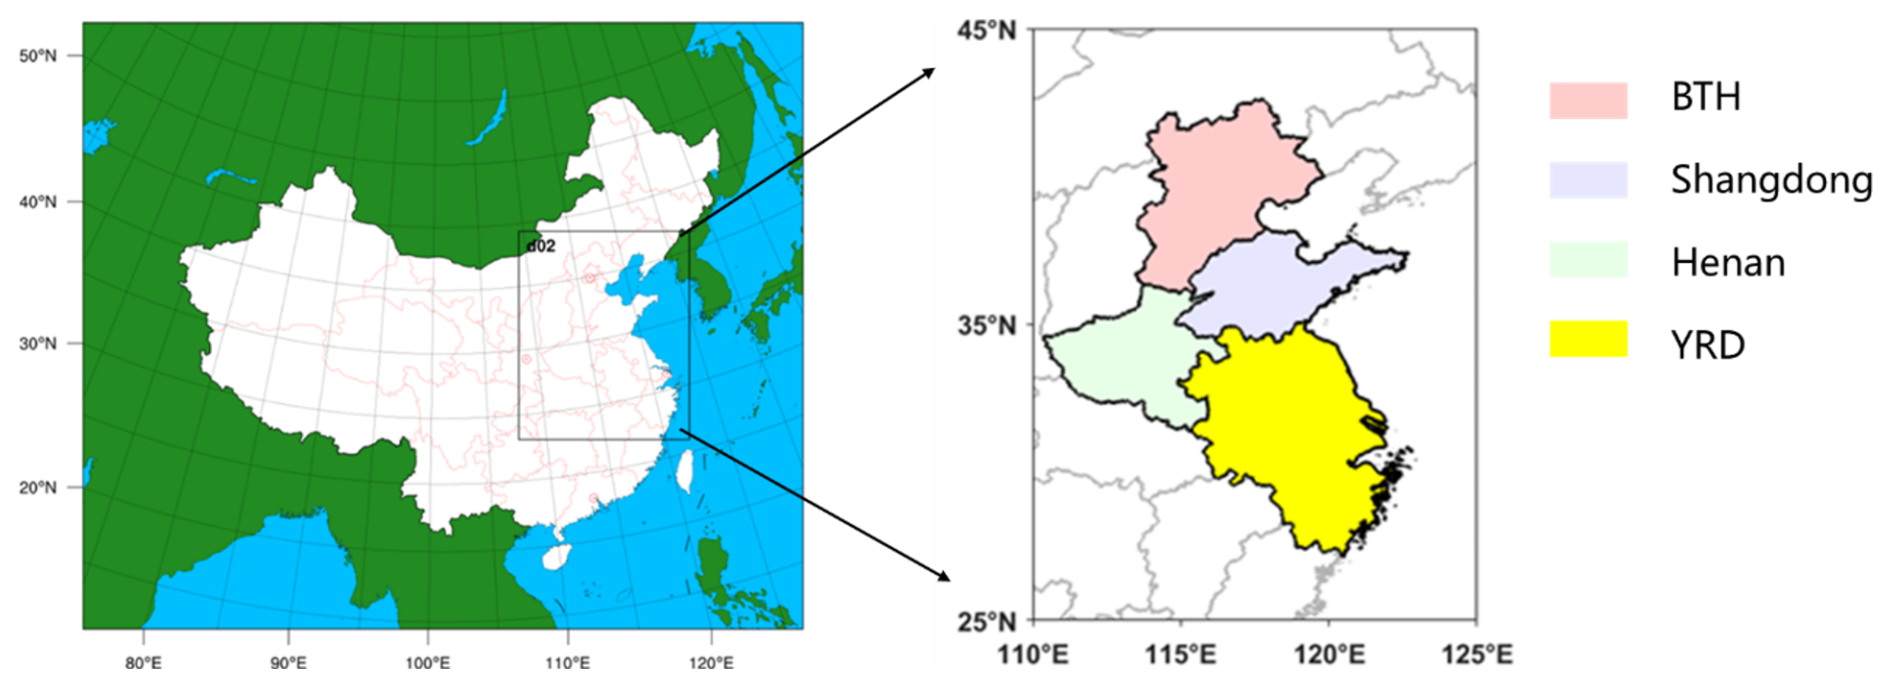
Figure 1Simulation domains of the WRF-Chem model used in this study (left). Right panel illustrates the four research regions in Eastern China. Names and locations are labeled with different colors in this panel.
2.1 Air Quality Model
In this study, the chemical transport model WRF-Chem v3.9.1 (Grell et al., 2005) was utilized to constrain the NH3 emissions and to assess the impact of reduced NH3 emission on PM2.5 concentrations. Spatially, two nested domains were configured with horizontal resolutions of 54 km × 54 km and 18 km × 18 km. The outer domain covered entire China and the inner domain focused on Eastern China, characterized by intensive anthropogenic activities and elevated pollution levels (Pendergrass et al., 2025; Peng et al., 2025), including the Beijing-Tianjin-Hebei (BTH) region, Henan, Shandong, and the Yangtze River Delta (YRD) region (Fig. 1). The initial and boundary conditions of meteorological parameters were derived from FNL reanalysis datasets provided by the National Centers for Environmental Prediction (NCEP) of the United States (https://rda.ucar.edu/datasets/, last access: 28 October 2025). The initial and boundary conditions of chemical species were obtained from the global chemical transport model MOZART (Emmons et al., 2010). We conducted simulations for the entire year of 2016. The physical and chemical parameterizations describing sub-grid processes, such as radiation, microphysics, and gas-phase reaction schemes, are listed in Table S1 in the Supplement.
We adopted the anthropogenic emissions from the Multi-resolution Emission Inventory for China (MEIC, version 1.3) developed by Tsinghua University (Li et al., 2017; Zheng et al., 2018). Furthermore, biogenic emissions were calculated online using the Model of Emissions of Gases and Aerosols from Nature (MEGAN, version 2.0.4) (Guenther et al., 2006). Our numerical simulations also incorporated offline biomass burning emissions of various air pollutants, based on the wildfire model Fire Inventory from NCAR (FINN, version 1.5) (Wiedinmyer et al., 2011).
2.2 Satellite retrievals and surface measurements
We obtained the total column density of NH3 from the passive satellite remote-sensing product of the Infrared Atmospheric Sounding Interferometer (IASI) (version 3.0, https://iasi.aeris-data.fr/nh3/, last access: 28 October 2025) as the observational constraint. The IASI is a Fourier transform spectrometer on board the Metop series of meteorological satellites, which circle the Earth in a polar Sun-synchronous orbit (Van Damme et al., 2014). Consequently, the satellite-based IASI instrument can cover the entire globe and provide measurements twice a day at 09:30 and 21:30 LST (local solar time). The IASI instrument detects infrared radiation in the spectral range from 645 to 2760 cm−1 emitted by Earth's surface and atmosphere with a 12 km circular footprint at nadir. This radiation absorption range includes the NH3 signal near 950 cm−1.
The daily NH3 column concentrations are categorized into level-2 satellite data and are developed based on the ANNI-NH3 inversion algorithm without averaging kernels, as presented by Van Damme et al. (2017). Specifically, their retrieval algorithm derives hyperspectral radiation indexes (HRI) from the direct satellite spectrum detection, which is then converted into final NH3 column concentrations using an artificial neural network technique (Whitburn et al., 2016). For better data quality, the present study removed NH3 column concentrations associated with cloud cover of more than 10 %. Furthermore, we preprocessed the IASI NH3 column concentration data through averaging all daily values to obtain a monthly mean value. Spatially, we mapped the original satellite product data to the grid cells of the WRF-Chem model for further comparison with those simulated NH3 columns.
In addition, surface in-situ NH3 measurements reported by Pan et al. (2018a) were collected for model evaluation. These ground-based measurements were summarized into the seasonal mean concentrations of NH3 at 53 sites in China from September 2015 to August 2016.
Additionally, surface meteorological data, including air temperature, relative humidity and wind speed was obtained from China Meteorological Administration website (https://data.cma.cn/, last access: 28 October 2025) to assess the meteorological simulations over the study region. Air pollutant concentrations associated with NH3 (such as PM2.5, NO2 and SO2) from public website of the Ministry of Ecology and Environment (MEE) of China (https://air.cnemc.cn:18007/, last access: 28 October 2025) were also derived for evaluation. Furthermore, speciated inorganic aerosol data from a representative site in Beijing were collected to evaluate the model's capacity in characterizing the formation of secondary inorganic aerosols (Tan et al., 2018). The complete information of the in-situ measurements used in this study is available in Tables S2–S4.
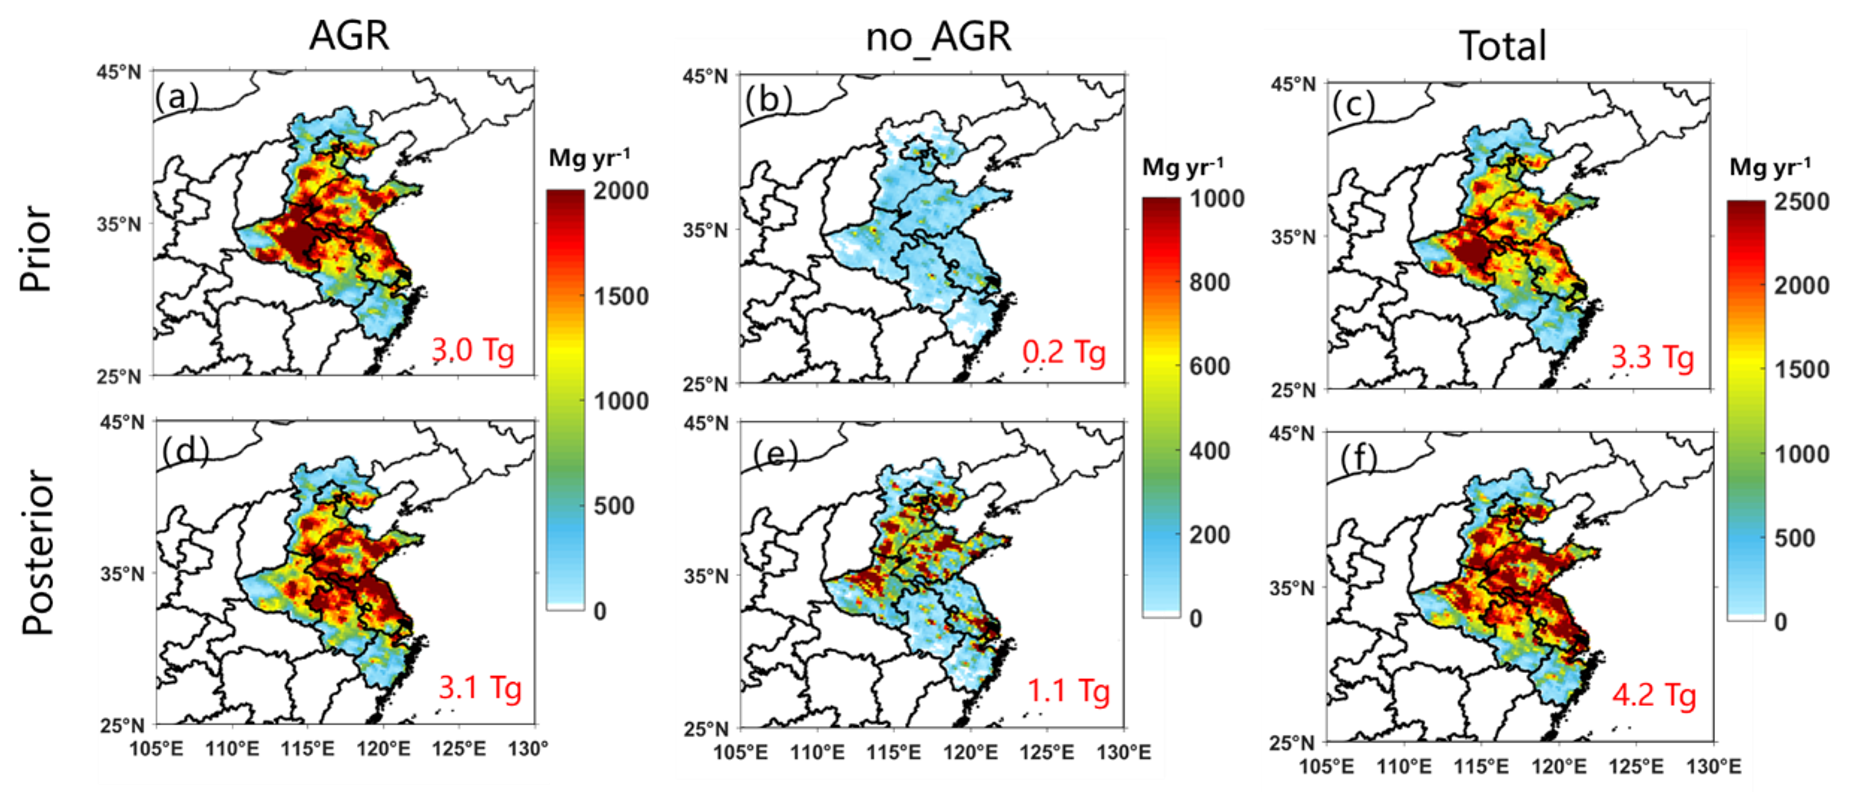
Figure 2Prior and posterior NH3 emissions from agricultural and non-agricultural sectors in the study region. The red numbers show the total emissions.
We applied the bottom-up NH3 emissions from MEIC (Li et al., 2017; Zheng et al., 2018) to drive the prior simulation. As shown in Fig. 2, the prior NH3 emission amounted to 3.3 Tg yr−1 in Eastern China, among which 93.0 % emission is from AGR sources and the other 7.0 % emission is from non-AGR sources. The largest emissions are recorded in July at 366.8 Gg month−1, while the smallest emissions are recorded in January at 206.5 Gg month−1 (Fig. S1 in the Supplement).
We compared the prior model results with IASI NH3 column concentration and surface NH3 volume concentration observations. The detailed method for calculating NH3 total column concentrations and surface volume concentrations from WRF-Chem is provided in Sect. S1 in the Supplement.
To quantitatively describe model performance, we adopted three statistical metrics, including root mean squared error (RMSE, 0 to +∞), index of agreement (IOA, 0 to 1) and mean fractional bias (MFB, −2 to 2) (Huang et al., 2021). The IOA quantifies the overall model skill, where a value of 1 indicates a perfect match and 0 denotes complete disagreement. The MFB diagnoses systematic model bias, where positive values indicate overestimation, negative values indicate underestimation, and 0 signifies no average bias. The RMSE represents the average model error in the same units as the variable under evaluation, with lower values indicating better performance. They were calculated following Eqs. (1)–(3), where C represents the concentration of the target pollutant (e.g., NH3 total column or surface concentrations), and subscripts s, o and N represent simulations, observations, and the number of samples, respectively.
As shown in Table S5, the annual average of NH3 total column concentrations is simulated to be 17.4 × 10¹⁵ for Eastern China, with a 61 % underestimation of MFB compared to the observations from IASI satellite retrievals (29.0 × 10¹⁵ ). The IOA between observations versus simulations is 0.72. The seasonal simulations of NH3 concentrations also exhibit significant discrepancies with observations, especially in spring. Specifically, the simulated NH3 total column concentration in Eastern China is only 13.2 × 10¹⁵ in spring, with concentration in 67.5 % of the study region being underestimated by more than 50 %. These discrepancies are evidently exhibited in Fig. 3. Most simulated NH3 total column concentrations are underestimated by more than 30 % compared with the observed values by satellite with the associated RMSE exceeding 10 × 1015 .
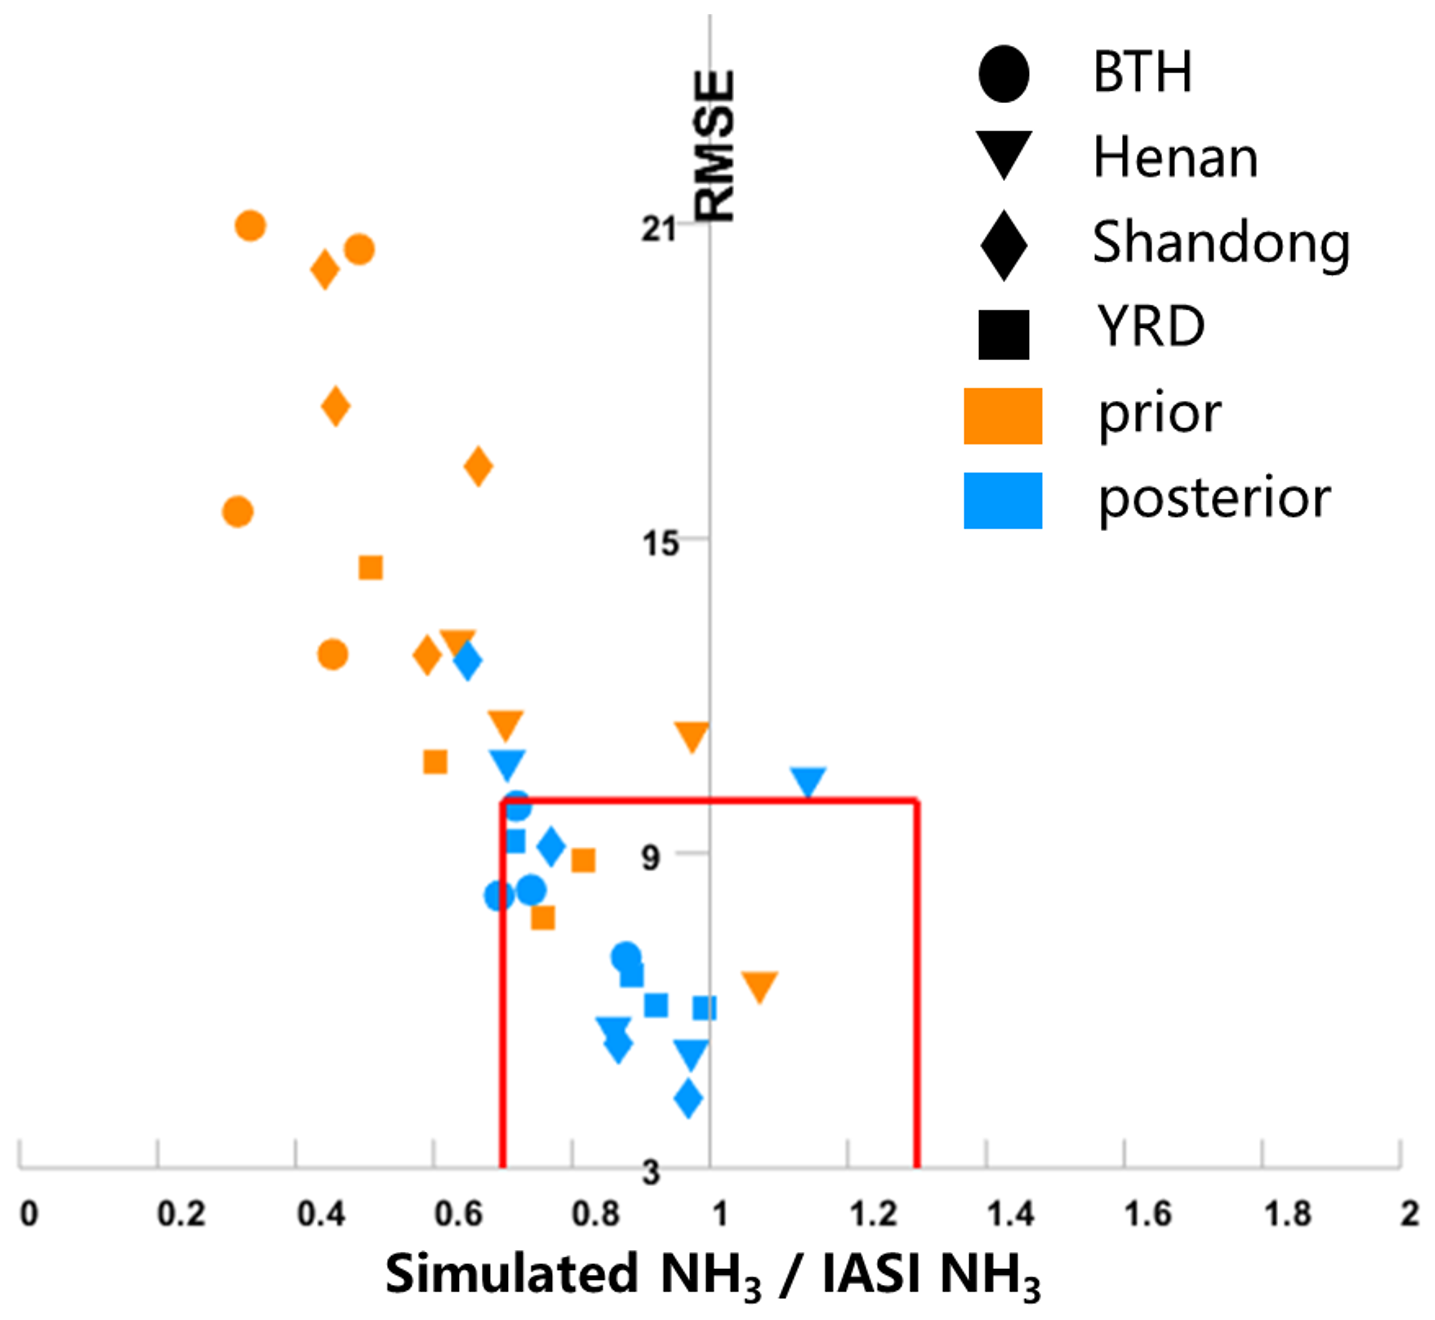
Figure 3Scatter plots of the prior and posterior NH3 total column data versus IASI retrievals. Each point represents prior (or posterior) data for a specific season and a specific region. Circles, triangles, rhombuses, and rectangles correspond to the BTH, Henan, Shandong, and YRD regions, respectively. Orange and blue markers represent a prior and a posterior data, respectively. The red box indicates the performance area, with a model error within ± 30 % and an RMSE below 10 (× 1015 ).
As illustrated in Fig. 6, satellite-based observations reveal that the spatial high-value areas of NH3 column are located at the junction of Henan, Shandong, and Hebei provinces. In contrast, the prior modeling results show that NH3 column densities are more concentrated in Henan. This indicates a clear discrepancy in the spatial distribution of NH3 column densities between the prior simulations and the observations.
Additionally, the comparison between the simulated and observed surface NH3 volume concentrations also indicates a notable underestimation (Fig. S2). The mean simulated surface NH3 volume concentration over the study region is 6.3 µg m−3, which is only half of the observation value (12.7 µg m−3), with an IOA of 0.57 and an MFB of −61 %, respectively (Table S5).
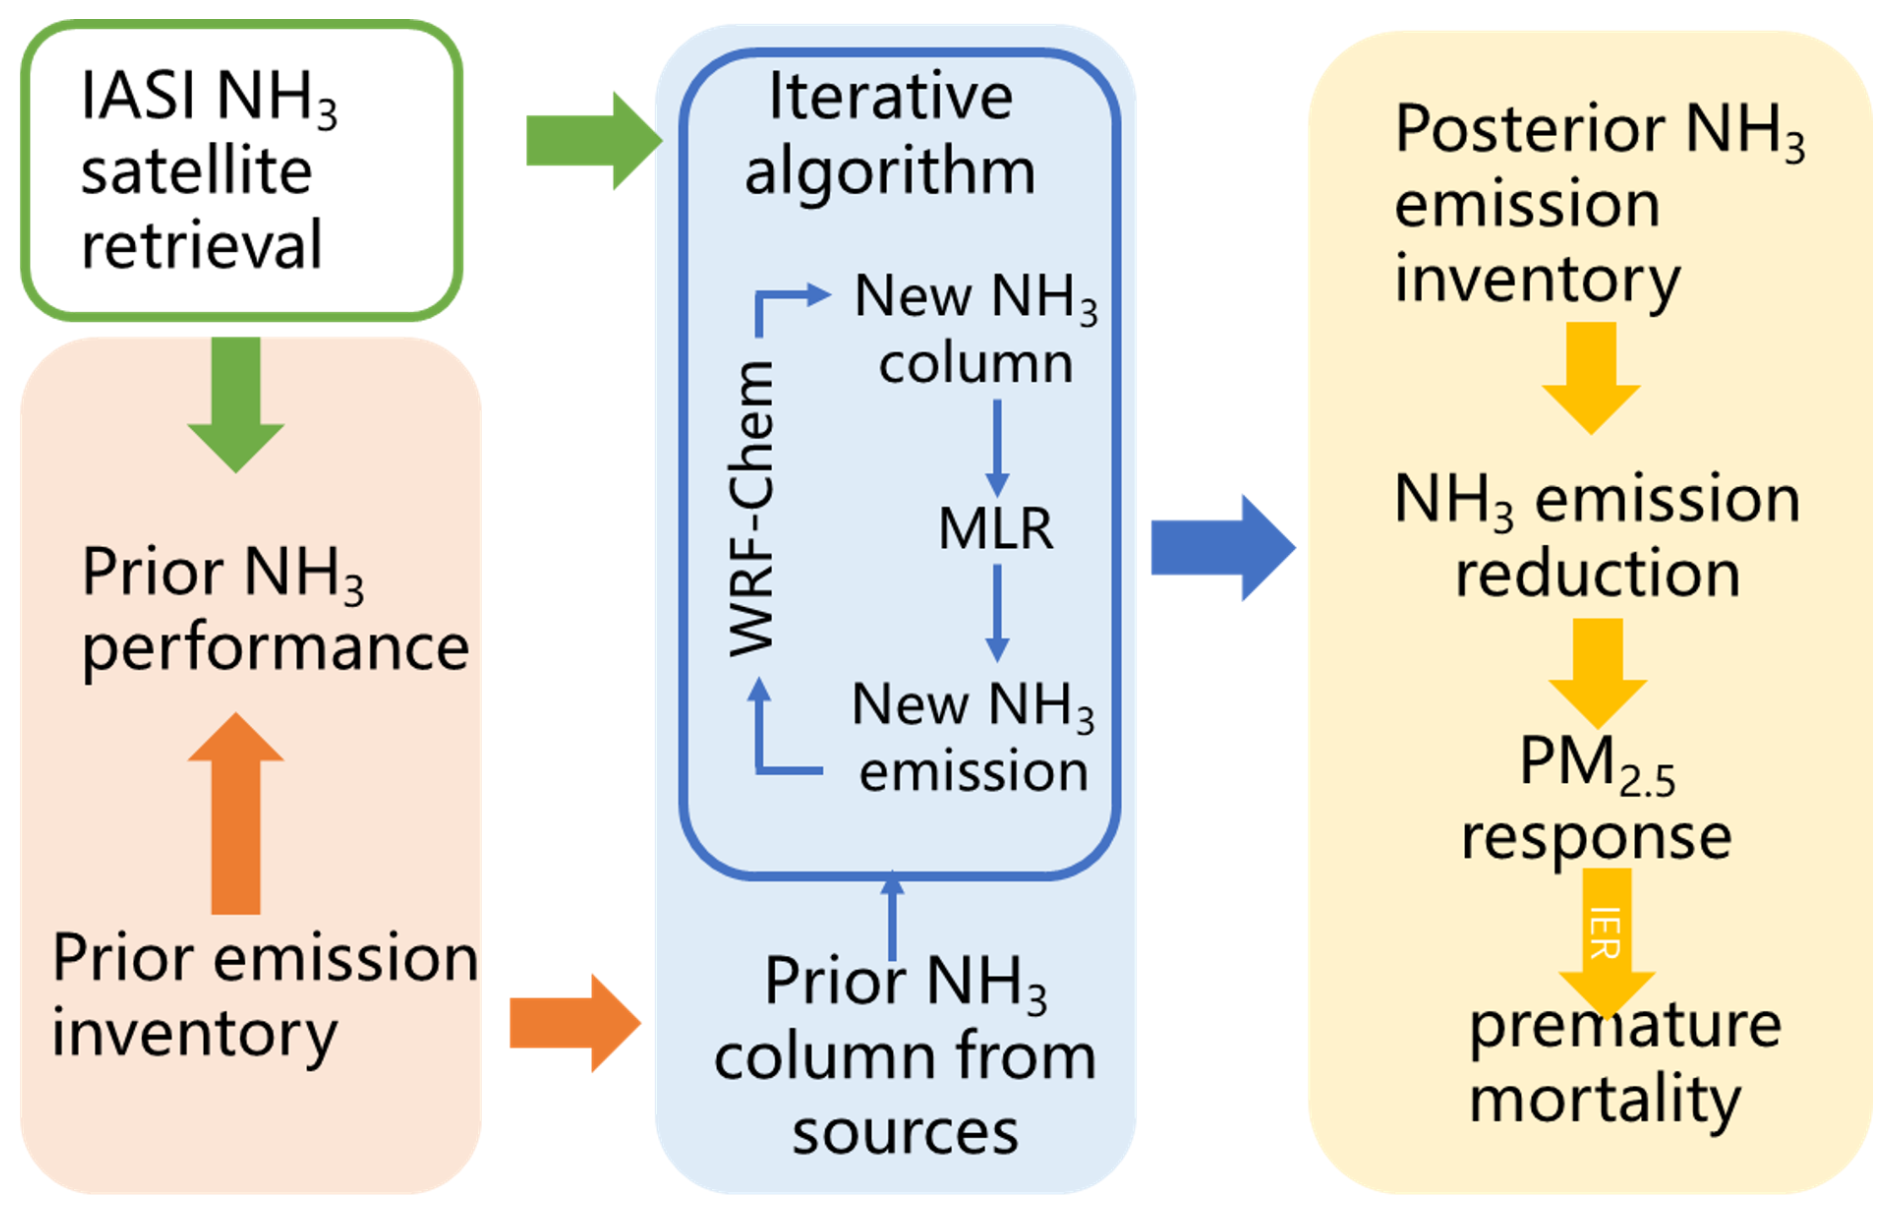
4.1 Iterative algorithm for NH3 emission estimation
We utilized an iterative algorithm (Fig. 4) to update the prior NH3 emissions from different sources constrained by IASI observations. This process was carried out in January, April, July, and October in 2016 to represent four seasons. The posterior emission inventory derived for each representative month was then applied to all three months within its corresponding season to generate the full 12 month posterior inventory. This representative-month approach was adopted to allow for a robust validation against the full 12 month period, with the remaining eight months serving as an independent dataset, and to manage the substantial computational cost of the iterative process. We compared the prior simulation results with satellite retrievals and discussed the performance of prior emissions in detail in Sect. 3. Furthermore, we conducted a series of sensitivity simulations to obtain prior simulated NH3 from disparate sources and which were then fed into the iterative algorithm along with satellite data for calculation. In each iterative calculation, the monthly average satellite-derived NH3 column concentration served as the target, and multiple linear regression (MLR) was applied to calculate the corresponding regression factors for AGR and non-AGR emissions (Fig. S3). This separation of sectors by MLR is effective because their respective spatial distributions are distinct and largely uncorrelated (r = 0.35). Here, we take the i iteration in k month, j region as an example to calculate the regression factors, and the formula is as follows:
where, denotes the monthly average of total NH3 column density retrieved from the IASI satellite data, and , and stand for the simulated total column concentration of NH3 contributed by outside transport, AGR emissions, and non-AGR emissions, respectively. We clarified this NH3 concentrations contributed by different pathways by conducting sensitivity experiments with the WRF-Chem model (Table 1).
Table 1List of sensitivity tests for optimized iterative algorithm.
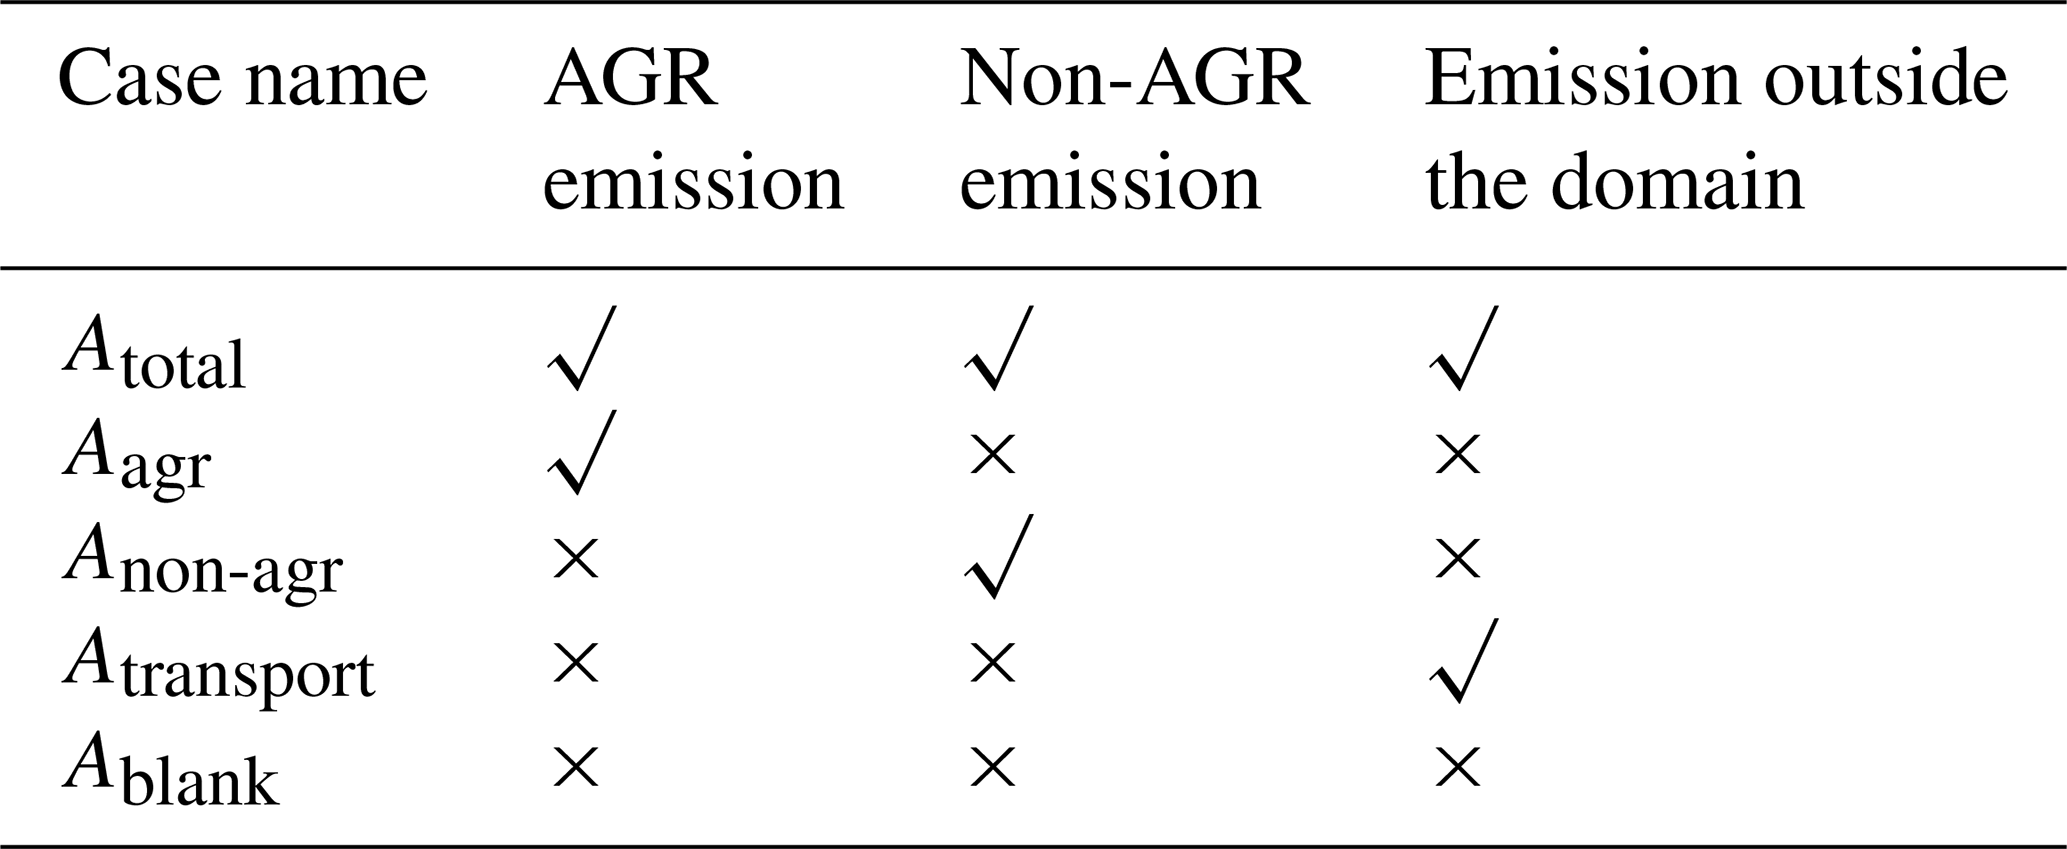
In each experiment, we zeroed out AGR emissions, non-AGR emissions and regional external emissions to obtain the corresponding NH3 column concentrations. The , , and are calculated by subtracting Ablank from Aagr, Anon-agr, and Atransport, respectively. Here, symbols A represent the total simulated NH3 column concentrations that result from each of the sensitivity simulations listed in Table 1. Specifically, the modeling case Ablank refers to a simulated NH3 total column in which all anthropogenic emissions within the study domain were zeroed out. The purpose of this simulation was to establish background concentrations, which represents the influence of the chemical boundary conditions provided to our model domain.
Furthermore, the MLR approach provided regression coefficients and , which function as scaling factors, respectively correspond to AGR and non-AGR NH3 emissions in month j from region k, within the i iteration. To ensure the statistical robustness of the regression equation, we need to correct for this regression coefficient. The biases between the model simulation and the satellite retrievals were calculated as . Specifically, it is the difference between the mean simulated column and the mean satellite retrieval, divided by the mean satellite retrieval. We considered the residuals of the MLR approach, the goodness of fit and , and obtained the judgment coefficient . The regression coefficients with excessive residuals, defined as cases where the 95 % confidence interval of the residual does not contain zero, are removed to increase credibility. Concurrently, the goodness of fit of the regression is calculated as the coefficient of determination (R-square, R2). To maintain algorithm stability, regressions with an R2 less than 0.3 are deemed invalid and excluded from the emission update, as they exhibit insufficient explanatory power (indicating > 70 % unexplained variance) and introduce destabilizing noise into the adjustments. We further use it to make a trade-off for the regression coefficient. If a regression is valid, the adjustment factors a and b are set to the new regression coefficients; if invalid, the factors are kept unchanged from the previous iteration. The updated emissions for the next iteration are then calculated by multiplying the emissions from the previous step by these adjustment factors. Finally, the entire process is iteratively repeated, a framework that captures the overall non-linear atmospheric response by combining the dynamic simulation of non-linear chemistry within each WRF-Chem step with the collective behavior of multiple iterations. The iteration concludes when the mean bias between the simulated values and observations is less than 30 %, a criterion chosen to represent a significant improvement over the large prior bias while falling within the range of widely accepted model performance benchmarks.
4.2 posterior NH3 emission estimates
The top-down constrained results (posterior) indicate that the annual NH3 emission in Eastern China has been updated to 4.2 Tg yr−1, representing a 27.3 % increase compared to the prior value (Fig. 2). The posterior AGR emissions increased slightly, from 3.0 to 3.1 Tg yr−1, but the high-emission regions shift from Henan to Shandong, Jiangsu and northern Anhui (Ren et al., 2023). The posterior non-AGR emissions show a significant increase, from 0.2 to 1.1 Tg yr−1, particularly in urban regions along the Yangtze River, as well as in southern BTH, central Shandong and northern Henan (Fig. S4). Analysis of emission inventories (An et al., 2021; Hoesly et al., 2018; Li et al., 2021, 2017; Ma, 2020; Wu et al., 2024) reveals that residential activities and waste disposal are dominant sources of non-AGR NH3 emissions, particularly in densely populated regions (Fig. S5). In multiple iterations, the framework optimizes the relative mix of the two sources to better match the observed spatial patterns. For instance, the spatial correlation between model and observation in Henan increased from 0.47–0.58 (prior simulations) to 0.64–0.90 (posterior simulations).
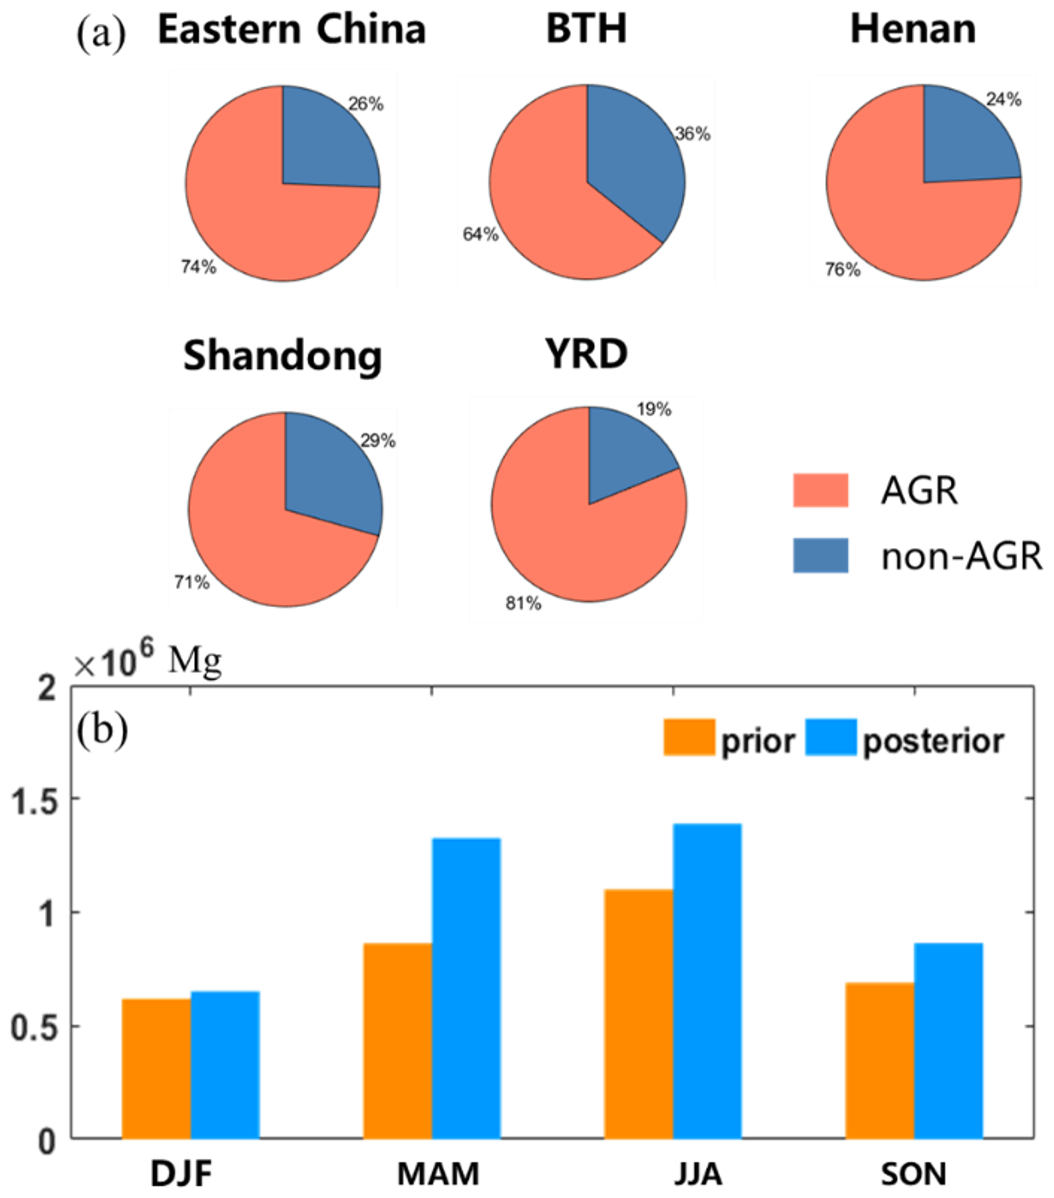
Figure 5Posterior emission characteristics. (a) Contribution from regional emission sectors. (b) Comparison of the posteriori and prior emissions (unit: Mg) in study region.
In terms of seasonality, as shown in Fig. 5, the posterior NH3 emissions are highest in summer, with a total of 463.1 Gg month−1, followed by spring (442.4 Gg month−1), largely due to fertilizer application (Li et al., 2021; Lu et al., 2025; Ren et al., 2025), and lowest in winter (217.4 Gg month−1). The seasonal variations in the posterior emissions is the net result of complex adjustments in both the AGR and non-AGR sectors. At the specific-source scale (Fig. S6), AGR NH3 emissions show similar seasonal patterns with the total NH3 emissions, higher in summer and spring. In contrast, non-AGR NH3 are highest in winter and fall because fossil fuel combustion-related emissions are higher in cold season, while the lowest emissions occur in summer. In addition, the ratio of AGR and non-AGR NH3 emissions significantly varies across different regions. The contribution of non-AGR NH3 emissions range from 18.8 % to 35.8 %, which is higher than the proportion in the prior inventory (Fig. 5a). This shift can be attributed to the increased relative importance of fossil fuel combustion-related emissions under high PM2.5 loadings, which in turn promote higher NH3 emissions from these sources (Pan et al., 2018b). Meanwhile, AGR NH3 emissions are relatively inactive in winter due to unfavorable meteorological conditions. Similar high fractions of non-AGR emissions have also been reported in other studies (Feng et al., 2022; He et al., 2021).
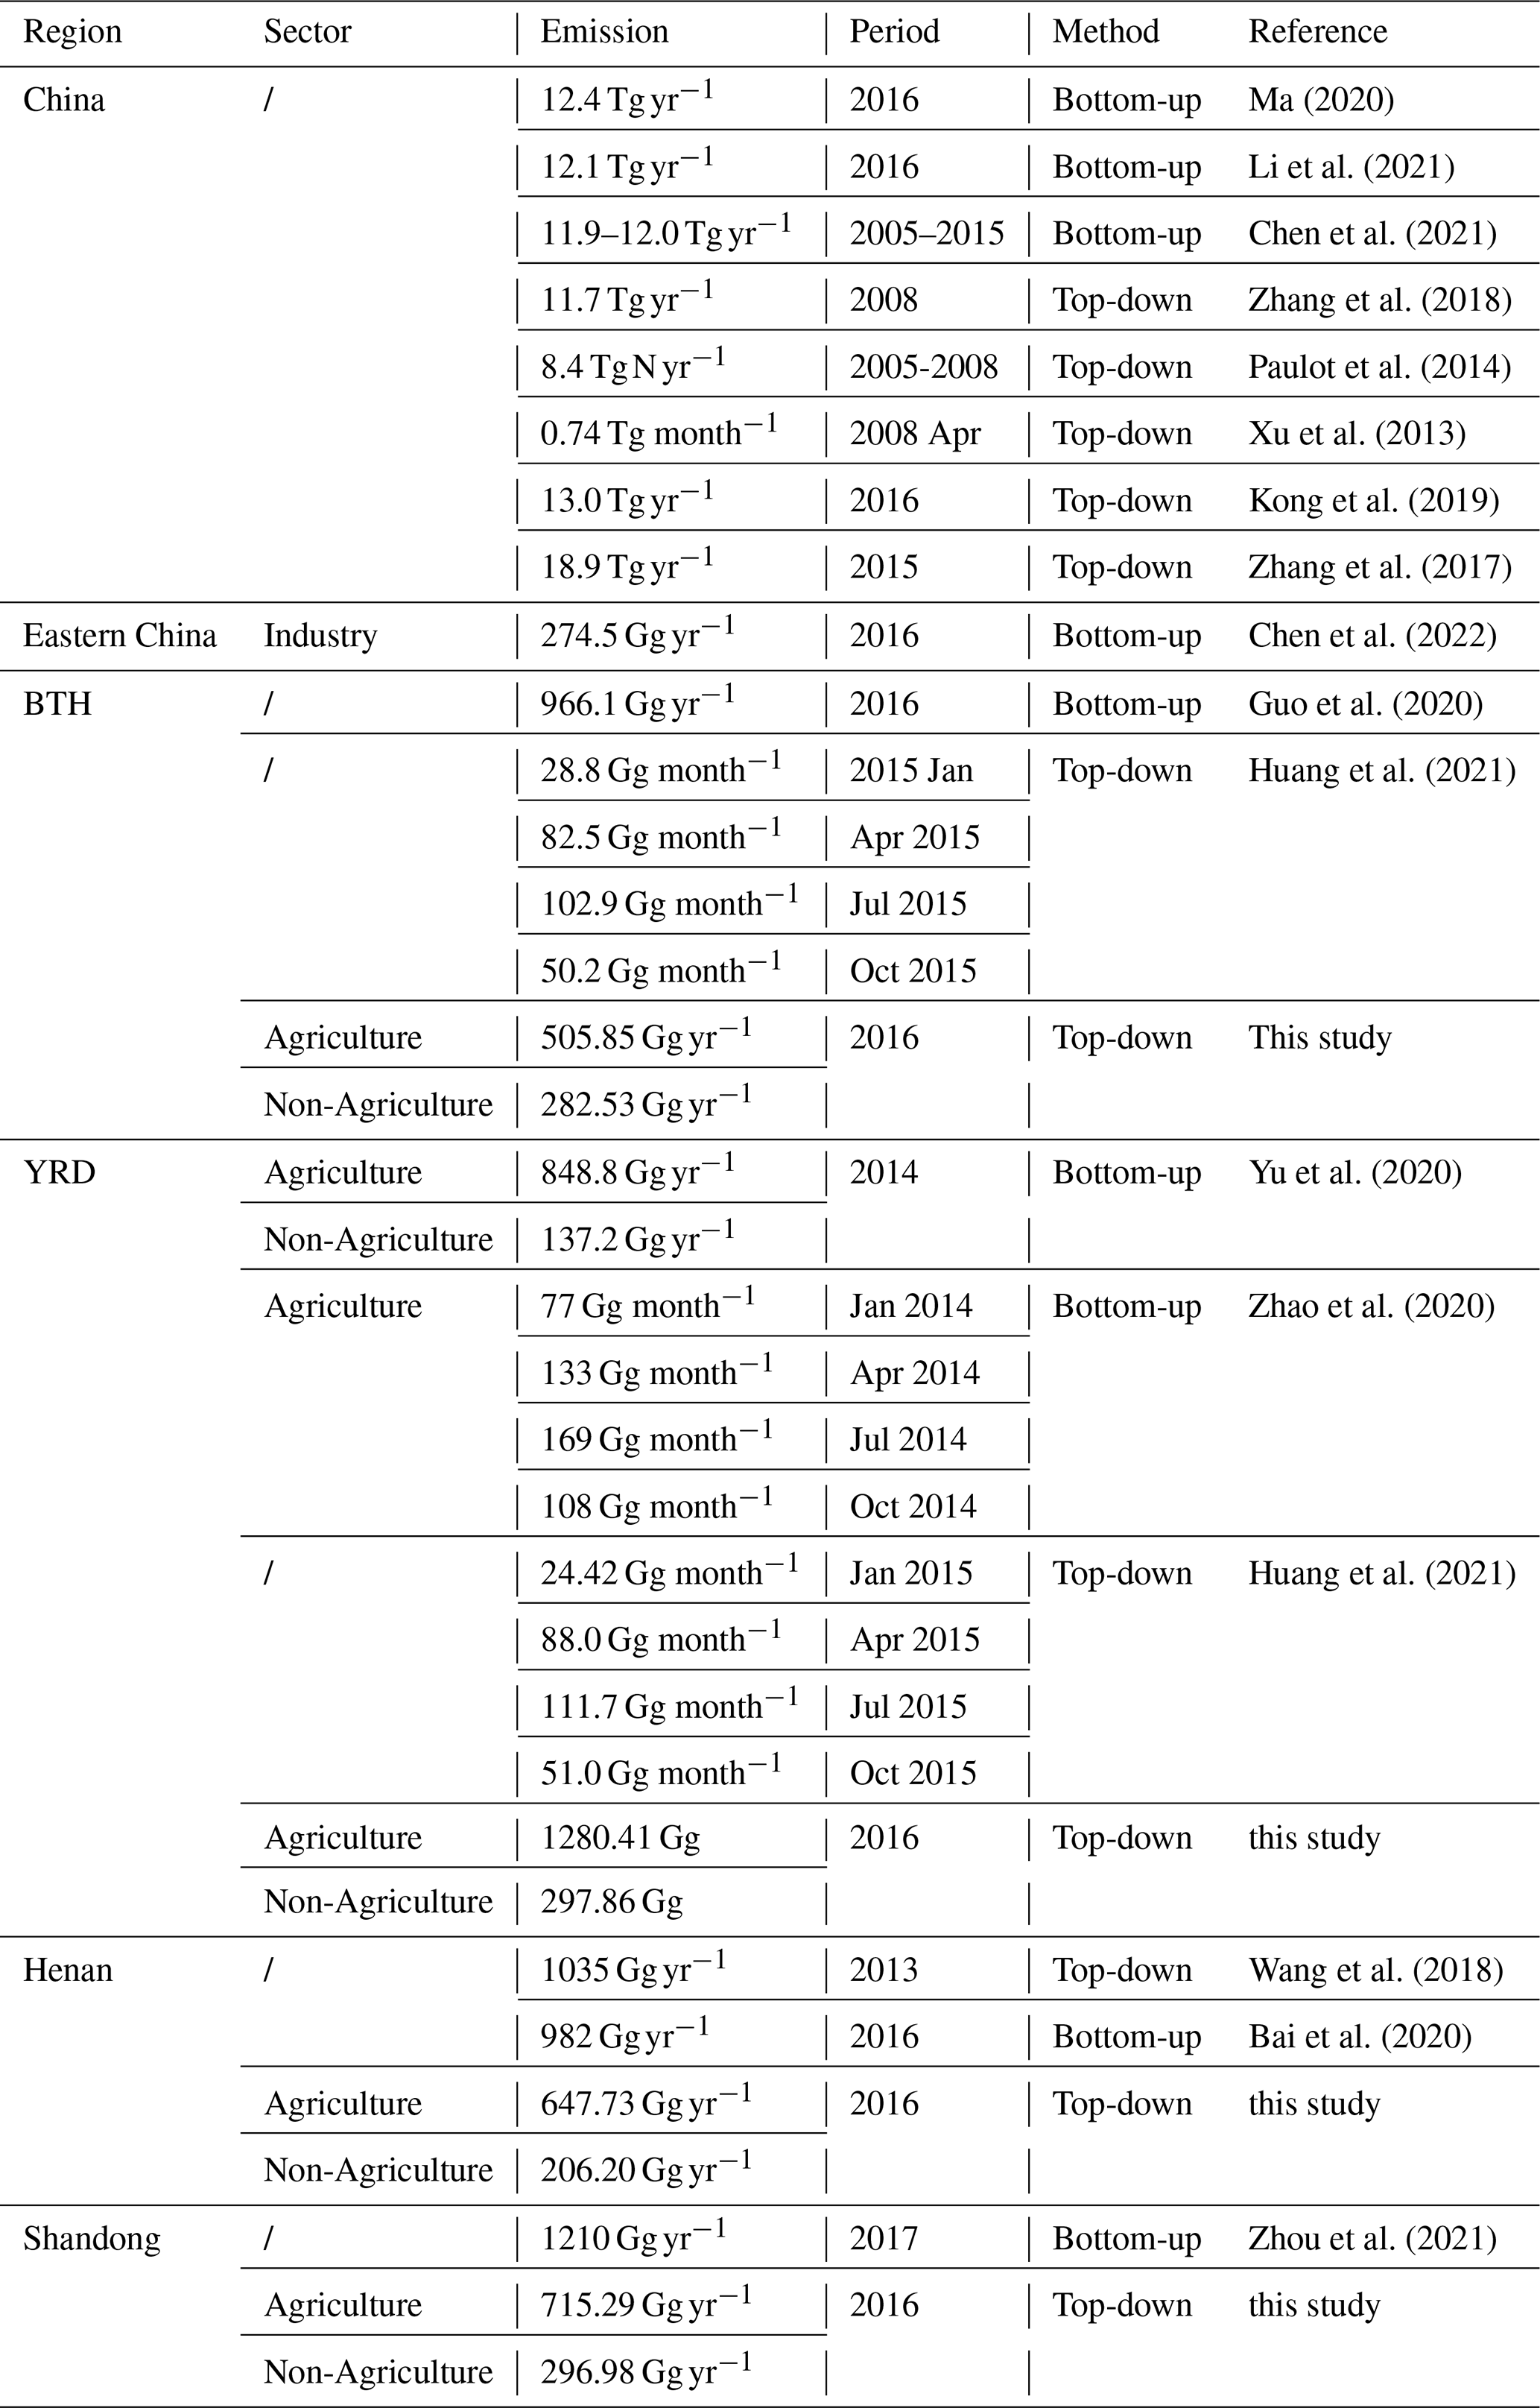
Table 2 compares the results with related studies focused on NH3 emission estimates. Overall, the estimated NH3 emission in this study is comparable to the estimates of the other studies based on both “top-down” and “bottom-up” approaches. In similar years and regions, the discrepancy between the estimates of this study and other studies ranges from 1.0 % to 19.6 %. The slight discrepancy can be partially explained by our estimate being a conservative lower bound, a consequence of the residual gap remaining with satellite retrieval. Additionally, uncertainties from the model's chemical mechanisms and the influence of nearby grid transport also contribute to this gap, but the overall impact on the final estimate is limited. Furthermore, the seasonal distribution of NH3 emissions in this study aligns with the findings of previous studies (Kong et al., 2019; Liu et al., 2024; Zhang et al., 2018; Zhao et al., 2020).
In terms of sectors, other studies have indicated that the contribution of NH3 emissions from AGR sources is more than 80 %, using the bottom-up approach (Chen et al., 2021; Huang et al., 2012; Kang et al., 2016; Li et al., 2021). The relatively small proportion of non-AGR emissions is likely due to overlooked industrial (e.g., NH3 slip and indirect emissions) (Chen and Wang, 2025; Chen et al., 2022; Wei et al., 2022) and residential sources (e.g., from waste) (Shao et al., 2020), combined with unrepresentative transportation emission factors (Sun et al., 2017; Zhang et al., 2021). This study, however, reveals a proportion of 74.4 % for AGR emissions, thereby emphasizing the contribution of non-AGR emissions. Concurrently, the eastern developed industry is expected to exhibit an increase in the proportion of NH3 emissions from non-AGR sources when compared to the national average. Our work attempts to quantitatively disentangle the emissions from AGR and non-AGR sectors directly within our top-down framework and facilitates a more comprehensive capture of neglected non-AGR sources.
It is important to note that discrepancies in results between studies may be attributable to methodological differences (e.g. the sensitivity of the top-down approach to target data selection) and uncertainty in the underlying data. For instance, the NH3 emission estimated by Paulot et al. (2014) using the mass balance method based on ammonium wet deposition fluxes is significantly lower than that in other studies, which may be attributed to its fewer observation sites in China. These discrepancies underscore the necessity to enhance the reliability of NH3 observations in forthcoming studies, with the objective of enhancing the precision of the estimates.
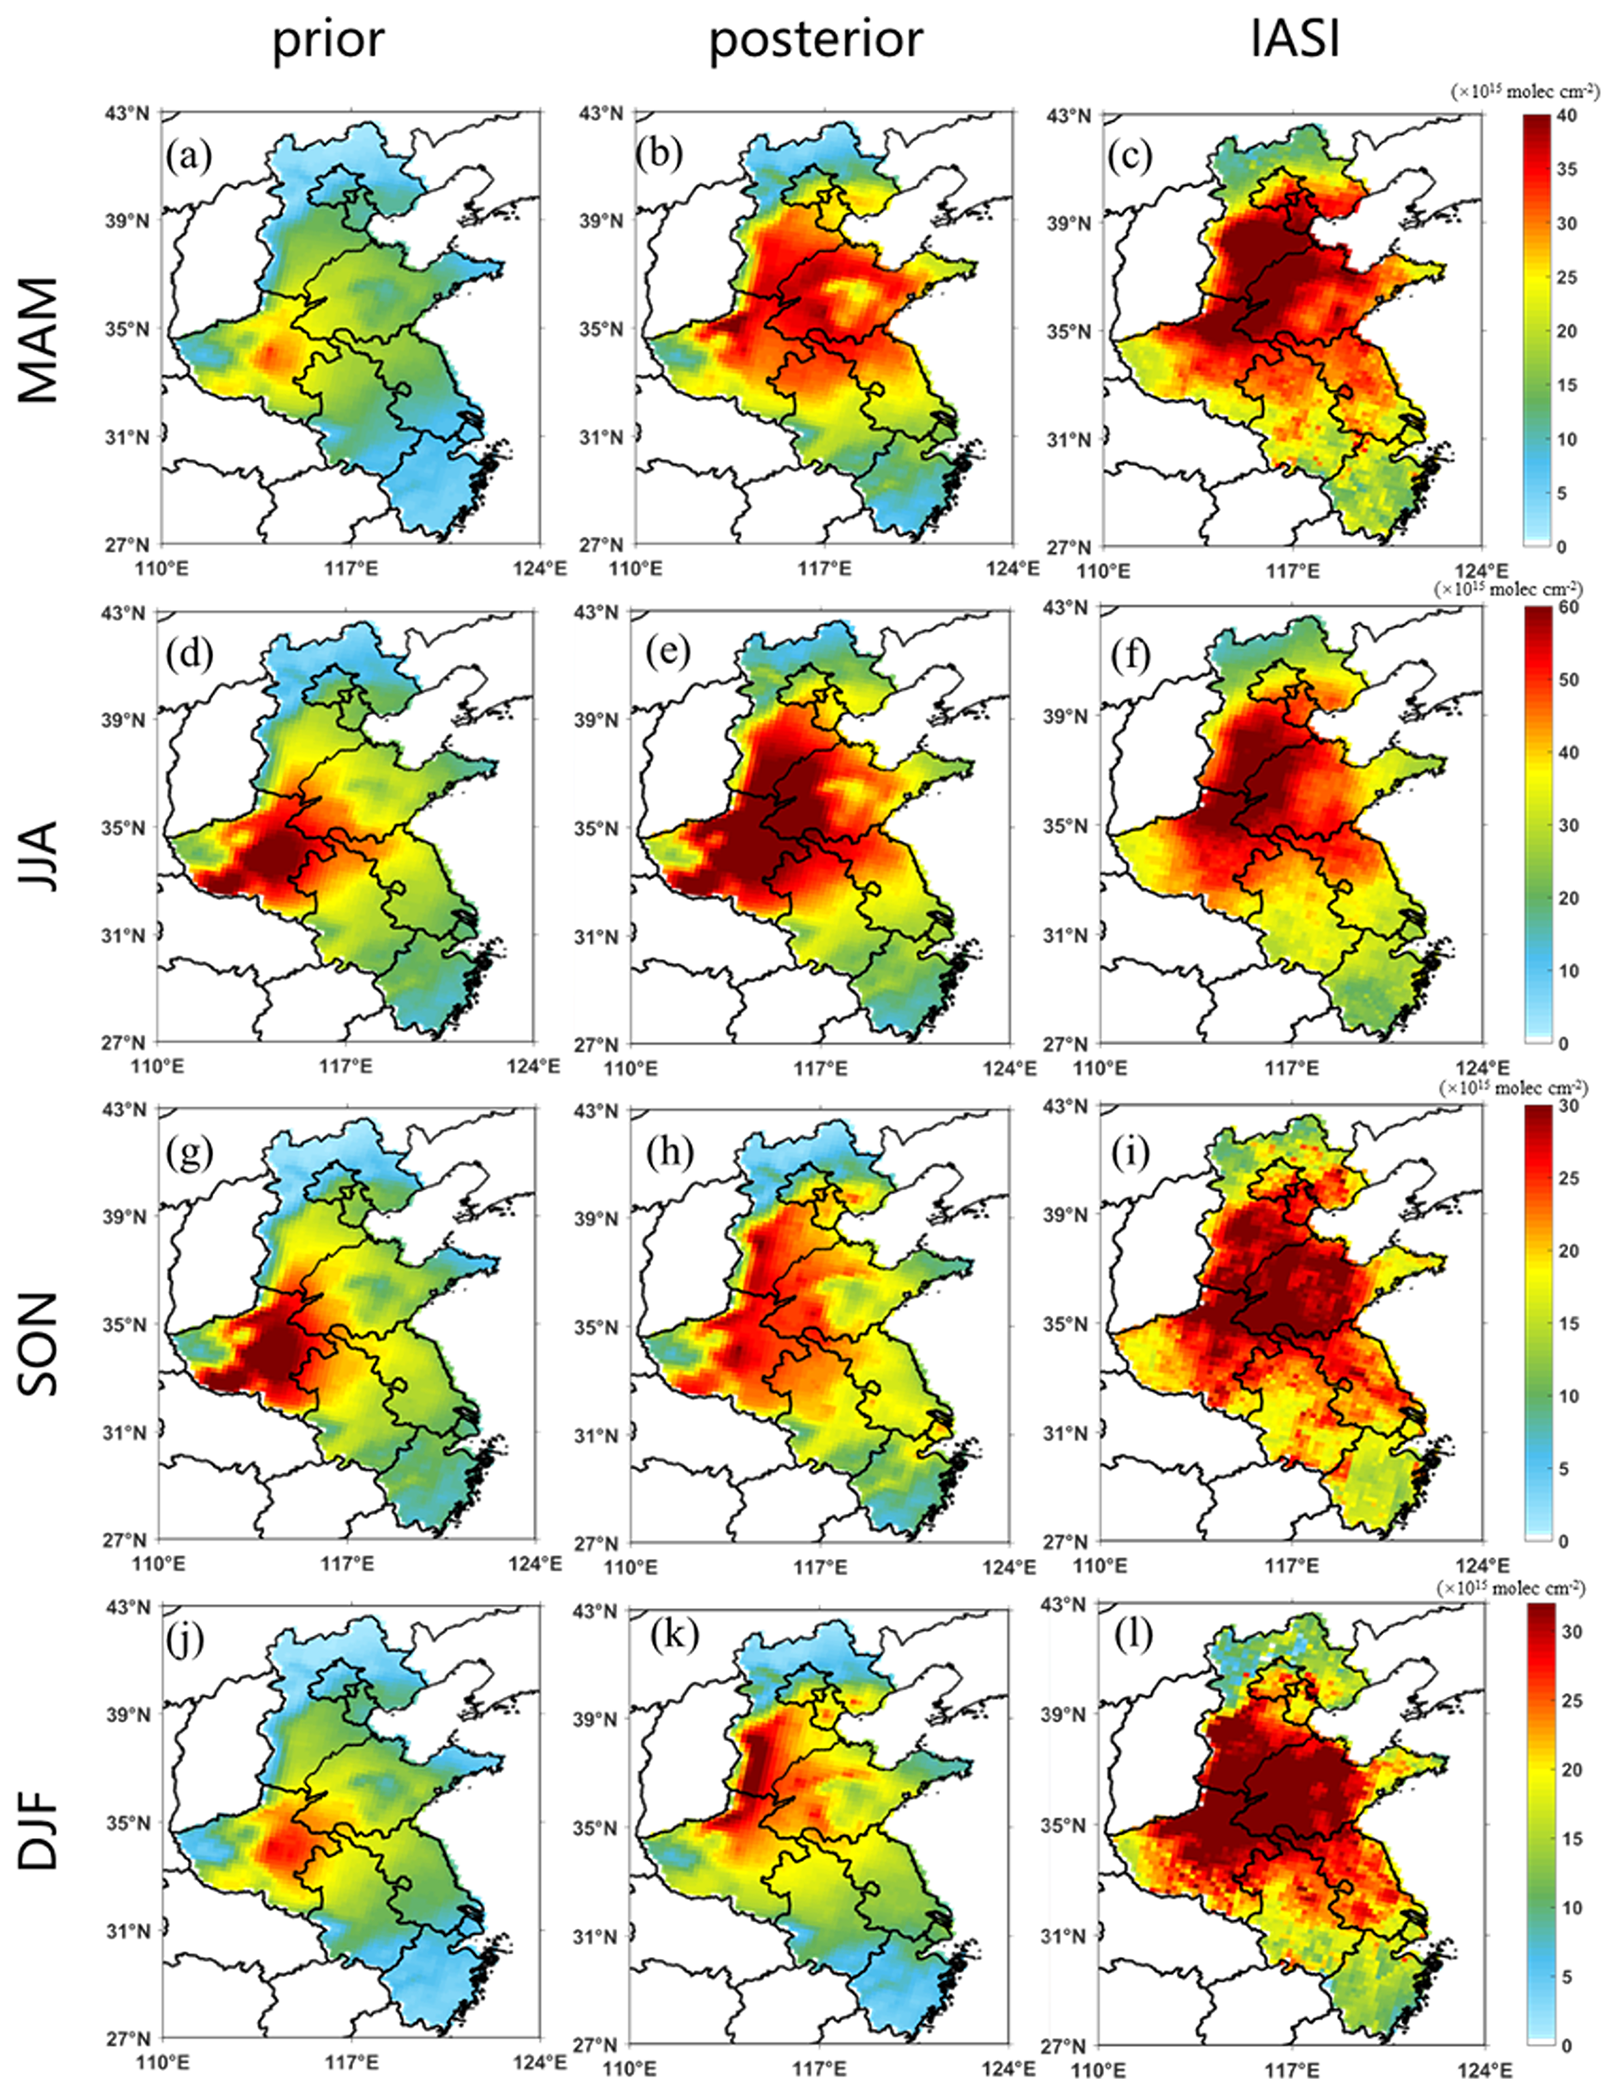
Figure 6Distributions of NH3 total column from prior simulation, posterior simulation and satellite retrieval in different seasons.
4.3 Simulated NH3 with top-down emissions
Figure 6 compares the spatial distributions of NH3 total column density from satellite retrievals, prior simulations and posterior simulations. The annual mean simulated NH3 total column density improved from the prior result of 17.4 × 10¹⁵ to a posterior value of 23.7 × 10¹⁵ , with an increase of 35.9 %, and is closer to the observed value of 29.0 × 10¹⁵ . IOA and MFB between the posterior simulations versus measurements are 0.9 and −30.0 %, respectively. Figure 3 also shows the improvement in model performance. More than 80 % of the points fall in the range where the simulation-to-observation ratio is between 0.7 and 1.3 and the RMSE is less than 10 × 1015 . A more consistent seasonal distribution can be obtained in a posterior simulation, with associated temporal MFB of NH3 column density on the seasonal scale is reduced from −53 % (prior) to −24 % (posterior). Simultaneously, the spatial distribution pattern of posterior simulation is more identical to the characteristics revealed by satellite-based observations (Fig. 6). The spatial MFB is also decreased from −52 % (prior) to −20 % (posterior), with an increase in spatial correlation coefficient from 0.79 to 0.92. The improvement is especially notable in the BTH region, where the simulated NH3 column densities are doubled. In summary, the posterior simulation improves the agreement between the simulated NH3 column concentrations and satellite observations in both overall magnitude and spatial distribution, although some deviations remain, particularly in the colder seasons. These can likely be attributed to methodological limitations, such as the inherent tolerance of our 30 % iterative stopping criterion and potential inconsistencies from aggregating monthly optimizations to a seasonal scale.
A similar improvement is also witnessed in the modeling of surface NH3 concentrations, which were evaluated against in-situ measurements from 13 sites reported by Pan et al. (2018a) for the 2015–2016 period (Table S2). The posterior simulation significantly improves the annual mean, increasing the surface concentration from 6.3 µg m−3 (prior) to 9.4 µg m−3 (posterior), much closer to the observed average of 12.7 µg m−3 . As shown in the scatter plot in Fig. S7, the posterior simulation alleviates the underestimation at most sites, which is quantified by a 42 % reduction in the overall underestimation bias and a clear improvement in the IOA. On a seasonal basis, the posterior emissions also alleviate the large underestimation of the prior simulation across all seasons, though the degree of improvement varies (Table S6). The prior simulation showed significant underestimation in all seasons, with the MFB ranging from −0.37 in winter to −0.79 in spring. The posterior simulation demonstrates a particularly evident improvement in spring, where the MFB reduced from −0.79 to −0.24. While some underestimation remains in summer, the posterior results still show improved performance metrics (e.g., lower RMSE and higher IOA) for all seasons, confirming a better capture of the seasonal characteristics overall. The remaining discrepancy between the posterior simulation and surface observations can be attributed to several factors, such as the spatial representativeness of the surface sites and the accuracy of the secondary inorganic aerosol simulation.
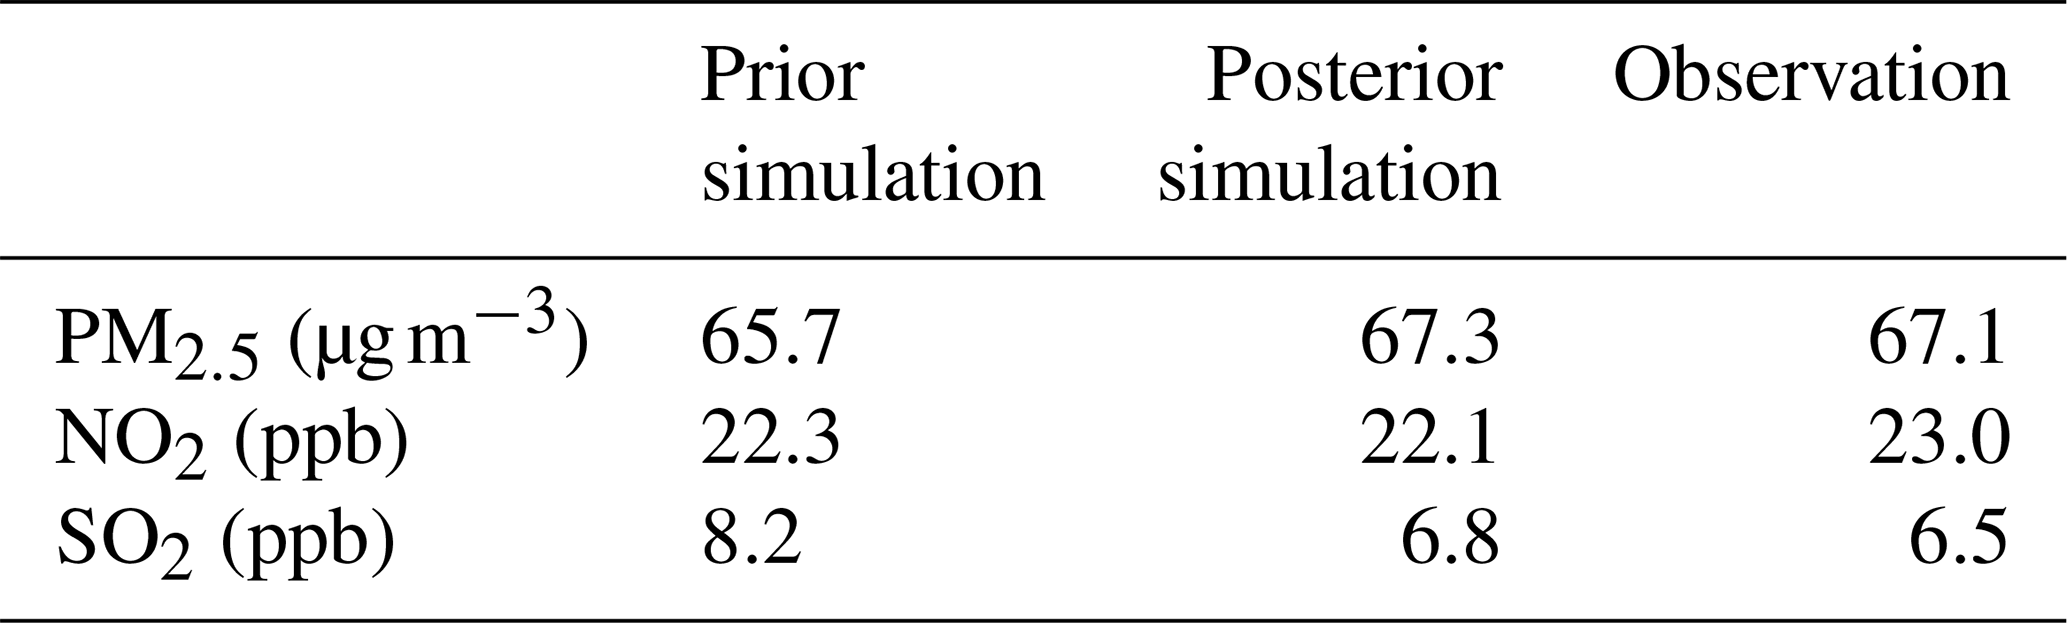
Furthermore, improving the NH3 simulation results in the other simulated air pollutants being closer to observed levels (Table 3). Specifically, we compare the annual mean concentrations of PM2.5, SO2, and NO2 from the prior and posterior simulations against surface observations averaged from 80 monitoring sites across 9 major cities (Table S4). It was found that posterior NH3 emissions effectively bridge the gap between simulated and observed PM2.5. The average PM2.5 concentration increased from 65.7 to 67.3 µg m−3, which is closer to the observed value of 67.1 µg m−3. To further characterize the model's chemical performance beyond total PM2.5, we also evaluated the simulation of secondary inorganic aerosol (SIA) components against in-situ measurements from a representative site in Beijing (Table S7). The evaluation shows that the posterior NH3 emissions improved the simulation of ammonium and nitrate, reducing the bias between simulated and observed concentrations. Although the model underestimates sulfate, likely due to missing formation mechanisms (Cai et al., 2024; Wang et al., 2021, 2020), the total SIA concentration is well reproduced with an overall bias of only −11.0 %. A similar improvement is also observed for SO2, where the posterior simulated concentration (6.8 ppbv) better matches the observed value (6.5 ppbv), reducing the model's previous overestimation by 27 %. This improvement is most significant in autumn. The successful capture of air pollutants highlights a significant improvement in the NH3 emission inventory for Eastern China. The evaluation of routine air pollutants in each city is detailed in Figs. S8–S10. The statistics of evaluation metrics for each city's meteorological simulations can also be found in Table S8.
To investigate the response of PM2.5 to various NH3 emission reduction scenarios, we conducted sensitivity experiments as outlined in Table S9. We formulated emission reduction scenarios of 30 %–60 % for January and July of 2016, considering the severe particulate pollution in winter and the higher NH3 concentrations in summer. Emission reductions from both the AGR and non-AGR sectors were considered separately.
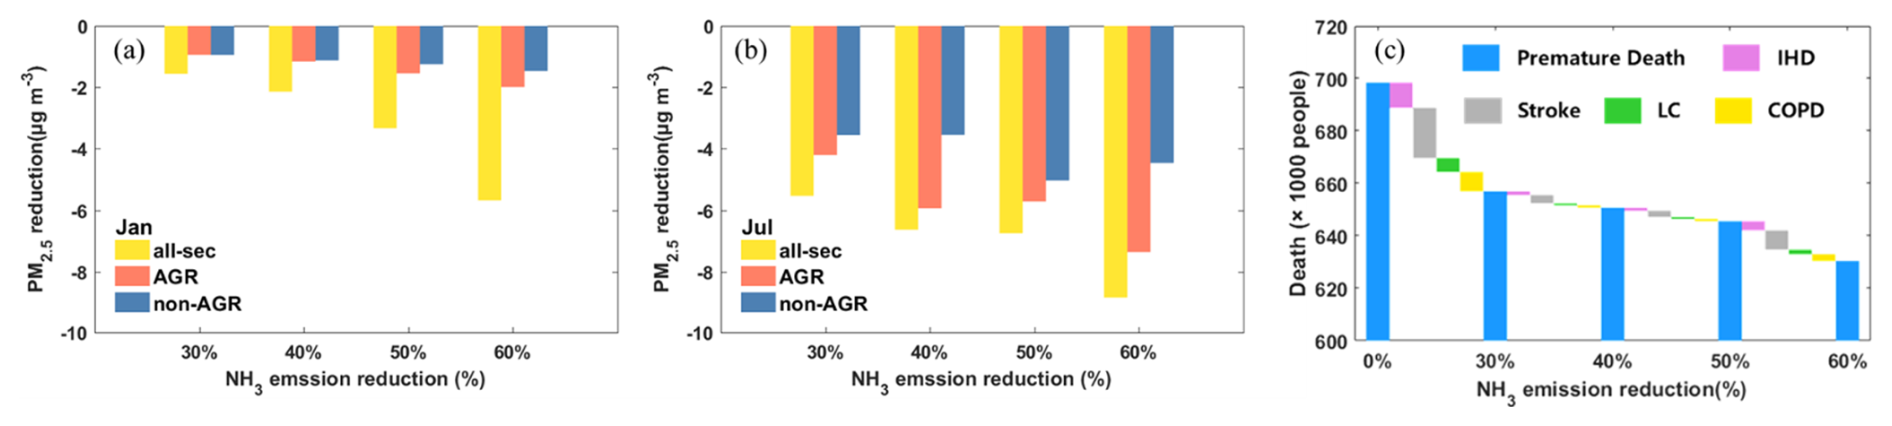
Figure 7Response of NH3 emission reduction in 30 %–60 % in (a, b) concentration of PM2.5 and (c) premature death caused by different diseases. The IHD, Stroke, LC and COPD represent the premature death caused by ischemic heart disease, stroke, lung cancer, chronic obstructive pulmonary disease.
Figure 7 illustrates that reducing NH3 emissions by 30 %–60 % can decrease the seasonal PM2.5 concentrations by 1.5–5.7 µg m−3 (2.0 %–7.2 %) averaged for Eastern China in winter, mainly due to the reduction in SIA. Specifically, nitrate, ammonium and sulfate are reduced by 0.9–3.3, 0.4–1.3 and 0.3–1.0 µg m−3, respectively. It is worth noting that the reduction in sulfate is smaller than that in nitrate because NH3 preferentially reacts with sulfuric acid during aerosol formation (Fig. S11). When ambient NH3 concentrations are limited, nitrate concentrations decrease more significantly than sulfate concentrations. In summer, although aerosol pollution is relatively lower, NH3 emissions and atmospheric reactivity are higher. Consequently, reducing emissions by the same percent results in a decrease in PM2.5 concentration by 5.5–8.8 µg m−3.
In terms of special sources, reducing non-AGR NH3 emissions is just as crucial as reducing AGR NH3 emissions in mitigating PM2.5. A 30 % to 60 % reduction in non-AGR NH3 emissions during winter can lead to a decrease in PM2.5 by 0.9–1.5 µg m−3, which is comparable to the effect of reducing AGR NH3 emissions (0.9–2.0 µg m−3). It should be noted that the reduction in PM2.5 resulting from both AGR and non-AGR NH3 emissions is not proportional to the emission reduction across all sectors. This is due to the non-linear relationship between NH3 emissions and PM2.5 concentrations.
This study utilized the integrated exposure–response (IER) model to estimate premature mortality resulting from PM2.5 exposure. Detailed methods and data can be found in our previous work (Li et al., 2023a). In the base case, PM2.5 exposure exhibits a significant impact on premature mortality, leading to 698.4 thousand deaths in the study region. Specifically, premature deaths attributable to ischemic heart disease (IHD), stroke, lung cancer (LC), and chronic obstructive pulmonary disease (COPD) are 202.3, 347.9, 61.5, and 86.7 thousand, respectively. In other scenarios, the overall premature mortality burden decreases by 45.6–72.0 thousand instances (6.5 %–10.3 %) in Eastern China. Notably, the decline in premature deaths, especially those related to stroke, plays a significant role in the overall reduction.
An accurate NH3 emission inventory is essential for developing effective air quality improvement policies. Numerous studies have demonstrated that the current bottom-up NH3 emission inventories in China often underestimate the total NH3 emissions, with significant uncertainties in the estimation of emissions from various sources. In this study, we used IASI satellite products and an iterative algorithm with the WRF-Chem model to optimize the bottom-up NH3 emission inventory for Eastern China and further assessed the impacts of NH3 emission reductions from different sources on PM2.5 concentrations.
The posterior results indicate that the NH3 emission in Eastern China for 2016 amounted to 4.2 Tg. The highest emissions occurred in summer (463.1 Gg month−1), with AGR sources contributing 86.5 % and non-AGR sources contributing 13.5 %. In contrast, emissions were lowest in winter (217.4 Gg month−1), and the proportion of emissions from non-AGR sources were higher than that from AGR sources. Spatially, the region with the highest NH3 emissions was located at the intersection of Henan, Hebei, and Shandong provinces. This is attributed to a combination of high emission intensity from dense agricultural and industrial activities and topographical effects that hinder the dispersal of pollutants. The optimization of the NH3 inventory further improved the simulation underestimation of the NH3 total column (MFB from −61 % to −30 %) and surface concentration (MFB from −61 % to −19 %). It also indirectly improved the simulation of other air pollutants, such as PM2.5, NO2 and SO2.
Based on the posterior emission inventory, we conducted a series of sensitivity simulations to investigate the response of PM2.5 concentrations to NH3 emission reductions. A 30 %–60 % reduction in NH3 emissions resulted in a 1.5–8.8 µg m−3 decrease in PM2.5 concentrations. In terms of sectoral contributions, reductions in AGR emissions led to a decrease in PM2.5 ranging from 0.9 to 7.4 µg m−3, while the response to reductions in non-AGR NH3 emissions ranged from 0.9 to 5.3 µg m−3. Furthermore, the reduction in NH3 emissions had a beneficial impact on public health, with a 6.5 %–10.3 % decrease in premature deaths attributed to PM2.5 exposure.
This study obtained a high-resolution NH3 emission inventory for Eastern China and highlights the significant role of non-AGR NH3 emission reductions in further decreasing PM2.5 levels. The findings provide robust data support for air quality research and offer scientific insights for exploring the potential air quality and public health benefits of NH3 emission reduction.
The underlying software used in this study is the WRF-Chem, a third-party, open-source community model. The source code is publicly available and can be accessed from the official GitHub repository: https://github.com/wrf-model/WRF (WRF-Chem Model Development Team, 2025).
The total column density of NH3 were available at https://iasi.aeris-data.fr/ (last access: 28 October 2025): https://doi.org/10.25326/10 (AERIS, 2023a) and https://doi.org/10.25326/11 (AERIS, 2023b). The surface meteorological data was obtained from China Meteorological Administration website (https://data.cma.cn/data/cdcdetail/dataCode/A.0012.0001.html, China Meteorological Administration, 2025). The observed PM2.5, NO2 and SO2 concentration were from public website of the Ministry of Ecology and Environment (MEE) of China (https://air.cnemc.cn:18007/, Ministry of Ecology and Environment of China, 2025).
The supplement related to this article is available online at https://doi.org/10.5194/acp-25-14747-2025-supplement.
Data curation, model simulation, visualization, and writing-original draft preparation, KQT, HRZ, GX, FYC, JM, XC and YX; Supervision, funding acquisition, writing-review and editing, NL, HL, JBJ, BJL and KL. All authors have read and agreed to the published version of the manuscript.
The contact author has declared that none of the authors has any competing interests.
Publisher's note: Copernicus Publications remains neutral with regard to jurisdictional claims made in the text, published maps, institutional affiliations, or any other geographical representation in this paper. While Copernicus Publications makes every effort to include appropriate place names, the final responsibility lies with the authors. Views expressed in the text are those of the authors and do not necessarily reflect the views of the publisher.
The numerical calculations in this paper have been done on the supercomputing system in the Supercomputing Center of Nanjing University of Information Science & Technology.
This work was supported by the National Key Research and Development Program of China (2022YFC3701005), the National Natural Science Foundation of China (42575125) and special found of Key Laboratory of Formation and Prevention of Urban Air Pollution Complex, Ministry of Ecology and Environment (SEPAir-2024080216).
This paper was edited by Xavier Querol and reviewed by three anonymous referees.
AERIS: Near-real time daily IASI/Metop-A ULB-LATMOS am monia (NH3) L2 product (total column), AERIS [data set], https://doi.org/10.25326/10, 2023a.
AERIS: Near-real time daily IASI/Metop-B ULB-LATMOS am monia (NH3) L2 product (total column), AERIS [data set], https://doi.org/10.25326/11, 2023b.
An, J., Huang, Y., Huang, C., Wang, X., Yan, R., Wang, Q., Wang, H., Jing, S., Zhang, Y., Liu, Y., Chen, Y., Xu, C., Qiao, L., Zhou, M., Zhu, S., Hu, Q., Lu, J., and Chen, C.: Emission inventory of air pollutants and chemical speciation for specific anthropogenic sources based on local measurements in the Yangtze River Delta region, China, Atmos. Chem. Phys., 21, 2003–2025, https://doi.org/10.5194/acp-21-2003-2021, 2021.
Bai, L., Lu, X., Yin, S., Zhang. H., Ma. S., Wang, C., Li, Y., and Zhang, R.: A recent emission inventory of multiple air pollutant, PM2.5 chemical species and its spatial-temporal characteristics in central china, Journal of Cleaner Production, 269, 122114, https://doi.org/10.1016/j.jclepro.2020.122114, 2020.
Bessagnet, B., Beauchamp, M., Guerreiro, C., de Leeuw, F., Tsyro, S., Colette, A., Meleux, F., Rouïl, L., Ruyssenaars, P., Sauter, F., Velders, G. J. M., Foltescu, V. L., and van Aardenne, J.: Can further mitigation of ammonia emissions reduce exceedances of particulate matter air quality standards?, Environmental Science & Policy, 44, 149–163, https://doi.org/10.1016/j.envsci.2014.07.011, 2014.
Cai, S., Liu, T., Huang, X., Song, Y., Wang, T., Sun, Z., Gao, J., and Ding, A.: Important Role of Low Cloud and Fog in Sulfate Aerosol Formation During Winter Haze Over the North China Plain, Geophysical Research Letters, 51, e2023GL106597, https://doi.org/10.1029/2023GL106597, 2024.
Chang, Y., Deng, C., Dore, A. J., and Zhuang, G.: Human Excreta as a Stable and Important Source of Atmospheric Ammonia in the Megacity of Shanghai, PLOS ONE, 10, e0144661, https://doi.org/10.1371/journal.pone.0144661, 2015.
Chang, Y., Zou, Z., Deng, C., Huang, K., Collett, J. L., Lin, J., and Zhuang, G.: The importance of vehicle emissions as a source of atmospheric ammonia in the megacity of Shanghai, Atmos. Chem. Phys., 16, 3577–3594, https://doi.org/10.5194/acp-16-3577-2016, 2016.
Chen, J., Du, X., Liu, X., Xu, W., and Krol, M.: Estimation of Ammonia Emissions over China Using IASI Satellite-Derived Surface Observations, Environ. Sci. Technol., 59, 9991–10000, https://doi.org/10.1021/acs.est.4c10878, 2025.
Chen, P. and Wang, Q.: Underestimated industrial ammonia emission in China uncovered by material flow analysis, Environ. Pollut., 368, 125740, https://doi.org/10.1016/j.envpol.2025.125740, 2025.
Chen, Y., Shen, H., Kaiser, J., Hu, Y., Capps, S. L., Zhao, S., Hakami, A., Shih, J.-S., Pavur, G. K., Turner, M. D., Henze, D. K., Resler, J., Nenes, A., Napelenok, S. L., Bash, J. O., Fahey, K. M., Carmichael, G. R., Chai, T., Clarisse, L., Coheur, P.-F., Van Damme, M., and Russell, A. G.: High-resolution hybrid inversion of IASI ammonia columns to constrain US ammonia emissions using the CMAQ adjoint model, Atmos. Chem. Phys., 21, 2067–2082, https://doi.org/10.5194/acp-21-2067-2021, 2021.
Chen, Y., Zhang, Q., Cai, X., Zhang, H., Lin, H., Zheng, C., Guo, Z., Hu, S., Chen, L., Tao, S., Liu, M., and Wang, X.: Rapid Increase in China's Industrial Ammonia Emissions: Evidence from Unit-Based Mapping, Environ. Sci. Technol., https://doi.org/10.1021/acs.est.1c08369, 2022.
Cheng, L., Ye, Z., Cheng, S., and Guo, X.: Agricultural ammonia emissions and its impact on PM2.5 concentrations in the Beijing-Tianjin-Hebei region from 2000 to 2018, Environ. Pollut., 291, 118162, https://doi.org/10.1016/j.envpol.2021.118162, 2021.
China Meteorological Administration: CMA, China surface international exchange station daily value dataset, https://data.cma.cn/data/cdcdetail/dataCode/A.0012.0001.html, last access: 28 October 2025.
Du, P., Du, H., Zhang, W., Lu, K., Zhang, C., Ban, J., Wang, Y., Liu, T., Hu, J., and Li, T.: Unequal Health Risks and Attributable Mortality Burden of Source-Specific PM2.5 in China, Environ. Sci. Technol., 58, 10897–10909, https://doi.org/10.1021/acs.est.3c08789, 2024.
Emmons, L. K., Walters, S., Hess, P. G., Lamarque, J.-F., Pfister, G. G., Fillmore, D., Granier, C., Guenther, A., Kinnison, D., Laepple, T., Orlando, J., Tie, X., Tyndall, G., Wiedinmyer, C., Baughcum, S. L., and Kloster, S.: Description and evaluation of the Model for Ozone and Related chemical Tracers, version 4 (MOZART-4), Geosci. Model Dev., 3, 43–67, https://doi.org/10.5194/gmd-3-43-2010, 2010.
Feng, S., Gao, D., Liao, F., Zhou, F., and Wang, X.: The health effects of ambient PM2.5 and potential mechanisms, Ecotoxicology and Environmental Safety, 128, 67–74, https://doi.org/10.1016/j.ecoenv.2016.01.030, 2016.
Feng, S., Xu, W., Cheng, M., Ma, Y., Wu, L., Kang, J., Wang, K., Tang, A., Collett, J. L., Fang, Y., Goulding, K., Liu, X., and Zhang, F.: Overlooked Nonagricultural and Wintertime Agricultural NH3 Emissions in Quzhou County, North China Plain: Evidence from 15N-Stable Isotopes, Environmental Science & Technology Letters, 9, 127–133, https://doi.org/10.1021/acs.estlett.1c00935, 2022.
Fu, X., Wang, S. X., Ran, L. M., Pleim, J. E., Cooter, E., Bash, J. O., Benson, V., and Hao, J. M.: Estimating NH3 emissions from agricultural fertilizer application in China using the bi-directional CMAQ model coupled to an agro-ecosystem model, Atmos. Chem. Phys., 15, 6637–6649, https://doi.org/10.5194/acp-15-6637-2015, 2015.
Gao, D., Zhao, B., Wang, S., Wang, Y., Gaudet, B., Zhu, Y., Wang, X., Shen, J., Li, S., He, Y., Yin, D., and Dong, Z.: Increased importance of aerosol–cloud interactions for surface PM2.5 pollution relative to aerosol–radiation interactions in China with the anthropogenic emission reductions, Atmos. Chem. Phys., 23, 14359–14373, https://doi.org/10.5194/acp-23-14359-2023, 2023.
Geng, G., Liu, Y., Liu, Y., Liu, S., Cheng, J., Yan, L., Wu, N., Hu, H., Tong, D., Zheng, B., Yin, Z., He, K., and Zhang, Q.: Efficacy of China's clean air actions to tackle PM2.5 pollution between 2013 and 2020, Nat. Geosci., 17, 987–994, https://doi.org/10.1038/s41561-024-01540-z, 2024.
Grell, G. A., Peckham, S. E., Schmitz, R., McKeen, S. A., Frost, G., Skamarock, W. C., and Eder, B.: Fully coupled “online” chemistry within the WRF model, Atmospheric Environment, 39, 6957–6975, https://doi.org/10.1016/j.atmosenv.2005.04.027, 2005.
Guenther, A., Karl, T., Harley, P., Wiedinmyer, C., Palmer, P. I., and Geron, C.: Estimates of global terrestrial isoprene emissions using MEGAN (Model of Emissions of Gases and Aerosols from Nature), Atmos. Chem. Phys., 6, 3181–3210, https://doi.org/10.5194/acp-6-3181-2006, 2006.
Guo, H., Otjes, R., Schlag, P., Kiendler-Scharr, A., Nenes, A., and Weber, R. J.: Effectiveness of ammonia reduction on control of fine particle nitrate, Atmos. Chem. Phys., 18, 12241–12256, https://doi.org/10.5194/acp-18-12241-2018, 2018.
Guo, X., Ye, Z., Chen, D., Wu, H., Shen, Y., Liu, J., and Cheng, S.: Prediction and mitigation potential of anthropogenic ammonia emissions within the Beijing-Tianjin-Hebei region, China, Environ. Pollut., 259, 113863, https://doi.org/10.1016/j.envpol.2019.113863, 2020.
Guo, Y., Zhang, L., Winiwarter, W., Van Grinsven, H. J. M., Wang, X., Li, K., Pan, D., Liu, Z., and Gu, B.: Ambitious nitrogen abatement is required to mitigate future global PM2.5 air pollution toward the World Health Organization targets, One Earth, 7, 1600–1613, https://doi.org/10.1016/j.oneear.2024.08.007, 2024.
He, Y., Pan, Y., Gu, M., Sun, Q., Zhang, Q., Zhang, R., and Wang, Y.: Changes of ammonia concentrations in wintertime on the North China Plain from 2018 to 2020, Atmospheric Research, 253, 105490, https://doi.org/10.1016/j.atmosres.2021.105490, 2021.
Hoesly, R. M., Smith, S. J., Feng, L., Klimont, Z., Janssens-Maenhout, G., Pitkanen, T., Seibert, J. J., Vu, L., Andres, R. J., Bolt, R. M., Bond, T. C., Dawidowski, L., Kholod, N., Kurokawa, J.-I., Li, M., Liu, L., Lu, Z., Moura, M. C. P., O'Rourke, P. R., and Zhang, Q.: Historical (1750–2014) anthropogenic emissions of reactive gases and aerosols from the Community Emissions Data System (CEDS), Geosci. Model Dev., 11, 369–408, https://doi.org/10.5194/gmd-11-369-2018, 2018.
Hu, S., Zhao, G., Tan, T., Li, C., Zong, T., Xu, N., Zhu, W., and Hu, M.: Current challenges of improving visibility due to increasing nitrate fraction in PM2.5 during the haze days in Beijing, China, Environ. Pollut., 290, 118032, https://doi.org/10.1016/j.envpol.2021.118032, 2021.
Huang, L., Zhu, Y., Zhai, H., Xue, S., Zhu, T., Shao, Y., Liu, Z., Emery, C., Yarwood, G., Wang, Y., Fu, J., Zhang, K., and Li, L.: Recommendations on benchmarks for numerical air quality model applications in China – Part 1: PM2.5 and chemical species, Atmos. Chem. Phys., 21, 2725–2743, https://doi.org/10.5194/acp-21-2725-2021, 2021.
Huang, R.-J., Zhang, Y., Bozzetti, C., Ho, K.-F., Cao, J.-J., Han, Y., Daellenbach, K. R., Slowik, J. G., Platt, S. M., Canonaco, F., Zotter, P., Wolf, R., Pieber, S. M., Bruns, E. A., Crippa, M., Ciarelli, G., Piazzalunga, A., Schwikowski, M., Abbaszade, G., Schnelle-Kreis, J., Zimmermann, R., An, Z., Szidat, S., Baltensperger, U., Haddad, I. E., and Prévôt, A. S. H.: High secondary aerosol contribution to particulate pollution during haze events in China, Nature, 514, 218–222, https://doi.org/10.1038/nature13774, 2014.
Huang, X., Song, Y., Li, M., Li, J., Huo, Q., Cai, X., Zhu, T., Hu, M., and Zhang, H.: A high-resolution ammonia emission inventory in China, Global Biogeochemical Cycles, 26, https://doi.org/10.1029/2011gb004161, 2012.
Jin, J., Fang, L., Li, B., Liao, H., Wang, Y., Han, W., Li, K., Pang, M., Wu, X., and Xiang Lin, H.: 4DEnVar-based inversion system for ammonia emission estimation in China through assimilating IASI ammonia retrievals, Environ. Res. Lett., 18, 034005, https://doi.org/10.1088/1748-9326/acb835, 2023.
Kang, Y., Liu, M., Song, Y., Huang, X., Yao, H., Cai, X., Zhang, H., Kang, L., Liu, X., Yan, X., He, H., Zhang, Q., Shao, M., and Zhu, T.: High-resolution ammonia emissions inventories in China from 1980 to 2012, Atmos. Chem. Phys., 16, 2043–2058, https://doi.org/10.5194/acp-16-2043-2016, 2016.
Kong, L., Tang, X., Zhu, J., Wang, Z., Pan, Y., Wu, H., Wu, L., Wu, Q., He, Y., Tian, S., Xie, Y., Liu, Z., Sui, W., Han, L., and Carmichael, G.: Improved Inversion of Monthly Ammonia Emissions in China Based on the Chinese Ammonia Monitoring Network and Ensemble Kalman Filter, Environ. Sci. Technol., 53, 12529–12538, https://doi.org/10.1021/acs.est.9b02701, 2019.
Lei, R., Nie, D., Zhang, S., Yu, W., Ge, X., and Song, N.: Spatial and temporal characteristics of air pollutants and their health effects in China during 2019–2020, Journal of Environmental Management, 317, 115460, https://doi.org/10.1016/j.jenvman.2022.115460, 2022.
Lei, Y., Yin, Z., Lu, X., Zhang, Q., Gong, J., Cai, B., Cai, C., Chai, Q., Chen, H., Chen, R., Chen, S., Chen, W., Cheng, J., Chi, X., Dai, H., Feng, X., Geng, G., Hu, J., Hu, S., Huang, C., Li, T., Li, W., Li, X., Liu, J., Liu, X., Liu, Z., Ma, J., Qin, Y., Tong, D., Wang, X., Wang, X., Wu, R., Xiao, Q., Xie, Y., Xu, X., Xue, T., Yu, H., Zhang, D., Zhang, N., Zhang, S., Zhang, S., Zhang, X., Zhang, X., Zhang, Z., Zheng, B., Zheng, Y., Zhou, J., Zhu, T., Wang, J., and He, K.: The 2022 report of synergetic roadmap on carbon neutrality and clean air for China: Accelerating transition in key sectors, Environmental Science and Ecotechnology, 19, 100335, https://doi.org/10.1016/j.ese.2023.100335, 2024.
Li, B., Chen, L., Shen, W., Jin, J., Wang, T., Wang, P., Yang, Y., and Liao, H.: Improved gridded ammonia emission inventory in China, Atmos. Chem. Phys., 21, 15883–15900, https://doi.org/10.5194/acp-21-15883-2021, 2021.
Li, B., Liao, H., Li, K., Wang, Y., Zhang, L., Guo, Y., Liu, L., Li, J., Jin, J., Yang, Y., Gong, C., Wang, T., Shen, W., Wang, P., Dang, R., Liao, K., Zhu, Q., and Jacob, D. J.: Unlocking nitrogen management potential via large-scale farming for air quality and substantial co-benefits, National Science Review, 11, nwae324, https://doi.org/10.1093/nsr/nwae324, 2024.
Li, M., Liu, H., Geng, G., Hong, C., Liu, F., Song, Y., Tong, D., Zheng, B., Cui, H., Man, H., Zhang, Q., and He, K.: Anthropogenic emission inventories in China: a review, National Science Review, 4, 834–866, https://doi.org/10.1093/nsr/nwx150, 2017.
Li, N., Zhang, H., Zhu, S., Liao, H., Hu, J., Tang, K., Feng, W., Zhang, R., Shi, C., Xu, H., Chen, L., and Li, J.: Secondary PM2.5 dominates aerosol pollution in the Yangtze River Delta region: Environmental and health effects of the Clean air Plan, Environment International, 171, 107725, https://doi.org/10.1016/j.envint.2022.107725, 2023a.
Li, R., Gao, Y., Xu, J., Cui, L., and Wang, G.: Impact of Clean Air Policy on Criteria Air Pollutants and Health Risks Across China During 2013–2021, J. Geophys. Res.-Atmospheres, 128, e2023JD038939, https://doi.org/10.1029/2023JD038939, 2023b.
Liu, H., Lei, J., Liu, Y., Zhu, T., Chan, K., Chen, X., Wei, J., Deng, F., Li, G., Jiang, Y., Bai, L., Wang, K., Chen, J., Lan, Y., Xia, X., Wang, J., Wei, C., Li, Y., Chen, R., Gong, J., Duan, X., Zhang, K., Kan, H., Shi, X., Guo, X., and Wu, S.: Hospital admissions attributable to reduced air pollution due to clean-air policies in China, Nat. Med., https://doi.org/10.1038/s41591-025-03515-y, 2025.
Liu, M., Huang, X., Song, Y., Tang, J., Cao, J., Zhang, X., Zhang, Q., Wang, S., Xu, T., Kang, L., Cai, X., Zhang, H., Yang, F., Wang, H., Yu, J. Z., Lau, A. K. H., He, L., Huang, X., Duan, L., Ding, A., Xue, L., Gao, J., Liu, B., and Zhu, T.: Ammonia emission control in China would mitigate haze pollution and nitrogen deposition, but worsen acid rain, Proc. Natl. Acad. Sci. USA, 116, 7760–7765, https://doi.org/10.1073/pnas.1814880116, 2019.
Liu, P., Ding, J., Liu, L., Xu, W., and Liu, X.: Estimation of surface ammonia concentrations and emissions in China from the polar-orbiting Infrared Atmospheric Sounding Interferometer and the FY-4A Geostationary Interferometric Infrared Sounder, Atmos. Chem. Phys., 22, 9099–9110, https://doi.org/10.5194/acp-22-9099-2022, 2022a.
Liu, R., Liu, T., Huang, X., Ren, C., Wang, L., Niu, G., Yu, C., Zhang, Y., Wang, J., Qi, X., Nie, W., Chi, X., and Ding, A.: Characteristics and sources of atmospheric ammonia at the SORPES station in the western Yangtze river delta of China, Atmospheric Environment, 318, 120234, https://doi.org/10.1016/j.atmosenv.2023.120234, 2024.
Liu, S., Geng, G., Xiao, Q., Zheng, Y., Liu, X., Cheng, J., and Zhang, Q.: Tracking Daily Concentrations of PM2.5 Chemical Composition in China since 2000, Environ. Sci. Technol., 56, 16517–16527, https://doi.org/10.1021/acs.est.2c06510, 2022b.
Liu, Z., Zhou, M., Chen, Y., Chen, D., Pan, Y., Song, T., Ji, D., Chen, Q., and Zhang, L.: The nonlinear response of fine particulate matter pollution to ammonia emission reductions in North China, Environmental Research Letters, https://doi.org/10.1088/1748-9326/abdf86, 2021.
Liu, Z., Rieder, H. E., Schmidt, C., Mayer, M., Guo, Y., Winiwarter, W., and Zhang, L.: Optimal reactive nitrogen control pathways identified for cost-effective PM2.5 mitigation in Europe, Nat. Commun., 14, 4246, https://doi.org/10.1038/s41467-023-39900-9, 2023.
Lu, L., Yuan, L., Cai, Z., Fu, J., and Wu, G.: Emission inventory and distribution characteristics of NH3 from agricultural fertilizers in Hunan, China, from 2012 to 2021, Atmospheric Pollution Research, 16, 102479, https://doi.org/10.1016/j.apr.2025.102479, 2025.
Ma, S.: High-resolution assessment of ammonia emissions in China: Inventories, driving forces and mitigation, Atmospheric Environment, 229, 117458, https://doi.org/10.1016/j.atmosenv.2020.117458, 2020.
Ministry of Ecology and Environment of China: MEE, National Urban Air Quality Real-time Release Platform, https://air.cnemc.cn:18007/, last access: 28 October 2025.
Pan, D., Mauzerall, D. L., Wang, R., Guo, X., Puchalski, M., Guo, Y., Song, S., Tong, D., Sullivan, A. P., Schichtel, B. A., Collett, J. L., and Zondlo, M. A.: Regime shift in secondary inorganic aerosol formation and nitrogen deposition in the rural United States, Nat. Geosci., 17, 617–623, https://doi.org/10.1038/s41561-024-01455-9, 2024.
Pan, Y., Tian, S., Liu, D., Fang, Y., Zhu, X., Zhang, Q., Zheng, B., Michalski, G., and Wang, Y.: Fossil Fuel Combustion-Related Emissions Dominate Atmospheric Ammonia Sources during Severe Haze Episodes: Evidence from 15N-Stable Isotope in Size-Resolved Aerosol Ammonium, Environ. Sci. Technol., 50, 8049–56, https://doi.org/10.1021/acs.est.6b00634, 2016.
Pan, Y., Tian, S., Zhao, Y., Zhang, L., Zhu, X., Gao, J., Huang, W., Zhou, Y., Song, Y., Zhang, Q., and Wang, Y.: Identifying Ammonia Hotspots in China Using a National Observation Network, Environ. Sci. Technol., 52, 3926–3934, https://doi.org/10.1021/acs.est.7b05235, 2018a.
Pan, Y., Tian, S., Liu, D., Fang, Y., Zhu, X., Gao, M., Gao, J., Michalski, G., and Wang, Y.: Isotopic evidence for enhanced fossil fuel sources of aerosol ammonium in the urban atmosphere, Environ. Pollut., 238, 942–947, https://doi.org/10.1016/j.envpol.2018.03.038, 2018b.
Paulot, F., Jacob, D. J., Pinder, R. W., Bash, J. O., Travis, K., and Henze, D. K.: Ammonia emissions in the United States, European Union, and China derived by high-resolution inversion of ammonium wet deposition data: Interpretation with a new agricultural emissions inventory (MASAGE_NH3), J. Geophys. Res.-Atmospheres, 119, 4343–4364, https://doi.org/10.1002/2013jd021130, 2014.
Pendergrass, D. C., Jacob, D. J., Oak, Y. J., Lee, J., Kim, M., Kim, J., Lee, S., Zhai, S., Irie, H., and Liao, H.: A continuous 2011–2022 record of fine particulate matter (PM2.5) in East Asia at daily 2-km resolution from geostationary satellite observations: Population exposure and long-term trends, Atmospheric Environment, 346, 121068, https://doi.org/10.1016/j.atmosenv.2025.121068, 2025.
Peng, Z., Wang, H., Zhang, M., Zhang, Y., Li, L., Li, Y., and Ao, Z.: Analysis of aerosol chemical components and source apportionment during a long-lasting haze event in the Yangtze River Delta, China, Journal of Environmental Sciences, 156, 14–29, https://doi.org/10.1016/j.jes.2024.06.023, 2025.
Pu, W., Ma, Z., Collett, J. L., Guo, H., Lin, W., Cheng, Y., Quan, W., Li, Y., Dong, F., and He, D.: Regional transport and urban emissions are important ammonia contributors in Beijing, China, Environ. Pollut., 265, 115062, https://doi.org/10.1016/j.envpol.2020.115062, 2020.
Qi, J., Zheng, B., Li, M., Yu, F., Chen, C., Liu, F., Zhou, X., Yuan, J., Zhang, Q., and He, K.: A high-resolution air pollutants emission inventory in 2013 for the Beijing-Tianjin-Hebei region, China, Atmospheric Environment, 170, 156–168, https://doi.org/10.1016/j.atmosenv.2017.09.039, 2017.
Ren, C., Huang, X., Liu, T., Song, Y., Wen, Z., Liu, X., Ding, A., and Zhu, T.: A dynamic ammonia emission model and the online coupling with WRF–Chem (WRF–SoilN–Chem v1.0): development and regional evaluation in China, Geosci. Model Dev., 16, 1641–1659, https://doi.org/10.5194/gmd-16-1641-2023, 2023.
Ren, C., Huang, X., Wang, Y., Zhang, L., Zhou, X., Sun, W., Zhang, H., Liu, T., Ding, A., and Wang, T.: Enhanced Soil Emissions of Reactive Nitrogen Gases by Fertilization and Their Impacts on Secondary Air Pollution in Eastern China, Environ. Sci. Technol., 59, 5119–5130, https://doi.org/10.1021/acs.est.4c12324, 2025.
Shao, S.-C., Zhang, Y.-L., Chang, Y.-H., Cao, F., Lin, Y.-C., Mozaffar, A., and Hong, Y.-H.: Online characterization of a large but overlooked human excreta source of ammonia in China's urban atmosphere, Atmospheric Environment, 230, 117459, https://doi.org/10.1016/j.atmosenv.2020.117459, 2020.
Song, L., Walters, W. W., Pan, Y., Li, Z., Gu, M., Duan, Y., Lü, X., and Fang, Y.: 15N natural abundance of vehicular exhaust ammonia, quantified by active sampling techniques, Atmospheric Environment, 255, 118430, https://doi.org/10.1016/j.atmosenv.2021.118430, 2021.
Song, Q., Huang, L., Zhang, Y., Li, Z., Wang, S., Zhao, B., Yin, D., Ma, M., Li, S., Liu, B., Zhu, L., Chang, X., Gao, D., Jiang, Y., Dong, Z., Shi, H., and Hao, J.: Driving Factors of PM2.5 Pollution Rebound in North China Plain in Early 2023, Environ. Sci. Technol. Lett., 12, 305–312, https://doi.org/10.1021/acs.estlett.4c01153, 2025.
Sun, K., Tao, L., Miller, D. J., Pan, D., Golston, L. M., Zondlo, M. A., Griffin, R. J., Wallace, H. W., Leong, Y. J., Yang, M. M., Zhang, Y., Mauzerall, D. L., and Zhu, T.: Vehicle Emissions as an Important Urban Ammonia Source in the United States and China, Environ. Sci. Technol., 51, 2472–2481, https://doi.org/10.1021/acs.est.6b02805, 2017.
Tan, T., Hu, M., Li, M., Guo, Q., Wu, Y., Fang, X., Gu, F., Wang, Y., and Wu, Z.: New insight into PM2.5 pollution patterns in Beijing based on one-year measurement of chemical compositions, Science of the Total Environment, 621, 734–743, https://doi.org/10.1016/j.scitotenv.2017.11.208, 2018.
Tang, C., Shi, C., Letu, H., Yin, S., Nakajima, T., Sekiguchi, M., Xu, J., Zhao, M., Ma, R., and Wang, W.: Development of a hybrid algorithm for the simultaneous retrieval of aerosol optical thickness and fine-mode fraction from multispectral satellite observation combining radiative transfer and transfer learning approaches, Remote Sensing of Environment, 319, 114619, https://doi.org/10.1016/j.rse.2025.114619, 2025.
Ti, C., Han, X., Chang, S. X., Peng, L., Xia, L., and Yan, X.: Mitigation of agricultural NH3 emissions reduces PM2.5 pollution in China: A finer scale analysis, Journal of Cleaner Production, 350, 131507, https://doi.org/10.1016/j.jclepro.2022.131507, 2022.
Van Damme, M., Clarisse, L., Whitburn, S., Hadji-Lazaro, J., Hurtmans, D., Clerbaux, C., and Coheur, P. F.: Industrial and agricultural ammonia point sources exposed, Nature, 564, 99–103, https://doi.org/10.1038/s41586-018-0747-1, 2018.
Van Damme, M., Wichink Kruit, R. J., Schaap, M., Clarisse, L., Clerbaux, C., Coheur, P. F., Dammers, E., Dolman, A. J., and Erisman, J. W.: Evaluating 4 years of atmospheric ammonia (NH3) over Europe using IASI satellite observations and LOTOS-EUROS model results, Journal of Geophysical Research: Atmospheres, 119, 9549–9566, https://doi.org/10.1002/2014jd021911, 2014.
Van Damme, M., Whitburn, S., Clarisse, L., Clerbaux, C., Hurtmans, D., and Coheur, P.-F.: Version 2 of the IASI NH3 neural network retrieval algorithm: near-real-time and reanalysed datasets, Atmospheric Measurement Techniques, 10, 4905–4914, https://doi.org/10.5194/amt-10-4905-2017, 2017.
Wang, G., Zhang, R., Gomez, M. E., Yang, L., Levy Zamora, M., Hu, M., Lin, Y., Peng, J., Guo, S., Meng, J., Li, J., Cheng, C., Hu, T., Ren, Y., Wang, Y., Gao, J., Cao, J., An, Z., Zhou, W., Li, G., Wang, J., Tian, P., Marrero-Ortiz, W., Secrest, J., Du, Z., Zheng, J., Shang, D., Zeng, L., Shao, M., Wang, W., Huang, Y., Wang, Y., Zhu, Y., Li, Y., Hu, J., Pan, B., Cai, L., Cheng, Y., Ji, Y., Zhang, F., Rosenfeld, D., Liss, P. S., Duce, R. A., Kolb, C. E., and Molina, M. J.: Persistent sulfate formation from London Fog to Chinese haze, Proc. Natl. Acad. Sci. USA, 113, 13630–13635, https://doi.org/10.1073/pnas.1616540113, 2016.
Wang, J., Zhao, B., Wang, S., Yang, F., Xing, J., Morawska, L., Ding, A., Kulmala, M., Kerminen, V.-M., Kujansuu, J., Wang, Z., Ding, D., Zhang, X., Wang, H., Tian, M., Petäjä, T., Jiang, J., and Hao, J.: Particulate matter pollution over China and the effects of control policies, Science of the Total Environment, 584–585, 426–447, https://doi.org/10.1016/j.scitotenv.2017.01.027, 2017.
Wang, W., Liu, M., Wang, T., Song, Y., Zhou, L., Cao, J., Hu, J., Tang, G., Chen, Z., Li, Z., Xu, Z., Peng, C., Lian, C., Chen, Y., Pan, Y., Zhang, Y., Sun, Y., Li, W., Zhu, T., Tian, H., and Ge, M.: Sulfate formation is dominated by manganese-catalyzed oxidation of SO2 on aerosol surfaces during haze events, Nat. Commun., 12, https://doi.org/10.1038/s41467-021-22091-6, 2021.
Wang, X., Gemayel, R., Hayeck, N., Perrier, S., Charbonnel, N., Xu, C., Chen, H., Zhu, C., Zhang, L., Wang, L., Nizkorodov, S. A., Wang, X., Wang, Z., Wang, T., Mellouki, A., Riva, M., Chen, J., and George, C.: Atmospheric Photosensitization: A New Pathway for Sulfate Formation, Environ. Sci. Technol., 54, 3114–3120, https://doi.org/10.1021/acs.est.9b06347, 2020.
Wang, C., Yin, S., Bai, L., Zhang, X., Gu, X., Zhang, H., Lu, Q., and Zhang, R.: High-resolution ammonia emission inventories with comprehensive analysis and evaluation in Henan, China, 2006–2016, Atmospheric Environment, 193, 11–23, https://doi.org/10.1016/j.atmosenv.2018.08.063, 2018.
Wei, J., Li, Z., Chen, X., Li, C., Sun, Y., Wang, J., Lyapustin, A., Brasseur, G. P., Jiang, M., Sun, L., Wang, T., Jung, C. H., Qiu, B., Fang, C., Liu, X., Hao, J., Wang, Y., Zhan, M., Song, X., and Liu, Y.: Separating Daily 1 km PM2.5 Inorganic Chemical Composition in China since 2000 via Deep Learning Integrating Ground, Satellite, and Model Data, Environ. Sci. Technol., 57, 18282–18295, https://doi.org/10.1021/acs.est.3c00272, 2023.
Wei, L., Zhang, H., Sun, C., and Yan, F.: Simultaneous estimation of ammonia injection rate and state of diesel urea-SCR system based on high gain observer, ISA Transactions, 126, 679–690, https://doi.org/10.1016/j.isatra.2021.08.002, 2022.
Whitburn, S., Van Damme, M., Clarisse, L., Bauduin, S., Heald, C. L., Hadji-Lazaro, J., Hurtmans, D., Zondlo, M. A., Clerbaux, C., and Coheur, P. F.: A flexible and robust neural network IASI-NH3retrieval algorithm, Journal of Geophysical Research: Atmospheres, 121, 6581–6599, https://doi.org/10.1002/2016jd024828, 2016.
Wiedinmyer, C., Akagi, S. K., Yokelson, R. J., Emmons, L. K., Al-Saadi, J. A., Orlando, J. J., and Soja, A. J.: The Fire INventory from NCAR (FINN): a high resolution global model to estimate the emissions from open burning, Geoscientific Model Development, 4, 625–641, https://doi.org/10.5194/gmd-4-625-2011, 2011.
WRF-Chem Model Development Team: WRF-Chem (Weather Research and Forecasting model coupled with Chemistry) Model, GitHub, https://github.com/wrf-model/WRF, last access: 28 October 2025.
Wu, C., Wang, G., Li, J., Li, J., Cao, C., Ge, S., Xie, Y., Chen, J., Liu, S., Du, W., Zhao, Z., and Cao, F.: Non-agricultural sources dominate the atmospheric NH3 in Xi'an, a megacity in the semi-arid region of China, Science of the Total Environment, 722, 137756, https://doi.org/10.1016/j.scitotenv.2020.137756, 2020.
Wu, N., Geng, G., Xu, R., Liu, S., Liu, X., Shi, Q., Zhou, Y., Zhao, Y., Liu, H., Song, Y., Zheng, J., Zhang, Q., and He, K.: Development of a high-resolution integrated emission inventory of air pollutants for China, Earth Syst. Sci. Data, 16, 2893–2915, https://doi.org/10.5194/essd-16-2893-2024, 2024.
Xia, J., Zhou, Y., Fang, L., Qi, Y., Li, D., Liao, H., and Jin, J.: South Asia anthropogenic ammonia emission inversion through assimilating IASI observations, Atmos. Chem. Phys., 25, 7071–7086, https://doi.org/10.5194/acp-25-7071-2025, 2025.
Xiao, Q., Geng, G., Xue, T., Liu, S., Cai, C., He, K., and Zhang, Q.: Tracking PM2.5 and O3 Pollution and the Related Health Burden in China 2013–2020, Environ. Sci. Technol., 56, 6922–6932, https://doi.org/10.1021/acs.est.1c04548, 2022.
Xu, X., Wang, J., Henze, D. K., Qu, W., and Kopacz, M.: Constraints on aerosol sources using GEOS-Chem adjoint and MODIS radiances, and evaluation with multisensor (OMI, MISR) data, Journal of Geophysical Research: Atmospheres, 118, 6396–6413, https://doi.org/10.1002/jgrd.50515, 2013.
Xu, W., Zhao, Y., Wen, Z., Chang, Y., Pan, Y., Sun, Y., Ma, X., Sha, Z., Li, Z., Kang, J., Liu, L., Tang, A., Wang, K., Zhang, Y., Guo, Y., Zhang, L., Sheng, L., Zhang, X., Gu, B., Song, Y., Van Damme, M., Clarisse, L., Coheur, P.-F., Collett, J. L., Goulding, K., Zhang, F., He, K., and Liu, X.: Increasing importance of ammonia emission abatement in PM2.5 pollution control, Science Bulletin, 67, 1745–1749, https://doi.org/10.1016/j.scib.2022.07.021, 2022.
Yang, G., Ren, G., Zhang, P., Xue, X., Tysa, S. K., Jia, W., Qin, Y., Zheng, X., and Zhang, S.: PM2.5 Influence on Urban Heat Island (UHI) Effect in Beijing and the Possible Mechanisms, J. Geophys. Res.-Atmospheres, 126, e2021JD035227, https://doi.org/10.1029/2021JD035227, 2021.
Yang, Z., Wang, Y., Xu, X.-H., Yang, J., and Ou, C.-Q.: Quantifying and characterizing the impacts of PM2.5 and humidity on atmospheric visibility in 182 Chinese cities: A nationwide time-series study, Journal of Cleaner Production, 368, 133182, https://doi.org/10.1016/j.jclepro.2022.133182, 2022.
Yu, X., Shen, L., Hou, X., Yuan, L., Pan, Y., An, J., and Yan, S.: High-resolution anthropogenic ammonia emission inventory for the Yangtze River Delta, China, Chemosphere, 251, 126342, https://doi.org/10.1016/j.chemosphere.2020.126342, 2020.
Zhang, H., Zhou, X., Ren, C., Li, M., Liu, T., and Huang, X.: A systematic review of reactive nitrogen simulations with chemical transport models in China, Atmospheric Research, 309, 107586, https://doi.org/10.1016/j.atmosres.2024.107586, 2024.
Zhang, L., Chen, Y., Zhao, Y., Henze, D. K., Zhu, L., Song, Y., Paulot, F., Liu, X., Pan, Y., Lin, Y., and Huang, B.: Agricultural ammonia emissions in China: reconciling bottom-up and top-down estimates, Atmos. Chem. Phys., 18, 339–355, https://doi.org/10.5194/acp-18-339-2018, 2018.
Zhang, Q., Zheng, Y., Tong, D., Shao, M., Wang, S., Zhang, Y., Xu, X., Wang, J., He, H., Liu, W., Ding, Y., Lei, Y., Li, J., Wang, Z., Zhang, X., Wang, Y., Cheng, J., Liu, Y., Shi, Q., Yan, L., Geng, G., Hong, C., Li, M., Liu, F., Zheng, B., Cao, J., Ding, A., Gao, J., Fu, Q., Huo, J., Liu, B., Liu, Z., Yang, F., He, K., and Hao, J.: Drivers of improved PM2.5 air quality in China from 2013 to 2017, Proc. Natl. Acad. Sci. USA, 116, 24463–24469, https://doi.org/10.1073/pnas.1907956116, 2019.
Zhang, Q., Wei, N., Zou, C., and Mao, H.: Evaluating the ammonia emission from in-use vehicles using on-road remote sensing test, Environ. Pollut., 271, 116384, https://doi.org/10.1016/j.envpol.2020.116384, 2021.
Zhang, X., Wu, Y., Liu, X., Reis, S., Jin, J., Dragosits, U., Van Damme, M., Clarisse, L., Whitburn, S., Coheur, P. F., and Gu, B.: Ammonia Emissions May Be Substantially Underestimated in China, Environ. Sci. Technol., 51, 12089–12096, https://doi.org/10.1021/acs.est.7b02171, 2017.
Zhang, Z., Yan, Y., Kong, S., Deng, Q., Qin, S., Yao, L., Zhao, T., and Qi, S.: Benefits of refined NH3 emission controls on PM2.5 mitigation in Central China, Science of the Total Environment, 814, 151957, https://doi.org/10.1016/j.scitotenv.2021.151957, 2022.
Zhao, Y., Yuan, M., Huang, X., Chen, F., and Zhang, J.: Quantification and evaluation of atmospheric ammonia emissions with different methods: a case study for the Yangtze River Delta region, China, Atmos. Chem. Phys., 20, 4275–4294, https://doi.org/10.5194/acp-20-4275-2020, 2020.
Zheng, B., Zhang, Q., Zhang, Y., He, K. B., Wang, K., Zheng, G. J., Duan, F. K., Ma, Y. L., and Kimoto, T.: Heterogeneous chemistry: a mechanism missing in current models to explain secondary inorganic aerosol formation during the January 2013 haze episode in North China, Atmos. Chem. Phys., 15, 2031–2049, https://doi.org/10.5194/acp-15-2031-2015, 2015.
Zheng, B., Tong, D., Li, M., Liu, F., Hong, C., Geng, G., Li, H., Li, X., Peng, L., Qi, J., Yan, L., Zhang, Y., Zhao, H., Zheng, Y., He, K., and Zhang, Q.: Trends in China's anthropogenic emissions since 2010 as the consequence of clean air actions, Atmos. Chem. Phys., 18, 14095–14111, https://doi.org/10.5194/acp-18-14095-2018, 2018.
Zhou, M., Jiang, W., Gao, W., Gao, X., Ma, M., and Ma, X.: Anthropogenic emission inventory of multiple air pollutants and their spatiotemporal variations in 2017 for the Shandong Province, China, Environ. Pollut., 288, 117666, https://doi.org/10.1016/j.envpol.2021.117666, 2021.
Zhou, M., Nie, W., Qiao, L., Huang, D. D., Zhu, S., Lou, S., Wang, H., Wang, Q., Tao, S., Sun, P., Liu, Y., Xu, Z., An, J., Yan, R., Su, H., Huang, C., Ding, A., and Chen, C.: Elevated Formation of Particulate Nitrate From N2O5 Hydrolysis in the Yangtze River Delta Region From 2011 to 2019, Geophysical Research Letters, 49, e2021GL097393, https://doi.org/10.1029/2021GL097393, 2022.
Zhou, Y., Zhao, Y., Mao, P., Zhang, Q., Zhang, J., Qiu, L., and Yang, Y.: Development of a high-resolution emission inventory and its evaluation and application through air quality modeling for Jiangsu Province, China, Atmos. Chem. Phys., 17, 211–233, https://doi.org/10.5194/acp-17-211-2017, 2017.
Zhu, Q., Deng, Y.-L., Liu, Y., and Steenland, K.: Associations between Ultrafine Particles and Incident Dementia in Older Adults, Environ. Sci. Technol., acs.est.4c10574, https://doi.org/10.1021/acs.est.4c10574, 2025.
- Abstract
- Introduction
- Methodology
- NH3 simulations with bottom-up emissions
- Top-down estimates of NH3 emissions
- PM2.5 and its health burden response to NH3 reduction
- Conclusions
- Code availability
- Data availability
- Author contributions
- Competing interests
- Disclaimer
- Acknowledgements
- Financial support
- Review statement
- References
- Supplement