the Creative Commons Attribution 4.0 License.
the Creative Commons Attribution 4.0 License.
 | 04 Nov 2025
Measurement report: Unraveling PM10 sources and oxidative potential across Chinese regions based on CNN-LSTM data preprocessing and receptor model
Qinghe Cai
Dongqing Fang
Junli Jin
Xiaoyu Hu
Yuxuan Cao
Tianyi Zhao
Yang Bai
The oxidative potential (OP) of particulate matter is a key driver of PM10-induced adverse health effects, triggering oxidative stress and inflammatory responses that increase respiratory and cardiovascular disease risks. To evaluate PM10 and its OP characteristics across China, samples were collected from twelve representative monitoring stations from June 2022 to May 2023. A deep learning model combining Convolutional Neural Networks and Long Short-Term Memory networks (CNN-LSTM) was employed to reconstruct anomalous PM10 data, achieving R2 values of 0.8840 for test sets. Significant spatial variations in PM10 were observed, with highest concentrations in the northwestern regions (Xi'An: , Dunhuang: ), the lowest in the northeast (Longfengshan: , Dalian: ), and elevated levels in suburban areas (average: ). Urban sites showed the highest OP values (), with significantly higher PM10 concentrations in northern regions compared to southern ones (p<0.05). Most sites exhibited peak PM10 and OP levels in winter and lowest in summer. Source apportionment using Positive Matrix Factorization (PMF) revealed dust (13.2 %–27.4 %), secondary aerosols (6.9 %–36.2 %), traffic (16.6 %–21.4 %), and biomass burning (22 %–39.3 %) as main contributors to PM10. Mass-normalized OP (OPm) analysis revealed traffic, biomass burning, and coal combustion sources showing consistently high values (0.008–0.022 nmol H2O2 µg−1). These findings highlight the need to control traffic, biomass burning, and coal combustion sources and other major sources to reduce OP and protect public health.
- Article
(6318 KB) - Full-text XML
-
Supplement
(473 KB) - BibTeX
- EndNote


Particulate matter (PM) is one of the main pollutants affecting air quality and human health. Among these, PM10, which refers to suspended particles with an aerodynamic diameter of 10 µm or less, has received considerable attention due to its complex sources, extensive environmental and health effects. The sources of PM10 are both complex and diverse, including anthropogenic activities such as fossil fuel combustion, industrial production, traffic emissions and dust, as well as natural sources such as dust storms and volcanic eruptions (Xue et al., 2010). PM10 can remain suspended in the atmosphere for extended periods of time, significantly affecting atmospheric visibility while potentially exerting profound effects on regional and global climate change through both direct and indirect mechanism (Slanina and Zhang, 2004). More critically, PM10 poses a serious threat to human health. Upon entering the human body via the respiratory system, it can be deposited in the airways and lungs, triggering respiratory diseases such as asthma, chronic obstructive pulmonary disease (COPD) and even lung cancer (Cao et al., 2016). Furthermore, PM10 can penetrate the alveolar barrier and enter the circulatory system, inducing systemic diseases such as cardiovascular disease and diabetes (Huang, 2023).
In the context of accelerating global industrialization and urbanization, PM10 pollution has emerged as a critical environmental concern. Research conducted by the World Health Organization (WHO) indicates that air pollution is responsible for millions of premature deaths worldwide each year, with PM10 being a major contributor (Cohen et al., 2005). The mechanisms by which PM10 affects human health are diverse and complex, one of the primary mechanisms being its ability to induce excessive production of reactive oxygen species (ROS), subsequently triggering oxidative stress (OS) effects. Components within PM10, such as transition metals and polycyclic aromatic hydrocarbons (PAHs), can directly or indirectly promote ROS generation, leading to cell membrane lipid peroxidation, protein denaturation, and DNA damage (Chirino et al., 2010). Furthermore, ROS can activate inflammatory signaling pathways, including nuclear factor κB (NF-κB), which amplify inflammatory responses and further leading to cellular dysfunction and tissue damage (Wang et al., 2017). This interplay between oxidative stress and inflammatory responses is considered a critical pathophysiological basis for various PM10-induced diseases. Several studies suggest that oxidative potential (OP) may be a more accurate indicator of PM health effects than its mass concentration, providing a new perspective for assessing PM health risks (Gao et al., 2020; Bates et al., 2019).
The OP of PM serves as a critical indicator for assessing its toxicity and is closely related to the generation of ROS. Research indicates that the OP of PM is strongly correlated with its physicochemical properties and sources (He and Zhang, 2023). In particular, PM of smaller size typically exhibits higher OP, possibly due to its larger specific surface area and enhanced bioavailability (Saffari et al., 2014; Yao et al., 2024). Water-soluble transition metals (e.g., iron and copper) and organic carbon (e.g., PAHs) in PM are considered to be the primary chemical components that influence OP. These components can induce ROS generation either by catalyzing Fenton reactions or by directly participating in redox processes (Saffari et al., 2014; Guo et al., 2020). Sources of OP in PM are varied and include primarily traffic emissions, fossil fuel combustion, and secondary organic aerosol formation (Bates et al., 2019; Saffari et al., 2014). Significantly, photochemical aging of PM in the atmosphere further alters its OP, possibly related to the formation of secondary organic aerosols, changes in oxidation states of metallic components during the aging process, and the oxidation degree of reactive organic compounds (An et al., 2022; Ma et al., 2025). In addition, the oxygen content in the fuel has been shown to be a critical factor affecting OP, as exemplified by the typically high OP of PM generated from biomass combustion (Hedayat et al., 2016).
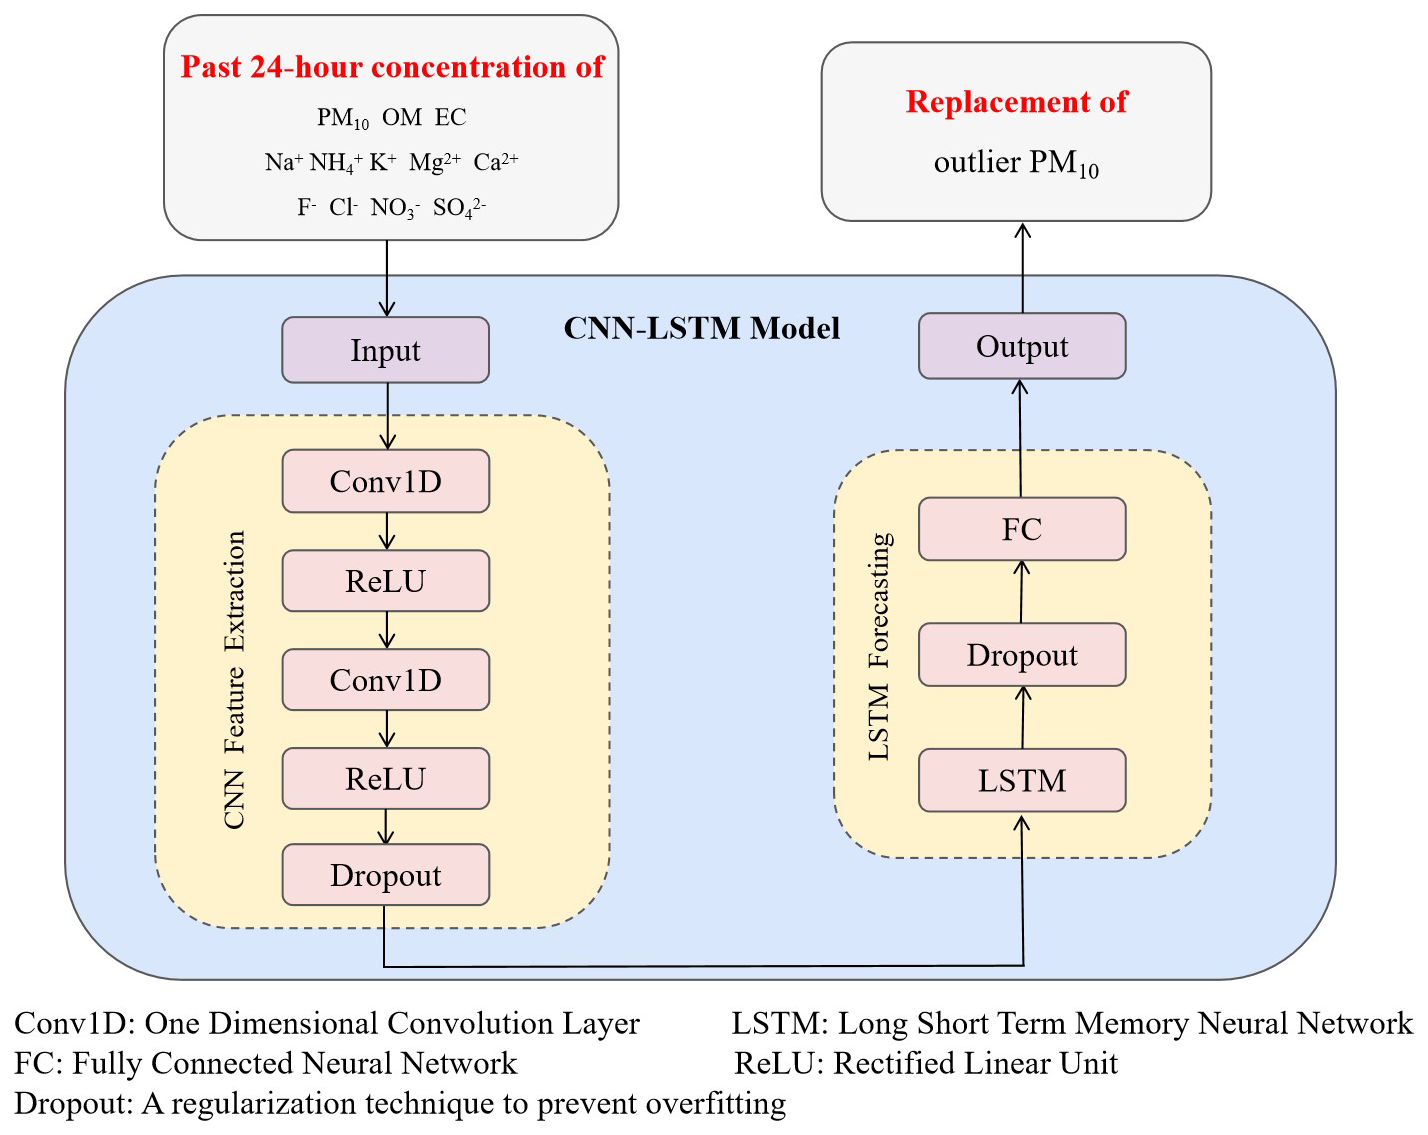
However, an accurate assessment of the health risks associated with PM10 requires an accurate analysis of its sources and chemical compositions. High-quality, complete datasets are essential for reliable source apportionment and subsequent risk assessment. Environmental monitoring data often contain missing values and anomalies due to instrument malfunction, maintenance periods, or extreme weather conditions, which can significantly affect the accuracy of subsequent analyses. In recent years, with the rapid development of deep learning technology, its application in handling environmental data quality issues has received increasing attention. Deep learning models, particularly the combination of Convolutional Neural Networks (CNN) and Long Short-Term Memory networks (LSTM), have demonstrated significant advantages in identifying and correcting anomalies and filling missing values in time series environmental data. CNNs effectively extract spatial features, while LSTMs excel at capturing long-term dependencies in time series (Huang and Kuo, 2018; Li et al., 2020). This hybrid model not only identifies anomalies, but also improves data completeness and reliability by predicting and replacing anomalous or missing values (Lee and Shin, 2019; Qin et al., 2019). Compared with traditional machine learning methods, CNN-LSTM models show superior performance in several evaluation metrics, such as Mean Absolute Error (MAE), Root Mean Square Error (RMSE) (Huang and Kuo, 2018; Yang et al., 2020a; Li et al., 2020). CNN-LSTM models retain significant value in processing atmospheric particulate matter data for data quality improvement. Their spatial feature extraction capabilities effectively identify and correct anomalies caused by instrument malfunction or local pollution events, thereby improving data quality (Zhang and Zhou, 2023). Through training and learning, CNN-LSTM models can effectively predict and fill missing data, providing a high-quality data foundation for subsequent source apportionment and risk assessment analyses (Li et al., 2020; Yang et al., 2020a).
After data pre-processing, the Positive Matrix Factorization (PMF) model was used to analyse PM10 sources in this study. The PMF model can identify major pollution sources and their contribution rates by decomposing the observation data matrix without requiring prior information (Paatero and Tapper, 1994). In recent years, PMF models have been extensively applied in PM10 and PM2.5 source apportionment, often in combination with other techniques such as multiple linear regression (MLR) (Weber et al., 2018). Based on the source contribution results from PMF analysis, MLR models can further quantify the contributions of different sources to the OP of PM, providing crucial evidence to reveal the association between PM sources and their health effects. Recent studies have innovatively introduced machine learning methods, such as multilayer perceptron (MLP), to model OP based on source contribution results from PMF analysis, significantly improving model predictive accuracy and explanatory power (Borlaza et al., 2022).
In this study, we adopted a comprehensive approach to process PM10 data and evaluate its OP. First, we removed anomalies from PM10 data and used a deep learning model combining CNN and LSTM to predict and replace anomalous values. This method effectively captures spatial and temporal features in time-series data, thereby improving data completeness and prediction accuracy. Then, we employed the PMF model for PM10 source apportionment to identify its major sources. Finally, based on the PMF results, we calculated the OP per unit mass of PM10 (OPm) to investigate the intrinsic toxicity of different emission sources. Through this series of methods, this study aims to reveal the OP characteristics and sources of PM10 in typical regions of China.
2.1 Sample Collections
Daily ambient PM10 samples were collected every three days from June 2022 to May 2023 at the twelve stations of the China Meteorological Administration Atmosphere Watch Network (CAWNET), with their distribution shown in Fig. 1 and detailed information provided in Table 1. Remote sites were selected in areas far from anthropogenic pollution sources to ensure the representativeness of the background monitoring data. Rural sites were selected in typical areas, with sampling points located away from local pollution sources and elevated above the surrounding ground to minimize local disturbances. At urban sites, sampling points were typically located 50–100 m above the average urban elevation in order to collect mixed aerosol samples rather than aerosols from single sources. Suburban sites were located in transition zones between urban and rural areas to reflect aerosol characteristics under different environmental conditions. All aerosol samples were collected using MiniVol™air samplers (Airmetrics, Oregon, USA) operating continuously for 24 h from 09:00 to 09:00 BJT the following day (Beijing time) at a flow rate of 5 L min−1. Whatman 47 mm quartz fiber filters (QM/A) were used for sampling. To prevent contamination from affecting the experimental results, all filters were heated at 800 °C for 3 h prior to use to remove potential organic contaminants.
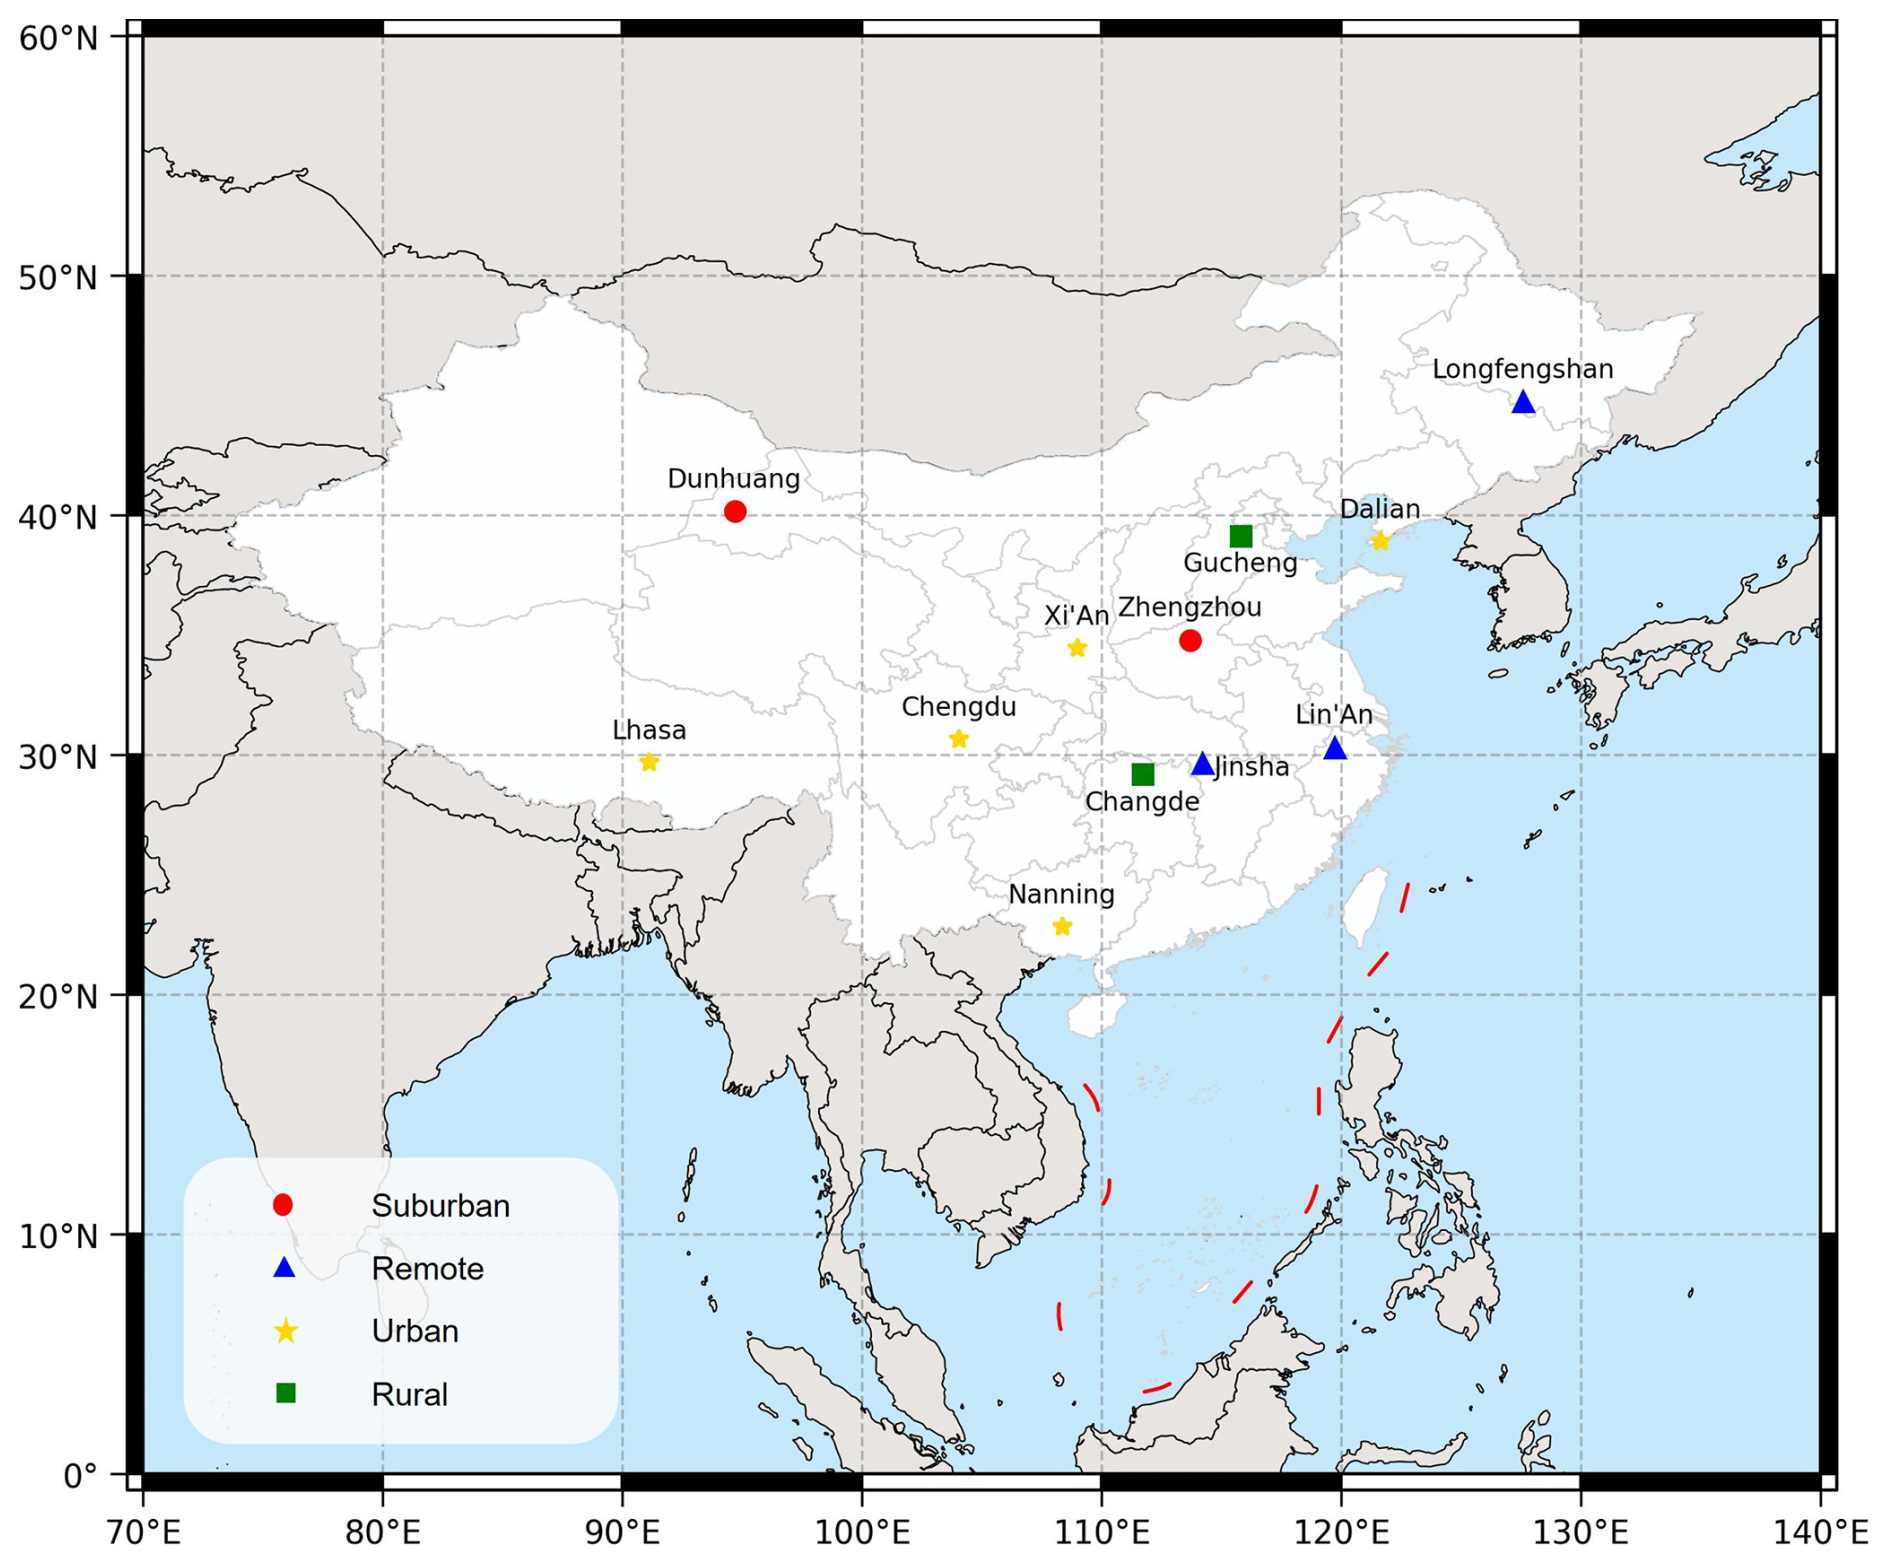
Figure 1Locations of 12 CAWNET stations. The map base is from the Ministry of Natural Resources' Standard Map Service, review number GS (2019)1822.
2.2 Chemical and OP analysis
2.2.1 Chemical compositions analysis
Quantitative measurements of OC and EC were performed using the DRI Model 2015A thermal/optical carbon analyzer developed by the Desert Research Institute, USA. After OC and EC analysis, ion chromatography (Dionex 600 series, USA) was used to analyze and determine various ions, including Na+, , K+, Ca2+, Mg2+, F−, Cl−, , and . This method has been widely used as a highly efficient and sensitive analytical technique for the determination of water-soluble ions in PM10 and PM2.5 (Domingos et al., 2012; Song et al., 2006).
2.2.2 OP analysis
The 2′,7′-Dichlorodihydrofluorescein (DCFH) method is widely used for detecting particle-bound ROS, mainly due to its lack of specificity and selectivity for various ROS species (Antonini et al., 1998; Cohn et al., 2008; Huang et al., 2016). In this study, the 2′,7′-Dichlorodihydrofluorescein diacetate (DCFH-DA) probe method was employed to measure ROS levels induced by PM10. First, DCFH-DA (97 %, Sigma-Aldrich, USA) was prepared as a 1 mmol mL−1 stock solution using anhydrous ethanol and mixed with 0.01 mol L−1 NaOH solution in a 1:4 () ratio. The mixture was kept at room temperature in the dark for 30 min to ensure complete alkaline hydrolysis of DCFH-DA to DCFH. Phosphate buffer solution (PBS, 0.0067 mol L−1, pH 7.2) was then added to adjust the pH to 7.0–7.4. The hydrolyzed DCFH solution was stored at 4 °C in the dark and used within 2 h. Horseradish peroxidase (HRP) was dissolved in phosphate buffer to prepare a 10 unit mL−1 HRP stock solution. It was mixed with the DCFH solution prior to use to achieve final concentrations of 10 µmol L−1 DCFH and 0.5 units mL−1 HRP in the reaction system. To generate a standard curve, a 1000 µg mL−1 H2O2 solution was diluted with ultrapure water to generate H2O2 standard solutions at concentrations of 20, 40, 80, 160, 200, 240, 320, 400, and 800 nmol L−1. In a 96-well plate, 20 µL standard solution and 60 µL DCFH-HRP mixture were added, with three replicates for each concentration. After 15 min of dark incubation at 37 °C, fluorescence intensity was measured using a multifunctional microplate reader (SynergyTMH1, BioTek America) at an excitation wavelength of 485 nm and an emission wavelength of 535 nm. Quantification was done through converting the sample's fluorescent intensity to the equivalent quantity of H2O2 (nmol H2O2 m−3). Before sample analysis, PM10 samples were extracted in phosphate buffer solution by sonication for 30 min. After centrifugation, the supernatant was collected for testing. In the 96-well plate, 20 µL of sample solution and 60 µL of DCFH-HRP mixture were added, with three replicates per sample. Water blanks, filter blanks, and DCFH-HRP background blanks were included to eliminate background interference. After 15 min of dark incubation at 37 °C, fluorescence intensity was measured and converted to H2O2 equivalent concentrations using the H2O2 standard curve to characterize PM10-induced ROS levels. Throughout the experimental procedure, the microplate reader was preheated for 30 min before measurement to ensure a stable incubation temperature of 37 °C. Background fluorescence values were subtracted from each measurement, and the relative standard deviation (RSD) of the replicates was controlled within 5 % to ensure the accuracy and reliability of the data.
2.3 Data analysis
2.3.1 CNN
One-dimensional convolutional neural networks (1D-CNN) have significant theoretical advantages and practical value in processing time series data. The core mechanism relies on local connectivity and weight sharing, where each neuron is connected only to a local region of the input data, while the convolution kernel weights are shared across the entire input sequence. This design significantly reduces the number of model parameters, improving computational efficiency while effectively mitigating overfitting problems. Moreover, 1D-CNN achieves translational invariance through convolution and pooling operations, ensuring robustness to input data translations and enabling stable capture of key patterns in time-series data. Crucially, 1D-CNN possesses automatic feature extraction capabilities, allowing the model to independently learn and extract multi-level feature representations from raw data through end-to-end training, thus reducing dependence on manual feature engineering. As illustrated in Fig. 2, the input sequence x1∼x6 undergoes convolution operations to generate feature mappings y1∼y4, with purple, green, and yellow connections linking the input layer to the convolution layer. Each connection maintains its distinct weight value, with connections of the same color sharing identical weights. By stacking multiple convolutional layers, the model progressively learns higher-level feature representations, offering robust expressive capabilities for time-series data modeling and prediction.
2.3.2 LSTM
Long Short-Term Memory (LSTM) networks are specialized recurrent neural networks that effectively address the long-term dependency problems inherent in traditional RNN (Hochreiter and Schmidhuber, 1997). LSTM introduces memory cells and gating mechanisms that selectively remember or forget information, enabling the capture of long-term dependencies in sequences (Okut, 2021). The network uses three primary gating mechanisms: the forgetting gate, the input gate, and the output gate. The operating principle of the LSTM is illustrated in Fig. 3, where σ represents the sigmoid function as shown in Eq. (1). Compared to traditional RNNs, LSTM networks exhibit superior handling of the vanishing gradient problem and can learn dependencies over longer time steps (Sherstinsky, 2020). These capabilities have led to the widespread application of LSTM in various domains, including time series prediction and natural language processing (Vennerød et al., 2021). The specific mathematical formulations of LSTM are detailed in Eqs. (1)–(6):
where Wf represents the weight matrix of the forget gate, and bf denotes its bias term. ht-1 is the previous hidden state and xt is the current input. The sigmoid activation function σ controls the proportion of information retention. it represents the output of the input gate, while indicates the candidate memory value. Wi and Wc represent the weight matrices for the input gate and candidate memory respectively, while bi and bc denote their corresponding bias terms. ct represents the memory cell state at the current time step. ⊙ represents the element-wise multiplication. Wo denotes the weight matrix of the output gate, bo represents its bias term, and ot indicates the output of the output gate.
2.3.3 CNN-LSTM
Several studies have shown that CNN-LSTM models have excellent performance in PM prediction, with low error rates and reduced training times (Li et al., 2020; Huang and Kuo, 2018). In this study, PM10 concentration data were preprocessed for 11 chemical components: OM, EC, Na+, , K+, Ca2+, Mg2+, F−, Cl−, , and . Specifically, if the sum of the chemical components in a data set exceeded the PM10 mass concentration or fell below 50 % of the PM10 mass concentration, the PM10 concentration in that data set was considered anomalous and removed. After screening, the remaining data were retained and included in the training set. A hybrid model combining CNN and LSTM was used to predict PM10 concentrations based on the training set. As shown in Fig.4, The model first extracts local features from the data through two CNN layers: the first CNN layer uses 16 channels and a kernel size of 2, while the second CNN layer uses 32 channels and the same kernel size, capturing local feature patterns through a sliding window with a stride of 1. Each CNN layer is followed by a ReLU activation function to introduce non-linearity, and a Dropout layer with a probability of 0.2 to enhance generalization capability. Subsequently, a 2-layer LSTM network (with 64 hidden units) captures long-term dependencies in the time series, with the LSTM layers also applying the same Dropout mechanism; finally, the prediction results are output through a fully connected layer. During the training process, Mean Squared Error (MSE) was used as the loss function, and the Adam optimizer was employed for parameter optimization, with an initial learning rate set to 0.0005. When training the model, a total of 3000 training epochs were set, while dynamically monitoring the loss value, with early stopping when the loss value fell below a preset threshold of 0.0007. Upon completion of training, the model was evaluated on both training and test sets by calculating MAE, RMSE, and Coefficient of Determination (R2) to comprehensively evaluate the predictive performance of the model.
2.4 Source apportionment
In this study, the US Environmental Protection Agency (US-EPA) EPA PMF 5.0 software (US EPA, 2017) was used to perform source apportionment of PM10. PMF is a multivariate statistical method based on factor analysis that has been widely applied in source apportionment studies of atmospheric particulate matter (Paatero and Tapper, 1994). The PMF model identifies pollution sources and their contribution rates by decomposing the observed data matrix into two non-negative matrices – the factor contribution matrix (G) and the factor profile matrix (F). The mathematical model can be expressed as:
where X is the observation data matrix (n×m), G is the factor contribution matrix (n×p), F is the factor profile matrix (p×m), and E is the residual matrix. Here, n represents the number of samples, m represents the number of chemical species, and p represents the number of factors. The PMF model optimizes the decomposition results by minimizing the objective function Q:
where xij is the concentration of chemical component j in sample i, uij is the corresponding uncertainty, gik is the contribution of factor k in sample i, and fkj is the proportion of chemical component j in factor k. By introducing non-negative constraints, the PMF model can more reasonably explain the physical significance of pollution sources (Paatero, 1997). The uncertainty (Unc) of the sample data is calculated using Eqs. (9) and (10):
where MDL represents the method detection limit, and EFij denotes the error fraction of component j in sample i. In this study, the EF values for OPv were set as the standard deviation during analysis (Verma et al., 2015), while the other components were set at 10 %.
3.1 CNN-LSTM prediction results
The CNN-LSTM model was trained using non-outlier datasets consisting of PM10 concentration measurement and their corresponding eleven chemical constituents, including OM, EC, Na+, , K+, Ca2+, Mg2+, F−, Cl−, , and . To ensure the integrity of the data quality, outlier elimination was performed based on the sum of the chemical components. After the outlier screening process described in Sect. 2.3.3, 471 non-outlier datasets meeting the quality criteria were retained for model training and evaluation, with 85 % allocated to the training set and 15 % to the test set. The trained CNN-LSTM model was then used to predict PM10 concentrations for the 766 outlier datasets by using their eleven chemical constituent concentrations as input features, with the predicted values replacing the original outlier measurements to maintain data completeness. Model performance was evaluated independently on both the training and test sets using three metrics: MAE, RMSE, and R2. These performance metrics are mathematically expressed in Eqs. (11)–(13). In these equations, yi represents the actual value, denotes the predicted value, n indicates the sample size, and represents the mean of the actual values.
3.1.1 Comparison with conventional gap-filling techniques
The model was evaluated on both the training and test sets after completion of training, with results presented in Table 2 and Fig. 5. As shown in Fig. 5a, the training process converged effectively, with the loss function decreasing steadily and stabilizing at approximately 0.0007, indicating successful model optimization without overfitting. For the training set, the CNN-LSTM model achieved a MAE of 6.6614 µg m−3, a RMSE of 8.7162 µg m−3, and a R2 of 0.9670. When evaluated on the test set, the model demonstrated an MAE of 12.6705 µg m−3, a RMSE of 17.4965 µg m−3, and an R2 of 0.8840.
Table 2Comparison of MAE, RMSE, and R2 among different models.
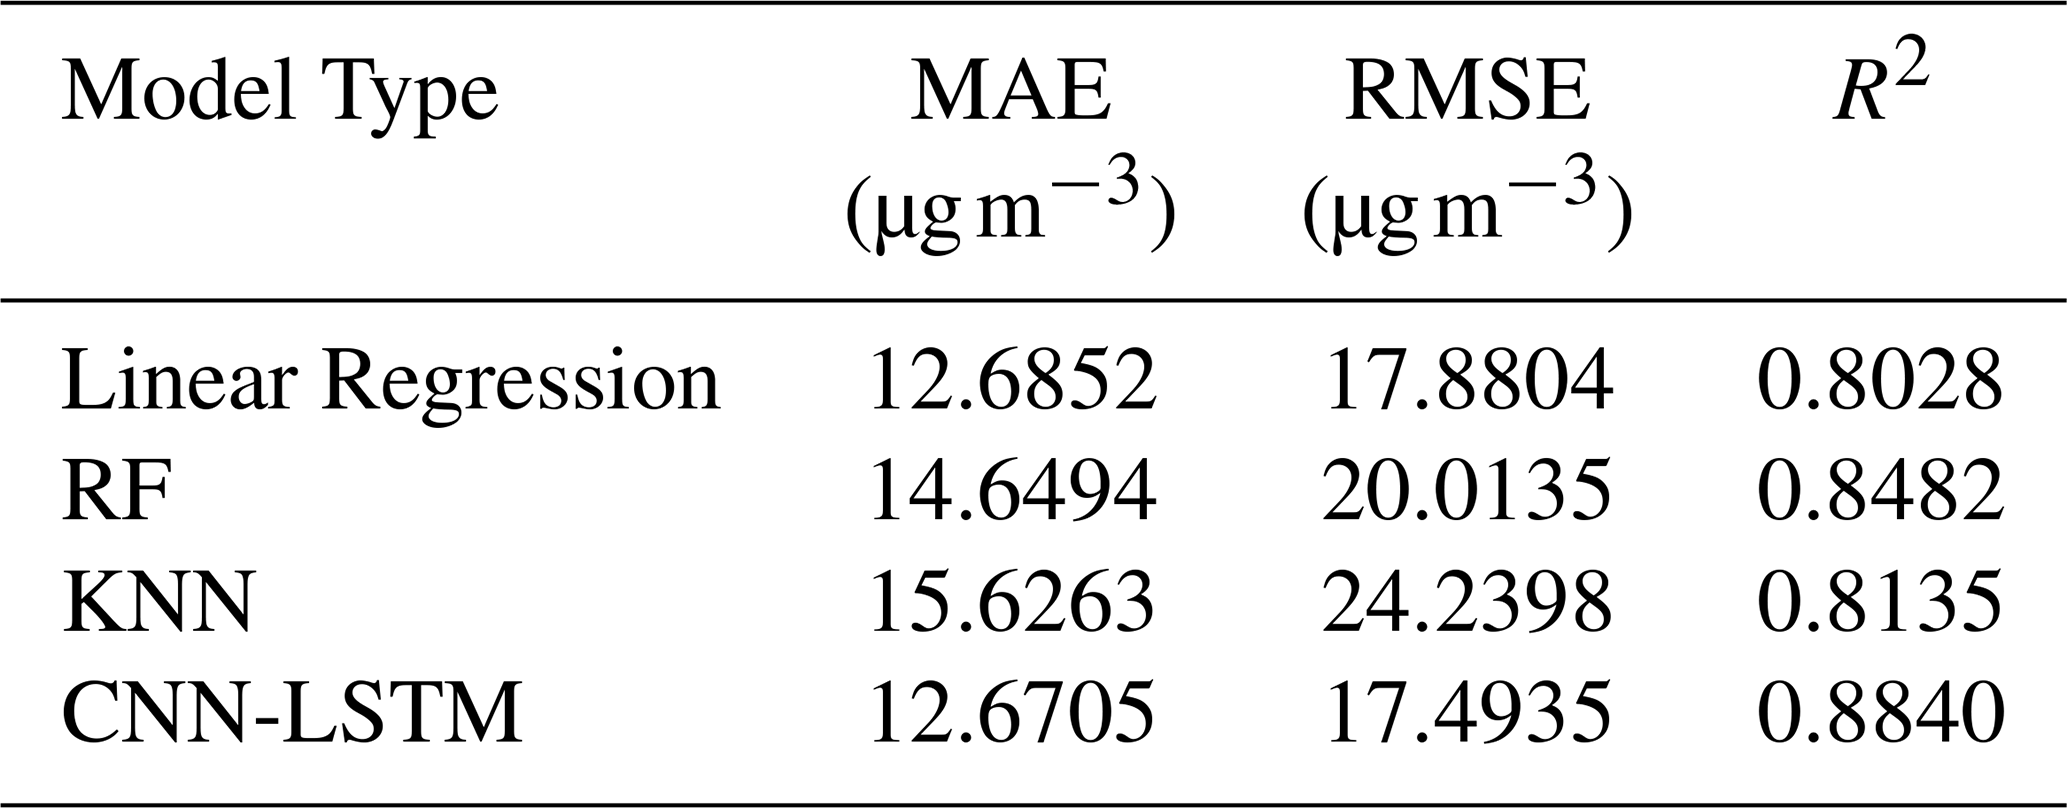
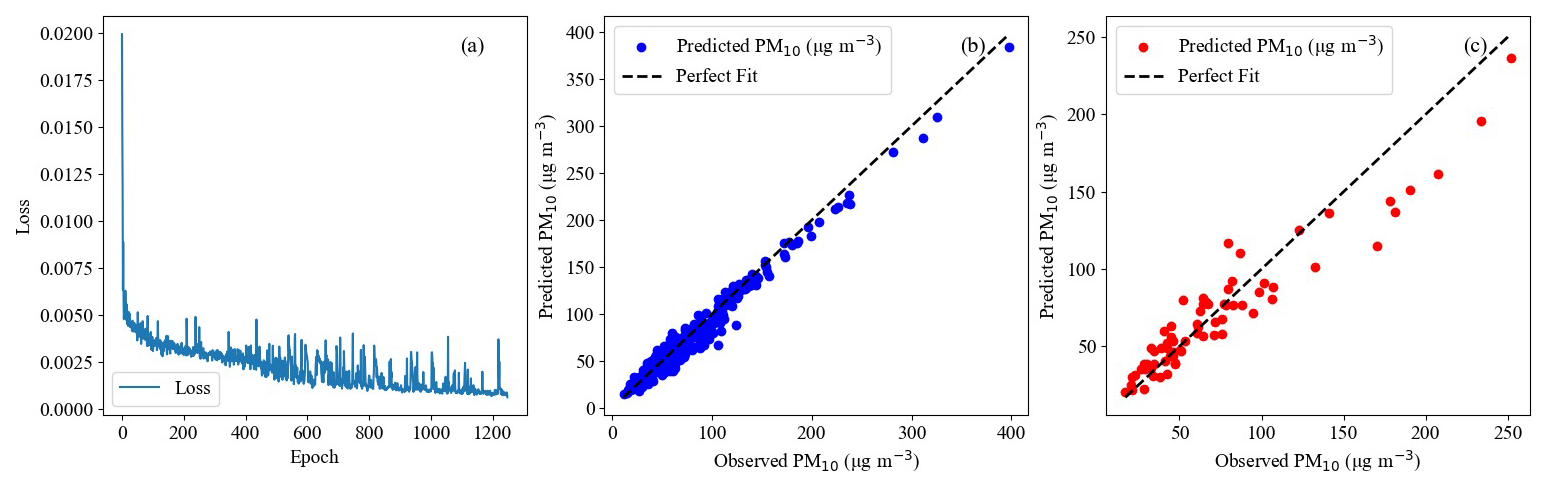
Figure 5(a) LOSS trends for the training sets; comparison of predictions and observations for the (b) training and (c) test sets by the CNN-LSTM.
Traditional gap-filling techniques in air quality data reconstruction commonly include Linear Regression, Random Forest (RF), and k-nearest neighbors (KNN) methods, which have been widely applied in environmental data analysis (Méndez et al., 2023). To evaluate the effectiveness of our CNN-LSTM approach, we conducted a comprehensive comparison with these conventional methods and individual deep learning components, with detailed results presented in Table 2.
In the ranking of MAE performance, from low to high, the results are: CNN-LSTM (12.6705 µg m−3), Linear Regression (12.6852 µg m−3), RF (14.6494 µg m−3), and KNN (15.6263 µg m−3). While in the ranking of RMSE, from low to high, the performance follows: CNN-LSTM (17.4935 µg m−3), Linear Regression (17.8804 µg m−3), RF (20.0135 µg m−3), and KNN (24.2398 µg m−3). In terms of R2, from high to low, the algorithms perform as follows: CNN-LSTM (0.8840), RF (0.8482), KNN (0.8135), and Linear Regression (0.8028).
This study shows that the CNN-LSTM model proposed in this paper demonstrates good performance across all evaluation metrics. Linear regression, despite achieving competitive MAE values, shows limitations in capturing complex non-linear relationships, as evidenced by its lower R2 value. This can be attributed to the linear model's relative inability to capture the complex non-linear relationships inherent in atmospheric particulate matter dynamics (Singh et al., 2012; Dragomir and Oprea, 2014). RF demonstrated moderate performance with balanced metrics across MAE, RMSE, and R2. KNN showed the least effective overall performance, particularly evident in its highest RMSE value of 24.2398 µg m−3.
Overall, CNN-LSTM is the strongest performer among all tested models. This result confirms that the combination of CNN and LSTM is quite effective for PM10 gap-filling applications. We conducted ablation experiments in Sect. S1 in the Supplement. As shown in Table S1 in the Supplement, the performances of CNN and LSTM are both good, but that of CNN-LSTM is even more outstanding. It is indicated that for PM10 data reconstruction, it is beneficial to first perform feature extraction using CNN, and then input the feature values into the LSTM architecture for temporal pattern recognition.
3.1.2 Leave-one-site-out cross-validation
To validate the model's generalization capability and ensure it captures physically meaningful variability rather than site-specific biases, we employed a site-type-based Leave-One-Site-Out (LOSO) cross-validation strategy. The monitoring sites within the study area were categorized into four types based on their functional characteristics and geographical environment: urban sites, rural sites, suburban sites, and remote sites. LOSO cross-validation was performed separately for each site type. For each iteration, one site of a particular type was withheld during model training. The model was then trained using data from the remaining sites and tested on the withheld site.
Table 3 presents the model performance metrics for different site types in the LOSO cross-validation, including MAE, RMSE, and R2. The cross-validation results demonstrate that the established neural network model exhibits good predictive performance across different site types, with R2 values exceeding 0.78 for all site types. This confirms that the model can effectively reproduce the physically meaningful variability in pollutant concentrations rather than merely fitting site-specific characteristics.
Table 3Results of Leave-One-Site-Out (LOSO) cross-validation for different site types.
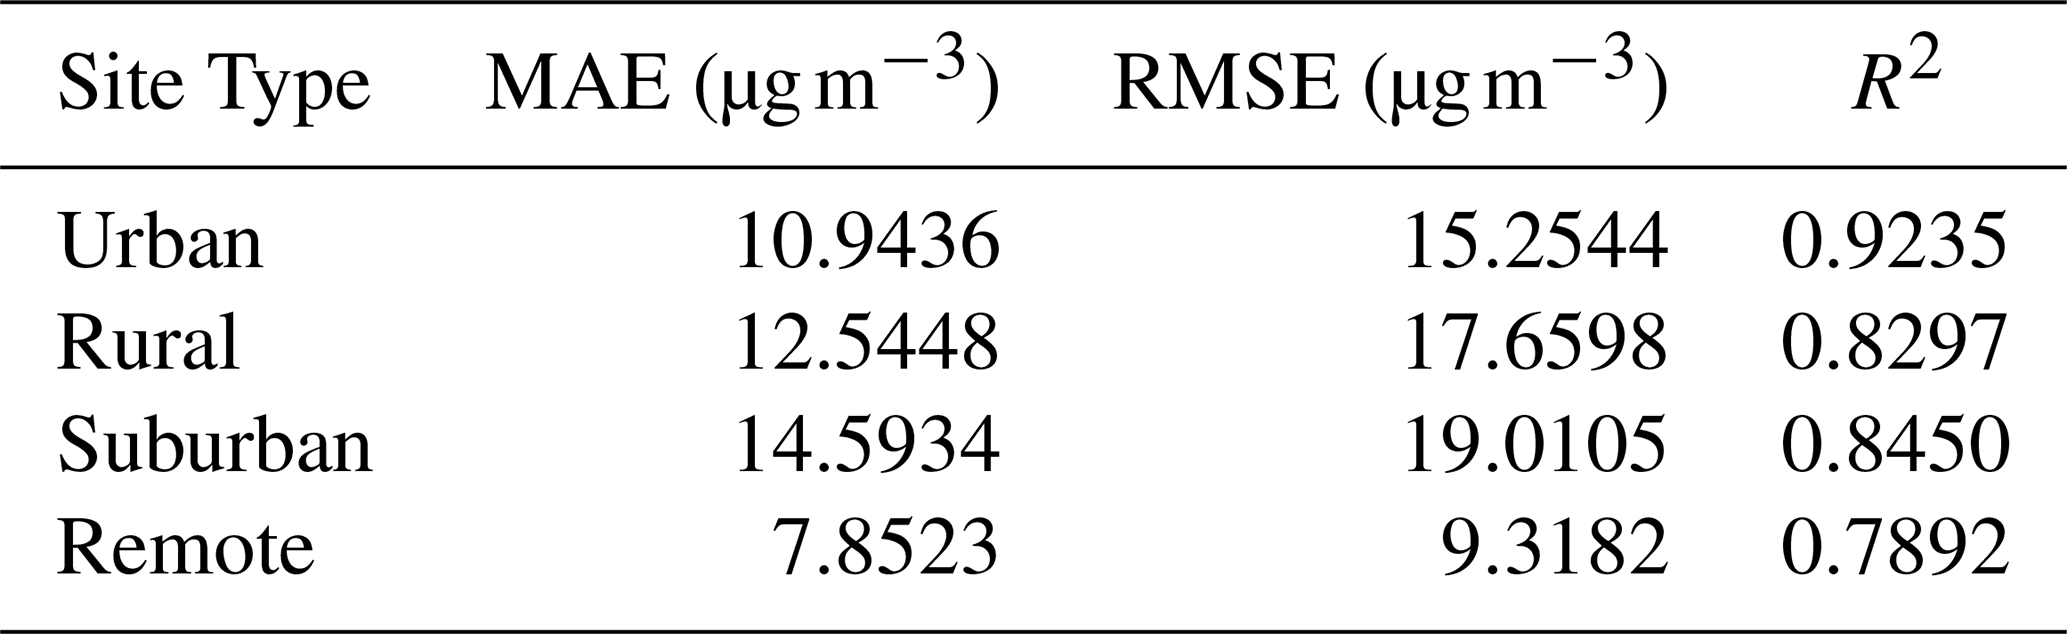
Remote stations exhibit the lowest MAE (7.8523 µg m−3) and RMSE (9.3182 µg m−3), indicating minimal prediction errors at these site types. This is primarily attributed to remote stations being located far from major pollution sources, resulting in relatively low pollutant concentrations with gradual variations that reduce absolute prediction errors. However, Remote stations show a relatively low R2 value (0.7892), which may be related to their smaller concentration variation range, making the correlation coefficient more sensitive to minor prediction deviations. Urban stations demonstrate the highest R2 value (0.9235), while maintaining moderate MAE (10.9436 µg m−3) and RMSE (15.2544 µg m−3) levels. This result indicates that the model can effectively capture pollutant concentration trends in urban environments. Urban areas feature dense and diverse pollution sources, including vehicle emissions and industrial emissions, which increase prediction complexity but provide larger concentration variation ranges that facilitate the establishment of robust predictive relationships. Rural stations show moderate performance across all metrics, with MAE of 12.5448 µg m−3, RMSE of 17.6598 µg m−3, and R2 of 0.8297. Rural areas are primarily influenced by relatively simple pollution sources such as regional transport and agricultural activities, resulting in more regular spatiotemporal variation patterns of pollutant concentrations that the model can effectively learn. Suburban stations display the highest MAE (14.5934 µg m−3) and RMSE (19.0105 µg m−3), but with an R2 value (0.8450) similar to rural stations. As transitional zones between urban and rural areas, suburban regions are simultaneously influenced by urban pollution dispersion and rural pollution sources, exhibiting distinct transitional and complex pollution characteristics. This composite pollution environment increases the difficulty of model prediction and may result in higher prediction errors.
3.2 PM10 mass and chemical composition concentrations
3.2.1 Annual average
The analysis of PM10 concentrations across diverse locations in China shows a remarkable spatial variation in the annual mean concentrations of PM10 and its chemical constituents from June 2022 to May 2023, as shown in Table 4. Significantly elevated PM10 levels were observed at northwestern sites, with Xi'An (XA) and Dunhuang (DH) recording concentrations of 98.20 and 90.36 µg m−3, respectively, while other sites had concentrations ranging from 40 to 80 µg m−3. These spatial patterns suggest complex interactions between natural and anthropogenic factors. The elevated PM10 concentrations observed in XA, a major industrial city and densely populated metropolitan area, are primarily due to industrial emissions and substantial high traffic volumes. Due to its location in an arid region, DH is likely influenced by dust storm events, as evidenced by higher concentrations of crustal elements such as Ca2+ (Yu et al., 2020). While Na+ is typically associated with sea salt spray, its presence at inland sites such as DH may indicate contributions from crustal material or other local sources (Zhang et al., 2014b).
Table 4Annual average concentrations (µg m−3) of PM10 and its chemical composition in different regions of China from June 2022 to May 2023.
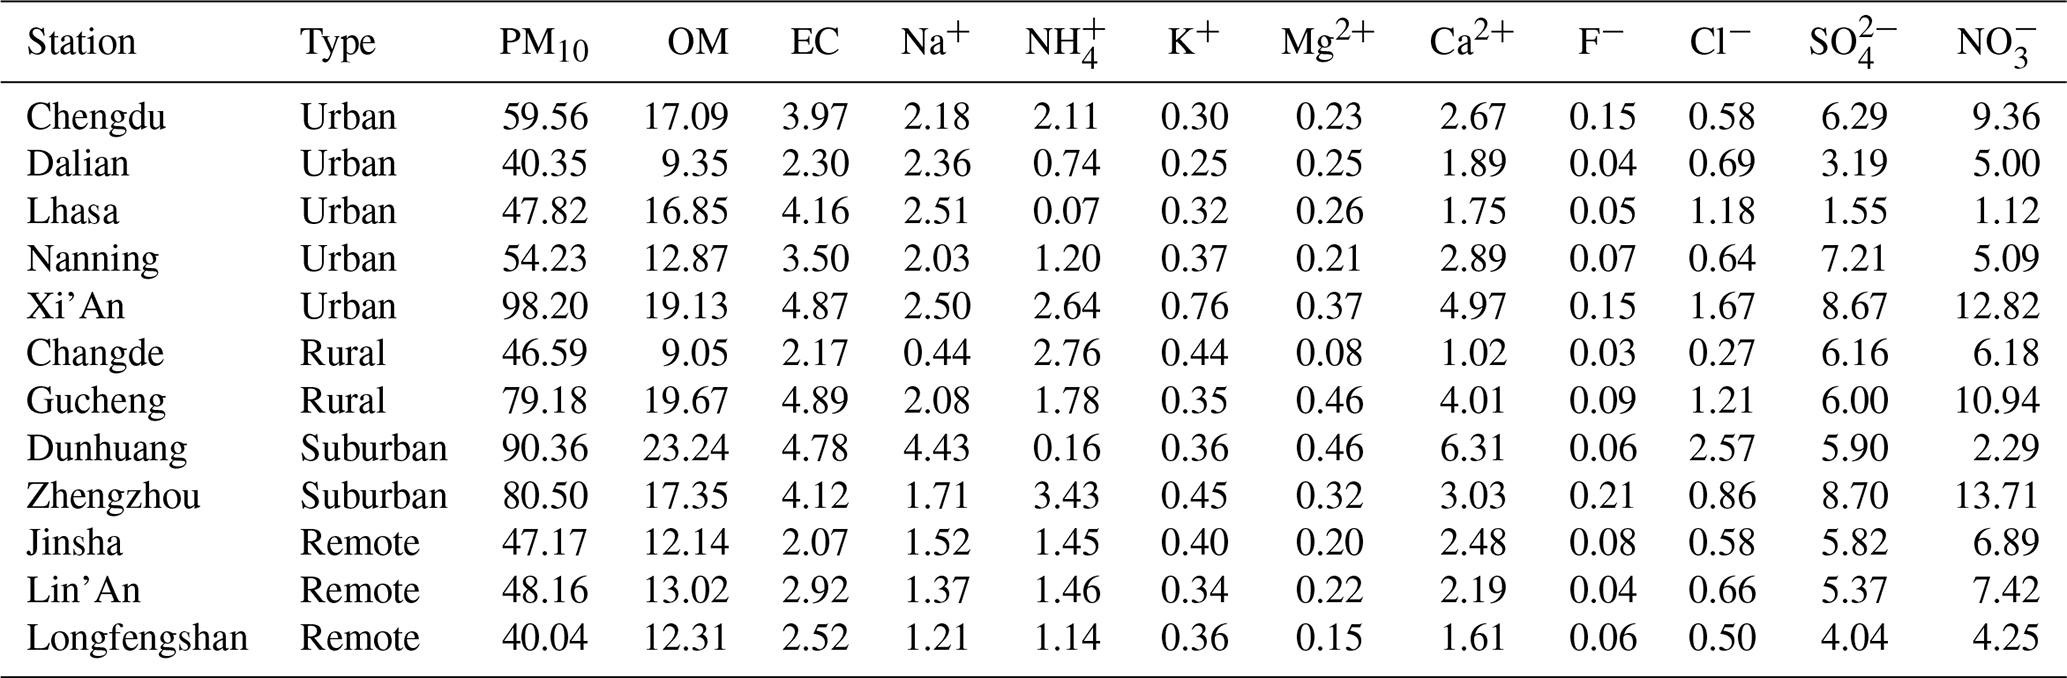
In contrast, the lowest PM10 concentrations were observed at Longfengshan (LFS) and Dalian (DL) in the northeastern region, with values of 40.04 and 40.35 µg m−3, respectively. These relatively lower concentrations may be due to relatively less anthropogenic activities and better air quality in these regions. LFS, located at the interface of agricultural and forested landscapes, primarily receives PM10 contributions from natural sources, such as soil dust resuspension and biomass burning reported in previous research (Yu et al., 2012). Meanwhile, Dalian's coastal location likely contributes to its lower PM10 concentrations. The observed Na+ concentration of 2.36 µg m−3 in DL may reflect the influence of marine aerosols (Shi et al., 2022). In addition, air quality in DL is likely modulated by meteorological conditions, especially sea breezes, which facilitate the dispersion and dilution of pollutants, thereby reducing PM10 concentrations (Wang et al., 2002).
In the densely populated regions of Gucheng (GC) and Zhengzhou (ZZ), where anthropogenic pollution sources are abundant, the annual mean PM10 concentrations were 79.18 and 80.50 µg m−3, respectively. These elevated PM10 levels are strongly correlated with intensive anthropogenic sources in these regions, including industrial activities, traffic emissions, and construction dust. As major industrial and transportation hubs, GC and ZZ have particularly high concentrations of organic matter () and elemental carbon (EC), specifically 19.67 and 4.89 µg m−3 in GC, 17.35 and 4.12 µg m−3 in ZZ. Additionally, the concentrations of sulfate () and nitrate () concentrations in ZZ and GC were measured to be 8.70, 13.71 and 6.00, 10.94 µg m−3, respectively. These values, which are significantly higher than in other regions, indicate particularly active secondary aerosol formation processes in these areas (Yang et al., 2020b).
In the southwestern region, Chengdu (CD), located in the Sichuan Basin, recorded an annual mean PM10 concentration of 59.56 µg m−3. This region is characterized by high aerosol optical depth and reduced visibility, attributed to poor dispersion conditions and significant local industrial emissions (Li et al., 2003; Zhang et al., 2012).
The central Chinese sites of Jinsha (JS), Changde (CHD), and Lin'An (LA) showed relatively lower annual mean concentrations of PM10 which are 47.17, 46.59, and 48.16 µg m−3, respectively. Despite these lower concentrations, the chemical composition shows distinct regional characteristics. Ca2+ concentrations of 2.48 and 2.19 µg m−3 in JS and LA, respectively, likely reflect contributions from soil dust resuspension (Shen et al., 2016). K+ concentration of 0.44 µg m−3 observed in CHD may be related to agricultural activities in the region (Liu et al., 2016).
Lhasa (LS), located in the center of the Tibetan Plateau at an elevation of 3663 m, has PM10 concentrations that are primarily influenced by natural factors due to its relatively sparse population and limited industrial emissions. Nevertheless, LS maintained an average PM10 concentration of 47.82 µg m−3, mainly due to extensive dust resuspension from arid and exposed terrain, coupled with regional dust storm events. The plateau's climatic conditions, characterized by particularly strong winds and low humidity, enhance the dispersal of soil dust and maintain relatively high PM10 levels despite the absence of significant anthropogenic sources.
The annual mean PM10 concentrations for urban, rural, suburban, and remote sites were , , , and , respectively. These data show that urban-rural transition zones had the highest PM10 concentrations, which may be due to the simultaneous influence of multiple pollution sources from both urban and rural areas, including industrial emissions, traffic pollution, and agricultural activities (Li et al., 2014). In contrast, remote sites had the lowest PM10 concentrations, reflecting minimal anthropogenic influence in these regions, with primary pollution sources consisting of natural dust resuspension and long-range transported pollutants (Jiao et al., 2021).
3.2.2 Seasonal variation
Monthly variations in PM10 concentrations are shown in Fig. 6. Overall, the study area shows a significant seasonal differentiation of PM10 concentrations, characterized by minimum levels in summer (June–August), maximum levels in winter (December–February), and a secondary peak in spring (March–May). Multiple studies have also identified distinct seasonal patterns in PM10 concentrations, with minimal concentrations in summer and maximal concentrations in winter (Yang, 2009; Qu et al., 2010; Li et al., 2009). The lower PM10 concentrations observed in summer may be attributed to increased precipitation, which effectively scavenges atmospheric particulate matter (Yang, 2009). In addition, research has shown significant negative correlations between PM10 concentrations and temperature, as well as positive correlations with atmospheric pressure (Han et al., 2015; Li et al., 2019). Elevated PM10 concentrations in winter are primarily associated with increased solid fuel consumption during the heating season (Tsvetanova et al., 2018). Additionally, unfavorable meteorological conditions in winter, including high atmospheric stability, reduced atmospheric boundary layer height, and frequent temperature inversions, exacerbate the accumulation of pollutants (Zhao et al., 2014). Five monitoring stations including GC, LFS, DH, LA, and Nanning (NN) exhibited significantly elevated concentrations during spring, which can be attributed to multiple factors. Firstly, the frequent occurrence of dust events during spring increases atmospheric particulate matter concentrations. Secondly, weak wind conditions and local circulation patterns establish local emissions as the primary source of PM10 (Park et al., 2019). Moreover, regional transport represents a significant influencing factor, with studies indicating substantial contributions to PM10 concentrations from dust transport from northwestern regions and pollutant transport from surrounding urban agglomerations in spring (Ham et al., 2017).
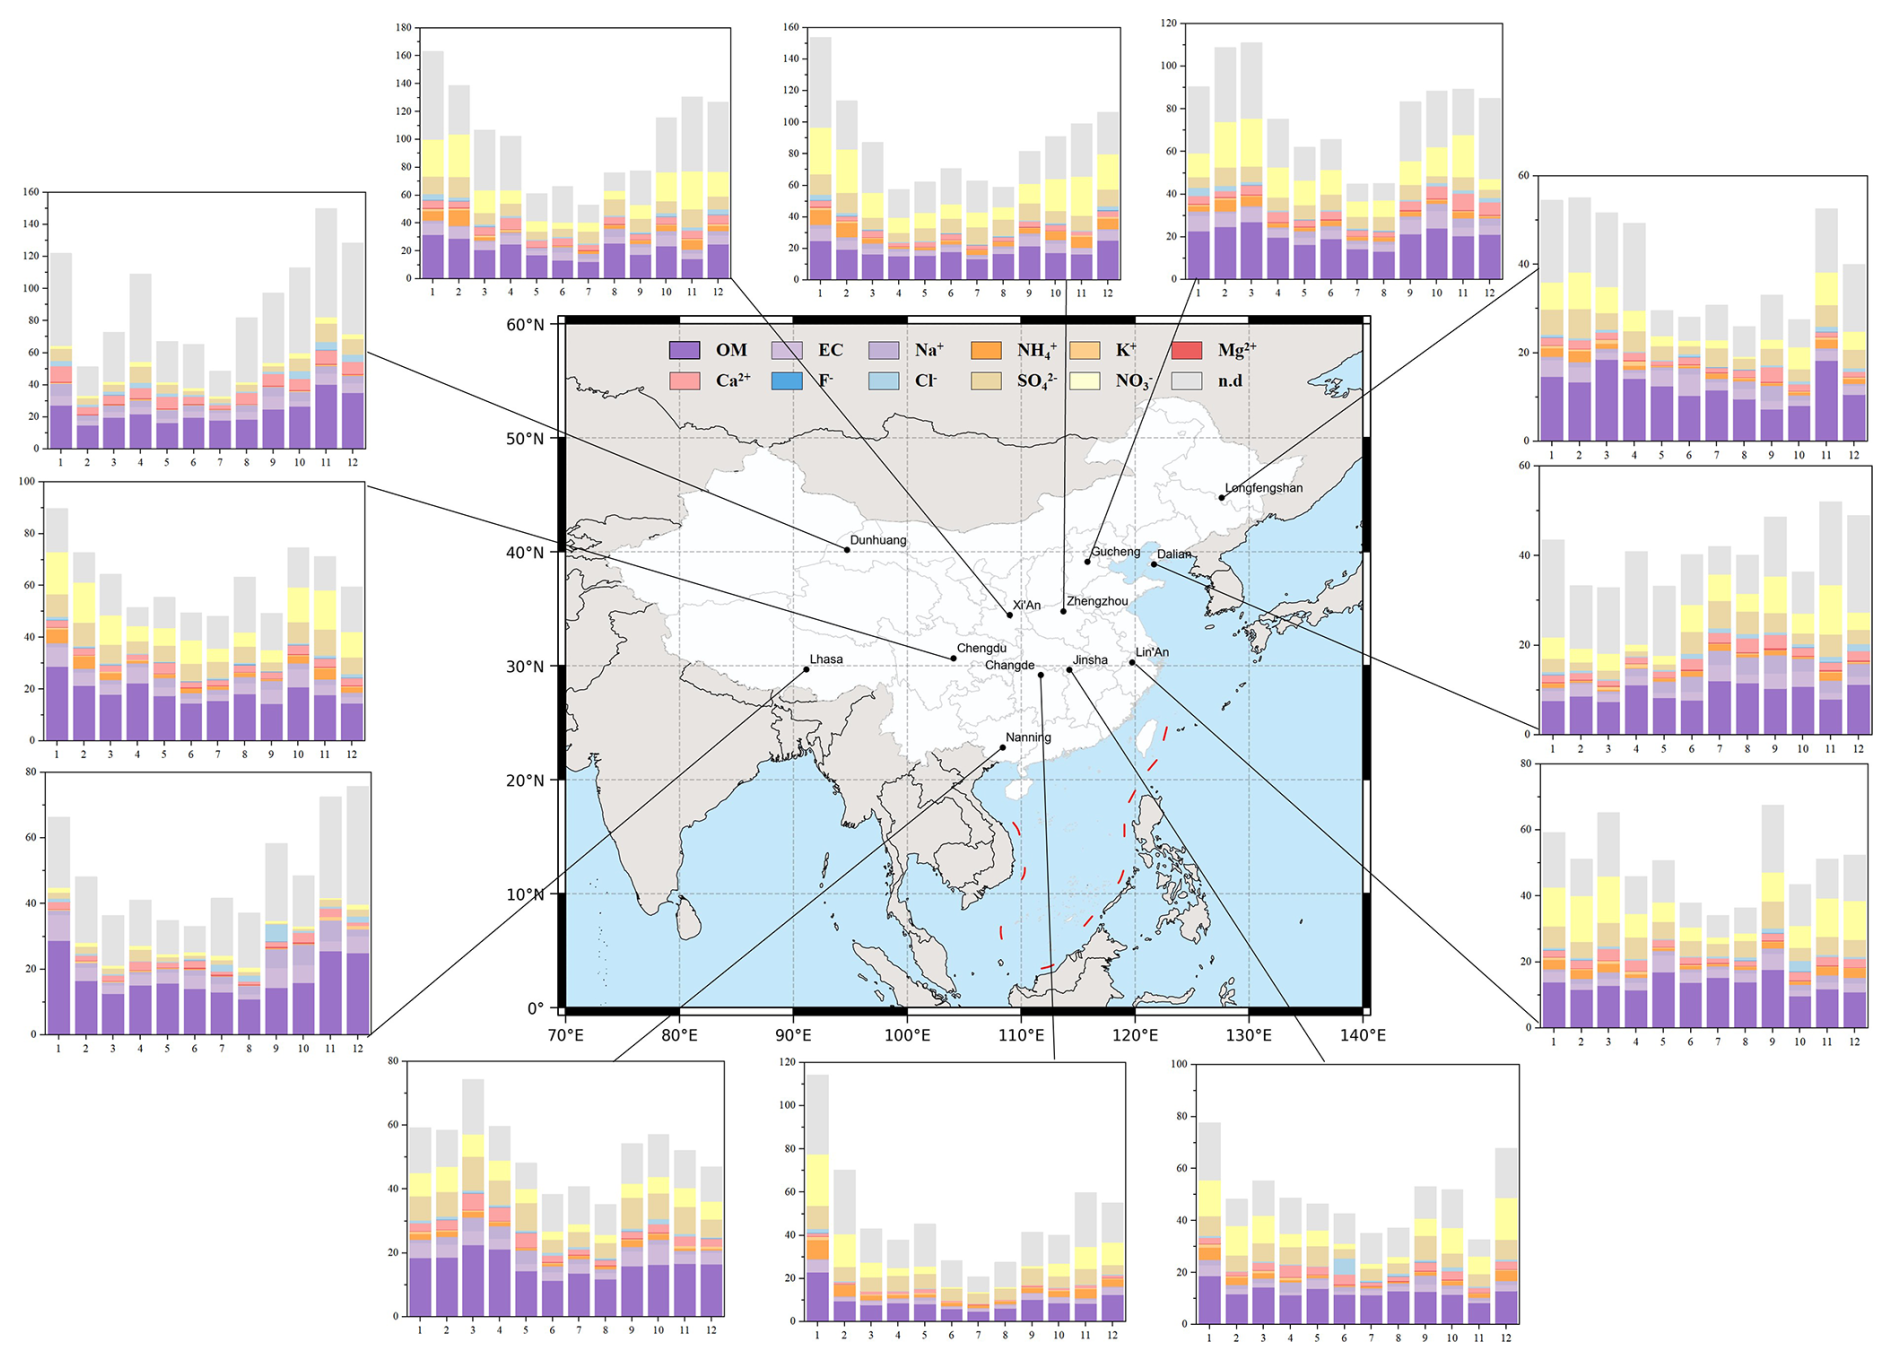
Figure 6Stacked Representation of Monthly averaged PM10 Concentrations and Chemical Composition (µg m−3) across Chinese Regions, Including Unknown Components from June 2022 to May 2023 (n. d.: Unknown Components). The map base is from the Ministry of Natural Resources' Standard Map Service, review number GS (2019)1822.
The results indicate significant seasonal variations in monthly mean concentrations of OM and EC in urban, rural, and suburban sites. All three functional site types showed the lowest concentrations in summer and the highest in winter, consistent with previous studies confirming the widespread winter-high and summer-low seasonal pattern of carbonaceous components in PM10 across China (Tian et al., 2013). The elevated concentrations of OM and EC in winter correlate primarily with increased fossil fuel and biomass combustion emissions during the heating season, coupled with unfavorable meteorological dispersion conditions. Conversely, the decrease concentrations in summer are attributed to increased precipitation, increased mixing layer height, and reduced stationary source emissions due to higher temperatures. However, remote sites showed different seasonal patterns than other sites, with OM and EC concentration peaks occurring in spring and fall. This phenomenon may be associated with regional-scale dust transport, biomass burning activities, and increased open-source emissions, while also reflecting minimal local anthropogenic influence at remote sites, better representing regional background concentration variations.
We observed generally higher concentrations of and in winter compared to lower concentrations in summer. This seasonal pattern is primarily due to increased SO2 and NOx emissions from extensive fossil fuel combustion, especially coal, during the winter heating season, which provides abundant precursors for the formation of sulfate and nitrate. In addition, stable atmospheric stratification and frequent temperature inversions in winter inhibit the dispersion of pollutants, leading to near-surface accumulation of these secondary inorganic ions. Furthermore, the relatively lower temperatures in winter facilitate the gas-to-particle conversion of gaseous precursors, promoting the partitioning of semi-volatiles such as ammonium sulfate and ammonium nitrate to the particulate phase (Wang et al., 2020). In contrast, higher summer temperatures favor the gaseous state of these semi-volatile substances, while frequent convection and stronger atmospheric dispersion conditions significantly reduce sulfate and nitrate concentrations in PM10 (Simonich and Hites, 1994). This seasonal pattern is consistent with observations from other regional studies and reflects the close relationship between secondary inorganic ion formation mechanisms and meteorological conditions (Liu et al., 2017a; Wang et al., 2023a).
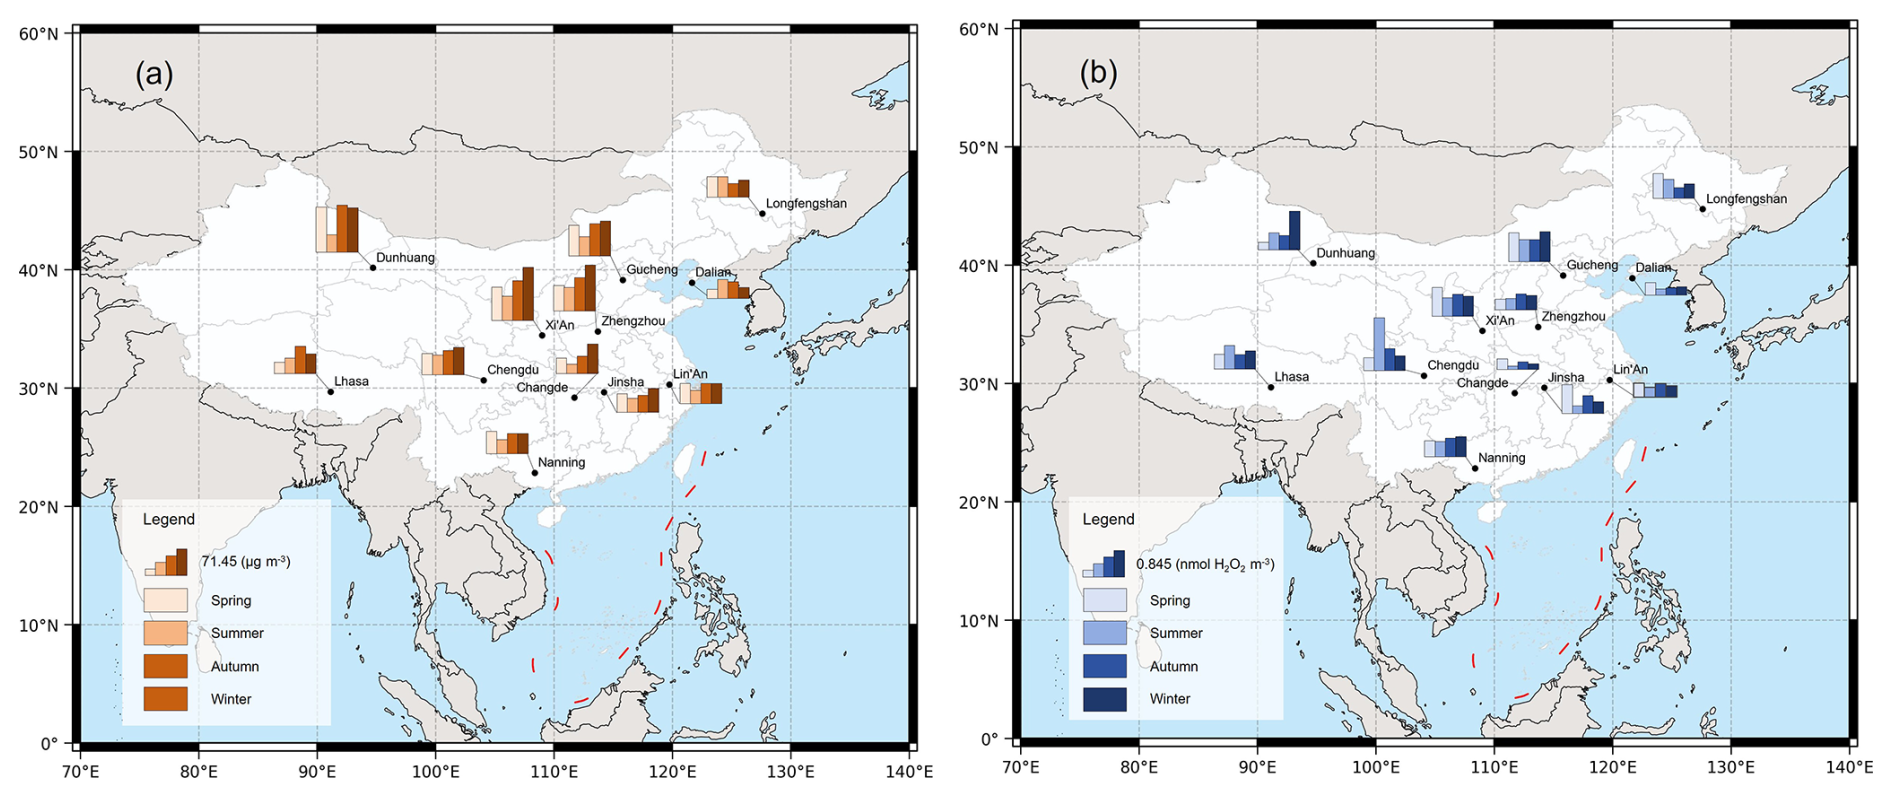
Figure 7Seasonal variations of (a) PM10 concentrations (µg m−3) and (b) OPv (nmol H2O2 m−3) across different regions of China. The map bases are from the Ministry of Natural Resources' Standard Map Service, review number GS (2019)1822.
3.3 OP concentrations
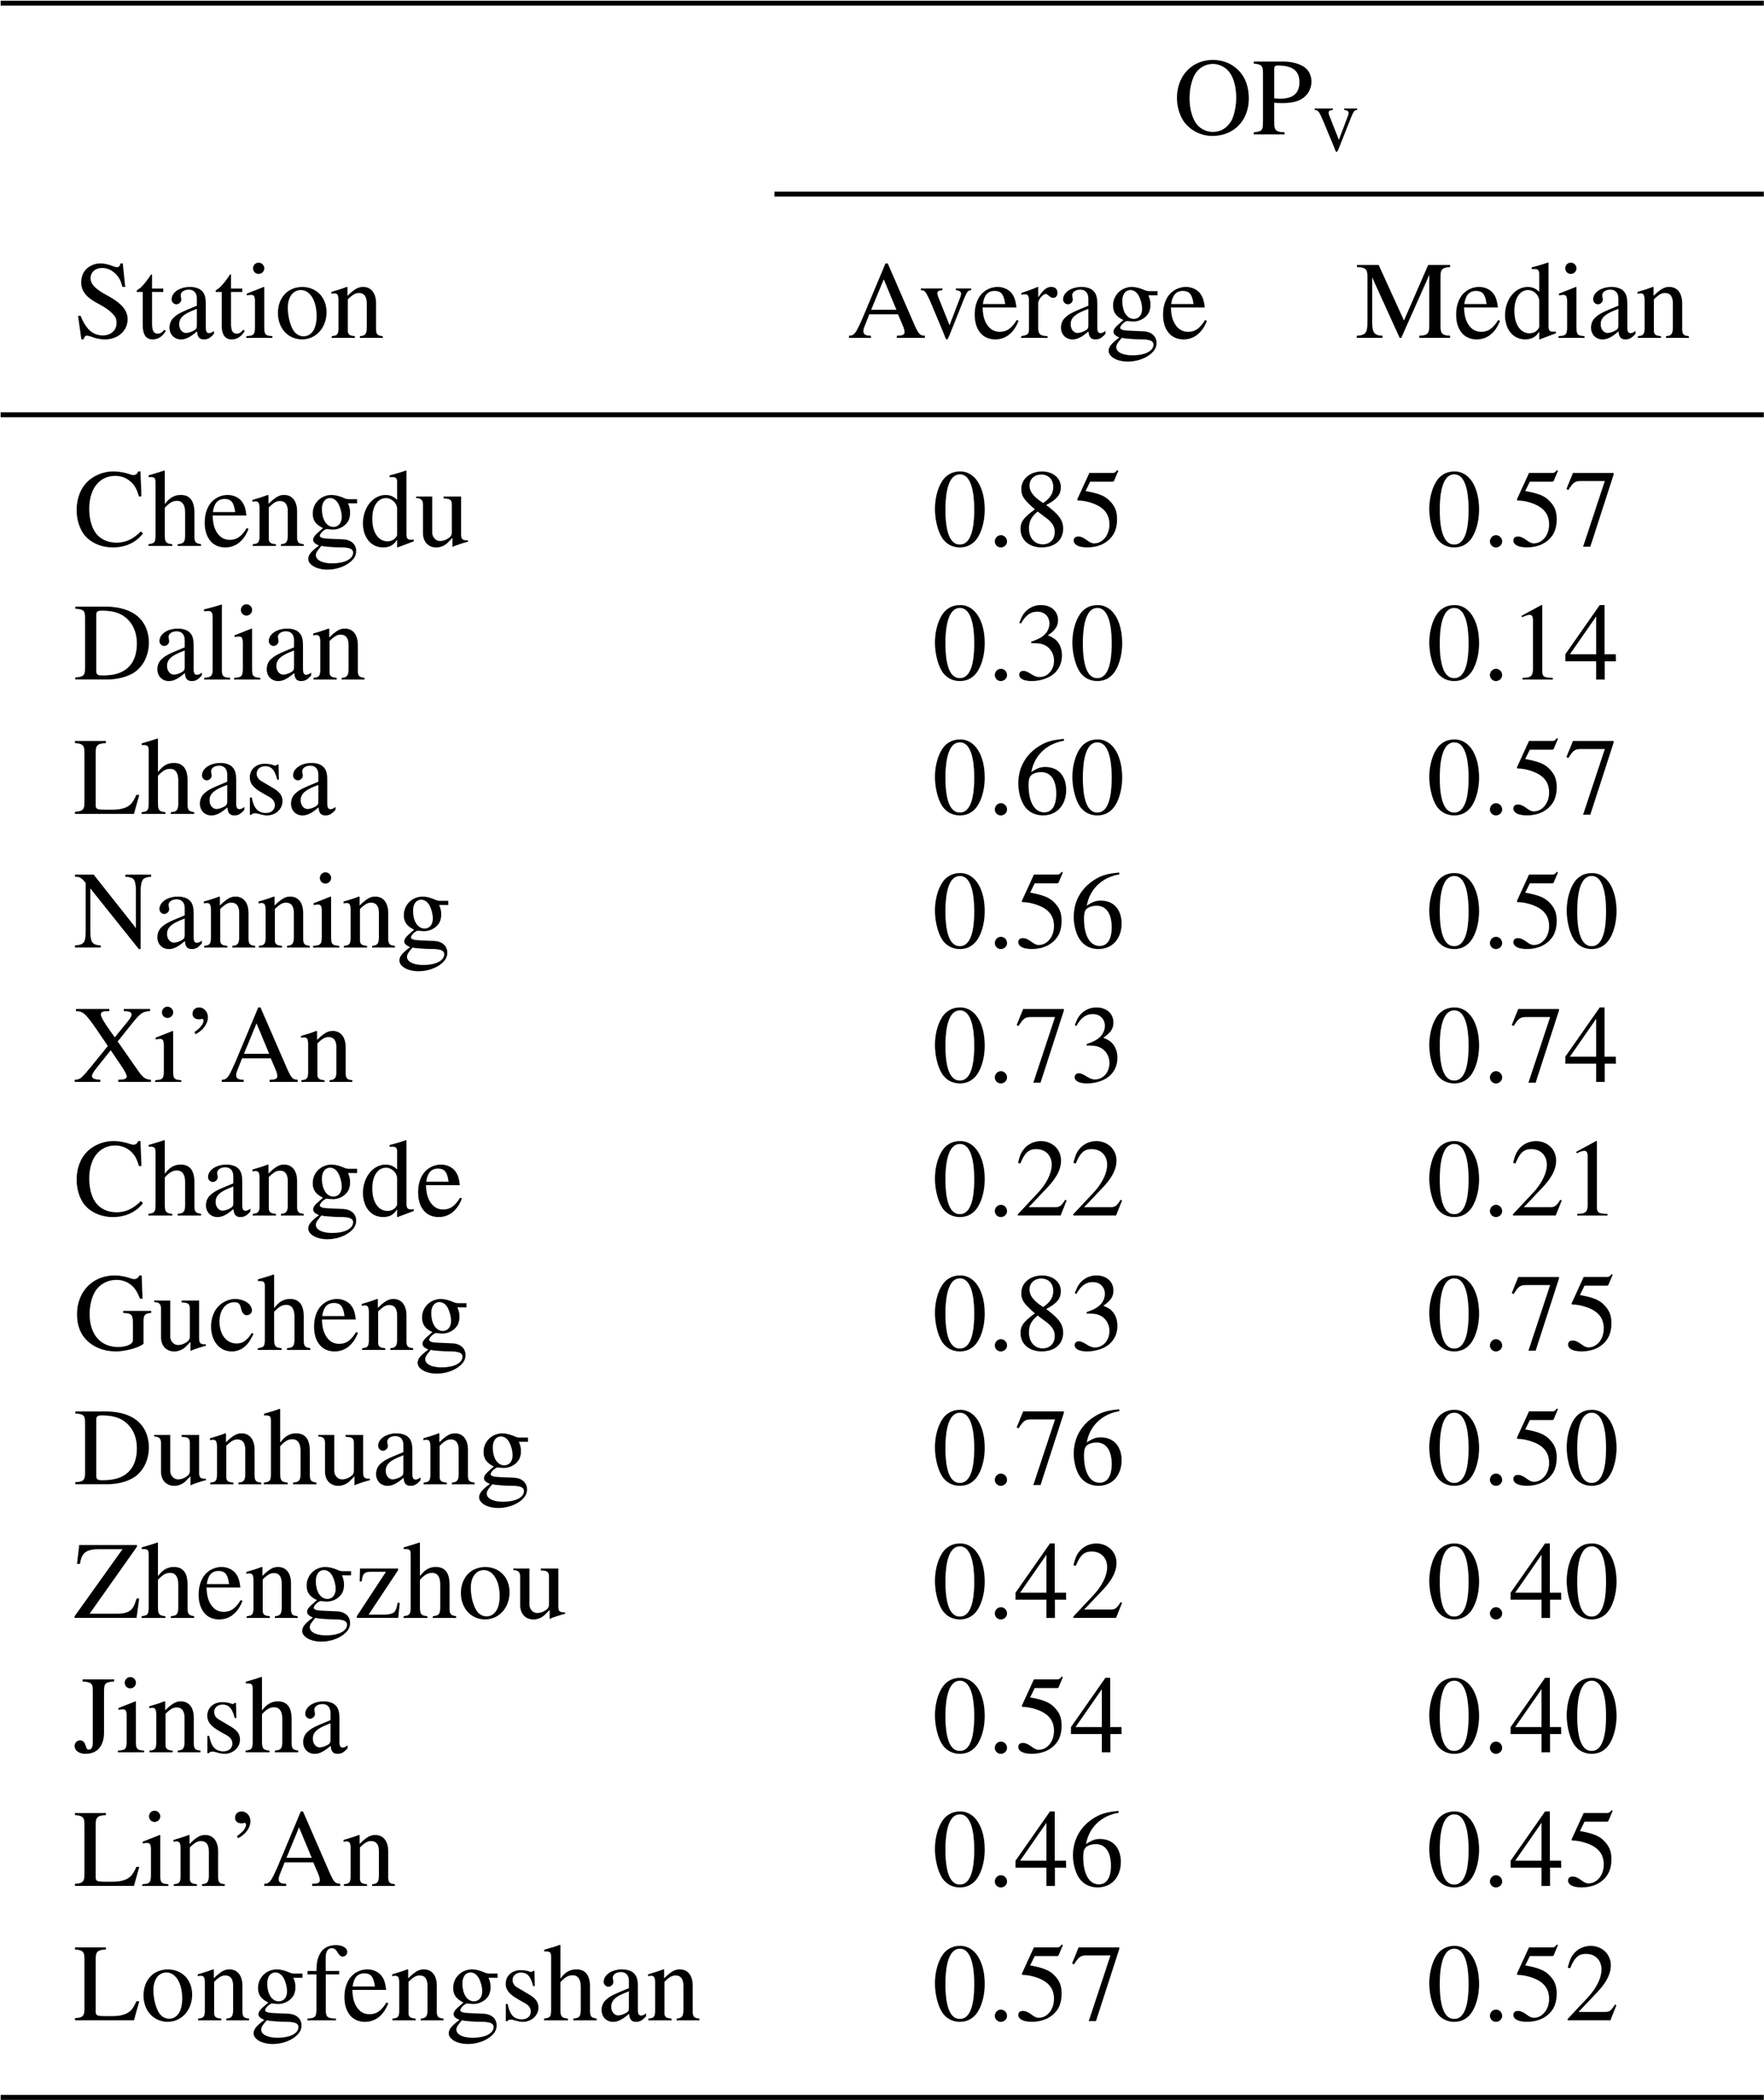
As shown in Fig. 7, OP measurements conducted at twelve different sampling sites across China from June 2022 to May 2023 revealed significant temporal and spatial variability in OPv. Further analysis revealed a strong correlation between OPv and the degree of urbanization at the sampling sites. Table 5 indicates that during the sampling period, the urban site in Chengdu had significantly higher OPv levels compared to the other sites, while the rural site in CHD had the lowest OPv levels. However, the study revealed unexpectedly high average OPv levels at the rural site in GC, ranking second highest among all sites. This finding is consistent with the high PM10 mass concentrations observed at this site, suggesting a strong correlation between particulate matter loading and OPv levels. GC, located in the Beijing-Tianjin-Hebei region characterized by high population density and typical pollution concentration, experiences elevated OPv levels likely due to the combined influence of high PM10 concentrations, pollutant transport from surrounding urban areas, and local emissions (Han et al., 2015). In contrast, the urban site in DL demonstrated relatively low average OPv levels, ranking second lowest. This phenomenon may be attributed to the coastal location of DL, which benefits from strong marine air mass modulation and favorable atmospheric dispersion conditions (Meng et al., 2019), resulting in comparatively lower OPv levels.
As shown in Fig. 7a and b, sites located in northern China exhibited significantly elevated PM10 concentrations and OPv levels during the autumn and winter seasons. This phenomenon in northern Chinese sites can be attributed to several factors unique to northern China's regional characteristics. Firstly, the widespread reliance on coal-based central heating systems and biomass burning for residential heating in northern China during the heating season (typically from November to March) (Liu et al., 2017b; Li et al., 2017) sharply contrasts with southern China where heating demand is minimal due to milder winter temperatures. In addition, northern China's continental climate creates more severe winter meteorological conditions, including prolonged periods of low wind speeds, frequent temperature inversions, and significantly reduced atmospheric boundary layer heights compared to the more temperate conditions in southern regions, which severely inhibited pollutant dispersion (Li et al., 2017). Despite lower levels of urbanization in rural areas, PM10 concentrations were comparable to urban areas due to the widespread use of solid fuels (Li et al., 2014). Figure 7b shows that nine of the twelve sites had lower OPv values in summer. This may be due to more frequent rainfall, which reduces PM10 concentrations and subsequently leads to lower OPv levels. However, sites such as LS and CD maintained relatively high OPv levels during the summer. This phenomenon may be related to the enhanced of photochemical reactions during summer, especially under conditions of high temperature and strong solar radiation, resulting in a significant increase in secondary organic aerosol (SOA) formation (Zhou et al., 2019; Saffari et al., 2014). In particular, Lhasa's high-altitude location, characterized by minimal precipitation and intense solar radiation, further promoted photochemical reactions, resulting in elevated OPv levels.
We observed elevated OPv levels at remote stations (such as LFS, JS, and LA stations) in spring. This phenomenon may be attributed to the minimal influence of anthropogenic pollution sources at remote stations, which typically exhibit more homogeneous mixing states and consequently have relatively lower and more stable OPv levels during other seasons. However, the frequent occurrence of dust storms and increased temperature inversion events during spring can lead to elevated particulate matter concentrations. In addition, the potential metal components carried by dust particles and the formation of secondary aerosols further enhance OPv levels (Saffari et al., 2014), resulting in significantly elevated OPv levels during spring.
Table 5Annual averaged OPv (nmol H2O2 m−3) for PM10 across different regions of China from June 2022 to May 2023.
We conducted a discussion on the differences between northern and southern sites across these 11 stations (excluding LS) in China. The geographical division corresponding to the station is shown in Table S2. The distinction between northern and southern sites and the specific analytical methods are detailed in S2. As shown in Fig. 8a, OPv concentrations in northern regions exhibited higher levels during the winter, primarily due to increased pollutant emissions associated with coal-based heating activities. In contrast, southern regions exhibited peak OPv concentrations in June, possibly due to enhanced photochemical reactions facilitated by stronger solar radiation intensity. However, a significant decrease was observed in July and August, which may be attributed to the increased frequency of precipitation events leading to enhanced wet deposition and the removal of particulate matter. Figure 8b shows that the annual mean OPv concentrations in northern regions were significantly higher than those in southern regions (p<0.05). This spatial variation can be attributed to several factors, including lower precipitation rates, frequent dust weather events, and emissions of coal combustion emissions in northern regions.
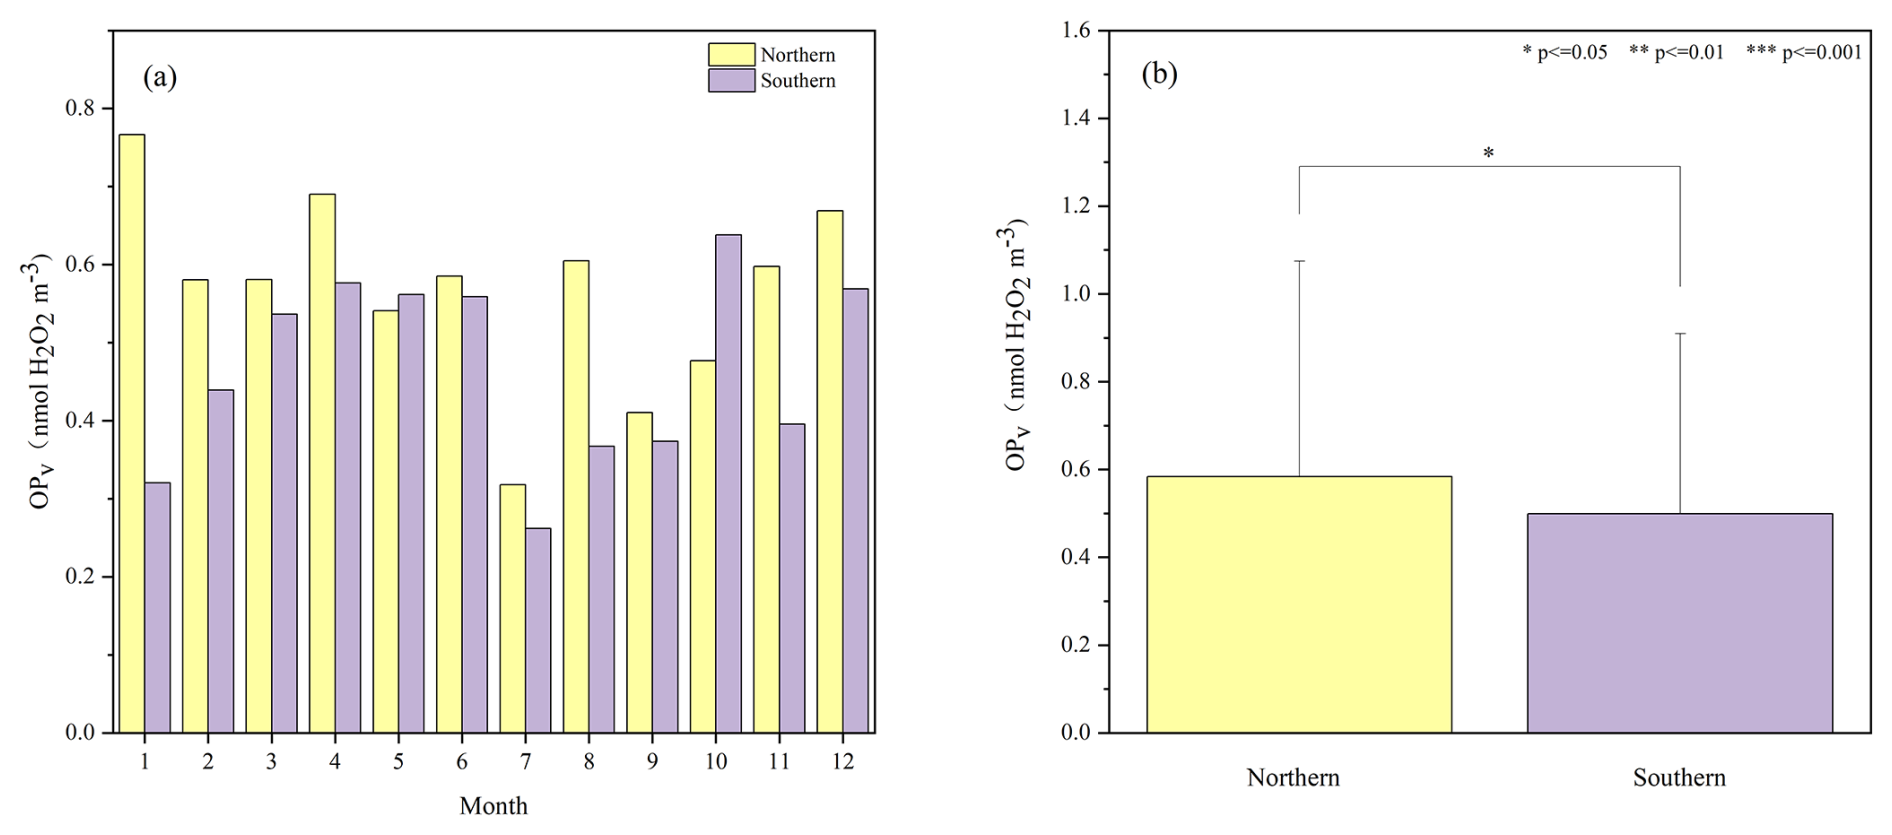
Figure 8Comparison of (a) monthly and (b) annual average OPv between sites in northern and southern China.
3.4 Source apportionment
3.4.1 Source apportionment of PM10
This study employed the PMF model to conduct a detailed analysis of PM10 sources at four representative sites selected based on distinct geographical and environmental characteristics. The selection criteria considered regional representativeness, pollution characteristics, and geographical diversity across China. The selected sites include: NN, an urban site in southern China with coastal proximity; Longfengshan (LFS), a remote site located in the northeastern region of Heilongjiang Province; ZZ, a suburban site serving as a major transportation hub in central China; and GC, a rural site situated in the heavily polluted Beijing-Tianjin-Hebei region. These four sites collectively represent different pollution source characteristics and regional environmental conditions, enabling a comprehensive understanding of PM10 source apportionment across diverse geographical and climatic zones in China. The optimal number of factors for PMF analysis was determined based on values and BS mapping evaluation, as illustrated in Fig. S1 in the Supplement. The PMF results in this study were subjected to BS, DISP, and BS-DISP error estimation analyses. Summary of error estimation diagnostics with PMF at NN, LFS, ZZ and GC stations are shown in Table S3. Results indicate that PM10 in NN likely originates primarily from biomass burning, dust, traffic, secondary aerosols, and sea salt emissions. Sources of PM10 in LFS may include secondary aerosols, traffic, dust, chloride-rich combustion, and agricultural activities. The ZZ site showed secondary aerosols, biomass burning, traffic, coal combustion, dust, and industry as the main sources. PM10 sources in GC are agricultural activities, traffic, biomass burning, secondary aerosols, chloride-rich combustion, dust, and coal combustion. Figure 9 summarizes the distribution of PM10 mass concentrations among the major sources at the four sites.
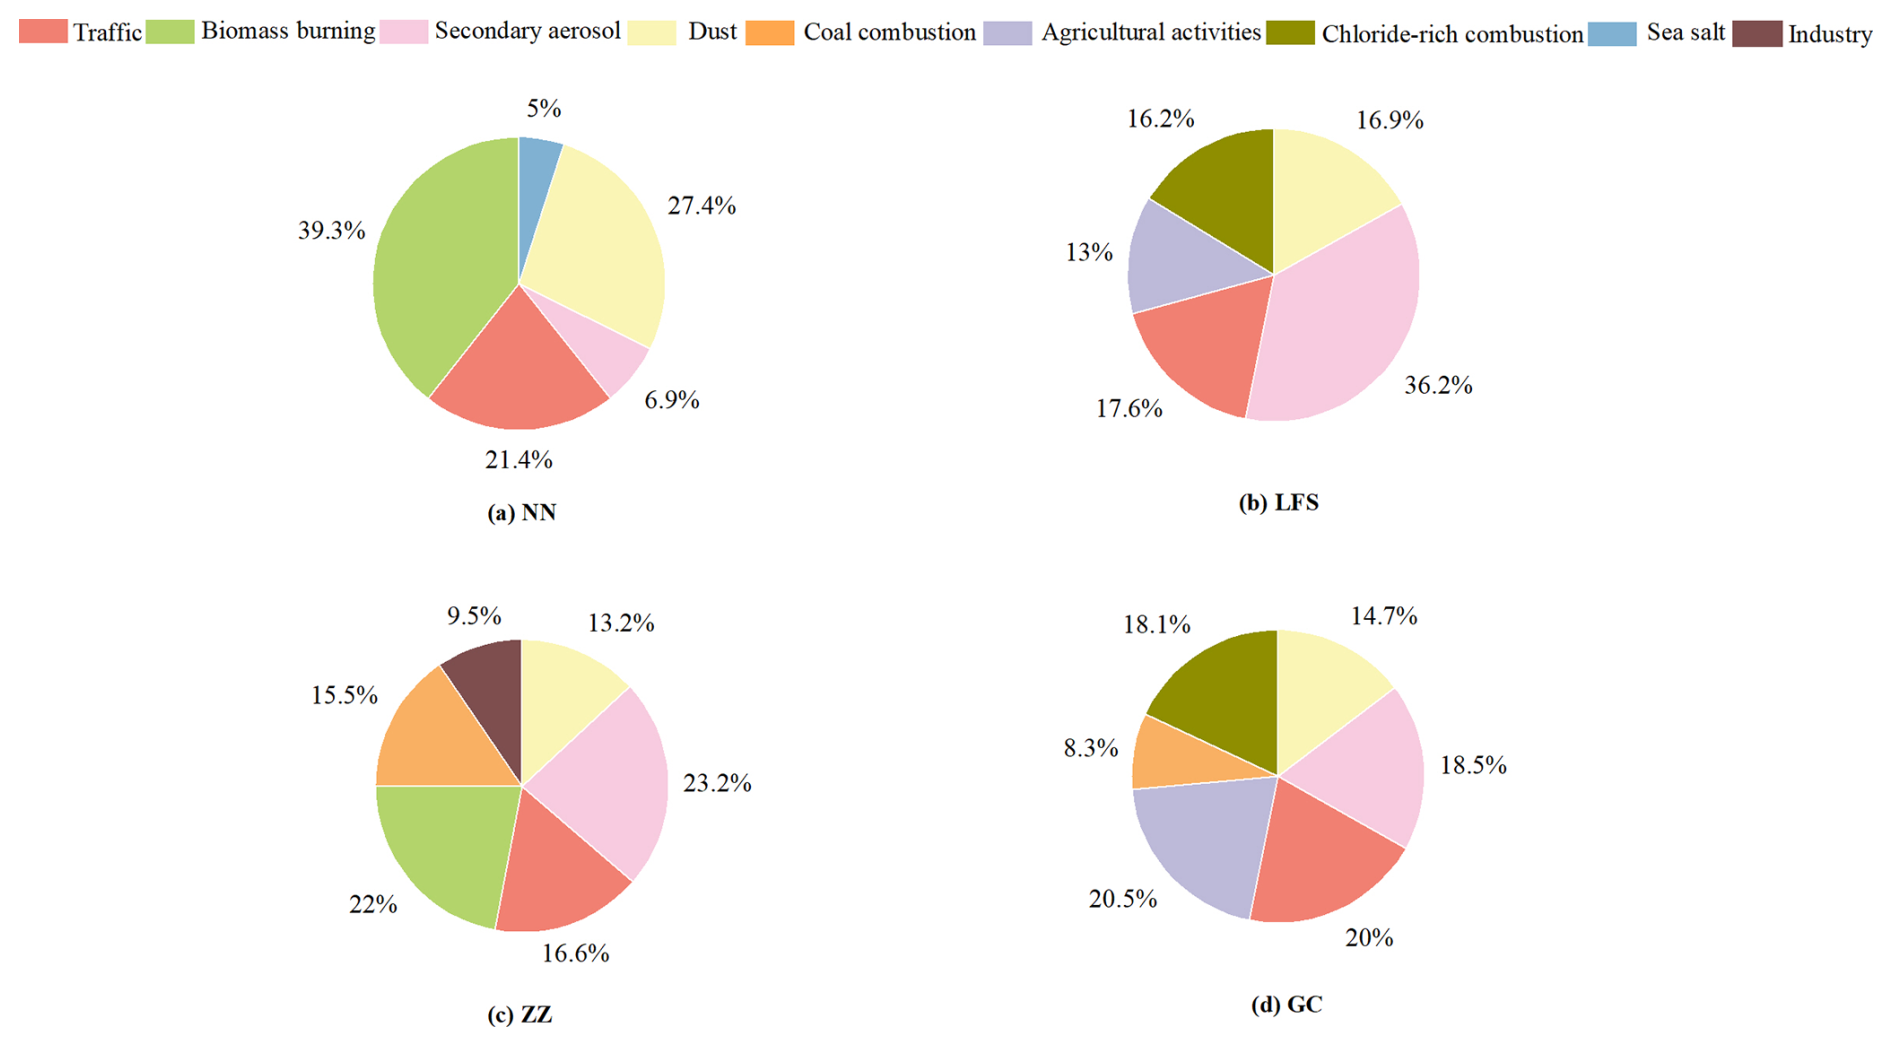
Figure 9The contributions of Traffic, Biomass burning, Secondary aerosol, Dust, Coal combustion, Agricultural activities, Chloride-rich combustion, Sea salt, and Industry to the atmospheric concentration of PM10 mass (%) as derived by PMF modelling at NN, LFS, ZZ, and GC.
As a typical urban site, the PM10 source apportionment results at the NN site indicate that biomass burning, dust, and traffic are likely the main contributors, accounting for 39.3 %, 27.4 %, and 21.4 % of total sources, respectively. As shown in Fig. 10, the first factor contained high levels of Cl− (76.9 %), Mg2+ (27.6 %), and Na+ (14.3 %), elements typically associated with sea salt (Viana et al., 2008), contributing approximately 5 % to PM10. Sea salt as a source of PM10 in NN likely enters urban areas primarily through coastal air mass transport. NN is about 110 kilometers from the Beibu Gulf, and when prevailing southerly winds occur, sea salt aerosols from the South China Sea may migrate to inland cities through atmospheric circulation. The second factor contained high levels of Na+ (66.7 %), Ca2+(48.1 %) and Mg2+ (17.5 %), contributing approximately 26 % to PM10. This likely represents dust sources (Sharma et al., 2016), indicating that human activities such as urban construction may have some impact on particulate emissions. The third factor had high levels of (84.2 %), (45.7 %), and (44.4 %), contributing approximately 6.9 % to PM10, possibly representing secondary aerosols. This suggests that the process of gaseous precursors (such as SO2, NOx, and VOCs) in the atmosphere forming secondary particles through photochemical reactions may have a certain impact on PM10 concentrations (Yue et al., 2015). The fourth factor contained high levels of Mg2+ (54.8 %), EC (50.7 %) and OC (38.2 %), contributing approximately 20.2 % to PM10, possibly related to traffic. EC and OC have long been considered the main tracer elements for traffic emission sources, particularly vehicle exhaust emissions (Saarikoski et al., 2008; Sowlat et al., 2016; Esmaeilirad et al., 2020). Research has shown that Mg is one of the elements present in high concentrations in brake pad materials. Mg is typically used as a filler material in brake pads, and along with Fe, Ba and Cu, serves as a characteristic element of brake wear (Mckenzie et al., 2009). At the NN urban site, which is heavily influenced by traffic, brake wear is likely the primary source of these elements. The fifth factor had high levels of K+ (74.9 %), OC (37.2 %), and EC (35.1 %), substances typically associated with biomass burning (Stracquadanio et al., 2019). This factor made a significant contribution to urban PM10 in NN, approximately 39.3 %, indicating that biomass burning may be one of the important sources of atmospheric particulate pollution in NN. Although the observation point is located in the urban area of NN, which may be at some distance from areas where straw burning occurs, studies have shown that particulate matter produced by biomass burning may undergo long-distance transport (Uranishi et al., 2019).
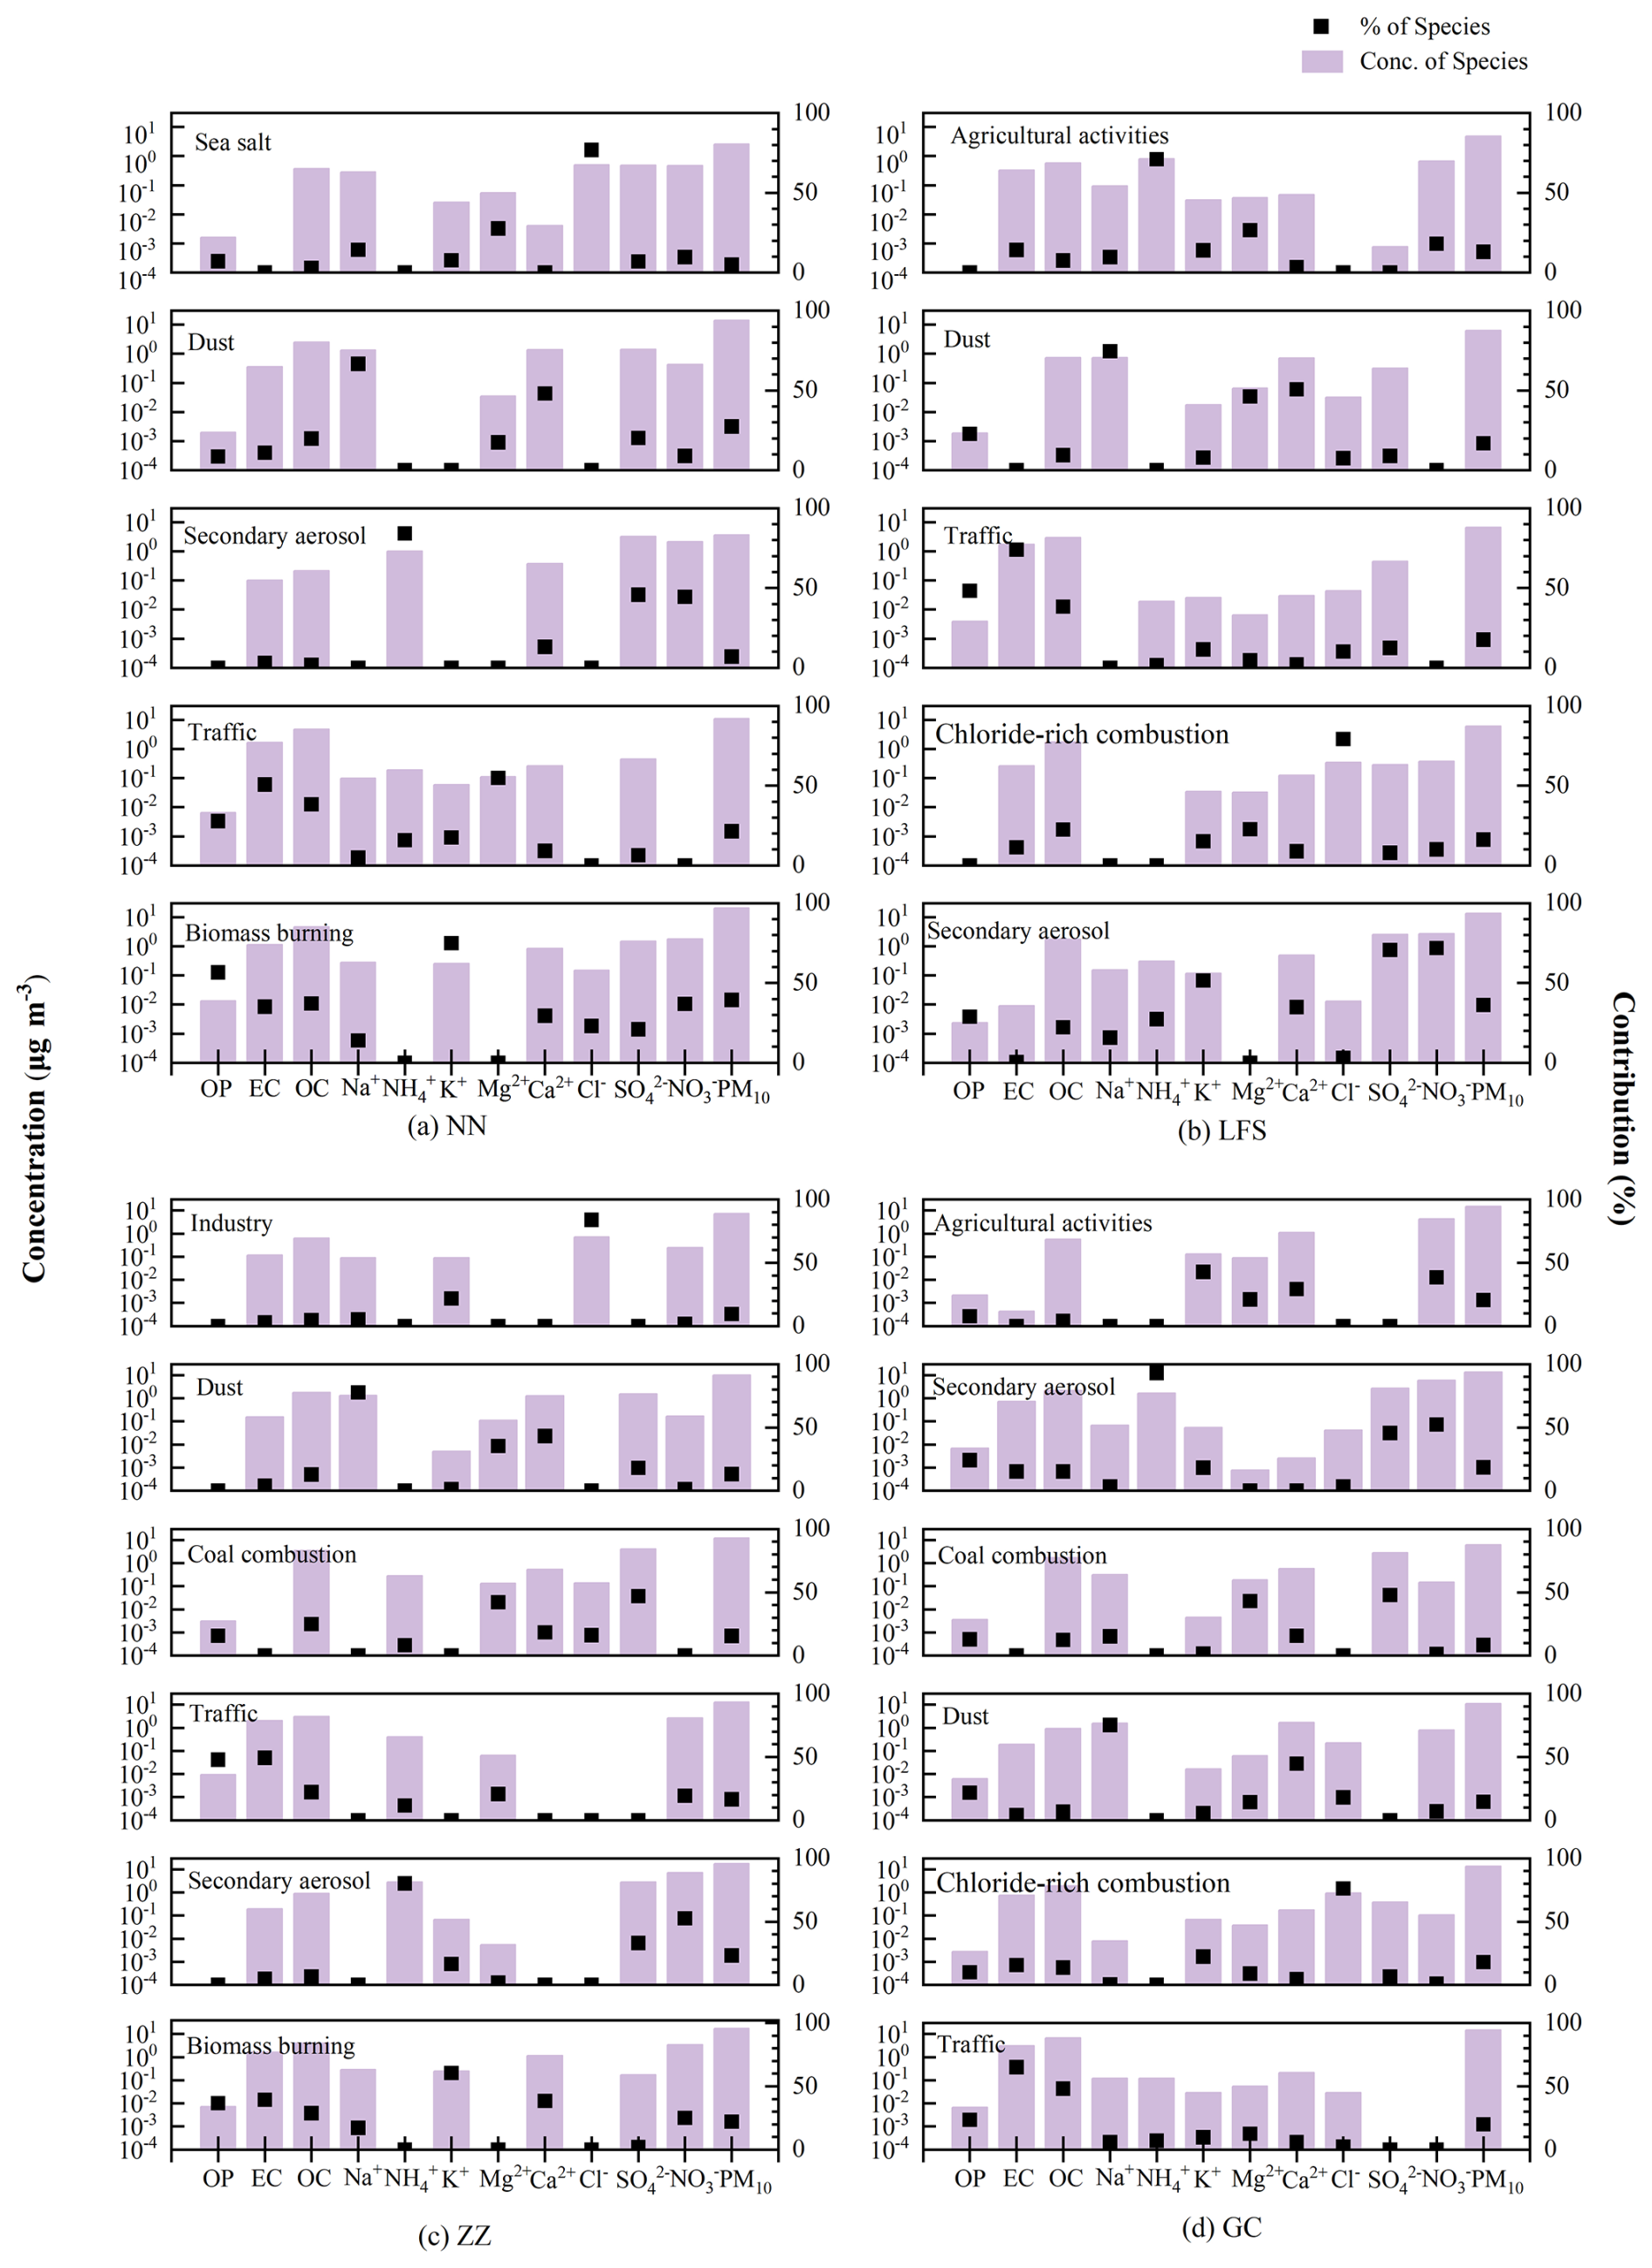
Figure 10Chemical profiles of the source factors identified at NN, LFS, ZZ and GC. The bars represent the chemical composition profiles (left y axis) and the dots indicate the contribution values (right y axis).
The PM10 source apportionment results for LFS indicate that secondary aerosols may be the main contributor, accounting for 36.2 % of total sources. Source analysis identified five potential major factors: In the first factor, (71.0 %), Mg2+ (26.5 %), and (18.0 %) were present in high concentrations. and are the main nitrogen components in agricultural fertilizers (Cao et al., 2018), while Mg2+ is commonly added to fertilizers as a supplementary element (Sun et al., 2018). This factor may be related to agricultural activities, particularly fertilizer application processes. The second factor contained high levels of Na+ (74.6 %), Mg2+ (46.2 %), and Ca2+ (50.8 %), elements typically associated with dust sources (Zhang et al., 2014a; Sharma et al., 2016), contributing approximately 16.9 % to PM10. The third factor had high levels of EC (74.0 %) and OC (38.3 %), components typically associated with traffic (Esmaeilirad et al., 2020), contributing approximately 17.6 %. The fourth factor is dominated by Cl− (79.2 %) with concentrations approximately one order of magnitude higher than K+ (22.7 %), indicating a chloride-rich combustion source. This pattern suggests combustion of chloride-containing materials or waste burning, which can produce elevated chloride emissions. The fifth factor had high levels of (70.7 %) and (71.9 %), with (27.3 %) also making a considerable contribution, these components are typically associated with secondary aerosol formation processes (Yue et al., 2015).
ZZ is located in a suburban area, and the diversity of its PM10 sources may reflect the complex environmental characteristics of this region. Source apportionment results suggest that there may be six major pollution sources in this area, with their respective contribution proportions as follows: The first factor had high contribution of K+ (21.7 %) and Cl− (83.9 %), but low contribution of OC (4.6 %) and EC (2.8 %), possibly indicating the influence of industrial emissions, such as food manufacturing, cement manufacturing, salt production, or industrial activities involving potassium chloride compounds (Yin et al., 2019; Seo et al., 2019), with a contribution proportion of approximately 9.5 %.The second factor contained high levels of Na+ (77.6 %), Mg2+ (35.3 %), and Ca2+ (43.2 %), elements typically associated with dust sources (Sharma et al., 2016), contributing approximately 13.2 % to PM10. In the third factor, Mg2+ (42.1 %) and (46.9 %) had relatively high concentrations. Since primarily originates from fuel combustion (Schwartz, 1993), and Mg is specifically mentioned as an element enriched in the magnetic separation of coal fly ash (Strzałkowska, 2021), this factor is associated with emissions from coal combustion when regional characteristics are considered. Coal combustion accounts for around 15.5 % of PM10 emissions and is likely to be associated with combined heat and power facilities in the surrounding area. The fourth factor had high levels of EC (49.2 %) and OC (22.1 %), components typically associated with traffic (Esmaeilirad et al., 2020), contributing approximately 16.6 %. The fifth factor contained high levels of (80.1 %), (33.0 %), and (52.6 %), components typically associated with secondary aerosol formation processes (Yue et al., 2015), accounting for approximately 23.2 % of total PM10 sources. The sixth factor had high levels of K+ (60.6 %), EC (39.3 %), Ca2+ (38.4 %), and OC (28.8 %), contributing approximately 22 % to PM10. K+, EC, and OC are tracers for biomass burning emissions (Stracquadanio et al., 2019). Given ZZ's location in a suburban of Zhengzhou, this factor likely represents crop residue burning and residential biomass combustion common in central China's agricultural regions.
The PM10 source apportionment results for the GC show that agricultural activities, traffic emissions, secondary aerosols, and Chloride-rich combustion are the main contributors, accounting for 20.5 %, 20 %, 18.5 %, and 18.1 % of total sources, respectively. The factor with K+ (42.7 %), (38.4 %), and Ca2+ (29.2 %) as primary characteristic species may be related to agricultural activities, accounting for 20.5 %. This likely reflects the contribution of corn, wheat, and other farming activities around the site to PM10, potentially associated with the agricultural-dominant economic structure of this rural area. Ca2+ and may originate from agricultural soil dust during tillage and other agricultural processes, and could be related to fertilizer application (Yu and Cao, 2023; Cao et al., 2018). Similar to the ZZ site, this agricultural source attribution is supported by Jung et al., who found elevated K+ concentrations at schools near corn farms (Jung et al., 2024). The factor characterized by EC (65.1 %) and OC (48.1 %) likely comes from traffic (Esmaeilirad et al., 2020), representing the second-largest contributor to PM10 at 20 %. This indicates that transportation activities in rural areas may have a significant impact on PM10 concentrations. The GC is relatively close to National Highway 107, and traffic emissions from the highway may contribute to the site's PM10 concentration through transport. Additionally, the increasing vehicle ownership in rural areas may be a contributing factor. Secondary aerosols, characterized by (93.0 %), (45.6 %), and (52.3 %), account for 18.5 %, indicating the important role of atmospheric secondary transformation processes in PM10 formation in this region (Yue et al., 2015). The fourth factor characterized by Cl− (76.2 %) represents chloride-rich combustion, accounting for 18.1 %. Similar to LFS, this factor is dominated by Cl− with concentrations, indicating a specific chloride-rich combustion source. The factor characterized by Na+ (75.2 %) and Ca2+ (44.6 %) may be related to dust (Sharma et al., 2016), accounting for 14.7 %, potentially reflecting the impact of agricultural cultivation and road dust on PM10. The factor characterized by Mg2+ (43.0 %) and (47.8 %) may be related to coal combustion emissions, accounting for 8.3 %. This suggests that industrial activities and residential coal use in rural areas may have some impact on PM10, especially during the winter heating season when such emissions may become more prominent.
The contrasting loadings in the agricultural activities factor between the suburban ZZ site and rural GC site reveal important insights into the spatial heterogeneity of agricultural emissions. The suburban ZZ site, located in the intensively cultivated Central Plains, experiences higher carbonaceous aerosol loadings from mechanized farming operations, which contribute significantly to EC emissions through diesel exhaust from agricultural machinery (Liu et al., 2018). In contrast, the rural GC site in Baoding represents areas with traditional, less mechanized farming practices, resulting in minimal EC contributions from agricultural activities.
A notable pattern observed among the two sites with agricultural activities (LFS and GC) is the differential contribution of within agricultural emission factors, with being exclusively associated with agricultural activities at the LFS site. This spatial variation reflects the complex interplay between regional meteorological conditions, agricultural practices, and atmospheric chemistry processes. At the LFS site in northeastern China, cooler climate conditions favor the stability of particulate , allowing its direct retention within agricultural emission factors (Wang et al., 2020). The concentrated fertilizer application during the spring planting season, combined with lower ambient temperatures that minimize volatilization, preserves the distinct agricultural source signature at this remote location (Huo et al., 2025). Conversely, at the warmer GC site in central and northern China, undergoes more extensive atmospheric processing due to higher ambient temperatures. These conditions promote the volatilization of to gaseous NH3, which subsequently undergoes secondary reactions with acidic species ( and ) to form ammonium-containing secondary aerosols (Stelson and Seinfeld, 1982; Wang et al., 2015).
3.4.2 Source apportionment of OP in PM10
In this study, the PMF model was applied to identify the sources of OPv in PM10 samples collected from four sites. As indicated in Fig. 11, the comparison of OPm across different pollution sources offered insights into the differential toxic efficiencies of these sources. Through comparison of OPm across different pollution sources, insights into the differential toxic efficiencies of various sources were obtained.
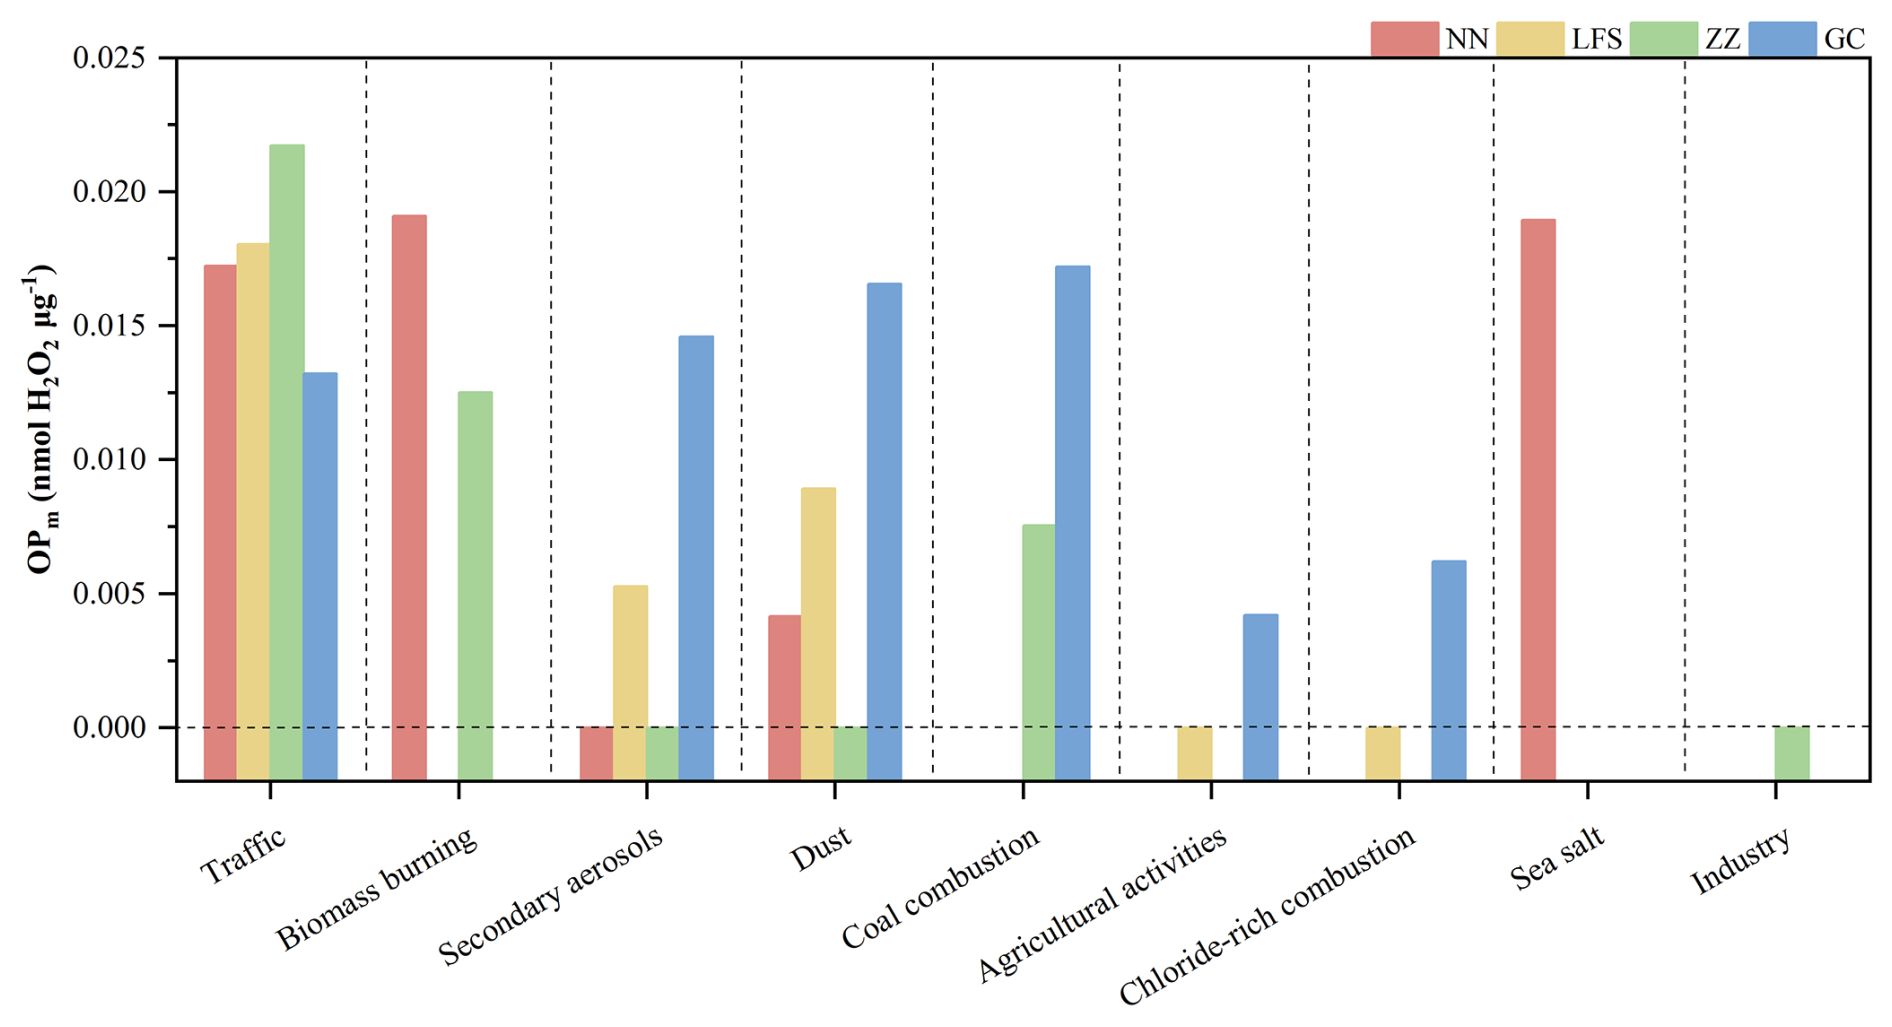
Figure 11Comparison of OPm contributions from different emission sources across NN, LFS, ZZ and GC sites.
Traffic
Traffic emission is a common important contributing source to OP at the four sites NN, LFS, ZZ and GC. The high OP of traffic emissions is mainly attributed to the oxidative components in their particulate matter emissions, including organic carbon as well as potentially present PAHs and transition metals (TMs) (Valavanidis et al., 2008). Traffic sources showed high OPm (0.013–0.022 nmol H2O2 µg−1) at all monitoring sites, indicating that the particulate matter they generate has significant toxic efficiency. The high oxidative activity of traffic-emitted particulate matter may be related to its complex chemical composition. PAHs emitted from traffic sources can form quinone compounds and other oxygen-containing organic compounds, which can promote reactive oxygen species generation through redox reactions (Nielsen, 1996; Libalova et al., 2018).
Biomass burning
Biomass burning sources were highly detected to contribute to OP at NN and ZZ sites, with OPm of 0.019 and 0.012 nmol H2O2 µg−1, respectively. This is closely related to the frequent crop straw burning activities in the region. Particulate matter emitted from biomass burning has complex chemical compositions, and its OP primarily originates from various organic compounds produced during the combustion process. Biomass burning produces substantial amounts of PAHs, which can form quinone intermediates, subsequently participating in ROS generation processes (Zhu et al., 2024; Libalova et al., 2018). The biomass burning process also releases water-soluble organic carbon (WSOC), which contains humic-like substances (HULIS) with significant oxidative activity (Yan et al., 2015; Salma et al., 2010). These macromolecular organic compounds contain abundant functional groups such as hydroxyl, carbonyl, and carboxyl groups, which can generate reactive oxygen species like hydroxyl radicals and hydrogen peroxide through photochemical reactions and metal-catalyzed reactions (Verma et al., 2015; Lin and Yu, 2011).
Secondary aerosols
Secondary aerosols exhibited distinctly different patterns at different sites. At the LFS and GC sites, OPm values of secondary aerosols are 0.005 and 0.014 nmol H2O2 µg−1, respectively, while the OP contributions of secondary aerosols were completely absent at NN and ZZ sites. PMF analysis revealed that OC at NN and ZZ sites was dominated by primary emissions with negligible SOA contributions, explaining their zero OP values. The photochemical oxidation of volatile organic compounds (VOCs) generates redox-active products (aldehydes, ketones, peroxides) that contribute to aerosol OP through ROS generation (Kong et al., 2023; Chen et al., 2022; Wei et al., 2022; Lin and Yu, 2011). The absence of secondary aerosol OP at NN and ZZ sites reflects their PMF-resolved source profiles: these sites were characterized by primary sources with low oxidation states, indicating limited photochemical processing.
Dust
The minerals contained in dust can participate in the ROS generation process (Nishita-Hara et al., 2019; Lodovici and Bigagli, 2011). The OPm values of dust at NN, LFS, and GC, are 0.004, 0.009, and 0.016 nmol H2O2 µg−1, respectively. The dust source at the GC site exhibited the highest toxic efficiency, which may be attributed to its location in the highly industrialized Beijing-Tianjin-Hebei region, resulting in elevated TMs emissions (Li et al., 2022). Notably, the dust source at the ZZ site contributed zero to the OP, suggesting the possible presence of chemically inert mineral phases in this region. This absence of oxidative activity may be attributed to limited TMs content in the local soil and the unique chemical characteristics of dust particles. The oxidative activity of dust particles is primarily associated with their complex mineral composition and surface chemical properties. Specifically, iron-containing minerals can catalyze ROS formation through Fenton reactions, while clay minerals provide large specific surface areas that facilitate metal ion adsorption and subsequent redox reactions (Saffari et al., 2014; Guo et al., 2020; Liu et al., 2022). Due to differences in geological background, dust from different regions exhibits significant variations in mineral composition, leading to differences in their oxidative activity (Gonçalves Ageitos et al., 2023; Jeong, 2024; Nishita-Hara et al., 2023). Furthermore, quartz particles demonstrate certain oxidative activity through surface catalytic reactions, with surface silanol groups and defect sites promoting the generation of •OH (Konecny et al., 2001).
Coal combustion
PM emitted from coal combustion may contain numerous TMs and PAHs, which can promote ROS generation through pathways such as the Fenton reaction, thereby enhancing the OP of the particles (Pardo et al., 2020). Notably, coal combustion sources exhibit significant differences in OPm contributions at the ZZ and GC sites (0.008 and 0.017 nmol H2O2 µg−1, respectively). This disparity in mass-specific toxicity may reflect variations in coal types or pollution control technologies across different regions, ultimately influencing the chemical composition and toxicological characteristics of the emitted particles. The organic carbon fraction of coal combustion emissions contains substantial amounts of oxygenated organic compounds, such as aldehydes and ketones, which can directly participate in oxidative stress reactions or act as precursors for generating stronger oxidants (Wang et al., 2023b). Different coal types produce particles with distinct oxidative properties. For instance, lignite combustion, due to its higher volatile matter content, tends to generate more organic compounds, resulting in relatively higher oxidative activity (Martens et al., 2021). Combustion technologies and pollution control measures also significantly influence the OP of coal-derived particles. Modern coal-fired power plants equipped with desulfurization (FGD), denitrification (), and particulate removal systems can effectively reduce certain redox-active components, thereby lowering the toxic efficiency of the emitted particles (Tao et al., 2020; Asif et al., 2022). The observed differences in oxidative activity between the ZZ and GC sites may be closely linked to local coal quality, combustion facility technologies, and the implementation level of environmental protection measures.
Agricultural activity
The OP of agricultural activities was only detected at the GC site, with OPm of 0.004 nmol H2O2 µg−1, while no OP contribution from agricultural activities was observed at the LFS site. PMF analysis showed contrasting patterns: agricultural factors at LFS were dominated by while GC showed minimal contributions. At LFS, the predominance of in agricultural factors likely forms stable ammonium salts that neutralize particle acidity and reduce redox activity. In contrast, the lower at GC may allow agricultural particles to maintain higher acidity and preserve the redox activity of trace metal components or organic matter (Tong et al., 2017; Wei et al., 2022). The presence of can alter particle pH and ionic strength, affecting the solubility and reactivity of redox-active species (Zhang et al., 2021, 2025).
Chloride-rich combustion
The OP of chloride-rich combustion was only detected at the GC site, with an OPm of 0.006 nmol H2O2 µg−1, while no OP was observed at the LFS site. This difference may be mainly attributed to the different pollution source characteristics and geographical locations of the two sites. The GC site is located in the Beijing-Tianjin-Hebei atmospheric pollution transport corridor and, as an industrial agglomeration area, the chlorine-rich combustion processes may be accompanied by co-emission or formation of more transition metals and other catalytically active components (Li et al., 2022). These metal ions can catalyze the generation of ROS through Fenton reactions and other pathways, thereby possibly exhibiting significant OP (Saffari et al., 2014; Guo et al., 2020). In contrast, LFS as a remote site may lack catalytically active metal components, and therefore showed no detectable OP.
Sea salt
Although NN is located inland, it is influenced by air masses originating from the South China Sea, enabling long-range transport of sea salt aerosols that affect local atmospheric OP. Halogen compounds (e.g., Cl−, Br−) in sea salt can catalyze the generation of radicals such as •OH and Cl•, thereby participating in atmospheric oxidation processes (Cao et al., 2024; Knipping et al., 2000). At the NN site, the OPm of sea salt aerosols was measured at 0.016 nmol H2O2 µg−1.
Industry
The PMF results revealed that industrial emissions at ZZ were dominated by Cl− and K+ with negligible contributions from OC and EC. OC typically serves as the primary contributor to particle oxidative activity through redox-active organic species, including quinones and phenolic compounds that can participate in electron transfer reactions and generate ROS (Libalova et al., 2018; Jiang and Jang, 2018). The absence of organic carbon compounds provides a mechanistic explanation for the zero OP observed in this source profile.
This study utilized a comprehensive approach to analyze the characteristics and sources of PM10 and its OP at 12 representative sites in China. The main findings are summarized as follows:
-
Performance of CNN-LSTM deep learning model
The CNN-LSTM deep learning model exhibited robust performance in reconstructing missing data for PM10 mass concentrations and outliers in chemical components. The model achieved R2 values of 0.9670 and 0.8840 for the training and testing sets, respectively. These results highlight the potential of the model to address missing data issues in PM10 research.
-
Spatiotemporal variations in PM10 and OP levels
PM10 and OP concentrations showed remarkable spatial and temporal variations:
-
PM10 concentrations were relatively higher in XA and DH in the northwestern region, while lower in LFS and DL in the northeastern region.
-
Suburban sites generally exhibited higher PM10 concentrations compared to other site types.
-
OP levels were relatively higher in CD and GC, with urban sites having higher OPv values than other sites.
-
Annual average PM10 concentrations in northern regions were typically higher than in southern regions.
-
Seasonally, PM10 and OP levels were higher in winter and lower in summer, suggesting the potential benefits of implementing targeted control measures during high-risk periods to mitigate adverse health impacts.
-
-
PM10 source apportionment
Source apportionment using PMF indicated that dust (13.2 %–27.4 %), secondary aerosols (6.9 %–36.2 %), traffic (16.6 %–21.4 %), and biomass burning (22 %–39.3 %) were likely the main contributing sources to PM10 mass concentrations at the study sites. Understanding the contributions of these sources is crucial for developing more effective PM10 reduction strategies.
-
OP source analysis
OPm analysis revealed significant spatial variations in toxic efficiency across different sources. Traffic sources demonstrated consistently high OPm values (0.013–0.022 nmol H2O2 µg−1) across all four sampling sites, while biomass burning exhibited elevated OPm at NN and ZZ sites (0.012 and 0.019 nmol H2O2 µg−1, respectively). Coal combustion also showed high OPm values at both ZZ and GC sites (0.008 and 0.017 nmol H2O2 µg−1, respectively), indicating the substantial toxic efficiency of particulate matter from these three major sources. Other sources displayed notable regional variations. Secondary aerosols contributed zero OP at NN and ZZ sites, likely due to local VOC emission patterns and oxidation processes. Dust sources showed zero contribution at ZZ, potentially related to the inherent composition of local dust particles. Agricultural activities exhibited zero OP at LFS, possibly due to neutralization effects that reduced redox activity. At GC, chloride-rich combustion demonstrated OP contribution (0.006 nmol H2O2 µg−1), likely attributed to elevated TMs emissions in Beijing-Tianjin-Hebei region that promote ROS formation. Sea salt aerosols at NN showed an OPm of 0.016 nmol H2O2 µg−1, which was attributed to the catalytic effect of halogen compounds on ROS. In contrast, industrial emissions at ZZ exhibited zero OP due to minimal organic carbon content.
The study results underscore the importance of identifying and quantifying OP sources to assess and mitigate health risks associated with PM10 exposure. The source apportionment findings suggest that emission reduction measures targeting traffic, biomass burning, and coal combustion may help lower OP levels and protect public health. This research employed deep learning techniques to analyze the spatiotemporal distribution characteristics, source apportionment, and influencing factors of PM10 and its OP in different typical regions of China from multiple perspectives. The findings provide a scientific basis for better understanding the causes of PM10 pollution, formulating control strategies, and mitigating health risks. Future studies should focus on further investigating the identification and health risk assessment of toxic and harmful components in PM10, exploring the toxicological mechanisms of OP, and developing integrated indicators that combine chemical components and toxicity for characterizing and evaluating PM10 pollution.
The software code is available upon request.
The data used in this study are available on the Zenodo data repository platform at https://doi.org/10.5281/zenodo.15420768 (Cai et al., 2025).
The supplement related to this article is available online at https://doi.org/10.5194/acp-25-14643-2025-supplement.
QC: Software, Writing – original draft preparation. DF and JJ: Data curation, Conceptualization, Writing – review and editing. XH: Management of OP measurements. YC: Methodology, Investigation. TZ and YB: Software, Methodology. YZ: Conceptualization, Writing – review and editing.
The contact author has declared that none of the authors has any competing interests.
Publisher's note: Copernicus Publications remains neutral with regard to jurisdictional claims made in the text, published maps, institutional affiliations, or any other geographical representation in this paper. While Copernicus Publications makes every effort to include appropriate place names, the final responsibility lies with the authors. Views expressed in the text are those of the authors and do not necessarily reflect the views of the publisher.
The authors are grateful to the study participants and field staff in the twelve stations of the CMA Atmosphere Watch Network (CAWNET).
This work was supported by the Foundation of CMA Field Scientific Experiment Base of Akdala Atmospheric Background (grant no. AKDL202413), the Foundation of CMA Meteorological Observation Center (grant no. MOCQN202409), the National Natural Science Foundation of China (grant no. 21677145) and the Fundamental Research Funds for the Central Universities (grant no. E0E48927X2).
This paper was edited by Pablo Saide and reviewed by two anonymous referees.
An, J. Q., Liu, H. B., Wang, X. M., Talifu, D., Abulizi, A., Maihemuti, M., Li, K. J., Bai, H. F., Luo, P., and Xie, X. X.: Oxidative potential of size-segregated particulate matter in the dust-storm impacted Hotan, northwest China, Atmos. Environ., 280, https://doi.org/10.1016/j.atmosenv.2022.119142, 2022.
Antonini, J. M., Clarke, R. W., Murthy, G. G. K., Sreekanthan, P., Jenkins, N., Eagar, T. W., and Brain, J. D.: Freshly generated stainless steel welding fume induces greater lung inflammation in rats as compared to aged fume, Toxicol. Lett., 98, 77–86, https://doi.org/10.1016/s0378-4274(98)00103-9, 1998.
Asif, Z., Chen, Z., Wang, H., and Zhu, Y.: Update on air pollution control strategies for coal-fired power plants, Clean Technol. Environ. Policy, 24, 2329–2347, https://doi.org/10.1007/s10098-022-02328-8, 2022.
Bates, J. T., Fang, T., Verma, V., Zeng, L. H., Weber, R. J., Tolbert, P. E., Abrams, J. Y., Sarnat, S. E., Klein, M., Mulholland, J. A., and Russell, A. G.: Review of Acellular Assays of Ambient Particulate Matter Oxidative Potential: Methods and Relationships with Composition, Sources, and Health Effects, Environ. Sci. Technol., 53, 4003–4019, https://doi.org/10.1021/acs.est.8b03430, 2019.
Borlaza, L. J., Weber, S., Marsal, A., Uzu, G., Jacob, V., Besombes, J.-L., Chatain, M., Conil, S., and Jaffrezo, J.-L.: Nine-year trends of PM10 sources and oxidative potential in a rural background site in France, Atmos. Chem. Phys., 22, 8701–8723, https://doi.org/10.5194/acp-22-8701-2022, 2022.
Cai, Q., Fang, D., Jin, J., Hu, X., Cao, Y., Zhao, T., Bai, Y., and Zhang, Y.: Measurement report: Unraveling PM10 Sources and Oxidative Potential Across Chinese Regions Insights Analysis Based on CNN-LSTM and Receptor Model, Zenodo [data set], https://doi.org/10.5281/zenodo.15420768, 2025.
Cao, L. M., Zhou, Y., Zhang, Z., Sun, W. W., and Chen, W. H.: Impacts of airborne particulate matter and its components on respiratory system health, Chinese journal of preventive medicine, 50, 1114–1118, https://doi.org/10.3760/cma.j.issn.0253-9624.2016.12.018, 2016.
Cao, P., Lu, C., and Yu, Z.: Historical nitrogen fertilizer use in agricultural ecosystems of the contiguous United States during 1850–2015: application rate, timing, and fertilizer types, Earth Syst. Sci. Data, 10, 969–984, https://doi.org/10.5194/essd-10-969-2018, 2018.
Cao, Y. Q., Wang, Z., Liu, J. R., Ma, Q. X., Li, S. Y., Liu, J., Li, H., Zhang, P., Chen, T. Z., Wang, Y. H., Chu, B. W., Zhang, X. H., Saiz-Lopez, A., Francisco, J. S., and He, H.: Spontaneous Molecular Bromine Production in Sea-Salt Aerosols, Angewandte Chemie-International Edition, 63, https://doi.org/10.1002/anie.202409779, 2024.
Chen, T., Zhang, P., Chu, B., Ma, Q., Ge, Y., Liu, J., and He, H.: Secondary organic aerosol formation from mixed volatile organic compounds: Effect of RO2 chemistry and precursor concentration, npj Clim. Atmos. Sci., 5, 95, https://doi.org/10.1038/s41612-022-00321-y, 2022.
Chirino, Y. I., Sánchez-Pérez, Y., Osornio-Vargas, Á. R., Morales-Bárcenas, R., Gutiérrez-Ruíz, M. C., Segura-García, Y., Rosas, I., Pedraza-Chaverri, J., and Garcia-Cuellar, C. M.: PM10 impairs the antioxidant defense system and exacerbates oxidative stress driven cell death, Toxicol. Lett., 193, 209–216, https://doi.org/10.1016/j.toxlet.2010.01.009, 2010.
Cohen, A. J., Ross Anderson, H., Ostro, B., Pandey, K. D., Krzyzanowski, M., Künzli, N., Gutschmidt, K., Pope, A., Romieu, I., Samet, J. M., and Smith, K.: The global burden of disease due to outdoor air pollution, Journal of Toxicology and Environmental Health Part A Current Issues, 68, 1301–1307, https://doi.org/10.1080/15287390590936166, 2005.
Cohn, C. A., Simon, S. R., and Schoonen, M. A. A.: Comparison of fluorescence-based techniques for the quantification of particle-induced hydroxyl radicals, Part. Fibre Toxicol., 5, https://doi.org/10.1186/1743-8977-5-2, 2008.
Domingos, J. S. S., Regis, A. C. D., Santos, J. V. S., and da Silva, M. V.: A comprehensive and suitable method for determining major ions from atmospheric particulate matter matrices, J. Chromatogr. A, 1266, 17–23, https://doi.org/10.1016/j.chroma.2012.08.074, 2012.
Dragomir, E. G. and Oprea, M.: Air Quality Forecasting by Using Nonlinear Modeling Methods, Nonlinear Dynamics of Electronic Systems, 438, 387–394, 2014.
Esmaeilirad, S., Lai, A., Abbaszade, G., Schnelle-Kreis, J., Zimmermann, R., Uzu, G., Daellenbach, K., Canonaco, F., Hassankhany, H., Arhami, M., Baltensperger, U., Prévôt, A. S. H., Schauer, J. J., Jaffrezo, J. L., Hosseini, V., and El Haddad, I.: Source apportionment of fine particulate matter in a Middle Eastern Metropolis, Tehran-Iran, using PMF with organic and inorganic markers, Sci. Total Environ., 705, https://doi.org/10.1016/j.scitotenv.2019.135330, 2020.
Gao, D., Ripley, S., Weichenthal, S., and Pollitt, K. J. G.: Ambient particulate matter oxidative potential: Chemical determinants, associated health effects, and strategies for risk management, Free Radical Biology and Medicine, 151, 7–25, https://doi.org/10.1016/j.freeradbiomed.2020.04.028, 2020.
Gonçalves Ageitos, M., Obiso, V., Miller, R. L., Jorba, O., Klose, M., Dawson, M., Balkanski, Y., Perlwitz, J., Basart, S., Di Tomaso, E., Escribano, J., Macchia, F., Montané, G., Mahowald, N. M., Green, R. O., Thompson, D. R., and Pérez García-Pando, C.: Modeling dust mineralogical composition: sensitivity to soil mineralogy atlases and their expected climate impacts, Atmos. Chem. Phys., 23, 8623–8657, https://doi.org/10.5194/acp-23-8623-2023, 2023.
Guo, H. B., Jin, L., and Huang, S. J.: Effect of PM characterization on PM oxidative potential by acellular assays: a review, Rev. Environ. Health, 35, 461–470, https://doi.org/10.1515/reveh-2020-0003, 2020.
Ham, J., Lee, H. J., Cha, J. W., and Ryoo, S. B.: Potential Source of PM10, PM2.5, and OC and EC in Seoul During Spring 2016, Atmosphere-Korea, 27, 41–54, https://doi.org/10.14191/Atmos.2017.27.1.041, 2017.
Han, L. J., Zhou, W. Q., and Li, W. F.: Increasing impact of urban fine particles (PM2.5) on areas surrounding Chinese cities, Sci. Rep.-UK, 5, https://doi.org/10.1038/srep12467, 2015.
He, L. C. and Zhang, J. F.: Particulate matter (PM) oxidative potential: Measurement methods and links to PM physicochemical characteristics and health effects, Crit. Rev. Environ. Sci. Technol., 53, 177–197, https://doi.org/10.1080/10643389.2022.2050148, 2023.
Hedayat, F., Stevanovic, S., Milic, A., Miljevic, B., Nabi, M. N., Zare, A., Bottle, S. E., Brown, R. J., and Ristovski, Z. D.: Influence of oxygen content of the certain types of biodiesels on particulate oxidative potential, Sci. Total Environ., 545, 381–388, https://doi.org/10.1016/j.scitotenv.2015.12.036, 2016.
Hochreiter, S. and Schmidhuber, J.: Long Short-term Memory, Neural Comput., 9, 1735–1780, https://doi.org/10.1162/neco.1997.9.8.1735, 1997.
Huang, C. J. and Kuo, P. H.: A Deep CNN-LSTM Model for Particulate Matter (PM2.5) Forecasting in Smart Cities, Sensors, 18, https://doi.org/10.3390/s18072220, 2018.
Huang, W., Zhang, Y., Zhang, Y., Fang, D., and Schauer, J. J.: Optimization of the Measurement of Particle-Bound Reactive Oxygen Species with 2',7'-dichlorofluorescin (DCFH), Water, Air, Soil Pollut., 227, 164, https://doi.org/10.1007/s11270-016-2860-9, 2016.
Huang, X.: The Impact of PM10 and Other Airborne Particulate Matter on the Cardiopulmonary and Respiratory Systems of Sports Personnel under Atmospheric Exposure, Atmosphere-Basel, 14, https://doi.org/10.3390/atmos14111697, 2023.
Huo, H. X., Gao, Y. T., Sun, L., Gao, Y., Gao, H. W., and Yao, X. H.: Investigating Dual Character of Atmospheric Ammonia on Particulate NH4NO3: Reducing Evaporation Versus Promoting Formation, Atmosphere-Basel, 16, https://doi.org/10.3390/atmos16060685, 2025.
Jeong, G. Y.: Microanalysis and mineralogy of Asian and Saharan dust, J. Anal. Sci. Technol., 15, 10, https://doi.org/10.1186/s40543-024-00425-5, 2024.
Jiang, H. and Jang, M.: Dynamic Oxidative Potential of Atmospheric Organic Aerosol under Ambient Sunlight, Environ. Sci. Technol., 52, 7496–7504, https://doi.org/10.1021/acs.est.8b00148, 2018.
Jiao, J., Jia, X. F., Yan, P., Cao, F., Fang, D. Q., Ma, Q. L., Yu, D. J., and Chu, J. H.: Chemical characterization of PM10 in the east-central background region of China, 2016–2017, Journal of Applied Meteorological Science, 32, 65–77, https://doi.org/10.11898/1001-7313.20210106, 2021.
Jung, C., Huang, C., Su, H., Chen, N., and Yeh, C.: Impact of agricultural activity on PM2.5 and its compositions in elementary schools near corn and rice farms, Sci. Total Environ., 906, 167496, https://doi.org/10.1016/j.scitotenv.2023.167496, 2024.
Knipping, E. M., Lakin, M. J., Foster, K. L., Jungwirth, P., Tobias, D. J., Gerber, R. B., Dabdub, D., and Finlayson-Pitts, B. J.: Experiments and simulations of ion-enhanced interfacial chemistry on aqueous NaCl aerosols, Science, 288, 301–306, https://doi.org/10.1126/science.288.5464.301, 2000.
Konecny, R., Leonard, S., Shi, X., Robinson, V., and Castranova, V.: Reactivity of free radicals on hydroxylated quartz surface and its implications for pathogenicity experimental and quantum mechanical study, Journal of environmental pathology, toxicology and oncology: official organ of the International Society for Environmental Toxicology and Cancer, 20, 119–132, https://doi.org/10.1615/JEnvironPatholToxicolOncol.v20.iSuppl.1.110, 2001.
Kong, L., Zhou, L., Chen, D., Luo, L., Xiao, K., Chen, Y., Liu, H., Tan, Q., and Yang, F.: Atmospheric oxidation capacity and secondary pollutant formation potentials based on photochemical loss of VOCs in a megacity of the Sichuan Basin, China, Sci. Total Environ., 901, 166259, https://doi.org/10.1016/j.scitotenv.2023.166259, 2023.
Lee, S. and Shin, J.: Hybrid Model of Convolutional LSTM and CNN to Predict Particulate Matter, International Journal of Information and Electronics Engineering, https://doi.org/10.18178/IJIEE.2019.9.1.701, 2019.
Li, H., Zhang, Q., Zhang, Q., Chen, C., Wang, L., Wei, Z., Zhou, S., Parworth, C., Zheng, B., Canonaco, F., Prévôt, A. S. H., Chen, P., Zhang, H., Wallington, T. J., and He, K.: Wintertime aerosol chemistry and haze evolution in an extremely polluted city of the North China Plain: significant contribution from coal and biomass combustion, Atmos. Chem. Phys., 17, 4751–4768, https://doi.org/10.5194/acp-17-4751-2017, 2017.
Li, N., Hao, M., Phalen, R. F., Hinds, W. C., and Nel, A. E.: Particulate air pollutants and asthma: A paradigm for the role of oxidative stress in PM-induced adverse health effects, Clin. Immunol., 109, 250, https://doi.org/10.1016/j.clim.2003.08.006, 2003.
Li, Q., Wyatt, A., and Kamens, R. M.: Oxidant generation and toxicity enhancement of aged-diesel exhaust, Atmos. Environ., 43, 1037–1042, https://doi.org/10.1016/j.atmosenv.2008.11.018, 2009.
Li, T., Hua, M., and Wu, X.: A Hybrid CNN-LSTM Model for Forecasting Particulate Matter (PM2.5), Ieee Access, 8, 26933–26940, https://doi.org/10.1109/access.2020.2971348, 2020.
Li, W., Wang, C., Wang, H. Q. J., Chen, J. W., Yuan, C. Y., Li, T. C., Wang, W. T., Shen, H. Z., Huang, Y., Wang, R., Wang, B., Zhang, Y. Y., Chen, H., Chen, Y. C., Tang, J. H., Wang, X. L., Liu, J. F., Coveney, R. M., and Tao, S.: Distribution of atmospheric particulate matter (PM) in rural field, rural village and urban areas of northern China, Environ. Pollut., 185, 134–140, https://doi.org/10.1016/j.envpol.2013.10.042, 2014.
Li, X., Song, H., Zhai, S., Lu, S., Kong, Y., Xia, H., and Zhao, H.: Particulate matter pollution in Chinese cities: Areal-temporal variations and their relationships with meteorological conditions (2015–2017), Environ. Pollut., 246, https://doi.org/10.1016/j.envpol.2018.11.103, 2019.
Li, X., Yan, C. Q., Wang, C. Y., Ma, J. J., Li, W. X., Liu, J. Y., and Liu, Y.: PM2.5-bound elements in Hebei Province, China: Pollution levels, source apportionment and health risks, Sci. Total Environ., 806, https://doi.org/10.1016/j.scitotenv.2021.150440, 2022.
Libalova, H., Milcova, A., Cervena, T., Vrbova, K., Rossnerova, A., Novakova, Z., Topinka, J., and Rossner, P.: Kinetics of ROS generation induced by polycyclic aromatic hydrocarbons and organic extracts from ambient air particulate matter in model human lung cell lines, Mutation Research/Genetic Toxicology and Environmental Mutagenesis, 827, 50–58, https://doi.org/10.1016/j.mrgentox.2018.01.006, 2018.
Lin, P. and Yu, J. Z.: Generation of Reactive Oxygen Species Mediated by Humic-like Substances in Atmospheric Aerosols, Environ. Sci. Technol., 45, 10362–10368, https://doi.org/10.1021/es2028229, 2011.
Liu, H., Zheng, J., Qu, C., Zhang, J., Wang, Y., Zhan, C., Yao, R., and Cao, J.: Characteristics and Source Analysis of Water-Soluble Inorganic Ions in PM10 in a Typical Mining City, Central China, Atmosphere-Basel, 8, https://doi.org/10.3390/atmos8040074, 2017a.
Liu, P., Zhang, C., Mu, Y., Liu, C., Xue, C., Ye, C., Liu, J., Zhang, Y., and Zhang, H.: The possible contribution of the periodic emissions from farmers' activities in the North China Plain to atmospheric water-soluble ions in Beijing, Atmos. Chem. Phys., 16, 10097–10109, https://doi.org/10.5194/acp-16-10097-2016, 2016.
Liu, P., Zhang, C., Xue, C., Mu, Y., Liu, J., Zhang, Y., Tian, D., Ye, C., Zhang, H., and Guan, J.: The contribution of residential coal combustion to atmospheric PM2.5 in northern China during winter, Atmos. Chem. Phys., 17, 11503–11520, https://doi.org/10.5194/acp-17-11503-2017, 2017b.
Liu, X., Tournassat, C., Grangeon, S., Kalinichev, A. G., Takahashi, Y., and Marques Fernandes, M.: Molecular-level understanding of metal ion retention in clay-rich materials, Nat. Rev. Earth Environ., 3, 461–476, https://doi.org/10.1038/s43017-022-00301-z, 2022.
Liu, Y., Zhang, W., Yang, W., Bai, Z., and Zhao, X.: Chemical Compositions of PM2.5 Emitted from Diesel Trucks and Construction Equipment, Aerosol Science and Engineering, 2, 51–60, https://doi.org/10.1007/s41810-017-0020-2, 2018.
Lodovici, M. and Bigagli, E.: Oxidative Stress and Air Pollution Exposure, Journal of Toxicology, 2011, https://doi.org/10.1155/2011/487074, 2011.
Ma, S., Cheng, D., Tang, Y., Fan, Y., Li, Q., He, C., Zhao, Z., and Xu, T.: Investigation of oxidative potential of fresh and O3-aging PM2.5 from various emission sources across urban and rural regions, J. Environ. Sci., 151, 608–615, https://doi.org/10.1016/j.jes.2024.04.023, 2025.
Martens, P., Czech, H., Tissari, J., Ihalainen, M., Suhonen, H., Sklorz, M., Jokiniemi, J., Sippula, O., and Zimmermann, R.: Emissions of Gases and Volatile Organic Compounds from Residential Heating: A Comparison of Brown Coal Briquettes and Logwood Combustion, Energy & Fuels, 35, 14010–14022, https://doi.org/10.1021/acs.energyfuels.1c01667, 2021.
McKenzie, E. R., Money, J. E., Green, P. G., and Young, T. M.: Metals associated with stormwater-relevant brake and tire samples, Sci. Total Environ., 407, 5855–5860, https://doi.org/10.1016/j.scitotenv.2009.07.018, 2009.
Méndez, M., Merayo, M. G., and Núñez, M.: Machine learning algorithms to forecast air quality: a survey, Artificial intelligence review, 1–36, https://doi.org/10.1007/s10462-023-10424-4, 2023.
Meng, L., Li, Y., Han, S., and Hao, T.: Influence of Sea-Land Breeze on the Concentrations of PM2.5 and O3 in Tianjin City, Research of Environmental Sciences, 32, 390–398, https://doi.org/10.13198/j.issn.1001-6929.2018.12.10, 2019.
Nielsen, T.: Traffic contribution of polycyclic aromatic hydrocarbons in the center of a large city, Atmos. Environ., 30, 3481–3490, https://doi.org/10.1016/1352-2310(96)00096-9, 1996.
Nishita-Hara, C., Hirabayashi, M., Hara, K., Yamazaki, A., and Hayashi, M.: Dithiothreitol-Measured Oxidative Potential of Size-Segregated Particulate Matter in Fukuoka, Japan: Effects of Asian Dust Events, Geohealth, 3, 160–173, https://doi.org/10.1029/2019gh000189, 2019.
Nishita-Hara, C., Kobayashi, H., Hara, K., and Hayashi, M.: Dithiothreitol-Measured Oxidative Potential of Reference Materials of Mineral Dust: Implications for the Toxicity of Mineral Dust Aerosols in the Atmosphere, Geohealth, 7, e2022GH000736, https://doi.org/10.1029/2022GH000736, 2023.
Okut, H.: Deep Learning for Subtyping and Prediction of Diseases: Long-Short Term Memory, Deep Learning Applications, https://doi.org/10.5772/intechopen.96180, 2021.
Paatero, P.: Least squares formulation of robust non-negative factor analysis, Chemom. Intell. Lab. Syst., 37, 23–35, https://doi.org/10.1016/s0169-7439(96)00044-5, 1997.
Paatero, P. and Tapper, U. J. E.: Positive matrix factorization: A nonnegative factor model with optimal utilization of error estimates of data values, Environmetrics, 5, https://doi.org/10.1002/env.3170050203, 1994.
Pardo, M., Qiu, X. H., Zimmermann, R., and Rudich, Y.: Particulate Matter Toxicity Is Nrf2 and Mitochondria Dependent: The Roles of Metals and Polycyclic Aromatic Hydrocarbons, Chem. Res. Toxicol., 33, 1110–1120, https://doi.org/10.1021/acs.chemrestox.0c00007, 2020.
Park, I. S., Kim, H. K., Song, C. K., Jang, Y. W., Kim, S. H., Cho, C. R., Owen, J. S., Kim, C. H., Chung, K. W., and Park, M. S.: Meteorological Characteristics and Assessment of the Effect of Local Emissions during High PM10 Concentration in the Seoul Metropolitan Area, Asian J. Atmos. Environ., 13, 117–135, https://doi.org/10.5572/ajae.2019.13.2.117, 2019.
Qin, D. M., Yu, J., Zou, G. J., Yong, R. H., Zhao, Q., and Zhang, B.: A Novel Combined Prediction Scheme Based on CNN and LSTM for Urban PM2.5 Concentration, Ieee Access, 7, 20050–20059, https://doi.org/10.1109/access.2019.2897028, 2019.
Qu, W. J., Arimoto, R., Zhang, X. Y., Zhao, C. H., Wang, Y. Q., Sheng, L. F., and Fu, G.: Spatial distribution and interannual variation of surface PM10 concentrations over eighty-six Chinese cities, Atmos. Chem. Phys., 10, 5641–5662, https://doi.org/10.5194/acp-10-5641-2010, 2010.
Saarikoski, S. K., Sillanpää, M. K., Saarnio, K. M., Hillamo, R. E., Pennanen, A. S., and Salonen, R. O.: Impact of biomass combustion on urban fine particulate matter in Central and Northern Europe, Water, Air, Soil Pollut., 191, 265–277, https://doi.org/10.1007/s11270-008-9623-1, 2008.
Saffari, A., Daher, N., Shafer, M. M., Schauer, J. J., and Sioutas, C.: Global perspective on the oxidative potential of airborne particulate matter: A synthesis of research findings, Environ. Sci. Technol., 48, 7576, https://doi.org/10.1021/es500937x, 2014.
Salma, I., Mészáros, T., Maenhaut, W., Vass, E., and Majer, Z.: Chirality and the origin of atmospheric humic-like substances, Atmos. Chem. Phys., 10, 1315–1327, https://doi.org/10.5194/acp-10-1315-2010, 2010.
Schwartz, S. E.: Does fossil fuel combustion lead to global warming?, Energy, 18, 1229–1248, https://doi.org/10.1016/0360-5442(93)90012-3, 1993.
Seo, M., Lee, S. Y., Lee, C., and Cho, S. S.: Recycling of Cement Kiln Dust as a Raw Material for Cement, Environments, 6, https://doi.org/10.3390/environments6100113, 2019.
Sharma, S. K., Mandal, T. K., Jain, S., Saraswati, Sharma, A., and Saxena, M.: Source Apportionment of PM2.5 in Delhi, India Using PMF Model, Bull. Environ. Contam. Toxicol., 97, 286–293, https://doi.org/10.1007/s00128-016-1836-1, 2016.
Shen, Z. X., Sun, J., Cao, J. J., Zhang, L. M., Zhang, Q., Lei, Y. L., Gao, J. J., Huang, R. J., Liu, S. X, Huang, Y., Zhu, C. S., Xu, H. M., Zheng, C. L., Liu, P. P., and Xue, Z. G.: Chemical profiles of urban fugitive dust PM2.5 samples in Northern Chinese cities, Sci. Total Environ. 569–570, 619–626, https://doi.org/10.1016/j.scitotenv.2016.06.156, 2016.
Sherstinsky, A.: Fundamentals of Recurrent Neural Network (RNN) and Long Short-Term Memory (LSTM) network, Physica D: Nonlinear Phenomena, 404, https://doi.org/10.1016/j.physd.2019.132306, 2020.
Shi, J., Yan, J. P., Wang, S. S., Zhao, S. H., Zhang, M. M., Xu, S. Q., Lin, Q., and Yang, H.: Determinant of Sea Salt Aerosol Emission in the Southern Hemisphere in Summer Time, Earth and Space Science, 9, https://doi.org/10.1029/2022ea002529, 2022.
Simonich, S. L. and Hites, R. A.: Vegetation-Atmosphere Partitioning of Polycyclic Aromatic Hydrocarbons, Environ. Sci. Technol., 28, 939–943, https://doi.org/10.1021/es00054a028, 1994.
Singh, K. P., Gupta, S., Kumar, A., and Shukla, S. P.: Linear and nonlinear modeling approaches for urban air quality prediction, Sci. Total Environ., 426, 244–255, https://doi.org/10.1016/j.scitotenv.2012.03.076, 2012.
Slanina, S. and Zhang, Y.: Aerosols: Connection between regional climate change and air quality (IUPAC Technical Report), Walter de Gruyter GmbH, Berlin, Boston, 1241–1253, https://doi.org/10.1351/pac200476061241, 2004.
Song, Y., Xu, D., and Chai, Z.: Composition and characteristics of water-soluble anions in PM10 and PM2.5 in Beijing, Analytical Laboratory, 25, 80–85, https://doi.org/10.3969/j.issn.1000-0720.2006.02.024, 2006.
Sowlat, M. H., Hasheminassab, S., and Sioutas, C.: Source apportionment of ambient particle number concentrations in central Los Angeles using positive matrix factorization (PMF), Atmos. Chem. Phys., 16, 4849–4866, https://doi.org/10.5194/acp-16-4849-2016, 2016.
Stelson, A. W. and Seinfeld, J. H.: Relative humidity and temperature dependence of the ammonium nitrate dissociation constant, Atmos. Environ., 16, 983–992, https://doi.org/10.1016/0004-6981(82)90184-6, 1982.
Stracquadanio, M., Petralia, E., Berico, M., La Torretta, T. M. G., Malaguti, A., Mircea, M., Gualtieri, M., and Ciancarella, L.: Source Apportionment and Macro Tracer: Integration of Independent Methods for Quantification of Woody Biomass Burning Contribution to PM10, Aerosol Air Qual. Res., 19, 711–723, https://doi.org/10.4209/aaqr.2018.05.0186, 2019.
Strzałkowska, E.: Morphology, chemical and mineralogical composition of magnetic fraction of coal fly ash, Int. J. Coal Geol., 240, 103746, https://doi.org/10.1016/j.coal.2021.103746, 2021.
Sun, X., Chen, J., Liu, L., Rosanoff, A., Xiong, X., Zhang, Y., and Pei, T.: Effects of Magnesium Fertilizer on the Forage Crude Protein Content Depend upon Available Soil Nitrogen, J. Agric. Food Chem., 66, 1743–1750, https://doi.org/10.1021/acs.jafc.7b04028, 2018.
Tao, L., Wang, Y., Yue, C., Shen, Z., Liu, Z., Liu, Q., Lu, J., Ding, H., and Pan, W.: Synergistic Emission Reduction of Particulate Pollutants in Coal-fired Power Plants Using Ultra-low Emission Technology, Aerosol Air Qual. Res., 20, 2529–2535, https://doi.org/10.4209/aaqr.2020.01.0004, 2020.
Tian, Y. Z., Xiao, Z. M., Han, B., Shi, G. L., Wang, W., Hao, H. Z., Li, X., Feng, Y. C., and Zhu, T.: Seasonal Study of Primary and Secondary Sources of Carbonaceous Species in PM10 from Five Northern Chinese Cities, Aerosol Air Qual. Res., 13, 148–161, https://doi.org/10.4209/aaqr.2012.01.0010, 2013.
Tong, H., Lakey, P. S. J., Arangio, A. M., Socorro, J., Kampf, C. J., Berkemeier, T., Brune, W. H., Pöschl, U., and Shiraiwa, M.: Reactive oxygen species formed in aqueous mixtures of secondary organic aerosols and mineral dust influencing cloud chemistry and public health in the Anthropocene, Faraday Discuss., 200, 251–270, https://doi.org/10.1039/C7FD00023E, 2017.
Tsvetanova, I., Zheleva, I., Filipova, M., and Stefanova, A.: Statistical analysis of ambient air PM10 contamination during winter periods for Ruse region, Bulgaria, 13th National Congress on Theoretical and Applied Mechanics (NCTAM), Bulgarian Acad. Sci., Inst. Mech. Campus I, Sofia, Bulgaria, 06–10 September, https://doi.org/10.1051/matecconf/201814501007, 2018.
Uranishi, K., Ikemori, F., Shimadera, H., Kondo, A., and Sugata, S.: Impact of field biomass burning on local pollution and long-range transport of PM2.5 in Northeast Asia, Environ. Pollut., 244, 414–422, https://doi.org/10.1016/j.envpol.2018.09.061, 2019.
US EPA: Positive Matrix Factorization Model for environmental data analyses, https://www.epa.gov/air-research/positive-matrix-factorization-model-environmental-data-analyses (last access: 24 October 2025), 2017.
Valavanidis, A., Fiotakis, K., and Vlachogianni, T.: Airborne Particulate Matter and Human Health: Toxicological Assessment and Importance of Size and Composition of Particles for Oxidative Damage and Carcinogenic Mechanisms, Journal of Environmental Science and Health Part C: Environmental Carcinogenesis and Ecotoxicology Reviews, 26, 339–362, https://doi.org/10.1080/10590500802494538, 2008.
Vennerød, C. B., Kjærran, A., and Bugge, E. S. J. A.: Long Short-term Memory RNN, arXiv [preprint], https://doi.org/10.48550/arXiv.2105.06756, 2021.
Verma, V., Fang, T., Xu, L., Peltier, R. E., Russell, A. G., Ng, N. L., and Weber, R. J.: Organic Aerosols Associated with the Generation of Reactive Oxygen Species (ROS) by Water-Soluble PM2.5, Environ. Sci. Technol., 49, 4646–4656, https://doi.org/10.1021/es505577w, 2015.
Viana, M., Kuhlbusch, T. A., Querol, X., Alastuey, A., Harrison, R. M., Hopke, P. K., Winiwarter, W., Vallius, M., Szidat, S., and Prevot, A. S.: Source apportionment of particulate matter in Europe: A review of methods and results, J. Aerosol Sci., 39, 827–849, https://doi.org/10.1016/j.jaerosci.2008.05.007, 2008.
Wang, J., Huang, J., Wang, L., Chen, C., Yang, D., Jin, M., Bai, C., and Song, Y.: Urban particulate matter triggers lung inflammation via the ROS-MAPK-NF-êB signaling pathway, J. Thorac. Dis., 9, 4398–4412, https://doi.org/10.21037/jtd.2017.09.135, 2017.
Wang, M., Kong, W., Marten, R., He, X.-C., Chen, D., Pfeifer, J., Heitto, A., Kontkanen, J., Dada, L., Kürten, A., Yli-Juuti, T., Manninen, H. E., Amanatidis, S., Amorim, A., Baalbaki, R., Baccarini, A., Bell, D. M., Bertozzi, B., Bräkling, S., Brilke, S., Murillo, L. C., Chiu, R., Chu, B., De Menezes, L.-P., Duplissy, J., Finkenzeller, H., Carracedo, L. G., Granzin, M., Guida, R., Hansel, A., Hofbauer, V., Krechmer, J., Lehtipalo, K., Lamkaddam, H., Lampimäki, M., Lee, C. P., Makhmutov, V., Marie, G., Mathot, S., Mauldin, R. L., Mentler, B., Müller, T., Onnela, A., Partoll, E., Petäjä, T., Philippov, M., Pospisilova, V., Ranjithkumar, A., Rissanen, M., Rörup, B., Scholz, W., Shen, J., Simon, M., Sipilä, M., Steiner, G., Stolzenburg, D., Tham, Y. J., Tomé, A., Wagner, A. C., Wang, D. S., Wang, Y., Weber, S. K., Winkler, P. M., Wlasits, P. J., Wu, Y., Xiao, M., Ye, Q., Zauner-Wieczorek, M., Zhou, X., Volkamer, R., Riipinen, I., Dommen, J., Curtius, J., Baltensperger, U., Kulmala, M., Worsnop, D. R., Kirkby, J., Seinfeld, J. H., El-Haddad, I., Flagan, R. C., and Donahue, N. M.: Rapid growth of new atmospheric particles by nitric acid and ammonia condensation, Nature, 581, 184–189, https://doi.org/10.1038/s41586-020-2270-4, 2020.
Wang, N. L., Yao, T. D., Thompson, L. G., and Davis, M. E.: Indian monsoon and North Atlantic Oscillation signals reflected by Cl− and Na+ in a shallow ice core from Dasuopu Glacier, Xixabangma, Himalaya, Ann. Glaciol., 273–277, https://doi.org/10.3189/172756402781816825, 2002.
Wang, Q. Z., Ding, H., Yu, F. W., Chao, N., Li, Y., Jiang, Q. Q., Huang, Y., Duan, L., Ji, Z. Q., Zhou, R., Yang, Z. P., Zheng, K. Y., and Miao, X. P.: The Characteristics and Impact Factors of Sulfate and Nitrate in Urban PM2.5 over Typical Cities of Hangzhou Bay Area, China, Atmosphere-Basel, 14, https://doi.org/10.3390/atmos14121799, 2023a.
Wang, S. S., Nan, J. L., Shi, C. Z., Fu, Q. Y., Gao, S., Wang, D. F., Cui, H. X., Saiz-Lopez, A., and Zhou, B.: Atmospheric ammonia and its impacts on regional air quality over the megacity of Shanghai, China, Sci. Rep., 5, https://doi.org/10.1038/srep15842, 2015.
Wang, T., Huang, R.-J., Yang, L., Dai, W., Ni, H., Gong, Y., Guo, J., Zhong, H., Lin, C., and Xu, W.: Direct emissions of particulate glyoxal and methylglyoxal from biomass burning and coal combustion, Sci. Total Environ., 862, 160757, https://doi.org/10.1016/j.scitotenv.2022.160757, 2023b.
Weber, S., Uzu, G., Calas, A., Chevrier, F., Besombes, J.-L., Charron, A., Salameh, D., Ježek, I., Močnik, G., and Jaffrezo, J.-L.: An apportionment method for the oxidative potential of atmospheric particulate matter sources: application to a one-year study in Chamonix, France, Atmos. Chem. Phys., 18, 9617–9629, https://doi.org/10.5194/acp-18-9617-2018, 2018.
Wei, J., Fang, T., and Shiraiwa, M.: Effects of Acidity on Reactive Oxygen Species Formation from Secondary Organic Aerosols, ACS Environ. Au, 2, 336–345, https://doi.org/10.1021/acsenvironau.2c00018, 2022.
Xue, Y. H., Wu, J. H., Feng, Y. C., Dai, L., Bi, X. H., Li, X. A., Zhu, T., Tang, S. B., and Chen, M. F.: Source Characterization and Apportionment of PM10 in Panzhihua, China, Aerosol Air Qual. Res., 10, 367–377, https://doi.org/10.4209/aaqr.2010.01.0002, 2010.
Yan, C., Zheng, M., Sullivan, A. P., Bosch, C., Desyaterik, Y., Andersson, A., Li, X., Guo, X., Zhou, T., Gustafsson, Ö., and Collett, J. L.: Chemical characteristics and light-absorbing property of water-soluble organic carbon in Beijing: Biomass burning contributions, Atmos. Environ., 121, 4–12, https://doi.org/10.1016/j.atmosenv.2015.05.005, 2015.
Yang, G., Lee, H., and Lee, G.: A Hybrid Deep Learning Model to Forecast Particulate Matter Concentration Levels in Seoul, South Korea, Atmosphere-Basel, 11, https://doi.org/10.3390/atmos11040348, 2020a.
Yang, L.: The space-time variations of PM10 concentration in major cities of China during 2000–2007, Journal of Arid Land Resources and Environment, 23, 51–54, https://doi.org/10.13448/j.cnki.jalre.2009.09.017, 2009.
Yang, L. M., Wang, S. B., Duan, S. G., Yan, Q. S., Jiang, N., Zhang, R. Q., and Li, S. L.: Characteristics and formation mechanisms of secondary inorganic ions in PM2.5 during winter in a central city of China: Based on a high time resolution data, Atmos. Res., 233, https://doi.org/10.1016/j.atmosres.2019.104696, 2020b.
Yao, K. X., Xu, Y. H., Zheng, H., Zhang, X. J., Song, Y. X., and Guo, H. B.: Oxidative potential associated with reactive oxygen species of size-resolved particles: The important role of the specific sources, J. Environ. Manage., 360, https://doi.org/10.1016/j.jenvman.2024.121122, 2024.
Yin, H., Guo, L., Xie, M., Xu, Z., Zhao, D., and Shi, Z.: Source Tracking of Food Industry Wastewater Discharge into Sewers Using Marker Species, J. Tongji Univ. Nat. Sci., 47, 1168–1174, https://doi.org/10.11908/j.issn.0253-374x.2019.08.013, 2019.
Yu, D. J., Wu, Y. L., Song, Q. L., Dai, X., and Lin, W. L.: Environmental Characteristics and Its Observations at Longfengshan WMO Regional Atmospheric Background Station, Climate Change Research Letters, 1, 65–73, https://doi.org/10.12677/ccrl.2012.12008, 2012.
Yu, H., Zhao, X. Y., Wang, J., Yin, B. H., Geng, C. M., Wang, X. H., Gu, C., Huang, L. H., Yang, W., and Bai, Z. P.: Chemical characteristics of road dust PM2.5 fraction in oasis cities at the margin of Tarim Basin, J. Environ. Sci., 95, 217–224, https://doi.org/10.1016/j.jes.2020.03.030, 2020.
Yu, Y. and Cao, J.: Chemical Fingerprints and Source Profiles of PM10 and PM2.5 from Agricultural Soil in a Typical Polluted Region of Northwest China, Aerosol Air Qual. Res., 23, 220419, https://doi.org/10.4209/aaqr.220419, 2023.
Yue, D. L., Zhong, L. J., Zhang, T., Shen, J., Zhou, Y., Zeng, L. M., Dong, H. B., and Ye, S. Q.: Pollution Properties of Water-Soluble Secondary Inorganic Ions in Atmospheric PM2.5 in the Pearl River Delta Region, Aerosol Air Qual. Res., 15, 1737–1747, https://doi.org/10.4209/aaqr.2014.12.0333, 2015.
Zhang, B., Shen, H., Liu, P., Guo, H., Hu, Y., Chen, Y., Xie, S., Xi, Z., Skipper, T. N., and Russell, A. G.: Significant contrasts in aerosol acidity between China and the United States, Atmos. Chem. Phys., 21, 8341–8356, https://doi.org/10.5194/acp-21-8341-2021, 2021.
Zhang, R., Cao, J., Tang, Y., Arimoto, R., Shen, Z., Wu, F., Han, Y., Wang, G., Zhang, J., and Li, G.: Elemental profiles and signatures of fugitive dusts from Chinese deserts, Sci. Total Environ., 472, 1121–1129, https://doi.org/10.1016/j.scitotenv.2013.11.011, 2014a.
Zhang, T. T., Shao, Y., Gong, H. Z., Li, L., and Wang, L. F.: Salt Content Distribution and Paleoclimatic Significance of the Lop Nur “Ear” Feature: Results from Analysis of EO-1 Hyperion Imagery, Remote Sens.-Basel, 6, 7783–7799, https://doi.org/10.3390/rs6087783, 2014b.
Zhang, X. L. and Zhou, W. S.: Structural Vibration Data Anomaly Detection Based on Multiple Feature Information Using CNN-LSTM Model, Structural Control and Health Monitoring, 2023, https://doi.org/10.1155/2023/3906180, 2023.
Zhang, X. Y., Wang, Y. Q., Niu, T., Zhang, X. C., Gong, S. L., Zhang, Y. M., and Sun, J. Y.: Atmospheric aerosol compositions in China: spatial/temporal variability, chemical signature, regional haze distribution and comparisons with global aerosols, Atmos. Chem. Phys., 12, 779–799, https://doi.org/10.5194/acp-12-779-2012, 2012.
Zhang, Y., Liu, Y., Ma, W., Hua, C., Zheng, F., Lian, C., Wang, W., Xia, M., Zhao, Z., Li, J., Xie, J., Wang, Z., Wang, Y., Chen, X., Zhang, Y., Feng, Z., Yan, C., Chu, B., Du, W., Kerminen, V.-M., Bianchi, F., Petäjä, T., Worsnop, D., and Kulmala, M.: Changing aerosol chemistry is redefining HONO sources, Nat. Commun., 16, 5238, https://doi.org/10.1038/s41467-025-60614-7, 2025.
Zhao, C. X., Wang, Y. Q., Wang, Y. J., Zhang, H. L., and Zhao, B. Q.: Temporal and Spatial Distribution of PM2.5 and PM10 Pollution Status and the Correlation of Particulate Matters and Meteorological Factors During Winter and Spring in Beijing, Huanjing Kexue, 35, 418–427, https://doi.org/10.13227/j.hjkx.2014.02.013, 2014.
Zhou, J., Elser, M., Huang, R.-J., Krapf, M., Fröhlich, R., Bhattu, D., Stefenelli, G., Zotter, P., Bruns, E. A., Pieber, S. M., Ni, H., Wang, Q., Wang, Y., Zhou, Y., Chen, C., Xiao, M., Slowik, J. G., Brown, S., Cassagnes, L.-E., Daellenbach, K. R., Nussbaumer, T., Geiser, M., Prévôt, A. S. H., El-Haddad, I., Cao, J., Baltensperger, U., and Dommen, J.: Predominance of secondary organic aerosol to particle-bound reactive oxygen species activity in fine ambient aerosol, Atmos. Chem. Phys., 19, 14703–14720, https://doi.org/10.5194/acp-19-14703-2019, 2019.
Zhu, X., Ho, K. F., Yang, T. T., Laiman, V., Sun, J., Shen, Z., and Chuang, H. C.: Emission Factors of PAHs Components and Bioreactivity in PM2.5 from Biomass Burning, Aerosol Air Qual. Res., 24, 230068, https://doi.org/10.4209/aaqr.230068, 2024.