the Creative Commons Attribution 4.0 License.
the Creative Commons Attribution 4.0 License.
The impact of tropical cyclones on regional ozone pollution and its future trend in the Yangtze River Delta of China
Mengzhu Xi
Da Gao
Yi Luo
Lingyun Feng
Shitong Chen
Shuxian Zhang
Tropical cyclones (TCs) have a significant impact on ozone (O3) in coastal regions by affecting atmospheric circulation and meteorological conditions. This paper investigates the impact and its future changing trends in the Yangtze River Delta (YRD) region. It was found that regional O3 pollution usually occurred before TCs made landfall and after they dissipated in 2018–2022. We classified the weather patterns (SWPs) from June to September during 2018–2022 into four main categories. As pollution levels increase within the TCs weather pattern, regional temperatures rise, relative humidity decreases, and wind speeds weaken, creating a favorable environment for O3 formation and accumulation. The annual O3 concentration series is reconstructed based on changes in SWP frequency and intensity, quantifying the impact of various SWPs on future O3 variations. The analysis focuses on the number of days with the TCs weather pattern and their contribution to O3 variation. Under the SSP2-4.5 and SSP5-8.5 scenarios, future YRD O3 concentrations from June to September will increase to varying degrees relative to historical average O3 concentrations, with average increases of approximately 1.88 and 6.86 µg m−3, respectively. Under all future scenarios, the number of days with TC weather pattern increases to varying degrees, and the frequency of TCs increases significantly. The contribution of TCs weather pattern to O3 changes is increasing compared to the historical period. This shows that the intensification of climate change will intensify the impact of TCs on O3 in the YRD, and monitoring and early warning need to be strengthened.
- Article
(11279 KB) - Full-text XML
- BibTeX
- EndNote
In recent years, the concentration of ground-level O3 in many cities in China has significantly exceeded standards and has intensified. O3 has replaced Particulate Matter (PM) as the primary pollutant in many regions (Wang et al., 2023b; Yang et al., 2025; Zhao et al., 2020). Ground-level O3 is mainly generated by photochemical reactions of volatile organic compounds (VOCs) and nitrogen oxides (NOx) under sunlight (Lu et al., 2019; Zhang et al., 2024). High concentrations of O3 can damage the human respiratory system, destroy the human immune system, and even increase the risk of death (Gong et al., 2024; Wang et al., 2025). It can also damage the ecosystem, causing plant leaf necrosis and crop yield reduction (Li et al., 2024). In recent years in the YRD, high emissions of motor vehicle and industrial waste gases, coupled with complex terrain and meteorological conditions due to urbanization, have led to complex air pollution characterized by high concentrations of O3 and PM (Zhan et al., 2024). According to the 2020 China Ecological Environment Bulletin, in the YRD, the number of days with air quality exceeding the standard with O3 as the primary pollutant accounted for over 50 % of the total number of days exceeding the standard.
O3 concentration is regulated by precursor emissions and meteorological conditions during its generation process (Gong et al., 2022; Xie et al., 2016; Xu et al., 2023b). Meteorological factors such as temperature, humidity, precipitation, atmospheric stability, and mixing layer height play important roles in the emission, transportation, and dispersion, chemical reaction, and dry and wet deposition of air pollutants (Chen et al., 2020; Li et al., 2020). Regional O3 pollution events are often triggered by meteorological conditions such as strong radiation, high temperature, low relative humidity, and low wind speed (Wang et al., 2024b; Zhan and Xie, 2022). Changes in meteorological conditions are affected by weather systems, and the role of weather systems in O3 concentration changes has also received widespread attention.
Tropical cyclone (TC) activities have a profound impact on the ecological environment of China's coastal areas. In the summer and autumn seasons when O3 pollution is frequent, TCs are one of the key weather systems that induce O3 pollution in the YRD (Qi et al., 2024; Shu et al., 2016; Zhan and Xie, 2022). Although the strong winds and precipitation brought by landfalling TCs have a strong scavenging effect on pollutants, the peripheral circulation of TCs away from lands will significantly change the temperature field, wind field, and boundary layer structure, thereby affecting the chemical and physical processes related to O3 generation, transport, dispersion and deposition, which may in turn aggravate O3 pollution (Chow et al., 2018; Jiang et al., 2015; Lam et al., 2005; Xu et al., 2023a; Yang et al., 2012). Deng et al. (2019) found that under the influence of the peripheral circulation of TCs, the Pearl River Delta (PRD) is prone to high temperature, low humidity, low wind speed, and strong radiation, which leads to the occurrence of high O3 and PM concentrations. Hu et al. (2023) focused on analyzing the atmospheric processes that are conducive to the increase in O3 concentration and the continuous exceedance of O3 during TC activities, and found that the prevailing downdraft over the PRD brought meteorological conditions of clear sky, low wind speed, high boundary layer, and low relative humidity, which led to the continuous excess of O3 concentration. Wang et al. (2024a) found that the continuous northward TCs produced and maintained meteorological conditions conducive to the generation of O3, promoted the local accumulation and cross-regional transmission of O3, and jointly led to a 30 % increase in O3 concentration in eastern China and a prolonged O3 pollution period. Xu et al. (2023a) further revealed that when a typhoon landed in the YRD, the contribution of BVOC to O3 in the Beijing-Tianjin-Hebei region reached 10 ppb; when the TCs moved to Beijing-Tianjin-Hebei region, the cross-transport between the northern China air mass and the YRD contributed half of the O3 related to biological emissions. The peripheral winds and downdrafts of TCs lead to high temperatures and stable weather, which affect O3 concentrations by affecting regional transport and biological emissions.
The Sixth Assessment Report of the Intergovernmental Panel on Climate Change (IPCC) has established that the rise in the average surface temperature of the earth, caused by human activities, has become a scientific consensus. Compared with the average surface temperature before industrialization (1850–1900), the global average surface temperature increased by about 0.8–1.3 °C due to human activities during 2010–2019 (Adak et al., 2023). In the context of global climate change, with the increases in greenhouse gas emissions, global warming, and interannual climate changes, the state of the atmosphere and ocean has changed, and sea-level rise and extreme climate events have occurred frequently, which have a low-frequency modulating effect on TCs (Chu et al., 2020; Moon et al., 2023, 2025; Wang et al., 2023a). The activity characteristics of TCs have changed significantly, and rare high-intensity TCs have frequently made landfall in China (Wu, 2023). The southeastern coastal area, as one of the most economically developed and densely populated regions in China, is the region most seriously affected by TCs. Most TCs that affect China originate in the northwest Pacific Ocean, and their movement paths are influenced by the WPSH. Before TCs make landfall from the northwest Pacific Ocean, China's coastal urban agglomerations often experience regional multi-day severe O3 pollution (Wang et al., 2022b). Although the frequency of TCs in the northwest Pacific Ocean has decreased in recent years, their average intensity has shown an upward trend (Balaguru et al., 2024; Bhatia et al., 2022; Chand et al., 2022; Jung, 2025; Wang et al., 2022a), and their duration has also become longer (Kossin, 2018; Zhang et al., 2020). Yamaguchi and Maeda (2020) showed that although climate warming has accelerated the overall movement speed of TCs, their speed will slow down when they move toward the temperate zone during the poleward migration process, and the time they stay in a specific area will be extended. Affected by the surrounding atmospheric circulation, the slower the TCs move, the longer their impact duration and the greater their effects, which influence O3 transport, extend the duration of O3 pollution, exacerbate O3 concentration, and expand the spatial extent of pollution. Global climate models (GCMs) are able to directly simulate surface O3 concentrations under both historical and future scenarios (Turnock et al., 2020). These simulations provide an important reference for understanding the long-term evolution of surface O3 driven by changes in emissions and climate. In the context of global warming in the future, the increase in unfavorable meteorological conditions will make the O3 pollution problem more serious (Fu and Tai, 2015; Keeble et al., 2017; Arnold et al., 2018; Akritidis et al., 2019; Saunier et al., 2020). Therefore, studying the trend of O3 changes under future climate change scenarios is particularly important for formulating countermeasures against O3 pollution.
The YRD is located in a key position in the eastern coastal economic zone of China. It is also a typical area frequently affected by TCs in the warm seasons (Wu et al., 2025; Qi et al., 2024). In addition, it has a high degree of urban agglomeration, dense population, and high energy consumption, making it a key area for air pollution prevention and control (Zhan et al., 2024; Bao et al., 2025). This study focuses on the regulatory mechanism of TCs on regional O3 pollution and its impact on future pollution trends. First, based on the weather classification over the years, the characteristics of atmospheric circulation changes that cause O3 changes are revealed, and the mechanism of the TC weather pattern in the YRD affecting O3 pollution is clarified. Secondly, based on the data reconstruction method, the O3 annual variation series is reconstructed according to the frequency and intensity of SWPs. Finally, based on future scenario data, the evolution characteristics of atmospheric circulation and the trend in O3 concentrations under different future scenarios are estimated, and the number of days when TC weather pattern appears and their contribution to O3 variation are quantified. The research results help to fully and systematically understand the influence mechanism of weather conditions on O3 pollution, provide a reference for the YRD to carry out targeted O3 pollution control strategies, and have dual significance in improving regional air quality and advancing low-carbon development.
2.1 O3 observation data
The hourly pollutant monitoring data of 26 cities in the YRD used are derived from the National Environmental Monitoring Center of China. The platform provides pollutant concentration data updated every hour. To better describe the level of O3 pollution at the urban scale, the arithmetic mean of the pollutant concentrations at each monitoring station was used as the pollutant concentration of the city. O3-8h represents the daily maximum 8 h average O3 concentration, which can more accurately characterize the long-term exposure to regional O3 pollution. The daily maximum 8 h average O3 concentration is calculated as the highest average O3 mixing ratio over any consecutive 8 h period within a calendar day (00:00–23:59 local time). Specifically, 8 h moving averages are computed for all possible consecutive 8 h windows (e.g., 00:00–07:59, 01:00–08:59, …, 16:00–23:59 LT), and the maximum value among them is recorded as the daily O3 concentration. Therefore, the O3 data used in the analysis of this article are all based on the O3-8h value, and the daily maximum 8 h average concentration (unit: µg m−3) is taken as the daily O3 concentration.
2.2 Classification of synoptic weather patterns
Common objective weather classification methods mainly include principal component analysis, clustering algorithms, variance method based on correlation coefficients and neural network algorithms. We use orthogonal rotation principal component analysis in T mode (PTT) to classify SWPs in the YRD from 2018 to 2022. The PTT classification method has been integrated into the “cost733class” software. This method is an objective circulation classification method based on principal component analysis. By rotating the loadings of the T-mode principal components, its classification results are more physically interpretable (Philipp et al., 2016). It can accurately reflect the characteristics of the initial circulation field, does not change significantly across different classification objects, and the obtained circulation spatio-temporal field is more stable (Huth et al., 2016). It has been widely used in research fields such as atmospheric circulation and air pollution (Hou et al., 2019; Gao et al., 2021).
The meteorological data are derived from the reanalysis data provided by the National Center for Environmental Prediction (NCEP). The dataset has a horizontal resolution of 2.5° × 2.5°, with 144 × 73 grid points in the latitude-longitude domain and 17 vertical layers ranging from 1000 to 10 hPa. Meteorological variables considered in this study include the 500 hPa geopotential height field, sea level pressure, 500 hPa wind field, 850 hPa wind field, 1000 hPa wind field, and vertical wind velocity. Considering that the geopotential height field at 850 hPa effectively minimizes the influence of surface conditions on atmospheric motion while capturing the variations of shallow meteorological systems (Shu et al., 2017). In this study, we used the geopotential height field at 850 hPa from June to September during 2018–2022 to classify SWPs and analyze the three-dimensional structure of circulation fields associated with different SWPs.
2.3 Reconstruction of annual variation series of O3 concentration
The change in SWPs includes the changes in SWP frequency and intensity. The change in SWP frequency refers to the number of occurrences of a certain type of SWP in different years, while the change in SWP intensity refers to the change in the average intensity of the weather system associated with a certain type of SWP across different years. To quantify the contribution of the change in SWP frequency and intensity to the annual change of O3, Yarnal (1993) proposed a method to assess the influence of changes in SWP frequency on the annual change of O3. The specific equation is as follows:
where represents the reconstructed mean O3 concentration influenced by the frequency variation in SWPs for year m; represents the average O3 concentration of a certain SWP in all years, and Fkm represents the frequency of occurrence of SWP for year m.
Later, Hegarty et al. (2007) proposed that the impact of SWP changes on the annual variation of O3 should take into account changes in both frequency and intensity. Therefore, Eq. (1) was modified as follows:
where represents the reconstructed mean O3 concentration influenced by the frequency and intensity changes of SWPs for year m; ΔO3km represents the modified anomaly concentration value obtained by fitting the SWP k intensity factor in the year m with the O3 concentration anomaly value (ΔO3) for that year, which represents the oscillation of the O3 concentration value caused by the change in the intensity of the SWP k in year m. Hegarty et al. (2007) used the average sea level pressure value in the classification area to represent the SWP intensity change factor. Liu et al. (2019) used the same method to construct the annual O3 variation series in North China, but used the lowest pressure value in the classification area as the SWP intensity factor.
Since the characteristic changes of each SWP that lead to the increase in O3 concentration are different, when defining the SWP intensity factor, it is necessary to consider the unique change characteristics that lead to the increase in O3 concentration for each SWP. To better describe the changes in SWP intensity, we selected the average, maximum, and minimum geopotential heights of different regions based on meteorological characteristics and the location of weather systems. The region with the largest correlation coefficient with the annual O3 variation series was defined as the SWP intensity factor under that pattern. This part is explained in detail in Sect. 3.4.1. We select the SWP intensity factor in SWP1 as the maximum geopotential height in zone 7 (110–130° E, 20–35° N); SWP2 as the maximum geopotential height in zone 2 (90–140° E, 20–50° N); SWP3 as the minimum geopotential height in zone 9 (110–130° E, 20–40° N); and SWP4 as the minimum geopotential height in zone 4 (110–130° E, 25–40° N).
2.4 CMIP6 future climate scenario data
Based on 18 models of the Sixth International Coupled Model Intercomparison Project (CMIP6) and the ERA5 dataset, a bias-corrected global dataset was constructed (Xu et al., 2021). The dataset covers the historical period from 1979 to 2014 and the future climate scenarios from 2015 to 2100, with a horizontal grid spacing of 1.25° × 1.25° and a time interval of 6 h. Considering that O3 pollution often occurs under extreme weather conditions, the more extreme SSP5-8.5 scenario was selected for this study. This scenario is a high-forcing scenario, and the radiative forcing stabilizes at 8.5 W m−2 by 2100. In addition, as China implements more and more energy-saving and emission reduction measures, especially with the establishment of carbon peak and carbon neutrality goals, future greenhouse gas emissions are expected to be effectively controlled. Therefore, the relatively mild SSP2-4.5 scenario was selected for comparison. This scenario is a moderate forcing scenario, and the radiative forcing stabilizes at 4.5 W m−2 by 2100. We use the geopotential height field at 850 hPa from June to September during 2018 to 2022 (historical period), 2030 (carbon peak), 2035 (beautiful China), 2060 (carbon neutrality), and 2100 as the input for the PTT to classify weather patterns.
3.1 Characteristics of O3 pollution in the YRD
Figure 1 shows the monthly variation trend of ground-level O3 concentrations and meteorological conditions (solar radiation, temperature, precipitation, and relative humidity) in the YRD from 2018 to 2022. It can be seen that the inter-month variations of O3 concentrations present an M-shaped pattern. From January to June, as the temperature rises and solar radiation increases, the O3 concentration rises significantly and reaches the first peak (133.36 µg m−3). However, the increased precipitation and higher humidity in July exert a notable wet scavenging effect on O3 precursors. O3 concentration increases again and reaches the second peak (126.38 µg m−3) in September. From October to December, as the temperature gradually decreases and solar radiation weakens, the O3 concentration shows a continuous downward trend, and reaches the lowest value of 54.17 µg m−3 of the year in December. The O3 concentration shows obvious seasonal changes throughout the year. In summer, higher temperatures, stronger solar radiation, and longer sunshine duration jointly enhance atmospheric photochemical reactions, thereby significantly increasing the O3 concentration. In winter, lower temperatures, weaker solar radiation, and shorter sunshine duration lead to a significant weakening of photochemical reactions, which is not conducive to the generation of O3. From the kernel density curve, it can be seen that the distribution in summer months is wider, indicating that the O3 concentration fluctuates greatly, while the distribution in winter months is narrower, indicating that the O3 concentration changes are relatively stable in winter. This periodic variation reflects the high sensitivity of O3 concentration in the YRD to meteorological conditions (temperature, solar radiation, humidity, wind speed, etc.), which affect the rate of photochemical reactions and thus affect the generation of O3.
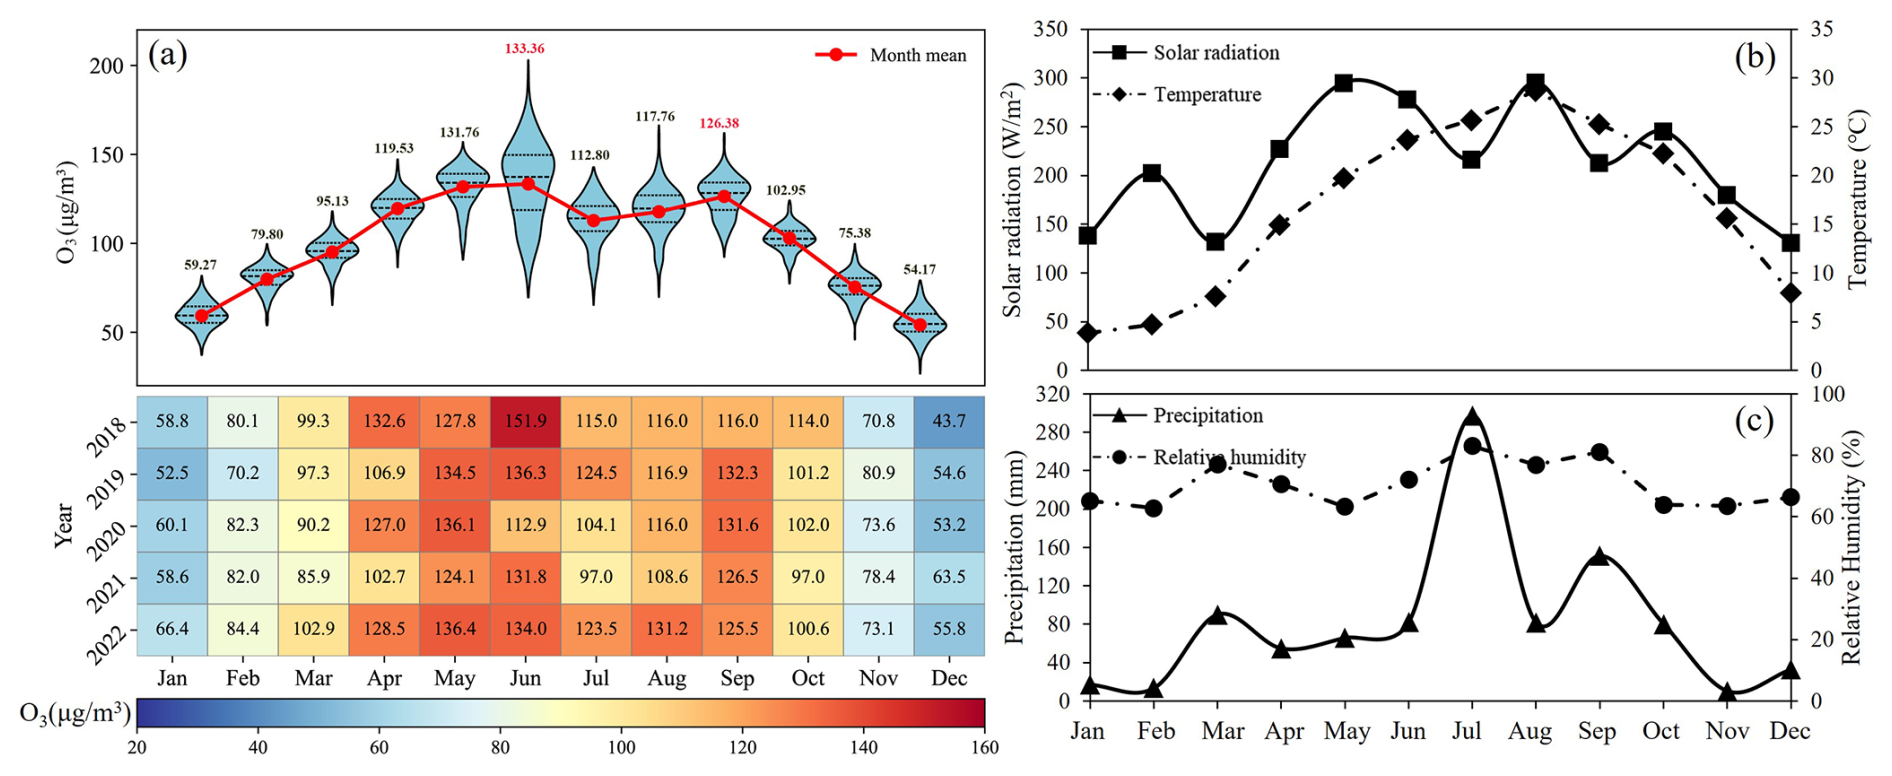
Figure 1Inter-monthly variations in mean O3 concentrations and associated meteorological conditions in the YRD from 2018 to 2022. (a) The monthly variation of O3 concentrations is shown, with the red trend line representing the monthly mean values and the individual monthly concentrations labeled. (b–c) The variation trends of solar radiation, temperature, precipitation and relative humidity during the same period. (The shaded area in the violin plot represents the kernel density curve, with the three black lines indicating the 25th percentile, the mean, and the 75th percentile, respectively.)
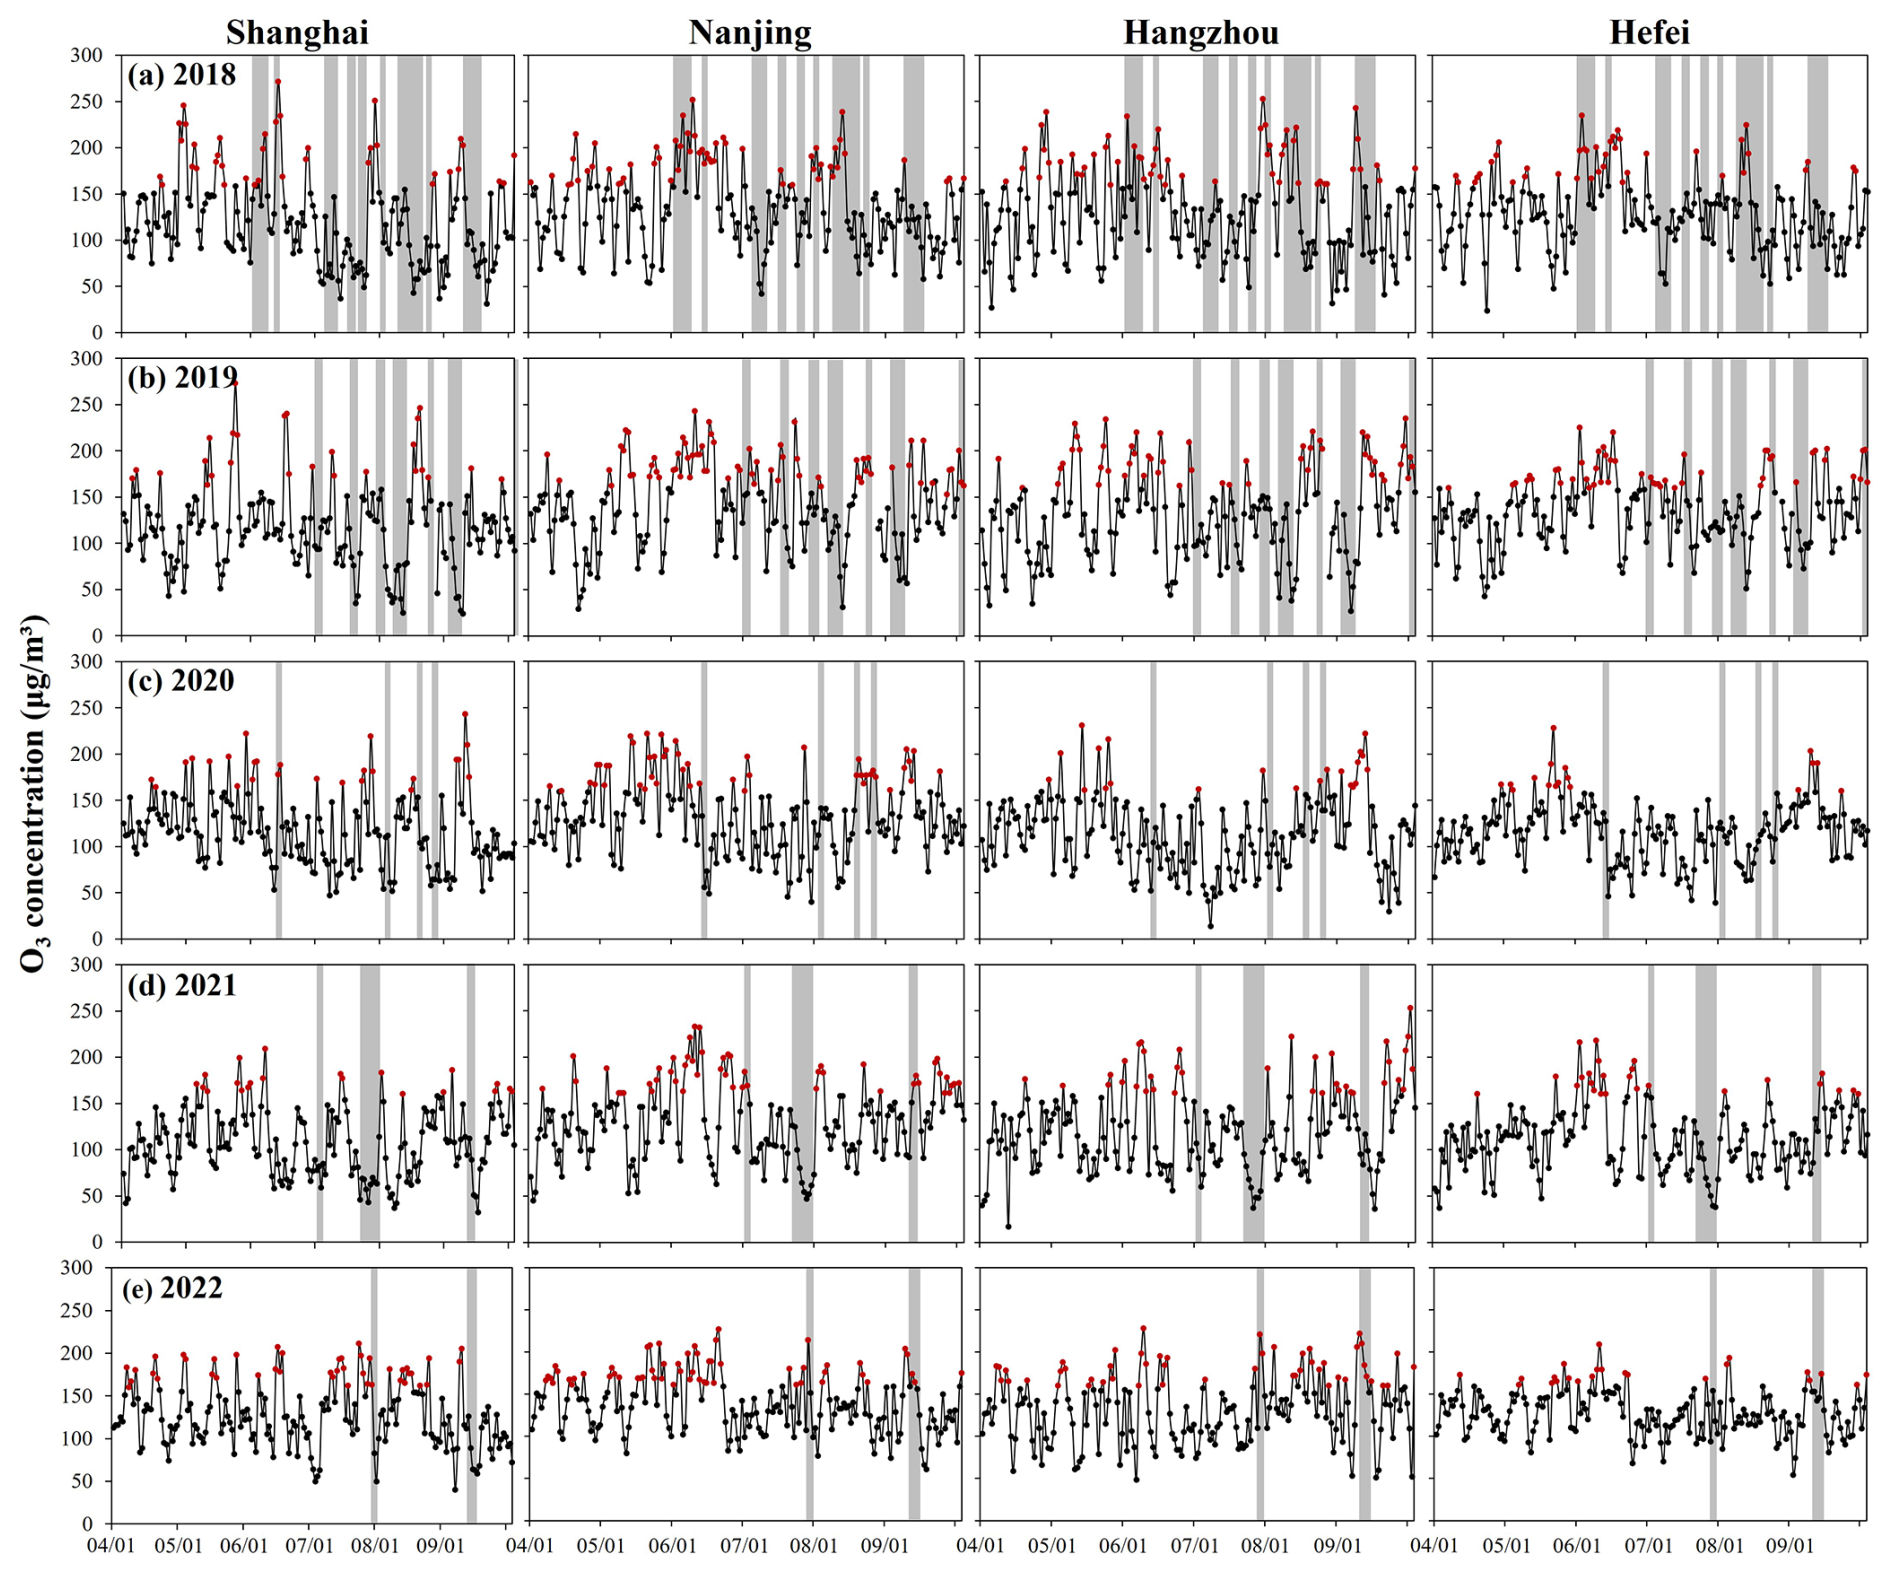
Figure 2Changes in O3 concentration in Shanghai, Nanjing, Hangzhou, and Hefei from April to September in 2018 to 2022. The gray shadows mark the time of impact of the TCs weather that landed, and the red dots are O3-polluted days.
O3 pollution in the YRD is concentrated in warm months of the year. We analyzed the temporal distribution of O3 concentrations in representative cities in the YRD (Shanghai, Nanjing, Hangzhou, and Hefei) from April to September during 2018–2022 (Fig. 2). Since TCs mainly occur after June, O3 pollution is often associated with TC activity. During the same TC period, the O3 concentrations in Shanghai, Nanjing, Hangzhou, and Hefei were different, but the temporal trends were similar. TCs have a certain impact on the changes in O3 concentrations in the YRD. According to the evolution and trajectory of TC weather, TCs affecting China are primarily from the northwest Pacific Ocean (Zhan et al., 2020; Wang et al., 2024a). As they develop and move, these TCs will have a significant impact on O3 concentrations in China (Xi et al., 2025). At this time, the YRD is located on the periphery of the TCs. Under the control of the periphery of the TCs, the strong downward airflow will make the YRD in stagnant weather conditions and inhibit the diffusion of pollutants (Shu et al., 2016), accompanied by high temperature, clear and dry weather conditions, which are the main weather conditions causing O3 pollution. With the evolution of TC weather system, when the TCs center gradually approaches the YRD until it is within a certain range, the YRD is no longer under the influence of the periphery of the TCs and comes under the control of the TC wind and rain belt. Strong winds and precipitation can significantly cleanse air pollutants, and thereby reduce O3 concentrations. After TCs dissipate, O3 pollution levels may rise again due to restored meteorological conditions conducive to O3 formation (Zhan et al., 2020). These results suggest that TCs can significantly affect O3 pollution in the YRD, highlighting the importance of implementing O3 control measures prior to TC landfall.
3.2 Main synoptic weather patterns in the YRD
Based on the analysis of O3 variation characteristics in the YRD, O3 concentrations were generally high from June to September, coinciding with the peak season of TC activity. We selected June to September during 2018–2022 as the research period and used the PTT weather classification method to classify the weather situation. SWPs in the YRD during this period were primarily divided into four categories. As shown in Table 1, SWP1 is the main SWP, occurring on 383 d and accounting for 62.79 % of the period. SWP2 and SWP4 followed, occurring on 81 and 80 d, respectively, with frequencies of 13.28 % and 13.11 %. SWP3 was less frequent, occurring on 10.82 % of days. Specifically, SWP1 was mainly influenced by the southwesterly flow introduced by the WPSH and the northeast China low, SWP2 by northwesterly flow introduced by a continental high and the northeast China low, SWP3 by southeasterly flow introduced by the WPSH, and SWP4 by northeasterly flow introduced by the WPSH and TCs.
Table 1The occurrence days and frequencies of various SWPs in the YRD from 2018 to 2022, average O3 concentrations and meteorological factors associated with each SWP.
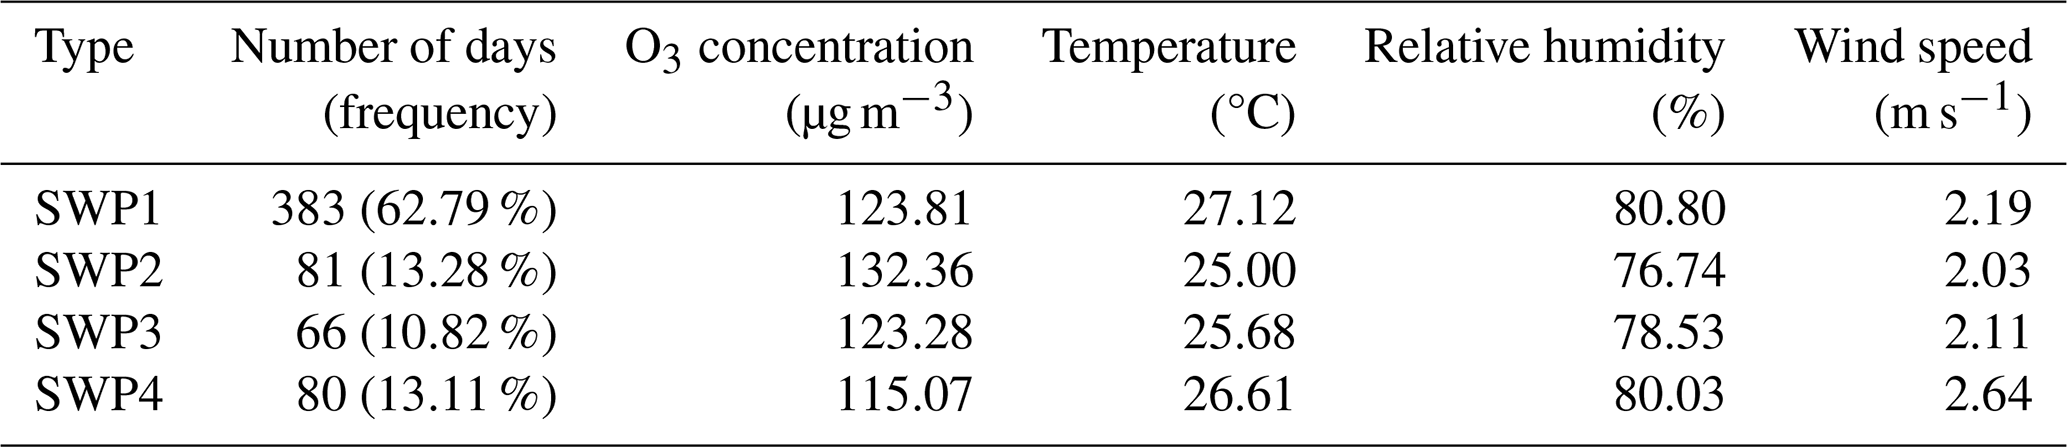
Statistics of average O3 concentrations and meteorological factors under each SWP indicate that SWP4 had the lowest average O3 concentration (115.07 µg m−3), whereas SWP2 had the highest value (132.36 µg m−3). O3 concentrations during SWP1 and SWP3 were similar, at 123.81 and 123.28 µg m−3, respectively. However, significant differences in O3 concentrations were observed among SWPs during the same period, highlighting the strong influence of circulation patterns on O3 pollution levels. SWP1 exhibited higher temperatures (27.12 °C), favoring increased O3 concentrations. SWP2 was influenced by dry northwesterly airflow, exhibiting lower humidity (76.74 %) and slower wind speed (2.03 m s−1), which hindered air pollutant dispersion and resulted in higher O3 concentrations. SWP3 was characterized by lower humidity (78.53 %) and slower wind speed (2.11 m s−1), which were key factors contributing to increased O3 concentration. Under SWP4, though TCs far from the coastline could lead to regional O3 pollution (in Sect. 3.3.2), the landfalling TCs could bring strong winds and rainstorms, increasing humidity (80.03 %) and wind speed (2.64 m s−1), which resulted in lower average O3 concentrations.
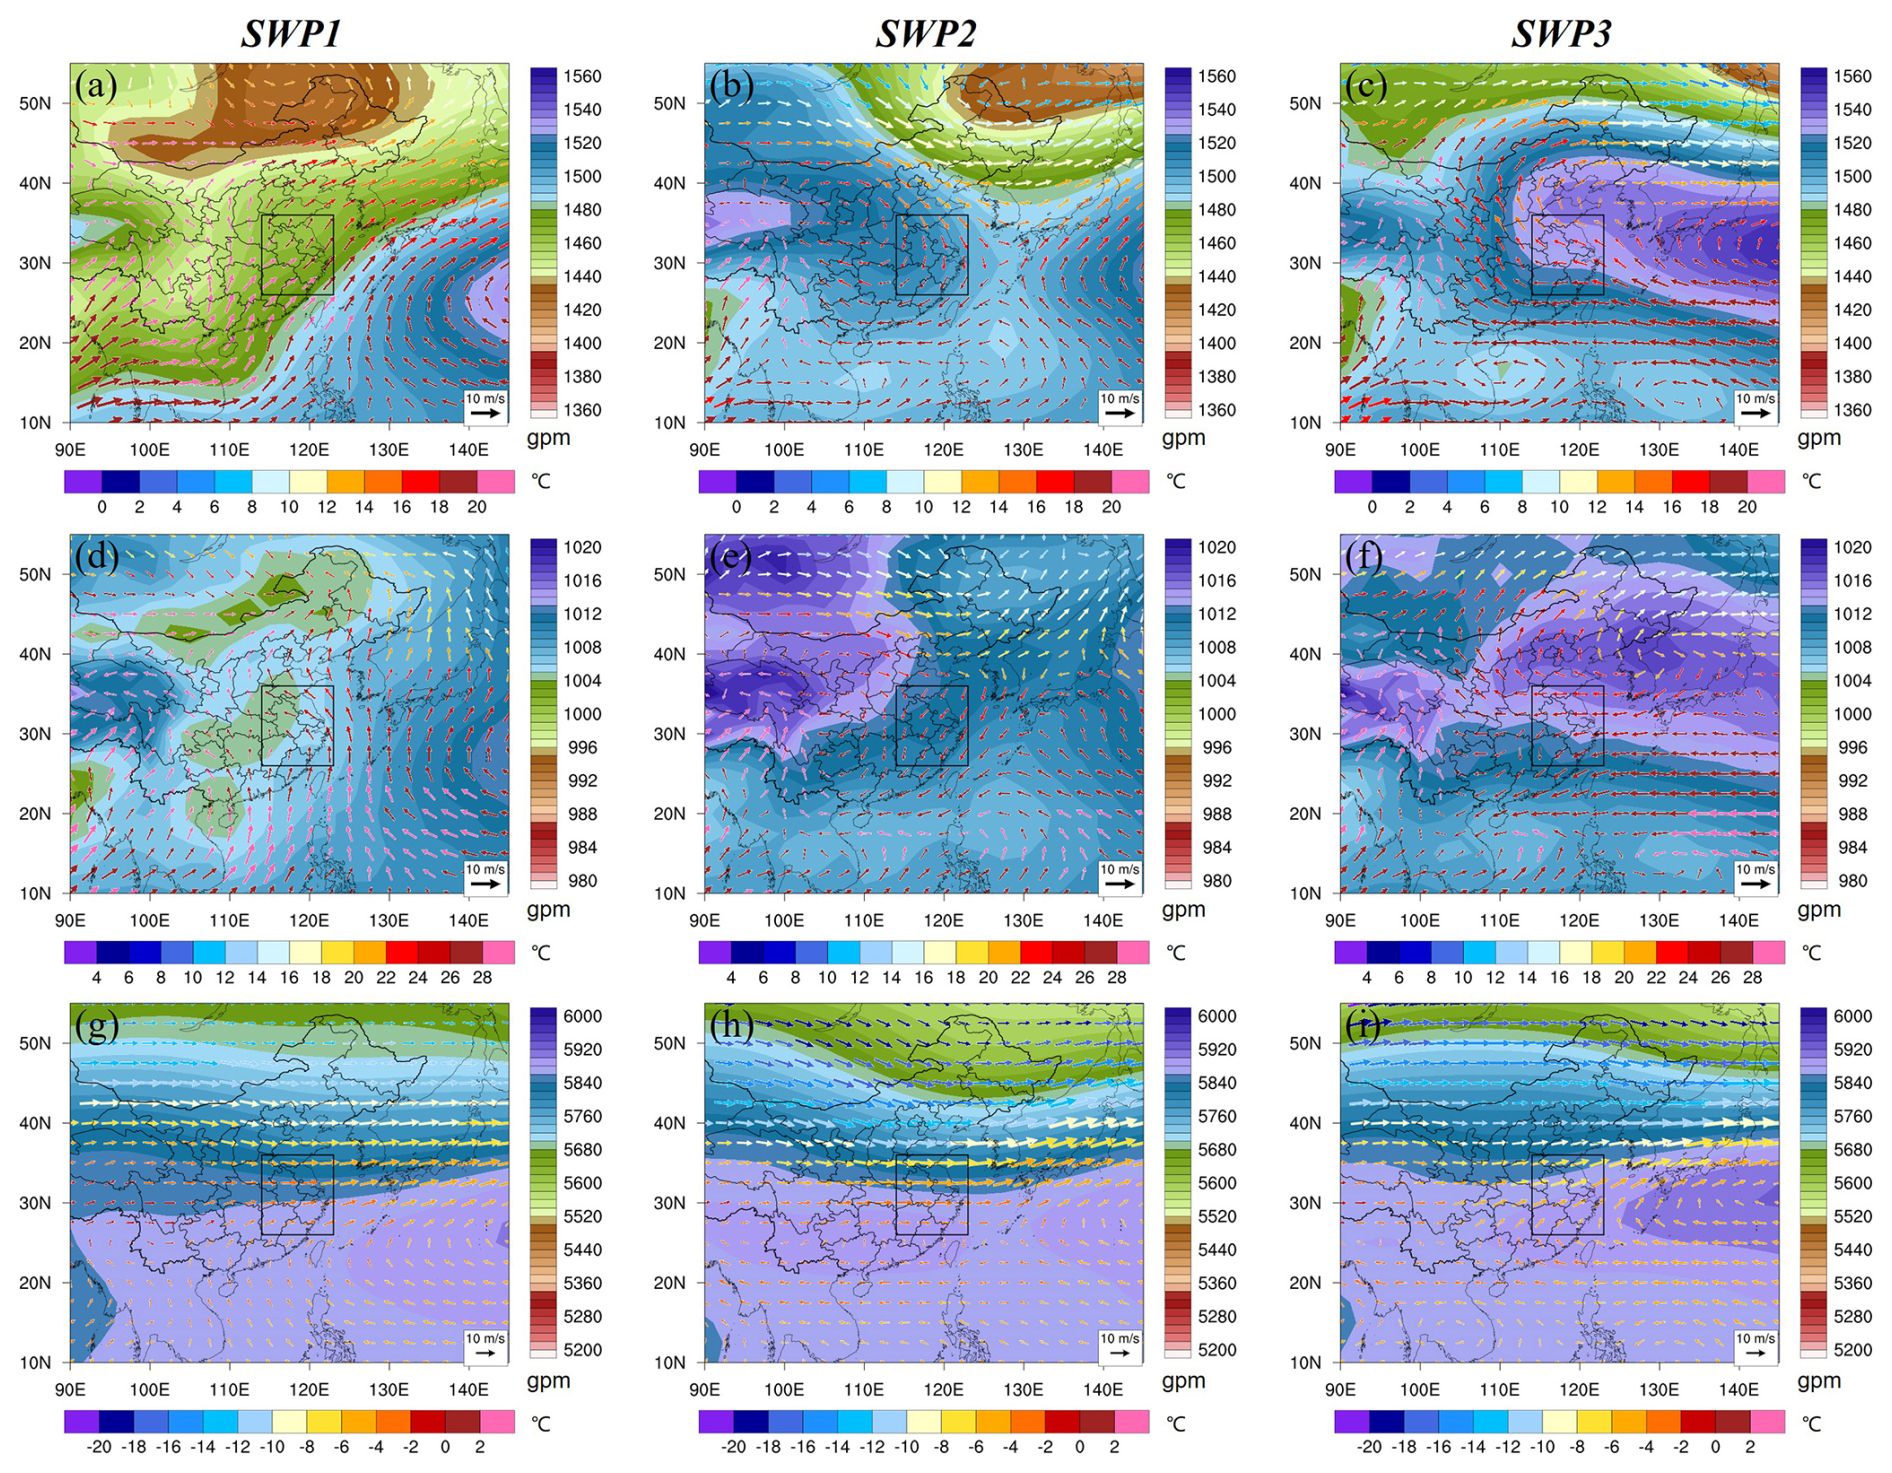
Figure 3The average weather conditions in SWP1, SWP2 and SWP3, including an 850 hPa geopotential height field superimposed on wind field (a–c), sea level pressure field superimposed on 1000 hPa wind field (d–f), a 500 hPa geopotential height field superimposed on wind field (g–i). In panels (a)–(i), shading represents geopotential height and color vectors represent wind with temperature. The black frame in panels (a)–(i) includes the YRD.
Figure 3 illustrates the three-dimensional atmospheric circulation structures of SWP1, SWP2, and SWP3. For SWP1, at 850 hPa, the YRD was located northwest of the WPSH and south of the northeast China low. This influence was controlled by southwesterly flow, which was jointly guided by the WPSH and the northeast China low (Fig. 3a). Warmer southerly winds promoted temperature increases in the YRD, and elevated temperatures enhanced photochemical reactions producing O3. At sea level, the WPSH shifted northeastward, influencing the YRD through southerly flow (Fig. 3d). These southerly winds transported pollutants from the PRD to the YRD. The combined effects of enhanced photochemical reactions and interregional advection contributed to elevated O3 concentrations in the YRD under SWP1. At 500 hPa, the YRD was dominated by straight westerly flows (Fig. 3g), indicating intensified subsidence.
For SWP2, the YRD was located east of the continental high and southwest of the northeast China low. This influence was driven by northwesterly flow, which was jointly guided by the continental high and the northeast China low (at 850 hPa, Fig. 3b). These dry northwesterly winds significantly reduced relative humidity in the region. At sea level, the YRD was primarily controlled by the continental high (Fig. 3e). At 500 hPa, downward airflow strengthened over the northern YRD behind the trough (Fig. 3h). The significantly lower relative humidity and slower wind speeds favored the formation and accumulation of O3, ultimately leading to increased O3 concentrations under this pattern.
For SWP3, at 850 hPa, the YRD was located southwest of the WPSH and was controlled by southeasterly flow at its southern edge (Fig. 3c). This southeasterly airflow from the ocean increased regional humidity and lowered temperatures. At sea level, the WPSH shifted northward, and the YRD was affected by easterly winds controlled by a tropical depression (Fig. 3f). At 500 hPa, the YRD was located near the edge of the WPSH or close to a low-pressure trough (Fig. 3i). As the WPSH weakened and retreated eastward, its intensity and position suppressed convective activity, leading to a dominant downdraft. This downdraft, combined with lower horizontal wind speeds, hindered the diffusion of pollutants, resulting in increased O3 concentrations.
3.3 The important role of TCs on regional O3 pollution
3.3.1 The impact of TC weather pattern (SWP4) on O3 pollution in the YRD
Figure 4 illustrates the three-dimensional atmospheric circulation structure under the TC weather pattern (SWP4). For the TC weather pattern, similar circulation conditions were observed at 850 hPa (Fig. 4a) and at sea level (Fig. 4b). The YRD was located northwest of the TCs and was controlled by northeasterly flow guided by the TCs. The direction and intensity of the northeast wind had a significant impact on meteorological conditions and pollutant transport in the YRD. At 500 hPa, the region was dominated by westerly or northwesterly flow (Fig. 4c). Meanwhile, the peripheral downward airflow associated with lower-level TCs (Fig. 4d) led to a more stagnant atmosphere over the YRD. As the TC approaches the YRD, strong northeasterly flow increased clean sea airflow transportation to the region, lowered temperatures and increased humidity, creating unfavorable meteorological conditions for photochemical reactions. Furthermore, higher wind speeds facilitated air pollutant elimination, leading to a decrease in O3 concentrations in the region (Table 1).
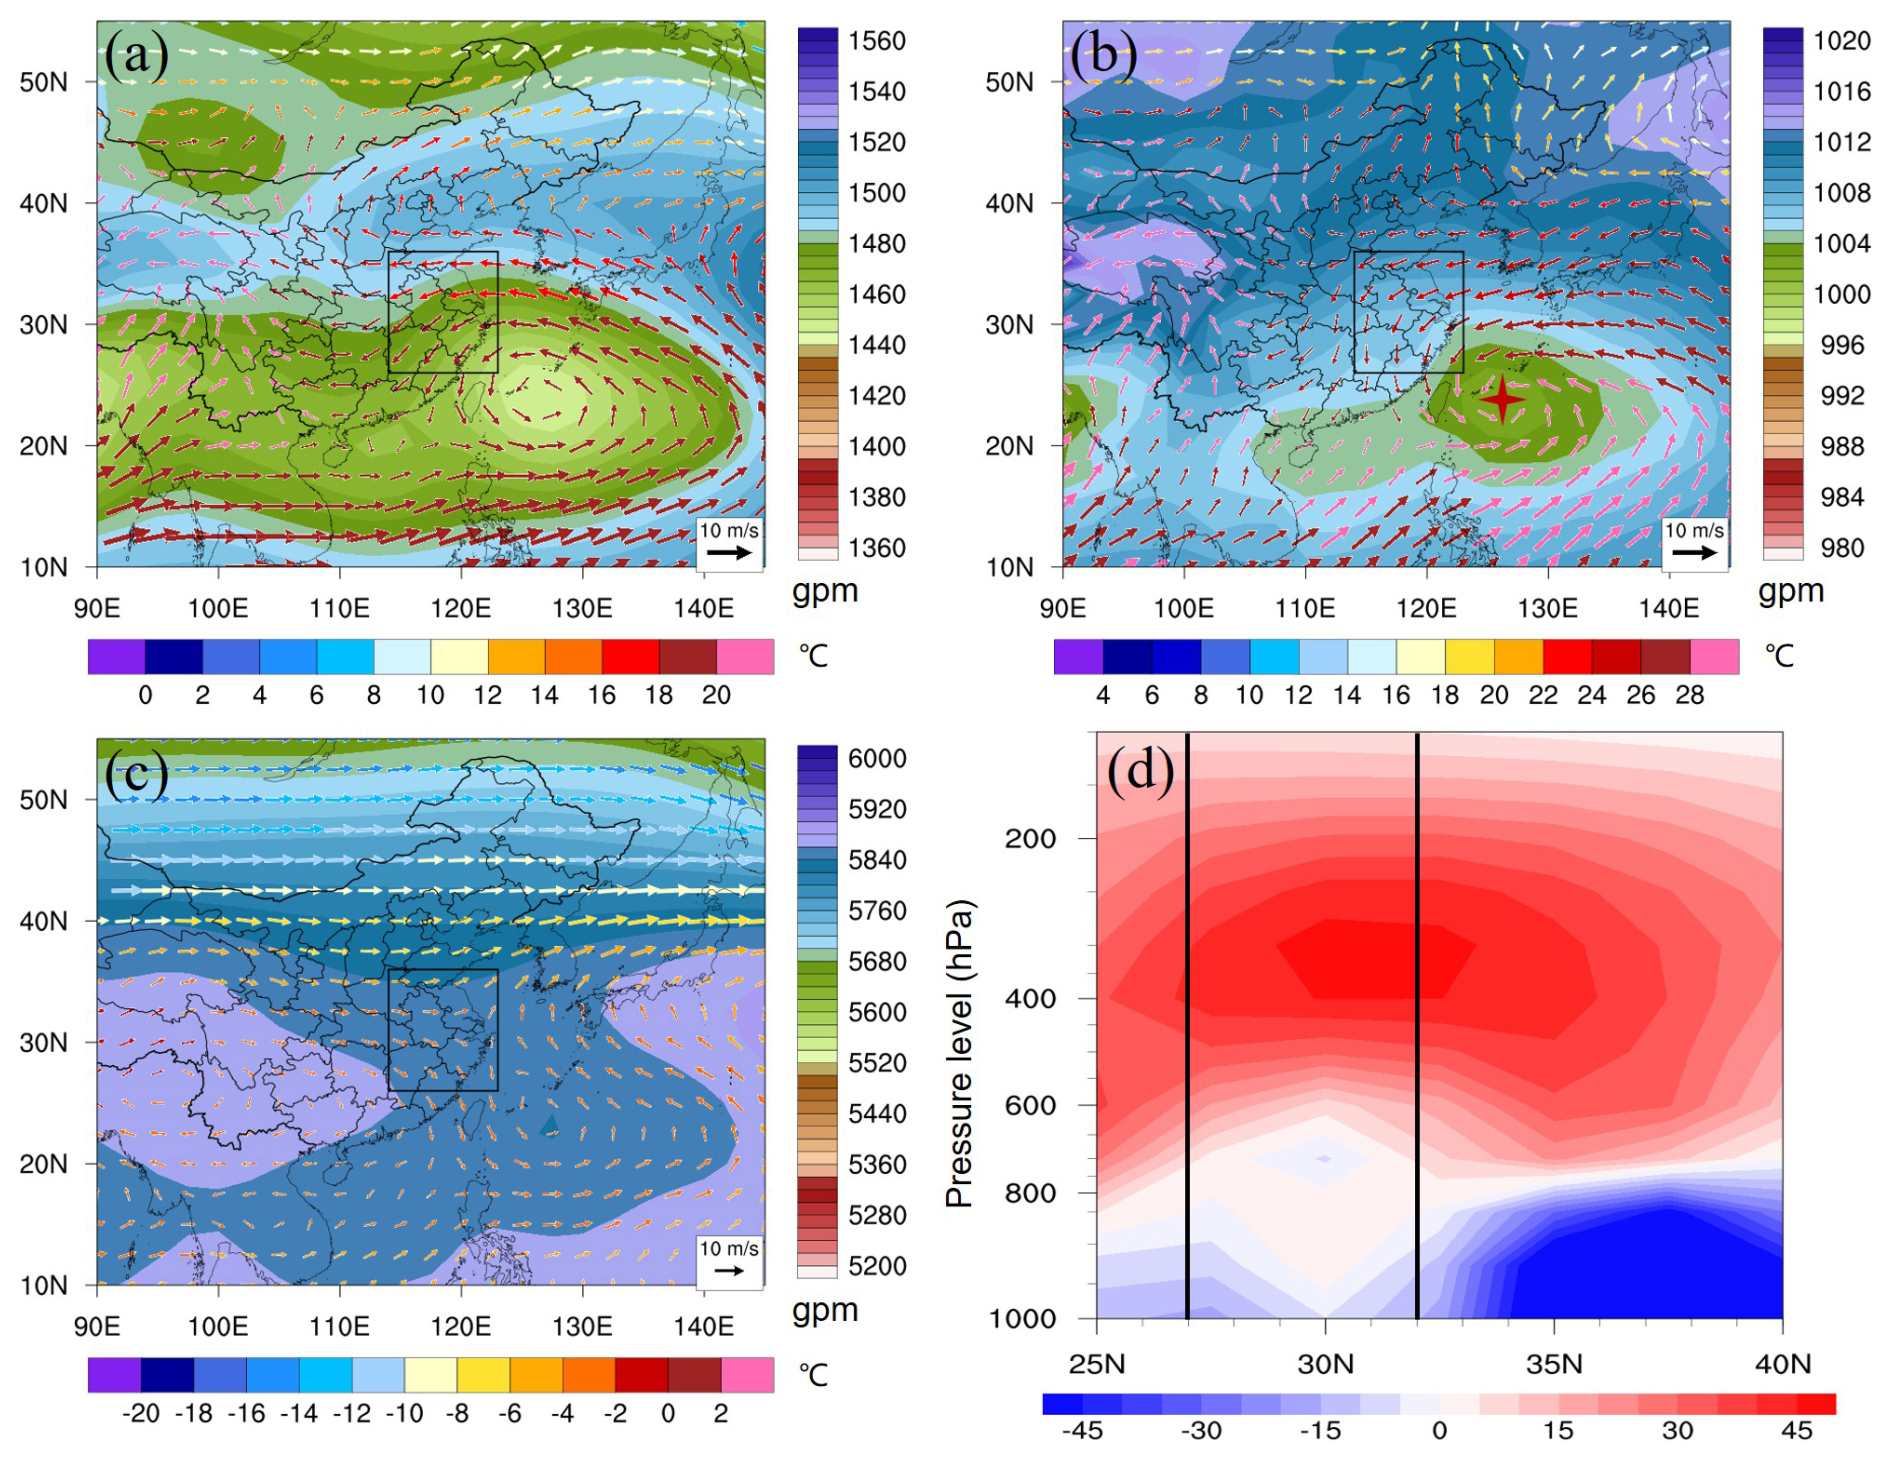
Figure 4The average weather conditions in SWP4, including an 850 hPa geopotential height field superimposed on wind field (a), sea level pressure field superimposed on 1000 hPa wind field (b), a 500 hPa geopotential height field superimposed on wind field (c), height-latitude cross-sections of vertical velocity (unit: 10−2 Pa s−1) between 25 and 40° N (d). In panels (a)–(c), shading represents geopotential height and color vectors represent wind with temperature. The black frame in panels (a)–(c) and the vertical line area in panel (d) includes the YRD.
3.3.2 Changes of atmospheric circulation field with different O3 pollution levels under TC weather pattern
To better explore the relationship between O3 pollution and the TC weather pattern (SWP4), O3 pollution was further classified into clean type (C), local pollution type (LP), and regional pollution type (RP) based on pollution characteristics. RP was defined as all days when more than 20 % (> 5) of the 26 cities in the YRD recorded a maximum daily O3 concentration exceeding 160 µg m−3, LP was defined as all days when fewer than 20 % (< 5) of the 26 cities in the YRD recorded a maximum daily O3 concentration exceeding 160 µg m−3, and C included the remaining days not classified as LP or RP. Table 2 presents the number of days and frequencies of C, LP, and RP under SWP4. The frequencies of SWP4_C, SWP4_LP, and SWP4_RP were 56.25 %, 18.75 %, and 25.00 %, respectively. The average O3 concentrations under these three types were 93.46, 126.97, and 161.19 µg m−3. The clean type occurred more than half the time, contributing to the lower average O3 concentration (115.07 µg m−3) under SWP4 (Table 1). Under the TC weather pattern, meteorological factors corresponding to different O3 pollution characteristics varied significantly (Table 2). As pollution levels increased, regional air temperatures gradually rose, relative humidity decreased, and surface wind speeds decreased significantly. These high temperatures, low humidity, and low wind speeds created favorable conditions for O3 formation and accumulation. Higher temperatures accelerated photochemical reactions, thereby promoting O3 production. Low humidity reduced the inhibitory effect of water vapor on photochemical reaction chains, favoring further O3 accumulation. Reduced wind speeds led to poor atmospheric diffusion, hindering the dilution and transport of precursors and O3. Overall, as pollution levels increased, meteorological conditions under the TC weather pattern gradually became more favorable for O3 formation and accumulation.
Table 2The number of days and frequency of occurrence of clean type (C), local pollution type (LP), and regional pollution type (RP) under each SWP, average O3 concentrations and meteorological factors associated with each type.
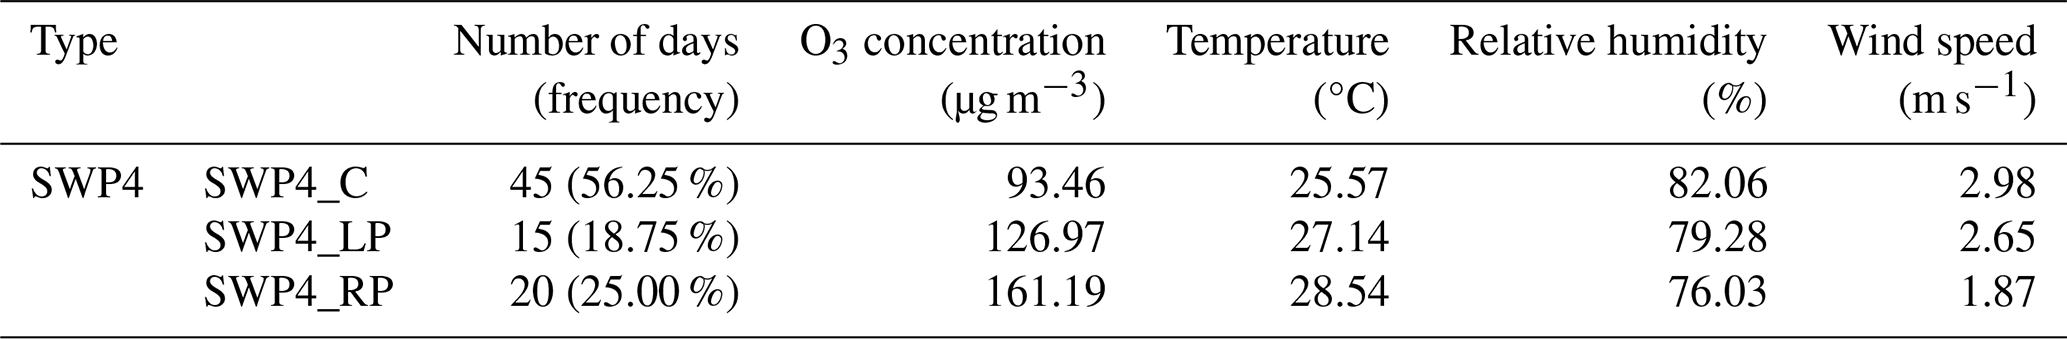
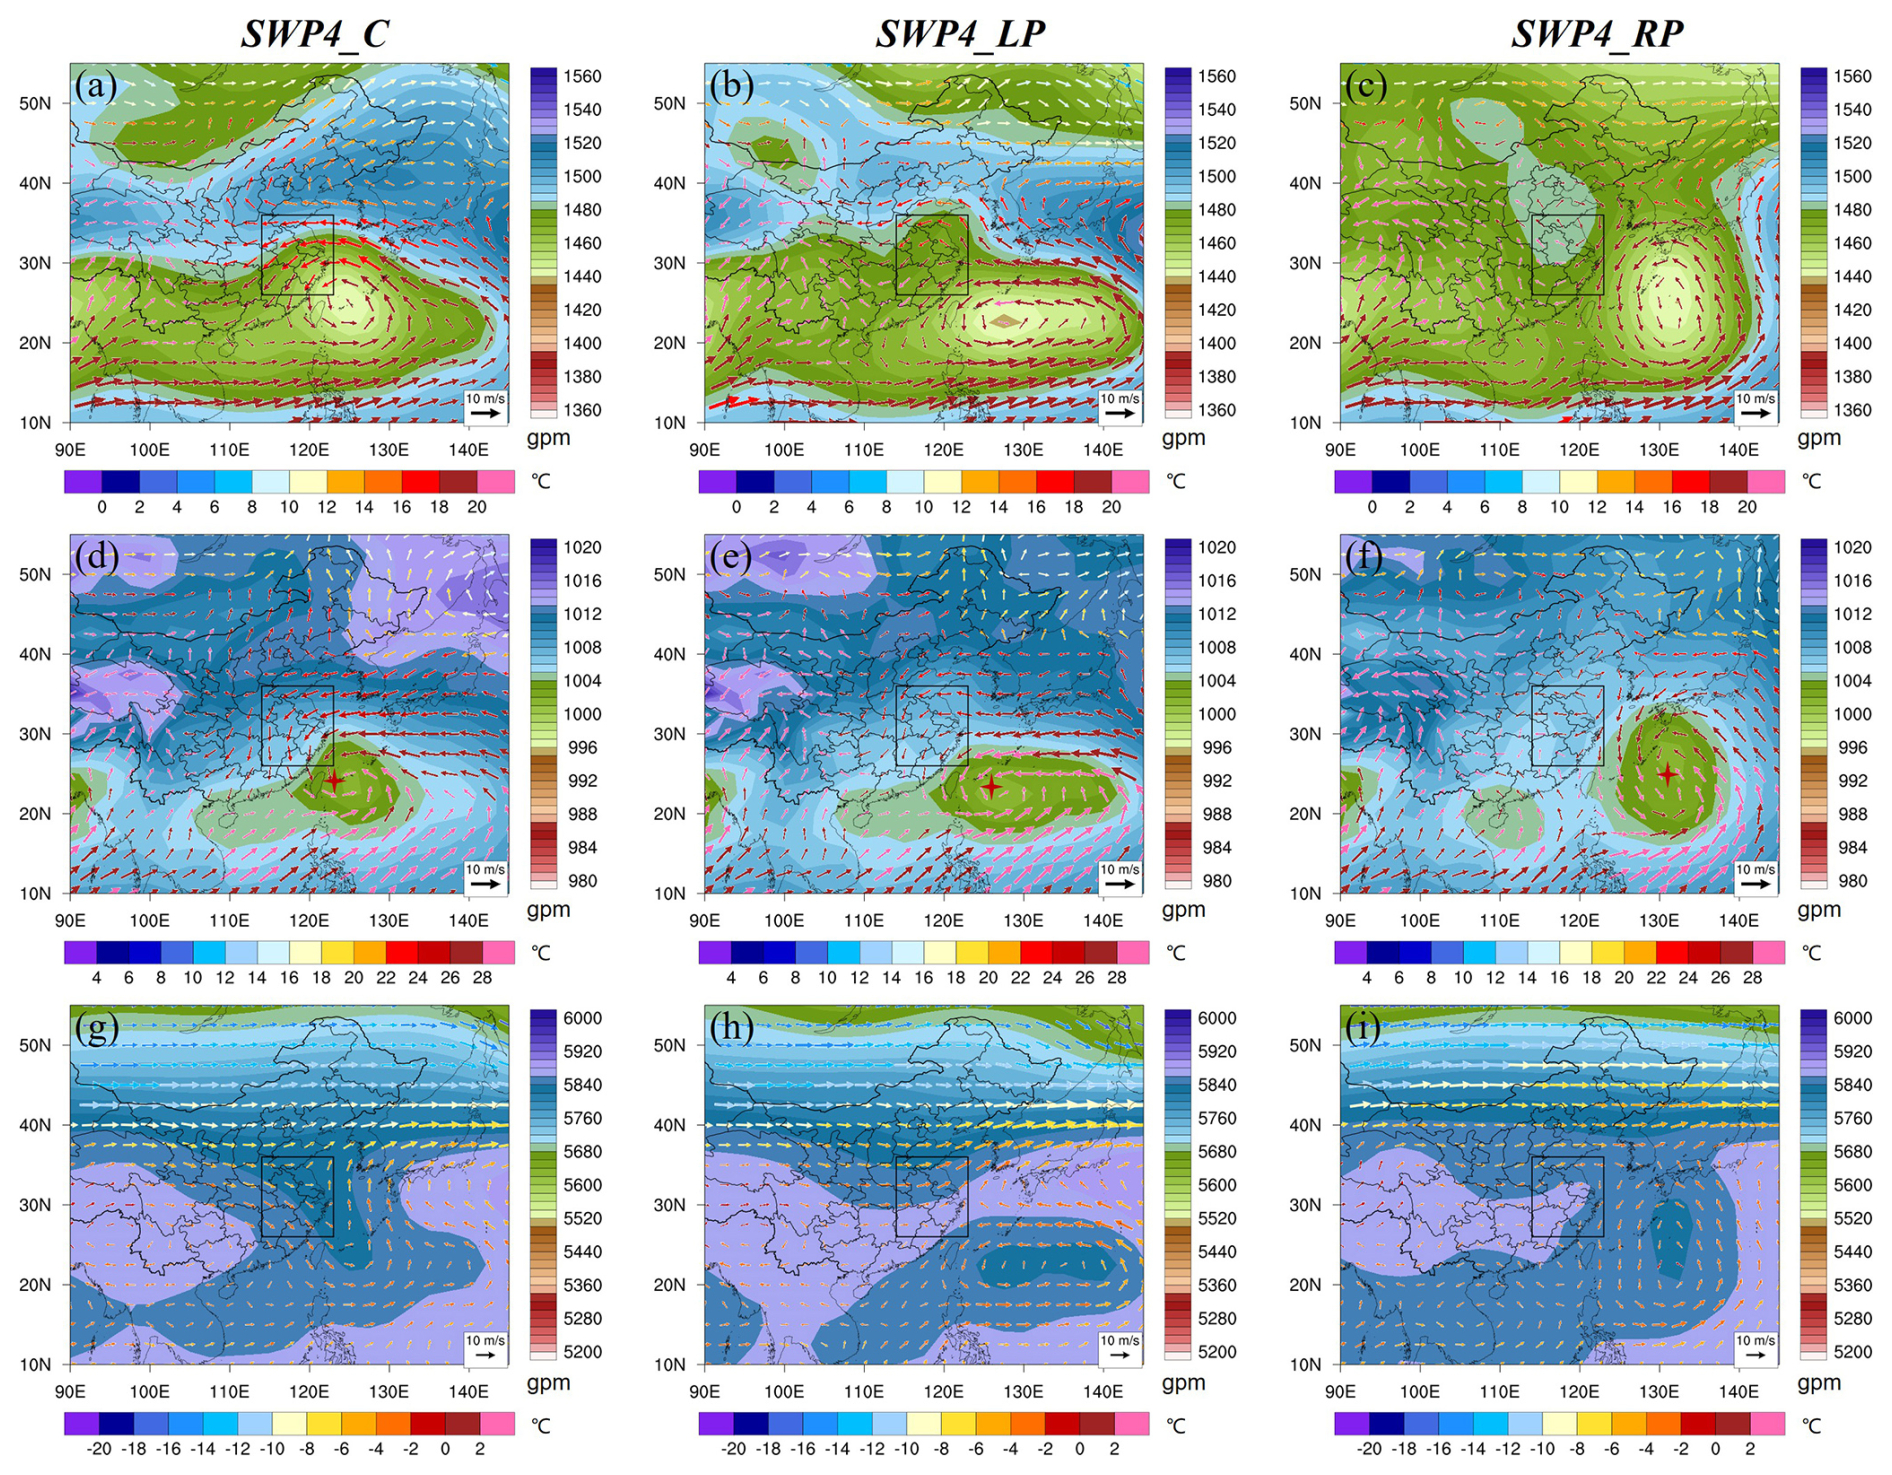
Figure 5The average weather conditions in SWP4_C (a, d, g), SWP4_LP (b, e, h), and SWP4_RP (c, f, i), including an 850 hPa geopotential height field superimposed on wind field (a–c), sea level pressure field superimposed on 1000 hPa wind field (d–f), a 500 hPa geopotential height field superimposed on wind field (g–i). The shading represents geopotential height, black vectors represent wind and the black frame includes the YRD, and the red asterisk in panels (d)–(f) indicates the location where the TCs made landfall.
Figure 5 illustrates the structural characteristics of the three-dimensional atmospheric circulation fields corresponding to different O3 pollution levels (SWP4_C, SWP4_LP, and SWP4_RP) under SWP4. For SWP4_C, at 850 hPa, the YRD was controlled by the TCs (Fig. 5a). The TCs brought strong winds and rainstorms to the YRD, which were not conducive to the accumulation of air pollutants or to O3 formation via photochemical reactions. Simultaneously, high wind speeds and rainfall facilitated pollutant removal. When the TCs made landfall in the YRD (Fig. 5d), significant updrafts occurred in the lower atmosphere, favoring pollutant dispersion. Consequently, clean days were observed in the YRD under the influence of TCs. For the local and regional pollution patterns (SWP4_LP and SWP4_RP), TCs were generally 500–1000 km from the YRD coastline (Fig. 5e and f). Previous studies have shown that downdrafts caused by the outer airflow of TCs before landfall led to more stable atmospheric conditions (Zhan et al., 2020; Zhan and Xie, 2022). Under SWP4_LP and SWP4_RP, the YRD experienced higher temperatures and lower humidity (Table 2). These meteorological conditions favored O3 formation, leading to the occurrence of O3 pollution events.
For SWP4_LP, the warm high pressure over North China weakened, and the TC shifted westward, closer to the coastline (Fig. 5e). At 850 hPa, pollutant air masses from the PRD were transported to the YRD, but were diluted by clean air from the ocean (Fig. 5b). Compared to SWP4_RP, SWP4_LP had stronger winds and higher relative humidity (Table 2). Consequently, O3 pollution in the YRD was slightly lower under SWP4_LP than under SWP4_RP. For SWP4_RP, the warm high pressure over North China weakened further, and the TC shifted eastward compared to SWP4_LP (Fig. 5c). The YRD was dominated by strong downdrafts induced by the peripheral flows of the TC (Fig. 5f). This downdraft reinforced stagnant weather, suppressed convective activity, and hindered pollutant dispersion (Shu et al., 2016; Xi et al., 2025). Combined with meteorological analysis in Table 2, the temperature in the YRD under SWP4_RP was higher (28.54 °C), the relative humidity was lower (76.03 %), and the wind speed was slower (1.87 m s−1), all of which favored photochemical reactions and limited pollutant dispersion. Furthermore, downdrafts induced by the peripheral flows of the TC promoted pollutant accumulation, significantly increasing the frequency of O3 pollution. In summary, when the TC was located at 130–135° E and 20–30° N, the YRD was influenced by its sinking airflow, facilitating the formation of O3 pollution.
3.4 To what extent TCs impact regional O3 pollution in the YRD
3.4.1 The role of changes in the intensity and frequency of SWPs in the reconstruction of the annual variation series of O3
Different dominant SWPs produced varying near-surface meteorological conditions, which in turn affected atmospheric processes such as O3 photochemical production, transport, diffusion, and wet and dry deposition. Changes in the frequency and intensity of SWPs were two key factors influencing O3 concentration variations. We reconstructed the annual time series of O3 concentrations from June to September between 2018 and 2022 by considering only changes in SWP frequency (fre) and changes in both SWP intensity and frequency (fre + int). In our study, we first removed the influence of emission sources on O3 concentrations based on the results of Yan et al. (2024). Subsequent analyses were conducted using O3 concentration series that were free from emission source influences. Using the O3 trend reconstruction method, we quantified the contribution of SWPs to annual variations in O3 concentrations from June to September.
Figure 6 illustrates the annual variations of reconstruction O3 concentrations from June to September during 2018 to 2022. When only changes in SWP frequency were considered, the reconstructed time series was relatively flat and did not adequately capture the variation trend of O3 concentrations. Therefore, changes in SWP frequency had minimal impact on the annual variation of O3. When changes in SWP intensity were considered, the reconstructed series more closely resembled the original annual variation series. Therefore, compared to changes in SWP frequency, changes in SWP intensity contributed more to variations in O3 concentration. To accurately assess the impact of both SWP frequency and intensity on annual O3 variation, we quantitatively calculated their contributions. The contribution index was defined as the ratio of the interannual variation amplitude of the reconstructed series to that of the original series, i.e., (O3max of the reconstructed series − O3min of the reconstructed series) (O3max of the original series − O3min of the original series). When only changes in SWP frequency were considered, their contribution to the interannual variation was 10.05 %. When changes in SWP intensity were additionally included, the contribution increased to 69.66 %. This indicates that, compared with changes in SWP frequency, changes in SWP intensity played a more important role in driving interannual variations in O3 concentrations.
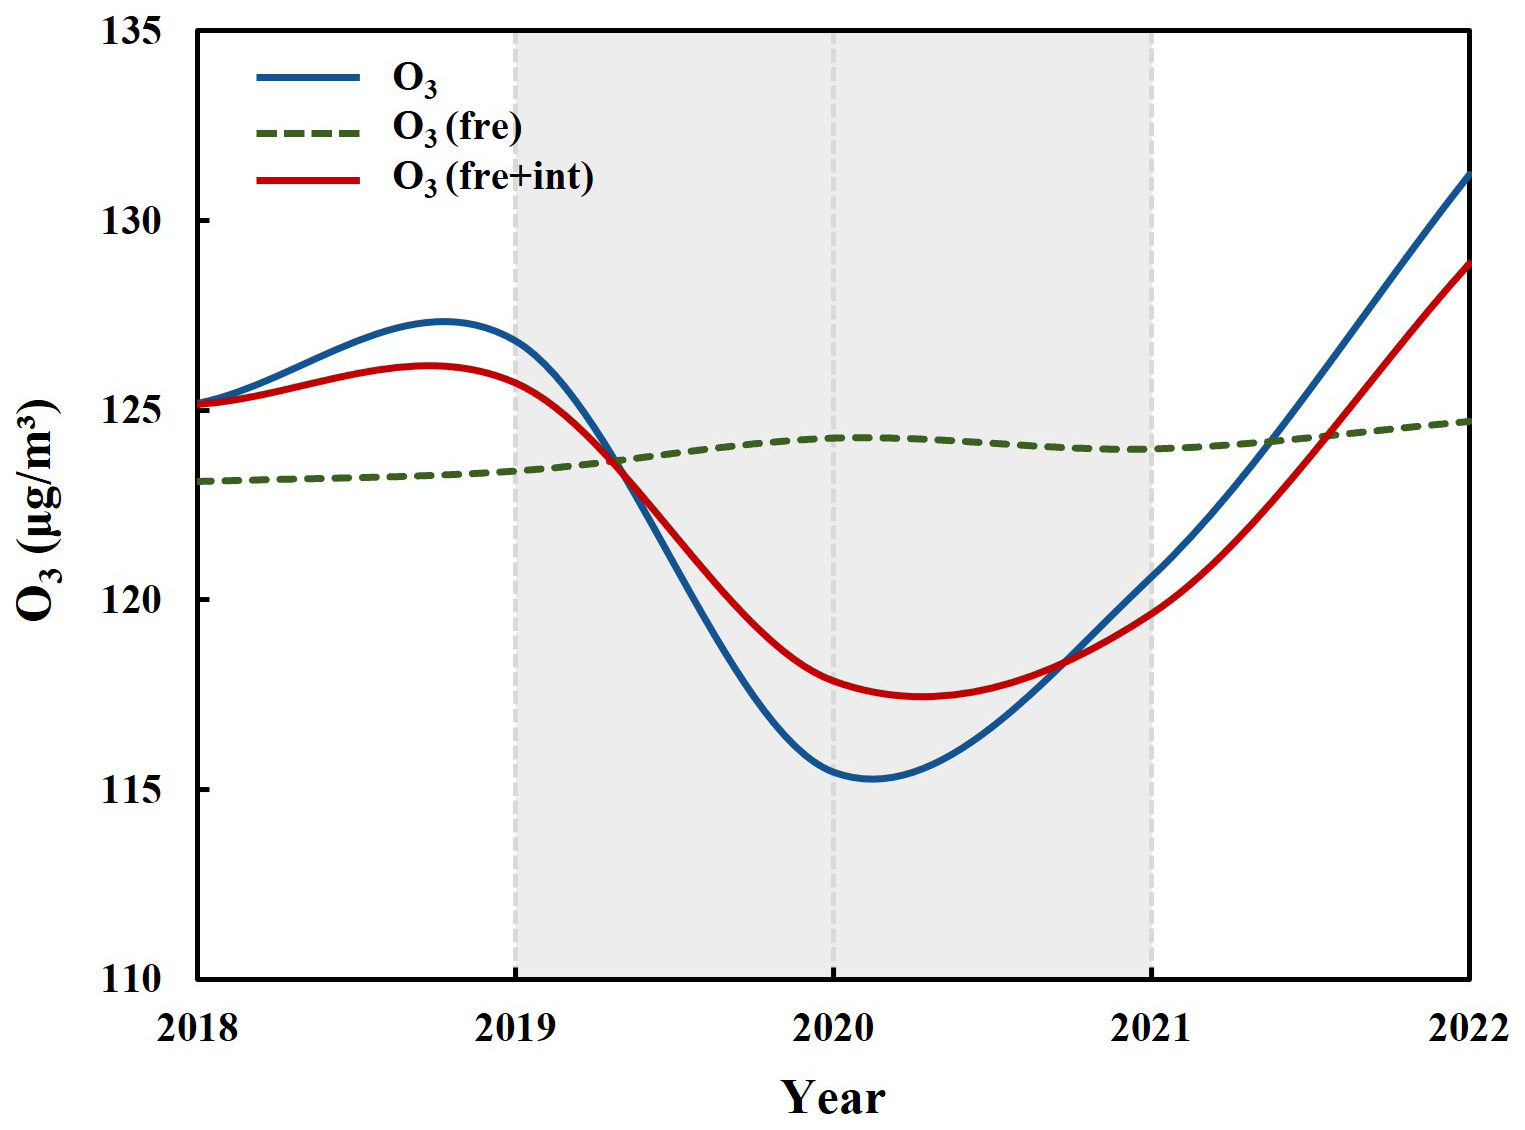
Figure 6The trend of the interannual O3 concentration time series from June to September during 2018 to 2022 in the YRD. The blue line represents the original interannual O3 time series, whereas the green and red lines represent the trends of reconstructed O3 concentrations according to the frequency-only and both frequency and intensity of SWP changes, respectively.
Table 3Correlation coefficients between the O3 concentration time series and different SWP intensity factors under each SWP.
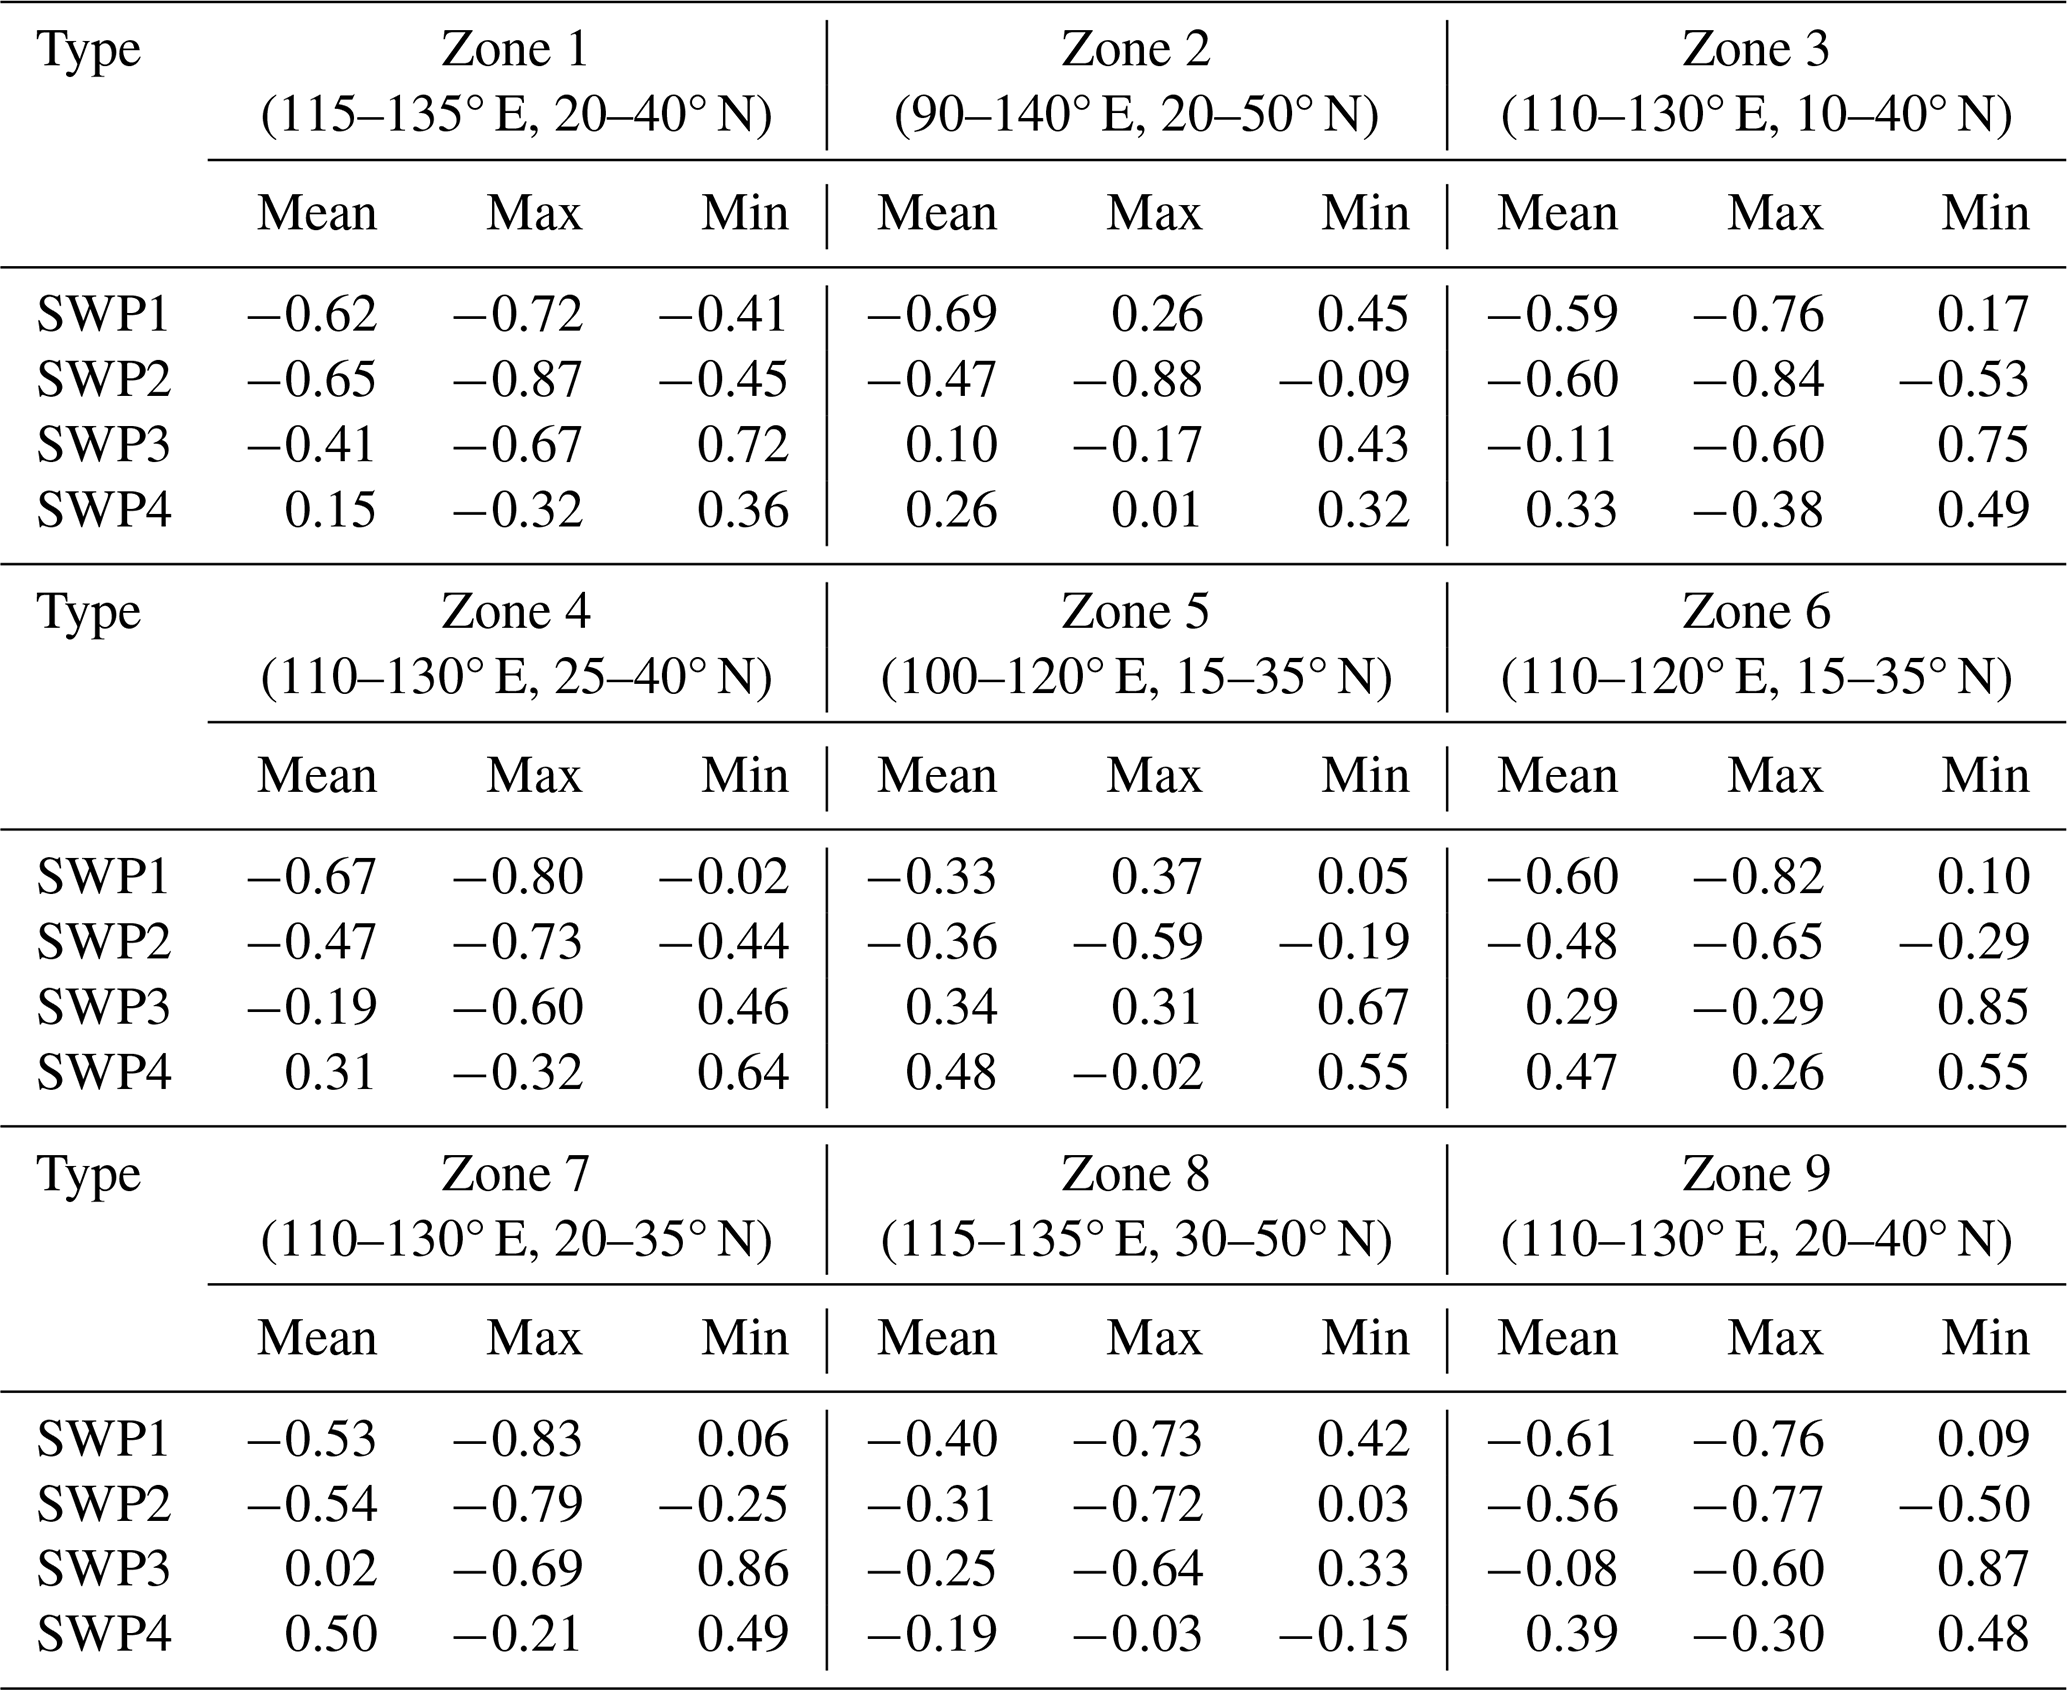
In reconstructing the time series of annual O3 concentrations, we found that the definition of the SWP intensity factor played a crucial role in the reconstruction. Previous studies reconstructed the annual O3 concentration series by defining the SWP intensity factor as either the regional mean sea level pressure or the regional minimum pressure (Hegarty et al., 2007; Liu et al., 2019). However, this definition showed poor correlation between the SWP intensity factor and the annual O3 concentration series for certain SWPs. Therefore, we defined the SWP intensity factor for each SWP based on its specific meteorological characteristics, selecting the maximum, minimum, and mean geopotential heights across nine zones, and evaluated its validity by calculating the correlation coefficient with the annual O3 variation series (Table 3). For SWP1 and SWP2, the maximum geopotential heights in zone 7 and zone 2 were highly correlated with the annual O3 variation series. For SWP3 and SWP4, the minimum geopotential heights in zone 9 and zone 4 were highly correlated with the annual O3 variation series. The maximum geopotential height reflects regional wind speeds, which determine the amount of water vapor transported into the region. Compared with SWP1, SWP2 has a larger weather system scale, so the maximum geopotential height in zone 2 shows a stronger correlation with the O3 series than that in zone 7. For SWP4, the YRD was affected by TCs, and O3 concentrations were closely related to TC intensity. The minimum geopotential height in zone 4 reflects the TC intensity. When the SWP intensity factor was defined based on the unique meteorological characteristics of each SWP, the reconstructed series more accurately reflected the impact of changes in SWP intensity on O3 concentrations.
3.4.2 Changes in TCs and the effects on O3 concentration over the YRD in the future
After clarifying the relationship between SWPs and O3 pollution, future trends of O3 concentrations under different scenarios were estimated based on projected changes in SWPs. Due to its unique geographical location, the YRD was subject to relatively complex weather systems. The PTT method was used to classify the weather conditions in the YRD from June to September under the SSP2-4.5 and SSP5-8.5 scenarios into four main categories. SWP1 was mainly controlled by southwesterly flow associated with the WPSH and the northeast China low, SWP2 by northwesterly flow associated with a continental high and the northeast China low, SWP3 by southeasterly flow associated with the WPSH, and SWP4 by northeasterly flow associated with the WPSH and TCs. Figure 7 illustrates the distribution of days for each SWP from June to September in the YRD during the historical period and under the SSP2-4.5 and SSP5-8.5 future scenarios. According to the average O3 concentration of each SWP during the historical period (Table 1), SWP1 and SWP2 with higher O3 concentrations are classified as high-average O3 patterns. The average annual number of days during the historical period was 92.8. The high-average O3 pattern occurred most frequently in 2022, with 98 d and higher O3 concentrations. This confirms that changes in SWP frequency, which characterize specific O3 concentration patterns, could influence O3 concentration trends to a certain extent (Hegarty et al., 2007).
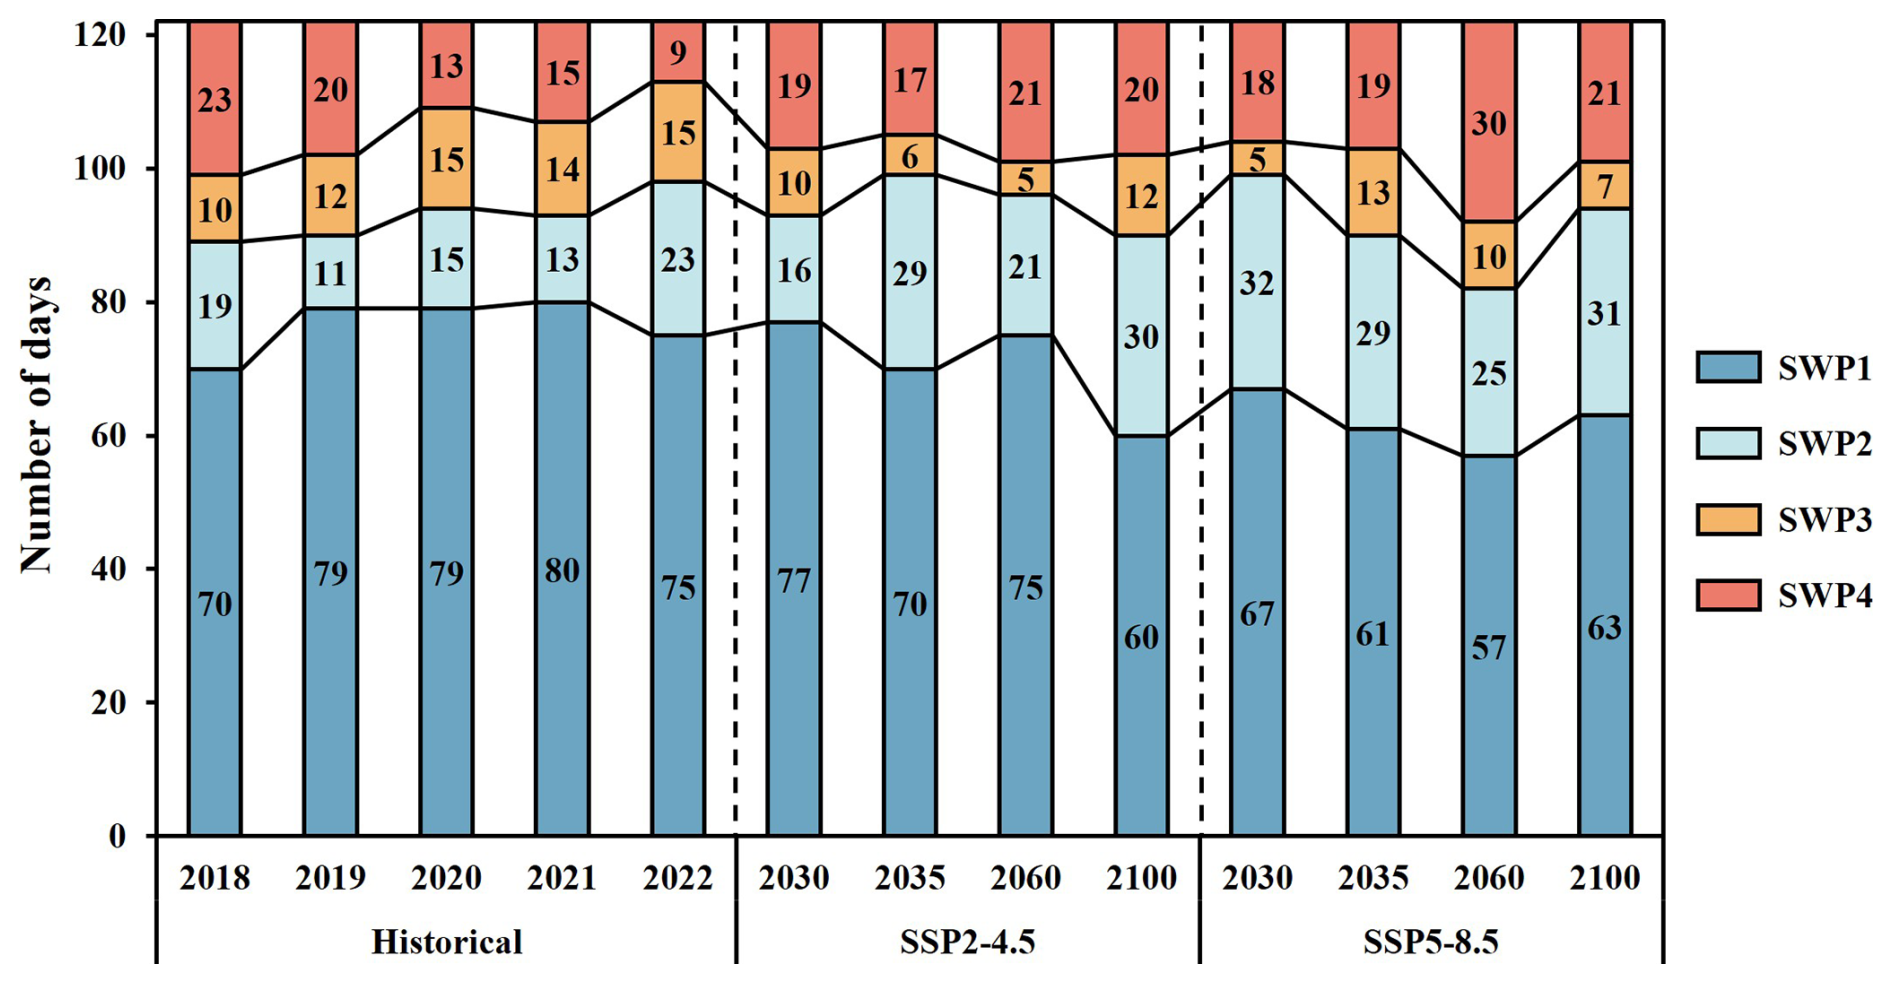
Figure 7Distribution of the number of days of occurrence of each SWP in the YRD from June to September under the historical period (2018–2022), SSP2-4.5, and SSP5-8.5 future scenarios.
Under the SSP2-4.5 scenario, the frequencies of SWP1 to SWP4 were 57.79 %, 19.67 %, 6.76 %, and 15.78 %, respectively (Fig. 10). High-average O3 pattern occurred on 93, 99, 96, and 90 d in 2030, 2035, 2060, and 2100, respectively, showing a general increasing trend, with the peak occurring in 2035. These results suggest that, considering only changes in SWP frequency, O3 concentrations would reach a maximum in 2035 under the SSP2-4.5 scenario. Under the SSP5-8.5 scenario, the frequencies of SWP1 to SWP4 were 50.82 %, 23.98 %, 7.17 %, and 18.03 %, respectively (Fig. 10). High-average O3 pattern will occur on 99, 90, 82, and 94 d in 2030, 2035, 2060, and 2100, respectively, under the SSP5-8.5 scenario, with the number of days increasing in 2030 and 2100. This also suggests that, considering only changes in SWP frequency, O3 concentrations would increase in 2030 and 2100 under the SSP5-8.5 scenario.
Due to the frequent occurrence of TCs in the YRD from June to September, they not only brought extreme weather events but also had a significant impact on regional O3 pollution. We further examined changes in the number of days under the TC weather pattern (SWP4). During the historical period (2018–2022), the annual average number of days with TC weather pattern in the YRD was 16 (Fig. 8). Under the SSP2-4.5 future scenario, this number increased to 19, 17, 21, and 20 d in 2030, 2035, 2060, and 2100, respectively. This indicates that the number of days with TC weather pattern increased to varying degrees, with the lowest number of days in 2035. Under the SSP5-8.5 future scenario, this number increased to 18, 19, 30, and 24 d in 2030, 2035, 2060, and 2100, respectively. Similarly, under the SSP5-8.5 future scenario, the number of days with the TC weather pattern in the YRD increased to varying degrees. Overall, the frequency of TCs affecting O3 concentrations in the YRD increased significantly under both future scenarios.
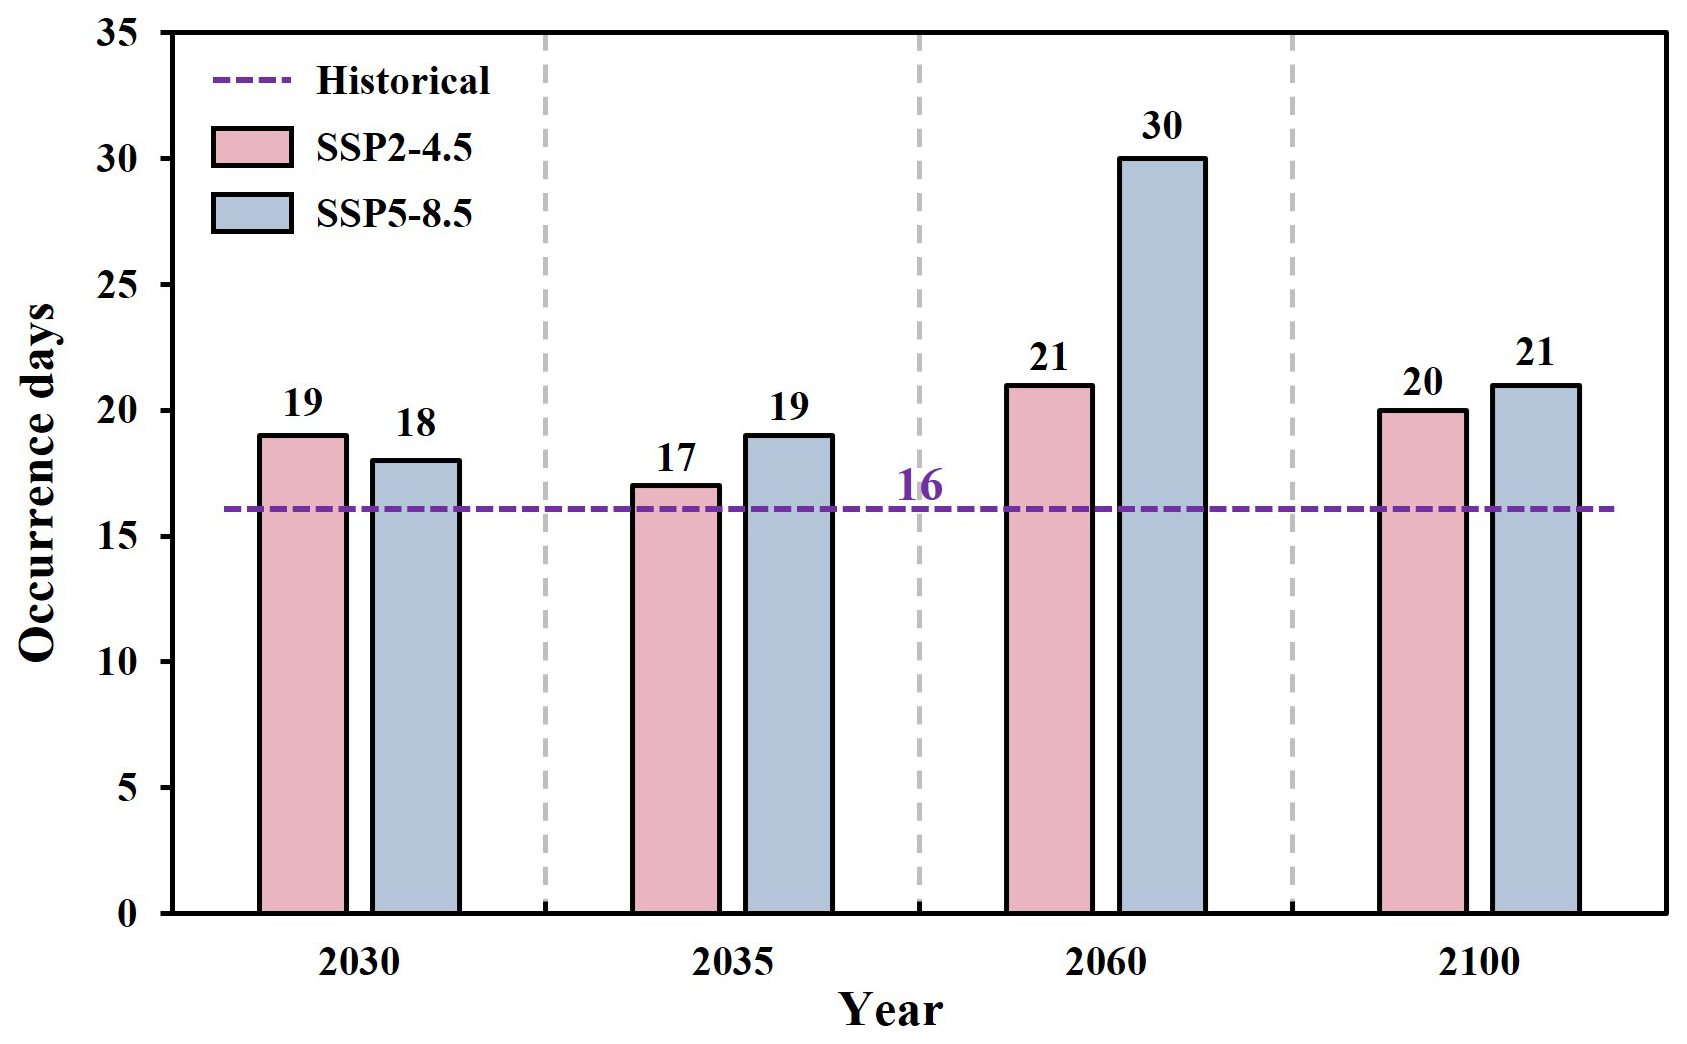
Figure 8Occurrence days of TCs SWP under the historical period, SSP2-4.5 and SSP5-8.5 future scenarios in the YRD from June to September.
3.4.3 Reconstruction of annual O3 variability in the YRD under future scenarios
Based on the SWP classification results and the reconstructed empirical relationships, statistical projections of the annual O3 concentration series from June to September were made for the SSP2-4.5 and SSP5-8.5 scenarios. Figure 9 compares the reconstructed annual O3 concentration series from June to September with the historical period. When considering only changes in SWP frequency, the reconstructed O3 series under the SSP2-4.5 scenario peaked in 2035. The reconstructed O3 series under the SSP5-8.5 scenario increased in 2030 and 2100, consistent with the conclusions drawn in Sect. 3.4.2. However, overall, the reconstructed series from 2018 to 2022 indicated that changes in SWP frequency had little impact on the annual O3 variation, and the reconstruction could not accurately capture the actual trend. After incorporating changes in the SWP intensity factor, the reconstructed annual O3 series more closely reflected the actual trend.
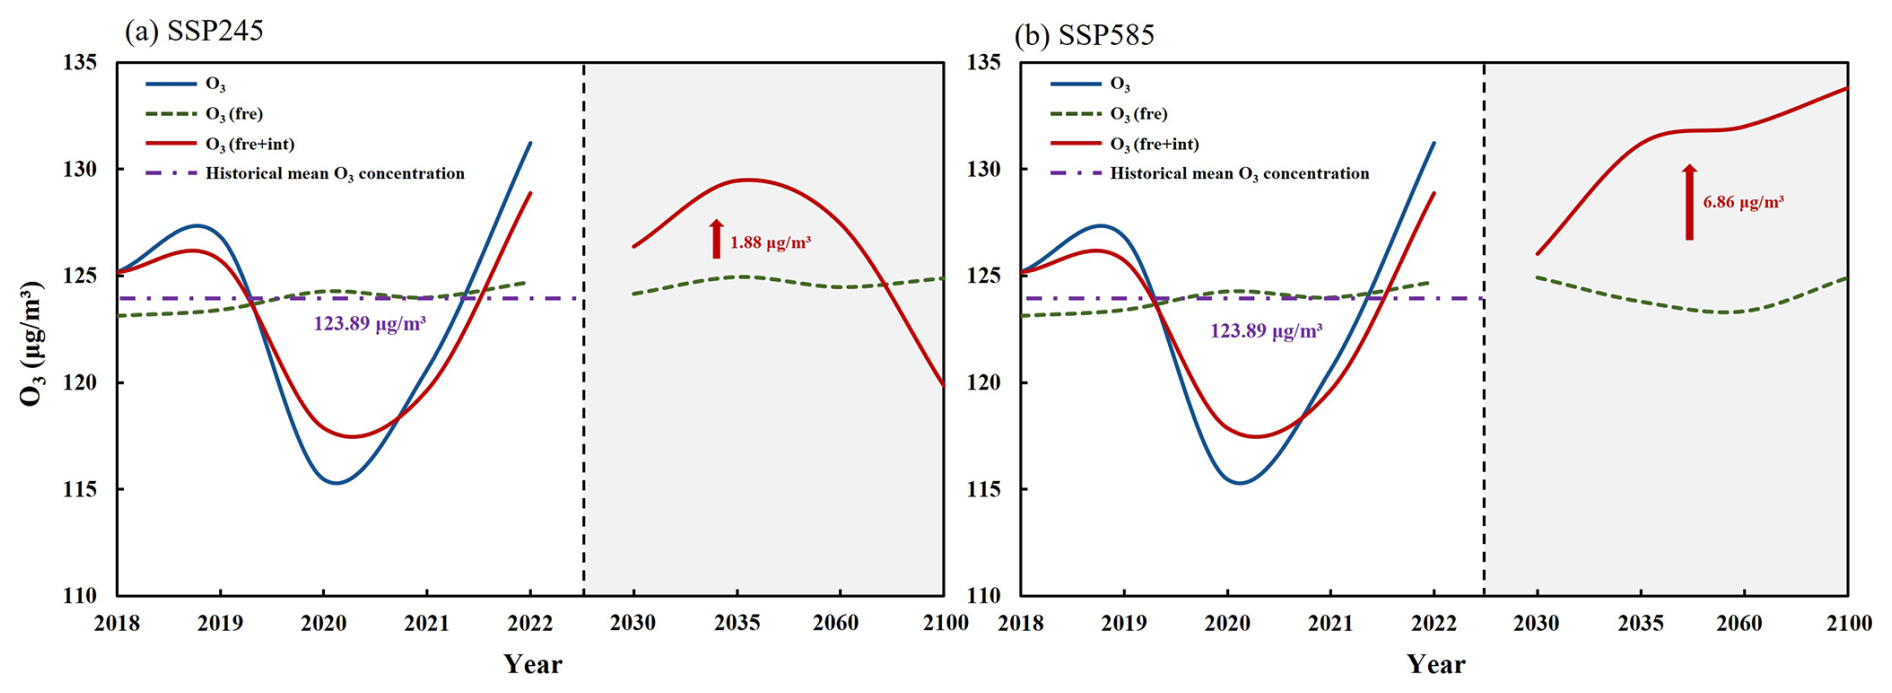
Figure 9The trend of the interannual O3 concentration time series under SSP2-4.5 (a) and SSP5-8.5 (b) future scenarios in the YRD. The blue line represents the original interannual O3 time series, whereas the green and red lines represent the trends of reconstructed O3 concentrations according to the frequency-only and both frequency and intensity of SWP changes, respectively.
The average O3 concentration in the YRD from June to September during 2018 to 2022 was 123.89 µg m−3. Under the SSP2-4.5 scenario, O3 concentrations in the YRD are projected to increase relative to the historical period (Fig. 9a), with an average increase of approximately 1.88 µg m−3. Based on the reconstructed contribution of SWP changes, future O3 concentrations in the YRD are estimated to be 2.70 µg m−3 higher than in the historical period. Under the SSP5-8.5 scenario, O3 concentrations are projected to increase relative to the historical period (Fig. 9b), reaching 133.80 µg m−3 in 2100, an increase of approximately 6.86 µg m−3. Based on the reconstructed contribution of SWP changes, future O3 concentrations in the YRD are estimated to be 9.85 µg m−3 higher than in the historical period. In summary, under both the SSP2-4.5 and SSP5-8.5 future climate scenarios, O3 concentrations in the YRD are projected to increase from June to September, with more severe O3 pollution under the SSP5-8.5 scenario. Previous studies based on CMIP6 multi-model simulations have shown that surface O3 concentrations are projected to decrease in response to reductions in anthropogenic emissions, although the magnitude and spatial distribution of changes vary among scenarios (Turnock et al., 2020; Li et al., 2023). The trends revealed in this study are generally consistent with those of previous studies, lending confidence to the robustness of our findings.
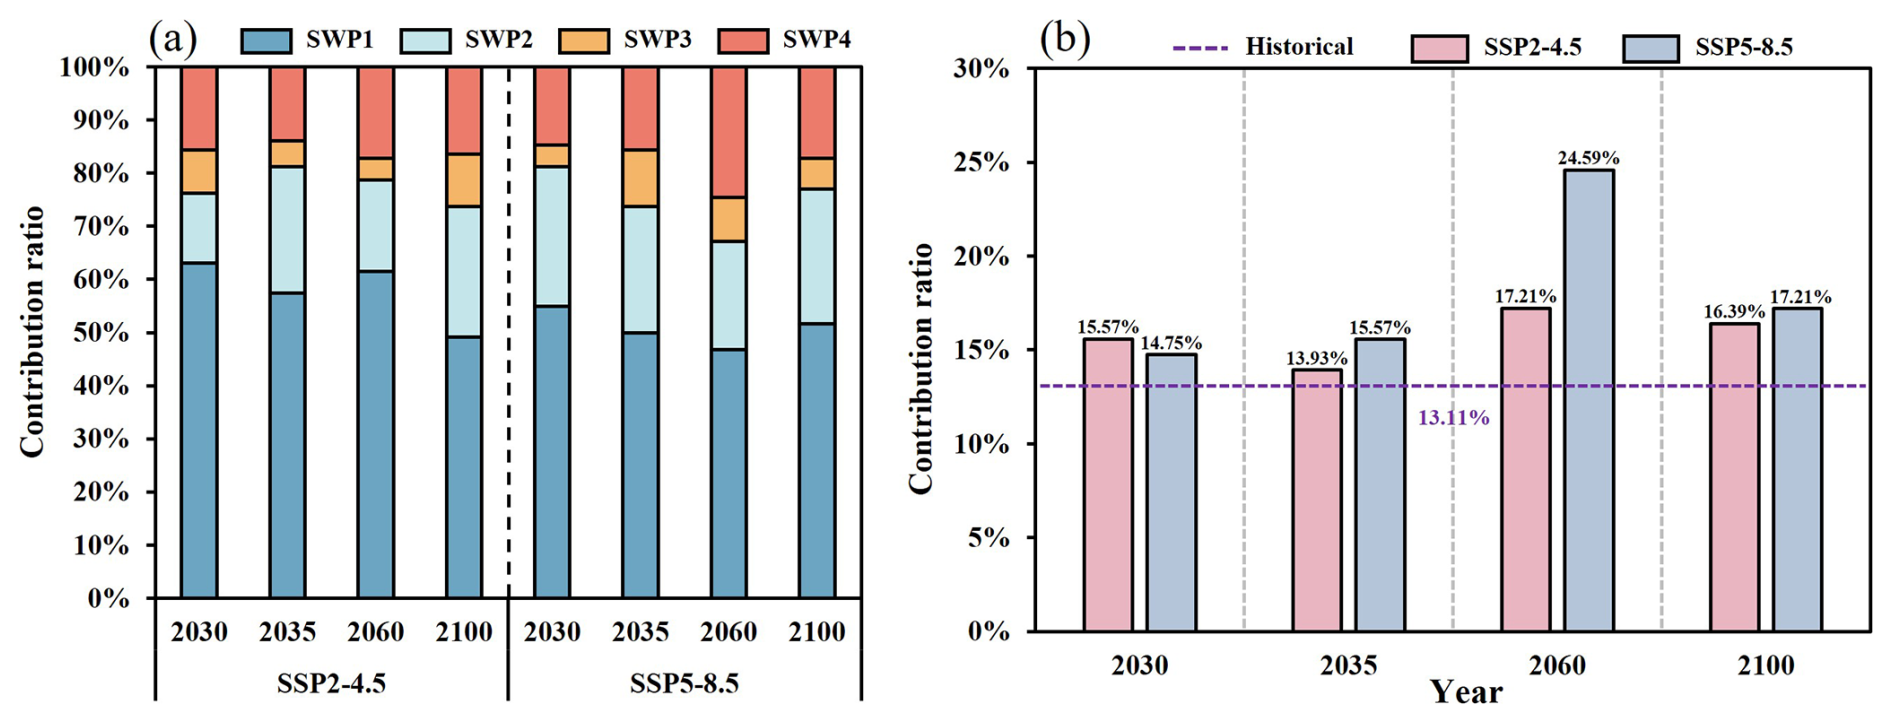
Figure 10Contribution of SWP to the projected annual variation series of O3 concentration under the SSP2-4.5 and SSP5-8.5 future scenarios. (a) Contribution of four SWPs, (b) contribution of TC weather pattern (SWP4).
Figure 10a shows the contribution of each SWP to the reconstructed series of future O3 concentrations in the YRD from June to September under the SSP2-4.5 and SSP5-8.5 scenarios. We focus on the contribution of the TC weather pattern (SWP4) to the reconstructed O3 concentration series under different scenarios (Fig. 10b). During the historical period (2018–2022), the TC weather pattern contributed an average of 13.11 % to O3 concentrations in the YRD. Under the SSP2-4.5 scenario, the contributions of the TC weather pattern in 2030, 2035, 2060, and 2100 were 15.57 %, 13.93 %, 17.21 %, and 16.39 %, respectively. The frequency of the TC weather pattern in the YRD in 2035 was lower, resulting in a lower contribution of the TC weather pattern to O3 concentrations in that year. Under the SSP5-8.5 scenario, the TC weather pattern contributes 14.75 %, 15.57 %, 24.59 %, and 19.67 % to O3 changes in 2030, 2035, 2060, and 2100, respectively. Under both the SSP2-4.5 and SSP5-8.5 scenarios, the contribution of the TC weather pattern to O3 pollution increases to varying degrees compared with the historical period. This suggests that under future climate change, the impact of TC weather pattern on O3 pollution in the YRD may intensify. Further research is needed on the relationship between key SWPs, such as TC weather pattern, and O3 formation mechanisms to more accurately predict and mitigate regional O3 pollution under future climate conditions.
This study investigates the impact of meteorological conditions on O3 pollution and future trends in the YRD, with a particular focus on the influence and mechanisms of TCs on O3 pollution. The spatial distribution and temporal variation of O3 pollution during TC events in the YRD from 2018 to 2022 were analyzed. The PTT objective classification method was applied to identify the main SWPs in the YRD from June to September 2018–2022 and assess their influence on varying levels of O3 pollution. Finally, using the reconstructed empirical relationship, the annual variation of O3 concentrations in the YRD from June to September under future scenarios was statistically projected, and the contribution of TCs to future O3 changes was quantified. The main findings are summarized as follows.
Analysis of O3 pollution characteristics in the YRD from 2018 to 2022 indicates that inter-month variations of O3 concentrations exhibit an M-shaped pattern. Peaks generally occur in June and September, with O3 concentrations showing substantial fluctuations during summer. During TC activity from 2018 to 2022, O3 pollution in typical YRD cities exhibited similar temporal trends, generally increasing initially and then decreasing, closely associated with the trajectory and center position of the TCs. When the TC center approaches the YRD, regional O3 concentrations decrease due to strong winds and rainfall, facilitating atmospheric pollutant removal. Conversely, when TCs are in their formation or dissipation stages, or their peripheral airflows influence the YRD, high temperatures, clear skies, and dry conditions favor O3 formation and accumulation.
Using the PTT objective classification method, four main SWPs were identified in the YRD from June to September 2018–2022. SWP1 is mainly controlled by the southwesterly flow introduced by the WPSH and the northeast China low, SWP2 by northwesterly flow introduced by a continental high and the northeast China low, SWP3 by southeasterly flow introduced by the WPSH, and SWP4 by northeasterly flow introduced by the WPSH and TCs. SWP1 is the dominant SWP, occurring 62.79 % of the time, whereas the TC weather pattern (SWP4) occurs 13.11 % of the time. SWP2 is influenced by dry northwesterly flow, exhibiting lower humidity (76.74 %) and slower wind speeds (2.03 m s−1), which hinder pollutant dispersion and lead to higher O3 concentrations. Under SWP4, TCs bring strong winds and rainstorms, increase humidity (80.03 %), and enhance wind speeds (2.64 m s−1), resulting in lower average O3 concentrations.
To investigate the interaction mechanisms between TC weather patterns and O3 pollution, three pollution levels, clean type (C), local pollution (LP), and regional pollution (RP), were defined based on O3 characteristics, and the corresponding atmospheric circulation features were analyzed in detail. For SWP4_C, TCs make landfall in the YRD, bringing strong winds and rainstorms that inhibit O3 accumulation and maintain clean air conditions. In contrast, under the SWP4_LP and SWP4_RP, downdrafts induced by the peripheral airflows of TCs that have not yet made landfall led to more stagnant atmospheric conditions. Elevated temperatures and weak winds over the YRD create conditions highly favorable for O3 formation. The mean O3 concentrations for these three categories were 93.46, 126.97, and 161.19 µg m−3. The clean type occurred more than half the time, contributing to the lower mean O3 concentration (115.07 µg m−3) under the SWP4. When the TC centers are located at 130–135° E and 20–30° N, the YRD is influenced by downdrafts from the peripheral flows of the TCs, facilitating the formation of high-concentration O3 pollution.
The SWP intensity and frequency contribute 10.05 % and 69.66 % to the annual O3 variation series, respectively. Compared to frequency, intensity variations have a more significant impact on O3 variation. Classification of SWPs from June to September under the SSP2-4.5 and SSP5-8.5 future scenarios shows that the number of days with TC weather pattern has increased to varying degrees, and the duration of TCs impacts will increase in the future. SWP intensity factors are defined based on the meteorological characteristics and location of each SWP, and a statistical estimate of the O3 concentration variation series from June to September in the YRD under future scenarios is made using data reconstruction methods. Under the SSP2-4.5 and SSP5-8.5 future scenarios, O3 concentrations increase by an average of 1.88 and 6.86 µg m−3 compared to the historical period. Based on their reduction contributions, the increase is expected to be 2.70 and 9.85 µg m−3. Under the two future scenarios, the contribution of TC weather pattern to O3 pollution has increased to varying degrees compared with the historical period, indicating that the impact of TC weather pattern on O3 pollution in the YRD may be further intensified in the future.
In summary, O3 pollution in the YRD is on the rise, and summer O3 pollution is often related to TC activities, and often occurs before and after TC activities. Through the research of this article, we have deepened our understanding of the mechanism of TCs on regional O3 pollution. In addition, under the background of global warming, the intensity and duration of TC generation will increase, which will have a serious impact on China's coastal areas. Compared with the direct damage caused by landfalling TCs, the secondary disasters caused by them, such as O3 pollution, should also be taken seriously. The research results have important scientific significance and practical application value for the in-depth understanding of the formation mechanism of O3 pollution in the YRD, formulating targeted pollution prevention and control strategies, and improving regional air quality.
Chinese O3 monitoring data are available at http://www.cnemc.cn/en/ (last access: 25 September 2024). Meteorological data are available at https://doi.org/10.5065/D6M043C6 (DOC/NOAA/NWS/NCEP, 2000). The TCs trajectory dataset are available at https://www.typhoon.org.cn/ (last access: 15 January 2025). CMIP6 future climate scenario data are available at https://doi.org/10.11922/sciencedb.00487 (Xu et al., 2024).
MeX collected and processed the data, and prepared the original draft. MiX had the original idea for the study, and provided financial support for this publication. MeX, MiX, DG and DM designed the experiments, discussed the results, and revised the original draft. DM also helped to collect and process the data. YL conducted the initial research work leading to this publication. LF, SC, and SZ checked the English of the original paper.
The contact author has declared that none of the authors has any competing interests.
Publisher's note: Copernicus Publications remains neutral with regard to jurisdictional claims made in the text, published maps, institutional affiliations, or any other geographical representation in this paper. While Copernicus Publications makes every effort to include appropriate place names, the final responsibility lies with the authors. Views expressed in the text are those of the authors and do not necessarily reflect the views of the publisher.
We are grateful to the National Environmental Monitoring Center for the air quality monitoring data, to the NCEP for global final analysis fields and we also extend our sincere gratitude to a broad range of other institutional partners. We also thank the anonymous reviewers for the constructive comments and suggestions.
This research has been supported by the National Nature Science Foundation of China (42275102), the Special Science and Technology Innovation Program for Carbon Peak and Carbon Neutralization of Jiangsu Province (BE2022612), the National Key Basic Research Development Program of China (2024YFC3711905) and the research start-up fund for the introduction of talents from Nanjing Normal University (184080H201B57).
This paper was edited by Suvarna Fadnavis and reviewed by two anonymous referees.
Adak, S., Mandal, N., Mukhopadhyay, A., Maity, P. P., and Sen, S.: Current state and prediction of future global climate change and variability in terms of CO2 levels and temperature, in: Enhancing resilience of dryland agriculture under changing climate: Interdisciplinary and convergence Approaches, Springer, 15–43, https://doi.org/10.1007/978-981-19-9159-2_2, 2023.
Akritidis, D., Pozzer, A., and Zanis, P.: On the impact of future climate change on tropopause folds and tropospheric ozone, Atmos. Chem. Phys., 19, 14387–14401, https://doi.org/10.5194/acp-19-14387-2019, 2019.
Arnold, S. R., Lombardozzi, D., Lamarque, J. F., Richardson, T., Emmons, L. K., Tilmes, S., Sitch, S. A., Folberth, G., Hollaway, M. J., and Martin, M. V.: Simulated Global Climate Response to Tropospheric Ozone-Induced Changes in Plant Transpiration, Geophysical Research Letters, 45, 13070–13079, https://doi.org/10.1029/2018gl079938, 2018.
Balaguru, K., Chang, C. C., Leung, L. R., Foltz, G. R., Hagos, S. M., Wehner, M. F., Kossin, J. P., Ting, M. F., and Xu, W. W.: A Global Increase in Nearshore Tropical Cyclone Intensification, Earths Future, 12, https://doi.org/10.1029/2023ef004230, 2024.
Bao, Q. Y., Lin, W. L., Jin, J. L., Xu, X. B., Zhao, G., Zhang, X. Y., and Ma, Q. L.: Long-term variation of O3 in the Yangtze River Delta and its influencing factors from a regional perspective, Urban Climate, 60, https://doi.org/10.1016/j.uclim.2025.102353, 2025.
Bhatia, K., Baker, A., Yang, W. C., Vecchi, G., Knutson, T., Murakami, H., Kossin, J., Hodges, K., Dixon, K., Bronselaer, B., and Whitlock, C.: A potential explanation for the global increase in tropical cyclone rapid intensification, Nature Communications, 13, https://doi.org/10.1038/s41467-022-34321-6, 2022.
Chand, S. S., Walsh, K. J. E., Camargo, S. J., Kossin, J. P., Tory, K. J., Wehner, M. F., Chan, J. C. L., Klotzbach, P. J., Dowdy, A. J., Bell, S. S., Ramsay, H. A., and Murakami, H.: Declining tropical cyclone frequency under global warming, Nature Climate Change, 12, 655, https://doi.org/10.1038/s41558-022-01388-4, 2022.
Chen, L., Zhu, J., Liao, H., Yang, Y., and Yue, X.: Meteorological influences on PM2.5 and O3 trends and associated health burden since China's clean air actions, Science of the Total Environment, 744, https://doi.org/10.1016/j.scitotenv.2020.140837, 2020.
Chow, E. C. H., Li, R. C. Y., and Zhou, W.: Influence of Tropical Cyclones on Hong Kong Air Quality, Advances in Atmospheric Sciences, 35, 1177–1188, https://doi.org/10.1007/s00376-018-7225-4, 2018.
Chu, J. E., Lee, S. S., Timmermann, A., Wengel, C., Stuecker, M. F., and Yamaguchi, R.: Reduced tropical cyclone densities and ocean effects due to anthropogenic greenhouse warming, Science Advances, 6, https://doi.org/10.1126/sciadv.abd5109, 2020.
Deng, T., Wang, T. J., Wang, S. Q., Zou, Y., Yin, C. Q., Li, F., Liu, L., Wang, N., Song, L., Wu, C., and Wu, D.: Impact of typhoon periphery on high ozone and high aerosol pollution in the Pearl River Delta region, Science of the Total Environment, 668, 617–630, https://doi.org/10.1016/j.scitotenv.2019.02.450, 2019.
DOC/NOAA/NWS/NCEP: NCEP FNL Operational Model Global Tropospheric Analyses, continuing from July 1999, updated daily, National Centers for Environmental Prediction, National Weather Service, NOAA, U.S. Department of Commerce, NSF National Center for Atmospheric Research [data set], https://doi.org/10.5065/D6M043C6, 2000.
Fu, Y. and Tai, A. P. K.: Impact of climate and land cover changes on tropospheric ozone air quality and public health in East Asia between 1980 and 2010, Atmos. Chem. Phys., 15, 10093–10106, https://doi.org/10.5194/acp-15-10093-2015, 2015.
Gao, D., Xie, M., Liu, J., Wang, T., Ma, C., Bai, H., Chen, X., Li, M., Zhuang, B., and Li, S.: Ozone variability induced by synoptic weather patterns in warm seasons of 2014–2018 over the Yangtze River Delta region, China, Atmos. Chem. Phys., 21, 5847–5864, https://doi.org/10.5194/acp-21-5847-2021, 2021.
Gong, S. L., Zhang, L., Liu, C., Lu, S. H., Pan, W. J., and Zhang, Y. H.: Multi-scale analysis of the impacts of meteorology and emissions on PM2.5 and O3 trends at various regions in China from 2013 to 2020 2. Key weather elements and emissions, Science of the Total Environment, 824, https://doi.org/10.1016/j.scitotenv.2022.153847, 2022.
Gong, X., Sun, F. X., Wei, L., Zhang, Y., Xia, M. J., Ge, M., and Xiong, L. L.: Association of Ozone and Temperature with Ischemic Heart Disease Mortality Risk: Mediation and Interaction Analyses, Environmental Science & Technology, 58, 20378–20388, https://doi.org/10.1021/acs.est.4c05899, 2024.
Hegarty, J., Mao, H., and Talbot, R.: Synoptic controls on summertime surface ozone in the northeastern United States, Journal of Geophysical Research-Atmospheres, 112, https://doi.org/10.1029/2006jd008170, 2007.
Hou, X. W., Zhu, B., Kumar, K. R., and Lu, W.: Inter-annual variability in fine particulate matter pollution over China during 2013–2018: Role of meteorology, Atmospheric Environment, 214, https://doi.org/10.1016/j.atmosenv.2019.116842, 2019.
Hu, W. Z., Liu, R., Chen, Z. C., Ouyang, S. S., Hu, T. T., Wang, Y., Cui, Z. Y., Jiang, B., Chen, D. H., and Liu, S. C.: Processes conducive to high ozone formation in Pearl River Delta in the presence of Pacific tropical cyclones, Atmospheric Environment, 307, https://doi.org/10.1016/j.atmosenv.2023.119859, 2023.
Huth, R., Beck, C., and Kucerová, M.: Synoptic-climatological evaluation of the classifications of atmospheric circulation patterns over Europe, International Journal of Climatology, 36, 2710–2726, https://doi.org/10.1002/joc.4546, 2016.
Jiang, Y. C., Zhao, T. L., Liu, J., Xu, X. D., Tan, C. H., Cheng, X. H., Bi, X. Y., Gan, J. B., You, J. F., and Zhao, S. Z.: Why does surface ozone peak before a typhoon landing in southeast China?, Atmos. Chem. Phys., 15, 13331–13338, https://doi.org/10.5194/acp-15-13331-2015, 2015.
Jung, H.: Humans fuel stronger cyclones, Nature Climate Change, 15, 351–351, https://doi.org/10.1038/s41558-025-02321-1, 2025.
Keeble, J., Bednarz, E. M., Banerjee, A., Abraham, N. L., Harris, N. R. P., Maycock, A. C., and Pyle, J. A.: Diagnosing the radiative and chemical contributions to future changes in tropical column ozone with the UM-UKCA chemistry–climate model, Atmos. Chem. Phys., 17, 13801–13818, https://doi.org/10.5194/acp-17-13801-2017, 2017.
Kossin, J. P.: A global slowdown of tropical-cyclone translation speed, Nature, 558, 104, https://doi.org/10.1038/s41586-018-0158-3, 2018.
Lam, K. S., Wang, T. J., Wu, C. L., and Li, Y. S.: Study on an ozone episode in hot season in Hong Kong and transboundary air pollution over Pearl River Delta region of China, Atmospheric Environment, 39, 1967–1977, https://doi.org/10.1016/j.atmosenv.2004.11.023, 2005.
Li, H., Yang, Y., Jin, J., Wang, H., Li, K., Wang, P., and Liao, H.: Climate-driven deterioration of future ozone pollution in Asia predicted by machine learning with multi-source data, Atmos. Chem. Phys., 23, 1131–1145, https://doi.org/10.5194/acp-23-1131-2023, 2023.
Li, K., Jacob, D. J., Shen, L., Lu, X., De Smedt, I., and Liao, H.: Increases in surface ozone pollution in China from 2013 to 2019: anthropogenic and meteorological influences, Atmos. Chem. Phys., 20, 11423–11433, https://doi.org/10.5194/acp-20-11423-2020, 2020.
Li, S., Gao, Y., Zhang, J., Hong, C., Zhang, S., Chen, D., Wild, O., Feng, Z., Xu, Y., and Guo, X.: Mitigating climate change and ozone pollution will improve Chinese food security, One Earth, https://doi.org/10.1016/j.oneear.2024.12.002, 2024.
Liu, J., Wang, L., Li, M., Liao, Z., Sun, Y., Song, T., Gao, W., Wang, Y., Li, Y., Ji, D., Hu, B., Kerminen, V.-M., Wang, Y., and Kulmala, M.: Quantifying the impact of synoptic circulation patterns on ozone variability in northern China from April to October 2013–2017, Atmos. Chem. Phys., 19, 14477–14492, https://doi.org/10.5194/acp-19-14477-2019, 2019.
Lu, H. X., Lyu, X. P., Cheng, H. R., Ling, Z. H., and Guo, H.: Overview on the spatial-temporal characteristics of the ozone formation regime in China, Environmental Science-Processes & Impacts, 21, 916–929, https://doi.org/10.1039/c9em00098d, 2019.
Moon, M., Ha, K. J., Kim, D., Ho, C. H., Park, D. S. R., Chu, J. E., Lee, S. S., and Chan, J. C. L.: Rainfall strength and area from landfalling tropical cyclones over the North Indian and western North Pacific oceans under increased CO2 conditions, Weather and Climate Extremes, 41, https://doi.org/10.1016/j.wace.2023.100581, 2023.
Moon, M., Min, S. K., Chu, J. E., An, S. I., Son, S. W., Ramsay, H., and Wang, Z.: Tropical cyclone response to ambitious decarbonization scenarios, Npj Climate and Atmospheric Science, 8, https://doi.org/10.1038/s41612-025-01122-9, 2025.
Philipp, A., Beck, C., Huth, R., and Jacobeit, J.: Development and comparison of circulation type classifications using the COST 733 dataset and software, International Journal of Climatology, 36, 2673–2691, https://doi.org/10.1002/joc.3920, 2016.
Qi, C., Wang, P., Yang, Y., Li, H., Zhang, H., Ren, L., Jin, X., Zhan, C., Tang, J., and Liao, H.: Impacts of tropical cyclone–heat wave compound events on surface ozone in eastern China: comparison between the Yangtze River and Pearl River deltas, Atmos. Chem. Phys., 24, 11775–11789, https://doi.org/10.5194/acp-24-11775-2024, 2024.
Saunier, A., Ormeño, E., Piga, D., Armengaud, A., Boissard, C., Lathière, J., Szopa, S., Genard-Zielinski, A. C., and Fernandez, C.: Isoprene contribution to ozone production under climate change conditions in the French Mediterranean area, Regional Environmental Change, 20, https://doi.org/10.1007/s10113-020-01697-4, 2020.
Shu, L., Xie, M., Wang, T., Gao, D., Chen, P., Han, Y., Li, S., Zhuang, B., and Li, M.: Integrated studies of a regional ozone pollution synthetically affected by subtropical high and typhoon system in the Yangtze River Delta region, China, Atmos. Chem. Phys., 16, 15801–15819, https://doi.org/10.5194/acp-16-15801-2016, 2016.
Shu, L., Xie, M., Gao, D., Wang, T., Fang, D., Liu, Q., Huang, A., and Peng, L.: Regional severe particle pollution and its association with synoptic weather patterns in the Yangtze River Delta region, China, Atmos. Chem. Phys., 17, 12871–12891, https://doi.org/10.5194/acp-17-12871-2017, 2017.
Turnock, S. T., Allen, R. J., Andrews, M., Bauer, S. E., Deushi, M., Emmons, L., Good, P., Horowitz, L., John, J. G., Michou, M., Nabat, P., Naik, V., Neubauer, D., O'Connor, F. M., Olivié, D., Oshima, N., Schulz, M., Sellar, A., Shim, S., Takemura, T., Tilmes, S., Tsigaridis, K., Wu, T., and Zhang, J.: Historical and future changes in air pollutants from CMIP6 models, Atmos. Chem. Phys., 20, 14547–14579, https://doi.org/10.5194/acp-20-14547-2020, 2020.
Wang, G. H., Wu, L. W., Mei, W., and Xie, S. P.: Ocean currents show global intensification of weak tropical cyclones, Nature, 611, 496, https://doi.org/10.1038/s41586-022-05326-4, 2022a.
Wang, J. H., Wang, P., Tian, C. F., Gao, M., Cheng, T. T., and Mei, W.: Consecutive Northward Super Typhoons Induced Extreme Ozone Pollution Events in Eastern China, Npj Climate and Atmospheric Science, 7, https://doi.org/10.1038/s41612-024-00786-z, 2024a.
Wang, N., Huang, X., Xu, J. W., Wang, T., Tan, Z. M., and Ding, A. J.: Typhoon-boosted biogenic emission aggravates cross-regional ozone pollution in China, Science Advances, 8, https://doi.org/10.1126/sciadv.abl6166, 2022b.
Wang, N., Wang, H., Huang, X., Chen, X., Zou, Y., Deng, T., Li, T., Lyu, X., and Yang, F.: Extreme weather exacerbates ozone pollution in the Pearl River Delta, China: role of natural processes, Atmos. Chem. Phys., 24, 1559–1570, https://doi.org/10.5194/acp-24-1559-2024, 2024b.
Wang, S., Murakami, H., and Cooke, W. F.: Anthropogenic forcing changes coastal tropical cyclone frequency, Npj Climate and Atmospheric Science, 6, https://doi.org/10.1038/s41612-023-00516-x, 2023a.
Wang, Y., Yang, Y. J., Yuan, Q. Q., Li, T. W., Zhou, Y., Zong, L., Wang, M. Y., Xie, Z. Y., Ho, H. C., Gao, M., Tong, S. L., Lolli, S., and Zhang, L. P.: Substantially underestimated global health risks of current ozone pollution, Nature Communications, 16, https://doi.org/10.1038/s41467-024-55450-0, 2025.
Wang, Y. T., Zhao, Y., Liu, Y. M., Jiang, Y. Q., Zheng, B., Xing, J., Liu, Y., Wang, S., and Nielsen, C. P.: Sustained emission reductions have restrained the ozone pollution over China, Nature Geoscience, 16, 967, https://doi.org/10.1038/s41561-023-01284-2, 2023b.
Wu, L. G., Yu, R. L., Xiang, C. Y., Yu, H., Feng, Y. C., and Zhou, X. Y.: Extreme Impacts of Four Landfalling Tropical Cyclones in China during the 2024 Peak Season, Advances in Atmospheric Sciences, 42, 817–824, https://doi.org/10.1007/s00376-025-4465-y, 2025.
Wu, S. H.: Research progress in climate change impact, risk, and adaptation: An interpretation of Part 2 of China's Fourth National Assessment Report on Climate Change, China Population, Resources and Environment, 33, 80–86, 2023.
Xi, M., Luo, Y., Li, Y., Ma, D., Feng, L., Zhang, S., Chen, S., and Xie, M.: Comprehensive analysis of prevailing weather patterns and high-impact typhoon tracks to reveal where and how tropical cyclone affects regional ozone pollution in the Yangtze River Delta region, China, Atmospheric Environment, 361, 121498, https://doi.org/10.1016/j.atmosenv.2025.121498, 2025.
Xie, M., Zhu, K. G., Wang, T. J., Chen, P. L., Han, Y., Li, S., Zhuang, B. L., and Shu, L.: Temporal characterization and regional contribution to O3 and NOx at an urban and a suburban site in Nanjing, China, Science of the Total Environment, 551, 533–545, https://doi.org/10.1016/j.scitotenv.2016.02.047, 2016.
Xu, J. W., Zhou, D. R., Gao, J., Huang, X., Xue, L. K., Huo, J. T., Fu, Q. Y., and Ding, A. J.: Biogenic emissions-related ozone enhancement in two major city clusters during a typical typhoon process, Applied Geochemistry, 152, https://doi.org/10.1016/j.apgeochem.2023.105634, 2023a.
Xu, Y. F., Shen, A., Jin, Y. B., Liu, Y. M., Lu, X., Fan, S. J., Hong, Y. Y., and Fan, Q.: A quantitative assessment and process analysis of the contribution from meteorological conditions in an O3 pollution episode in Guangzhou, China, Atmospheric Environment, 303, https://doi.org/10.1016/j.atmosenv.2023.119757, 2023b.
Xu, Z., Han, Y., Tam, C. Y., Yang, Z. L., and Fu, C. B.: Bias-corrected CMIP6 global dataset for dynamical downscaling of the Earth's historical and future climate (1979–2100)[DS/OL], V5, Science Data Bank [data set], https://doi.org/10.11922/sciencedb.00487, 2024.
Xu, Z. F., Han, Y., Tam, C. Y., Yang, Z. L., and Fu, C. B.: Bias-corrected CMIP6 global dataset for dynamical downscaling of the historical and future climate (1979–2100), Scientific Data, 8, https://doi.org/10.1038/s41597-021-01079-3, 2021.
Yamaguchi, M. and Maeda, S.: Slowdown of Typhoon Translation Speeds in Mid-latitudes in September Influenced by the Pacific Decadal Oscillation and Global Warming, Journal of the Meteorological Society of Japan, 98, 1321–1334, https://doi.org/10.2151/jmsj.2020-068, 2020.
Yan, D., Jin, Z. P., Zhou, Y. T., Li, M. M., Zhang, Z. H., Wang, T. J., Zhuang, B. L., Li, S., and Xie, M.: Anthropogenically and meteorologically modulated summertime ozone trends and their health implications since China's clean air actions, Environmental Pollution, 343, https://doi.org/10.1016/j.envpol.2023.123234, 2024.
Yang, J. X., Lau, A. K. H., Fung, J. C. H., Zhou, W., and Wenig, M.: An air pollution episode and its formation mechanism during the tropical cyclone Nuri's landfall in a coastal city of south China, Atmospheric Environment, 54, 746–753, https://doi.org/10.1016/j.atmosenv.2011.12.023, 2012.
Yang, Z. Y., Li, Z. Q., Cheng, F., Lv, Q. C., Li, K., Zhang, T., Zhou, Y. Y., Zhao, B., Xue, W. H., and Wei, J.: Two-decade surface ozone (O3) pollution in China: Enhanced fine-scale estimations and environmental health implications, Remote Sensing of Environment, 317, https://doi.org/10.1016/j.rse.2024.114459, 2025.
Yarnal, B.: Synoptic Climatology in Environmental Analysis A Primer, Journal of Preventive Medicine Information, 347, 170–180, https://doi.org/10.1016/j.crte.2014.12.002, 1993.
Zhan, C. and Xie, M.: Land use and anthropogenic heat modulate ozone by meteorology: a perspective from the Yangtze River Delta region, Atmos. Chem. Phys., 22, 1351–1371, https://doi.org/10.5194/acp-22-1351-2022, 2022.
Zhan, C., Xie, M., Huang, C., Liu, J., Wang, T., Xu, M., Ma, C., Yu, J., Jiao, Y., Li, M., Li, S., Zhuang, B., Zhao, M., and Nie, D.: Ozone affected by a succession of four landfall typhoons in the Yangtze River Delta, China: major processes and health impacts, Atmos. Chem. Phys., 20, 13781–13799, https://doi.org/10.5194/acp-20-13781-2020, 2020.
Zhan, Y. Z. H., Xie, M., Zhuang, B. L., Gao, D., Zhu, K. G., Lu, H., Wang, T. J., Li, S., Li, M. M., Luo, Y., and Zhao, R. Q.: Particle-ozone complex pollution under diverse synoptic weather patterns in the Yangtze River Delta region: Synergistic relationships and the effects of meteorology and chemical compositions, Science of the Total Environment, 946, https://doi.org/10.1016/j.scitotenv.2024.174365, 2024.
Zhang, G., Murakami, H., Knutson, T. R., Mizuta, R., and Yoshida, K.: Tropical cyclone motion in a changing climate, Science Advances, 6, https://doi.org/10.1126/sciadv.aaz7610, 2020.
Zhang, Z. K., Lu, B. Q., Liu, C., Meng, X., Jiang, J. K., Herrmann, H., Chen, J. M., and Li, X.: Nitrate pollution deterioration in winter driven by surface ozone increase, Npj Climate and Atmospheric Science, 7, https://doi.org/10.1038/s41612-024-00667-5, 2024.
Zhao, S. P., Yin, D. Y., Yu, Y., Kang, S. C., Qin, D. H., and Dong, L. X.: PM2.5 and O3 pollution during 2015–2019 over 367 Chinese cities: Spatiotemporal variations, meteorological and topographical impacts, Environmental Pollution, 264, https://doi.org/10.1016/j.envpol.2020.114694, 2020.