the Creative Commons Attribution 4.0 License.
the Creative Commons Attribution 4.0 License.
 | 29 Oct 2025
Advances in CALIPSO (IIR) cirrus cloud property retrievals – Part 2: Global estimates of the fraction of cirrus clouds affected by homogeneous ice nucleation
Anne Garnier
Cirrus clouds can form through two ice nucleation pathways (homo- and heterogeneous ice nucleation; henceforth hom and het, respectively) that result in very different cloud physical and radiative properties. While important to the climate system, they are poorly understood due to lack of knowledge on the relative roles of hom and het. This study differs from earlier relevant studies by estimating the relative radiative contribution of hom-affected cirrus clouds. Here, we employ new global retrievals (described in Part 1: Mitchell et al., 2025; henceforth M2025) of cirrus cloud ice particle number concentration, effective diameter (De), ice water content (IWC), shortwave extinction coefficient (αext), optical depth (τ) and cloud radiative temperature based on Imaging Infrared Radiometer (IIR) and Cloud and Aerosol Lidar with Orthogonal Polarization (CALIOP) co-located observations onboard Cloud-Aerosol Lidar and Infrared Pathfinder Satellite Observation (CALIPSO). Transition from het dominated to hom-affected regimes are identified using αext and De. Over oceans outside the tropics in winter, the zonal fraction of hom-affected cirrus generally ranges between 20 % and 35 %, with comparable contributions from in situ and warm base cirrus. Using τ distributions to establish a proxy for net cloud radiative effect (CRE), the τ-weighted fraction for hom-affected cirrus over oceans outside the tropics during winter was > 50 %, indicating that hom cirrus play an important role in climate. Using these retrievals (including those relating to the cloud geometric thickness), a conceptual model of cirrus cloud characterization is proposed.
- Article
(34072 KB) - Full-text XML
- Companion paper
-
Supplement
(3856 KB) - BibTeX
- EndNote


Clouds are important due to their critical role in the Earth's radiation budget (e.g., Kiehl and Trenberth, 1997) and need to be realistically predicted in climate models in terms of their coverage, altitude, temperature and optical thickness or depth to accurately predict climate change (e.g., Stephens, 2005). The microphysical and radiative properties of cirrus clouds are poorly understood in large part due to two pathways or mechanisms through which the cirrus clouds form: heterogeneous ice nucleation (henceforth het) and homogeneous ice nucleation (henceforth hom). Since het activates before hom begins, this can result in two types of cirrus clouds: (1) cirrus formed through het (i.e., het cirrus) and (2) cirrus formed through a combination of het and hom (i.e., hom cirrus). Since hom generally results in relatively high concentrations of ice crystals (which can in turn affect their sizes and the cloud ice water content (IWC)) while het produces relatively few, the microphysical and radiative properties of het and hom cirrus could strongly differ (Barahona and Nenes, 2009; Mitchell et al., 2018; henceforth M2018).
Cirrus clouds have also been classified in terms of their origin as (1) in situ cirrus and (2) liquid origin cirrus (LOC) (e.g., Krämer et al., 2016; Luebke et al., 2016; Dekoutsidis et al., 2023), with LOC associated with cloudy air advected from lower levels (T > 235 K) that is typically near ice saturation and completely glaciated by the Wegener–Bergeron–Findeisen process when this air enters the cirrus temperature regime (T ≤ 235 K; Luebke et al., 2016; Costa et al., 2017; Avery et al., 2020; Mitchell and d'Entremont, 2012). However, at high vertical velocities liquid cloud droplets may be advected into the cirrus regime where they immediately freeze homogeneously (e.g., Rosenfeld and Woodley, 2000). LOC are expected to result from deep convection that produces anvil cirrus and may occur in frontal systems where a “conveyor belt” of condensate is advected from warmer levels into cirrus clouds. In situ cirrus clouds are not subject to condensate advection from levels below the 235 K isotherm, and they form and grow within an ice cloud only environment. Using aircraft measurements from many field campaigns, Luebke et al. (2016) found that cirrus IWC was higher in LOC while differences between ice particle number concentration Ni and Dm were similar for a given altitude, where Dm corresponds to the ice particle size distribution (PSD) bin size where the maximum amount of ice mass is located. This study utilizes a similar cirrus cloud classification, comparing relative differences in Ni, effective diameter De and IWC regarding in situ cirrus and an approximation for LOC clouds (as described in Sect. 2.1).
Since this study estimates the fraction of cirrus clouds strongly affected by hom, we briefly review similar estimates from modeling and observational studies here. Some studies using global climate models (GCMs) have predicted the role of hom relative to het. Using the Community Atmosphere Model Version 5 (CAM5) with the Liu and Penner (2005) ice nucleation scheme, Gettelman et al. (2010), Liu et al. (2012), Gettelman et al. (2012), and Penner et al. (2015) found that het prevailed in the northern hemisphere (NH) outside the tropics, with hom prevailing in the southern hemisphere (SH) and in the tropics. Using the ECHAM6-HAM2 GCM, Gasparini and Lohmann (2016) found hom was only relevant near the tropopause over mountainous terrain in the NH and SH outside the tropics. Muench and Lohmann (2020) used this same GCM but without the treatment for orographic gravity waves (OGWs) used in Gasparini and Lohmann (2016). Their results regarding hom and het were similar to the CAM5 studies, with het prevailing over hom in the NH outside the tropics. However, hom resulting from cloud droplet freezing dominated ice production in the lower part of cirrus clouds at all latitudes, a result not found in a more detailed cloud process model (Lüttmer et al., 2025). The dominance of het relative to hom in the NH outside the tropics is common to all these studies (at least in the upper cirrus cloud), and this is predicted from the higher mineral dust concentrations in the NH, which are higher due to the much greater land area. This prediction was recently validated by Froyd et al. (2022) where global in situ measurements of the upper troposphere (UT) mineral dust concentration initialized a detailed cirrus-formation model that predicted the relative contributions of het and hom cirrus during four field campaigns that each traversed the world from pole-to-pole. Finally, Barahona et al. (2017) simulated hom and het in cirrus clouds using a GCM at 100 km horizontal resolution. However, standard deviations in vertical velocities (w), σw, were calculated at 7 km horizontal resolution in a separate simulation to drive ice nucleation processes in the lower resolution simulation. Results show that the frequency of hom cirrus clouds was highest in the tropics, intermediate in the SH and lowest in the NH, with hom cirrus highest during winter outside the tropics in both hemispheres due to colder temperatures. However, at high latitudes (especially in the Arctic), the fraction of hom cirrus was relatively low.
It is possible that hom plays a larger role in the NH than currently predicted in most climate models having explicit microphysics. For example, the satellite remote sensing study by Sourdeval et al. (2018) shows that Ni in cirrus clouds (T < 235 K) outside the tropics is relatively high during the NH and SH winter seasons, with relatively low Ni for T > 235 K. Highest Ni during winter was also observed in the cirrus cloud remote sensing study of M2018, which was limited to in situ cirrus clouds. These studies also found Ni outside the tropics (±30° latitude) was higher over mountainous terrain, attributing this to mountain-induced wave clouds having relatively strong and sustained updrafts (and thus greater cooling rates producing high supersaturations) conducive for hom. This was also observed in the satellite remote sensing study of Gryspeerdt et al. (2018) that explained the higher Ni over mountainous terrain in a similar way. Sedimenting ice crystals originating near cloud top may promote reduced Ni at lower levels by lowering the relative humidity with respect to ice (RHi) there and “quenching” hom (Spichtinger and Gierens, 2009a), which is consistent with Fig. 10 in M2018. Aircraft measurements also underscore the importance of hom. By developing an analysis scheme sensitive to hom and het influences, Patnaude and Diao (2020) and Ngo et al. (2024) found evidence that both mechanisms are important in cirrus cloud formation, depending on environmental factors.
M2018 found that Ni was relatively high at high latitudes, mostly over land. This can be partly explained by the relatively low concentrations of ice nucleating particles (INPs), measured or inferred, over the Southern Ocean (Vergara-Temprado et al., 2018; McCluskey et al., 2018; Carlsen and David, 2022) and in the Arctic, especially when snow and sea ice cover is more extensive (Creamean et al., 2018; Carlsen and David, 2022). That is, when Ni produced by het is relatively low, the ice surface area produced for vapor removal is often inadequate for preventing the RHi from climbing and reaching the hom threshold in a cirrus cloud updraft, generally resulting in higher Ni produced by hom (Krämer et al., 2016). Results similar to M2018 over the Southern Ocean are shown in Fig. 1 of Gryspeerdt et al. (2018).
As in M2018, the new Cloud-Aerosol Lidar and Infrared Pathfinder Satellite Observation (CALIPSO) satellite retrieval of De, Ni and IWC presented in Part 1 (Mitchell et al., 2025; henceforth M2025) uses the Imaging Infrared Radiometer (IIR) and Cloud and Aerosol Lidar with Orthogonal Polarization (CALIOP). The new retrievals of De, Ni, and IWC are based on an extended set of aircraft measurements. Whereas M2018 had several sets of retrievals for several independent formulations, M2025 established a unique retrieval scheme which combines various formulations according to temperature and latitude. Nevertheless, the general findings from M2018 referred to above still stand.
In Sect. 2, we give an overview of the new retrievals based on M2025. Our cirrus cloud sampling is discussed, and we describe why 0.3 < τ < 3.0, where τ is visible optical depth, may be the most radiatively representative τ category for all cirrus clouds. In Sect. 3, we present the rationale for the identification of hom-affected cirrus clouds and a method for quantifying the fraction of hom-affected cirrus clouds is developed and the results are discussed. In Sect. 4, we synthesize results from this and previous studies to propose a conceptual model for characterizing cirrus clouds. This work is related to the treatment of cirrus clouds in Earth system models and cirrus cloud thinning in Sect. 5. A summary and conclusions are given in Sect. 6.
2.1 Cloud sampling
As described in Part 1 (M2025), the CALIPSO retrieval uses IIR passive observations at 10.6 and 12.05 µm with description of the atmospheric column informed by perfectly collocated CALIOP observations. Results presented in this study are based on CALIPSO data during 2008, 2010, 2012 and 2013. Microphysical properties are retrieved for atmospheric columns that contain only one semi-transparent ice cloud layer that does not fully attenuate the CALIOP laser beam to ensure that cloud base is detected. We also require the cloud layer to be classified as ice with high confidence by the CALIOP ice/water phase algorithm (Avery et al., 2020). The CALIOP in-cloud 532 nm attenuated backscatter profiles with temperatures from MERRA-2 re-analyses (Gelaro et al., 2017) allows one to estimate the cloud layer radiative temperature, Tr (Garnier et al., 2021), and cirrus clouds are defined as those ice clouds having a Tr ≤ 235 K. The upper range of optical depth for semi-transparent single-layer cirrus clouds is approximately 3. The lower range is driven by retrieval uncertainties. In earlier work (M2018), global retrievals over both oceans and land have been in clouds having a CALIOP 532 nm layer integrated attenuated backscatter (IAB) larger than 0.01 sr−1, generally corresponding to clouds with visible optical depth τ > 0.3. These clouds will be hereafter called “thick” cirrus clouds (see Table 1). However, over oceans, uncertainties are lower due to the absence of highly variable land surface emissivities, allowing all cirrus clouds with valid retrieved effective emissivities at both 10.6 and 12.0 µm to be considered, yielding τ > ∼ 0.01 (M2025).
Table 1Notations used for CALIOP retrievals of cirrus clouds. Both in situ cirrus and warm base cirrus (WBC) clouds are included in the τ categories below unless otherwise indicated.
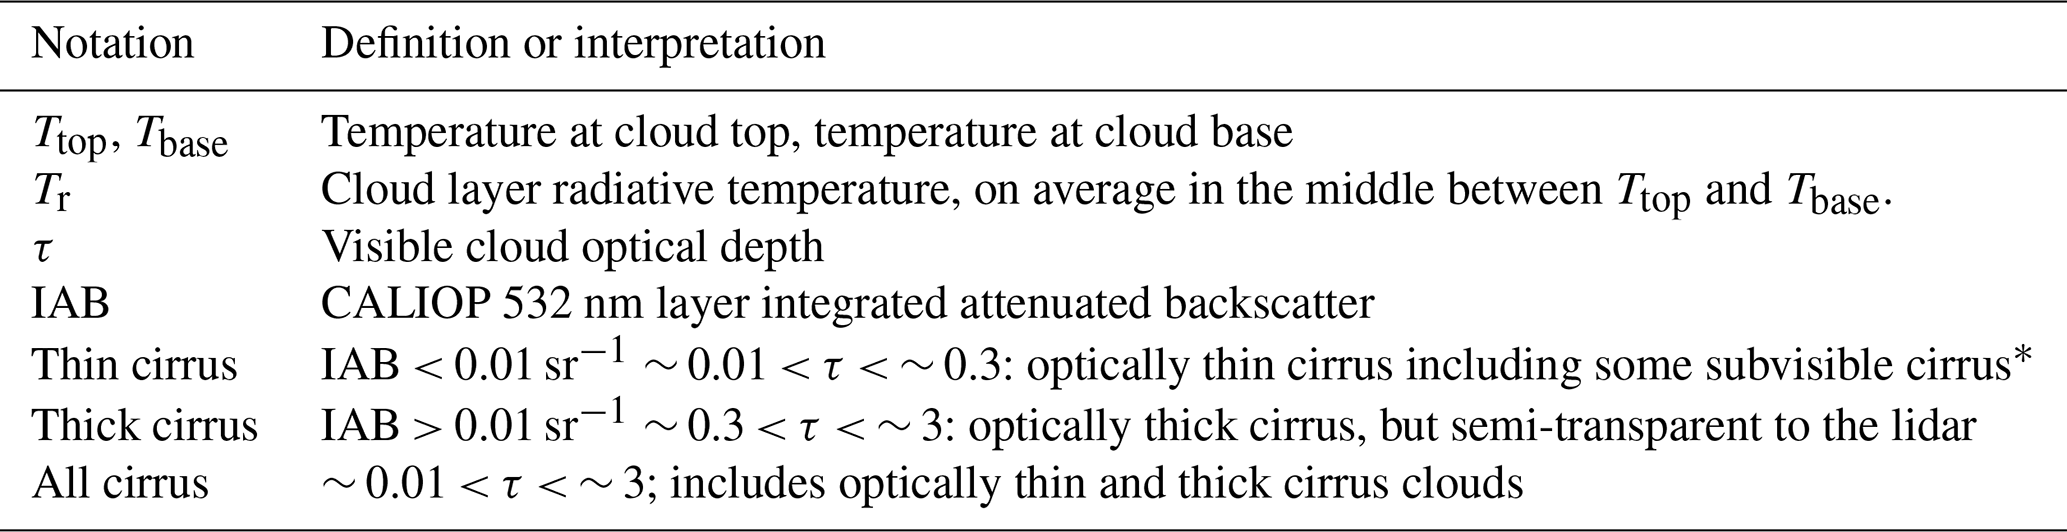
* Subvisible cirrus (τ < 0.03).
The geographical distribution of the cirrus cloud sampling is shown in Fig. A1 in Appendix A. In M2018, the sampled cirrus clouds were in situ cirrus clouds having base temperature, Tbase, colder than 235 K. In this work, we take advantage of the improved ice/water phase assignment in the Version 4 CALIOP products to also include cirrus clouds with Tbase warmer than 235 K (and Tr colder than 235 K), hereafter called warm base cirrus clouds or WBC clouds. Even though these WBC clouds are identified as high confidence ice cloud layers by CALIOP, this assessment does not rule out the possibility of liquid droplets in the lower part of the layer. This classification method is an attempt to qualitatively contrast the properties of in situ and LOC clouds, using WBC as a proxy for LOC clouds. A similar approach was used in Gasparini et al. (2018). This approximation may underestimate LOC clouds (overestimating in situ cirrus) since cloud condensate from below the 235 K isotherm may be advected across this isotherm upwind of the CALIOP nadir view when there is no cloud at nadir below this isotherm. In this case the cloud would be mistakenly classified as in situ cirrus. On the other hand, the modeling study by Wernli et al. (2016) estimates that approximately 50 % of in situ cirrus clouds occur on top of LOC, indicating a strong dynamical linkage. Relative to an air parcel back trajectory analysis as used in Wernli et al. (2016) and other LOC studies cited below, our approach should underestimate in situ cirrus if there is no clear layer separating in situ from WBC clouds. This classification scheme is evaluated in Appendix A in Figs. A2 and A3. Figure A2 shows the dependence of the in situ fraction on temperature, where this fraction is ∼ 0.5 (indicating a transition from in situ to WBC) at approximately 227 K over oceans when all clouds are considered. In the LOC studies by Dekoutsidis et al. (2023) and Luebke et al. (2016), which are both based on the same field campaign, this transition occurs around 221 K and between 218–222 K, respectively. This suggests that the WBC approximation overestimates the in situ fraction somewhat (shifting the transition temperature by ∼ 6 K relative to these measurement-based studies), but that WBC may still serve as a qualitative proxy for LOC. The blue curves in Fig. A3 indicate that while WBC clouds have relatively higher IWCs, the main difference between them and in situ cirrus clouds is the greater ice water path (IWP) and τ associated with WBC clouds.
2.2 Realism of the CALIPSO cloud sampling for representing cirrus clouds
As in M2018, global retrievals over both oceans and land are in thick clouds having τ > ∼ 0.3, and we are now sampling both in situ cirrus and WBC clouds. This raises the question: “Is this subcategory of cirrus cloud adequate for testing cirrus clouds in climate models?” It was argued in Sect. 6.3 of M2018 that cirrus clouds in this τ range should dominate the overall cirrus cloud net radiative forcing, but more can be said about this. Table 4 in Hong et al. (2016) gives global mean top-of-atmosphere net ice cloud radiative effect (CRE) values for the following five τ categories: τ < 0.03; 0.03 < τ < 0.3; 0.3 < τ < 3.0; 3 < τ < 20; τ > 20. The corresponding net CRE values in W m−2 are: 0.05, 0.96, 4.98, −0.49 and −0.43. These CRE values are weighted by ice cloud frequency of occurrence. Relative contributions of net CRE can be calculated by taking absolute values, in which case ice clouds having 0.3 ≤ τ ≤ 3.0 contribute 72 % of the total “absolute” CRE. Moreover, the global mean net CRE for all ice cloud categories in their Table 4 was 5.07 W m−2 whereas the global mean net CRE for 0.3 ≤ τ ≤ 3.0 is 4.98 W m−2, further suggesting that this thick cloud category is representative for all ice clouds. However, Hong et al. (2016) addressed all ice clouds (i.e., Tr < 273 K) whereas our study addresses only cirrus clouds (Tr ≤ 235 K).
To further investigate this question for our cirrus sampling, we examine the distributions of retrieved τ (M2025) over oceans for the high- and midlatitudes and the tropics. The tropics are defined here as ±30°, while the mid- and high latitudes are 30–60 and 60–90° in each hemisphere, respectively. The τ distributions are built using bins equal to 0.1 in log (τ) space. The number of IIR 1 km2 cloudy pixels, p and the product p × τ, are plotted against τ in Fig. 1. This is done over oceans for all sampled cirrus clouds and for thick clouds that have lower retrieval uncertainties. The p × τ product serves as a proxy for the radiative impact of cirrus clouds since τ and frequency of occurrence are the principal factors determining CREs. The right-hand panels in Fig. 1 show the cumulative distributions over τ (panel b) and for this proxy or radiative weighting (panel d). The cumulative distributions are normalized with respect to all cirrus clouds sampled. The cumulative distributions for thick clouds indicate that cirrus clouds having τ > ∼ 0.3 represent 31 % to 48 % (depending on latitude band) of the cirrus clouds sampled. However, they represent 78 % to 87 % of the radiative weight for all cirrus clouds sampled (i.e., cirrus clouds having τ < 0.3 represent 13 % to 22 % of the radiative weight). This compares favorably with results from Hong et al. (2016) described above, where the ice cloud CRE fraction for τ < 0.3 relative to τ < 3 is 0.17, or 17 %. The occurrence frequency of cirrus having τ > 3 is negligible here because only clouds that are semi-transparent to CALIOP are sampled.
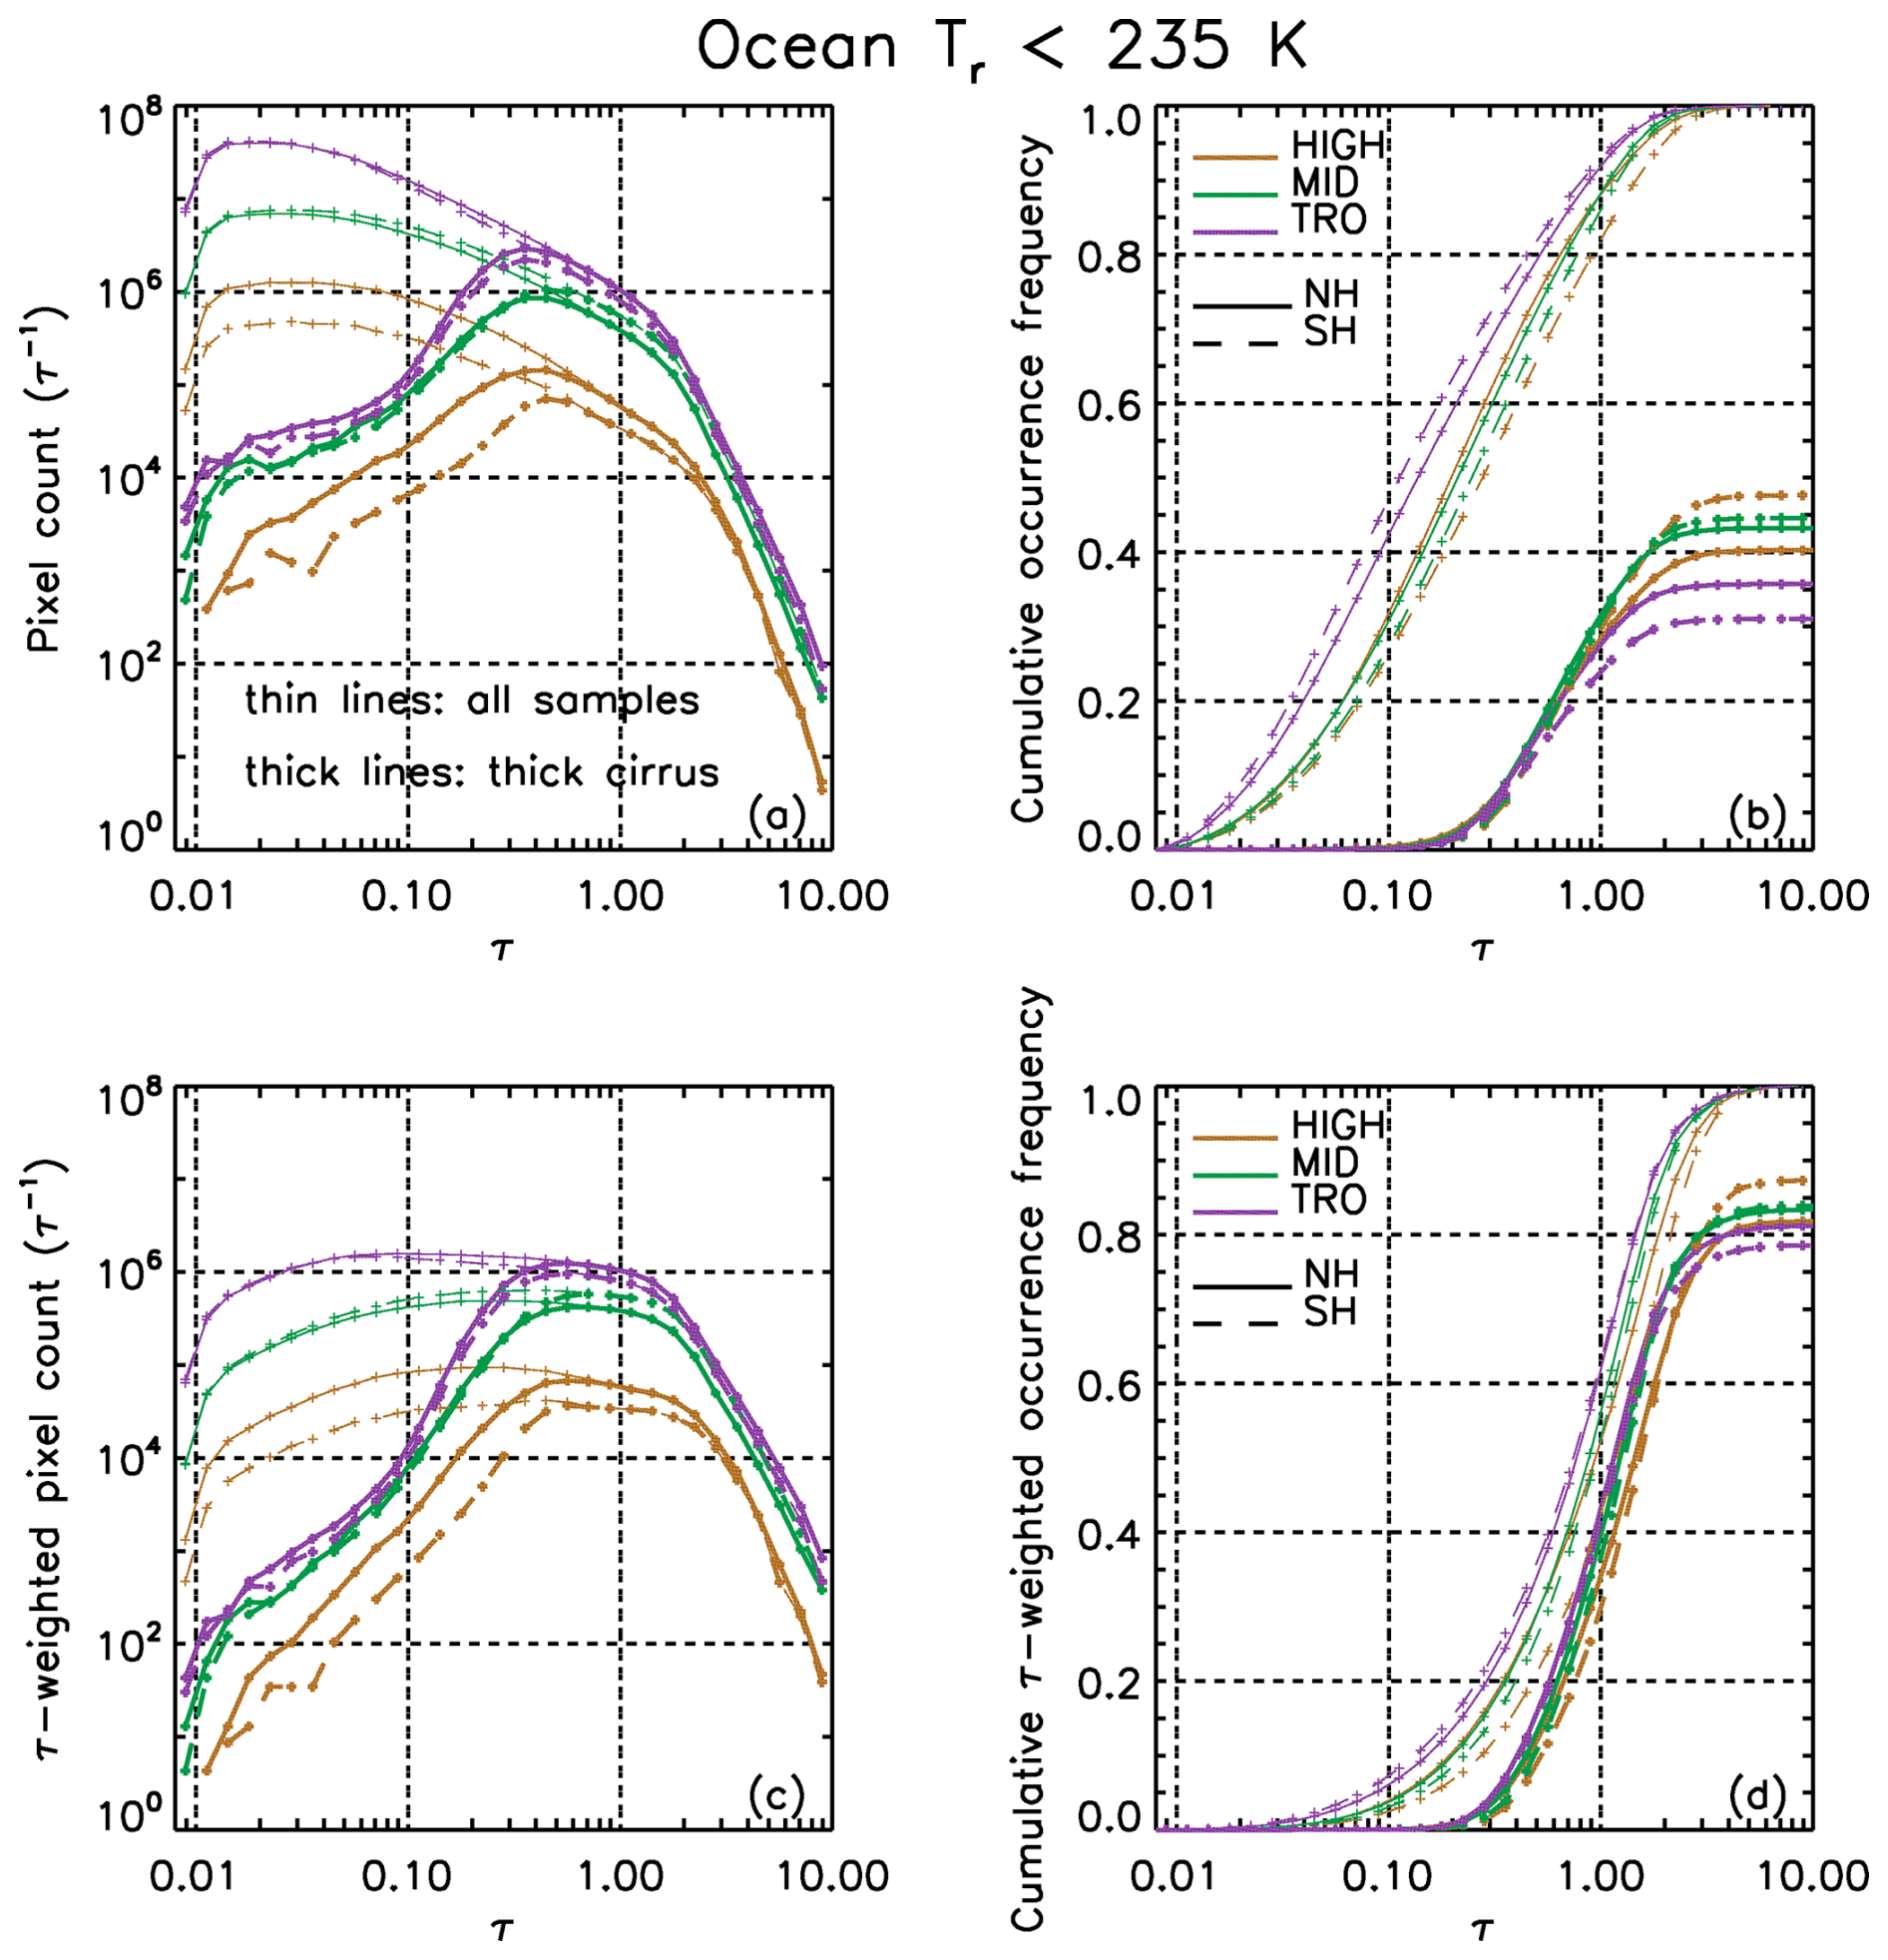
Figure 1Panels (a) and (b) show IIR cirrus sampling statistics during 2008, 2010, 2012 and 2013 over visible optical depth (τ) while panels (c) and (d) show the same distribution of sampled pixels multiplied by τ. All samples have a cloud radiative temperature Tr ≤ 235 K for the tropics (purple), midlatitudes (green) and high latitudes (brown). Solid and dashed patterns refer to the NH and SH, respectively. The product of the number of IIR pixels × τ is a proxy for the radiative impact of cirrus clouds. The thin curves indicate all IIR samples while the thicker curves are for the optically thick clouds. Panels (b) and (d) show the cumulative distributions. The IIR pixels count is normalized per τ bin size. Retrievals are only over oceans to minimize uncertainties at the lowest τ.
2.3 Global maps of cirrus cloud properties
Global maps for December–January–February (DJF) and June–July–August (JJA) during 2008, 2010, 2012 and 2013 are shown for median Ni, De, IWC and cirrus cloud Tr for thick cirrus clouds (i.e., ∼ 0.3 < τ < ∼ 3) in Figs. 2, 3, 4 and 5, respectively. Global maps for the two other seasons are given in the Supplement as Figs. S1 to S4. From Sect. 2.2, this sampling criteria appears to provide cloud property values of cirrus clouds whose radiative properties are representative of all cirrus clouds.
Relatively high Ni are found at high latitudes over land, as well as over mountainous regions in the midlatitudes, especially during winter. These observations appear consistent with hom since hom tends to produce higher Ni in stronger updrafts (e.g., OGWs induced by mountains) and during winter (Joos et al., 2014). The seasonal dependence of Ni in Fig. 2 was also found by Sourdeval et al. (2018, their Fig. 8) at mid-to-high latitudes for winter vs. summer. The regions with large Ni in the tropics in Sourdeval et al. (2018) are absent in Fig. 2 possibly because thick cirrus here have τ < ∼ 3 and thus deep convective cores (where hom is often active) are not sampled.
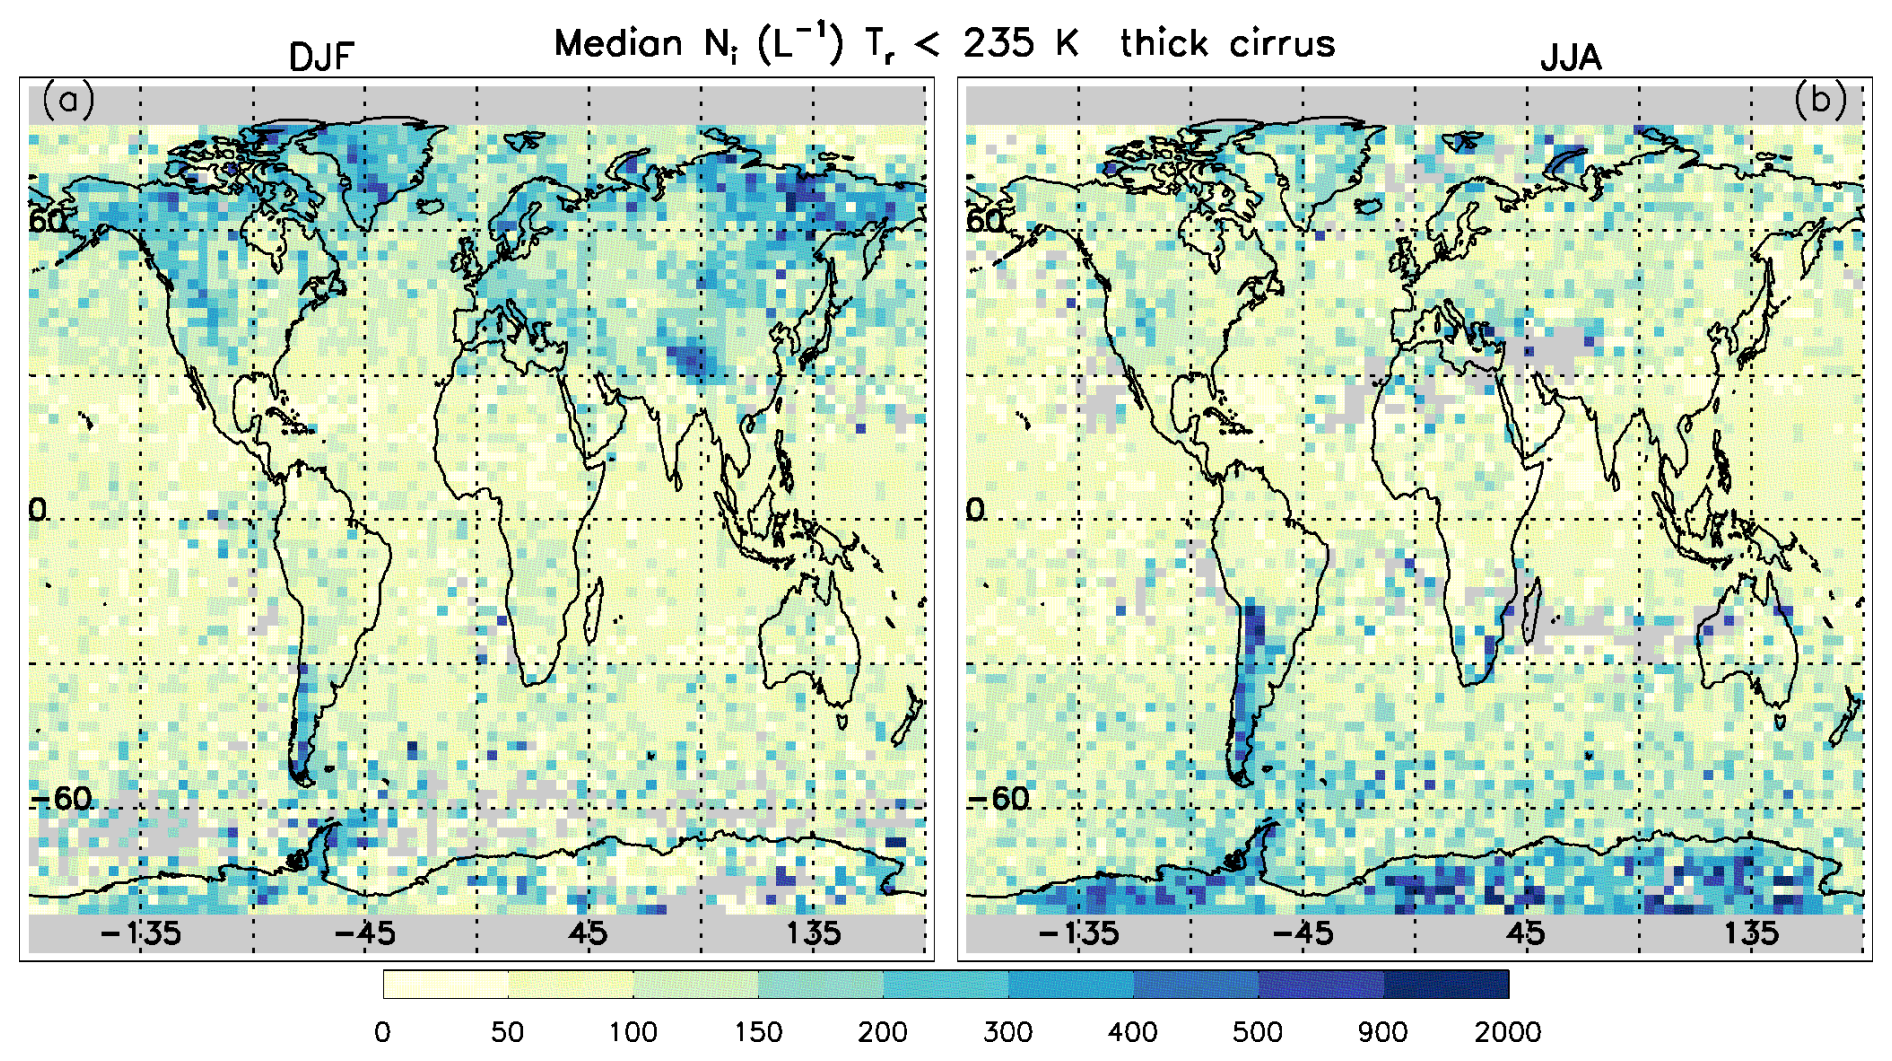
Figure 2Global-seasonal maps of the median ice particle number concentration Ni for thick cirrus (∼ 0.3 < τ < ∼ 3) that include both WBC and in situ cirrus clouds. The color legend gives Ni in L−1. The two panels are for (a) December–January–February (DJF) and (b) June–July–August (JJA) during 2008, 2010, 2012 and 2013.
For a given season, regions having relatively high Ni in Fig. 2 have relatively small De in Fig. 3. An exception is in the tropical western Pacific during winter where De is relatively small and Ni is relatively low. The deepest convection occurs in this region during winter (Danielsen, 1993), producing the coldest cloud top temperatures where ice crystal growth rates are bound to be minimal, probably resulting in smaller De. This phenomenon is more evident in Fig. 4, showing retrieved median IWCs, where IWC is lowest during winter in the tropical western Pacific due to these minimal temperatures. The correspondence between Tr (Fig. 5) and IWC (Fig. 4) is clearly seen as expected from the Clausius–Clapeyron equation.
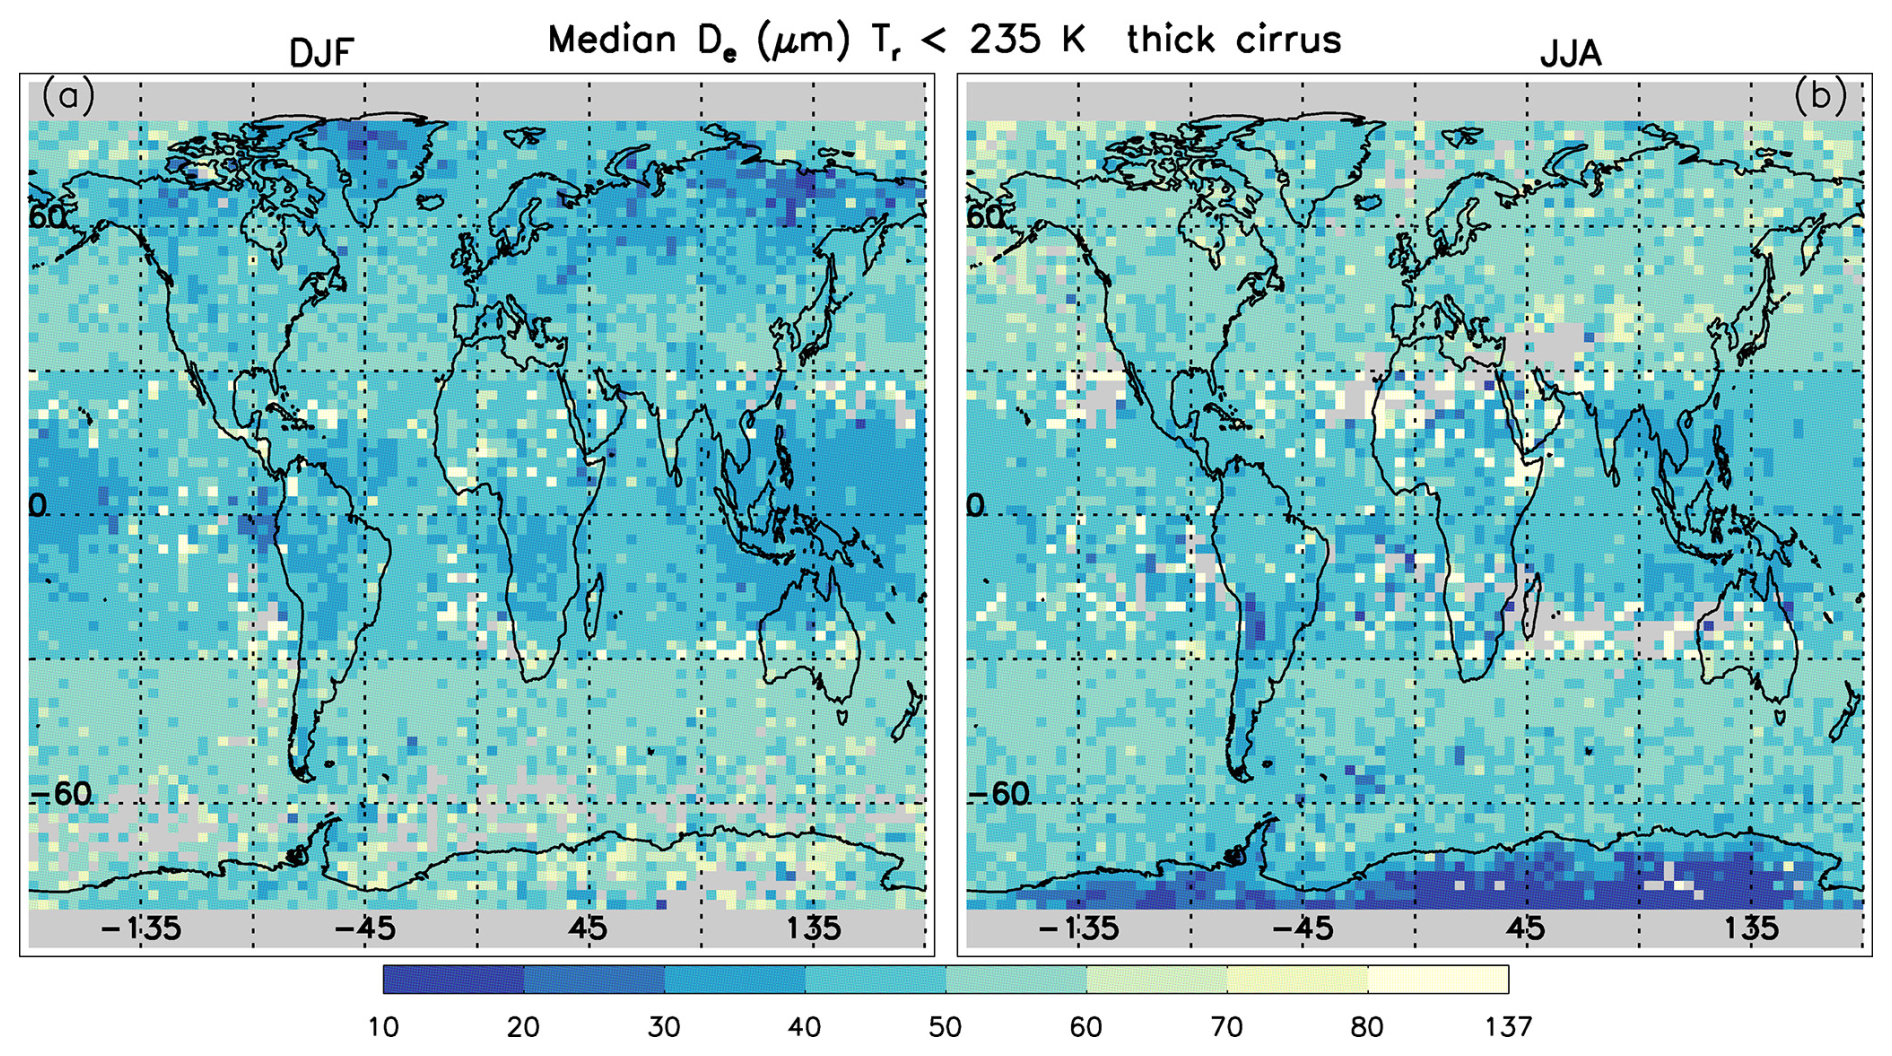
Figure 3Global-seasonal maps of the median effective diameter De for thick cirrus(∼ 0.3 < τ < ∼ 3) that include both WBC and in situ cirrus clouds. The color legend gives De in micrometers. Otherwise, as in Fig. 2.
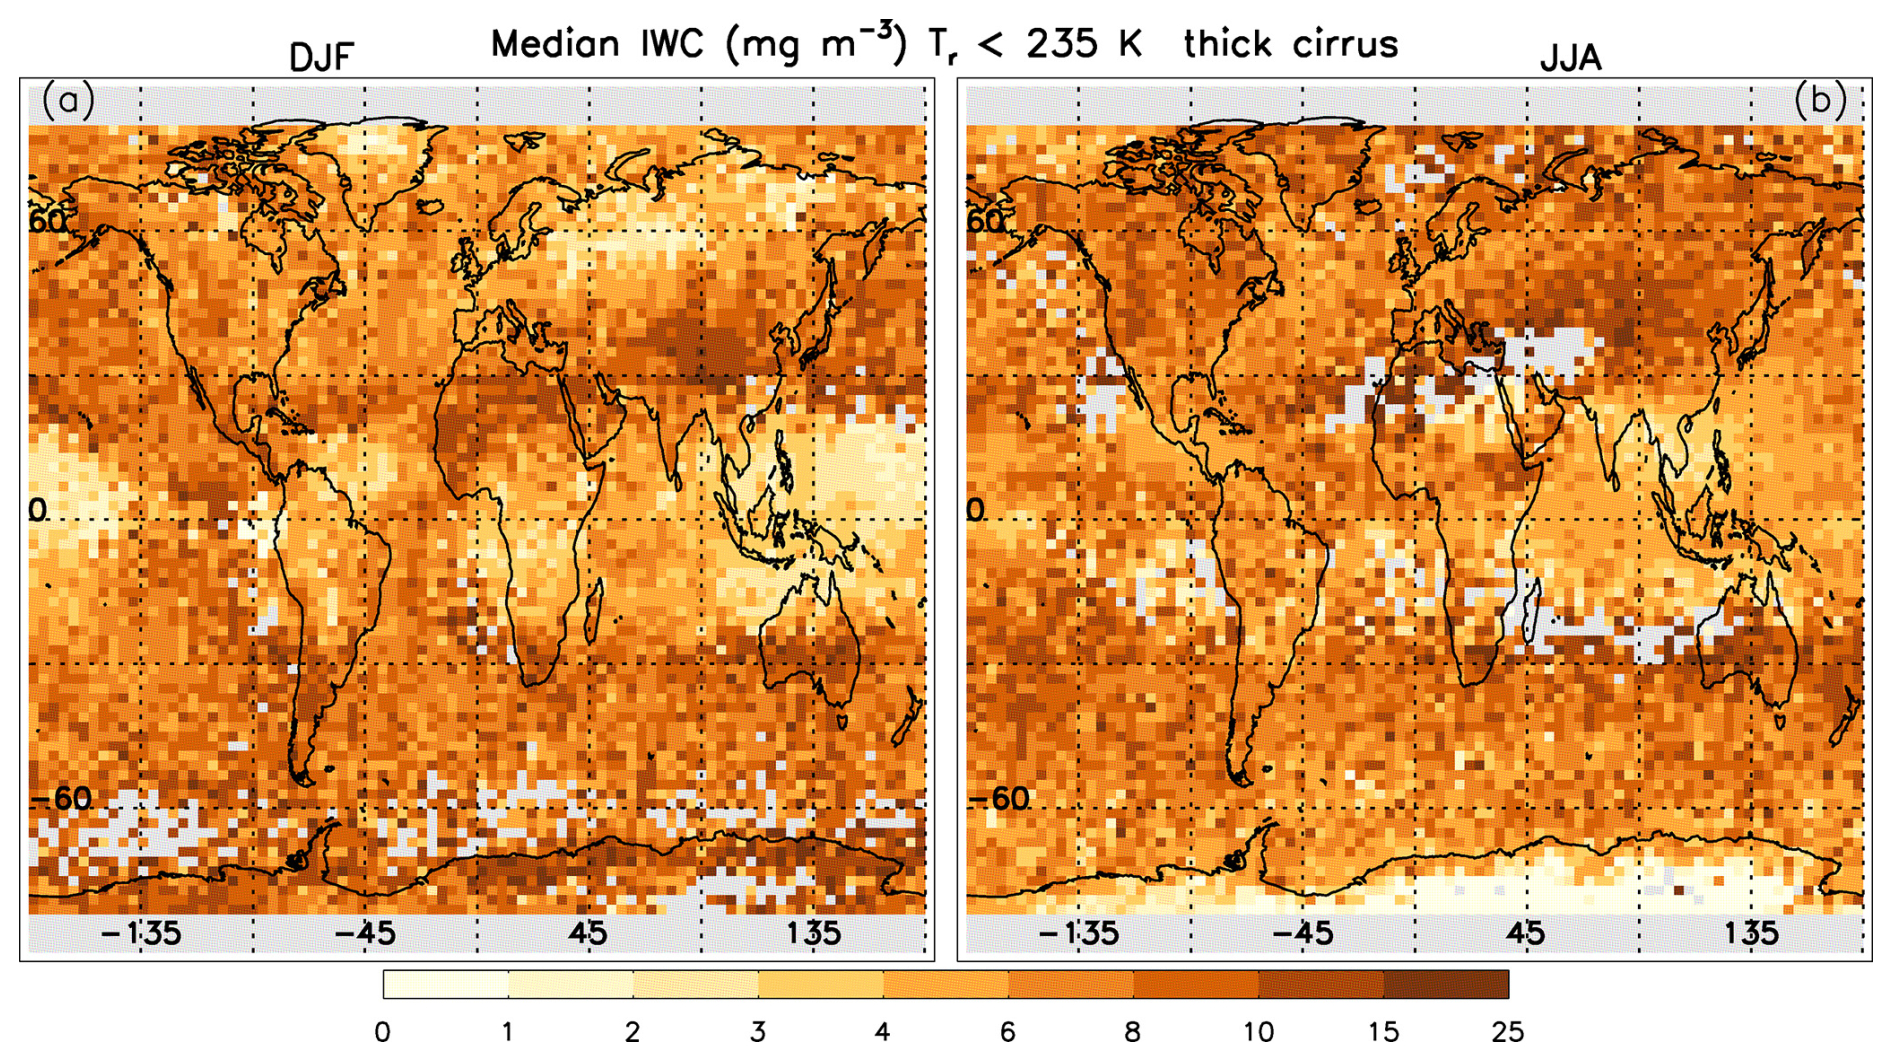
Figure 4Global-seasonal maps of the median ice water content IWC for thick cirrus (∼ 0.3 < τ < ∼ 3) that include both WBC and in situ cirrus clouds. The color legend gives IWC in mg m−3. Otherwise, as in Fig. 2.
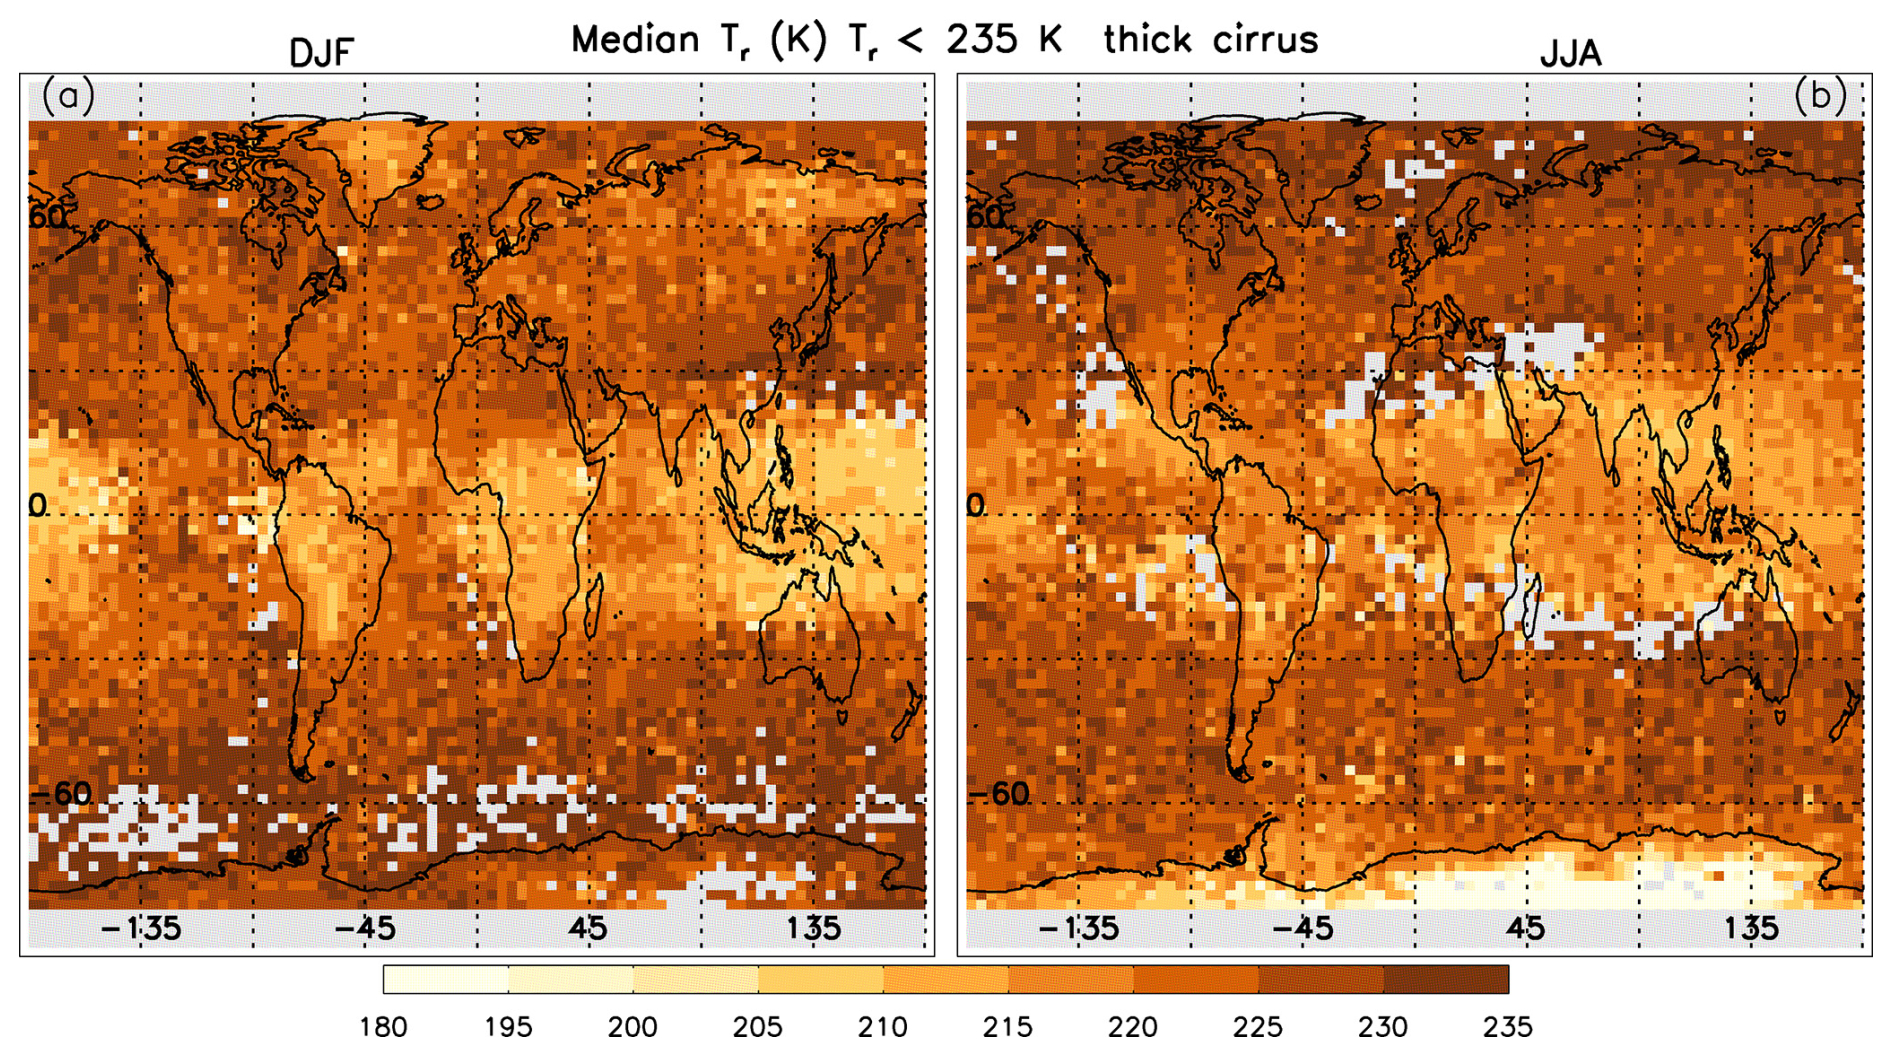
Figure 5Global-seasonal maps of the median cirrus cloud radiative temperature Tr (K) for thick cirrus (∼ 0.3 < τ < ∼ 3) that include both WBC and in situ cirrus clouds. Otherwise, as in Fig. 2.
Figures S5 and S6 show global maps of median Ni and De for in situ cirrus clouds only, where Ni is higher and De considerably smaller relative to Figs. 2 and 3 (where WBC are included). To interpret these figures, microphysical properties of in situ cirrus and WBC clouds are investigated in Fig. A3. Although corresponding to a specific season and latitude zone, these Fig. A3 results are globally representative. Median De increases as Tr increases, with no marked difference between in situ and WBC cirrus clouds at a given Tr. This suggests that the De differences seen between Fig. 3 (for thick WBC and in situ cirrus) and the thick in situ cirrus in Fig. S6 (residing at a lower Tr on average) are due to temperature differences. Temperature could also be a factor in explaining the lower Ni in Fig. 2 (for thick WBC and in situ cirrus) relative to the thick in situ clouds in Fig. S5, since the latter tend to form at lower temperatures (Fig. A2) and hom depends strongly on temperature (e.g., Lamb and Verlinde, 2011). Figure A3 shows that both the geometric thickness and the equivalent thickness seen by IIR are on average greater for WBC clouds than for in situ cirrus clouds. This is the main reason that IWP and τ tend to be substantially greater for WBC clouds. Finally, IWC and Ni are both higher in WBC, in agreement with Luebke et al. (2016), only when clouds with τ < ∼ 0.3 are included (blue curves). Figure A3 highlights the importance of cloud sampling in optically thick vs. thin cirrus when interpreting cirrus cloud field campaign measurements of Ni and IWC, and ultimately in terms of the contribution of het and hom to cloud formation.
3.1 Sensitivity of cirrus cloud physical properties to hom
The main purpose of this section is to justify the use of the extinction coefficient αext as a means of separating cirrus clouds formed primarily through het from those formed primarily through hom. As discussed in M2025, when all IIR samples over oceans were used (∼ 0.01 < τ < ∼ 3) retrieved median Ni, Rv (mean volume radius), and IWC were in reasonable agreement with corresponding values in the cirrus cloud property climatology of Krämer et al. (2020) which is based on many field campaigns throughout the world. However, when the CALIPSO retrievals were restricted to thick clouds, the agreement degraded for Ni and IWC. Again, this raised the question of whether cirrus clouds having τ smaller and larger than 0.3 tend to be characterized by different physical properties and processes.
Figures 6 provides a means of investigating this question, evaluating Ni, IWC, De and the sampling densities for optically thin (∼ 0.01 < τ < ∼ 0.3) and thick (∼ 0.3 < τ < ∼ 3) cirrus clouds. Only retrievals over ocean are considered since variable land emissivities preclude retrievals over land for the thin clouds. These quantities are plotted in Tr vs. Tr–Ttop space where Ttop is temperature at cloud top and Tr is most of the time near mid-cloud (M2025). Thus, Tr–Ttop is an index for cloud geometrical thickness. Figure 6a shows that for thick cirrus, the highest Ni (resulting from hom due to its magnitude) is found in relatively geometrically thin clouds (consistent with Fig. 10 in M2018), while Fig. 6d for optically thin cirrus is almost featureless with Ni < 100 L−1 in general. Note that the retrievals characterize cloud layers (i.e., no vertical profiling within a cloud is possible).
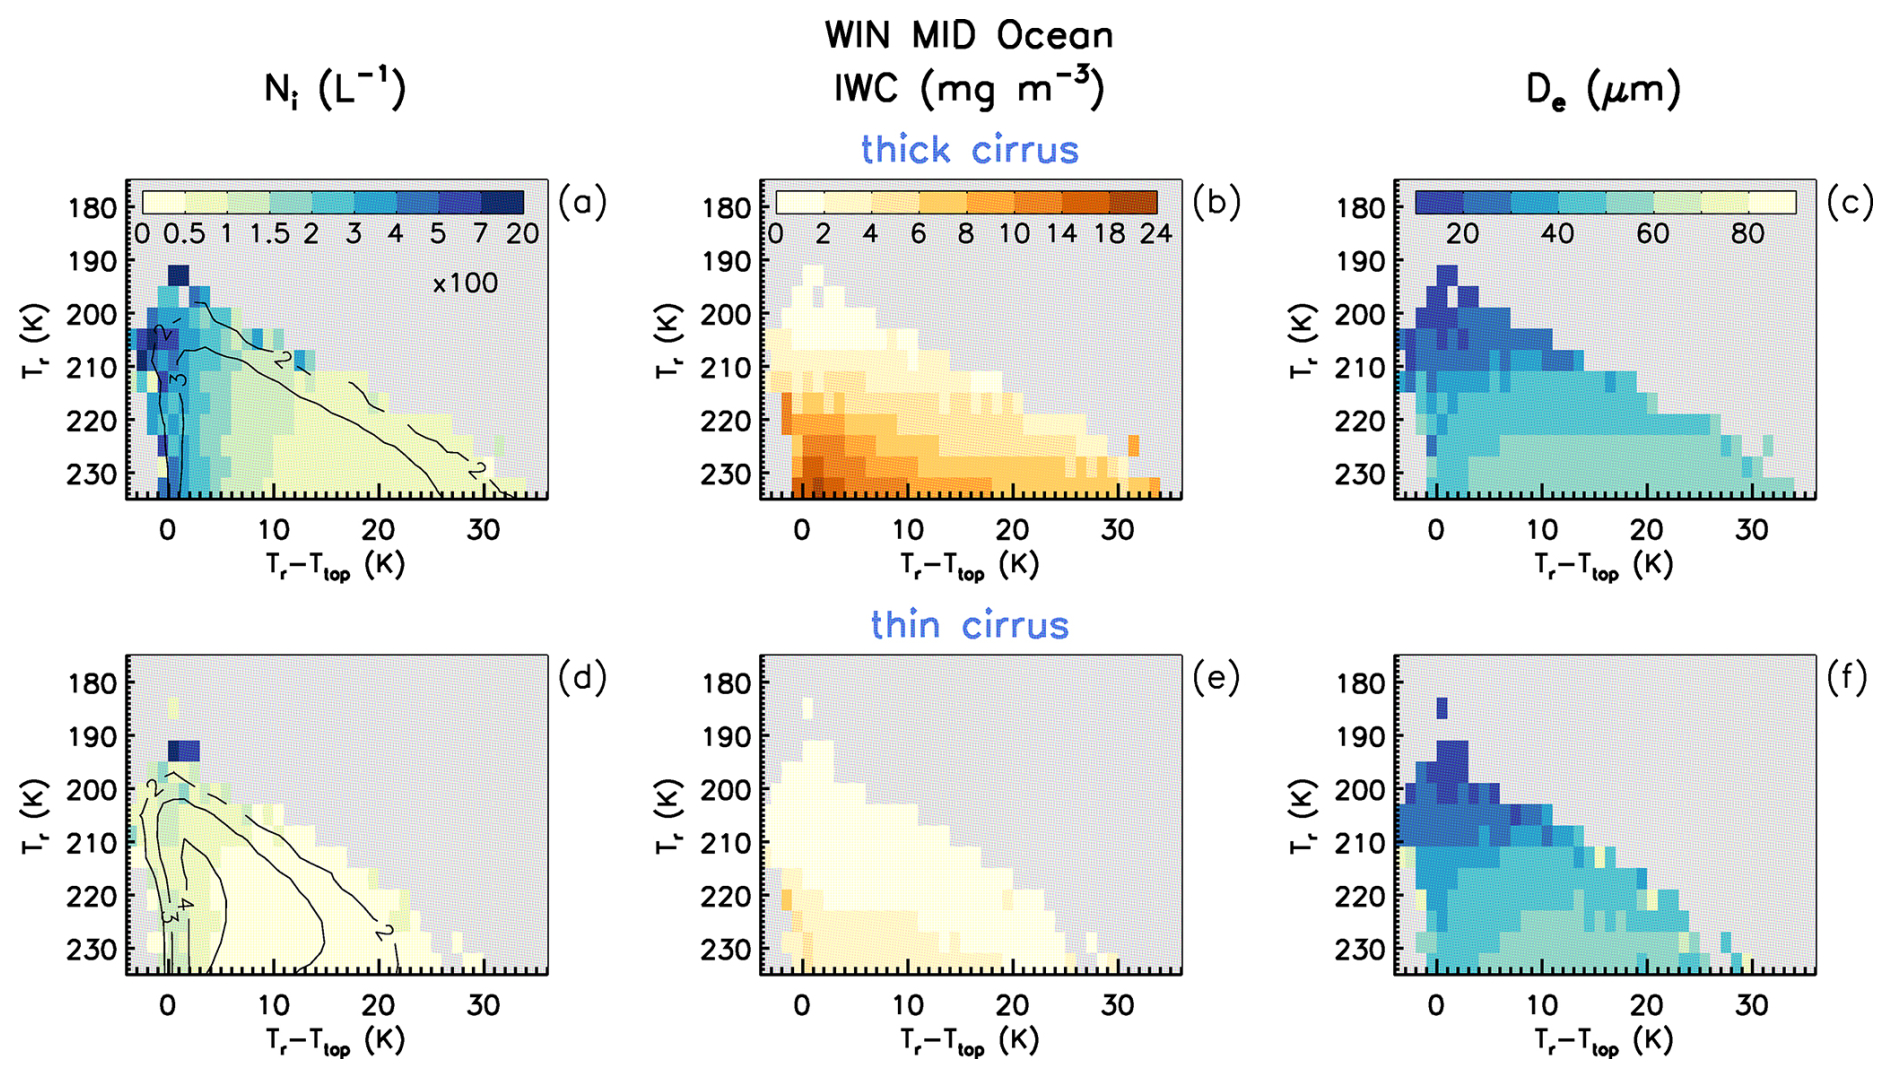
Figure 6Cirrus cloud median ice particle number concentration Ni (a, c), IWC (b, d), and De (c, f) plotted in Tr vs. Tr–Ttop space (for both WBC and in situ cirrus clouds) where Ttop is cloud top temperature and Tr–Ttop is related to cloud geometrical thickness. Panels (a)–(c) feature thick cirrus (∼ 0.3 < τ < ∼ 3) while panels (d)–(f) feature thin cirrus (∼ 0.01 < τ < ∼ 0.3). While only winter midlatitudes (WIN MID) over oceans are shown here during 2008, 2010, 2012, and 2013, these results were found to be valid at all latitudes and seasons over oceans. For panels (a) and (d), the numbers in the color legend are to be multiplied by 100 to give Ni in L−1.
The cirrus cloud remote sensing results from Dekoutsidis et al. (2023) and the cirrus cloud modeling results of Spichtinger and Gierens (2009a, b) both show that hom is primarily active only near cloud top, with the later showing relatively low Ni in the mid- to lower cloud where sedimenting ice crystals quench hom by lowering the RHi. Based on this, geometrically thicker cirrus should have vertically averaged Ni much lower than Ni in the upper cloud and in geometrically thinner cirrus (assuming comparable thicknesses for the ice generating regions). These findings are consistent with our results for optically thick cirrus. IWC for these cirrus (Fig. 6b) is higher than for optically thin cirrus (Fig. 6e) clouds which exhibit much lower values, typically smaller than 4 mg m−3. Jensen et al. (2024) show that Ni and IWC are higher in younger tropical cirrus clouds due to mesoscale temperature fluctuations from gravity waves that act to decrease them over time. This may help explain these results if hom cirrus are associated with young cirrus. Differences in De between the two τ categories are considerably less, as shown in Fig. 6c and f. For a given Tr, De tends to be quasi-constant, although decreasing for the geometrically thinnest clouds in both τ categories. To summarize, these results show that hom is active in optically thick cirrus (due to the high Ni in geometrically thin cirrus) but not in optically thin cirrus. Moreover, they show that hom mostly affects Ni and IWC, with perhaps a secondary impact on decreasing De (referring to Figs. 2, 3, S5 and S6 as well as Fig. 6). This suggests that the ratio IWC De and therefore the extinction coefficient (αext = 3 IWC (ρiDe), where ρi = bulk density of ice = 0.917 g cm−3) may be sensitive to hom.
3.2 Using the extinction coefficient to identify hom-affected and het cirrus clouds
As described in M2018 and M2025, one of the cloud properties retrieved by this method is the cloud extinction coefficient for visible light, αext. Here we use this retrieved αext as a means for measuring the activity of hom since it contains the ratio IWC De, which was shown in Sect. 3.1 to be sensitive to hom activity. For a given Tr, relatively high values of αext should correspond to a substantial impact from hom on the cloud microphysics.
To test this idea, Ni is plotted in Tr vs. log (αext) space in Fig. 7 for retrievals over ocean using all IIR samples, with τ ranging from ∼ 0.01 to ∼ 3, for the tropics, midlatitudes and high latitudes during winter (for both hemispheres) for in situ cirrus and WBC clouds. Light gray regions in these plots are where the number of samples is smaller than 10. Characteristic in all plots is a broad region on the left-hand side (relatively low αext) where Ni < 30 L−1. Although hom can produce such low concentrations at warmer temperatures and low updrafts (Krämer et al., 2016), hom tends to produce much higher Ni (Barahona and Nenes, 2009). To the right of this region is a gradient of increasing Ni, culminating in values of Ni > 1000 L−1. This gradient region is probably produced by varying degrees of hom activity, although het may also contribute to this gradient under conditions of relatively high INP concentration. It is evident that hom-affected cirrus clouds are common in both in situ cirrus and WBC. For WBC, hom appears quite active even at the highest temperatures. This can be understood if the cloud is glaciated by het freezing at T > 235 K and ice supersaturation si is already near the hom threshold. Then some cloud parcels are transported upwards across the 235 K isotherm, increasing si, with haze solution droplets freezing as they cross this isotherm. The main difference between these cloud types is in the tropics where in situ cirrus often appear to the right-hand side of the region predicted for pure hom (i.e., the triangles or squares), which will be discussed below. This may be due to deep convection overshooting the temperature level predicted for hom to activate, depositing ice mass at lower temperatures where in situ cirrus may subsequently form. Results like Fig. 7 are shown in Fig. S7 for land where this “overshooting effect” is more evident for in situ cirrus outside the tropics, perhaps due to stronger orography-induced updrafts over land. Also to be noted in Fig. S7 is the strong contribution from polar stratospheric clouds over Antarctica at very cold temperatures. To the right of this Ni gradient in Fig. 7, the boundary between peak Ni values and the “no data” region has a curious diagonal orientation (as well as the gradient) that may be explained from first principles.
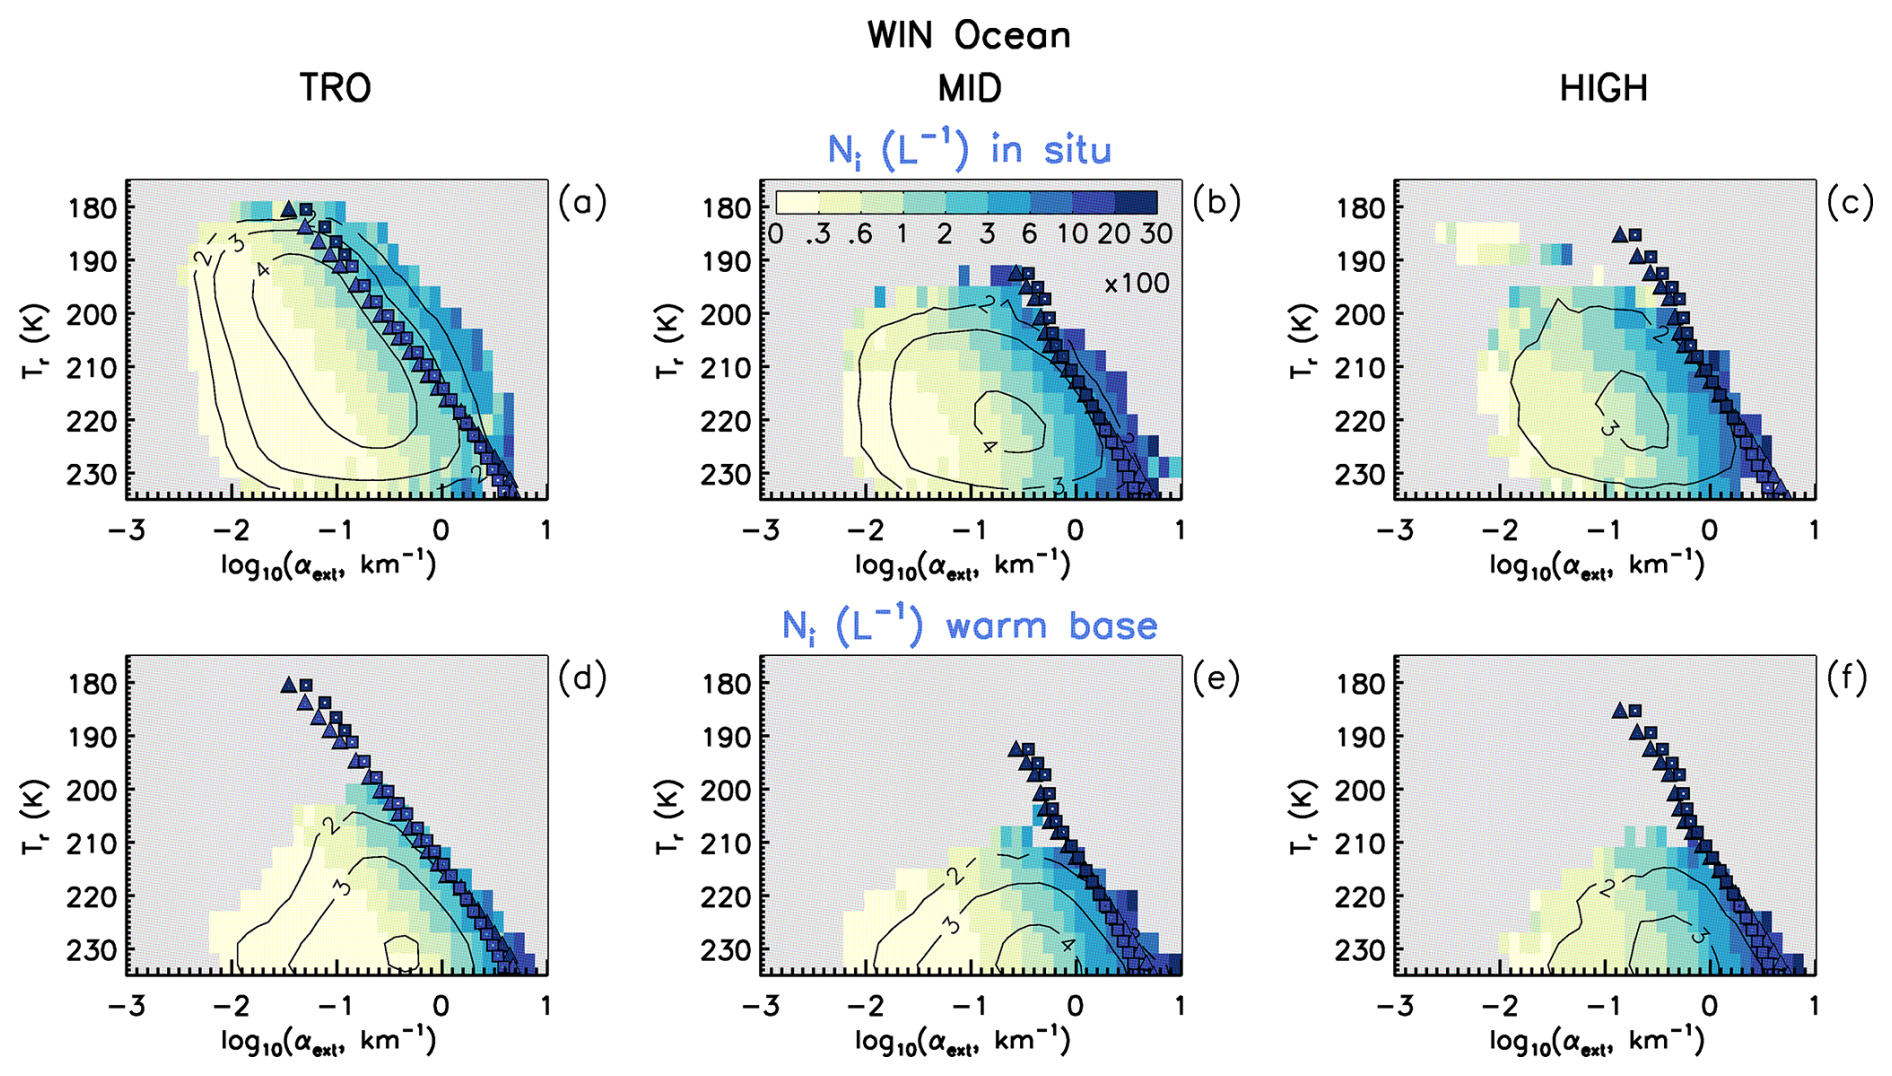
Figure 7Median retrieved ice particle number concentration Ni plotted in Tr vs. log (αext) space to separate the het- and hom-regimes. The black contours show the log 10 of the number of samples. The numbers in the color legend are to be multiplied by 100 to give Ni in L−1. Retrievals are over ocean using all IIR samples for in situ cirrus and WBC as indicated, with τ ranging from ∼ 0.01 to ∼ 3, for the tropics (TRO, panels a and d), midlatitudes (MID, panels b and e), and high latitudes (HIGH, panels c and f) during winter (WIN) using both hemispheres during 2008, 2010, 2012 and 2013. The triangles and squares represent theoretical and empirical predictions for ice nucleation through hom. The color within each triangle or square indicates the approximate Nmax for pure hom conditions via the color bar legends.
To explore this further, two formulations of the Clausius–Clapeyron equation and the supersaturation threshold equation for hom, first derived in Lamb and Verlinde (2011), were used:
where esi is water vapor pressure at ice saturation, Ls is latent heat of sublimation, Rg is the gas constant, T is temperature and es0 and T0 refer to water vapor pressure and temperature at the ice-point of water (6.11 hPa and 273.15 K, respectively). Reformulating Eq. (1) as described in Sect. 3.3.1 of Lamb and Verlinde (2011) gives an expression useful in calculating the supersaturation required for homogeneous ice nucleation:
where es = water vapor pressure at water saturation and Lf = latent heat of fusion. Finally, the threshold supersaturation ratio where hom occurs, , was developed in Lamb and Verlinde (2011) from results in Koop et al. (2000):
Noting that the water vapor pressure at , ehom, is simply ehom = esi, water vapor densities are obtained from the gas law (ρhom = and ρsi = , Rv = gas constant for water vapor) to predict the maximum IWC resulting from hom:
But to relate IWChom(T) to retrieved IWC in Tr vs. αext space, a corresponding αext is needed which requires De. For the tropics, the PSD mean ice particle maximum dimension Dmean was related to T using the CEPEX PSD scheme described in Mitchell et al. (1999), where only the large ice particle mode was used. For outside the tropics, a Dmean–T relationship based on the SPARTICUS field campaign (Mishra et al., 2014) was used, which is log (Dmean) = 0.0307 T + 3.169, with Dmean in micrometers and T in °C. Using the ice particle mass- and projected-area-dimensional relationships from Erfani and Mitchell (2016) and an exponential gamma PSD, De was calculated from Dmean as described in that study. This gives De under “normal” conditions. To estimate De under maximum hom conditions (corresponding to Eq. 4), we use panels (h), (i) and (l) of Fig. 10 over land for high latitudes and for midlatitudes during winter which show that when hom is most active, De decreases from “normal values” of ∼ 55 to ∼ 35.5 µm for T between 219 and 235 K, or by a factor of 0.646. Thus, we apply this factor to De estimated from Dmean to estimate De for maximum hom conditions. Finally, we calculate Ni by converting this De back to Dmean for an exponential PSD using Eq. (7) in Mitchell et al. (2020) and then calculating the PSD slope parameter λ from Dmean (λ = ). For the region where hom is most active, Ni is Nmax calculated as
where ν is a parameter in the gamma PSD and α and β define the ice particle mass relationship m = αDβ, where ν = 0 here. The values of α and β were obtained from Erfani and Mitchell (2016) in the same way that De was calculated; Nmax predicted from Eqs. (5) and (1) of Schneider et al. (2021) is overplotted in Fig. 7 as shown by the triangles and squares, respectively, with the color inside the triangles/squares indicating the concentration range (based on the color bar). Schneider et al. (2021) provide an empirical expression for based on experiments in the AIDA cloud chamber.
Figure 8a to c show the retrieved median IWC plotted in Tr vs. log (αext) space for all samples over oceans (both in situ and WBC), with triangles predicted from Eq. (4) overlaying these retrieved IWCs. The different Dmean–T relationships for the tropics and for outside the tropics yield slightly different αext(T) associated to IWChom(T) (since αext = 3 IWC (ρiDe)). The color within the triangle indicates the approximate IWChom value via the color bar legend. It is seen that the color within the triangles matches the background color in almost all cases, showing good agreement between basic theory and the retrieved IWC where hom is expected to be most active. IWChom was also calculated from Eq. (1) in Schneider et al. (2021), shown by the squares in Fig. 8. There is close agreement between the theoretical (i.e., Eq. 3) and experimental methods, where both methods address the homogeneous freezing of solution haze droplets based on the activity of water in a solution droplet (Koop et al., 2000) and do not address the homogeneous freezing of activated cloud droplets. In panels (d) to (f), retrieved median De is plotted in Tr vs. log (αext) space for all samples over oceans, with theoretical and experimental hom De indicated by the triangles and squares, respectively, with their color based on the same color legend as used for the retrievals. The predicted and retrieved De values are in general agreement for this hom-active region. Results like Fig. 8 but over land are shown in Fig. S8.
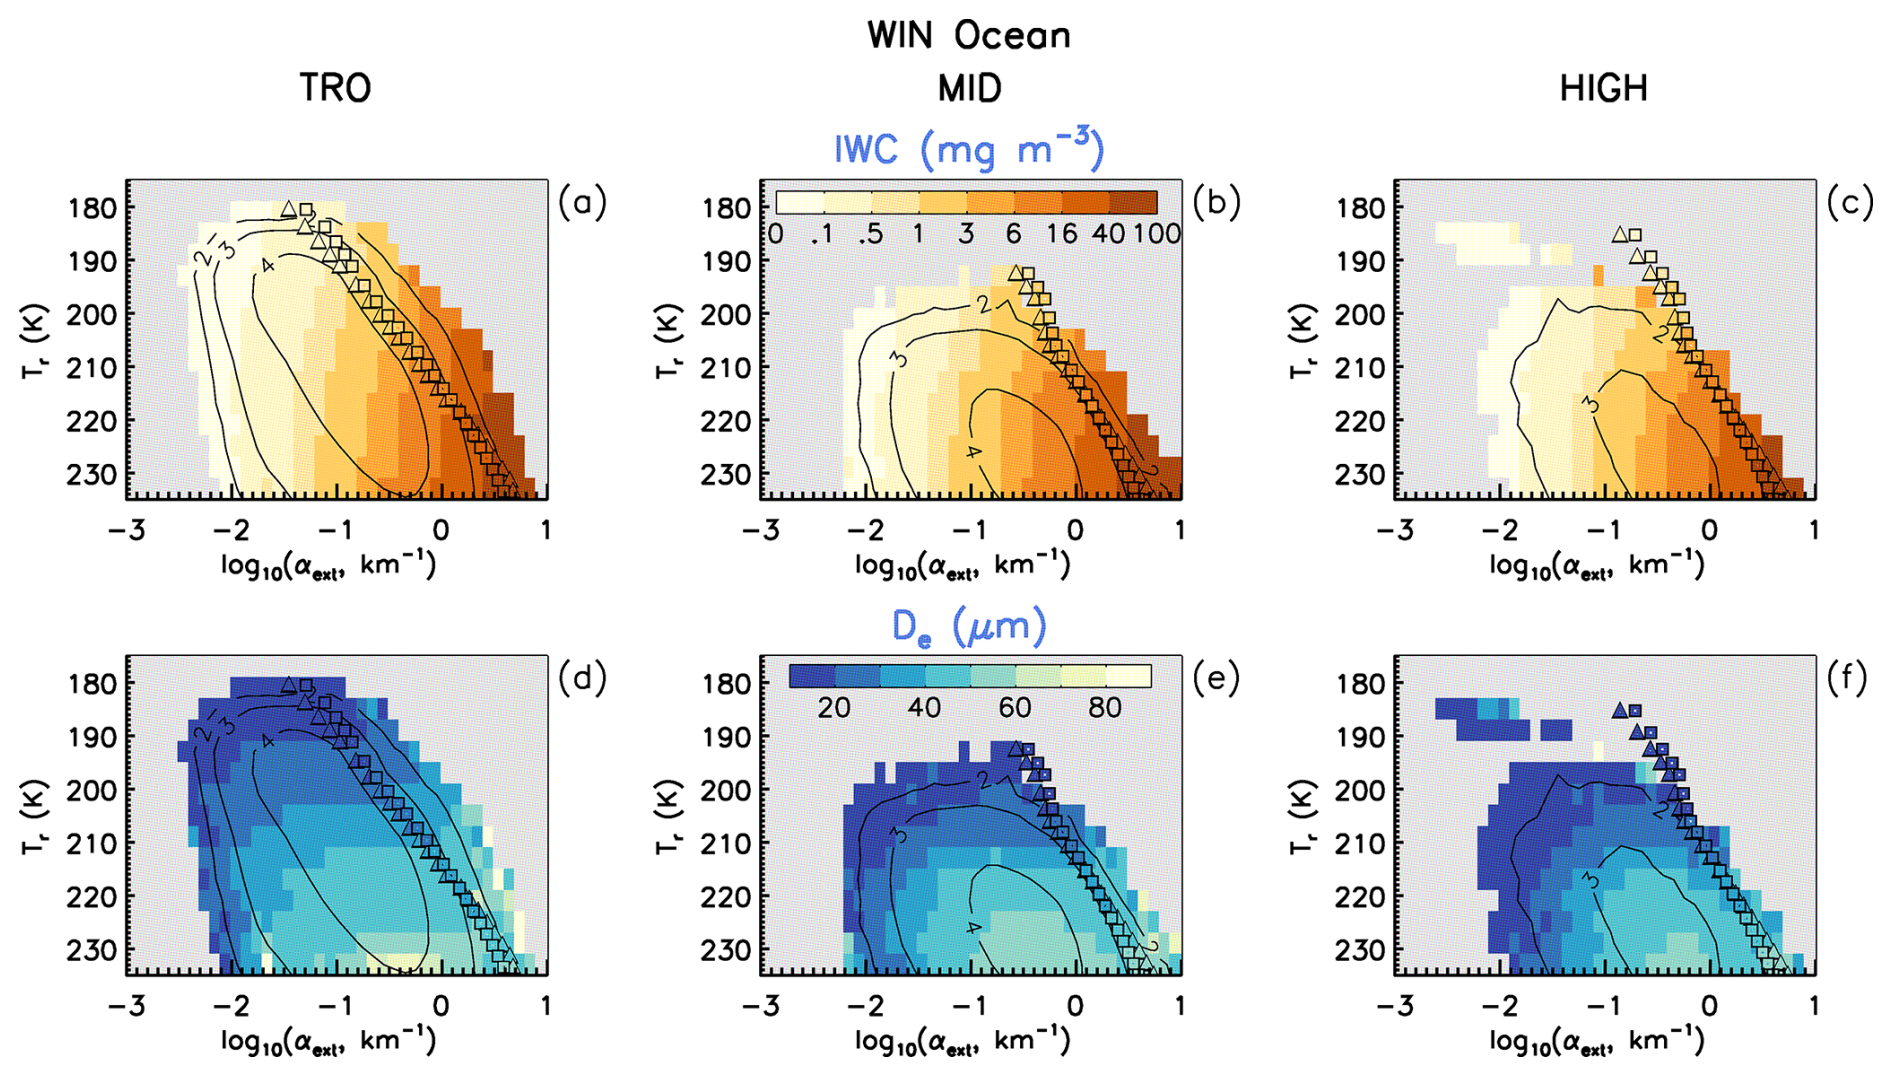
Figure 8Median retrieved IWC (a–c) and De (d–f) plotted in Tr vs. log (αext) space to separate the het- and hom-regimes. The black contours show log 10(number of samples). The color-bars give IWC (mg m−3) and De (µm). Retrievals are over oceans using all IIR samples (both in situ and WBC), with τ ranging from ∼ 0.01 to ∼ 3, for the tropics (TRO, panels a, d), midlatitudes (MID, panels b, e), and high latitudes (HIGH, panels c, f) during winter (WIN) using both hemispheres during 2008, 2010, 2012 and 2013. The triangles and the squares represent predictions from simple hom theory using Eq. (4) and Schneider et al. (2021), respectively, and the color within each triangle or square indicates the approximate IWChom (a–c) and hom De (d–f) values via the color bar legends.
There is a close correspondence between the predicted triangle (or square) color and adjacent retrieval colors in Figs. 8 and S8, indicating reasonably good agreement between theory and observations. The predicted triangles and squares in Figs. 7 and S7 show the maximum Ni expected for a given Tr (thus indicating the region of maximum hom activity). The predicted colors (triangles and squares) tend to indicate higher Ni than the adjacent background retrieved Ni colors, which is consistent with expectations that hom events are diluted through mixing and entrainment (Jensen et al., 2012). The diagonal orientation of this hom region is a consequence of the Clausius–Clapeyron equation that predicts lower saturation water vapor pressure and density as T decreases. In the tropics, the predicted colors indicate considerably higher Ni values than the adjacent retrieval values. This may indicate that hom is less active in the tropics for our cloud sampling.
The black contours in Figs. 7, S7, 8 and S8 show the pixel count densities in Tr vs. log (αext) space. Outside the tropics, the triangles/squares coincide with relatively low pixel counts, indicating the frequency of occurrence for hom events is quite low, consistent with theoretical expectations (e.g., Krämer et al., 2016).
3.3 Microphysical attributes of het and hom-affected cirrus clouds
It has now been shown that αext seems to be a suitable metric to identify varying degrees of hom activity, but how can this be used to quantify the contribution of hom-affected cirrus clouds in terms of frequency of occurrence and radiative impact? To address this question, a method is presented that estimates the fraction of hom-affected cirrus clouds such that these clouds are strongly altered microphysically relative to cirrus associated with relatively low Ni, such as cirrus formed through het and aged, dissipating/sublimating cirrus clouds (formed either through hom or het). Henceforth the former will be referred to as hom cirrus and the latter as het cirrus. These dissipating cirrus clouds are microphysically described in Fig. 6 of Krämer et al. (2020) where RHi < 100 %. These two categories will now be described and finally quantified.
The median Ni and median De corresponding to various temperature intervals in Figs. 7 and 8 were plotted against αext in Fig. 9 (panels a–f and g–l, respectively) for both winter and summer. These retrievals are over oceans for only in situ cirrus clouds, and a similar plot, Fig. S9, is given for WBC clouds. When median De was set equal to the sensitivity limit (M2025), it was not plotted, which rarely occurred. Colors indicate the 4 K temperature interval corresponding to the retrievals. Outside the tropics, it is seen that two populations exist, characterized by different ) slopes in the case of Ni or trends in the case of De, mostly for the higher temperatures. If one were to describe the “warm-colored” (T > 215 K) Ni data with two linear fits, a change in slope occurs around αext ≈ 0.3 km−1. The increased slope for αext > 0.3 km−1 is where median De increases slowly or starts decreasing. For Tr < 215 K, these trends are less coherent. This behavior suggests a transition from het cirrus to hom cirrus. For Ni in the tropics, there is no apparent change in slope, which may indicate that hom is less active in the tropics. Note that this analysis is based on clouds having τ < ∼ 3 and thus does not consider thick cirrus clouds originating from deep convection where τ > 3 and hom is probably active in the strong updrafts. Note that these observations apply to both in situ and WBC clouds, suggesting that similar physics applies to both cloud types.
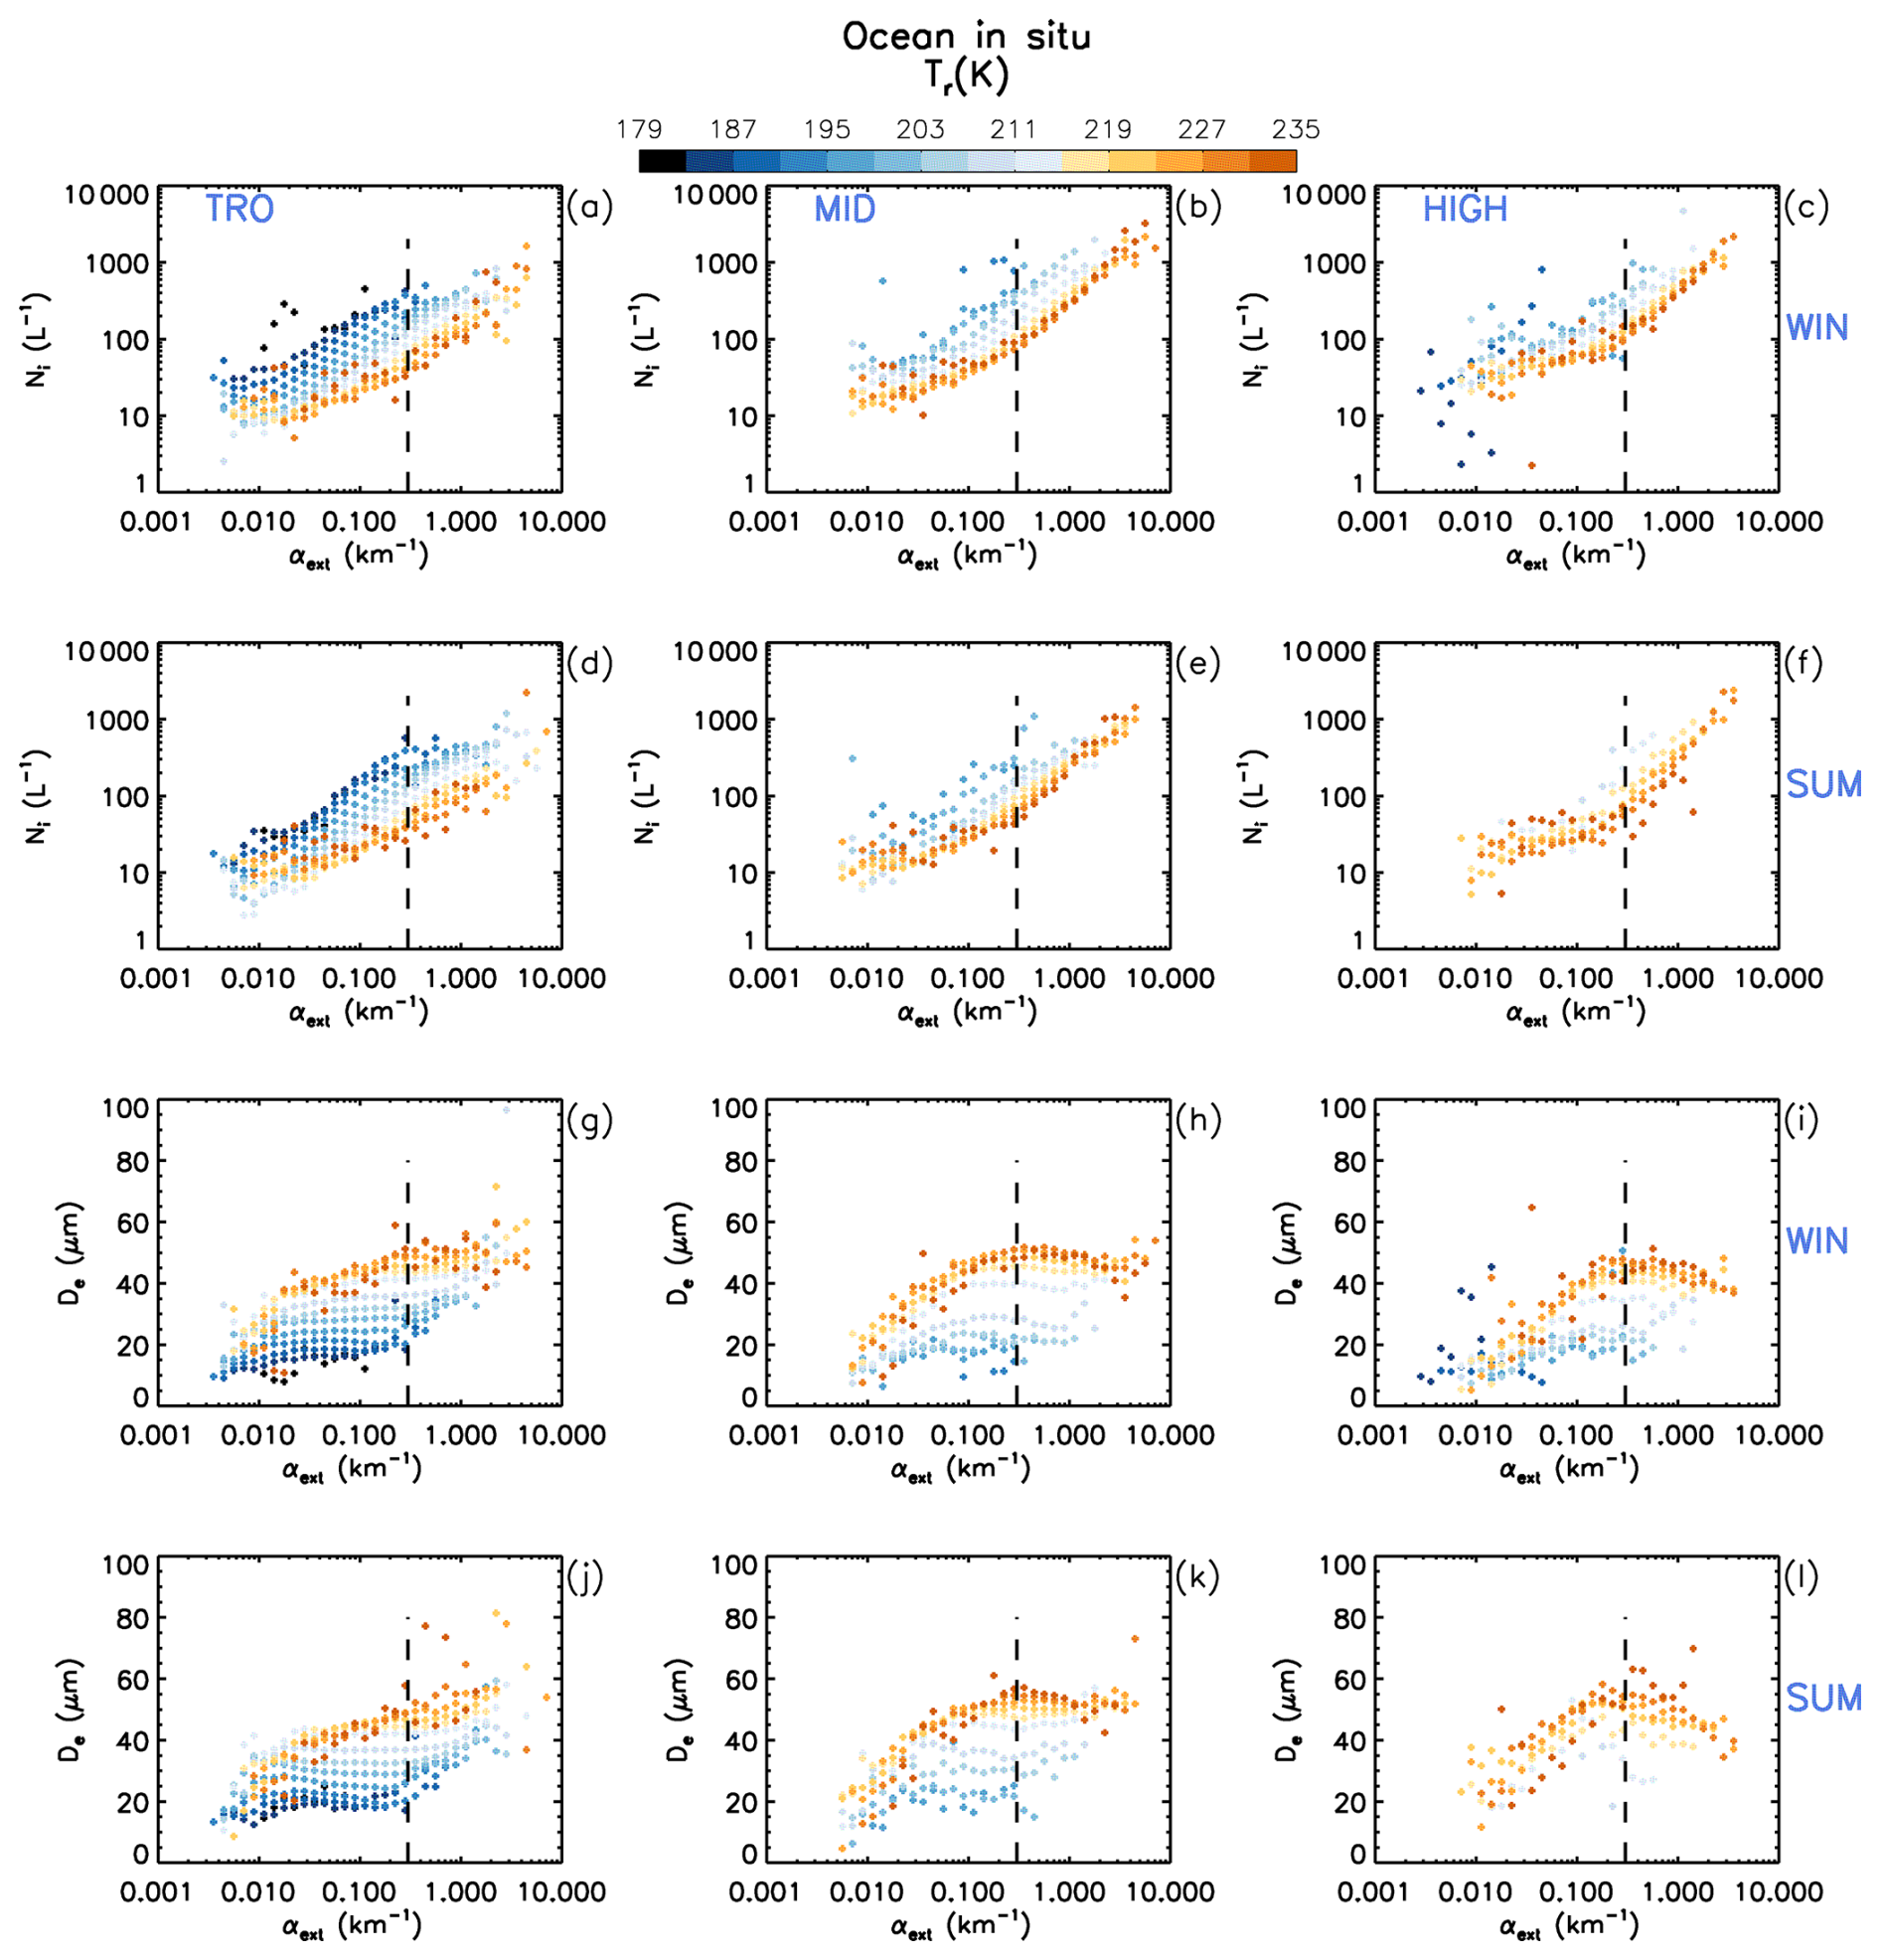
Figure 9The dependence of median log Ni (upper half, panels a–f) and median De (lower half, panels g–l) on αext for all in situ cirrus samples over oceans (∼ 0.01 < τ < ∼ 3). The various Tr intervals (4 K per interval) are given by the color legend. Each row features the tropics (TRO), midlatitudes (MID), and high latitudes (HIGH) in both hemispheres for either winter (WIN) or summer (SUM). The vertical dashed line at αext = 0.3 km−1 in panels (a)–(f) marks where a change in slope generally occurs for the 231–235 K interval. These same dashed line positions are also indicated in panels (g)–(l) showing their relation to the De maximum.
A maximum in De is expected to occur after a slope change regarding Ni due to the competition for water vapor among a relatively high concentration of newly formed ice crystals. This competition reduces the growth rates of these ice crystals, keeping them relatively small. Other than hom, we know of no process that can explain the decrease in De at higher extinction shown in Fig. 9. Since for spherical ice the spherical volume radius Rv is proportional to , it is apparent that even for non-spherical ice crystals, it will take a larger change in Ni to affect a significant change in Rv or De through vapor competition effects. Thus, regarding De and Ni, a decrease in De caused by hom would be a more conservative criterion for defining hom cirrus. This would be more pragmatic if one were primarily interested in the impact of hom on radiation since cloud radiative properties are parameterized in terms of De and IWC (e.g., Gettelman et al., 2010; Emde et al., 2016). For this reason, we define hom cirrus as cirrus having an extinction exceeding that at the De maximum.
3.3.1 Hom intensity
To better understand these principles, these ideas can be tested in an environment where INP concentrations are higher, that is, over land. Figure 10 is like Fig. 9 except the retrievals are over land and therefore only for optically thick in situ cirrus (τ > ∼ 0.3). Despite the different ranges of optical depth in Figs. 9 and 10, observations are qualitatively similar. Regarding the Ni plots (panels a–f) in Fig. 10, there is a clear inflection point around αext = 0.2 to 0.3 km−1 where the Ni slope changes for 215 < Tr < 235 K in all latitude bands and around αext = 0.1 to 0.2 km−1 for Tr < 215 K in three latitude bands. Note that consistent changes of slope or trend of opposite sign are seen in the De plots (panels g–l). Referring to Fig. 7, this change in Ni slope is due to hom with hom affecting the cirrus microphysics for αext ≥ 0.3 km−1. The slope of the Ni data for 235–215 K for αext ≥ 0.5 km−1 appears related to the production rate of ice crystals through hom (i.e., Ni is higher for steeper slopes) and as such can be viewed as a measure of the intensity of hom. The midlatitude slope over land is greater during winter relative to summer, consistent with Ni in Figs. 2 and S5. This may be due to higher cirrus cloud updrafts over land, especially over mountainous terrain. For αext < 0.3 km−1, het is expected to dominate, and the Ni distributions are almost flat outside the tropics, with Ni increasing somewhat for decreasing αext in the tropics. Figure S10 provides similar results for WBC clouds.
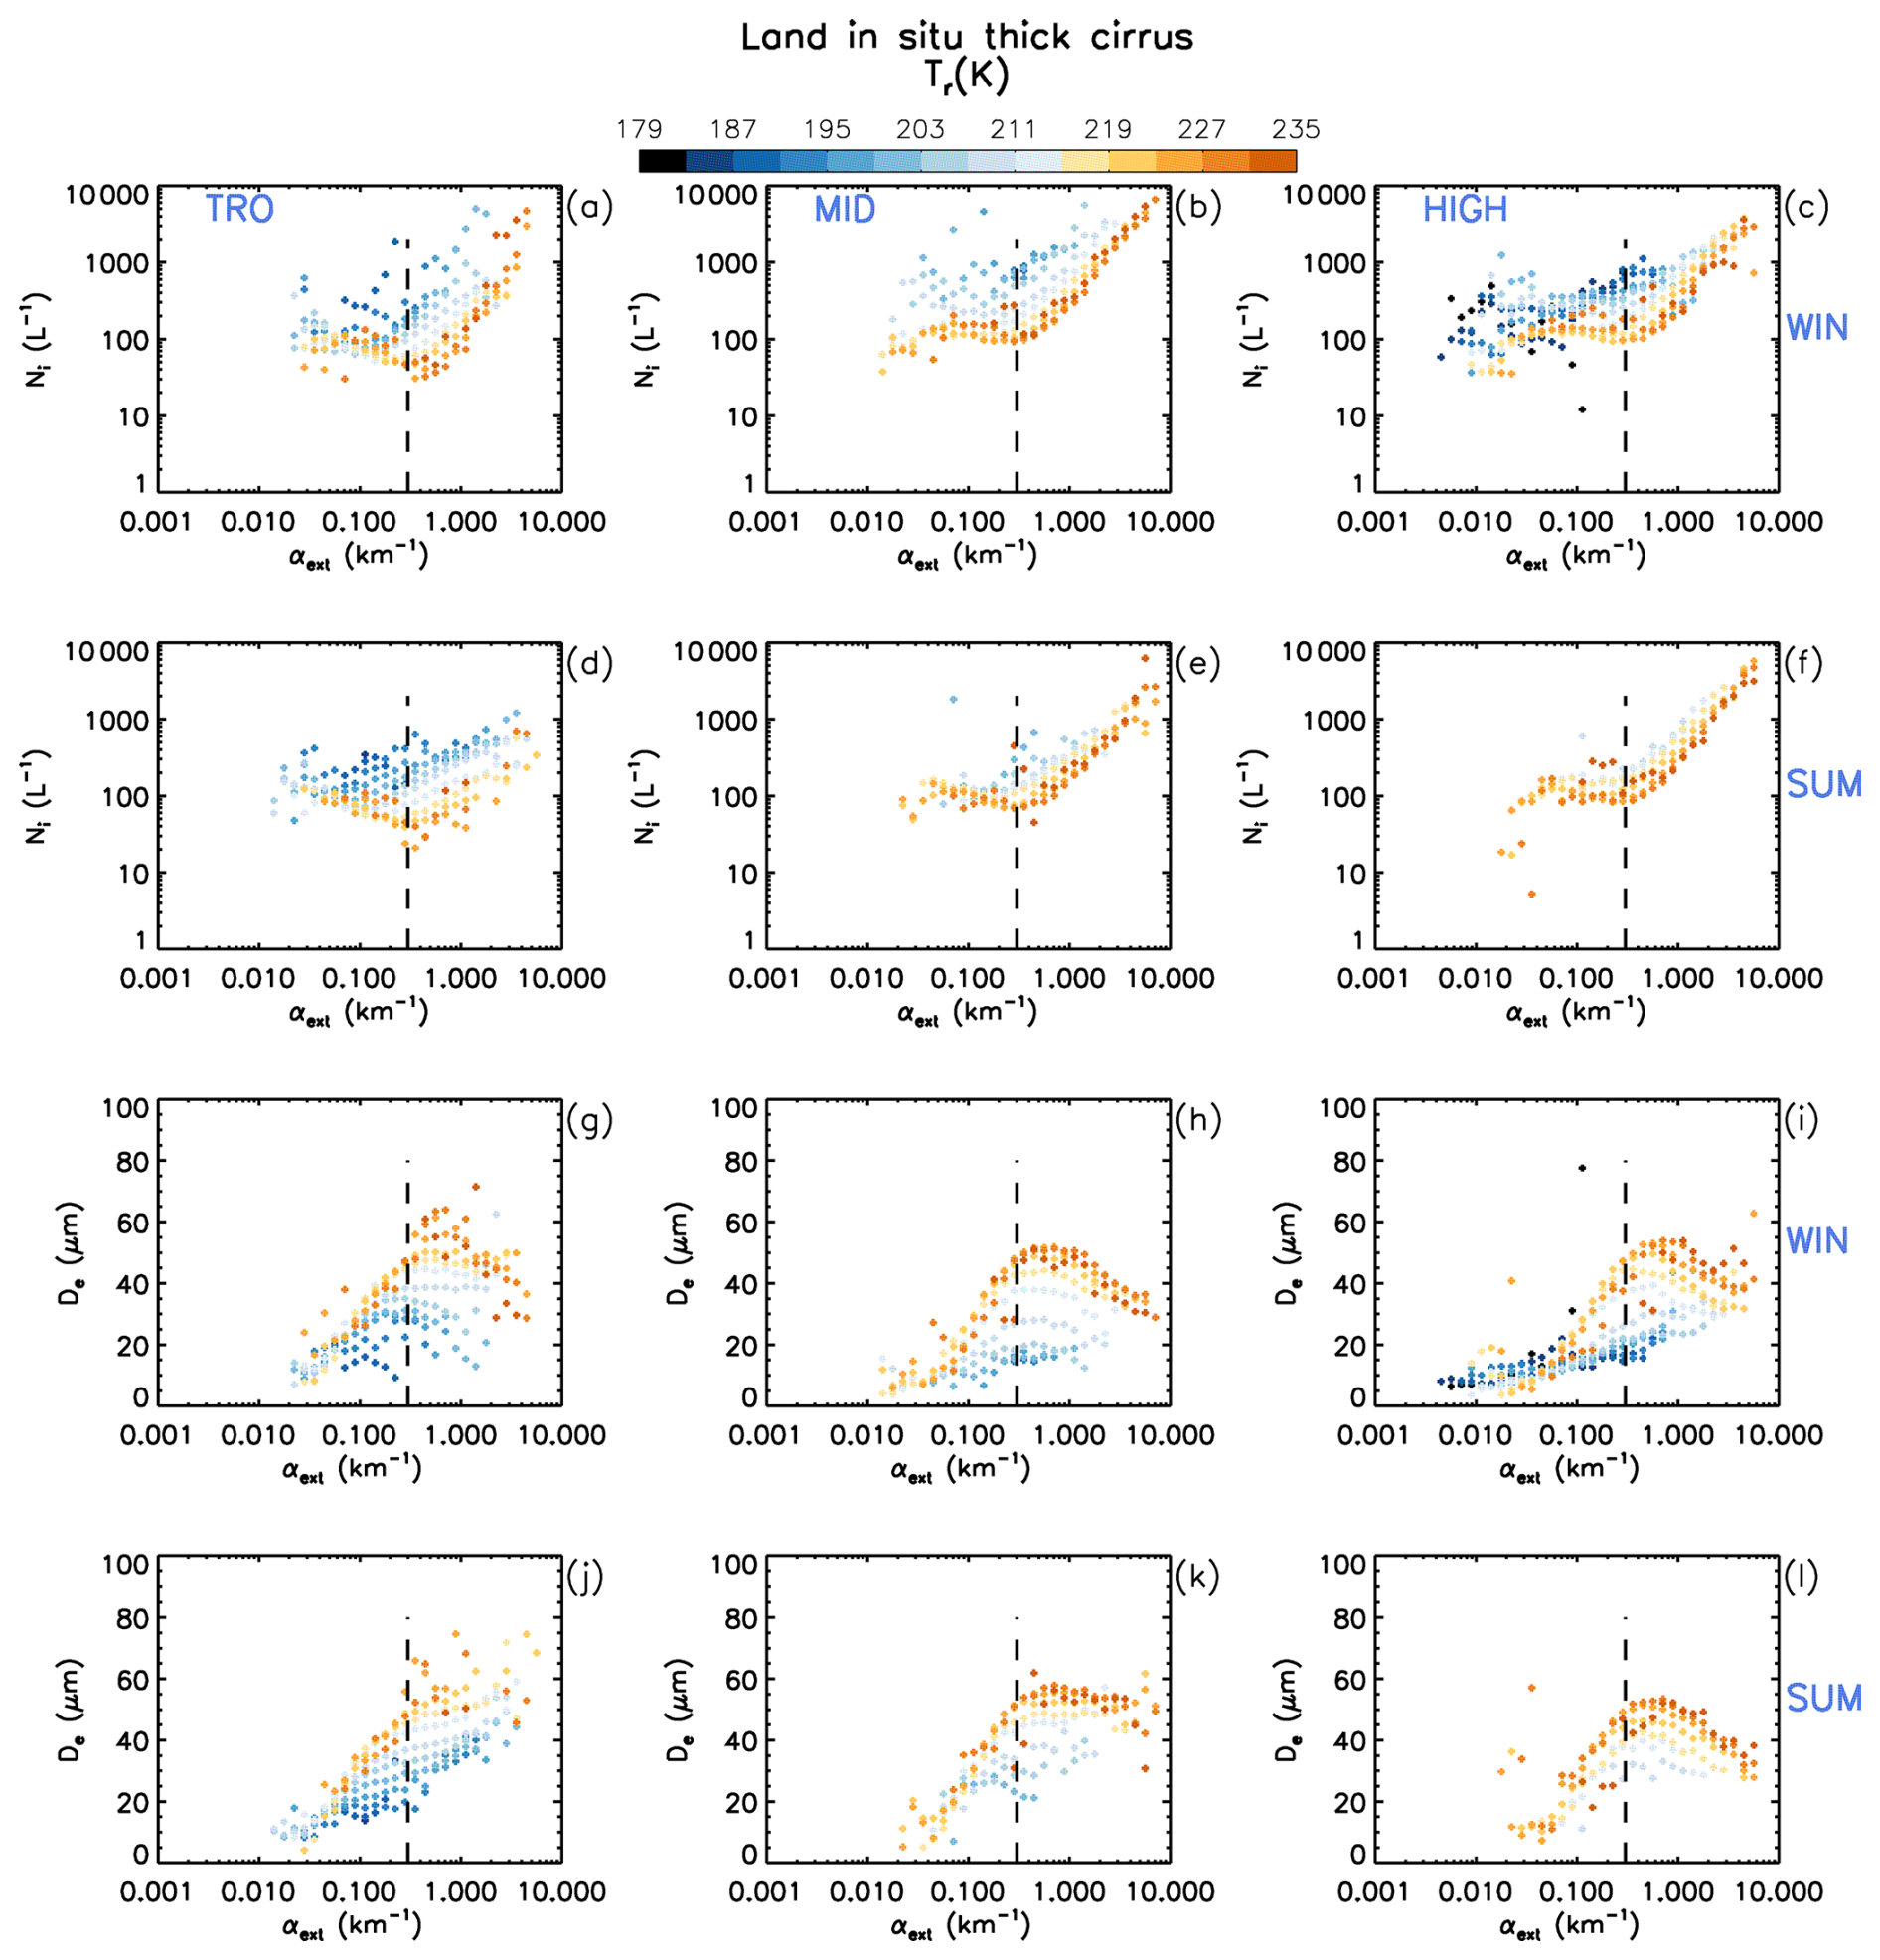
Figure 10Same as in Fig. 9 but for retrievals over land for optically thick in situ cirrus (∼ 0.3 < τ < ∼ 3).
3.3.2 A cirrus cloud Twomey effect?
Most evident when comparing Figs. 9 and 10 (or Figs. S9 and S10) for αext < 0.3 km−1 (i.e., the het cirrus regime) is that median Ni is higher over land (up to a factor of 10), presumably due to higher INP concentrations over land. For direct comparison with Fig. 10, results similar to Fig. 9 but for thick cirrus (like Fig. 10) are shown in Fig. S11. In the lower half of Figs. S11 and 10, De is related to αext where it is evident that De is substantially smaller over land relative to oceans for αext < 0.3 km−1. Since Ni is higher over land (although perhaps not at high latitudes, based on Fig. S11), this suggests that higher INP concentrations over land may be producing a “Twomey effect” in het cirrus clouds over land. While higher updrafts over land could also enhance INP and Ni concentrations, note that updraft effects are implicit in Figs. 9, S11 and 10. That is, higher updrafts are associated with higher IWC (Hu et al., 2021; Mitchell, 1988) and higher extinction is associated with higher IWCs. The apparent Twomey effect here is associated with αext < 0.3 km−1 where updrafts are expected to be relatively weak over both ocean and land.
3.4 Quantifying the contribution of hom-affected cirrus clouds based on extinction and De
As shown in Figs. 9 and 10, De exhibits a maximum where ≈ 0. This maximum generally occurs for αext > 0.3 km−1 and serves as a more conservative estimate of the transition from het to hom-affected conditions. Figure 11 shows plots of Ni in Tr vs. log (αext) space for the tropics, midlatitudes and high latitudes over oceans for DJF and JJA in each hemisphere, where ∼ 0.01 < τ < ∼ 3. The transition from het to hom cirrus at each Tr value is where De is maximum, and this maximum is marked by the black “+” signs. However, in the tropics and in the summer NH midlatitudes, De maxima were ambiguous and the transition from het to hom cirrus at a given Tr was determined by a Ni threshold, Nthres. This threshold is the mean value of Ni that correspond to all the De maxima (51 in total) in the extra-tropics. The value and standard deviation of Nthres is 118 ± 57 L−1 where the standard deviation is probably subject to variations in INP concentration (Haag et al., 2003). The hom threshold was assigned to the αext having the corresponding Ni closest to Nthres. In two extra-tropical datasets (DJF MID SH and DJF MID NH), Nthres was also used to estimate the hom threshold for Tr < 219 K and Tr < 207 K, respectively.
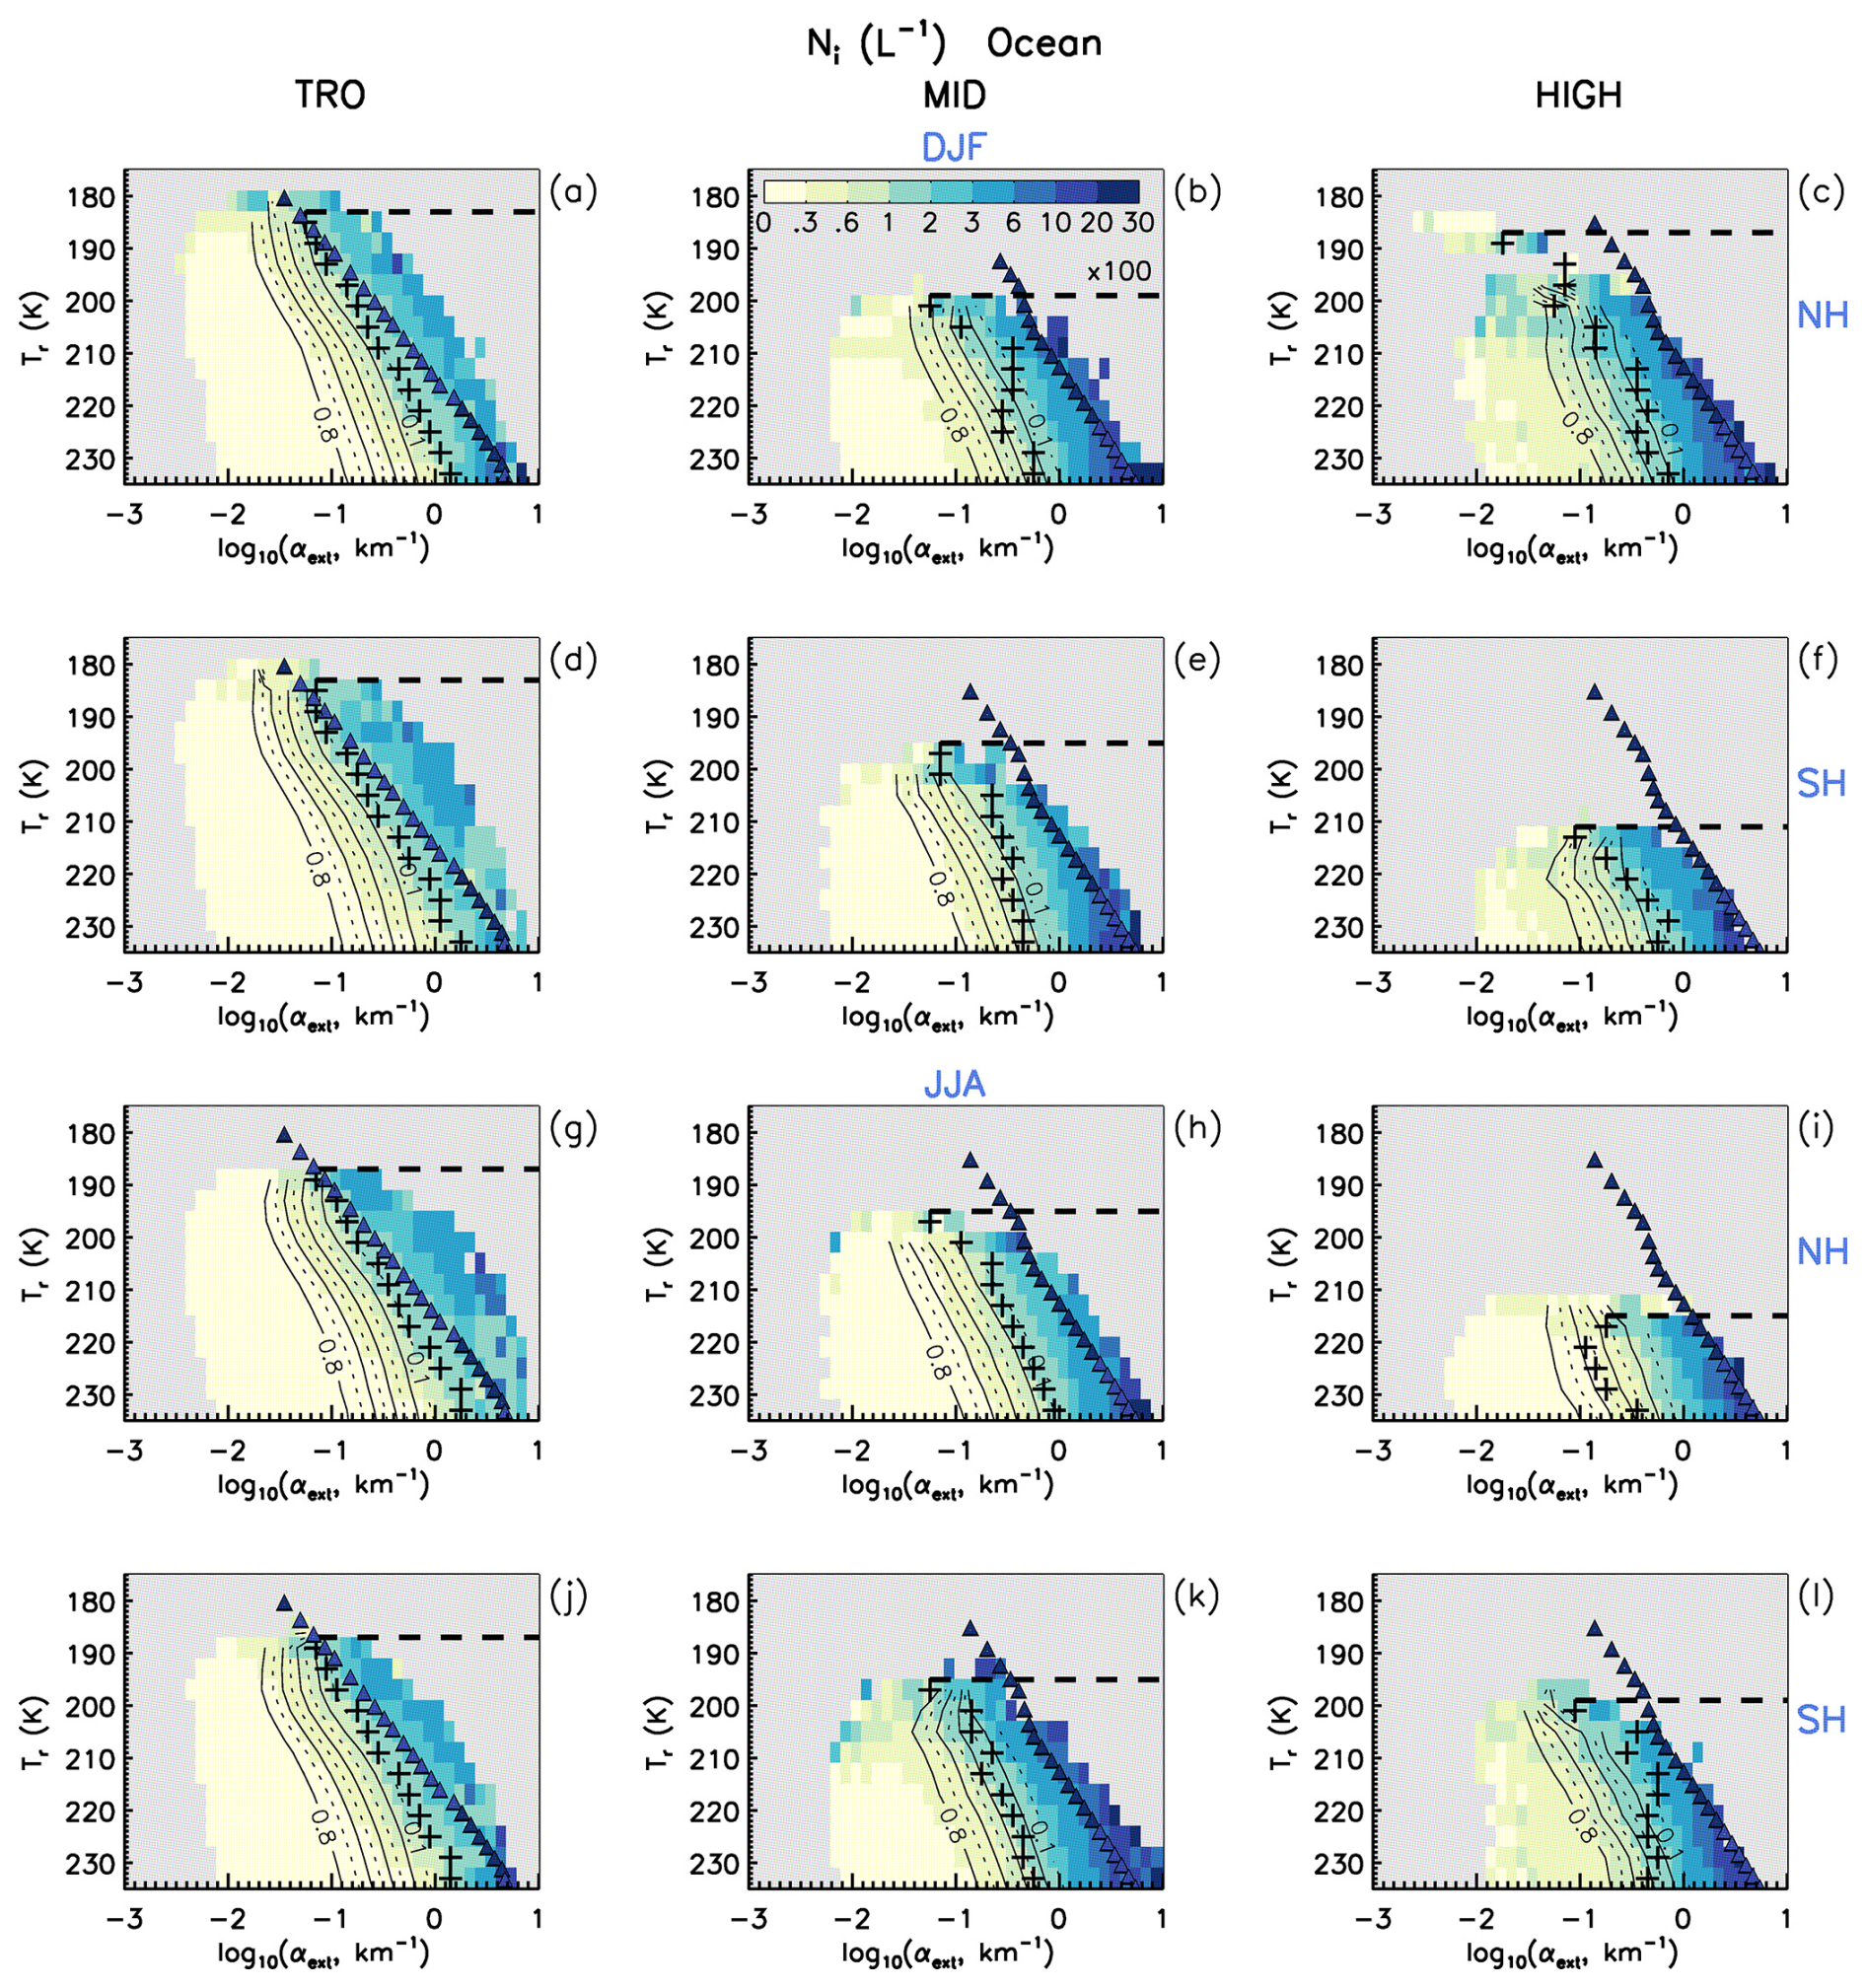
Figure 11Procedure for identifying hom-affected cirrus over oceans using all samples (∼ 0.01 < τ < ∼ 3). The hom-affected region is bounded by the De maxima (+ signs) in the vertical and in the horizontal by the 235 K isotherm and Tmin (dashed line) below which sampling is too low for meaningful analysis. Other features are as in Fig. 7. The alternating solid-dashed contour lines are varied with increments of 0.10 (i.e., 10 %) from right to left to show the approximate fraction of samples (at a given Tr) within the hom-affected region. Each row features the tropics (TRO), midlatitudes (MID), and high latitudes (HIGH) for either the northern (NH, panels a–c and g–i) or southern (SH, panels d–f and j–l) hemisphere in DJF and JJA during 2008, 2010, 2012, and 2013.
The horizontal dashed line in Fig. 11 indicates the temperature Tmin, below which the number of cirrus cloud samples was too low for statistically meaningful analysis. The region of hom-affected cirrus clouds is thus defined as the region bounded by the + signs in the vertical and the dashed line in the horizontal, with the right-hand vertical boundary defined by the absence of data and the lower horizontal boundary defined by the 235 K isotherm. Also plotted in Fig. 11 are alternating solid and dashed curves indicating the fraction of samples, in increments of 0.10 from right to left, having a larger extinction than the extinction corresponding to the curve (at a given Tr). This provides estimates of the fraction of hom cirrus for a given Tr. For reference, the triangles predicted from hom theory are also shown (same as in Fig. 7). Overall, αext at het–hom transitions is found between ∼ 1.8 km−1 (in the tropics) and 0.02 km−1 (in the winter Arctic) and tends to decrease as Tr decreases (similar to the temperature dependence of Ni predicted from hom theory). Similar results were found for cirrus clouds over land (∼ 0.3 < τ < ∼ 3), which are shown in Fig. S12.
These hom region boundaries were incorporated into look-up-tables that relate 4 K temperature intervals to latitude band, season and surface type (oceans or land) for determining whether a sample was het cirrus or hom cirrus. When De > sensitivity limit, we set the sample as het cirrus. Applying this De sensitivity limit to all cirrus cloud samples over oceans reduces the estimated hom fraction by less than 8 % at Tr < 211 K. The largest changes are for Tr within the 223–235 K interval, where the hom fraction is reduced by 50 % in the tropics, and by 22 %–25 % in the extra-tropics.
3.4.1 Results
Results from this analysis over oceans (∼ 0.01 < τ < ∼ 3) are shown in Figs. 12 and 13, where the hom fraction vs. Tr is shown in red. The hom fraction, which is defined as the number of hom cirrus pixels divided by the total number of cirrus pixels, varies with Tr and is typically smaller than 0.4 (with five exceptions at the lowest Tr outside the tropics). WBC clouds, which tend to have stronger updrafts than in situ cirrus (Wernli et al., 2016), contribute primarily to the hom fraction at higher Tr as shown in Appendix A. In addition, Fig. 12 shows median Ni vs. Tr for all cirrus (blue), for het cirrus (black), and for hom cirrus (orange). The “all cirrus” and “het cirrus” profiles are identical where the hom fraction is null and they are close when the hom fraction is relatively small. Conversely, when the hom fraction is relatively large, the “all cirrus” and “hom cirrus” profiles become closer. For the latter, median Ni is most of the time larger than 200 L−1. In this way, Fig. 12 shows how the Tr dependence of the hom fraction affects median Ni.
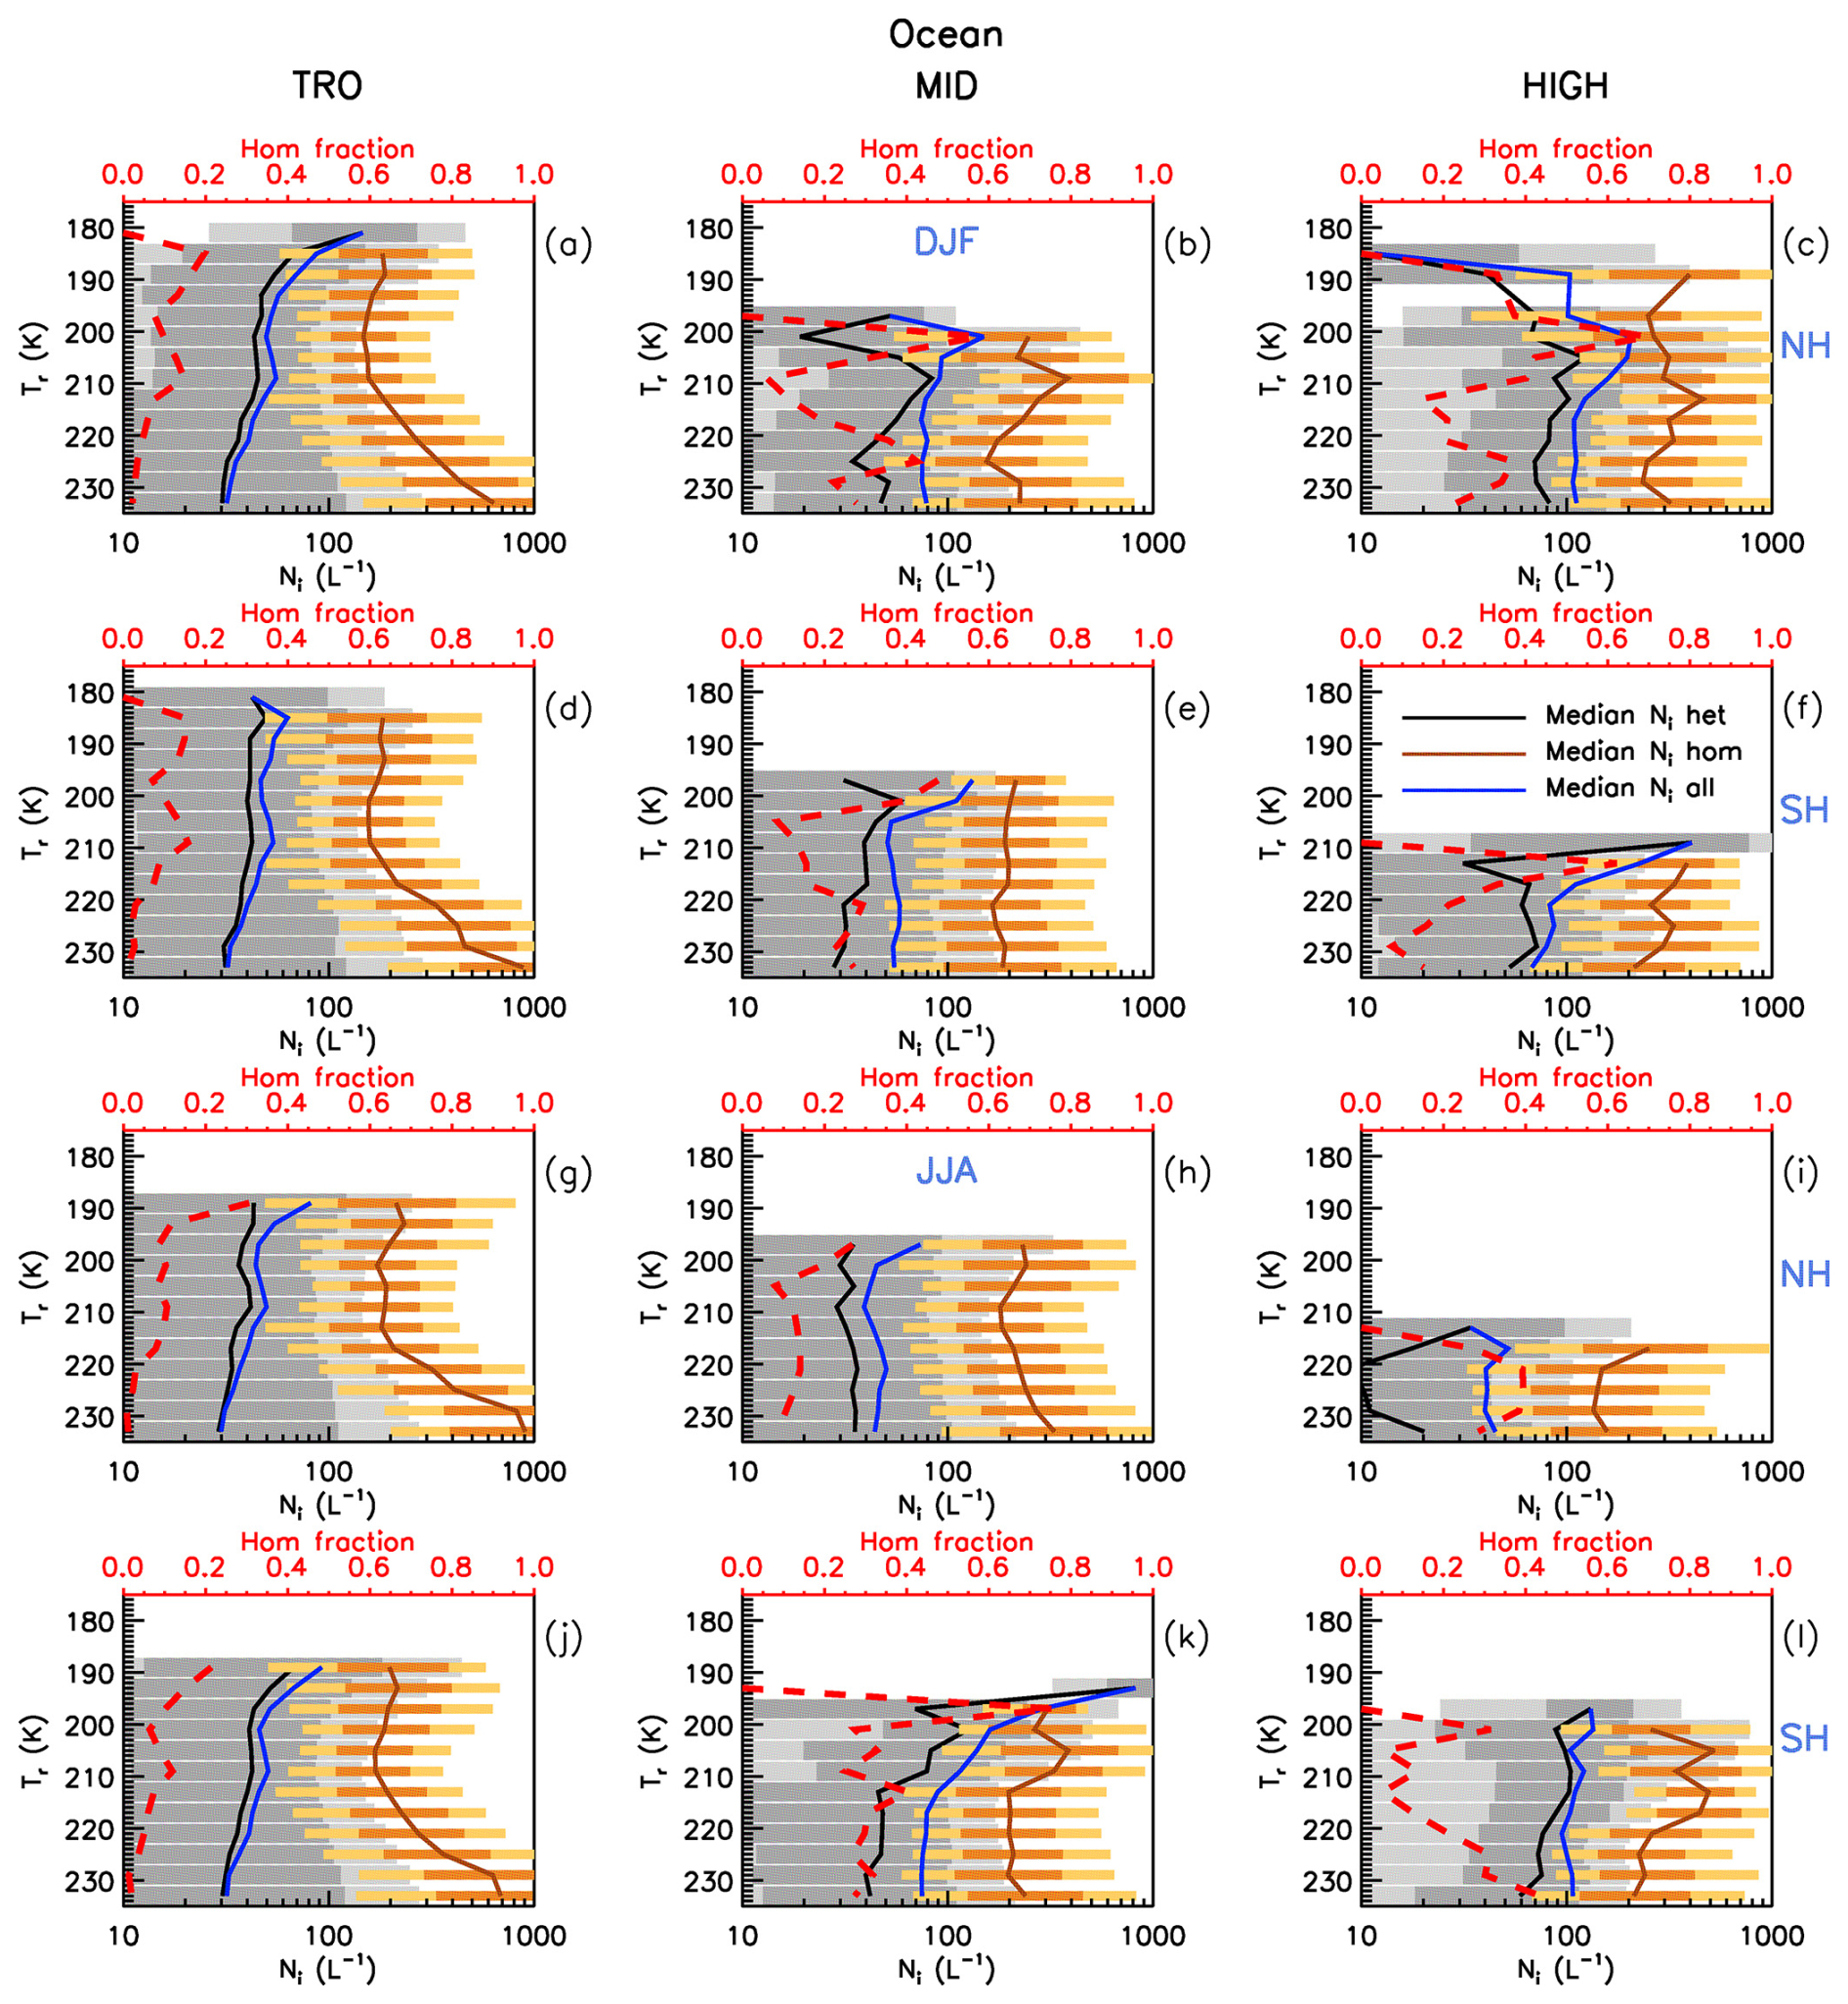
Figure 12The Tr dependence of the hom fraction (red dashed) for all samples over oceans (∼ 0.01 < τ < ∼ 3). Each row features the tropics (TRO), midlatitudes (MID), and high latitudes (HIGH) for either the northern (NH) or southern (SH) hemisphere in DJF and JJA during 2008, 2010, 2012, and 2013. Also shown are median Ni profiles for all cirrus (blue), for het cirrus (black), and for hom cirrus (orange). The 25th to 75th percentile range is indicated by darker gray shading for het cirrus and darker orange shading for hom cirrus, while the 10th to 90th percentile range is indicated by lighter gray shading for het cirrus and lighter orange shading for hom cirrus.
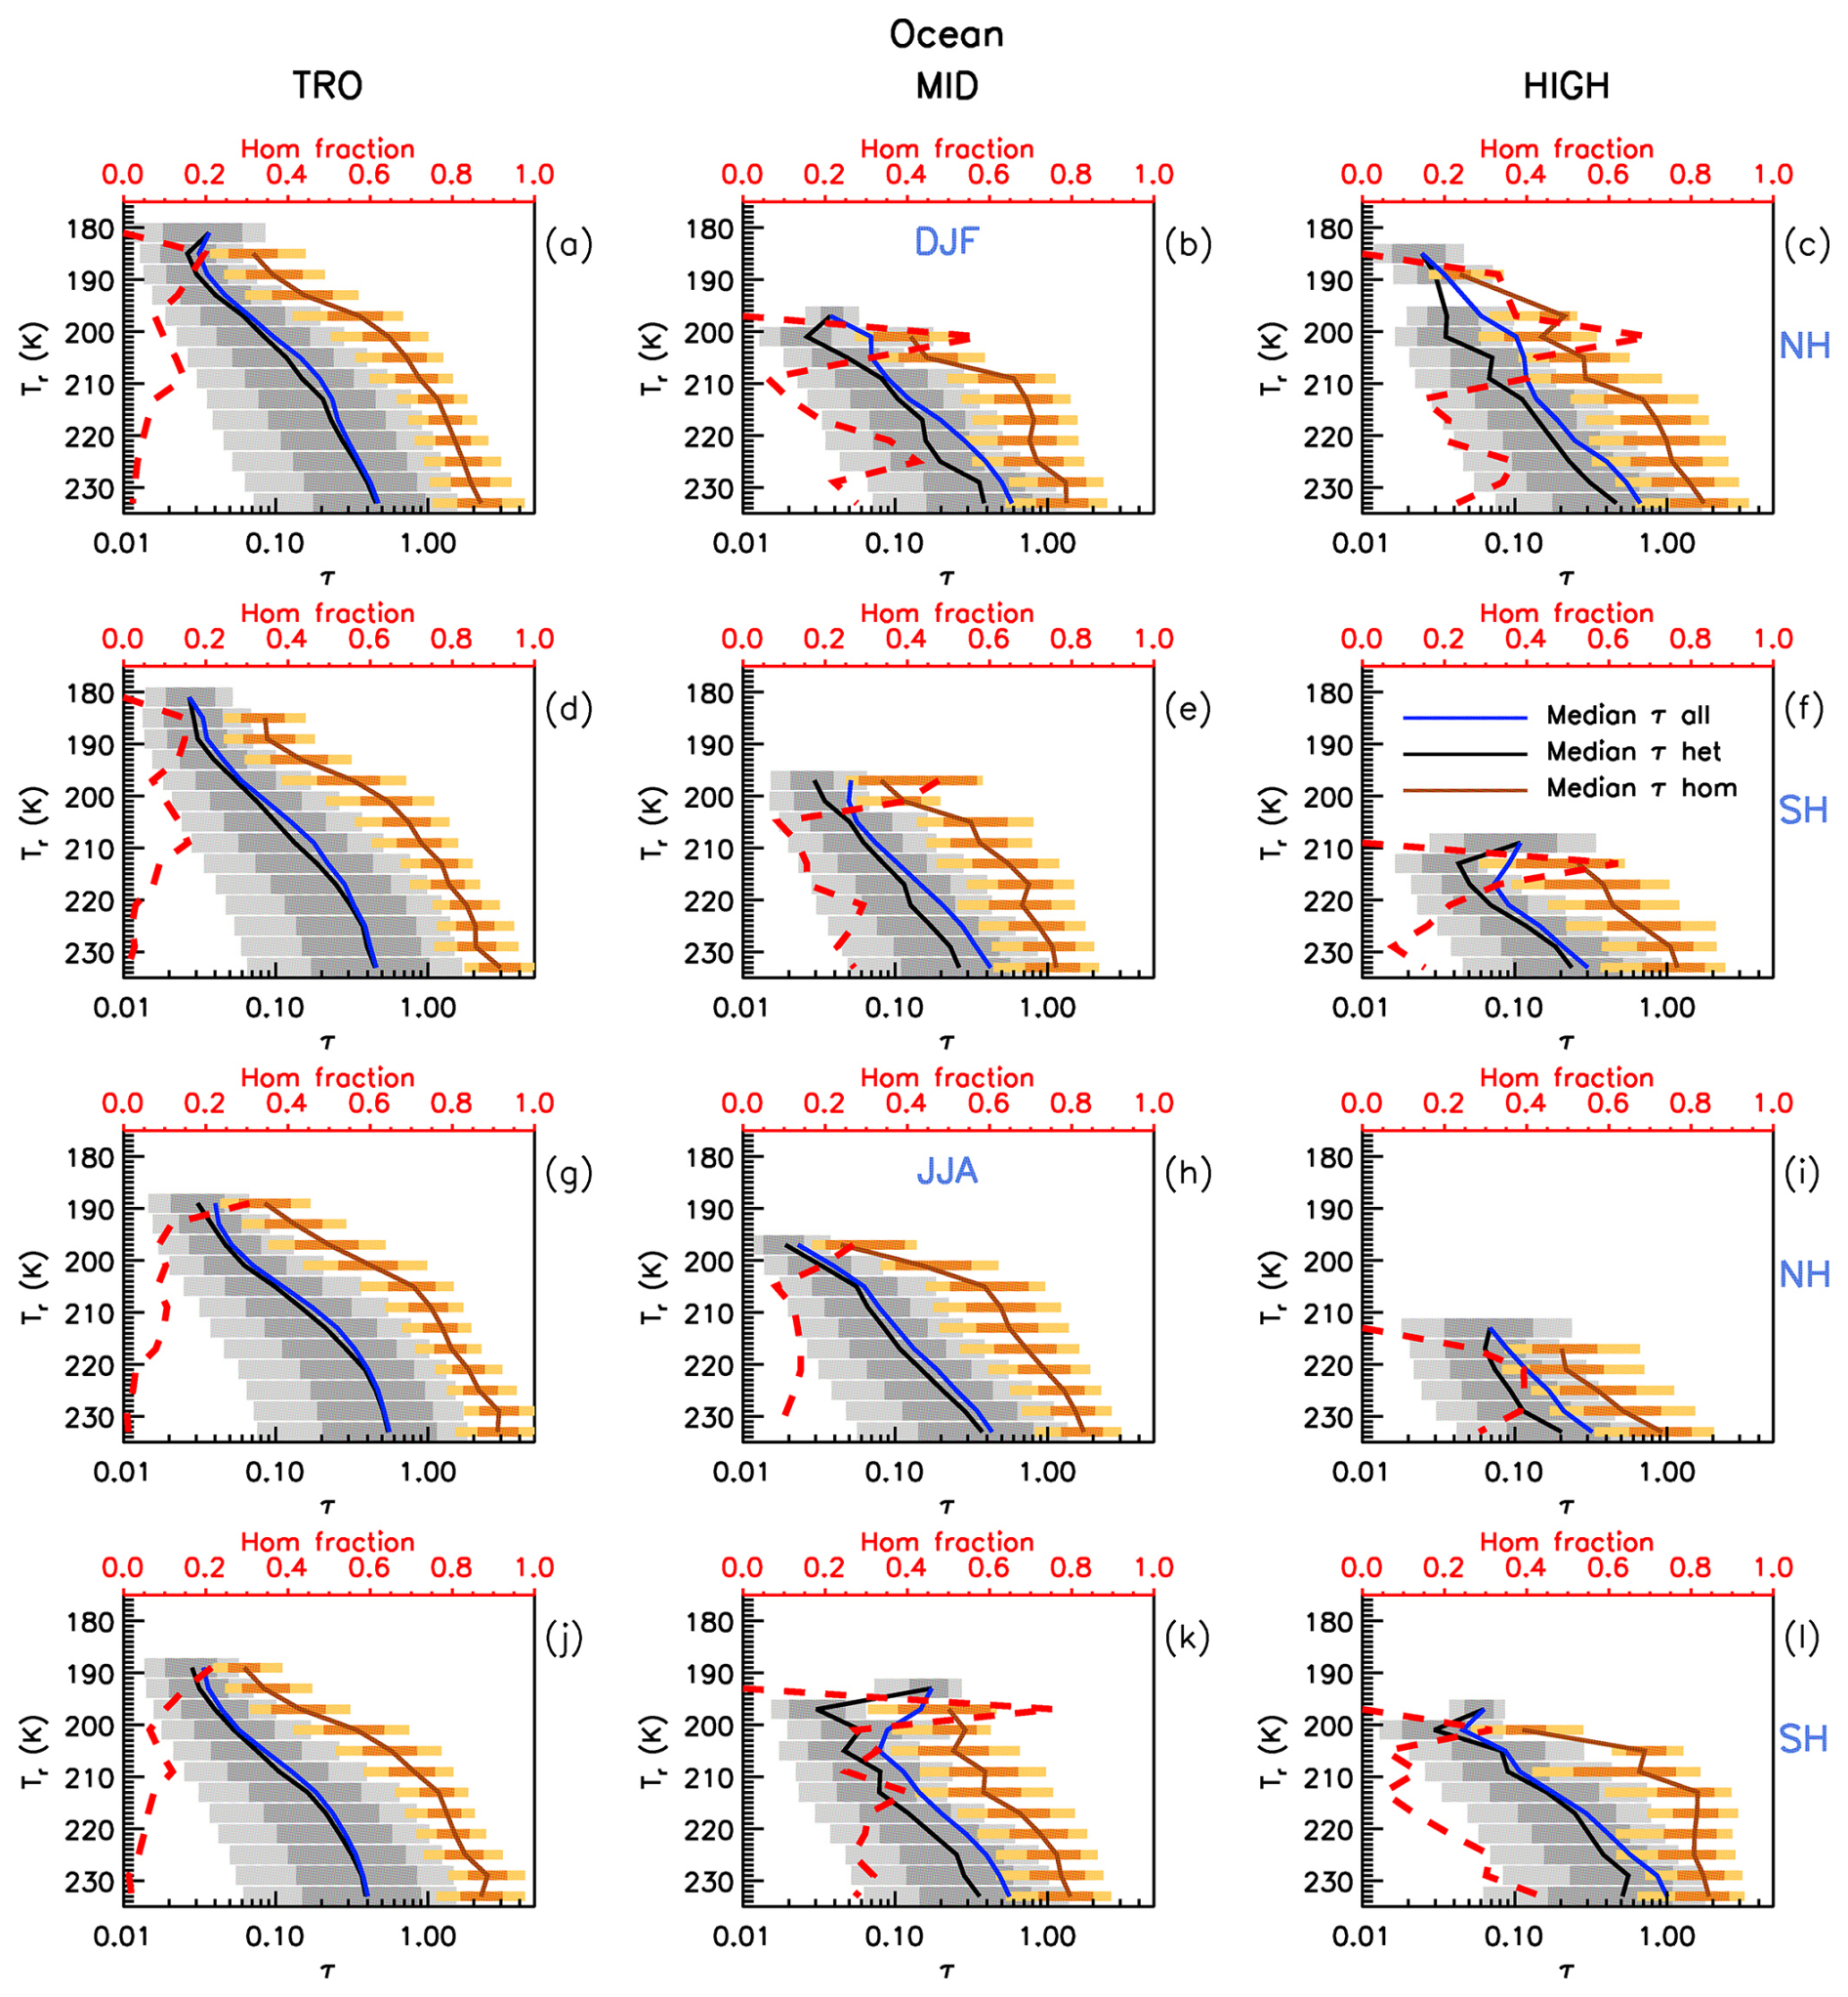
Figure 13As in Fig. 12, but instead of showing median Ni profiles, median τ profiles are shown for all cirrus (blue), for het cirrus (black), and for hom cirrus (orange).
Hom may occur through (1) the freezing of haze solution droplets (Koop et al., 2000) and (2) the freezing of supercooled cloud droplets advected across the isotherm ∼ 235 K (e.g., Rosenfeld and Woodley, 2000). If (1) and (2) are comparable in their frequency of occurrence, an abrupt increase in median all cirrus Ni should be evident in Fig. 12 in the 231–235 K range (given typical non-convective cirrus updrafts of 10 to 30 cm s−1). Since such an abrupt increase is not evident in Fig. 12, it appears that (2) does not contribute significantly to Ni, even in the tropics. This is consistent with Avery et al. (2020), Costa et al. (2017), and Mitchell and d'Entremont (2012) where it was shown that liquid water is rare in clouds over the range 239–235 K. This applies to both in situ cirrus and WBC clouds and is consistent with the definition of LOC in Luebke et al. (2016) where it is stated that LOC are restricted to pure ice clouds having T < 250 K (−23 °C). When considering only hom cirrus Ni, an increase in hom Ni with Tr is seen in the tropics for Tr > 215 K, which might be attributed to (2), but it applies to only 2 % of the sampled cirrus at 231–235 K, as shown by the hom fraction curve.
Figure 13 is similar to Fig. 12 except cloud optical depth τ is evaluated instead of Ni. Noting the log scaling of τ, it is clear that hom has a non-trivial impact on median τ. That is, aerosol-cloud-radiation interactions for cirrus clouds are probably greatest for optically thick cirrus where hom is active. The maximum CRE change is expected when INP concentrations are just enough to completely prevent hom but do not exceed this concentration by more than a factor of ∼ 3 (Storelvmo et al., 2013). Under this condition, the blue median τ profile for all cirrus and the black het cirrus τ profile should be the same. Thus, the difference between the blue and black τ profiles reveals the potential relative CRE impact of INPs (e.g., Mitchell and Finnegan, 2009; Storelvmo et al., 2013; Gruber et al., 2019). Finally, it should be noted that the relatively low hom fractions in the tropics are believed to partly result from sampling restrictions, where only cirrus having τ < ∼ 3 are sampled. That is, hom is probably very active where deep convection occurs, but these clouds are characterized by τ ≫ 3.
Global geographical distributions of hom fractions in the atmospheric column are shown for DJF and JJA in Fig. 14. Because hom clouds tend to have an overall larger optical depth than het clouds, the hom fraction over land which is based on optically thick cirrus clouds is expected to be overestimated. Therefore, we applied a zonal correction factor at 2° resolution which was estimated from samples over oceans as
where fractionAll is the hom fraction using all samples and fractionthick is the hom fraction using samples of optically thick cirrus clouds. This correction factor was multiplied by the hom fraction based on optically thick cirrus to produce the hom fractions shown in Fig. 14. For a given grid cell (i.e., column of atmosphere), the Tr-dependent hom fractions were weighted by the normalized fraction of samples at each level and vertically integrated to yield the mapped hom fraction. The hom fraction ranges between 0.02 in the tropics and 0.6 at high latitudes in the SH. Relatively few grid cells are light gray to indicate that fewer than 10 samples constitute that grid cell (see also Fig. A1a and b for cloud sampling). Since this methodology is based on Tr-dependent hom thresholds determined for 30° latitude bands, discontinuities in the hom fraction are common between latitude bands. Thus, the hom fractions in Fig. 14 are qualitative, and there should actually be a more gradual transition between latitude bands where discontinuities occur.
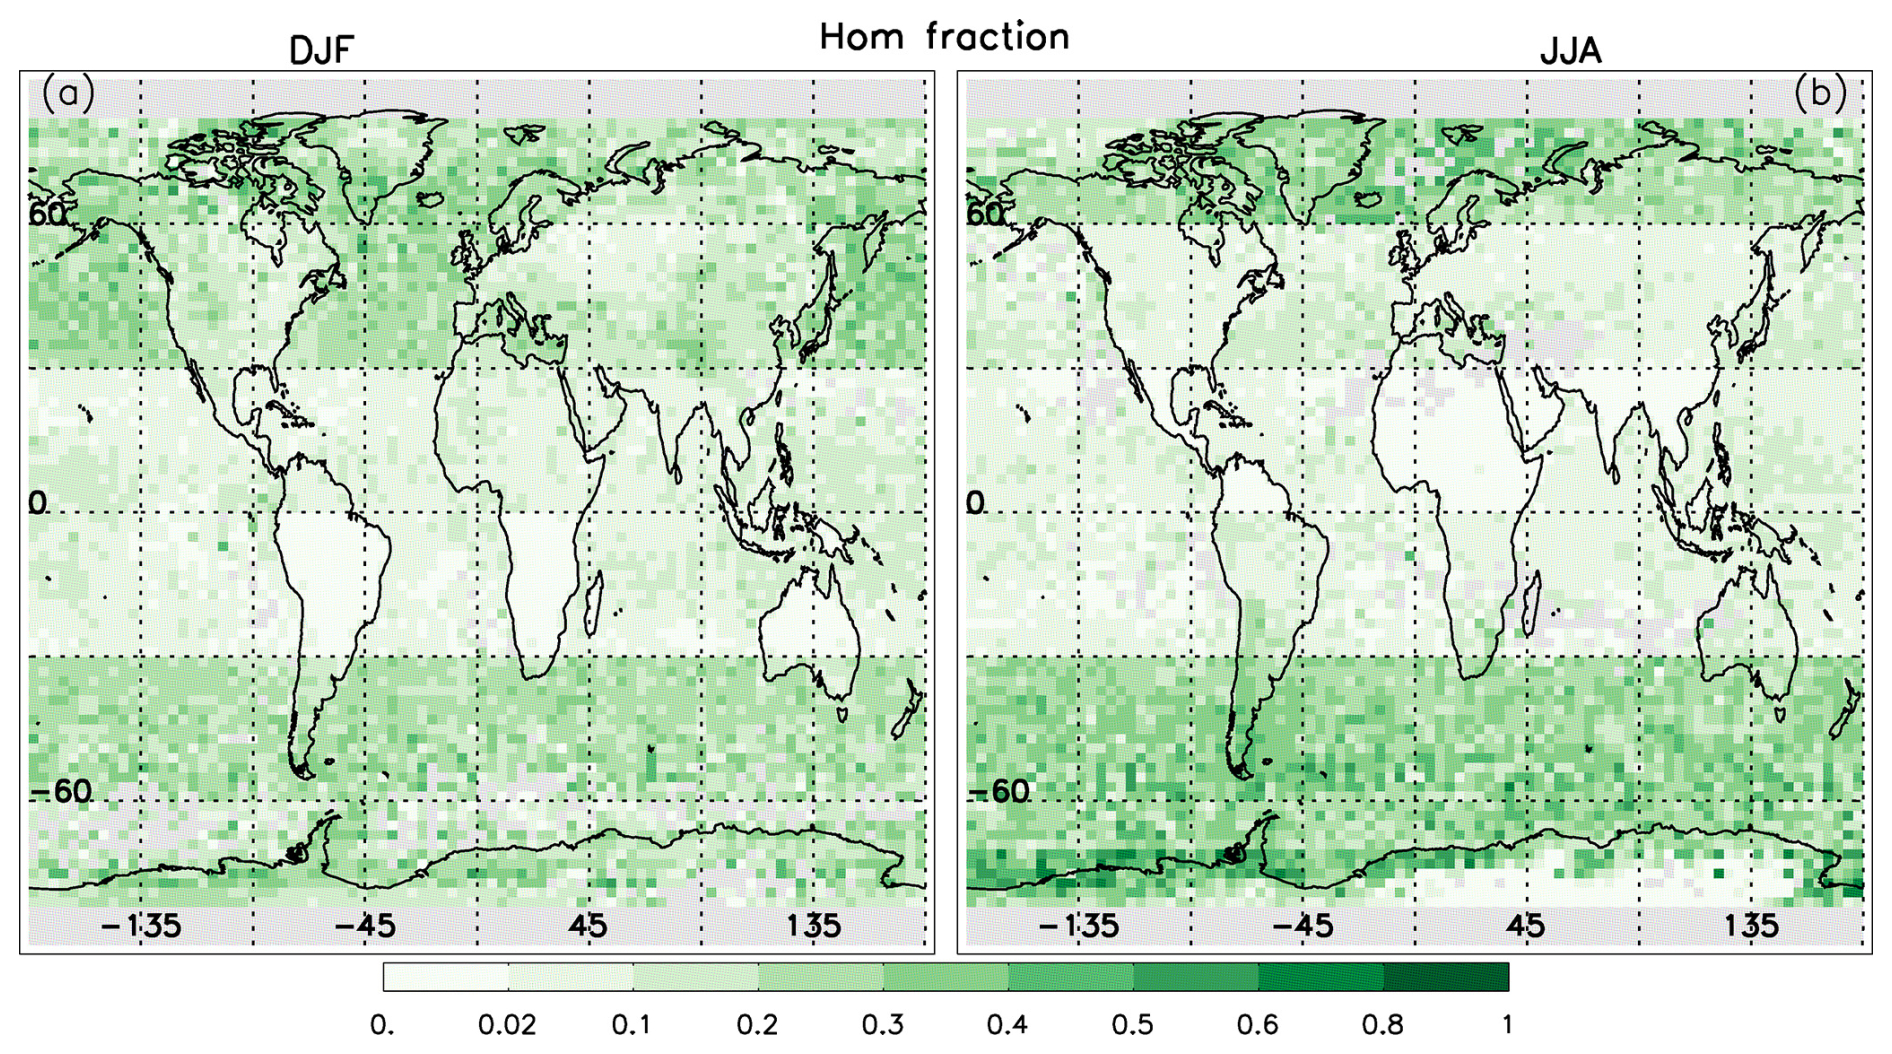
Figure 14Geographical distribution of the fraction of cirrus clouds affected by hom during (a) DJF and (b) JJA where the color bar indicates the hom fraction. See text for details.
A case in point is the discontinuity at 60° N in Fig. 14 for JJA, with relatively high hom fractions north of 60° N. As seen in Fig. 11i, the maximum De values at the four warmest temperature levels between 221 and 233 K occur at low αext relative to the other panels, corresponding Ni values are relatively small, and hom fractions in Figs. 12i and 13i range between 0.3 and 0.4. Because this was unexpected, we examine in Fig. 15 the dependence of Ni, De and IWC on extinction for the four seasons for the temperature bin at 229 K. Other temperature intervals (having a mid-temperature of 233, 225 and 221 K) exhibited the same behavior. Regardless of temperature, the maximum De value at low αext occurs only in JJA, and no marked difference between the three other seasons is observed. In addition, Ni is lowest in JJA (consistent with largest De in JJA), with a change in slope consistent with the De maximum, and IWC is consistent with the Ni–De behavior. A possible reason for this low het–hom αext threshold and resulting high hom αext threshold and resulting high hom fraction during JJA is relatively low INP concentrations which would allow the RHi in an ascending air parcel to reach the hom threshold more frequently due to lower water vapor removal rates by ice (Krämer et al., 2016). Evidence for lower INP concentrations can be found in the CALIOP dust aerosol optical depth (DAOD) climatology of Song et al. (2021, Fig. 6) where JJA has the lowest DAOD north of 60° N, but dust concentrations were not vertically resolved in this figure. Froyd et al. (2022) reported aircraft measured dust concentrations at cirrus levels using the Particle Analysis by Laser Mass Spectrometry (PALMS) instrument which discriminated between mineral dust and other aerosol types. Dust mass and number concentration were determined from simultaneous measurements by PALMS and of size-resolved aerosol number concentration. Such measurements were made during four global flights mostly over the Pacific and Atlantic Ocean, from the Arctic to Antarctica and back. Dust concentrations were lowest during August and October north of 60° N regarding the 4 months (also including February and May) of the ATOM field campaign. However, estimated dust mixing ratios in Kok et al. (2021) poleward of 60° N from 200–400 hPa show slightly higher values for JJA relative to DJF. Overall, if this interpretation is correct, it suggests that changes in relatively low levels of dust concentration can significantly affect the De of cirrus clouds and hence their optical properties.
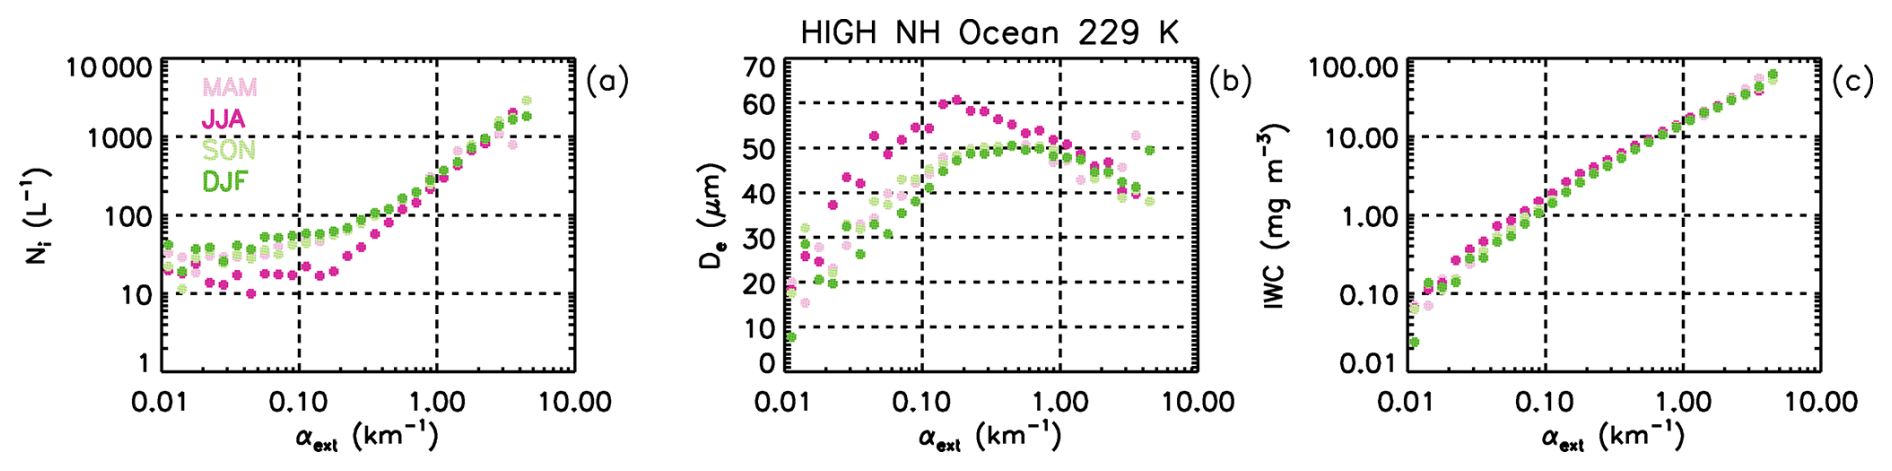
Figure 15Seasonal analysis of the region 60–90° N over oceans for the 229 K temperature level in terms of the extinction dependence of (a) Ni, (b) De, and (c) IWC. Extinction at maximum De, indicative of het–hom transition, is the smallest in JJA (dark pink) compared to MAM (light pink), SON (light green) and DJF (dark green), yielding the greatest hom fraction during JJA.
Also of interest are the seasonal changes in hom fraction between 30 and 60° N in Fig. 14. Relative dust contributions of the world's main dust source regions are estimated in Kok et al. (2021) and Froyd et al. (2022), with dust from Asian deserts (e.g., Taklimakan and Gobi) more likely to reach cirrus cloud levels in the UT due to ascent within frontal systems, orographic uplift, and dry convection. Asian dust emissions to the UT were maximum in summer (JJA), contributing 59 %–73 % of dust to the NH UT, but with minimal contributions during winter (also see the Supplement of Kok et al., 2021). Regions downwind of these Asian dust sources in Fig. 14 (into North America) undergo a strong seasonal change regarding their hom fraction, being relatively high in winter and relatively low in summer. This may be due to the above noted changes in mineral dust, with higher UT dust concentrations promoting het cirrus clouds. This phenomenon is discussed in greater detail in Mitchell and Finnegan (2009), where a climate intervention method known as cirrus cloud thinning (CCT) was proposed. A similar phenomenon may be occurring in the SH over the Southern Ocean (30–60° S), where the main UT dust source is South America. Estimated dust concentrations between 200 and 400 hPa are highest during summer (DJF) and lowest during winter (Kok et al., 2021, the Supplement). In Fig. 14, hom fractions over the Southern Ocean tend to be lower in summer and higher in winter, consistent with these estimated seasonal changes in dust concentration. To summarize, it appears that an increase in INP concentration pre-empts the formation of hom cirrus by preventing the RHi from reaching the threshold for hom,
It can also be argued that the above seasonal differences in the hom fraction can be attributed to seasonal differences in vertical velocities at cirrus cloud levels. This appears likely over the Southern Ocean when one considers the stronger OGWs occurring there during the winter season (Jiang et al., 2002; Hoffmann et al., 2016). Moreover, Gryspeerdt et al. (2018) notes that Ni is higher during winter in the midlatitude storm tracks, consistent with stronger jets. Nonetheless, two studies (Sporre et al., 2022; Lin et al., 2025) have documented large microphysical changes in cirrus clouds that were affected by volcanic aerosol, which suggests that the observed seasonal differences can be attributed in part to seasonal differences in INP concentrations.
The thick black histograms in the upper panels of Fig. 16 show the zonal mean hom fractions over oceans for DJF (a) and JJA (b). Outside the tropics (±30°), the hom fraction is generally between 10 % and 35 %, although over Antarctica during winter it can be much higher. For comparison, Froyd et al. (2022) estimated the contribution of het and hom to cirrus formation using the dust measurements described above to initialize a detailed cirrus-formation model. They found that het on mineral dust was responsible for 71 % of the cirrus clouds modeled, which is consistent with our findings based exclusively on retrieved cirrus cloud properties. However, comparing Fig. 16 with Fig. 5 and S12 in Froyd et al. (2022) shows that regional differences are larger, where the fraction of hom cirrus in the NH for this study is greater than in Froyd et al. (2022).
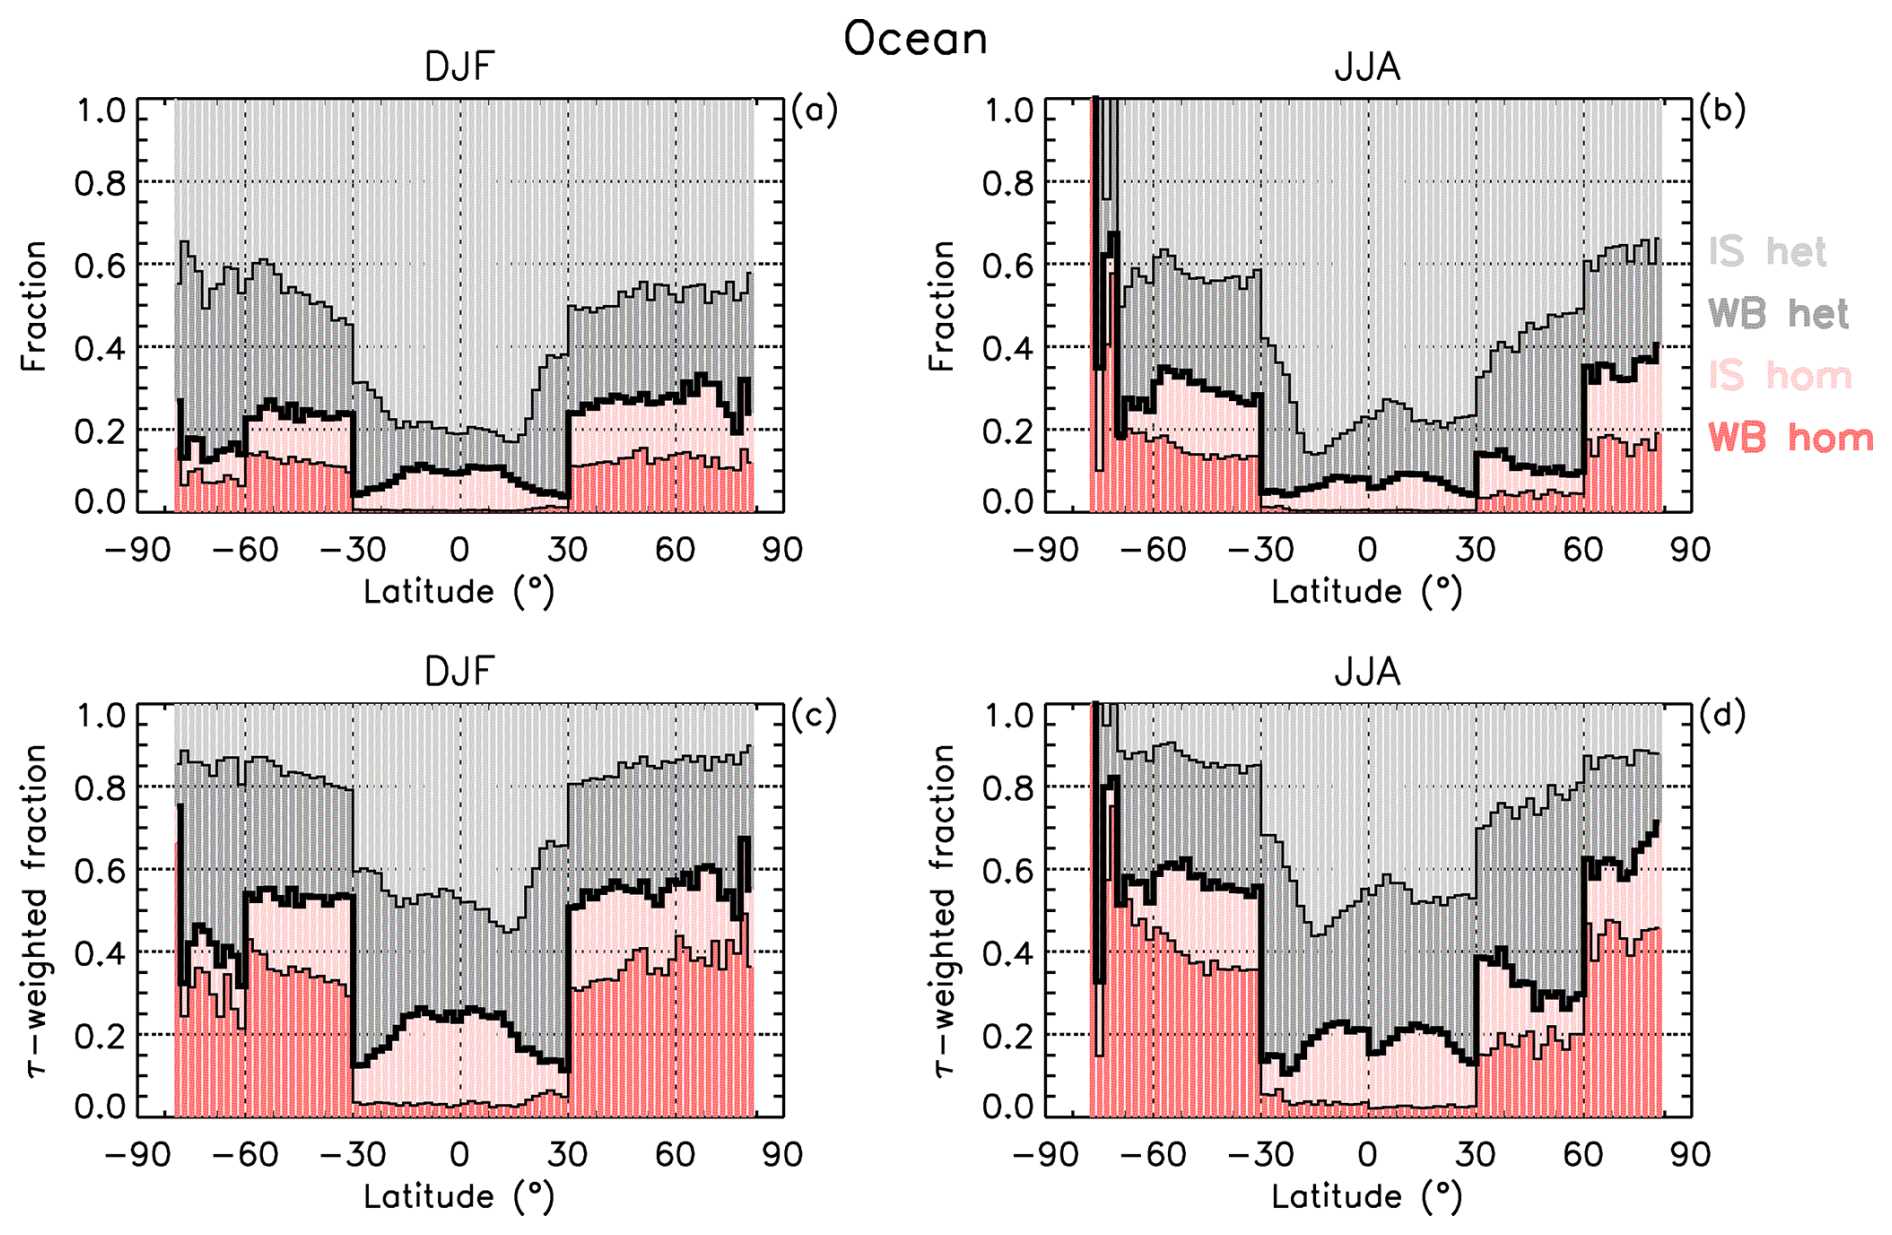
Figure 16(a, b) The fraction of warm base (WB) (red) and in situ (pink) hom-affected cirrus and of WB (dark gray) and in situ (light gray) het cirrus vs. latitude (negative in SH) in (a) DJF and (b) JJA based on all samples over oceans. The thick black histogram gives the total fraction of hom-affected cirrus. (c, d) Same as upper panels except that the fractions are weighted by cloud optical depth (τ).
3.4.2 Estimating the fraction of het and hom cirrus comprising in situ and warm base cirrus clouds and their estimated radiative impacts
The remote sensing study by Dekoutsidis et al. (2023) found that RHi values in both in situ and LOC clouds exceed 140 % near cloud top, which is high enough to activate hom. The case studies they examined further underscored the importance of hom in LOC clouds, regardless of whether they were convectively generated or produced through frontal systems (as part of a moisture conveyor belt). The methodology described above for identifying het and hom cirrus clouds was applied to in situ cirrus and WBC clouds. Zonal means of the cloud fractions over oceans are shown in the upper panels of Fig. 16 for DJF (a) and JJA (b), where the thick black histogram separates the het (gray colors) and hom (reddish colors) cirrus cloud regimes. The het fraction is 1 minus the hom fraction. Within these two regimes, the fraction of in situ (IS in the figure) and warm base (WB in the figure) cirrus are indicated. In situ het cirrus are most common, followed by WB het cirrus, although these two cloud types are comparable over the Southern Ocean and Antarctica during summer (DJF). For the hom fraction outside the tropics, the fractions of in situ cirrus and WBC origin clouds are often comparable, although WBC dominates south of 60° S latitude during winter. Although hom in WBC (and thus LOC) has been predicted to occur mostly through the freezing of cloud droplets (Gasparini et al., 2018), evidence for this was not found in Fig. 12 (as discussed in Sect. 3.4.1). Thus, it appears that hom proceeds through the freezing of solution haze droplets for both hom cirrus categories in Fig. 16, making both in situ hom cirrus and hom WBC clouds susceptible to modification by increasing the concentration of INPs, which is the physical basis of CCT (discussed in Sect. 5).
Panels (c) (DJF) and (d) (JJA) of Fig. 16 show for each type of cirrus cloud (i.e., WB hom, IS hom, WB het, IS het) the zonal fraction weighted by optical depth. As in Fig. 1, τ distributions are computed for log (τ) between −3 and 1 using bins equal to 0.1 in log space. The τ-weighted fraction of a cirrus type is defined as
where pi is the number of pixels in bin τi. The τ-weighted fraction of a cirrus type is a proxy for its relative CRE contribution, following the same reasoning given for the CRE proxy in Fig. 1. The thick black histograms in panels (c) and (d) give the relative CRE proxy associated with hom cirrus clouds while the relative contributions from in situ cirrus and WBC clouds to hom cirrus are indicated by the pink and red colors, respectively. Similarly, the relative CRE proxy associated with het cirrus clouds is indicated by the gray colors, with relative contributions from WBC and in situ cirrus indicated by the darker and lighter shades, respectively. The main finding here is that, outside the tropics, the radiative impact of hom cirrus clouds appears comparable to het cirrus clouds. During winter in both hemispheres and over the Southern Ocean in summer, the radiative impact of hom cirrus can even be greater than het cirrus clouds.
3.5 Relating IWC to het and hom cirrus clouds
The results in this study appear generally consistent with those reported in Krämer et al. (2016), titled “A microphysics guide to cirrus clouds – Part 1: Cirrus types” as shown in their Fig. 5 and summarized in their Fig. 9. That study combined measurements of cirrus cloud IWC from 17 aircraft campaigns (94 sampling hours) with predictions of cirrus cloud properties from a detailed microphysical box model. The modeling revealed that the measured median IWC effectively divided cirrus clouds into two updraft (w) regimes; slow (0.01 to 0.1 m s−1) and fast (0.5 to 3.0 m s−1). The slow w regime where het dominates was characterized by IWC < median IWC, relatively low Ni and relatively large mean mass volume radius Rv. Conversely, the fast w regime where hom dominates was characterized by IWC > median IWC, relatively high Ni and relatively small Rv. Interpreting these w regimes as het and hom regimes, respectively, this study reports similar findings in Figs. 9 and 10 (where αext correlates strongly with IWC). Figure 17 compares the temperature dependence of the retrieved median IWC (and variance as percentiles) where the median IWC usually lies near the temperature-dependent het–hom transition (shown by the black triangles) as described in Sect. 3.4.1 for cirrus over oceans (∼ 0.01 < τ < ∼ 3). In most cases there is a close correspondence between the median IWC and the het–hom transition IWC. The tropics and JJA MID NH are exceptions where the De maximum was ambiguous (suggesting hom is less active) and the hom threshold was determined by Nthres. Excluding these exceptions, the median IWC tends to partition the het and hom cirrus cloud regimes. This description is different from the explanations given in Krämer et al. (2016), where the median IWC roughly separates in situ cirrus from LOC (their Fig. 13).
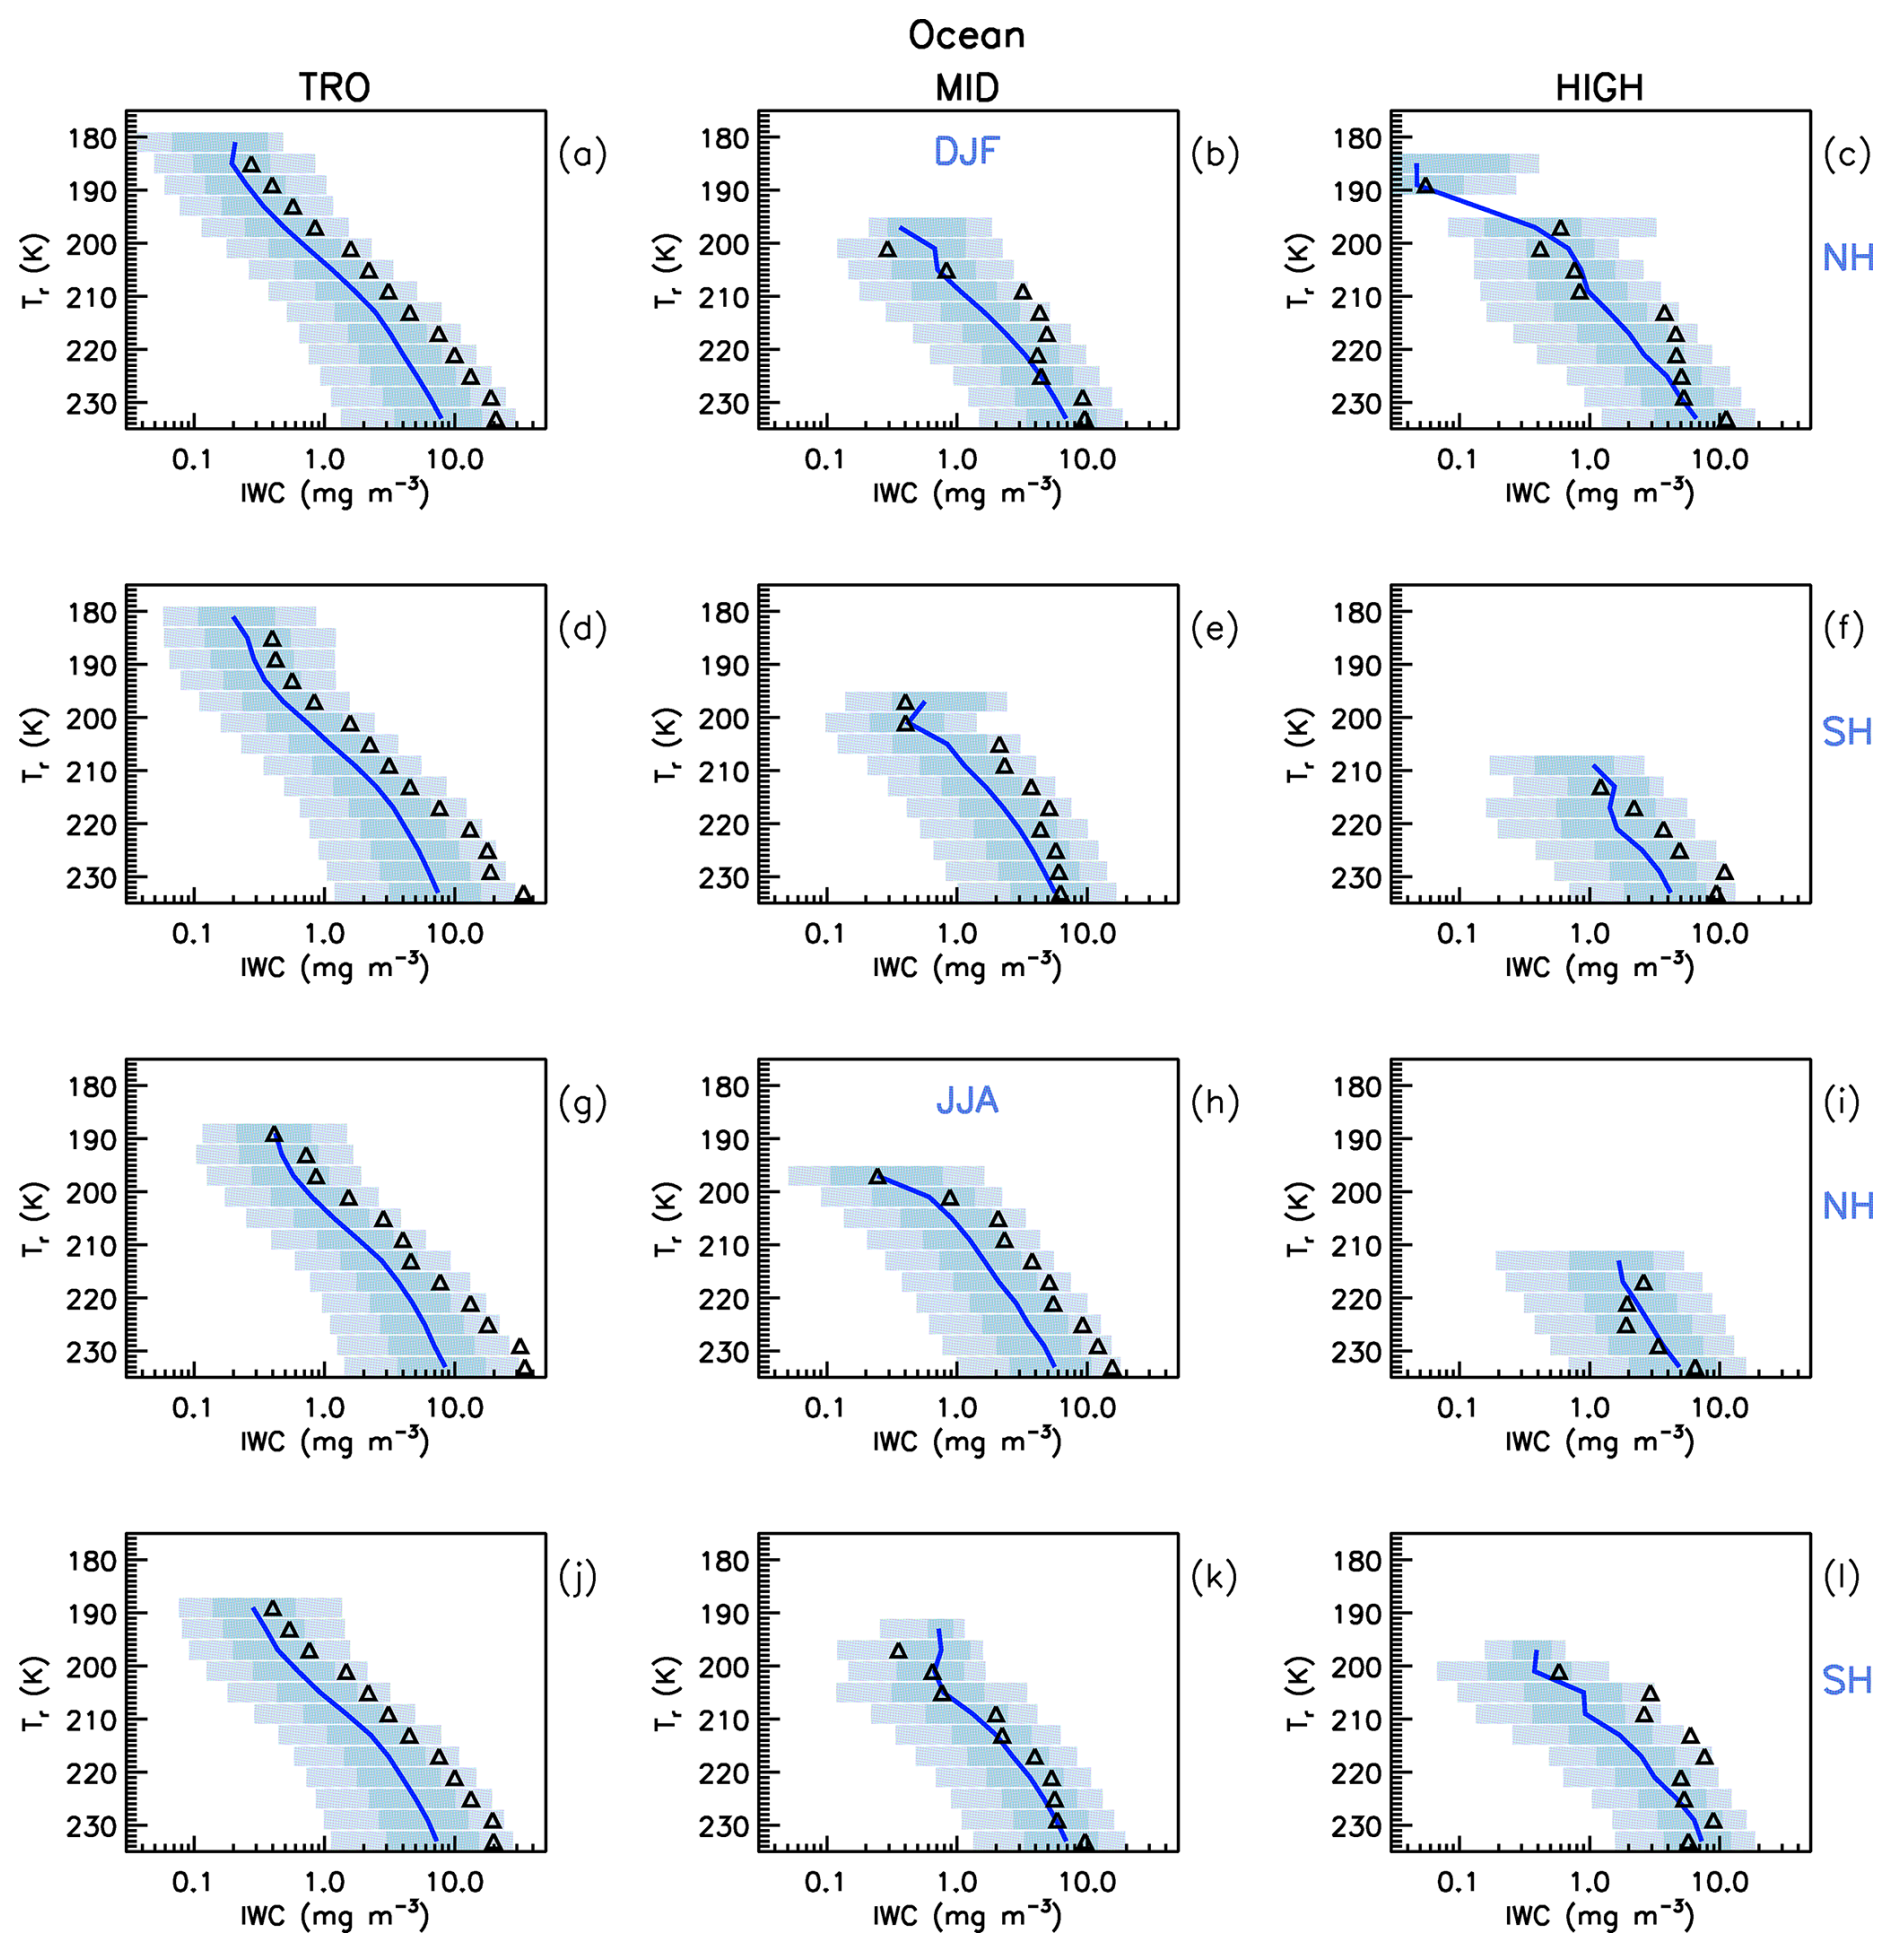
Figure 17Comparing the median IWC (navy blue curves) over oceans (using all samples) with the temperature-dependent het–hom transition point (black triangles) based on the De maximum and the corresponding extinction coefficient αext for a given 4 K temperature interval. Latitude zones and seasons (DJF and JJA) are denoted as in Figs. 12 and 13. The light-blue shade lies between the 10th and the 90th percentiles and the overplotted medium-blue shade lies between the 25th and 75th percentiles.
Figure 18 relates median Tr–Ttop to αext for various 4 K Tr bins (indicated by the color legend), with the vertical dashed lines giving the αext at which the corresponding median De maximum occurs for the three “warmest” Tr bins. This is done separately for in situ cirrus and WBC clouds. This is based on all IIR samples over the midlatitude oceans, where Tr–Ttop is related to cloud geometric thickness as discussed earlier. Immediately, it is evident that the in situ cirrus are generally much thinner (geometrically) than the WBC clouds. For the warmest WBC layers (223 K < T < 235 K), it is seen that the correspondence between the De maximum and the Tr–Ttop maximum for a given Tr curve is usually very close; so close that it is hard to dismiss it as a coincidence. For in situ cirrus, this relationship is less evident but begins to emerge in the 223–227 K T bin.
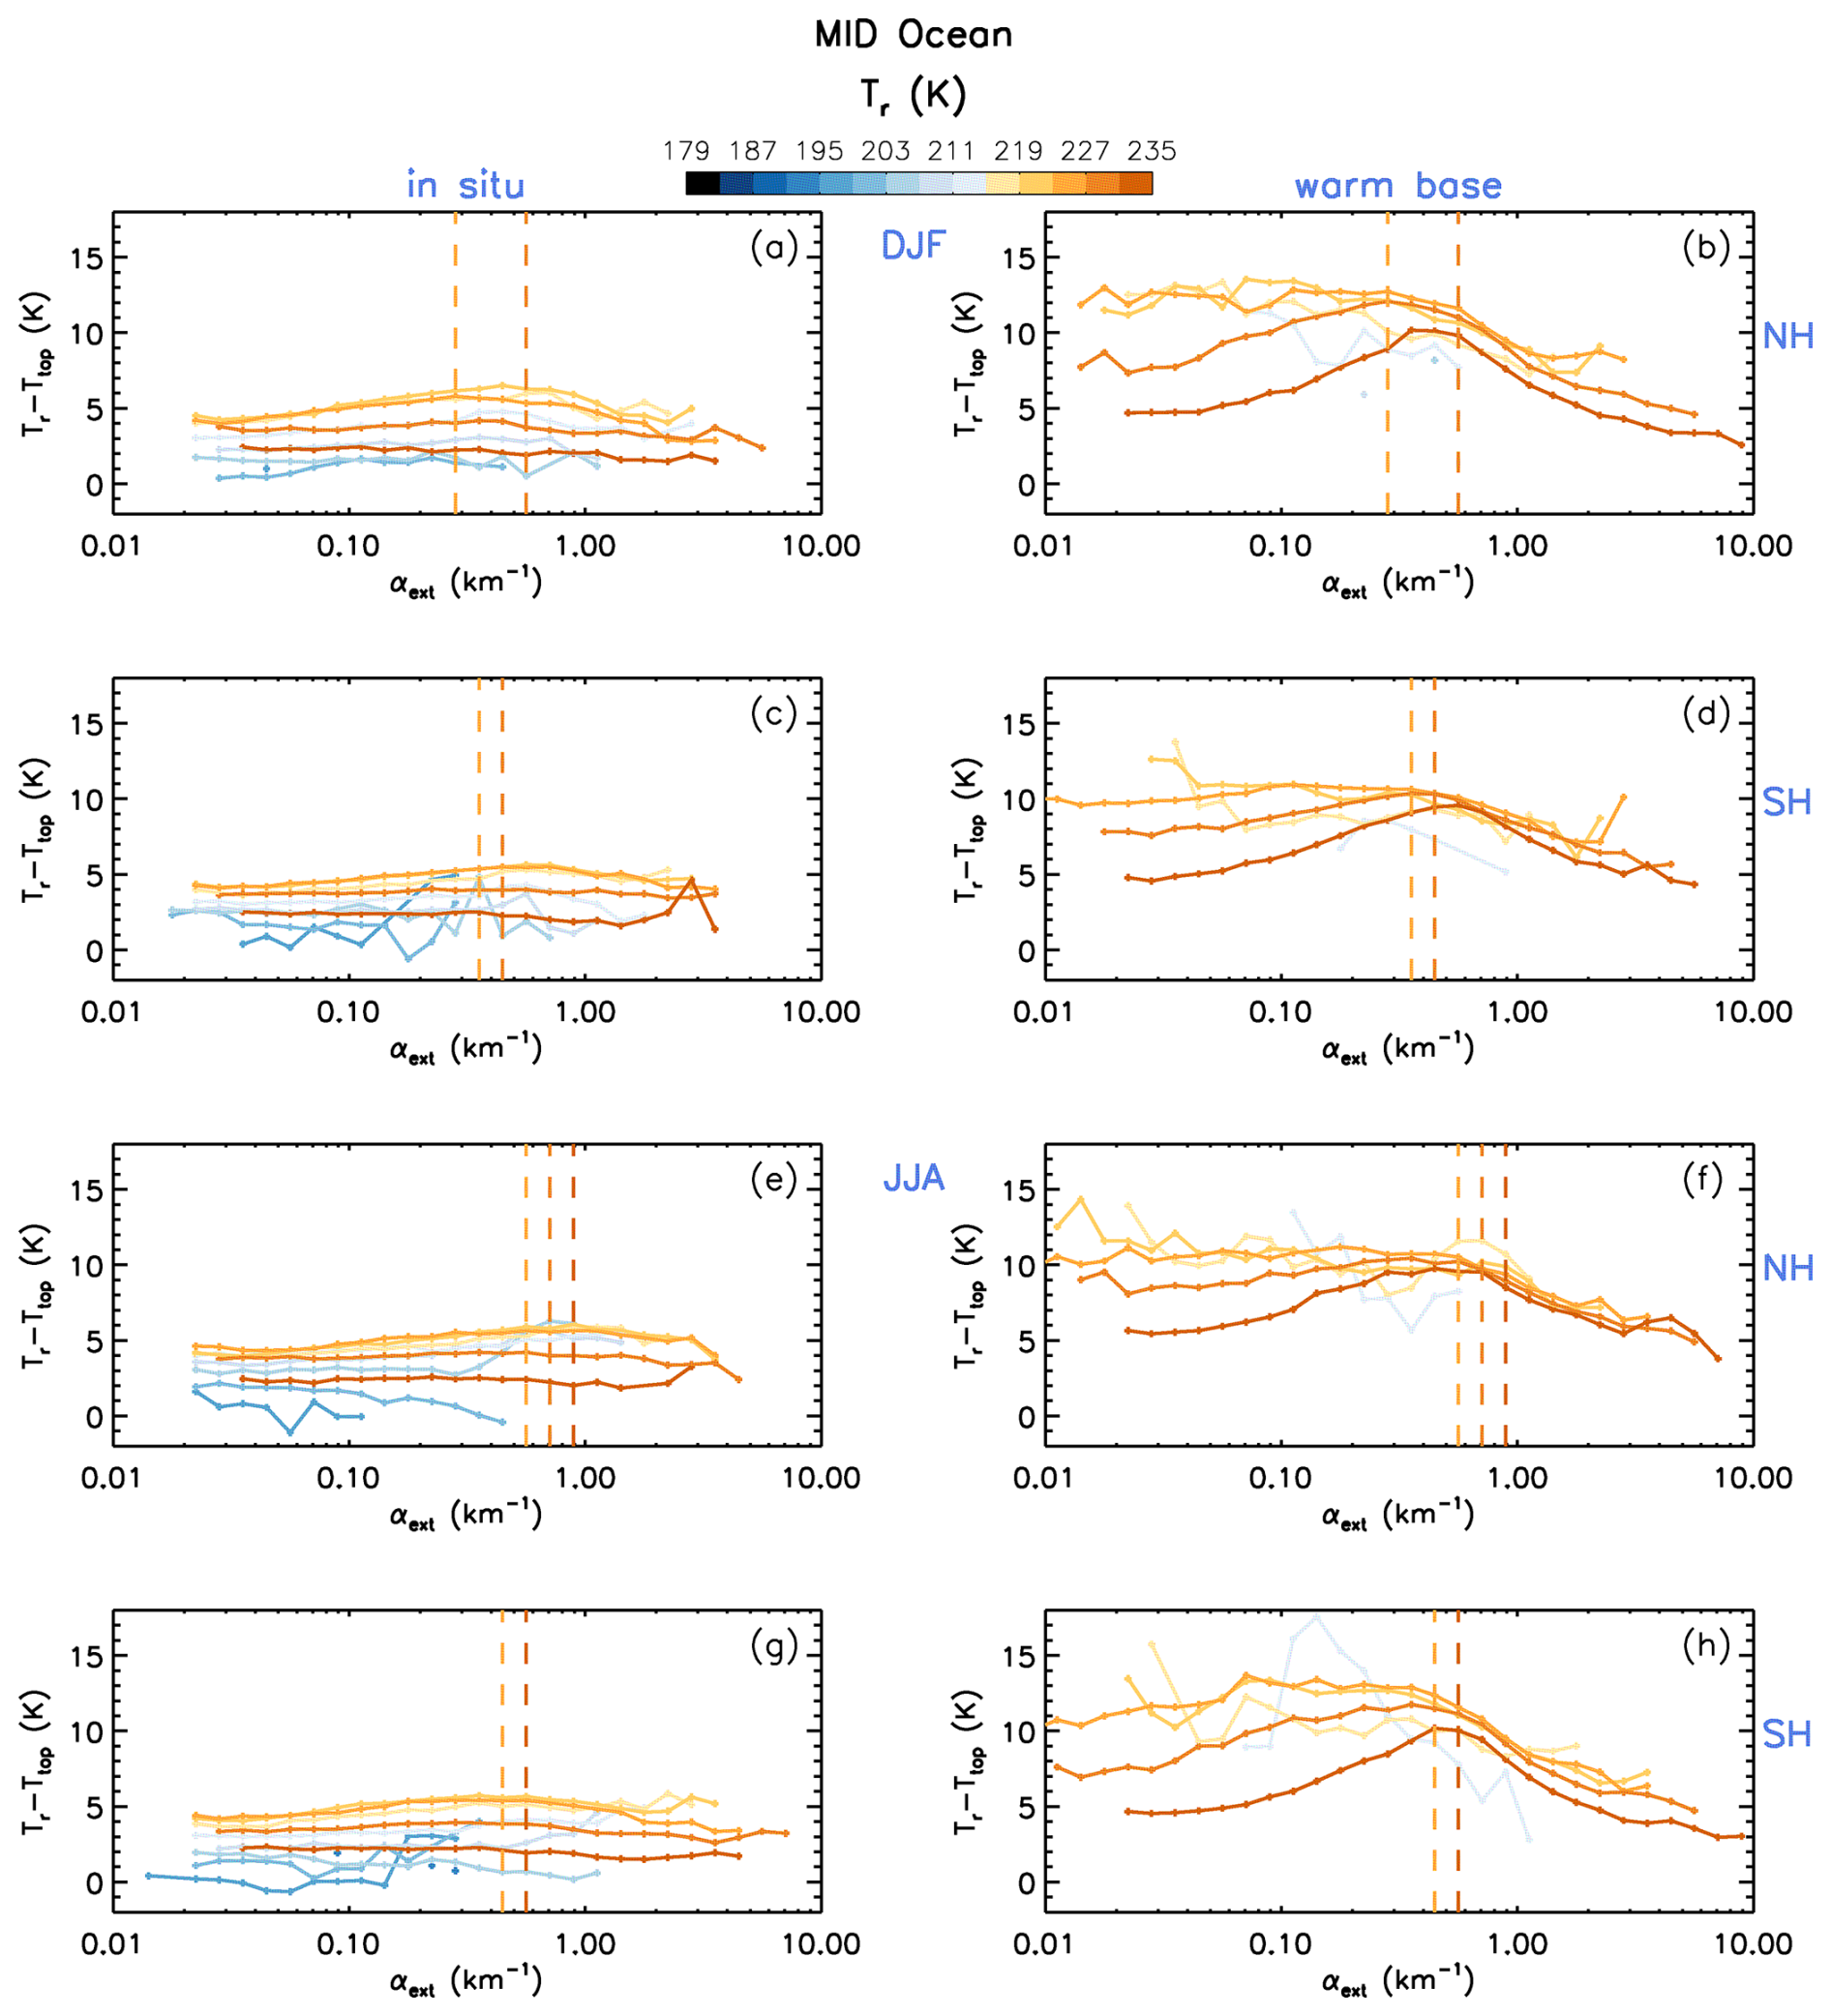
Figure 18Dependence of Tr–Ttop (which is related to cirrus cloud geometrical thickness) on the extinction coefficient αext for various 4 K temperature bins indicated by the color bar. Retrievals were over oceans (∼ 0.01 < τ < ∼ 3) for in situ cirrus (a, c, e, g) and WBC (b, d, f, h) clouds at midlatitude for two seasons (DJF and JJA) in both hemispheres (NH and SH) during 2008, 2010, 2012, and 2013. Vertical lines indicate De maxima for the three “warmest” temperature bins, revealing a correspondence between cloud thickness and De maxima. Panels having only two vertical lines result from two De maxima having the same αext.
As for the underlying reason accounting for the correspondence between the De and Tr–Ttop maxima in the warmest WBC cloud layers (orange curves), the following is proposed as a working hypothesis for WBC clouds. From Eqs. (24) and (26) in Mitchell (1988), it can be shown that for ice clouds at quasi-steady state conditions, the mean cloud updraft w is directly proportional to the downward ice mass flux χf, and since IWC ≈ where vm is the mass-weighted ice fall speed; IWC is also directly proportional to w when vm > w. As shown in Fig. 17, the het regime increases in IWC as it approaches the het–hom transition region, suggesting an increase in w as well. As w increases (for a given INP concentration), RHi increases within the cloud until the RHi reaches the hom threshold. Under quasi-steady state conditions where ice mass produced approximates ice mass removed (e.g., Mitchell, 1994; Field and Heymsfield, 2003), as IWC increases within the het regime, De and vm also increase, exporting ice at higher rates through cloud base. This ice then sublimates, humidifying the sub-cloud layer. Over time this increased sedimentation flux tends to lower cloud base, deepening the cloud. But this cloud deepening ends once hom becomes important, with vm decreasing due to smaller ice particle sizes. As w (and thus IWC) increase further beyond the het–hom transition, hom becomes more vigorous and De further decreases, decreasing vm and sedimentation rates, showing the evolution of cirrus cloud thickness with increasing cloud updraft and IWC raising cloud base, with geometric cloud thickness becoming minimal at the highest w, IWCs and Ni, and at the lowest De, in the hom regime. As cloud layer Tr decreases, ice particle growth rates and mass fluxes through cloud base decrease relative to warmer cloud layers having the same αext, allowing cloud base to rise, and the curves in Fig. 18 in the het regime become “flatter”. Because Tbase > 235 K, the WBC in the het regime become geometrically thicker as Tr decreases. When Tr < 215 K, these trends become less coherent presumably due to lower sedimentation rates. This conceptual model for WBC is expected to be most apparent over land where the hom-regime decrease in De (with increasing w and IWC) is more obvious. This simple explanation is consistent with the retrievals of these quantities and Tr–Ttop. This proposed explanation of Figs. 17 and 18 is summarized in the schematic in Fig. 19 for the warmest WBC layer, presenting a conceptual model of how cirrus cloud thickness might evolve with increasing cloud updraft and IWC for a fixed INP number concentration. Since upward air movements are balanced by downward movements, w in Fig. 19 can be better viewed as the standard deviation of w, σw.
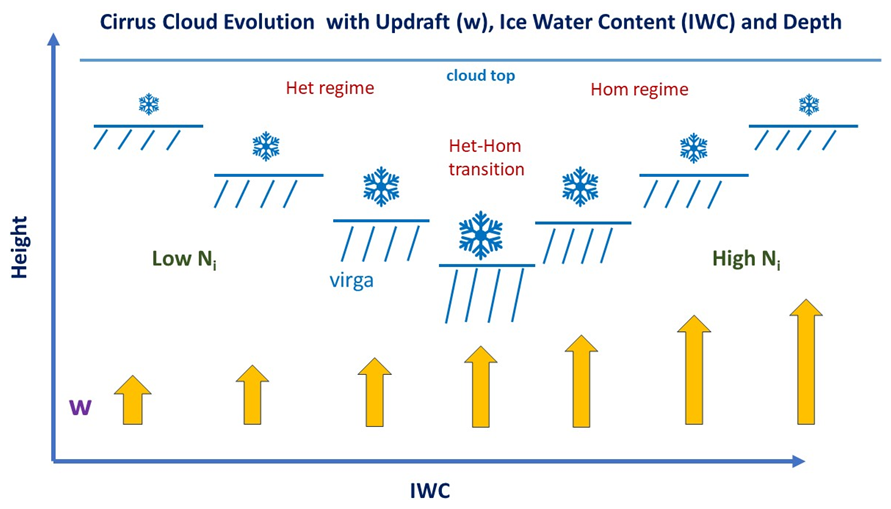
Figure 19Proposed evolution of cirrus cloud thickness or depth with increasing cloud updraft (arrows) and IWC, based on results in Figs. 17 and 18 for the warmest WBC cloud layers. The relative cloud depth is the height difference between the cloud top line and the line segments below (with virga shown below these line segments). The size of the ice crystal symbol represents the relative size of De. As De increases, sedimentation or virga increases, lowering cloud base. Hom acts to decrease De, decreasing sedimentation and thus raising cloud base.
For in situ cirrus clouds, Tbase ≥ 235 K and when Tr ≈ 233 K, the clouds are very thin, making it difficult to discern impacts from ice mass sedimentation rates on cloud geometrical depth. This may explain the “flat” nature of these highest temperature curves in Fig. 18. As Tr decreases, cloud depth increases, and for 219 < Tr < 227 K, the trend observed for warmer WBC clouds is evident, sometimes becoming less coherent for Tr < 219 K for reasons similar to WBC clouds.
An Arctic cirrostratus modeling study by Spichtinger and Gierens (2009a, b) simulated hom cirrus where ice nucleation occurred at cloud top, with cirrus beginning as geometrically thin cirrus that rapidly deepen with time (i.e., over the course of an hour). As the cloud deepens, mean Ni (for the cloud layer) decreases since sedimenting and growing ice from cloud top reduces RHi in the mid- to lower cloud, preventing the RHi there from reaching the hom threshold. With only het capable of producing new ice crystals in the mid- to lower cloud, mean layer Ni decreases. This appears generally consistent with the above description of hom cirrus and with the upper panel results (a)–(c) in Fig. 6 (where Ni and IWC are lower in the geometrically thicker cirrus). This explanation is also consistent with Fig. A3e–f for τ > ∼ 0.3 (where hom cirrus are common), with lower Ni and IWC in the geometrically thicker WBC clouds relative to the thinner in situ cirrus. This “working hypothesis” is speculative and should be tested against other observational datasets and modeling studies.
Climate modeling investigations into the climate intervention method known as cirrus cloud thinning or CCT have exposed our lack of understanding about cirrus clouds. CCT is based on the principle that hom cirrus can be seeded with higher INP concentrations (relative to ambient) to convert them to het cirrus. This would allow more outgoing longwave radiation to escape to space since a conversion to het cirrus would (1) reduce the cirrus cloud τ and lifetime (due to larger ice crystals falling faster), (2) cause the cirrus to form at lower altitudes (since the augmented INP require lower RHi to nucleate) where their warming effect is weaker, and (3) the enhanced ice sedimentation rates would enhance the removal of water vapor (a powerful greenhouse gas) from the UT (Mitchell and Finnegan, 2009; Lohmann and Gasparini, 2017). Thus, the physical processes affecting CCT are complex and difficult to model, and numerous CCT modeling studies have produced mixed results, with some predicting a cooling effect (Storelvmo et al., 2013; Storelvmo and Herger, 2014; Storelvmo et al., 2014; Gruber et al., 2019; Gasparini et al., 2020; Liu and Shi, 2021; Muri et al., 2014; Crook et al., 2015; Kristjánsson et al., 2015; Jackson et al., 2016; Cao et al., 2017; Muri et al., 2018; Duan et al., 2018, 2020) and others predicting a negligible or warming effect regarding the CCT net CRE (Penner et al., 2015; Gasparini and Lohmann, 2016; Gasparini et al., 2017; Tully et al., 2022, 2023). But perhaps the greatest uncertainty in these studies is the role of hom in cirrus cloud formation, since if hom is not an important process, no significant cooling from CCT is possible. To quote Lohmann and Gasparini (2017), “For the time being, cirrus cloud thinning should be viewed as a thought experiment that is helping to understand cirrus cloud–formation mechanisms”. Similarly, the United Nations Environment Programme (2023) titled “One Atmosphere: An independent expert review on Solar Radiation Modification research and deployment” states, “The feasibility of CCT is uncertain, in part because of the larger uncertainties associated with the ice nucleation processes in high clouds”. Both reports are indicating that the relative role of het and hom is the key issue determining the viability of CCT. This CALIPSO study is relevant to CCT because it evaluates the relative role of het and hom as a function of temperature, latitude, season and topography in terms of cloud fraction and radiative impact. Since this study found that the radiative contribution of hom cirrus is substantial, an attempt to improve the treatment of cirrus cloud microphysics in CCT modeling experiments is given below.
The CCT simulations that use the treatment of pre-existing ice (Shi et al., 2015) tend to predict a relatively small or no CCT cooling effect while those CCT simulations that do not use this pre-existing ice treatment predict a substantial cooling (Gasparini et al., 2020; Tully et al., 2023). The pre-existing ice treatment described in Shi et al. (2015) is based on the supersaturation development equation that can be written as
where qi, nuc is the ice mass mixing ratio due to ice nucleation and qi, pre is the ice mass mixing ratio of pre-existing ice, parameters a1, a2 and a3 depend only on the ambient temperature and pressure, Si is the supersaturation with respect to ice, W is the updraft velocity and t is time. From this equation it is seen that the greater qi, pre is, the smaller the increase in Si. The study by Dekoutsidis et al. (2023) indicates that hom occurs in a relatively thin layer near cloud top, and the study by Diao et al. (2015) shows that ice nucleation in cirrus occurs near cloud top. This suggests that qi, pre may be overestimated in GCMs since qi, pre is based on layer mean IWC or qi values, whereas the actual qi, pre should correspond to a relatively thin layer near cloud top that the vertical resolution in a climate model cannot accommodate. When qi, pre is overestimated, it is much more difficult for Si to reach the threshold for hom. As stated in Shi et al. (2015), “The pre-existing ice crystals significantly reduce ice number concentrations in cirrus clouds, especially at mid- to high latitudes in the UT (by a factor of ∼ 10). Furthermore, the contribution of heterogeneous ice nucleation to cirrus ice crystal number increases considerably.” That is, CCT modeling experiments that predict a relatively small hom fraction and thus negligible cooling have used a pre-existing ice treatment (e.g., Gasparini and Lohmann, 2016). To address this issue, the model's vertical resolution could be increased, or qi, pre could be attenuated by a factor that best represents qi near cloud top in the “nucleation zone”. The global/seasonal distribution of the predicted hom fraction could be compared against results from this CALIPSO study.
The Community Atmosphere Model Version 6 (i.e., CAM6) uses the standard treatment of pre-existing ice, and also considers turbulence kinetic energy as the only dynamic source for in situ ice formation (Lyu et al., 2023). That is, OGWs are not considered in ice nucleation. Lyu et al. (2023) demonstrated the importance of including OGWs in CAM6, which triggered more frequent hom in orographic cirrus, increasing Ni and IWC while decreasing De.
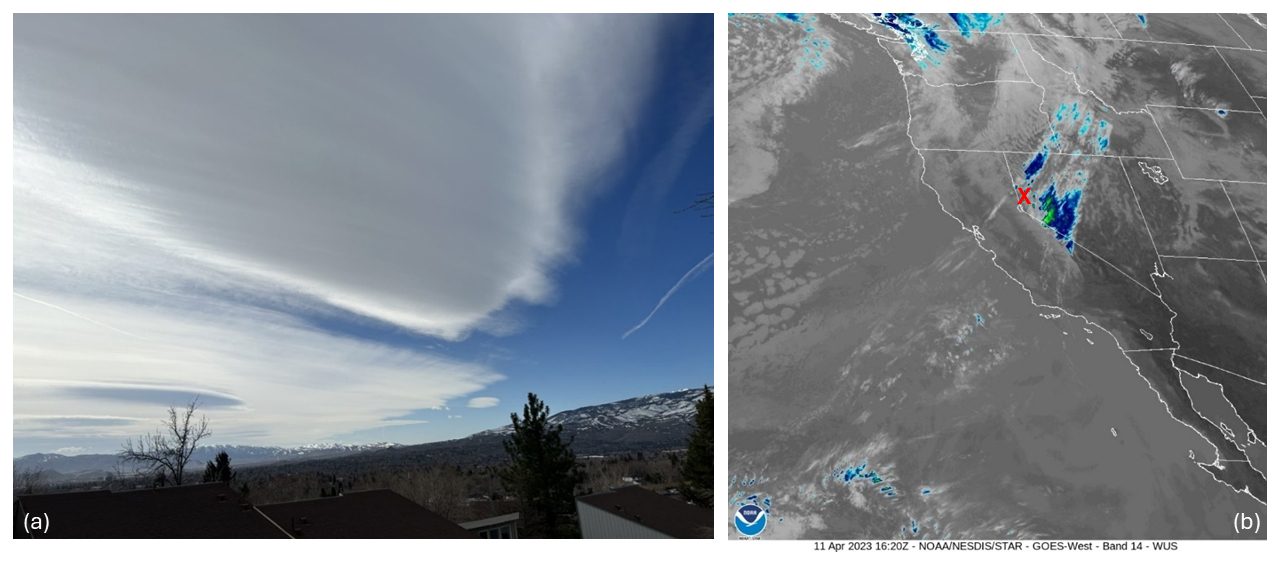
Figure 20(a) A wave cloud example of hom cirrus, forming over the Sierra Nevada mountains next to Reno, Nevada, that are associated with a warm front on 11 April 2023. (b) GOES-18 satellite image (11.2 µm channel) of these cirrus wave clouds acquired about 10 min before the photo was taken, revealing their extensive coverage. Low clouds are white-gray while high clouds (e.g., blue colors) tend to have lower brightness temperatures (BT), with lowest BT in dark blue and green. The red “X” indicates the location of the cloud scene in the photo.
The impact of OGWs on cirrus clouds is evaluated in Appendix A of Tully et al. (2022), where a version of the ECHAM6-HAM GCM is used. Figure A3 of that paper evaluates Ni at 200 hPa for vertical motions with and without orographic effects active. When orographic effects are included, predicted global distributions of Ni appear similar to Fig. S5 of this study featuring Ni for in situ cirrus clouds. An example of what OGW cirrus clouds often look like is given in Fig. 20; they are usually optically thicker than het cirrus clouds. Cirrus clouds induced by OGWs, often called wave cirrus, have relatively high updrafts and thus are more likely to be hom cirrus clouds (Barahona and Nenes, 2008; Joos et al., 2008, 2014; Barahona et al., 2017; Lyu et al., 2023; M2018). They also tend to exhibit higher cloud fractions (see Fig. 4 in Matus and L'Ecuyer, 2017). These OGW cirrus are characterized by relatively high Ni (M2018; Gryspeerdt et al., 2018) and, perhaps due to the oscillation of the OGW, are evident far downwind from mountain ranges in North America, Patagonia and Antarctica during winter (see Figs. 2 and S5). Note that hom cirrus are not restricted to OGW cirrus and may form under other conditions having relatively high updrafts and/or low INP concentrations.
CCT is potentially most effective at high latitudes during autumn and winter when solar insolation is relatively weak (Storelvmo et al., 2014; Mitchell et al., 2020). Based on this study, CCT could have a cooling effect at high latitudes based on the τ-weighted hom fraction. But this cooling could be compromised by a corresponding warming effect resulting from (1) a het cirrus Twomey effect (i.e., where higher INP concentrations produce higher Ni and smaller De) and (2) a het cirrus IWC/IWP effect (i.e., where smaller De from the Twomey effect produce lower fall speeds, increasing the IWC and IWP as demonstrated in Mitchell et al., 2008). These two effects may increase τ and cloud lifetime (Mitchell et al., 2008), increasing the warming effect of het cirrus clouds during Arctic winter. The two opposing radiative effects resulting from higher INP concentrations, the hom cirrus cooling effect and the het cirrus warming effect, need to be investigated by empowering climate modeling with satellite observations like these to better understand aerosol-cirrus cloud-climate interactions. Moreover, radiative transfer models may employ the CALIPSO retrievals presented here to better understand INP-cirrus cloud-radiation interactions, but these topics are beyond the scope of this study.
This study dealt with the identification of relevant cloud physical parameters to identify hom-affected cirrus clouds and further quantify their frequency of occurrence. From a global observational purview, this was done for the first time by Froyd et al. (2022) who used global measurements of dust concentration from aircraft in the UT to initialize a detailed cirrus cloud formation model that used reanalysis data in the dust trajectory simulations. In contrast, our study is based on retrieved cirrus cloud properties and does not involve modeling. In addition, our study estimates the relative radiative impact of het and hom cirrus clouds through the τ-weighted hom fraction.
In Sect. 2, global-seasonal maps for optically thick cirrus clouds (∼ 0.3 < τ < ∼ 3) show relatively high Ni and relatively low De at high latitudes during winter, especially over mountainous terrain. OGWs induced by mountains provide stronger updrafts that promote hom, which may help explain these results. Gryspeerdt et al. (2018) and M2018 reported similar findings and explanations. This winter phenomenon was also observed at midlatitudes over mountainous regions. Similar maps for IWC and Tr show that IWC tends to track Tr, consistent with expectations from the Clausius–Clapeyron equation. Similar maps of Ni and De restricted to in situ cirrus exhibit these same patterns but with higher Ni and smaller De, possibly resulting from their lower temperatures and lower geometrical thickness as described in Sect. 4.
The attribution study of het and hom-affected cirrus clouds (Sect. 3) began with determining which cloud properties were most sensitive to hom by exploiting a finding that hom was most active (based on Ni) in the geometrically thinnest cirrus clouds (i.e., having the smallest Tr–Ttop). Other than Ni, IWC was most sensitive to hom (with IWC increasing with hom activity), followed by De (mostly over land, with De decreasing with increasing hom activity). Therefore, the extinction coefficient αext for visible radiation was used to separate het and hom cirrus clouds since αext includes the IWC De ratio. Comparisons of our retrievals of Ni, IWC and De in the Tr vs. αext space with predicted corresponding values for pure hom conditions (based on the Clausius–Clapeyron equation and simple hom theory) revealed that maximum retrieved values for IWC and Ni (for a given Tr) coincided with theory, verifying the success of αext for separating het- and hom-affected cirrus clouds (as well as validating the retrievals).
With this understanding, a method was developed to quantify the contribution of cirrus clouds affected by hom. This involved analyzing variations of De against log (αext) where De exhibited a maximum typically at αext > 0.3 km−1 for Tr = 233 K, with the maxima tending to occur at lower αext with decreasing Tr. This De maximum was interpreted as a transition from het cirrus to hom-affected cirrus, with De decreasing with increasing αext in the hom regime due to higher Ni resulting from hom. That is, the greater competition for water vapor due to higher Ni in the hom regime reduces ice crystal growth rates, reducing De with increasing Ni. This method ensures that hom always has an unambiguous impact on cloud microphysical and radiative properties. Most of the quantitative results are over oceans where retrieval uncertainties are smaller than over land, owing to smaller uncertainties in surface parameters. The main findings of this het–hom attribution study are as follows:
- 1.
Outside the tropics over oceans, zonal means of the fraction of hom-affected cirrus clouds during winter were generally between 25 % and 30 %, with a comparable contribution from in situ cirrus and warm base cirrus clouds, similar to the findings of Dekoutsidis et al. (2023).
- 2.
The relative contribution of hom-affected cirrus in terms of radiation impact was estimated using a proxy for the net CRE inferred from τ distributions as a τ-weighted occurrence frequency. Using this proxy, we found that optically thick cirrus clouds with 0.3 < τ < 3 represent 78 % to 87 % of the radiative weight for all cirrus clouds sampled depending on latitude, which compared favorably with results from Hong et al. (2016). Using this proxy, the τ-weighted fraction for hom-affected cirrus over oceans outside the tropics during winter was > 50 %, indicating that hom cirrus may contribute substantially to the Earth's radiation budget.
- 3.
Based on two earlier studies that evaluate mineral dust contributions from the main dust source regions to different latitude zones during different seasons, the fraction of hom cirrus was lowest downwind of the Asian dust source regions during summer when UT dust concentrations were highest. Similarly, the fraction of hom cirrus over the Southern Ocean was lowest during summer when dust concentrations were highest (relative to winter). This suggests that the hom fraction is sensitive to mineral dust concentration and this may be a natural analogue to the climate intervention proposal known as cirrus cloud thinning (Mitchell and Finnegan, 2009). However, these seasonal changes in the hom cirrus fraction might partly be explained by seasonal changes in vertical velocities.
- 4.
Hom-affected cirrus were found to have a median Ni typically ≥ 200 L−1 (see Fig. 12) and τ is much larger than in het cirrus (Fig. 13). To a first approximation, the median IWC divides the het and hom cirrus cloud regimes outside the tropics (Fig. 17).
- 5.
When plotting De and Tr–Ttop against αext, it was found that their maxima occurred at approximately the same αext. A simple theory of cirrus cloud development was postulated to explain this observation.
- 6.
Contrasting Ni and De vs. αext plots for oceans and land in the het regime, it appears that higher INP over land may be producing a Twomey effect in het cirrus clouds over land. However, in the hom regime, higher INP concentrations appear to reduce the hom fraction and thus substantially reduce cirrus cloud optical depth.
Figure A1 shows the geographic sampling distribution of 1 km2 IIR pixels for two periods: DJF and JJA. Optically thick cirrus that can be measured over both land and oceans are featured in the panels (a)–(b) while sample counts for all cirrus over oceans with valid retrieved effective emissivities at both 10.6 and 12.05 µm (∼ 0.01 < τ < ∼ 3) are featured in panels (c)–(d). The higher counts in panels (c)–(d) are mostly due to in situ cirrus clouds.
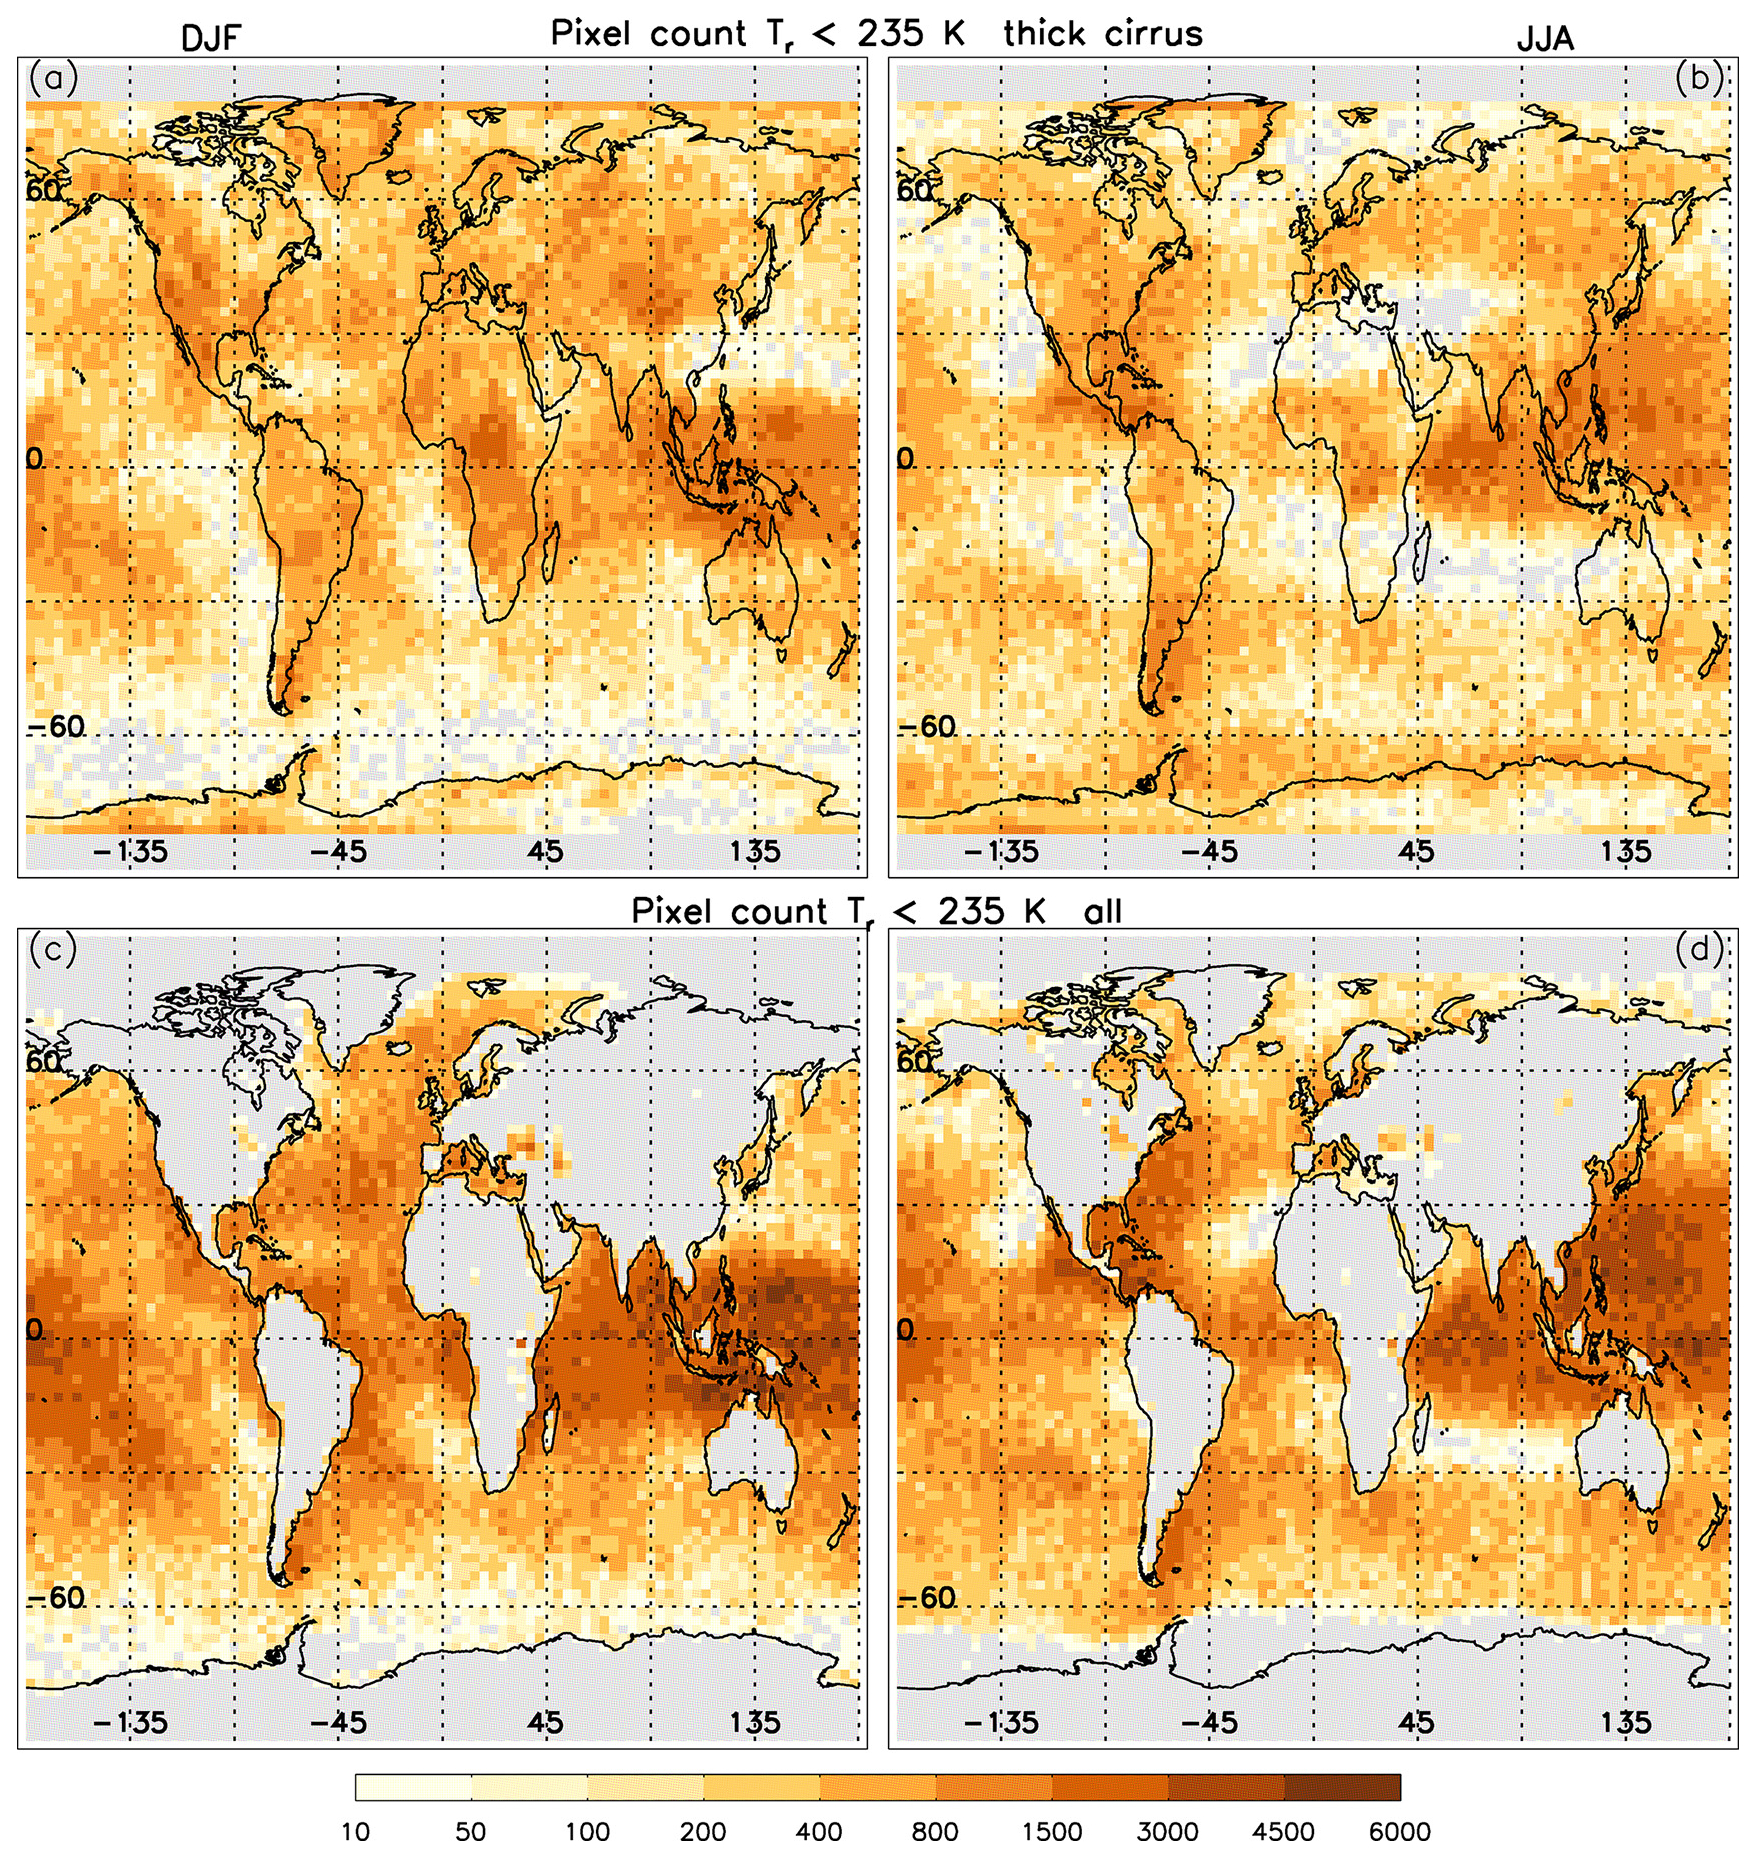
Figure A1Geographic sampling distribution of optically thick cirrus clouds during DJF (a) and JJA (b), where the number of sample counts is given by the color bar. Similarly, this sampling distribution is given for all cirrus clouds over oceans only (∼ 0.01 < τ < ∼ 3) during DJF (c) and JJA (d). Analysis for years 2008, 2010, 2012, and 2013.
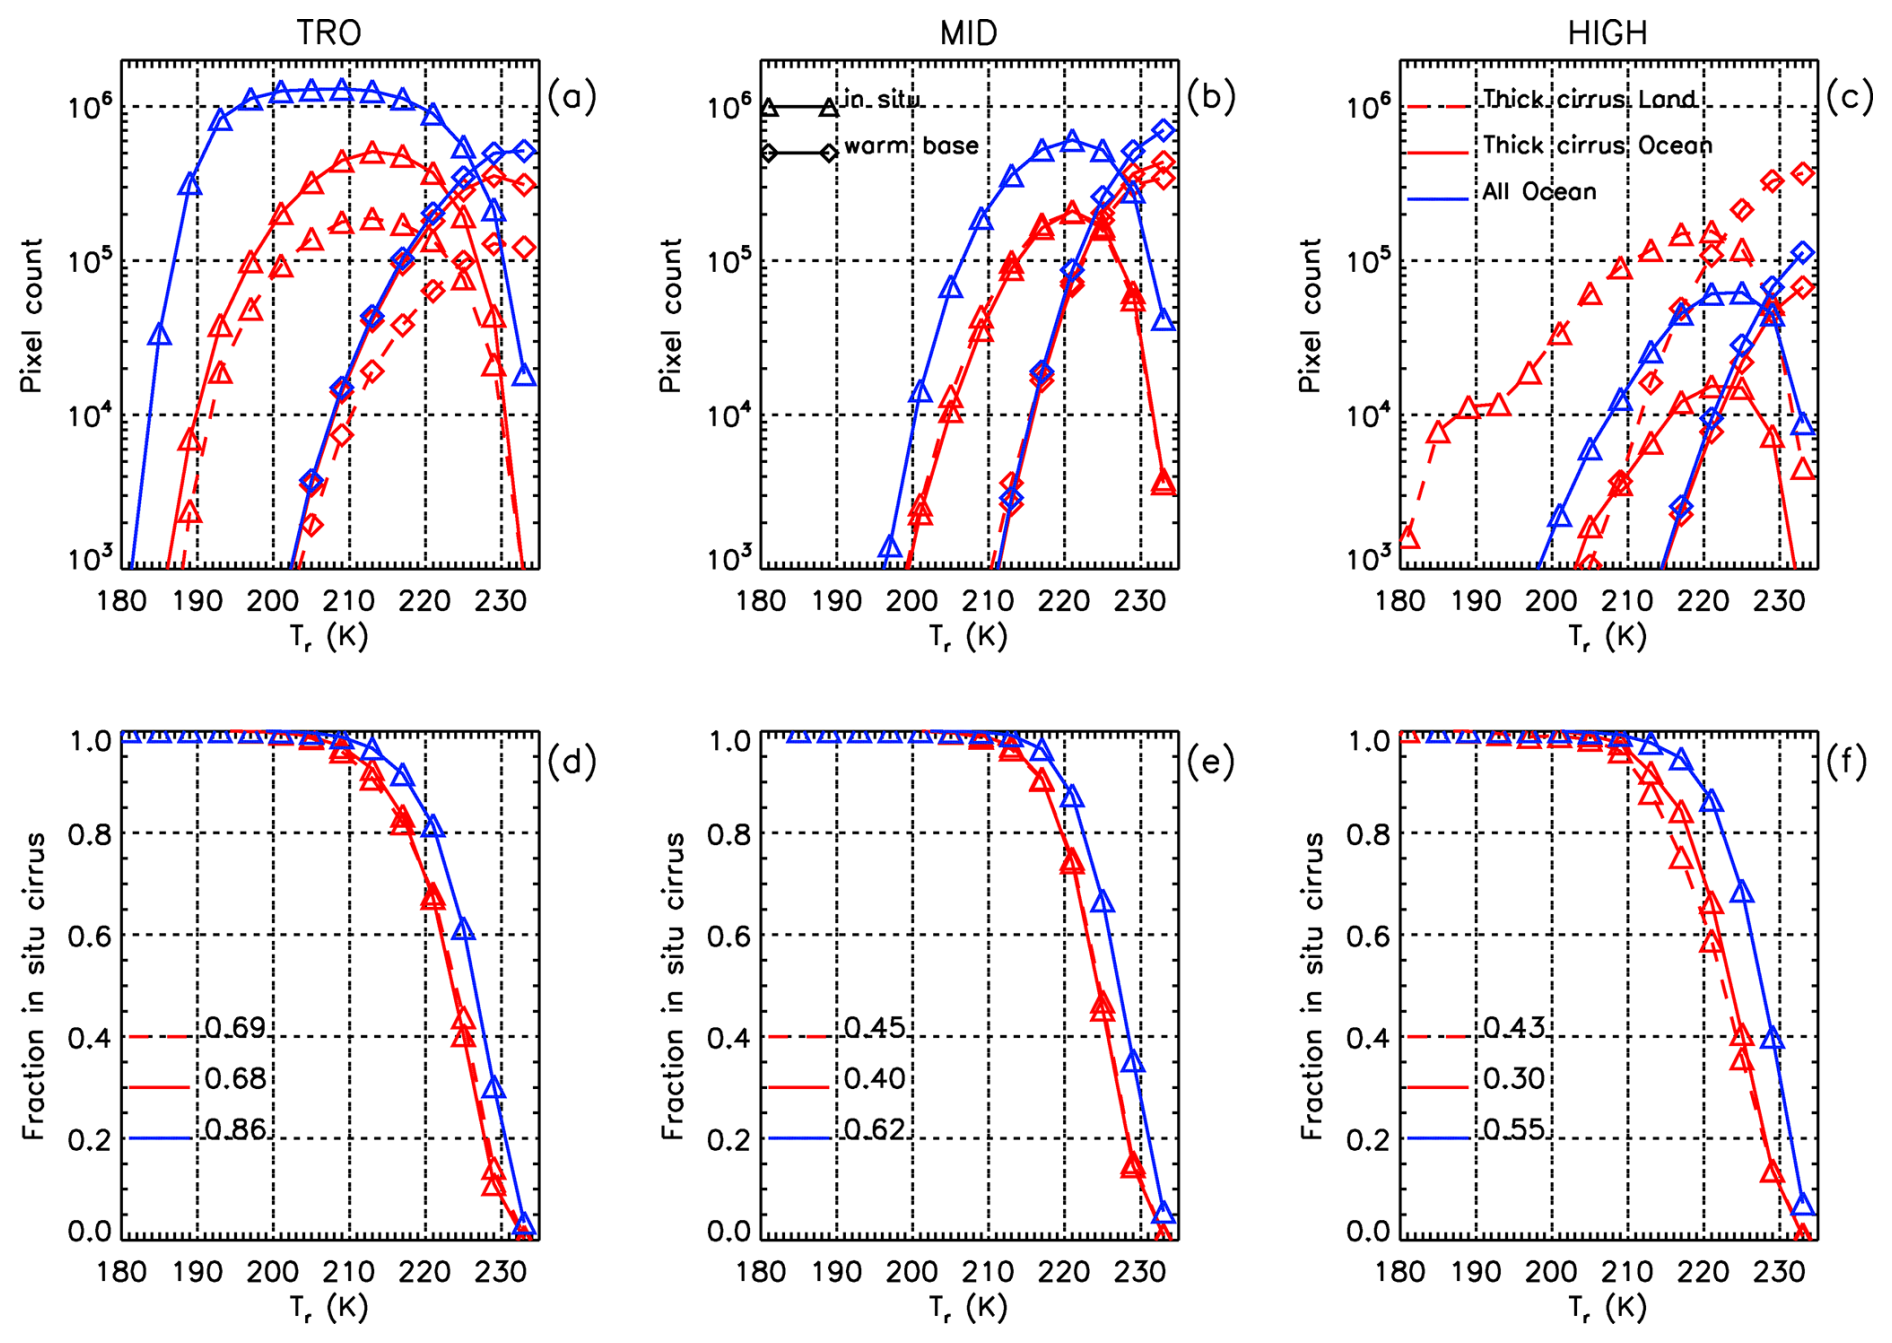
Figure A2(a–c) Global annual mean radiative temperature distributions of sampled in situ (triangles) and warm base (diamonds) cirrus clouds arranged horizontally by latitude zone: (a) tropics, (b) mid- and (c) high latitudes, NH and SH combined. Distributions were built with a 4 K temperature step. Red curves indicate optically thick clouds over land (dashed) and oceans (solid), while blue curves show results for all samples over oceans. (d–f) Red curves show the fraction of in situ cirrus clouds derived from upper panel results for optically thick clouds over land (dashed) and oceans (solid) while blue curves show the same but for all samples over oceans only. Numbers indicate the overall fraction of in situ cirrus clouds for each cloud category (indicated by corresponding line pattern or color). Analysis for years 2008, 2010, 2012, and 2013.
Figure A2a–c shows the abundance of in situ and warm base cirrus (WBC) as a function of cloud radiative temperature Tr for three latitude bands (combining NH and SH results), discriminating between optically thick cirrus (1) over land and (2) over oceans (∼ 0.3 < τ < ∼ 3) and (3) all retrieved cirrus clouds over oceans (∼ 0.01 < τ < ∼ 3). Figure A2d–f shows the fraction of in situ cirrus clouds as a function of Tr. The overall (total) fraction of in situ cirrus clouds for the above three cloud classes is indicated in each panel by the fraction and adjacent line pattern (or color). Temperature bins are 4 K resolution. Note that we count 1 km2 IIR pixels, and that a cirrus cloud extending 20 km horizontally along a portion of the lidar track is counted 20 times whereas a cirrus cloud extending 5 km along this track is counted only five times. Using the above definitions, Fig. A2d–f shows that the fraction of all retrieved in situ cirrus clouds over oceans reaches ∼ 50 % for Tr ≈ 227 K for all latitude zones. These findings can be compared with those reported in Fig. 4 of Dekoutsidis et al. (2023) over Europe, where it is evident that the occurrence of in situ cirrus prevails over LOC for Tr < 221 K. Similarly, Fig. 13 in Luebke et al. (2016) shows that for Europe, the transition from in situ cirrus dominating to LOC dominating occurs between 218 and 222 K. These studies are fairly consistent with this one given the different methods used to discriminate between in situ cirrus and either LOC or WBC clouds. As noted in Sect. 2.1, our method may overestimate the occurrence frequency of in situ cirrus clouds. From Fig. A2, the overall percentage of in situ cirrus for all sampled cirrus over oceans ranges from 86 % in the tropics, to 62 % in the midlatitudes, and 55 % in the high latitudes. These percentages, subtracted from 100, yield the percentage of WBC clouds.
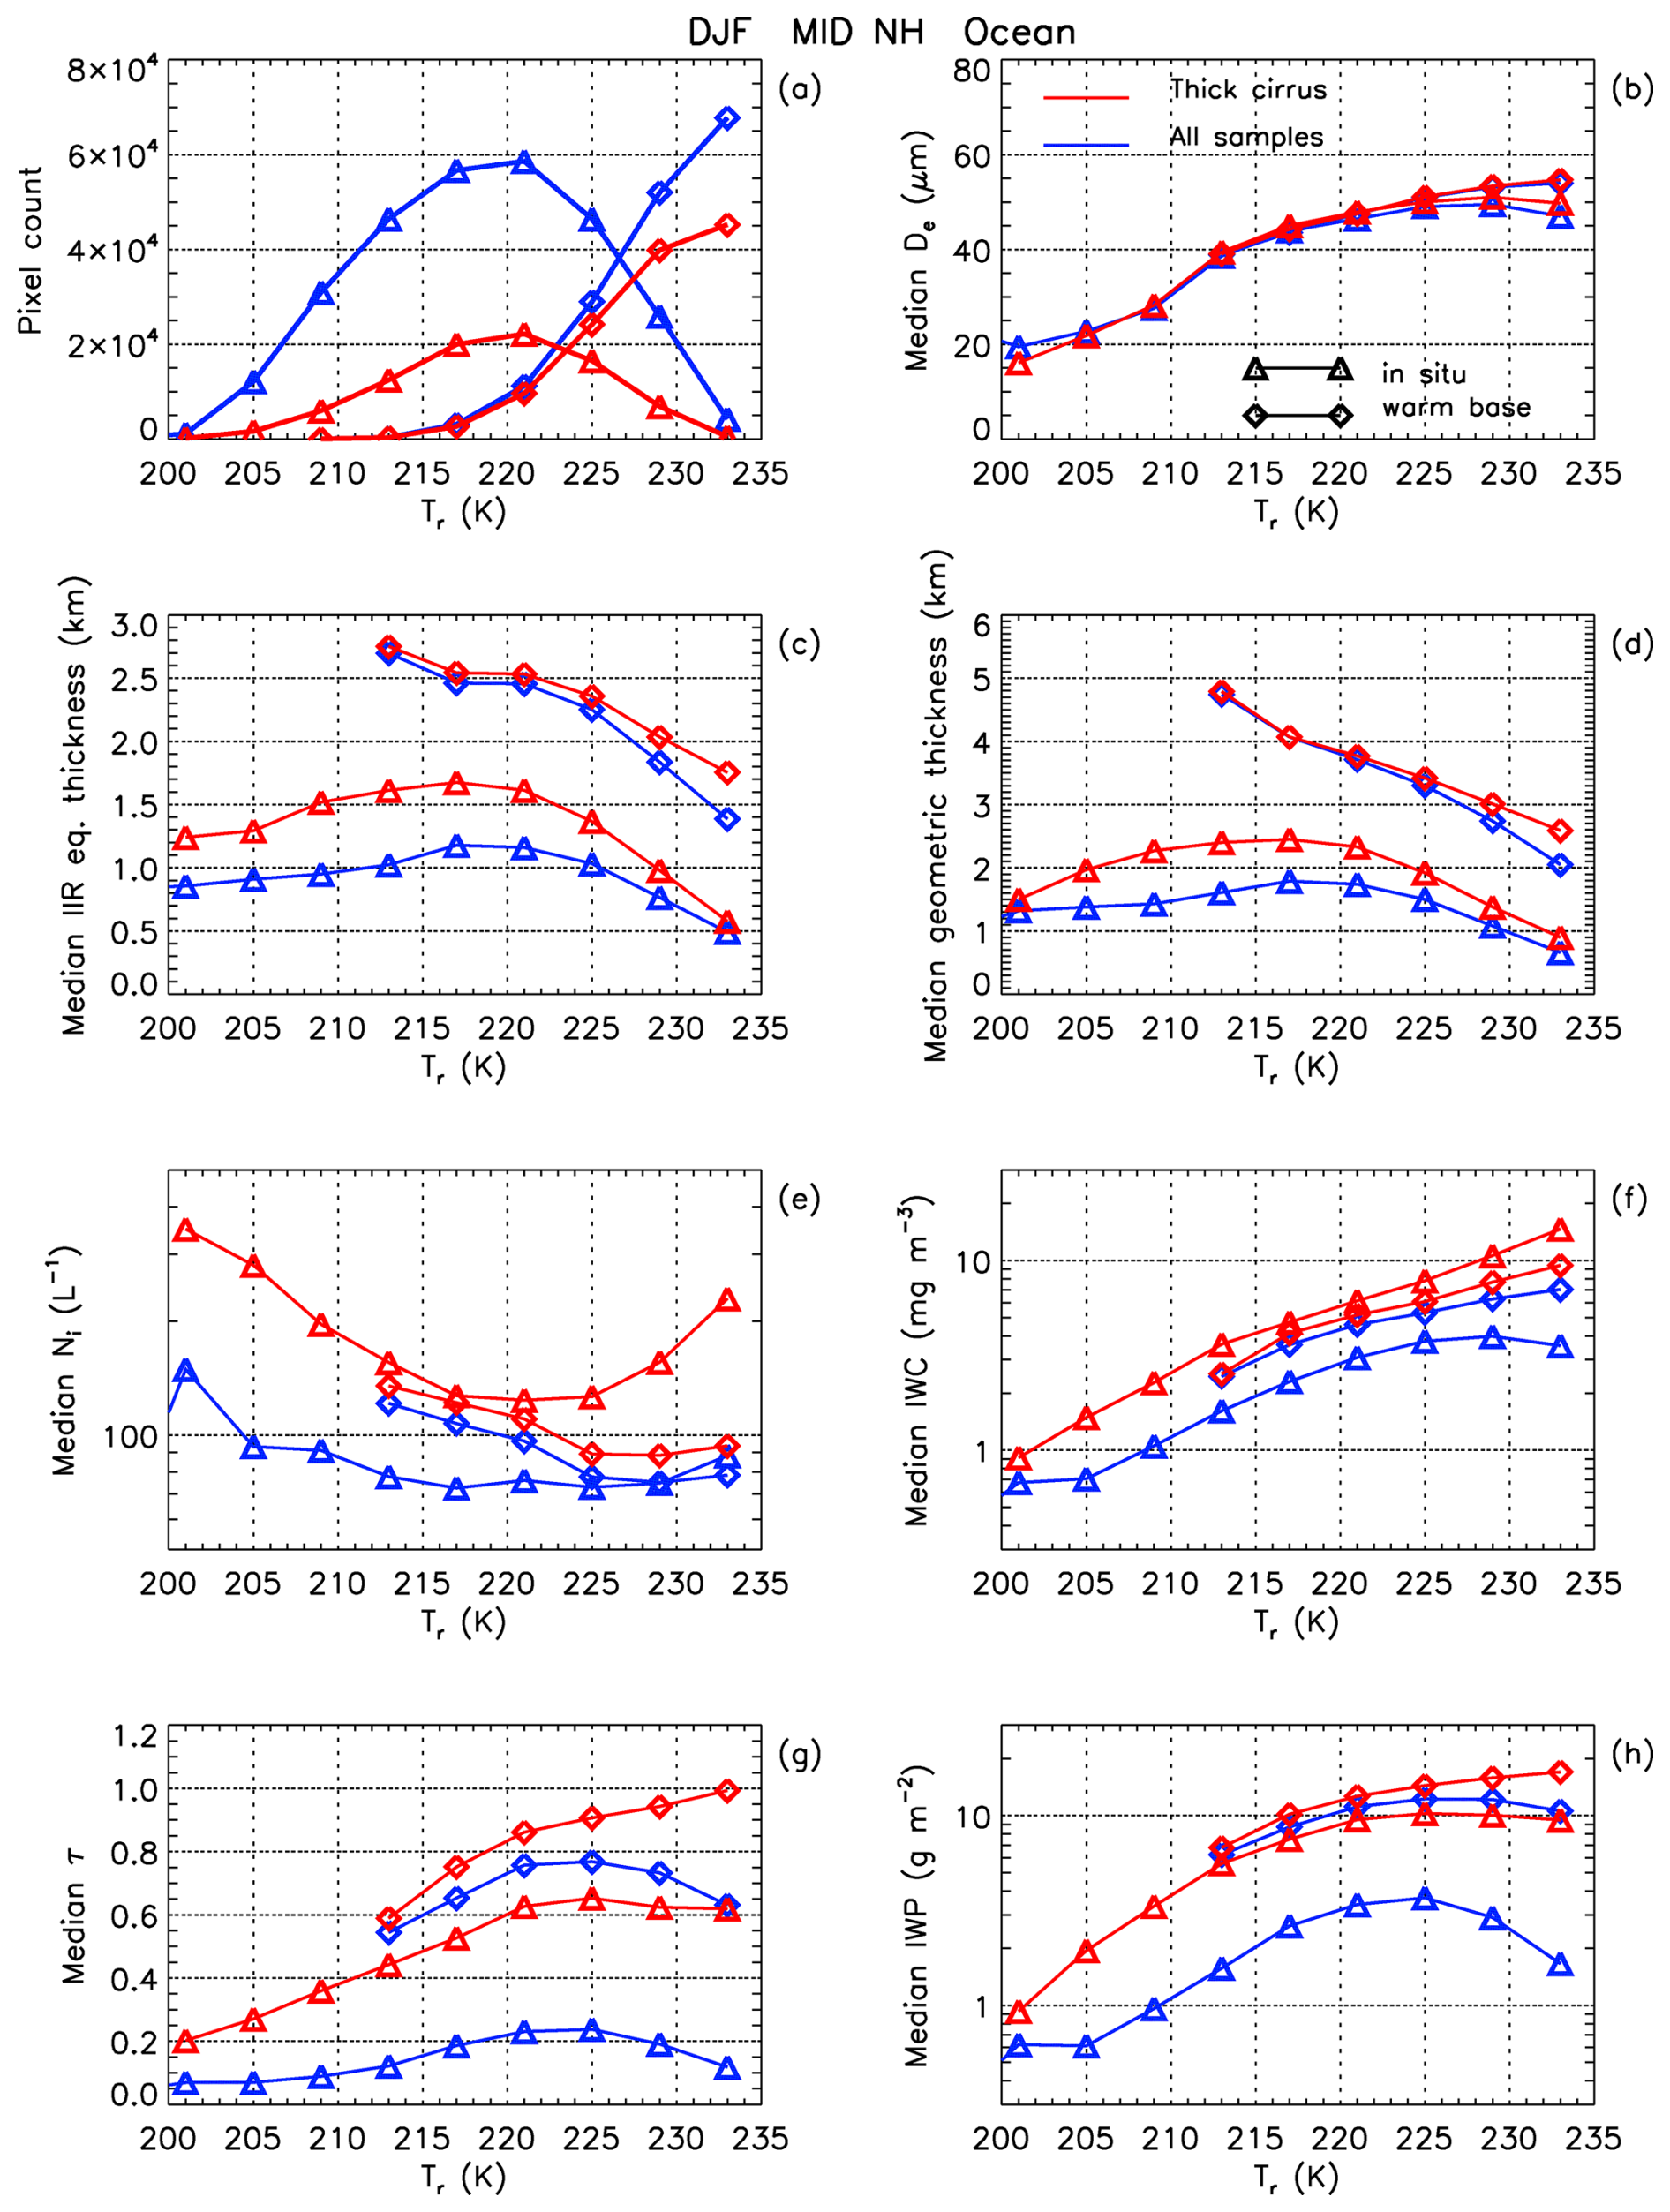
Figure A3Retrieval results contrasting in situ (triangle symbols) with warm base (diamond symbols) cirrus cloud properties for the NH midlatitudes over oceans during DJF. The blue curves are based on all samples (∼ 0.01 < τ < ∼ 3) while the red curves are for optically thick cirrus clouds (∼ 0.3 < τ < ∼ 3). Shown for each cirrus cloud type and range of τ are (a) number of retrieval samples, (b) median De (µm), (c) median IIR equivalent thickness (km), (d) median geometric thickness (km), (e) median Ni (L−1), (f) median IWC (mg m−3), (g) median τ, and (h) median IWP (g m−2).
A major motivation for investigating these two types of cirrus cloud is that their probable different origins may endow them with different microphysical and radiative properties. While our cloud classification method (in situ vs. WBC) was not designed for evaluating the cloud's microphysical origin (i.e., using back-trajectory analysis) like the in situ-LOC classification was, it may be sufficiently similar to capture some of the microphysical distinctions observed between the in situ and LOC classifications. This assumption is tested in Fig. A3 which contrasts the Tr dependence of Ni, De and IWC for in situ and WBC clouds over oceans for two τ classes: (1) 0.01 < τ < 3 and (2) 0.3 ≤ τ ≤ 3, where (1) is for all IIR samples and (2) provides the lowest uncertainties. This analysis is for winter at 30–60° N latitude. Class (1) may be more representative of aircraft measurements that do not discriminate between thin and thick cirrus, while class (2) is for relatively optically thick cirrus. These results are discussed in the last paragraph of Sect. 2.3. Based on all samples over oceans (blue curves), the main differences between in situ cirrus and WBC clouds are their IWPs and τ, which are greater for WBC clouds. The geometric thickness (Δz) in Fig. A3d is the vertical geometrical thickness of the cloud layer measured by CALIOP while the IIR equivalent thickness (Δzeq, panel c) accounts for the fact that the IIR instrument does not equally sense all of the cloud profile that contribute to thermal emission (M2018; Garnier et al., 2021; M2025). This is accounted for through the IIR weighting profile as illustrated in M2025, which gives more weight to higher extinctions in the cloud profile. Both median Δz and Δzeq are larger for WBC, partly explaining their higher IWPs and τ. As shown in Fig. 12, the temperature dependence of the fraction of hom cirrus varies with latitude and season, indicating that results in Fig. A3 may vary somewhat for different latitude zones and seasons.
The CALIPSO IIR Level 2 data products used in this study are available at the NASA Langley Atmospheric Science Data Center and can be retrieved from https://doi.org/10.5067/IIR/CALIPSO/CAL_IIR_L2_Track-Standard-V4-51 (NASA/LARC/SD/ASDC, 2023a). The CALIPSO Lidar Level 2 cloud profiles used in this study are available at the NASA Langley Atmospheric Science Data Center and can be retrieved from https://doi.org/10.5067/CALIOP/CALIPSO/CAL_LID_L2_05kmCPro-Standard-V4-51 (NASA/LARC/SD/ASDC, 2023b). These CALIPSO data products are also available from the AERIS/ICARE Data and Services Center in France (https://www.icare.univ-lille.fr/, last access: 11 October 2025). Post-processed data are available upon request to the authors.
The supplement related to this article is available online at https://doi.org/10.5194/acp-25-14099-2025-supplement.
DM and AG conceived the study; DM contributed to the writing of the paper; AG accessed and analyzed the CALIPSO data and contributed to the writing of the paper.
The contact author has declared that neither of the authors has any competing interests.
Publisher’s note: Copernicus Publications remains neutral with regard to jurisdictional claims made in the text, published maps, institutional affiliations, or any other geographical representation in this paper. While Copernicus Publications makes every effort to include appropriate place names, the final responsibility lies with the authors.
This research was supported by NOAA (grant no. NA22OAR4690640) and by the NASA CALIPSO project. The authors are grateful to the Centre National d'Etudes Spatiales (CNES) and to the AERIS/ICARE Data and Services Center in France for their support with the CALIPSO IIR data. We are grateful to Martina Krämer for asking us to produce Fig. 17. We also thank Ehsan Erfani for his assistance with the SPARTICUS data analysis and for his participation and suggestions in scientific discussions. The authors extend their gratitude to the two reviewers who have contributed important content to this study.
This research has been supported by the National Oceanic and Atmospheric Administration (NOAA; grant no. NA22OAR4690640) and the NASA Science Mission Directorate (CALIPSO Project).
This paper was edited by Matthias Tesche and reviewed by Blaž Gasparini and one anonymous referee.
Avery, M. A., Ryan, R. A., Getzewich, B. J., Vaughan, M. A., Winker, D. M., Hu, Y., Garnier, A., Pelon, J., and Verhappen, C. A.: CALIOP V4 cloud thermodynamic phase assignment and the impact of near-nadir viewing angles, Atmos. Meas. Tech., 13, 4539–4563, https://doi.org/10.5194/amt-13-4539-2020, 2020.
Barahona, D. and Nenes, A.: Parameterization of cirrus cloud formation in large-scale models: Homogeneous nucleation, J. Geophys. Res., 113, D11211, https://doi.org/10.1029/2007JD009355, 2008.
Barahona, D. and Nenes, A.: Parameterizing the competition between homogeneous and heterogeneous freezing in ice cloud formation – polydisperse ice nuclei, Atmos. Chem. Phys., 9, 5933–5948, https://doi.org/10.5194/acp-9-5933-2009, 2009.
Barahona, D., Molod, A., and Kalesse, H.: Direct estimation of the global distribution of vertical velocity within cirrus clouds, Sci. Rep., 7, 6840, https://doi.org/10.1038/s41598-017-07038-6, 2017.
Cao, L., Duan, L., Bala, G., and Caldeira, K.: Simultaneous stabilization of global temperature and precipitation through cocktail geoengineering, Geophys. Res. Lett., 44, 7429–7437, https://doi.org/10.1002/2017GL074281, 2017.
Carlsen, T. and David, R. O.: Spaceborne evidence that ice-nucleating particles influence high-latitude cloud phase, Geophys. Res. Lett., 49, e2022GL098041, https://doi.org/10.1029/2022GL098041, 2022.
Costa, A., Meyer, J., Afchine, A., Luebke, A., Günther, G., Dorsey, J. R., Gallagher, M. W., Ehrlich, A., Wendisch, M., Baumgardner, D., Wex, H., and Krämer, M.: Classification of Arctic, midlatitude and tropical clouds in the mixed-phase temperature regime, Atmos. Chem. Phys., 17, 12219–12238, https://doi.org/10.5194/acp-17-12219-2017, 2017.
Creamean, J. M., Kirpes, R. M., Pratt, K. A., Spada, N. J., Maahn, M., de Boer, G., Schnell, R. C., and China, S.: Marine and terrestrial influences on ice nucleating particles during continuous springtime measurements in an Arctic oilfield location, Atmos. Chem. Phys., 18, 18023–18042, https://doi.org/10.5194/acp-18-18023-2018, 2018.
Crook, J. A., Jackson, L. S., Osprey, S. M., and Forster, P. M.: A comparison of temperature and precipitation responses to different Earth radiation management geoengineering schemes, J. Geophys. Res., 120, 9352–9373, https://doi.org/10.1002/2015JD023269, 2015.
Danielsen, E. F.: In situ evidence of rapid, vertical, irreversible transport of lower tropospheric air into the lower tropical stratosphere by convective cloud turrets and by larger-scale upwelling in tropical cyclones, J. Geophys. Res., 98, 8665–8681, https://doi.org/10.1029/92JD02954, 1993.
Dekoutsidis, G., Groß, S., Wirth, M., Krämer, M., and Rolf, C.: Characteristics of supersaturation in midlatitude cirrus clouds and their adjacent cloud-free air, Atmos. Chem. Phys., 23, 3103–3117, https://doi.org/10.5194/acp-23-3103-2023, 2023.
Diao, M., Jensen, J. B., Pan, L. L., Homeyer, C. R., Honomichl, S., Bresch, J. F., and Bansemer, A.: Distributions of ice supersaturation and ice crystals from airborne observations in relation to upper tropospheric dynamical boundaries, J. Geophys. Res.-Atmos., 120, 5101–5121, https://doi.org/10.1002/2015JD023139, 2015.
Duan, L., Cao, L., Bala, G., and Caldeira, K.: Comparison of the fast and slow climate response to three radiation management geoengineering schemes, J. Geophys. Res.-Atmos., 123, 11980–12001, https://doi.org/10.1029/2018JD029034, 2018.
Duan, L., Cao, L., Bala, G., and Caldeira, K.: A model-based investigation of terrestrial plant carbon uptake response to four radiation modification approaches, J. Geophys. Res.-Atmos., 125, e2019JD031883, https://doi.org/10.1029/2019JD031883, 2020.
Emde, C., Buras-Schnell, R., Kylling, A., Mayer, B., Gasteiger, J., Hamann, U., Kylling, J., Richter, B., Pause, C., Dowling, T., and Bugliaro, L.: The libRadtran software package for radiative transfer calculations (version 2.0.1), Geosci. Model Dev., 9, 1647–1672, https://doi.org/10.5194/gmd-9-1647-2016, 2016.
Erfani, E. and Mitchell, D. L.: Developing and bounding ice particle mass- and area-dimension expressions for use in atmospheric models and remote sensing, Atmos. Chem. Phys., 16, 4379–4400, https://doi.org/10.5194/acp-16-4379-2016, 2016.
Field, P. R. and Heymsfield, A. J.: Aggregation and Scaling of Ice Crystal Size Distributions, J. Atmos. Sci., 60, 544–560, https://doi.org/10.1175/1520-0469(2003)060<0544:AASOIC>2.0.CO;2, 2003.
Froyd, K. D., Yu, P. F., Schill, G. P., Brock, C. A., Kupc, A., Williamson, C. J., Jensen, E. J., Ray, E., Rosenlof, K. H., Bian, H. S., Darmenov, A. S., Colarco, P. R., Diskin, G. S., Bui, T., and Murphy, D. M.: Dominant role of mineral dust in cirrus cloud formation revealed by global-scale measurements, Nat. Geosci., 15, 177–183, https://doi.org/10.1038/s41561-022-00901-w, 2022.
Garnier, A., Pelon, J., Pascal, N., Vaughan, M. A., Dubuisson, P., Yang, P., and Mitchell, D. L.: Version 4 CALIPSO Imaging Infrared Radiometer ice and liquid water cloud microphysical properties – Part I: The retrieval algorithms, Atmos. Meas. Tech., 14, 3253–3276, https://doi.org/10.5194/amt-14-3253-2021, 2021.
Gasparini, B. and Lohmann, U.: Why cirrus cloud seeding cannot substantially cool the planet, J. Geophys. Res., 121, 4877–4893, https://doi.org/10.1002/2015JD024666, 2016.
Gasparini, B., Münch, S., Poncet, L., Feldmann, M., and Lohmann, U.: Is increasing ice crystal sedimentation velocity in geoengineering simulations a good proxy for cirrus cloud seeding?, Atmos. Chem. Phys., 17, 4871–4885, https://doi.org/10.5194/acp-17-4871-2017, 2017.
Gasparini, B., Meyer, A., Neubauer, D., Münch, S., and Lohmann, U.: Cirrus Cloud Properties as Seen by the CALIPSO Satellite and ECHAM-HAM Global Climate Model, J. Climate, 31, 1983–2003, https://doi.org/10.1175/JCLI-D-16-0608.1, 2018.
Gasparini, B., McGraw, Z., Storelvmo, T., and Lohmann, U.: To what extent can cirrus cloud seeding counteract global warming?, Environ. Res. Lett., 15, 054002, https://doi.org/10.1088/1748-9326/ab71a3, 2020.
Gelaro, R., McCarty, W., Suárez, M. J., Todling, R., Molod, A., Takacs, L., Randles, C. A., Darmenov, A., Bosilovich, M. G., Reichle, R., Wargan, K., Coy, L., Cullather, R., Draper, C., Akella, S., Buchard, V., Conaty, A., da Silva, A. M., Gu, W., Kim, G., Koster, R., Lucchesi, R., Merkova, D., Nielsen, J. E., Partyka, G., Pawson, S., Putman, W., Rienecker, M., Schubert, S. D., Sienkiewicz, M., and Zhao, B.: The Modern-Era Retrospective Analysis for Research and Applications, Version 2 (MERRA-2), J. Climate, 30, 5419–5454, https://doi.org/10.1175/JCLI-D-16-0758.1, 2017.
Gettelman, A., Liu, X., Ghan, S. J., Morrison, H., Park, S., Conley, A. J., Klein, S. A., Boyle, J., Mitchell, D. L., and Li, J.-L. F.: Global simulations of ice nucleation and ice supersaturation with an improved cloud scheme in the community atmosphere model, J. Geophys. Res., 115, D18216, https://doi.org/10.1029/2009JD013797, 2010.
Gettelman, A., Liu, X., Barahona, D., Lohmann, U. and Chen, C.: Climate impacts of ice nucleation, J. Geophys. Res., 117, D20201, https://doi.org/10.1029/2012JD017950, 2012.
Gruber, S., Blahak, U., Haenel, F., Kottmeier, C., Leisner, T., Muskatel, H., Storelvmo, T. and Vogel, B.: A process study on thinning of Arctic winter cirrus clouds with high-resolution ICON-ART simulations, J. Geophys. Res., 124, 5860–5888, https://doi.org/10.1029/2018JD029815, 2019.
Gryspeerdt, E., Sourdeval, O., Quaas, J., Delanoë, J., Krämer, M., and Kühne, P.: Ice crystal number concentration estimates from lidar–radar satellite remote sensing – Part 2: Controls on the ice crystal number concentration, Atmos. Chem. Phys., 18, 14351–14370, https://doi.org/10.5194/acp-18-14351-2018, 2018.
Haag, W., Kärcher, B., Ström, J., Minikin, A., Lohmann, U., Ovarlez, J., and Stohl, A.: Freezing thresholds and cirrus cloud formation mechanisms inferred from in situ measurements of relative humidity, Atmos. Chem. Phys., 3, 1791–1806, https://doi.org/10.5194/acp-3-1791-2003, 2003.
Hoffmann, L., Grimsdell, A. W., and Alexander, M. J.: Stratospheric gravity waves at Southern Hemisphere orographic hotspots: 2003–2014 AIRS/Aqua observations, Atmos. Chem. Phys., 16, 9381–9397, https://doi.org/10.5194/acp-16-9381-2016, 2016.
Hong, Y., Liu, G., and Li, J. F.: Assessing the radiative effects of global ice clouds based on CloudSat and CALIPSO measurements, J. Climate, 29, 7651–7674, https://doi.org/10.1175/JCLI-D-15-0799.1, 2016.
Hu, Y., McFarquhar, G. M., Wu, W., Huang, Y., Schwarzenboeck, A., Protat A., Korolev, A., Rauber, R., and Wang, H.: Dependence of Ice Microphysical Properties on Environmental Parameters: Results from HAIC-HIWC Cayenne Field Campaign, J. Atmos. Sci., 78, 2957–2981, https://doi.org/10.1175/JAS-D-21-0015.1, 2021.
Jackson, L. S., Crook, J. A., and Forster, P. M.: An intensified hydrological cycle in the simulation of geoengineering by cirrus cloud thinning using ice crystal fall speed changes, J. Geophys. Res.-Atmos., 121, 6822–6840, https://doi.org/10.1002/2015JD024304, 2016.
Jensen, E. J., Pfister, L., and Bui, T. P.: Physical processes controlling ice concentrations in cold cirrus near the tropical tropopause, J. Geophys. Res., 117, D11205, https://doi.org/10.1029/2011JD017319, 2012.
Jensen, E. J., Kärcher, B., Woods, S., Krämer, M., and Ueyama, R.: The impact of gravity waves on the evolution of tropical anvil cirrus microphysical properties, J. Geophys. Res., 129, e2023JD039887, https://doi.org/10.1029/2023JD039887, 2024.
Jiang, J., Wu, D. L., and Eckermann, S. D.: Upper Atmospheric Research Satellite (UARS) MLS observation of mountain waves over the Andes, J. Geophys. Res., 107, 8273, https://doi.org/10.1029/2002JD002091, 2002.
Joos, H., Spichtinger, P., Lohmann, U., Gayet, J.-F., and Minikin, A.: Orographic cirrus in the global climate model ECHAM5, J. Geophys. Res., 113, D18205, https://doi.org/10.1029/2007JD009605, 2008.
Joos, H., Spichtinger, P., Reutter, P., and Fusina, F.: Influence of heterogeneous freezing on the microphysical and radiative properties of orographic cirrus clouds, Atmos. Chem. Phys., 14, 6835–6852, https://doi.org/10.5194/acp-14-6835-2014, 2014.
Kiehl, J. T. and Trenberth, K. E.: Earth's annual global mean energy budget, B. Am. Meteorol. Soc., 78, 197–208, https://doi.org/10.1175/1520-0477(1997)078<197:EAGMEB>2.0.CO;2, 1997.
Kok, J. F., Adebiyi, A. A., Albani, S., Balkanski, Y., Checa-Garcia, R., Chin, M., Colarco, P. R., Hamilton, D. S., Huang, Y., Ito, A., Klose, M., Leung, D. M., Li, L., Mahowald, N. M., Miller, R. L., Obiso, V., Pérez García-Pando, C., Rocha-Lima, A., Wan, J. S., and Whicker, C. A.: Improved representation of the global dust cycle using observational constraints on dust properties and abundance, Atmos. Chem. Phys., 21, 8127–8167, https://doi.org/10.5194/acp-21-8127-2021, 2021.
Koop, T., Luo, B., Tsias, A., and Peter, T.: Water activity as the determinant for homogeneous ice nucleation in aqueous solutions, Nature, 406, 611–614, https://doi.org/10.1038/35020537, 2000.
Krämer, M., Rolf, C., Luebke, A., Afchine, A., Spelten, N., Costa, A., Meyer, J., Zöger, M., Smith, J., Herman, R. L., Buchholz, B., Ebert, V., Baumgardner, D., Borrmann, S., Klingebiel, M., and Avallone, L.: A microphysics guide to cirrus clouds – Part 1: Cirrus types, Atmos. Chem. Phys., 16, 3463–3483, https://doi.org/10.5194/acp-16-3463-2016, 2016.
Krämer, M., Rolf, C., Spelten, N., Afchine, A., Fahey, D., Jensen, E., Khaykin, S., Kuhn, T., Lawson, P., Lykov, A., Pan, L. L., Riese, M., Rollins, A., Stroh, F., Thornberry, T., Wolf, V., Woods, S., Spichtinger, P., Quaas, J., and Sourdeval, O.: A microphysics guide to cirrus – Part 2: Climatologies of clouds and humidity from observations, Atmos. Chem. Phys., 20, 12569–12608, https://doi.org/10.5194/acp-20-12569-2020, 2020.
Kristjánsson, J. E., Muri, H., and Schmidt, H.: The hydrological cycle response to cirrus cloud thinning, Geophys. Res. Lett., 42, 10807–10815, https://doi.org/10.1002/2015GL066795, 2015.
Lamb, D. and Verlinde, J.: Physics and chemistry of clouds, Cambridge University Press, https://doi.org/10.1017/CBO9780511976377, 2011.
Lin, L., Liu, X., Zhao, X., Shan, Y., Ke, Z., Lyu, K., and Bowman, K. P.: Ice nucleation by volcanic ash greatly alters cirrus cloud properties, Sci. Adv., 11, eads0572, https://doi.org/10.1126/sciadv.ads0572, 2025.
Liu, X. H. and Penner, J. E.: Ice nucleation parameterization for global models, Meteorol. Z., 14, 499–514, https://doi.org/10.1127/0941-2948/2005/0059, 2005.
Liu, X., Shi, X., Zhang, K., Jensen, E. J., Gettelman, A., Barahona, D., Nenes, A., and Lawson, P.: Sensitivity studies of dust ice nuclei effect on cirrus clouds with the Community Atmosphere Model CAM5, Atmos. Chem. Phys., 12, 12061–12079, https://doi.org/10.5194/acp-12-12061-2012, 2012.
Liu, J. and Shi, X.: Estimating the potential cooling effect of cirrus thinning achieved via the seeding approach, Atmos. Chem. Phys., 21, 10609–10624, https://doi.org/10.5194/acp-21-10609-2021, 2021.
Lohmann, U. and Gasparini, B.: A cirrus cloud climate dial?, Science, 357, 248–249, https://doi.org/10.1126/science.aan3325, 2017.
Luebke, A. E., Afchine, A., Costa, A., Grooß, J.-U., Meyer, J., Rolf, C., Spelten, N., Avallone, L. M., Baumgardner, D., and Krämer, M.: The origin of midlatitude ice clouds and the resulting influence on their microphysical properties, Atmos. Chem. Phys., 16, 5793–5809, https://doi.org/10.5194/acp-16-5793-2016, 2016.
Lüttmer, T., Miltenberger, A., and Spichtinger, P.: On the impact of ice formation processes and sedimentation on cirrus origin classification in warm conveyor belt outflow, Atmos. Chem. Phys., 25, 10245–10265, https://doi.org/10.5194/acp-25-10245-2025, 2025.
Lyu, K., Liu, X., Bacmeister, J., Zhao, X., Lin, L., Shi, Y., and Sourdeval, O.: Orographic cirrus and its radiative forcing in NCAR CAM6, J. Geophys. Res.-Atmos., 128, e2022JD038164, https://doi.org/10.1029/2022JD038164, 2023.
Matus, A. V. and L'Ecuyer, T. S.: The role of cloud phase in Earth's radiation budget, J. Geophys. Res., 122, 2559–2578, https://doi.org/10.1002/2016JD025951, 2017.
McCluskey, C. S., Hill, T. C. J., Humphries, R. S., Rauker, A. M., Moreau, S., Strutton, P. G., Chambers, S. D., Williams, A. G., McRobert, I., Ward, J., Keywood, M. D., Harnwell, J., Ponsonby, W., Loh, Z. M., Krummel, P. B., Protat, A., Kreidenweis, S. M., and DeMott, P. J.: Observations of ice nucleating particles over Southern Ocean waters, Geophys. Res. Lett., 45, 11989–11997, https://doi.org/10.1029/2018GL079981, 2018.
Mishra, S., Mitchell, D. L., Turner, D. D., and Lawson, R. P.: Parameterization of ice fall speeds in midlatitude cirrus: results from SPartICus, J. Geophys. Res.-Atmos., 119, 3857–3876, https://doi.org/10.1002/2013jd020602, 2014.
Mitchell, D. L.: Evolution of snow-size spectra in cyclonic storms. Part I: Snow growth by vapor deposition and aggregation, J. Atmos. Sci., 45, 3431–3451, https://doi.org/10.1175/1520-0469(1988)045<3431:EOSSSI>2.0.CO;2, 1988.
Mitchell, D. L.: A model predicting the evolution of ice particle size spectra and radiative properties of cirrus clouds. Part 1: Microphysics, J. Atmos. Sci., 51, 797–816, https://doi.org/10.1175/1520-0469(1994)051<0797:AMPTEO>2.0.CO;2, 1994.
Mitchell, D. L. and Finnegan, W.: Modification of cirrus clouds to reduce global warming, Environ. Res. Lett., 4, 045102, https://doi.org/10.1088/1748-9326/4/4/045102, 2009.
Mitchell, D. L, Ivanova, D., Edwards, J. M., and McFarquhar, G. C.: A GCM parameterization of bimodal size spectral for ice clouds, in: Ninth ARM Science Team Meeting Proceedings, San Antonio, Texas, 22–26 March 1999, https://www.arm.gov/publications/proceedings/conf09/extended_abs/mitchell2_dl.pdf (last access: 31 October 2024), 1999.
Mitchell, D. L., Rasch, P., Ivanova, D., McFarquhar, G., and Nousiainen, T.: Impact of small ice crystal assumptions on ice sedimentation rates in cirrus clouds and GCM simulations, Geophys. Res. Lett., 35, L09806, https://doi.org/10.1029/2008GL033552, 2008.
Mitchell, D. L. and d’Entremont, R. P.: Satellite retrieval of the liquid water fraction in tropical clouds between −20 and −38 °C, Atmos. Meas. Tech., 5, 1683–1698, https://doi.org/10.5194/amt-5-1683-2012, 2012.
Mitchell, D. L., Garnier, A., Pelon, J., and Erfani, E.: CALIPSO (IIR–CALIOP) retrievals of cirrus cloud ice-particle concentrations, Atmos. Chem. Phys., 18, 17325–17354, https://doi.org/10.5194/acp-18-17325-2018, 2018.
Mitchell, D. L., Mejia, J., Garnier, A., Tomii, Y., Krämer, M., and Hosseinpour, F.: An Estimate of Global, Regional and Seasonal Cirrus Cloud Radiative Effects Contributed by Homogeneous Ice Nucleation, Atmos. Chem. Phys. Discuss. [preprint], https://doi.org/10.5194/acp-2020-846, 2020.
Mitchell, D. L., Garnier, A., and Woods, S.: Advances in CALIPSO (IIR) cirrus cloud property retrievals – Part 1: Methods and testing, Atmos. Chem. Phys., 25, 14071–14098, https://doi.org/10.5194/acp-25-14071-2025, 2025.
Muench, S. and Lohmann, U.: Developing a cloud scheme with prognostic cloud fraction and two moment microphysics for ECHAM-HAM, J. Adv. Model. Earth Sy., 12, e2019MS001824, https://doi.org/10.1029/2019MS001824, 2020.
Muri, H., Kristjánsson, J. E., Storelvmo, T., and Pfeffer, M. A.: The climatic effects of modifying cirrus clouds in a climate engineering framework, J. Geophys. Res., 119, 4174–4191, https://doi.org/10.1002/2013JD021063, 2014.
Muri, H., Tjiputra, J., Otterå, O. H., Adakudlu, M., Lauvset, S. K., Grini, A., Schulz, M., Niemeier, U., and Kristjánsson, J. K.: Climate response to aerosol geoengineering: A multimethod comparison, J. Climate, 31, 6319–6340, https://doi.org/10.1175/JCLI-D-17-0620.1, 2018.
Ngo, D., Diao, M., Patnaude, R. J., Woods, S., and Diskin, G.: Aerosol Indirect Effects on Cirrus Clouds Based on Global-Scale Airborne Observations and Machine Learning Models, EGUsphere [preprint], https://doi.org/10.5194/egusphere-2024-2122, 2024.
NASA/LARC/SD/ASDC: CALIPSO Infrared Imaging Radiometer (IIR) Level 2 Track, V4-51, NASA Langley Atmospheric Science Data Center DAAC [data set], https://doi.org/10.5067/IIR/CALIPSO/CAL_IIR_L2_Track-Standard-V4-51, 2023a.
NASA/LARC/SD/ASDC: CALIPSO Lidar Level 2 Cloud Profile, V4-51, NASA Langley Atmospheric Science Data Center DAAC [data set], https://doi.org/10.5067/CALIOP/CALIPSO/CAL_LID_L2_05kmCPro-Standard-V4-51, 2023b.
Patnaude, R. and Diao, M.: Aerosol Indirect Effects on Cirrus Clouds Based on Global Aircraft Observations, Geophys. Res. Lett., 47, e2019GL086550, https://doi.org/10.1029/2019GL086550, 2020.
Penner, J. E., Zhou, C., and Liu, X.: Can cirrus cloud seeding be used for geoengineering?, Geophys. Res. Lett., 42, 8775–8782, https://doi.org/10.1002/2015GL065992, 2015.
Rosenfeld, D. and Woodley, W.: Deep convective clouds with sustained supercooled liquid water down to −37.5 °C, Nature, 405, 440–442, https://doi.org/10.1038/35013030, 2000.
Schneider, J., Höhler, K., Wagner, R., Saathoff, H., Schnaiter, M., Schorr, T., Steinke, I., Benz, S., Baumgartner, M., Rolf, C., Krämer, M., Leisner, T., and Möhler, O.: High homogeneous freezing onsets of sulfuric acid aerosol at cirrus temperatures, Atmos. Chem. Phys., 21, 14403–14425, https://doi.org/10.5194/acp-21-14403-2021, 2021.
Shi, X., Liu, X., and Zhang, K.: Effects of pre-existing ice crystals on cirrus clouds and comparison between different ice nucleation parameterizations with the Community Atmosphere Model (CAM5), Atmos. Chem. Phys., 15, 1503–1520, https://doi.org/10.5194/acp-15-1503-2015, 2015.
Song, Q., Zhang, Z., Yu, H., Ginoux, P., and Shen, J.: Global dust optical depth climatology derived from CALIOP and MODIS aerosol retrievals on decadal timescales: regional and interannual variability, Atmos. Chem. Phys., 21, 13369–13395, https://doi.org/10.5194/acp-21-13369-2021, 2021.
Sourdeval, O., Gryspeerdt, E., Krämer, M., Goren, T., Delanoë, J., Afchine, A., Hemmer, F., and Quaas, J.: Ice crystal number concentration estimates from lidar–radar satellite remote sensing – Part 1: Method and evaluation, Atmos. Chem. Phys., 18, 14327–14350, https://doi.org/10.5194/acp-18-14327-2018, 2018.
Spichtinger, P. and Gierens, K. M.: Modelling of cirrus clouds – Part 1a: Model description and validation, Atmos. Chem. Phys., 9, 685–706, https://doi.org/10.5194/acp-9-685-2009, 2009a.
Spichtinger, P. and Gierens, K. M.: Modelling of cirrus clouds – Part 1b: Structuring cirrus clouds by dynamics, Atmos. Chem. Phys., 9, 707–719, https://doi.org/10.5194/acp-9-707-2009, 2009b.
Sporre, M. K., Friberg, J., Svenhag, C., Sourdeval, O., and Storelvmo, T.: Springtime stratospheric volcanic aerosol impact on midlatitude cirrus clouds, Geophys. Res. Lett., 49, e2021GL096171, https://doi.org/10.1029/2021GL096171, 2022.
Stephens, G. L.: Cloud feedbacks in the climate system: A critical review, J. Climate, 18, 237–273, https://doi.org/10.1175/JCLI-3243.1, 2005.
Storelvmo, T., Kristjansson, J. E., Muri, H., Pfeffer, M., Barahona, D., and Nenes, A.: Cirrus cloud seeding has potential to cool climate, Geophys. Res. Lett., 40, 178–182, https://doi.org/10.1029/2012GL054201, 2013.
Storelvmo, T. and Herger, N.: Cirrus cloud susceptibility to the injection of ice nuclei in the upper troposphere, J. Geophys. Res.-Atmos., 119, 2375–2389, https://doi.org/10.1002/2013JD020816, 2014.
Storelvmo, T., Boos, W. R., and Herger, N.: Cirrus cloud seeding: a climate engineering mechanism with reduced side effects?, Philos. T. Roy. Soc. A, 372, 20140116, https://doi.org/10.1098/rsta.2014.0116, 2014.
Tully, C., Neubauer, D., Omanovic, N., and Lohmann, U.: Cirrus cloud thinning using a more physically based ice microphysics scheme in the ECHAM-HAM general circulation model, Atmos. Chem. Phys., 22, 11455–11484, https://doi.org/10.5194/acp-22-11455-2022, 2022.
Tully, C., Neubauer, D., Villanueva, D., and Lohmann, U.: Does prognostic seeding along flight tracks produce the desired effects of cirrus cloud thinning?, Atmos. Chem. Phys., 23, 7673–7698, https://doi.org/10.5194/acp-23-7673-2023, 2023.
United Nations Environment Programme: One Atmosphere: An independent expert review on Solar Radiation Modification research and deployment, Kenya, Nairobi, https://wedocs.unep.org/handle/20.500.11822/41903 (last access: 9 October 2025), 2023.
Vergara-Temprado, J., Miltenberger, A. K., Furtado, K., Grosvenor, D. P., Shipway, B. J., Hill, A. A., Wilkinson, J. M., Field, P. R., Murray, B. J., and Carslaw, K. S.: Strong control of Southern Ocean cloud reflectivity by ice-nucleating particles, P. Natl. Acad. Sci. USA, 115, 2687–2692, https://doi.org/10.1073/pnas.1721627115, 2018.
Wernli, H., Boettcher, M., Joos, H., Miltenberger, A. K., and Spichtinger, P.: A trajectory-based classification of ERA-Interim ice clouds in the region of the North Atlantic storm track, Geophys. Res. Lett., 43, 6657–6664, https://doi.org/10.1002/2016GL068922, 2016.
- Abstract
- Introduction
- CALIPSO retrievals
- Contribution of hom-affected cirrus clouds
- Conceptualizing cirrus cloud formation and evolution
- Implications for cirrus cloud representations in climate models and cirrus cloud thinning
- Summary and conclusions
- Appendix A: Global distributions and properties of in situ and liquid origin cirrus clouds
- Data availability
- Author contributions
- Competing interests
- Disclaimer
- Acknowledgements
- Financial support
- Review statement
- References
- Supplement