the Creative Commons Attribution 4.0 License.
the Creative Commons Attribution 4.0 License.
 | 27 Oct 2025
Measurement report: Six-year DOAS observations reveal post-2020 rebound of ship SO2 emissions in a Shanghai port despite low-sulfur fuel policies
Jiaqi Liu
Shanshan Wang
Yan Zhang
Sanbao Zhang
Yuhao Yan
Zimin Han
Bin Zhou
The expansion of maritime trade has made ship emissions a significant target for SO2 reduction policies. However, there is still a lack of observational data to reflect the long-term changes in SO2 emission from ships. This study conducted continuous observational experiments using differential optical absorption spectroscopy (DOAS) from 2018 to 2023 in a shipping channel in Shanghai, China. By employing machine learning for gap filling and meteorological normalization, the trends of ambient SO2 related to ship emissions (Ship_related_SO2) over the 6-year period were revealed. Furthermore, whether ships in the channel were using low-sulfur fuels was determined by a decomposition of SO2-rich plume signals (which reflect high-emission ships) and baseline variations. The findings indicate that ship activities increased ambient SO2 concentrations in the channel by 0.48±0.25 ppbv (43.24 % of urban background levels). During the policy adjustment phase (2018 to 2020), Ship_related_SO2 levels declined steadily due to low-sulfur fuel regulations. Meanwhile, from 2021 to 2023 (the policy stabilization phase), increased ship activity became the dominant driver of rising Ship_related_SO2 levels. Despite policy effectiveness, excessive emissions from cargo ships persisted throughout the study period. This study quantified the contribution of ship emissions to ambient SO2 during 2018–2023 based on observations, evaluating the effectiveness of low-sulfur policies and supporting ongoing efforts to mitigate SO2 pollution from maritime activities. The methodology developed here can be adapted to other global shipping channels, providing a framework for monitoring and regulating ship emissions worldwide.
- Article
(5288 KB) - Full-text XML
-
Supplement
(2738 KB) - BibTeX
- EndNote


Sulfur dioxide (SO2), classified as an airborne carcinogen (von Nieding, 1978; Ghanbari Ghozikali et al., 2016), contributes to urban haze, increases environmental health risks and facilitates the formation of sulfate aerosols through heterogeneous reactions (Squizzato et al., 2018). Although volcanic eruptions are a major natural source of SO2 (Carn et al., 2016), the widespread use of sulfur-containing fuels, such as coal and oil, in human activities remains the dominant anthropogenic source globally (Zhong et al., 2019; Van Aardenne et al., 2001). In response to the global challenge of rising energy demand and continued SO2 emissions, the United States (Miller, 2011), the European Union (Meyer and Pac, 2017) and several other countries (Moran, 2007; Lou et al., 2021; Kuttippurath, 2022) have introduced a series of policies that have effectively reduced land-based SO2 emissions. However, with the rapid expansion of maritime trade, SO2 emissions from shipping are projected to keep increasing (Zhao et al., 2020), posing growing threats to coastal atmospheric environments (Zhang et al., 2017; Wang et al., 2019) and becoming a major focus of global research and policy initiatives.
To curb SO2 emissions from maritime shipping, the International Maritime Organization (IMO) implemented a global regulation in 2020 that reduced the allowable sulfur content from 3.5 % to 0.5 % (Zhao et al., 2020; Fossum et al., 2024), aiming to reduce the shipping industry's impact on atmospheric environments. In addition, six emission control areas (ECAs) have been established worldwide. Among them, the Baltic Sea, North Sea, North American and US Caribbean ECAs received IMO approval, while the European and California coastal ECAs were independently designated by their respective authorities (Fossum et al., 2024; Mohiuddin et al., 2024). As the world's most active maritime trading nation (Ducruet and Wang, 2018), China's port activities exert a particularly strong influence on coastal air quality. In 2015, China launched its Domestic Emission Control Area (DECA 1.0) policy, requiring ships with compatible facilities in the Pearl River Delta, Yangtze River Delta and Bohai Rim (Beijing–Tianjin–Hebei) regions to use fuel with ≤0.5 % sulfur content during berthing periods from January 2016 (Zou et al., 2020; Zhang et al., 2019; Wang et al., 2021). By late 2018, China upgraded the policy to DECA 2.0, mandating that all ships operating within China's territorial sea (12-nautical-mile zone) must use fuel with ≤0.5 % sulfur content while sailing from January 2019 onward and ≤0.1 % sulfur content while at berth or adopt equivalent emission control measures, e.g., installing exhaust gas cleaning systems (scrubbers) (Lunde Hermansson et al., 2024; Andreasen and Mayer, 2007), adopting alternative fuels like liquefied natural gas (LNG) (Pavlenko et al., 2020; Attah and Bucknall, 2015), methanol (Svanberg et al., 2018; Shi et al., 2023) and biofuels (Cesilla de Souza and Eugênio Abel Seabra, 2024; Ahmed et al., 2025), and applying operational strategies such as slow steaming and shore power use (Zis et al., 2014, 2015). Despite the effectiveness of these policy measures in controlling SO2 emissions from shipping, previous studies have shown that the impact of ship emissions on air quality in coastal areas is still significant (Viana et al., 2014; Xiao et al., 2022, 2023), which provides an important basis for further research on the reduction of ship SO2 emissions.
Previous research has extensively utilized high spatiotemporal resolution AIS (Automatic Identification System) ship activity data and air quality models to quantify the environmental impact of ship emissions (Zhao et al., 2020; Liu et al., 2017; Feng et al., 2019a, 2023; Li et al., 2020; Fan et al., 2016; Zhang et al., 2023). Simulation results from 2016 to 2020 show that the control of SO2 emissions from ships was particularly effective in 2020 due to the influence of low-sulfur policies (Luo et al., 2024). Compared to simulations, observational data can more accurately capture real-world changes in pollution from ships and ports (Eger et al., 2023) while also serving as a critical tool for refining emission inventories, improving atmospheric models and identifying excessive emission ships (Cheng et al., 2019; Liu et al., 2024; Krause et al., 2021; Kattner et al., 2015). In light of the low-sulfur policies, critical questions remain: has the low-sulfur policy effectively regulated ship SO2 emissions? Can the low levels of SO2 observed in 2020 be sustained amidst anticipated long-term growth in maritime activity? Addressing these questions requires continued observational research.
This study aims to address these gaps by presenting long-term observational data from the Shanghai shipping channel, one of the busiest maritime routes in the world. By integrating differential optical absorption spectroscopy (DOAS) measurements with machine learning, we propose a novel approach to quantifying ship emissions and evaluating policy effectiveness, with implications for other coastal regions facing similar challenges. Specifically, this study pursues three key objectives: (1) to quantify the contribution of ship emissions to ambient SO2 levels in the Shanghai shipping channel over a 6-year period (2018–2023), (2) to evaluate the effectiveness of low-sulfur policies in reducing ship-related SO2 emissions, and (3) to identify potential gaps in current emission inventories and regulatory frameworks.
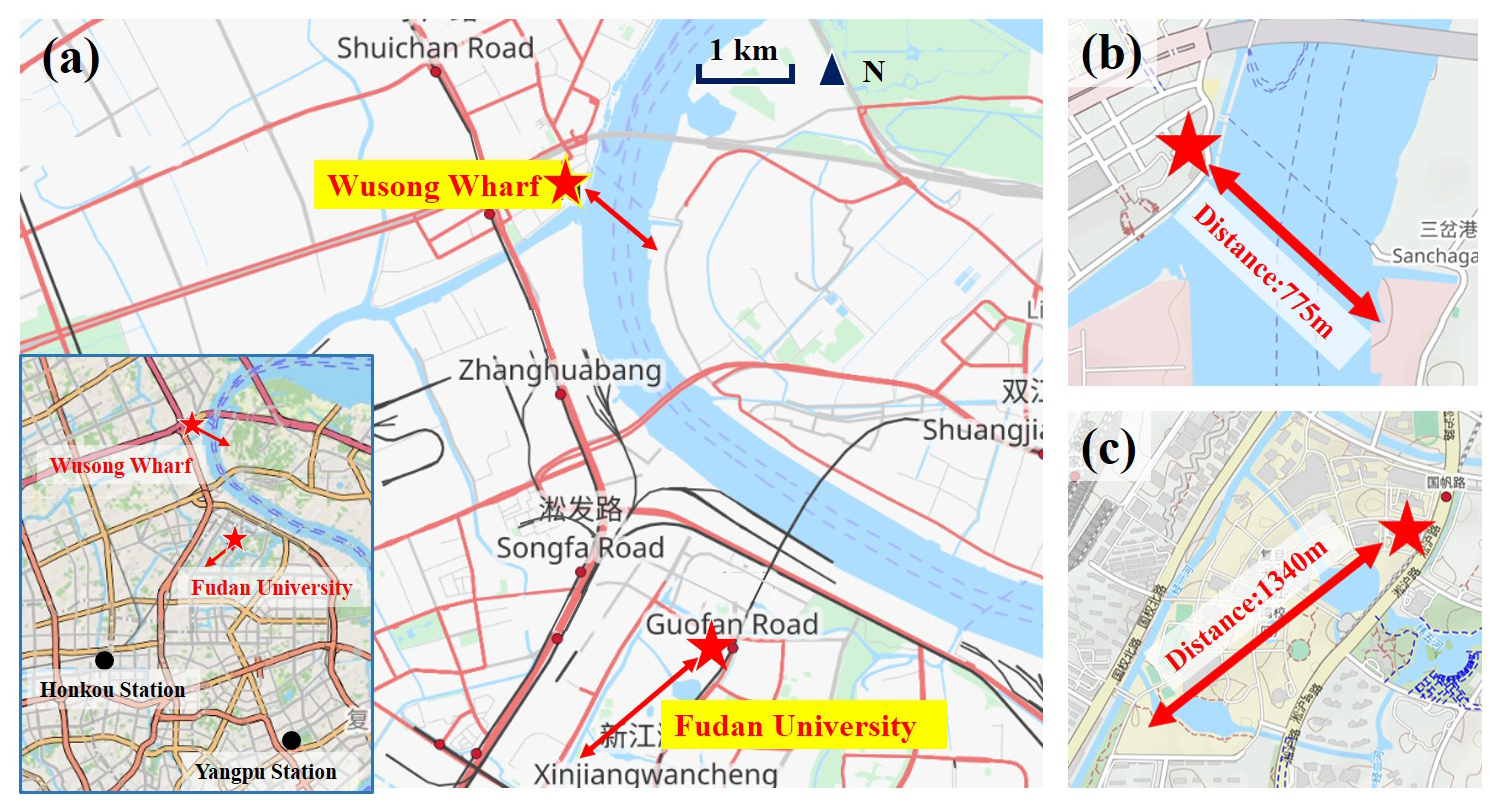
Figure 1Location of the relevant site in this campaign. (a) The red stars represent the location of the DOAS in Wusong Wharf (WSW) and Fudan University (FDU); the bidirectional arrows indicate the light path of the DOAS. The black circles represent the two environmental monitor stations around FDU station. (b) DOAS light path setting in WSW and (c) that in FDU. Base map: ©OpenStreetMap contributors 2025. Distributed under the Open Data Commons Open Database License (ODbL) v1.0.
2.1 DOAS setup and spectra retrieval
Experiments measuring SO2 were conducted using two active DOAS systems from 2018 to 2023 at Wusong Wharf (WSW, 31.37° N, 121.51° E) and the Jiangwan Campus of Fudan University (FDU, 31.34° N, 121.51° E), as seen in Fig. 1. The WSW site is located downstream the confluence of the Huangpu River and the Yangtze River, where over a thousand vessels pass daily, including cargo ships, passenger ships, fishing boats, oil tankers and other ships in various operating conditions. Shipping activities are the primary source of ambient pollution at this site. Figures S1 and S2 and Sect. S1 in the Supplement give an overview of ship activity in the WSW channel. The FDU site, situated 4 km southwest of WSW, is characterized as a typical urban location with no significant local pollution sources, as noted in previous studies (Liu et al., 2024; Guo et al., 2020).
Each active DOAS system was equipped with a light source (150 W xenon lamp), a reflecting/receiving telescope, an array of retroreflectors, a spectrometer and a computer. In WSW, the light was emitted from a laboratory on the third floor (approximately 10 m a.g.l. – above ground level) of the Wusong Maritime Safety Administration building (ground elevation ∼ 6 m a.s.l. – above sea level) and reflected across the channel by an array of retroreflectors located on the opposite bank (which is also about 10 m a.g.l.), forming a light path of 1540 m. Given the local tidal range of approximately 1–4 m, the vertical height of the light path above the water surface varied between roughly 12 and 15 m. Due to the optical path crossing the airspace above the shipping channel, emission signals from vessels below can be easily captured by active DOAS. At FDU, the transmitting terminal of the active DOAS was located in a laboratory on the seventh floor of the Environmental Science Building, with the retroreflector array placed to the southwest, forming a light path of 2689 m. In previous studies, this site effectively represented Shanghai's urban areas with relatively clean atmospheric conditions (Liu et al., 2024; Zhu et al., 2020; Gu et al., 2022). Spectral signal retrieval and time-series pollutant concentration calculations were performed using the DOASIS software developed by the Institute of Environmental Physics at Heidelberg University, with SO2 retrieved in the 299–308 nm wavelength range. Additional technical details on the DOAS instrument, spectral data processing and detection limits are provided in Sect. S2 and Table S1 in the Supplement.
2.2 Machine learning and Ship_related_SO2 obtained
The SO2 in the atmosphere associated with ship activity in the channel (Ship_related_SO2) was obtained by removing both meteorological effects and land-based emissions from the completed WSW observations, as shown in Fig. 2. Therefore, this study developed two data-processing models using extremeGradientBoostingRegressor (XGB) and ExtraTreesRegressor (ETR). The first model was used to impute missing SO2 concentration data (Fig. 2a), while the second model was designed to eliminate meteorological influences (Fig. 2b). Both models use machine learning techniques to capture complex relationships among multiple variables and improve data accuracy.
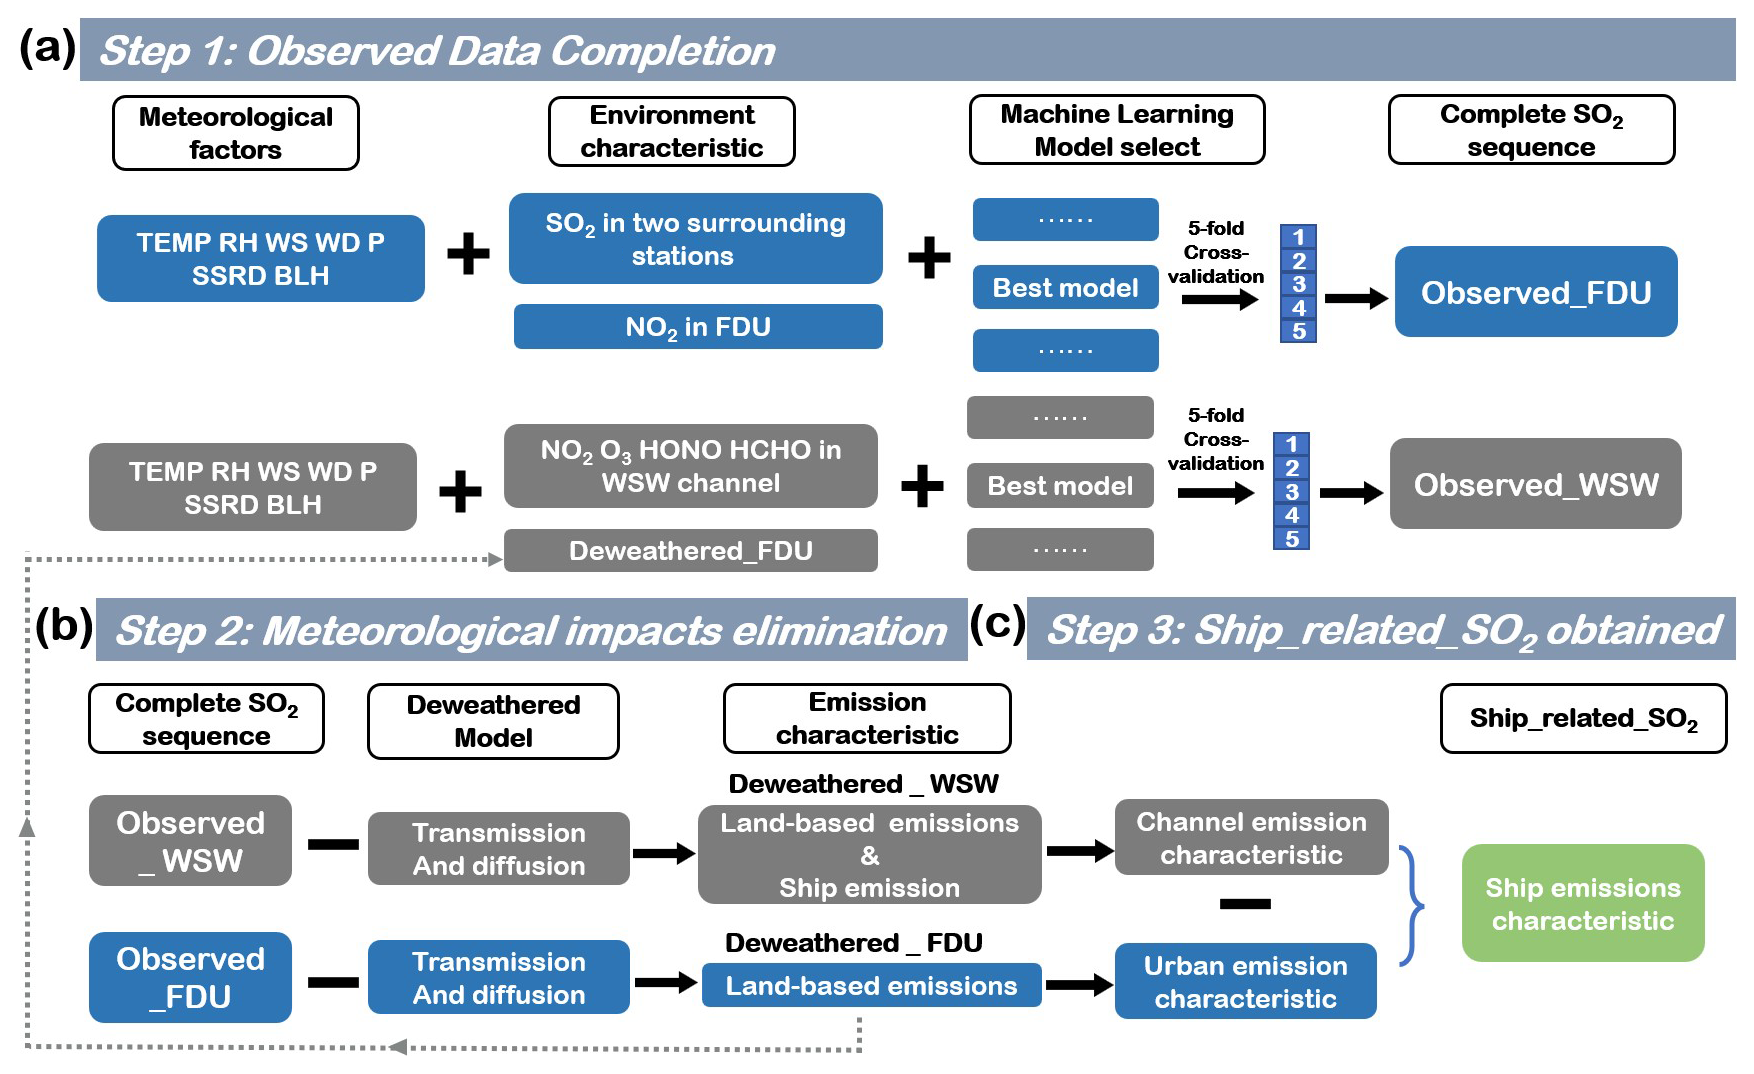
Figure 2Schematics of Ship_related_SO2 obtained based on DOAS observation, machine learning and meteorological impact elimination. (a) For gap filling, several models were trained, and the most effective XGB model was selected using 5-fold cross-validation. For the training of FDU, the feature parameters were selected from the continuous observation data of two automatic monitoring stations near FDU and seven meteorological factors. The training of WSW involved using the SO2 observation data of FDU, other pollution data observed in the channel and seven meteorological factors. (b) Meteorological influences on Observed_WSW and Observed_FDU were eliminated to highlight local emission impacts. (c) The emission characteristics of FDU and WSW were subtracted to obtain Ship_related_SO2.
XGB was selected to address data gaps from 2018 to 2023 caused by weather conditions and equipment maintenance at both sites. XGB is an optimized distributed gradient enhancement library designed for efficiency, flexibility and portability. It implements machine learning algorithms in the Gradient Boosting framework (Pan, 2018; Friedman, 2002). These models identify patterns between feature and target vectors in large datasets to make predictions or decisions, and they have been maturely applied to environmental research (Li et al., 2024; Zhu et al., 2022; Zhang et al., 2022).
As illustrated in Fig. 2a, the gap-filling model for WSW SO2 incorporates several predictive features representing three major types of environmental influences: meteorological conditions, ship emissions and urban land-based emissions. Specifically, co-measured pollutants at WSW (NO2, HCHO, HONO, O3) help represent shipping-related emissions through cross-species learning, while SO2 measured at FDU – after meteorological normalization (Deweathered_FDU) – accounts for urban land-based emission influences. When filling gaps in the FDU SO2, NO2 concentration from active DOAS in FDU and SO2 from two surrounding environmental monitoring stations are used to represent environment characteristics of land emissions in Shanghai. In addition, seven meteorological factors, i.e., temperature (TEMP), relative humidity (RH), wind speed (WS), wind direction (WD), solar radiation (SSRD), boundary layer height (BLH) and surface pressure (P) from the European Centre for Medium-Range Weather Forecasts (ECMWF) atmospheric reanalysis product ERA5, were used as meteorological impacts for both models. Observed_WSW and Observed_FDU represent the completed SO2 sequence after XGB filling. All input data were hourly averages. Models were trained with 5-fold cross-validation and evaluated through an independent validation test. Details about the machine learning data input, model tuning and performance evaluation can be seen in Section S3 in the Supplement.
The Deweathered model is used to eliminate the influence of meteorological factors on air pollution. This method simulates and offsets the impacts of various meteorological conditions, thereby estimating pollutant concentrations independent of weather variability (Vu et al., 2019; Grange et al., 2018). Among the commonly used methods, tree-based ensemble learning models, such as random forest and its variants, have been widely applied and proven effective in deweathering air quality data (Grange and Carslaw, 2019; Grange et al., 2018; Ceballos-Santos et al., 2021). To the best of our knowledge, this study is the first to apply ETR specifically for deweathering Ship_related_SO2 data. In this study, the ETR model was selected as the core algorithm. ETR is a variant of the random forest model, sharing nearly identical ensemble learning principles but introducing greater randomness during node splitting. This added randomness helps further reduce model variance and overfitting risk compared to the standard random forest model while maintaining comparable interpretability and robustness (Gall et al., 2011). For both sites, a large amount of historical meteorological data from the ERA5 reanalysis dataset and time-related variables (Unix time, Julian day and day of the week) were included in the Deweathered model training. The training process and parameter description of the model are provided in Fig. S7 and Sect. S3.
By applying the Deweathered model to the observed SO2 at WSW and FDU in Fig. 2b and c, the study isolated the ambient SO2 contribution directly attributable to ship emissions (Ship_related_SO2). This is because, after accounting for meteorological effects, the SO2 concentrations recorded at WSW reflect the combined influence of the urban land-based emissions and ship emissions. For the FDU site, however, the Deweathered model effectively removes the influence of transported pollution under different wind directions (Fig. S8) – for example, ship-related SO2 transported from the northeast channel – so that the residual values can represent the locally generated SO2 level. Given that both FDU and WSW are located in similar environments, primarily surrounded by residential areas and typical urban roads, the Deweathered_SO2 concentrations at FDU are therefore taken as the background level for Shanghai's urban region. Thus, by subtracting the background (Deweathered_FDU) from the Deweathered_WSW, the contribution of Ship_related_SO2 can be effectively determined.
2.3 Auxiliary data
This study utilized AIS-based ship trajectory data to identify suspicious high-emission ships. AIS data provide detailed real-time information on ship locations, speeds, routes and types, having been widely used in the study of ship emissions and related environmental impacts (Yang et al., 2019; Tu et al., 2018). The automatic monitoring stations for ambient air quality, i.e., Yangpu Station and Hongkou Station, provided hourly SO2 concentration time series data from 2018 to 2023, which were used as input variables for imputing missing values in Observed_SO2. All meteorological data used in this study were obtained from the fifth-generation European Centre for Medium-Range Weather Forecasts (ECMWF) atmospheric reanalysis, known as ERA5, which provides hourly around-the-clock meteorological factors from the surface up to 0.01 hPa with a spatial resolution of 0.25°×0.25° (Marshall, 2000; Hersbach et al., 2020).
3.1 Long-term characteristics of SO2
Figure 3 illustrates the monthly variations in SO2 concentrations at the FDU background site and the WSW shipping channel site from 2018 to 2023, both before and after use of the Deweathered model. At the FDU site (Fig. 3a and b), the observed SO2 concentrations display significant variability and weak inter-annual correlation, indicative of the influence of meteorological factors. After using the Deweathered model, the SO2 levels demonstrate a highly consistent trend over the 6 years, with minimal inter-annual differences. This reflects the stable nature of land-based emissions and highlights the effectiveness of the Deweathered process in isolating anthropogenic emission signals from meteorological noise. In contrast, at the WSW site (Fig. 3c and d), the Deweathered model also reduces variability and enhances the stability of the annual trends compared to the observed data. However, noticeable differences remain between years, likely due to the irregular and dynamic nature of shipping activities.
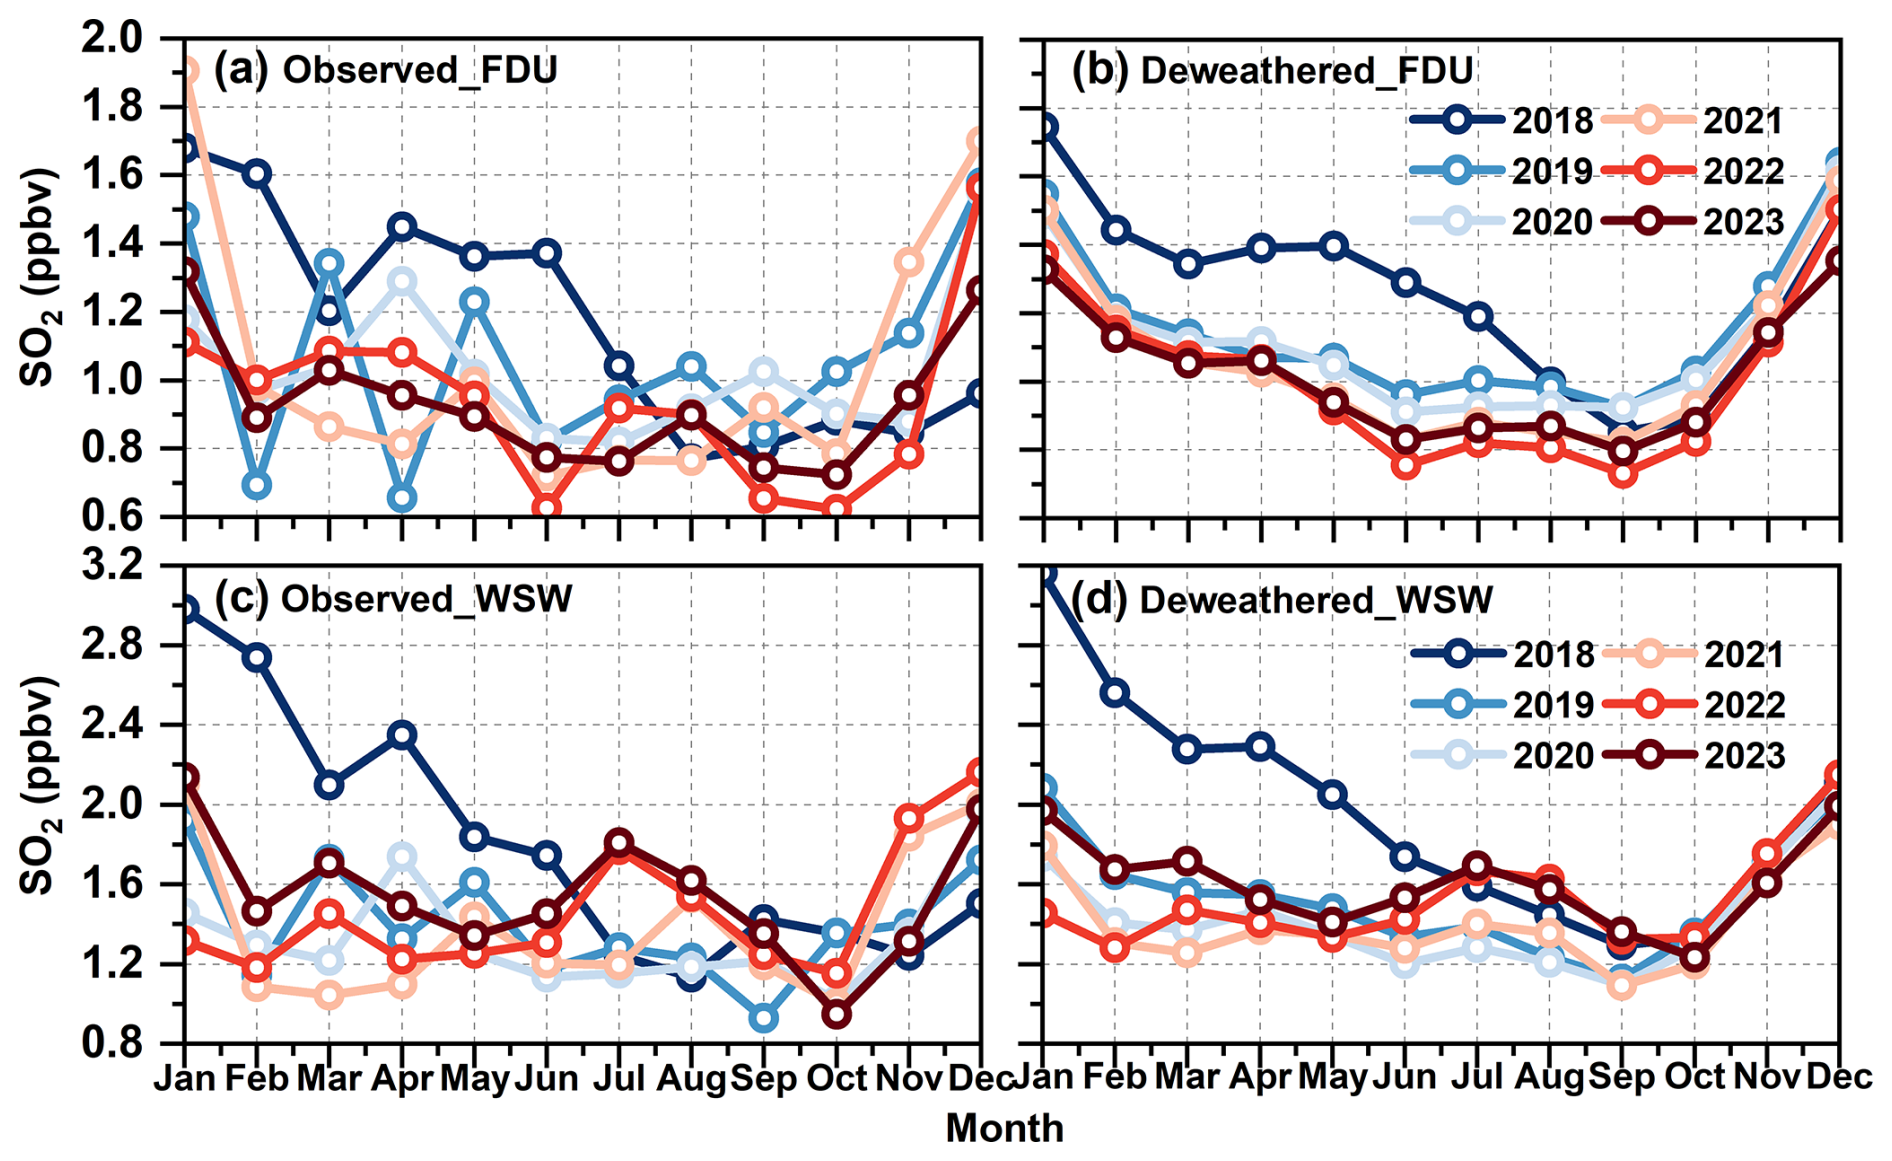
Figure 3Monthly SO2 concentrations at the FDU background site and WSW shipping channel site from 2018 to 2023. (a) Observed and (b) meteorological impacts eliminated (deweathered) SO2 concentrations at the FDU site, respectively. (c, d) The corresponding data for the WSW site.
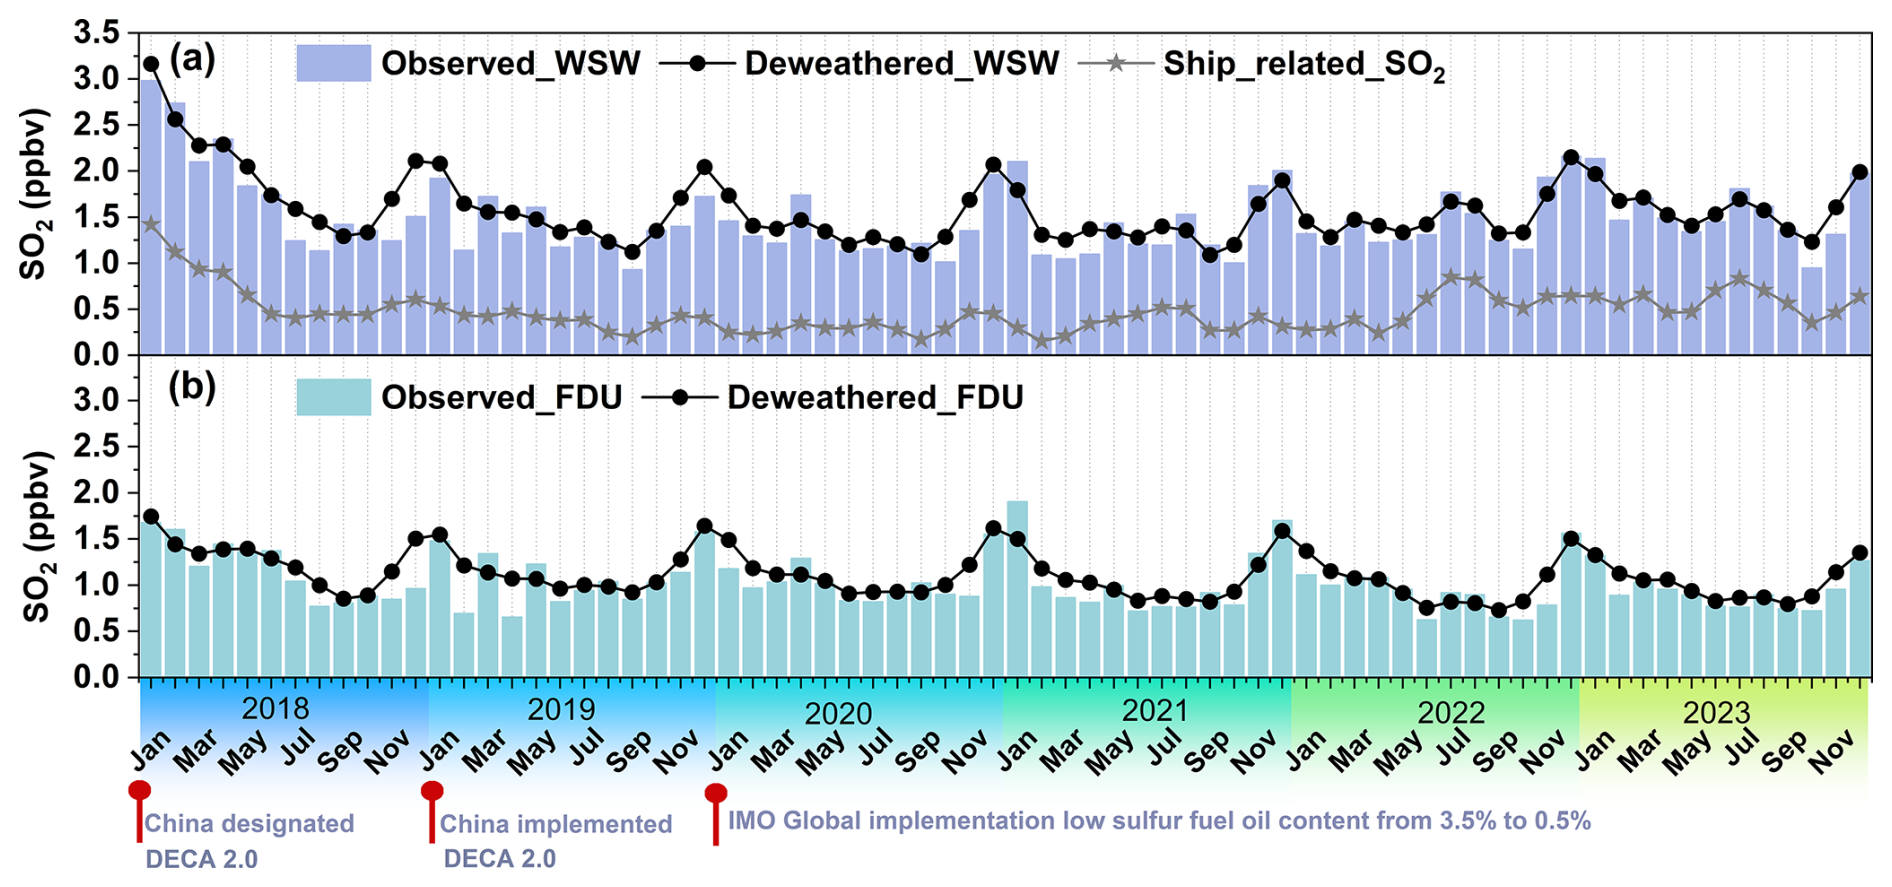
Figure 4Monthly Observed_SO2 concentrations based on DOAS and Deweathered_SO2 after weather normalization in WSW and FDU, and Ship_related_SO2 contributions during 2018–2023. (a) The light-purple bars represent the monthly average Observed_SO2 concentration at WSW; the solid black circles represent the deweathered SO2 concentration at WSW after removing meteorological influences. The gray stars indicate the monthly average contribution of Ship_related_SO2. (b) The light-blue bars represent the monthly average observed SO2 concentration at FDU; the solid black circles represent the Deweathered_SO2 concentration at FDU removing meteorological influences.
Figure 4 shows the observed monthly average SO2 concentrations at WSW and FDU from 2018 to 2023, as well as the results after removing meteorological influences. Table 1 presents their annual changes. Figure S9 displays their annual changes by a column chart. Influenced by the activities of ships using sulfur-containing fuels in the channel, the observed SO2 in WSW (Observed_WSW) was notably higher than the observed SO2 in FDU (Observed_FDU), with mean values of 1.49±1.25 and 1.03±0.88 ppbv, respectively. Owing to China's relentless efforts to improve air quality and reduce the use of sulfur-containing fuels, including initiatives such as the Air Pollution Prevention and Control Action Plan (2013–2017) and the Three-Year Action Plan to Fight Air Pollution (2018–2021) (Yue et al., 2020; Cai et al., 2017; Feng et al., 2019b), the Observed_FDU has decreased to relatively low levels and showed a continuous decline over the past 6 years, with a 19.0 % (0.22 ppbv) reduction from 2018 to 2023. Conversely, the Observed_WSW showed an annual trend of first decreasing by 26.11 % from 2018 to 2020, reaching their lowest point in 2020, and then gradually increasing by 16.5 % from 2020 to 2023. This trend before 2020 is consistent with previous studies (Luo et al., 2024). Both locations exhibit a pattern of slightly higher SO2 concentrations in winter and lower concentrations in summer, with fluctuations occurring mid-year. Emissions and meteorological conditions are the two primary factors influencing atmospheric pollutant levels (Zhao et al., 2020). Changes in SO2 emissions serve as the primary driving force. According to the Multi-resolution Emission Inventory for China (MEIC), residential and transportation sources of SO2 emissions in Shanghai are significantly higher in winter than in other seasons (Fig. S10), likely contributing to the elevated winter values. The transport and dispersion of SO2 from other sources under specific wind directions, such as emissions from power generation activities located far from the WSW and FDU sites, may account for the mid-year fluctuations in SO2 concentrations. We trained 50 ETR models on bootstrap samples of the training data for each site and computed the permutation importance (with 95 % confidence intervals) for each predictor variable. The result shows that “wind direction” became the most important variable for explaining SO2 variability at both sites (Fig. S11), which aligns with the findings of Grange and Carslaw (2019) at the port city of Dover in England. The higher degree of fluctuation at WSW compared to FDU can be attributed to the more irregular ship emissions at WSW. Figure S12 shows the overall increasing trend in the number of ships from 2018 to 2023, with irregular fluctuations within each year. In addition, a ship emission inventory based on AIS data was constructed, which further supports the interpretation of the variability observed at WSW (Sect. S5). Furthermore, the cold and dry winter monsoon reduces the rates of SO2 oxidation and wet deposition, resulting in a longer lifetime of SO2 molecules and thus easier accumulation. In contrast, during the summer, increased chemical reactivity and more effective wet removal processes lead to lower SO2 concentrations.
Table 1The annual concentration of Observed_WSW, Deweathered_WSW, Observed_FDU, Deweathered_FDU and Ship_related_SO2 from 2018 to 2023.
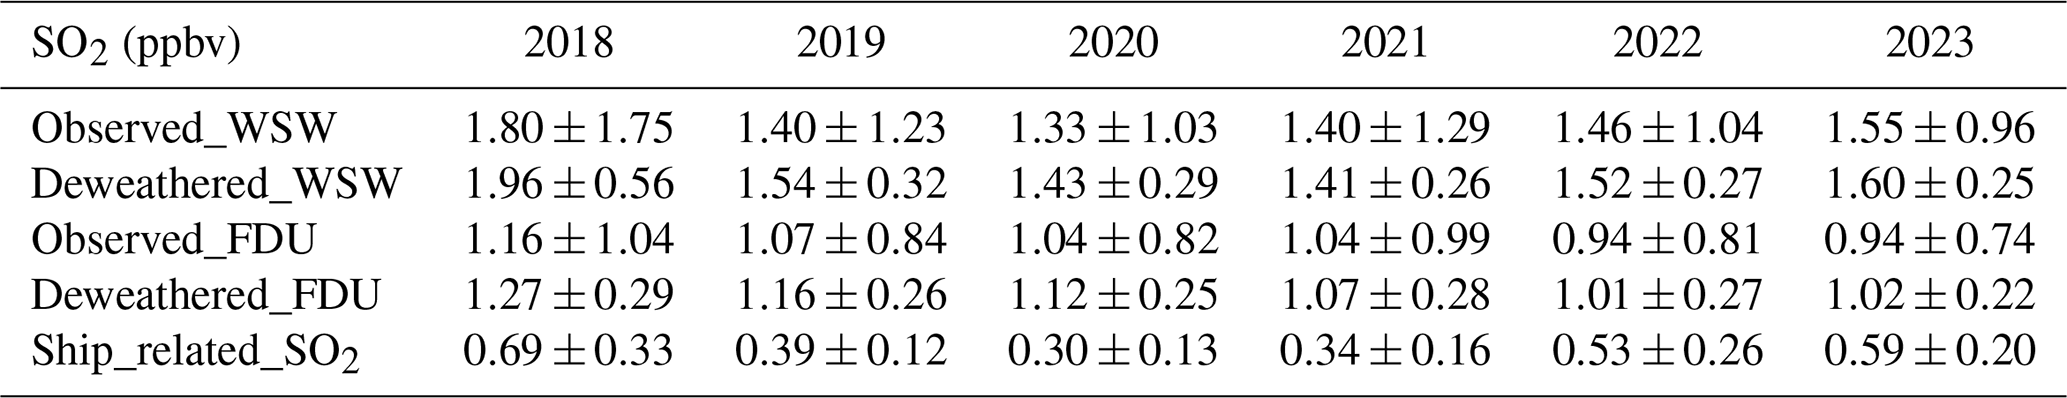
Meteorological factors affect the dispersion, transport, accumulation and chemical reactions of pollutants in the atmosphere. After normalizing for meteorological influences, the deweathered SO2 concentrations (Deweathered_WSW and Deweathered_FDU) represent a time series with meteorological variability removed. These deweathered values are overall higher than the observed concentrations. Deweathered_FDU shows a decreasing trend in 2022 followed by a stabilization in 2023, while Deweathered_WSW exhibits a decline since 2018 and an increase again in 2022 and 2023. Nonetheless, under certain conditions, high concentrations of pollutants can still be locally transported, leading to elevated pollution levels, such as in January 2021. The Deweathered_FDU data, which represent the baseline SO2 levels from terrestrial anthropogenic sources in urban Shanghai (mainly residential activities and ground transportation), showed a reduction of 16.7 % (0.25 ppbv) over the 6-year period. Due to the removal of meteorological dispersion effects, Deweathered_FDU exhibited a smoother U-shaped seasonal pattern, with lower concentrations in summer and higher concentrations in winter, consistent with previously observed trends in SO2 vertical column densities over the Yangtze River Delta derived from satellite data (Wang et al., 2018). In contrast, the Deweathered_WSW results, which reflect the combined impact of both terrestrial and maritime SO2 sources, retain some mid-year fluctuations. These fluctuations can be attributed to higher ship emissions during spring and summer (Fan et al., 2016; Jalkanen et al., 2009), as well as the influence of weather conditions, such as typhoons, which can restrict shipping activities.
The contribution of SO2 air pollution directly associated with shipping activities (Ship_related_SO2) can be quantified by subtracting the Deweathered_FDU values from the Deweathered_WSW values. Over the 6-year period, Ship_related_SO2 led to an average increase of 0.48±0.25 ppbv in atmospheric SO2 concentrations. Year-on-year reductions in Ship_related_SO2 were observed in 2019 and 2020, with declines of 43.47 % and 23.08 %, respectively. These reductions likely highlight the effectiveness of China's comprehensive low-sulfur policy within emission control areas, implemented on 1 January 2019, and the IMO global low-sulfur policy, enacted on 1 January 2020, in curbing SO2 emissions from shipping activities. From 2020 to 2023, Ship_related_SO2 exhibited an average annual growth rate of 19.50 %. This upward trend is plausibly attributable to the progressive increase in port throughput at Shanghai post-2020. The reasons behind these changes will be further discussed in Sect. 3.2.
In addition, the reduction in SO2 levels not only improves air quality but will also mitigate the formation of sulfate aerosols, which are known to contribute to respiratory diseases and climate change. This highlights the dual benefits of low-sulfur policies for public health and environmental sustainability. To sustain these reductions, stricter enforcement of low-sulfur fuel regulations and enhanced monitoring of ship activities are recommended. Additionally, expanding emission control areas to other high-traffic regions could further mitigate the impact of ship emissions on coastal air quality.
3.2 Variation of SO2-rich plumes in the channel
To further investigate whether the observed increase in SO2 concentrations in the shipping channel is attributable to the potential failure of low-sulfur policies, this study analyzes the frequency of SO2 signals captured in the channel from 2018 to 2023, as well as changes in baseline levels. This analysis was conducted by separating high-time-resolution DOAS observations using the Baseline Estimation and Denoising using Sparsity (BEADs) algorithm (Ning et al., 2014), as illustrated in Fig. 5 (which shows an example from 12 to 13 January 2018). The SO2-rich plumes emitted during the operation of ships burning high-sulfur fuel can serve as indicators of the fuel's sulfur content, with higher plume peaks generally corresponding to higher sulfur levels. In contrast, lower variation in the baseline reflects the slower-changing trend of environmental SO2, likely due to an increased proportion of low-emission vessels. All SO2-rich plumes were confirmed by AIS data to originate from ship activity (Sect. S4).
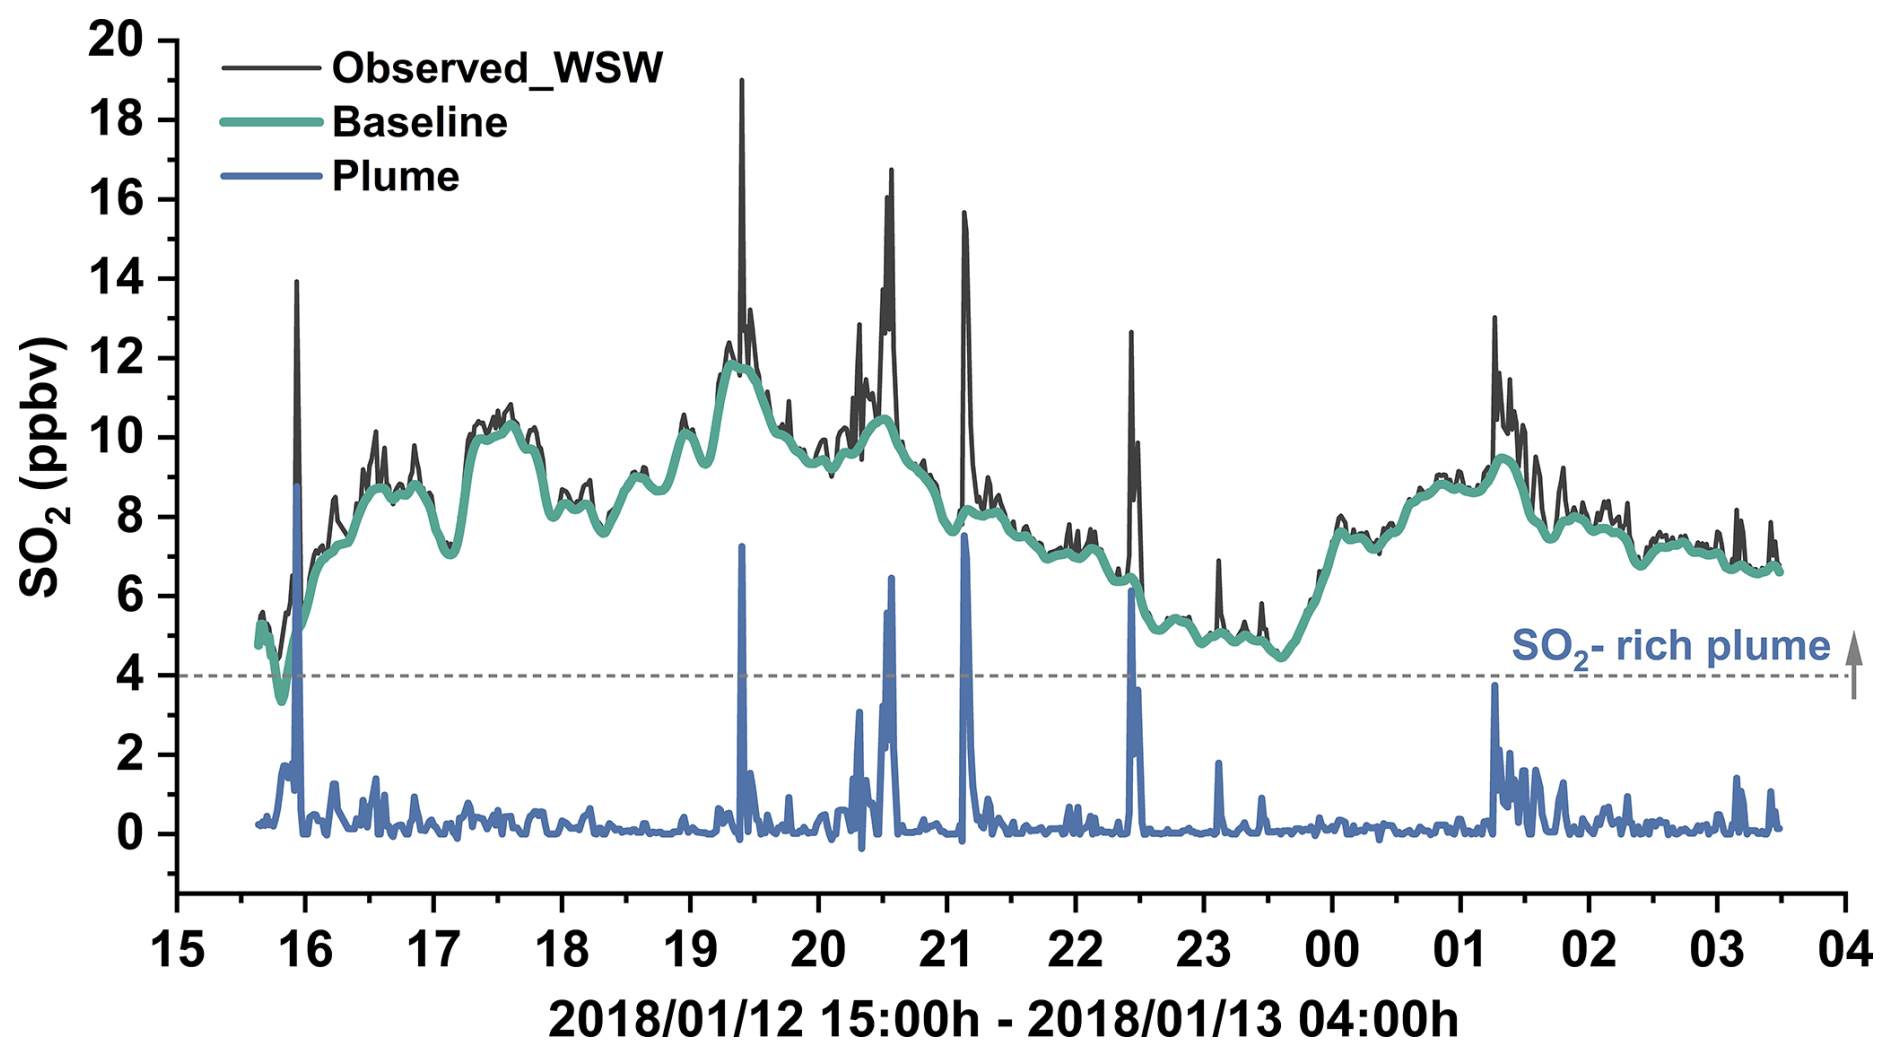
Figure 5Time series of baseline trends and SO2-rich plume signals separated from Observed_WSW using the BEADs algorithm. The black line represents the DOAS observed SO2 concentrations, the green line indicates the baseline and the blue line corresponds to the plume sequence extracted using the BEADs algorithm. The dashed line marks the threshold for identifying SO2-rich plumes.
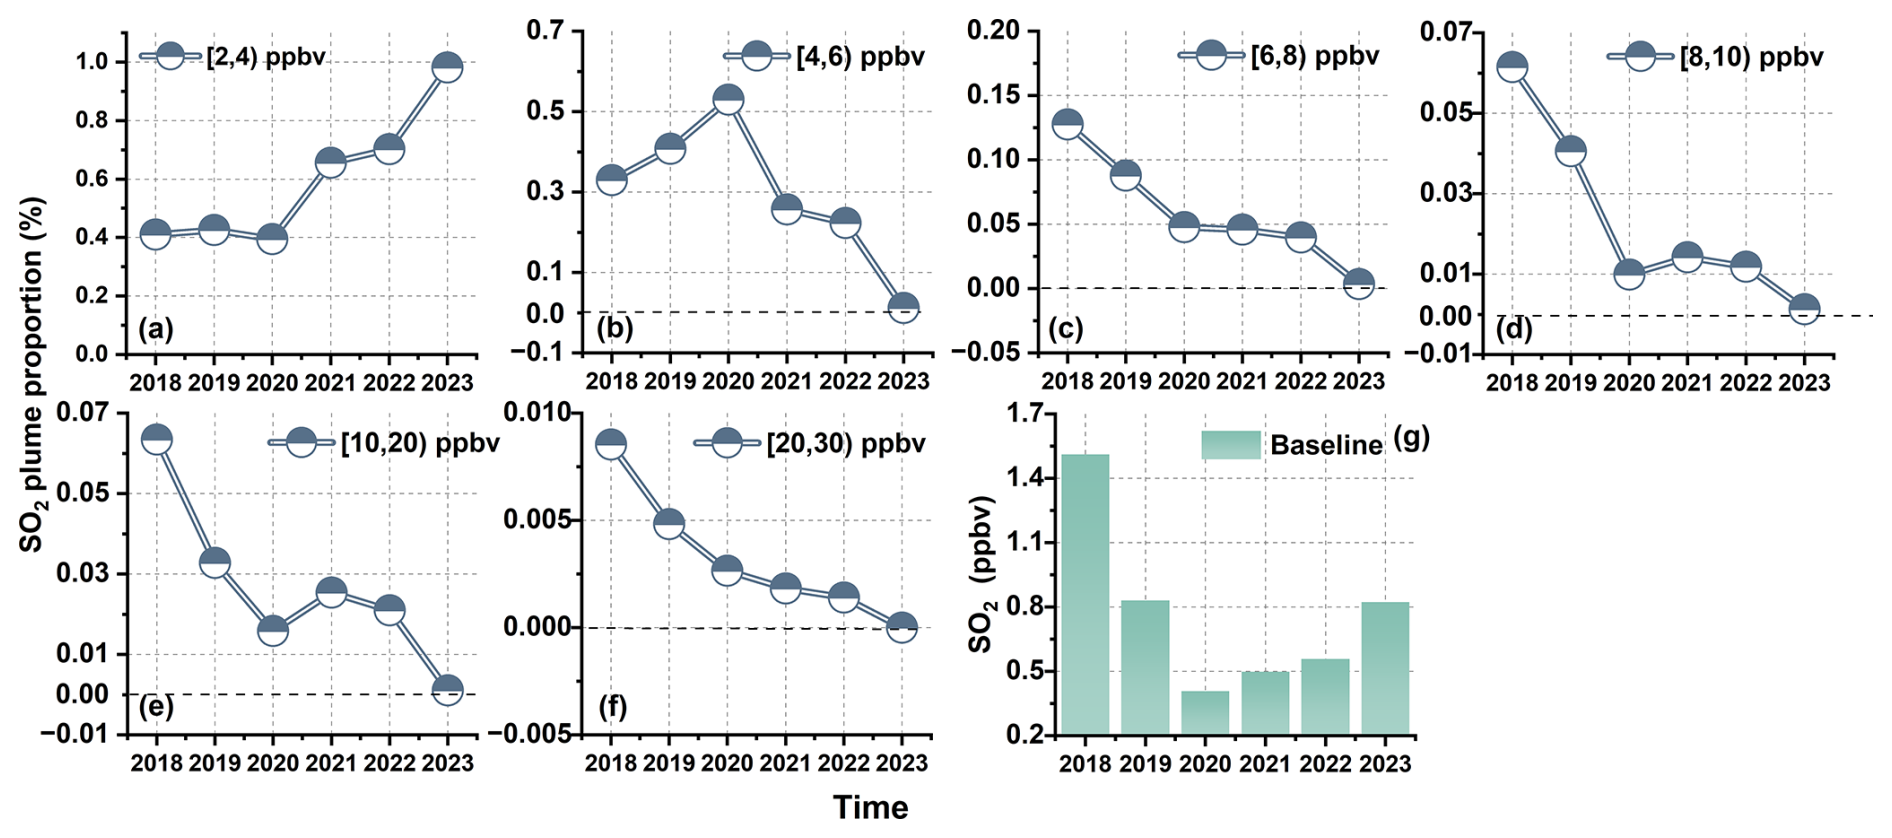
Figure 6Yearly variation in SO2 plume proportions and the baseline level from 2018 to 2023. (a–f) Number of SO2-rich plumes within different concentration ranges divided by the total valid spectra for each year. (g) Annual baseline concentrations of SO2 obtained through the BEADs algorithm.
Figure 6 illustrates the annual variation in the absolute frequency proportion of SO2-rich plume events, as well as changes in the baseline from 2018 to 2023. Here, SO2-rich plumes are classified into six concentration ranges: [2, 4), [4, 6), [6, 8), [8, 10), [10, 20) and [20, 30) ppbv, respectively. The peak frequency of SO2-rich plumes within the [6, 30) ppbv range exhibits a general declining trend year by year, while the numbers of major emission sources in the channel (cargo ships and passenger boats) exhibited a stable or growing trend from 2018 to 2023 (Fig. S12b). This demonstrates that the observed trends in SO2 emissions were not driven by changes in the scale or composition of the ship fleet (because emission sources were actually increasing) but rather by changes in the emission behavior of individual ships. These results indicate that low-sulfur policies have effectively reduced high-level SO2 emissions from ships overall – particularly in 2023, when the SO2 plumes exceeding 10 ppbv were nearly absent, despite gaps in observational data in certain years that caused fluctuations in the overall declining trend. In contrast, low SO2 plumes within the [4, 6) ppbv range show a fluctuating pattern, gradually increasing before 2020 and then declining with some variations during the policy stabilization phase. This trend may reflect the transitional effect of policy implementation: during the policy adjustment phase from 2018 to 2020, high SO2 emissions began to decrease, but many pollution sources were not fully eliminated. Some ships may have started using fuels with slightly lower sulfur content, which led to an increase in the frequency of low SO2 plumes. The adoption of low-sulfur fuels was the most common choice during this period, as it required little or no modification of existing engine systems (Vedachalam et al., 2022; Slaughter et al., 2020). In contrast, due to the high retrofitting costs of engine systems and the limited number of ships using LNG, most ports currently do not provide bunkering facilities for LNG and other alternative fuels, including biofuels (Vedachalam et al., 2022). Although scrubbers allowed the continued use of high-sulfur fuels, their application was constrained by high installation costs, long retrofitting times (up to 9 months) (Slaughter et al., 2020) and concerns about secondary environmental impacts from waste discharges (Hassellöv et al., 2013; Claremar et al., 2017; Thor et al., 2021). Only 3000 / 60 000 vessels have been retrofitted with a scrubber system, as reported by Slaughter et al. (2020). As policies were more strictly enforced after 2020, the frequency of low SO2 plume emissions also started to decline, reflecting the impact of comprehensive control measures.
The baseline was highest in 2018 and subsequently exhibited a declining trend from 2018 to 2021, followed by an increase from 2021 to 2023, consistent with the variation in Ship_related_SO2 observed in Sect. 3.1. During the policy adjustment period from 2018 to 2020, ships gradually reduced the sulfur content in their fuel, which led to an overall decrease in environmental SO2, offsetting the increase in SO2 emissions caused by the growing number of shipping activities. Starting in 2021, as policy implementation stabilized, the rise in the baseline was mainly attributed to the increased intensity of shipping operations. Therefore, we also analyzed the occurrence of low-concentration SO2 plumes in the [2–4) ppbv range. These weaker plumes showed a clear increasing trend from 2021 to 2023, suggesting that the observed rise in baseline SO2 was not driven by high-emission ships but rather by the cumulative contribution of numerous compliant vessels emitting smaller amounts of SO2. The growing frequency of such plumes highlights how large-scale, compliant shipping activity can still elevate ambient SO2 levels, especially when vessel density increases significantly.
Based on the combined results from Sect. 3.1 and 3.2, it is likely that the observed increase in ambient SO2 concentrations over the shipping channel after 2020 was primarily driven by increased shipping activity. However, throughout the 6 years of observation, we consistently found signals suggesting the use of illegal fuel by ships (especially during the policy adjustment phase from 2018 to 2020). Given the expected continued growth in maritime activities, further reducing the sulfur content in marine fuels will be crucial to preventing Ship_related_SO2 emissions from impacting air quality in coastal cities and potentially offsetting the land-based SO2 reduction efforts already achieved. To address this, real-time monitoring systems, such as the DOAS-based approach developed in this study, could be integrated into port inspection protocols to identify and penalize non-compliant vessels more effectively. The methodology developed here provides a scalable framework for monitoring ship emissions in other coastal regions, enabling policymakers to better assess the effectiveness of low-sulfur policies and identify areas for improvement.
3.3 Ship type contributions to SO2-rich plumes
To determine which ships were potentially using non-compliant fuel, those SO2-rich plumes identified in Sect. 3.2 were matched with ship information from AIS data. Given the high traffic density in the channel, multiple ships could be passing through the light path when a SO2-rich plume was detected; therefore, two matching datasets were established as illustrated in Fig. 7: the Unique-Matching dataset, which includes only those plumes where a single ship was present near the light path at the plume peak moment, and the Fastest-Matching dataset, which considers all plumes with identifiable concurrent ship activities and matches them with the ship that had the shortest time consumption when crossing the light path (indicating a higher likelihood of being the source). Approximately 30 % of the plumes satisfied the strict criteria of the Unique-Matching dataset, emphasizing accuracy in source identification. In contrast, the Fastest-Matching dataset, while sacrificing some precision, provides a more comprehensive statistical representation of SO2-rich plumes.
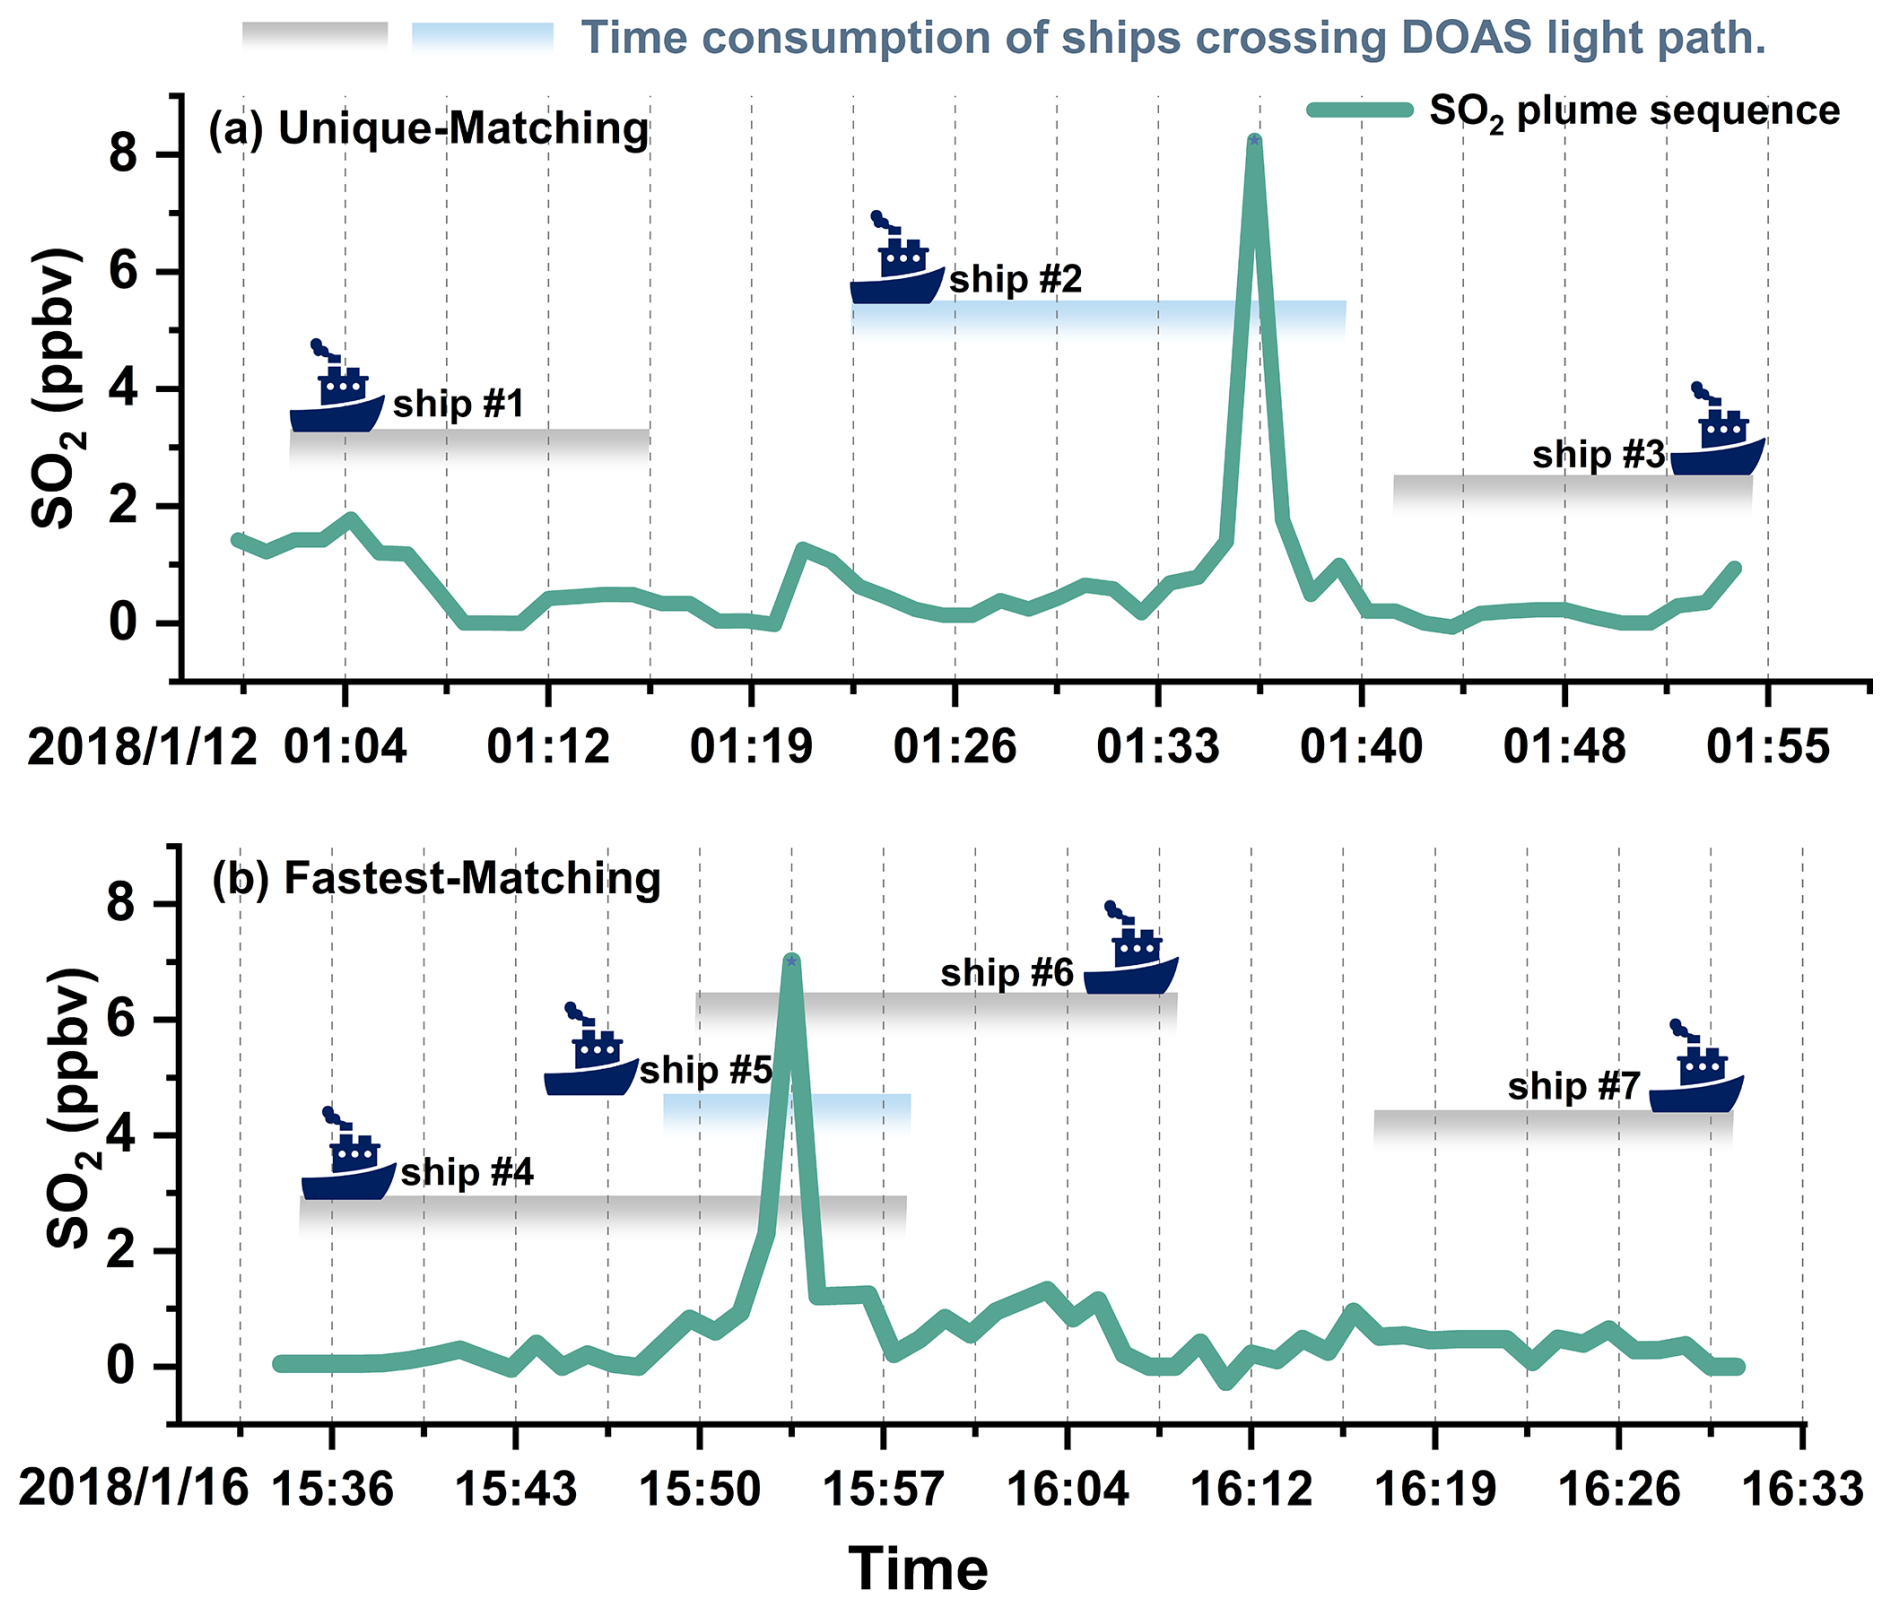
Figure 7Illustration of two matching datasets for associating SO2-rich plumes with AIS ship activities: (a) Unique-Matching, where only plumes observed during the passage of a single ship (ship #2) near the DOAS light path are considered, and (b) Fastest-Matching, where plumes are matched to the ship (ship #5) with the shortest crossing time.
Figure 8 illustrates the proportional contributions of various ship types to different SO2 peak value ranges within the Unique-Matching datasets during two distinct policy periods. During 2018–2020 in Fig. 8a, cargo ships dominated the contribution to SO2 emissions across all peak value ranges, with proportions increasing from 56 % in the >4 ppbv range to 80 % in the >20 ppbv range. Passenger boats were the second-largest contributors, accounting for 29 %–31 % in lower peak value ranges but decreasing as peak values increased. The contributions of oil tankers, fishing boats and harbor ships were relatively small and remain stable across all ranges. During 2021–2023 in Fig. 8b, cargo ships remained the primary contributors, with a slight decrease in dominance compared to 2018–2020, ranging from 55 % in the >4 ppbv range to 60 % in the >20 ppbv range. Although the proportion of peaks contributed by certain ship types increased, such as passenger boats and harbor ships, the total peak occurrences for all ships significantly decreased during the policy stabilization period. At this stage, the distribution of ship types remained consistent regardless of changes in the SO2 plume concentrations. The same trend can be seen in the Fastest-Matching dataset in Fig. S14. All results indicate that from 2018 to 2023, cargo ships consistently dominated SO2 emissions under both matching datasets, particularly at higher plume value ranges. This suggests that greater emphasis should be placed on inspecting cargo ships for compliance with fuel standards during future port supervision and enforcement efforts. Moreover, these non-compliant ship activities may have contributed to inaccuracies in bottom-up ship emission inventories based on AIS data during the 2018–2020 period (a comparison between observational data and AIS-based ship emission inventory is provided in Sect. S5).
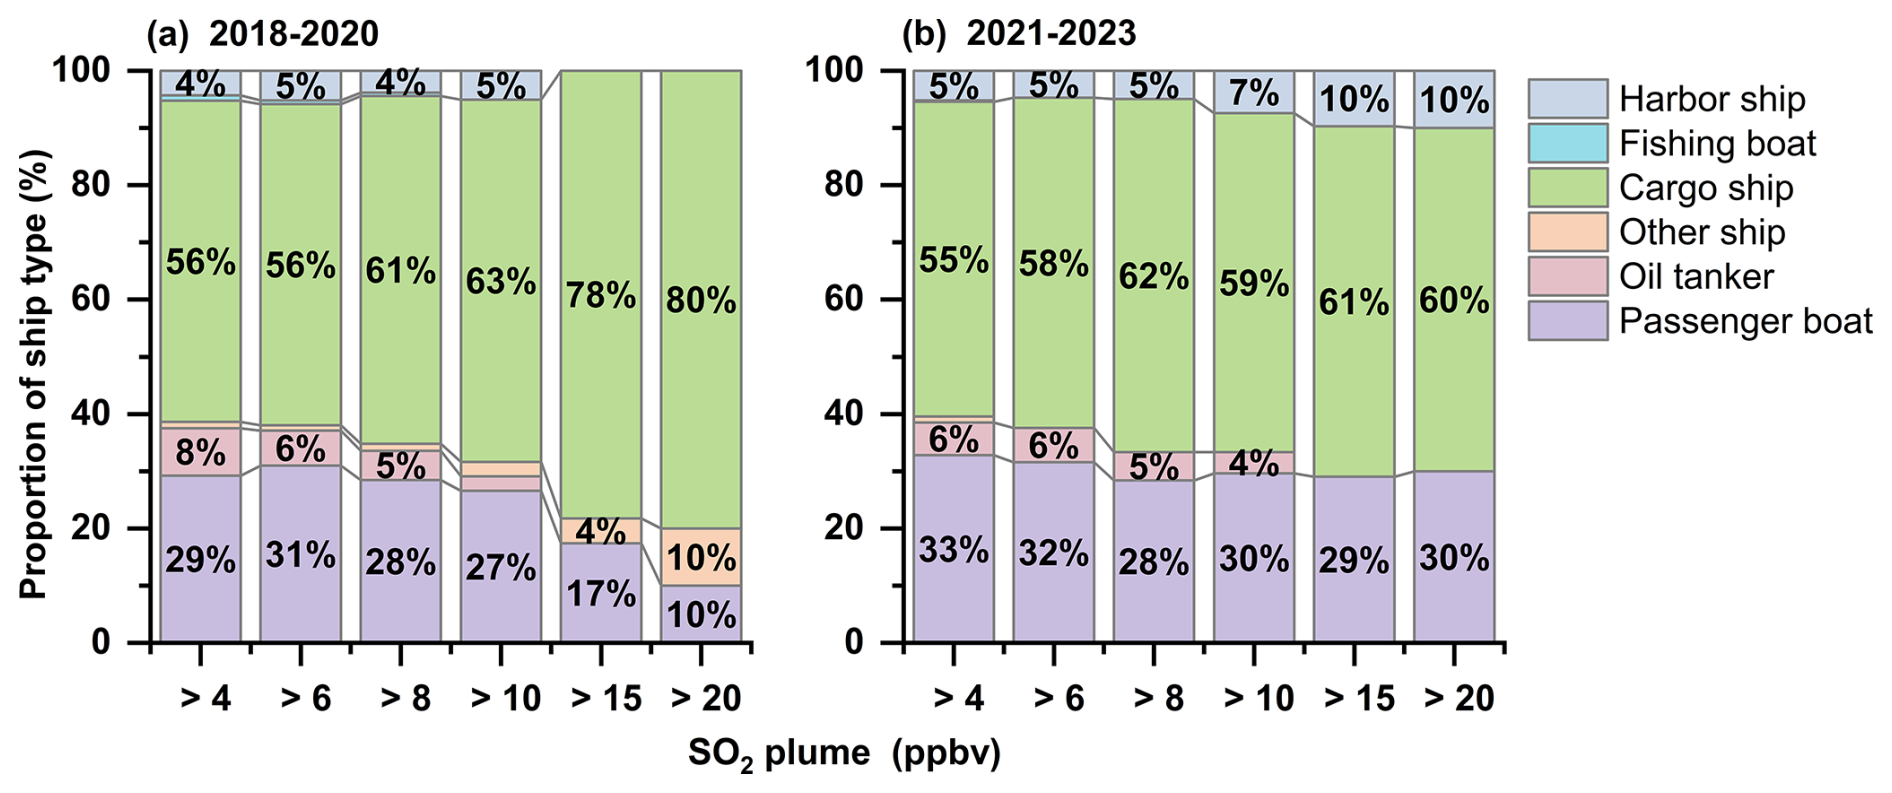
Figure 8Proportional distribution of Unique-Matching ship types corresponding to different peak SO2 values during (a) the policy adjustment period (2018–2020) and (b) the policy stabilization period (2021–2023). The ship types include harbor ships, fishing boats, cargo ships, passenger boats, oil tankers and other ships.
This study provides a comprehensive 6-year dataset on ship-related SO2 emissions in the Shanghai shipping channel from 2018 to 2023, using continuous observations with differential optical absorption spectroscopy (DOAS) and machine learning techniques. The results indicate a marked decrease in urban SO2 concentrations, reflecting the success of China's emission reduction policies. However, at the shipping channel, SO2 levels initially decreased from 2018 to 2020 due to the low-sulfur policy but began to rise again from 2020 to 2023, driven by increased shipping activities. This underscores the need for stricter sulfur content regulations and better enforcement, particularly for non-compliant cargo ships, which were identified as key contributors to SO2-rich plumes.
The study's findings highlight two important considerations for global policymakers: first, the success of low-sulfur policies in reducing emissions during the 2018–2020 phase offers valuable insights for other coastal nations, particularly those with rapidly growing maritime traffic. Second, the detection of non-compliant ships stresses the importance of enhancing real-time monitoring technologies.
The DOAS-based methodology employed here, which effectively separates ship emissions from meteorological and urban background influences, offers a scalable and cost-effective tool for port authorities worldwide. However, when expanding this framework to other regions with varying maritime traffic densities and regulatory contexts, or when applying it to monitor additional pollutants such as NOx and PM2.5, it is imperative to acknowledge several methodological limitations. These include potential biases from the single-site background subtraction method, dependencies on meteorological reanalysis data in the Deweathered model, and uncertainties arising from vertical sampling geometry due to tidal variations and stack heights (Sect. S7). Although these systematic uncertainties do not substantially impact the conclusions supported by the large-sample data, they indicate that more precise data – such as using image recognition to determine specific ship activity and stack characteristics – would be necessary for finer-scale studies, such as quantifying emissions from individual ships. These factors should be carefully considered in future applications.
The code and data used for our analyses are available at https://doi.org/10.17632/dvc97wxbcz.1 (Liu, 2025).
The supplement related to this article is available online at https://doi.org/10.5194/acp-25-13849-2025-supplement.
JL conceived and designed the research. SW, BZ and YZ guided and supervised the research. SZ and YY guided the model construction. ZH provided the AIS data. All authors participated in the discussion and interpretation of the data.
The contact author has declared that none of the authors has any competing interests.
Publisher's note: Copernicus Publications remains neutral with regard to jurisdictional claims made in the text, published maps, institutional affiliations, or any other geographical representation in this paper. While Copernicus Publications makes every effort to include appropriate place names, the final responsibility lies with the authors. Views expressed in the text are those of the authors and do not necessarily reflect the views of the publisher.
This research has been supported by the National Natural Science Foundation of China (grant numbers 22376030, 22176037, 42375089 and 42077195). We would like to thank the Wusong Maritime Safety Bureau of Shanghai for the coordination of field measurements.
This research has been supported by the National Natural Science Foundation of China (grant nos. 22376030, 22176037, 42375089 and 42077195).
This paper was edited by Andreas Richter and reviewed by two anonymous referees.
Ahmed, S., Li, T., Zhou, X. Y., Yi, P., Chen, R.: Quantifying the environmental footprints of biofuels for sustainable passenger ship operations, Renew. Sustain. Energ. Rev., 207, 114919, https://doi.org/10.1016/j.rser.2024.114919, 2025.
Andreasen, A. and Mayer, S.: Use of Seawater Scrubbing for SO2 Removal from Marine Engine Exhaust Gas, Energy Fuels, 21, 3274–3279, https://doi.org/10.1021/ef700359w, 2007.
Attah, E. E. and Bucknall, R.: An analysis of the energy efficiency of LNG ships powering options using the EEDI, Ocean Eng., 110, 62–74, https://doi.org/10.1016/j.oceaneng.2015.09.040, 2015.
Cai, S., Wang, Y., Zhao, B., Wang, S., Chang, X., and Hao, J.: The impact of the “Air Pollution Prevention and Control Action Plan” on PM2.5 concentrations in Jing-Jin-Ji region during 2012–2020, Sci. Total Environ., 580, 197–209, https://doi.org/10.1016/j.scitotenv.2016.11.188, 2017.
Carn, S. A., Clarisse, L., and Prata, A. J.: Multi-decadal satellite measurements of global volcanic degassing, J. Volcanol. Geoth. Res., 311, 99–134, https://doi.org/10.1016/j.jvolgeores.2016.01.002, 2016.
Ceballos-Santos, S., González-Pardo, J., Carslaw, D. C., Santurtún, A., Santibáñez, M., and Fernández-Olmo, I.: Meteorological Normalisation Using Boosted Regression Trees to Estimate the Impact of COVID-19 Restrictions on Air Quality Levels, Int. J. Environ. Res. Publ. Health, 18, https://doi.org/10.3390/ijerph182413347, 2021.
Cesilla de Souza, L. and Eugênio Abel Seabra, J.: Technical-economic and environmental assessment of marine biofuels produced in Brazil, Clean. Environ. Syst., 13, 100195, https://doi.org/10.1016/j.cesys.2024.100195, 2024.
Cheng, Y., Wang, S., Zhu, J., Guo, Y., Zhang, R., Liu, Y., Zhang, Y., Yu, Q., Ma, W., and Zhou, B.: Surveillance of SO2 and NO2 from ship emissions by MAX-DOAS measurements and the implications regarding fuel sulfur content compliance, Atmos. Chem. Phys., 19, 13611–13626, https://doi.org/10.5194/acp-19-13611-2019, 2019.
Claremar, B., Haglund, K., and Rutgersson, A.: Ship emissions and the use of current air cleaning technology: contributions to air pollution and acidification in the Baltic Sea, Earth Syst. Dynam., 8, 901–919, https://doi.org/10.5194/esd-8-901-2017, 2017.
Ducruet, C. and Wang, L.: China's Global Shipping Connectivity: Internal and External Dynamics in the Contemporary Era (1890–2016), Chin. Geogr. Sci., 28, 202–216, https://doi.org/10.1007/s11769-018-0942-x, 2018.
Eger, P., Mathes, T., Zavarsky, A., and Duester, L.: Measurement report: Inland ship emissions and their contribution to NOx and ultrafine particle concentrations at the Rhine, Atmos. Chem. Phys., 23, 8769–8788, https://doi.org/10.5194/acp-23-8769-2023, 2023.
Fan, Q., Zhang, Y., Ma, W., Ma, H., Feng, J., Yu, Q., Yang, X., Ng, S. K. W., Fu, Q., and Chen, L.: Spatial and Seasonal Dynamics of Ship Emissions over the Yangtze River Delta and East China Sea and Their Potential Environmental Influence, Environ. Sci. Technol., 50, 1322–1329, https://doi.org/10.1021/acs.est.5b03965, 2016.
Feng, J., Zhang, Y., Li, S., Mao, J., Patton, A. P., Zhou, Y., Ma, W., Liu, C., Kan, H., Huang, C., An, J., Li, L., Shen, Y., Fu, Q., Wang, X., Liu, J., Wang, S., Ding, D., Cheng, J., Ge, W., Zhu, H., and Walker, K.: The influence of spatiality on shipping emissions, air quality and potential human exposure in the Yangtze River Delta/Shanghai, China, Atmos. Chem. Phys., 19, 6167–6183, https://doi.org/10.5194/acp-19-6167-2019, 2019a.
Feng, X., Ma, Y., Lin, H., Fu, T.-M., Zhang, Y., Wang, X., Zhang, A., Yuan, Y., Han, Z., Mao, J., Wang, D., Zhu, L., Wu, Y., Li, Y., and Yang, X.: Impacts of Ship Emissions on Air Quality in Southern China: Opportunistic Insights from the Abrupt Emission Changes in Early 2020, Environ. Sci. Technol., 57, 16999–17010, https://doi.org/10.1021/acs.est.3c04155, 2023.
Feng, Y., Ning, M., Lei, Y., Sun, Y., Liu, W., and Wang, J.: Defending blue sky in China: Effectiveness of the “Air Pollution Prevention and Control Action Plan” on air quality improvements from 2013 to 2017, J. Environ. Manage., 252, 109603, https://doi.org/10.1016/j.jenvman.2019.109603, 2019b.
Fossum, K. N., Lin, C., O'Sullivan, N., Lei, L., Hellebust, S., Ceburnis, D., Afzal, A., Tremper, A., Green, D., Jain, S., Byčenkienė, S., O'Dowd, C., Wenger, J., and Ovadnevaite, J.: Two distinct ship emission profiles for organic-sulfate source apportionment of PM in sulfur emission control areas, Atmos. Chem. Phys., 24, 10815–10831, https://doi.org/10.5194/acp-24-10815-2024, 2024.
Friedman, J. H.: Stochastic gradient boosting, Comput. Stat. Data Anal., 38, 367–378, https://doi.org/10.1016/S0167-9473(01)00065-2, 2002.
Gall, J., Yao, A., Razavi, N., Gool, L. V., and Lempitsky, V.: Hough Forests for Object Detection, Tracking, and Action Recognition, IEEE T. Pattern Anal. Mach. Intel., 33, 2188–2202, https://doi.org/10.1109/TPAMI.2011.70, 2011.
Ghanbari Ghozikali, M., Heibati, B., Naddafi, K., Kloog, I., Oliveri Conti, G., Polosa, R., and Ferrante, M.: Evaluation of Chronic Obstructive Pulmonary Disease (COPD) attributed to atmospheric O3, NO2, and SO2 using Air Q Model (2011–2012 year), Environ. Res., 144, 99–105, https://doi.org/10.1016/j.envres.2015.10.030, 2016.
Grange, S. K. and Carslaw, D. C.: Using meteorological normalisation to detect interventions in air quality time series, Sci. Total Environ., 653, 578–588, https://doi.org/10.1016/j.scitotenv.2018.10.344, 2019.
Grange, S. K., Carslaw, D. C., Lewis, A. C., Boleti, E., and Hueglin, C.: Random forest meteorological normalisation models for Swiss PM10 trend analysis, Atmos. Chem. Phys., 18, 6223–6239, https://doi.org/10.5194/acp-18-6223-2018, 2018.
Gu, C., Wang, S., Zhu, J., Wu, S., Duan, Y., Gao, S., and Zhou, B.: Investigation on the urban ambient isoprene and its oxidation processes, Atmos. Environ., 270, 118870, https://doi.org/10.1016/j.atmosenv.2021.118870, 2022.
Guo, Y., Wang, S., Gao, S., Zhang, R., Zhu, J., and Zhou, B.: Influence of ship direct emission on HONO sources in channel environment, Atmos. Environ., 242, 117819, https://doi.org/10.1016/j.atmosenv.2020.117819, 2020.
Hassellöv, I.-M., Turner, D. R., Lauer, A., and Corbett, J. J.: Shipping contributes to ocean acidification, Geophys. Res. Lett., 40, 2731–2736, https://doi.org/10.1002/grl.50521, 2013.
Hersbach, H., Bell, B., Berrisford, P., Hirahara, S., Horányi, A., Muñoz Sabater, J., Nicolas, J., Peubey, C., Radu, R., Schepers, D., Simmons, A., Soci, C., Abdalla, S., Abellan, X., Balsamo, G., Bechtold, P., Biavati, G., Bidlot, J., Bonavita, M., and Thépaut, J. N.: The ERA5 global reanalysis, Q. J. Roy. Meteorol. Soc., 146, https://doi.org/10.1002/qj.3803, 2020.
Jalkanen, J. P., Brink, A., Kalli, J., Pettersson, H., Kukkonen, J., and Stipa, T.: A modelling system for the exhaust emissions of marine traffic and its application in the Baltic Sea area, Atmos. Chem. Phys., 9, 9209–9223, https://doi.org/10.5194/acp-9-9209-2009, 2009.
Kattner, L., Mathieu-Üffing, B., Burrows, J. P., Richter, A., Schmolke, S., Seyler, A., and Wittrock, F.: Monitoring compliance with sulfur content regulations of shipping fuel by in situ measurements of ship emissions, Atmos. Chem. Phys., 15, 10087–10092, https://doi.org/10.5194/acp-15-10087-2015, 2015.
Krause, K., Wittrock, F., Richter, A., Schmitt, S., Pöhler, D., Weigelt, A., and Burrows, J. P.: Estimation of ship emission rates at a major shipping lane by long-path DOAS measurements, Atmos. Meas. Tech., 14, 5791–5807, https://doi.org/10.5194/amt-14-5791-2021, 2021.
Kuttippurath, J.: Improvements in SO2 pollution in India: role of technology and environmental regulations, Environ. Sci. Pollut. Res., 29, 78637–78649, https://doi.org/10.1007/s11356-022-21319-2, 2022.
Li, J., Wang, S., Yang, T., Zhang, S., Zhu, J., Xue, R., Liu, J., Li, X., Ge, Y., and Zhou, B.: Investigating the causes and reduction approaches of nocturnal ozone increase events over Tai'an in the North China Plain, Atmos. Res., 307, 107499, https://doi.org/10.1016/j.atmosres.2024.107499, 2024.
Li, S., Zhang, Y., Zhao, J., Sarwar, G., Zhou, S., Chen, Y., Yang, G., and Saiz-Lopez, A.: Regional and Urban-Scale Environmental Influences of Oceanic DMS Emissions over Coastal China Seas, Atmosphere, 11, 849, https://doi.org/10.3390/atmos11080849, 2020.
Liu, J.: Measurement report: Six-year DOAS observations reveal post-2020 rebound of ship SO2 emissions in Shanghai Port despite low-sulfur fuel regulations (V1), Mendeley [data set], https://doi.org/10.17632/dvc97wxbcz.1, 2025.
Liu, J., Wang, S., Zhang, Y., Yan, Y., Zhu, J., Zhang, S., Wang, T., Tan, Y., and Zhou, B.: Investigation of formaldehyde sources and its relative emission intensity in shipping channel environment, J. Environ. Sci., 142, 142–154, https://doi.org/10.1016/j.jes.2023.06.020, 2024.
Liu, Z., Lu, X., Feng, J., Fan, Q., Zhang, Y., and Yang, X.: Influence of Ship Emissions on Urban Air Quality: A Comprehensive Study Using Highly Time-Resolved Online Measurements and Numerical Simulation in Shanghai, Environ. Sci. Technol., 51, 202–211, https://doi.org/10.1021/acs.est.6b03834, 2017.
Lou, L., Li, J., and Zhong, S.: Sulfur dioxide (SO2) emission reduction and its spatial spillover effect in high-tech industries: based on panel data from 30 provinces in China, Environ. Sci. Pollut. Res., 28, 31340–31357, https://doi.org/10.1007/s11356-021-12755-7, 2021.
Lunde Hermansson, A., Hassellöv, I.-M., Grönholm, T., Jalkanen, J.-P., Fridell, E., Parsmo, R., Hassellöv, J., and Ytreberg, E.: Strong economic incentives of ship scrubbers promoting pollution, Nat. Sustainabil., 7, 812–822, https://doi.org/10.1038/s41893-024-01347-1, 2024.
Luo, Z., Lv, Z., Zhao, J., Sun, H., He, T., Yi, W., Zhang, Z., He, K., and Liu, H.: Shipping-related pollution decreased but mortality increased in Chinese port cities, Nat. Cities, 1, 295–304, https://doi.org/10.1038/s44284-024-00050-8, 2024.
Marshall, G.: An examination of the precipitation regime at Thurston Island, Antarctica, from ECMWF Re-Analysis data, Int. J. Climatol., 20, 255–277, https://doi.org/10.1002/(SICI)1097-0088(20000315)20:3<255::AID-JOC466>3.0.CO;2-M, 2000.
Meyer, A. and Pac, G.: Analyzing the characteristics of plants choosing to opt-out of the Large Combustion Plant Directive, Utilities Policy, 45, 61–68, https://doi.org/10.1016/j.jup.2017.02.001, 2017.
Miller, B. G.: 8 – Coal-Fired Emissions and Legislative Action, in: Clean Coal Engineering Technology, edited by: Miller, B. G., Butterworth-Heinemann, Boston, 301–374, https://doi.org/10.1016/B978-1-85617-710-8.00008-X, 2011.
Mohiuddin, K., Akram, M. N., Islam, M. M., Shormi, M. E., and Wang, X.: Exploring the trends of research: a bibliometric analysis of global ship emission estimation practices, J. Ocean Eng. Mar. Energ., https://doi.org/10.1007/s40722-024-00341-1, 2024.
Moran, M. D.: Application of a Comprehensive Acid Deposition Model in Support of Acid Rain Abatement in Canada, Air Pollution Modeling and Its Application XVII, Springer, Boston, MA, 109–118, https://doi.org/10.1007/978-0-387-68854-1_13, 2007.
Ning, X., Selesnick, I. W., and Duval, L.: Chromatogram baseline estimation and denoising using sparsity (BEADS), Chemometr. Intel. Labor. Syst., 139, 156–167, https://doi.org/10.1016/j.chemolab.2014.09.014, 2014.
Pan, B.: Application of XGBoost algorithm in hourly PM2.5 concentration prediction, IOP Conf. Ser.: Earth Environ. Sci., 113, 012127, https://doi.org/10.1088/1755-1315/113/1/012127, 2018.
Pavlenko, N., Comer, B., Zhou, Y., Clark, N., and Rutherford, D.: The climate implications of using LNG as a marine fuel, Swedish Environmental Protection Agency, Stockholm, https://theicct.org/sites/default/files/publications/Climate_implications_LNG_marinefuel_01282020.pdf (last access: 1 June 2025), 2020.
Shi, J., Zhu, Y., Feng, Y., Yang, J., and Xia, C.: A prompt decarbonization pathway for shipping: green hydrogen, ammonia, and methanol production and utilization in marine engines, Atmosphere, 14, 584, https://doi.org/10.3390/atmos14030584, 2023.
Slaughter, A., Ray, S., and Shattuck, T.: International Maritime Organization (IMO) 2020 strategies in a non-compliant world, International Maritime Organization (IMO), https://globalmaritimehub.com/wp-content/uploads/2020/01/international-maritime-organization-pov-2020.pdf (last access: 1 June 2025), 2020.
Squizzato, S., Masiol, M., Rich, D. Q., and Hopke, P. K.: A long-term source apportionment of PM2.5 in New York State during 2005–2016, Atmos. Environ., 192, 35–47, https://doi.org/10.1016/j.atmosenv.2018.08.044, 2018.
Svanberg, M., Ellis, J., Lundgren, J., and Landälv, I.: Renewable methanol as a fuel for the shipping industry, Renew. Sustain. Energ. Rev., 94, 1217–1228, https://doi.org/10.1016/j.rser.2018.06.058, 2018.
Thor, P., Granberg, M. E., Winnes, H., and Magnusson, K.: Severe Toxic Effects on Pelagic Copepods from Maritime Exhaust Gas Scrubber Effluents, Environ. Sci. Technol., 55, 5826–5835, https://doi.org/10.1021/acs.est.0c07805, 2021.
Tu, E., Zhang, G., Rachmawati, L., Rajabally, E., and Huang, G. B.: Exploiting AIS Data for Intelligent Maritime Navigation: A Comprehensive Survey From Data to Methodology, IEEE T. Intel. Transport. Syst., 19, 1559–1582, https://doi.org/10.1109/TITS.2017.2724551, 2018.
Van Aardenne, J. A., Dentener, F. J., Olivier, J. G. J., Goldewijk, C. G. M. K., and Lelieveld, J.: A 1°×1° resolution data set of historical anthropogenic trace gas emissions for the period 1890–1990, Global Biogeochem. Cy., 15, 909–928, https://doi.org/10.1029/2000GB001265, 2001.
Vedachalam, S., Baquerizo, N., and Dalai, A. K.: Review on impacts of low sulfur regulations on marine fuels and compliance options, Fuel, 310, 122243, https://doi.org/10.1016/j.fuel.2021.122243, 2022.
Viana, M., Hammingh, P., Colette, A., Querol, X., Degraeuwe, B., Vlieger, I. D., and van Aardenne, J.: Impact of maritime transport emissions on coastal air quality in Europe, Atmosp. Environ., 90, 96–105, https://doi.org/10.1016/j.atmosenv.2014.03.046, 2014.
von Nieding, G.: Possible mutagenic properties and carcinogenic action of the irritant gaseous pollutants NO2, O3, and SO2, Environ. Health Perspect., 22, 91–92, https://doi.org/10.1289/ehp.782291, 1978.
Vu, T. V., Shi, Z., Cheng, J., Zhang, Q., He, K., Wang, S., and Harrison, R. M.: Assessing the impact of clean air action on air quality trends in Beijing using a machine learning technique, Atmos. Chem. Phys., 19, 11303–11314, https://doi.org/10.5194/acp-19-11303-2019, 2019.
Wang, T., Wang, P., Theys, N., Tong, D., Hendrick, F., Zhang, Q., and Van Roozendael, M.: Spatial and temporal changes in SO2 regimes over China in the recent decade and the driving mechanism, Atmos. Chem. Phys., 18, 18063–18078, https://doi.org/10.5194/acp-18-18063-2018, 2018.
Wang, X., Shen, Y., Lin, Y., Pan, J., Zhang, Y., Louie, P. K. K., Li, M., and Fu, Q.: Atmospheric pollution from ships and its impact on local air quality at a port site in Shanghai, Atmos. Chem. Phys., 19, 6315–6330, https://doi.org/10.5194/acp-19-6315-2019, 2019.
Wang, X., Yi, W., Lv, Z., Deng, F., Zheng, S., Xu, H., Zhao, J., Liu, H., and He, K.: Ship emissions around China under gradually promoted control policies from 2016 to 2019, Atmos. Chem. Phys., 21, 13835–13853, https://doi.org/10.5194/acp-21-13835-2021, 2021.
Xiao, G., Wang, T., Chen, X., and Zhou, L.: Evaluation of Ship Pollutant Emissions in the Ports of Los Angeles and Long Beach, J. Mar. Sci. Eng., 10, 1206, https://doi.org/10.3390/jmse10091206, 2022.
Xiao, G., Wang, T., Luo, Y., and Yang, D.: Analysis of port pollutant emission characteristics in United States based on multiscale geographically weighted regression, Front. Marine Sci., 10, https://doi.org/10.3389/fmars.2023.1131948, 2023.
Yang, D., Wu, L., Wang, S., Jia, H., and Li, K. X.: How big data enriches maritime research – a critical review of Automatic Identification System (AIS) data applications, Transport Rev., 39, 755–773, https://doi.org/10.1080/01441647.2019.1649315, 2019.
Yue, H., He, C., Huang, Q., Yin, D., and Bryan, B. A.: Stronger policy required to substantially reduce deaths from PM2.5 pollution in China, Nat. Commun., 11, 1462, https://doi.org/10.1038/s41467-020-15319-4, 2020.
Zhang, S., Wang, S., Xue, R., Zhu, J., Tanvir, A., Li, D., and Zhou, B.: Impact Assessment of COVID-19 Lockdown on Vertical Distributions of NO2 and HCHO From MAX-DOAS Observations and Machine Learning Models, J. Geophys. Res.-Atmos., 127, e2021JD036377, https://doi.org/10.1029/2021JD036377, 2022.
Zhang, X., Zhang, Y., Liu, Y., Zhao, J., Zhou, Y., Wang, X., Yang, X., Zou, Z., Zhang, C., Fu, Q., Xu, J., Gao, W., Li, N., and Chen, J.: Changes in the SO2 Level and PM2.5 Components in Shanghai Driven by Implementing the Ship Emission Control Policy, Environ. Sci. Technol., 53, 11580–11587, https://doi.org/10.1021/acs.est.9b03315, 2019.
Zhang, X., van der A, R., Ding, J., Zhang, X., and Yin, Y.: Significant contribution of inland ships to the total NOx emissions along the Yangtze River, Atmos. Chem. Phys., 23, 5587–5604, https://doi.org/10.5194/acp-23-5587-2023, 2023.
Zhang, Y., Yang, X., Brown, R., Yang, L., Morawska, L., Ristovski, Z., Fu, Q., and Huang, C.: Shipping emissions and their impacts on air quality in China, Sci. Total Environ., 581–582, 186–198, https://doi.org/10.1016/j.scitotenv.2016.12.098, 2017.
Zhao, J., Zhang, Y., Patton, A. P., Ma, W., Kan, H., Wu, L., Fung, F., Wang, S., Ding, D., and Walker, K.: Projection of ship emissions and their impact on air quality in 2030 in Yangtze River delta, China, Environ. Pollut., 263, 114643, https://doi.org/10.1016/j.envpol.2020.114643, 2020.
Zhong, Q., Shen, H., Yun, X., Chen, Y., Ren, Y. a., Xu, H., Shen, G., Ma, J., and Tao, S.: Effects of International Fuel Trade on Global Sulfur Dioxide Emissions, Environ. Sci. Technol. Lett., 6, 727–731, https://doi.org/10.1021/acs.estlett.9b00617, 2019.
Zhu, J., Wang, S., Wang, H., Jing, S., Lou, S., Saiz-Lopez, A., and Zhou, B.: Observationally constrained modeling of atmospheric oxidation capacity and photochemical reactivity in Shanghai, China, Atmos. Chem. Phys., 20, 1217–1232, https://doi.org/10.5194/acp-20-1217-2020, 2020.
Zhu, J., Wang, S., Zhang, S., Xue, R., Gu, C., and Zhou, B.: Changes in NO3 Radical and Its Nocturnal Chemistry in Shanghai From 2014 to 2021 Revealed by Long-Term Observation and a Stacking Model: Impact of China's Clean Air Action Plan, J. Geophys. Res.-Atmos., 127, e2022JD037438, https://doi.org/10.1029/2022JD037438, 2022.
Zis, T., North, R. J., Angeloudis, P., Ochieng, W. Y., and Harrison Bell, M. M. G.: Evaluation of cold ironing and speed reduction policies to reduce ship emissions near and at ports, Mar. Econ. Logist., 16, 371–398, https://doi.org/10.1057/mel.2014.6, 2014.
Zis, T., North, R. J., Angeloudis, P., Ochieng, W. Y., and Bell, M. G.: Environmental balance of shipping emissions reduction strategies, Transport. Res. Rec. J. Transport. Res. Board, 2479, 25–33, https://doi.org/10.3141/2479-04, 2015.
Zou, Z., Zhao, J., Zhang, C., Zhang, Y., Yang, X., Chen, J., Xu, J., Xue, R., and Zhou, B.: Effects of cleaner ship fuels on air quality and implications for future policy: A case study of Chongming Ecological Island in China, J. Clean. Product., 267, 122088, https://doi.org/10.1016/j.jclepro.2020.122088, 2020.