the Creative Commons Attribution 4.0 License.
the Creative Commons Attribution 4.0 License.
 | 22 Oct 2025
Scattering properties and lidar characteristics of Asian dust particles based on realistic shape models
Anthony La Luna
Jianyu Zheng
Qianqian Song
Hongbin Yu
Jiachen Ding
Ping Yang
Masanori Saito
The lidar backscattering properties of Asian dust particles, namely the lidar ratio (S) and backscattering depolarization ratio (δ), were studied using a discrete dipole approximation (DDA) model. The three-dimensional morphology of the dust particles was reconstructed in fine detail using the focused ion beam (FIB) tomography technique. An index based on the symmetry of the scattering matrix was developed to assess the convergence of random orientation computation using DDA. Both S and δ exhibit an asymptotic trend with dust particle size: the S initially decreases, while the δ increases with size, before both approach their asymptotic values. The lidar properties were found to have statistically insignificant dependence on effective sphericity. The presence of strongly absorbing minerals, such as magnetite, can greatly reduce the dust's single-scattering albedo and δ. Utilizing the robust asymptotic trend behavior, two parameterization schemes were developed: one to estimate the δ of a single dust particle given its size and the other to estimate the δ of dust particles with a lognormal particle size distribution given the effective radius. The parameterization scheme was compared with results based on the TAMUdust2020 database, showing hexahedrons to reasonably represent realistic geometries with similar physical properties.
- Article
(3755 KB) - Full-text XML
- BibTeX
- EndNote


Dust aerosols are an important component of the Earth system, interacting with Earth's energy, water, and carbon cycles. Directly, dust aerosols scatter and absorb both shortwave and longwave radiation, influencing the planet's energy balance (Tegen et al., 1996; Miller and Tegen, 1998; Myhre et al., 2013; Song et al., 2018, 2022). By scattering incoming solar radiation, dust aerosols contribute to cooling the atmosphere and surface regionally, impacting temperatures and affecting atmospheric circulation patterns (Evan et al., 2006; Lau and Kim, 2007; Zhang et al., 2022).
The transport of dust aerosols also has far-reaching implications. The long-range transport of Asian dust is frequently observed on the United States' west coast with considerable impacts on the air quality and climate (Yu et al., 2012; Creamean et al., 2014; Wu et al., 2015). It is also observed impacting Taiwan through similar transport mechanisms (Lin et al., 2007). In fact, mineral dust from the Taklimakan Desert has been found to be transported a full rotation around the globe (Uno et al., 2009). Moreover, the deposition of dust aerosol during the long-range transport brings essential nutrients such as iron and phosphorus from terrestrial sources to marine ecosystems, being part of biogeochemical cycles across vast distances (Baker et al., 2003; Yu et al., 2015b; Westberry et al., 2023). Asian dust deposition in the East China Sea stimulates phytoplankton growth and primary productivity, influencing marine food webs and carbon cycling (Kong et al., 2022b).
Lidar is an important tool for remote sensing measurements of airborne dust particles. As demonstrated in many previous studies (Omar et al., 2009; Burton et al., 2012), it allows us to distinguish dust aerosols from clouds and other types of aerosols, track their long-range transport, and study their evolution as they interact with components of the environment such as clouds, atmospheric gases, and other aerosols. Elastic backscattering lidars are one of the most widely used types of lidar. For example, Cloud-Aerosol Lidar and Infrared Pathfinder Satellite Observations (CALIPSO) is a NASA–French satellite mission that implements a two-wavelength elastic lidar, the Cloud-Aerosol Lidar with Orthogonal Polarization (CALIOP), at 532 and 1064 nm wavelengths (Winker et al., 2009). Ground-based lidar networks such as the NASA Micro-Pulse Lidar Network (MPLNET) use single-wavelength measurements for extinction, backscattering, and depolarization profiles (Welton et al., 2001). The EarthCARE mission utilizes ATmospheric LIDar (ATLID), a 355 nm wavelength laser and high-spectral-resolution receiver, allowing it to directly measure both the lidar ratio and the extinction coefficient (Illingworth et al., 2015; Donovan et al., 2024). Ground-based lidars operating at 532 and 1064 nm throughout Eastern Asia are also useful for monitoring dust transport and air quality, running as part of the Asian Development Bank (ADB) and Global Environment Facility (GEF) (Sugimoto et al., 2008).
The lidar ratio (S) and depolarization ratio (δ) are two of the most important parameters for lidar-based remote sensing of aerosols and clouds. For a single dust particle, S, referred to as the extinction-to-backscatter coefficient, is defined as (Platt, 1979; Ansmann et al., 1992; Mattis et al., 2002; Liu et al., 2002)
where σ is the extinction coefficient and ω and P11 are the single-scattering albedo and phase function of the dust particle, respectively. For the purposes of this paper, P11 is normalized to 1 when integrating across all scattering directions. is the backscattering coefficient at the exact backscattering direction. When considering a multitude of particles,
where rv is the volume-equivalent sphere radius and defines a normalized particle size distribution (n(rv)).
For Raman lidar and high-spectral-resolution lidar systems, the lidar ratio can be derived directly from the observed extinction and backscatter without assumptions about the composition (Müller et al., 2007; Bambha et al., 2016). However, for elastic backscattering lidars, the lidar ratio cannot be directly measured. As a result, assumptions need to be made about the composition of the atmosphere. Therefore, the lidar ratio is fundamentally important for elastic lidars like CALIOP and MPLNET to convert the direct attenuated backscatter observations into an extinction profile (Young et al., 2018) and derive quantities such as dust aerosol optical depth (Yu et al., 2015a; Song et al., 2021).
The depolarization ratio δ is the ratio of the perpendicular or cross-polarized component to the parallel component of the polarized backscattering signal. For backscattering lidar the depolarization ratio is defined as
where Pij is the ijth element of the particle's scattering matrix (Kong et al., 2022a). δ is often used for aerosol type (Kim et al., 2018) and cloud-phase classifications (Hu et al., 2009). First, if lidar backscattering is dominated by single scattering, δ is close to zero for spherical particles like sulfate aerosols and water droplets. In contrast, δ is notably greater for nonspherical particles like dust aerosols and ice crystals. Moreover, the considerable δ differences between spherical fine particles and nonspherical coarse dust particles also enable the separation of dust extinction from the total extinction profile retrieved by CALIOP (Yu et al., 2015; Song et al., 2021).
Because of the fundamental importance of S and δ for lidar-based dust remote sensing, previous studies have made substantial effort to understand the connection between dust particle properties, e.g., shape and size, and their lidar characteristics, in particular the S and δ (e.g., Dubovik et al., 2006; Gasteiger et al., 2011; Liu et al., 2015a; Kahnert et al., 2020; Saito et al., 2021; Saito and Yang, 2021; Kong et al., 2022a). The common methodology used in these studies is to use light-scattering models, such as the T matrix (Mishchenko et al., 1996; Bi and Yang, 2014b) and discrete dipole approximation (DDA) model (Draine and Flatau, 1994, 2013; Yurkin and Hoekstra, 2007, 2011), to compute the scattering properties including S and δ of dust aerosols and then study the potential dependence on particle properties. Although these studies have greatly improved our understanding and paved the foundation for the current aerosol retrieval algorithms, they share a common limitation as they all use hypothetical dust particle shape models, such as spheroid (Dubovik et al., 2006), irregular polyhedron (Saito et al., 2021), Gaussian random sphere (Muinonen et al., 1996; Liu et al., 2015a; Kahnert et al., 2020), tri-axial spheroid (Meng et al., 2010; Huang et al., 2023), and super-spheroid (Kong et al., 2022a), to simulate dust particle shapes that are weakly constrained or not constrained by observations. The reason for this is probably twofold. Most microscopic observations of dust particles in the literature are two-dimensional (2-D) images based on scanning or transmission electron microscopy (SEM or TEM), while three-dimensional (3-D) observations are extremely rare. In addition, the implementation of complex shapes in scattering models is also a challenging task. For example, until recently the widely used T-matrix code based on the extended boundary condition method (Mishchenko et al., 1996) has primarily been applicable only to rotationally symmetric particles such as spheroids. It is worth noting that the T-matrix method implementation based on the invariant imbedding T-matrix method is applicable to arbitrary shapes (Bi and Yang, 2014a). Aware of the limitation of hypothetical dust particle shapes, these studies often use dust-scattering properties from laboratory measurements as benchmarks to select an optimal set of hypothetical shapes that can generate similar scattering properties, e.g., lidar characteristics, as measurements (Saito et al., 2021; Kong et al., 2022a). Nevertheless, the use of a hypothetical instead of realistic dust shape inevitably leads to some important questions. Is the match of the dust-scattering properties a result of a good shape model or a fortunate coincidence? If an optimal shape model is selected based on one set of dust-scattering observations (e.g., δ at 532 nm), can this model automatically simulate other scattering properties (e.g., δ at other wavelengths)? Obviously, one way to address the above questions is to use realistic shape models in the computation of dust-scattering properties. A few studies have made attempts in this direction. For example, Lindqvist et al. (2014) developed a so-called stereogrammetric surface retrieval method to construct 3-D dust shapes from 2-D SEM dust images and Kemppinen et al. (2015b) used a surface roughening model to add detail to the model. Ishimoto et al. (2010) and Kemppinen et al. (2015 a) used a Voronoi tessellation-based algorithm to mimic dust internal structure. Järvinen et al. (2016) compared the lidar backscattering properties based on the constructed 3-D dust shapes with laboratory measurements and found reasonable agreement. An important finding from this study is that δ values of realistic dust particles at 532 nm first increase with particle size but seem to approach an asymptotic constant value of ∼0.30 for coarse dust particles.
The main objective of this study is to better understand the lidar backscattering properties of dust particles with realistic shapes. The dust shape models used here are based on the focused ion beam (FIB) tomography technique, aided by energy-dispersive X-ray spectroscopy (EDX) and SEM imaging, developed by Conny et al. (2014) and Conny and Ortiz-Montalvo (2017), which as far as we know is the most direct and faithful way to measure the shape and morphology of single dust particles. In addition to shape measurement, EDX is used to measure the mineral composition of dust particles, which in turn enables the estimation of the complex refractive index (CRI) of dust particles. Based on the measured dust particle shape and estimated CRI, Conny et al. (2019, 2020) simulated and studied the scattering properties such as single-scattering albedo and phase functions of the dust samples using the DDSCAT model (Draine and Flatau, 1994, 2013).
In this study, we focus on the lidar backscattering properties of realistic dust samples obtained from FIB tomography measurements (Conny et al., 2019; Conny, 2018). For simplicity, we will refer to these dust samples as “FIB dust samples”. We are particularly interested in the following questions: how do the S and δ of realistic dust samples vary with particle size, shape, mineral composition, and lidar spectral channel? The remaining portion of the paper is organized as follows: first, in Sect. 3, we introduce the dust samples used in this study, along with their origins and properties. We also explain the Amsterdam Discrete Dipole Approximation (ADDA) model and introduce a convergence index to determine the number of orientations necessary for calculating the optical properties under the random orientation condition. In Sect. 4, we examine how the lidar backscattering properties of the dust samples depend on dust properties, including size, shape, and mineral composition. In Sect. 5, we present two dust δ parameterization schemes: one to estimate the δ of a single dust particle based on its size and the other to estimate the δ of dust particles with a lognormal particle size distribution based on the effective radius. Finally, in Sect. 6, we summarize the main findings and conclusions of this study.
3.1 FIB dust samples
The 13 dust particles measured by FIB were obtained from the Mauna Loa Observatory (19°32′10′′ N, 155°34′34′′ W) on the island of Hawaii between 15 March and 26 April 2011. Six of these particles were collected during the daytime. Following Conny et al. (2019), these particles will be referred to as the “D” sample (e.g., “3D” indicates that the sample was collected during the daytime of day 3). The other eight particles were collected at night and are referred to as “N” samples. The properties of these particles, including their shape, size, and composition, as well as the measurement techniques, have been extensively documented in Conny et al. (2019, 2020). Conny et al. (2019) analyzed the back trajectories from the Mauna Loa Observatory during this time interval, suggesting that their samples likely originated as Asian dust. Out of curiosity, we collocated the CALIOP observations with the back trajectories from the Hybrid Single-Particle Lagrangian Integrated Trajectory (HYSPLIT) model (Stein et al., 2015; Rolph et al., 2017) from 25 March 2011, 00:00 UTC, to 18 March 2011, 00:00 UTC, starting from the Mauna Loa Observatory. The lidar depolarization ratio observations and aerosol classification (Fig. 1c and e) results show large amounts of dust along the later portion of the projected path on 23 March 2011. The back trajectories and CALIOP observations confirm that the FIB dust samples are likely long-range-transported Asian dust particles, more specifically from the Gobi Desert, consistent with Conny et al. (2019). This may be an important distinction as Asian dust exhibits some differences in optical properties when compared to other regions such as the Sahara (Hofer et al., 2020; Floutsi et al., 2023), particularly in regard to the mineral composition discussion in Sects. 3.2 and 4.3. However, to our knowledge, there is no evidence to suggest that the morphology of dust particles is strongly tied to regional origin. Therefore, while these dust particles are suspected to be of Gobi origin, we believe these dust samples to be useful for the characterization of atmospheric dust more generally.
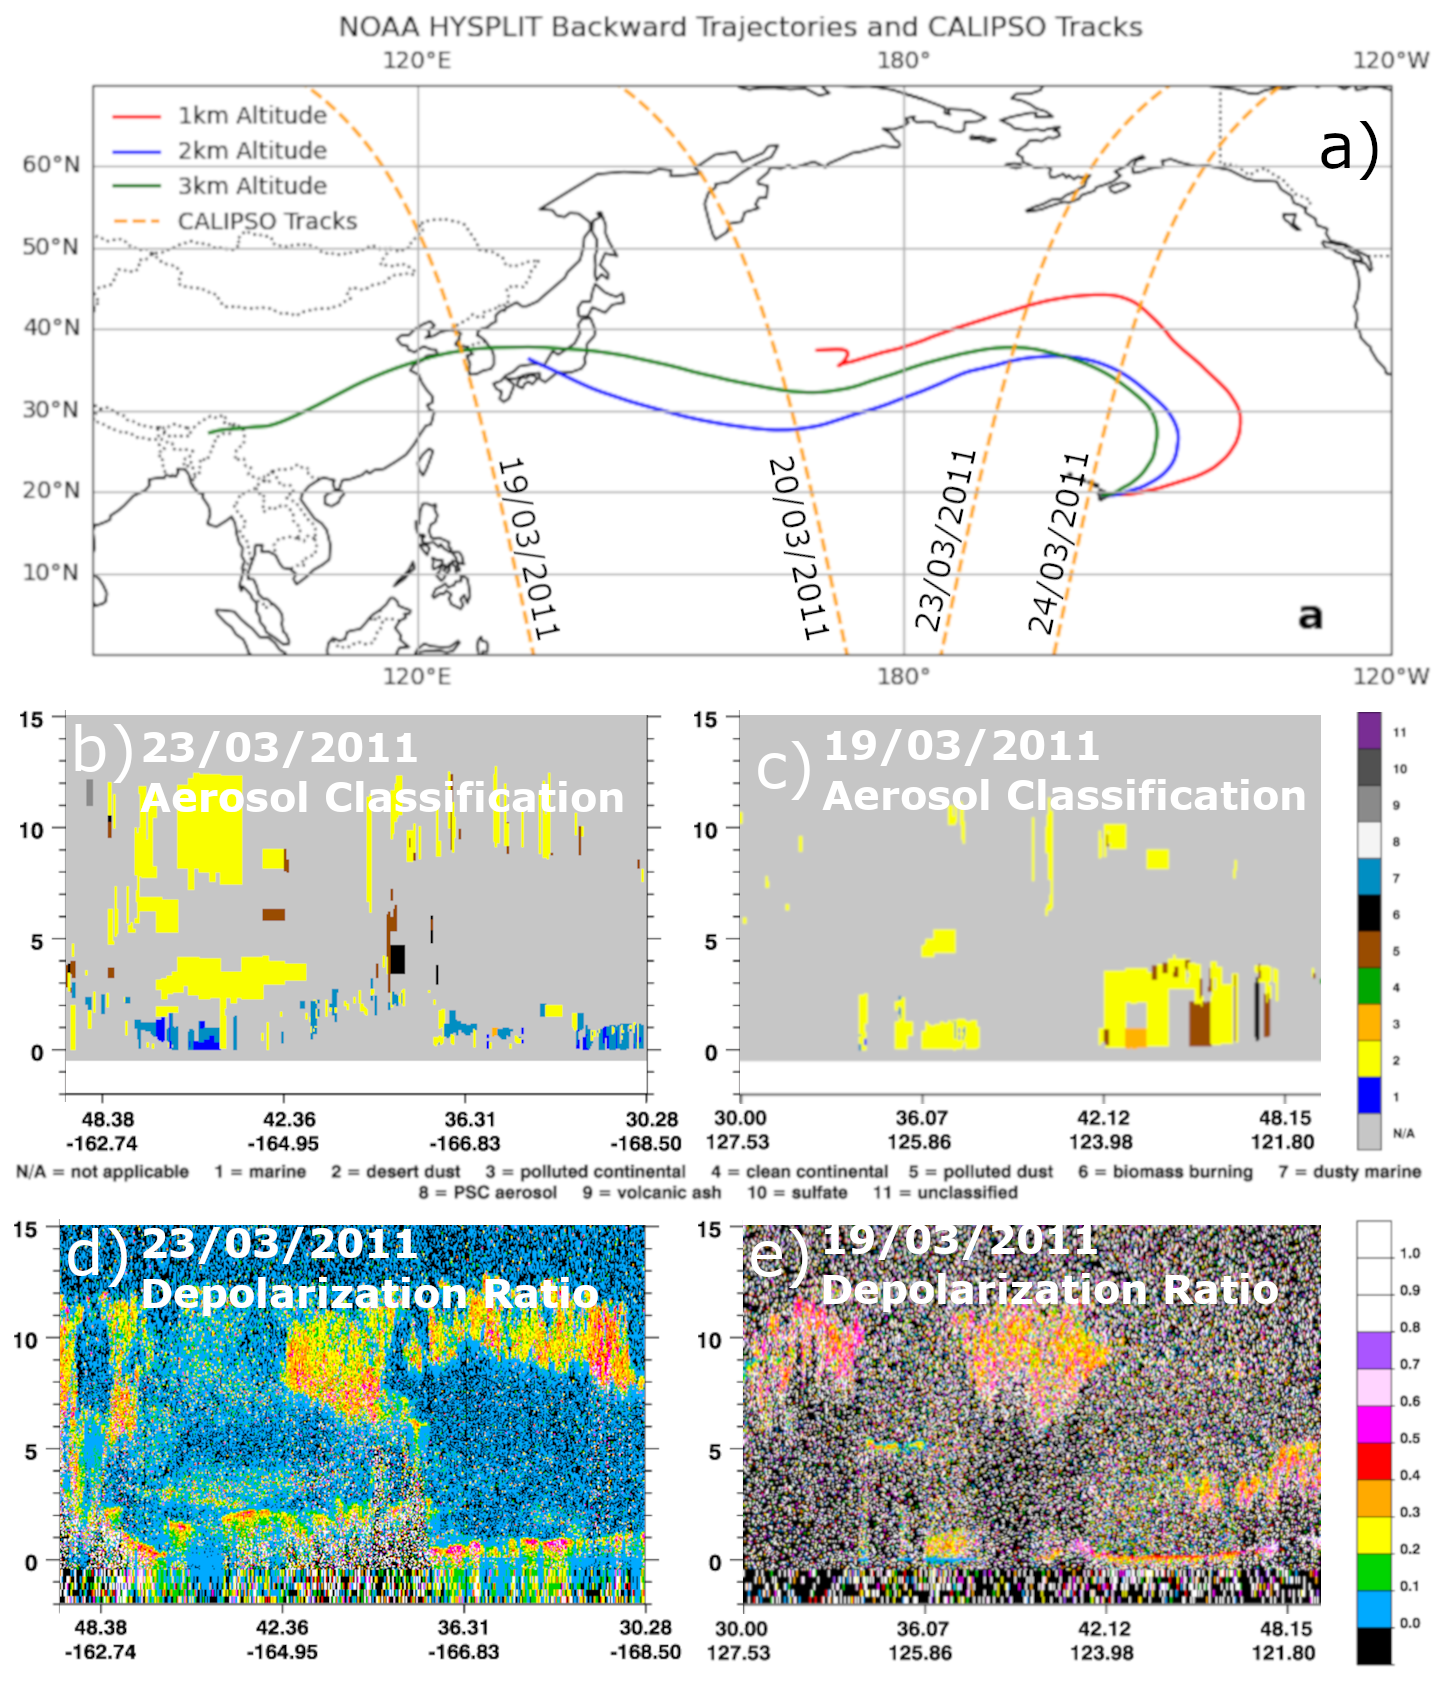
Figure 1(a) NOAA HYSPLIT backward-trajectory paths from 25 March 2011, 00:00 UTC, to 18 March 2011, 00:00 UTC, starting from Mauna Loa Observatory, shown in solid lines. North–south-running dashed lines show CALIPSO tracks intersecting with the modeled dust paths. Depolarization ratio and aerosol subtype classification for CALIPSO tracks intersecting with modeled dust paths from the NOAA HYSPLIT backward-trajectory paths for 19 and 23 March 2011 (b–e, respectively). Through δ and aerosol subtype classification, a dust plume was found to be present. In subplots (b) and (c), yellow (labeled 2) corresponds to desert dust.
3.2 Dust particle shape and refractive index
As emphasized above, the primary advantage of using FIB dust samples for this study is that the shape and composition of these samples are directly measured. To determine the dust shape, the FIB uses a gallium ion beam, milling through each particle in 15–20 nm increments. This process results in a stack of 100–200 cross-sectional images with dimensions of 1024 by 884 pixels for each particle. These cross-sectional images are then combined to reconstruct highly detailed 3-D dust shapes, composed of three-dimensional pixels or voxels, as illustrated by an example in Fig. 2.
The collection of dust samples spans a range of sizes. In this study, we quantify this range for irregular geometries using the volume-equivalent sphere radius (rv). Using this metric, our library covers a range from 0.46 µm to 0.93 µm in rv. The particle geometries are also assigned two aspect ratios, where orientation is determined through principal component analysis of the voxel coordinates. This analysis aligns the longest axis along the z direction and the greatest variation from this axis with the x and y directions, aligning with an intuitive understanding of defining aspect ratios in three dimensions. The aspect ratios of these particles vary from 0.629 and 0.398 (particle 2N Ca–S) to more symmetrical particles with aspect ratios of 0.582 and 0.575 (particle 4N1 Ca–Mg).
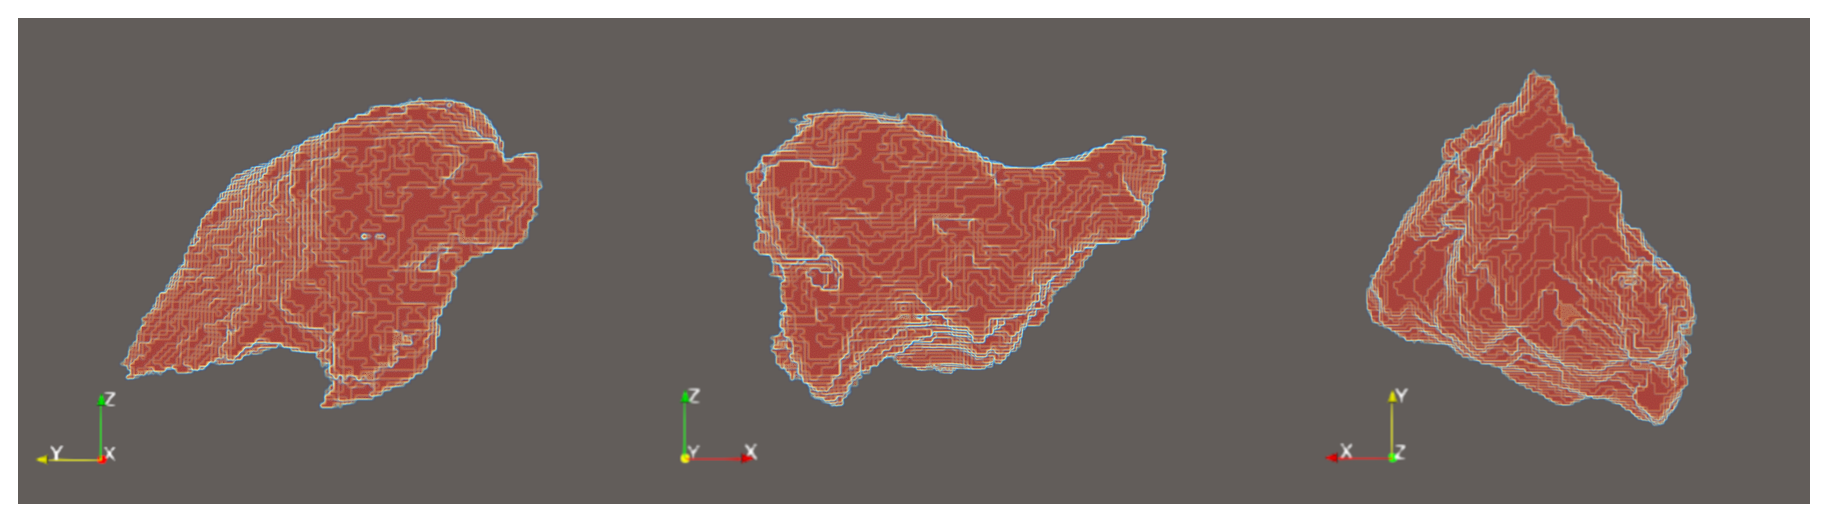
Figure 2Orthographic projection of a sample dust particle from the FIB-reconstructed database, 3D Ca-rich.
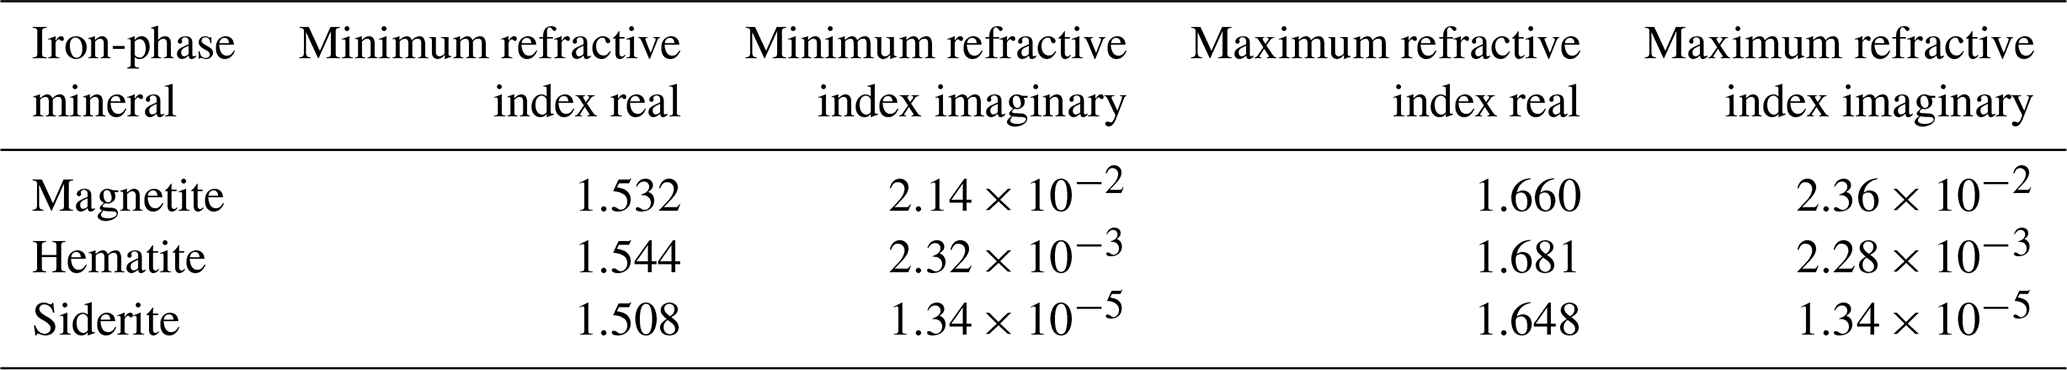
In addition to the FIB-based dust shape reconstruction, Conny et al. (2019) also performed the element composition and mineral-phase analysis for the FIB dust samples using SEM and energy-dispersive X-ray spectroscopy (EDX). They found that the dust samples can be loosely classified into three categories based on the element compositions, the mainly calcium–magnesium-based (Ca–Mg) ones, the calcium-rich (Ca-rich) ones, and lastly those primarily composed of calcium sulfide (Ca–S). In this study we follow this naming convention of Conny et al. (2019). To determine the refractive index of the dust samples, Conny et al. (2019) first estimated the volume fractions of possible mineral phases in the particles based on the composition analysis results. Then, the complex refractive index of each particle was determined through the average Maxwell–Garnett dielectric function based on the estimated volume fraction of each mineral phase. It should be noted that the iron-phase composition in the particle was assumed to be either siderite, hematite, or magnetite, which have different complex refractive indices. Moreover, two sets of the complex refractive index were used for each iron-phase mineral to account for the variability induced by optical anisotropy. The combination of mineral differences and refractive index variability leads to several sets of the final refractive index after the Maxwell–Garnett averaging. Take the 3D Ca-rich particle in Fig. 2 for example. Table 1 provides the complex refractive indices at 589 nm from Conny et al. (2019) for a single particle. Interested readers are referred to their study for more information.
In this study, we are interested in the dust-scattering properties at three commonly encountered lidar wavelengths, namely, 355, 532, and 1064 nm. For simplicity, we assume the same refractive index from Conny et al. (2019) for all three wavelengths, which is probably reasonable only for the 532 nm. On the other hand, because we assume the refractive index to be invariant with wavelength, the wavelength variation essentially corresponds to the variation in the dust particle size parameter , allowing us to focus on the impact of the dust particle size on the lidar scattering properties. The impacts of the spectral variation in the refractive index will be investigated in future studies.
3.3 ADDA model and convergence index of random orientation
In this study, we utilize the ADDA model version 1.4.0 (Yurkin and Hoekstra, 2020) to compute the single-scattering properties, including the extinction cross section Cext, single-scattering albedo ω, and scattering matrix P, of each FIB dust particle. The scattering properties of dust particles depend on not only their size, shape, and refractive index, but also their orientations with respect to the incident light and the wavelength of incident light. In this study we assume that dust particles are randomly oriented. The theoretical basis and numerical implementation of the ADDA model have been well documented (Yurkin and Hoekstra, 2007, 2011). The model has been used in numerous previous studies to compute the scattering properties of aerosol and cloud particles (Yang et al., 2013; Gasteiger, 2011; Collier et al., 2016). The process to generate the inputs from the FIB shape measurements for the discrete dipole approximation (DDA) model has been described in detail in Conny et al. (2019). We use the same inputs and configurations in this study. The only difference is that we use the ADDA model, while Conny et al. (2019) used a different DDA model, DDSCAT, by Draine and Flatau (1994). The reason we cannot directly use the DDA simulation results from Conny et al. (2019) is twofold. Firstly, their computations are conducted for an incident light at the 589 nm wavelength, whereas we are interested in lidar wavelengths of 355, 532, and 1064 nm. Secondly, as will be explained later, we will need a greater number of orientations to simulate random orientation for P and lidar backscattering properties (Konoshonkin et al., 2020) than may be sufficient for the σe and ω to converge. In the remainder of this section, we will introduce a practical method to determine if a sufficient number of orientations have been used in the ADDA simulations to ensure convergence in the results for random orientation computations.
Table 1The possible complex refractive index at 589 nm of the 3D Ca-rich particle in Fig. 2 from Conny et al. (2019).
For a particle with an irregular shape and arbitrary orientation, the scattering matrix P that relates the incident and scattering Stokes parameters is a 4×4 matrix with 16 elements:
where θs is the scattering angle. If the particle is randomly oriented, for any orientation its reciprocal orientation is equally likely. Because of the reciprocal symmetry, the scattering matrix for a randomly oriented particle with irregular shape reduces to (van de Hulst, 1981; Mishchenko et al., 2002; Mishchenko and Yurkin, 2017)
The symmetry property of the P matrix for randomly oriented particles in Eq. (5) provides a basis to assess the convergence of random orientation simulations in ADDA. For example, utilizing the fact that P41=P14 for a randomly oriented particle, we can define a convergence index (CI) for random orientation as
As such, CI approaches zero when the random orientation computation converges. It should be noted that CI can also be defined based on other symmetric elements of the scattering matrix such as P21=P12, . For practical applications, we usually assume that particles are randomly oriented with an equal number of mirror particles. Under such a condition or if the particle in question has mirror symmetry itself, the scattering matrix has only 6 independent elements in the form (van de Hulst, 1957; Mishchenko and Yurkin, 2017; Yang et al., 2023)
and a CI based on P12=P21 or must be used.
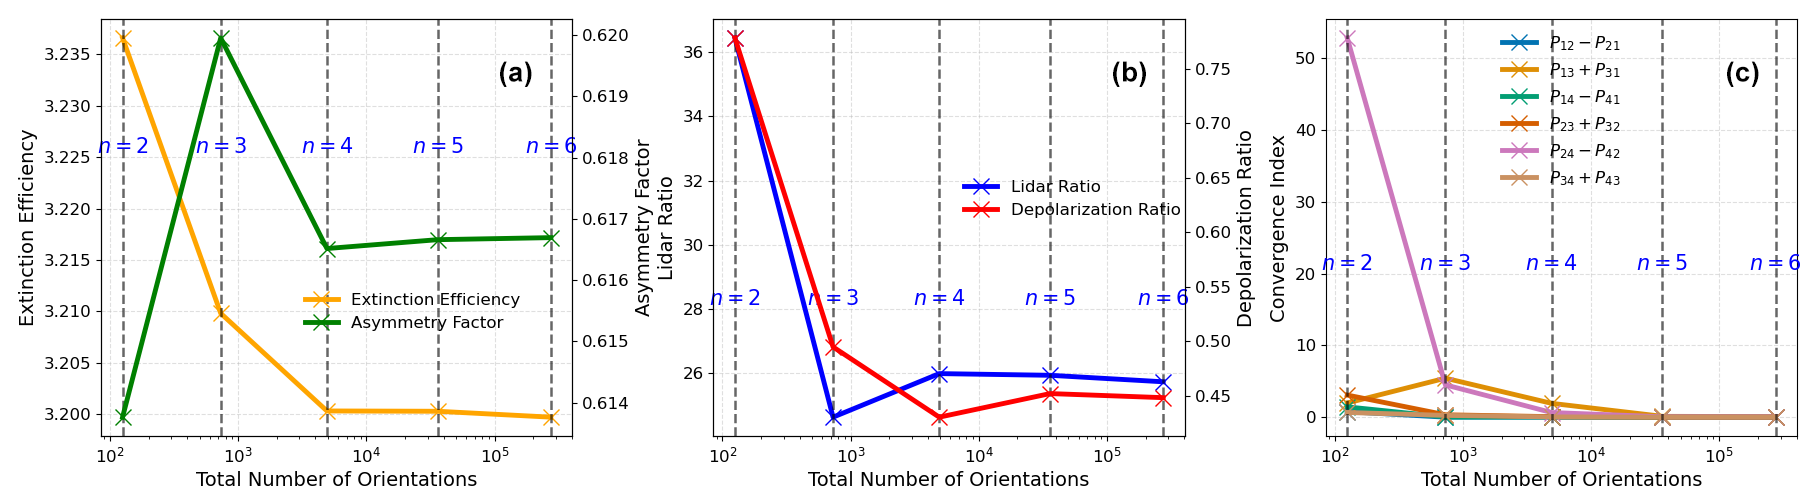
Figure 3(a) Change in the extinction efficiency and asymmetry factor with an increasing number of orientations for a representation of a randomly oriented dust particle, 3D Ca-rich. (b) S and the linear depolarization ratio as a function of the number of orientations for the dust particle 3D Ca-rich. (c) Convergence index for each of the dust particle 3D Ca-rich's Mueller index pairs at 532 nm. Note that the panels start at n=2.
In the context of ADDA, the orientation of a particle with respect to the incidence is defined using three Euler angles: α, β, and γ. To specify a certain orientation, the particle is rotated first α on the z axis, then β on the y axis, and finally γ across the new z axis through the zyz convention (Yurkin and Hoekstra, 2020). Then, to produce the scattering properties for a randomly oriented particle, ADDA averages across a large number of orientations. ADDA can do this internally through a specified number of evenly spaced intervals across α, β, and γ. For α and β, ADDA calculates the scattering properties for the new orientation, while for γ, or the self-rotation angle, it equivalently rotates the scattering plane to improve computational time. It calculates orientations in intervals of 2n+1 for each of α, β, and γ, resulting in (2n+1)3 total orientations. To assess if the random orientation convergence has been achieved, one can examine the behavior of CI as well as other scattering properties of interest as a function of the number of orientations. An example using the 3D Ca-rich dust particle is shown in Fig. 3 for . As expected, all properties converge to asymptotic values as n increases from n=1 (i.e., 27 orientations) to n=6 (i.e., 274 625 orientations). On the other hand, it is important to note that the scalar properties such as the extinction efficiency and asymmetry factor (Fig. 3a) and S and δ (Fig. 3b) converged when n=4, while the CI based on certain scattering matrix elements (Fig. 3c) only converged after n=5. Based on this result, we employ n=5 for the computations in this study. The results in Fig. 3 clearly show that although one can assess the convergence of random orientation computation by observing the asymptotic behavior of scalar properties, the CI based on scattering matrix elements is a more robust index supported by fundamental physics.
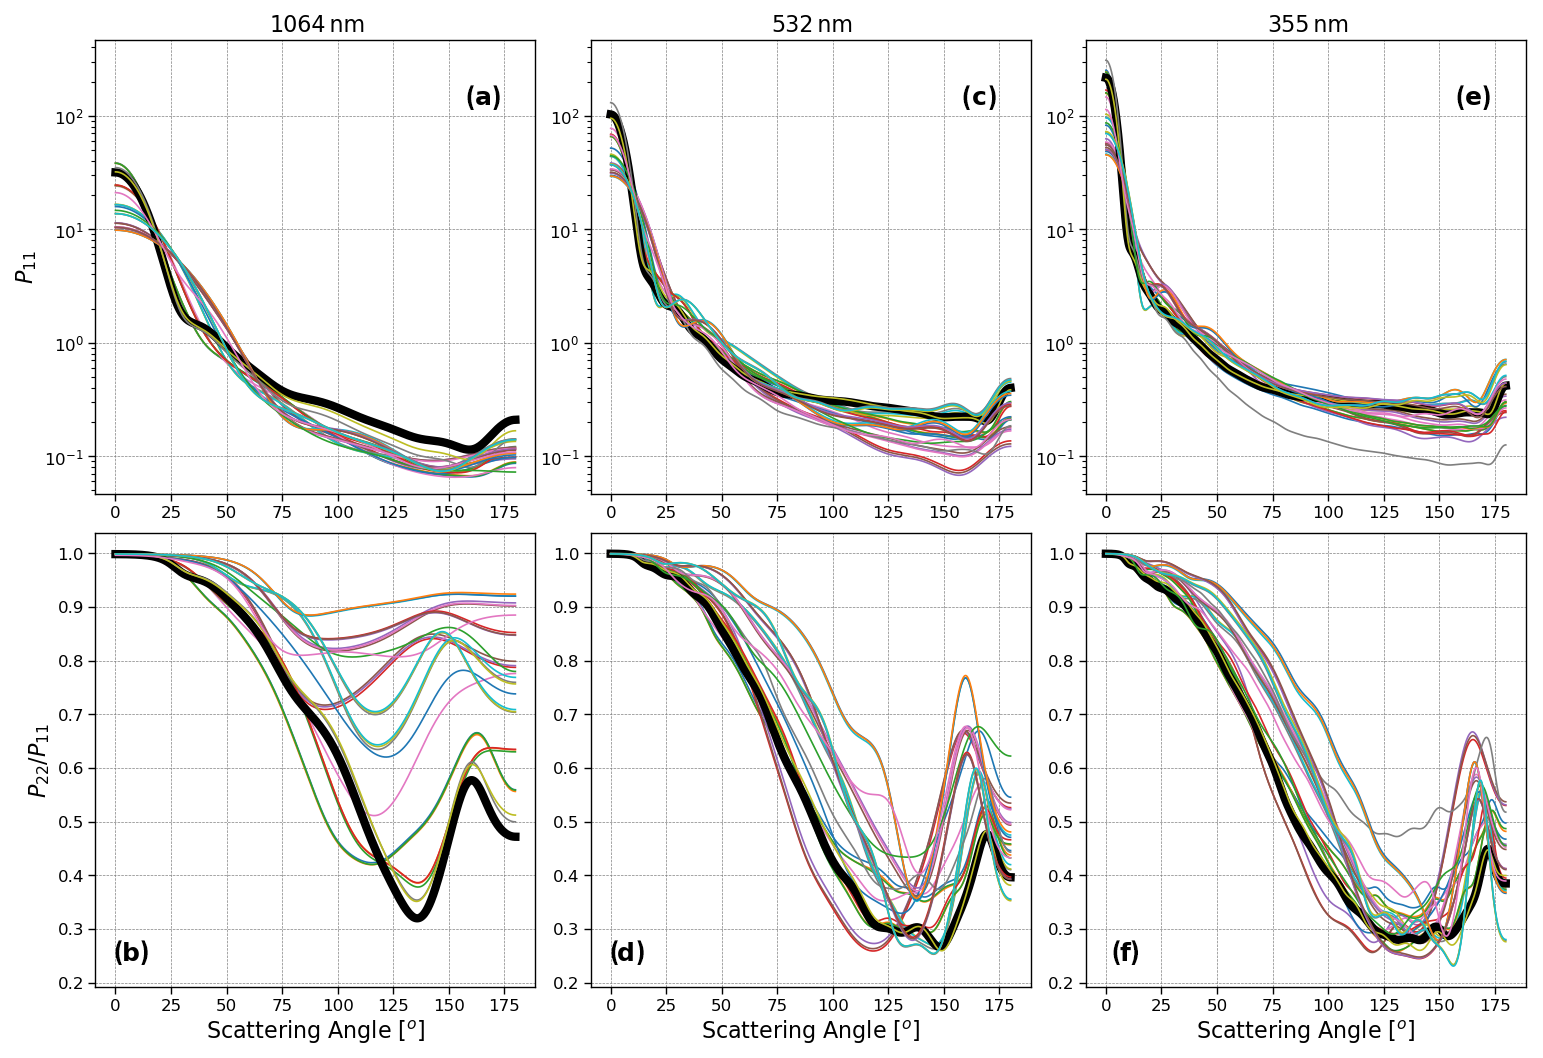
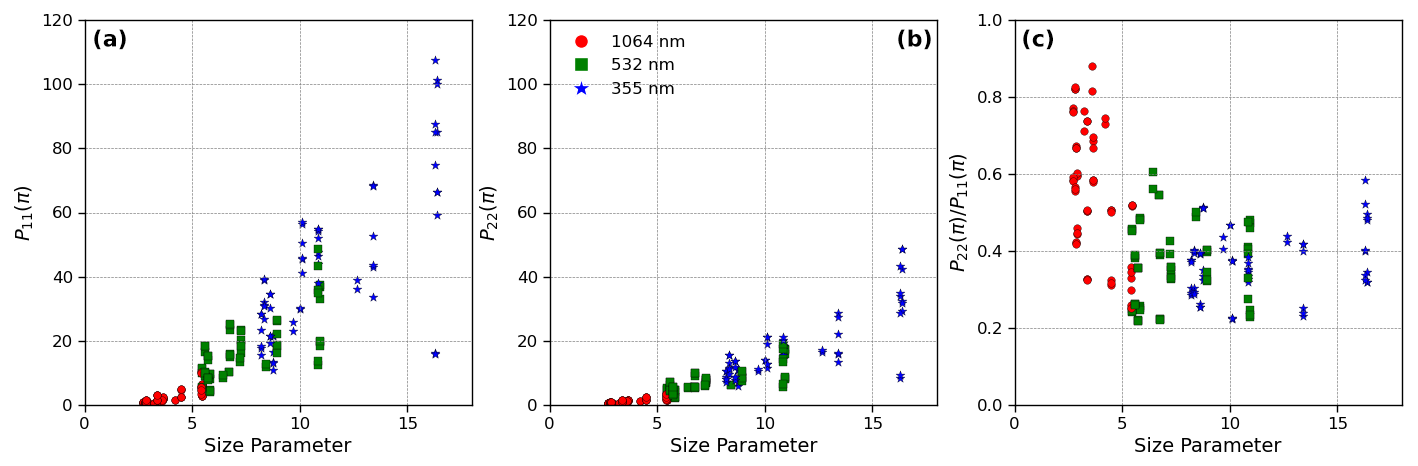
Figure 4P11 and for each particle geometry. Results for (a, b) 1064 nm, (c, d) 532 nm, and (e, f) 355 nm of each iron-containing mineral phase's minimum refractive index. Highlighted in black is the particle 3D Ca-rich.
Thus, the error in computations of optical properties through ADDA is strongly tied to the number of orientations used. We find in Sect. 4 that constraining the refractive index through mineralogy and size through proper characterization of the particle size distribution creates the largest potential sources of error in these calculations, as ADDA's integration error has been set to less than 10−5 and the geometries used are highly detailed, with individual dipole sizes on the order of 103 nm3. This makes the numerical error negligible compared to the error in chosen parameters, convergence level, and sample size through the limited set of geometries. The CI is a tool to minimize computational error while considering computational cost.
With the help of the newly developed CI, we computed the scattering properties of the FIB dust samples for three commonly encountered lidar wavelengths: 355, 532, and 1064 nm. For each wavelength, more than 60 ADDA simulations are carried out corresponding to different particles, as well as different refractive indices for each particle as explained above (see Sect. 3.2). Figure 4 shows the scattering matrix elements P11 and for the FIB dust samples for the three lidar wavelengths for their minimum refractive index for each mineral typing. Given the realistic morphology of the FIB dust samples and extensive computational methods of determining these optical properties, the FIB dust samples can serve as a benchmark for future studies on simulated mineral dust-scattering properties. As one can see in Fig. 4a–c, the values of P11 in the forward scattering directions increase systematically from 1064–532 nm and 355 nm, which can be explained by the increase in the size parameter as wavelength decreases. In Fig. 4d–f, shows considerable decreases from 1064–532 nm, down ∼13 % on average. In contrast, the changes are relatively small from 532–355 nm. These features will help us understand the spectral dependence of S and δ shown and discussed in the next section.
4.1 Sensitivity to dust particle size
In lidar-based aerosol remote sensing, the S–δ diagram is often used to classify aerosols into different types (Burton et al., 2012; Illingworth et al., 2015). The S–δ diagram for the FIB dust samples is shown in Fig. 5. Notably, S is negatively correlated with δ when the results for all three wavelengths are combined (correlation coefficient of 0.83). Specifically, the δ at 1064 nm is smaller than the corresponding values at 532 and 355 nm, while the opposite is true for S. The results for 532 and 355 nm largely overlap with each other. Recall that the same CRI is used for all three wavelengths, so these spectral differences are caused by the size parameter difference, i.e., the relative size of the particle with respect to the lidar wavelength. To further illustrate this point, we plotted the S and δ separately as a function of the dust particle size parameter, shown in Fig. 6. Note that the size of the irregular particle can be defined in different ways; here, we adopt the volume-equivalent size.
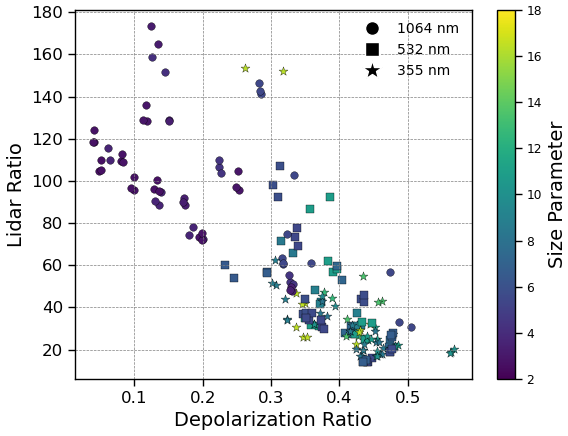
Figure 5S–δ graph of FIB dust particles at each of the 355, 532, and 1064 nm wavelengths for the refractive index of each mineral type found in the particle.
Figure 6 reveals an interesting asymptotic behavior of lidar properties with respect to size, where S (Fig. 6a) first decreases and δ (Fig. 6b) first increases with size parameters, and then they seemingly approach their asymptotic values. We use a locally weighted scatterplot smoothing regression (or LOWESS) to fit the trend in lidar optical properties with size parameters. We find that both S and δ plateau around the size parameter x≈8 and then approach their asymptotic values, S=35 sr and δ=0.41. These asymptotic values differ from the global averages of CALIPSO shown in Fig. 6 due to the differences between single scatterers and volumetric measurements produced by a lidar instrument in the atmosphere where non-dust particles and a full particle size distribution affect the results. Notably, these results span a limited size distribution due to the sizes present in the dust particles analyzed and the computational expense of producing simulations of larger particles. However, the asymptotic behavior of lidar properties has also been reported in several previous studies. For example, the S and δ based on the so-called super-spheroid dust model in Kong et al. (2022a) showed a similar asymptotic behavior for the size parameter range between 2 and 20 (see their Fig. 3), and so did the laboratory-measured dust δ in Järvinen et al. (2016) (see their Fig. 9).
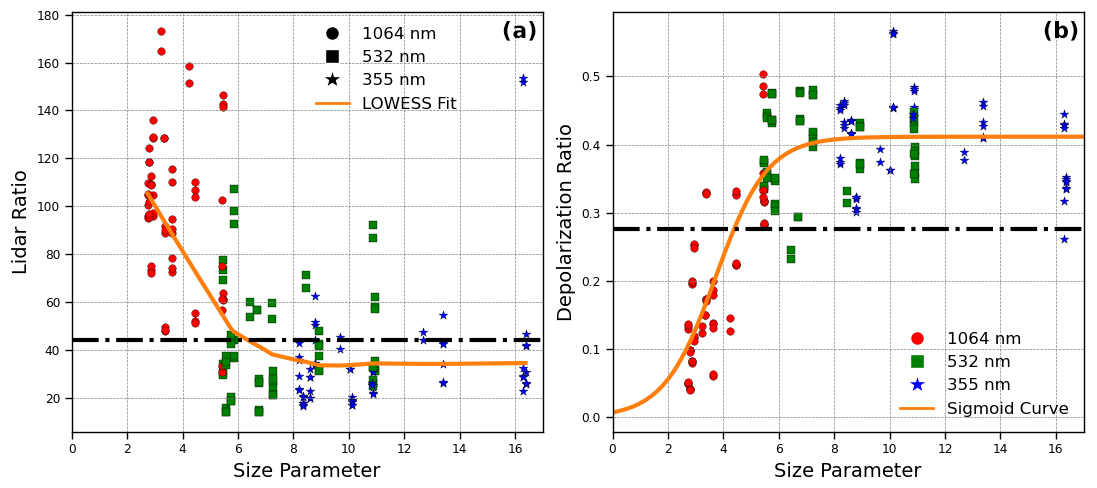
Figure 6Relationship between the dust particle size parameter and (a) S and (b) δ. The orange lines represent a LOWESS fit of the data for S and a sigmoid function for δ. The black lines correspond to (a) S=44 sr, the S used for CALIPSO's aerosol classification of dust (Kim et al., 2018), and (b) δ=0.277, the median observed δ at 532 nm of the Atlantic dust transport region using CALIOP (Liu et al., 2015b).
Since S is a function of both P11(π) and ω, we investigate their relative roles in determining the size dependence of S. Figure 7a shows that the values of S lie closely around the line, with the r2 value around 0.97 for a simple regression of . In contrast, single-scattering albedo ω plays a lesser role in S among the particles tested due to greater similarities in values (Fig. 7b). However, the outliers in Fig. 7a correspond to points with much lower ω in Fig. 7b, particularly the FIB sample 3D Ca-rich (see Fig. 2) using the magnetite refractive index, which has an imaginary refractive index of 0.021–0.024, an outlier with a magnitude 10 times greater than the other mineral types present (see Table 1). In Fig. 7c and d, we plot the variation in P11(π) and ω, respectively, as a function of the size parameter. Although the variability in P11(π) is quite large, especially in the size parameter range between 5 and 10, it generally increases with size parameter. In contrast, the ω in Fig. 7b shows a slight decrease with size. These results indicate that P11(π) plays a more dominant role than ω in determining the size dependence of S in these dust samples.
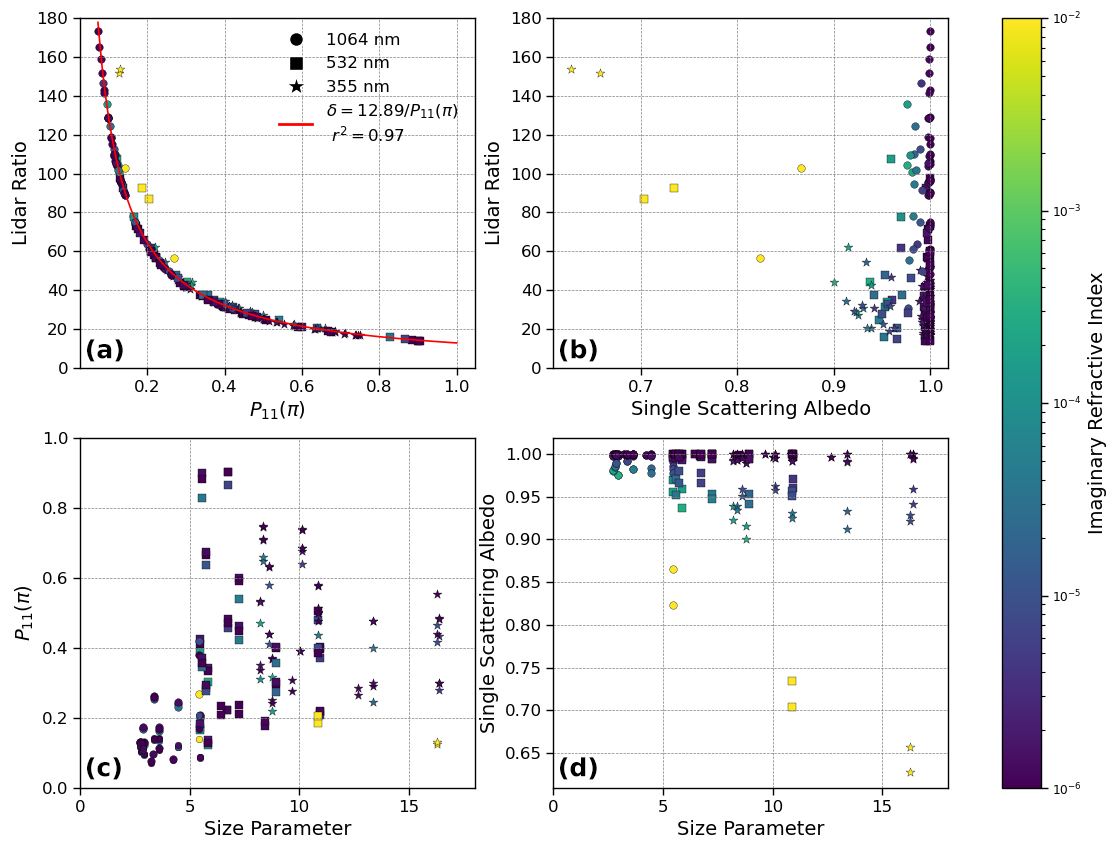
Figure 7S as a function of (a) P11 and (b) ω. (c) P11 and (d) ω as a function of the dust size parameter. The color of each dot corresponds to the imaginary refractive index.
Following the same thought for the above S analysis, we analyze the role of P11(π) and P22(π) in determining the asymptotic behavior of δ in Fig. 6b. It is seen in Fig. 8a and b that both P11(π) and P22(π) increase with dust size. Interestingly, their ratio first decreases with size and then seems to approach an asymptotic value of 0.4 when dust particles are large. So, the result suggests that the asymptotic trend of δ with respect to dust size is a result of the asymptotic behavior of .
4.2 Sensitivity to dust shape and sphericity
Several studies have shown that constraining particle morphology is important for quantifying the δ of dust particles (Dubovik et al., 2006; Saito et al., 2021; Liu et al., 2015a; Kahnert et al., 2020; Kong et al., 2022a). As explained in the introduction, most of these studies are based on simple hypothetical shape models such as ellipsoid and irregular hexahedrons. In this section, we investigate the dependence of δ on dust sphericity based on the FIB dust samples. As explained in Sect. 3.2, in the baseline simulations each dust sample has different sizes and CRIs that correspond to laboratory-measured dust mineralogy. As a result, the differences in δ between different sample particles in the baseline simulations are caused by not only shape but also size and CRI differences. To eliminate the influence of size and CRI and focus on the effect of sphericity, we carried out an additional set of ADDA computations for the 532 nm wavelength, where we used the same CRI of and the same volume-equivalent radius of 0.5 µm for all the FIB particles but kept the original shape of each particle. The use of the common size and CRI allows us to investigate the dependence of δ on the sphericity index defined as follows (Wadell, 1935; Saito and Yang, 2022):
where Ψ is the sphericity, V is the volume of the particle, and As is the surface area. By definition, a sphere is Ψ=1, and a perfectly spherical particle has a δ of 0. However, due to the irregularity of the FIB dust sample geometries, their Ψ, more specifically the surface area, is heavily impacted by the level of granularity in voxel size, similarly to the well-known coastline paradox (Steinhaus, 1954). Therefore, we employ the effective sphericity as the average projected area of a particle is not susceptible to the same issues of increasing value with precision (Vouk, 1948; Saito and Yang, 2022):
where Ψeff is the effective sphericity and Aproj is the average projected area across all projection directions. This gives us a wide range of effective sphericity values between 0.49–0.89. As shown in Fig. 9, we find no clear relationship between effective sphericity and δ or S (null hypothesis rejected with p>0.05 for both S and δ). This may be a result of a limited set of geometries of the FIB dust samples. It could also be due to the limitation of the effective sphericity index in Eq. (9) failing to capture the subtle dependence of δ on dust particle shape. Note that other previous studies have also found a weak dependence of δ on particle sphericity (e.g., Kong et al., 2022a). Further studies are warranted to better understand the relationship between δ and the morphology of dust particles. But overall, our results seem to suggest that the impact of particle sphericity on δ and S is less important than particle size.
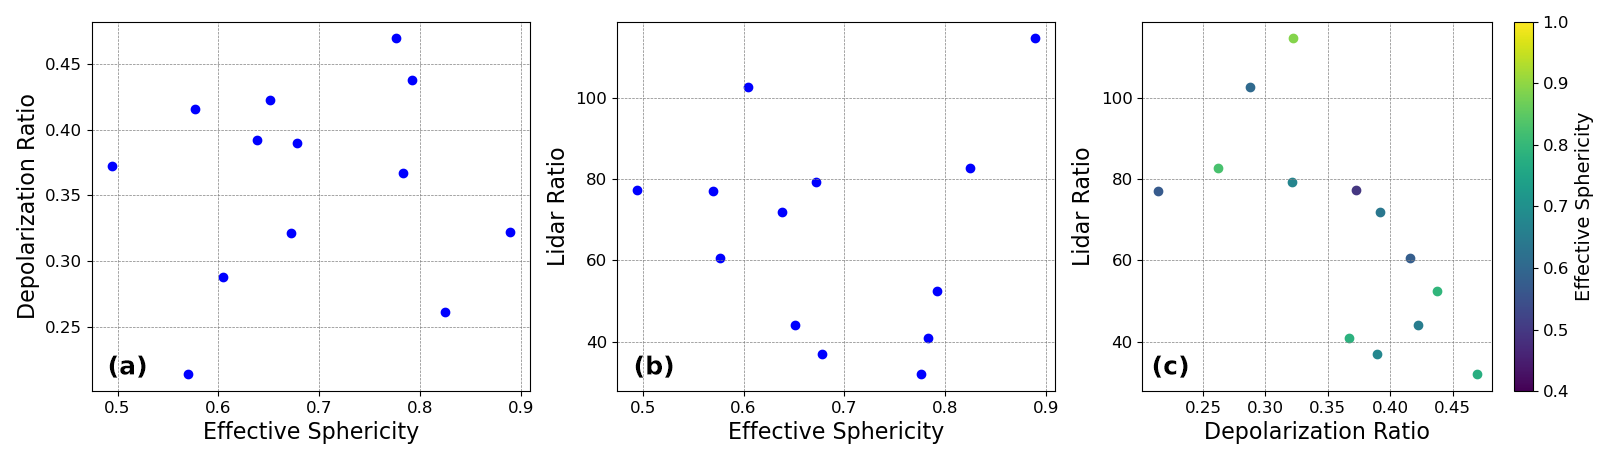
Figure 9(a) Effective sphericity dependence of δ. (b) Lidar ratio variance with effective sphericity. (c) S–δ graph of FIB dust particles across effective sphericity. A common volume is used by constraining the volume-equivalent sphere radius to 0.5 µm for each particle as well as a refractive index of . A wavelength of 532 nm was used.
4.3 Sensitivity to dust mineralogy
Each particle from the study of Conny et al. (2019) was determined to have different amounts of iron in its composition through their EDX spectroscopy tests. Using these data, they determined the refractive index of each particle with the Maxwell–Garnett dielectric function described in Sect. 3.2. The tests resulted in the percentage of elements by mass and volume but did not reveal the mineral phase within the dust. To account for this, the study uses various possible iron-containing mineral phases for each particle to determine the refractive index, as these phases have the greatest variability in the possible refractive index for these particles. They also account for birefringence through a minimum and maximum value for the refractive index. Each particle was given a hematite phase, while some had magnetite, ankerite, and/or siderite present. Interested readers are directed to Conny et al. (2019) for further details.
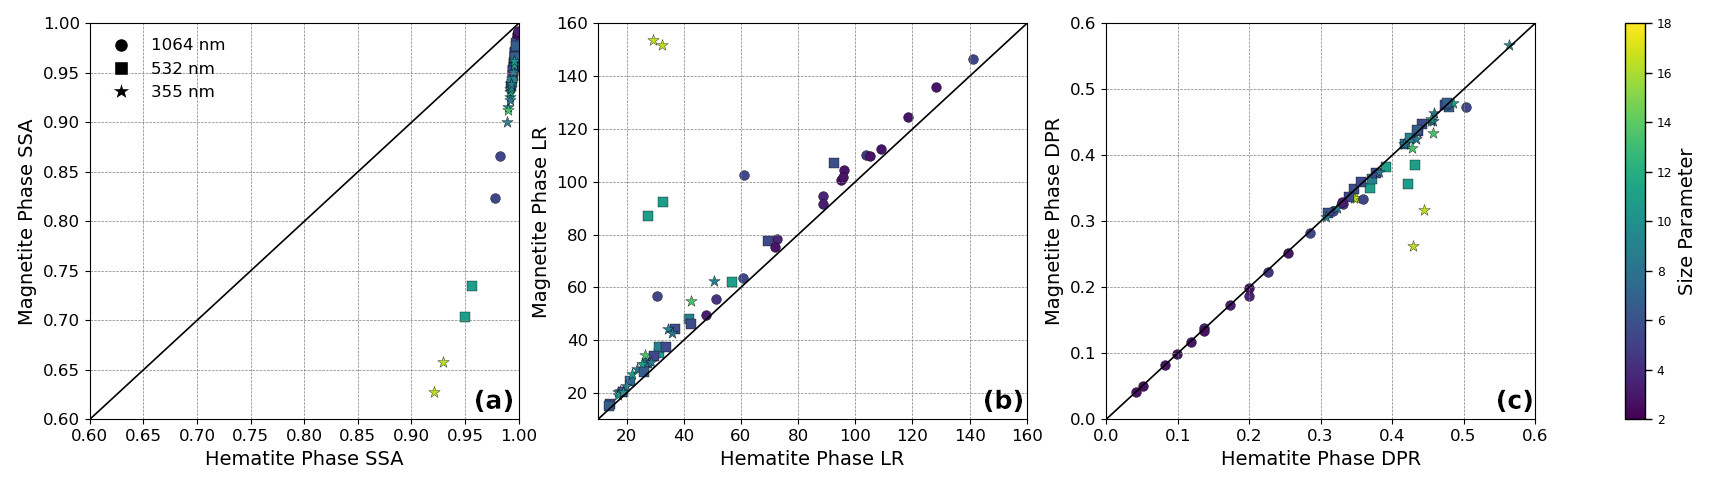
Figure 10Variation in (a) ω, (b) S, and (c) δ for each particle with its magnetite phase and corresponding hematite phase.
Each of these mineral phases has a different CRI, with magnetite being the most absorbing of the iron-containing phases present (see Table 1). This results in considerable variations (up to 32 %) in single-scattering albedo (Fig. 10a), particularly for the 3D Ca-rich particle, which has the highest iron content by mass, ranging from 11.4 % to 7.90 % depending on the mineral phase used. In contrast, the next most iron-dense particle (4N1 Ca–Mg) contains only 4.35 % to 1.56 %. Accompanying the reduction in single-scattering albedo, the S becomes systematically larger (Fig. 10b), and the δ becomes smaller (Fig. 10c) when hematite is replaced by magnetite. These results underscore the critical role of dust mineralogy in influencing the single-scattering albedo (SSA) of dust particles, as highlighted in previous studies (Li et al., 2021; Song et al., 2022, 2024). However, the effects of mineralogy on lidar-derived δ and S are smaller than the impacts of dust particle size. An important caveat to keep in mind when interpreting these results is that the same dust CRI has been used for all three wavelengths, as mentioned earlier. Dust absorption typically increases with decreasing wavelength in the visible to ultraviolet spectral region, which is not accounted for in our computations. Therefore, the impacts of mineralogy on lidar properties at the 355 nm wavelength, where dust can have strong absorption, may be underestimated. We will leave this for future studies because the spectral dependence of dust CRI is still highly uncertain due to the lack of reliable observations.
The results in Sect. 4 indicate that particle size plays a dominant role in determining the dust δ of FIB dust particles. As shown in Sect. 4.1, the dust δ exhibits an asymptotic trend with increasing size (see Fig. 6b), a pattern also noted in several previous studies (Kong et al., 2022a; Järvinen et al., 2016; Kemppinen et al., 2015a, b). The robustness of this asymptotic trend inspired us to develop two parameterization schemes for δ as a function of dust size, which will be introduced in this section. This will allow us to extend the utility of the dust particle data to a larger range of sizes, as the individual particles have a limited range of size parameters. One scheme is designed for single particles, while the other is intended for ensembles of particles with a particle size distribution. We hope that these parameterization schemes can be used to efficiently estimate the δ of dust particles without resorting to time-consuming scattering simulations.
The parameterization for single particles is straightforward. To model the asymptotic trend of individual particle δ with dust particle size, we employed a sigmoid function as follows:
The sigmoid function has three parameters: δ∞ is the asymptotic value of δ when the size parameter is large. The other two parameters a and b control the shape of the sigmoid function. After a nonlinear curve fitting, we find δ∞=0.41, a=1.09, and (R2=0.72). This simple parameterization can be used to estimate the δ of a single dust particle given its size and the wavelength of interest.
Next, we will use Eq. (10) to construct a parameterization scheme for the volumetric depolarization ratio, 〈δ〉 of a dust plume following the widely used lognormal particle size distribution (n(rv)), giving us a value for δ for the ensemble of particles. To this end, we need to first make an approximation. For a given dust particle size distribution , the rigorous definition of the volumetric δ is given by
where 〈P11〉 and 〈P22〉 are the bulk-scattering matrix elements after the averaging over n(rv). For example,
where Csca is the scattering cross section of dust particles with the size of rv. We found that it is difficult to use Eq. (11) to estimate 〈δ〉, because neither 〈P11〉 nor 〈P22〉 can be easily parameterized with the size parameter. To avoid this difficulty, we propose the following approximate way to estimate the 〈δ〉 as
which allows us to use the simple parameterization in Eq. (10). The accuracy of this approximation will be evaluated momentarily. Here, we convert from the size parameter into volume median radius through as δ will vary with wavelength. Next, we need to specify the Csca(rv) of single particles. Unfortunately, the size parameter span of the FIB dust samples is too small to cover the whole dust n(rv). To solve this problem, we use the TAUMdust2020 database to estimate Csca(rv). TAMUdust2020 is a comprehensive database by Saito et al. (2021) that covers the scattering properties of 20 irregular hexahedral-shape models over the entire practical range of particle sizes, wavelengths, and CRI values of mineral dust particles. Based on the regional dust models recommended by Saito et al. (2021), an ensemble-weighted degree of sphericity of 0.7 is selected to represent the dust particles. For the dust CRI, we use the data from Song et al. (2022) to interpolate the TAMUdust2020 and obtain the Csca(rv). In Song et al. (2022), three sets of dust CRI values corresponding to the low, mean, and high concentration of hematite (Di Biagio et al., 2019) were used to compute the dust-scattering properties and their direct radiative effects. Here we adopt the CRI corresponding to the mean concentration of hematite. Note that the CRI from Song et al. (2022) is spectrally dependent with increasing absorption and decreasing wavelength (see their Fig. 2), which means that the 355 nm wavelength has the strongest absorption among the three lidar wavelengths considered here. Finally, for the dust n(rv), we use the lognormal distribution
where N0 is a constant and rvgis the volume median radius. We use a fixed standard deviation of σg=0.529, the same standard deviation of the fine-mode dust from AERONET's n(rv) in Cabo Verde from Dubovik et al. (2002) shown in Fig. 12, when creating the parameterization in Fig. 11.
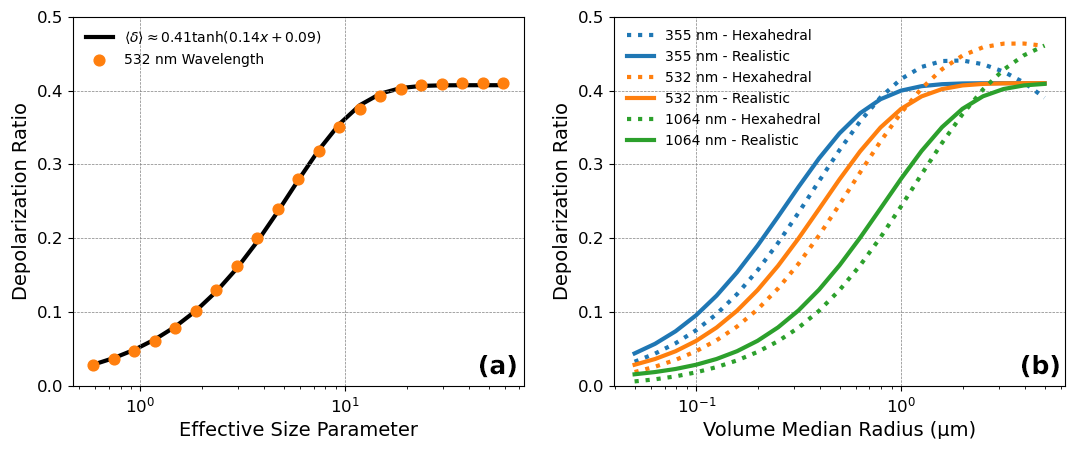
Figure 11(a) Parameterization of realistic δ for the effective size parameter using a hyperbolic tangent function. (b) Depolarization ratio predicted for a monomodal size distribution with varying volume-equivalent median radius. The δ for realistic geometries was derived through Eq. (15), while hexahedral shapes used P11 and P22 parameters.
Using a combination of the δ(x) parameterization in Eq. (10) and the Csca(rv) from the TAMUdust2020 database and the lognormal n(rv) in Eq. (14), we computed the volumetric dust depolarization ratio 〈δ〉 based on the proposed approximation in Eq. (13). The result for the 532 nm 〈δ〉 as a function of the effective size parameter is shown in Fig. 11a. It is not surprising to see that the volumetric dust depolarization ratio 〈δ(xvg)〉 resembles δ(x) for the single particles in terms of its size dependence. Further simplification is possible through a fitting of the newly bulk-averaged depolarization ratio. We find the depolarization of the FIB realistic particles is well approximated by the following hyperbolic tangent equation:
with an r2 value of 0.79, as shown in Fig. 11a. While this function is fitted for a wavelength of 532 nm in particular, we found that the results for the 355 and 1064 nm wavelengths are almost identical. This is probably because we used the same δ(x) parameterization for all three wavelengths and only different Csca values due to the use of the spectrally dependent CRI in Song et al. (2022). It turns out that Csca plays a minimal role in the δ value, making Eq. (15) a reasonable approximation for all three lidar wavelengths given an effective particle size parameter, xvg. This is supported by the comparison results shown in Fig. 11b. The solid lines correspond to the volumetric 〈δ〉 for the three wavelengths predicted based on the parameterization Eq. (15). The dotted line corresponds to the 〈δ〉 of irregular hexahedrons computed based on the TAMUdust2020 database using the Song et al. (2022) dust CRI. It is important to note that the computation for irregular hexahedrons is based on the rigorous definition of δ in Eq. (11) without any approximation. Evidently, the two sets of 〈δ〉 agree reasonably well in terms of both spectral and size parameter dependencies. Interestingly, a decreasing trend was observed for the 355 nm δ based on the irregular hexahedral shape when rvg is larger than about 2–3 µm, which is not seen in either our parameterization or our hexahedral results for other wavelengths. As mentioned above, in the computation for the irregular hexahedral shape, we used the spectrally dependent CRI, which has a higher absorption at 355 nm. Recall the result in Fig. 10c that indicates δ decreases with dust absorption. This decreasing-with-size trend of δ for large rvg is a result of stronger absorption at 355 nm, as it is reflected in a decrease in SSA for those particles (Saito and Yang, 2021).
The utility of the simple parameterization scheme in Eq. (15) is further demonstrated in terms of simulating the spectral dependence of δ as shown in the following case. Here, we use the climatological dust n(rv) retrieved by AERONET at Cabo Verde as reported in Dubovik et al. (2002) (Fig. 12a) to compute three sets of volumetric dust 〈δ〉 for the three lidar wavelengths using the following three methods:
-
In the first method (solid black lines in Fig. 12b), dust-scattering properties are based on the irregular hexahedral model from the TAMUdust2020 database. The dust CRI is spectrally dependent and from Song et al. (2022). The 〈δ〉 is computed based on the rigorous definition in Eq. (11) with 〈P11〉 and 〈P22〉 averaged over n(rv).
-
The second method (solid blue lines in Fig. 12b) is the same as the first method except that the 〈δ〉 is computed based on the approximation method in Eq. (13).
-
In the third method (solid red lines in Fig. 12b), the 〈δ〉 for each wavelength is simply predicted using the parameterization in Eq. (15) by converting xvg into rvg.
As such, comparisons between the three methods enable us to assess the uncertainty associated with each step of the approximation. For example, the comparison between method 1 and 2 can help us understand the uncertainty associated with the 〈δ〉 computation using the approximation method in Eq. (13). The comparison of method 3 to the other two methods helps us understand the overall accuracy of our simple parameterization.
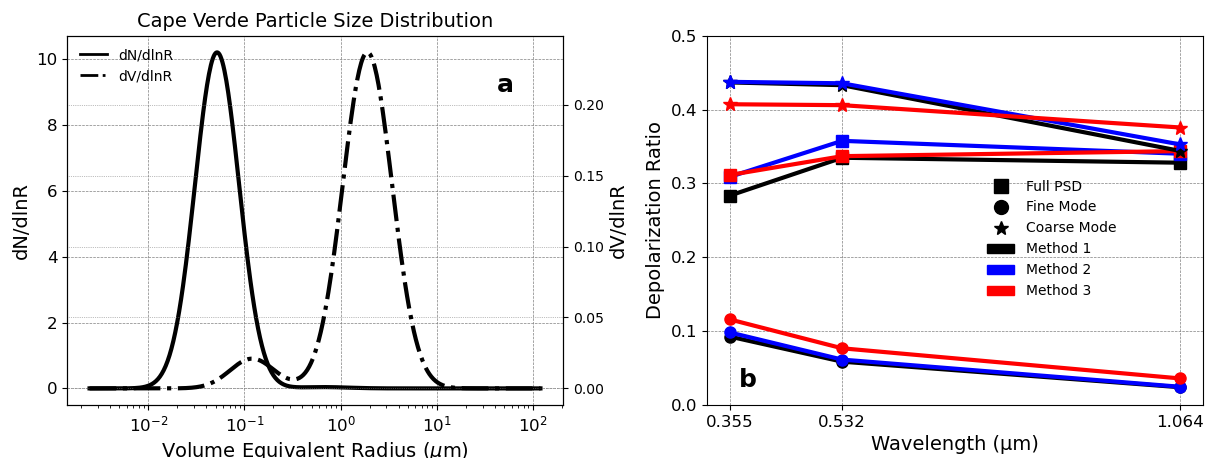
Figure 12(a) Dust particle size distribution for Cabo Verde (Cape Verde in the figure) using AERONET, adapted from Dubovik et al. (2002). (b) Depolarization ratio of the fine and coarse mode for hexahedral dust and FIB reconstruction using approximation methods 1, 2, and 3 as described in the text.
In order to use the full n(rv) with method 3, a weighting by backscatter coefficient is utilized such that (Mamouri and Ansmann, 2014)
where β is calculated from the TAMUdust2020 database.
The resulting comparison in Fig. 12 shows all three methods simulate a substantially smaller δ for the fine mode than the coarse mode. Additionally, the fine-mode δ based on all three methods exhibits a decreasing trend with wavelength, which is a result of the fast-increasing trend of δ with dust particle size parameter for fine-mode dust particles (see Fig. 6). The differences in the fine-mode δ between the three methods are mostly smaller than 0.05, with the method 3 result based on the simple parameterization scheme being slightly larger than the results of the other two methods. Finally, for the coarse-mode dust δ, the results based on the simple parameterization (method 3) are close to spectrally neutral and smaller than the results for methods 1 and 2 for 355 and 532 nm, while the use of TAMUdust2020 decreases δ at 1064 nm.
Interestingly, the full size distribution δ's based on methods 1 and 2 exhibit an inverse “v” shape, with the maximum at 532 nm and decreasing toward both 355 and 1064 nm. Such an inverse “v”-shape spectral signature of dust δ has also been observed recently by Haarig et al. (2022) over Leipzig, Germany, in February and March 2021 during a transported Sahara dust event (see their Fig. 5). As mentioned, our δ parameterization scheme using method 3 and the parameterization of the FIB dust samples does not take into account the spectral dependence of dust CRI and the corresponding change in absorption. In methods 1 and 2, we use the CRI from Song et al. (2022), which has a stronger absorption at 355 nm and leads to a decrease in δ from 532–355 nm. Therefore, our results indicate that the inverse “v”-shape spectral signature of dust δ is a result of the competing effects of dust size and absorption. The decrease in δ from 532–1064 nm is the result of dust size, while the decrease from 532–355 nm is a result of dust absorption.
Despite the limitation of spectrally independent CRI, the overall accuracy of our parameterization scheme is satisfying, partly due to the error cancellation between the overestimation of the fine-mode δ and underestimation of coarse-mode δ. For example, after summation of the fine and coarse modes, the δ of the whole n(rv) for the 532 nm wavelength is 〈δ〉≈0.335 based on method 1, while for method 3 based on our simple parameterization it is 〈δ〉≈0.334.
Comparing the dust δ of the full n(rv) to that of fine-mode δ and coarse-mode δ also gives us interesting results. Both fine and coarse modes individually decrease with wavelength despite the inverse “v”-shape spectral signature of the full n(rv). This characteristic is quite nicely explained by an interpretation of Eq. (16). Across each wavelength, βf<βc, so 〈δ〉 is greater than a simple average of both fine and coarse modes. But βc increases with wavelength. Therefore, despite δf and δc decreasing spectrally, δc has a greater weighting in the equation. In other words, more of the backscattered signal is due to larger particles as wavelength increases, which are the particles exhibiting greater depolarization. Competing factors of β and δ further reinforce the absorption and size impact on δ. Thus, the comparisons shown in Fig. 12 are promising.
The utility of this parameterization likely comes from the inverse problem. Given the reliance on TAMUdust2020 for β, reconstructing the δ from n(rv) still requires use of simplified theoretical geometries for some amount of the calculation. However, given a retrieved backscattering coefficient, δ, and n(rv), using Eqs. (15) and (16) creates a succinct method of retrieving βf and βc, separating the fine and coarse fraction of dust according to Mamouri and Ansmann (2014).
Specifically in coarse-mode analysis, there are some limitations of our study. The sigmoid parameterization leads to a very flat parameterization of δ for particles greater than 1 µm in volume-equivalent radius, which is seen in both Fig. 11b and Fig. 12b and may be further refined with larger particles, currently unavailable due to computational cost. It is also important to note our study uses a wavelength-independent refractive index based on 589 nm, causing this work to miss some spectral dependency that may cause the coarse-mode differences in each wavelength when using the globally averaged refractive index (see Fig. 11b). The competing effects of the size and mineral composition of dust particles have been observed in studies of spectral dependence of δ (Haarig et al., 2022), which we will investigate in future studies.
In this study, we utilized the ADDA model to compute the scattering properties of FIB dust samples and derived the S and δ at three widely used lidar wavelengths: 355, 532, and 1064 nm. The advantage of this study compared to previous work is the use of realistic dust shapes reconstructed through the FIB tomography technique. The characterization of single-scattering properties of these realistic samples through rigorous computational techniques should serve well as benchmark data for the dust-scattering community. We investigated the dependence of dust S and δ on dust particle size, shape, and mineral composition. The results lead to the following conclusions.
-
Both S and δ exhibit an asymptotic trend with dust particle size: the S initially decreases and the δ increases with size, before both approach their asymptotic values.
-
The lidar properties were found to have only a weak dependence on effective sphericity.
-
The presence of strongly absorbing minerals, such as magnetite, can greatly reduce the dust's single-scattering albedo and δ while increasing S.
In addition to these scientific findings, the convergence index introduced in Sect. 3.3 and the δ parameterization schemes described in Sect. 5 may be useful for future research on light scattering by nonspherical particles and lidar-based remote sensing. The convergence index can be used to assess the convergence of random orientation computation using the DDA method. The δ parameterization scheme in Eq. (15) can be used to estimate the δ of dust with a lognormal size distribution n(rv), which can help us understand the variation in dust size based on δ observations and the separation of fine- and coarse-mode dust (Mamouri and Ansmann, 2014).
Certain limitations of this study also need to be addressed, particularly regarding the parameterization scheme of Sect. 5. This model's parameterization leads to a flattened coarse mode in an attempt to extrapolate from the limited size range available due to computational limits of DDA. Therefore, it may not have fully captured the optical properties for use with particularly large size parameters. Additionally, the wavelength-independent complex refractive index based on 589 nm measurements was applied to all three lidar wavelengths, simplifying the spectral differences in lidar properties, particularly at 355 nm where absorption from iron-phase minerals is more significant. Future studies on the coarse mode and spectral variation in dust lidar properties will improve the parameterization and applicability of the parameterization scheme and ability to utilize the FIB dust samples for atmospheric observations.
The scattering properties generated for the lidar properties of the FIB dust samples presented in this work have been made available under https://doi.org/10.5281/zenodo.15684438 (La Luna et al., 2025) through publication with Zenodo. Readers interested in the original shape models are directed to https://doi.org/10.1029/2018jd029387 (Conny et al., 2019) and https://doi.org/10.18434/T4/1503344 (Conny, 2018) for data availability. The scattering properties of hexahedral dust geometries are obtained from TAMUdust2020 (https://doi.org/10.5281/zenodo.4711247, Saito, 2021).
ZZ proposed and conceptualized the work, providing both funding acquisition and supervision of the project. All authors contributed to review and editing of the manuscript. JD helped to design the convergence index. MS and PY provided the TAMUdust2020 database for comparison to the FIB dust particles, and MS provided insight into particle sphericity. JZ and QS assisted in data curation and interpretation for FIB dust lidar property results and global refractive index data. ALL and ZZ contributed to the original draft preparation of the manuscript. ALL contributed to the methodology, data collection, interpretation and analysis, and data visualization under ZZ's supervision and project administration.
At least one of the (co-)authors is a member of the editorial board of Atmospheric Chemistry and Physics. The peer-review process was guided by an independent editor, and the authors also have no other competing interests to declare.
Publisher's note: Copernicus Publications remains neutral with regard to jurisdictional claims made in the text, published maps, institutional affiliations, or any other geographical representation in this paper. While Copernicus Publications makes every effort to include appropriate place names, the final responsibility lies with the authors.
This research was supported by the National Science Foundation (NSF) through Atmospheric and Geospace Sciences Grant No. 2232138. Computational resources were provided by UMBC's Chip High Performance Computing Facility.
This research has been supported by the National Science Foundation, Directorate for Geosciences (grant no. AGS-2232138), and the National Aeronautics and Space Administration, Science Mission Directorate (grant nos. 80NSSC24K0859 and 80NSSC24K0457).
This paper was edited by Matthias Tesche and reviewed by three anonymous referees.
Ansmann, A., Wandinger, U., Riebesell, M., Weitkamp, C., and Michaelis, W.: Independent measurement of extinction and backscatter profiles in cirrus clouds by using a combined Raman elastic-backscatter lidar, Appl. Optics, 31, 7113, https://doi.org/10.1364/ao.31.007113, 1992.
Baker, A. R., Kelly, S. D., Biswas, K. F., Witt, M., and Jickells, T. D.: Atmospheric deposition of nutrients to the Atlantic Ocean, Geophys. Res. Lett., 30, https://doi.org/10.1029/2003gl018518, 2003.
Bambha, R., Garcia, J., Razenkov, I., and Eloranta, E.: High-Spectral Resolution Lidar (HSRL) Instrument Handbook, ARM Climate Research Facility, Pacific Northwest National Laboratory, Richland, WA, https://doi.org/10.2172/1251392, 2016.
Bi, L. and Yang, P.: Accurate simulation of the optical properties of atmospheric ice crystals with the invariant imbedding T-matrix method, J. Quant. Spectrosc. Ra., 138, 17–35, https://doi.org/10.1016/j.jqsrt.2014.01.013, 2014a.
Bi, L. and Yang, P.: High-frequency extinction efficiencies of spheroids: rigorous T-matrix solutions and semi-empirical approximations, Opt. Express, 22, 10270, https://doi.org/10.1364/oe.22.010270, 2014b.
Burton, S. P., Ferrare, R. A., Hostetler, C. A., Hair, J. W., Rogers, R. R., Obland, M. D., Butler, C. F., Cook, A. L., Harper, D. B., and Froyd, K. D.: Aerosol classification using airborne High Spectral Resolution Lidar measurements – methodology and examples, Atmos. Meas. Tech., 5, 73–98, https://doi.org/10.5194/amt-5-73-2012, 2012.
Collier, C. T., Hesse, E., Taylor, L., Ulanowski, Z., Penttilä, A., and Nousiainen, T.: Effects of surface roughness with two scales on light scattering by hexagonal ice crystals large compared to the wavelength: DDA results, Journal of Quantitative Spectroscopy and Radiative Transfer, 182, 225–239, https://doi.org/10.1016/j.jqsrt.2016.06.007, 2016.
Conny, J.: Analysis and Optical Modeling of Individual Heterogeneous Asian Dust Particles Collected at Mauna Loa Observatory, 1.0.0, National Institute of Standards and Technology [data set], https://doi.org/10.18434/T4/1503344, 2018.
Conny, J. M. and Ortiz-Montalvo, D. L.: Effect of heterogeneity and shape on optical properties of urban dust based on three-dimensional modeling of individual particles, JGR Atmospheres, 122, 9816–9842, https://doi.org/10.1002/2017jd026488, 2017.
Conny, J. M., Collins, S. M., and Herzing, A. A.: Qualitative Multiplatform Microanalysis of Individual Heterogeneous Atmospheric Particles from High-Volume Air Samples, Anal. Chem., 86, 9709–9716, https://doi.org/10.1021/ac5022612, 2014.
Conny, J. M., Willis, R. D., and Ortiz-Montalvo, D. L.: Analysis and Optical Modeling of Individual Heterogeneous Asian Dust Particles Collected at Mauna Loa Observatory, JGR Atmospheres, 124, 2702–2723, https://doi.org/10.1029/2018jd029387, 2019.
Conny, J. M., Willis, R. D., and Ortiz-Montalvo, D. L.: Optical Modeling of Single Asian Dust and Marine Air Particles: A Comparison with Geometric Particle Shapes for Remote Sensing, J. Quant. Spectrosc. Ra., 254, https://doi.org/10.1016/j.jqsrt.2020.107197, 2020.
Creamean, J. M., Spackman, J. R., Davis, S. M., and White, A. B.: Climatology of long-range transported Asian dust along the West Coast of the United States, JGR Atmospheres, 119, https://doi.org/10.1002/2014jd021694, 2014.
Di Biagio, C., Formenti, P., Balkanski, Y., Caponi, L., Cazaunau, M., Pangui, E., Journet, E., Nowak, S., Andreae, M. O., Kandler, K., Saeed, T., Piketh, S., Seibert, D., Williams, E., and Doussin, J.-F.: Complex refractive indices and single-scattering albedo of global dust aerosols in the shortwave spectrum and relationship to size and iron content, Atmos. Chem. Phys., 19, 15503–15531, https://doi.org/10.5194/acp-19-15503-2019, 2019.
Donovan, D. P., van Zadelhoff, G.-J., and Wang, P.: The EarthCARE lidar cloud and aerosol profile processor (A-PRO): the A-AER, A-EBD, A-TC, and A-ICE products, Atmos. Meas. Tech., 17, 5301–5340, https://doi.org/10.5194/amt-17-5301-2024, 2024.
Draine, B. T. and Flatau, P. J.: Discrete-Dipole Approximation For Scattering Calculations, J. Opt. Soc. Am. A, 11, 1491, https://doi.org/10.1364/josaa.11.001491, 1994.
Draine, B. T. and Flatau, P. J.: User Guide for the Discrete Dipole Approximation Code DDSCAT 7.3, arXiv [preprint], https://doi.org/10.48550/arXiv.1305.6497, 2013.
Dubovik, O., Holben, B., Eck, T. F., Smirnov, A., Kaufman, Y. J., King, M. D., Tanré, D., and Slutsker, I.: Variability of Absorption and Optical Properties of Key Aerosol Types Observed in Worldwide Locations, J. Atmos. Sci., 59, 590–608, https://doi.org/10.1175/1520-0469(2002)059<0590:voaaop>2.0.co;2, 2002.
Dubovik, O., Sinyuk, A., Lapyonok, T., Holben, B. N., Mishchenko, M., Yang, P., Eck, T. F., Volten, H., Muñoz, O., Veihelmann, B., van der Zande, W. J., Leon, J., Sorokin, M., and Slutsker, I.: Application of spheroid models to account for aerosol particle nonsphericity in remote sensing of desert dust, J. Geophys. Res., 111, https://doi.org/10.1029/2005jd006619, 2006.
Evan, A. T., Dunion, J., Foley, J. A., Heidinger, A. K., and Velden, C. S.: New evidence for a relationship between Atlantic tropical cyclone activity and African dust outbreaks, Geophys. Res. Lett., 33, https://doi.org/10.1029/2006GL026408, 2006.
Floutsi, A. A., Baars, H., Engelmann, R., Althausen, D., Ansmann, A., Bohlmann, S., Heese, B., Hofer, J., Kanitz, T., Haarig, M., Ohneiser, K., Radenz, M., Seifert, P., Skupin, A., Yin, Z., Abdullaev, S. F., Komppula, M., Filioglou, M., Giannakaki, E., Stachlewska, I. S., Janicka, L., Bortoli, D., Marinou, E., Amiridis, V., Gialitaki, A., Mamouri, R.-E., Barja, B., and Wandinger, U.: DeLiAn – a growing collection of depolarization ratio, lidar ratio and Ångström exponent for different aerosol types and mixtures from ground-based lidar observations, Atmos. Meas. Tech., 16, 2353–2379, https://doi.org/10.5194/amt-16-2353-2023, 2023.
Gasteiger, J., Wiegner, M., Groß, S., Freudenthaler, V., Toledano, C., Tesche, M., and Kandler, K.: Modelling lidar-relevant optical properties of complex mineral dust aerosols, Tellus B, 63, 725, https://doi.org/10.1111/j.1600-0889.2011.00559.x, 2011.
Gasteiger, J. K.: Retrieval of microphysical properties of desert dust and volcanic ash aerosols from ground-based remote sensing, PhD Thesis, Ludwig-Maximilians-Universität München, https://doi.org/10.5282/edoc.13786, 2011.
Haarig, M., Ansmann, A., Engelmann, R., Baars, H., Toledano, C., Torres, B., Althausen, D., Radenz, M., and Wandinger, U.: First triple-wavelength lidar observations of depolarization and extinction-to-backscatter ratios of Saharan dust, Atmos. Chem. Phys., 22, 355–369, https://doi.org/10.5194/acp-22-355-2022, 2022.
Hofer, J., Ansmann, A., Althausen, D., Engelmann, R., Baars, H., Abdullaev, S. F., and Makhmudov, A. N.: Long-term profiling of aerosol light extinction, particle mass, cloud condensation nuclei, and ice-nucleating particle concentration over Dushanbe, Tajikistan, in Central Asia, Atmos. Chem. Phys., 20, 4695–4711, https://doi.org/10.5194/acp-20-4695-2020, 2020.
Hu, Y., Winker, D., Vaughan, M., Lin, B., Omar, A., Trepte, C., Flittner, D., Yang, P., Nasiri, S. L., Baum, B., Holz, R., Sun, W., Liu, Z., Wang, Z., Young, S., Stamnes, K., Huang, J., and Kuehn, R.: CALIPSO/CALIOP Cloud Phase Discrimination Algorithm, J. Atmos. Ocean. Tech., 26, 2293–2309, https://doi.org/10.1175/2009jtecha1280.1, 2009.
Huang, Y., Kok, J. F., Saito, M., and Muñoz, O.: Single-scattering properties of ellipsoidal dust aerosols constrained by measured dust shape distributions, Atmos. Chem. Phys., 23, 2557–2577, https://doi.org/10.5194/acp-23-2557-2023, 2023.
Illingworth, A. J., Barker, H. W., Beljaars, A., Ceccaldi, M., Chepfer, H., Clerbaux, N., Cole, J., Delanoë, J., Domenech, C., Donovan, D. P., Fukuda, S., Hirakata, M., Hogan, R. J., Huenerbein, A., Kollias, P., Kubota, T., Nakajima, T., Nakajima, T. Y., Nishizawa, T., Ohno, Y., Okamoto, H., Oki, R., Sato, K., Satoh, M., Shephard, M. W., Velázquez-Blázquez, A., Wandinger, U., Wehr, T., and van Zadelhoff, G.-J.: The EarthCARE Satellite: The Next Step Forward in Global Measurements of Clouds, Aerosols, Precipitation, and Radiation, B. Am. Meteorol. Soc., 96, 1311–1332, https://doi.org/10.1175/bams-d-12-00227.1, 2015.
Ishimoto, H., Zaizen, Y., Uchiyama, A., Masuda, K., and Mano, Y.: Shape modeling of mineral dust particles for light-scattering calculations using the spatial Poisson–Voronoi tessellation, J. Quant. Spectrosc. Ra., 111, 2434–2443, https://doi.org/10.1016/j.jqsrt.2010.06.018, 2010.
Järvinen, E., Kemppinen, O., Nousiainen, T., Kociok, T., Möhler, O., Leisner, T., and Schnaiter, M.: Laboratory investigations of mineral dust near-backscattering depolarization ratios, J. Quant. Spectrosc. Ra., 178, 192–208, https://doi.org/10.1016/j.jqsrt.2016.02.003, 2016.
Kahnert, M., Kanngießer, F., Järvinen, E., and Schnaiter, M.: Aerosol-optics model for the backscatter depolarisation ratio of mineral dust particles, J. Quant. Spectrosc. Ra., 254, https://doi.org/10.1016/j.jqsrt.2020.107177, 2020.
Kemppinen, O., Nousiainen, T., and Jeong, G. Y.: Effects of dust particle internal structure on light scattering, Atmos. Chem. Phys., 15, 12011–12027, https://doi.org/10.5194/acp-15-12011-2015, 2015a.
Kemppinen, O., Nousiainen, T., and Lindqvist, H.: The impact of surface roughness on scattering by realistically shaped wavelength-scale dust particles, J. Quant. Spectrosc. Ra., 150, 55–67, https://doi.org/10.1016/j.jqsrt.2014.05.024, 2015b.
Kim, M.-H., Omar, A. H., Tackett, J. L., Vaughan, M. A., Winker, D. M., Trepte, C. R., Hu, Y., Liu, Z., Poole, L. R., Pitts, M. C., Kar, J., and Magill, B. E.: The CALIPSO version 4 automated aerosol classification and lidar ratio selection algorithm, Atmos. Meas. Tech., 11, 6107–6135, https://doi.org/10.5194/amt-11-6107-2018, 2018.
Kong, S., Sato, K., and Bi, L.: Lidar Ratio–Depolarization Ratio Relations of Atmospheric Dust Aerosols: The Super-Spheroid Model and High Spectral Resolution Lidar Observations, JGR Atmospheres, 127, https://doi.org/10.1029/2021jd035629, 2022a.
Kong, S. S.-K., Pani, S. K., Griffith, S. M., Ou-Yang, C.-F., Babu, S. R., Chuang, M.-T., Ooi, M. C. G., Huang, W.-S., Sheu, G.-R., and Lin, N.-H.: Distinct transport mechanisms of East Asian dust and the impact on downwind marine and atmospheric environments, Sci. Total Environ., 827, 154255, https://doi.org/10.1016/j.scitotenv.2022.154255, 2022b.
Konoshonkin, A., Kustova, N., Borovoi, A., Tsekeri, A., and Gasteiger, J.: Using the Physical Optics Approximation for Estimating the Light Scattering Properties of Large Dust Particles for Lidar Applications, EPJ Web Conf., 237, 08025, https://doi.org/10.1051/epjconf/202023708025, 2020.
La Luna, A., Zhang, Z., Zheng, J., Song, Q., Yu, H., Ding, J., Yang, P., and Saito, M.: Scattering properties and Lidar Characteristics of Asian Dust Particles Based on Realistic Shape Models (1.0.0), Zenodo [data set], https://doi.org/10.5281/zenodo.15684438, 2025.
Lau, K. M. and Kim, K. M.: Cooling of the Atlantic by Saharan dust, Geophys. Res. Lett., 34, https://doi.org/10.1029/2007GL031538, 2007.
Li, L., Mahowald, N. M., Miller, R. L., Pérez García-Pando, C., Klose, M., Hamilton, D. S., Gonçalves Ageitos, M., Ginoux, P., Balkanski, Y., Green, R. O., Kalashnikova, O., Kok, J. F., Obiso, V., Paynter, D., and Thompson, D. R.: Quantifying the range of the dust direct radiative effect due to source mineralogy uncertainty, Atmos. Chem. Phys., 21, 3973–4005, https://doi.org/10.5194/acp-21-3973-2021, 2021.
Lin, C.-Y., Wang, Z., Chen, W.-N., Chang, S.-Y., Chou, C. C. K., Sugimoto, N., and Zhao, X.: Long-range transport of Asian dust and air pollutants to Taiwan: observed evidence and model simulation, Atmos. Chem. Phys., 7, 423–434, https://doi.org/10.5194/acp-7-423-2007, 2007.
Lindqvist, H., Jokinen, O., Kandler, K., Scheuvens, D., and Nousiainen, T.: Single scattering by realistic, inhomogeneous mineral dust particles with stereogrammetric shapes, Atmos. Chem. Phys., 14, 143–157, https://doi.org/10.5194/acp-14-143-2014, 2014.
Liu, J., Yang, P., and Muinonen, K.: Dust-aerosol optical modeling with Gaussian spheres: Combined invariant-imbedding T-matrix and geometric-optics approach, J. Quant. Spectrosc. Ra., 161, 136–144, https://doi.org/10.1016/j.jqsrt.2015.04.003, 2015a.
Liu, Z., Sugimoto, N., and Murayama, T.: Extinction-to-backscatter ratio of Asian dust observed with high-spectral-resolution lidar and Raman lidar, Appl. Optics, 41, 2760, https://doi.org/10.1364/ao.41.002760, 2002.
Liu, Z., Winker, D., Omar, A., Vaughan, M., Kar, J., Trepte, C., Hu, Y., and Schuster, G.: Evaluation of CALIOP 532 nm aerosol optical depth over opaque water clouds, Atmos. Chem. Phys., 15, 1265–1288, https://doi.org/10.5194/acp-15-1265-2015, 2015b.
Mamouri, R. E. and Ansmann, A.: Fine and coarse dust separation with polarization lidar, Atmos. Meas. Tech., 7, 3717–3735, https://doi.org/10.5194/amt-7-3717-2014, 2014.
Mattis, I., Ansmann, A., Müller, D., Wandinger, U., and Althausen, D.: Dual-wavelength Raman lidar observations of the extinction-to-backscatter ratio of Saharan dust, Geophys. Res. Lett., 29, https://doi.org/10.1029/2002gl014721, 2002.
Meng, Z., Yang, P., Kattawar, G. W., Bi, L., Liou, K. N., and Laszlo, I.: Single-scattering properties of tri-axial ellipsoidal mineral dust aerosols: A database for application to radiative transfer calculations, J. Aerosol Sci., 41, 501–512, https://doi.org/10.1016/j.jaerosci.2010.02.008, 2010.
Miller, R. L. and Tegen, I.: Climate Response to Soil Dust Aerosols, J. Climate, 11, 3247–3267, https://doi.org/10.1175/1520-0442(1998)011<3247:crtsda>2.0, 1998.
Mishchenko, M. I. and Yurkin, M. A.: On the concept of random orientation in far-field electromagnetic scattering by nonspherical particles, Opt. Lett., 42, 494, https://doi.org/10.1364/ol.42.000494, 2017.
Mishchenko, M. I., Travis, L. D., and Mackowski, D. W.: T-matrix computations of light scattering by nonspherical particles: A review, J. Quant. Spectrosc. Ra., 55, 535–575, https://doi.org/10.1016/0022-4073(96)00002-7, 1996.
Mishchenko, M. I., Travis, L. D., and Lacis, A. A.: Scattering, Absorption, and Emission of Light by Small Particles, Cambridge University Press, 560 pp., ISBN 0-521-78252-X, 2002.
Muinonen, K., Nousiainen, T., Fast, P., Lumme, K., and Peltoniemi, J. I.: Light scattering by Gaussian random particles: Ray optics approximation, J. Quant. Spectrosc. Ra., 55, 577–601, https://doi.org/10.1016/0022-4073(96)00003-9, 1996.
Müller, D., Ansmann, A., Mattis, I., Tesche, M., Wandinger, U., Althausen, D., and Pisani, G.: Aerosol-type-dependent lidar ratios observed with Raman lidar, J. Geophys. Res., 112, https://doi.org/10.1029/2006jd008292, 2007.
Myhre, G., Samset, B. H., Schulz, M., Balkanski, Y., Bauer, S., Berntsen, T. K., Bian, H., Bellouin, N., Chin, M., Diehl, T., Easter, R. C., Feichter, J., Ghan, S. J., Hauglustaine, D., Iversen, T., Kinne, S., Kirkevåg, A., Lamarque, J.-F., Lin, G., Liu, X., Lund, M. T., Luo, G., Ma, X., van Noije, T., Penner, J. E., Rasch, P. J., Ruiz, A., Seland, Ø., Skeie, R. B., Stier, P., Takemura, T., Tsigaridis, K., Wang, P., Wang, Z., Xu, L., Yu, H., Yu, F., Yoon, J.-H., Zhang, K., Zhang, H., and Zhou, C.: Radiative forcing of the direct aerosol effect from AeroCom Phase II simulations, Atmos. Chem. Phys., 13, 1853–1877, https://doi.org/10.5194/acp-13-1853-2013, 2013.
Omar, A. H., Winker, D. M., Vaughan, M. A., Hu, Y., Trepte, C. R., Ferrare, R. A., Lee, K.-P., Hostetler, C. A., Kittaka, C., Rogers, R. R., Kuehn, R. E., and Liu, Z.: The CALIPSO Automated Aerosol Classification and Lidar Ratio Selection Algorithm, J. Atmos. Ocean. Tech., 26, 1994–2014, https://doi.org/10.1175/2009JTECHA1231.1, 2009.
Platt, C. M. R.: Remote Sounding of High Clouds: I. Calculation of Visible and Infrared Optical Properties from Lidar and Radiometer Measurements, J. Appl. Meteorol., 18, 1130–1143, https://doi.org/10.1175/1520-0450(1979)018<1130:rsohci>2.0.co;2, 1979.
Rolph, G., Stein, A., and Stunder, B.: Real-time Environmental Applications and Display sYstem: READY, Environ. Modell. Softw., 95, 210–228, https://doi.org/10.1016/j.envsoft.2017.06.025, 2017.
Saito, M.: TAMUdust2020 Database (1.0.0), Zenodo [data set], https://doi.org/10.5281/zenodo.4711247, 2021.
Saito, M. and Yang, P.: Advanced Bulk Optical Models Linking the Backscattering and Microphysical Properties of Mineral Dust Aerosol, Geophys. Res. Lett., 48, https://doi.org/10.1029/2021gl095121, 2021.
Saito, M. and Yang, P.: Generalization of Atmospheric Nonspherical Particle Size: Interconversions of Size Distributions and Optical Equivalence, J. Atmos. Sci., 79, 3333–3349, https://doi.org/10.1175/jas-d-22-0086.1, 2022.
Saito, M., Yang, P., Ding, J., and Liu, X.: A comprehensive database of the optical properties of irregular aerosol particles for radiative transfer simulations, J. Atmos. Sci., 78, 2089–2111, https://doi.org/10.1175/jas-d-20-0338.1, 2021.
Song, Q., Zhang, Z., Yu, H., Kato, S., Yang, P., Colarco, P., Remer, L. A., and Ryder, C. L.: Net radiative effects of dust in the tropical North Atlantic based on integrated satellite observations and in situ measurements, Atmos. Chem. Phys., 18, 11303–11322, https://doi.org/10.5194/acp-18-11303-2018, 2018.
Song, Q., Zhang, Z., Yu, H., Ginoux, P., and Shen, J.: Global dust optical depth climatology derived from CALIOP and MODIS aerosol retrievals on decadal timescales: regional and interannual variability, Atmos. Chem. Phys., 21, 13369–13395, https://doi.org/10.5194/acp-21-13369-2021, 2021.
Song, Q., Zhang, Z., Yu, H., Kok, J. F., Di Biagio, C., Albani, S., Zheng, J., and Ding, J.: Size-resolved dust direct radiative effect efficiency derived from satellite observations, Atmos. Chem. Phys., 22, 13115–13135, https://doi.org/10.5194/acp-22-13115-2022, 2022.
Song, Q., Ginoux, P., Gonçalves Ageitos, M., Miller, R. L., Obiso, V., and Pérez García-Pando, C.: Modeling impacts of dust mineralogy on fast climate response, Atmos. Chem. Phys., 24, 7421–7446, https://doi.org/10.5194/acp-24-7421-2024, 2024.
Stein, A. F., Draxler, R. R., Rolph, G. D., Stunder, B. J. B., Cohen, M. D., and Ngan, F.: NOAA's HYSPLIT Atmospheric Transport and Dispersion Modeling System, B. Am. Meteorol. Soc., 96, 2059–2077, https://doi.org/10.1175/bams-d-14-00110.1, 2015.
Steinhaus, H.: Length, shape and area, Colloquium Mathematicum, 3, 1–13, https://doi.org/10.4064/cm-3-1-1-13, 1954.
Sugimoto, N., Matsui, I., Shimizu, A., and Nishizawa, T.: Lidar Network for Monitoring Asian Dust and Air Pollution Aerosols, in: IGARSS 2008–2008 IEEE International Geoscience and Remote Sensing Symposium, II-573–II–576, https://doi.org/10.1109/IGARSS.2008.4779057, 2008.
Tegen, I., Lacis, A. A., and Fung, I.: The influence on climate forcing of mineral aerosols from disturbed soils, Nature, 380, 419–422, https://doi.org/10.1038/380419a0, 1996.
Uno, I., Eguchi, K., Yumimoto, K., Takemura, T., Shimizu, A., Uematsu, M., Liu, Z., Wang, Z., Hara, Y., and Sugimoto, N.: Asian dust transported one full circuit around the globe, Nat. Geosci., 2, 557–560, https://doi.org/10.1038/ngeo583, 2009.
van de Hulst, H. C.: Light scattering by small particles, Dover Publications, New York, 502 pp., ISBN 978-0-486-64228-4, 1981.
Vouk, V.: Projected Area of Convex Bodies, Nature, 162, 330–331, https://doi.org/10.1038/162330a0, 1948.
Wadell, H.: Volume, Shape, and Roundness of Quartz Particles, J. Geol., 43, 250–280, https://doi.org/10.1086/624298, 1935.
Welton, E. J., Campbell, J. R., Spinhirne, J. D., and Scott III, V. S.: Global monitoring of clouds and aerosols using a network of micropulse lidar systems, in: SPIE Proceedings, https://doi.org/10.1117/12.417040, 2001.
Westberry, T. K., Behrenfeld, M. J., Shi, Y. R., Yu, H., Remer, L. A., and Bian, H.: Atmospheric nourishment of global ocean ecosystems, Science, 380, https://doi.org/10.1126/science.abq5252 2023.
Winker, D. M., Vaughan, M. A., Omar, A., Hu, Y., Powell, K. A., Liu, Z., Hunt, W. H., and Young, S. A.: Overview of the CALIPSO Mission and CALIOP Data Processing Algorithms, J. Atmos. Ocean. Tech., 26, 2310–2323, https://doi.org/10.1175/2009jtecha1281.1, 2009.
Wu, Y., Han, Z., Nazmi, C., Gross, B., and Moshary, F.: A trans-Pacific Asian dust episode and its impacts to air quality in the east coast of U. S., Atmos. Environ., 106, 358–368, https://doi.org/10.1016/j.atmosenv.2015.02.013, 2015.
Yang, P., Bi, L., Baum, B. A., Liou, K.-N., Kattawar, G. W., Mishchenko, M. I., and Cole, B.: Spectrally Consistent Scattering, Absorption, and Polarization Properties of Atmospheric Ice Crystals at Wavelengths from 0.2 to 100 µm, https://doi.org/10.1175/JAS-D-12-039.1, 2013.
Yang, P., Ding, J., and Kattawar, G. W.: Applications of Maxwell's equations to light scattering by dielectric particles, in: Light, Plasmonics and Particles, edited by: Mengüç, M. P. and Francoeur, M., Elsevier, 133–147, https://doi.org/10.1016/b978-0-323-99901-4.00011-1, 2023.
Young, S. A., Vaughan, M. A., Garnier, A., Tackett, J. L., Lambeth, J. D., and Powell, K. A.: Extinction and optical depth retrievals for CALIPSO's Version 4 data release, Atmos. Meas. Tech., 11, 5701–5727, https://doi.org/10.5194/amt-11-5701-2018, 2018.
Yu, H., Remer, L. A., Chin, M., Bian, H., Tan, Q., Yuan, T., and Zhang, Y.: Aerosols from Overseas Rival Domestic Emissions over North America, Science, 337, https://doi.org/10.1126/science.1217576 2012.
Yu, H., Chin, M., Bian, H., Yuan, T., Prospero, J. M., Omar, A. H., Remer, L. A., Winker, D. M., Yang, Y., Zhang, Y., and Zhang, Z.: Quantification of trans-Atlantic dust transport from seven-year (2007–2013) record of CALIPSO lidar measurements, Remote Sens. Environ., 159, 232–249, https://doi.org/10.1016/j.rse.2014.12.010, 2015a.
Yu, H., Chin, M., Yuan, T., Bian, H., Remer, L. A., Prospero, J. M., Omar, A., Winker, D., Yang, Y., Zhang, Y., Zhang, Z., and Zhao, C.: The fertilizing role of African dust in the Amazon rainforest: A first multiyear assessment based on data from Cloud-Aerosol Lidar and Infrared Pathfinder Satellite Observations, Geophys. Res. Lett., 42, 1984–1991, https://doi.org/10.1002/2015GL063040, 2015b.
Yurkin, M. A. and Hoekstra, A. G.: The discrete dipole approximation: An overview and recent developments, J. Quant. Spectrosc. Ra., 106, 558–589, https://doi.org/10.1016/j.jqsrt.2007.01.034, 2007.
Yurkin, M. A. and Hoekstra, A. G.: The discrete-dipole-approximation code ADDA: Capabilities and known limitations, J. Quant. Spectrosc. Ra., 112, 2234–2247, https://doi.org/10.1016/j.jqsrt.2011.01.031, 2011.
Yurkin M. A. and Hoekstra A. G.: ADDA, Github [code], (1.4.0), https://github.com/adda-team/adda (last access: 20 October 2025), 2020.
Zhang, X., Xu, X., Chen, H., Hu, X.-M., and Gao, L.: Dust-planetary boundary layer interactions amplified by entrainment and advections, Atmos. Res., 278, 106359, https://doi.org/10.1016/j.atmosres.2022.106359, 2022.
- Abstract
- Introduction
- Theoretical background
- Data and model
- Sensitivities of the lidar ratio and depolarization ratio to particle properties
- Parameterization schemes for dust δ
- Conclusions and summary
- Data availability
- Author contributions
- Competing interests
- Disclaimer
- Acknowledgements
- Financial support
- Review statement
- References